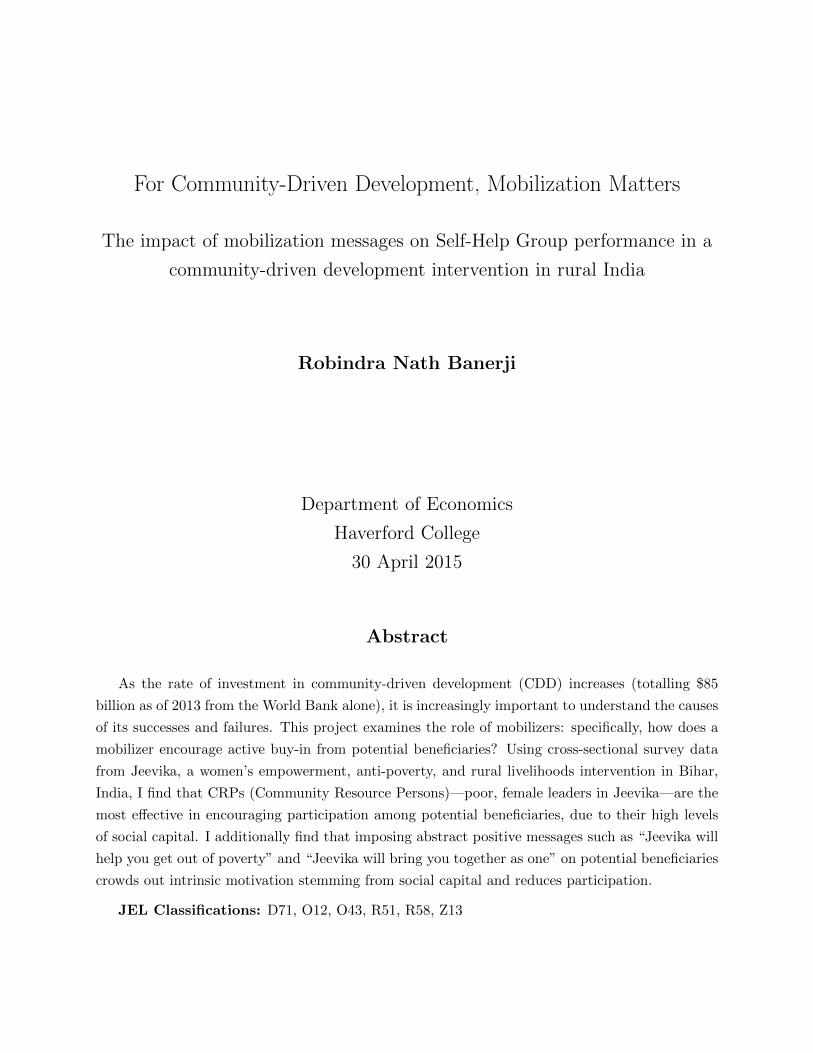
For Community-Driven Development, Mobilization Matters The impact of mobilization messages on Self-Help Group performance in a community-driven development intervention in rural India Robindra Nath Banerji Department of Economics Haverford College 30 April 2015 Abstract As the rate of investment in community-driven development (CDD) increases (totalling $85 billion as of 2013 from the World Bank alone), it is increasingly important to understand the causes of its successes and failures. This project examines the role of mobilizers: specifically, how does a mobilizer encourage active buy-in from potential beneficiaries? Using cross-sectional survey data from Jeevika, a women’s empowerment, anti-poverty, and rural livelihoods intervention in Bihar, India, I find that CRPs (Community Resource Persons)—poor, female leaders in Jeevika—are the most effective in encouraging participation among potential beneficiaries, due to their high levels of social capital. I additionally find that imposing abstract positive messages such as “Jeevika will help you get out of poverty” and “Jeevika will bring you together as one” on potential beneficiaries crowds out intrinsic motivation stemming from social capital and reduces participation. JEL Classifications: D71, O12, O43, R51, R58, Z13

Welcome message from author
This document is posted to help you gain knowledge. Please leave a comment to let me know what you think about it! Share it to your friends and learn new things together.
Transcript
For Community-Driven Development, Mobilization Matters
The impact of mobilization messages on Self-Help Group performance in a
community-driven development intervention in rural India
Robindra Nath Banerji
Department of Economics
Haverford College
30 April 2015
Abstract
As the rate of investment in community-driven development (CDD) increases (totalling $85
billion as of 2013 from the World Bank alone), it is increasingly important to understand the causes
of its successes and failures. This project examines the role of mobilizers: specifically, how does a
mobilizer encourage active buy-in from potential beneficiaries? Using cross-sectional survey data
from Jeevika, a women’s empowerment, anti-poverty, and rural livelihoods intervention in Bihar,
India, I find that CRPs (Community Resource Persons)—poor, female leaders in Jeevika—are the
most effective in encouraging participation among potential beneficiaries, due to their high levels
of social capital. I additionally find that imposing abstract positive messages such as “Jeevika will
help you get out of poverty” and “Jeevika will bring you together as one” on potential beneficiaries
crowds out intrinsic motivation stemming from social capital and reduces participation.
JEL Classifications: D71, O12, O43, R51, R58, Z13


For the women of Lakshmi and Maa Kali SHGs in Rupauli, Bihar, in the hope that the fervor of
your empowerment will spread to every corner of the state of Bihar.
Acknowledgments
The realization of this project would not have been possible without the help and advice of my
thesis advisor, David Owens, or my research supervisors at The World Bank, Shruti Majumdar,
Vijayendra Rao, and Upamanyu Dutta. I am very grateful to the Center for Peace and
Global Citizenship at Haverford College, as well as The World Bank, for their gracious funding
of components of this project.
iii


Contents
1 Introduction 1
2 Previous literature 3
2.1 Scaling up . . . . . . . . . . . . . . . . . . . . . . . . . . . . . . . . . . . . . . . . . . 3
2.2 Evaluation . . . . . . . . . . . . . . . . . . . . . . . . . . . . . . . . . . . . . . . . . . 4
2.3 Social capital . . . . . . . . . . . . . . . . . . . . . . . . . . . . . . . . . . . . . . . . 5
2.3.1 Implications of social capital theory . . . . . . . . . . . . . . . . . . . . . . . 5
2.3.2 Measuring social capital . . . . . . . . . . . . . . . . . . . . . . . . . . . . . . 6
2.4 Models of aid and development . . . . . . . . . . . . . . . . . . . . . . . . . . . . . . 7
3 Context and methodology 8
3.1 Organizational context . . . . . . . . . . . . . . . . . . . . . . . . . . . . . . . . . . . 9
3.1.1 Jeevika structure . . . . . . . . . . . . . . . . . . . . . . . . . . . . . . . . . . 9
3.1.2 The mobilization process . . . . . . . . . . . . . . . . . . . . . . . . . . . . . 10
3.2 Methodology . . . . . . . . . . . . . . . . . . . . . . . . . . . . . . . . . . . . . . . . 12
3.2.1 Sampling strategy . . . . . . . . . . . . . . . . . . . . . . . . . . . . . . . . . 12
3.2.2 Survey strategy . . . . . . . . . . . . . . . . . . . . . . . . . . . . . . . . . . . 13
3.2.3 Analytical methods . . . . . . . . . . . . . . . . . . . . . . . . . . . . . . . . . 14
4 Data 15
4.1 Dependent variables . . . . . . . . . . . . . . . . . . . . . . . . . . . . . . . . . . . . 15
4.2 Independent variables . . . . . . . . . . . . . . . . . . . . . . . . . . . . . . . . . . . 16
4.2.1 Messaging dummies . . . . . . . . . . . . . . . . . . . . . . . . . . . . . . . . 16
4.2.2 Mobilizer dummies . . . . . . . . . . . . . . . . . . . . . . . . . . . . . . . . . 19
4.3 Control variables . . . . . . . . . . . . . . . . . . . . . . . . . . . . . . . . . . . . . . 20
4.3.1 Group demographic controls . . . . . . . . . . . . . . . . . . . . . . . . . . . . 20
4.3.2 Geographic controls . . . . . . . . . . . . . . . . . . . . . . . . . . . . . . . . 23
v
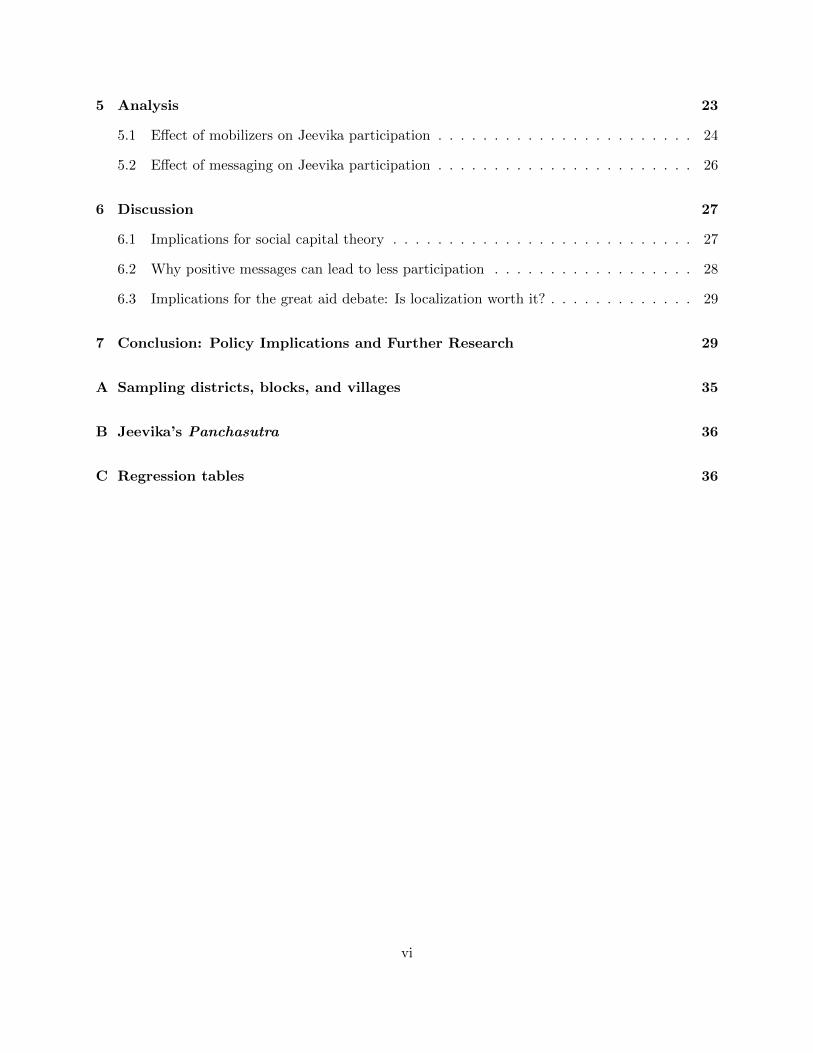
5 Analysis 23
5.1 Effect of mobilizers on Jeevika participation . . . . . . . . . . . . . . . . . . . . . . . 24
5.2 Effect of messaging on Jeevika participation . . . . . . . . . . . . . . . . . . . . . . . 26
6 Discussion 27
6.1 Implications for social capital theory . . . . . . . . . . . . . . . . . . . . . . . . . . . 27
6.2 Why positive messages can lead to less participation . . . . . . . . . . . . . . . . . . 28
6.3 Implications for the great aid debate: Is localization worth it? . . . . . . . . . . . . . 29
7 Conclusion: Policy Implications and Further Research 29
A Sampling districts, blocks, and villages 35
B Jeevika’s Panchasutra 36
C Regression tables 36
vi
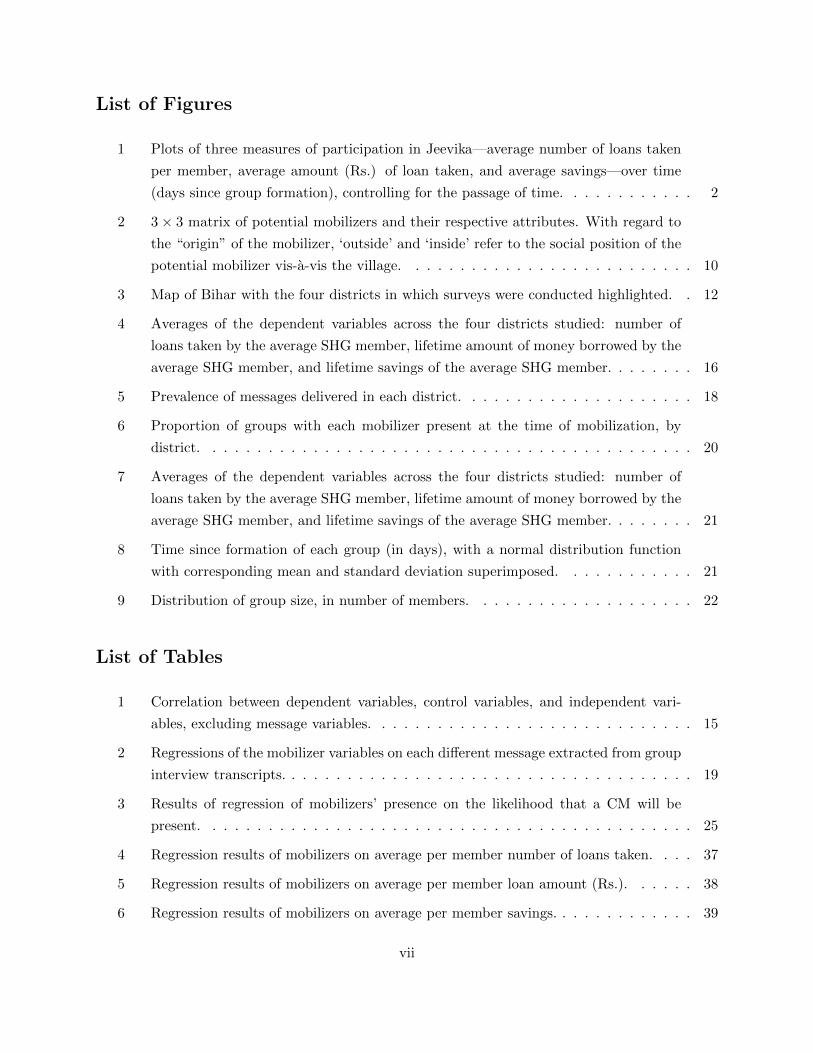
List of Figures
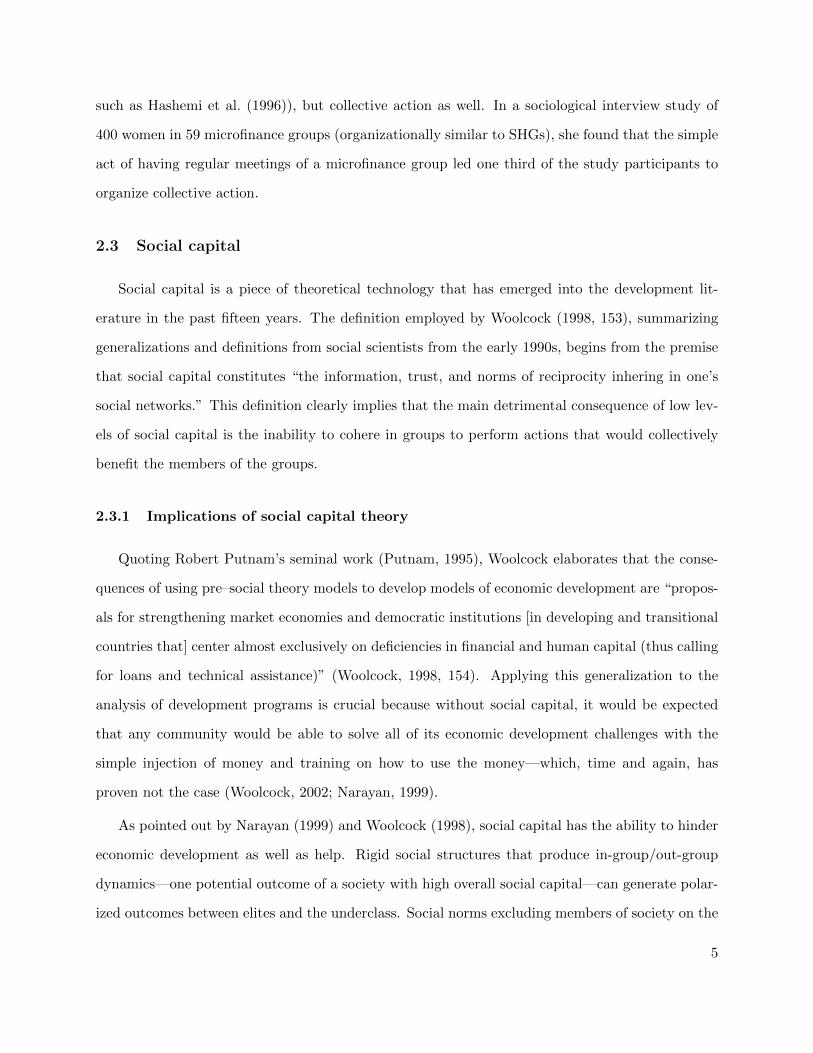
1 Plots of three measures of participation in Jeevika—average number of loans taken
per member, average amount (Rs.) of loan taken, and average savings—over time
(days since group formation), controlling for the passage of time. . . . . . . . . . . . 2
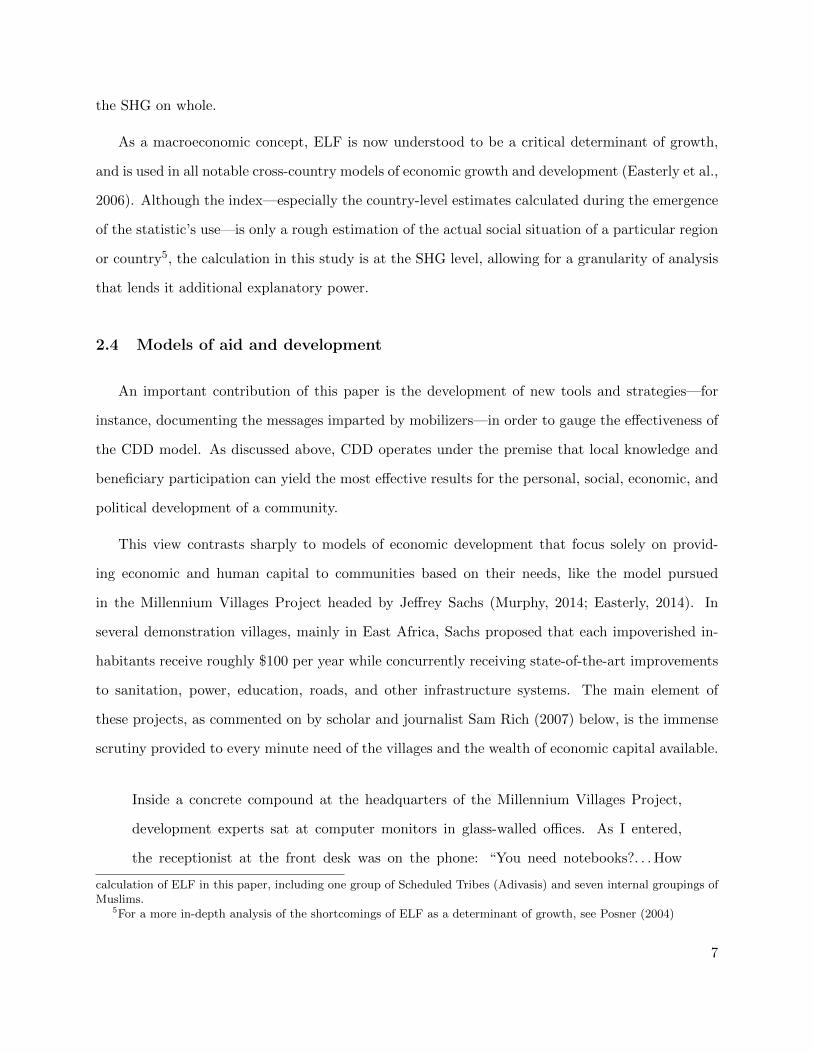
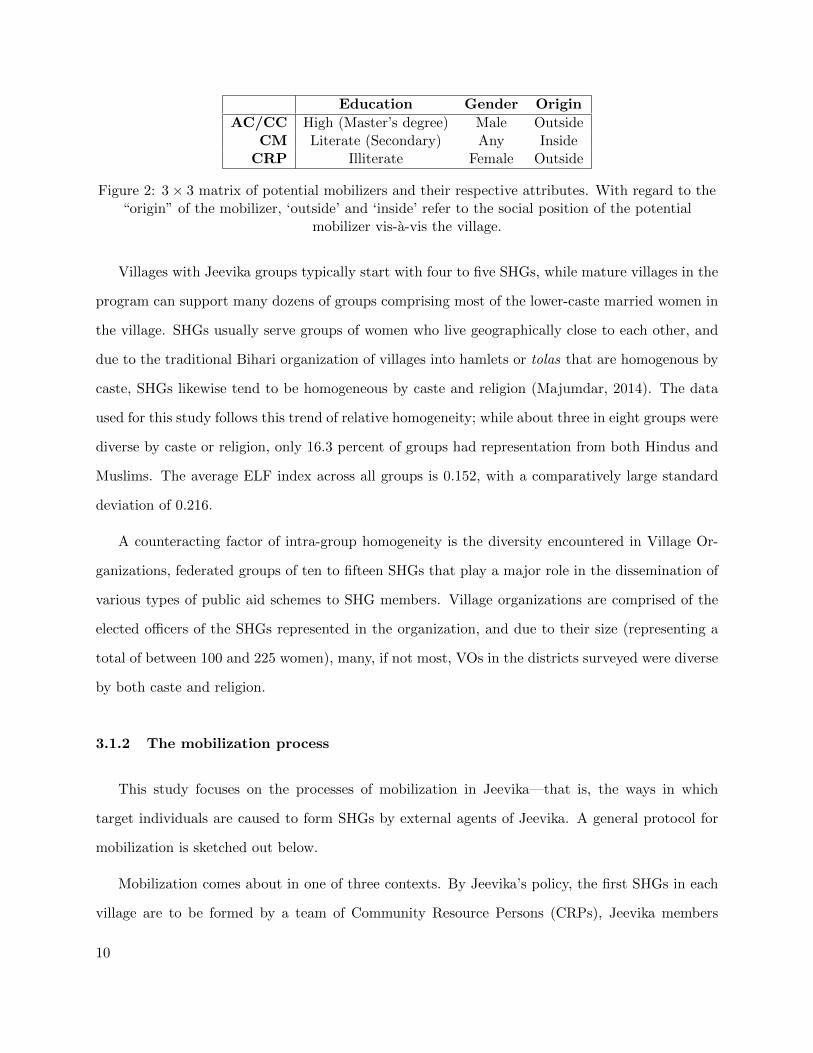
2 3 × 3 matrix of potential mobilizers and their respective attributes. With regard to
the “origin” of the mobilizer, ‘outside’ and ‘inside’ refer to the social position of the
potential mobilizer vis-a-vis the village. . . . . . . . . . . . . . . . . . . . . . . . . . 10
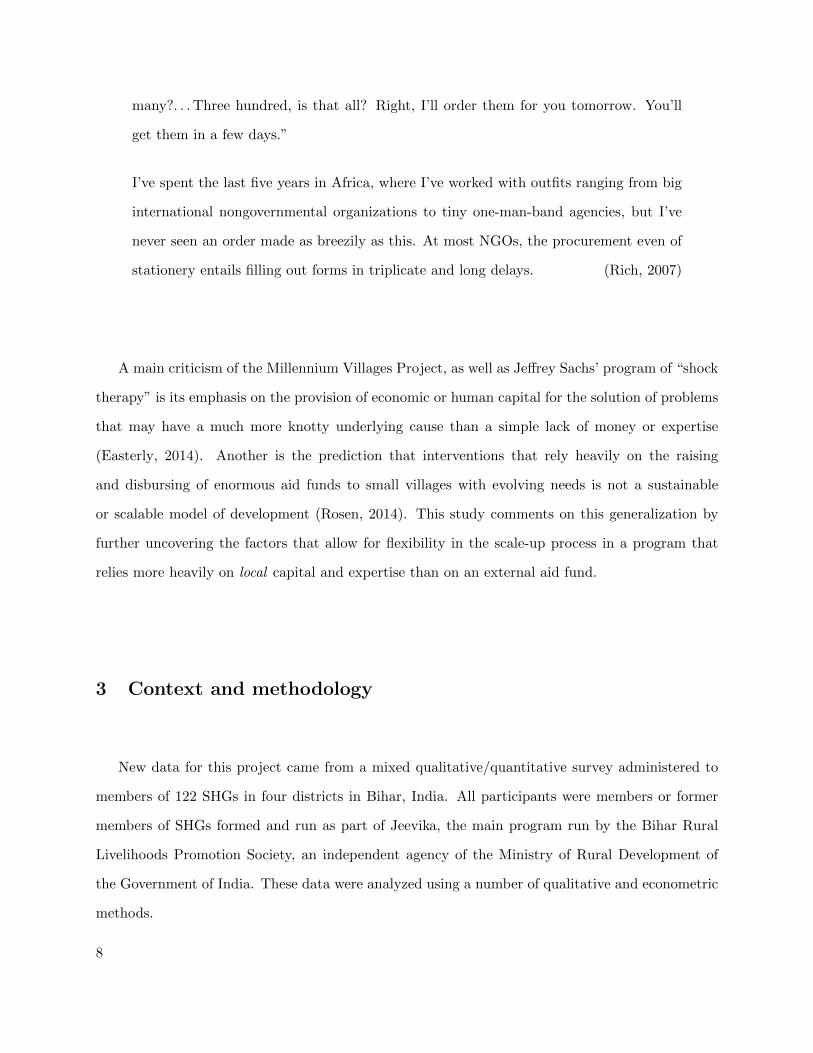
3 Map of Bihar with the four districts in which surveys were conducted highlighted. . 12
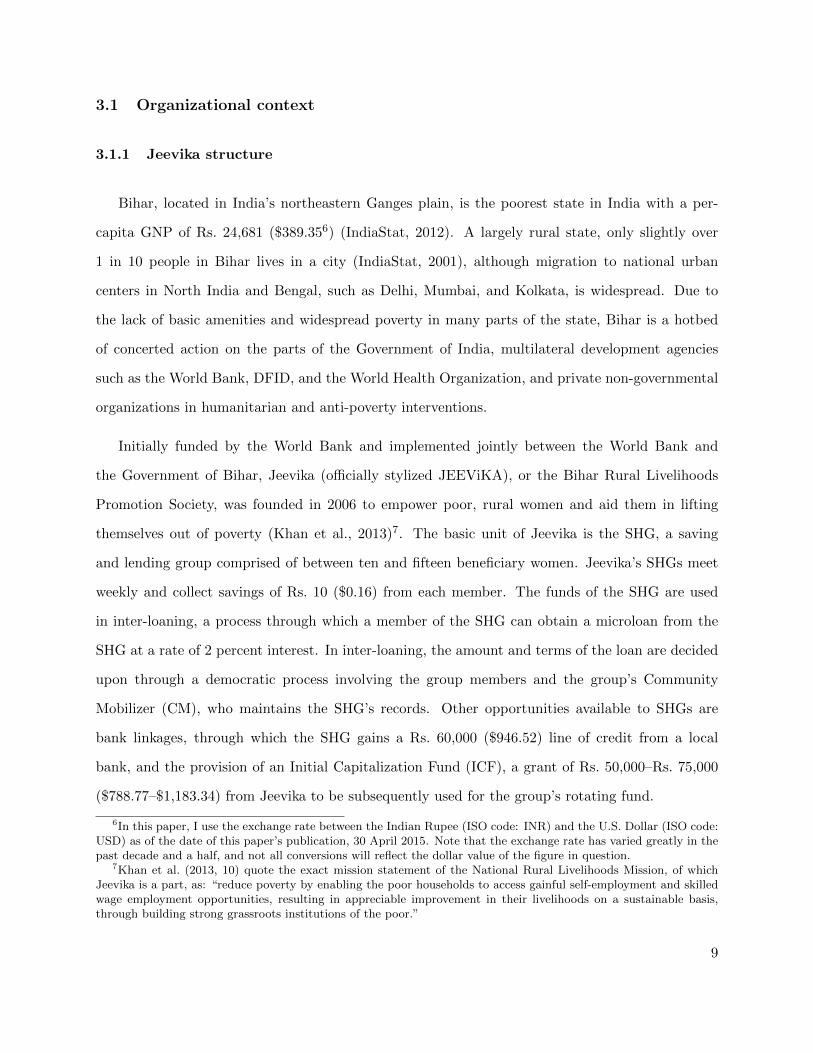
4 Averages of the dependent variables across the four districts studied: number of
loans taken by the average SHG member, lifetime amount of money borrowed by the
average SHG member, and lifetime savings of the average SHG member. . . . . . . . 16
5 Prevalence of messages delivered in each district. . . . . . . . . . . . . . . . . . . . . 18
6 Proportion of groups with each mobilizer present at the time of mobilization, by
district. . . . . . . . . . . . . . . . . . . . . . . . . . . . . . . . . . . . . . . . . . . . 20
7 Averages of the dependent variables across the four districts studied: number of
loans taken by the average SHG member, lifetime amount of money borrowed by the
average SHG member, and lifetime savings of the average SHG member. . . . . . . . 21
8 Time since formation of each group (in days), with a normal distribution function
with corresponding mean and standard deviation superimposed. . . . . . . . . . . . 21
9 Distribution of group size, in number of members. . . . . . . . . . . . . . . . . . . . 22
List of Tables
1 Correlation between dependent variables, control variables, and independent vari-
ables, excluding message variables. . . . . . . . . . . . . . . . . . . . . . . . . . . . . 15
2 Regressions of the mobilizer variables on each different message extracted from group
interview transcripts. . . . . . . . . . . . . . . . . . . . . . . . . . . . . . . . . . . . . 19
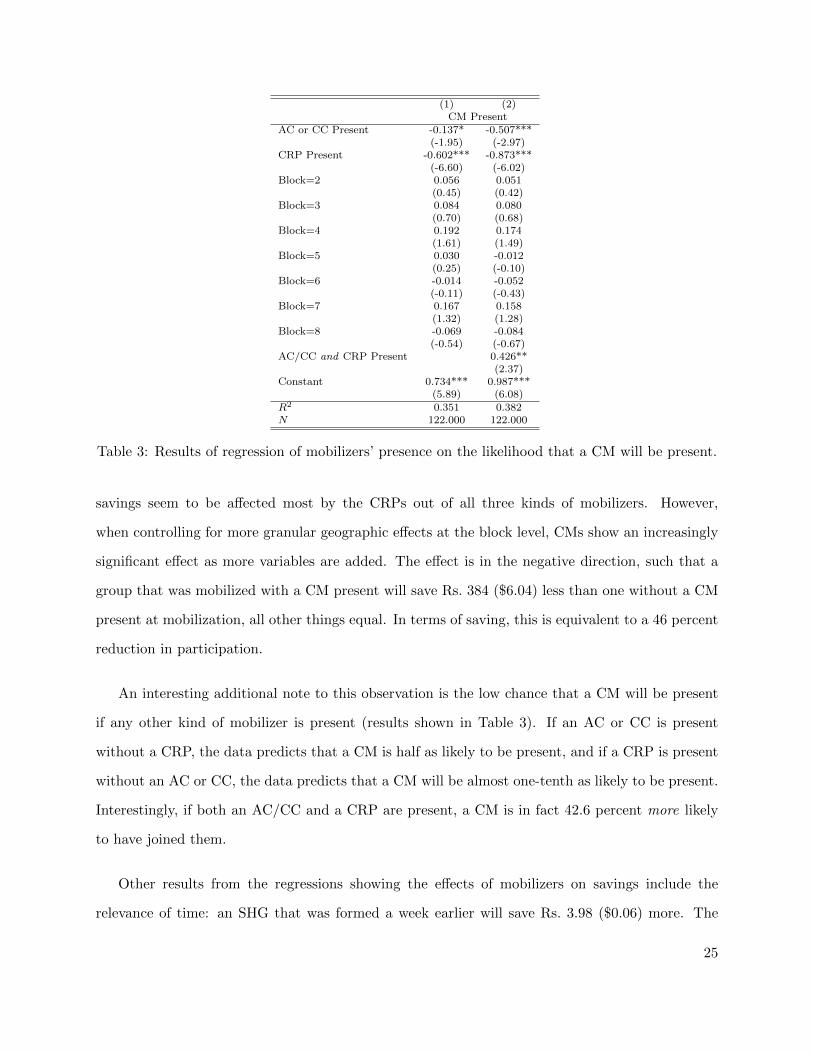
3 Results of regression of mobilizers’ presence on the likelihood that a CM will be
present. . . . . . . . . . . . . . . . . . . . . . . . . . . . . . . . . . . . . . . . . . . . 25
4 Regression results of mobilizers on average per member number of loans taken. . . . 37
5 Regression results of mobilizers on average per member loan amount (Rs.). . . . . . 38
6 Regression results of mobilizers on average per member savings. . . . . . . . . . . . . 39
vii

7 Regression results of messages on average per member number of loans taken. . . . . 40
8 Regression results of messages on average per member loan amount (Rs.). . . . . . . 41
9 Regression results of messages on average per member savings. . . . . . . . . . . . . 42
viii
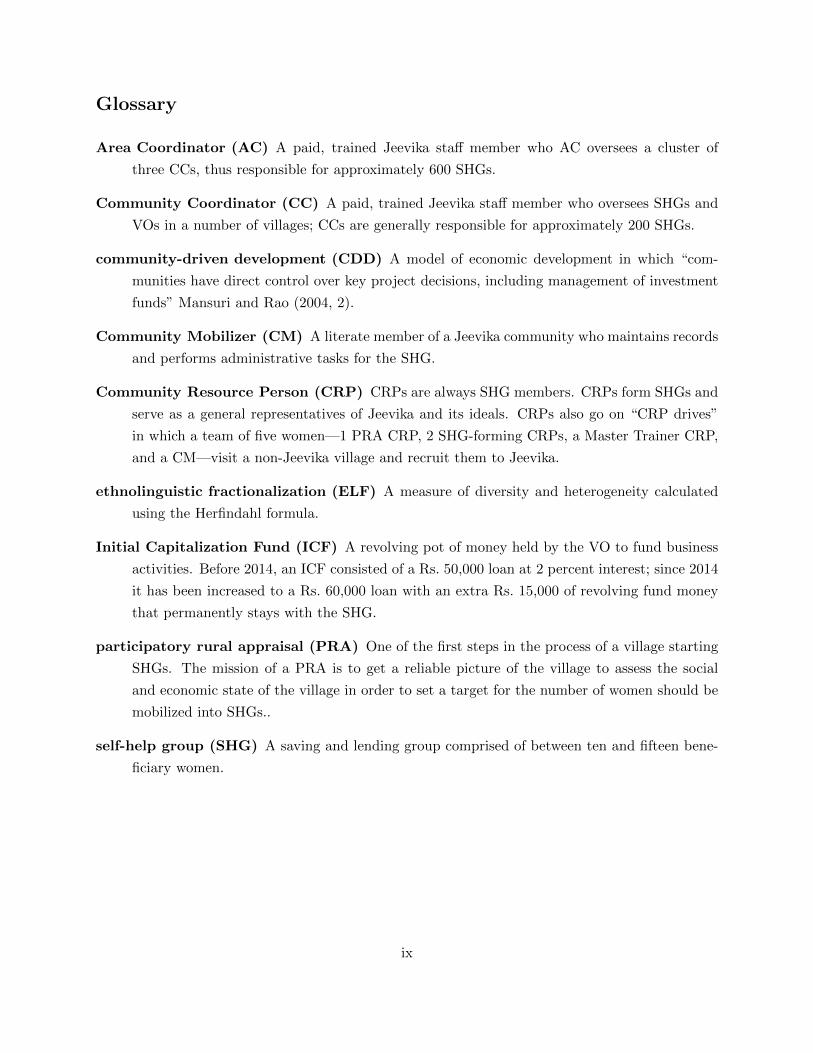
Glossary
Area Coordinator (AC) A paid, trained Jeevika staff member who AC oversees a cluster of
three CCs, thus responsible for approximately 600 SHGs.
Community Coordinator (CC) A paid, trained Jeevika staff member who oversees SHGs and
VOs in a number of villages; CCs are generally responsible for approximately 200 SHGs.
community-driven development (CDD) A model of economic development in which “com-
munities have direct control over key project decisions, including management of investment
funds” Mansuri and Rao (2004, 2).
Community Mobilizer (CM) A literate member of a Jeevika community who maintains records
and performs administrative tasks for the SHG.
Community Resource Person (CRP) CRPs are always SHG members. CRPs form SHGs and
serve as a general representatives of Jeevika and its ideals. CRPs also go on “CRP drives”
in which a team of five women—1 PRA CRP, 2 SHG-forming CRPs, a Master Trainer CRP,
and a CM—visit a non-Jeevika village and recruit them to Jeevika.
ethnolinguistic fractionalization (ELF) A measure of diversity and heterogeneity calculated
using the Herfindahl formula.
Initial Capitalization Fund (ICF) A revolving pot of money held by the VO to fund business
activities. Before 2014, an ICF consisted of a Rs. 50,000 loan at 2 percent interest; since 2014
it has been increased to a Rs. 60,000 loan with an extra Rs. 15,000 of revolving fund money
that permanently stays with the SHG.
participatory rural appraisal (PRA) One of the first steps in the process of a village starting
SHGs. The mission of a PRA is to get a reliable picture of the village to assess the social
and economic state of the village in order to set a target for the number of women should be
mobilized into SHGs..
self-help group (SHG) A saving and lending group comprised of between ten and fifteen bene-
ficiary women.
ix


1 Introduction
Community-driven development (CDD) falls under the umbrella of participatory development,
a movement in development theory and practice calling for the consideration of the needs and wants
of beneficiaries and the use of local knowledge to determine the contextual factors that should af-
fect a program’s design. In CDD programs, this framework is realized through active beneficiary
participation in the design, implementation, and management of the project; Mansuri and Rao
(2004, 2) emphasize that in CDD, “communities have direct control over key project decisions,
including management of investment funds.” CDD and its related philosophy, community-based
development, have long been considered a breakthrough innovation in the methodology of interna-
tional development, especially in the realm of anti-poverty, health, and sanitation initiatives. This
is reflected in the current boom in interest in participatory and community development; the World
Bank alone has invested over $85 billion in participatory programs (Mansuri and Rao, 2013, 15).
Due to the local and contextual nature of CDD programs, they generally begin in small-scale
pilot tests of the program, closely monitored by evaluators and implementers. Because of this situa-
tion, CDD programs face unique challenges in expansion and ‘scaling-up’ compared to development
programs operating under different models, especially top-down or technocratic development mod-
els. In particular, it is often difficult to use standard methods of recruitment (or “mobilization,” in
the language of community organizing), since the methods that work in one community may prove
unhelpful in another. This leads from the understanding that communities are “fluid, dynamic,
and differentiated, rather than static and homogenous” (Mathie and Cunningham, 2005, 175).
Currently, published studies on the successes and failures of the scaling-up process focus on
the institutional and organizational factors that lead CDD programs to either scale up effectively
or stagnate. However, this approach fails to consider what may be the most important factor in
deciding the extent of a CDD program’s success or failure: the decisions of potential beneficiaries
to join or not, and the related question of the locus of their motivations in joining the program.
A beneficiary with intrinsic motivation can be expected to participate considerably more and thus
achieve more successes, both tangible and intangible, than a beneficiary driven only by external
1
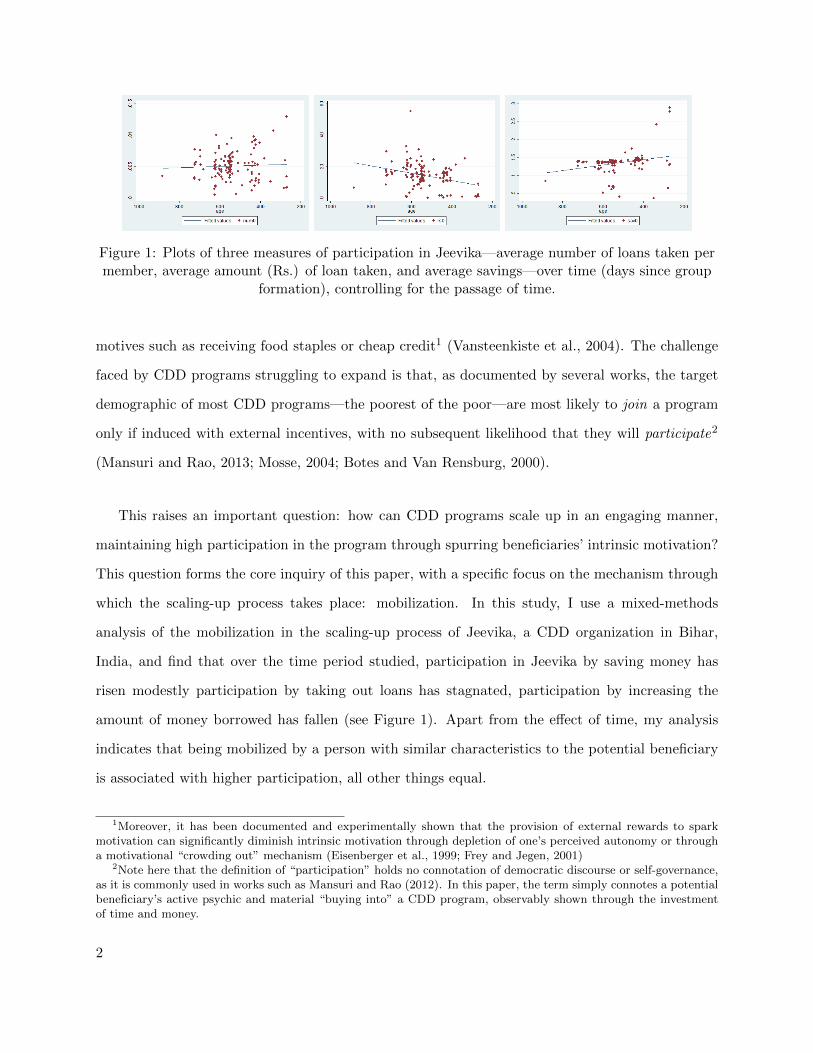
Figure 1: Plots of three measures of participation in Jeevika—average number of loans taken permember, average amount (Rs.) of loan taken, and average savings—over time (days since group
formation), controlling for the passage of time.
motives such as receiving food staples or cheap credit1 (Vansteenkiste et al., 2004). The challenge
faced by CDD programs struggling to expand is that, as documented by several works, the target
demographic of most CDD programs—the poorest of the poor—are most likely to join a program
only if induced with external incentives, with no subsequent likelihood that they will participate2
(Mansuri and Rao, 2013; Mosse, 2004; Botes and Van Rensburg, 2000).
This raises an important question: how can CDD programs scale up in an engaging manner,
maintaining high participation in the program through spurring beneficiaries’ intrinsic motivation?
This question forms the core inquiry of this paper, with a specific focus on the mechanism through
which the scaling-up process takes place: mobilization. In this study, I use a mixed-methods
analysis of the mobilization in the scaling-up process of Jeevika, a CDD organization in Bihar,
India, and find that over the time period studied, participation in Jeevika by saving money has
risen modestly participation by taking out loans has stagnated, participation by increasing the
amount of money borrowed has fallen (see Figure 1). Apart from the effect of time, my analysis
indicates that being mobilized by a person with similar characteristics to the potential beneficiary
is associated with higher participation, all other things equal.
1Moreover, it has been documented and experimentally shown that the provision of external rewards to sparkmotivation can significantly diminish intrinsic motivation through depletion of one’s perceived autonomy or througha motivational “crowding out” mechanism (Eisenberger et al., 1999; Frey and Jegen, 2001)
2Note here that the definition of “participation” holds no connotation of democratic discourse or self-governance,as it is commonly used in works such as Mansuri and Rao (2012). In this paper, the term simply connotes a potentialbeneficiary’s active psychic and material “buying into” a CDD program, observably shown through the investmentof time and money.
2

2 Previous literature
2.1 Scaling up
Previous studies on the challenges facing community-driven development projects while scaling
up have largely focused on the organizational and structural issues that may arise in the context of
community development, and have in doing so taken out of the equation the beneficiary’s agency
to choose her own level of participation.
For instance, in his analysis of the scaling-up processes of two CDD projects headed respectively
by Indian and Nepali NGOs, the National Agricultural Bank for Agriculture and Rural Development
(NABARD) and the Nirdhan Uttthan Bank Limited (NUBL), Sharma (2004) demonstrates that the
projects would not have been able to expand without the aid of the federal and state governments.
The paper comments that one of the most helpful factors to effectively expanding the projects and
reaching a larger beneficiary base was the support of the governments of India and Nepal in the
form of subsidized, “priority-sector” lines of credit.
The paper also comments that the two projects differed in that NUBL provided banking services
directly to beneficiaries and NABARD used third-party financial organizations to provide banking
services. Thus, “in the case of NABARD, the dynamics of group formation and the quality of
the group’s interaction with the financial institution is greatly conditional on the type of NGO
and bank selected to service the group” (Sharma, 2004). However, the author claims that both
NUBL and NABARD benefited from having standard rules of conduct and basic service delivery
mechanisms. Commenting on NUBL, especially, Sharma speaks of “methodologically-imposed lim-
itations,” such as the labor-intensive practice of visiting each village to recruit, rather than opening
central branches serving several villages. While these findings are useful from a high-level policy
perspective, they stem from the unreliable assumption that all beneficiaries will join the program
if given the opportunity—which sometimes turns out not to be the case.
Many papers evaluating the overall successes and failures of CDD projects cite the critical
importance of many different contextual variables contributing the ability of a project to function,
3
let alone achieve its intended impact on the community in which it works. Wolff (2013) echoes
Binswanger and Aiyar (2003) and Mansuri and Rao (2004) in positing, “the most important aspect
of a community development project is that it fits the local context as best as possible.” Mansuri
and Rao (2012) also elaborate on this point, citing “inequality, history, geography, the nature of
social interactions, networks, and political systems” as contextual features that can lead to the
success or failure of a CDD project.
2.2 Evaluation
Scholarly authors and works disagree on how a project involving women’s self-help groups
(SHGs) should be evaluated. Mansuri and Rao (2012) call for contextualization and customization
of the monitoring and evaluation components of different groups and encourage innovation among
evaluation teams, giving the example of the emerging availability of SMS project updates and other
mobile technologies that can be employed to effectively track various the indicators chosen by the
monitoring and evaluation team.
In their study of women’s SHGs in Andhra Pradesh, India, Galab and Rao (2003) name the
two parameters of evaluation as poverty alleviation and women empowerment. Within women
empowerment, there are three dimensions of outcomes: the first, “power to,” includes basic abilities
to perform necessary and desired roles and functions. The second, “power with,” includes the power
of collective action with other women members of the community to negotiate their status. Finally,
“power within” includes what (Galab and Rao, 2003, 1274) call “strategic gender awareness”, or
questioning at a deep level the structure of power among genders. A successful women’s SHG
project, the authors claim, will empower women among all of these dimensions, as well as lift them
out of poverty in terms of their income or consumption.
To Sanyal (2009), women’s empowerment is intrinsically linked to escaping the strict bonds of
the patriarchal culture of rural India, which includes limits on women’s vocations, mobility, choice of
social networks, and ability to make household decisions. In the case of Sanyal (2009), empowerment
not only involves engaging in individual social, economic, and political action (studied in other works
4
such as Hashemi et al. (1996)), but collective action as well. In a sociological interview study of
400 women in 59 microfinance groups (organizationally similar to SHGs), she found that the simple
act of having regular meetings of a microfinance group led one third of the study participants to
organize collective action.
2.3 Social capital
Social capital is a piece of theoretical technology that has emerged into the development lit-
erature in the past fifteen years. The definition employed by Woolcock (1998, 153), summarizing
generalizations and definitions from social scientists from the early 1990s, begins from the premise
that social capital constitutes “the information, trust, and norms of reciprocity inhering in one’s
social networks.” This definition clearly implies that the main detrimental consequence of low lev-
els of social capital is the inability to cohere in groups to perform actions that would collectively
benefit the members of the groups.
2.3.1 Implications of social capital theory
Quoting Robert Putnam’s seminal work (Putnam, 1995), Woolcock elaborates that the conse-
quences of using pre–social theory models to develop models of economic development are “propos-
als for strengthening market economies and democratic institutions [in developing and transitional
countries that] center almost exclusively on deficiencies in financial and human capital (thus calling
for loans and technical assistance)” (Woolcock, 1998, 154). Applying this generalization to the
analysis of development programs is crucial because without social capital, it would be expected
that any community would be able to solve all of its economic development challenges with the
simple injection of money and training on how to use the money—which, time and again, has
proven not the case (Woolcock, 2002; Narayan, 1999).
As pointed out by Narayan (1999) and Woolcock (1998), social capital has the ability to hinder
economic development as well as help. Rigid social structures that produce in-group/out-group
dynamics—one potential outcome of a society with high overall social capital—can generate polar-
ized outcomes between elites and the underclass. Social norms excluding members of society on the
5

basis of gender, caste, tribe, or ethnicity can significantly impede the flow of economic, physical,
and human capital (Narayan, 1999). Coleman (1988) examines the effect that different rates of
social capital can have on the formation of human capital: specifically, he finds that high-schoolers
with low levels of social capital have a significantly higher likelihood of dropping out. This effect is
compounded by social structures in which norms prevent women, for instance, from even attending
school at all.
Despite the possible negative implications of high social capital, issues of low social capital
present significant roadblocks to the expansion of CDD programs. A main hypothesis put forth
in this paper is that low levels of social capital among beneficiaries and mobilizers during the
mobilization process forms a main constraint affecting the participation of beneficiaries in Jeevika.
2.3.2 Measuring social capital
A common proxy for the level of social capital is the level of participation in formal institutions
of civil society3. By default, participation in Jeevika is participation in a formal grassroots, civil
society organization. Thus, measuring social capital by participation in civil society institutions in
this study involves a circular argument about social capital—that high social capital is reflected in
high participation in institutions like Jeevika, and that if we observe high participation, it shows
that there is high social capital.
This paper additionally examines the concept of ethnolinguistic fractionalization (ELF), a mea-
sure of diversity and heterogeneity. ELF is a measure of diversity among groups in a particular
population. Here, ELF is calculated using the Herfindahl formula, modified for the purposes of this
study. That is, the statistic takes the form
ELF =n∑
i=1
(Ni
N)2
where an SHG with N members includes castes4 i = 1, 2, · · · , n, each caste having a share NiN in
3For more on the link between formal institutions and social capital, see (among others) Glaeser et al. (2002),Knack and Keefer (1997a), and Grootaert and van Bastelaer (2002).
4It is important to note here that other groups, as well as official government caste groupings, are included in the
6
the SHG on whole.
As a macroeconomic concept, ELF is now understood to be a critical determinant of growth,
and is used in all notable cross-country models of economic growth and development (Easterly et al.,
2006). Although the index—especially the country-level estimates calculated during the emergence
of the statistic’s use—is only a rough estimation of the actual social situation of a particular region
or country5, the calculation in this study is at the SHG level, allowing for a granularity of analysis
that lends it additional explanatory power.
2.4 Models of aid and development
An important contribution of this paper is the development of new tools and strategies—for
instance, documenting the messages imparted by mobilizers—in order to gauge the effectiveness of
the CDD model. As discussed above, CDD operates under the premise that local knowledge and
beneficiary participation can yield the most effective results for the personal, social, economic, and
political development of a community.
This view contrasts sharply to models of economic development that focus solely on provid-
ing economic and human capital to communities based on their needs, like the model pursued
in the Millennium Villages Project headed by Jeffrey Sachs (Murphy, 2014; Easterly, 2014). In
several demonstration villages, mainly in East Africa, Sachs proposed that each impoverished in-
habitants receive roughly $100 per year while concurrently receiving state-of-the-art improvements
to sanitation, power, education, roads, and other infrastructure systems. The main element of
these projects, as commented on by scholar and journalist Sam Rich (2007) below, is the immense
scrutiny provided to every minute need of the villages and the wealth of economic capital available.
Inside a concrete compound at the headquarters of the Millennium Villages Project,
development experts sat at computer monitors in glass-walled offices. As I entered,
the receptionist at the front desk was on the phone: “You need notebooks?. . . How
calculation of ELF in this paper, including one group of Scheduled Tribes (Adivasis) and seven internal groupings ofMuslims.
5For a more in-depth analysis of the shortcomings of ELF as a determinant of growth, see Posner (2004)
7
many?. . . Three hundred, is that all? Right, I’ll order them for you tomorrow. You’ll
get them in a few days.”
I’ve spent the last five years in Africa, where I’ve worked with outfits ranging from big
international nongovernmental organizations to tiny one-man-band agencies, but I’ve
never seen an order made as breezily as this. At most NGOs, the procurement even of
stationery entails filling out forms in triplicate and long delays. (Rich, 2007)
A main criticism of the Millennium Villages Project, as well as Jeffrey Sachs’ program of “shock
therapy” is its emphasis on the provision of economic or human capital for the solution of problems
that may have a much more knotty underlying cause than a simple lack of money or expertise
(Easterly, 2014). Another is the prediction that interventions that rely heavily on the raising
and disbursing of enormous aid funds to small villages with evolving needs is not a sustainable
or scalable model of development (Rosen, 2014). This study comments on this generalization by
further uncovering the factors that allow for flexibility in the scale-up process in a program that
relies more heavily on local capital and expertise than on an external aid fund.
3 Context and methodology
New data for this project came from a mixed qualitative/quantitative survey administered to
members of 122 SHGs in four districts in Bihar, India. All participants were members or former
members of SHGs formed and run as part of Jeevika, the main program run by the Bihar Rural
Livelihoods Promotion Society, an independent agency of the Ministry of Rural Development of
the Government of India. These data were analyzed using a number of qualitative and econometric
methods.
8
3.1 Organizational context
3.1.1 Jeevika structure
Bihar, located in India’s northeastern Ganges plain, is the poorest state in India with a per-
capita GNP of Rs. 24,681 ($389.356) (IndiaStat, 2012). A largely rural state, only slightly over
1 in 10 people in Bihar lives in a city (IndiaStat, 2001), although migration to national urban
centers in North India and Bengal, such as Delhi, Mumbai, and Kolkata, is widespread. Due to
the lack of basic amenities and widespread poverty in many parts of the state, Bihar is a hotbed
of concerted action on the parts of the Government of India, multilateral development agencies
such as the World Bank, DFID, and the World Health Organization, and private non-governmental
organizations in humanitarian and anti-poverty interventions.
Initially funded by the World Bank and implemented jointly between the World Bank and
the Government of Bihar, Jeevika (officially stylized JEEViKA), or the Bihar Rural Livelihoods
Promotion Society, was founded in 2006 to empower poor, rural women and aid them in lifting
themselves out of poverty (Khan et al., 2013)7. The basic unit of Jeevika is the SHG, a saving
and lending group comprised of between ten and fifteen beneficiary women. Jeevika’s SHGs meet
weekly and collect savings of Rs. 10 ($0.16) from each member. The funds of the SHG are used
in inter-loaning, a process through which a member of the SHG can obtain a microloan from the
SHG at a rate of 2 percent interest. In inter-loaning, the amount and terms of the loan are decided
upon through a democratic process involving the group members and the group’s Community
Mobilizer (CM), who maintains the SHG’s records. Other opportunities available to SHGs are
bank linkages, through which the SHG gains a Rs. 60,000 ($946.52) line of credit from a local
bank, and the provision of an Initial Capitalization Fund (ICF), a grant of Rs. 50,000–Rs. 75,000
($788.77–$1,183.34) from Jeevika to be subsequently used for the group’s rotating fund.
6In this paper, I use the exchange rate between the Indian Rupee (ISO code: INR) and the U.S. Dollar (ISO code:USD) as of the date of this paper’s publication, 30 April 2015. Note that the exchange rate has varied greatly in thepast decade and a half, and not all conversions will reflect the dollar value of the figure in question.
7Khan et al. (2013, 10) quote the exact mission statement of the National Rural Livelihoods Mission, of whichJeevika is a part, as: “reduce poverty by enabling the poor households to access gainful self-employment and skilledwage employment opportunities, resulting in appreciable improvement in their livelihoods on a sustainable basis,through building strong grassroots institutions of the poor.”
9
Education Gender Origin
AC/CC High (Master’s degree) Male OutsideCM Literate (Secondary) Any Inside
CRP Illiterate Female Outside
Figure 2: 3 × 3 matrix of potential mobilizers and their respective attributes. With regard to the“origin” of the mobilizer, ‘outside’ and ‘inside’ refer to the social position of the potential
mobilizer vis-a-vis the village.
Villages with Jeevika groups typically start with four to five SHGs, while mature villages in the
program can support many dozens of groups comprising most of the lower-caste married women in
the village. SHGs usually serve groups of women who live geographically close to each other, and
due to the traditional Bihari organization of villages into hamlets or tolas that are homogenous by
caste, SHGs likewise tend to be homogeneous by caste and religion (Majumdar, 2014). The data
used for this study follows this trend of relative homogeneity; while about three in eight groups were
diverse by caste or religion, only 16.3 percent of groups had representation from both Hindus and
Muslims. The average ELF index across all groups is 0.152, with a comparatively large standard
deviation of 0.216.
A counteracting factor of intra-group homogeneity is the diversity encountered in Village Or-
ganizations, federated groups of ten to fifteen SHGs that play a major role in the dissemination of
various types of public aid schemes to SHG members. Village organizations are comprised of the
elected officers of the SHGs represented in the organization, and due to their size (representing a
total of between 100 and 225 women), many, if not most, VOs in the districts surveyed were diverse
by both caste and religion.
3.1.2 The mobilization process
This study focuses on the processes of mobilization in Jeevika—that is, the ways in which
target individuals are caused to form SHGs by external agents of Jeevika. A general protocol for
mobilization is sketched out below.
Mobilization comes about in one of three contexts. By Jeevika’s policy, the first SHGs in each
village are to be formed by a team of Community Resource Persons (CRPs), Jeevika members
10
from another village who are paid to spend 45 days in each village, conducting a participatory
rural appraisal (PRA) including identification of the poorest of the poor, forming SHGs through
motivational speaking and the sharing of stories and songs, and training the SHG members in three
modules of training explaining the social causes of poverty and the SHG model.
Following the formation of the first groups by the CRPs, other groups come to be formed in the
village through the efforts of Jeevika staff organizers, such as Community Coordinators (CCs) and
Area Coordinators (ACs). While CCs are responsible for managing approximately 200 groups, ACs
are responsible for managing three CCs, or 600 SHGs, in a contiguous geographical area. CMs,
literate, non-beneficiary members of the village community who are charged with maintaining the
record books of 5–11 SHGs in the same village. CMs also often act as representatives or coordinators
of the Village Organizations in their locale.
In practice, groups may be mobilized by CRPs, ACs, CCs, or CMs. While it is most directly the
task of CRPs to form new groups and mobilize women to join Jeevika, ACs and CCs often either
accompany CRPs to their target villages or form groups independently of CRPs, responding to
pressure to meet mandatory targets for group saturation set by block- and district-level authorities.
CMs form groups when petitioned by potential beneficiaries who wish to join Jeevika, as well as
for their own benefit, since CMs receive higher stipends for overseeing 1–5, 6–10, and more than 10
groups.
Additionally, the mobilization process does not always involve the educational and empower-
ment messages put forth by official Jeevika mobilization trainings: mobilizers sometimes use tactics
they believe will entice the maximum number of potential beneficiaries to join SHGs. When asked
what messages spurred them to join Jeevika, many respondents to the survey in this study men-
tioned material benefits that they were told they could expect for free or at a subsidized cost,
including food staples (wheat; rice; salt; oil), household necessities (soap; cloth; toilets), or finan-
cial benefits (cheap, easy-to-access credit; cash transfers). In fact, Jeevika does not provide any
of the above material benefits to its beneficiaries, apart from loans. These incentives are used to
encourage potential members, especially the poorest of the poor, to join Jeevika. However, these
incentives backfire, as they do not cause intrinsic motivation for the members to join and actively
11

Figure 3: Map of Bihar with the four districts in which surveys were conducted highlighted.
participate in their Self-Help Group.
3.2 Methodology
3.2.1 Sampling strategy
In August 2014, I led a team of three independent surveyors funded by the World Bank in col-
lecting data from beneficiaries of Jeevika SHGs formed between 5 September 2012 and 27 November
2013 by CRPs, Jeevika staff (ACs and CCs), and CMs. Of the eight districts with Jeevika activity
at the time of formation, four were selected by random; within each district, two blocks were se-
lected at random, and three villages were selected at random from these blocks in which to conduct
data collection8.
It is important to note that sub-national administrative levels in India differ significantly from
their counterparts in other countries, largely due to India’s geography and tremendous population
density. A district is a division of a state, geographically analogous to a county in the United
States. However, in terms of population, districts are much larger—for instance, the district of
Madhubani is slightly smaller than the US state of Louisiana. There are 37 districts in Bihar. Each
8See Appendix A for the list of locations surveyed and the numbers corresponding to each location used in thisstudy.
12
district is comprised of a number of blocks, each with dozens of villages; the number of blocks in
the four districts studied ranges from 21 (Madhubani) to 7 (Khagaria).
The four districts chosen contrast in interesting ways that are significant for the analysis of
the data collected. For instance, while all of the blocks in this study were entered less than to
years ago, certain blocks in Khagaria and Madhubani (Districts 1 and 2, respectively) comprised
part of of the original four districts where Jeevika was piloted by the World Bank between six
and eight years before this study. In contrast, the first blocks in West Champaran and Gopalganj
(Districts 3 and 4, respectively) were entered in the latest round of mobilization, beginning in 2013.
West Champaran and Gopalganj are also located in the far northwest of the state of Bihar, an
impoverished area ravaged over the past decades by the violent activities of the Naxalite Maoist
rebels. On whole, the contrast between Districts 1 and 2 and Districts 3 and 4, and geographical
idiosyncrasies on whole, plays a large role in explaining variation in program outcomes.
3.2.2 Survey strategy
Within each village, one or more CMs were requested to arrange meetings of between 7 and
15 SHG members, with whom a surveyor conducted a focus group discussion. Following this,
the same surveyor conducted two one-on-one interviews: one each with a semi-randomly chosen
office-bearer and non-office-bearer. While the interviews were conducted using questionnaires in
Hindi, interviewers and interviewees also used local languages such as Bhojpuri and Maithili. In
addition to paper and digital notation of responses, the interviewers also used audio recordings to
capture the responses in individual interviews and focus group discussions. Rosters were collected
for each SHG with each member’s name and caste as well as her total savings amount, total amount
withdrawn as a loan, and number of loans taken.
Questions on the questionnaires focused on collecting two types of data: information on the
methods of mobilization and the messages employed by the mobilizers to recruit the interviewees
to Jeevika, and questions designed to gauge the effectiveness of Jeevika. Both in groups and
individually, respondents were asked to recall what messages the mobilizer shared to convince
the respondent to join Jeevika, and they were also asked who the mobilizer was in relation to
13
them. In order to understand how Jeevika may have affected the respondents’ levels of social
capital and mobility in her community, respondents were asked to consider a number of scenarios
of economic issues she might confront such as lack of money to buy food, political issues such as
an extended closing of the village’s government ration shop, or social issues such as domestic abuse
or alcoholism. The respondents were also asked who they regularly confided in and looked to for
help; many respondents cited women they had met through Jeevika.
3.2.3 Analytical methods
Using Microsoft Excel and NVivo, a software package for qualitative analysis, I analyzed the field
notes collected from individual and group interviews for the messages that the interview participants
recalled being shared with them by their mobilizers. These messages were then organized into eight
themes by broad topic, as described in Section 4.2.1 below. Each instance of a theme’s mention
was recorded as a value of “1” for the corresponding dummy variable, with the variable taking a
value of “0” otherwise.
Factor analysis was used to condense message variables into more concise, highly explanatory
motivational incentives, but ultimately failed, because the message variables were already in their
most concise form—no hidden, underlying variable was found to be inducing covariance between
variables. In testing the suitability of the data for factor analysis, Bartlett’s test of sphericity yielded
a significant result (p < 0.0001). However, using the Kaiser-Meyer-Olkin Measure of Sampling
Adequacy, the message variables are shown to be already expressed in their most concise form,
with no underlying variables able to explain correlational or covariance matrices (KMO = 0.523,
slightly above the threshold of acceptability). The correlation between the dependent variables,
controls, and independent variables not used in factor analysis is shown in Table 1.
The association between outcomes, messages, mobilizers, and group characteristics was estab-
lished through OLS regression analysis of the latter three groups of variables on the outcome vari-
ables, and OLS regressions were also run to determine the relative tendencies of different mobilizers
to deliver certain messages. The results of these regressions is discussed in Section 4.2.1.
14
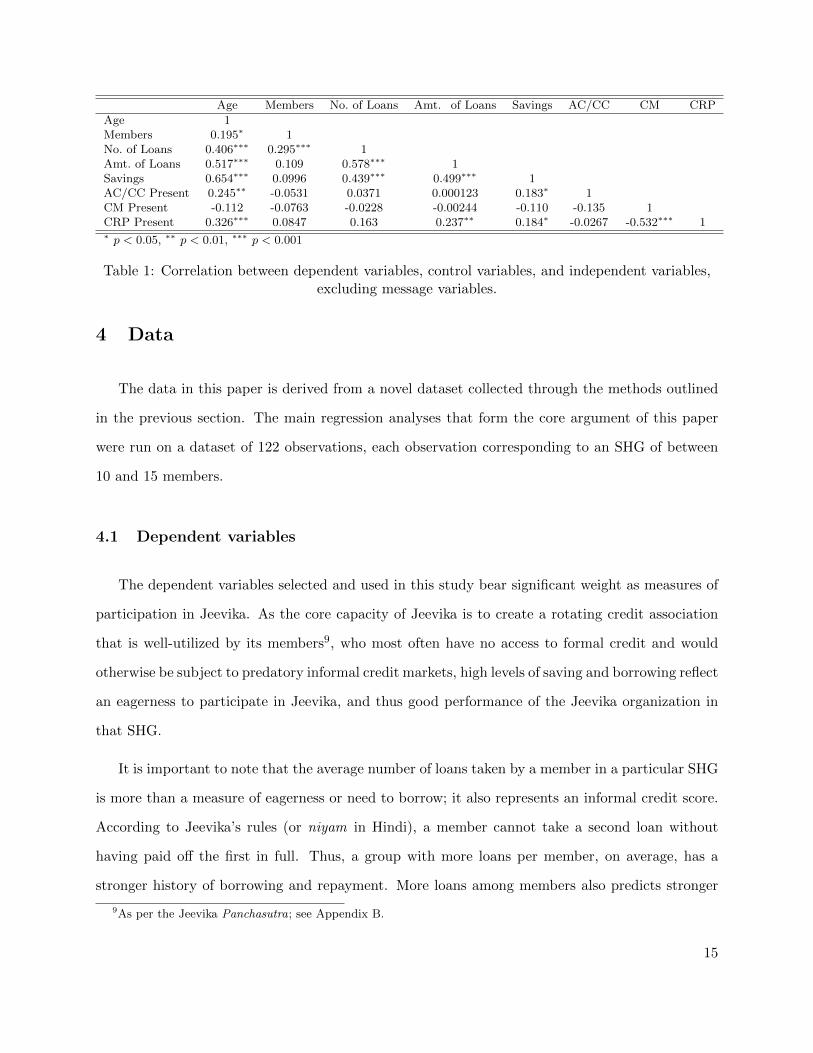
Age Members No. of Loans Amt. of Loans Savings AC/CC CM CRP
Age 1Members 0.195∗ 1No. of Loans 0.406∗∗∗ 0.295∗∗∗ 1Amt. of Loans 0.517∗∗∗ 0.109 0.578∗∗∗ 1Savings 0.654∗∗∗ 0.0996 0.439∗∗∗ 0.499∗∗∗ 1AC/CC Present 0.245∗∗ -0.0531 0.0371 0.000123 0.183∗ 1CM Present -0.112 -0.0763 -0.0228 -0.00244 -0.110 -0.135 1CRP Present 0.326∗∗∗ 0.0847 0.163 0.237∗∗ 0.184∗ -0.0267 -0.532∗∗∗ 1∗ p < 0.05, ∗∗ p < 0.01, ∗∗∗ p < 0.001
Table 1: Correlation between dependent variables, control variables, and independent variables,excluding message variables.
4 Data
The data in this paper is derived from a novel dataset collected through the methods outlined
in the previous section. The main regression analyses that form the core argument of this paper
were run on a dataset of 122 observations, each observation corresponding to an SHG of between
10 and 15 members.
4.1 Dependent variables
The dependent variables selected and used in this study bear significant weight as measures of
participation in Jeevika. As the core capacity of Jeevika is to create a rotating credit association
that is well-utilized by its members9, who most often have no access to formal credit and would
otherwise be subject to predatory informal credit markets, high levels of saving and borrowing reflect
an eagerness to participate in Jeevika, and thus good performance of the Jeevika organization in
that SHG.
It is important to note that the average number of loans taken by a member in a particular SHG
is more than a measure of eagerness or need to borrow; it also represents an informal credit score.
According to Jeevika’s rules (or niyam in Hindi), a member cannot take a second loan without
having paid off the first in full. Thus, a group with more loans per member, on average, has a
stronger history of borrowing and repayment. More loans among members also predicts stronger
9As per the Jeevika Panchasutra; see Appendix B.
15

Figure 4: Averages of the dependent variables across the four districts studied: number of loanstaken by the average SHG member, lifetime amount of money borrowed by the average SHG
member, and lifetime savings of the average SHG member.
future participation: as borrowers pay interest on loans, repayment with interest increases the
amount that SHG members can borrow in the future.
Understandably, the three outcome variables are significantly positively correlated with each
other, with r-values ranging from 0.44 (between savings and number of times a loan was withdrawn)
to 0.58 (between number of times a loan was withdrawn and the total amount in rupees of loans).
Across districts, the outcome variables are somewhat uniform (see Figure 4).
4.2 Independent variables
4.2.1 Messaging dummies
Eight variables relating to the message delivered by the mobilizer during the mobilization of
the SHG under study were derived and quantified from group and individual interview transcripts,
encoded respectively as savings, lending, poverty, food, govt, together, activities, and work.
If a message or related theme was mentioned in an interview, the value of the variable for that
observation (SHG) was set to “1”, “0” otherwise.
Savings and lending are perhaps the most straightforwardly understood messages, and also the
most common: if the interview participants recalled the mobilizer mentioning the incentive of saving
or lending through Jeevika—as they did in 88.5 and 87.7 percent of the time, respectively—the
message was understood as the mobilizer intended. Food is a related variable, but different in one
important way: in most cases, the participant recalled receiving a message such as “through Jeevika,
16

you will receive wheat” (Hindi: Jeevika se gehoon milegi). While some Village Organizations do
participate in wheat- and rice-buying operations, the perception that food will be “received” by
the potential Jeevika beneficiaries is inaccurate—the assumption being that it will be received free
of cost. The prevalence of this message (39.3 percent of interview participants reported hearing it)
shows clear misalignment between the incentives of the mobilizers and potential beneficiaries.
Government and work are other sites of potential disingenuity. Like food, these was most
often recalled in the formulation Jeevika se rozgaar/sarkaari sahayta milegi—“you will receive a
job/government help.” Government message was recalled much less frequently; only about 1 in 13
participants recalled it, whereas 1 in 5 participants recalled a message about jobs or work.
The second-most-prevalent message recalled was poverty, which usually was associated with a
message such as Jeevika se garibi ka samasya door ho jayenge—“though Jeevika, the problems of
poverty will be relieved.”
Finally, many participants recalled receiving messages about the Jeevika lifestyle, expressed in
the variables together and activities. Together captures a number of different sentiments recalled
as incentivizing messages from the mobilizers: examples include “you will come together as one”
(ekta ho jayengi), “you will sit together as an SHG” (samooh se milke baithayenge), and “you will
have a weekly meeting together” (sare sapta, aap logon milke ek baithak karenge); more than 2
in 5 participants recalled this message. Activities encompasses empowerment exercises performed
weekly by the SHGs, including singing songs together and introducing oneself to other members of
the SHG.
As shown in Figure 5, there is significant level of variation in the distribution of messages
delivered across districts. On whole, survey respondents in District 1, Khagaria, recalled a much
more diverse set of messages than in any other district. For instance, respondents in District
1, Khagaria, recalled significantly more mobilizers mentioning government help (p < 0.0510) and
group activities (p < 0.05). Respondents in District 4, West Champaran, recalled significantly
more mobilizers mentioning employment opportunities, and respondents in Khagaria mentioned
10The p-values listed in this paragraph are derived from χ2-tests of independence between the district variable andthe relevant messaging variable.
17

Figure 5: Prevalence of messages delivered in each district.
this variable significantly less (p < 0.001).
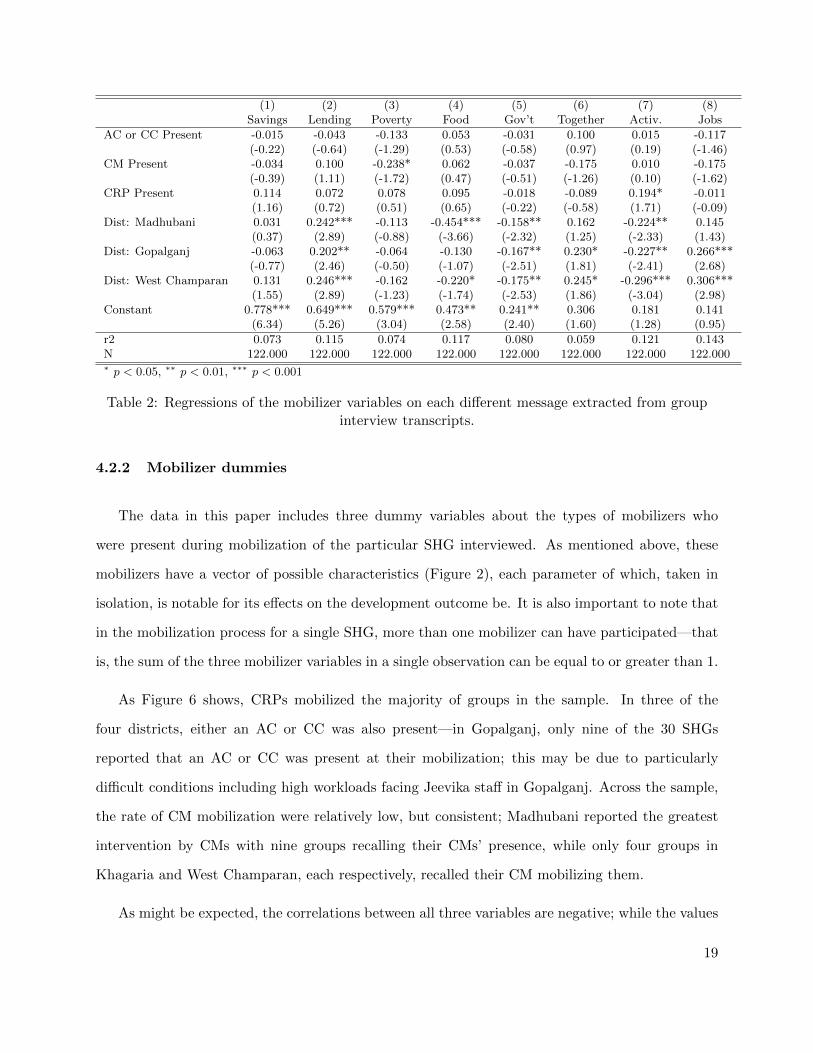
A regression calculating the propensity of different kinds of mobilizers to give different kinds of
messages (Table 2) shows little significant explanation of why particular messages are recalled by
survey respondents. Two interesting effects revealed by these regressions is that CMs, or having
a CM present during mobilization, is associated with 23.8% less delivery of messages relating to
poverty. This may be because when CMs mobilize new groups, they are sometimes formed at the
request of the potential beneficiaries, who would not need more information or incentive about Jee-
vika in order to join. Having a CRP present increases the probability that a message about Jeevika
activities conducted in SHGs by 19.4%; this is an intuitive result, because in general, CRPs narrate
their own experiences with Jeevika, which would naturally include the activities they participated
in at the beginning of every SHG meeting, like praying together and introducing themselves.
However, it should be noted that these results do not persist with a more granular geographic
control. When control variables at the block level are included in place of those at the district
level, the geographic control variables are the only variables with significant coefficients at the 10%
confidence level. For these regressions, the R2 value is also higher, ranging between 0.083 and 0.198,
in contrast to the R2 values shown in Table 2.
18
(1) (2) (3) (4) (5) (6) (7) (8)Savings Lending Poverty Food Gov’t Together Activ. Jobs
AC or CC Present -0.015 -0.043 -0.133 0.053 -0.031 0.100 0.015 -0.117(-0.22) (-0.64) (-1.29) (0.53) (-0.58) (0.97) (0.19) (-1.46)
CM Present -0.034 0.100 -0.238* 0.062 -0.037 -0.175 0.010 -0.175(-0.39) (1.11) (-1.72) (0.47) (-0.51) (-1.26) (0.10) (-1.62)
CRP Present 0.114 0.072 0.078 0.095 -0.018 -0.089 0.194* -0.011(1.16) (0.72) (0.51) (0.65) (-0.22) (-0.58) (1.71) (-0.09)
Dist: Madhubani 0.031 0.242*** -0.113 -0.454*** -0.158** 0.162 -0.224** 0.145(0.37) (2.89) (-0.88) (-3.66) (-2.32) (1.25) (-2.33) (1.43)
Dist: Gopalganj -0.063 0.202** -0.064 -0.130 -0.167** 0.230* -0.227** 0.266***(-0.77) (2.46) (-0.50) (-1.07) (-2.51) (1.81) (-2.41) (2.68)
Dist: West Champaran 0.131 0.246*** -0.162 -0.220* -0.175** 0.245* -0.296*** 0.306***(1.55) (2.89) (-1.23) (-1.74) (-2.53) (1.86) (-3.04) (2.98)
Constant 0.778*** 0.649*** 0.579*** 0.473** 0.241** 0.306 0.181 0.141(6.34) (5.26) (3.04) (2.58) (2.40) (1.60) (1.28) (0.95)
r2 0.073 0.115 0.074 0.117 0.080 0.059 0.121 0.143N 122.000 122.000 122.000 122.000 122.000 122.000 122.000 122.000∗ p < 0.05, ∗∗ p < 0.01, ∗∗∗ p < 0.001
Table 2: Regressions of the mobilizer variables on each different message extracted from groupinterview transcripts.
4.2.2 Mobilizer dummies
The data in this paper includes three dummy variables about the types of mobilizers who
were present during mobilization of the particular SHG interviewed. As mentioned above, these
mobilizers have a vector of possible characteristics (Figure 2), each parameter of which, taken in
isolation, is notable for its effects on the development outcome be. It is also important to note that
in the mobilization process for a single SHG, more than one mobilizer can have participated—that
is, the sum of the three mobilizer variables in a single observation can be equal to or greater than 1.
As Figure 6 shows, CRPs mobilized the majority of groups in the sample. In three of the
four districts, either an AC or CC was also present—in Gopalganj, only nine of the 30 SHGs
reported that an AC or CC was present at their mobilization; this may be due to particularly
difficult conditions including high workloads facing Jeevika staff in Gopalganj. Across the sample,
the rate of CM mobilization were relatively low, but consistent; Madhubani reported the greatest
intervention by CMs with nine groups recalling their CMs’ presence, while only four groups in
Khagaria and West Champaran, each respectively, recalled their CM mobilizing them.
As might be expected, the correlations between all three variables are negative; while the values
19
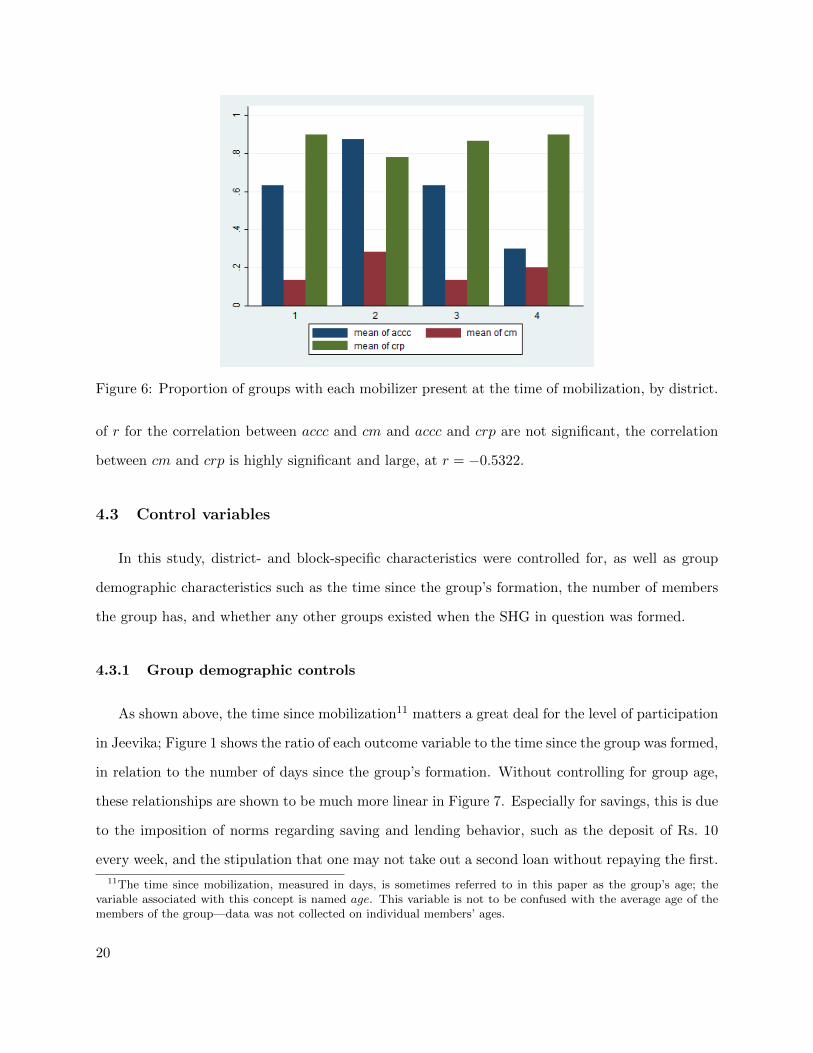
Figure 6: Proportion of groups with each mobilizer present at the time of mobilization, by district.
of r for the correlation between accc and cm and accc and crp are not significant, the correlation
between cm and crp is highly significant and large, at r = −0.5322.
4.3 Control variables
In this study, district- and block-specific characteristics were controlled for, as well as group
demographic characteristics such as the time since the group’s formation, the number of members
the group has, and whether any other groups existed when the SHG in question was formed.
4.3.1 Group demographic controls
As shown above, the time since mobilization11 matters a great deal for the level of participation
in Jeevika; Figure 1 shows the ratio of each outcome variable to the time since the group was formed,
in relation to the number of days since the group’s formation. Without controlling for group age,
these relationships are shown to be much more linear in Figure 7. Especially for savings, this is due
to the imposition of norms regarding saving and lending behavior, such as the deposit of Rs. 10
every week, and the stipulation that one may not take out a second loan without repaying the first.
11The time since mobilization, measured in days, is sometimes referred to in this paper as the group’s age; thevariable associated with this concept is named age. This variable is not to be confused with the average age of themembers of the group—data was not collected on individual members’ ages.
20

Figure 7: Averages of the dependent variables across the four districts studied: number of loanstaken by the average SHG member, lifetime amount of money borrowed by the average SHG
member, and lifetime savings of the average SHG member.
Figure 8: Time since formation of each group (in days), with a normal distribution function withcorresponding mean and standard deviation superimposed.
The age of groups in the sample is roughly normally distributed, as seen in 8, and has a minimum
of 267 days for Bhawani Jeevika SHG in the village of Madhuban in Andhrathadhi, Madhubani,
or slightly less than nine months since the mobilization of the group. The largest value for age
is 887 days, from Mithila Jeevika SHG, which was the first SHG formed in the village of Gaur,
Andhrathadhi, Madhubani, as it was formed at the beginning of April, 2012. The mean age of
groups, at 535 days (approximately one and one half years) was slightly less than the median of
549.5 days.
The groups in the sample all lie in the required range of 10-15 members, with the plurality (37.7
percent) having 12 members (see Figure 9). This may be in response to pressure from beneficiaries
21
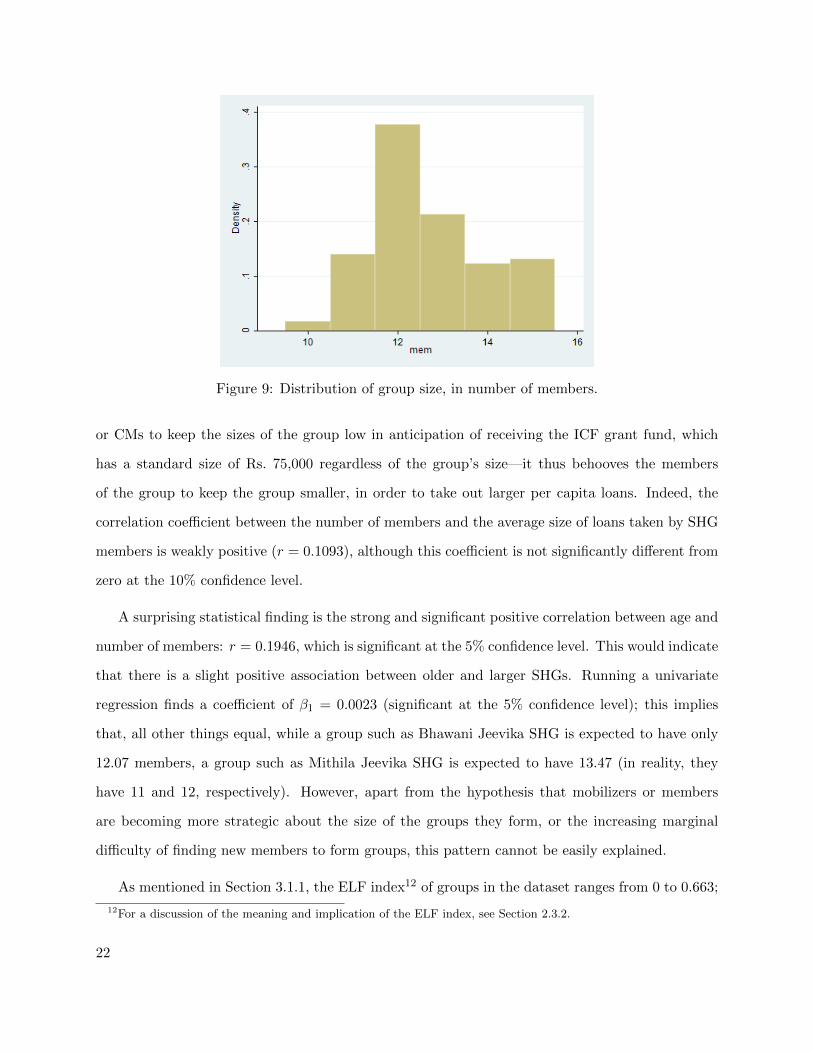
Figure 9: Distribution of group size, in number of members.
or CMs to keep the sizes of the group low in anticipation of receiving the ICF grant fund, which
has a standard size of Rs. 75,000 regardless of the group’s size—it thus behooves the members
of the group to keep the group smaller, in order to take out larger per capita loans. Indeed, the
correlation coefficient between the number of members and the average size of loans taken by SHG
members is weakly positive (r = 0.1093), although this coefficient is not significantly different from
zero at the 10% confidence level.
A surprising statistical finding is the strong and significant positive correlation between age and
number of members: r = 0.1946, which is significant at the 5% confidence level. This would indicate
that there is a slight positive association between older and larger SHGs. Running a univariate
regression finds a coefficient of β1 = 0.0023 (significant at the 5% confidence level); this implies
that, all other things equal, while a group such as Bhawani Jeevika SHG is expected to have only
12.07 members, a group such as Mithila Jeevika SHG is expected to have 13.47 (in reality, they
have 11 and 12, respectively). However, apart from the hypothesis that mobilizers or members
are becoming more strategic about the size of the groups they form, or the increasing marginal
difficulty of finding new members to form groups, this pattern cannot be easily explained.
As mentioned in Section 3.1.1, the ELF index12 of groups in the dataset ranges from 0 to 0.663;
12For a discussion of the meaning and implication of the ELF index, see Section 2.3.2.
22

the mean index is 0.152 due to a large number—63.1 percent of all groups—having no diversity
whatsoever, and thus an ELF of zero. 16.4 percent of all groups have at least one member from the
non-majority religion in the group (as recorded by the variable reldiv), indicating a high rate of
groups that are entirely homogeneous by religion13. This may also be because a disproportionately
low proportion of respondents in the sample are Muslim; while the overall proportion in Bihar is
about 1 in 5, only about 8.6 percent of members surveyed were Muslim. This gap was most severely
pronounced for Khagaria, in which fewer than 1 in 20 respondents were Muslim.
4.3.2 Geographic controls
Inter-group variation that could not be explained through any of the independent or control
variables above were often accounted for by dummy variables indexed to the SHG’s district or block
(see Figure 4 for a breakdown of outcome variables by district). These variables were coded “1” if
an SHG fell into a particular district or block and “0” otherwise; in regressions, the first variable
in each set was omitted to avoid issues pertaining to multicollinearity.
5 Analysis
In this section, OLS regression analysis of the data shows the following effect:
The OLS regressions yielding the results in Tables 4–9 all take the general form:
Y = β0 +
i∑β1(X1)i +
j∑β2(X2)j +
k∑β3(X3)k +
l∑β4(X4)l + ε
Where: Y is the dependent variable, one of the three participation outcomes, (X1)i is a set of
messaging dummy variables, (X2)j is a set of mobilizer dummy variables, (X3)k is a set of group-
level control variables, (X4)l is a set of geographic control variables, β0 is the constant regression
13Formally, reldiv = 1 when at least one member of the group is not Hindu and one member of the group is notMuslim. The Diverse variable, represented by div, takes a value of 1 when at least two members of the group do notshare the same value of caste.
23

coefficient,∑β1 · · ·
∑β4 is a set of the sums of the regression coefficients on X1 · · ·X4, and ε is an
error term, assumed to be i.i.d.
5.1 Effect of mobilizers on Jeevika participation
Simple regressions of the three mobilizer variables on each participation measure variable (Tables
4, 5, and 6, Column 1) show the importance of CRPs’ presence in the mobilization process to
subsequent participation. The coefficient on the CRP variable is always significant (p < 0.1),
and the effect is shown to have a huge effect on both savings and lending: all other things equal,
having a CRP present during mobilization will cause an average member to withdraw approximately
Rs. 4,750 ($74.77) more, and save about Rs. 100 ($1.57) more—equivalent to ten weeks’ saving.
Additionally, in these regressions, CMs are predicted to positively affect borrowing amounts and
ACs and CCs are predicted to positively affect savings.
However, these effects becomes murkier with the addition of more potentially explanatory vari-
ables. For instance, in Table 4, Column 2 shows that the effect of CRPs on number of loans taken
does not change when geographical controls are taken into account. However, Columns 3 and 4
demonstrate that the effect is overshadowed by the explanatory effect of the control variables, es-
pecially the variable of whether another SHG was present during mobilization: if one was, then,
all other things equal, members are predicted to take 0.8 fewer loans.
Similarly, Columns 2, 3, and 4 of Table 5 show that while the effect of CRPs on the amount of
money a member borrows is not diminished by the inclusion of messages or geographical controls—
either at the district or block level—it is diminished by the inclusion of the othershg variable, the
coefficient on which is significant and negative. Additionally, the table shows that older groups
borrow more than younger groups, all other things equal, and that the older groups that were
mobilized by ACs and CCs participate less than younger groups that were mobilized in the same
way.
The results of mobilizers on savings are perhaps the most interesting: without controlling for
geographic idiosyncrasies, or when controlling for geographic idiosyncrasies at the district level,
24
(1) (2)CM Present
AC or CC Present -0.137* -0.507***(-1.95) (-2.97)
CRP Present -0.602*** -0.873***(-6.60) (-6.02)
Block=2 0.056 0.051(0.45) (0.42)
Block=3 0.084 0.080(0.70) (0.68)
Block=4 0.192 0.174(1.61) (1.49)
Block=5 0.030 -0.012(0.25) (-0.10)
Block=6 -0.014 -0.052(-0.11) (-0.43)
Block=7 0.167 0.158(1.32) (1.28)
Block=8 -0.069 -0.084(-0.54) (-0.67)
AC/CC and CRP Present 0.426**(2.37)
Constant 0.734*** 0.987***(5.89) (6.08)
R2 0.351 0.382N 122.000 122.000
Table 3: Results of regression of mobilizers’ presence on the likelihood that a CM will be present.
savings seem to be affected most by the CRPs out of all three kinds of mobilizers. However,
when controlling for more granular geographic effects at the block level, CMs show an increasingly
significant effect as more variables are added. The effect is in the negative direction, such that a
group that was mobilized with a CM present will save Rs. 384 ($6.04) less than one without a CM
present at mobilization, all other things equal. In terms of saving, this is equivalent to a 46 percent
reduction in participation.
An interesting additional note to this observation is the low chance that a CM will be present
if any other kind of mobilizer is present (results shown in Table 3). If an AC or CC is present
without a CRP, the data predicts that a CM is half as likely to be present, and if a CRP is present
without an AC or CC, the data predicts that a CM will be almost one-tenth as likely to be present.
Interestingly, if both an AC/CC and a CRP are present, a CM is in fact 42.6 percent more likely
to have joined them.
Other results from the regressions showing the effects of mobilizers on savings include the
relevance of time: an SHG that was formed a week earlier will save Rs. 3.98 ($0.06) more. The
25

effect of one standard deviation in formation date is thus a whopping Rs. 62.43 ($0.98) in per-capita
savings, even holding all other factors constant. Table 6 also shows that for groups formed later,
CMs encourage more and more participation, such that holding other factors constant, having a
CM form a group a week later is associated with the group’s members saving Rs. 4.35 ($0.07) more.
Finally, savings are also affected by the identities of the members of the group: a religiously diverse
group will save Rs. 71.35 ($1.12) more, all other things equal.
5.2 Effect of messaging on Jeevika participation
Overall, mobilization messages are shown to give relatively little explanation of the variation in
participation outcomes in Jeevika compared to locale-specific, group-demographic, and mobilizer
variation. In fact, in a simple regression of messages on the number of times a Jeevika member
takes out a loan yields no significant right-hand-side variables other than the constant term, a point
estimate—in other words, the regression predicts that, on the basis of the messages given, all Jeevika
beneficiaries will borrow exactly 2.65 times. This is true regardless of the inclusion of mobilizers
(Table 7, Column 3) or block-specific controls (Column 5) in the regression or not; Column 6
elaborates that this effect (or lack thereof) persists when other controls are added to geographic
controls. On the other hand, Columns 2 and 4 show that one message, poverty, becomes significant
with the inclusion of group-demographic controls. This effect persists in the largest regression in
Column 7. The coefficient on poverty is negative; it indicates that the act of sharing a message
such as “Jeevika will get you out of poverty” is associated with borrowing 0.385 of one time less.
In a regression of all available explanatory variables except geographical controls on the average
per capita amount of money withdrawn by a Jeevika member (Table 8, Column 1), no message is
shown to have a significant effect; the same is true for a regression that includes block-level controls
(Column 4). Interestingly, the message activities is significant and negative when it its regressed on
the average total amount of loans along with block-level controls and mobilizer variables. This may
be a chance product of the omitted variables age and othershg, which are significantly correlated
with activities (r = 0.22; p ≈ 0.01 for both correlations, respectively).
In predicting the effects of messages on savings behavior among Jeevika members (Table 9),
26
two messages stand out: together and work, represented in Table 9 as “Togetherness” and “Jobs”.
Both variables have significant, relatively large, and negative regression coefficients14. The clear
result in this case is that messages such as “you will come together as one” and “you will receive
employment opportunities” hurt potential beneficiaries’ future participation levels.
6 Discussion
So far, this paper has found that while the the role and identity of a particular mobilizer
matters considerably to the level of participation found among beneficiaries, messages thought to
be positive, such as poverty, together, and work can actually lead to less participation. This section
brings some insights and theories from the literature to bear to find why these findings may have
arisen.
6.1 Implications for social capital theory
Like physical, human, or political capital, social capital exists because of the investment a
particular person contributes to it (Collier, 2002; Knack and Keefer, 1997b). Glaeser et al. (2002)
defines social capital for their own purposes as “. . . a person’s social characteristics—including social
skills, charisma, and the size of his Rolodex—which enables him to reap market and non-market
returns from interactions with others. As such, individual social capital might be seen as the social
component of human capital.” This definition heavily implies that besides tangible investments
in social capital one can make—such as a large Rolodex—one can also invest in intangible social
assets, like the relationships represented in the Rolodex. An individual is also endowed with a
stock of innate, idiosyncratic social capital (e.g. charisma, which cannot be honed and practiced
like “social skills”).
This is crucial for the current-day setting of Jeevika. Testimony from respondents to the survey
conducted for this study indicates that the current amount of time spent in a village by a mobilizing
14A skeptic may claim here that these coefficients could not be individually negatively correlated with positivesavings—however, in fact, the significant regression coefficients derived from univariate regression of together andwork on avgsavings are indeed negative, and larger than those in the regressions shown in Table 9
27
team is far from the recommended 45 days—in fact, most respondents in Madhubani recalled CRPs
spending no more than three days with each group before leaving the members to their own devices.
Most likely, this is a paired effect of the pressure from supervisors to create as many groups as
possible, and the desire to work as little as possible in order to receive the CRP stipend, which is
paid as a lump sum for 45 days’ work15.
In situations like the mobilization process, which may involve as little as three days in order to
establish relationships and build social capital, the contribution of investment social capital to an
overall level of social capital can be far out-shadowed by an individual’s personal prior endowment
of social capital. As seen in Section 5.1 above, an important aspect of this prior endowment is the
identity and role an individual carries. As a poor, typically illiterate, married, lower-caste woman
with command of the sociolinguistically relevant local dialect, a CRP is much more likely to be
able to foment participation and intrinsic motivation than a CM, AC, or CC.
6.2 Why positive messages can lead to less participation
It is difficult to tell why certain messages—poverty, activities, and together among them—
lead to reduced rates of participation rather than increasing them. A possible theory proposed
by Vansteenkiste et al. (2004) is the notion of “crowding out” motivation: that given too many
overt, extrinsic motives, an individual may lose sight of intrinsically important motives, and lose
motivation overall.
It is also possible that, as alluded to by Mansuri and Rao (2013), Mosse (2004), and Botes
and Van Rensburg (2000), the poorest of the poor may not respond as readily to non-material
incentives as material incentives, and without the granting of material incentives—food, work, or
money—the potential beneficiaries would choose to spend their time away from Jeevika meetings.
Additional evidence for this hypothesis comes from Table 2, which shows that CMs, with their more
intimate knowledge of the community being mobilized, use less of the poverty message. However,
15In fact, while a rationally acting individual fully expecting to be paid the stipend may adopt the same course ofaction, CRPs are often wary that the stipend will not be paid at all, further diminishing their motivation to work forlonger.
28
this explanation lacks considerable support, and shows ample room for improvement in future
qualitative and mixed-methods studies.
6.3 Implications for the great aid debate: Is localization worth it?
This paper presents a nuanced case study to the literature on overarching theories of aid and
development. Jeevika has not had universal success in scaling up—in the groups with the lowest
levels of participation, the group had only apportioned four loans among 12 members, loans totaled
only Rs. 125 ($1.96), and savings amounted to Rs. 130 ($2.04) per member. However, the program
has also achieved enormous successes, including one group that has an average borrowing rate of
Rs. 33,367 ($524.76) per member.
Other groups have made great strides in social empowerment: whereas before, members may
have been victims of domestic violence, denied agency in the household, and physically and socially
immobile, many survey respondents reported feeling liberated through increased solidarity with the
members of their SHGs. When asked what they would want to do further with Jeevika (Hindi:
Jeevika ke bare me aur kya hona chahiye? ), about one in five groups in this study wanted to
expand Jeevika by enlarging loans, one group thought that the savings rates were too low, and
many wanted to build education programs through Jeevika and meeting-houses for the SHGs and
Village Organizations.
The conclusion overall, then, is that yes: localization is worth it. By continuing the mobilization
process and perfecting the messages and the building of social capital between mobilizers and
potential beneficiaries, Jeevika is, in fact, making much larger strides toward sustainable, grassroots
economic and social empowerment than the Millennium Villages Project or any “shock-therapy”
program.
7 Conclusion: Policy Implications and Further Research
This research and analysis draws the following conclusions:
29

1. Among all mobilizers, CRPs most effectively encourage participation in Jeevika in the form
of savings;
2. For other measures of participation, the effect of mobilizers is washed out by group- and
area-specific features;
3. Groups mobilized by CMs tend to show less participation than average in the form of savings;
4. CMs are most likely to mobilize a group only in two situations: entirely alone, or as a small
part of CRPs, ACs and CCs;
5. Groups formed further in the past participate more in Jeevika, with an effect noticeable even
in data limited to a span of one year;
6. While the effects of mobilization messages on participation are minimal, certain messages—
poverty, together, and work, for example—lead to less participation than average, holding
other factors constant.
There are four main, direct implications of these findings for CDD programs such as Jeevika.
First, for the greatest level of participation during scale-up, the organization should actively pursue
a strategy of “the poor recruiting the poor” through a CRP drive rather than a model of using
professional Program Resource Persons as represented in Khan et al. (2013). Second, as far as
possible, CRPs should have more than adequate knowledge of the area of mobilization, or should
be allowed ample time—upwards of one month—to become acquainted with the local context
of mobilization and build interpersonal social capital before they begin the mobilization process.
Third, while it may be tempting to allow groups to form independently of the CRP process through
CMs, these groups may not have adequate information and cohesive social capital to effectively
enforce the Panchasutra (see Appendix B). Finally, CRPs should be careful to allow prospective
beneficiaries to come to their own conclusions about whether to join or not—those who do will
have high levels of intrinsic motivation, and may become strongly empowered by the program.
While this study opens the way for further research on the role promised incentives and individ-
ual decisions interact in the sphere of development, much remains to be explored. Further research
30
may use more heavily qualitative methods or theoretical economic methods to determine the struc-
ture and tradeoffs involved in the decision of whether or not to participate in a CDD organization,
and if so, how much. Other directions include the interpersonal strategies CRPs use to build social
capital during the mobilization process, that may be transferred to CMs, ACs, and CCs; behavioral
economic experimentation to determine which incentives function in which ways in the laboratory
setting; dynamic network analysis using qualitative and quantitative methods to determine how
social capital lubricates economic empowerment on the micro scale; and cross-organizational em-
pirical study to find whether other strategies of scale-up, such as the use of PRPs, may, in fact,
benefit . Finally, this preliminary investigation provides significant rationale for a larger study with
an increased sample size, employing the textual/qualitative and quantitative analyses used in this
paper, to better understand the decision at the moment of mobilization.
31

References
Binswanger, H. P. and S. S. Aiyar (2003). Scaling up community-driven development: theoretical
underpinnings and program design implications. World Bank Policy Research Working Pa-
per (3039).
Botes, L. and D. Van Rensburg (2000). Community participation in development: nine plagues
and twelve commandments. Community Development Journal 35 (1), 41–58.
Coleman, J. S. (1988). Social capital in the creation of human capital. American Journal of
Sociology , S95–S120.
Collier, P. (2002). Social capital and poverty: a microeconomic perspective. The role of social
capital in development: An empirical assessment , 19–41.
Easterly, W. (2014, January). The aid debate is over. Reason.
Easterly, W., J. Ritzen, and M. Woolcock (2006). Social cohesion, institutions, and growth. Eco-
nomics & Politics 18 (2), 103–120.
Eisenberger, R., W. D. Pierce, and J. Cameron (1999). Effects of reward on intrinsic motiva-
tion—negative, neutral, and positive: Comment on deci, koestner, and ryan (1999).
Frey, B. S. and R. Jegen (2001). Motivation crowding theory. Journal of economic surveys 15 (5),
589–611.
Galab, S. and N. C. Rao (2003). Women’s self-help groups, poverty alleviation and empowerment.
Economic and Political Weekly , 1274–1283.
Glaeser, E. L., D. Laibson, and B. Sacerdote (2002). An economic approach to social capital*. The
Economic Journal 112 (483), F437–F458.
Grootaert, C. and T. van Bastelaer (2002). The role of social capital in development: An empirical
assessment. Cambridge University Press.
32
Hashemi, S. M., S. R. Schuler, and A. P. Riley (1996). Rural credit programs and women’s em-
powerment in bangladesh. World Development 24 (4), 635–653.
IndiaStat (2001). State-wise urban population of india (1981, 1991 and 2001).
IndiaStat (2012). State-wise per capita state domestic income at factor cost (at constant prices) in
india (1980-1981 to 2013-2014).
Khan, R., R. Negi, and R. Sarkar (2013). Resource Block Study. The Social Observatory for
Livelihoods Projects, The World Bank.
Knack, S. and P. Keefer (1997a). Does social capital have an economic payoff? a cross country
investigation. The Quarterly Journal of Economics 112 (4), 1251–1288.
Knack, S. and P. Keefer (1997b). Does social capital have an economic payoff? a cross country
investigation. The Quarterly Journal of Economics 112 (4), 1251–1288.
Majumdar, S. (2014). Impacts From Qualitative Study: Phase I and Phase II. The Social Obser-
vatory for Livelihoods Projects, The World Bank.
Mansuri, G. and V. Rao (2004). Community-based and-driven development: A critical review. The
World Bank Research Observer 19 (1), 1–39.
Mansuri, G. and V. Rao (2012). Localizing development: Does participation work? World Bank
Publications.
Mansuri, G. and V. Rao (2013). Can participation be induced? some evidence from developing
countries 1. Critical Review of International Social and Political Philosophy 16 (2), 284–304.
Mathie, A. and G. Cunningham (2005). Who is driving development? reflections on the trans-
formative potential of asset-based community development. Canadian Journal of Development
Studies/Revue canadienne d’etudes du developpement 26 (1), 175–186.
Mosse, D. (2004). Is good policy unimplementable? reflections on the ethnography of aid policy
and practice. Development and change 35 (4), 639–671.
33

Murphy, T. (2014). Sachs-easterly cease fire broken, aid war of words breaks out on twitter. The
Humanosphere (January 8,).
Narayan, D. (1999). Bonds and bridges: social capital and poverty, Volume 2167. World Bank
Publications.
Posner, D. N. (2004). Measuring ethnic fractionalization in africa. American journal of political
science 48 (4), 849–863.
Putnam, R. D. (1995). Bowling alone: America’s declining social capital. Journal of Democ-
racy 6 (1), 65–78.
Rich, S. (2007). Africa’s village of dreams. The Wilson Quarterly (Spring).
Rosen, R. (2014). Scaling up. The Wilson Quarterly .
Sanyal, P. (2009). From credit to collective action: The role of microfinance in promoting women’s
social capital and normative influence. American Sociological Review 74 (4), 529–550.
Sharma, M. P. (2004). Community-driven development and scaling-up of microfinance services:
Case studies from nepal and india. Food Consumption and Nutrition Division Discussion Pa-
per 178.
Vansteenkiste, M., J. Simons, W. Lens, K. M. Sheldon, and E. L. Deci (2004). Motivating learning,
performance, and persistence: the synergistic effects of intrinsic goal contents and autonomy-
supportive contexts. Journal of personality and social psychology 87 (2), 246.
Wolff, J. (2013). Community development: An exploration of its utility as a development approach.
University of California, Santa Barbara.
Woolcock, M. (1998). Social capital and economic development: Toward a theoretical synthesis
and policy framework. Theory and Society 27 (2), 151–208.
Woolcock, M. (2002). Social capital in theory and practice: where do we stand. Social capital and
economic development: Well-being in developing countries, 18–39.
34
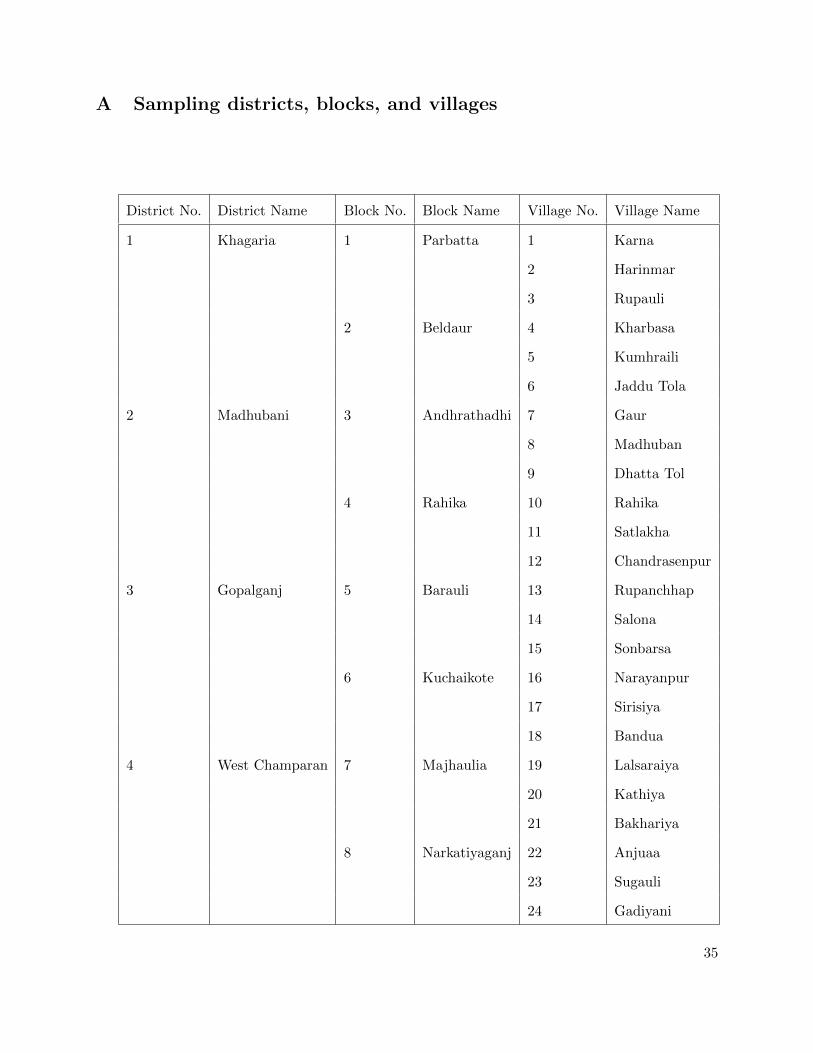
A Sampling districts, blocks, and villages
District No. District Name Block No. Block Name Village No. Village Name
1 Khagaria 1 Parbatta 1 Karna
2 Harinmar
3 Rupauli
2 Beldaur 4 Kharbasa
5 Kumhraili
6 Jaddu Tola
2 Madhubani 3 Andhrathadhi 7 Gaur
8 Madhuban
9 Dhatta Tol
4 Rahika 10 Rahika
11 Satlakha
12 Chandrasenpur
3 Gopalganj 5 Barauli 13 Rupanchhap
14 Salona
15 Sonbarsa
6 Kuchaikote 16 Narayanpur
17 Sirisiya
18 Bandua
4 West Champaran 7 Majhaulia 19 Lalsaraiya
20 Kathiya
21 Bakhariya
8 Narkatiyaganj 22 Anjuaa
23 Sugauli
24 Gadiyani
35
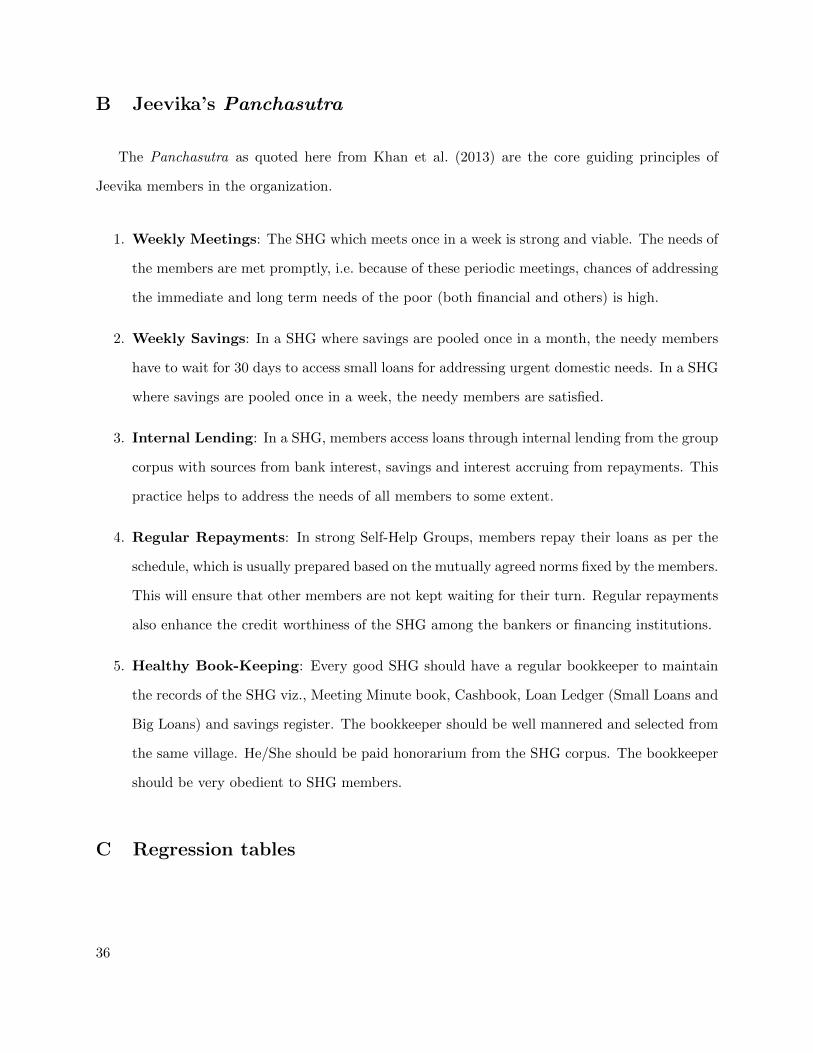
B Jeevika’s Panchasutra
The Panchasutra as quoted here from Khan et al. (2013) are the core guiding principles of
Jeevika members in the organization.
1. Weekly Meetings: The SHG which meets once in a week is strong and viable. The needs of
the members are met promptly, i.e. because of these periodic meetings, chances of addressing
the immediate and long term needs of the poor (both financial and others) is high.
2. Weekly Savings: In a SHG where savings are pooled once in a month, the needy members
have to wait for 30 days to access small loans for addressing urgent domestic needs. In a SHG
where savings are pooled once in a week, the needy members are satisfied.
3. Internal Lending: In a SHG, members access loans through internal lending from the group
corpus with sources from bank interest, savings and interest accruing from repayments. This
practice helps to address the needs of all members to some extent.
4. Regular Repayments: In strong Self-Help Groups, members repay their loans as per the
schedule, which is usually prepared based on the mutually agreed norms fixed by the members.
This will ensure that other members are not kept waiting for their turn. Regular repayments
also enhance the credit worthiness of the SHG among the bankers or financing institutions.
5. Healthy Book-Keeping: Every good SHG should have a regular bookkeeper to maintain
the records of the SHG viz., Meeting Minute book, Cashbook, Loan Ledger (Small Loans and
Big Loans) and savings register. The bookkeeper should be well mannered and selected from
the same village. He/She should be paid honorarium from the SHG corpus. The bookkeeper
should be very obedient to SHG members.
C Regression tables
36

(1) (2) (3) (4)Average Number of Loans Taken
AC or CC Present 0.138 -0.342 -1.061 -1.013(0.62) (-1.55) (-0.82) (-0.77)
CM Present 0.307 0.012 -1.748 -1.941(0.93) (0.04) (-1.40) (-1.50)
CRP Present 0.748** 0.690** -0.617 -0.900(2.03) (2.09) (-0.54) (-0.75)
Block=2 -1.177*** -1.109*** -1.189***(-3.03) (-2.81) (-2.86)
Block=3 -0.962** -0.729* -0.811*(-2.61) (-1.84) (-1.74)
Block=4 -0.105 -0.052 -0.123(-0.29) (-0.14) (-0.30)
Block=5 -0.588 -0.570 -0.703(-1.57) (-1.34) (-1.49)
Block=6 -0.842** -0.637 -0.683(-2.25) (-1.60) (-1.55)
Block=7 -0.592 -0.207 -0.277(-1.51) (-0.43) (-0.52)
Block=8 -2.385*** -1.924*** -1.953***(-6.04) (-3.44) (-3.20)
AC/CC*Time 0.001 0.001(0.58) (0.48)
CM*Time 0.003 0.003(1.45) (1.50)
CRP*Time 0.002 0.003(0.92) (1.20)
SHG Age -0.001 -0.001(-0.22) (-0.34)
Other SHG -0.645** -0.811***(-2.37) (-2.82)
Group Membership 0.134* 0.128(1.67) (1.57)
Deserted Members 0.159 0.183(0.65) (0.73)
ELF -1.517 -1.444(-1.36) (-1.26)
Diverse 0.253 0.190(0.49) (0.36)
Relig. Diverse 0.390 0.448(1.24) (1.38)
Savings -0.269(-0.79)
Lending 0.009(0.03)
Poverty -0.385*(-1.84)
Food -0.035(-0.16)
Government 0.044(0.10)
Togetherness 0.129(0.60)
Activities 0.087(0.31)
Jobs -0.082(-0.32)
Constant 1.931*** 3.158*** 1.937 2.613(4.70) (7.20) (1.00) (1.30)
R2 0.035 0.337 0.452 0.493N 122 122 122 122
Table 4: Regression results of mobilizers on average per member number of loans taken.
37
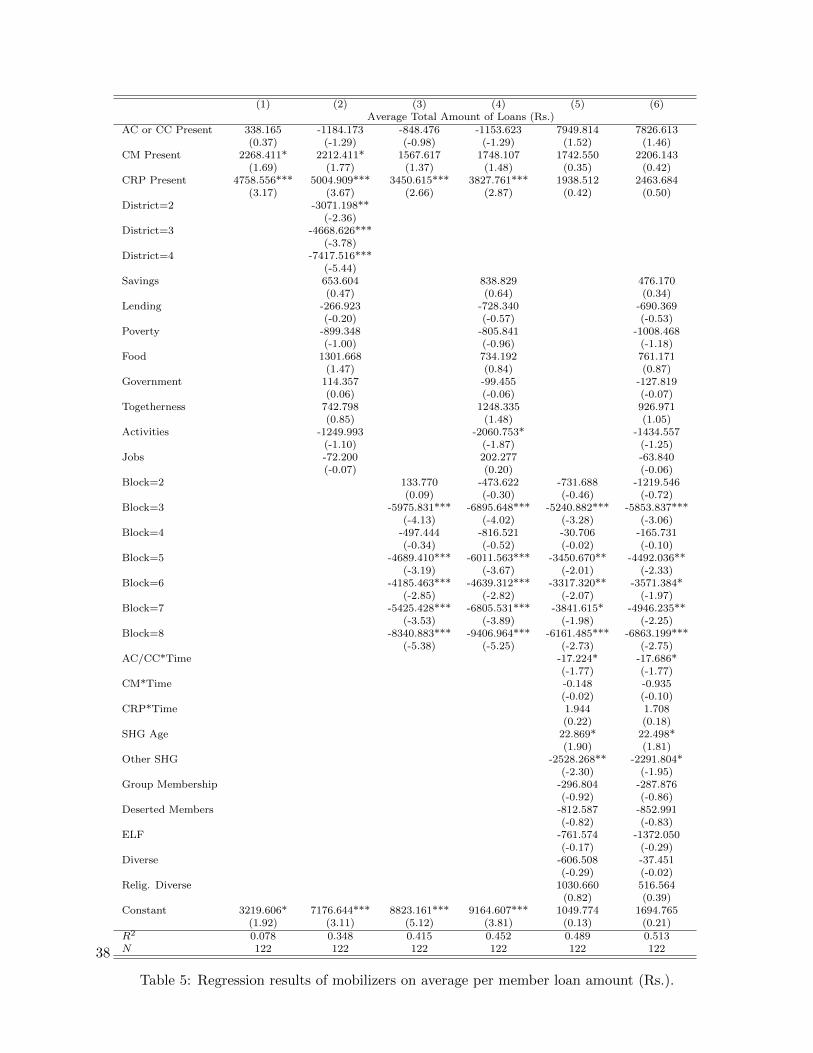
(1) (2) (3) (4) (5) (6)Average Total Amount of Loans (Rs.)
AC or CC Present 338.165 -1184.173 -848.476 -1153.623 7949.814 7826.613(0.37) (-1.29) (-0.98) (-1.29) (1.52) (1.46)
CM Present 2268.411* 2212.411* 1567.617 1748.107 1742.550 2206.143(1.69) (1.77) (1.37) (1.48) (0.35) (0.42)
CRP Present 4758.556*** 5004.909*** 3450.615*** 3827.761*** 1938.512 2463.684(3.17) (3.67) (2.66) (2.87) (0.42) (0.50)
District=2 -3071.198**(-2.36)
District=3 -4668.626***(-3.78)
District=4 -7417.516***(-5.44)
Savings 653.604 838.829 476.170(0.47) (0.64) (0.34)
Lending -266.923 -728.340 -690.369(-0.20) (-0.57) (-0.53)
Poverty -899.348 -805.841 -1008.468(-1.00) (-0.96) (-1.18)
Food 1301.668 734.192 761.171(1.47) (0.84) (0.87)
Government 114.357 -99.455 -127.819(0.06) (-0.06) (-0.07)
Togetherness 742.798 1248.335 926.971(0.85) (1.48) (1.05)
Activities -1249.993 -2060.753* -1434.557(-1.10) (-1.87) (-1.25)
Jobs -72.200 202.277 -63.840(-0.07) (0.20) (-0.06)
Block=2 133.770 -473.622 -731.688 -1219.546(0.09) (-0.30) (-0.46) (-0.72)
Block=3 -5975.831*** -6895.648*** -5240.882*** -5853.837***(-4.13) (-4.02) (-3.28) (-3.06)
Block=4 -497.444 -816.521 -30.706 -165.731(-0.34) (-0.52) (-0.02) (-0.10)
Block=5 -4689.410*** -6011.563*** -3450.670** -4492.036**(-3.19) (-3.67) (-2.01) (-2.33)
Block=6 -4185.463*** -4639.312*** -3317.320** -3571.384*(-2.85) (-2.82) (-2.07) (-1.97)
Block=7 -5425.428*** -6805.531*** -3841.615* -4946.235**(-3.53) (-3.89) (-1.98) (-2.25)
Block=8 -8340.883*** -9406.964*** -6161.485*** -6863.199***(-5.38) (-5.25) (-2.73) (-2.75)
AC/CC*Time -17.224* -17.686*(-1.77) (-1.77)
CM*Time -0.148 -0.935(-0.02) (-0.10)
CRP*Time 1.944 1.708(0.22) (0.18)
SHG Age 22.869* 22.498*(1.90) (1.81)
Other SHG -2528.268** -2291.804*(-2.30) (-1.95)
Group Membership -296.804 -287.876(-0.92) (-0.86)
Deserted Members -812.587 -852.991(-0.82) (-0.83)
ELF -761.574 -1372.050(-0.17) (-0.29)
Diverse -606.508 -37.451(-0.29) (-0.02)
Relig. Diverse 1030.660 516.564(0.82) (0.39)
Constant 3219.606* 7176.644*** 8823.161*** 9164.607*** 1049.774 1694.765(1.92) (3.11) (5.12) (3.81) (0.13) (0.21)
R2 0.078 0.348 0.415 0.452 0.489 0.513N 122 122 122 122 122 122
Table 5: Regression results of mobilizers on average per member loan amount (Rs.).
38

(1) (2) (3) (4) (5) (6)Average Total Savings
AC or CC Present 67.996** 55.374* 20.851 -4.175 81.585 115.983(2.13) (1.75) (0.66) (-0.14) (0.54) (0.79)
CM Present 10.137 -19.135 -26.817 -30.351 -341.796** -384.385***(0.22) (-0.41) (-0.62) (-0.80) (-2.36) (-2.64)
CRP Present 100.491* 82.561 91.077* 75.011* -165.959 -267.513**(1.91) (1.59) (1.93) (1.74) (-1.25) (-1.99)
Savings 19.441 40.009 24.396 -24.031(0.38) (0.82) (0.57) (-0.63)
Lending -23.537 14.837 -11.967 -17.564(-0.48) (0.32) (-0.29) (-0.49)
Poverty -11.693 -29.233 -28.117 -24.405(-0.35) (-0.94) (-1.03) (-1.04)
Food -6.036 -2.863 6.658 1.150(-0.19) (-0.09) (0.24) (0.05)
Government 19.935 -2.476 -19.750 -35.669(0.30) (-0.04) (-0.36) (-0.76)
Togetherness -83.780** -55.133* -24.368 -62.186**(-2.59) (-1.82) (-0.90) (-2.56)
Activities 49.002 -2.011 -49.211 -33.115(1.20) (-0.05) (-1.38) (-1.06)
Jobs -90.162** -42.882 -53.532 -48.595*(-2.31) (-1.16) (-1.62) (-1.71)
District=2 -54.297(-1.21)
District=3 -178.969***(-4.18)
District=4 -186.137***(-3.94)
Block=2 -120.434** -85.934* -110.962**(-2.34) (-1.88) (-2.38)
Block=3 -186.749*** -92.634** -88.677*(-3.37) (-2.02) (-1.69)
Block=4 -48.289 -35.344 -44.477(-0.95) (-0.81) (-0.96)
Block=5 -370.881*** -295.211*** -289.154***(-7.00) (-5.98) (-5.47)
Block=6 -133.696** -65.017 -61.267(-2.51) (-1.41) (-1.24)
Block=7 -228.590*** -72.768 -56.395(-4.05) (-1.30) (-0.94)
Block=8 -296.415*** -139.320** -115.685*(-5.13) (-2.15) (-1.69)
AC/CC*Time -0.167 -0.244(-0.60) (-0.89)
CM*Time 0.583** 0.621**(2.26) (2.39)
CRP*Time 0.243 0.466*(0.95) (1.78)
SHG Age 0.637* 0.569*(1.85) (1.67)
Other SHG -19.141 -33.201(-0.61) (-1.03)
Group Membership 0.987 2.689(0.11) (0.29)
Deserted Members 28.965 23.559(1.02) (0.84)
ELF -15.931 11.573(-0.12) (0.09)
Diverse -4.190 -8.181(-0.07) (-0.14)
Relig. Diverse 68.963* 71.088*(1.90) (1.95)
Constant 578.847*** 662.037*** 724.680*** 854.575*** 489.948** 584.346**(9.85) (7.70) (9.08) (11.00) (2.18) (2.59)
R2 0.070 0.202 0.356 0.529 0.654 0.699N 122 122 122 122 122 122
Table 6: Regression results of mobilizers on average per member savings.
39

(1) (2) (3) (4) (5) (6) (7)Average Number of Loans Taken
Savings -0.034 -0.113 -0.143 -0.158 0.245 -0.044 -0.269(-0.09) (-0.33) (-0.38) (-0.45) (0.72) (-0.13) (-0.79)
Lending 0.026 0.226 0.020 0.208 -0.029 -0.082 0.009(0.07) (0.69) (0.06) (0.63) (-0.09) (-0.26) (0.03)
Poverty -0.278 -0.374* -0.304 -0.380* -0.303 -0.330 -0.385*(-1.14) (-1.70) (-1.23) (-1.69) (-1.38) (-1.60) (-1.84)
Food 0.245 0.098 0.224 0.093 -0.016 -0.013 -0.035(1.05) (0.46) (0.96) (0.44) (-0.07) (-0.06) (-0.16)
Government 0.215 0.136 0.231 0.149 0.134 -0.014 0.044(0.44) (0.31) (0.47) (0.33) (0.30) (-0.03) (0.10)
Togetherness 0.193 0.167 0.199 0.189 0.295 0.148 0.129(0.82) (0.78) (0.84) (0.86) (1.35) (0.71) (0.60)
Activities 0.430 0.289 0.311 0.249 0.111 0.161 0.087(1.47) (1.05) (1.04) (0.88) (0.39) (0.59) (0.31)
Jobs -0.369 -0.183 -0.402 -0.221 0.074 0.029 -0.082(-1.33) (-0.71) (-1.41) (-0.83) (0.28) (0.11) (-0.32)
SHG Age 0.004*** 0.004*** 0.003*** -0.001(4.39) (3.81) (2.85) (-0.34)
Other SHG -0.643** -0.625** -0.686** -0.811***(-2.17) (-2.06) (-2.49) (-2.82)
Group Membership 0.199** 0.201** 0.157** 0.128(2.45) (2.45) (2.00) (1.57)
Deserted Members 0.220 0.195 0.206 0.183(0.88) (0.76) (0.84) (0.73)
ELF -1.729 -1.811 -1.442 -1.444(-1.46) (-1.50) (-1.26) (-1.26)
Diverse 0.295 0.306 0.508 0.190(0.54) (0.55) (1.57) (0.36)
Relig. Diverse 0.349 0.310 0.174 0.448(1.02) (0.89) (0.33) (1.38)
AC or CC Present 0.010 -0.101 -1.013(0.05) (-0.45) (-0.77)
CM Present 0.200 0.133 -1.941(0.58) (0.42) (-1.50)
CRP Present 0.717* 0.332 -0.900(1.90) (0.90) (-0.75)
Block=2 -0.848** -0.900** -1.189***(-2.15) (-2.39) (-2.86)
Block=3 -1.189*** -0.654 -0.811*(-2.65) (-1.42) (-1.74)
Block=4 -0.010 0.093 -0.123(-0.02) (0.24) (-0.30)
Block=5 -0.540 -0.479 -0.703(-1.27) (-1.06) (-1.49)
Block=6 -0.687 -0.493 -0.683(-1.60) (-1.16) (-1.55)
Block=7 -0.463 0.129 -0.277(-1.06) (0.28) (-0.52)
Block=8 -2.150*** -1.387*** -1.953***(-4.77) (-2.75) (-3.20)
AC/CC*Time 0.001(0.48)
CM*Time 0.003(1.50)
CRP*Time 0.003(1.20)
Constant 2.654*** -2.022* 2.137*** -2.099* 3.230*** -0.334 2.613(5.35) (-1.77) (3.41) (-1.79) (6.12) (-0.27) (1.30)
R2 0.070 0.308 0.101 0.316 0.317 0.421 0.493N 122 122 122 122 122 122 122
Table 7: Regression results of messages on average per member number of loans taken.
40

(1) (2) (3) (4)Average Total Amount of Loans (Rs.)
AC or CC Present 10399.535** -1153.623 7826.613(2.24) (-1.29) (1.46)
AC/CC*Time -22.503** -17.686*(-2.59) (-1.77)
CM Present 2105.916 1748.107 2206.143(0.40) (1.48) (0.42)
CM*Time -0.952 -0.935(-0.10) (-0.10)
CRP Present -1001.791 3827.761*** 2463.684(-0.21) (2.87) (0.50)
CRP*Time 7.445 1.708(0.80) (0.18)
Savings -162.383 1238.781 838.829 476.170(-0.12) (0.92) (0.64) (0.34)
Lending -904.967 -423.700 -728.340 -690.369(-0.70) (-0.32) (-0.57) (-0.53)
Poverty -965.253 -672.690 -805.841 -1008.468(-1.08) (-0.78) (-0.96) (-1.18)
Food 1350.612 680.942 734.192 761.171(1.63) (0.76) (0.84) (0.87)
Government 190.689 142.926 -99.455 -127.819(0.11) (0.08) (-0.06) (-0.07)
Togetherness -77.792 1093.157 1248.335 926.971(-0.09) (1.28) (1.48) (1.05)
Activities -186.645 -1504.634 -2060.753* -1434.557(-0.17) (-1.35) (-1.87) (-1.25)
Jobs -420.581 352.575 202.277 -63.840(-0.40) (0.34) (0.20) (-0.06)
SHG Age 34.982*** 22.498*(3.07) (1.81)
Other SHG -2279.430* -2291.804*(-1.89) (-1.95)
Group Membership -233.618 -287.876(-0.70) (-0.86)
Deserted Members -1398.591 -852.991(-1.39) (-0.83)
ELF 2031.547 -1372.050(0.43) (-0.29)
Diverse -1554.182 -37.451(-0.71) (-0.02)
Relig. Diverse 75.898 516.564(0.05) (0.39)
Block=2 977.019 -473.622 -1219.546(0.63) (-0.30) (-0.72)
Block=3 -7035.328*** -6895.648*** -5853.837***(-3.99) (-4.02) (-3.06)
Block=4 52.186 -816.521 -165.731(0.03) (-0.52) (-0.10)
Block=5 -5262.870*** -6011.563*** -4492.036**(-3.16) (-3.67) (-2.33)
Block=6 -3924.952** -4639.312*** -3571.384*(-2.33) (-2.82) (-1.97)
Block=7 -5405.640*** -6805.531*** -4946.235**(-3.15) (-3.89) (-2.25)
Block=8 -8236.186*** -9406.964*** -6863.199***(-4.66) (-5.25) (-2.75)
Constant -7788.223 10571.773*** 9164.607*** 1694.765(-1.07) (5.11) (3.81) (0.21)
R2 0.419 0.399 0.452 0.513N 122 122 122 122
Table 8: Regression results of messages on average per member loan amount (Rs.).
41

(1) (2) (3) (4) (5)Average Total Savings
Savings 34.244 42.348 19.441 28.180 -24.031(0.66) (1.02) (0.38) (0.66) (-0.63)
Lending -37.338 -14.438 -23.537 -0.315 -17.564(-0.75) (-0.36) (-0.48) (-0.01) (-0.49)
Poverty -5.010 -21.433 -11.693 -26.723 -24.405(-0.15) (-0.80) (-0.35) (-0.98) (-1.04)
Food -3.620 -15.293 -6.036 -16.733 1.150(-0.11) (-0.59) (-0.19) (-0.66) (0.05)
Government 12.298 -14.756 19.935 -10.998 -35.669(0.18) (-0.27) (0.30) (-0.20) (-0.76)
Togetherness -76.268** -71.737*** -83.780** -79.040*** -62.186**(-2.33) (-2.73) (-2.59) (-2.97) (-2.56)
Activities 70.174* 19.847 49.002 11.694 -33.115(1.72) (0.59) (1.20) (0.34) (-1.06)
Jobs -92.136** -31.741 -90.162** -36.048 -48.595*(-2.38) (-1.00) (-2.31) (-1.13) (-1.71)
SHG Age 1.000*** 0.866** 0.569*(8.23) (2.48) (1.67)
Other SHG -3.475 -2.903 -33.201(-0.10) (-0.08) (-1.03)
Group Membership -1.680 -6.838 2.689(-0.17) (-0.67) (0.29)
Deserted Members -23.159 -24.344 23.559(-0.75) (-0.79) (0.84)
ELF 32.296 45.285 11.573(0.22) (0.31) (0.09)
Diverse -43.447 -38.395 -8.181(-0.65) (-0.57) (-0.14)
Relig. Diverse 72.095* 67.088 71.088*(1.73) (1.58) (1.95)
AC or CC Present 55.374* 93.741 115.983(1.75) (0.66) (0.79)
CM Present -19.135 -375.228** -384.385***(-0.41) (-2.33) (-2.64)
CRP Present 82.561 -186.469 -267.513**(1.59) (-1.28) (-1.99)
AC/CC*Time -0.192 -0.244(-0.72) (-0.89)
CM*Time 0.593** 0.621**(2.07) (2.39)
CRP*Time 0.255 0.466*(0.89) (1.78)
Block=2 -110.962**(-2.38)
Block=3 -88.677*(-1.69)
Block=4 -44.477(-0.96)
Block=5 -289.154***(-5.47)
Block=6 -61.267(-1.24)
Block=7 -56.395(-0.94)
Block=8 -115.685*(-1.69)
Constant 752.857*** 221.346 662.037*** 425.423* 584.346**(10.86) (1.59) (7.70) (1.90) (2.59)
R2 0.144 0.510 0.202 0.550 0.699N 122 122 122 122 122
Table 9: Regression results of messages on average per member savings.
42
Related Documents