209 JOURNAL OF IMAGING SCIENCE AND TECHNOLOGY ® • Volume 47, Number 3, May/June 2003 Banding Reduction in Electrophotographic Process Using Human Contrast Sensitivity Function Shaped Photoreceptor Velocity Control Cheng-Lun Chen and George T.-C. Chiu School of Mechanical Engineering, Purdue University, West Lafayette, Indiana, USA Jan Allebach ✦ School of Electrical and Computer Engineering, Purdue University, West Lafayette, Indiana, USA This article presents a process control strategy for reducing banding artifact in electrophotographic (EP) process. EP banding was shown to be closely related to the angular velocity fluctuation of the photoreceptor. Proper regulation of the photoreceptor rotational velocity under various process uncertainties and variations will improve EP process stability and reduce the occurrence of visual banding. The proposed closed-loop control strategy is to modulate the main drive motor speed based on the velocity measurement of the photoreceptor. The controller featured two levels of angular velocity regulation. The first level utilized the loop-shaping technique to incorporate the human visual system (HVS) model, i.e., an approximation of the human contrast sensitivity function (CSF), into the feedback loop to eliminate low frequency and non-periodic velocity fluctuations. The second level used an internal model based repeti- tive controller to reduce the effect of periodic velocity fluctuation. The HVS based loop shaping design is intended for addressing the subjective evaluation of the human visual perception. Experimental result from a low cost 600 dpi EP engine showed significant banding reduction from reflectance measurement as well as subjective evaluation of the printed image. Journal of Imaging Science and Technology 47: 209–223 (2003) Original manuscript received October 11, 2002 ✦ IS&T Fellow Corresponding authors: {chenglun, gchiu}@purdue.edu ©2003, IS&T—The Society for Imaging Science and Technology Introduction Electrophotography (EP) is the underlying imaging pro- cess used in paper copiers and laser printers. A typical EP process is composed of six basic steps: charging, ex- posure, development, transfer, fusing, and cleaning. For a typical EP process, the print quality will strongly de- pend on the stability of these basic steps. Researchers have shown that vibration or transmission deviation resulting from various mechanical components within an EP process can potentially degrade the print qual- ity. The effect of eccentricity on multi-gear transmis- sion accuracy for a color laser printer was examined by Kusuda and co-workers. 1 Kawamoto 2–4 developed dy- namic and vibration models for polygon mirror scanner motors and the cleaning blades. He and other research- ers 5 have also shown that the electrostatic force on the charge roller is another vibration source. Among vari- ous image artifacts, halftone banding due to dot gain or scan line spacing variation is one of the most visible artifacts, which appears as periodic light and dark bands across a printed page perpendicular to the process or print direction. Significant amount of work has devoted to the model- ing and analysis of banding in EP process. Burns and co-workers. 6 modeled the effect of independent identi- cally distributed (iid) zero-mean laser dot positioning error on the mean and variance of the exposure error along the process (or slow scan) direction. The analyti- cal results were verified by simulation for two types of laser profiles, i.e., Gaussian and triangular. Their work pointed out that the sensitivity of a laser writer to ras- ter noise strongly depends on the interaction of the la- ser profile shape and the system modulation transfer function (MTF). The effect of positioning error due to polygon mirror facet-angle variation on the exposure was also investigated. Melnychuck and Shaw 7 modeled the effect of laser dot positioning error on the halftone cell. To analyze reflectance instead of exposure, the nonlin- ear transformation between exposure and reflectance was simplified by assuming binary material response. Based on this assumption and a thresholding process, they were able to convert the exposure profile for a half- tone cell to a rectangular-shaped reflectance profile. Note that although such quantization striped informa- tion concerning the effect of position error on individual dots, the error still affects the overall position and width of the halftone cell. Banding coefficient was introduced by Haas 8 to relate the scan-line or feature spacing modu- lation to the resulted contrast modulation. The depen- dence of the banding coefficient on halftone dot size was examined for one-dimension spatial models of arbitrary profile and for numerical simulation of a uniform array of superimposed, scan-smeared Gaussian exposures. It was concluded that the smallest banding coefficient is

Welcome message from author
This document is posted to help you gain knowledge. Please leave a comment to let me know what you think about it! Share it to your friends and learn new things together.
Transcript
209
JOURNAL OF IMAGING SCIENCE AND TECHNOLOGY® • Volume 47, Number 3, May/June 2003
Banding Reduction in Electrophotographic Process Using HumanContrast Sensitivity Function Shaped Photoreceptor Velocity Control
Cheng-Lun Chen and George T.-C. ChiuSchool of Mechanical Engineering, Purdue University, West Lafayette, Indiana, USA
Jan Allebach✦
School of Electrical and Computer Engineering, Purdue University, West Lafayette, Indiana, USA
This article presents a process control strategy for reducing banding artifact in electrophotographic (EP) process. EP banding wasshown to be closely related to the angular velocity fluctuation of the photoreceptor. Proper regulation of the photoreceptor rotationalvelocity under various process uncertainties and variations will improve EP process stability and reduce the occurrence of visualbanding. The proposed closed-loop control strategy is to modulate the main drive motor speed based on the velocity measurement ofthe photoreceptor. The controller featured two levels of angular velocity regulation. The first level utilized the loop-shaping techniqueto incorporate the human visual system (HVS) model, i.e., an approximation of the human contrast sensitivity function (CSF), into thefeedback loop to eliminate low frequency and non-periodic velocity fluctuations. The second level used an internal model based repeti-tive controller to reduce the effect of periodic velocity fluctuation. The HVS based loop shaping design is intended for addressing thesubjective evaluation of the human visual perception. Experimental result from a low cost 600 dpi EP engine showed significantbanding reduction from reflectance measurement as well as subjective evaluation of the printed image.
Journal of Imaging Science and Technology 47: 209–223 (2003)
Original manuscript received October 11, 2002
✦ IS&T Fellow
Corresponding authors: {chenglun, gchiu}@purdue.edu
©2003, IS&T—The Society for Imaging Science and Technology
IntroductionElectrophotography (EP) is the underlying imaging pro-cess used in paper copiers and laser printers. A typicalEP process is composed of six basic steps: charging, ex-posure, development, transfer, fusing, and cleaning. Fora typical EP process, the print quality will strongly de-pend on the stability of these basic steps. Researchershave shown that vibration or transmission deviationresulting from various mechanical components withinan EP process can potentially degrade the print qual-ity. The effect of eccentricity on multi-gear transmis-sion accuracy for a color laser printer was examined byKusuda and co-workers.1 Kawamoto2–4 developed dy-namic and vibration models for polygon mirror scannermotors and the cleaning blades. He and other research-ers5 have also shown that the electrostatic force on thecharge roller is another vibration source. Among vari-ous image artifacts, halftone banding due to dot gain orscan line spacing variation is one of the most visibleartifacts, which appears as periodic light and dark bandsacross a printed page perpendicular to the process orprint direction.
Significant amount of work has devoted to the model-ing and analysis of banding in EP process. Burns andco-workers.6 modeled the effect of independent identi-cally distributed (iid) zero-mean laser dot positioningerror on the mean and variance of the exposure erroralong the process (or slow scan) direction. The analyti-cal results were verified by simulation for two types oflaser profiles, i.e., Gaussian and triangular. Their workpointed out that the sensitivity of a laser writer to ras-ter noise strongly depends on the interaction of the la-ser profile shape and the system modulation transferfunction (MTF). The effect of positioning error due topolygon mirror facet-angle variation on the exposure wasalso investigated. Melnychuck and Shaw7 modeled theeffect of laser dot positioning error on the halftone cell.To analyze reflectance instead of exposure, the nonlin-ear transformation between exposure and reflectancewas simplified by assuming binary material response.Based on this assumption and a thresholding process,they were able to convert the exposure profile for a half-tone cell to a rectangular-shaped reflectance profile.Note that although such quantization striped informa-tion concerning the effect of position error on individualdots, the error still affects the overall position and widthof the halftone cell. Banding coefficient was introducedby Haas8 to relate the scan-line or feature spacing modu-lation to the resulted contrast modulation. The depen-dence of the banding coefficient on halftone dot size wasexamined for one-dimension spatial models of arbitraryprofile and for numerical simulation of a uniform arrayof superimposed, scan-smeared Gaussian exposures. Itwas concluded that the smallest banding coefficient is
210 Journal of Imaging Science and Technology® Chen, et al.
obtained for the least halftone dot size and the bandingcoefficient increases hyperbolically for larger halftonedot size. Analytical models of exposure and reflectancemodulation due to simple sinusoidal raster positionvariation were developed by Loce and co-workers.9,10 Intheir work, first order approximation of the halftone cellreflectance, which is similar to the thresholding processused by Melnychuck and Shaw7, was applied on the ex-posure profile to yield the on and off regions of the half-tone cell. It was shown that for low frequency variation,banding is proportional to the fractional spacing error,the halftone frequency, and the raster spacing; and isinversely proportional to the average reflectance of thehalftone cell. Although reflectance variation due to scan-line spacing fluctuation is shown to be a direct contribu-tor of banding, a model of the human visual system isneeded to reflect the actual perceived banding. The con-trast sensitivity function (CSF) is one of such modelsthat attempts to capture the modulation transfer func-tion (MTF) of the human visual system in perceivingcontrast variations. Several researchers have contrib-uted to the analysis and synthesis of the CSF functionthat have been used by other researchers to quantifyperceived image quality.11,12 The bandpass-like CSF func-tion reveals the fact that mid-frequency disturbanceshave greater impact on perceived banding so that abanding reduction scheme should supply its effortmainly on noise or disturbances located in this frequencyregion.
Typically, the design of EP engines has relied ontightly toleranced components and open-loop designprinciples. System parameters and operating conditionsare carefully modeled, designed and maintained so thatthe physical process is least affected by disturbancesand uncertainties. For example, exposure level is de-termined so that the photoreceptor is discharged to satu-ration; large inertia of the photoreceptor motion systemis used to reduce motion sensitivity to load variation;very high manufacturing precisions are kept for the keycomponents in the development system. These solutionsare costly and limited. Although closed-loop approachhas been seen to be used on component level control,e.g., polygon mirror and main drive motor speed regu-lation. Regulation of each individual subsystem basedon local sensory feedback, e.g., velocity from the motor,usually does not guarantee good regulation on the im-aging component where the latent image is formed.
In this study, we proposed closing the loop by control-ling the actuator using signal feedback from sensorsplaced on the component of which specific physical quan-tities are to be regulated. For example, in a monochromeplatform, a suitable choice for the actuator and sensorplacement would be the main drive motor and the photo-receptor, respectively. Next, the control algorithm shouldbe able to tackle disturbances with control action withinthe actuator limitation; e.g., without saturating the ac-tuator. Another objective of using closed-loop control isto obtain system robustness, which, by definition, is toreduce system sensitivity to uncertainties such as con-sumable change and component aging.
Many works have been reported on reducing bandingin EP process. They can be categorized into the follow-ing four approaches. The first approach1,13,14 is to designbetter gear train, i.e., gear meshing or gear pitch, toeither reduce transmission error or move the vibrationinto higher frequency region where human visual sys-tem is less sensitive. The second approach15–18 is to de-flect the laser beam in the print or process direction tocompensate for the scan-line spacing variation. The
third approach19–23 is to modulate the laser exposure todirectly compensate for the absorptance variation dueto line spacing error. Using halftone techniques to maskbanding artifacts was also investigated in the litera-tures.24,25 Improved velocity regulation of the EP pro-cess is more of a challenge since the drive motortransmits the power through a set of gear trains to com-ponents that also perform other functions of the imag-ing process, i.e., media transport.
Since the majority of the photoreceptor velocity varia-tion is of known and constant periods that are relatedto the transmission gearing, repetitive control is a fea-sible solution to compensate for these periodic distur-bances. Repetitive control based systems have beenshown to work well for tracking periodic reference com-mands and rejecting periodic disturbances in regulationapplications. The analysis and synthesis of repetitivecontrollers for continuous time single-input-single-out-put (SISO) systems were first proposed by Hara and co-workers. and they extended the idea to MIMO systemsin 1998.26 Around the same time, Tomizuka and co-work-ers27 addressed the analysis and synthesis of discretetime repetitive controller considering the fact that digi-tal implementation of a repetitive controller is simplerand does not require the controlled plant to be proper.
In this study, a two level closed-loop photoreceptordrum velocity regulation control was proposed to reducemotion induced banding in EP processes. Through sys-tem modeling, signal processing, and experimental mea-surement, banding artifact was shown to stronglyrelated to the transmission quality, e.g., velocity. Theproposed compensation strategy is to improve the EPprocess stability by reducing the sensitivity of the pho-toreceptor velocity regulation to both periodic and non-periodic disturbances and manufacturing uncertainties.The proposed drum velocity loop was closed at the pho-toreceptor angular position through an optical shaftencoder. To account for the effect of the human visualsystem in interpreting non-periodic and low spatial fre-quency artifacts, a HVS based loop-shaping controllerwas designed to incorporate the human CSF into thenominal loop design. The HVS based controller alsohelped eliminate dc drift as well as provided robustnessto the photoreceptor velocity loop. A second level repeti-tive controller was designed to compensate for the peri-odic disturbances that are the major contributors tovisual banding. With the removal of the dc componentsof the disturbances by the HVS based controller, thenominal (mean) value of the photoreceptor angular ve-locity will be fixed. Thus, the fundamental and harmonicfrequencies of the periodic disturbances are stationaryand the repetitive control algorithm can be applied di-rectly without modification. Effectiveness of the pro-posed control approach was verified by using a 600 dpimonochrome EP engine. Experimental results showedsignificant disturbance reduction in the measured ve-locity and reflectance within the spatial frequency rangewhere human vision is most sensitive to periodic arti-facts. Subjective evaluation of the printed images alsodemonstrated significant improvement.
System DescriptionElectrophotographic (EP) Process
A brief description of the electrophotographic imag-ing process is presented here. A detailed discussion ofthe physics can be found in Schein.28 The central com-ponent in the EP process is the photoreceptor, or basedon the material, sometimes called the organic
Banding Reduction in Electrophotographic Processes Using Human Contrast ...Velocity Control Vol. 47, No. 3, May/June 2003 211
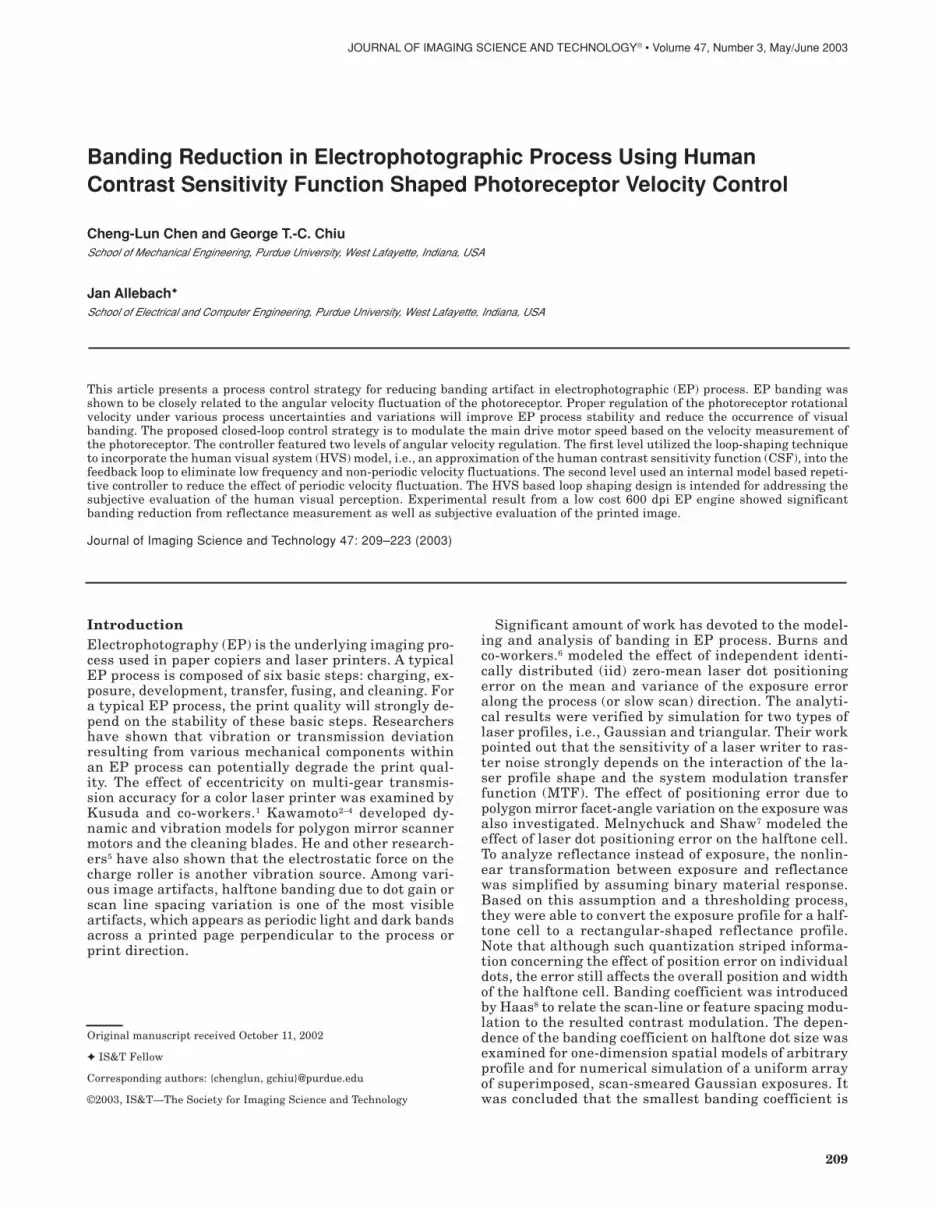
photoconductor (OPC), which is in the form of a drumor a belt that continuously rotates and cyclically inter-acts with several stationary subsystems or processes.The photoreceptor is used as a staging area where atoner image is first built up before being transferred tothe paper, or to an intermediate transfer medium. Thedensity profile of the toner image, which is critical tothe print quality, depends on the behavior of the follow-ing six basic steps (see Fig. 1):
Primary Charge: A primary charge roller applies aDC bias to the photoreceptor. This is usually achievedby placing the photoreceptor near a high voltage corotronwire or roller, which emits charged particles via the coro-nal discharge process. A uniform charge density is thencreated on the surface of the photoreceptor. The result-ing charge level depends on the voltage and the condi-tion of the corotron wire, the relative motion, anddistance between the corotron and the photoreceptor,as well as the voltage on the metal grid.
Laser Exposure: The charged photoreceptor thentravels to an exposure station, where a binary operated(either on or off) raster laser beam scans the photore-ceptor line by line and emits light at locations wheretoners are desired (if a discharged area developmentprocess is used). Since the photoreceptor is photosensi-tive, areas where light is shone is discharged. This cre-ates a discharge density profile on the photoreceptor,known as the latent image that resembles the desiredimage. The depth of the discharge (the discharged well)is affected by the laser power and the nonlinear photo-induced discharged characteristic of the photoreceptor.
Development: In this step, toner particles are depos-ited on the photoreceptor. Within the development hous-ing, toner particles are pre-charged by being agitatedagainst magnetic carrier beads via the triboelectric pro-cess. By biasing the voltage of the development housingwith respect to that of the photoreceptor, the chargedtoner particles are selectively deposited onto the dis-charged or the charged regions (the latent image) onthe photoreceptor. A toner image that corresponds to thedesired image is created. The development process de-
pends heavily on the electric field profile in the devel-opment gap, as established by the charge profile on thephotoreceptor, bias voltages of the development hous-ing, toner charge density, as well as toner surface prop-erties such as cohesivity.
Transfer: In this step, the toner image is transferredto the paper. In general, the photoreceptor is brought incontact with an intermediate medium or a sheet of pa-per so that the toner particles, which were loosely at-tached by electrostatic forces to the photoreceptor aredeposited onto the medium. This process requires thatthe intermediate medium or the paper be pre-chargedto a sufficiently high potential relative to that of thephotoreceptor.
Waste Toner Cleaning: Toner particles that failed todeposit onto the paper is brushed off (electrically and/ormechanically) into the waste toner reservoir by a clean-ing blade to avoid contaminating the subsequent images.
Fusing: The final step is the fusing of the toners tothe paper. The heat and pressure provided by the fus-ing assembly serve two purposes: to permanently fusethe toner to the paper, and to melt the toner together toproduce the full color image on the page.
The Monochrome EP ProcessFor a monochrome EP process, the coordination among
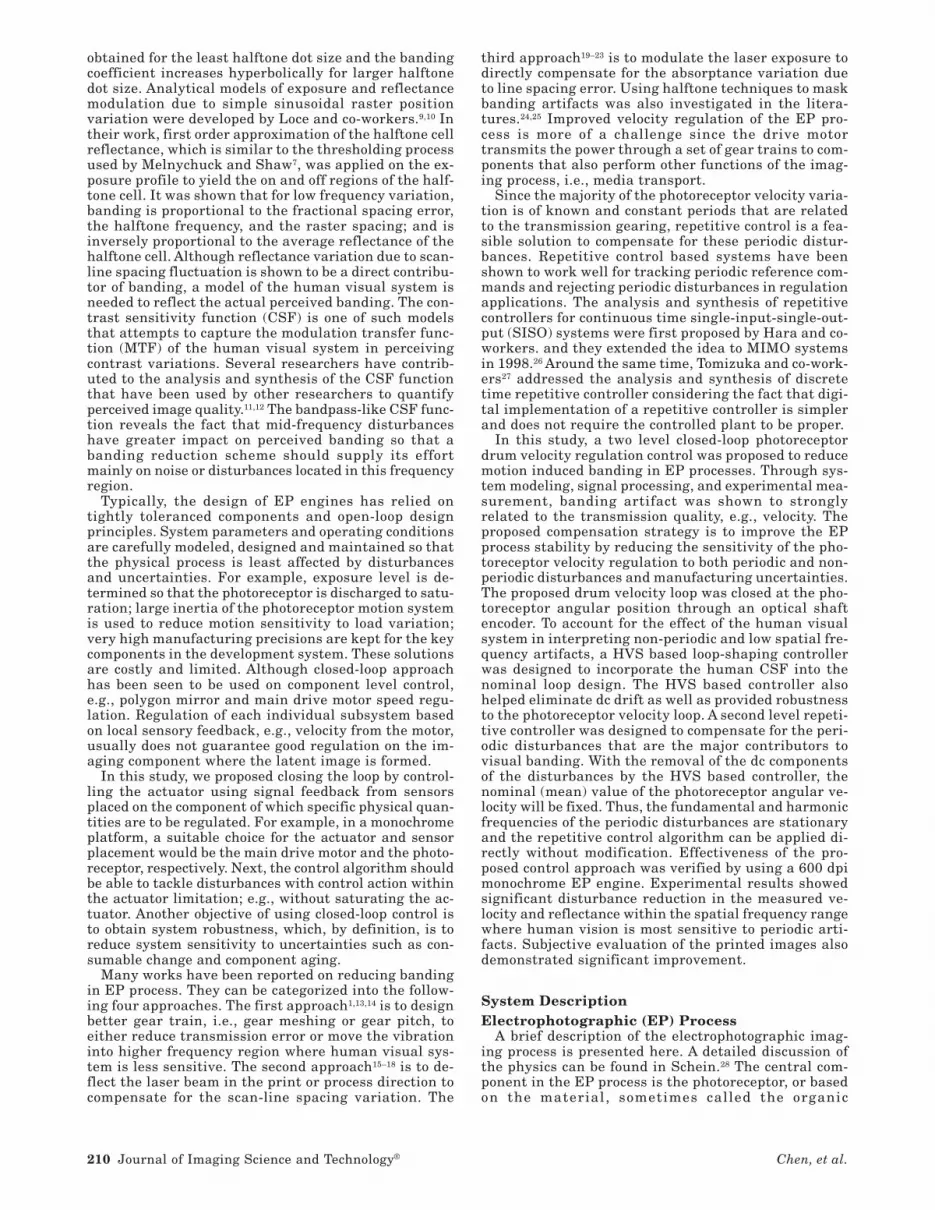
several motion systems is essential to the final printquality: (see Fig. 2):• The image formation system, which includes the sub-
system responsible for the motion of the photorecep-tor, and the subsystem controlling the rastering ofthe laser beam.
• The pick-up/feed system in charge of paper pick-upand transportation.
• The fusing system.
The first imaging subsystem is usually a motor/geartransmission system composed of a motor, gear trains,and a photosensitive drum or belt. The motor suppliestorque to maintain constant angular velocity for the pho-toreceptor. The velocity of the motor is controlled
Figure 1. Six basic steps for a typical electrophotographic (EP) process: charging, exposure, developing, transferring, cleaning,and fusing.
212 Journal of Imaging Science and Technology® Chen, et al.
through a driver. For stepper motor, the driver gener-ates and repeats a set of stepping sequences, e.g., halfor full stepping at certain pre-specified stepping ratesuch that the motor velocity is proportional to the step-ping rate. For brushless dc (BLDC) motor, the drivermodulates the amount of currents flowing through thearmature windings of the motor by techniques like pulsewidth modulation (PWM), and thus is able to adjust themotor velocity. The motor shaft drives a set of gear trainsthat connect with the photoreceptor as well as the cor-responding rollers in the EP subsystems.
The second imaging subsystem is the optics part ofthe EP process, i.e., the laser control unit, the laser di-ode and the polygon mirror, which deflects the laserbeam to the surface of the photoreceptor. Its main taskis to control the intensity and location of the laser. Thelaser control unit generates pulses that control the on–off of the laser diode based on the image that is to beexposed on the photoreceptor.
Nominally, the polygon mirror and the photoreceptormove at constant linear or angular speed by using sepa-rate open or closed-loop control, and the laser intensityis preset at certain level. Across-page rastering isachieved by the rotating polygon mirror deflecting thelaser beam with the preset intensity from the laser diodeacross the surface of the photoreceptor, where the scan-line spacing, variation of which induces visual banding,is determined by the motion of the photoreceptor. Themotion quality of the photoreceptor thus affects the im-age quality since it can be affected by mechanical load-ing and disturbances such as structure vibrations.
System ModelingAs mentioned previously, halftone banding is an artifactdue to periodic luminance or reflectance variation on aprinted page. Factors that affect either scan-line spac-ing or dot gain variation are the main contributors tobanding. Researchers have shown that vibration or trans-mission error resulting from mechanical componentswithin an EP system can affect scan-line spacing and thusinduce banding. Furthermore, models have also been de-veloped for modeling and analysis of the reflectance varia-tion (banding) due to scan-line spacing variation in EP
processes. In the following, we will derive the nonlinearmapping that relates a set of process parameters, i.e.,laser scanning frequency, angular velocity of the photo-receptor, and the radius of rotation, to the output reflec-tance on the printed image.
From Process Parameters to Scan Line SpacingA rigorous relation among the scan-line spacing, the
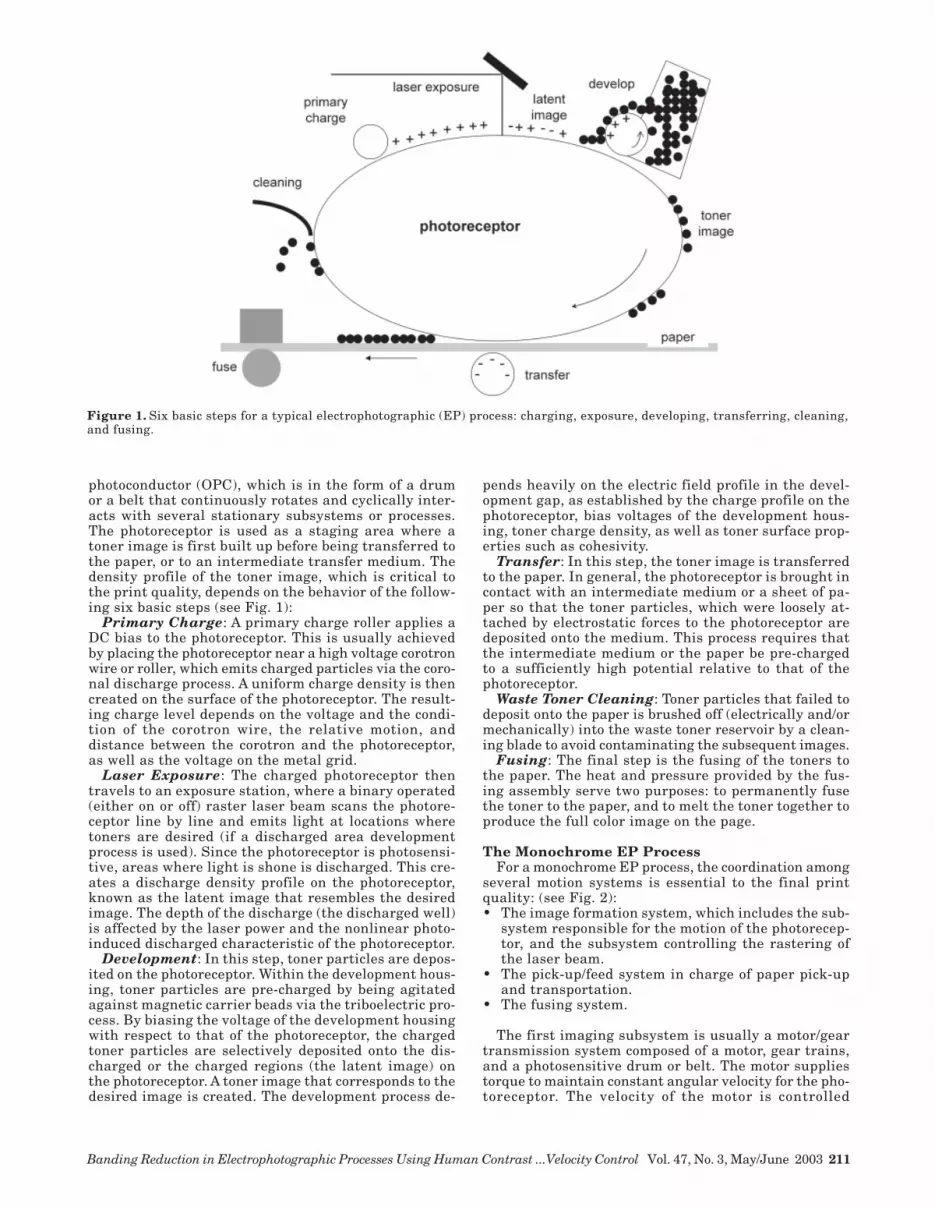
photoreceptor drum velocity, and the instantaneous ra-dius of rotation can be derived by inspecting Fig. 3,where fs is the laser beam scanning frequency in Hz and∆l is the scan-line spacing. Suppose at point P, wherethe laser beam hits the surface of the drum, the instan-taneous radius of rotation is r. θ and w are angular po-sition and angular velocity, respectively. From basicgeometry, we have
dl dr rd= +( ) ( )2 2θ (1)
which implies that
dld
drd
rθ θ
=
+2
2 (2)
or
dl dtd dt
drd
rθ θ
=
+2
2 (3)
Use the fact that w = dθ/dt, we have
dldt
wdrd
r=
+θ
22
. (4)
Now suppose that (l0,t0) is the coordinate pair represent-ing the measured linear displacement at time t0. Theline spacing thus is governed by the following equation:
Figure 2. Motion systems that coordinate the sequence of EP processes. The image formation system is composed of the motor/gear transmission subsystem and the laser/polygon mirror subsystem.
Banding Reduction in Electrophotographic Processes Using Human Contrast ...Velocity Control Vol. 47, No. 3, May/June 2003 213
∆
∆l dl w
drd
r dtl
l l
t
t fs= =
++ +
∫ ∫0
0
0
02
21
θ
/(5)
Since no assumptions are made on velocity, radius andscanning frequency, Eq. (5) gives a general kinematicrelationship among those variables.
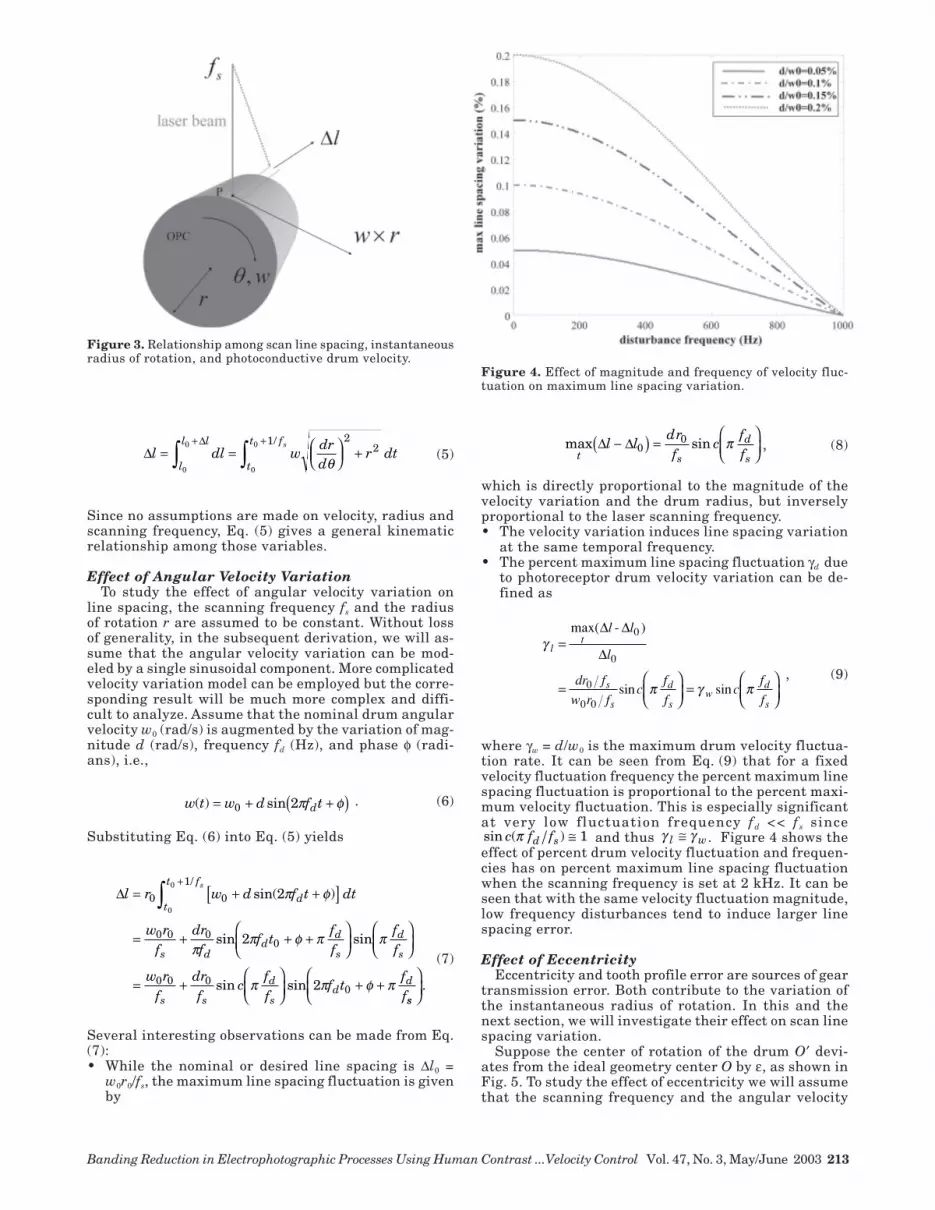
Effect of Angular Velocity VariationTo study the effect of angular velocity variation on
line spacing, the scanning frequency fs and the radiusof rotation r are assumed to be constant. Without lossof generality, in the subsequent derivation, we will as-sume that the angular velocity variation can be mod-eled by a single sinusoidal component. More complicatedvelocity variation model can be employed but the corre-sponding result will be much more complex and diffi-cult to analyze. Assume that the nominal drum angularvelocity w0 (rad/s) is augmented by the variation of mag-nitude d (rad/s), frequency fd (Hz), and phase φ (radi-ans), i.e.,
w t w d f td( ) sin= + +( )0 2π φ . (6)
Substituting Eq. (6) into Eq. (5) yields
∆l r w d f t dt
w rf
drf
f tff
ff
w rf
drf
cff
f tff
dt
t f
s dd
d
s
d
s
s s
d
sd
d
s= + +[ ]
= + + +
= +
+ +
+
∫0 0
1
0 0 00
0 0 00
2
2
2
0
0sin( )
sin sin
sin sin
/π φ
ππ φ π π
π π φ πss
.
(7)
Several interesting observations can be made from Eq.(7):• While the nominal or desired line spacing is ∆l0 =
w0r0/fs, the maximum line spacing fluctuation is givenby
max sin
t s
d
sl l
drf
cff
∆ − ∆( ) =
0
0 π , (8)
which is directly proportional to the magnitude of thevelocity variation and the drum radius, but inverselyproportional to the laser scanning frequency.• The velocity variation induces line spacing variation
at the same temporal frequency.• The percent maximum line spacing fluctuation γd due
to photoreceptor drum velocity variation can be de-fined as
γ
π γ π
lt
s
s
d
sw
d
s
l l
l
dr f
w r fc
f
fc
f
f
=
=
=
max( - )
sin sin
∆ ∆
∆
0
0
0
0 0
, (9)
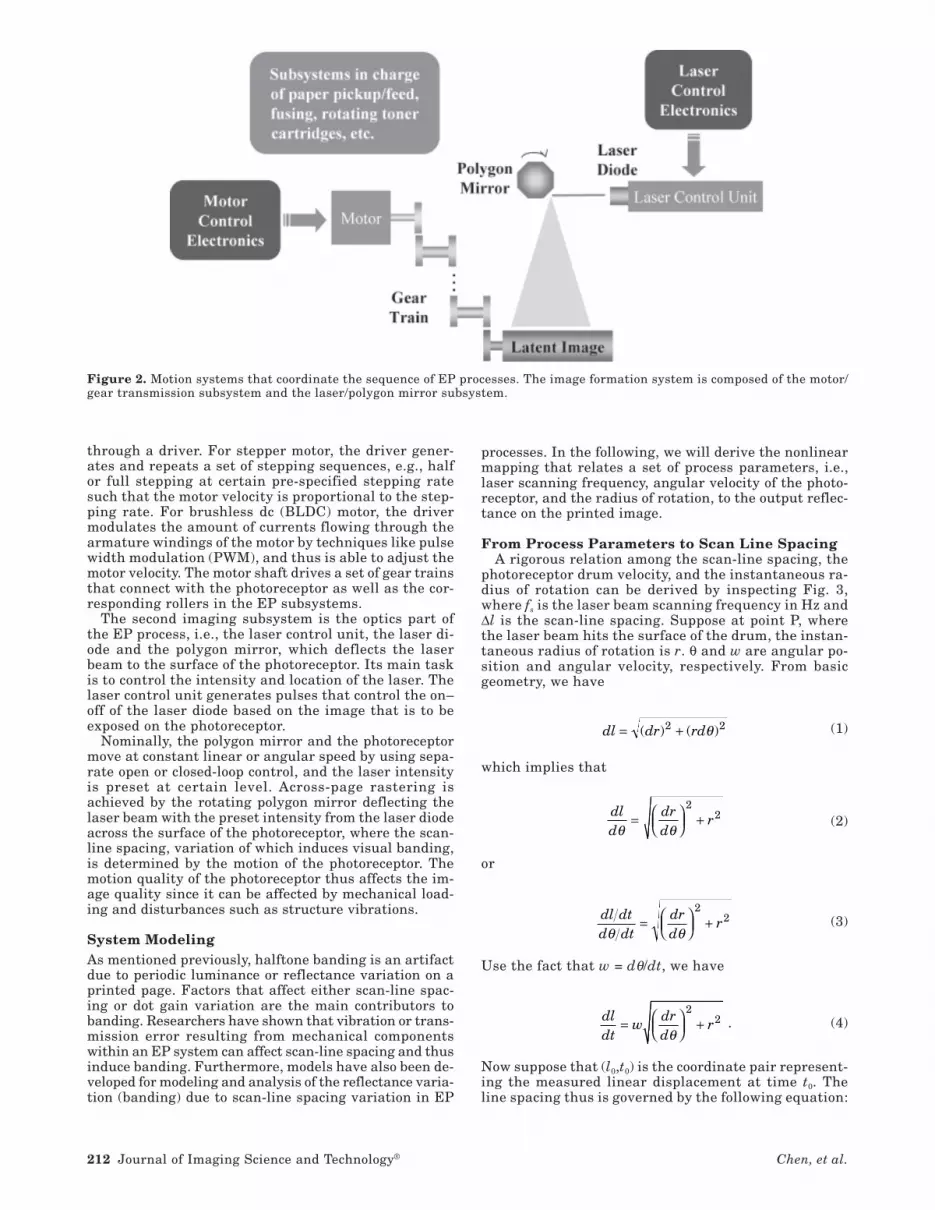
where γw = d/w0 is the maximum drum velocity fluctua-tion rate. It can be seen from Eq. (9) that for a fixedvelocity fluctuation frequency the percent maximum linespacing fluctuation is proportional to the percent maxi-mum velocity fluctuation. This is especially significantat very low fluctuation frequency fd << f s since sin ( )c f fd sπ ≅ 1 and thus γ γl w≅ . Figure 4 shows theeffect of percent drum velocity fluctuation and frequen-cies has on percent maximum line spacing fluctuationwhen the scanning frequency is set at 2 kHz. It can beseen that with the same velocity fluctuation magnitude,low frequency disturbances tend to induce larger linespacing error.
Effect of EccentricityEccentricity and tooth profile error are sources of gear
transmission error. Both contribute to the variation ofthe instantaneous radius of rotation. In this and thenext section, we will investigate their effect on scan linespacing variation.
Suppose the center of rotation of the drum O′ devi-ates from the ideal geometry center O by ε, as shown inFig. 5. To study the effect of eccentricity we will assumethat the scanning frequency and the angular velocity
Figure 3. Relationship among scan line spacing, instantaneousradius of rotation, and photoconductive drum velocity.
Figure 4. Effect of magnitude and frequency of velocity fluc-tuation on maximum line spacing variation.

214 Journal of Imaging Science and Technology® Chen, et al.
are both constants, e.g., w0 and fs are constants. Fromgeometry, we can express the instantaneous radius ofrotation r and dr/dθ as
r r r= + −02 2
02ε ε θcos (10)
and
drd
r
r rθε θ
ε ε θ=
+ −0
02 2
02
sin
cos. (11)
Assuming that the eccentricity is small compared withthe nominal radius of rotation, i.e., r0 >> ε, we have
rdrd
r rr
r r
rr r r r
r r
r
22
02 2
002 2 2
02 2
0
02
2
02
0
2 2
202
0
02
0
0
22
1 21 2
1 2
+
= + − ++ −
= + −
+
+ −
≅ −( )≅ −
θ
ε ε θ ε θε ε θ
ε ε θ ε θε ε θ
ε θ
ε θ
cossin
cos
cossin
cos
cos
cos .
(12)
The first approximation in the above equation is obtainedby neglecting the second order terms, while the last ap-proximation is done using the fact that (1 + x)k ≅ 1+ kx as x ≅ 0 . Substituting Eq. (12) into Eq. (5), we have
∆l wdrd
r dt
w r dt
t
t f
t
t f
s
s
=
+
= −
+
+
∫∫
0
22
1
0 0
10
0
0
0
θ
ε θ
/
/( cos ) .
(13)
Since θ = w0t + φ, therefore
∆lw r
fw t
w rf
w tf
w t
w rf
wf
w t
st
tf
s s
s s
s= − +
= − +
+
− +( )
= −
+ ′( )
+0 0
0
1
0 00 0 0 0
0 0 00 0
0
0
1
22
ε φ
ε φ φ
ε φ
sin( )|
sin sin
sin cos ,
(14)
where φ′ = w0/fs + φ. It can be seen that Eq. (14) can alsobe separated into a nominal line spacing and a varia-tion term due to eccentricity, ε. Further approximationon the variation term can be made if we accept that fs
>> w0, which is a necessary condition for EP processes.Equation (14) can be rewritten as
∆l
w rf
wf
w ts s
= − + ′( )0 0 00 0
ε φcos . (15)
Since for fs >> w0, sin w f w fs s0 02 2( ) ≅ , Eq. (15) indicatesthat the maximum scan line spacing variation due tophotoconductor drum eccentricity alone is proportionalto the magnitude of the eccentricity. Furthermore, thevariation frequency w0/2π is the drum rotating frequency.
Effect of Tooth Profile ErrorIn this section, the effect of tooth profile error will be
studied. Constant scanning frequency and the angularvelocity are assumed. Suppose that one end of the pho-toreceptor drum is a gear with N teeth of equal facewidth. As shown in Fig. 6, each tooth will span2π/N radians around the gear. Within each tooth span,the radius of rotation varies due to imperfect tooth pro-file. In general, each tooth will have its profile errorcausing certain amount of variation, b(θ), on the instan-taneous radius of rotation r0 such that r = r0 + b(θ), whereθ = w0t + φ is the angular position of the drum. b(θ) canbe restated as
b b
iN
iN
i Ni( ) ( )( )
,θ θ π θ π= − ≤ < for 2
= 1, 2,..., 1 2
,(16)
Figure 6. Modeling effect of tooth-profile error on scan linespacing.
Figure 5. Modeling effect of eccentricity on scan line spacing.
Banding Reduction in Electrophotographic Processes Using Human Contrast ...Velocity Control Vol. 47, No. 3, May/June 2003 215
where N is the number of teeth. Note that b(θ) is alsoperiodic, i.e.,
b b( ) ( ).θ θ π= + 2 (17)
Actual gear measurements31 suggested that tooth pro-file error usually introduces transmission error with afundamental frequency equal to the number of teeth perrevolution. The corresponding error magnitude is alsomuch larger than its harmonics at higher frequencies.Thus, without loss of generality, we will restrict the fol-lowing discussion to the case in which r = r0 + b(θ) withb(θ) = β sin (Nθ + ϕ) and θ = w0t, i.e., the radius error is2π/Nθ periodic. β is the maximum tooth profile error.Since
drd
N Nθ
β θ ϕ= +( )cos , (18)
let the instantaneous radius of rotation R(θ) be
Rdrd
r
N N r N r N
rr
Nr
NN
rN
θθ
β θ ϕ β θ ϕ β θ ϕ
β θ ϕ β θ ϕ β θ ϕ
( ) =
+
= +( ) + + +( ) + +( )
= + + + + + +
22
2 2 20
2 2 20
00
2
02
22 2
02
2
2
1 2
cos sin sin
sin( ) sin ( ) cos ( ).
If r0 >> β, Eq. (19) can be further simplified to
R r
rN
N
rN( ) sin( ) cos ( ).θ β θ ϕ β θ ϕ≅ + + + +0
0
2 2
02
21 2 (20)
Substituting Eq. (20) into Eq. (5), the scan line spacingcan be calculated as
∆l w R dt
w rr
NN
rN dt
w rf r
NN
rN
t
t f
t
t f
s
s
s
= ( )
= + + + +
≅ + + + +
+
+
∫
∫
0
1
0 00
2 2
02
21
0 0
0
2 2
02
2
0
0
0
01 2
1 2
θ
β θ ϕ β θ ϕ
β θ ϕ β θ ϕ
/
/sin( ) cos ( )
sin( ) cos ( ).
(21)
The last approximation in the above equation is basedon the fact that the instantaneous radius of rotation R(θ)does not change during one laser scan period, which isreasonable for an EP engine with high scanning fre-quency and relatively slow photoreceptor drum angu-lar velocity. When r0 >> βN, e.g., when the number ofteeth is small, Eq. (21) can be further simplified by ne-glecting the second order term; i.e.,
∆lw r
f rN
N
rN
w rf r
N
w rf
wf
Nw t
s
s
s s
≅ + + + +
≅ + +
≅ + +( )
0 0
0
2 2
02
2
0 0
0
0 0 00
1 2
1 2
β θ ϕ β θ ϕ
β θ ϕ
β ϕ
sin( ) cos ( )
sin( )
sin .
(22)
Similar observations can be made from Eq. (22) aboutthe effect of tooth profile error on the scan-line spacingvariation as that of the eccentricity. Note that the varia-tion frequency Nw0/2π now equals to the number of teethper revolution.
SimulationMore complicated analysis can be performed for situ-
ations when various error sources are present at thesame time. In this case, however, numerical simulationmight be more useful in predicting the results. If theinstantaneous radius of rotation is given by Eq. (19),the governing equation of the scan line spacing, i.e., Eq.(1) , can be rewritten as
∆
∆l dl wR dt
l
l l
t
t f= =
+ +
∫ ∫0
0
0
0 1( )
/θ (23)
with
R dr d rθ θ( ) = +( )2 2 ,
and
r r r b= + − +02 2
02ε ε θ θcos ( ). (24)
Note that r now takes into account both eccentricityand tooth profile error.
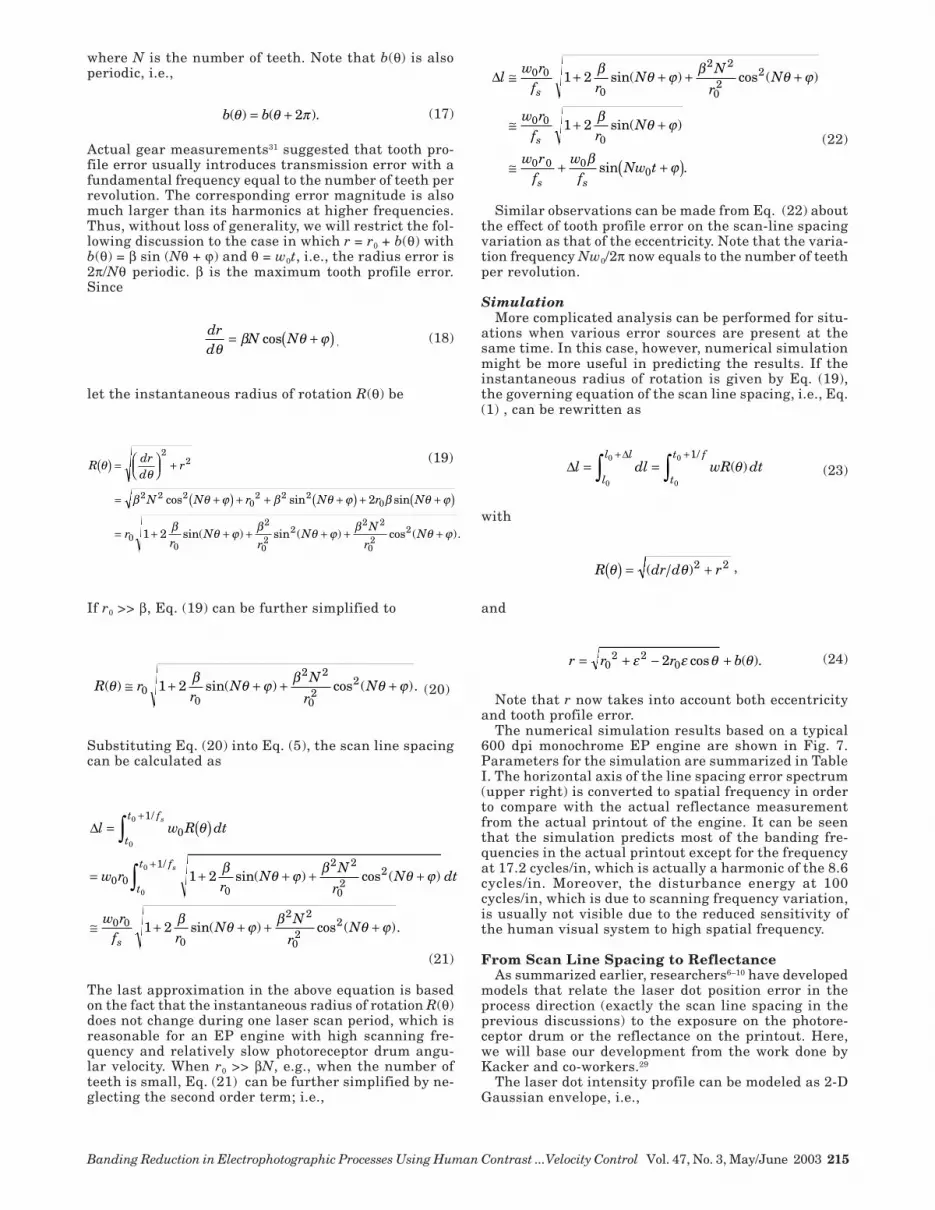
The numerical simulation results based on a typical600 dpi monochrome EP engine are shown in Fig. 7.Parameters for the simulation are summarized in TableI. The horizontal axis of the line spacing error spectrum(upper right) is converted to spatial frequency in orderto compare with the actual reflectance measurementfrom the actual printout of the engine. It can be seenthat the simulation predicts most of the banding fre-quencies in the actual printout except for the frequencyat 17.2 cycles/in, which is actually a harmonic of the 8.6cycles/in. Moreover, the disturbance energy at 100cycles/in, which is due to scanning frequency variation,is usually not visible due to the reduced sensitivity ofthe human visual system to high spatial frequency.
From Scan Line Spacing to ReflectanceAs summarized earlier, researchers6–10 have developed
models that relate the laser dot position error in theprocess direction (exactly the scan line spacing in theprevious discussions) to the exposure on the photore-ceptor drum or the reflectance on the printout. Here,we will base our development from the work done byKacker and co-workers.29
The laser dot intensity profile can be modeled as 2-DGaussian envelope, i.e.,
(19)
216 Journal of Imaging Science and Technology® Chen, et al.
I x y I
x y
x y( , ) exp= − −
0
2 2
2 2σ σ Watts / m2
, (25)
where x and y are the position in the scan and processdirection, respectively. I0 is the peak intensity of the laser,and σx and σy are the standard deviations which describethe width of the profile. As we are focusing on effect of thedot positioning error in the process direction, the follow-ing 1-D profile will be considered,
I y t I t
y
y( , ) ( ) exp .= −
0
2
2σ (26)
Note that the value of I0(t) will depend on the switch-on and switch-off time of the laser, which can be ex-pressed as
I t
I t tI t t t t t
r
off r off f
0
01
1
( )
,( exp( )),
( exp( ))(exp( )),max
max
=
− − ≤ ≤− − − −
t < 0 0 t t
t > toff
off
(27)
where it is assumed that the laser is switched on at t =0 and off at t = toff. tr is the time for the laser intensity toreach Imax and tf is the time for the intensity to fall backto 0. The exposure value at position y due to the n-thprinted pixel along the process direction at position yn
can be computed by
E y I
y ydn
n
y( ) ( ) exp(
( ))= −
−∞
∫ 0
2
20 2τ
στ J / m2
. (28)
Assuming that the contributions of each printed pixelto the total exposure on the photoreceptor drum is ad-ditive, the total exposure value at y may be found by
E y E ynn
( ) ( )= ∑ . (29)
The relation among the exposure on the photoreceptordrum, toner mass transferred during development stageand the final reflectance/absorptance at any fixed posi-tion on the page is quite complicated. However, a staticnonlinear mapping γ(⋅) between the exposure E(y) on thephotoreceptor drum and the reflectance R(y) on the pa-per can be obtained experimentally, i.e.,
R(y) = γ(E(y)). (30)
A typical γ curve can be found in Kacker ’s study.29
To obtain the model from transmission error to half-tone banding, first note that the position of the n-th scanline, yn, can be expressed as
y w
drd
r dtn
nfs=
+∫ θ
22
0, (31)
which is based on Eq. (5). Substituting Eq. (31) into(28) and use Eq. (29) and (30), we have
Figure 7. Simulation results of the scan line spacing variation due to various transmission error sources. The actual reflectancemeasurement is also shown for comparison.
TABLE I. Parameter Set-up for the Scan Line Spacing Simulation
Platform 4M
Nominal Radius of rotation r0 (inch) 1.183/2PC drum velocity w0 (rad/s) 3.141Number of teeth N 32Scanning period Ts0 (Hz) 1/1111
Variation Eccentricity ε (inch) 0.0059Velocity variation frequency fd (Hz) 48Velocity variation ∆w (rad/s) 0.01Scanning period variation ∆Ts (sec) 0.01/1111Tooth profile error β (inch) 0.003
Banding Reduction in Electrophotographic Processes Using Human Contrast ...Velocity Control Vol. 47, No. 3, May/June 2003 217
R y
Iy w t dr d r t dt
d
n f
yn
s
( )
( ) exp( ) ( ) ( ) )
=
−− +
∫∫∑∞
γ τθ
στ0
2 2
020 2
(32)
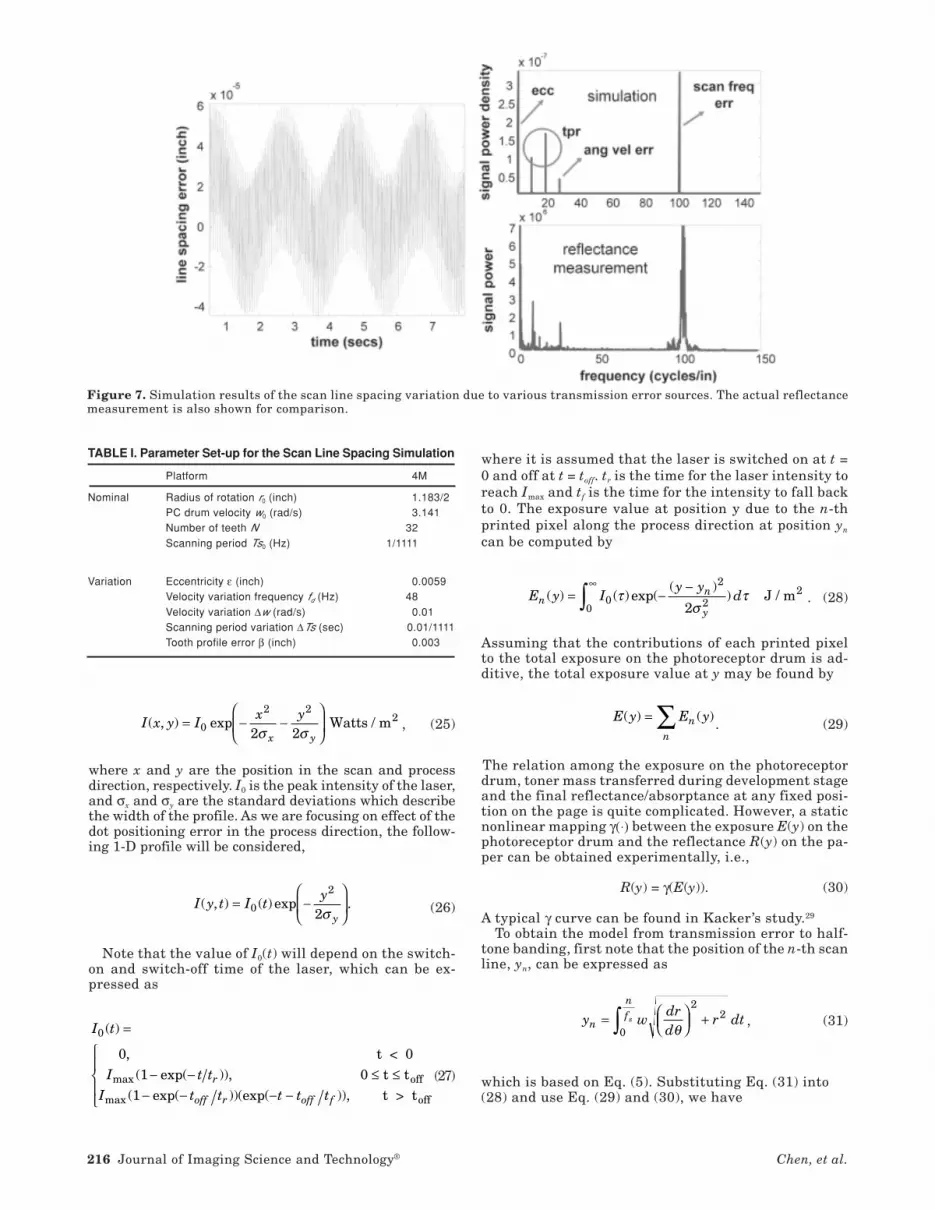
Equation (32) is a complete model that maps the trans-mission parameters such as scanning frequency, angu-lar velocity, and radius of rotation to the outputreflectance on a printed page. Numerical simulation canbe performed based on this equation to help us investi-gate the relationship among those parameters, whichis not the main focus of this study. The close correlationamong angular velocity variation, line spacing varia-tion, and reflectance variation can also be verified bycomparing the actual measurements. Figure 8 showsthe frequency spectrums of the measured velocity er-ror, line spacing variation, and reflectance variation fora typical 600 dpi laser platform. We observe similarityof those three frequency spectrums in the frequency re-gion from 5 to 30 cycles/in. This indicates that angularvelocity fluctuation has direct effect on output reflec-tance variation, which implies that control of the pho-toreceptor drum angular velocity could reduce bandingartifact.
Controller DesignClosed-Loop OPC Drum Velocity Regulation
As described previously, the imaging part of most mono-chrome laser printing systems consists of two subsystems(see Fig. 2). The first subsystem forms a motor/gear-traintransmission system, which is composed of the main
motor drive with onboard driver, the gear train and theOPC drum. Phase-lock loop (PLL) is the most commonmethod of velocity control for BLDC motors. The PLL isa feedback system composed of a phase comparator, alow-pass filter, an error amplifier in the forward signalpath, and a pulse generator in the feedback path. Thedesired angular velocity is proportional to the frequencyof the reference pulse generated by the oscillator. Themotor angular velocity is proportional to the frequencyof the frequency generator (FG) pulses generated by theHall-effect sensors. The phase comparator compares thephase differences between these two signals and gener-ates an error signal proportional to the phase difference.The phase error is then passed through the low-pass fil-ter and the amplifier to set voltage level for the PWMgenerator, which will modulate the amount of currentflowing through the phase windings and adjust the mo-tor velocity.
Note that the PLL is to regulate the speed of the mo-tor and not that of the photoconductor drum. Since themotor shaft, the gear train and the photoconductor drumare not rigidly coupled, constant motor speed does notguarantee constant photoconductor drum velocity. Thatis, the Hall-effect sensor will not be able to pick up thedisturbances introduced between the motor and thephotoconductor drum. This is demonstrated by observ-ing the signal from the Hall-effect sensor and that ofthe optical encoder mounted on the photoconductordrum, see Fig. 9. Therefore, to compensate for the dis-turbances that cause photoconductor drum velocity fluc-tuation, it would be desirable to regulate thephotoconductor drum velocity by directly measuring thedrum velocity or position.
A schematic of the proposed closed-loop system is de-picted in Fig. 10. Two separate controllers are to be de-signed based on the transfer function from control effort,u(s), to the angular velocity error, e(s), which is the calledplant transfer function. A 3rd order model is fitted tothe experimental frequency response of the plant ashaving the following transfer function:
G s
s s s0
7
3 2 5 62 046 10
801 3 4 443 10 4 326 10( )
.
. . ..= ×
+ + × + × (33)
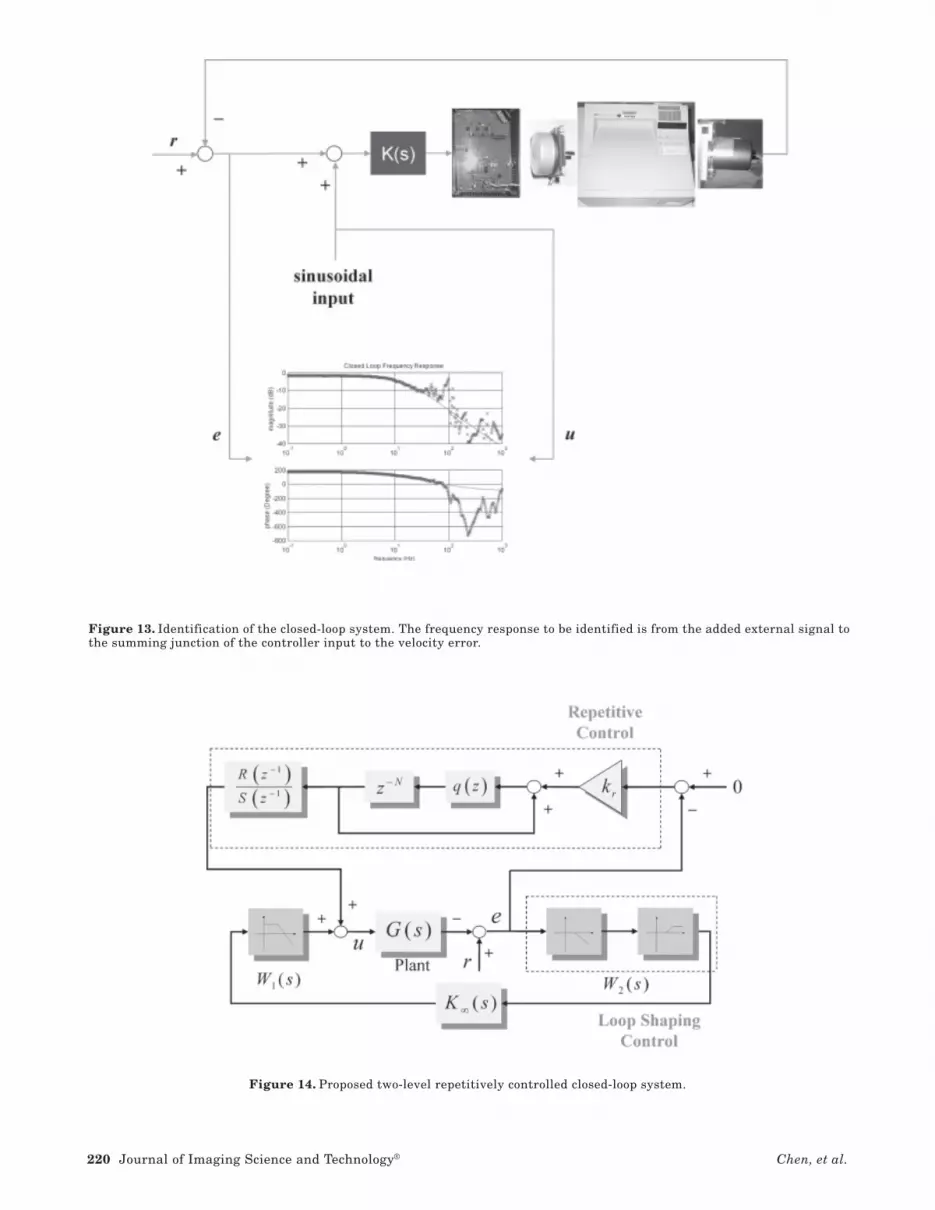
The loop shaping controller forms the first layer con-trol, which will reject those non-periodic disturbanceslying within the low frequency region. Note that thislayer of control also aims at eliminating the dc compo-nent of the disturbances so that the frequencies of theremaining periodic components will be stationary. Therepetitive controller then forms the second layer of con-trol to cancel those periodic disturbances. The input tothe controllers, e(s), is the angular velocity error of theOPC drum measured by an optical encoder and the con-trol effort u(s) to the motor driver are summation of thecomputed outputs from both controllers.
Synthesis of the HVS Shaped H∞ Loop-shapingController
The guideline for H∞ loop-shaping design is availablein many existing literatures.30 The objective is to designfeedback controllers such that the open-loop transferfunction has high gain at the specific frequencies wheredisturbances are to be rejected. The human contrast sen-sitivity function (CSF) is a good target for shaping theopen loop transfer function gain where high gain is re-quired to reduce the perceived banding (with high con-trast sensitivity). It also provides a guideline for reducing
Figure 8. Spectra of the measured average absorptance,scanned line spacing and the rastering line spacing.

218 Journal of Imaging Science and Technology® Chen, et al.
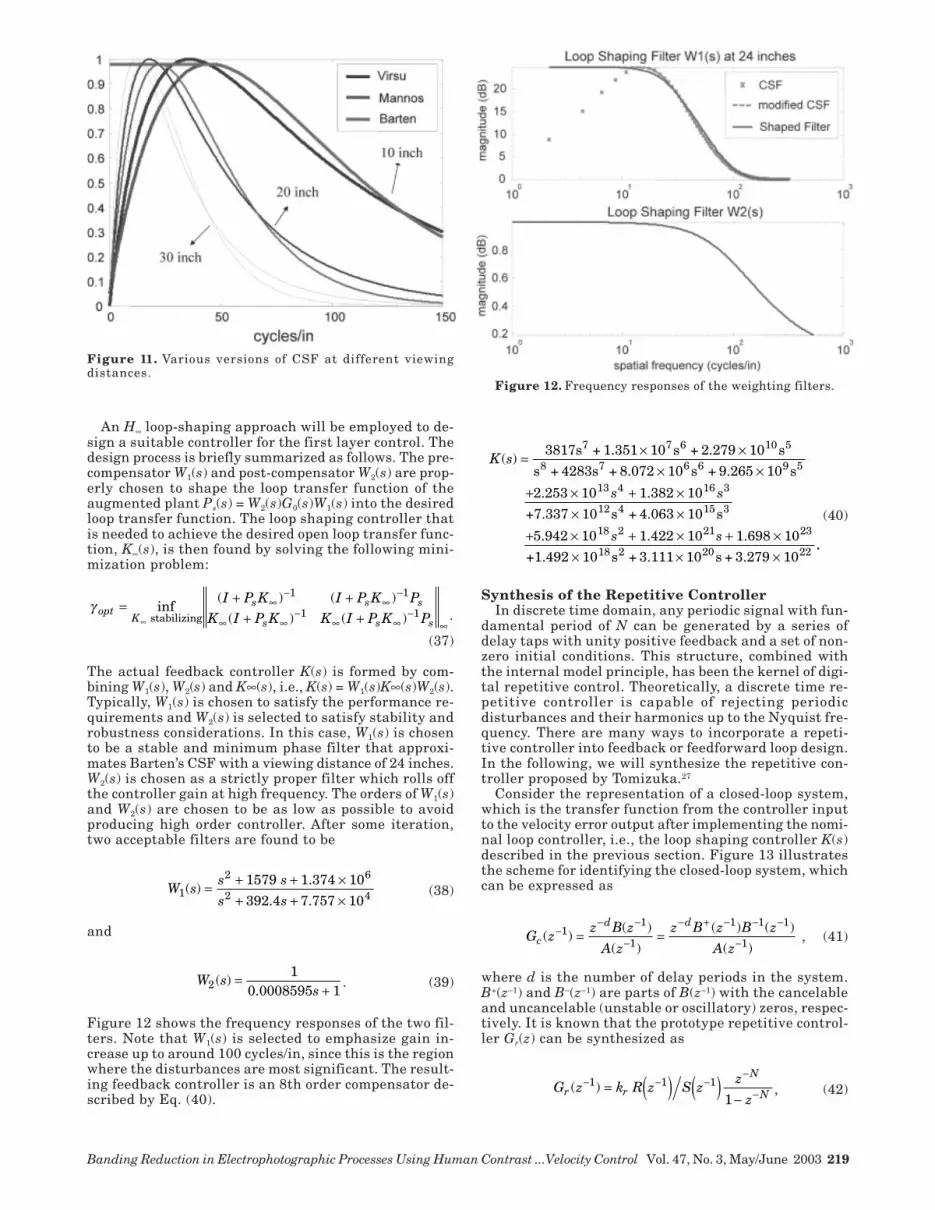
the open-loop transfer function gain to provide robust-ness for actuator bandwidth limitation and model uncer-tainty. There are various versions of CSF functions inthe existing literature,11,12 which all represent certainband-pass or low pass characteristics, see Fig. 11. Inparticular Barten’s low-pass model, which is modifiedfrom Mannos’ model, can be parameterized to be12
CSF f a b cf e f f
CSF f a b cf e f f
cf
cf
d
d
( ) , max
max maxmax
1 1 1
1 1
1= × +( ) ≥
( ) = × +( ) <
−( ){ }−( ){ }
if
, if (34)
with a = 2.6, b = 0.0192, c = 0.114, d = 1.1. In addition,
f
f
vd1 1360 1 2
= ×× ( )−
πtan , (35)
where vd is the viewing distance in inch, f is the spatialfrequency in cycles/in, and f1 is in cycles/deg. Note thatfmax satisfies the following equation:
1 01 1− − =− −bc df c dfd d d dmax max . (36)
From a feedback control design point of view, a cer-tain amount of low frequency gain is needed to main-tain an acceptable steady state operating speedregulation. Hence, Barten’s modified CSF would be abetter interpretation of the desired frequency dependentmagnitude profile of the open-loop transfer function ofthe OPC drum velocity control system.
Figure 9. Velocity fluctuation comparison between the photoconductor drum and the main drive motor.
Figure 10. Configuration of the proposed two-level closed-loop control system.
Banding Reduction in Electrophotographic Processes Using Human Contrast ...Velocity Control Vol. 47, No. 3, May/June 2003 219
Figure 11. Various versions of CSF at different viewingdistances.
An H∞ loop-shaping approach will be employed to de-sign a suitable controller for the first layer control. Thedesign process is briefly summarized as follows. The pre-compensator W1(s) and post-compensator W2(s) are prop-erly chosen to shape the loop transfer function of theaugmented plant Ps(s) = W2(s)G0(s)W1(s) into the desiredloop transfer function. The loop shaping controller thatis needed to achieve the desired open loop transfer func-tion, K∞(s), is then found by solving the following mini-mization problem:
γ optK
s s s
s s s
I P K I P K PK I P K K I P K P
= + ++ +∞
∞−
∞−
∞ ∞−
∞ ∞−
∞
inf( ) ( )
( ) ( ) stabilizing
1 1
1 1 .
(37)
The actual feedback controller K(s) is formed by com-bining W1(s), W2(s) and K∞(s), i.e., K(s) = W1(s)K∞(s)W2(s).Typically, W1(s) is chosen to satisfy the performance re-quirements and W2(s) is selected to satisfy stability androbustness considerations. In this case, W1(s) is chosento be a stable and minimum phase filter that approxi-mates Barten’s CSF with a viewing distance of 24 inches.W2(s) is chosen as a strictly proper filter which rolls offthe controller gain at high frequency. The orders of W1(s)and W2(s) are chosen to be as low as possible to avoidproducing high order controller. After some iteration,two acceptable filters are found to be
W s
s s
s s1
2 6
2 41579 1 374 10
392 4 7 757 10( )
.
. .= + + ×
+ + ×
(38)
and
W s
s21
0 0008595 1( )
.=
+ . (39)
Figure 12 shows the frequency responses of the two fil-ters. Note that W1(s) is selected to emphasize gain in-crease up to around 100 cycles/in, since this is the regionwhere the disturbances are most significant. The result-ing feedback controller is an 8th order compensator de-scribed by Eq. (40).
K s
s s
s s
( )
. .
. . .
= × ×× ×
+ × + ×× ×
+ × + × + ×× × ×
3817s + 1.351 10 s + 2.279 10 s
s + 4283s + 8.072 10 s + 9.265 10 s
10 10
+7.337 10 s + 4.063 10 s
10 10 10
+1.492 10 s + 3.111 10 s + 3.279 10
7 7 6 10 5
8 7 6 6 9 5
13 16
12 4 15 3
18 21 23
18 2 20 22
2 253 1 382
5 942 1 422 1 698
4 3
2..
(40)
Synthesis of the Repetitive ControllerIn discrete time domain, any periodic signal with fun-
damental period of N can be generated by a series ofdelay taps with unity positive feedback and a set of non-zero initial conditions. This structure, combined withthe internal model principle, has been the kernel of digi-tal repetitive control. Theoretically, a discrete time re-petitive controller is capable of rejecting periodicdisturbances and their harmonics up to the Nyquist fre-quency. There are many ways to incorporate a repeti-tive controller into feedback or feedforward loop design.In the following, we will synthesize the repetitive con-troller proposed by Tomizuka.27
Consider the representation of a closed-loop system,which is the transfer function from the controller inputto the velocity error output after implementing the nomi-nal loop controller, i.e., the loop shaping controller K(s)described in the previous section. Figure 13 illustratesthe scheme for identifying the closed-loop system, whichcan be expressed as
G z
z B z
A z
z B z B z
A zc
d d( )
( )
( )
( ) ( )
( )−
− −
−
− + − − −
−= =11
1
1 1 1
1 , (41)
where d is the number of delay periods in the system.B+(z–1) and B–(z–1) are parts of B(z–1) with the cancelableand uncancelable (unstable or oscillatory) zeros, respec-tively. It is known that the prototype repetitive control-ler Gr(z) can be synthesized as
G z k R z S z
z
zr r
N
N( )− − −−
−= ( ) ( )−
1 1 1
1, (42)
Figure 12. Frequency responses of the weighting filters.
220 Journal of Imaging Science and Technology® Chen, et al.
Figure 13. Identification of the closed-loop system. The frequency response to be identified is from the added external signal tothe summing junction of the controller input to the velocity error.
Figure 14. Proposed two-level repetitively controlled closed-loop system.
Banding Reduction in Electrophotographic Processes Using Human Contrast ...Velocity Control Vol. 47, No. 3, May/June 2003 221
where
R z k z A z B z
S z B z b b B e w
rd
jw
− − −
− + − − −
( ) = ( ) ( )
( ) = ( ) ≥ ( ) ∈[ ]
1 1
1 12
0
,
, max , , . π
with N = fs/fd, where fs is the sampling frequency of thediscrete time system and fd is the fundamental frequencyof disturbances to be rejected. For stability, kr is limitedto 0 < kr < 2. A zero-phase error low pass q-filter, q(z) =(z–1 + a + z)/(a + 2) with a∈Z+, is introduced in the for-ward or feedback loop of the delay taps to improve sta-bility robustness.
Experimental ResultsThe proposed two-level closed-loop control system isshown in Fig. 14. The control scheme is applied to theexperimental platform, a 600 dpi monochrome laserprinter. A high-resolution optical encoder capable of50,000 pulses per revolution is mounted on the OPCdrum. The sampling frequency of the experimental sys-tem is set to 1000 Hz. After activating the loop- shapingcontrol, the closed-loop system, Gc(z), is identified as Eq.(43):
G z
z z z z z
z z z z z
c ( )
- . . - . . - .
- . . - . . - ..
−
− − − − −
− − − − −
=
+ +( )+ +
1
1 1 2 3 4
1 2 3 4 5
0 01957 0 07826 0 1437 0 1197 0 03519
1 4 2971 7 7448 7 3329 3 6426 0 7569
(43)
Note that the one step delay z–1 comes from discretizingthe identified continuous-time system into its zero-or-der-hold (ZOH) equivalent discrete time model. Follow-ing the synthesis procedure, the repetitive controller isdesign to be
G z kz
z
R z
S zr r
N d
N−
− + +
−
−
−( ) = ⋅−
⋅( )( )
11 1
11
, (44)
where
kr = 0.12, d = 2,
and
R z z z z
z z
z z
S z z z
( ) ( . . .
. . )
( . - . )
( ) . . .
-
- -
- - -
1 1 2 3
4 5
1 2
1 1 2
1 4 2971 7 7448 7 3329
3 6426 0 75688
2 86761 2 3873
0 01957 0 03154 0 01227
= − + −
+ −
+
= − + −
− − −
− −
Since the fundamental frequency of the repetitive dis-turbances after closing the loop using the loop shapingcontroller is 8 Hz, the period of the repetitive controllerN should be set to N = 1000/8 = 125. To improve overallsystem robustness, a = 2 is chosen for the q-filter, i.e.,
q z
z z( ) = + +−1 24
. (45)
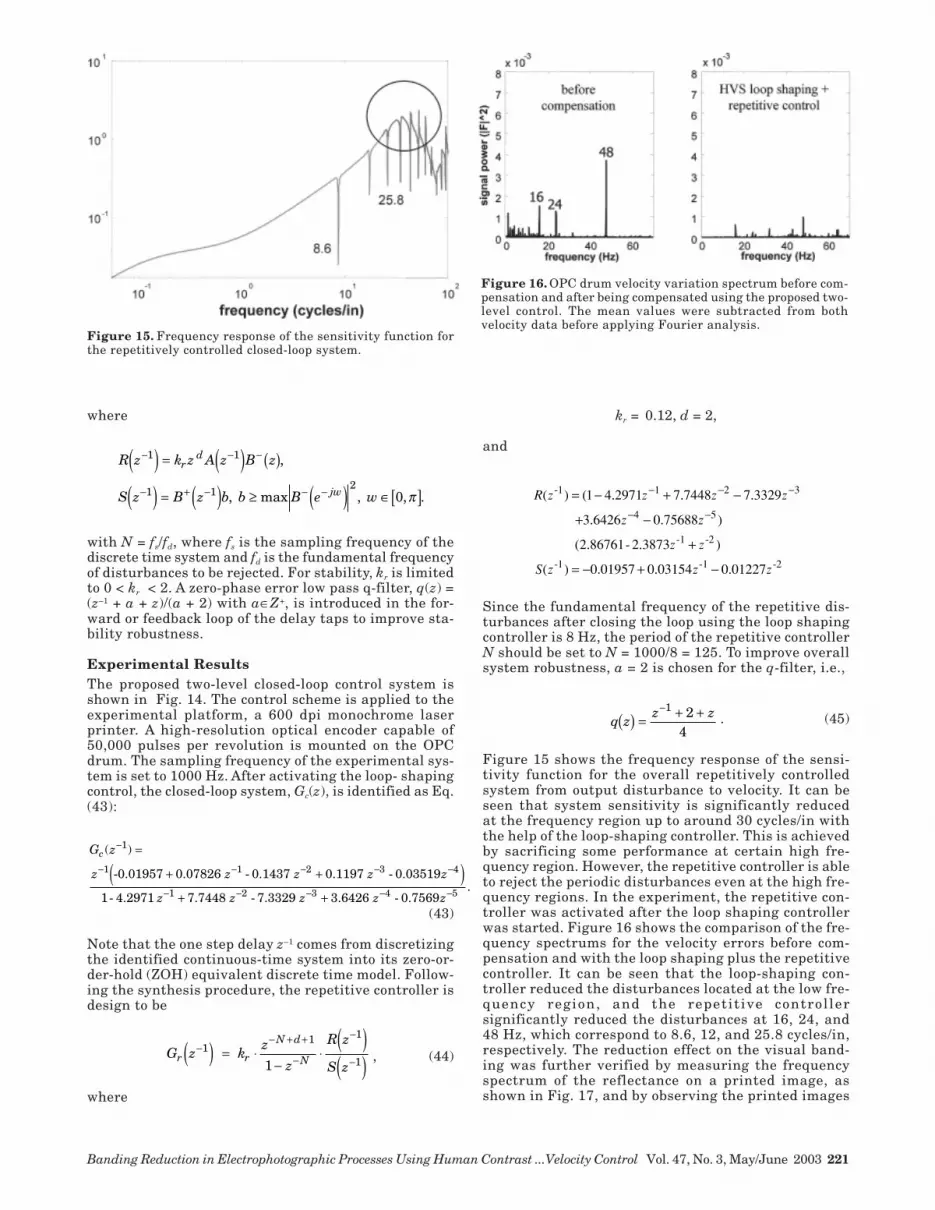
Figure 15 shows the frequency response of the sensi-tivity function for the overall repetitively controlledsystem from output disturbance to velocity. It can beseen that system sensitivity is significantly reducedat the frequency region up to around 30 cycles/in withthe help of the loop-shaping controller. This is achievedby sacrificing some performance at certain high fre-quency region. However, the repetitive controller is ableto reject the periodic disturbances even at the high fre-quency regions. In the experiment, the repetitive con-troller was activated after the loop shaping controllerwas started. Figure 16 shows the comparison of the fre-quency spectrums for the velocity errors before com-pensation and with the loop shaping plus the repetitivecontroller. It can be seen that the loop-shaping con-troller reduced the disturbances located at the low fre-quency region, and the repetit ive controllersignificantly reduced the disturbances at 16, 24, and48 Hz, which correspond to 8.6, 12, and 25.8 cycles/in,respectively. The reduction effect on the visual band-ing was further verified by measuring the frequencyspectrum of the reflectance on a printed image, asshown in Fig. 17, and by observing the printed images
Figure 15. Frequency response of the sensitivity function forthe repetitively controlled closed-loop system.
Figure 16. OPC drum velocity variation spectrum before com-pensation and after being compensated using the proposed two-level control. The mean values were subtracted from bothvelocity data before applying Fourier analysis.
222 Journal of Imaging Science and Technology® Chen, et al.
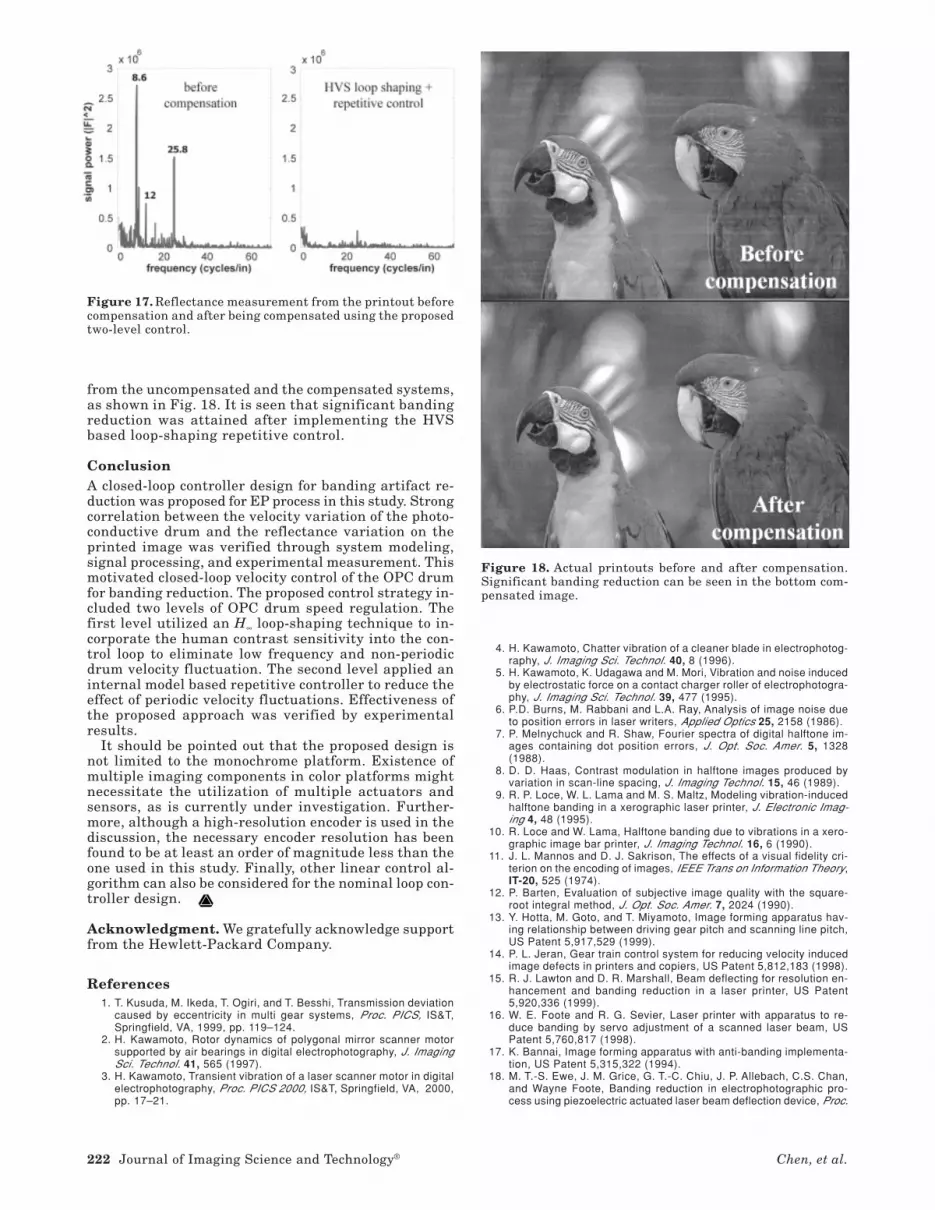
from the uncompensated and the compensated systems,as shown in Fig. 18. It is seen that significant bandingreduction was attained after implementing the HVSbased loop-shaping repetitive control.
ConclusionA closed-loop controller design for banding artifact re-duction was proposed for EP process in this study. Strongcorrelation between the velocity variation of the photo-conductive drum and the reflectance variation on theprinted image was verified through system modeling,signal processing, and experimental measurement. Thismotivated closed-loop velocity control of the OPC drumfor banding reduction. The proposed control strategy in-cluded two levels of OPC drum speed regulation. Thefirst level utilized an H∞ loop-shaping technique to in-corporate the human contrast sensitivity into the con-trol loop to eliminate low frequency and non-periodicdrum velocity fluctuation. The second level applied aninternal model based repetitive controller to reduce theeffect of periodic velocity fluctuations. Effectiveness ofthe proposed approach was verified by experimentalresults.
It should be pointed out that the proposed design isnot limited to the monochrome platform. Existence ofmultiple imaging components in color platforms mightnecessitate the utilization of multiple actuators andsensors, as is currently under investigation. Further-more, although a high-resolution encoder is used in thediscussion, the necessary encoder resolution has beenfound to be at least an order of magnitude less than theone used in this study. Finally, other linear control al-gorithm can also be considered for the nominal loop con-troller design.
Acknowledgment. We gratefully acknowledge supportfrom the Hewlett-Packard Company.
References 1. T. Kusuda, M. Ikeda, T. Ogiri, and T. Besshi, Transmission deviation
caused by eccentricity in multi gear systems, Proc. PICS, IS&T,Springfield, VA, 1999, pp. 119–124.
2. H. Kawamoto, Rotor dynamics of polygonal mirror scanner motorsupported by air bearings in digital electrophotography, J. ImagingSci. Technol. 41, 565 (1997).
3. H. Kawamoto, Transient vibration of a laser scanner motor in digitalelectrophotography, Proc. PICS 2000, IS&T, Springfield, VA, 2000,pp. 17–21.
Figure 18. Actual printouts before and after compensation.Significant banding reduction can be seen in the bottom com-pensated image.
Figure 17. Reflectance measurement from the printout beforecompensation and after being compensated using the proposedtwo-level control.
4. H. Kawamoto, Chatter vibration of a cleaner blade in electrophotog-raphy, J. Imaging Sci. Technol. 40, 8 (1996).
5. H. Kawamoto, K. Udagawa and M. Mori, Vibration and noise inducedby electrostatic force on a contact charger roller of electrophotogra-phy, J. Imaging Sci. Technol. 39, 477 (1995).
6. P.D. Burns, M. Rabbani and L.A. Ray, Analysis of image noise dueto position errors in laser writers, Applied Optics 25, 2158 (1986).
7. P. Melnychuck and R. Shaw, Fourier spectra of digital halftone im-ages containing dot position errors, J. Opt. Soc. Amer. 5, 1328(1988).
8. D. D. Haas, Contrast modulation in halftone images produced byvariation in scan-line spacing, J. Imaging Technol. 15, 46 (1989).
9. R. P. Loce, W. L. Lama and M. S. Maltz, Modeling vibration-inducedhalftone banding in a xerographic laser printer, J. Electronic Imag-ing 4, 48 (1995).
10. R. Loce and W. Lama, Halftone banding due to vibrations in a xero-graphic image bar printer, J. Imaging Technol. 16, 6 (1990).
11. J. L. Mannos and D. J. Sakrison, The effects of a visual fidelity cri-terion on the encoding of images, IEEE Trans on Information Theory,IT-20, 525 (1974).
12. P. Barten, Evaluation of subjective image quality with the square-root integral method, J. Opt. Soc. Amer. 7, 2024 (1990).
13. Y. Hotta, M. Goto, and T. Miyamoto, Image forming apparatus hav-ing relationship between driving gear pitch and scanning line pitch,US Patent 5,917,529 (1999).
14. P. L. Jeran, Gear train control system for reducing velocity inducedimage defects in printers and copiers, US Patent 5,812,183 (1998).
15. R. J. Lawton and D. R. Marshall, Beam deflecting for resolution en-hancement and banding reduction in a laser printer, US Patent5,920,336 (1999).
16. W. E. Foote and R. G. Sevier, Laser printer with apparatus to re-duce banding by servo adjustment of a scanned laser beam, USPatent 5,760,817 (1998).
17. K. Bannai, Image forming apparatus with anti-banding implementa-tion, US Patent 5,315,322 (1994).
18. M. T.-S. Ewe, J. M. Grice, G. T.-C. Chiu, J. P. Allebach, C.S. Chan,and Wayne Foote, Banding reduction in electrophotographic pro-cess using piezoelectric actuated laser beam deflection device, Proc.

Banding Reduction in Electrophotographic Processes Using Human Contrast ...Velocity Control Vol. 47, No. 3, May/June 2003 223
NIP 16: International Conference on Digital Printing Technologies,IS&T, Springfield, VA, 2000, pp. 276–280.
19. R. P. Loce and W. L. Lama, Printer compensated for vibration-gen-erated scan line errors, US Patent 4,884,083 (1989).
20. D. W. Costanza, R. E. Jodoin, and R. P. Loce, Method and appara-tus for compensating for raster position errors in output scanners,US Patent 5,900,901 (1999).
21. R. D. Morrison, System and method for modifying an output imagesignal to compensate for drum velocity variations in a laser printer,US Patent 5,729,277 (1998).
22. W. L. Lama, R. P. Loce, and J. A. Durbin, Image bar printer compen-sated for vibration-generated scan line errors, US Patent 4,801,978(1989).
23. G.-Y. Lin, J. M. Grice, J. P. Allebach, G. T.-C. Chiu, W. Bradburn,and J. Weaver, Banding artifact reduction in electrophotographicprinters by using pulse width modulation, Proc. NIP 16: 2000 Inter-national Conference on Digital Printing Technologies, IS&T, Spring-field, VA, 2000, pp. 281–286.
24. C.-H. Li and J. Shu, Banding noise reduction for clustered-dot dither,
US Patent 5,875,287 (1999).25. J. Marsden, Reduction of banding in printed images, US Patent
6,025,922 (2000).26. S. Hara, Y. Yamamoto, T. Omata, and M. Nakano, Repetitive control
system: A new type servo system for periodic exogenous signals,IEEE Trans. Automatic Control 33, 659 (1988).
27. M. Tomizuka, T. C. Tsao, and K. K. Chew, Analysis and synthesis ofdiscrete time repetitive controllers, ASME J. Dynamic Systems, Mea-surements and Control 111, 353 (1989).
28. L. B. Schein, Electrophography and Development Physics, LaplacianPress, Morgan Hill, California, USA, 1996.
29. D. Kacker, T. Camis, and J. P. Allebach, Electrophotographic pro-cess embedded in direct binary search, Proc. SPIE, 3963, 468,(2000).
30. K. Glover and D. Mcfarlane, Robust stabilization of normalizedcoprime factor plant descriptions with H•-bounded uncertainty, IEEETrans. Automatic Control 34, 821 (1989).
31. J. D. Smith, Gear Noise and Vibration, Marcel Dekker, New York,New York, 1999.
Related Documents