Band Residual Difference Band Residual Difference algorithm for retrieval of SO algorithm for retrieval of SO 2 2 from the AURA OMI from the AURA OMI N. Krotkov 1 , S. Carn 2 , A. Krueger 2 , P. K. Bhartia 3 , K. Yang 3 1. Goddard Earth Sciences and Technology (GEST) Center, UMBC, Baltimore, MD 2. Joint Center for Earth Systems Technology (NASA/UMBC), UMBC 3. Laboratory for Atmospheres, NASA Goddard Space Flight Center, Greenbelt, MD With thanks to all the OMI Science and Support Teams

Band Residual Difference algorithm for retrieval of SO 2 from the AURA OMI N. Krotkov 1, S. Carn 2, A. Krueger 2, P. K. Bhartia 3, K. Yang 3 1.Goddard.
Dec 31, 2015
Welcome message from author
This document is posted to help you gain knowledge. Please leave a comment to let me know what you think about it! Share it to your friends and learn new things together.
Transcript

Band Residual Difference algorithm for Band Residual Difference algorithm for retrieval of SOretrieval of SO22 from the AURA OMI from the AURA OMI
N. Krotkov1, S. Carn2, A. Krueger2 , P. K. Bhartia3 , K. Yang3
1. Goddard Earth Sciences and Technology (GEST) Center, UMBC, Baltimore, MD
2. Joint Center for Earth Systems Technology (NASA/UMBC), UMBC
3. Laboratory for Atmospheres, NASA Goddard Space Flight Center, Greenbelt, MD
With thanks to all the OMI Science and Support Teams
Global Sulfur Sources
Northern Hemisphere
Southern Hemisphere
Global
Marine and Terrestrial DMS 7.5 11.0 18.5
Volcanic SO2 10.0 4.0 14.0
Explosive degassing 0.5-4
Passive degassing 5-10
Biomass Burning 1.0 1.5 2.5
Fossil Fuel Use and Industry 60.5 6.3 66.8
TOTAL (S, Tg) 79.0 22.8 101.8
[Bluth et al., 1993; Pyle et al., 1996; Graf et al., 1997; Andres & Kasgnoc, 1998]
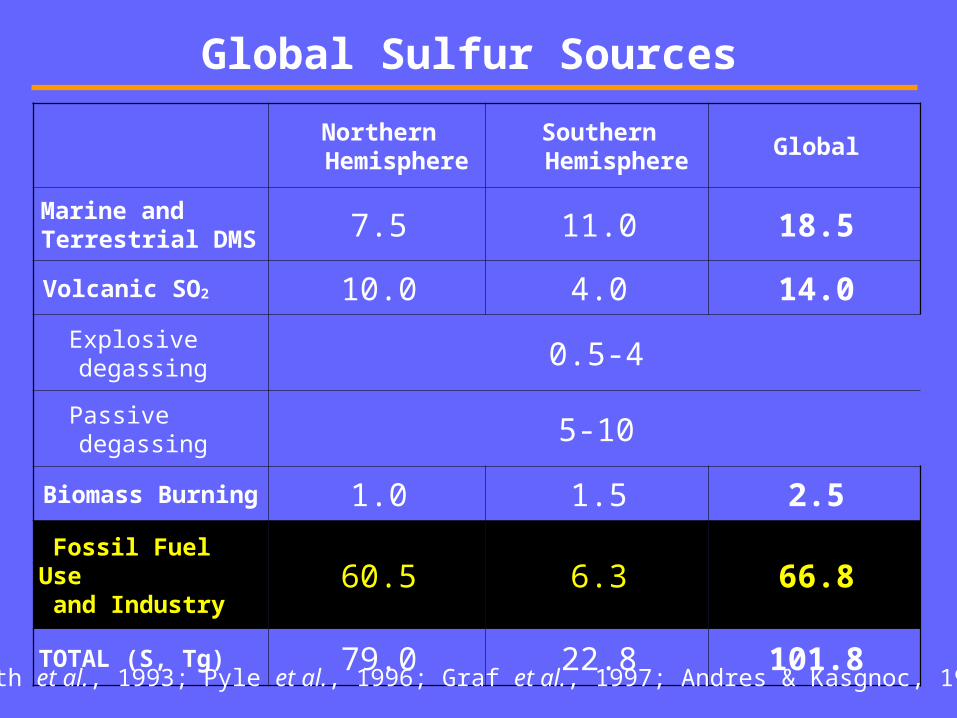
Ozone Monitoring Instrument (OMI )
July 15 2004July 15 2004
The NASA EOS Aura platform, launched on July 15, 2004, carries the Ozone Monitoring Instrument (OMI), a hyperspectral UV/Visible spectrometer with a 2600 km swath for daily, global contiguous mapping that was provided by the Netherlands's Agency for Aerospace Programs (NIVR) in collaboration with the KNMI and Finnish Meteorological Institute (FMI) to the EOS Aura mission for continued monitoring of ozone and other trace gases.

OMI SO2 algorithm
An OMI SO2 Band Residual Difference ( BRD) algorithm uses calibrated residuals at SO2 absorption band centers produced by the NASA operational ozone algorithm (OMTO3)
[Bhartia et al 2002]

OMI SO2 provisional products released for validation in July 2005:
1. Explosive Eruptions: 15km
2. Passive degassing: 5km
3. Anthropogenic SO2 pollution : PBL (<700mb)
Validation scientists are welcome to collaborate

TOMS climatic SO2 record from Explosive eruptions
The AURA OMI SO2 volcanic data set will continue the TOMS
SO2 record, which covers a quarter-century: http://toms.umbc.edu

Anatahan eruption plumes
OMI SO2 image of
the Anatahan (Mariana Islands) eruption cloud on April 7, 2005, produced by an explosive eruption on April 6.
White regions are meteorological clouds.

Anatahan plume in July 2005, including the passage of some typhoons.

Anatahan
Manam
MODIS and AIRS are part of NASA A-train satellite constellation in sun-synchronous afternoon orbit
OMI-SO2 (color bar) superimposed over high-resolution true-color composite map from AQUA-MODIS
CALLIPSO (LIDAR) and CloudSat on A-train will soon provide vertical profiling of volcanic clouds
Soputan
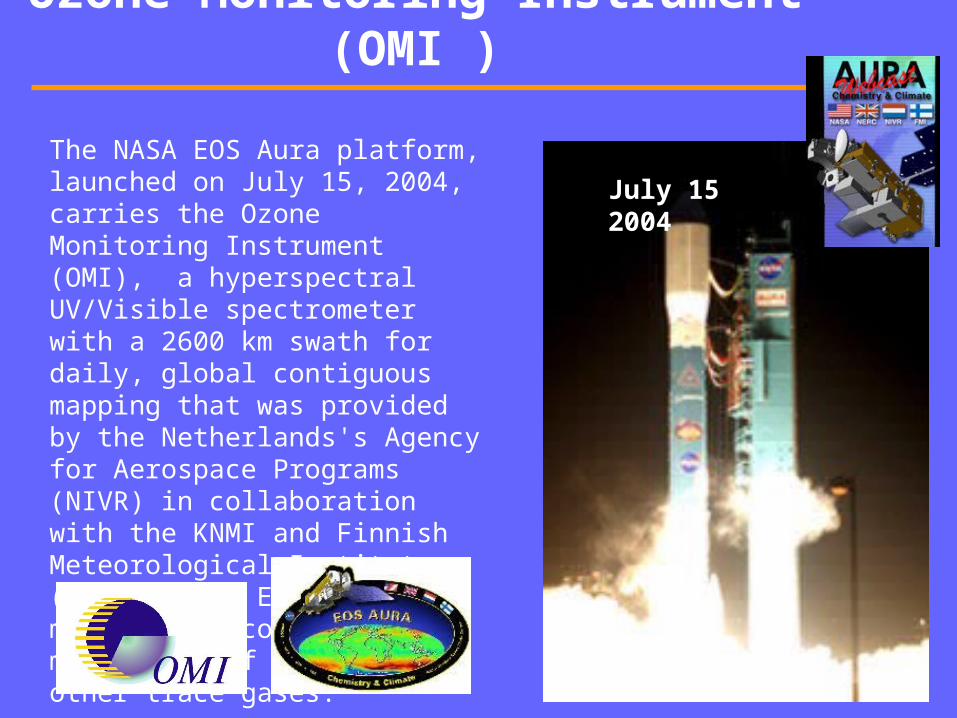
OMI has permitted the first routine, space-based
measurements of passive volcanic SO2 degassing
OMI SO2 image of passive degassing from Ambrym volcano, Vanuatu (16.25ºS, 168.12ºE) on February 20, 2005.

SO2 emissions from lignite-burning power plants in the Balkan region
SO2 enhancements observed by
GOME in February 1998 [Eisinger and Burrows, GRL 1998]. SO2 enhancements detected
by OMI in February 2005

SO2 burdens over China
• 70% of China’s energy is derived from coal burning
• SO2 emissions increased at a rate 35%/decade in 1979-2000
• China’s sulfate aerosol loading has increased by 17%/decade in 1979-2000 [Massie, Torres and Smith 2004]
• 65,000 SO2 tons/day emitted in 1995 [Streets & Waldhof, 2000]

Anthropogenic SO2 burdens in Asia
• Norislk Nickel is one of Russia’s heaviest industrial polluters
• World’s biggest producer of nickel and palladium
• Plans to reduce SO2 emissions by 80-90% by 2015

Persian Gulf region
• SO2 emissions associated with oil and gas refining in the Persian Gulf (Kuwait, Saudi Arabia, Iran, UAE)
• Outgassing flares from oil fields in the Gulf produce detectable SO2

Major SO2 sources in Africa:
GOME observation of the time evolution of the SO2 plume over Nyamuragira volcano during its December 1996 eruption.
OMI: South African power plants (e.g., near Johannesburg); copper smelting
Nyiragongo(DR Congo)
•More than 90% of South Africa's electricity is generated by the combustion of coal
• Coal-fired power plants not required to use scrubbers to remove sulfur from emissions

South East Asia
Anatahan (Mariana Is)
Ambrym (Vanuatu)
Manam (PNG)

Conclusions
• The OMI SO2 data set will continue the TOMS record but the improved sensitivity and smaller footprint of OMI will extend the range of detection to smaller eruptions and older clouds, and to degassing volcanoes.
• Anthropogenic SO2 emissions measured over China, Peru, USA (Ohio Valley), Europe, Central America, Uzbekistan.
(Sources generally in agreement with 1985 GEIA database )
• Algorithm improvements are needed (realistic a-priori vertical SO2 and temperature profiles, bias, noise) before public release of anthropogenic SO2 data
• Validation collaborations are welcome

backup

Comparisons with GOCART model
GOCART model monthly average SO2
OMI cumulative SO2
( December 2001) ( December 2004 )

Manam volcano eruption: January 27-28 2005TOMS SO2
OMI SO2
AIRS SO2
http://earthobservatory.nasa.gov/Newsroom/NewImages/images.php3?img_id=16820

Sierra Negra eruption on October 23-25, 2005

Africa
Nyiragongo(DR Congo)
• Major SO2 sources in Africa: Nyiragongo volcano (DR Congo); South African power plants (e.g., near Johannesburg); copper smelting
• More than 90% of South Africa's electricity is generated by the combustion of coal
• Coal-fired power plants not required to use scrubbers to remove sulfur from emissions
Related Documents