Banca IMI Investment Seminar Banca IMI Investment Seminar Milan, 8 March 2001 Milan, 8 March 2001 2000-2001 Exceeding our 2000-2001 Exceeding our targets targets

Banca IMI Investment Seminar Milan, 8 March 2001 2000-2001 Exceeding our targets.
Dec 27, 2015
Welcome message from author
This document is posted to help you gain knowledge. Please leave a comment to let me know what you think about it! Share it to your friends and learn new things together.
Transcript

Banca IMI Investment SeminarBanca IMI Investment SeminarMilan, 8 March 2001Milan, 8 March 2001
2000-2001 Exceeding our targets2000-2001 Exceeding our targets

Banca IMI Investment Seminar - Milan, 8 Banca IMI Investment Seminar - Milan, 8 March 2001March 2001
• Giovanni RecordatiGiovanni Recordati Chairman and Chief Executive Chairman and Chief Executive OfficerOfficer
• Fritz SquindoFritz Squindo Chief Financial OfficerChief Financial Officer
• Walter BevilacquaWalter Bevilacqua Vice President Corporate Vice President Corporate DevelopmentDevelopment
22
Giovanni RecordatiGiovanni RecordatiChairman and Chief Executive OfficerChairman and Chief Executive Officer
33
44
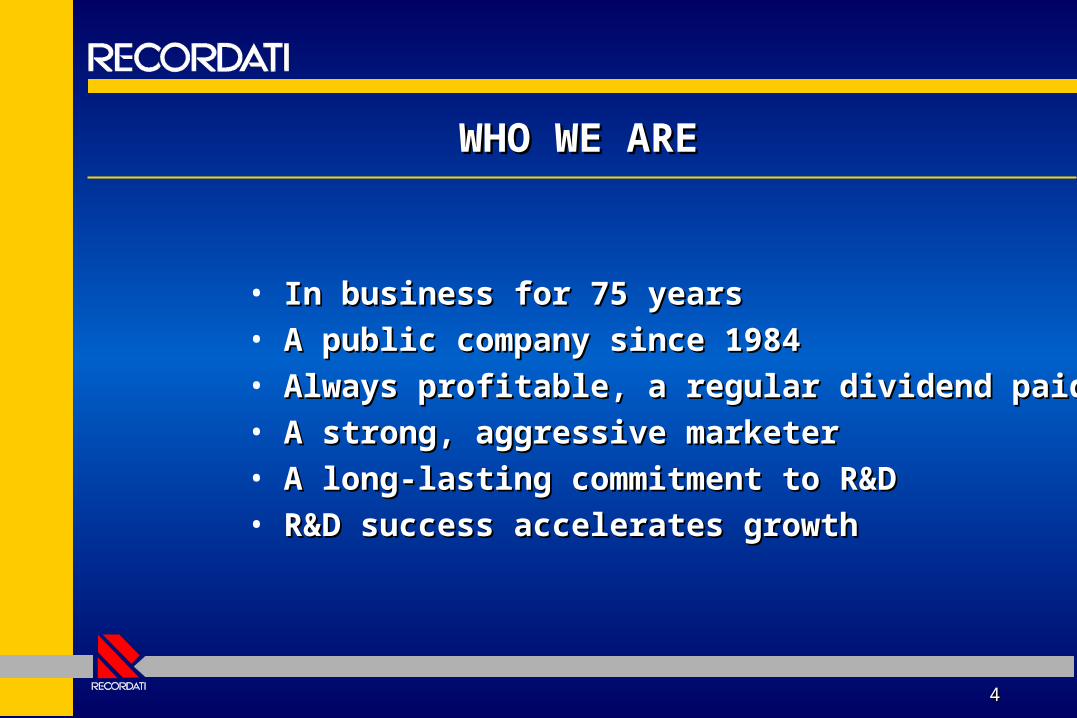
WHO WE AREWHO WE ARE
• In business for 75 yearsIn business for 75 years• A public company since 1984A public company since 1984• Always profitable, a regular dividend paidAlways profitable, a regular dividend paid• A strong, aggressive marketerA strong, aggressive marketer• A long-lasting commitment to R&DA long-lasting commitment to R&D• R&D success accelerates growthR&D success accelerates growth
55
KEY EVENTS IN 2000KEY EVENTS IN 2000
• Strong improvement in businessStrong improvement in business• Expansion in France completed successfullyExpansion in France completed successfully• ZanidipZanidip®® license for the USA license for the USA• Pharmacia agreement: a strong basis for Pharmacia agreement: a strong basis for
further growthfurther growth
Fritz SquindoFritz SquindoChief Financial OfficerChief Financial Officer
66

• YEAR 2000 RESULTSYEAR 2000 RESULTS• QUARTERLY SALES AND EBITQUARTERLY SALES AND EBIT• COMPOSITION OF SALESCOMPOSITION OF SALES• YEAR 2000 GROWTHYEAR 2000 GROWTH• EBITDA BY BUSINESS AREAEBITDA BY BUSINESS AREA• CAPITAL EMPLOYEDCAPITAL EMPLOYED
77

88
526.3526.3
281.7281.753.5%53.5%
37.237.27.1%7.1%
38.638.67.3%7.3%
23.223.24.4%4.4%
72.272.213.7%13.7%
19991999
58.758.711.2%11.2%
689.1689.1
399.5399.558.0%58.0%
90.390.313.1%13.1%
79.879.811.6%11.6%
53.153.17.7%7.7%
136.7136.719.8%19.8%
20002000
71.471.410.4%10.4%
30.9%30.9%
41.8%41.8%
142.5%142.5%
107.1%107.1%
128.9%128.9%
89.3%89.3%
Change Change %%
21.6%21.6%
YEAR 2000 RESULTSYEAR 2000 RESULTS
Net SalesNet Sales
Gross ProfitGross Profitas % of salesas % of sales
Operating Income Operating Income as % of salesas % of sales
Pretax IncomePretax Incomeas % of salesas % of sales
Net IncomeNet Incomeas % of salesas % of sales
EBITDAEBITDAas % of salesas % of sales
(billion lira)(billion lira)
R&D ExpensesR&D Expensesas % of salesas % of sales
99
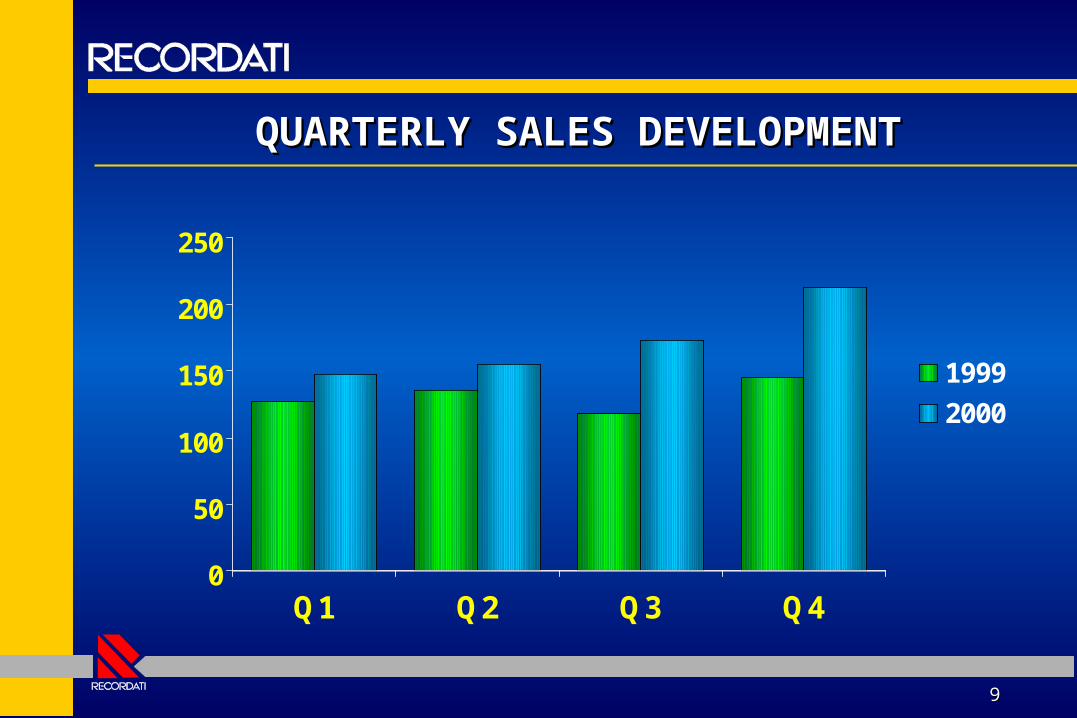
QUARTERLY SALES DEVELOPMENTQUARTERLY SALES DEVELOPMENT
0
50
100
150
200
250
Q1 Q2 Q3 Q4
1999
2000
1010
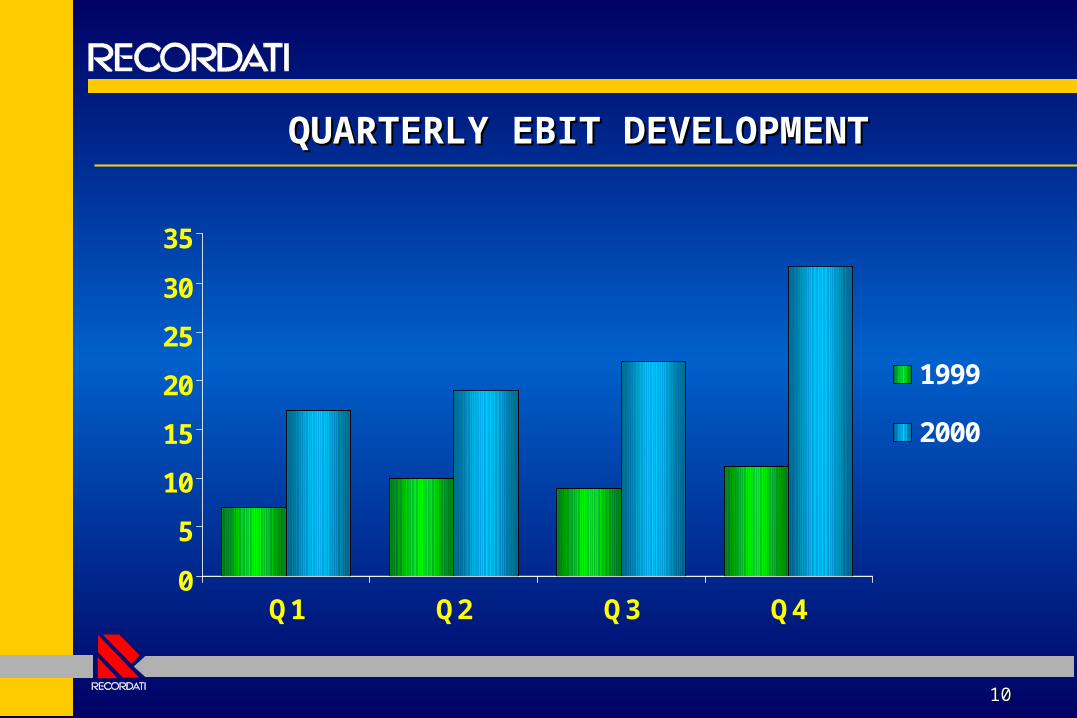
QUARTERLY EBIT DEVELOPMENTQUARTERLY EBIT DEVELOPMENT
0
5
10
15
20
25
30
35
Q1 Q2 Q3 Q4
1999
2000
1111
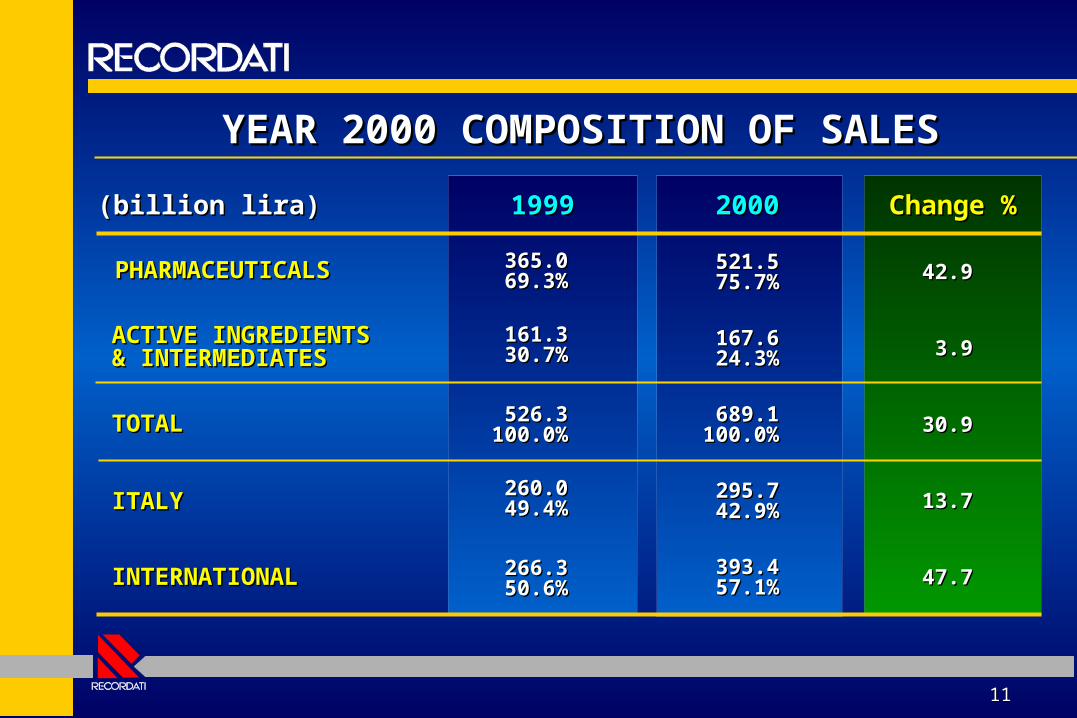
20002000
393.4393.457.1%57.1%
19991999 Change Change %%
YEAR 2000 COMPOSITION OF SALESYEAR 2000 COMPOSITION OF SALES
(billion lira)(billion lira)
PHARMACEUTICALPHARMACEUTICALSS
365.0365.069.3%69.3%
47.747.7
ACTIVE ACTIVE INGREDIENTS & INGREDIENTS & INTERMEDIATESINTERMEDIATES
TOTATOTALL
ITALYITALY
INTERNATIONAINTERNATIONALL
161.3161.330.7%30.7%
526.3526.3100.0%100.0%
260.0260.049.4%49.4%
266.3266.350.6%50.6%
521.5521.575.7%75.7%
167.6167.624.3%24.3%
689.1689.1100.0%100.0%
295.7295.742.9%42.9%
42.942.9
3.93.9
30.930.9
13.713.7
1212
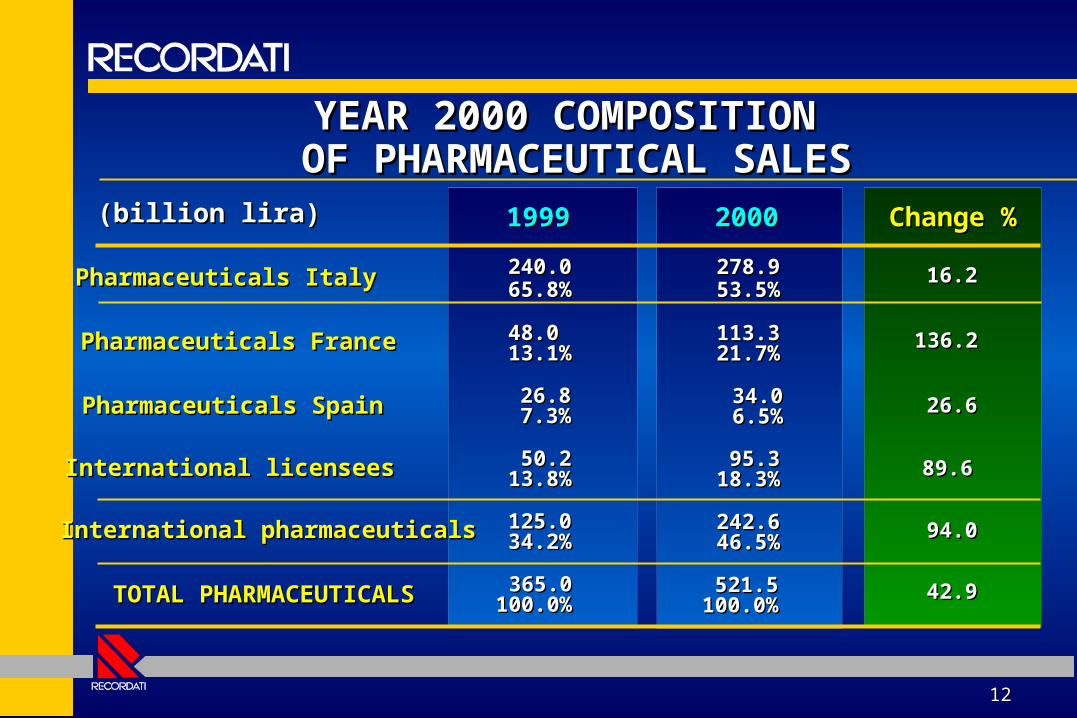
2000200019991999 Change Change %%
278.9278.953.5%53.5%
113.3113.321.7%21.7%
95.395.318.3%18.3%
242.6242.646.5%46.5%
521.5521.5100.0100.0
%%
34.034.0 6.5%6.5%
240.0240.065.8%65.8%
48.0 48.0 13.1%13.1%
50.250.213.8%13.8%
125.0125.034.2%34.2%
365.0365.0100.0%100.0%
26.826.87.3%7.3%
16.216.2
136.2136.2
89.689.6
94.094.0
42.942.9
26.626.6
YEAR 2000 COMPOSITION YEAR 2000 COMPOSITION OF PHARMACEUTICAL SALESOF PHARMACEUTICAL SALES
Pharmaceuticals ItalyPharmaceuticals Italy
Pharmaceuticals FrancePharmaceuticals France
International licenseesInternational licensees
International pharmaceuticalsInternational pharmaceuticals
TOTAL PHARMACEUTICALSTOTAL PHARMACEUTICALS
Pharmaceuticals SpainPharmaceuticals Spain
(billion lira)(billion lira)
1313
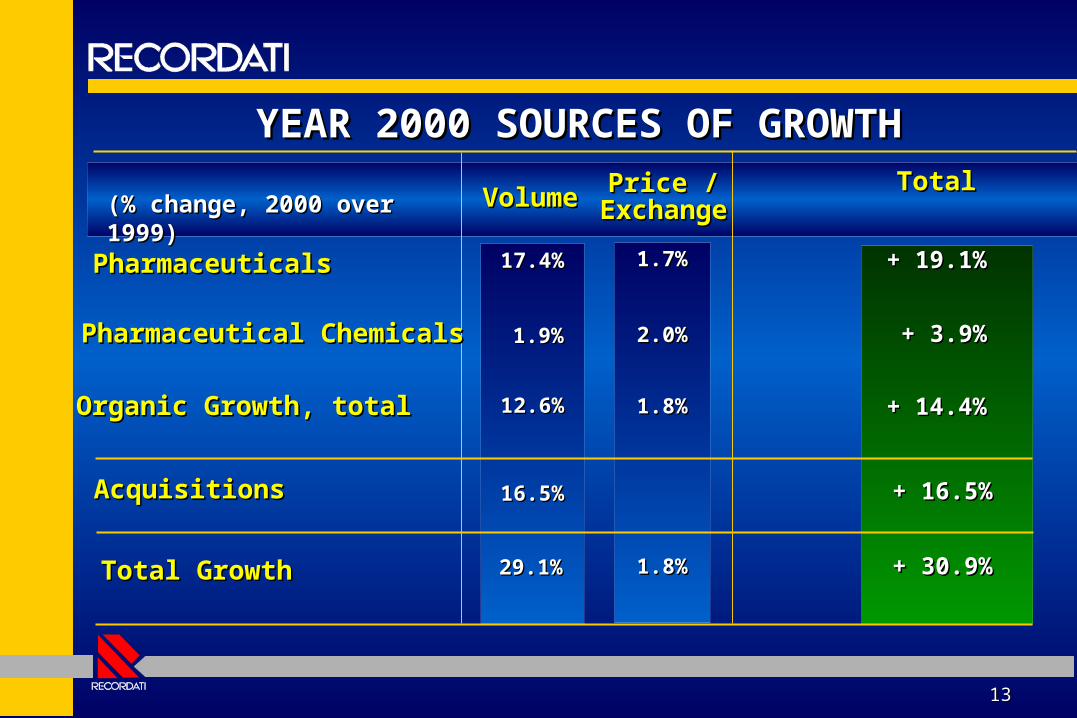
17.4%17.4%
29.1%29.1%
YEAR 2000 SOURCES OF GROWTHYEAR 2000 SOURCES OF GROWTH
PharmaceuticalsPharmaceuticals
Total GrowthTotal Growth
1.7%1.7%
1.8%1.8%
TotalTotal
+ 30.9%+ 30.9%
+ + 14.4%14.4%
(% change, 2000 over (% change, 2000 over 1999)1999)
Price /Price /ExchangExchang
ee
16.5%16.5% + 16.5%+ 16.5%
Pharmaceutical ChemicalsPharmaceutical Chemicals
Organic Growth, totalOrganic Growth, total
1.9%1.9% 2.0%2.0%
12.6%12.6% 1.8%1.8%
AcquisitionsAcquisitions
+ 19.1%+ 19.1%
+ 3.9%+ 3.9%
VolumVolumee
1414
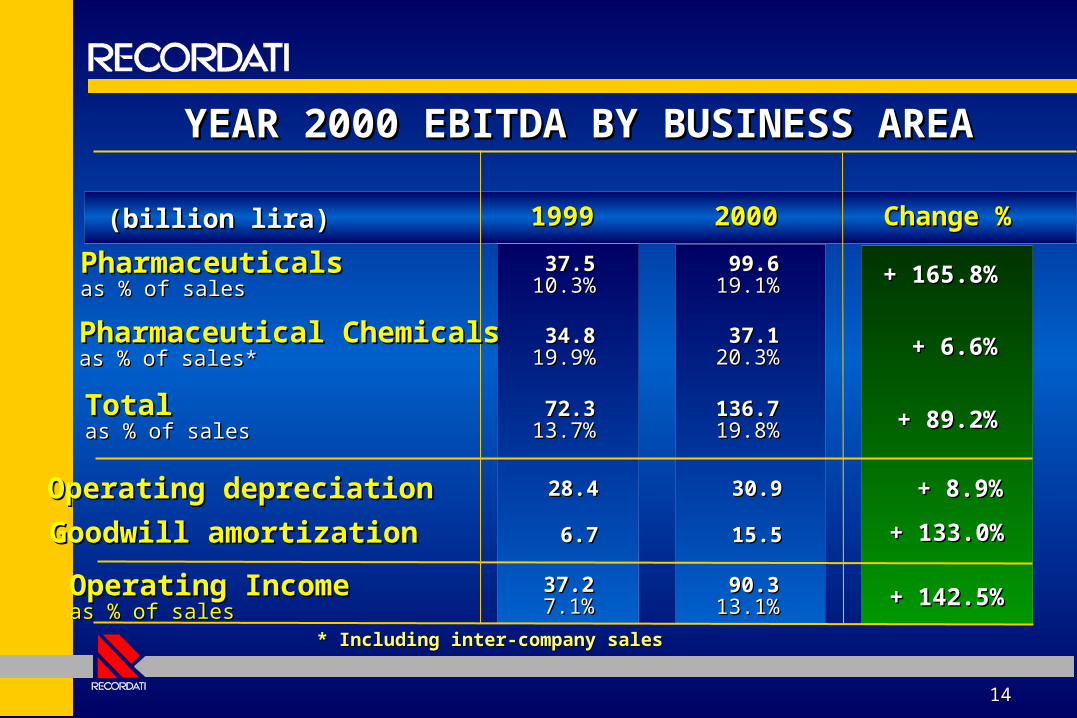
37.537.510.3%10.3%
37.237.2 7.1%7.1%
YEAR 2000 EBITDA BY BUSINESS AREAYEAR 2000 EBITDA BY BUSINESS AREA
PharmaceuticalsPharmaceuticalsas % of salesas % of sales
Operating IncomeOperating Incomeas % of salesas % of sales
99.699.619.1%19.1%
90.390.313.1%13.1%
Change %Change %
+ 142.5%+ 142.5%
+ + 89.2%89.2%
(billion lira)(billion lira)
* Including inter-company sales* Including inter-company sales
20002000
28.428.4 30.930.9 + 8.9%+ 8.9%
Pharmaceutical ChemicalsPharmaceutical Chemicalsas % of sales*as % of sales*
TotalTotalas % of salesas % of sales
34.834.819.9%19.9%
37.137.120.3%20.3%
72.372.313.7%13.7%
136.7136.719.8%19.8%
Operating depreciationOperating depreciation
Goodwill amortizationGoodwill amortization 15.515.56.76.7
+ + 165.8%165.8%
+ 6.6%+ 6.6%
+ 133.0%+ 133.0%
19991999
1515
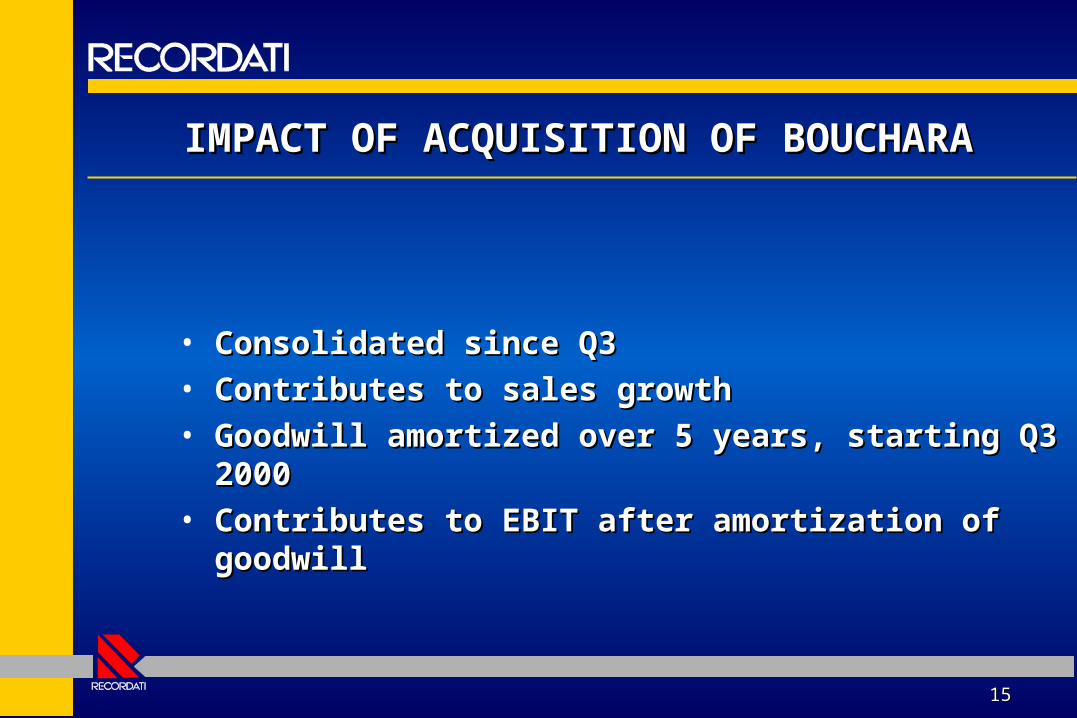
IMPACT OF ACQUISITION OF BOUCHARAIMPACT OF ACQUISITION OF BOUCHARA
• Consolidated since Q3Consolidated since Q3• Contributes to sales growthContributes to sales growth• Goodwill amortized over 5 years, starting Q3 Goodwill amortized over 5 years, starting Q3
20002000• Contributes to EBIT after amortization of Contributes to EBIT after amortization of
goodwillgoodwill
1616
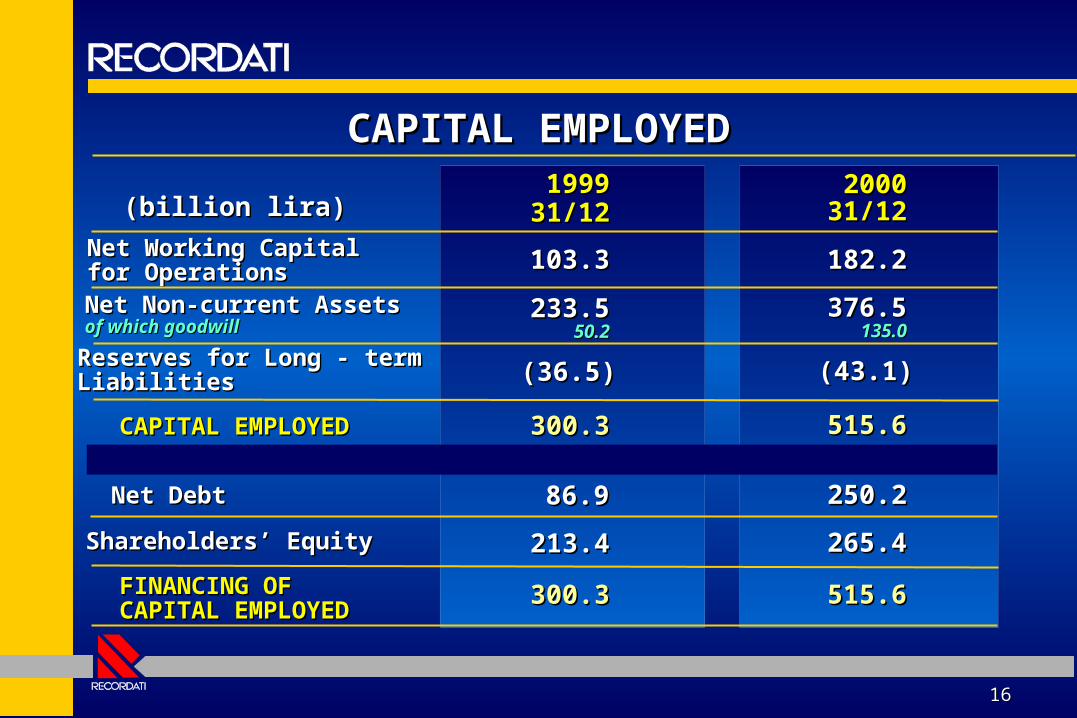
1999199931/1231/12
103.3103.3
233.5233.550.250.2
(36.5)(36.5)
300.3300.3
86.986.9
213.4213.4
300.3300.3
CAPITAL EMPLOYEDCAPITAL EMPLOYED
Net Working Capital Net Working Capital for Operationsfor OperationsNet Non-current AssetsNet Non-current Assetsof which goodwillof which goodwill
Reserves for Long - termReserves for Long - termLiabilitiesLiabilities
FINANCING OF FINANCING OF CAPITAL EMPLOYEDCAPITAL EMPLOYED
Net DebtNet Debt
Shareholders’ EquityShareholders’ Equity
CAPITAL EMPLOYEDCAPITAL EMPLOYED
(billion lira)(billion lira)
182.2182.2
376.5376.5135.0135.0
(43.1)(43.1)
515.6515.6
250.2250.2
265.4265.4
515.6515.6
2000200031/1231/12
Walter BevilacquaWalter BevilacquaVice President Corporate DevelopmentVice President Corporate Development
1717

ZANIDIPZANIDIP®® WORLDWIDE WORLDWIDESITUATION AND OUTLOOKSITUATION AND OUTLOOK
1818

1919
ZANIDIPZANIDIP®® (LERCANIDIPINE) (LERCANIDIPINE)A COMPARATIVE PRODUCT PROFILEA COMPARATIVE PRODUCT PROFILE
• Latest generation calcium-channel blockerLatest generation calcium-channel blocker
• Natural once a day Natural once a day
• Efficacy comparable to best competitorsEfficacy comparable to best competitors
• Excellent / superior tolerability and safety Excellent / superior tolerability and safety
profileprofile
2020
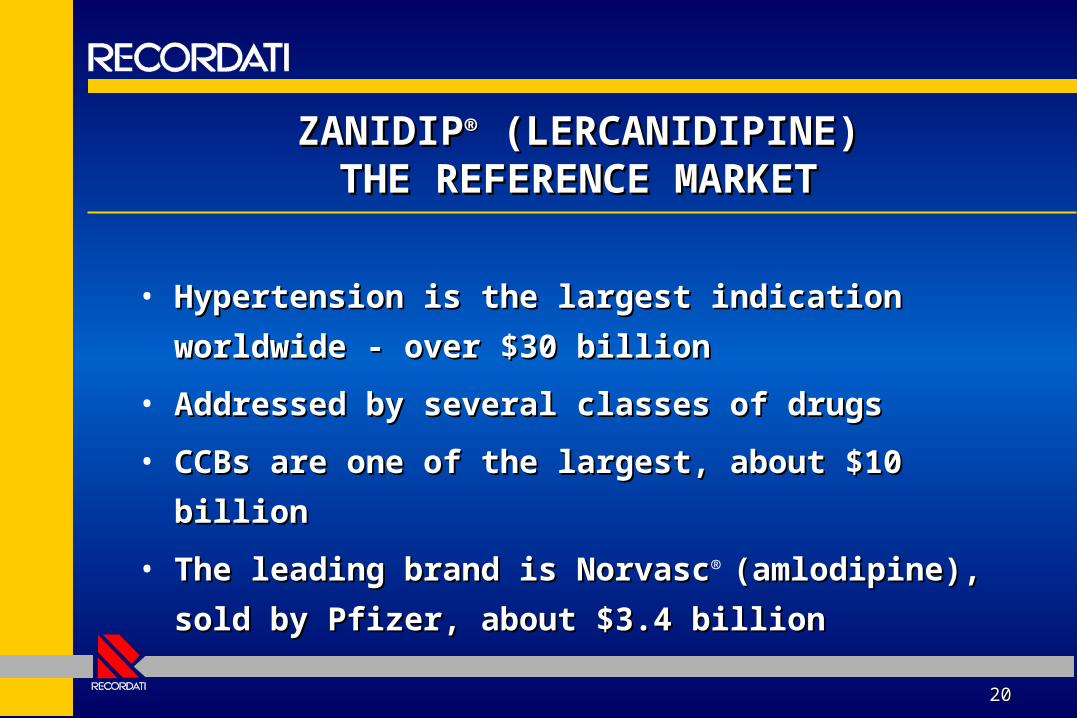
ZANIDIPZANIDIP®® (LERCANIDIPINE) (LERCANIDIPINE)THE REFERENCE MARKETTHE REFERENCE MARKET
• Hypertension is the largest indication Hypertension is the largest indication
worldwide - over $30 billionworldwide - over $30 billion
• Addressed by several classes of drugsAddressed by several classes of drugs
• CCBs are one of the largest, about $10 billionCCBs are one of the largest, about $10 billion
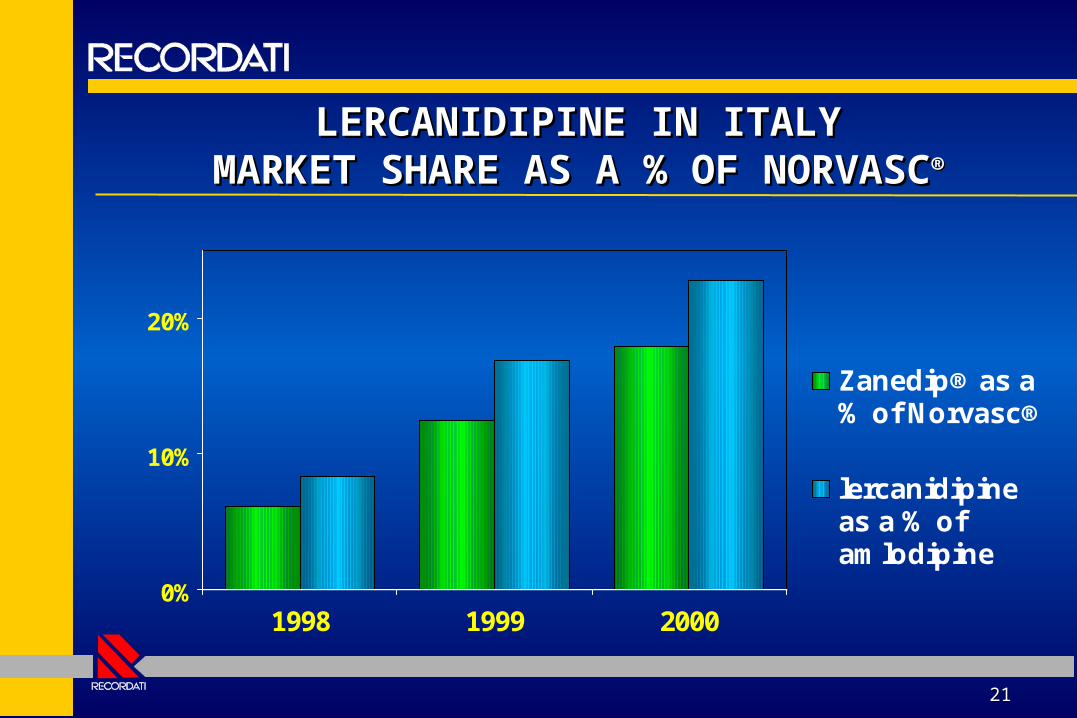
• The leading brand is NorvascThe leading brand is Norvasc® (amlodipine), (amlodipine),
sold by Pfizer, about $3.4 billion sold by Pfizer, about $3.4 billion
2121
LERCANIDIPINE IN ITALYLERCANIDIPINE IN ITALYMARKET SHARE AS A % OF NORVASCMARKET SHARE AS A % OF NORVASC®®
0%
10%
20%
1998 1999 2000
Zanedip® as a% of Norvasc®
lercanidipineas a % ofamlodipine
2222
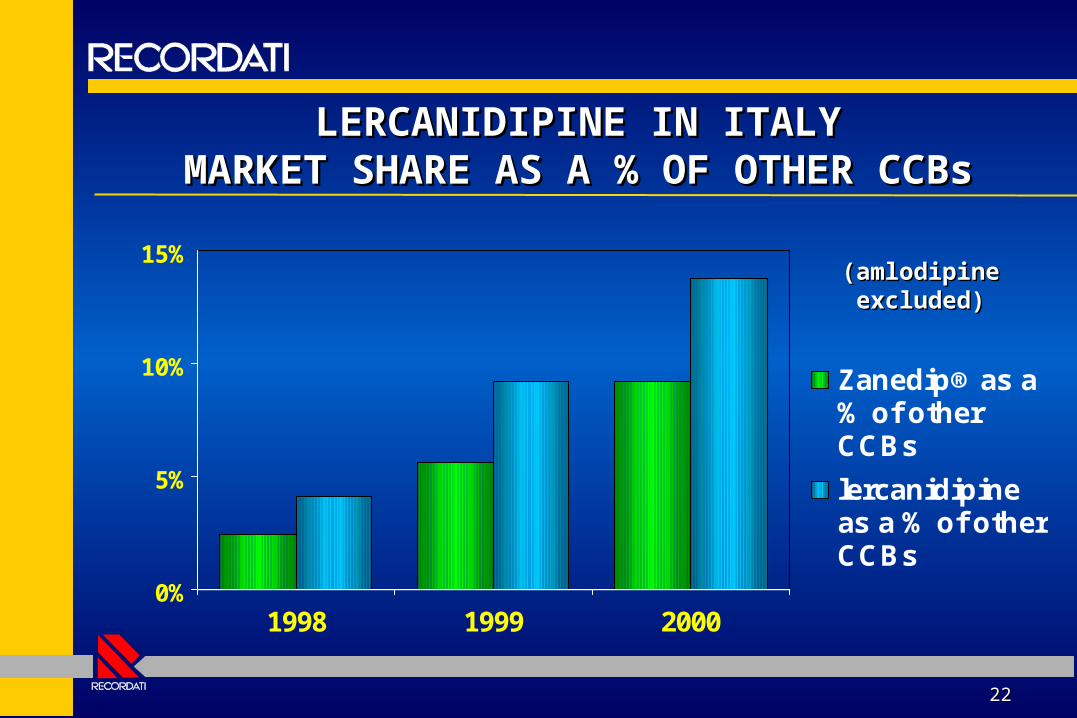
LERCANIDIPINE IN ITALYLERCANIDIPINE IN ITALYMARKET SHARE AS A % OF OTHER CCBsMARKET SHARE AS A % OF OTHER CCBs
0%
5%
10%
15%
1998 1999 2000
Zanedip® as a% of otherCCBs
lercanidipineas a % of otherCCBs
(amlodipine (amlodipine excluded)excluded)
2323
19991999 20002000
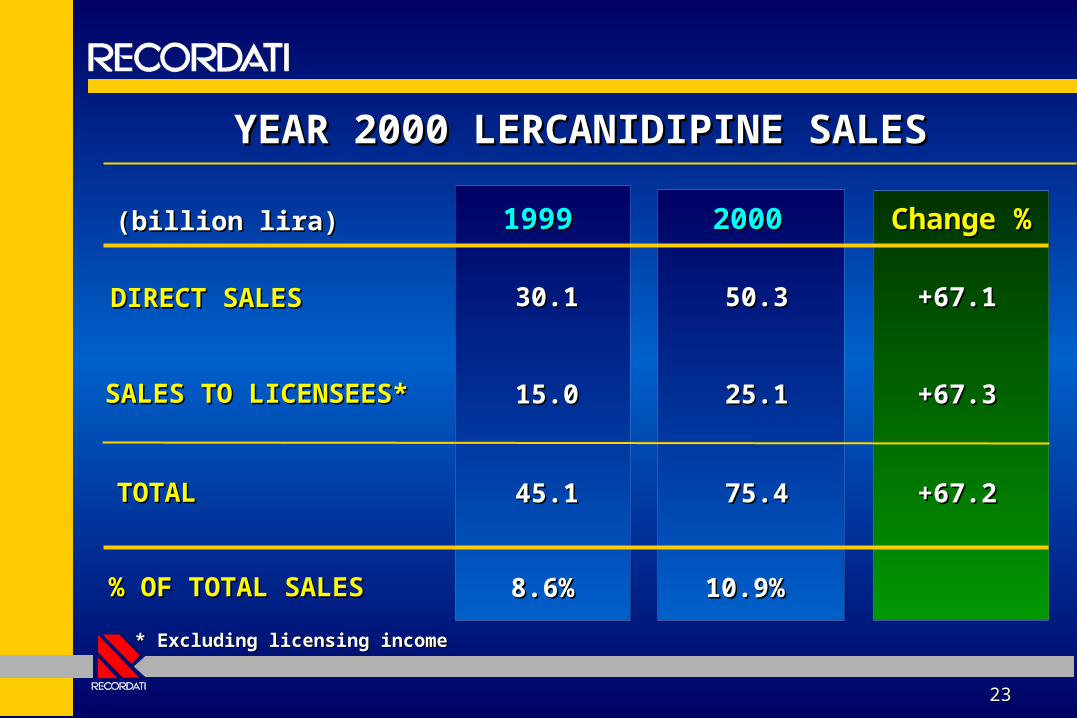
YEAR 2000 LERCANIDIPINE SALESYEAR 2000 LERCANIDIPINE SALES
SALES TO LICENSEES*SALES TO LICENSEES*
(billion lira)(billion lira) Change Change %%
30.130.1 50.350.3
25.125.115.015.0
75.475.4
+67.1+67.1
+67.3+67.3
+67.2+67.245.145.1
10.9%10.9%8.6%8.6%
* Excluding licensing income* Excluding licensing income
DIRECT SALESDIRECT SALES
% OF TOTAL SALES% OF TOTAL SALES
TOTALTOTAL
2424
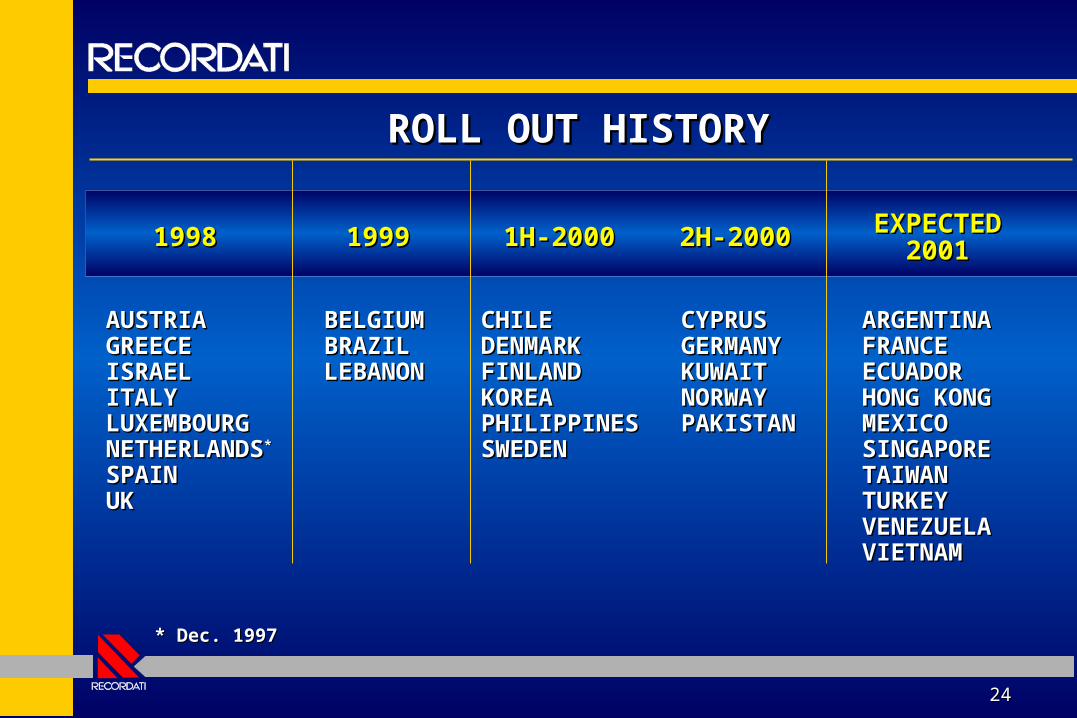
ROLL OUT HISTORYROLL OUT HISTORY
19981998
AUSTRIAAUSTRIAGREECEGREECEISRAELISRAELITALYITALYLUXEMBOURGLUXEMBOURGNETHERLANDSNETHERLANDS**
SPAINSPAINUKUK
19991999
BELGIUMBELGIUMBRAZIL BRAZIL LEBANONLEBANON
1H-20001H-2000
CHILE CHILE DENMARKDENMARKFINLANDFINLANDKOREAKOREAPHILIPPINESPHILIPPINESSWEDENSWEDEN
2H-20002H-2000
CYPRUSCYPRUSGERMANYGERMANYKUWAITKUWAITNORWAYNORWAYPAKISTANPAKISTAN
EXPECTEDEXPECTED20012001
ARGENTINAARGENTINAFRANCEFRANCEECUADORECUADORHONG KONGHONG KONGMEXICOMEXICOSINGAPORESINGAPORETAIWANTAIWANTURKEYTURKEYVENEZUELAVENEZUELAVIETNAMVIETNAM
* Dec. 1997* Dec. 1997
2525
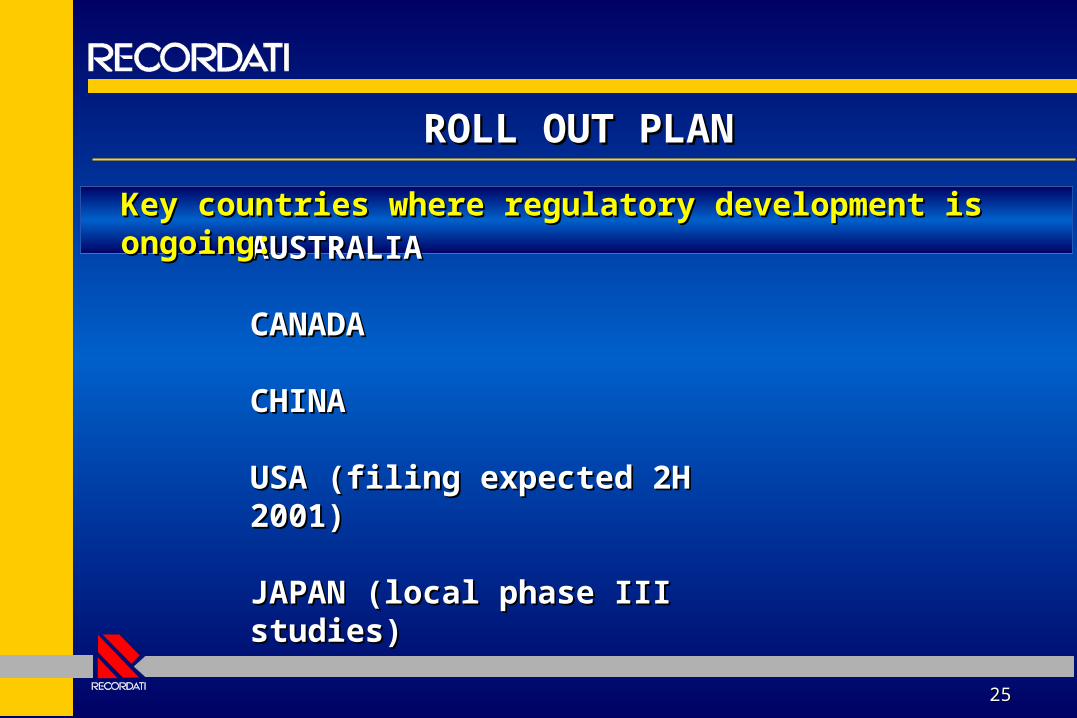
ROLL OUT PLANROLL OUT PLAN
AUSTRALIAAUSTRALIA CANADACANADA
CHINACHINA USA (filing expected 2H USA (filing expected 2H 2001)2001)
JAPAN (local phase III JAPAN (local phase III studies)studies)
Key countries where regulatory development is Key countries where regulatory development is ongoing:ongoing:
2626
LICENSING / ROLL OUT TARGETS LICENSING / ROLL OUT TARGETS
ANNOUNCED FOR 2003ANNOUNCED FOR 2003
TO BE MET IN 2001TO BE MET IN 2001
ROLL OUT PLANROLL OUT PLAN
ZANIDIPZANIDIP®® IN THE USA IN THE USAFOREST LABORATORIES LICENSE AGREEMENTFOREST LABORATORIES LICENSE AGREEMENT
2727
2828
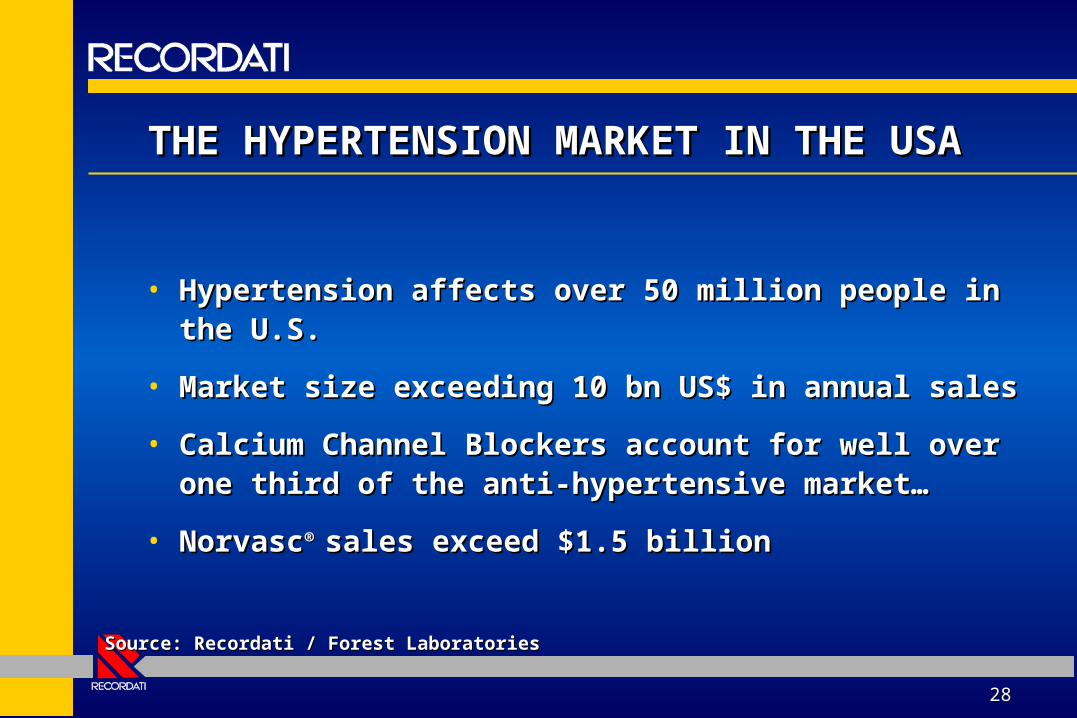
THE HYPERTENSION MARKET IN THE THE HYPERTENSION MARKET IN THE USAUSA
• Hypertension affects over 50 million people in Hypertension affects over 50 million people in the U.S. the U.S.
• Market size exceeding 10 bn US$ in annual salesMarket size exceeding 10 bn US$ in annual sales
• Calcium Channel Blockers account for well over Calcium Channel Blockers account for well over one third of the anti-hypertensive market…one third of the anti-hypertensive market…
• NorvascNorvasc® ® sales exceed $1.5 billionsales exceed $1.5 billion
Source: Recordati / Forest LaboratoriesSource: Recordati / Forest Laboratories
2929
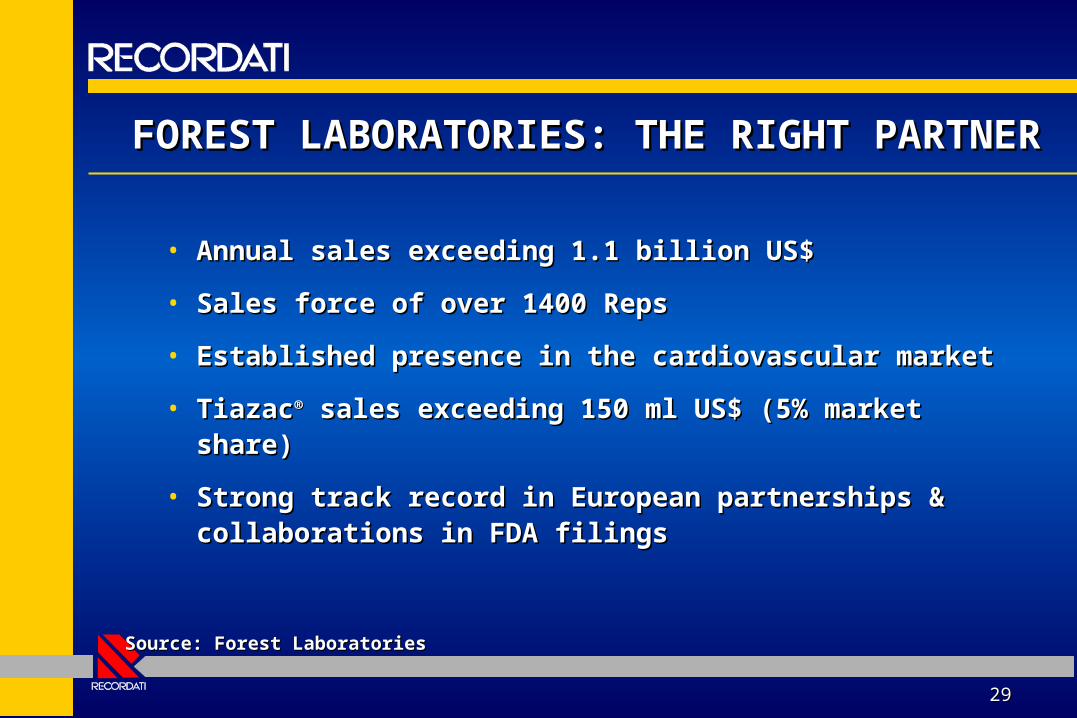
FOREST LABORATORIES: THE RIGHT FOREST LABORATORIES: THE RIGHT PARTNERPARTNER
• Annual sales exceeding 1.1 billion US$Annual sales exceeding 1.1 billion US$
• Sales force of over 1400 RepsSales force of over 1400 Reps
• Established presence in the cardiovascular marketEstablished presence in the cardiovascular market
• TiazacTiazac®® sales exceeding 150 ml US$ (5% market sales exceeding 150 ml US$ (5% market share)share)
• Strong track record in European partnerships & Strong track record in European partnerships & collaborations in FDA filingscollaborations in FDA filings
Source: Forest LaboratoriesSource: Forest Laboratories
3030
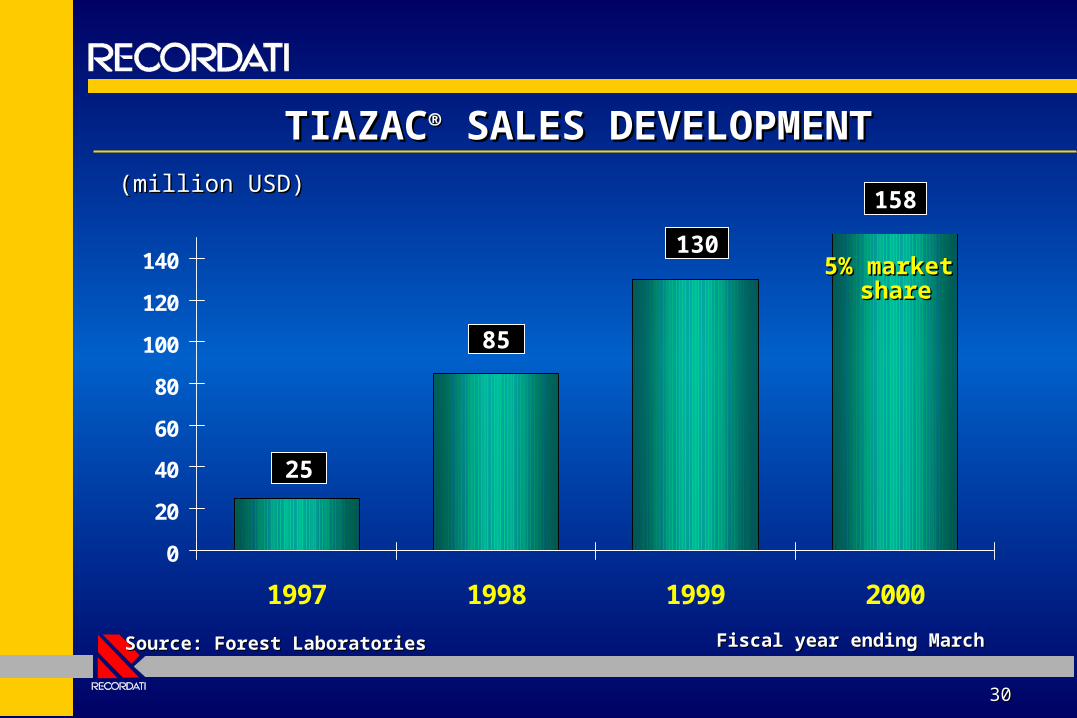
TIAZACTIAZAC®® SALES DEVELOPMENT SALES DEVELOPMENT
0
20
40
60
80
100
120
140
1997 1998 1999 2000
(million USD)(million USD)
25
85
130
158
5% market 5% market shareshare
Source: Forest LaboratoriesSource: Forest Laboratories Fiscal year ending MarchFiscal year ending March
3131
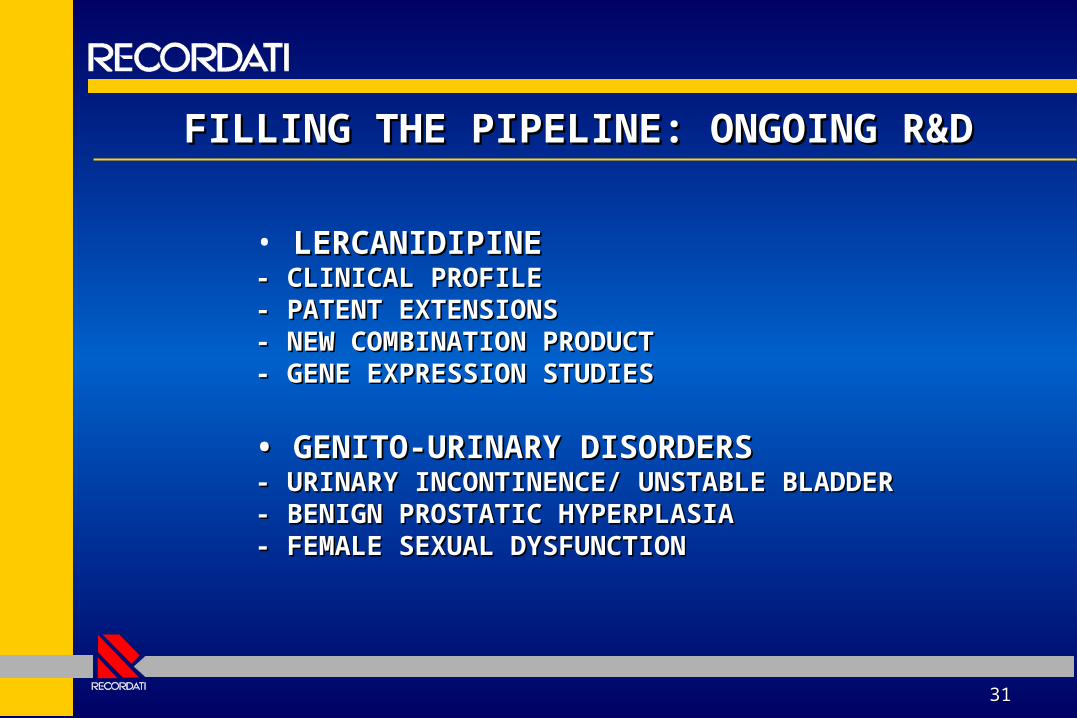
FILLING THE PIPELINE: ONGOING R&DFILLING THE PIPELINE: ONGOING R&D
• LERCANIDIPINELERCANIDIPINE- CLINICAL PROFILE- CLINICAL PROFILE- PATENT EXTENSIONS- PATENT EXTENSIONS- NEW COMBINATION PRODUCT- NEW COMBINATION PRODUCT- GENE EXPRESSION STUDIES- GENE EXPRESSION STUDIES
• GENITO-URINARY DISORDERS • GENITO-URINARY DISORDERS - URINARY INCONTINENCE/ UNSTABLE - URINARY INCONTINENCE/ UNSTABLE BLADDERBLADDER- BENIGN PROSTATIC HYPERPLASIA- BENIGN PROSTATIC HYPERPLASIA- FEMALE SEXUAL DYSFUNCTION- FEMALE SEXUAL DYSFUNCTION
3232
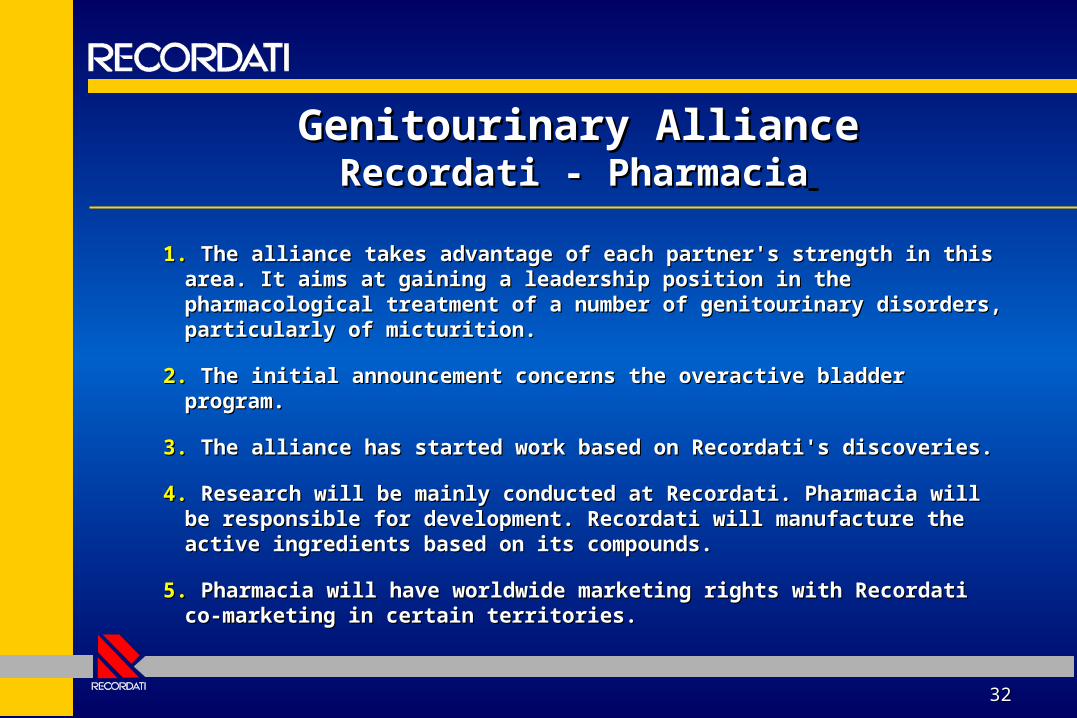
Genitourinary AllianceGenitourinary AllianceRecordati - PharmaciaRecordati - Pharmacia
1.1. The alliance takes advantage of each partner's strength in this The alliance takes advantage of each partner's strength in this area. It aims at gaining a leadership position in the area. It aims at gaining a leadership position in the pharmacological treatment of a number of genitourinary disorders, pharmacological treatment of a number of genitourinary disorders, particularly of micturition.particularly of micturition.
2.2. The initial announcement concerns the overactive bladder The initial announcement concerns the overactive bladder program.program.
3.3. The alliance has started work based on Recordati's discoveries. The alliance has started work based on Recordati's discoveries.
4.4. Research will be mainly conducted at Recordati. Pharmacia will be Research will be mainly conducted at Recordati. Pharmacia will be responsible for development. Recordati will manufacture the active responsible for development. Recordati will manufacture the active ingredients based on its compounds.ingredients based on its compounds.
5.5. Pharmacia will have worldwide marketing rights with Recordati co- Pharmacia will have worldwide marketing rights with Recordati co-marketing in certain territories.marketing in certain territories.

Giovanni RecordatiGiovanni RecordatiChairman and Chief Executive OfficerChairman and Chief Executive Officer
3333
3434
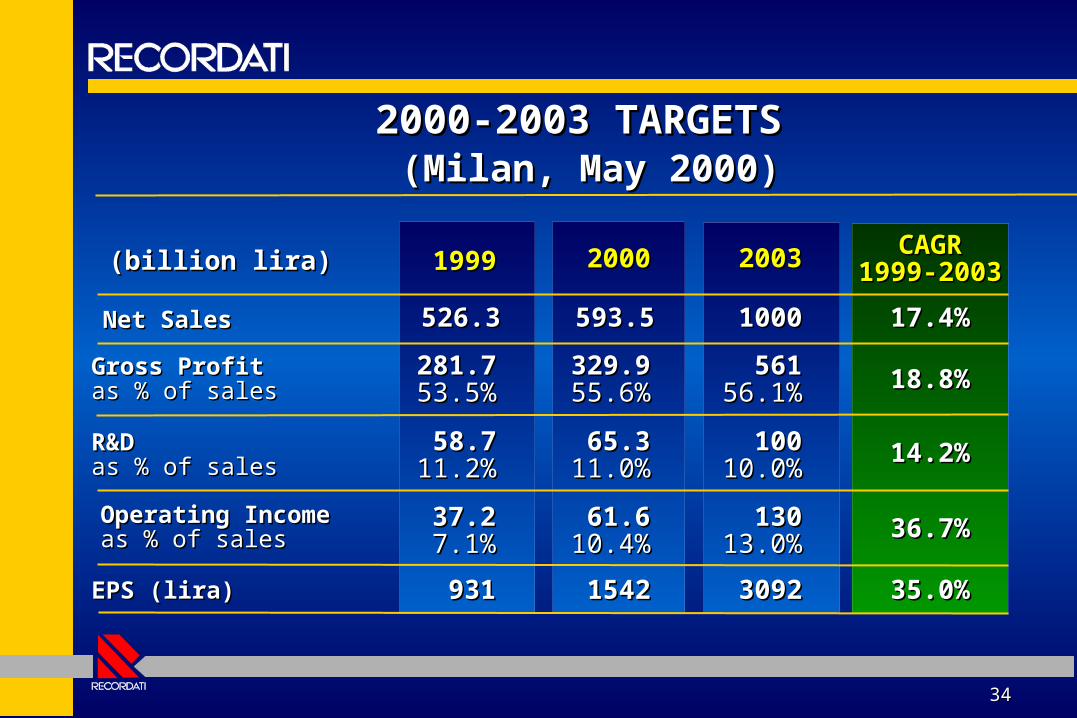
2000-2003 TARGETS2000-2003 TARGETS (Milan, May 2000)(Milan, May 2000)
2000200019991999
Net SalesNet Sales
Gross ProfitGross Profitas % of salesas % of sales
EPS (lira)EPS (lira)
Operating IncomeOperating Incomeas % of salesas % of sales
526.3526.3
281.7281.753.5%53.5%
37.237.27.1%7.1%
593.5593.5
329.9329.955.6%55.6%
931931
R&DR&Das % of salesas % of sales
58.758.711.2%11.2%
65.365.311.0%11.0%
61.661.610.4%10.4%
15421542
20032003
10001000
56156156.1%56.1%
10010010.0%10.0%
13013013.0%13.0%
30923092
CAGRCAGR1999-20031999-2003
17.4%17.4%
18.8%18.8%
14.2%14.2%
36.7%36.7%
35.0%35.0%
(billion lira)(billion lira)
3535
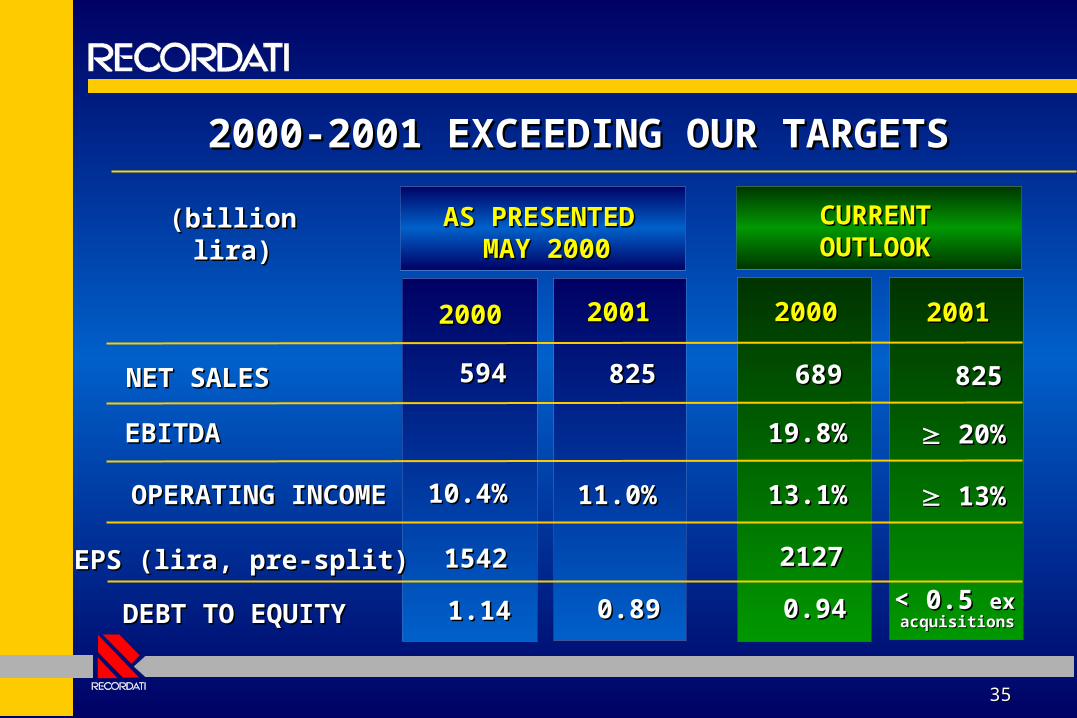
2000-2001 EXCEEDING OUR TARGETS2000-2001 EXCEEDING OUR TARGETS
2001200120002000
NET SALESNET SALES 594594 825825
OPERATING INCOMEOPERATING INCOME 10.4%10.4% 11.0%11.0%
20002000
689689
13.1%13.1%
20012001
825825
13%13%
(billion lira)(billion lira)AS PRESENTED AS PRESENTED
MAY 2000MAY 2000CURRENTCURRENTOUTLOOKOUTLOOK
EPS (lira, pre-split)EPS (lira, pre-split)
DEBT TO EQUITYDEBT TO EQUITY 0.940.940.890.891.141.14
15421542
< 0.5 < 0.5 exexacquisitionsacquisitions
21272127
EBITDAEBITDA 19.8%19.8% 20%20%
Banca IMI Investment SeminarBanca IMI Investment SeminarMilan, 8 March 2001Milan, 8 March 2001
2000-2001 Exceeding our targets2000-2001 Exceeding our targets
Related Documents