_____________________________________________

Welcome message from author
This document is posted to help you gain knowledge. Please leave a comment to let me know what you think about it! Share it to your friends and learn new things together.
Transcript
_____________________________________________
2
Contents Background and objectives of the report ..................................................................... 12
1. Overview of Latvian port and transit business ........................................................ 14
1.1. Industry of ports in Latvia ..................................................................................... 14
1.2. The volume of cargo in Latvian ports ................................................................... 17
2. Port infrastructure description.................................................................................. 28
2.1. Port evaluation criteria .......................................................................................... 28
2.2. The review of the Freeport of Ventspils ............................................................... 29
2.3. The review of other ports around BSR ................................................................. 32
2.4. Conclusions ........................................................................................................... 33
3. The significance of Belarusian transit...................................................................... 34
3.1. The cooperation in transit business between Belarus, Latvia and Sweden ........... 34
3.2. Port of Klaipeda: influence on the potential of the Belarus - Latvia - Sweden
Corridor ........................................................................................................................ 56
3.3. Conclusions ........................................................................................................... 57
4. Economic description of the Belarus-Latvia-Sweden Corridor ............................... 59
4.1. The role of the railway in the Belarus-Latvia-Sweden Corridor .......................... 59
4.2. The estimation of the current economic activity within the Belarus-Latvia-
Sweden Corridor .......................................................................................................... 62
4.3. Freight transport between Sweden and Latvia/Belarus ........................................ 67
4.4. Forecast analysis on Belarus-Latvia-Sweden Corridor ......................................... 76
4.5. Competitors’ analysis............................................................................................ 80
4.6. Conclusions ........................................................................................................... 87
5. Infrastructure assessment along the Belarus-Latvia-Sweden Corridor .................... 89
5.1. Road infrastructure................................................................................................ 89
5.1.1. Road infrastructure in Belarus ........................................................................... 89
5.1.2. Road infrastructure in Latvia ............................................................................. 90
5.1.3. Roads infrastructure in Lithuania ....................................................................... 94
5.2. The analysis of the railways along the entire Corridor ......................................... 96
5.2.1. Railways infrastructure in Belarus ..................................................................... 96
5.2.2. Railway infrastructure in Latvia ........................................................................ 97
5.2.3. Railway infrastructure in Lithuania ................................................................... 99
5.3. Conclusions ......................................................................................................... 100
6. The cargo traffic on the route Ventspils – Nynäshamn ......................................... 101
3
6.1. Traffic intensity on the highways to Ventspils ................................................... 101
6.2. International logistics companies working in the Baltics ................................... 104
6.3 External transit through Latvia ............................................................................ 105
6.4. The difference in numbers between the private transport and commercial
transport sector in the Freeport of Ventspils .............................................................. 108
6.5. Types of cargo and commodoties on the route Ventspils – Nynäshamn and
Nynäshamn – Ventspils ............................................................................................. 110
6.6. Conclusions ......................................................................................................... 115
7. Freight village development in Ventspils .............................................................. 116
7.1. The review of the freight villages around Europe .............................................. 116
7.2. The description of the Freeport of Ventspils for the companies willing to expand
or relocate................................................................................................................... 122
7.3. The commodities with the highest development potential for manufacture in
Ventspils .................................................................................................................... 129
7.4. The evaluation of companies willing to expand or relocate to the Freeport of
Ventspils .................................................................................................................... 138
7.5. Ways how to reach the Belarusian business niche in terms of relocation .......... 146
7.6. Advantages of Latvia for attracting Belarusian entrepreneurs ........................... 149
7.7. Conclusions ......................................................................................................... 153
8. Recommendations .................................................................................................. 155
8.1. The potential of Belarus-Sweden-Latvia Corridor ............................................. 155
8.2. The industries and companies willing to expand or relocate of the Freeport of
Ventspils .................................................................................................................... 157
8.3. The ways how to attract Belarusian and Swedish companies............................. 162
Appendix 1. Overview of the volume of cargo from Belarus to Latvian ports
Appendix 2. Overview of the main ports in Baltics and Nynäshamn/Norvik in Sweden
Appendix 3. The transport companies licensed in Latvia
Appendix 4. The TOP20 freight villages in Europe
4
List of Abbreviations
BKT – JSC Bulk Cargo Terminal (Biriu Kroviniu Terminalas)
BOC – Belarusian Oil Company
BSR – Baltic Sea Region
BTS – Build to suit investment
BZD – Belarusian Railways
CIS – Commonwealth of Independent States
CIT – Corporate Income Tax
CSB – Central Statistical Bureau of Latvia
DGG – Deutsche GVZ-Gesellschaft (German Freight Centres Society)
EAEU - Euroasian Economic Union
EFTI – Regulation on electronic freight transport information
EU – European Union
GDP – Gross Domestic Product
GVZ – Gunterverkehrszentren (Freight Centres – German/English)
IDAL – Investment and Development Agency of Latvia
ICT – Information Communication Technologies
KN – Klaipedos Nafta
LDZ Cargo – Latvian Railways Cargo
LR – Lithuanian Railways
RET – Real Estate Tax
SEZ – Special Economic Zone
UK – United Kingdom
VHTP – Ventspils High Technology Park
5
List of Interviews
1. Interview with an expert on port business Māris Katranži, 22.12.2020.,
01.02.2021., and 18.02.2021.
2. Interview with an expert on Belarusian business Andris Spūlis, 15.01.2021.
3. Interview with ex-deputy head of investments department - National
Investment and Privatisation Agency of Belarus Alexei Veluygo, 09.02.2021.
4. Interview with the Head of Investment Promotion Division of the Investment
and Development Agency of Latvia Toms Stūrītis, 10.02.2021.
5. Interview with freight commercial manager at Stena Line Oskars Osis,
19.02.2021.
6. Interview with an expert on international trade with Asia/China Andrejs
Pumpurs, 22.02.2021.
6
List of Maps MAP 1: LATVIAN TRAFFIC SYSTEM 14 MAP 2: THE TRANSIT SYSTEM OF LATVIA 15 MAP 3: MAIN TRANSPORT CORRIDORS IN SWEDEN 70 MAP 4: THE TEN-T CORE NETWORK CORRIDORS (TRANS-EUROPEAN
TRANSPORTNETWORK) 72 MAP 5: BELARUSIAN ROAD SYSTEM 89 MAP 6: LATVIAN ROAD SYSTEM 91 MAP 7: LITHUANIAN ROAD SYSTEM 95 MAP 8: BELARUSIAN RAILWAY SYSTEM 96 MAP 9: LATVIAN RAILWAY SYSTEM 98 MAP 10: LITHUANIAN RAILWAY SYSTEM 99 MAP 11: T0P-20 FREIGHT VILLAGES IN EUROPE IN 2015, ACCORDING TO DGG 121
7
List of Tables
TABLE 1: CARGO LOADED AND UNLOADED AT LATVIA'S PORTS (THSD T). ..................................... 18
TABLE 2: CARGO LOADED AND UNLOADED AT FREEPORT IN VENTSPILS BY KIND OF CARGO
(THSD T) .................................................................................................................................................... 21
TABLE 3: CARGO LOADED AND UNLOADED AT FREEPORT OF RIGA BY KIND OF CARGO (THSD
T) ................................................................................................................................................................. 21
TABLE 4: CARGO LOADED AND UNLOADED AT PORTS IN LIEPAJA BY KIND OF CARGO (THSD
T) ................................................................................................................................................................. 22
TABLE 5: CARGO LOADED AND UNLOADED AT MINOR PORTS BY KIND OF CARGO (THSD T) ..... 23
TABLE 6: CARGO TURNOVER AND COMPARISON OF LATVIAN PORTS, CSB ..................................... 24
TABLE 7: CARGO TURNOVER IN PORTS OF LATVIA JANUARY-SEPTEMBER, 2015-2020,
(THSD.T.) ................................................................................................................................................... 25
TABLE 8: CARGO TURNOVER IN THE PORT OF VENTSPILS, JANUARY-SEPTEMBER, 2015-2020,
(THSD. TONS) ........................................................................................................................................... 26
TABLE 9: CARGO TURNOVER AT THE FREEPORT OF VENTSPILS (THSD. T.), 2012-2020. .................. 29
TABLE 10: CARGO STRUCTURE AT THE FREEPORT OF VENTSPILS, 2014-2019, (THSD.T.) ................ 30
TABLE 11: TYPES OF CARGO 2015-2020 (THSD.T.). THE FREEPORT OF VENTSPILS ............................ 30
TABLE 12: RO-RO CARGO TURNOVER IN THE FREEPORT OF VENTSPILS (THDS.T) .......................... 30
TABLE 13: CARGO TURNOVER BY TERMINALS 2015-2020. G. (THOUSAND TONS). SOURCE: THE
FREEPORT OF VENTSPILS ..................................................................................................................... 31
TABLE 14: INFORMATION FOR 2019 ON THE MOVEMENT OF GOODS ARRIVING FROM THE
BALTIC PORT CITIES ACROSS THE CUSTOMS BORDER OF THE EUROASIAN ECONOMIC
UNION IN THE REPUBLIC OF BELARUS. SOURCE: STATE CUSTOMS COMMITTEE OF THE
REPUBIC OF BELARUS ........................................................................................................................... 42
TABLE 15: INFORMATION FOR 2019 ON THE MOVEMENT OF GOODS ARRIVING FROM THE
BALTIC PORT CITIES ACROSS THE CUSTOMS BORDER OF THE EAEU (THSD. T). SOURCE:
STATE CUSTOMS COMMITTEE OF THE REPUBLIC OF BELARUS ................................................ 42
TABLE 16: INFORMATION FOR JANUARY-NOVEMBER 2020 ON THE MOVEMENT OF GOODS
ACROSS THE CUSTOMS BORDER OF THE EAEU IN BELARUS SENT TO THE BALTIC PORT
CITIES (THSD. T., STATE CUSTOMS COMMITTEE OF THE REPUBLIC OF BELARUS) ............... 42
TABLE 17: FREIGHT TRANSPORT BY RAIL (THSD. TONS) CSB ............................................................... 43
TABLE 18: TOP-10 EXPORT POSITIONS FROM BELARUS TO LATVIA IN 2019 SOURCE:
NATIONAL STATISTICAL COMMITTEE OF THE REPUBLIC OF BELARUS .................................. 51
TABLE 19: TOP-10 IMPORT POSITIONS TO BELARUS FROM LATVIA IN 2019. SOURCE:
NATIONAL STATISTICAL COMMITTEE OF THE REPUBLIC OF BELARUS .................................. 53
TABLE 20: OVERVIEW OF THE VOLUME OF CARGO CARRIED BY LDZ CARGO LTD. IMPORT
SHIPMENTS TO LATVIAN PORTS FROM BELARUS BY BENEFICIARY (THSD T)....................... 60
TABLE 21: INFORMATION ON THE VOLUME OF FREIGHT TRANSPORT FROM BELARUS TO
LATVIA 2015-2019 AND 9 MONTHS OF 2020 (THSD T) ..................................................................... 61
TABLE 22: OVERVIEW OF THE VOLUME OF CARGO CARRIED BY LDZ CARGO LTD. IMPORT
SHIPMENTS FROM BELARUS TO LATVIAN RAILWAY STATIONS (THSD T). SOURCE:
LDZCARGO ............................................................................................................................................... 62
TABLE 23: THE AMOUNT OF EXPORT TO BELARUS FROM LATVIA (FROM 2015 TILL OCTOBER
2020) (MLN., EUR), ................................................................................................................................... 62
TABLE 24: THE AMOUNT OF EXPORT TO BELARUS FROM LATVIA (FROM 2015 TILL OCTOBER
2020) (MLN., EUR) ................................................................................................................................... 62
TABLE 25: THE AMOUNT OF EXPORT TO SWEDEN FROM LATVIA (FROM 2015 TILL OCTOBER
2020) (MLN., EUR) .................................................................................................................................... 63
TABLE 26: THE AMOUNT OF IMPORT FROM SWEDEN TO LATVIA (FROM 2015 TILL OCTOBER
2020) (MLN., EUR) .................................................................................................................................... 63
TABLE 27: THE TRADE TO BELARUS FROM LATVIA (FROM 2015 TILL 2020) (MLN., EUR) .............. 63
TABLE 28: THE TRADE FROM BELARUS TO LATVIA (FROM 2015 TILL 2020) (MLN., EUR) ............... 64
TABLE 29: THE TRADE FROM SWEDEN TO LATVIA (FROM 2015 TILL 2020) (MLN., EUR). CSB ....... 65
TABLE 30: THE TRADE FROM LATVIA TO SWEDEN (FROM 2015 TILL OCTOBER 2020) (MLN.,
EUR) ........................................................................................................................................................... 66
TABLE 31: THE TRADE FROM SWEDEN TO BELARUS (FROM 2015 TILL OCTOBER 2020) (MLN.,
EUR), SOURCE: STATISTIKAAMET ...................................................................................................... 67
TABLE 32: THE TRADE FROM BELARUS FROM SWEDEN(FROM 2015 TILL OCTOBER 2020)
(MLN., EUR) SOURCE: STATISTIKAAMET .......................................................................................... 67
TABLE 33: FREIGHT TRAFFIC (THSD.T.) ....................................................................................................... 72
TABLE 34: CARGO TRAFFIC BY RAIL ............................................................................................................ 73
TABLE 35: CARGO TRAFFIC AND CARGO TURNOVER BY MODE OF TRANSPORT IN LATVIA........ 73
8
TABLE 36: EXPORTS AND IMPORTS BY GROUPING OF COUNTRIES BY YEARS (MLN EURO) ......... 74
TABLE 37: COMPARISON OF RAILWAY CARGO TURNOVER BY TYPES 9 MONTHS 2015-2020,
(THSD. T.) .................................................................................................................................................. 74
TABLE 38: BILATERAL TRADE BETWEEN BELARUS AND SWEDEN IN 2015-2019 (MLN USD/EUR) 75
TABLE 39: TOTAL CARGO HANDLED IN POLISH PORTS 2019 WITH ALL TRADING PARTNERS
SOURCE: EUROSTAT .............................................................................................................................. 80
TABLE 40: TOTAL CARGO HANDLED IN POLISH PORTS WITH SWEDEN SOURCE: EUROSTAT ...... 81
TABLE 41: TOTAL CARGO HANDLED BY LATVIA AND LATVIAN PORTS WITH SWEDEN IN 2019.
SOURCE: EUROSTAT ONLY REGULAR RO-RO TRAFFIC FROM RIGA-STOCKHOLM
(TALLINKSILJA) ...................................................................................................................................... 82
TABLE 42: THE TOTAL CARGO HANDLED WITH SWEDEN BY LITHUANIAN AND POLISH PORTS
IN 2019 SOURCE: EUROSTAT ................................................................................................................ 82
TABLE 43: GROSS WEIGHT OF GOODS TRANSPORTED TO/FROM THE FREEPORT OF VENTSPILS
(ALL TRADING PORTS) SOURCE: EUROSTAT ................................................................................... 83
TABLE 44: GROSS WEIGHT OF GOODS TRANSPORTED TO/FROM THE FREEPORT OF VENTSPILS
(WITH SWEDEN ONLY) SOURCE: EUROSTAT ................................................................................... 83
TABLE 45: THE CHANGES IN CARGO IN LATVIA AND IN LATVIAN PORTS FROM 2010 TILL 2019
(ALL TRADING PARTNERS) SOURCE: EUROSTAT ........................................................................... 84
TABLE 46: THE CHANGES IN CARGO IN LATVIA AND IN LATVIAN PORTS FROM 2010 TILL 2019
(WITH SWEDEN ONLY) SOURCE: EUROSTAT ................................................................................... 84
TABLE 47: THE CHANGES IN CARGO IN POLAND AND IN POLISH PORTS FROM 2010 TILL 2019
(ALL TRADING PARTNERS) SOURCE: EUROSTAT ........................................................................... 85
TABLE 48: THE CHANGES IN CARGO IN POLAND AND IN POLISH PORTS FROM 2010 TILL 2019
(WITH SWEDEN ONLY) SOURCE: EUROSTAT ................................................................................... 86
TABLE 49: THE CHANGES IN CARGO IN LITHUANIA AND IN A PORT OF KLAIPEDA FROM 2010
TILL 2019 (ALL TRADING PARTS) SOURCE: EUROSTAT................................................................. 86
TABLE 50: THE CHANGES IN CARGO IN LITHUANIA AND IN A PORT OF KLAIPEDA FROM 2010
TILL 2019 (WITH SWEDEN ONLY) SOURCE: EUROSTAT................................................................. 87
TABLE 51: THE SURVEY: DRIVERS' VIEWS ON THE CREATION OF POTENTIAL NEW TRUCK
PARKS ........................................................................................................................................................ 93
TABLE 52: TRAFFIC INTENSITY ON THE ROAD A-10 RIGA-VENTSPILS. NUMBER OF THE CARS
IN A DAY ................................................................................................................................................. 101
TABLE 53: THE AVERAGE NUMBER OF TRUCKS PER DAY ON THE HIGH-WAY „RIGA-
VENTSPILS” BETWEEN KILOMETERS 181 AND 183 ....................................................................... 102
TABLE 54: THE AVERAGE NUMBER OF TRUCKS PER DAY ON THE REGIONAL ROAD
„VENTSPILS – KULDIGA/SALDUS” BETWEEN KILOMETERS 4 AND 13 ..................................... 102
TABLE 55: NUMBER OF REGISTERED VEHICLES AT THE END OF THE YEAR IN LATVIA. CSB ..... 102
TABLE 56: NUMBER OF REGISTERED VEHICLES AT THE END OF THE YEAR IN THE CITY OF
VENTSPILS. SOURCE:CSB .................................................................................................................... 102
TABLE 57: CARGO TRAFFIC AND CARGO TURNOVER BY MODE OF CARGO TRANSPORT
(TOTAL) ................................................................................................................................................... 103
TABLE 58: CARGO TRAFFIC AND CARGO TURNOVER BY MODE OF TRANSPORT .......................... 103
TABLE 59: BIGGEST ROAD LOGISTICS COMPANIES IN EUROPE .......................................................... 104
TABLE 60: INTERNATIONAL TRANSPORT COMPANIES IN THE BALTIC STATES ............................. 105
TABLE 61: NUMBER OF VIGNETTES PURCHASED FOR THE VEHICLES REGISTERED IN
BELARUS FROM 2015 TILL 12.11.2020. (DATA GIVEN BY ROAD SAFETY DIRECTORATE) ... 105
TABLE 62: EXTERNAL TRANSIT TO THE CIS COUNTRIES, UKRAINE, AND TURKMENISTAN IN
2020 (IN GENERAL).TRANSIT DECLARATION WHERE THE COUNTRY OF DISPATCH AND
DESTINATION IS NOT LATVIA. SOURCE: LATVIAN CUSTOMS STATISTICS ........................... 106
TABLE 63: EXTERNAL TRANSIT FROM THE CIS COUNTRIES, UKRAINE, AND TURKMENISTAN
IN 2020 (IN GENERAL).TRANSIT DECLARATION WHERE THE COUNTRY OF DISPATCH
AND DESTINATION IS NOT LATVIA. SOURCE: LATVIAN CUSTOMS STATISTICS .................. 106
TABLE 64: EXTERNAL TRANSIT TO THE CIS COUNTRIES, UKRAINE, AND TURKMENISTAN IN
2020 (BY ROAD TRANSPORT). TRANSIT DECLARATION WHERE THE COUNTRY OF
DISPATCH AND DESTINATION IS NOT LATVIA. SOURCE: LATVIAN CUSTOMS
STATISTICS ............................................................................................................................................. 107
TABLE 65: EXTERNAL TRANSIT FROM THE CIS COUNTRIES, UKRAINE, AND TURKMENISTAN
BY ROAD 2020 (BY ROAD TRANSPORT).TRANSIT DECLARATION WHERE THE COUNTRY
OF DISPATCH AND DESTINATION IS NOT LATVIA. SOURCE: LATVIAN CUSTOMS
STATISTICS ............................................................................................................................................. 107
TABLE 66: TRANSPORT FROM THE FREEPORT OF VENTSPILS TO THE PORT OF NYNÄSHAMN.
COMPARISON 18.11.2019.-24.11.2019. AND 09.12.2019.-15.12.2019. ............................................... 109
TABLE 67: TRANSPORT FROM THE PORT OF NYNÄSHAMN TO THE FREEPORT OF VENTSPILS.
COMPARISON 18.11.2019.-24.11.2019. AND 09.12.2019.-15.12.2019. ............................................... 109
9
TABLE 68: TRANSPORT FROM THE FREEPORT OF VENTSPILS TO THE PORT OF NYNÄSHAMN.
COMPARISON 06.07.2020.-12.07.2020. AND 24.08.2020.-30.08.2020. ............................................... 109
TABLE 69: TRANSPORT FROM THE PORT OF NYNÄSHAMN TO THE FREEPORT OF VENTSPILS.
COMPARISON 06.07.2020.-12.07.2020. AND 24.08.2020.-30.08.2020. ............................................... 109
TABLE 70: COMMODITIES SENT FROM BELARUS TO THE PORT OF NYNÄSHAMN THROUGH
THE FREEPORT OF VENTSPILS .......................................................................................................... 113
TABLE 71: COMMODITIES SENT FROM THE PORT OF NYNÄSHAMN TO BELARUS THROUGH
THE FREEPORT OF VENTSPILS. ......................................................................................................... 114
TABLE 72: THE CHARACTERISTICS OF VORSINO .................................................................................... 118
TABLE 73: THE CHARACTERISTICS OF ROSVA ........................................................................................ 119
TABLE 74: THE CHARACTERISTICS OF CLIP LOGISTICS TERMINALS ................................................ 120
TABLE 75: SWOT ABOUT THE FREEPORT OF VENTSPILS ...................................................................... 126
TABLE 76: RATING ASSESSMENT OF THE TOP-10 INDUSTRIES TO DETERMINE THE POTENTIAL
INTEREST OF ENTERPRISES IN PLACING A BUSINESS IN THE TERRITORY OF LATVIA.
SOURCE: ASER ....................................................................................................................................... 130
TABLE 77: CONCEPTUAL PORTRAIT OF THE TARGET COMPANIES .................................................... 136
TABLE 78: THE CONCEPTUAL PORTRAIT OF TARGET COMPANIES .................................................... 137
TABLE 79: BELARUSIAN COMPANIES THAT MAY NEED TO BE APPROACHED FOR WORK AT
THE FREEPORT OF VENTSPILS .......................................................................................................... 143
TABLE 80 SWEDISH COMPANIES THAT MAY NEED TO BE APPROACHED FOR WORK AT THE
FREEPORT OF VENTSPILS ................................................................................................................... 145
10
List of Figures
FIGURE 1: CARGO STRUCTURE IN LATVIAN PORTS, 2019. 23
FIGURE 2: EXPORT RAILWAY TRANSPORTATION OF GOODS FROM BELARUS TO THE
PORTS OF LITHUANIA (KLAIPEDA) AND LATVIA (VENTSPILS, RIGA). SOURCE:
NATIONAL STATISTICAL COMMITTEE OF THE REPUBLIC OF BELARUS 36
FIGURE 3: DYNAMICS OF EXPORT OF GOODS FROM BELARUS TO THE FREEPORT OF
VENTSPILS BY TYPE.(TONNES) SOURCE: NATIONAL STATISTICAL COMMITTEE OF
THE REPUBLIC OF BELARUS 38
FIGURE 4: STRUCTURE OF CARGO EXPORT FROM BELARUS TO THE FREEPORT OF RIGA BY
TYPE IN 2018 (10 MONTHS) 39
FIGURE 5: STRUCTURE OF CARGO EXPORT FROM BELARUS TO THE FREEPORT OF RIGA BY
TYPE IN 2019 (10 MONTHS) 40
FIGURE 6: STRUCTURE OF CARGO EXPORT FROM BELARUS TO THE FREEPORT OF RIGA BY
TYPE IN 2020 (10 MONTHS) SOURCE FOR THE FIGURES 4,5 AND 6: BELARUSIAN
RAILWAYS (BELARUSSKAJA ZELEZNAJA DOROGA) 40
FIGURE 7: DYNAMICS OF FREIGHT TURNOVER OF RAILWAY TRANSPORT IN
INTERNATIONAL TRAFFIC IN THE REPUBLIC OF BELARUS IN 2017 - 2019.(MLN.
TONNES) SOURCE: NATIONAL STATISTICAL COMMITTEE OF THE REPUBLIC OF
BELARUS 44
FIGURE 8: DYNAMICS OF THE VOLUME OF TRANSPORTATION OF GOODS BY ROAD IN THE
REPUBLIC OF BELARUS IN 2017 (JAN-DEC) - 2019 (JAN-SEPT.)(MLN. TONNES).
SOURCE: NATIONAL STATISTICAL COMMITTEE OF THE REPUBLIC OF BELARUS 45
FIGURE 9: CHANGE IN FREIGHT TURNOVER AND VOLUME OF TRANSPORTED GOODS IN
BELARUS IN JANUARY-SEPTEMBER 2020 COMPARED TO THE SAME PERIOD IN 2019%
. SOURCE: NATIONAL STATISTICAL COMMITTEE OF THE REPUBLIC OF BELARUS 45
FIGURE 10: FOREIGN TRADE IN GOODS BETWEEN THE REPUBLIC OF BELARUS AND
LITHUANIA IN 2017 (JAN-DEC) – 2020 (JAN-OCT). SOURCE: NATIONAL STATISTICAL
COMMITTEE OF THE REPUBLIC OF BELARUS 46
FIGURE 11: EXPORT OF GOODS FROM THE REPUBLIC OF BELARUS TO LITHUANIA IN 2017
(JAN - DEC) – 2020 (JAN - DEC) BY MODE OF TRANSPORT. SOURCE: NATIONAL
STATISTICAL COMMITTEE OF THE REPUBLIC OF BELARUS 47
FIGURE 12: IMPORT OF GOODS TO THE REPUBLIC OF BELARUS FROM LITHUANIA IN 2017
(JAN - DEC) – 2020 (JAN - OCT) BY MODE OF TRANSPORT. SOURCE: NATIONAL
STATISTICAL COMMITTEE OF THE REPUBLIC OF BELARUS 48
FIGURE 13: FOREIGN TRADE IN GOODS BETWEEN THE REPUBLIC OF BELARUS AND
LATVIA IN 2017 - JANUARY-OCTOBER 2020. SOURCE: NATIONAL STATISTICAL
COMMITTEE OF THE REPUBLIC OF BELARUS 49
FIGURE 14: EXPORT OF GOODS FROM THE REPUBLIC OF BELARUS TO LATVIA IN 2017 (JAN
- DEC) – 2020 (JAN - OCT) BY MODE OF TRANSPORT. SOURCE: NATIONAL
STATISTICAL COMMITTEE OF THE REPUBLIC OF BELARUS 50
FIGURE 15: IMPORT OF GOODS TO THE REPUBLIC OF BELARUS FROM LATVIA IN 2017(JAN-
DEC) – 2020 (JAN-OCT) BY MODE OF TRANSPORT. SOURCE: NATIONAL STATISTICAL
COMMITTEE OF THE REPUBLIC OF BELARUS 52
FIGURE 16: FOREIGN TRADE IN GOODS BETWEEN THE REPUBLIC OF BELARUS AND
ESTONIA IN 2017 - JANUARY-OCTOBER 2020. SOURCE: NATIONAL STATISTICAL
COMMITTEE OF THE REPUBLIC OF BELARUS 53
FIGURE 17: EXPORT OF GOODS FROM THE REPUBLIC OF BELARUS TO ESTONIA IN 2017
(JAN-DEC) – 2020 (JAN-OCT) BY MODE OF TRANSPORT. SOURCE: NATIONAL
STATISTICAL COMMITTEE OF THE REPUBLIC OF BELARUS. 54
FIGURE 18: IMPORT OF GOODS TO THE REPUBLIC OF BELARUS FROM ESTONIA IN 2017
(JAN-DEC) – 2020 (JAN-OCT) BY MODE OF TRANSPORT. SOURCE: NATIONAL
STATISTICAL COMMITTEE OF THE REPUBLIC OF BELARUS 55
FIGURE 19: FREIGHT TRAFFIC BY RAIL BY GROUP OF GOODS 71
FIGURE 20: CHANGES IN ROAD LOADING ON STATE MAIN ROADS 103
FIGURE 21: TYPES OF RO-RO FROM THE FREEPORT OF VENTSPILS TO THE PORT OF
NYNÄSHAMN. AVERAGE : (18.11.2019.-24.11.2019) , (09.12.2019.-15.12.2019) , (06.07.2020.-
12.07.2020) , (24.08.2020.-30.08.2020) 108
FIGURE 22: TYPES OF RO-RO FROM THE PORT OF NYNÄSHAMN TO THE FREEPORT OF
VENTSPILS. AVERAGE: (18.11.2019.-24.11.2019) , (09.12.2019.-15.12.2019) , (06.07.2020.-
12.07.2020) , (24.08.2020.-30.08.2020) 108
11
FIGURE 23: TOP COMMODITIES FROM THE FREEPORT OF VENTSPILS TO THE PORT OF
NYNÄSHAMN. AVERAGE : (18.11.2019.-24.11.2019) , (09.12.2019.-15.12.2019) , (06.07.2020.-
12.07.2020) , (24.08.2020.-30.08.2020) 110
FIGURE 24: TOP COMMODITIES FROM THE PORT OF NYNÄSHAMN TO THE FREEPORT OF
VENTSPILS. AVERAGE : (18.11.2019.-24.11.2019) , (09.12.2019.-15.12.2019) , (06.07.2020.-
12.07.2020) , (24.08.2020.-30.08.2020) 111
FIGURE 25: COUNTRY OF ORIGIN. TRANSPORT FROM THE FREEPORT OF VENTSPILS TO
THE PORT OF NYNÄSHAMN. CATEGORY: TRUCKS. AVERAGE : (18.11.2019.-24.11.2019) ,
(09.12.2019.-15.12.2019) , (06.07.2020.-12.07.2020) , (24.08.2020.-30.08.2020) 112
FIGURE 26: DESTINATION COUNTRY. TRANSPORT FROM THE FREEPORT OF VENTSPILS TO
THE PORT OF NYNÄSHAMN. CATEGORY: TRUCKS. AVERAGE : (18.11.2019.-24.11.2019) ,
(09.12.2019.-15.12.2019) , (06.07.2020.-12.07.2020) , (24.08.2020.-30.08.2020) 112
FIGURE 27: COUNTRY OF ORIGIN. TRANSPORT FROM THE PORT OF NYNÄSHAMN TO THE
FREEPORT OF VENTSPILS. CATEGORY: TRUCKS. AVERAGE : (18.11.2019.-24.11.2019) ,
(09.12.2019.-15.12.2019) , (06.07.2020.-12.07.2020) , (24.08.2020.-30.08.2020) 113
FIGURE 28: DESTINATION COUNTRY. TRANSPORT FROM THE PORT OF NYNÄSHAMN TO
THE FREEPORT OF VENTSPILS. CATEGORY: TRUCKS. AVERAGE : (18.11.2019.-
24.11.2019) , (09.12.2019.-15.12.2019) , (06.07.2020.-12.07.2020) , (24.08.2020.-30.08.2020) 114
FIGURE 29: HAVE THE EVENTS TAKING PLACE IN 2020 IN BELARUS AND IN THE WORLD
INFLUENCED YOUR BUSINESS? SOURCE: ASER SURVEY 132
FIGURE 30: HAVE YOU THOUGHT ABOUT BUSINESS RELOCATION (FULL OR PARTIAL)?
SOURCE: ASER SURVEY 133
FIGURE 31: TOP IMPORTING COUNTRIES IN THE BELARUSIAN EXPORT OF GOODS OUTSIDE
THE CIS IN 2020 SOURCE: NATIONAL STATISTICAL COMMITTEE OF THE REPUBLIC OF
BELARUS 134
FIGURE 32: COMMODITY STRUCTURE OF EXPORTS OF THE REPUBLIC OF BELARUS
OUTSIDE THE CIS IN 2020. SOURCE: NATIONAL STATISTICAL COMMITTEE OF THE
REPUBLIC OF BELARUS 135
FIGURE 33: ATTRACTING CLIENTS AND FINDING PROJECTS DURING COVID-19. THE
SOURCE: BICC AND REGISCONSULT 152
12
Background and objectives of the Study
Baltic Loop is an international project that focuses on solutions improving and
smoothening transport flows in three selected corridors to the West-East direction –
Northern, Middle, and Southern – within the Central Baltic Region. Ventspils is also
one of the points in Baltic Loop. One of the aims is also to make the corridors more
attractive to new businesses and innovations. However, the project seeks to minimize
the impact and number of different traffic hindrances or bottlenecks. The programme
includes partners from Finland, Estonia, Latvia, and Sweden. The development of
Baltic Loop includes several points: business models for smart and sustainable sea
logistics and port operations, technical solutions along the corridors, and dialogue
between different transportation actors.1
Objectives
One can separate several aims addressed by the study. The first objective is to analyse
the current cargo flows, bottlenecks and goods in the transport corridor Belarus-
Latvia-Sweden pertaining to the Freeport of Ventspils, thus examining the
competitiveness and potential of the transport corridor Belarus-Latvia-Sweden. The
study will also consider what kind of goods are at the heart of the corridor in both
directions and which new goods have the potential to serve the local freight market.
The second aim – to show what kind of companies would be ready to expand or to
relocate to the territory of the Freeport of Ventspils, what kind of qualities and
services these companies are waiting from the Freeport of Ventspils before the
potential relocation and how the Freeport of Ventspils can interest and be more
attractive for Belarusian and Swedish companies in order to establish a perspective
and look at the potential of a Freight Village to be developed in Ventspils.
The third objective – to find potential Belarusian companies that would be ready to
start negotiations about the relocation with the Freeport of the Ventspils.
1 About Baltic Loop, The Baltic Loop, https://www.balticloop.eu/index.php/about/
13
Therefore, the study aims to increase the competitiveness of both the Freeport of
Ventspils in the Baltic Sea Region and the transport corridor Belarus-Latvia-Sweden.
Material and methods
The following types of data sources and methods are used in the report:
1. Literature review.
2. Data of Latvian, Belarusian, and Swedish official institutions.
3. Data of non-governmental organisations in transport industry.
4. Information provided by official institutions and NGOs.
5. Interviews with logistics and port business experts.
6. Information provided by the Latvian, Lithuanian and Belarusian media.
Report structure
The report is divided into eight Chapters:
Chapter 1: offers the overview of Latvian ports and transit business and examines the
volume of cargoes in Latvian ports.
Chapter 2: overlooks the Latvian and BSR port infrastructure.
Chapter 3: examines the volume of Belarusian transit to the Freeport of Ventspils,
Latvia, and Lithuania.
Chapter 4: presents and examines the data on the transport corridor of Belarus-
Latvia-Sweden.
Chapter 5: looks at and provides data on the road and railway infrastructure in
Belarus, Latvia, and Lithuania.
Chapter 6: provides and analyses the data on the route Ventspils-Nynäshamn.
Chapter 7: analyses the potential of a Freight village in the Freeport of Ventspils.
Chapter 8: provides recommendations about the industries and enterprises that could
be ready to settle in the freight village of the Freeport of Ventspils.
The study was prepared by SIA eMobility in 2020 - 2021.
14
1. Overview of Latvian port and transit business
1.1. Industry of ports in Latvia
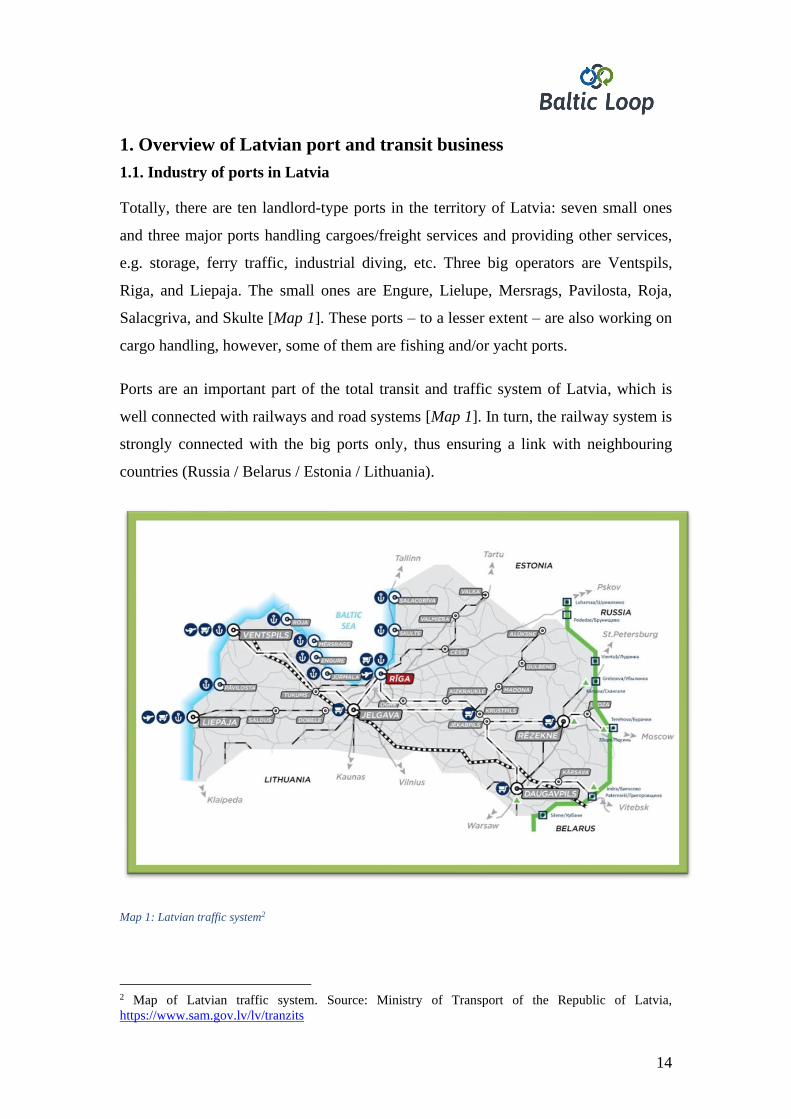
Totally, there are ten landlord-type ports in the territory of Latvia: seven small ones
and three major ports handling cargoes/freight services and providing other services,
e.g. storage, ferry traffic, industrial diving, etc. Three big operators are Ventspils,
Riga, and Liepaja. The small ones are Engure, Lielupe, Mersrags, Pavilosta, Roja,
Salacgriva, and Skulte [Map 1]. These ports – to a lesser extent – are also working on
cargo handling, however, some of them are fishing and/or yacht ports.
Ports are an important part of the total transit and traffic system of Latvia, which is
well connected with railways and road systems [Map 1]. In turn, the railway system is
strongly connected with the big ports only, thus ensuring a link with neighbouring
countries (Russia / Belarus / Estonia / Lithuania).
Map 1: Latvian traffic system2
2 Map of Latvian traffic system. Source: Ministry of Transport of the Republic of Latvia,
https://www.sam.gov.lv/lv/tranzits
15
Overall, about [75%] of Europe’s trade with the rest of the world, and more than one-
third of intra-European trade is shipped through the seaports. Many European seaports
are home to vast industrial complexes, located in port areas with the aim to be at the
crossroads of supply chains, and save transport costs and time.3 It is estimated that
European ports’ investment needs to amount to [48 billion EUR] for the coming ten
years.4 For European ports, an open trade environment is a priority, because any
barriers to trade could be considered as an additional burden or loss of business for
the aforementioned. Any geopolitical event may immediately affect a ports’ business.5
The Baltic Sea Region (BSR) forms economically, politically, and sociologically an
integrated and stable geographic area, with a consumer base of approximately
100 million people. An advanced and well-working transport network is crucial for
ensuring continued prosperity, growth, and further development of the region.
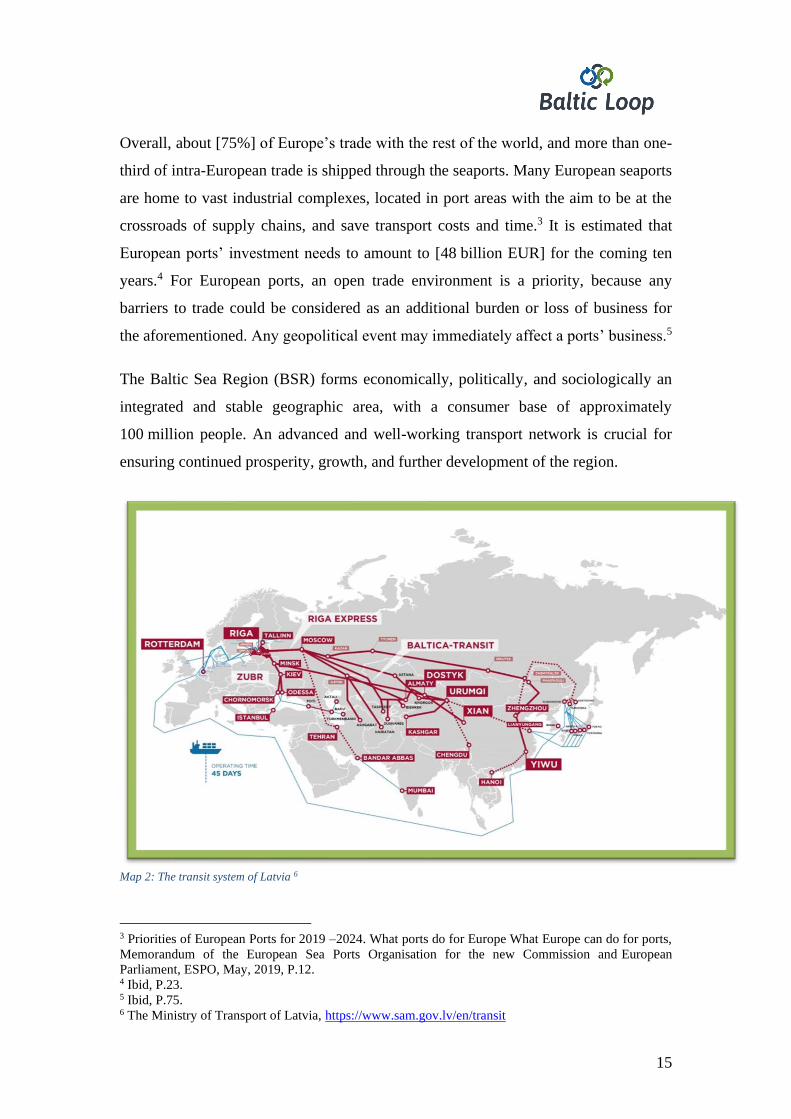
Map 2: The transit system of Latvia 6
3 Priorities of European Ports for 2019 –2024. What ports do for Europe What Europe can do for ports,
Memorandum of the European Sea Ports Organisation for the new Commission and European
Parliament, ESPO, May, 2019, P.12. 4 Ibid, P.23. 5 Ibid, P.75. 6 The Ministry of Transport of Latvia, https://www.sam.gov.lv/en/transit
16
Transport is also noted as one of the core fields in Latvian economics. According to
the National Development of Latvia, for 2021-2027, transport infrastructure, and
transport and logistics services directly impact competitiveness and economic growth
by creating preconditions for the development of other sectors and investments that
provide significant export revenues.7 Also, the advantage of Latvia in the competition
for servicing of freights is its geographical location – by the Baltic Sea, on the axle
which connects markets of Western Europe, Russia, and Asia [Map 2]. Transit traffic
is dominated by means of railway freight carriage, mainly from Russia and Belarus
via the East-West railway corridor to the ports of Latvia. However, according to the
Sustainable Development Strategy of Latvia until 2030 the potential of ports is not
used to its full extent8. At this very moment transhipment capacities of freights are far
from the maximum: in Riga around [50%], Ventspils – [25%], Liepaja – [65%] and
minor ports – [70%].
In order to utilise the potential of ports to the fullest, new flows of cargo will need to
be attracted, particularly from Asia and the Commonwealth of Independent States
(CIS) countries. Together with the development of distribution and management
centres for the flows of cargoes, this should increase the competitiveness of the ports
of Latvia in comparison to ports of Klaipeda, Tallinn, and Helsinki, Primorsk,
Baltiysk, and other ports of the BSR.9
According to the Sustainable Development Strategy of Latvia until 2030 all three
ports have a future development potential that could be closely related to the
development of the cities. However, not always ports are directly mentioned as a part
of the development. For instance, regarding the port of Riga, it is stressed that
„combining this [scientific and entrepreneurial – author’s note] potential and
establishing clusters for science, research, and development, innovations, as well as
for the growth of technologically capacious enterprises, it is possible to attain the
7 National Development of Latvia for 2021-2027, Approved on 2 July 2020 by decision of the Saeima
of the Republic of Latvia No. 418/Lm13, 279.point, https://www.pkc.gov.lv/en/national-development-
planning Cross-Sectoral Coordination Center Riga 2020, P.57. 8 Sustainable Development Strategy of Latvia until 2030, Saeima of the Latvia of the Republic,
https://www.pkc.gov.lv/en/national-development-planning, 279. point, P.65. 9 Ibid, P.70.
17
development of Riga as business, science, culture and tourism center of Northern
Europe”.
In contrary to Riga, the development of cities of Liepaja and Ventspils, according to
the Sustainable Development Strategy of Latvia until 2030, are directly connected
with the development of the ports as one of the centres of logistics, international
cooperation, and business as a whole. Concerning Liepaja City there is mentioned,
that „in order to integrate into the BSR, Liepaja should develop logistics services for
markets of the Nordic countries and Western Europe, using the vicinity of ports,
railways, and airports, as well as the vicinity of Lithuania that provides the
possibilities to attract more tourists”.10 Also for the development of the city of
Ventspils, the port plays an important role. It is estimated that logistics and
multimodal transport services could be one of the cornerstones for Ventspils to
become the development centre of innovations, industry, and engineering sectors with
high added value and logistics and transit in the BSR.11
1.2. The volume of cargo in Latvian ports
Overall the transit cargo volumes in Latvia have reduced over the years. Export
volumes both in shipping and railways in the GDP of Latvia have been reduced by
[2.5%]. Transit export has fallen from around [20%] in [2000] to [4%] at the end of
[2019]. Moreover, parts of the current volumes are also at risk. Russia is eager to
develop its own ports due to economic independence factors and the second – a
decrease in the main Latvia transit cargo volume and liquid petroleum products
transhipped.12 Especially this makes a large difference in the economics of Latvian
Railway operations as coal was forming the main budget cargo volume, which paid all
the infrastructure maintenance costs. In other words, Russia wants to substitute the
import of services provided by other countries ensuring its own services.13 Experts are
stressing that the volumes of cargoes coming to Latvia from neighbouring countries
10 Sustainable Development Strategy of Latvia until 2030, Saeima of the Latvia of the Republic,
https://www.pkc.gov.lv/en/national-development-planning, 325. point, P.74. 11 Ibid, 325. point, P.74. 12 „Latvijas tranzīta jomas nozīme jau gadiem sarūk; ASV sankciju ietekmi vēl nevar aplēst”,
www.lsm.lv, Zalāne, L., 11.12.2019., https://www.lsm.lv/raksts/zinas/ekonomika/latvijas-tranzita-
jomas-nozime-jau-gadiem-saruk-asv-sankciju-ietekmi-vel-nevar-aplest.a341376/ 13 Interview with Maris Katranzi 18.02.2021.
18
depend on political issues rather than economics. In addition, according to climate
targets, the European Union (EU) is going to reduce the consumption of coal14, which
would impacts total coal transhipment volumes on the BSR as such.
However, according to the data of the Freeport of Riga for [2020], 19 from 33 cargo
terminals have transhipped more cargo than in the previous year.15 Moreover, in four
terminals the amount of cargo remained the same. For instance, the volume of timber
in [2020] has increased. This is connected with Brexit and with the strategy of UK
partners to export more timber before the new Brexit regulations come into effect on
[1 January 2021] .
2019 2016 2017 2016 2015
Cargo loaded
Total 52 892 57 054 54 156 56 217 62 551
Riga 27 084 31 151 28 995 32 891 35 952
Ventspils 17 690 17 620 17 921 16 860 20 808
Liepaja 6428 6603 5818 5109 4861
Minor ports 1690 1680 1422 1357 1110
Cargo unloaded
Total 9488 9121 7721 6899 7018
Riga 5678 5281 4680 4179 4104
Ventspils 2767 2706 2114 1949 1719
Liepaja 907 935 771 571 930
Minor ports 136 199 156 200 265
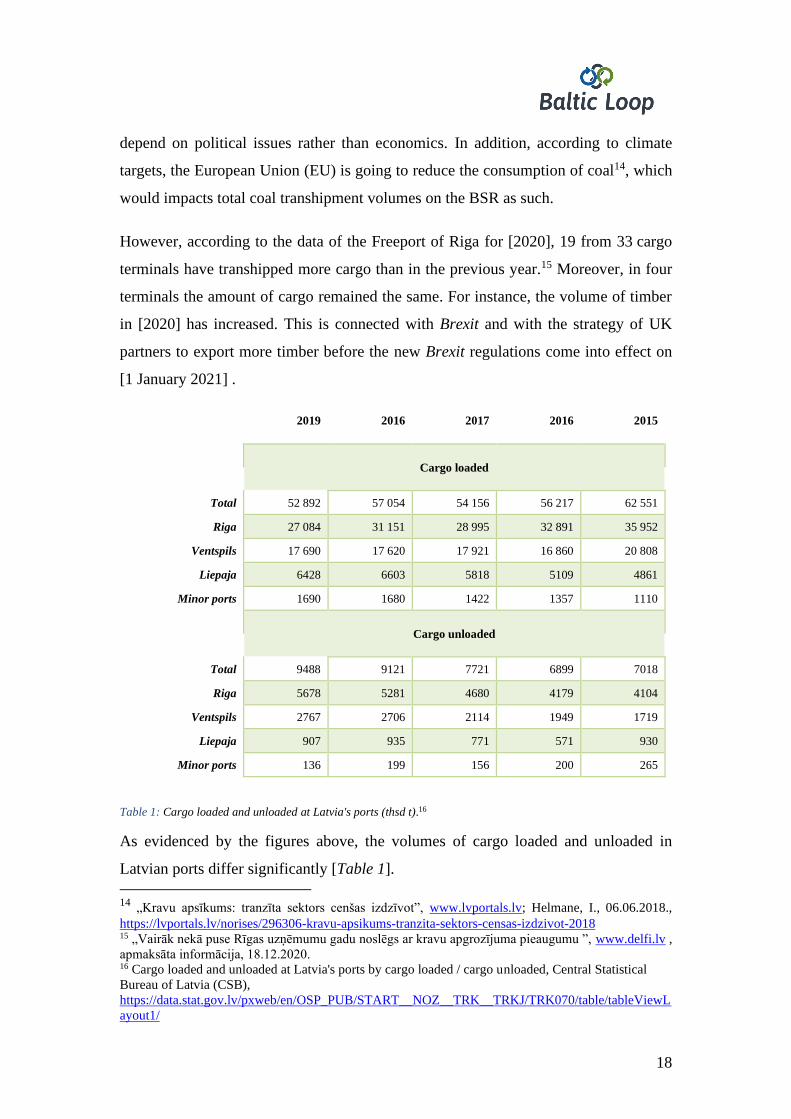
Table 1: Cargo loaded and unloaded at Latvia's ports (thsd t).16
As evidenced by the figures above, the volumes of cargo loaded and unloaded in
Latvian ports differ significantly [Table 1].
14
„Kravu apsīkums: tranzīta sektors cenšas izdzīvot”, www.lvportals.lv; Helmane, I., 06.06.2018.,
https://lvportals.lv/norises/296306-kravu-apsikums-tranzita-sektors-censas-izdzivot-2018 15 „Vairāk nekā puse Rīgas uzņēmumu gadu noslēgs ar kravu apgrozījuma pieaugumu ”, www.delfi.lv ,
apmaksāta informācija, 18.12.2020. 16 Cargo loaded and unloaded at Latvia's ports by cargo loaded / cargo unloaded, Central Statistical
Bureau of Latvia (CSB),
https://data.stat.gov.lv/pxweb/en/OSP_PUB/START__NOZ__TRK__TRKJ/TRK070/table/tableViewL
ayout1/
19
In [2015], the volume of cargo loaded reached 62 551 thousand tons, whereas cargo
unloaded – 7018 thousand tons. The obvious difference between those two indicators
remained in the following years as well. However, in [2019] the difference has
become slightly less: for 52 892 thousand tons that is [-15.45%] less in comparison
with [2015] thousand tons of cargo loaded vs. 9488 thousand tons that are [-26.04%]
in comparison with [2015] of cargo unloaded.
Assessing the performance of individual ports, it is observed that the volume of cargo
loaded in the Freeport of Ventspils has decreased from 20 808 t tons in [2015] to
17 690 thousand tons in [2019] that is [-14.99%] in comparison with [2015], while the
volume of unloaded cargo has increased from 1719 t tons in [2015] to 2767 thousand
tons in [2019] that is [+37.88%] in comparison with [2015].
The same tendency has been observed also in the Freeport of Riga. The volume of
cargo loaded has decreased from 35 952 thousand tons in [2015] to 27 084 thousand
tons in [2019] that is [-24.67%] in comparison with [2015]. Concerning cargoes
unloaded, the volume has increased from 4104 thousand tons in [2015] to 5678
thousand tons in [2019] that is [+27.73%] in comparison with [2015].
According to the information provided by the Ministry of Transport of Latvia, during
the first half of [2020], 22 628 tons of cargo were handled in the Latvian ports, which
is [30.1%] less than in the corresponding period of [2019]. In terms of cargo amounts
handled in the first six months of this year, the Freeport of Riga was still in the lead
with 11 843 million tons handled, which is [26.7%] less than in the corresponding
period of last year. This is followed by the Freeport of Ventspils, where cargo
turnover in the first half of this year amounted to 6.8 million tons, which is [41.1%]
less compared to [2019].17
The situation is different in the Port of Liepaja: the volume of cargo loaded in [2015]
reached 4861 thousand tons, but contrary to Ventspils and Riga, in [2019] the
unloaded cargo amounts have increased reaching 6428 or +24.38 in comparison with
2015 t tons, while the volume of cargo unloaded has remained almost the same.
17 Statistics of Ministry of Transport, https://www.sam.gov.lv/lv/statistika-2
20
According to the Central Statistical Bureau (CSB) of Latvia, in the nine months of
[2020] compared to the nine months of [2019], freight carried by land transport and
the pipeline has dropped by [19.7%], while the ports were down by [29.7%.]
71.3 million tons of freights were carried by land and pipeline transport, a decrease of
17.5 million tons. In the nine months of [2020], rail transport freights comprised
17.4 million tons, which is [44.9%] less than in the nine months of [2019]. National
freights by rail comprised 1.4 million tons – [13.8%] more. In international traffic, the
volume of freight carried by rail comprised 16 million tons – a reduction of [47.4%].
The decline can be explained by Russia’s efforts to shift all its exports to its own
ports.18
Freights by road comprised 52.7 million tons, which is [4.3%] less than in the nine
months of the previous year. National freights comprised 41.6 million tons, [0.4%]
more. International freights accounted for 11.1 million tons – [18.6%] less.
1.2 million tonnes of oil products were transported via the main pipeline, which is
[44%] less.
In the year [2020], almost 45 million tonnes of cargoes have been overloaded in
Latvian ports. This is for [28%] less than in the year [2019]. It is also estimated by the
Ministry of Transport that the volume of transit through ports has been reduced by
[52%], including in Ventspils – almost 38%. The shrinkage of coals – totally in
Latvian ports – has been reduced by 80% in comparison with the year [2019]. As
noted before, the main reason for the decline is Russia’s policy to shift the cargoes to
their own ports.19
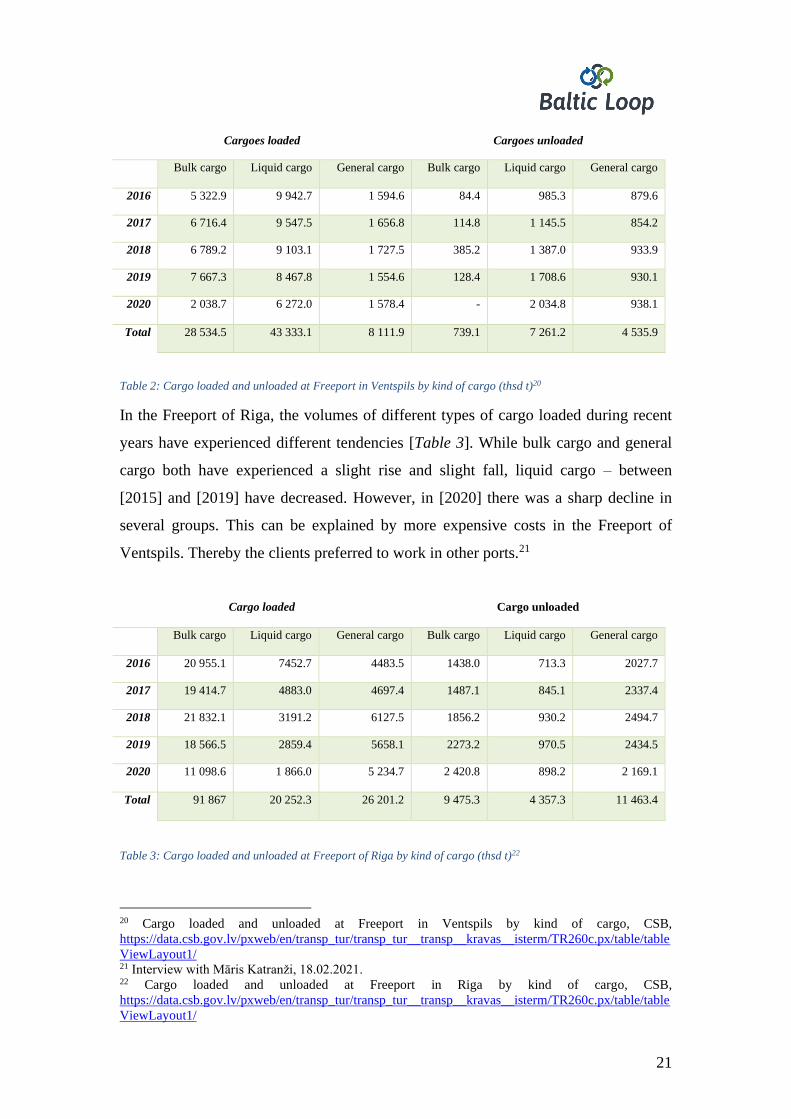
In the Freeport of Ventspils (Table 2), it is observed that the volume of cargoes loaded
has been reduced drastically in [2020]. The exception is general cargoes. However,
things have not changed a lot regarding the cargoes unloaded.
18 Interview with Maris Katranzi, 19.02.2021. 19 „Latvijas ostās pērn pārkrauto kravu apjoms sarucis par 28%”, www.lsm.lv, Zalāne, L.,
https://www.lsm.lv/raksts/zinas/ekonomika/latvijas-ostas-pern-parkrauto-kravu-apjoms-sarucis-par-
28.a393148/, 16.02.2021.
21
Cargoes loaded Cargoes unloaded
Bulk cargo Liquid cargo General cargo Bulk cargo
Liquid cargo
General cargo
2016 5 322.9 9 942.7 1 594.6 84.4 985.3 879.6
2017 6 716.4 9 547.5 1 656.8 114.8 1 145.5 854.2
2018 6 789.2 9 103.1 1 727.5 385.2 1 387.0 933.9
2019 7 667.3 8 467.8 1 554.6 128.4 1 708.6 930.1
2020 2 038.7
6 272.0
1 578.4
- 2 034.8
938.1
Total 28 534.5
43 333.1
8 111.9
739.1 7 261.2
4 535.9
Table 2: Cargo loaded and unloaded at Freeport in Ventspils by kind of cargo (thsd t)20
In the Freeport of Riga, the volumes of different types of cargo loaded during recent
years have experienced different tendencies [Table 3]. While bulk cargo and general
cargo both have experienced a slight rise and slight fall, liquid cargo – between
[2015] and [2019] have decreased. However, in [2020] there was a sharp decline in
several groups. This can be explained by more expensive costs in the Freeport of
Ventspils. Thereby the clients preferred to work in other ports.21
Cargo loaded
Cargo unloaded
Bulk cargo Liquid cargo General cargo Bulk cargo
Liquid cargo
General cargo
2016 20 955.1 7452.7 4483.5 1438.0 713.3 2027.7
2017 19 414.7 4883.0 4697.4 1487.1 845.1 2337.4
2018 21 832.1 3191.2 6127.5 1856.2 930.2 2494.7
2019 18 566.5 2859.4 5658.1 2273.2 970.5 2434.5
2020 11 098.6
1 866.0
5 234.7
2 420.8 898.2 2 169.1
Total 91 867
20 252.3
26 201.2
9 475.3
4 357.3
11 463.4
Table 3: Cargo loaded and unloaded at Freeport of Riga by kind of cargo (thsd t)22
20 Cargo loaded and unloaded at Freeport in Ventspils by kind of cargo, CSB,
https://data.csb.gov.lv/pxweb/en/transp_tur/transp_tur__transp__kravas__isterm/TR260c.px/table/table
ViewLayout1/ 21 Interview with Māris Katranži, 18.02.2021. 22 Cargo loaded and unloaded at Freeport in Riga by kind of cargo, CSB,
https://data.csb.gov.lv/pxweb/en/transp_tur/transp_tur__transp__kravas__isterm/TR260c.px/table/table
ViewLayout1/
22
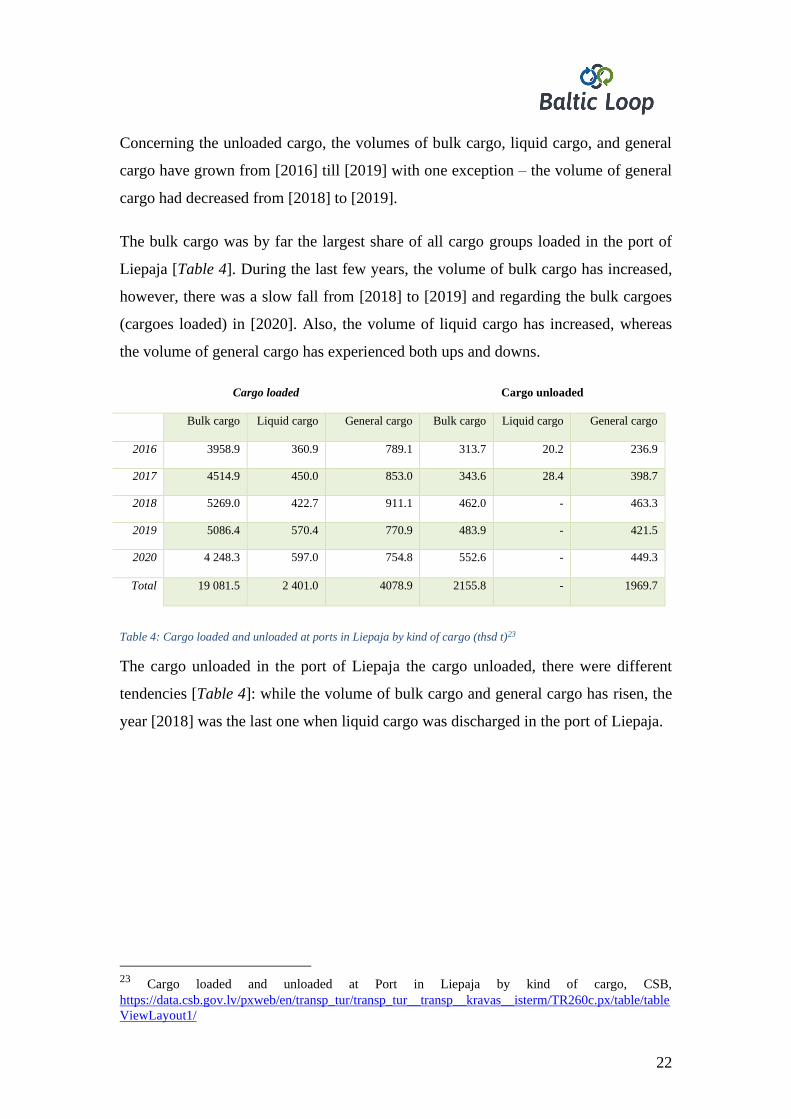
Concerning the unloaded cargo, the volumes of bulk cargo, liquid cargo, and general
cargo have grown from [2016] till [2019] with one exception – the volume of general
cargo had decreased from [2018] to [2019].
The bulk cargo was by far the largest share of all cargo groups loaded in the port of
Liepaja [Table 4]. During the last few years, the volume of bulk cargo has increased,
however, there was a slow fall from [2018] to [2019] and regarding the bulk cargoes
(cargoes loaded) in [2020]. Also, the volume of liquid cargo has increased, whereas
the volume of general cargo has experienced both ups and downs.
Cargo loaded
Cargo unloaded
Bulk cargo Liquid cargo General cargo Bulk cargo
Liquid cargo
General cargo
2016 3958.9 360.9 789.1 313.7 20.2 236.9
2017 4514.9 450.0 853.0 343.6 28.4 398.7
2018 5269.0 422.7 911.1 462.0 - 463.3
2019 5086.4 570.4 770.9 483.9 - 421.5
2020 4 248.3
597.0
754.8
552.6
- 449.3
Total 19 081.5
2 401.0
4078.9
2155.8
- 1969.7
Table 4: Cargo loaded and unloaded at ports in Liepaja by kind of cargo (thsd t)23
The cargo unloaded in the port of Liepaja the cargo unloaded, there were different
tendencies [Table 4]: while the volume of bulk cargo and general cargo has risen, the
year [2018] was the last one when liquid cargo was discharged in the port of Liepaja.
23
Cargo loaded and unloaded at Port in Liepaja by kind of cargo, CSB,
https://data.csb.gov.lv/pxweb/en/transp_tur/transp_tur__transp__kravas__isterm/TR260c.px/table/table
ViewLayout1/
23
Cargo loaded
Cargo unloaded
Bulk cargo Liquid cargo General cargo Bulk cargo
Liquid cargo
General cargo
2016 588.9 - 768.1 313.7 15.7 48.1
2017 691.4 - 731.1 343.6 15.5 70.5
2018 584.4 - 1095.8 462.0 16.0 109.6
2019 652.1 - 1038.0 483.9 19.2 51.9
2020 721.3
- 866.1
386.7
17.4
45.2
Total 3 238.1
- 4 499.1
1 989.9
83.8
325.3
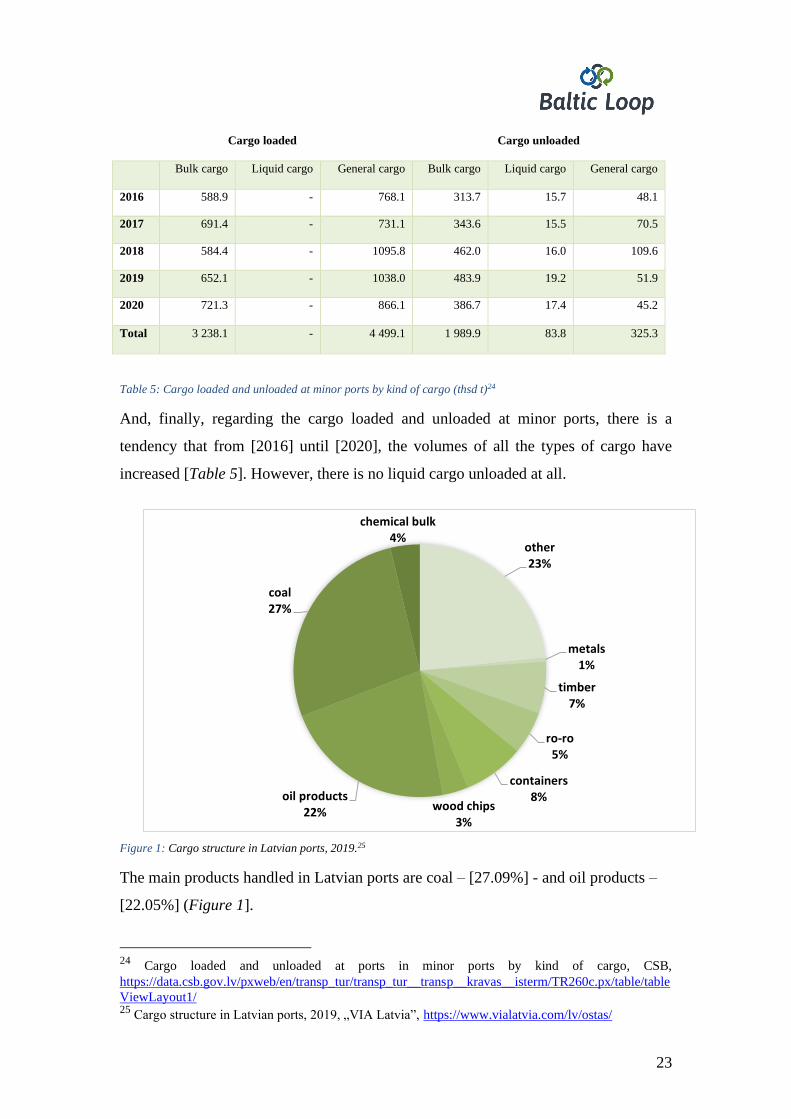
Table 5: Cargo loaded and unloaded at minor ports by kind of cargo (thsd t)24
And, finally, regarding the cargo loaded and unloaded at minor ports, there is a
tendency that from [2016] until [2020], the volumes of all the types of cargo have
increased [Table 5]. However, there is no liquid cargo unloaded at all.
Figure 1: Cargo structure in Latvian ports, 2019.25
The main products handled in Latvian ports are coal – [27.09%] - and oil products –
[22.05%] (Figure 1].
24
Cargo loaded and unloaded at ports in minor ports by kind of cargo, CSB,
https://data.csb.gov.lv/pxweb/en/transp_tur/transp_tur__transp__kravas__isterm/TR260c.px/table/table
ViewLayout1/ 25
Cargo structure in Latvian ports, 2019, „VIA Latvia”, https://www.vialatvia.com/lv/ostas/
other23%
metals1%
timber7%
ro-ro5%
containers8%
wood chips3%
oil products22%
coal27%
chemical bulk4%
24
Port
Last 9 months in 2019 Last 9 months in 2020 2020/2019
Export Import Total Export Received Total
Riga 19,837.2 4,078.0 23 915.5 13 413.2 4,185.1 17 598.3 -26,4
Ventspils 14,477.5 2,124.1 16 601.1 7,213.7 2,425.5 9,639.20 -41,9
Liepaja 4 668.00 645.6 5 313,60 3 992,80 692,9 4 685,70 -11,8
Salacgriva 205.2 44,8 250 159,2 46,6 205,8 -17,7
Mersrags 310.8 36,4 347,2 281,1 15,5 296,6 -14,6
Roja 32,5 9,9 42,4 31,7 8,5 40,2 -5,2
Pavilosta 0 2,6 2,6 0 1,8 1,8 -30,8
Skulte 751.4 24,7 776,1 700,4 28,6 729 -6,1
Total of
minor ports
1 299.90 118,4 1,18.30 1 172,40 101 1 273,40 -10,2
Total of all
ports
40 282.6 6 966.4 47 249 25 792.1 7 404.5 33 196.6 -29,7
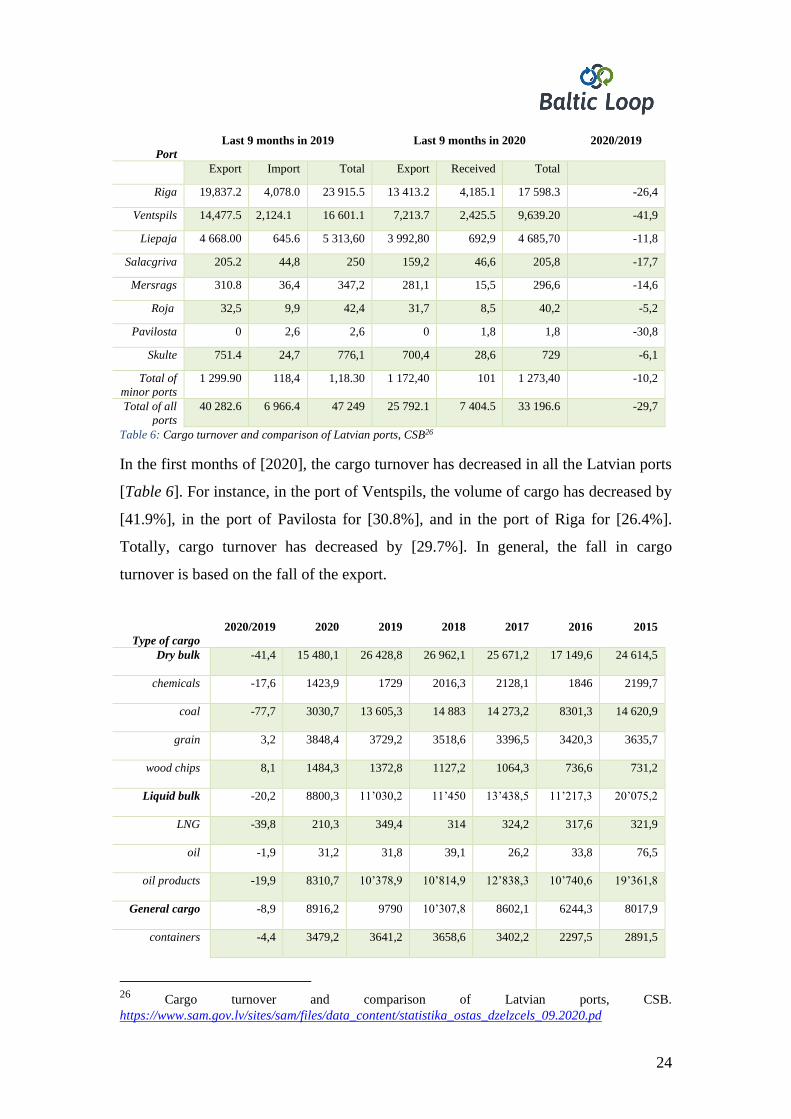
Table 6: Cargo turnover and comparison of Latvian ports, CSB26
In the first months of [2020], the cargo turnover has decreased in all the Latvian ports
[Table 6]. For instance, in the port of Ventspils, the volume of cargo has decreased by
[41.9%], in the port of Pavilosta for [30.8%], and in the port of Riga for [26.4%].
Totally, cargo turnover has decreased by [29.7%]. In general, the fall in cargo
turnover is based on the fall of the export.
Type of cargo
2020/2019 2020 2019 2018 2017 2016 2015
Dry bulk -41,4
15 480,1 26 428,8 26 962,1 25 671,2
17 149,6
24 614,5
chemicals -17,6
1423,9 1729
2016,3 2128,1 1846
2199,7
coal -77,7
3030,7 13 605,3 14 883 14 273,2
8301,3
14 620,9
grain 3,2 3848,4 3729,2 3518,6 3396,5
3420,3
3635,7
wood chips 8,1 1484,3 1372,8 1127,2 1064,3
736,6
731,2
Liquid bulk -20,2 8800,3 11’030,2 11’450 13’438,5
11’217,3
20’075,2
LNG -39,8
210,3 349,4 314 324,2
317,6
321,9
oil -1,9
31,2 31,8 39,1 26,2
33,8
76,5
oil products -19,9
8310,7 10’378,9 10’814,9 12’838,3
10’740,6
19’361,8
General cargo -8,9
8916,2 9790 10’307,8 8602,1
6244,3
8017,9
containers -4,4 3479,2 3641,2 3658,6 3402,2
2297,5
2891,5
26
Cargo turnover and comparison of Latvian ports, CSB.
https://www.sam.gov.lv/sites/sam/files/data_content/statistika_ostas_dzelzcels_09.2020.pd
25
Type of cargo
2020/2019 2020 2019 2018 2017 2016 2015
(TEU) -2,3
340’069 348’094 347’233 327’158
216’876
268’356
Ro-Ro -9,8 2299 2549,5 2644,9 2348,6
1638,6
2011,1
number -28,6
113’000 158’362 167’214 154’874
106’031
127 457
wood products -15,5
2785 3295,2 3600,3 2474,6
2058,5
2719,6
thsd. m3 -14
3323,9 3864 4089,7 2879,8
2537,2
3682
metals -1,3
222,7 225,6 275,2 223,1
176,4
286,5
Total -29,7
33’196,6 47’249 48’719,9 47’711,8
34’611,2
52 707,6
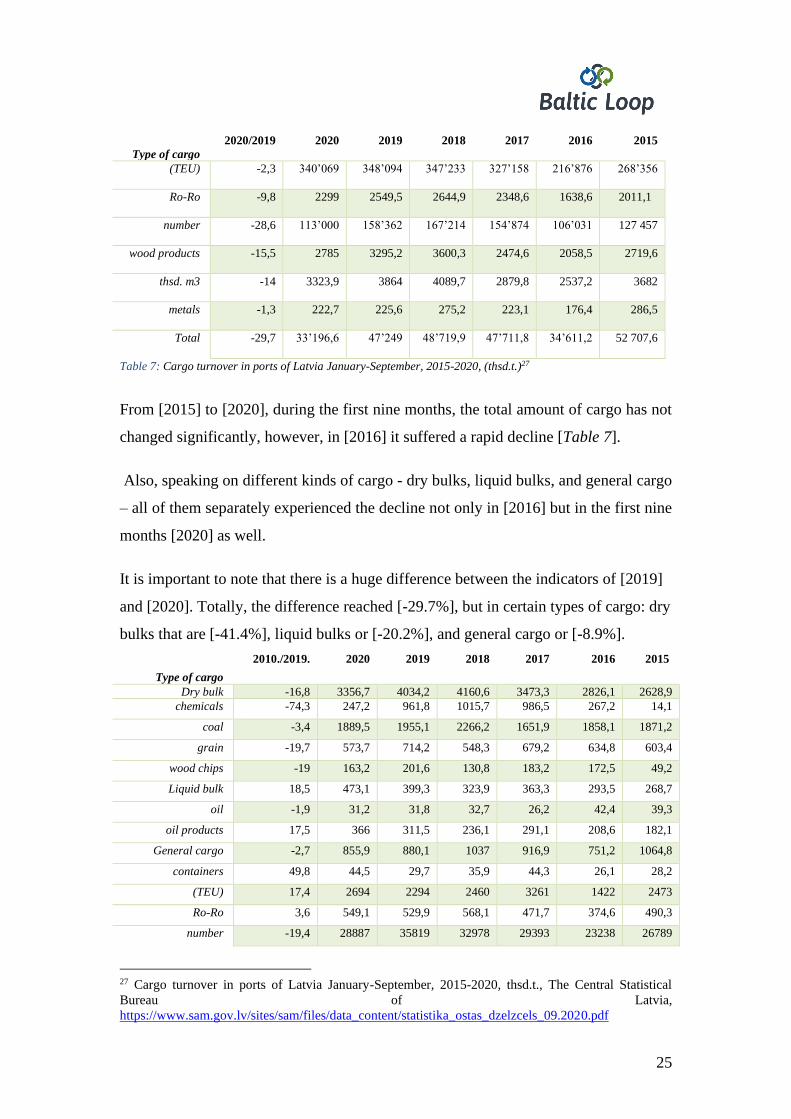
Table 7: Cargo turnover in ports of Latvia January-September, 2015-2020, (thsd.t.)27
From [2015] to [2020], during the first nine months, the total amount of cargo has not
changed significantly, however, in [2016] it suffered a rapid decline [Table 7].
Also, speaking on different kinds of cargo - dry bulks, liquid bulks, and general cargo
– all of them separately experienced the decline not only in [2016] but in the first nine
months [2020] as well.
It is important to note that there is a huge difference between the indicators of [2019]
and [2020]. Totally, the difference reached [-29.7%], but in certain types of cargo: dry
bulks that are [-41.4%], liquid bulks or [-20.2%], and general cargo or [-8.9%].
Type of cargo
2010./2019. 2020 2019 2018 2017 2016 2015
Dry bulk -16,8 3356,7 4034,2 4160,6 3473,3 2826,1 2628,9 chemicals -74,3 247,2 961,8 1015,7 986,5 267,2 14,1
coal -3,4 1889,5 1955,1 2266,2 1651,9 1858,1 1871,2
grain -19,7 573,7 714,2 548,3 679,2 634,8 603,4
wood chips -19 163,2 201,6 130,8 183,2 172,5 49,2
Liquid bulk 18,5 473,1 399,3 323,9 363,3 293,5 268,7
oil -1,9 31,2 31,8 32,7 26,2 42,4 39,3
oil products 17,5 366 311,5 236,1 291,1 208,6 182,1
General cargo -2,7 855,9 880,1 1037 916,9 751,2 1064,8
containers 49,8 44,5 29,7 35,9 44,3 26,1 28,2
(TEU) 17,4 2694 2294 2460 3261 1422 2473
Ro-Ro 3,6 549,1 529,9 568,1 471,7 374,6 490,3
number -19,4 28887 35819 32978 29393 23238 26789
27 Cargo turnover in ports of Latvia January-September, 2015-2020, thsd.t., The Central Statistical
Bureau of Latvia,
https://www.sam.gov.lv/sites/sam/files/data_content/statistika_ostas_dzelzcels_09.2020.pdf
26
Type of cargo
2010./2019. 2020 2019 2018 2017 2016 2015
wood products -24 226,7 298,2 379,3 343,4 259,7 400
thsd. m3 -22,9 260,6 338 375,1 399,3 286,8 438,2
metals 0 0 0 0 5 43,7 123,2
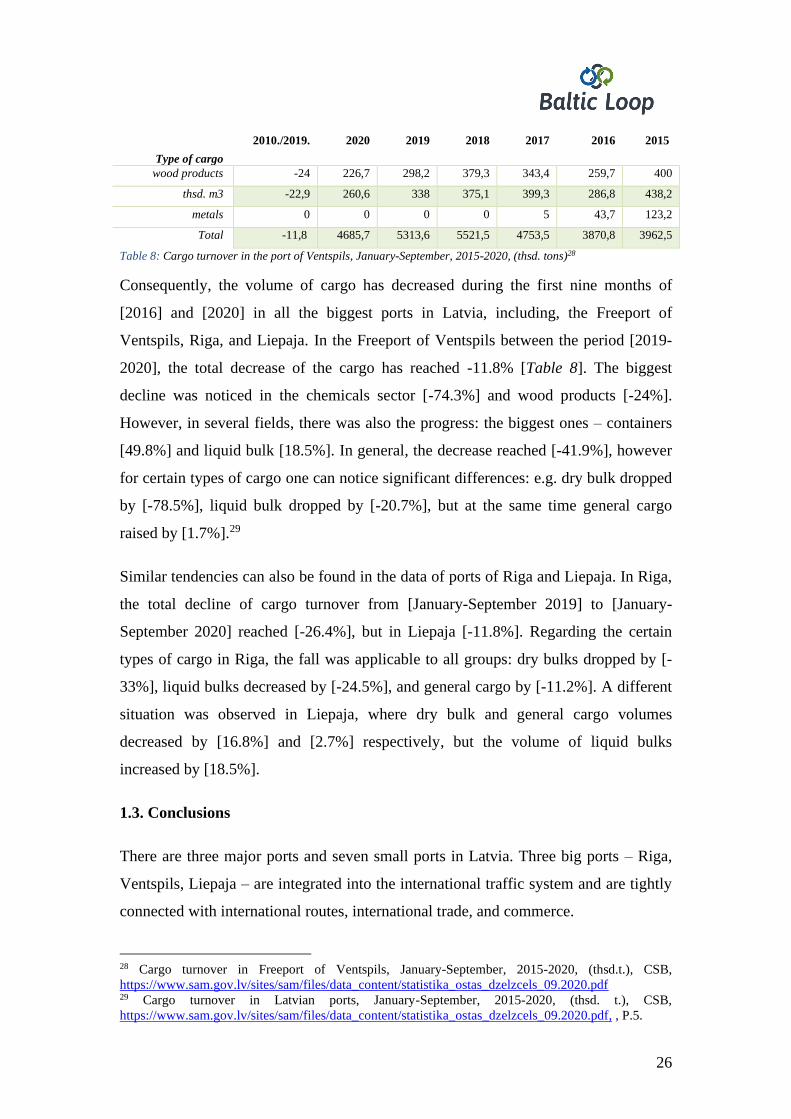
Total -11,8 4685,7 5313,6 5521,5 4753,5 3870,8 3962,5
Table 8: Cargo turnover in the port of Ventspils, January-September, 2015-2020, (thsd. tons)28
Consequently, the volume of cargo has decreased during the first nine months of
[2016] and [2020] in all the biggest ports in Latvia, including, the Freeport of
Ventspils, Riga, and Liepaja. In the Freeport of Ventspils between the period [2019-
2020], the total decrease of the cargo has reached -11.8% [Table 8]. The biggest
decline was noticed in the chemicals sector [-74.3%] and wood products [-24%].
However, in several fields, there was also the progress: the biggest ones – containers
[49.8%] and liquid bulk [18.5%]. In general, the decrease reached [-41.9%], however
for certain types of cargo one can notice significant differences: e.g. dry bulk dropped
by [-78.5%], liquid bulk dropped by [-20.7%], but at the same time general cargo
raised by [1.7%].29
Similar tendencies can also be found in the data of ports of Riga and Liepaja. In Riga,
the total decline of cargo turnover from [January-September 2019] to [January-
September 2020] reached [-26.4%], but in Liepaja [-11.8%]. Regarding the certain
types of cargo in Riga, the fall was applicable to all groups: dry bulks dropped by [-
33%], liquid bulks decreased by [-24.5%], and general cargo by [-11.2%]. A different
situation was observed in Liepaja, where dry bulk and general cargo volumes
decreased by [16.8%] and [2.7%] respectively, but the volume of liquid bulks
increased by [18.5%].
1.3. Conclusions
There are three major ports and seven small ports in Latvia. Three big ports – Riga,
Ventspils, Liepaja – are integrated into the international traffic system and are tightly
connected with international routes, international trade, and commerce.
28 Cargo turnover in Freeport of Ventspils, January-September, 2015-2020, (thsd.t.), CSB,
https://www.sam.gov.lv/sites/sam/files/data_content/statistika_ostas_dzelzcels_09.2020.pdf 29 Cargo turnover in Latvian ports, January-September, 2015-2020, (thsd. t.), CSB,
https://www.sam.gov.lv/sites/sam/files/data_content/statistika_ostas_dzelzcels_09.2020.pdf, , P.5.
27
Latvian ports are participating in international competition with Lithuanian, Estonian,
Russian, and other ports for the cargo overload. Those cargoes are coming mainly
from Russia, however, some part of the cargoes are coming as well from Belarus,
Kazakhstan, and other countries and markets. However, the volume of transit cargoes
in the GDP has been reduced over the years. It happened because of the changes in
Russian policies – more and more Russia overload their cargoes in their ports. Besides
during the last years also the port of Klaipeda has increased its competitiveness.
Therefore lots of Belarusian cargoes went to Lithuania.
28
2. Port infrastructure description
2.1. Port evaluation criteria
The study compared six ports in four countries: the Freeport in Ventspils, the Freeport
in Riga and the Port in Liepaja in Latvia, the Port of Klaipeda in Lithuania, the Port of
Nynäshamn/Norvik (as part of the Port of Stockholm) in Sweden and the Port of
Tallinn in Estonia. All these ports characterising the cargo traffic over the Baltic Sea
between the Baltic States and Sweden and at the same time between Scandinavia and
Belarus, or even more Russia, CIS, and Asia. One should take into account that there
is a permanent connection also between Poland and Sweden and this connection – that
is already out of the frames of the Baltics and the frames of project Baltic Loop – will
be discussed later as well.
The ports are compared by several criteria: total area (in hectares), the total length of
piers, number of piers, the minimum/maximum draft in ports, volume of cargo
transhipped at each port [2019], stevedoring companies operating in ports, number of
terminals, connectivity of the railway with a width of 1520 mm, the connection of
those railways with European railway lines and Belarus, the distance from the port to
the border with Belarus, industrial parks, the connectivity with Rail Baltica30 and
plans for future development.
Apart from the statistics related to port operations, it is important to note that the Port
of Klaipeda has a shorter distance from the port to the border Lithuania-Belarus.
Another differentiating factor is that all the ports handle different types of cargo and
participate in passenger transport to a different extent.
And, finally, one more aspect that characterises the ports, is the railway network and
its connectivity with the ports and the railway in other countries. Latvia, Estonia, and
Lithuania share the same width of rails – 1520 mm. There is no information about the
width of the gauge track in ports on the website of the Port of Stockholm, however,
according to official information, the width of the gauge track is 1435 mm, and there
30 Rail Baltica, https://www.railbaltica.org/
29
is no railway in the Port of the Nynäshamn.31 Sweden also is not involved in the Rail
Baltica traffic network. Nevertheless, Sweden can reach the Rail Baltica through
Finland with whom Sweden has a land border.
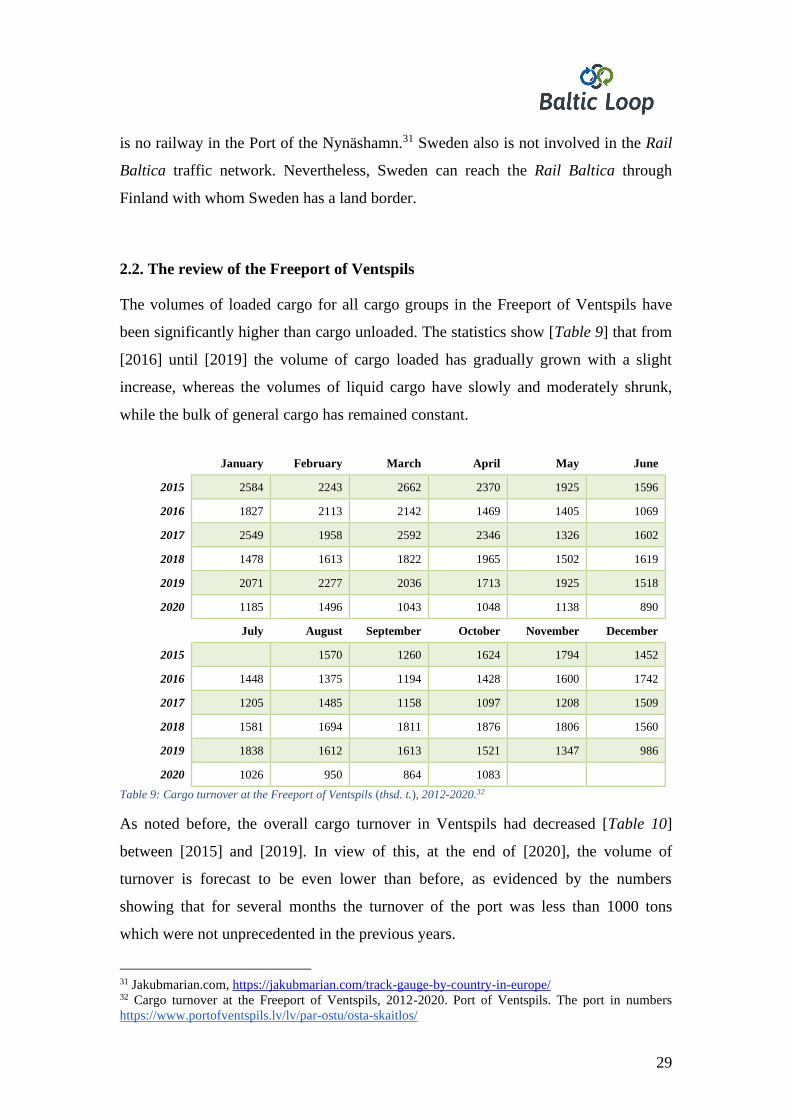
2.2. The review of the Freeport of Ventspils
The volumes of loaded cargo for all cargo groups in the Freeport of Ventspils have
been significantly higher than cargo unloaded. The statistics show [Table 9] that from
[2016] until [2019] the volume of cargo loaded has gradually grown with a slight
increase, whereas the volumes of liquid cargo have slowly and moderately shrunk,
while the bulk of general cargo has remained constant.
January February March April May June
2015 2584 2243 2662 2370 1925 1596
2016 1827 2113 2142 1469 1405 1069
2017 2549 1958 2592 2346 1326 1602
2018 1478 1613 1822 1965 1502 1619
2019 2071 2277 2036 1713 1925 1518
2020 1185 1496 1043 1048 1138 890
July August September October November December
2015 1570 1260 1624 1794 1452
2016 1448 1375 1194 1428 1600 1742
2017 1205 1485 1158 1097 1208 1509
2018 1581 1694 1811 1876 1806 1560
2019 1838 1612 1613 1521 1347 986
2020 1026 950 864 1083
Table 9: Cargo turnover at the Freeport of Ventspils (thsd. t.), 2012-2020.32
As noted before, the overall cargo turnover in Ventspils had decreased [Table 10]
between [2015] and [2019]. In view of this, at the end of [2020], the volume of
turnover is forecast to be even lower than before, as evidenced by the numbers
showing that for several months the turnover of the port was less than 1000 tons
which were not unprecedented in the previous years.
31 Jakubmarian.com, https://jakubmarian.com/track-gauge-by-country-in-europe/ 32 Cargo turnover at the Freeport of Ventspils, 2012-2020. Port of Ventspils. The port in numbers
https://www.portofventspils.lv/lv/par-ostu/osta-skaitlos/
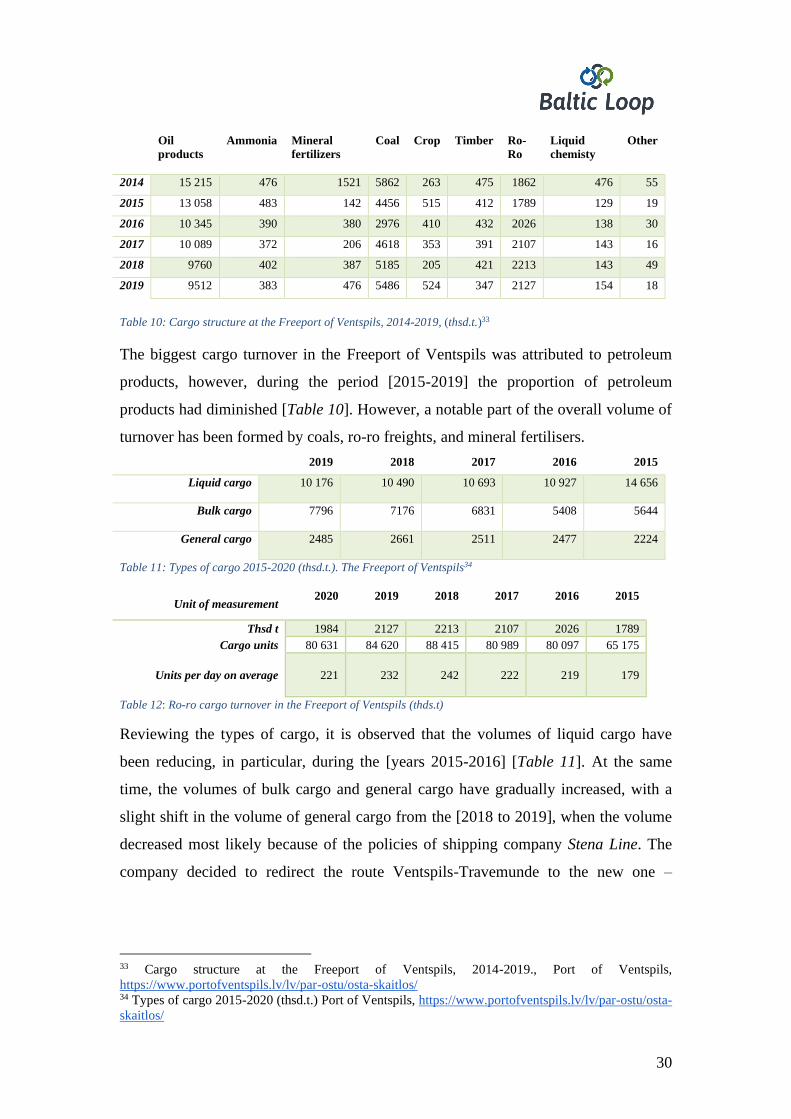
30
Oil
products
Ammonia Mineral
fertilizers
Coal Crop Timber Ro-
Ro
Liquid
chemisty
Other
2014 15 215 476 1521 5862 263 475 1862 476 55
2015 13 058 483 142 4456 515 412 1789 129 19
2016 10 345 390 380 2976 410 432 2026 138 30
2017 10 089 372 206 4618 353 391 2107 143 16
2018 9760 402 387 5185 205 421 2213 143 49
2019 9512 383 476 5486 524 347 2127 154 18
Table 10: Cargo structure at the Freeport of Ventspils, 2014-2019, (thsd.t.)33
The biggest cargo turnover in the Freeport of Ventspils was attributed to petroleum
products, however, during the period [2015-2019] the proportion of petroleum
products had diminished [Table 10]. However, a notable part of the overall volume of
turnover has been formed by coals, ro-ro freights, and mineral fertilisers.
2019 2018 2017 2016 2015
Liquid cargo 10 176 10 490 10 693 10 927
14 656
Bulk cargo 7796 7176 6831 5408
5644
General cargo 2485 2661 2511 2477
2224
Table 11: Types of cargo 2015-2020 (thsd.t.). The Freeport of Ventspils34
Unit of measurement 2020 2019 2018 2017 2016 2015
Thsd t 1984 2127 2213 2107 2026 1789
Cargo units 80 631 84 620 88 415 80 989 80 097 65 175
Units per day on average 221 232 242 222 219 179
Table 12: Ro-ro cargo turnover in the Freeport of Ventspils (thds.t)
Reviewing the types of cargo, it is observed that the volumes of liquid cargo have
been reducing, in particular, during the [years 2015-2016] [Table 11]. At the same
time, the volumes of bulk cargo and general cargo have gradually increased, with a
slight shift in the volume of general cargo from the [2018 to 2019], when the volume
decreased most likely because of the policies of shipping company Stena Line. The
company decided to redirect the route Ventspils-Travemunde to the new one –
33 Cargo structure at the Freeport of Ventspils, 2014-2019., Port of Ventspils,
https://www.portofventspils.lv/lv/par-ostu/osta-skaitlos/ 34 Types of cargo 2015-2020 (thsd.t.) Port of Ventspils, https://www.portofventspils.lv/lv/par-ostu/osta-
skaitlos/
31
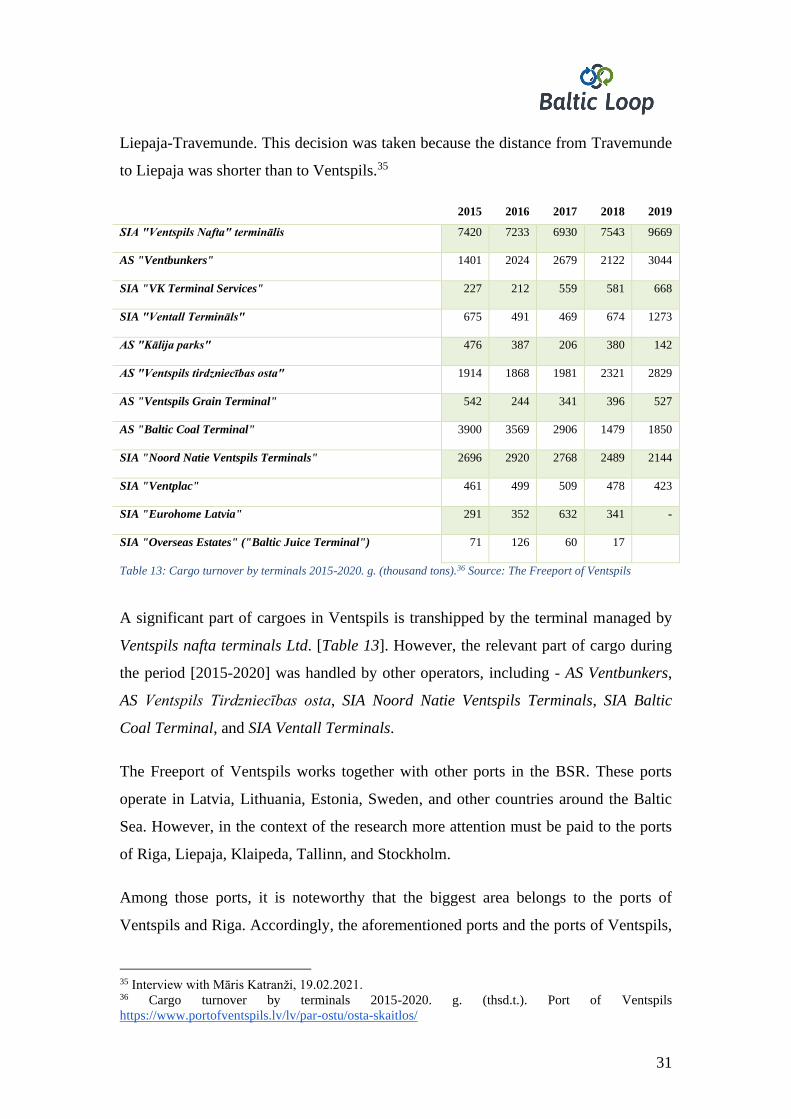
Liepaja-Travemunde. This decision was taken because the distance from Travemunde
to Liepaja was shorter than to Ventspils.35
2015 2016 2017 2018 2019
SIA "Ventspils Nafta" terminālis 7420 7233 6930 7543
9669
AS "Ventbunkers" 1401 2024 2679 2122
3044
SIA "VK Terminal Services" 227 212 559 581
668
SIA "Ventall Termināls" 675 491 469 674
1273
AS "Kālija parks" 476 387 206 380
142
AS "Ventspils tirdzniecības osta" 1914 1868 1981 2321
2829
AS "Ventspils Grain Terminal" 542 244 341 396
527
AS "Baltic Coal Terminal" 3900 3569 2906 1479
1850
SIA "Noord Natie Ventspils Terminals" 2696 2920 2768 2489
2144
SIA "Ventplac" 461 499 509 478
423
SIA "Eurohome Latvia" 291 352 632 341
-
SIA "Overseas Estates" ("Baltic Juice Terminal") 71 126 60 17
Table 13: Cargo turnover by terminals 2015-2020. g. (thousand tons).36 Source: The Freeport of Ventspils
A significant part of cargoes in Ventspils is transhipped by the terminal managed by
Ventspils nafta terminals Ltd. [Table 13]. However, the relevant part of cargo during
the period [2015-2020] was handled by other operators, including - AS Ventbunkers,
AS Ventspils Tirdzniecības osta, SIA Noord Natie Ventspils Terminals, SIA Baltic
Coal Terminal, and SIA Ventall Terminals.
The Freeport of Ventspils works together with other ports in the BSR. These ports
operate in Latvia, Lithuania, Estonia, Sweden, and other countries around the Baltic
Sea. However, in the context of the research more attention must be paid to the ports
of Riga, Liepaja, Klaipeda, Tallinn, and Stockholm.
Among those ports, it is noteworthy that the biggest area belongs to the ports of
Ventspils and Riga. Accordingly, the aforementioned ports and the ports of Ventspils,
35 Interview with Māris Katranži, 19.02.2021. 36 Cargo turnover by terminals 2015-2020. g. (thsd.t.). Port of Ventspils
https://www.portofventspils.lv/lv/par-ostu/osta-skaitlos/
32
Riga, and also Klaipeda operate the longest piers and the greatest number of piers.
Regarding the terminals, it must be mentioned that all the ports operate passenger
terminals and all the ports reload containers and other kinds of cargo. Overall the
quality of the infrastructure of the Freeport of Ventspils corresponds to the European
standards and both – infrastructure and experts who are working there – are at a high
level37.
2.3. The review of other ports around BSR
Among other things, the ports of the Baltic States are distinguished by the fact that
they are dominated by shipped cargo over the received exported cargo over the
imported cargo. This can be explained by the fact that most of the cargoes from
Russia and other CIS countries are sent to the West via Latvia and other BSR
countries. In this context Lithuania has actively worked with Belarus and the port of
Klaipeda to approve an ambitious development plan for the next 25 years. Therefore
the connection between the Klaipeda and Belarus demands special attention.
However, the relationships between Lithuania and Belarus have been overshadowed
by the conflict over the nuclear power plant of Astravets.38 Nevertheless, the port of
Klaipeda also plays a serious role for the Freeport of Ventspils as a competitor also in
a term of the route from Klaipeda-Karlskrona.39
The government of Lithuania has declared a resolution that creates the necessary
conditions for Klaipeda State Seaport Authority to invest in port infrastructure, which
would be used for the production, assembly, and storage of wind turbine parts and
other components meant for Lithuania and close region. This policy does not directly
stem from the relationship between Lithuanian and Belarus, however, it clearly shows
the attempts to expand the business opportunities in Klaipeda Port. The investment
will also lead to the creation of new jobs, according to the government, as
approximately EUR [483 million] are planned to be invested into the expansion of the
port of Klaipeda from [2021] to [2024], with EU co-financing. Most of it will be
37 Interview with Oskars Osis, 19.02.2021. 38
„Skaitļi un fakti: Eiropas ostās kravu apjomi aug, Latvijā – ne”, Ukenābele, I., www.lsm.lv,
https://www.lsm.lv/raksts/zinas/ekonomika/skaitli-un-fakti-eiropas-ostas-kravu-apjomi-aug-latvija-
ne.a345485/ 21.01.2020. 39 The interview with Oskars Osis, 19.02.2021.
33
invested in construction and reconstruction projects of the quays and dredging
works.40
The example of the cooperation between the port of Klaipeda and the Lithuanian
government shows the way how the ports around the Baltics are searching and can
find new ways of development and opportunities to work in new business fields.
Other ports that play a significant role in the BSR are the ports of Riga and Liepaja in
Latvia and Tallinn in Estonia. As noted before, the ports of Riga and Liepaja together
with Ventspils share a significant part of the total cargo turnover in Latvia. In turn, the
port of Tallinn consists of several harbours around Tallinn and other parts of Estonia.
For more detailed information about the ports in BSR see Appendix 2.
2.4. Conclusions
Here, in this research, six ports around the Baltic Sea are compared to each other.
Including them is the Freeport of Ventspils, the Freeport of Riga and the port of
Liepaja, the port of Klaipeda, the port of Nynäshamn/Norvik, and the port of Tallinn.
The ports are compared by using different kinds of things that characterise the ports.
Including them are such criteria as total area, the total length of piers, number of piers,
the minimum/maximum draft in ports, volume of cargo transhipped at each port,
stevedoring companies operating in ports, number of terminals and connectivity,
industrial parks. These factors characterise the port operations, diversity,
characteristics, probably also perspective.
40 „Lithuanian Government Sets Stage for Klaipeda Port Offshore Wind Upgrade”, Buljan, A.,
https://www.offshorewind.biz/2020/12/03/lithuanian-government-sets-stage-for-klaipeda-port-
offshore-wind-upgrade/, 03.12.2020.
34
3. The significance of Belarusian transit
3.1. The cooperation in transit business between Belarus, Latvia and Sweden
According to experts from Armstrong&Associates, the global logistics market is
estimated at [7.84 trillion euros] and accounts for about [12%] of world GDP, while
the volume of the global transport market is [5.07 trillion euros], which is equivalent
to [8%] of world GDP. At the same time, the share of the transport and logistics sector
in the global GDP, as well as in the GDP of the EU countries, is about [20%], and in
the GDP of the Euroasian Economic Union (EAEU) countries – about [12%]. Also,
the transport sector provides about [8%] of global employment.41
The Republic of Belarus is located at the crossroads of several international transport
corridors connecting the states of Western Europe with the East, regions of the Black
Sea coast with the countries of the BSR. Over 100 million tons of European cargoes
annually cross the country, of which about [90%] are between Russia and the EU.
Moreover, the republic in most cases ensures an efficient and safe option of transit.
Transport services are provided by rail, road, air, inland waterways, and pipelines.
However, it should be noted that the transport potential of Belarus has not been fully
realised: according to the National Agency for Investment and Privatisation of
Belarus, transport corridors in the country are used by no more than [25-40%] of their
real capacity.42
The territory of the republic is crossed by two international trans-European transport
corridors (according to the international classification): number II (West-East): Berlin
- Poznan - Warsaw - Minsk - Moscow - Nizhny Novgorod; - number IX (North-
South): (Helsinki - St. Petersburg - Pskov - Gomel - Kyiv - Odesa) with a branch IX B
(Klaipeda / Kaliningrad - Vilnius - Minsk - Gomel). The market of transport and
logistics services is important for the economy of Belarus: in [2019], [41.7%] of
exports of services were formed by transport and logistics services, the share of which
in the export of services decreased by 2.7 percentage points relative to the level of
[2018]. Transport and logistics services showed an increase of [9.4%] compared to
41 „Развитие грузопотоков между республикой Беларусь и Латвийской республикой.
Углубленный анализ Беларусского бизнеса на предмет релокации в Латвию”, Маркетинговое
исследование, „Aser”, 2020, P.4 42 Ibid, P. 4.-5.
35
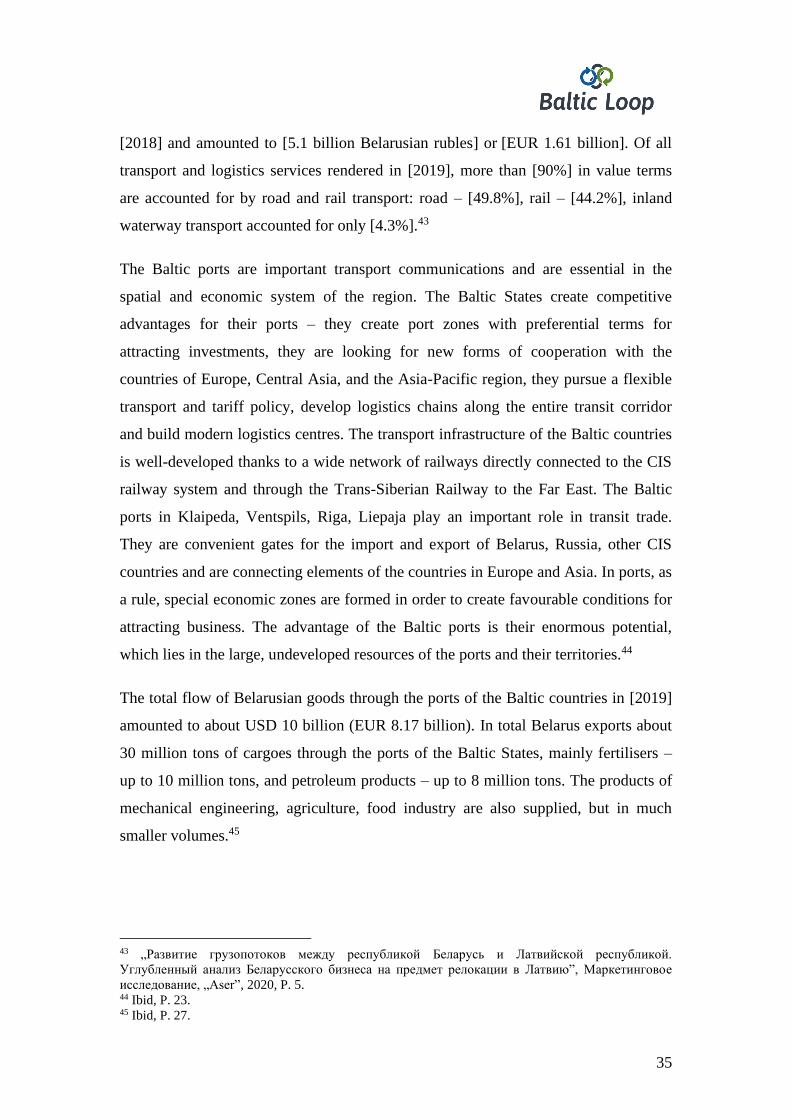
[2018] and amounted to [5.1 billion Belarusian rubles] or [EUR 1.61 billion]. Of all
transport and logistics services rendered in [2019], more than [90%] in value terms
are accounted for by road and rail transport: road – [49.8%], rail – [44.2%], inland
waterway transport accounted for only [4.3%].43
The Baltic ports are important transport communications and are essential in the
spatial and economic system of the region. The Baltic States create competitive
advantages for their ports – they create port zones with preferential terms for
attracting investments, they are looking for new forms of cooperation with the
countries of Europe, Central Asia, and the Asia-Pacific region, they pursue a flexible
transport and tariff policy, develop logistics chains along the entire transit corridor
and build modern logistics centres. The transport infrastructure of the Baltic countries
is well-developed thanks to a wide network of railways directly connected to the CIS
railway system and through the Trans-Siberian Railway to the Far East. The Baltic
ports in Klaipeda, Ventspils, Riga, Liepaja play an important role in transit trade.
They are convenient gates for the import and export of Belarus, Russia, other CIS
countries and are connecting elements of the countries in Europe and Asia. In ports, as
a rule, special economic zones are formed in order to create favourable conditions for
attracting business. The advantage of the Baltic ports is their enormous potential,
which lies in the large, undeveloped resources of the ports and their territories.44
The total flow of Belarusian goods through the ports of the Baltic countries in [2019]
amounted to about USD 10 billion (EUR 8.17 billion). In total Belarus exports about
30 million tons of cargoes through the ports of the Baltic States, mainly fertilisers –
up to 10 million tons, and petroleum products – up to 8 million tons. The products of
mechanical engineering, agriculture, food industry are also supplied, but in much
smaller volumes.45
43 „Развитие грузопотоков между республикой Беларусь и Латвийской республикой.
Углубленный анализ Беларусского бизнеса на предмет релокации в Латвию”, Маркетинговое
исследование, „Aser”, 2020, P. 5. 44 Ibid, P. 23. 45 Ibid, P. 27.
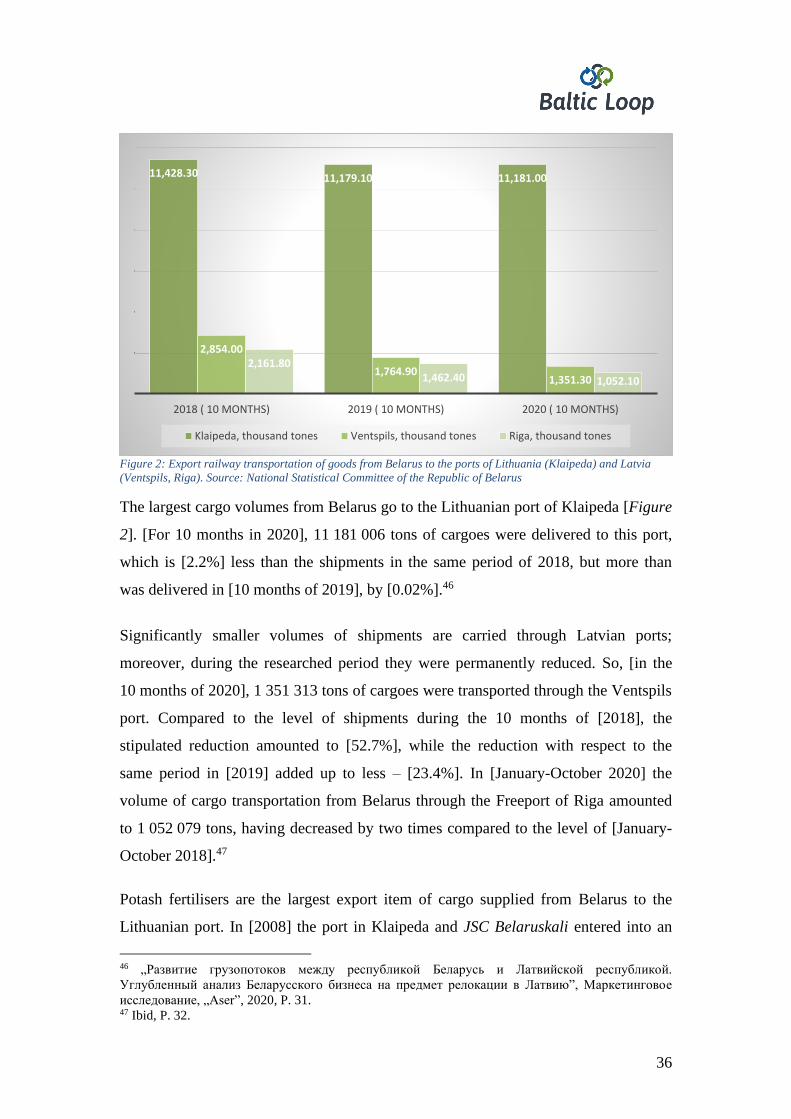
36
Figure 2: Export railway transportation of goods from Belarus to the ports of Lithuania (Klaipeda) and Latvia
(Ventspils, Riga). Source: National Statistical Committee of the Republic of Belarus
The largest cargo volumes from Belarus go to the Lithuanian port of Klaipeda [Figure
2]. [For 10 months in 2020], 11 181 006 tons of cargoes were delivered to this port,
which is [2.2%] less than the shipments in the same period of 2018, but more than
was delivered in [10 months of 2019], by [0.02%].46
Significantly smaller volumes of shipments are carried through Latvian ports;
moreover, during the researched period they were permanently reduced. So, [in the
10 months of 2020], 1 351 313 tons of cargoes were transported through the Ventspils
port. Compared to the level of shipments during the 10 months of [2018], the
stipulated reduction amounted to [52.7%], while the reduction with respect to the
same period in [2019] added up to less – [23.4%]. In [January-October 2020] the
volume of cargo transportation from Belarus through the Freeport of Riga amounted
to 1 052 079 tons, having decreased by two times compared to the level of [January-
October 2018].47
Potash fertilisers are the largest export item of cargo supplied from Belarus to the
Lithuanian port. In [2008] the port in Klaipeda and JSC Belaruskali entered into an
46 „Развитие грузопотоков между республикой Беларусь и Латвийской республикой.
Углубленный анализ Беларусского бизнеса на предмет релокации в Латвию”, Маркетинговое
исследование, „Aser”, 2020, P. 31. 47 Ibid, P. 32.
11,428.30 11,179.10 11,181.00
2,854.00
1,764.901,351.30
2,161.801,462.40 1,052.10
2018 ( 10 MONTHS) 2019 ( 10 MONTHS) 2020 ( 10 MONTHS)
Klaipeda, thousand tones Ventspils, thousand tones Riga, thousand tones
37
agreement under which Lithuanian port companies began to apply competitive tariffs
for the transhipment of Belarusian mineral fertilisers through their terminals. At the
same time, stevedores and Belarusian cargo owners also began to conclude long-term
contracts for the transhipment of this cargo group in the port, which became an
additional advantage of the Lithuanian transit corridor. In April [2013], Belaruskali
completed the purchase of a 30% stake in the BKT (JSC Biriu Kroviniu Terminalas or
Bulk Cargo Terminal, owns a bulk cargo terminal in the port of Klaipeda). The
successful implementation of the joint logistics project Soligorsk-Klaipeda helped
ОАО Белору́сская кали́йная компа́ния (Belarusian Potash Company, BKK) to
increase its export efficiency by optimising logistics thus becoming one of the world’s
leaders in potash fertiliser sales in [2014], including making a major breakthrough in
increasing container traffic in the corridor.48
In addition, in [2015], BKK became the main shareholder of the Lithuanian company
Fertimara (established in [2004]), which is engaged in agency services in the port of
Klaipeda and chartering of ships, as well as providing transport and forwarding
services. The deal is also in line with BKK’s strategy of delivering products
efficiently “to the customer’s doorstep” using predominantly CFR (cost and freight) /
CIF (cost, insurance, and freight) delivery bases in its sales. BKK is now developing
Fertimara as its preferred shipbroker, which allows it to gain additional benefits and
revenues in the field of freight. Thus, today, when supplying Belarusian potassium
chloride through the port of Klaipeda, all links of the logistics chain work in one
bundle: manufacturer, seller, stevedore, shipping agent, broker, as well as the
Belarusian and Lithuanian railways [LG].49
48 „Развитие грузопотоков между республикой Беларусь и Латвийской республикой.
Углубленный анализ Беларусского бизнеса на предмет релокации в Латвию”, Маркетинговое
исследование, „Aser”, 2020, P. 33. 49 Ibid, P.33.
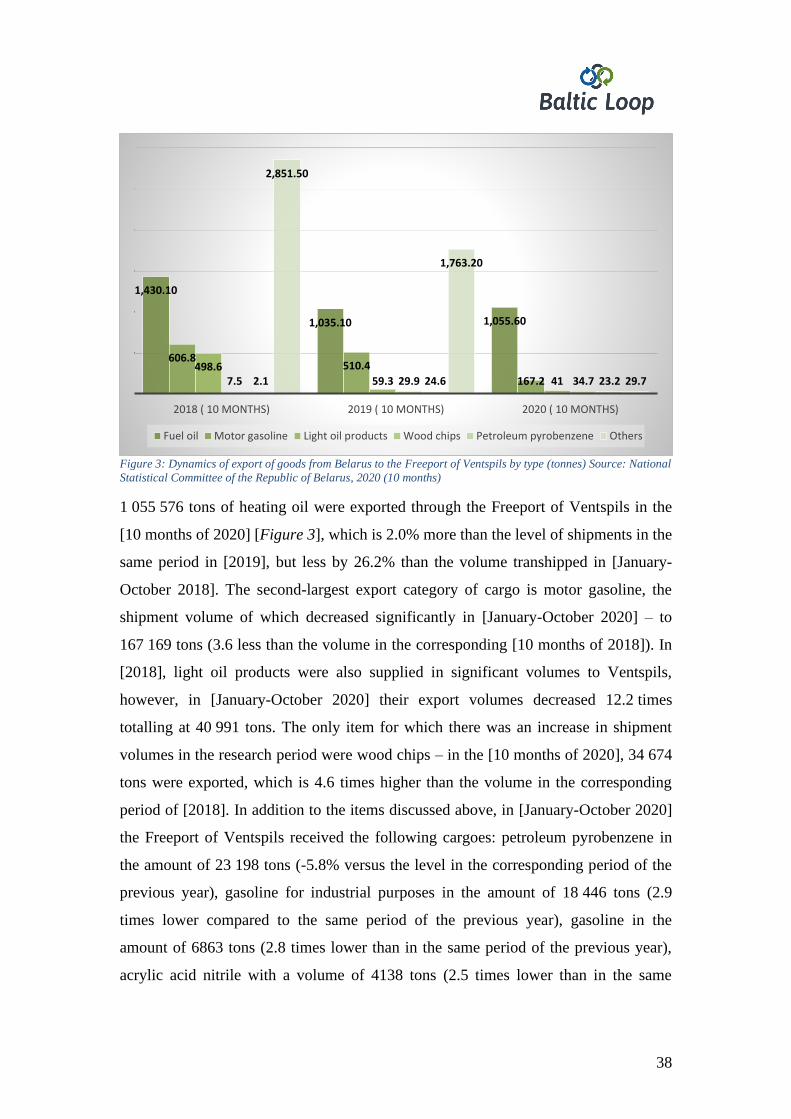
38
Figure 3: Dynamics of export of goods from Belarus to the Freeport of Ventspils by type (tonnes) Source: National
Statistical Committee of the Republic of Belarus, 2020 (10 months)
1 055 576 tons of heating oil were exported through the Freeport of Ventspils in the
[10 months of 2020] [Figure 3], which is 2.0% more than the level of shipments in the
same period in [2019], but less by 26.2% than the volume transhipped in [January-
October 2018]. The second-largest export category of cargo is motor gasoline, the
shipment volume of which decreased significantly in [January-October 2020] – to
167 169 tons (3.6 less than the volume in the corresponding [10 months of 2018]). In
[2018], light oil products were also supplied in significant volumes to Ventspils,
however, in [January-October 2020] their export volumes decreased 12.2 times
totalling at 40 991 tons. The only item for which there was an increase in shipment
volumes in the research period were wood chips – in the [10 months of 2020], 34 674
tons were exported, which is 4.6 times higher than the volume in the corresponding
period of [2018]. In addition to the items discussed above, in [January-October 2020]
the Freeport of Ventspils received the following cargoes: petroleum pyrobenzene in
the amount of 23 198 tons (-5.8% versus the level in the corresponding period of the
previous year), gasoline for industrial purposes in the amount of 18 446 tons (2.9
times lower compared to the same period of the previous year), gasoline in the
amount of 6863 tons (2.8 times lower than in the same period of the previous year),
acrylic acid nitrile with a volume of 4138 tons (2.5 times lower than in the same
1,430.10
1,035.10 1,055.60
606.8510.4
167.2498.6
59.3 417.5 29.9 34.72.1 24.6 23.2
2,851.50
1,763.20
29.7
2018 ( 10 MONTHS) 2019 ( 10 MONTHS) 2020 ( 10 MONTHS)
Fuel oil Motor gasoline Light oil products Wood chips Petroleum pyrobenzene Others
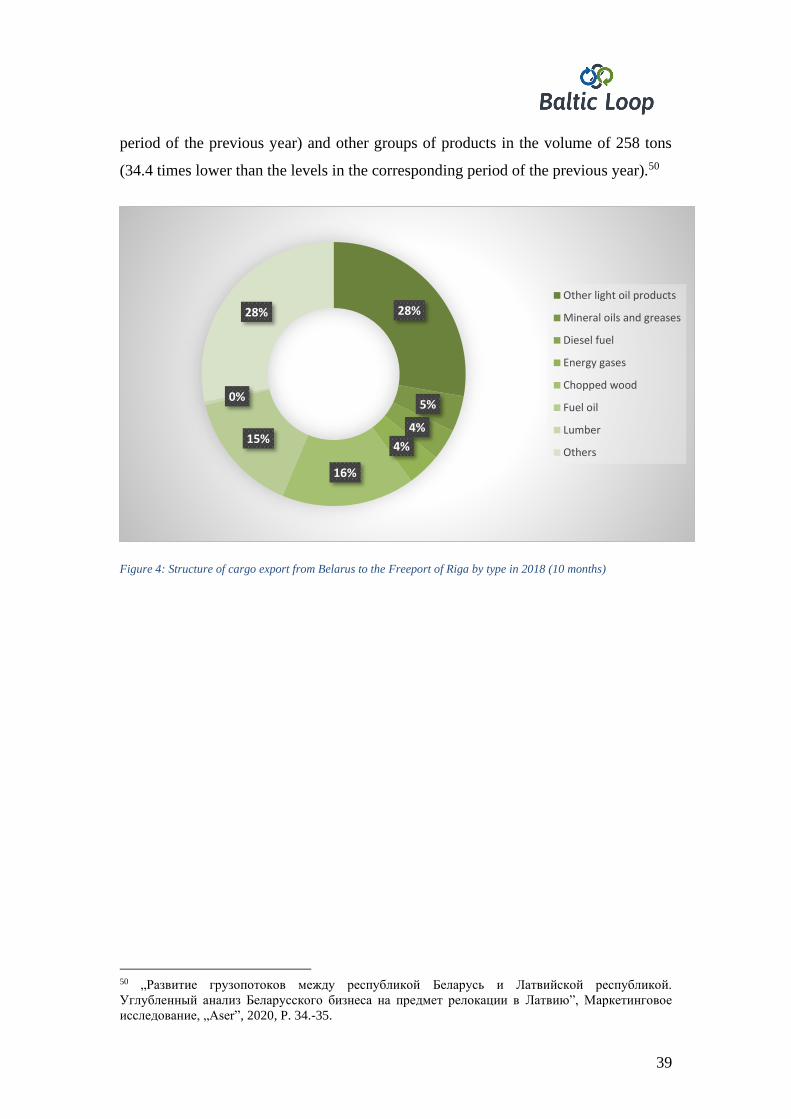
39
period of the previous year) and other groups of products in the volume of 258 tons
(34.4 times lower than the levels in the corresponding period of the previous year).50
Figure 4: Structure of cargo export from Belarus to the Freeport of Riga by type in 2018 (10 months)
50 „Развитие грузопотоков между республикой Беларусь и Латвийской республикой.
Углубленный анализ Беларусского бизнеса на предмет релокации в Латвию”, Маркетинговое
исследование, „Aser”, 2020, P. 34.-35.
28%
5%
4%
4%
16%
15%
0%
28%
Other light oil products
Mineral oils and greases
Diesel fuel
Energy gases
Chopped wood
Fuel oil
Lumber
Others
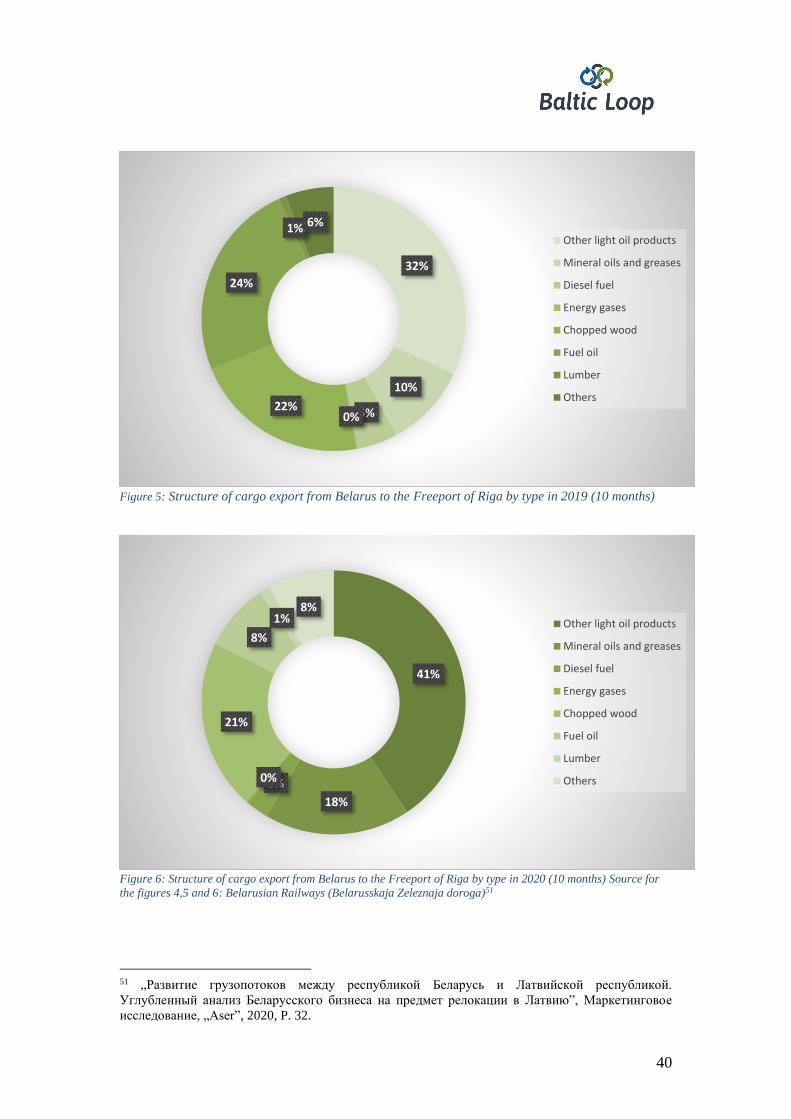
40
Figure 5: Structure of cargo export from Belarus to the Freeport of Riga by type in 2019 (10 months)
Figure 6: Structure of cargo export from Belarus to the Freeport of Riga by type in 2020 (10 months) Source for
the figures 4,5 and 6: Belarusian Railways (Belarusskaja Zeleznaja doroga)51
51 „Развитие грузопотоков между республикой Беларусь и Латвийской республикой.
Углубленный анализ Беларусского бизнеса на предмет релокации в Латвию”, Маркетинговое
исследование, „Aser”, 2020, P. 32.
32%
10%
5%0%22%
24%
1% 6%
Other light oil products
Mineral oils and greases
Diesel fuel
Energy gases
Chopped wood
Fuel oil
Lumber
Others
41%
18%
3%0%
21%
8%
1%8%
Other light oil products
Mineral oils and greases
Diesel fuel
Energy gases
Chopped wood
Fuel oil
Lumber
Others
41
The largest export items delivered from Belarus to the Latvian Freeport of Riga are
other light oil products [Figures 4, 5, and 6], the received volume of which in
[January-October 2020] amounted to 427 242 tons, or [40.6%] of the total export
volume. Despite the increase in the share of light petrol against the total volumes in
[2020], in physical terms during the 10 months of [2020], Riga received [8.3%] less
product than in [January-October 2019] – 427 242 tons. The second-largest export
item is shredded wood - [20.8%] of the total export volume (0.7 percentage points
compared to the same period of last year) in [January-October 2020]. During the [10
months of 2020], 219 001 tons of chopped wood was delivered from Belarus to the
Freeport of Riga, which is [37.8%] less than the amount received in the same period
in [2018]. Cargo items the volumes of which grew significantly in the research period
are mineral oils and lubricants, with an export volume through the Freeport of Riga in
[January-October 2020] of 187 834 tons, and an increase by almost two times
compared to the corresponding period of [2018]. The share of this position in the total
volume of cargoes also grew soundly and amounted to [17.9%] in [January-October
2020], having increased by 13.5 percentage points compared to the same period in
2017. Another product supplied to the Freeport of Riga in a significant amount from
Belarus within 10 months was fuel oil. In [2020] the volume of exports of this product
added up to 87 323 tons, which was still 3.7 times lower compared to the volume in
the same period of [2017].52
In addition to the above items, the following cargo groups were exported from
Belarus through the Freeport of Riga in [January-October 2020]: diesel fuel in the
amount of 29 447 tons (2.4 times less than in the same period of [2019]), sawn timber
with a volume of 13 484 tons (2.4% less than in the same period of [2019]), energy
gases in the amount of 2522 tons (22.9% less than in the same period of [2019]) and
other products in the amount of 85 226 tons (16.8% more than in the same period of
2019). According to the owner of the Freeport of Riga, the decline in supplies from
Belarus for key items (oil products, in particular, fuel oil) is retrospective.53
52 „Развитие грузопотоков между республикой Беларусь и Латвийской республикой.
Углубленный анализ Беларусского бизнеса на предмет релокации в Латвию”, Маркетинговое
исследование, „Aser”, 2020, P. 36. 53 Ibid, P. 36.
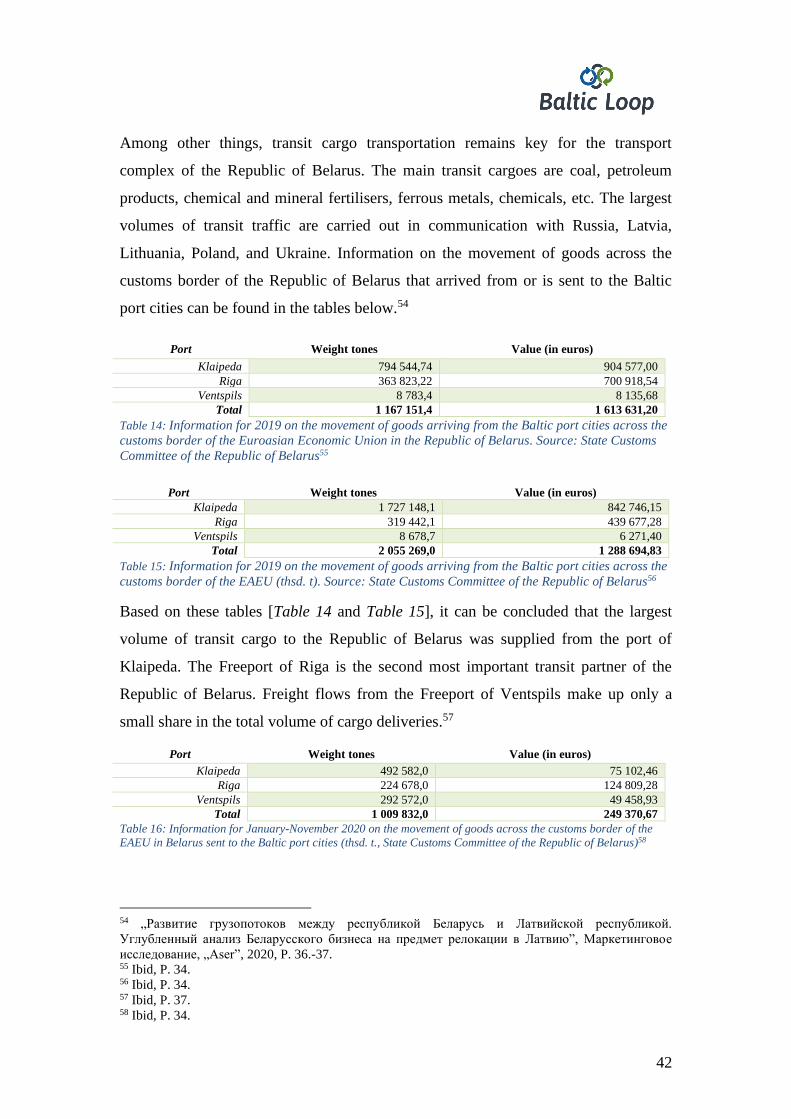
42
Among other things, transit cargo transportation remains key for the transport
complex of the Republic of Belarus. The main transit cargoes are coal, petroleum
products, chemical and mineral fertilisers, ferrous metals, chemicals, etc. The largest
volumes of transit traffic are carried out in communication with Russia, Latvia,
Lithuania, Poland, and Ukraine. Information on the movement of goods across the
customs border of the Republic of Belarus that arrived from or is sent to the Baltic
port cities can be found in the tables below.54
Port Weight tones Value (in euros)
Klaipeda 794 544,74 904 577,00
Riga 363 823,22 700 918,54
Ventspils 8 783,4 8 135,68
Total 1 167 151,4 1 613 631,20
Table 14: Information for 2019 on the movement of goods arriving from the Baltic port cities across the
customs border of the Euroasian Economic Union in the Republic of Belarus. Source: State Customs
Committee of the Republic of Belarus55
Port Weight tones Value (in euros)
Klaipeda 1 727 148,1 842 746,15
Riga 319 442,1 439 677,28
Ventspils 8 678,7 6 271,40
Total 2 055 269,0 1 288 694,83
Table 15: Information for 2019 on the movement of goods arriving from the Baltic port cities across the
customs border of the EAEU (thsd. t). Source: State Customs Committee of the Republic of Belarus56
Based on these tables [Table 14 and Table 15], it can be concluded that the largest
volume of transit cargo to the Republic of Belarus was supplied from the port of
Klaipeda. The Freeport of Riga is the second most important transit partner of the
Republic of Belarus. Freight flows from the Freeport of Ventspils make up only a
small share in the total volume of cargo deliveries.57
Port Weight tones Value (in euros)
Klaipeda 492 582,0 75 102,46
Riga 224 678,0 124 809,28
Ventspils 292 572,0 49 458,93
Total 1 009 832,0 249 370,67
Table 16: Information for January-November 2020 on the movement of goods across the customs border of the
EAEU in Belarus sent to the Baltic port cities (thsd. t., State Customs Committee of the Republic of Belarus)58
54 „Развитие грузопотоков между республикой Беларусь и Латвийской республикой.
Углубленный анализ Беларусского бизнеса на предмет релокации в Латвию”, Маркетинговое
исследование, „Aser”, 2020, P. 36.-37. 55 Ibid, P. 34. 56 Ibid, P. 34. 57 Ibid, P. 37. 58 Ibid, P. 34.
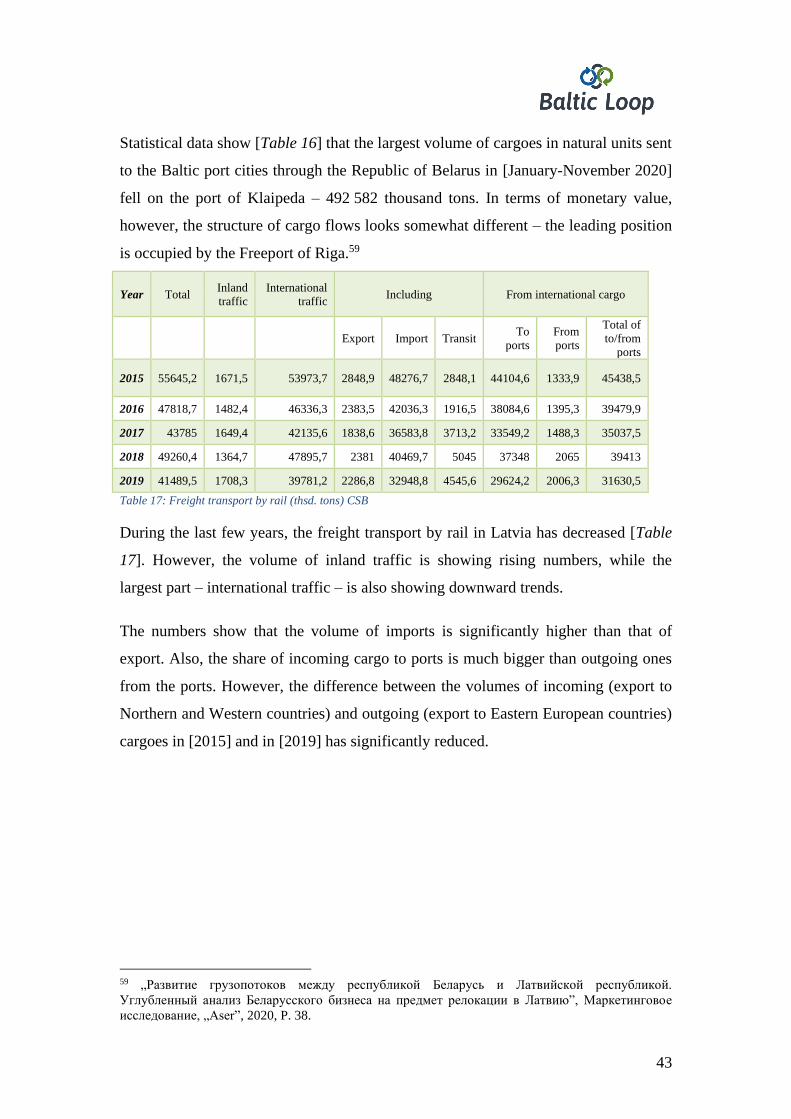
43
Statistical data show [Table 16] that the largest volume of cargoes in natural units sent
to the Baltic port cities through the Republic of Belarus in [January-November 2020]
fell on the port of Klaipeda – 492 582 thousand tons. In terms of monetary value,
however, the structure of cargo flows looks somewhat different – the leading position
is occupied by the Freeport of Riga.59
Year Total Inland
traffic
International
traffic Including From international cargo
Export Import Transit To
ports
From
ports
Total of
to/from
ports
2015 55645,2 1671,5 53973,7 2848,9 48276,7 2848,1 44104,6 1333,9 45438,5
2016 47818,7 1482,4 46336,3 2383,5 42036,3 1916,5 38084,6 1395,3 39479,9
2017 43785 1649,4 42135,6 1838,6 36583,8 3713,2 33549,2 1488,3 35037,5
2018 49260,4 1364,7 47895,7 2381 40469,7 5045 37348 2065 39413
2019 41489,5 1708,3 39781,2 2286,8 32948,8 4545,6 29624,2 2006,3 31630,5
Table 17: Freight transport by rail (thsd. tons) CSB
During the last few years, the freight transport by rail in Latvia has decreased [Table
17]. However, the volume of inland traffic is showing rising numbers, while the
largest part – international traffic – is also showing downward trends.
The numbers show that the volume of imports is significantly higher than that of
export. Also, the share of incoming cargo to ports is much bigger than outgoing ones
from the ports. However, the difference between the volumes of incoming (export to
Northern and Western countries) and outgoing (export to Eastern European countries)
cargoes in [2015] and in [2019] has significantly reduced.
59 „Развитие грузопотоков между республикой Беларусь и Латвийской республикой.
Углубленный анализ Беларусского бизнеса на предмет релокации в Латвию”, Маркетинговое
исследование, „Aser”, 2020, P. 38.
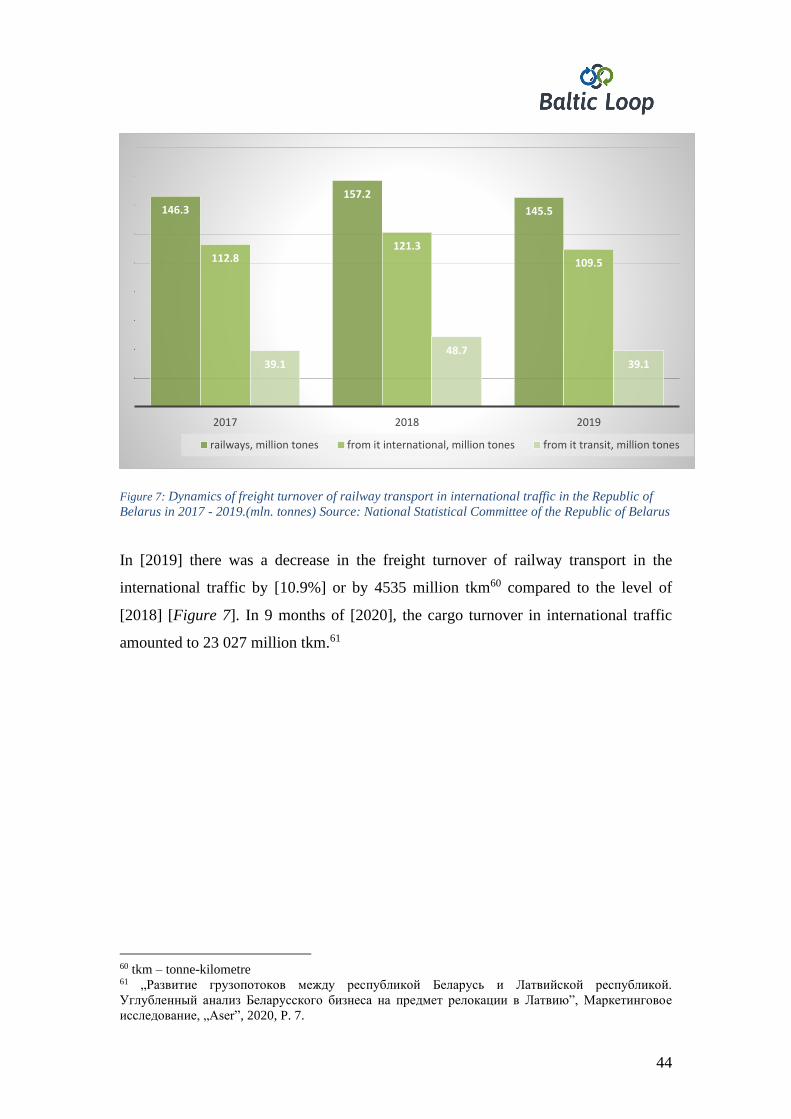
44
Figure 7: Dynamics of freight turnover of railway transport in international traffic in the Republic of
Belarus in 2017 - 2019.(mln. tonnes) Source: National Statistical Committee of the Republic of Belarus
In [2019] there was a decrease in the freight turnover of railway transport in the
international traffic by [10.9%] or by 4535 million tkm60 compared to the level of
[2018] [Figure 7]. In 9 months of [2020], the cargo turnover in international traffic
amounted to 23 027 million tkm.61
60 tkm – tonne-kilometre 61 „Развитие грузопотоков между республикой Беларусь и Латвийской республикой.
Углубленный анализ Беларусского бизнеса на предмет релокации в Латвию”, Маркетинговое
исследование, „Aser”, 2020, P. 7.
146.3
157.2
145.5
112.8121.3
109.5
39.148.7
39.1
2017 2018 2019
railways, million tones from it international, million tones from it transit, million tones
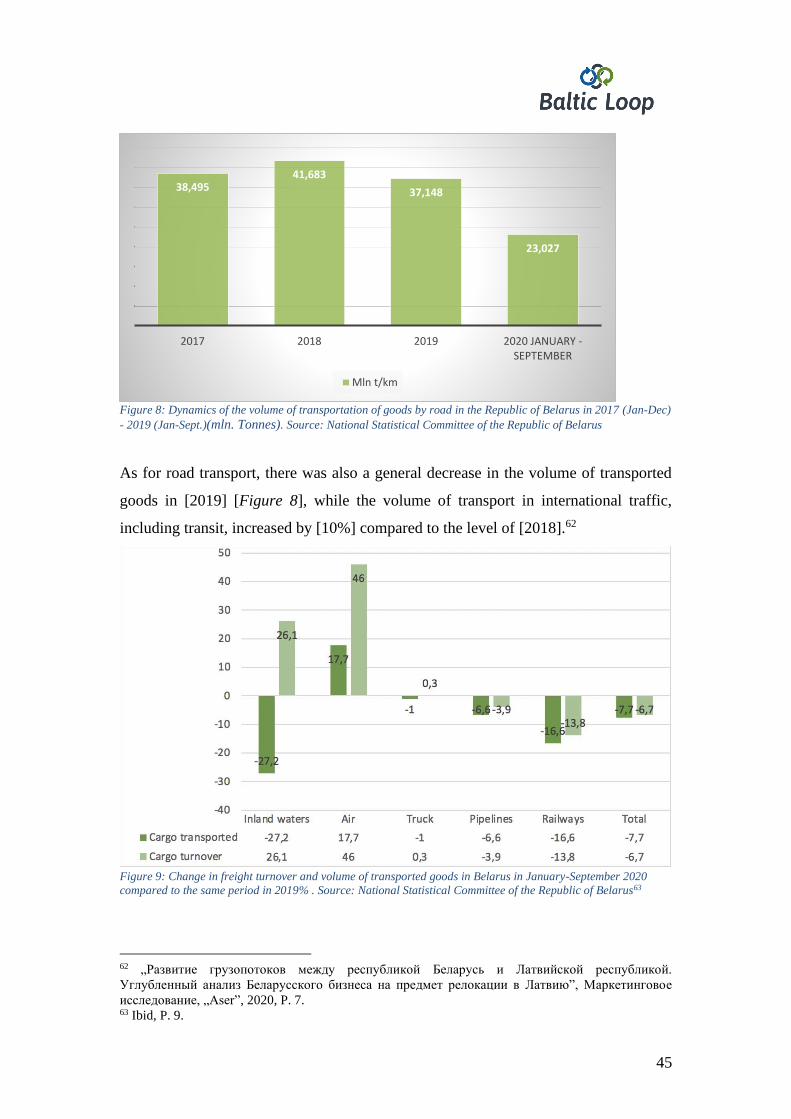
45
Figure 8: Dynamics of the volume of transportation of goods by road in the Republic of Belarus in 2017 (Jan-Dec)
- 2019 (Jan-Sept.)(mln. Tonnes). Source: National Statistical Committee of the Republic of Belarus
As for road transport, there was also a general decrease in the volume of transported
goods in [2019] [Figure 8], while the volume of transport in international traffic,
including transit, increased by [10%] compared to the level of [2018].62
Figure 9: Change in freight turnover and volume of transported goods in Belarus in January-September 2020
compared to the same period in 2019% . Source: National Statistical Committee of the Republic of Belarus63
62 „Развитие грузопотоков между республикой Беларусь и Латвийской республикой.
Углубленный анализ Беларусского бизнеса на предмет релокации в Латвию”, Маркетинговое
исследование, „Aser”, 2020, P. 7. 63 Ibid, P. 9.
38,49541,683
37,148
23,027
2017 2018 2019 2020 JANUARY -SEPTEMBER
Mln t/km
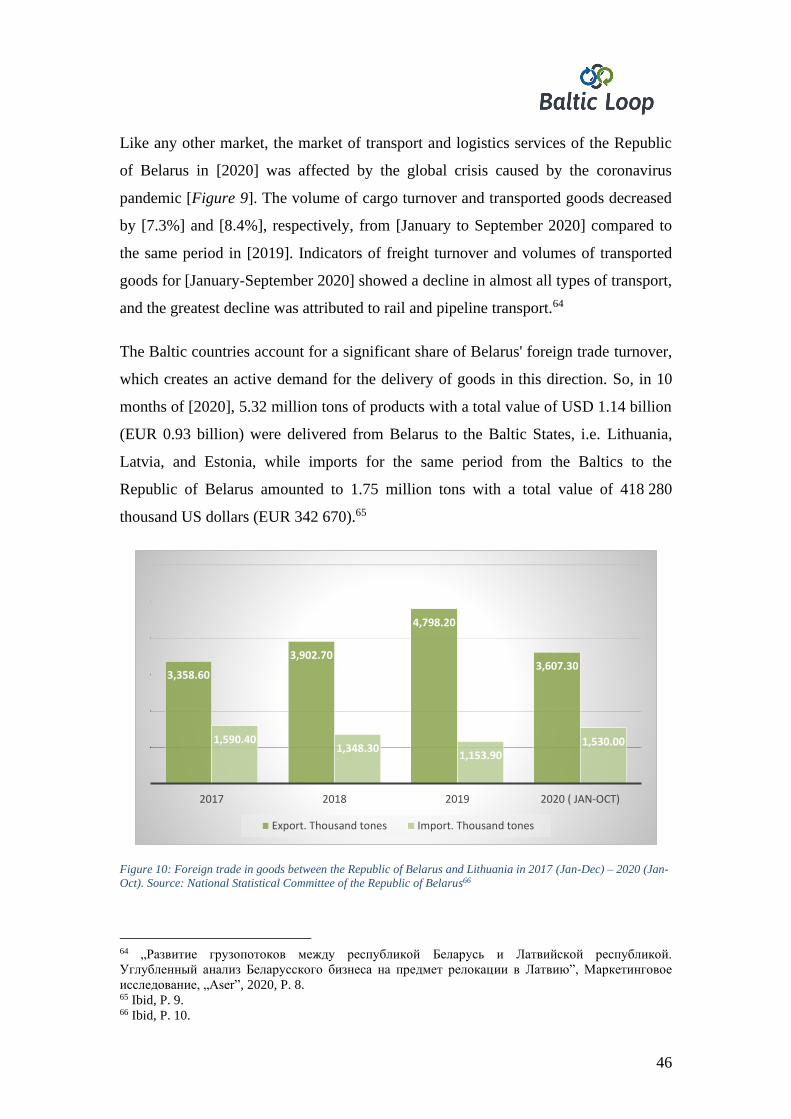
46
Like any other market, the market of transport and logistics services of the Republic
of Belarus in [2020] was affected by the global crisis caused by the coronavirus
pandemic [Figure 9]. The volume of cargo turnover and transported goods decreased
by [7.3%] and [8.4%], respectively, from [January to September 2020] compared to
the same period in [2019]. Indicators of freight turnover and volumes of transported
goods for [January-September 2020] showed a decline in almost all types of transport,
and the greatest decline was attributed to rail and pipeline transport.64
The Baltic countries account for a significant share of Belarus' foreign trade turnover,
which creates an active demand for the delivery of goods in this direction. So, in 10
months of [2020], 5.32 million tons of products with a total value of USD 1.14 billion
(EUR 0.93 billion) were delivered from Belarus to the Baltic States, i.e. Lithuania,
Latvia, and Estonia, while imports for the same period from the Baltics to the
Republic of Belarus amounted to 1.75 million tons with a total value of 418 280
thousand US dollars (EUR 342 670).65
Figure 10: Foreign trade in goods between the Republic of Belarus and Lithuania in 2017 (Jan-Dec) – 2020 (Jan-
Oct). Source: National Statistical Committee of the Republic of Belarus66
64 „Развитие грузопотоков между республикой Беларусь и Латвийской республикой.
Углубленный анализ Беларусского бизнеса на предмет релокации в Латвию”, Маркетинговое
исследование, „Aser”, 2020, P. 8. 65 Ibid, P. 9. 66 Ibid, P. 10.
3,358.60
3,902.70
4,798.20
3,607.30
1,590.401,348.30
1,153.901,530.00
2017 2018 2019 2020 ( JAN-OCT)
Export. Thousand tones Import. Thousand tones
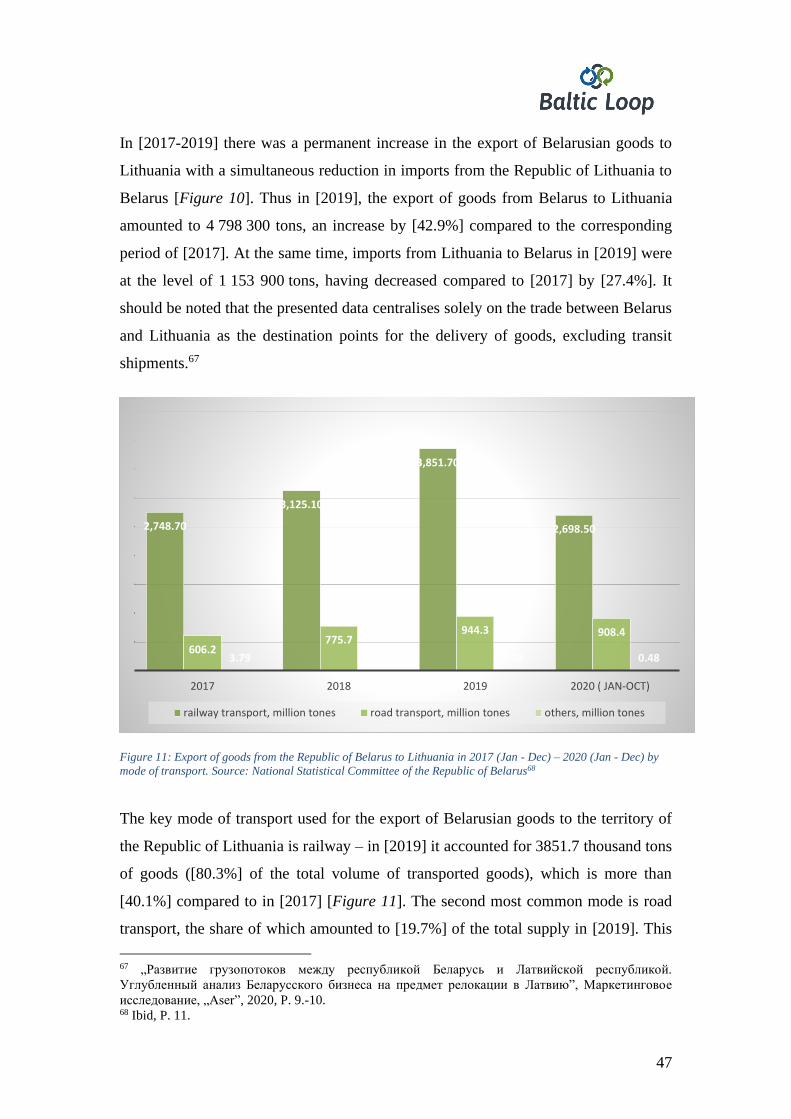
47
In [2017-2019] there was a permanent increase in the export of Belarusian goods to
Lithuania with a simultaneous reduction in imports from the Republic of Lithuania to
Belarus [Figure 10]. Thus in [2019], the export of goods from Belarus to Lithuania
amounted to 4 798 300 tons, an increase by [42.9%] compared to the corresponding
period of [2017]. At the same time, imports from Lithuania to Belarus in [2019] were
at the level of 1 153 900 tons, having decreased compared to [2017] by [27.4%]. It
should be noted that the presented data centralises solely on the trade between Belarus
and Lithuania as the destination points for the delivery of goods, excluding transit
shipments.67
Figure 11: Export of goods from the Republic of Belarus to Lithuania in 2017 (Jan - Dec) – 2020 (Jan - Dec) by
mode of transport. Source: National Statistical Committee of the Republic of Belarus68
The key mode of transport used for the export of Belarusian goods to the territory of
the Republic of Lithuania is railway – in [2019] it accounted for 3851.7 thousand tons
of goods ([80.3%] of the total volume of transported goods), which is more than
[40.1%] compared to in [2017] [Figure 11]. The second most common mode is road
transport, the share of which amounted to [19.7%] of the total supply in [2019]. This
67 „Развитие грузопотоков между республикой Беларусь и Латвийской республикой.
Углубленный анализ Беларусского бизнеса на предмет релокации в Латвию”, Маркетинговое
исследование, „Aser”, 2020, P. 9.-10. 68 Ibid, P. 11.
2,748.70
3,125.10
3,851.70
2,698.50
606.2775.7
944.3 908.4
3.79 1.82 2.28 0.48
2017 2018 2019 2020 ( JAN-OCT)
railway transport, million tones road transport, million tones others, million tones
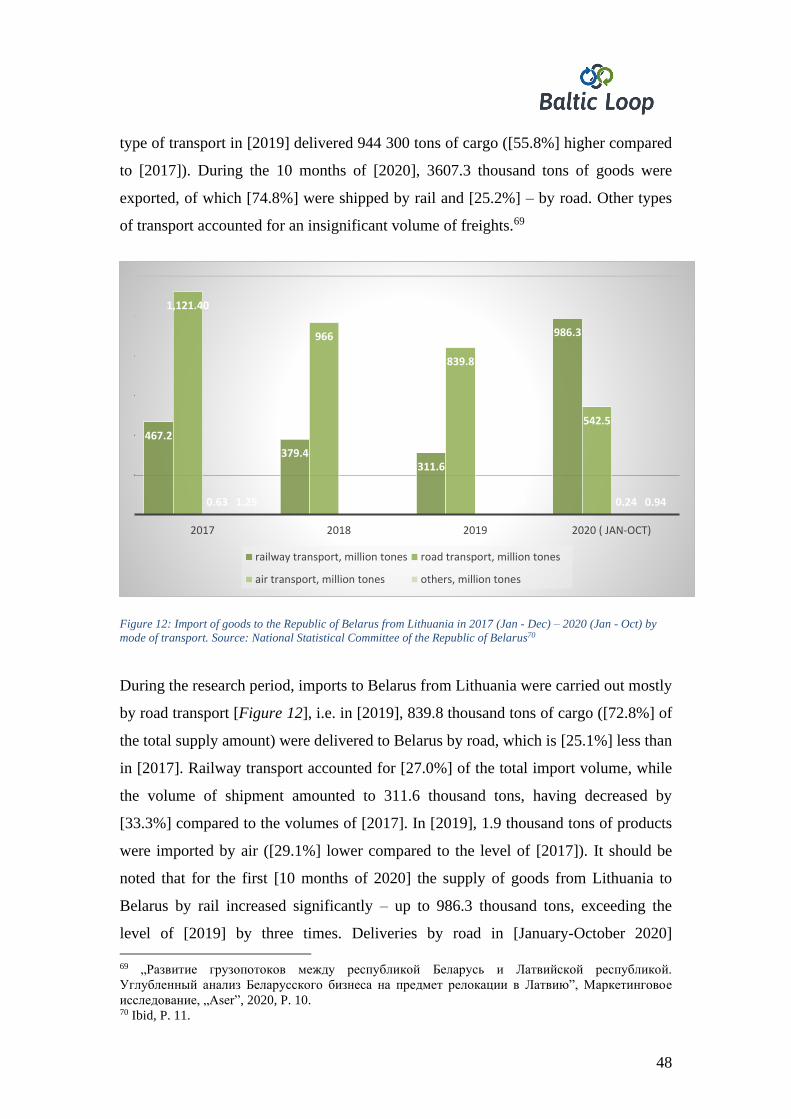
48
type of transport in [2019] delivered 944 300 tons of cargo ([55.8%] higher compared
to [2017]). During the 10 months of [2020], 3607.3 thousand tons of goods were
exported, of which [74.8%] were shipped by rail and [25.2%] – by road. Other types
of transport accounted for an insignificant volume of freights.69
Figure 12: Import of goods to the Republic of Belarus from Lithuania in 2017 (Jan - Dec) – 2020 (Jan - Oct) by
mode of transport. Source: National Statistical Committee of the Republic of Belarus70
During the research period, imports to Belarus from Lithuania were carried out mostly
by road transport [Figure 12], i.e. in [2019], 839.8 thousand tons of cargo ([72.8%] of
the total supply amount) were delivered to Belarus by road, which is [25.1%] less than
in [2017]. Railway transport accounted for [27.0%] of the total import volume, while
the volume of shipment amounted to 311.6 thousand tons, having decreased by
[33.3%] compared to the volumes of [2017]. In [2019], 1.9 thousand tons of products
were imported by air ([29.1%] lower compared to the level of [2017]). It should be
noted that for the first [10 months of 2020] the supply of goods from Lithuania to
Belarus by rail increased significantly – up to 986.3 thousand tons, exceeding the
level of [2019] by three times. Deliveries by road in [January-October 2020]
69 „Развитие грузопотоков между республикой Беларусь и Латвийской республикой.
Углубленный анализ Беларусского бизнеса на предмет релокации в Латвию”, Маркетинговое
исследование, „Aser”, 2020, P. 10. 70 Ibid, P. 11.
467.2
379.4311.6
986.3
1,121.40
966
839.8
542.5
0.63 0.23 0.63 0.241.25 2.68 1.9 0.94
2017 2018 2019 2020 ( JAN-OCT)
railway transport, million tones road transport, million tones
air transport, million tones others, million tones
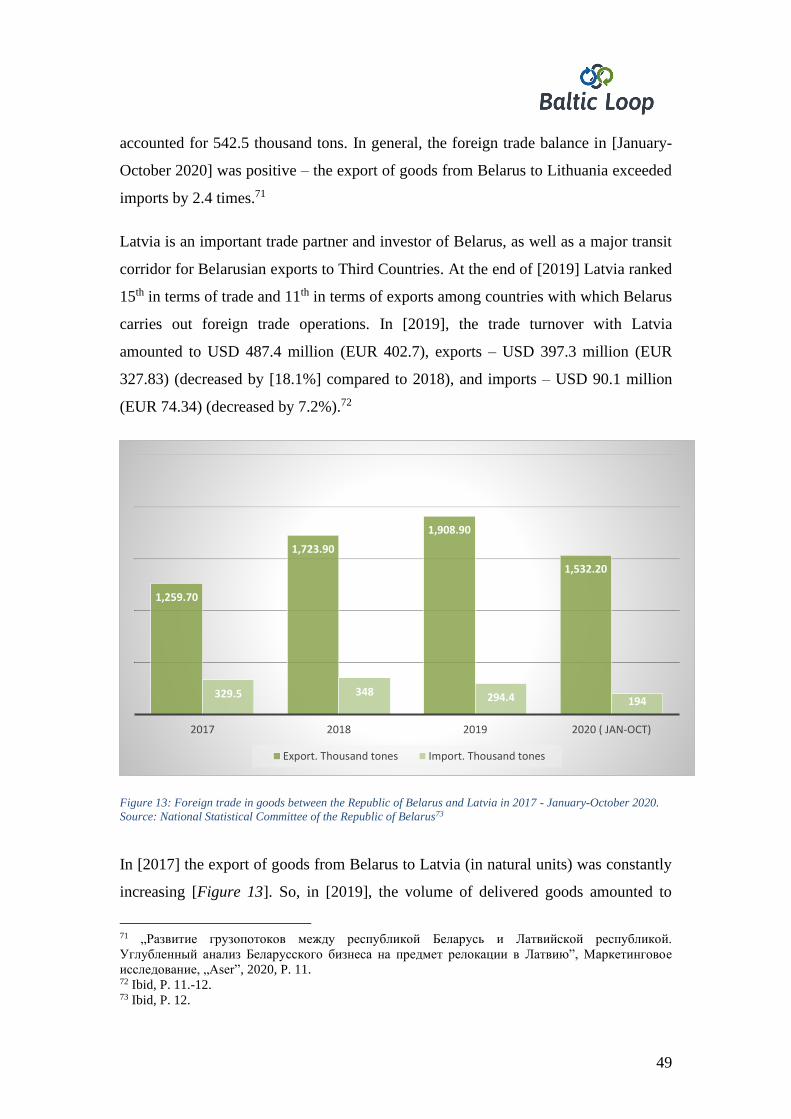
49
accounted for 542.5 thousand tons. In general, the foreign trade balance in [January-
October 2020] was positive – the export of goods from Belarus to Lithuania exceeded
imports by 2.4 times.71
Latvia is an important trade partner and investor of Belarus, as well as a major transit
corridor for Belarusian exports to Third Countries. At the end of [2019] Latvia ranked
15th in terms of trade and 11th in terms of exports among countries with which Belarus
carries out foreign trade operations. In [2019], the trade turnover with Latvia
amounted to USD 487.4 million (EUR 402.7), exports – USD 397.3 million (EUR
327.83) (decreased by [18.1%] compared to 2018), and imports – USD 90.1 million
(EUR 74.34) (decreased by 7.2%).72
Figure 13: Foreign trade in goods between the Republic of Belarus and Latvia in 2017 - January-October 2020.
Source: National Statistical Committee of the Republic of Belarus73
In [2017] the export of goods from Belarus to Latvia (in natural units) was constantly
increasing [Figure 13]. So, in [2019], the volume of delivered goods amounted to
71 „Развитие грузопотоков между республикой Беларусь и Латвийской республикой.
Углубленный анализ Беларусского бизнеса на предмет релокации в Латвию”, Маркетинговое
исследование, „Aser”, 2020, P. 11. 72 Ibid, P. 11.-12. 73 Ibid, P. 12.
1,259.70
1,723.90
1,908.90
1,532.20
329.5 348 294.4 194
2017 2018 2019 2020 ( JAN-OCT)
Export. Thousand tones Import. Thousand tones
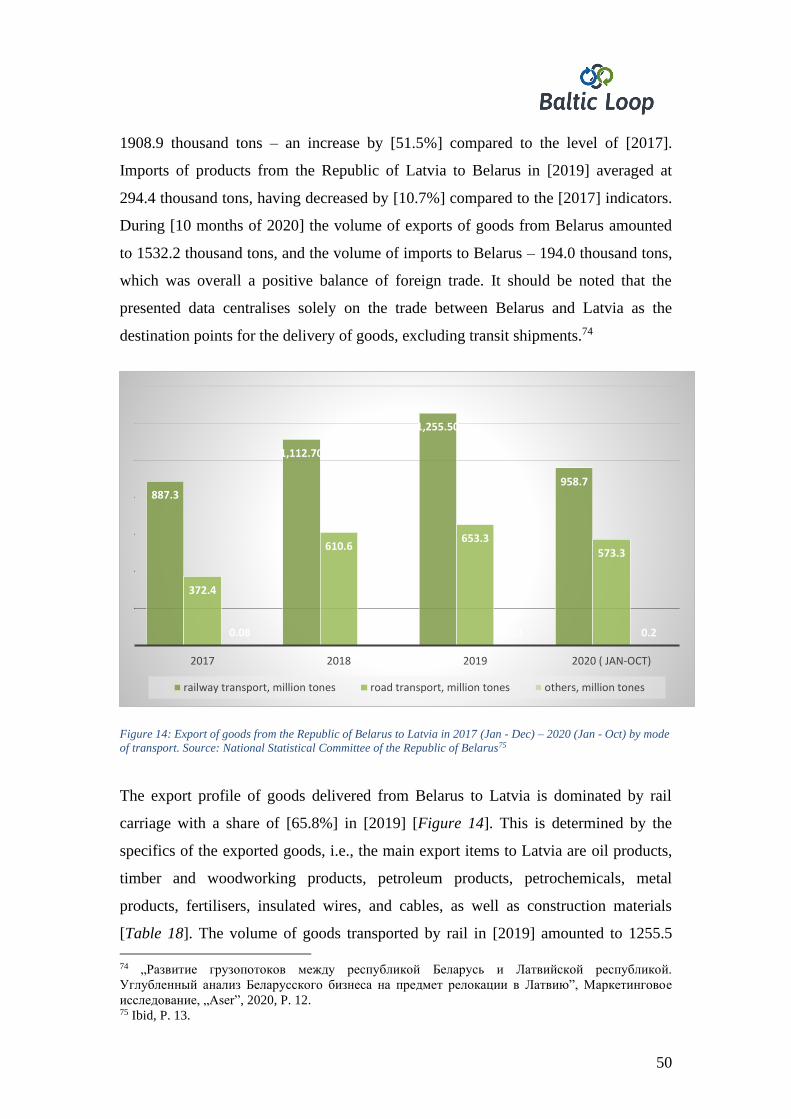
50
1908.9 thousand tons – an increase by [51.5%] compared to the level of [2017].
Imports of products from the Republic of Latvia to Belarus in [2019] averaged at
294.4 thousand tons, having decreased by [10.7%] compared to the [2017] indicators.
During [10 months of 2020] the volume of exports of goods from Belarus amounted
to 1532.2 thousand tons, and the volume of imports to Belarus – 194.0 thousand tons,
which was overall a positive balance of foreign trade. It should be noted that the
presented data centralises solely on the trade between Belarus and Latvia as the
destination points for the delivery of goods, excluding transit shipments.74
Figure 14: Export of goods from the Republic of Belarus to Latvia in 2017 (Jan - Dec) – 2020 (Jan - Oct) by mode
of transport. Source: National Statistical Committee of the Republic of Belarus75
The export profile of goods delivered from Belarus to Latvia is dominated by rail
carriage with a share of [65.8%] in [2019] [Figure 14]. This is determined by the
specifics of the exported goods, i.e., the main export items to Latvia are oil products,
timber and woodworking products, petroleum products, petrochemicals, metal
products, fertilisers, insulated wires, and cables, as well as construction materials
[Table 18]. The volume of goods transported by rail in [2019] amounted to 1255.5
74 „Развитие грузопотоков между республикой Беларусь и Латвийской республикой.
Углубленный анализ Беларусского бизнеса на предмет релокации в Латвию”, Маркетинговое
исследование, „Aser”, 2020, P. 12. 75 Ibid, P. 13.
887.3
1,112.70
1,255.50
958.7
372.4
610.6653.3
573.3
0.08 0.57 0.11 0.2
2017 2018 2019 2020 ( JAN-OCT)
railway transport, million tones road transport, million tones others, million tones
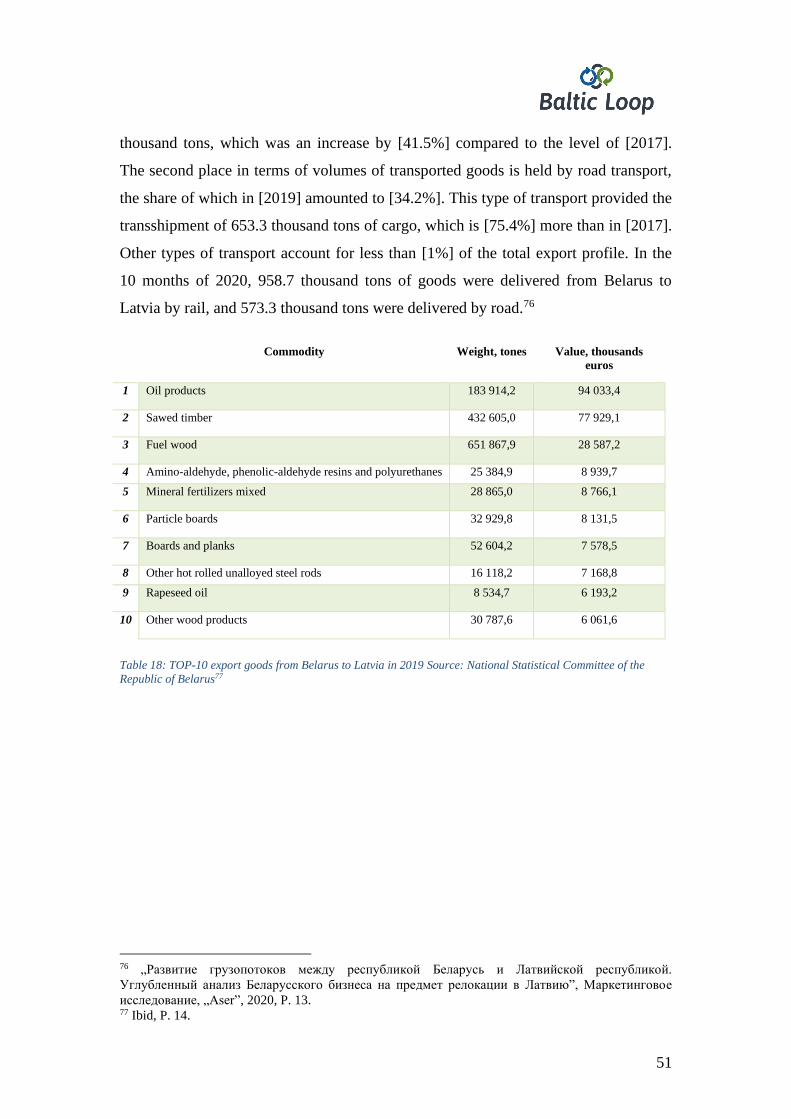
51
thousand tons, which was an increase by [41.5%] compared to the level of [2017].
The second place in terms of volumes of transported goods is held by road transport,
the share of which in [2019] amounted to [34.2%]. This type of transport provided the
transshipment of 653.3 thousand tons of cargo, which is [75.4%] more than in [2017].
Other types of transport account for less than [1%] of the total export profile. In the
10 months of 2020, 958.7 thousand tons of goods were delivered from Belarus to
Latvia by rail, and 573.3 thousand tons were delivered by road.76
№ Commodity Weight, tones Value, thousands
euros
1 Oil products 183 914,2 94 033,4
2 Sawed timber 432 605,0 77 929,1
3 Fuel wood 651 867,9 28 587,2
4 Amino-aldehyde, phenolic-aldehyde resins and polyurethanes 25 384,9 8 939,7
5 Mineral fertilizers mixed 28 865,0 8 766,1
6 Particle boards 32 929,8 8 131,5
7 Boards and planks 52 604,2 7 578,5
8 Other hot rolled unalloyed steel rods 16 118,2 7 168,8
9 Rapeseed oil 8 534,7 6 193,2
10 Other wood products 30 787,6 6 061,6
Table 18: TOP-10 export goods from Belarus to Latvia in 2019 Source: National Statistical Committee of the
Republic of Belarus77
76 „Развитие грузопотоков между республикой Беларусь и Латвийской республикой.
Углубленный анализ Беларусского бизнеса на предмет релокации в Латвию”, Маркетинговое
исследование, „Aser”, 2020, P. 13. 77 Ibid, P. 14.
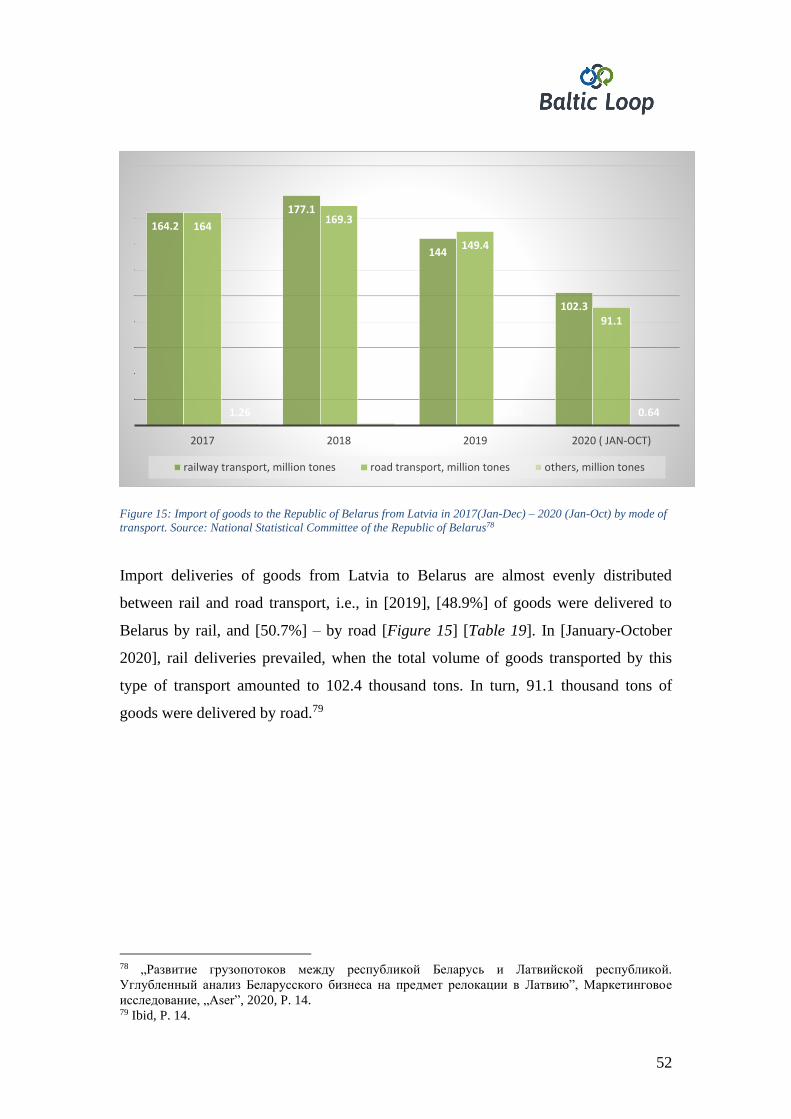
52
Figure 15: Import of goods to the Republic of Belarus from Latvia in 2017(Jan-Dec) – 2020 (Jan-Oct) by mode of
transport. Source: National Statistical Committee of the Republic of Belarus78
Import deliveries of goods from Latvia to Belarus are almost evenly distributed
between rail and road transport, i.e., in [2019], [48.9%] of goods were delivered to
Belarus by rail, and [50.7%] – by road [Figure 15] [Table 19]. In [January-October
2020], rail deliveries prevailed, when the total volume of goods transported by this
type of transport amounted to 102.4 thousand tons. In turn, 91.1 thousand tons of
goods were delivered by road.79
78 „Развитие грузопотоков между республикой Беларусь и Латвийской республикой.
Углубленный анализ Беларусского бизнеса на предмет релокации в Латвию”, Маркетинговое
исследование, „Aser”, 2020, P. 14. 79 Ibid, P. 14.
164.2
177.1
144
102.3
164169.3
149.4
91.1
1.26 1.58 0.95 0.64
2017 2018 2019 2020 ( JAN-OCT)
railway transport, million tones road transport, million tones others, million tones
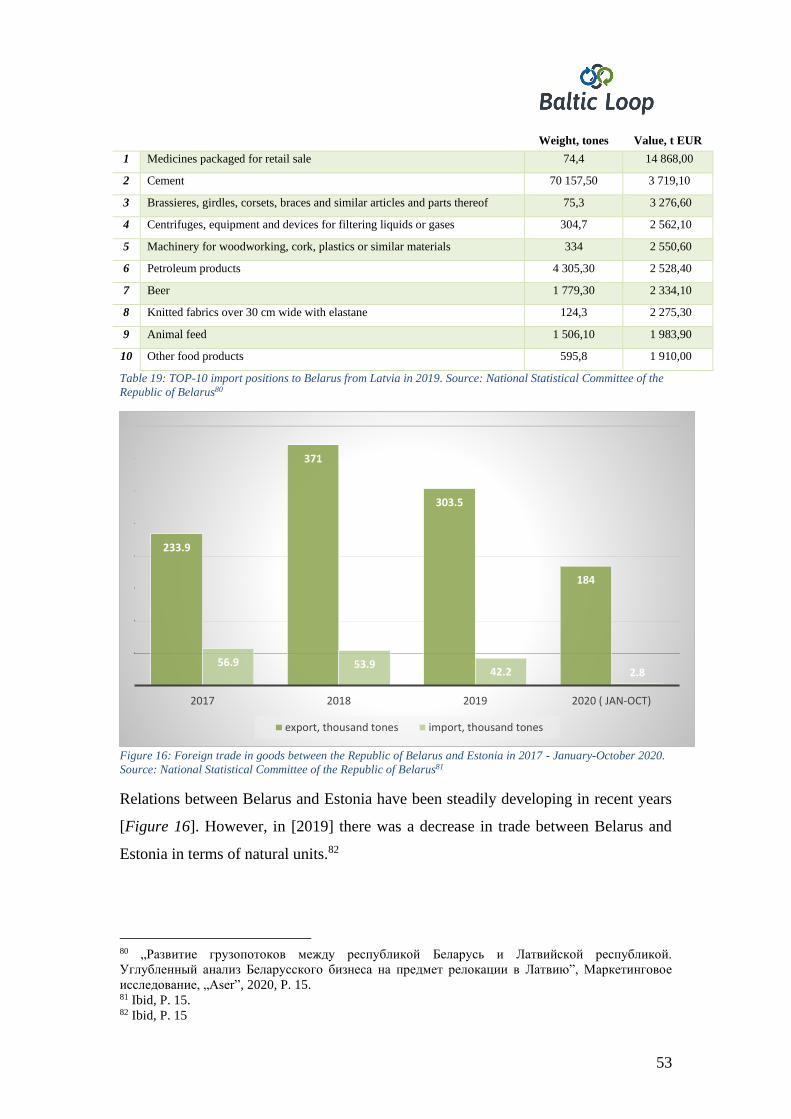
53
Weight, tones Value, t EUR
1 Medicines packaged for retail sale 74,4 14 868,00
2 Cement 70 157,50 3 719,10
3 Brassieres, girdles, corsets, braces and similar articles and parts thereof 75,3 3 276,60
4 Centrifuges, equipment and devices for filtering liquids or gases 304,7 2 562,10
5 Machinery for woodworking, cork, plastics or similar materials 334 2 550,60
6 Petroleum products 4 305,30 2 528,40
7 Beer 1 779,30 2 334,10
8 Knitted fabrics over 30 cm wide with elastane 124,3 2 275,30
9 Animal feed 1 506,10 1 983,90
10 Other food products 595,8 1 910,00
Table 19: TOP-10 import positions to Belarus from Latvia in 2019. Source: National Statistical Committee of the
Republic of Belarus80
Figure 16: Foreign trade in goods between the Republic of Belarus and Estonia in 2017 - January-October 2020.
Source: National Statistical Committee of the Republic of Belarus81
Relations between Belarus and Estonia have been steadily developing in recent years
[Figure 16]. However, in [2019] there was a decrease in trade between Belarus and
Estonia in terms of natural units.82
80 „Развитие грузопотоков между республикой Беларусь и Латвийской республикой.
Углубленный анализ Беларусского бизнеса на предмет релокации в Латвию”, Маркетинговое
исследование, „Aser”, 2020, P. 15. 81 Ibid, P. 15. 82 Ibid, P. 15
233.9
371
303.5
184
56.9 53.942.2 2.8
2017 2018 2019 2020 ( JAN-OCT)
export, thousand tones import, thousand tones
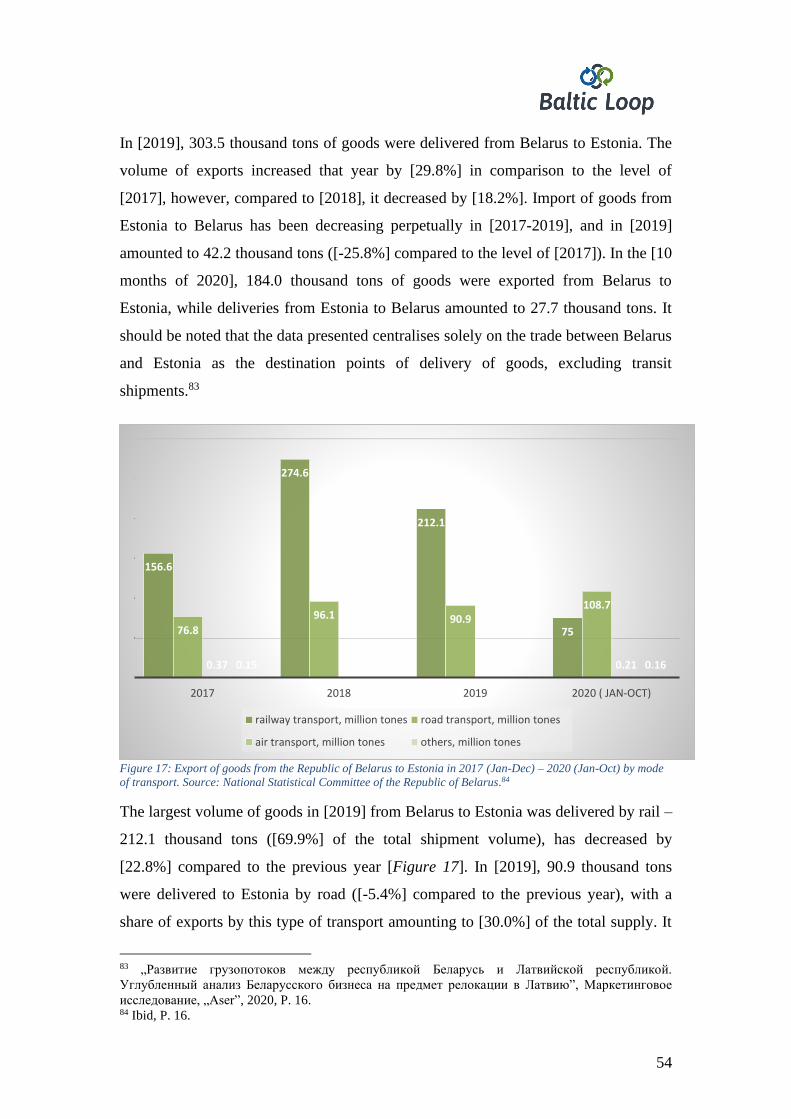
54
In [2019], 303.5 thousand tons of goods were delivered from Belarus to Estonia. The
volume of exports increased that year by [29.8%] in comparison to the level of
[2017], however, compared to [2018], it decreased by [18.2%]. Import of goods from
Estonia to Belarus has been decreasing perpetually in [2017-2019], and in [2019]
amounted to 42.2 thousand tons ([-25.8%] compared to the level of [2017]). In the [10
months of 2020], 184.0 thousand tons of goods were exported from Belarus to
Estonia, while deliveries from Estonia to Belarus amounted to 27.7 thousand tons. It
should be noted that the data presented centralises solely on the trade between Belarus
and Estonia as the destination points of delivery of goods, excluding transit
shipments.83
Figure 17: Export of goods from the Republic of Belarus to Estonia in 2017 (Jan-Dec) – 2020 (Jan-Oct) by mode
of transport. Source: National Statistical Committee of the Republic of Belarus.84
The largest volume of goods in [2019] from Belarus to Estonia was delivered by rail –
212.1 thousand tons ([69.9%] of the total shipment volume), has decreased by
[22.8%] compared to the previous year [Figure 17]. In [2019], 90.9 thousand tons
were delivered to Estonia by road ([-5.4%] compared to the previous year), with a
share of exports by this type of transport amounting to [30.0%] of the total supply. It
83 „Развитие грузопотоков между республикой Беларусь и Латвийской республикой.
Углубленный анализ Беларусского бизнеса на предмет релокации в Латвию”, Маркетинговое
исследование, „Aser”, 2020, P. 16. 84 Ibid, P. 16.
156.6
274.6
212.1
7576.8
96.1 90.9108.7
0.37 0.3 0.46 0.210.15 0.02 0.06 0.16
2017 2018 2019 2020 ( JAN-OCT)
railway transport, million tones road transport, million tones
air transport, million tones others, million tones
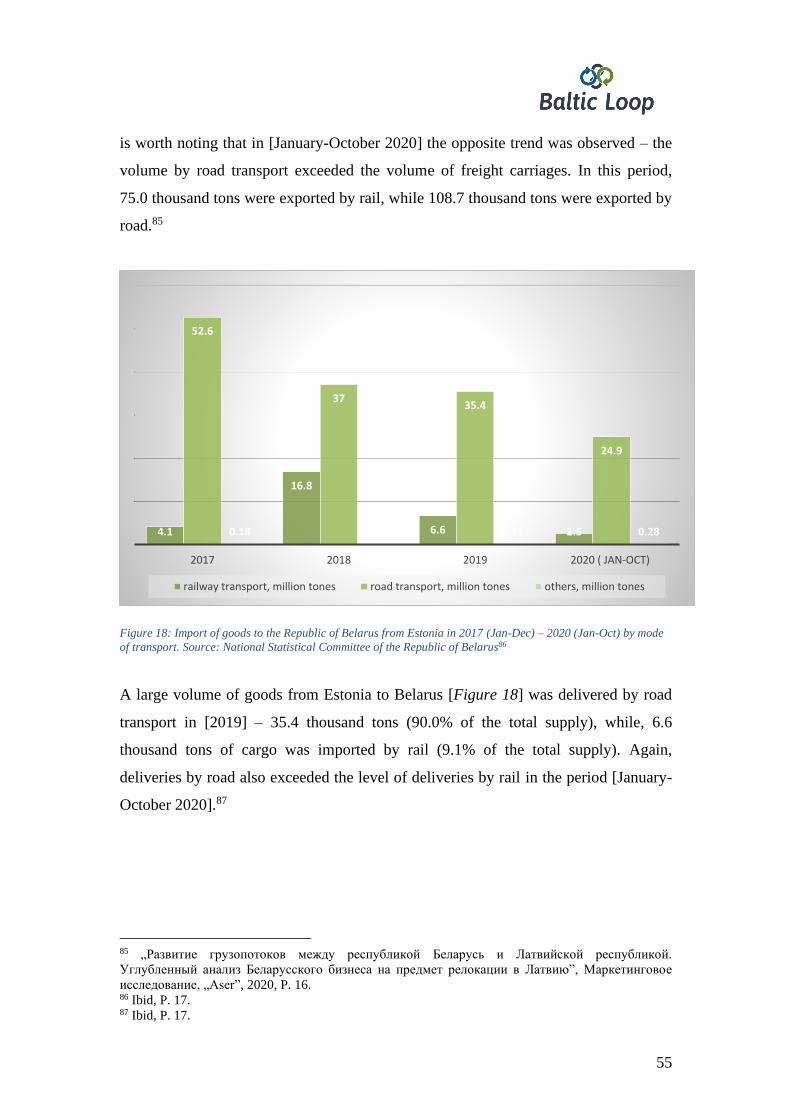
55
is worth noting that in [January-October 2020] the opposite trend was observed – the
volume by road transport exceeded the volume of freight carriages. In this period,
75.0 thousand tons were exported by rail, while 108.7 thousand tons were exported by
road.85
Figure 18: Import of goods to the Republic of Belarus from Estonia in 2017 (Jan-Dec) – 2020 (Jan-Oct) by mode
of transport. Source: National Statistical Committee of the Republic of Belarus86
A large volume of goods from Estonia to Belarus [Figure 18] was delivered by road
transport in [2019] – 35.4 thousand tons (90.0% of the total supply), while, 6.6
thousand tons of cargo was imported by rail (9.1% of the total supply). Again,
deliveries by road also exceeded the level of deliveries by rail in the period [January-
October 2020].87
85 „Развитие грузопотоков между республикой Беларусь и Латвийской республикой.
Углубленный анализ Беларусского бизнеса на предмет релокации в Латвию”, Маркетинговое
исследование, „Aser”, 2020, P. 16. 86 Ibid, P. 17. 87 Ibid, P. 17.
4.1
16.8
6.6 2.5
52.6
3735.4
24.9
0.18 0.19 0.25 0.28
2017 2018 2019 2020 ( JAN-OCT)
railway transport, million tones road transport, million tones others, million tones
56
3.2. Port of Klaipeda: influence on the potential of the Belarus - Latvia - Sweden
Corridor
Potash fertilizers are one of the main directions of Belarusian exports to the Baltic
ports. It should be noted that the Freeport of Ventspils remained the favourite for
transhipment of Belarusian potash fertilizers for a long time. However, Latvia lost the
transit of Belarusian potash fertilizers more than 10 years ago due to the fact that it
could not compete with the port of Klaipeda, which managed to create more
favourable conditions for transhipment of Belarusian potash fertilizers. In [2008], the
Lithuanian port in Klaipeda and JSC Belaruskali entered into an agreement under
which Lithuanian port companies began to apply competitive tariffs for the
transhipment of Belarusian mineral fertilisers through their terminals. At the same
time, stevedores and Belarusian cargo owners also began to conclude long-term
contracts for the transhipment of cargo in the port, which became an additional
advantage of the Lithuanian transit corridor.88
It should be noted that in [2020] the Ministry of Finance of Belarus forecasts the
export of potash fertilizers in the amount of 9.96 million tons (in physical weight) and
export duties at the level of [1.4 billion BYN] or [440 million euros].89
As for the country-wide diversification of cargo deliveries through ports, the best
offer to Belarus is currently offered by the Lithuanian port. It should be noted that
about 14-15 million Belarusian cargoes pass through the port of Klaipeda - about
10 million tons of potash fertilizers and about 4-5 million tons of oil products. That is,
half of all Belarusian cargo traffic goes through Lithuania. Belarus is one of the most
important trade partners of Lithuania. According to the Lithuanian side, Belarusian
imports to Lithuania in [2019] increased by [2.3%] compared to [2018] to [783
million euros]. Belarusian exports in [2019] increased by [6.36%] to [1.2 billion
euros], and Lithuanian - by 4.17% to [160 million euros]. Lithuanian Railways (LG)
is the most important partner of the Belarusian Railways (BZD) in terms of
international cargo transportation. Lithuania provides Belarus with optimal transport
88 „Развитие грузопотоков между республикой Беларусь и Латвийской республикой.
Углубленный анализ Беларусского бизнеса на предмет релокации в Латвию”, Маркетинговое
исследование, „Aser”, 2020, P. 27. 89 Ibid, P. 27.
57
and logistics schemes for the delivery of export-import cargo, such as potash
fertilizers, oil products, ferrous metals. LRD transported 55 million tons of cargo in
[2019], 19 million of which are associated with the Belarusian direction. For the first
half of [2020], the dynamics are similar: out of 24 million tons of cargo, 9 million
tons were Belarusian.90
The Republic of Belarus does not have its own seaports. The main transit of
Belarusian export-import cargo is carried out through the ports of Lithuania
(Klaipeda) and Latvia (Freeport of Riga, Ventspils, Liepaja).91
3.3. Conclusions
The essential part of the effectiveness of Belarus – Latvia – Sweden is the
attractiveness of the Freeport of Ventspils. The port's ability to attract Belarusian
companies can determine the efficiency of the entire Belarusian-Latvian-Swedish
route.
The Freeport of Ventspils can be proud of its well-developed and versatile
infrastructure and a huge experience in working with Belarus and with different kinds
of cargoes. Also, the freeport itself is a deep-water port with skilled labour. The
geographical location is close both to Belarus and Western countries.
However, Ventspils is away from the main routes in the Baltic countries. For instance,
the Rail Baltica has no direct connection to Ventspils. Besides, the Freeport of
Ventspils must keep in mind that there is a strong competition with ports in Lithuania,
and, specially, Russia that is trying both politically and economically to get the
Belarusian cargoes. The situation is even more complicated because Latvia politically
stands up against the regimes in Russia and Belarus.
Nevertheless, an opportunity could be seen in the attraction of Belarusian
investments. In other words, Belarusian companies potentially could be ready to
90 „Развитие грузопотоков между республикой Беларусь и Латвийской республикой.
Углубленный анализ Беларусского бизнеса на предмет релокации в Латвию”, Маркетинговое
исследование, „Aser”, 2020, P. 28.-29. 91 Ibid, P. 30.
58
relocate or expand and work in Ventspils and in the territory of the Freeport of
Ventspils. Belarusian companies would highly appreciate the transparency of
ownership of the Freeport of Ventspils. It gives safety and self-assurance to the
investors. Thus, they would be ready to invest in the Freeport of Ventspils. One must
keep in mind, that the potential privatisation of the Belarusian companies will happen
in a couple of years, therefore the private sector probably will be more interested to
relocate to Ventspils. There could also be interest expressed by Belarusian Tech
companies to work in Ventspils. According to ASER, more than 39% of respondents
are considering relocation to other countries.
The Freeport of Ventspils is also characterised by the readiness to gain back activities
very steeply in case of political regime change in Russia and Belarus. As an added
value there are a lot of free territories for the development of the port.
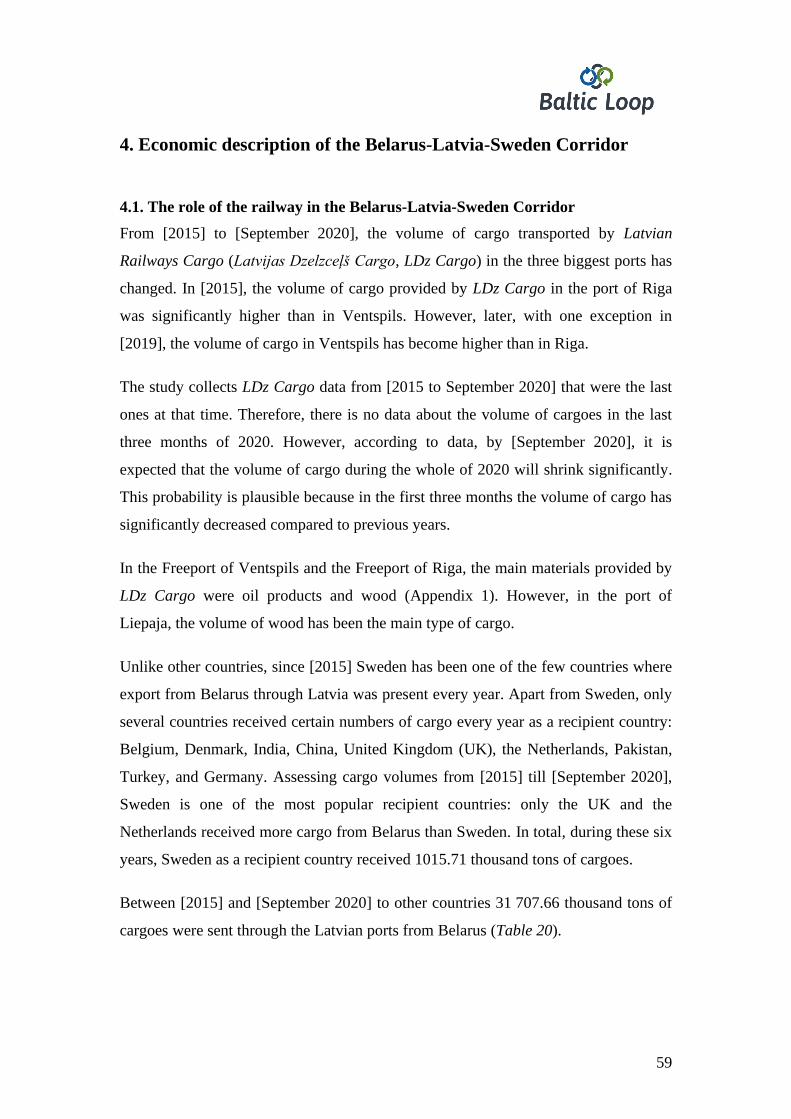
59
4. Economic description of the Belarus-Latvia-Sweden Corridor
4.1. The role of the railway in the Belarus-Latvia-Sweden Corridor
From [2015] to [September 2020], the volume of cargo transported by Latvian
Railways Cargo (Latvijas Dzelzceļš Cargo, LDz Cargo) in the three biggest ports has
changed. In [2015], the volume of cargo provided by LDz Cargo in the port of Riga
was significantly higher than in Ventspils. However, later, with one exception in
[2019], the volume of cargo in Ventspils has become higher than in Riga.
The study collects LDz Cargo data from [2015 to September 2020] that were the last
ones at that time. Therefore, there is no data about the volume of cargoes in the last
three months of 2020. However, according to data, by [September 2020], it is
expected that the volume of cargo during the whole of 2020 will shrink significantly.
This probability is plausible because in the first three months the volume of cargo has
significantly decreased compared to previous years.
In the Freeport of Ventspils and the Freeport of Riga, the main materials provided by
LDz Cargo were oil products and wood (Appendix 1). However, in the port of
Liepaja, the volume of wood has been the main type of cargo.
Unlike other countries, since [2015] Sweden has been one of the few countries where
export from Belarus through Latvia was present every year. Apart from Sweden, only
several countries received certain numbers of cargo every year as a recipient country:
Belgium, Denmark, India, China, United Kingdom (UK), the Netherlands, Pakistan,
Turkey, and Germany. Assessing cargo volumes from [2015] till [September 2020],
Sweden is one of the most popular recipient countries: only the UK and the
Netherlands received more cargo from Belarus than Sweden. In total, during these six
years, Sweden as a recipient country received 1015.71 thousand tons of cargoes.
Between [2015] and [September 2020] to other countries 31 707.66 thousand tons of
cargoes were sent through the Latvian ports from Belarus (Table 20).
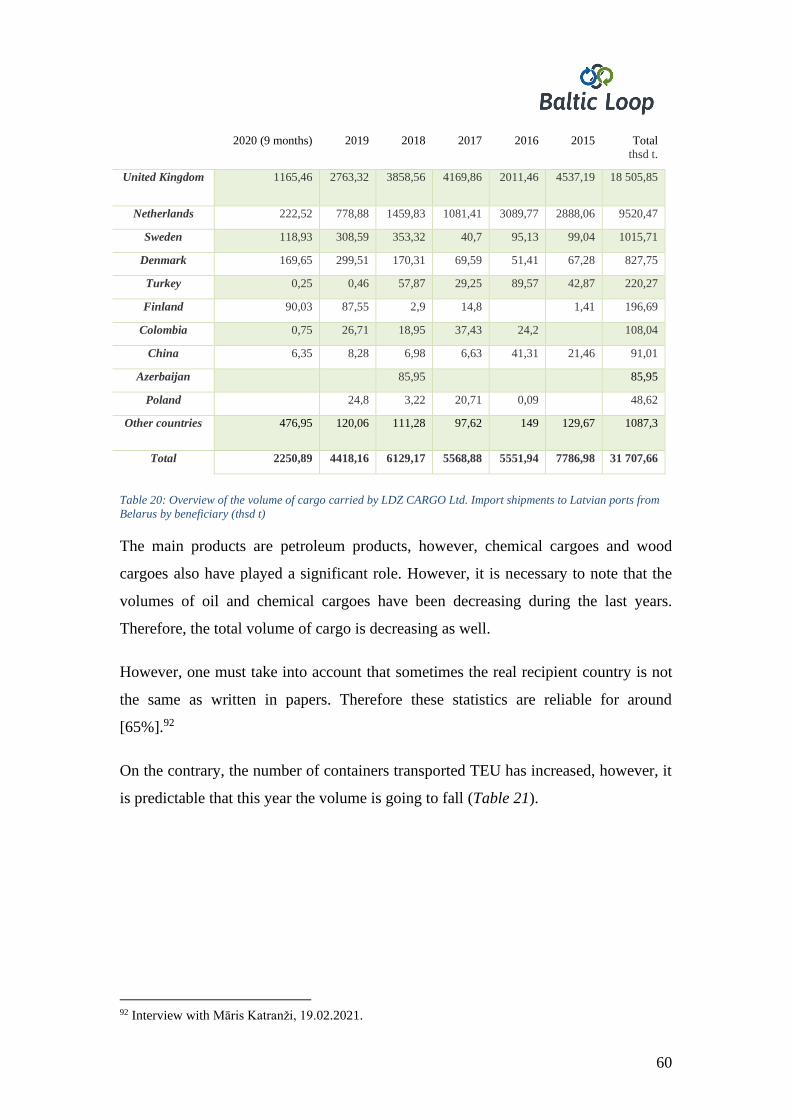
60
Saņēmējvalsts 2020 (9 months) 2019 2018 2017 2016 2015 Total
thsd t.
United Kingdom 1165,46 2763,32 3858,56 4169,86 2011,46 4537,19 18 505,85
Netherlands 222,52 778,88 1459,83 1081,41 3089,77 2888,06 9520,47
Sweden 118,93 308,59 353,32 40,7 95,13 99,04 1015,71
Denmark 169,65 299,51 170,31 69,59 51,41 67,28 827,75
Turkey 0,25 0,46 57,87 29,25 89,57 42,87 220,27
Finland 90,03 87,55 2,9 14,8 1,41 196,69
Colombia 0,75 26,71 18,95 37,43 24,2 108,04
China 6,35 8,28 6,98 6,63 41,31 21,46 91,01
Azerbaijan 85,95 85,95
Poland 24,8 3,22 20,71 0,09 48,62
Other countries 476,95 120,06 111,28 97,62 149 129,67 1087,3
Total 2250,89 4418,16 6129,17 5568,88 5551,94 7786,98 31 707,66
Table 20: Overview of the volume of cargo carried by LDZ CARGO Ltd. Import shipments to Latvian ports from
Belarus by beneficiary (thsd t)
The main products are petroleum products, however, chemical cargoes and wood
cargoes also have played a significant role. However, it is necessary to note that the
volumes of oil and chemical cargoes have been decreasing during the last years.
Therefore, the total volume of cargo is decreasing as well.
However, one must take into account that sometimes the real recipient country is not
the same as written in papers. Therefore these statistics are reliable for around
[65%].92
On the contrary, the number of containers transported TEU has increased, however, it
is predictable that this year the volume is going to fall (Table 21).
92 Interview with Māris Katranži, 19.02.2021.
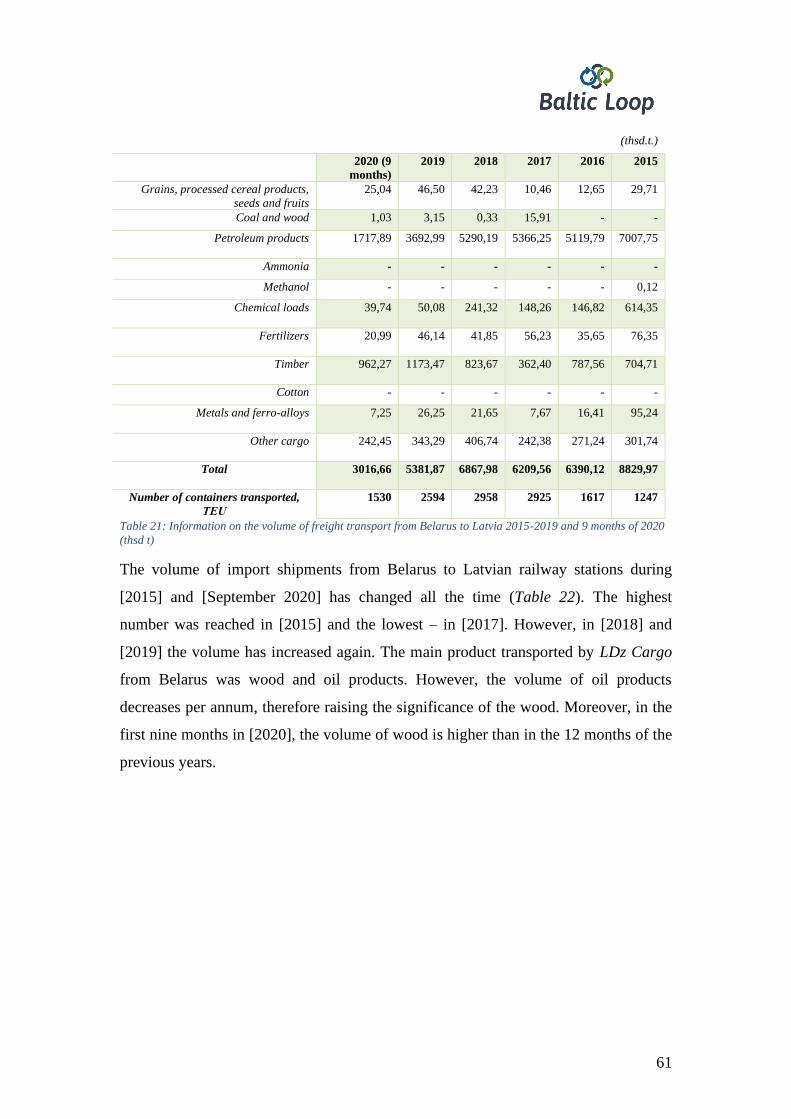
61
(thsd.t.)
IMPORT TO LATVIA, INCLUDING
PORTS
2020 (9
months)
2019 2018 2017 2016 2015
Grains, processed cereal products,
seeds and fruits
25,04
46,50 42,23 10,46
12,65
29,71
Coal and wood 1,03 3,15 0,33 15,91 - -
Petroleum products 1717,89
3692,99 5290,19 5366,25
5119,79
7007,75
Ammonia - - - - - -
Methanol - - - - - 0,12
Chemical loads 39,74 50,08 241,32 148,26
146,82
614,35
Fertilizers 20,99 46,14 41,85 56,23
35,65
76,35
Timber 962,27 1173,47 823,67 362,40
787,56
704,71
Cotton - - - - - -
Metals and ferro-alloys 7,25 26,25 21,65 7,67
16,41
95,24
Other cargo 242,45 343,29 406,74 242,38
271,24
301,74
Total 3016,66 5381,87 6867,98 6209,56
6390,12
8829,97
Number of containers transported,
ТЕU
1530 2594 2958 2925
1617
1247
Table 21: Information on the volume of freight transport from Belarus to Latvia 2015-2019 and 9 months of 2020
(thsd t)
The volume of import shipments from Belarus to Latvian railway stations during
[2015] and [September 2020] has changed all the time (Table 22). The highest
number was reached in [2015] and the lowest – in [2017]. However, in [2018] and
[2019] the volume has increased again. The main product transported by LDz Cargo
from Belarus was wood and oil products. However, the volume of oil products
decreases per annum, therefore raising the significance of the wood. Moreover, in the
first nine months in [2020], the volume of wood is higher than in the 12 months of the
previous years.
62
Year Total
weight
Grains
and
processed
cereal
products,
fruit and
seeds
Petrole-
um
products
Chemical
loads
Ferti-
lizers
Timber Metals
and
ferro-
alloys
Other
cargo
Freight
contain-
ners
Number
of
contain-
ners
(TEU)
2020 9
mths
765,77 4,75 33,61 5,51 20,88 493,09 6,72 201,20 22,99 731
2019 963,71 11,09 132,61 7,54 36,62 453,60 24,00 298,26 31,42 1110
2018 738,82 20,65 139,38 8,28 41,30 227,04 21,50 280,68 32,17 1030
2017 640,67 8,14 164,87 8,84 55,82 220,56 7,67 174,77 34,23 1063
2016 838,18 11,42 90,73 7,25 35,21 504,38 14,38 174,81 11,68 349
2015 1042,99 11,18 235,07 9,24 75,02 486,94 95,11 130,43 0,08 18
Table 22: Overview of the volume of cargo carried by LDZ CARGO Ltd. Import shipments from Belarus to Latvian
railway stations (thsd t). Source: LDz Cargo
4.2. The estimation of the current economic activity within the Belarus-Latvia-
Sweden Corridor
It is observable that export from Belarus and then from Latvia to Sweden is larger
than import from Sweden to the aforementioned countries. Also, there are differences
between the commodities exported by these countries. From Belarus and Latvia to
Sweden there is more export of wood, wood and metal production, while from
Sweden, and also from Latvia to Belarus – machines and electrical devices are the
dominant cargoes.
Year 2020 2019 2018 2017 2016 2015
Export (EUR) 181.83 192.34 163.80 154.17 107.34 151.62
Table 23: The amount of export to Belarus from Latvia (from 2015 till October 2020) (mln., EUR),93
During the last five years, the amount of export from Latvia to Belarus has gradually
increased (Table 23). In [2015], the amount has reached 151.62 mln. EUR, but after
this, with the exception in [2016], the amount increased year by year. The highest
point was reached in [2019] – 192.34 mln. EUR.
Year 2020 2019 2018 2017 2016 2025
Export (EUR) 298.62 320.39 313.21 240.67 191.87 299.78
Table 24: The amount of export to Belarus from Latvia (from 2015 till October 2020) (mln., EUR) 94
93 The amount of export to Belarus from Latvia (from 2015 till October 2020) (mln., EUR) The source:
Central Bureau of Statistics of Latvia, https://eksports.csb.gov.lv/lv/years/countries-
selected/export/2020/TOTAL/BY
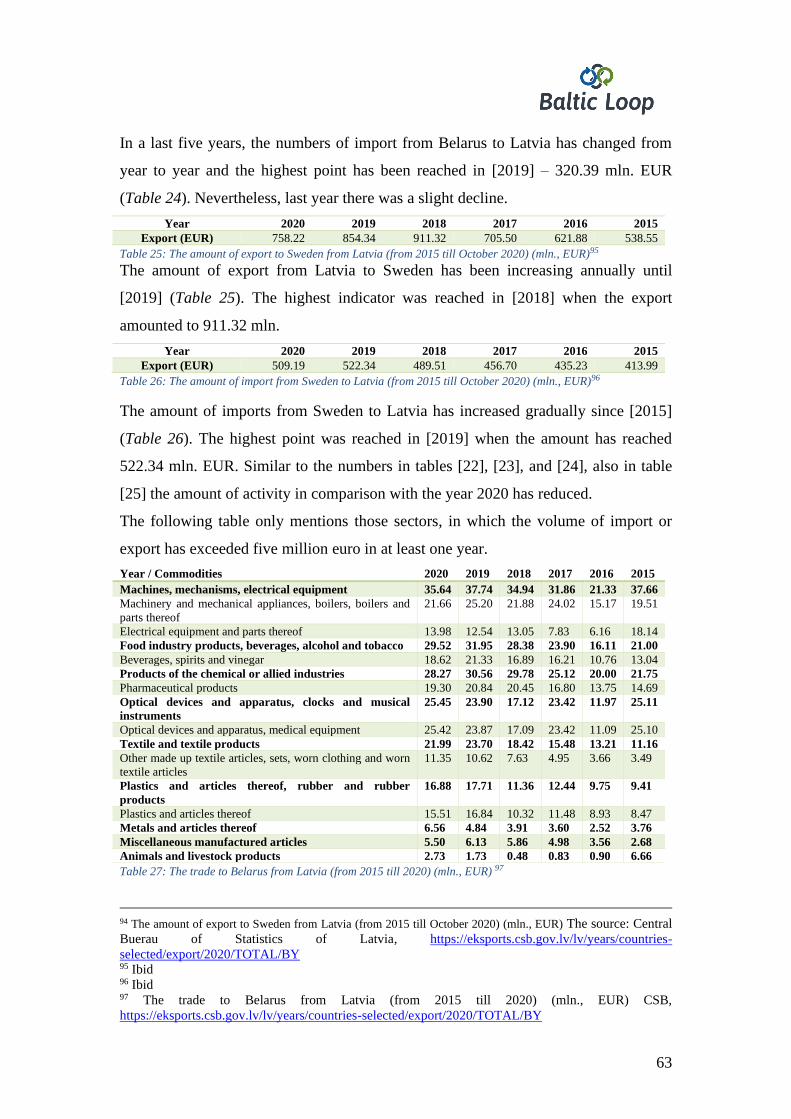
63
In a last five years, the numbers of import from Belarus to Latvia has changed from
year to year and the highest point has been reached in [2019] – 320.39 mln. EUR
(Table 24). Nevertheless, last year there was a slight decline.
Year 2020 2019 2018 2017 2016 2015
Export (EUR) 758.22 854.34 911.32 705.50 621.88 538.55
Table 25: The amount of export to Sweden from Latvia (from 2015 till October 2020) (mln., EUR)95
The amount of export from Latvia to Sweden has been increasing annually until
[2019] (Table 25). The highest indicator was reached in [2018] when the export
amounted to 911.32 mln.
Year 2020 2019 2018 2017 2016 2015
Export (EUR) 509.19 522.34 489.51 456.70 435.23 413.99
Table 26: The amount of import from Sweden to Latvia (from 2015 till October 2020) (mln., EUR)96
The amount of imports from Sweden to Latvia has increased gradually since [2015]
(Table 26). The highest point was reached in [2019] when the amount has reached
522.34 mln. EUR. Similar to the numbers in tables [22], [23], and [24], also in table
[25] the amount of activity in comparison with the year 2020 has reduced.
The following table only mentions those sectors, in which the volume of import or
export has exceeded five million euro in at least one year.
Year / Commodities 2020 2019 2018 2017 2016 2015
Machines, mechanisms, electrical equipment 35.64 37.74 34.94 31.86 21.33 37.66
Machinery and mechanical appliances, boilers, boilers and
parts thereof
21.66 25.20 21.88 24.02 15.17 19.51
Electrical equipment and parts thereof 13.98 12.54 13.05 7.83 6.16 18.14
Food industry products, beverages, alcohol and tobacco 29.52 31.95 28.38 23.90 16.11 21.00
Beverages, spirits and vinegar 18.62 21.33 16.89 16.21 10.76 13.04
Products of the chemical or allied industries 28.27 30.56 29.78 25.12 20.00 21.75
Pharmaceutical products 19.30 20.84 20.45 16.80 13.75 14.69
Optical devices and apparatus, clocks and musical
instruments
25.45 23.90 17.12 23.42 11.97 25.11
Optical devices and apparatus, medical equipment 25.42 23.87 17.09 23.42 11.09 25.10
Textile and textile products 21.99 23.70 18.42 15.48 13.21 11.16
Other made up textile articles, sets, worn clothing and worn
textile articles
11.35 10.62 7.63 4.95 3.66 3.49
Plastics and articles thereof, rubber and rubber
products
16.88 17.71 11.36 12.44 9.75 9.41
Plastics and articles thereof 15.51 16.84 10.32 11.48 8.93 8.47
Metals and articles thereof 6.56 4.84 3.91 3.60 2.52 3.76
Miscellaneous manufactured articles 5.50 6.13 5.86 4.98 3.56 2.68
Animals and livestock products 2.73 1.73 0.48 0.83 0.90 6.66
Table 27: The trade to Belarus from Latvia (from 2015 till 2020) (mln., EUR) 97
94 The amount of export to Sweden from Latvia (from 2015 till October 2020) (mln., EUR) The source: Central
Buerau of Statistics of Latvia, https://eksports.csb.gov.lv/lv/years/countries-
selected/export/2020/TOTAL/BY 95 Ibid 96 Ibid 97 The trade to Belarus from Latvia (from 2015 till 2020) (mln., EUR) CSB,
https://eksports.csb.gov.lv/lv/years/countries-selected/export/2020/TOTAL/BY
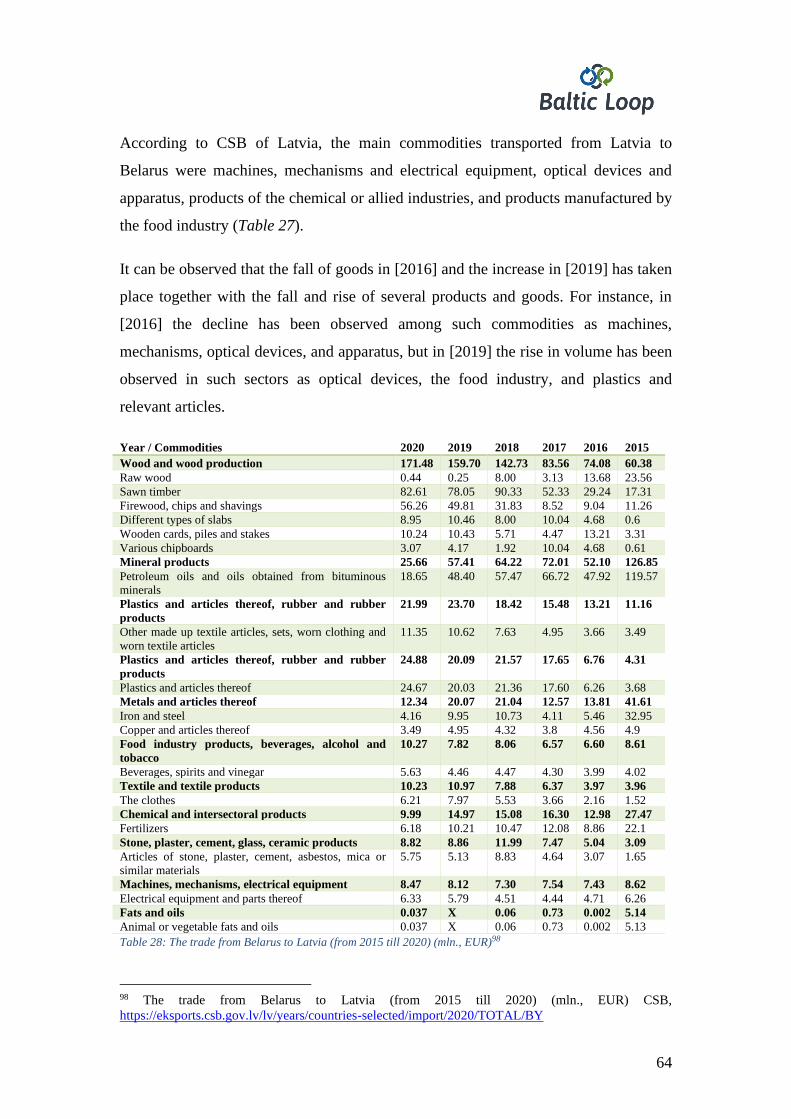
64
According to CSB of Latvia, the main commodities transported from Latvia to
Belarus were machines, mechanisms and electrical equipment, optical devices and
apparatus, products of the chemical or allied industries, and products manufactured by
the food industry (Table 27).
It can be observed that the fall of goods in [2016] and the increase in [2019] has taken
place together with the fall and rise of several products and goods. For instance, in
[2016] the decline has been observed among such commodities as machines,
mechanisms, optical devices, and apparatus, but in [2019] the rise in volume has been
observed in such sectors as optical devices, the food industry, and plastics and
relevant articles.
Year / Commodities 2020 2019 2018 2017 2016 2015
Wood and wood production 171.48 159.70 142.73 83.56 74.08 60.38
Raw wood 0.44 0.25 8.00 3.13 13.68 23.56
Sawn timber 82.61 78.05 90.33 52.33 29.24 17.31
Firewood, chips and shavings 56.26 49.81 31.83 8.52 9.04 11.26
Different types of slabs 8.95 10.46 8.00 10.04 4.68 0.6
Wooden cards, piles and stakes 10.24 10.43 5.71 4.47 13.21 3.31
Various chipboards 3.07 4.17 1.92 10.04 4.68 0.61
Mineral products 25.66 57.41 64.22 72.01 52.10 126.85
Petroleum oils and oils obtained from bituminous
minerals
18.65 48.40 57.47 66.72 47.92 119.57
Plastics and articles thereof, rubber and rubber
products
21.99 23.70 18.42 15.48 13.21 11.16
Other made up textile articles, sets, worn clothing and
worn textile articles
11.35 10.62 7.63 4.95 3.66 3.49
Plastics and articles thereof, rubber and rubber
products
24.88 20.09 21.57 17.65 6.76 4.31
Plastics and articles thereof 24.67 20.03 21.36 17.60 6.26 3.68
Metals and articles thereof 12.34 20.07 21.04 12.57 13.81 41.61
Iron and steel 4.16 9.95 10.73 4.11 5.46 32.95
Copper and articles thereof 3.49 4.95 4.32 3.8 4.56 4.9
Food industry products, beverages, alcohol and
tobacco
10.27 7.82 8.06 6.57 6.60 8.61
Beverages, spirits and vinegar 5.63 4.46 4.47 4.30 3.99 4.02
Textile and textile products 10.23 10.97 7.88 6.37 3.97 3.96
The clothes 6.21 7.97 5.53 3.66 2.16 1.52
Chemical and intersectoral products 9.99 14.97 15.08 16.30 12.98 27.47
Fertilizers 6.18 10.21 10.47 12.08 8.86 22.1
Stone, plaster, cement, glass, ceramic products 8.82 8.86 11.99 7.47 5.04 3.09
Articles of stone, plaster, cement, asbestos, mica or
similar materials
5.75 5.13 8.83 4.64 3.07 1.65
Machines, mechanisms, electrical equipment 8.47 8.12 7.30 7.54 7.43 8.62
Electrical equipment and parts thereof 6.33 5.79 4.51 4.44 4.71 6.26
Fats and oils 0.037 X 0.06 0.73 0.002 5.14
Animal or vegetable fats and oils 0.037 X 0.06 0.73 0.002 5.13
Table 28: The trade from Belarus to Latvia (from 2015 till 2020) (mln., EUR)98
98 The trade from Belarus to Latvia (from 2015 till 2020) (mln., EUR) CSB,
https://eksports.csb.gov.lv/lv/years/countries-selected/import/2020/TOTAL/BY
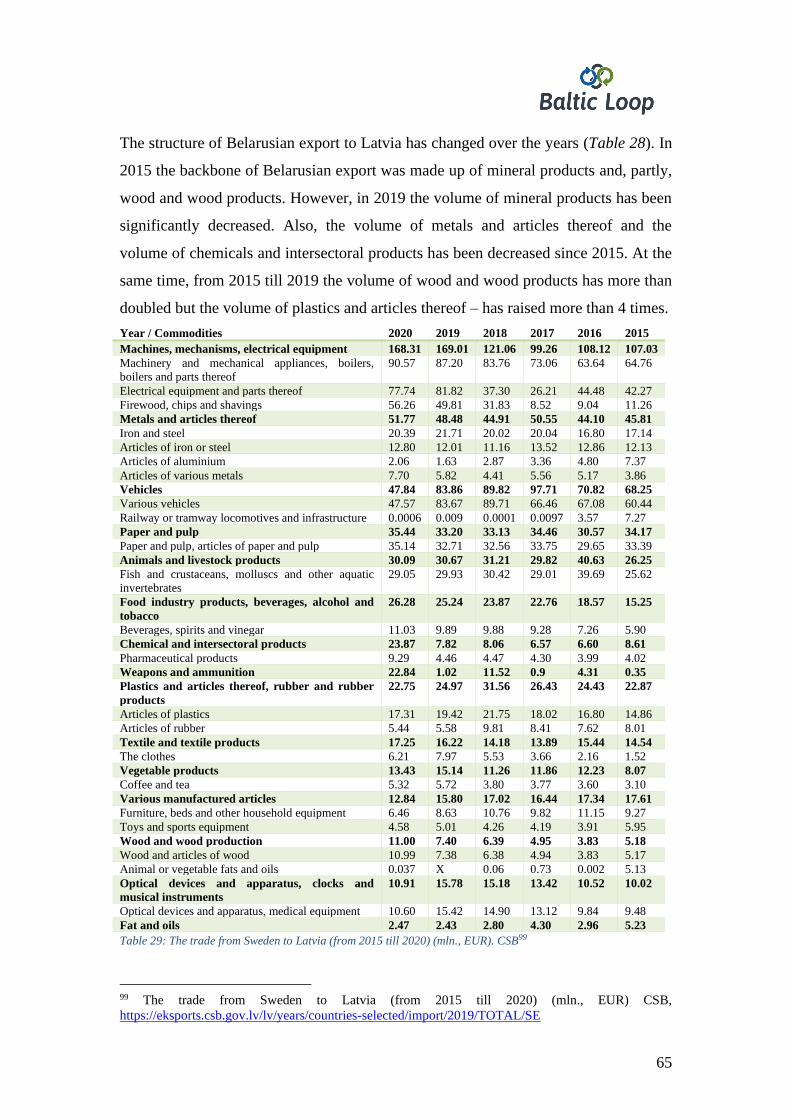
65
The structure of Belarusian export to Latvia has changed over the years (Table 28). In
2015 the backbone of Belarusian export was made up of mineral products and, partly,
wood and wood products. However, in 2019 the volume of mineral products has been
significantly decreased. Also, the volume of metals and articles thereof and the
volume of chemicals and intersectoral products has been decreased since 2015. At the
same time, from 2015 till 2019 the volume of wood and wood products has more than
doubled but the volume of plastics and articles thereof – has raised more than 4 times.
Year / Commodities 2020 2019 2018 2017 2016 2015
Machines, mechanisms, electrical equipment 168.31 169.01 121.06 99.26 108.12 107.03
Machinery and mechanical appliances, boilers,
boilers and parts thereof
90.57 87.20 83.76 73.06 63.64 64.76
Electrical equipment and parts thereof 77.74 81.82 37.30 26.21 44.48 42.27
Firewood, chips and shavings 56.26 49.81 31.83 8.52 9.04 11.26
Metals and articles thereof 51.77 48.48 44.91 50.55 44.10 45.81
Iron and steel 20.39 21.71 20.02 20.04 16.80 17.14
Articles of iron or steel 12.80 12.01 11.16 13.52 12.86 12.13
Articles of aluminium 2.06 1.63 2.87 3.36 4.80 7.37
Articles of various metals 7.70 5.82 4.41 5.56 5.17 3.86
Vehicles 47.84 83.86 89.82 97.71 70.82 68.25
Various vehicles 47.57 83.67 89.71 66.46 67.08 60.44
Railway or tramway locomotives and infrastructure 0.0006 0.009 0.0001 0.0097 3.57 7.27
Paper and pulp 35.44 33.20 33.13 34.46 30.57 34.17
Paper and pulp, articles of paper and pulp 35.14 32.71 32.56 33.75 29.65 33.39
Animals and livestock products 30.09 30.67 31.21 29.82 40.63 26.25
Fish and crustaceans, molluscs and other aquatic
invertebrates
29.05 29.93 30.42 29.01 39.69 25.62
Food industry products, beverages, alcohol and
tobacco
26.28 25.24 23.87 22.76 18.57 15.25
Beverages, spirits and vinegar 11.03 9.89 9.88 9.28 7.26 5.90
Chemical and intersectoral products 23.87 7.82 8.06 6.57 6.60 8.61
Pharmaceutical products 9.29 4.46 4.47 4.30 3.99 4.02
Weapons and ammunition 22.84 1.02 11.52 0.9 4.31 0.35
Plastics and articles thereof, rubber and rubber
products
22.75 24.97 31.56 26.43 24.43 22.87
Articles of plastics 17.31 19.42 21.75 18.02 16.80 14.86
Articles of rubber 5.44 5.58 9.81 8.41 7.62 8.01
Textile and textile products 17.25 16.22 14.18 13.89 15.44 14.54
The clothes 6.21 7.97 5.53 3.66 2.16 1.52
Vegetable products 13.43 15.14 11.26 11.86 12.23 8.07
Coffee and tea 5.32 5.72 3.80 3.77 3.60 3.10
Various manufactured articles 12.84 15.80 17.02 16.44 17.34 17.61
Furniture, beds and other household equipment 6.46 8.63 10.76 9.82 11.15 9.27
Toys and sports equipment 4.58 5.01 4.26 4.19 3.91 5.95
Wood and wood production 11.00 7.40 6.39 4.95 3.83 5.18
Wood and articles of wood 10.99 7.38 6.38 4.94 3.83 5.17
Animal or vegetable fats and oils 0.037 X 0.06 0.73 0.002 5.13
Optical devices and apparatus, clocks and
musical instruments
10.91 15.78 15.18 13.42 10.52 10.02
Optical devices and apparatus, medical equipment 10.60 15.42 14.90 13.12 9.84 9.48
Fat and oils 2.47 2.43 2.80 4.30 2.96 5.23
Table 29: The trade from Sweden to Latvia (from 2015 till 2020) (mln., EUR). CSB99
99 The trade from Sweden to Latvia (from 2015 till 2020) (mln., EUR) CSB,
https://eksports.csb.gov.lv/lv/years/countries-selected/import/2019/TOTAL/SE
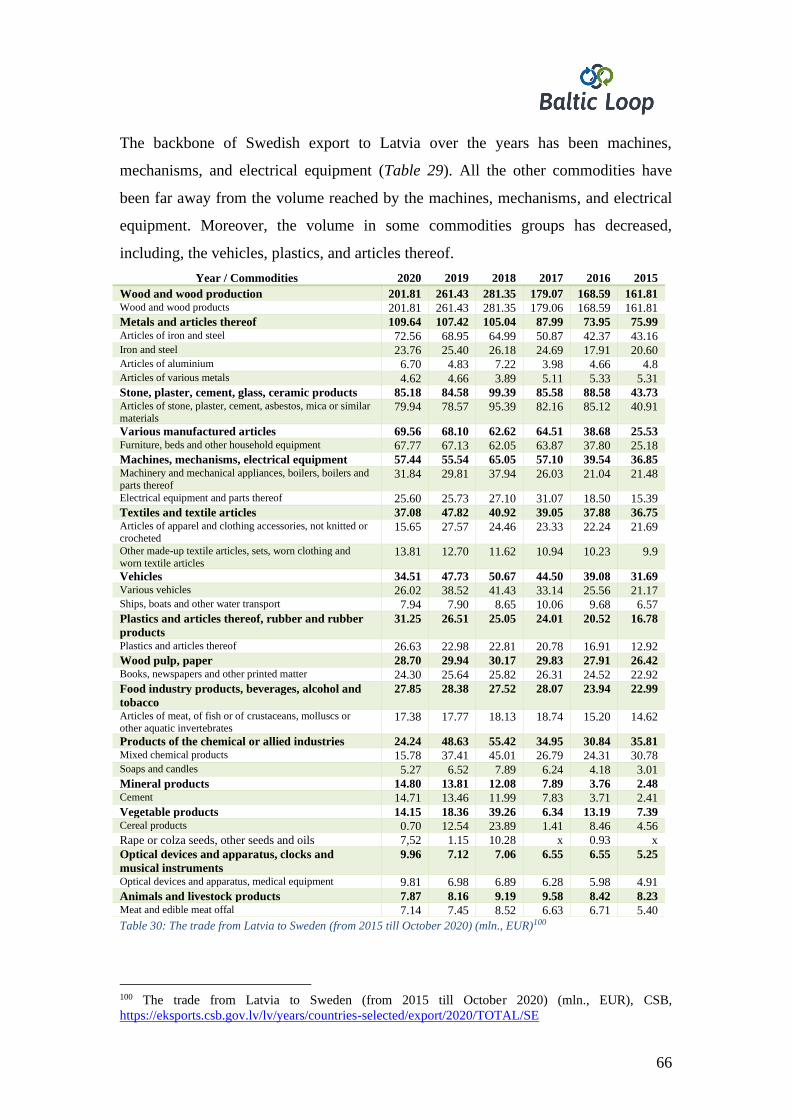
66
The backbone of Swedish export to Latvia over the years has been machines,
mechanisms, and electrical equipment (Table 29). All the other commodities have
been far away from the volume reached by the machines, mechanisms, and electrical
equipment. Moreover, the volume in some commodities groups has decreased,
including, the vehicles, plastics, and articles thereof.
Year / Commodities 2020 2019 2018 2017 2016 2015
Wood and wood production 201.81 261.43 281.35 179.07 168.59 161.81 Wood and wood products 201.81 261.43 281.35 179.06 168.59 161.81
Metals and articles thereof 109.64 107.42 105.04 87.99 73.95 75.99 Articles of iron and steel 72.56 68.95 64.99 50.87 42.37 43.16 Iron and steel 23.76 25.40 26.18 24.69 17.91 20.60 Articles of aluminium 6.70 4.83 7.22 3.98 4.66 4.8 Articles of various metals 4.62 4.66 3.89 5.11 5.33 5.31
Stone, plaster, cement, glass, ceramic products 85.18 84.58 99.39 85.58 88.58 43.73 Articles of stone, plaster, cement, asbestos, mica or similar
materials 79.94 78.57 95.39 82.16 85.12 40.91
Various manufactured articles 69.56 68.10 62.62 64.51 38.68 25.53 Furniture, beds and other household equipment 67.77 67.13 62.05 63.87 37.80 25.18
Machines, mechanisms, electrical equipment 57.44 55.54 65.05 57.10 39.54 36.85 Machinery and mechanical appliances, boilers, boilers and
parts thereof 31.84 29.81 37.94 26.03 21.04 21.48
Electrical equipment and parts thereof 25.60 25.73 27.10 31.07 18.50 15.39
Textiles and textile articles 37.08 47.82 40.92 39.05 37.88 36.75 Articles of apparel and clothing accessories, not knitted or
crocheted 15.65 27.57 24.46 23.33 22.24 21.69
Other made-up textile articles, sets, worn clothing and
worn textile articles 13.81 12.70 11.62 10.94 10.23 9.9
Vehicles 34.51 47.73 50.67 44.50 39.08 31.69 Various vehicles 26.02 38.52 41.43 33.14 25.56 21.17 Ships, boats and other water transport 7.94 7.90 8.65 10.06 9.68 6.57
Plastics and articles thereof, rubber and rubber
products
31.25 26.51 25.05 24.01 20.52 16.78
Plastics and articles thereof 26.63 22.98 22.81 20.78 16.91 12.92
Wood pulp, paper 28.70 29.94 30.17 29.83 27.91 26.42 Books, newspapers and other printed matter 24.30 25.64 25.82 26.31 24.52 22.92
Food industry products, beverages, alcohol and
tobacco
27.85 28.38 27.52 28.07 23.94 22.99
Articles of meat, of fish or of crustaceans, molluscs or
other aquatic invertebrates 17.38 17.77 18.13 18.74 15.20 14.62
Products of the chemical or allied industries 24.24 48.63 55.42 34.95 30.84 35.81 Mixed chemical products 15.78 37.41 45.01 26.79 24.31 30.78 Soaps and candles 5.27 6.52 7.89 6.24 4.18 3.01
Mineral products 14.80 13.81 12.08 7.89 3.76 2.48 Cement 14.71 13.46 11.99 7.83 3.71 2.41
Vegetable products 14.15 18.36 39.26 6.34 13.19 7.39 Cereal products 0.70 12.54 23.89 1.41 8.46 4.56
Rape or colza seeds, other seeds and oils 7,52 1.15 10.28 x 0.93 x
Optical devices and apparatus, clocks and
musical instruments
9.96 7.12 7.06 6.55 6.55 5.25
Optical devices and apparatus, medical equipment 9.81 6.98 6.89 6.28 5.98 4.91
Animals and livestock products 7.87 8.16 9.19 9.58 8.42 8.23 Meat and edible meat offal 7.14 7.45 8.52 6.63 6.71 5.40
Table 30: The trade from Latvia to Sweden (from 2015 till October 2020) (mln., EUR)100
100 The trade from Latvia to Sweden (from 2015 till October 2020) (mln., EUR), CSB,
https://eksports.csb.gov.lv/lv/years/countries-selected/export/2020/TOTAL/SE
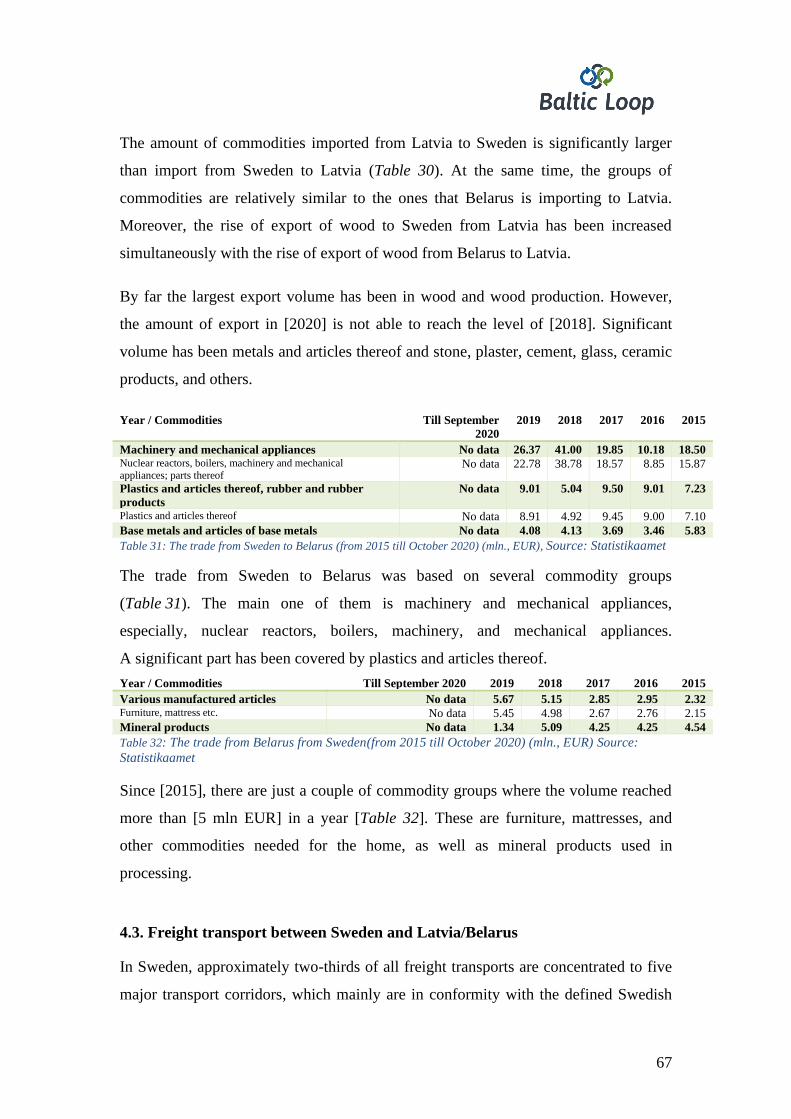
67
The amount of commodities imported from Latvia to Sweden is significantly larger
than import from Sweden to Latvia (Table 30). At the same time, the groups of
commodities are relatively similar to the ones that Belarus is importing to Latvia.
Moreover, the rise of export of wood to Sweden from Latvia has been increased
simultaneously with the rise of export of wood from Belarus to Latvia.
By far the largest export volume has been in wood and wood production. However,
the amount of export in [2020] is not able to reach the level of [2018]. Significant
volume has been metals and articles thereof and stone, plaster, cement, glass, ceramic
products, and others.
Year / Commodities Till September
2020
2019 2018 2017 2016 2015
Machinery and mechanical appliances No data 26.37 41.00 19.85 10.18 18.50 Nuclear reactors, boilers, machinery and mechanical
appliances; parts thereof No data 22.78 38.78 18.57 8.85 15.87
Plastics and articles thereof, rubber and rubber
products
No data 9.01 5.04 9.50 9.01 7.23
Plastics and articles thereof No data 8.91 4.92 9.45 9.00 7.10
Base metals and articles of base metals No data 4.08 4.13 3.69 3.46 5.83
Table 31: The trade from Sweden to Belarus (from 2015 till October 2020) (mln., EUR), Source: Statistikaamet
The trade from Sweden to Belarus was based on several commodity groups
(Table 31). The main one of them is machinery and mechanical appliances,
especially, nuclear reactors, boilers, machinery, and mechanical appliances.
A significant part has been covered by plastics and articles thereof.
Year / Commodities Till September 2020 2019 2018 2017 2016 2015
Various manufactured articles No data 5.67 5.15 2.85 2.95 2.32 Furniture, mattress etc. No data 5.45 4.98 2.67 2.76 2.15
Mineral products No data 1.34 5.09 4.25 4.25 4.54
Table 32: The trade from Belarus from Sweden(from 2015 till October 2020) (mln., EUR) Source:
Statistikaamet
Since [2015], there are just a couple of commodity groups where the volume reached
more than [5 mln EUR] in a year [Table 32]. These are furniture, mattresses, and
other commodities needed for the home, as well as mineral products used in
processing.
4.3. Freight transport between Sweden and Latvia/Belarus
In Sweden, approximately two-thirds of all freight transports are concentrated to five
major transport corridors, which mainly are in conformity with the defined Swedish
68
sections of the TEN-T core network. Seen both from a national and international
perspective, the major transport routes and nodes stand well over time. One of the
corridors is between the East European Continent – Baltic Sea Coast.101
Many Swedish ports are specialised in handling only certain types of goods. The ports
of Göteborg, Brofjorden, Helsingborg, Malmö, Trelleborg, Stockholm and Luleå are
the main gateway ports in foreign trade.102
The port of Nynäshamn is located 270.45 km away from Ventspils, Latvia, and is one
of the parts of the port of Stockholm. Therefore it is the closest port on the Swedish
mainland. However, the port of Visby, located on Gotland, is located even closer –
198 km from Ventspils but there are not so many other sea routes as in Nynäshamn
and this is not such an economical centre and region as Stockholm.
The largest port in Sweden based on the volume of cargo103 – the port of Gothenburg
– geographically is located in the western part of Sweden and even further than a port
of Stockholm – 761 km, including sea route Ventspils – Nynäshamn and highway
Nynäshamn – Gothenburg. Also, the second largest port in Sweden – the port of
Trelleborg – geographically is located in another part of Sweden – south-west of
Sweden – that is further than the port of Stockholm or 563 km. The port of Stockholm
is the third biggest port of Sweden.
One more reason why the port of Stockholm is a more profitable partner for Ventspils
is the fact that Stockholm and the region of Stockholm are highly technologically
developed and are in a densely populated region. The Stockholm-Mälar region
101 Identification of bottlenecks and inefficiencies on selected East-West corridors, Survey summary
report, Corridors: Northern corridor, Middle corridor and Southern corridor, Wahlström, I., Åbo
Akademi University, September, 2020., P.21., 24. 102 Identification of bottlenecks and inefficiencies on selected East-West corridors, Survey summary
report, Corridors: Northern corridor, Middle corridor and Southern corridor, Wahlström, I., Åbo
Akademi University, September, 2020, P.27.. 103 Largest ports in Sweden in 2018, based on volume of cargo, www.statista.com,
https://www.statista.com/statistics/1066646/ranking-of-ports-in-sweden-based-on-volume-of-goods/,
69
constitutes the biggest consumer market in Sweden, with extensive product
production and large transit flows of goods.104
And, finally, the port of Stockholm is a good starting point for the distribution of the
commodities not only in Sweden but also in other parts of Northern Europe and even
other parts of Europe. There are five main major routes in Sweden and Stockholm is a
part of at least in a three of them, therefore ensuring the transit of foreign
commodities. The port of Stockholm has a direct approach to the Corridor 1 (North
Calotte – Norrland Coast – Bergslagen/Mälardalen – Malmö /Trelleborg – continental
Europe), Coridor 2 (Göteborg–Stockholm–Oslo), and Corridor 5 (The East European
Continent–Baltic Sea Coast) According to [Map 3], there are five bottlenecks in
Swedish transport system:
• Corridor 1: North Calotte–Norrland Coast–Bergslagen/Mälardalen–
Malmö/Trelleborg–continental Europe (Red)
• Corridor 2: Göteborg–Stockholm–Oslo (Orange; mainly E20, National road
40, E4 and the Western mainline) with extension from Stockholm eastward)
• Corridor 3: Norway–Gothenburg–Malmö–Continental Europe (Green)
• Corridor 4: West coast–European Continent- rest of the world (Yellow)
• Corridor 5: The East European Continent–Baltic Sea Coast (Blue)105
104 „Identification of bottlenecks and inefficiencies on selected East-West corridors”, Wählstrom, I.,
Abo Akademi University, Survey summary report, Corridors: Northern corridor, Middle corridor and
Southern corridor. September, 2020., P.23. 105 Main transport corridors in Sweden. Identification of Bottlenecks and Inefficiencies on Selected
East-West Corridors. P.21. Trafikverket.
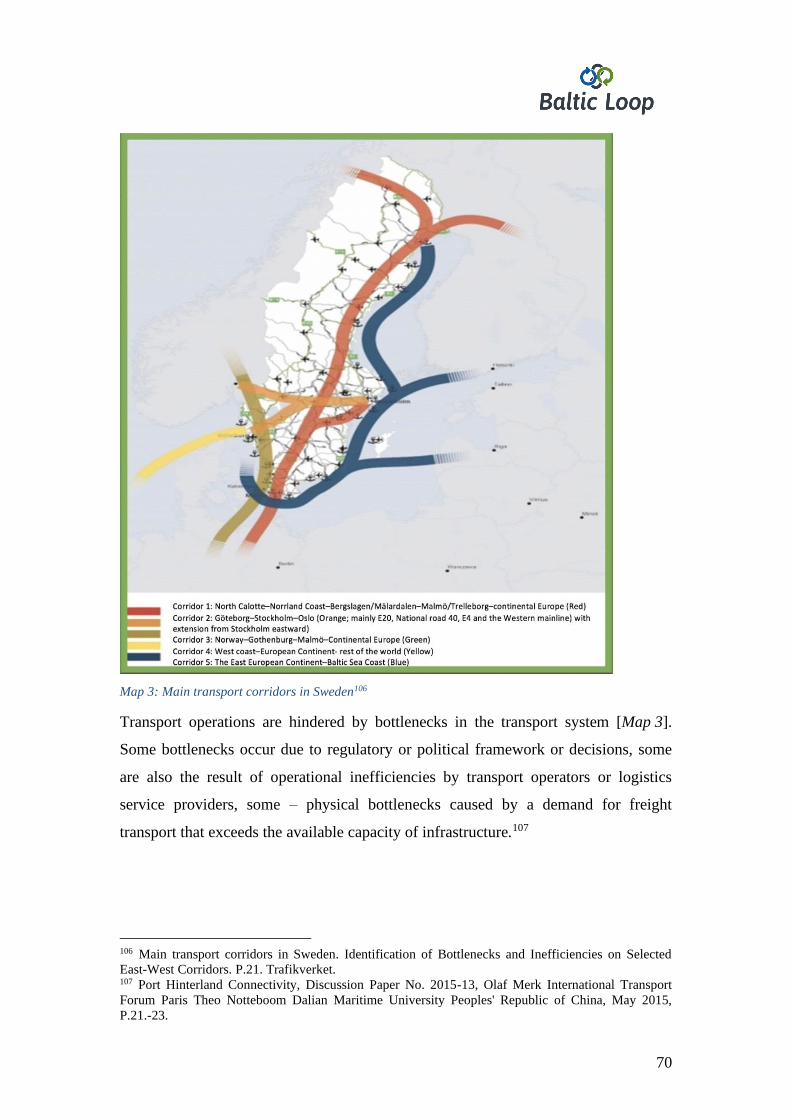
70
Map 3: Main transport corridors in Sweden106
Transport operations are hindered by bottlenecks in the transport system [Map 3].
Some bottlenecks occur due to regulatory or political framework or decisions, some
are also the result of operational inefficiencies by transport operators or logistics
service providers, some – physical bottlenecks caused by a demand for freight
transport that exceeds the available capacity of infrastructure.107
106 Main transport corridors in Sweden. Identification of Bottlenecks and Inefficiencies on Selected
East-West Corridors. P.21. Trafikverket. 107 Port Hinterland Connectivity, Discussion Paper No. 2015-13, Olaf Merk International Transport
Forum Paris Theo Notteboom Dalian Maritime University Peoples' Republic of China, May 2015,
P.21.-23.
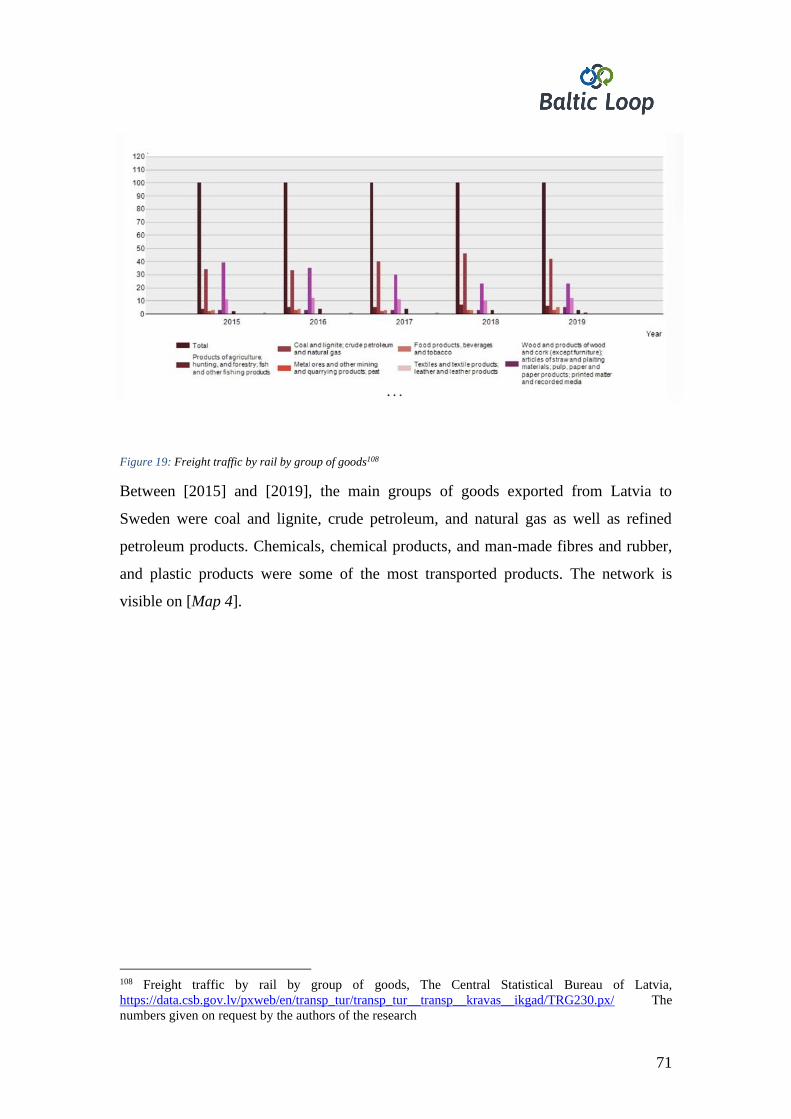
71
Figure 19: Freight traffic by rail by group of goods108
Between [2015] and [2019], the main groups of goods exported from Latvia to
Sweden were coal and lignite, crude petroleum, and natural gas as well as refined
petroleum products. Chemicals, chemical products, and man-made fibres and rubber,
and plastic products were some of the most transported products. The network is
visible on [Map 4].
108 Freight traffic by rail by group of goods, The Central Statistical Bureau of Latvia,
https://data.csb.gov.lv/pxweb/en/transp_tur/transp_tur__transp__kravas__ikgad/TRG230.px/ The
numbers given on request by the authors of the research
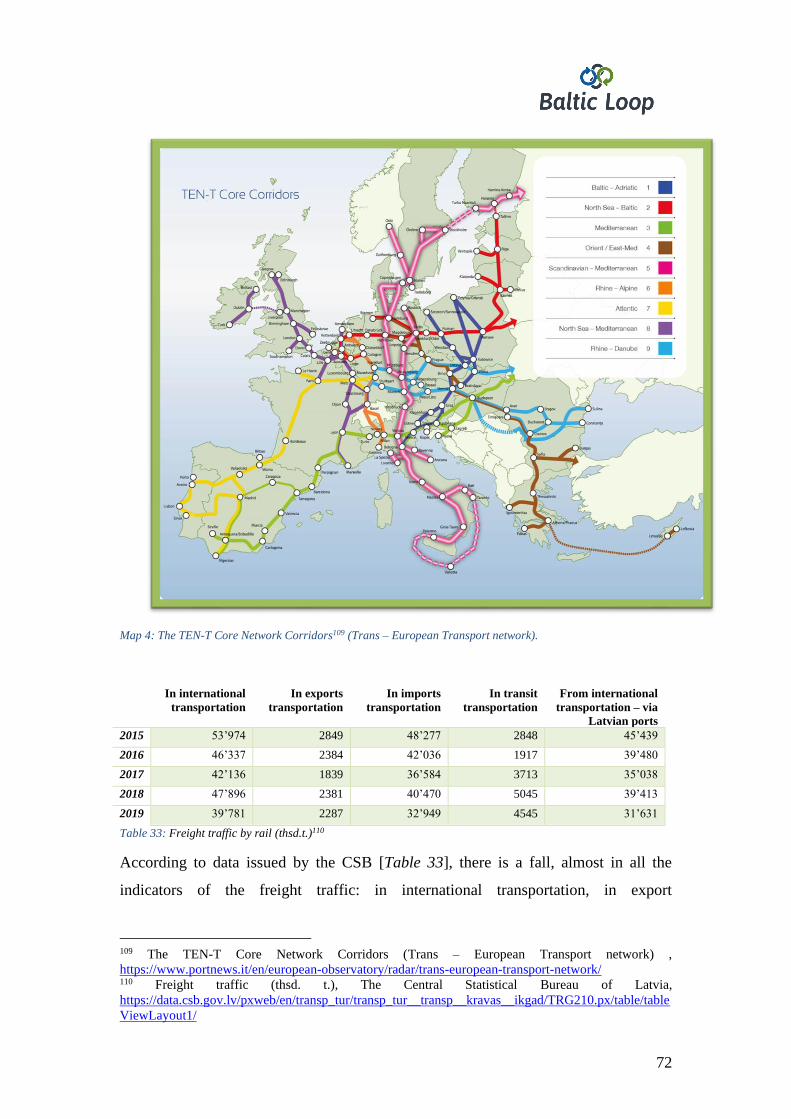
72
Map 4: The TEN-T Core Network Corridors109 (Trans – European Transport network).
In international
transportation
In exports
transportation
In imports
transportation
In transit
transportation
From international
transportation – via
Latvian ports
2015 53’974 2849 48’277 2848 45’439
2016 46’337 2384 42’036 1917 39’480
2017 42’136 1839 36’584 3713 35’038
2018 47’896 2381 40’470 5045 39’413
2019 39’781 2287 32’949 4545 31’631
Table 33: Freight traffic by rail (thsd.t.)110
According to data issued by the CSB [Table 33], there is a fall, almost in all the
indicators of the freight traffic: in international transportation, in export
109 The TEN-T Core Network Corridors (Trans – European Transport network) ,
https://www.portnews.it/en/european-observatory/radar/trans-european-transport-network/ 110 Freight traffic (thsd. t.), The Central Statistical Bureau of Latvia,
https://data.csb.gov.lv/pxweb/en/transp_tur/transp_tur__transp__kravas__ikgad/TRG210.px/table/table
ViewLayout1/
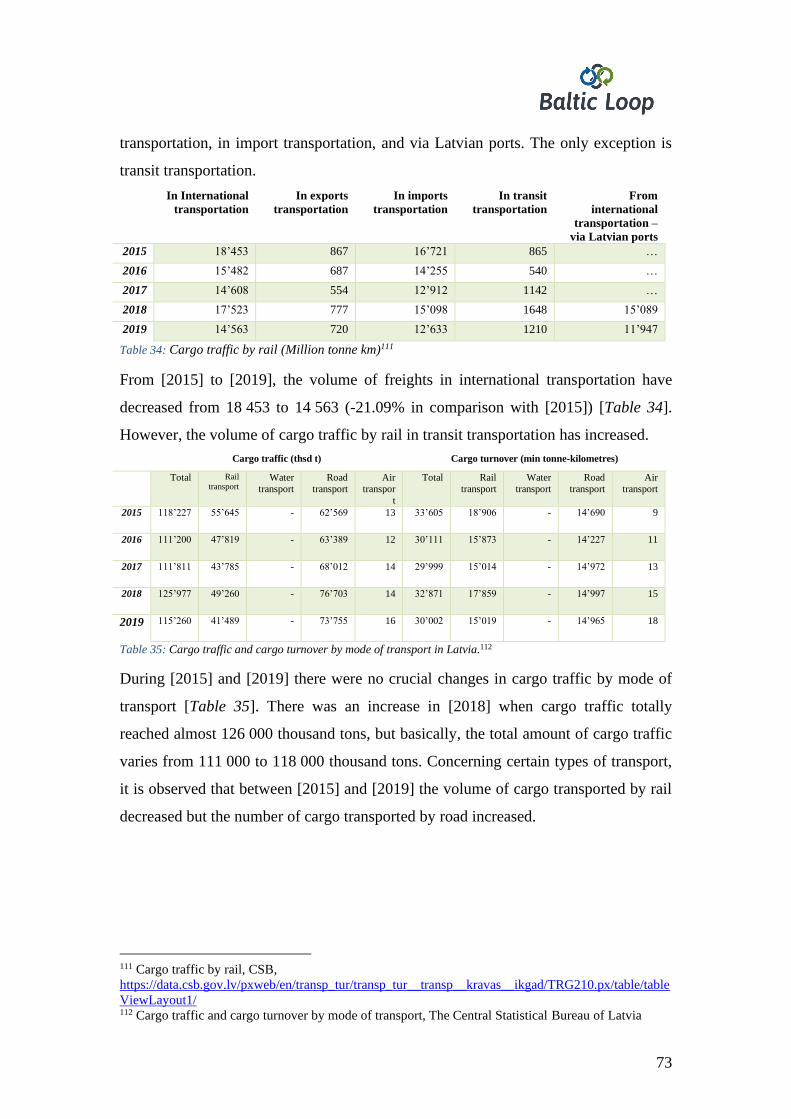
73
transportation, in import transportation, and via Latvian ports. The only exception is
transit transportation.
In International
transportation
In exports
transportation
In imports
transportation
In transit
transportation
From
international
transportation –
via Latvian ports
2015 18’453 867 16’721 865 …
2016 15’482 687 14’255 540 …
2017 14’608 554 12’912 1142 …
2018 17’523 777 15’098 1648 15’089
2019 14’563 720 12’633 1210 11’947
Table 34: Cargo traffic by rail (Million tonne km)111
From [2015] to [2019], the volume of freights in international transportation have
decreased from 18 453 to 14 563 (-21.09% in comparison with [2015]) [Table 34].
However, the volume of cargo traffic by rail in transit transportation has increased.
Cargo traffic (thsd t) Cargo turnover (min tonne-kilometres)
Total Rail
transport Water
transport
Road
transport
Air
transpor
t
Total Rail
transport
Water
transport
Road
transport
Air
transport
2015 118’227 55’645 - 62’569 13 33’605 18’906 - 14’690 9
2016 111’200 47’819 - 63’389 12 30’111 15’873 - 14’227 11
2017 111’811 43’785 - 68’012 14 29’999 15’014 - 14’972 13
2018 125’977 49’260 - 76’703 14 32’871 17’859 - 14’997 15
2019 115’260 41’489 - 73’755 16 30’002 15’019 - 14’965 18
Table 35: Cargo traffic and cargo turnover by mode of transport in Latvia.112
During [2015] and [2019] there were no crucial changes in cargo traffic by mode of
transport [Table 35]. There was an increase in [2018] when cargo traffic totally
reached almost 126 000 thousand tons, but basically, the total amount of cargo traffic
varies from 111 000 to 118 000 thousand tons. Concerning certain types of transport,
it is observed that between [2015] and [2019] the volume of cargo transported by rail
decreased but the number of cargo transported by road increased.
111 Cargo traffic by rail, CSB,
https://data.csb.gov.lv/pxweb/en/transp_tur/transp_tur__transp__kravas__ikgad/TRG210.px/table/table
ViewLayout1/ 112 Cargo traffic and cargo turnover by mode of transport, The Central Statistical Bureau of Latvia
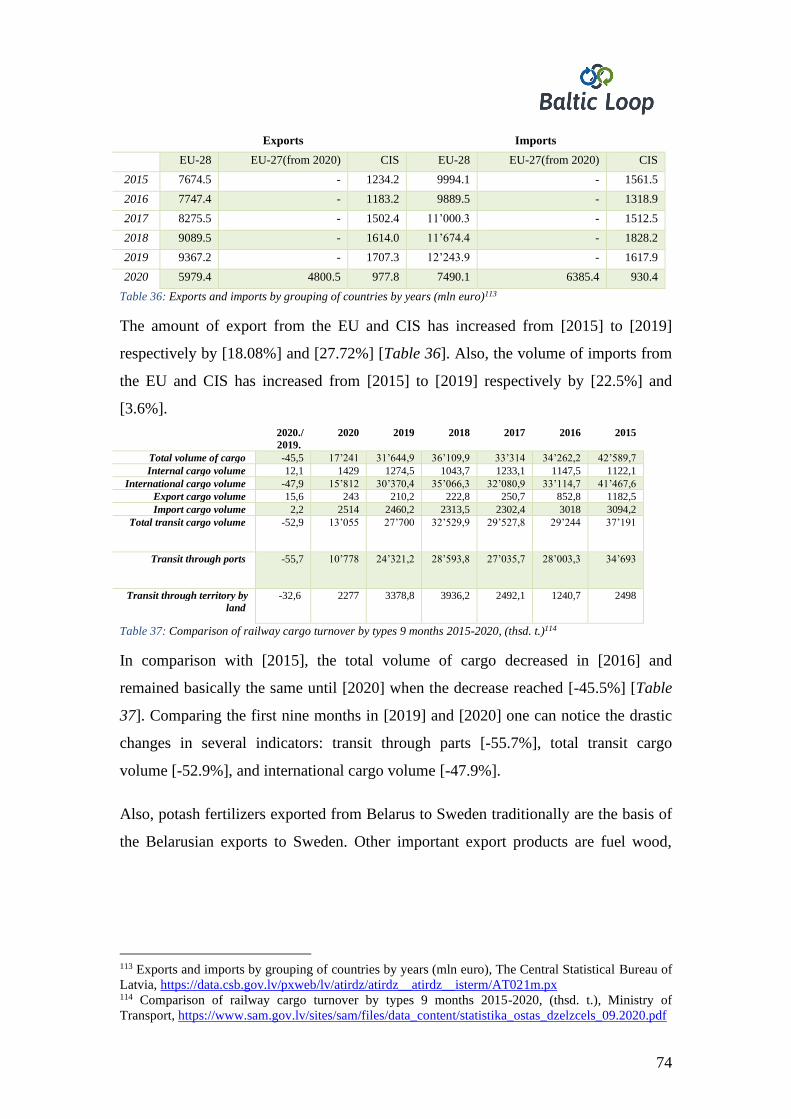
74
Exports Imports
EU-28 EU-27(from 2020) CIS EU-28 EU-27(from 2020) CIS
2015 7674.5 - 1234.2 9994.1 - 1561.5
2016 7747.4 - 1183.2 9889.5 - 1318.9
2017 8275.5 - 1502.4 11’000.3 - 1512.5
2018 9089.5 - 1614.0 11’674.4 - 1828.2
2019 9367.2 - 1707.3 12’243.9 - 1617.9
2020 5979.4 4800.5 977.8 7490.1 6385.4 930.4
Table 36: Exports and imports by grouping of countries by years (mln euro)113
The amount of export from the EU and CIS has increased from [2015] to [2019]
respectively by [18.08%] and [27.72%] [Table 36]. Also, the volume of imports from
the EU and CIS has increased from [2015] to [2019] respectively by [22.5%] and
[3.6%].
2020./
2019.
2020 2019 2018 2017 2016 2015
Total volume of cargo -45,5 17’241 31’644,9 36’109,9 33’314 34’262,2 42’589,7
Internal cargo volume 12,1 1429 1274,5 1043,7 1233,1 1147,5 1122,1
International cargo volume -47,9 15’812 30’370,4 35’066,3 32’080,9 33’114,7 41’467,6
Export cargo volume 15,6 243 210,2 222,8 250,7 852,8 1182,5
Import cargo volume 2,2 2514 2460,2 2313,5 2302,4 3018 3094,2
Total transit cargo volume -52,9 13’055 27’700 32’529,9 29’527,8 29’244 37’191
Transit through ports -55,7 10’778 24’321,2 28’593,8 27’035,7 28’003,3 34’693
Transit through territory by
land
-32,6 2277 3378,8 3936,2 2492,1 1240,7 2498
Table 37: Comparison of railway cargo turnover by types 9 months 2015-2020, (thsd. t.)114
In comparison with [2015], the total volume of cargo decreased in [2016] and
remained basically the same until [2020] when the decrease reached [-45.5%] [Table
37]. Comparing the first nine months in [2019] and [2020] one can notice the drastic
changes in several indicators: transit through parts [-55.7%], total transit cargo
volume [-52.9%], and international cargo volume [-47.9%].
Also, potash fertilizers exported from Belarus to Sweden traditionally are the basis of
the Belarusian exports to Sweden. Other important export products are fuel wood,
113 Exports and imports by grouping of countries by years (mln euro), The Central Statistical Bureau of
Latvia, https://data.csb.gov.lv/pxweb/lv/atirdz/atirdz__atirdz__isterm/AT021m.px 114 Comparison of railway cargo turnover by types 9 months 2015-2020, (thsd. t.), Ministry of
Transport, https://www.sam.gov.lv/sites/sam/files/data_content/statistika_ostas_dzelzcels_09.2020.pdf
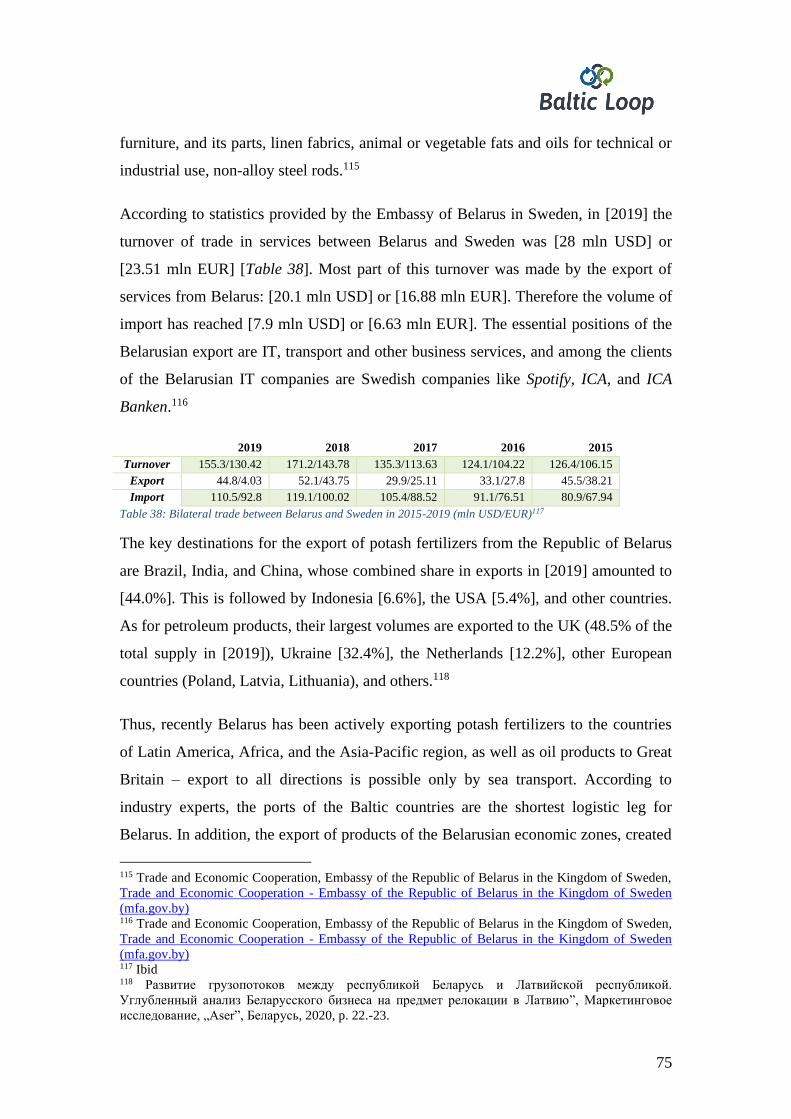
75
furniture, and its parts, linen fabrics, animal or vegetable fats and oils for technical or
industrial use, non-alloy steel rods.115
According to statistics provided by the Embassy of Belarus in Sweden, in [2019] the
turnover of trade in services between Belarus and Sweden was [28 mln USD] or
[23.51 mln EUR] [Table 38]. Most part of this turnover was made by the export of
services from Belarus: [20.1 mln USD] or [16.88 mln EUR]. Therefore the volume of
import has reached [7.9 mln USD] or [6.63 mln EUR]. The essential positions of the
Belarusian export are IT, transport and other business services, and among the clients
of the Belarusian IT companies are Swedish companies like Spotify, ICA, and ICA
Banken.116
2019 2018 2017 2016 2015
Turnover 155.3/130.42 171.2/143.78 135.3/113.63 124.1/104.22 126.4/106.15
Export 44.8/4.03 52.1/43.75 29.9/25.11 33.1/27.8 45.5/38.21
Import 110.5/92.8 119.1/100.02 105.4/88.52 91.1/76.51 80.9/67.94
Table 38: Bilateral trade between Belarus and Sweden in 2015-2019 (mln USD/EUR)117
The key destinations for the export of potash fertilizers from the Republic of Belarus
are Brazil, India, and China, whose combined share in exports in [2019] amounted to
[44.0%]. This is followed by Indonesia [6.6%], the USA [5.4%], and other countries.
As for petroleum products, their largest volumes are exported to the UK (48.5% of the
total supply in [2019]), Ukraine [32.4%], the Netherlands [12.2%], other European
countries (Poland, Latvia, Lithuania), and others.118
Thus, recently Belarus has been actively exporting potash fertilizers to the countries
of Latin America, Africa, and the Asia-Pacific region, as well as oil products to Great
Britain – export to all directions is possible only by sea transport. According to
industry experts, the ports of the Baltic countries are the shortest logistic leg for
Belarus. In addition, the export of products of the Belarusian economic zones, created
115 Trade and Economic Cooperation, Embassy of the Republic of Belarus in the Kingdom of Sweden,
Trade and Economic Cooperation - Embassy of the Republic of Belarus in the Kingdom of Sweden
(mfa.gov.by) 116 Trade and Economic Cooperation, Embassy of the Republic of Belarus in the Kingdom of Sweden,
Trade and Economic Cooperation - Embassy of the Republic of Belarus in the Kingdom of Sweden
(mfa.gov.by) 117 Ibid 118 Развитие грузопотоков между республикой Беларусь и Латвийской республикой.
Углубленный анализ Беларусского бизнеса на предмет релокации в Латвию”, Маркетинговое
исследование, „Aser”, Беларусь, 2020, p. 22.-23.
76
with the participation of Chinese capital, goes through these sea harbors. Moreover,
they find a place for the transportation of Russian, Kazakh, and other foreign trade
goods through such ports of the Baltic Sea as Klaipeda (Lithuania), Riga (Latvia),
Ventspils (Latvia), Kaliningrad (Russia), etc., passing through the territory of
Belarus.119
4.4. Forecast analysis on Belarus-Latvia-Sweden Corridor
In January 2020, the Minister of Transport of Latvia Talis Linkaits noted that one of
the ways to develop cooperation with Belarus is to establish a state-owned oil
terminal because Belarus is also used to working with state guarantees and state-
owned structures. At that time all port terminals are private and thus decisions are
made based on their business interests. He also noted that Belarus has addressed
several terminals in Riga and Ventspils about possible cooperation, and the issue is
being addressed. The Minister also emphasised that Latvian ports have the technical
possibility to tranship oil and petroleum products to and from Belarus – in both
directions. There are technical possibilities to organise the supply of Belarusian oil
both in the ports of Riga and Ventspils and in one terminal also in the port of
Liepaja.120
One should take into account that at this very moment there are two institutions that
work on attracting potential investors. This feature can make it more difficult the
cooperation with potential investors since they are not sure which institution should
be the right one. However, recently foreign enterprises have been attracted and now
operate in Ventspils. Among them, one company from Belarus – Ultraplast EU – that
produces polycarbonate sheets.121122
119 Развитие грузопотоков между республикой Беларусь и Латвийской республикой.
Углубленный анализ Беларусского бизнеса на предмет релокации в Латвию”, Маркетинговое
исследование, „Aser”, Беларусь, 2020, p. 23. 120 „Linkaits: Iespējams, valstij vajadzētu investēt ostu terminālī, lai nodrošinātu kravu plūsmu”,
www.delfi.lv, https://www.delfi.lv/bizness/biznesa_vide/linkaits-iespejams-valstij-vajadzetu-investet-
ostu-terminali-lai-nodrosinatu-kravu-plusmu.d?id=51829815 27.01.2020. 121 „Liepājas ostā cerīgi raugās uz nākotni; Ventspils ostu plosa konflikts”, www.lsm.lv, Liepājas ostā
cerīgi raugās uz nākotni; Ventspils ostu plosa konflikts / Raksts / LSM.lv, 06.02.2021. 122 Ventspilī ražos politkarbonāta loksnes, https://www.portofventspils.lv/lv/jaunumi-un-
notikumi/ventspili-razos-polikarbonata-loksnes/ , 27.11.2019.
77
One of the things that can influence the politics of Belarusian cargo transit is the
relationships between Russia and Belarus. With increasing political problems in
Belarus and the sanctions against Belarus introduced by the Baltic States, the Russian
prime minister Mikhail Mishustin and Belarusian prime minister Roman
Golovchenko have discussed the possibility to divert transit from the Baltics to
Russia.123124
Moreover, the Russian Ministry of Transport can suggest that Belarusian shippers
construct a fertilizer terminal in a Russian port, according to Deputy Minister Yuri
Tsvetkov. However, the Russian Railways already provides a [50%] discount for its
Belarusian colleagues. The throughput cost in ports is often higher though because
there are no long-term Take-or-Pay contracts. No discounts from the budget are
planned to reduce the transportation cost of Belarusian goods.125
Therefore, at the beginning of [2021] Klaipedos nafta (KN) acknowledged that [2021]
is going to be tough, because Belarusian Oil Company (BOC) decided temporarily to
stop the export of oil products through Klaipeda.126 And, finally, in 2021, Lithuania
acknowledged that fact and added that this decision will unfavourably influence the
port of Klaipeda and LR. According to Lithuanian authorities, the agreement between
Belarus and Russia is not economically justified and both Lithuania and Belarus are
no winners in this situation.127
123 „Krievija un Baltkrievija apspriedušas naftas plūsmu pārorientēšanu no Klaipēdas uz Krievijas
ostām”, www.delfi.lv, https://www.delfi.lv/news/arzemes/krievija-un-baltkrievija-apspriedusas-naftas-
plusmu-parorientesanu-no-
s-uz-krievijas-ostam.d?id=52437371 03.09.2020 124 „Belarus may stop oil supplies via Klaipeda port”, https://belsat.eu/en/,
https://belsat.eu/en/news/belarus-may-stop-oil-supplies-via-klaipeda-port/ 17.12.2020. 125 „Moscow eyes proposal for Belarus to build fertilizer terminal in Russian port”,
https://www.hellenicshippingnews.com/, https://www.hellenicshippingnews.com/moscow-eyes-
proposal-for-belarus-to-build-fertilizer-terminal-in-russian-port/, 25.11.2020. 126„Потерявшую белорусские грузы компанию Klaipedos nafta ожидает сложный год”,
https://www.delfi.lt/ru/, https://www.delfi.lt/ru/news/economy/poteryavshuyu-belorusskie-gruzy-
kompaniyu-klaipedos-nafta-ozhidaet-slozhnyj-god.d?id=86360971 , 29.01.2021. 127 „Baltkrievijas naftas produkti turpmāk tiks eksportēti caur Krievijas ostām, nevis Klaipēdu”,
www.delfi.lv, https://www.delfi.lv/bizness/pasaule/baltkrievijas-naftas-produkti-turpmak-tiks-
eksporteti-caur-krievijas-ostam-nevis-klaipedu.d?id=52958977, 22.02.2021.
78
Even before these announcements reached the population, Latvia also did not hide
that despite the fact that the policy has not affected the volume of cargo transhipped
through Latvia, it cannot be sure that the situation will not change.128129130
Therefore, one of the alternatives for the Freeport of Ventspils is cargoes from China.
Moreover, China is searching for new ways to ensure its cargo to Europe. Latvia is
mainly advantageous for those cargo that are sent to Sweden and Norway.131 Besides
Latvian officials have already started to search for opportunities to ensure the flow of
transit between Scandinavia (first of all, Sweden) and CIS countries, Central Asia, the
Middle East, and China. Taking into account that China wants to increase the volume
of cargo to Scandinavia, Latvia has already started to research ways to provide more
services of the Latvian ports for the Belarusian partners.132
Poland is also working on developing routes around Eastern Europe and the Baltic
Sea. Poland’s port of Gdansk has signed a letter of intent with the Ukrainian Sea Ports
Authority to open up a new alternative transport corridor between the Black Sea and
the Baltics.133
At the same time, the Freeport of Ventspils continues to strengthen its cooperation
with Stena Line. The universal cargo terminal SIA Noord Natie Ventspils Terminals
has signed a 20-year agreement with Swedish shipping company Stena Line.
According to the agreement, both sides are going to invest in the zone of the terminal
for meeting growing and current tonnage needs. Stena Line emphasises that Ventspils
128 „Baltkrievu kravu zaudēšana vairāk kaitētu Ventspils ostai un „Latvijas dzelzceļam””, www.lsm.lv<
https://www.lsm.lv/raksts/zinas/ekonomika/baltkrievu-kravu-zaudesana-vairak-kaitetu-ventspils-ostai-
un-latvijas-dzelzcelam.a373845/ 10.09.2020. 129 „Kravu apjoms ostās rūk, tranzīta bizness ar bažām sagaida Baltkrievijas sankciju sekas”,
www.lsm.lv, https://www.lsm.lv/raksts/zinas/ekonomika/kravu-apjoms-ostas-ruk-tranzita-bizness-ar-
bazam-sagaida-baltkrievijas-sankciju-sekas.a372982/, 06.09.2020. 130 „Лукашенко намерен «взяться» за грузопоток из Литвы и Латвии”, www.tut.by,
https://news.tut.by/economics/702845.html?c 05.10.2020. 131 „Skaitļi un fakti: Latvijas ostas meklē jaunas kravas”, www.lsm.lv,
https://www.lsm.lv/raksts/zinas/ekonomika/skaitli-un-fakti-latvijas-ostas-mekle-jaunas-
kravas.a345628/ 22.01.2020. 132 „Latvijas transporta dienās Zviedrijā prezentēja tranzīta koridora priekšrocības”, www.delfi.lv,
https://www.delfi.lv/news/transports-sodien-rit/latvijas-transporta-dienas-zviedrija-prezenteja-tranzita-
koridora-prieksrocibas.d?id=51709919 10.12.2019. 133 „Port of Gdansk to open new Black Sea to the Baltic trade route”, https://www.seatrade-
maritime.com/, Lee Hong Liang, https://www.seatrade-maritime.com/ports-logistics/port-gdansk-open-
new-black-sea-baltic-trade-route, 16.12.2020.
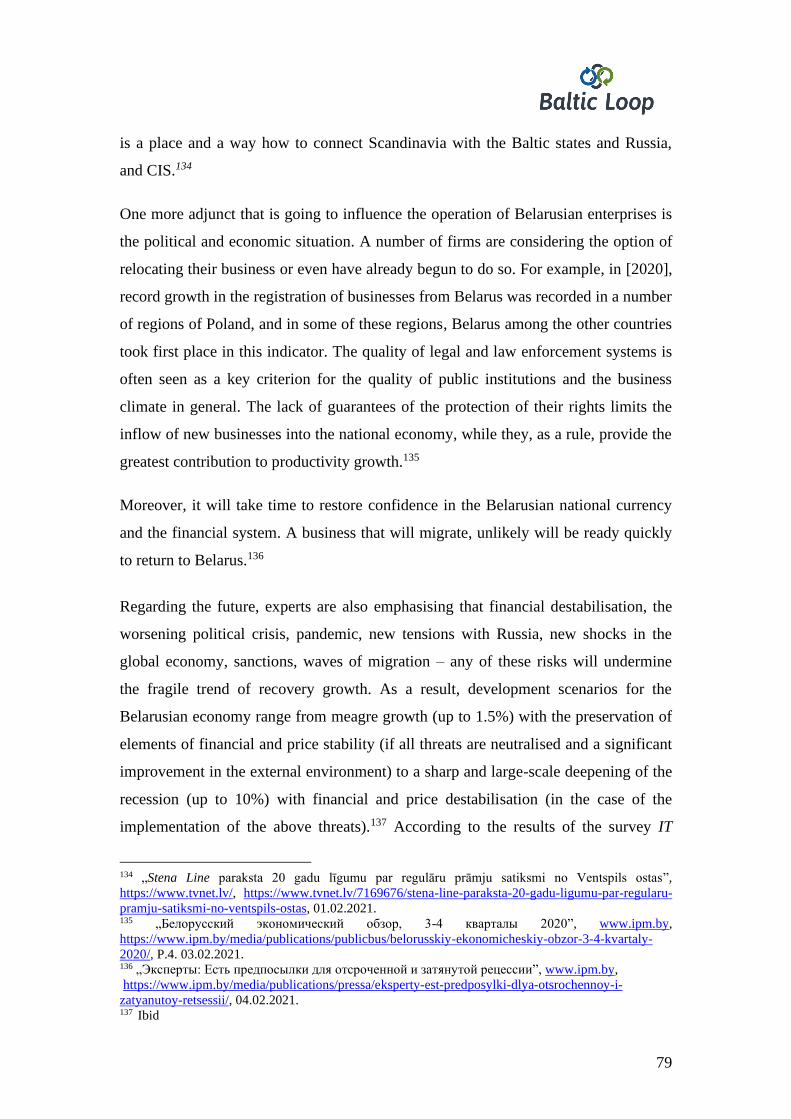
79
is a place and a way how to connect Scandinavia with the Baltic states and Russia,
and CIS.134
One more adjunct that is going to influence the operation of Belarusian enterprises is
the political and economic situation. A number of firms are considering the option of
relocating their business or even have already begun to do so. For example, in [2020],
record growth in the registration of businesses from Belarus was recorded in a number
of regions of Poland, and in some of these regions, Belarus among the other countries
took first place in this indicator. The quality of legal and law enforcement systems is
often seen as a key criterion for the quality of public institutions and the business
climate in general. The lack of guarantees of the protection of their rights limits the
inflow of new businesses into the national economy, while they, as a rule, provide the
greatest contribution to productivity growth.135
Moreover, it will take time to restore confidence in the Belarusian national currency
and the financial system. A business that will migrate, unlikely will be ready quickly
to return to Belarus.136
Regarding the future, experts are also emphasising that financial destabilisation, the
worsening political crisis, pandemic, new tensions with Russia, new shocks in the
global economy, sanctions, waves of migration – any of these risks will undermine
the fragile trend of recovery growth. As a result, development scenarios for the
Belarusian economy range from meagre growth (up to 1.5%) with the preservation of
elements of financial and price stability (if all threats are neutralised and a significant
improvement in the external environment) to a sharp and large-scale deepening of the
recession (up to 10%) with financial and price destabilisation (in the case of the
implementation of the above threats).137 According to the results of the survey IT
134 „Stena Line paraksta 20 gadu līgumu par regulāru prāmju satiksmi no Ventspils ostas”,
https://www.tvnet.lv/, https://www.tvnet.lv/7169676/stena-line-paraksta-20-gadu-ligumu-par-regularu-
pramju-satiksmi-no-ventspils-ostas, 01.02.2021. 135 „Белорусский экономический обзор, 3-4 кварталы 2020”, www.ipm.by,
https://www.ipm.by/media/publications/publicbus/belorusskiy-ekonomicheskiy-obzor-3-4-kvartaly-
2020/, P.4. 03.02.2021. 136 „Эксперты: Есть предпосылки для отсроченной и затянутой рецессии”, www.ipm.by,
https://www.ipm.by/media/publications/pressa/eksperty-est-predposylki-dlya-otsrochennoy-i-
zatyanutoy-retsessii/, 04.02.2021. 137
Ibid
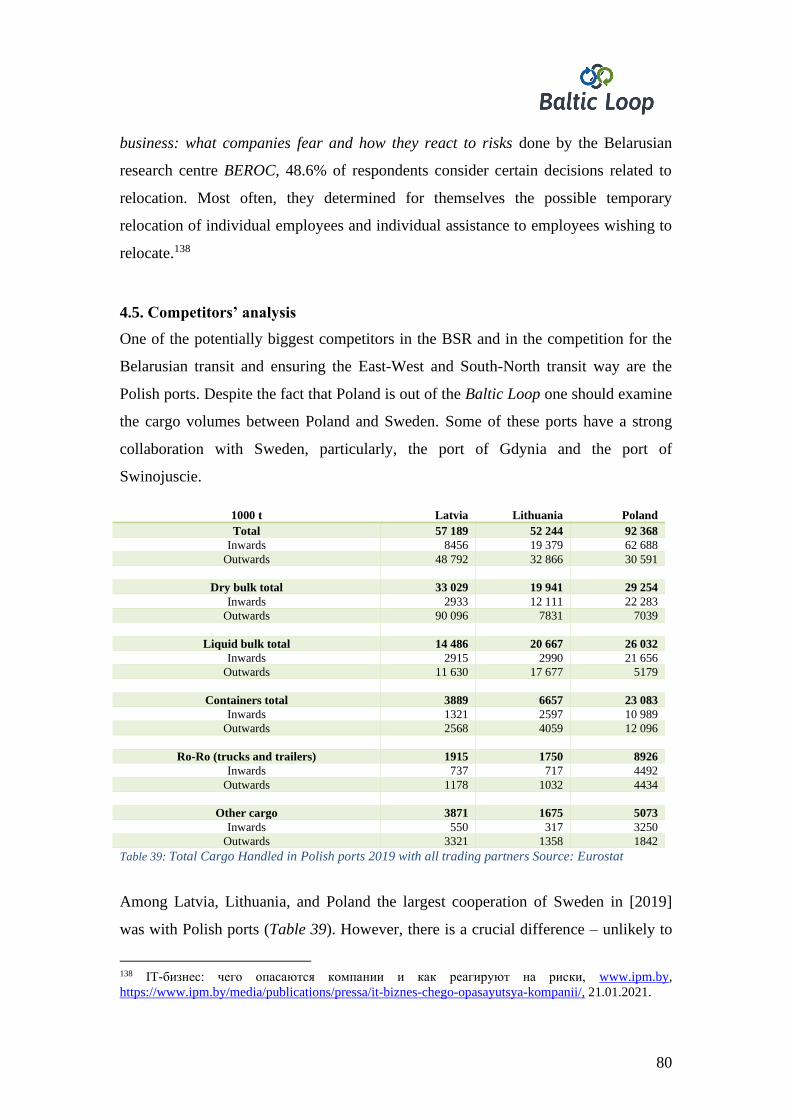
80
business: what companies fear and how they react to risks done by the Belarusian
research centre BEROC, 48.6% of respondents consider certain decisions related to
relocation. Most often, they determined for themselves the possible temporary
relocation of individual employees and individual assistance to employees wishing to
relocate.138
4.5. Competitors’ analysis
One of the potentially biggest competitors in the BSR and in the competition for the
Belarusian transit and ensuring the East-West and South-North transit way are the
Polish ports. Despite the fact that Poland is out of the Baltic Loop one should examine
the cargo volumes between Poland and Sweden. Some of these ports have a strong
collaboration with Sweden, particularly, the port of Gdynia and the port of
Swinojuscie.
1000 t Latvia Lithuania Poland
Total 57 189 52 244 92 368
Inwards 8456 19 379 62 688
Outwards 48 792 32 866 30 591
Dry bulk total 33 029 19 941 29 254
Inwards 2933 12 111 22 283
Outwards 90 096 7831 7039
Liquid bulk total 14 486 20 667 26 032
Inwards 2915 2990 21 656
Outwards 11 630 17 677 5179
Containers total 3889 6657 23 083
Inwards 1321 2597 10 989
Outwards 2568 4059 12 096
Ro-Ro (trucks and trailers) 1915 1750 8926
Inwards 737 717 4492
Outwards 1178 1032 4434
Other cargo 3871 1675 5073
Inwards 550 317 3250
Outwards 3321 1358 1842
Table 39: Total Cargo Handled in Polish ports 2019 with all trading partners Source: Eurostat
Among Latvia, Lithuania, and Poland the largest cooperation of Sweden in [2019]
was with Polish ports (Table 39). However, there is a crucial difference – unlikely to
138 IT-бизнес: чего опасаются компании и как реагируют на риски, www.ipm.by,
https://www.ipm.by/media/publications/pressa/it-biznes-chego-opasayutsya-kompanii/, 21.01.2021.
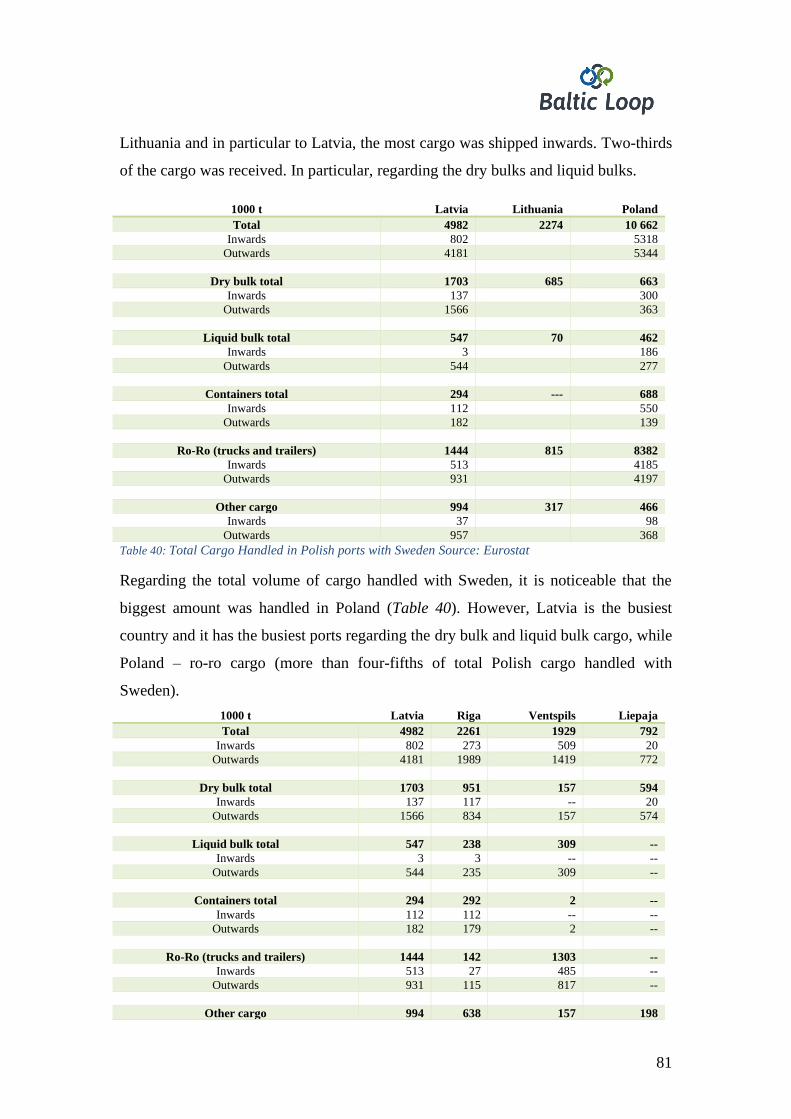
81
Lithuania and in particular to Latvia, the most cargo was shipped inwards. Two-thirds
of the cargo was received. In particular, regarding the dry bulks and liquid bulks.
1000 t Latvia Lithuania Poland
Total 4982 2274 10 662
Inwards 802 5318
Outwards 4181 5344
Dry bulk total 1703 685 663
Inwards 137 300
Outwards 1566 363
Liquid bulk total 547 70 462
Inwards 3 186
Outwards 544 277
Containers total 294 --- 688
Inwards 112 550
Outwards 182 139
Ro-Ro (trucks and trailers) 1444 815 8382
Inwards 513 4185
Outwards 931 4197
Other cargo 994 317 466
Inwards 37 98
Outwards 957 368
Table 40: Total Cargo Handled in Polish ports with Sweden Source: Eurostat
Regarding the total volume of cargo handled with Sweden, it is noticeable that the
biggest amount was handled in Poland (Table 40). However, Latvia is the busiest
country and it has the busiest ports regarding the dry bulk and liquid bulk cargo, while
Poland – ro-ro cargo (more than four-fifths of total Polish cargo handled with
Sweden).
1000 t Latvia Riga Ventspils Liepaja
Total 4982 2261 1929 792
Inwards 802 273 509 20
Outwards 4181 1989 1419 772
Dry bulk total 1703 951 157 594
Inwards 137 117 -- 20
Outwards 1566 834 157 574
Liquid bulk total 547 238 309 --
Inwards 3 3 -- --
Outwards 544 235 309 --
Containers total 294 292 2 --
Inwards 112 112 -- --
Outwards 182 179 2 --
Ro-Ro (trucks and trailers) 1444 142 1303 --
Inwards 513 27 485 --
Outwards 931 115 817 --
Other cargo 994 638 157 198
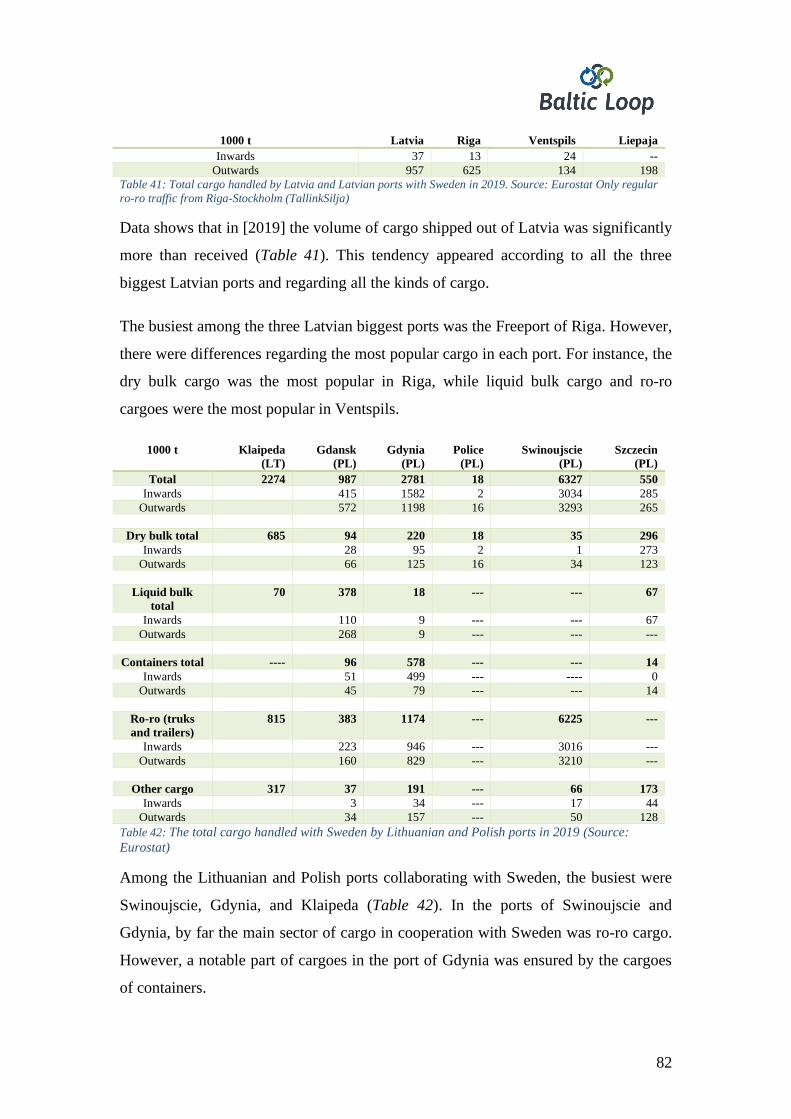
82
1000 t Latvia Riga Ventspils Liepaja
Inwards 37 13 24 --
Outwards 957 625 134 198
Table 41: Total cargo handled by Latvia and Latvian ports with Sweden in 2019. Source: Eurostat Only regular
ro-ro traffic from Riga-Stockholm (TallinkSilja)
Data shows that in [2019] the volume of cargo shipped out of Latvia was significantly
more than received (Table 41). This tendency appeared according to all the three
biggest Latvian ports and regarding all the kinds of cargo.
The busiest among the three Latvian biggest ports was the Freeport of Riga. However,
there were differences regarding the most popular cargo in each port. For instance, the
dry bulk cargo was the most popular in Riga, while liquid bulk cargo and ro-ro
cargoes were the most popular in Ventspils.
1000 t Klaipeda
(LT)
Gdansk
(PL)
Gdynia
(PL)
Police
(PL)
Swinoujscie
(PL)
Szczecin
(PL)
Total 2274 987 2781 18 6327 550
Inwards 415 1582 2 3034 285
Outwards 572 1198 16 3293 265
Dry bulk total 685 94 220 18 35 296
Inwards 28 95 2 1 273
Outwards 66 125 16 34 123
Liquid bulk
total
70 378 18 --- --- 67
Inwards 110 9 --- --- 67
Outwards 268 9 --- --- ---
Containers total ---- 96 578 --- --- 14
Inwards 51 499 --- ---- 0
Outwards 45 79 --- --- 14
Ro-ro (truks
and trailers)
815 383 1174 --- 6225 ---
Inwards 223 946 --- 3016 ---
Outwards 160 829 --- 3210 ---
Other cargo 317 37 191 --- 66 173
Inwards 3 34 --- 17 44
Outwards 34 157 --- 50 128
Table 42: The total cargo handled with Sweden by Lithuanian and Polish ports in 2019 (Source:
Eurostat)
Among the Lithuanian and Polish ports collaborating with Sweden, the busiest were
Swinoujscie, Gdynia, and Klaipeda (Table 42). In the ports of Swinoujscie and
Gdynia, by far the main sector of cargo in cooperation with Sweden was ro-ro cargo.
However, a notable part of cargoes in the port of Gdynia was ensured by the cargoes
of containers.
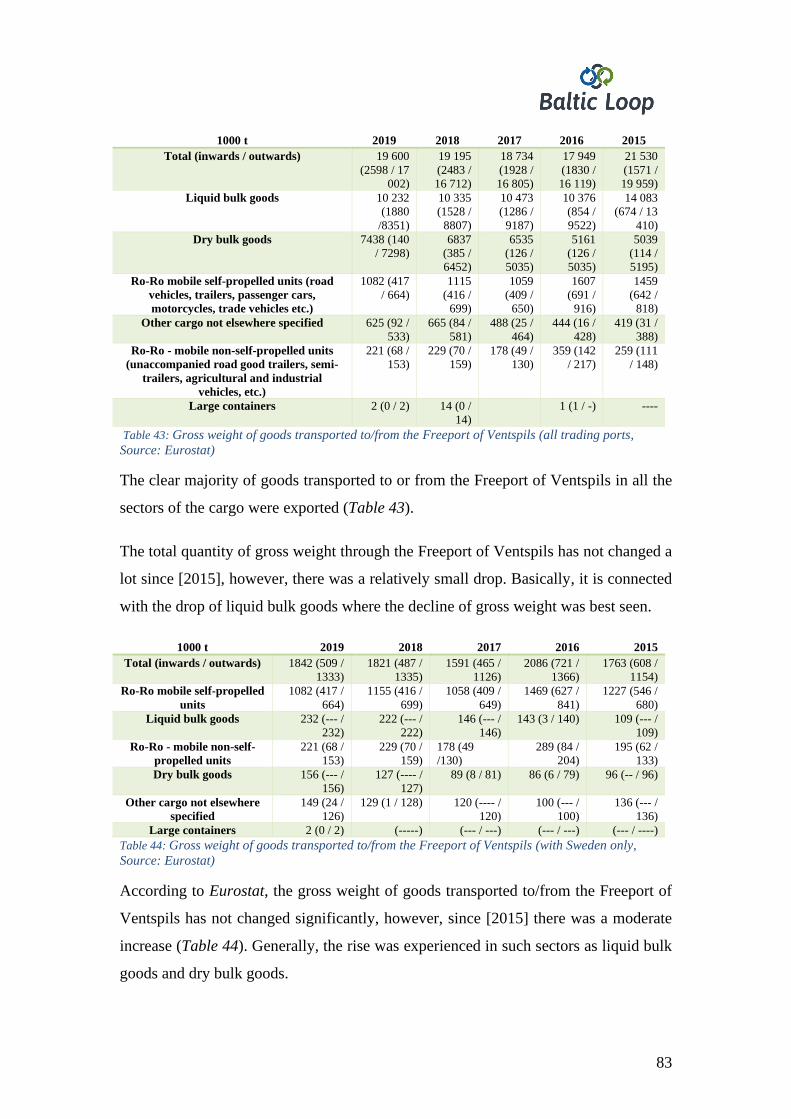
83
1000 t 2019 2018 2017 2016 2015
Total (inwards / outwards) 19 600
(2598 / 17
002)
19 195
(2483 /
16 712)
18 734
(1928 /
16 805)
17 949
(1830 /
16 119)
21 530
(1571 /
19 959)
Liquid bulk goods 10 232
(1880
/8351)
10 335
(1528 /
8807)
10 473
(1286 /
9187)
10 376
(854 /
9522)
14 083
(674 / 13
410)
Dry bulk goods 7438 (140
/ 7298)
6837
(385 /
6452)
6535
(126 /
5035)
5161
(126 /
5035)
5039
(114 /
5195)
Ro-Ro mobile self-propelled units (road
vehicles, trailers, passenger cars,
motorcycles, trade vehicles etc.)
1082 (417
/ 664)
1115
(416 /
699)
1059
(409 /
650)
1607
(691 /
916)
1459
(642 /
818)
Other cargo not elsewhere specified 625 (92 /
533)
665 (84 /
581)
488 (25 /
464)
444 (16 /
428)
419 (31 /
388)
Ro-Ro - mobile non-self-propelled units
(unaccompanied road good trailers, semi-
trailers, agricultural and industrial
vehicles, etc.)
221 (68 /
153)
229 (70 /
159)
178 (49 /
130)
359 (142
/ 217)
259 (111
/ 148)
Large containers 2 (0 / 2) 14 (0 /
14)
1 (1 / -) ----
Table 43: Gross weight of goods transported to/from the Freeport of Ventspils (all trading ports,
Source: Eurostat)
The clear majority of goods transported to or from the Freeport of Ventspils in all the
sectors of the cargo were exported (Table 43).
The total quantity of gross weight through the Freeport of Ventspils has not changed a
lot since [2015], however, there was a relatively small drop. Basically, it is connected
with the drop of liquid bulk goods where the decline of gross weight was best seen.
1000 t 2019 2018 2017 2016 2015
Total (inwards / outwards) 1842 (509 /
1333)
1821 (487 /
1335)
1591 (465 /
1126)
2086 (721 /
1366)
1763 (608 /
1154)
Ro-Ro mobile self-propelled
units
1082 (417 /
664)
1155 (416 /
699)
1058 (409 /
649)
1469 (627 /
841)
1227 (546 /
680)
Liquid bulk goods 232 (--- /
232)
222 (--- /
222)
146 (--- /
146)
143 (3 / 140) 109 (--- /
109)
Ro-Ro - mobile non-self-
propelled units
221 (68 /
153)
229 (70 /
159)
178 (49
/130)
289 (84 /
204)
195 (62 /
133)
Dry bulk goods 156 (--- /
156)
127 (---- /
127)
89 (8 / 81) 86 (6 / 79) 96 (-- / 96)
Other cargo not elsewhere
specified
149 (24 /
126)
129 (1 / 128) 120 (---- /
120)
100 (--- /
100)
136 (--- /
136)
Large containers 2 (0 / 2) (-----) (--- / ---) (--- / ---) (--- / ----)
Table 44: Gross weight of goods transported to/from the Freeport of Ventspils (with Sweden only,
Source: Eurostat)
According to Eurostat, the gross weight of goods transported to/from the Freeport of
Ventspils has not changed significantly, however, since [2015] there was a moderate
increase (Table 44). Generally, the rise was experienced in such sectors as liquid bulk
goods and dry bulk goods.
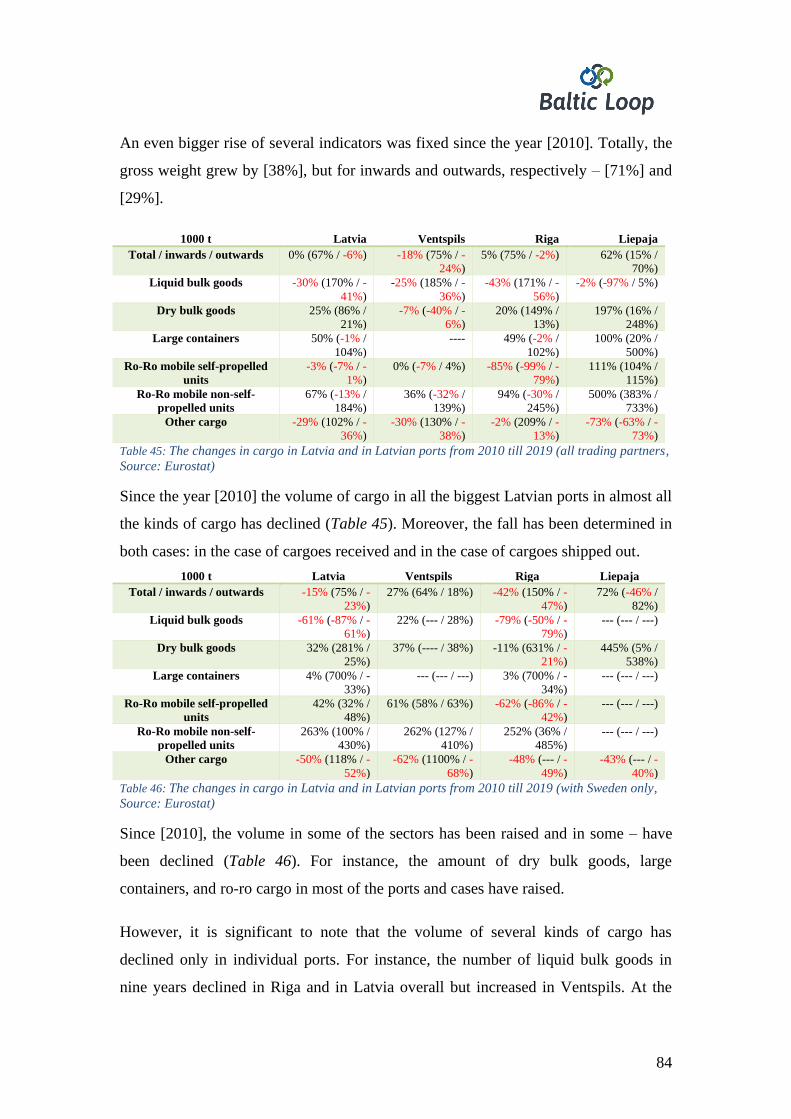
84
An even bigger rise of several indicators was fixed since the year [2010]. Totally, the
gross weight grew by [38%], but for inwards and outwards, respectively – [71%] and
[29%].
1000 t Latvia Ventspils Riga Liepaja
Total / inwards / outwards 0% (67% / -6%) -18% (75% / -
24%)
5% (75% / -2%) 62% (15% /
70%)
Liquid bulk goods -30% (170% / -
41%)
-25% (185% / -
36%)
-43% (171% / -
56%)
-2% (-97% / 5%)
Dry bulk goods 25% (86% /
21%)
-7% (-40% / -
6%)
20% (149% /
13%)
197% (16% /
248%)
Large containers 50% (-1% /
104%)
---- 49% (-2% /
102%)
100% (20% /
500%)
Ro-Ro mobile self-propelled
units
-3% (-7% / -
1%)
0% (-7% / 4%) -85% (-99% / -
79%)
111% (104% /
115%)
Ro-Ro mobile non-self-
propelled units
67% (-13% /
184%)
36% (-32% /
139%)
94% (-30% /
245%)
500% (383% /
733%)
Other cargo -29% (102% / -
36%)
-30% (130% / -
38%)
-2% (209% / -
13%)
-73% (-63% / -
73%)
Table 45: The changes in cargo in Latvia and in Latvian ports from 2010 till 2019 (all trading partners,
Source: Eurostat)
Since the year [2010] the volume of cargo in all the biggest Latvian ports in almost all
the kinds of cargo has declined (Table 45). Moreover, the fall has been determined in
both cases: in the case of cargoes received and in the case of cargoes shipped out.
1000 t Latvia Ventspils Riga Liepaja
Total / inwards / outwards -15% (75% / -
23%)
27% (64% / 18%) -42% (150% / -
47%)
72% (-46% /
82%)
Liquid bulk goods -61% (-87% / -
61%)
22% (--- / 28%) -79% (-50% / -
79%)
--- (--- / ---)
Dry bulk goods 32% (281% /
25%)
37% (---- / 38%) -11% (631% / -
21%)
445% (5% /
538%)
Large containers 4% (700% / -
33%)
--- (--- / ---) 3% (700% / -
34%)
--- (--- / ---)
Ro-Ro mobile self-propelled
units
42% (32% /
48%)
61% (58% / 63%) -62% (-86% / -
42%)
--- (--- / ---)
Ro-Ro mobile non-self-
propelled units
263% (100% /
430%)
262% (127% /
410%)
252% (36% /
485%)
--- (--- / ---)
Other cargo -50% (118% / -
52%)
-62% (1100% / -
68%)
-48% (--- / -
49%)
-43% (--- / -
40%)
Table 46: The changes in cargo in Latvia and in Latvian ports from 2010 till 2019 (with Sweden only,
Source: Eurostat)
Since [2010], the volume in some of the sectors has been raised and in some – have
been declined (Table 46). For instance, the amount of dry bulk goods, large
containers, and ro-ro cargo in most of the ports and cases have raised.
However, it is significant to note that the volume of several kinds of cargo has
declined only in individual ports. For instance, the number of liquid bulk goods in
nine years declined in Riga and in Latvia overall but increased in Ventspils. At the
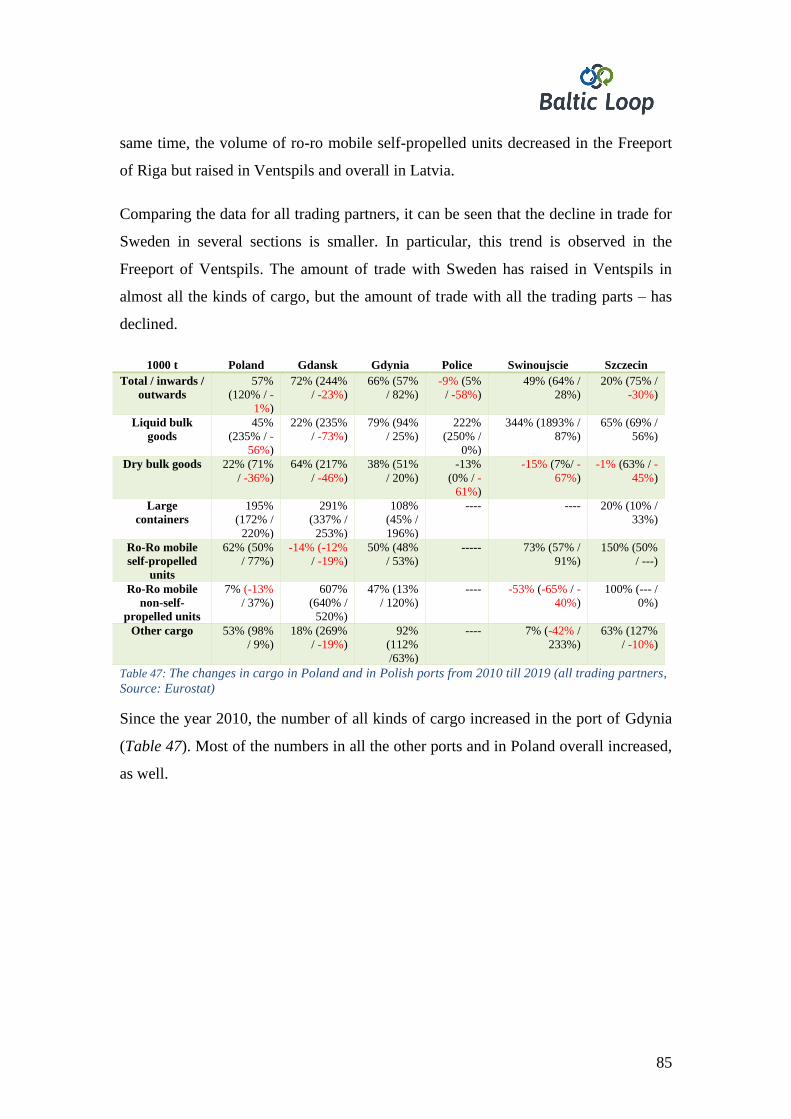
85
same time, the volume of ro-ro mobile self-propelled units decreased in the Freeport
of Riga but raised in Ventspils and overall in Latvia.
Comparing the data for all trading partners, it can be seen that the decline in trade for
Sweden in several sections is smaller. In particular, this trend is observed in the
Freeport of Ventspils. The amount of trade with Sweden has raised in Ventspils in
almost all the kinds of cargo, but the amount of trade with all the trading parts – has
declined.
1000 t Poland Gdansk Gdynia Police Swinoujscie Szczecin
Total / inwards /
outwards
57%
(120% / -
1%)
72% (244%
/ -23%)
66% (57%
/ 82%)
-9% (5%
/ -58%)
49% (64% /
28%)
20% (75% /
-30%)
Liquid bulk
goods
45%
(235% / -
56%)
22% (235%
/ -73%)
79% (94%
/ 25%)
222%
(250% /
0%)
344% (1893% /
87%)
65% (69% /
56%)
Dry bulk goods 22% (71%
/ -36%)
64% (217%
/ -46%)
38% (51%
/ 20%)
-13%
(0% / -
61%)
-15% (7%/ -
67%)
-1% (63% / -
45%)
Large
containers
195%
(172% /
220%)
291%
(337% /
253%)
108%
(45% /
196%)
---- ---- 20% (10% /
33%)
Ro-Ro mobile
self-propelled
units
62% (50%
/ 77%)
-14% (-12%
/ -19%)
50% (48%
/ 53%)
----- 73% (57% /
91%)
150% (50%
/ ---)
Ro-Ro mobile
non-self-
propelled units
7% (-13%
/ 37%)
607%
(640% /
520%)
47% (13%
/ 120%)
---- -53% (-65% / -
40%)
100% (--- /
0%)
Other cargo 53% (98%
/ 9%)
18% (269%
/ -19%)
92%
(112%
/63%)
---- 7% (-42% /
233%)
63% (127%
/ -10%)
Table 47: The changes in cargo in Poland and in Polish ports from 2010 till 2019 (all trading partners,
Source: Eurostat)
Since the year 2010, the number of all kinds of cargo increased in the port of Gdynia
(Table 47). Most of the numbers in all the other ports and in Poland overall increased,
as well.
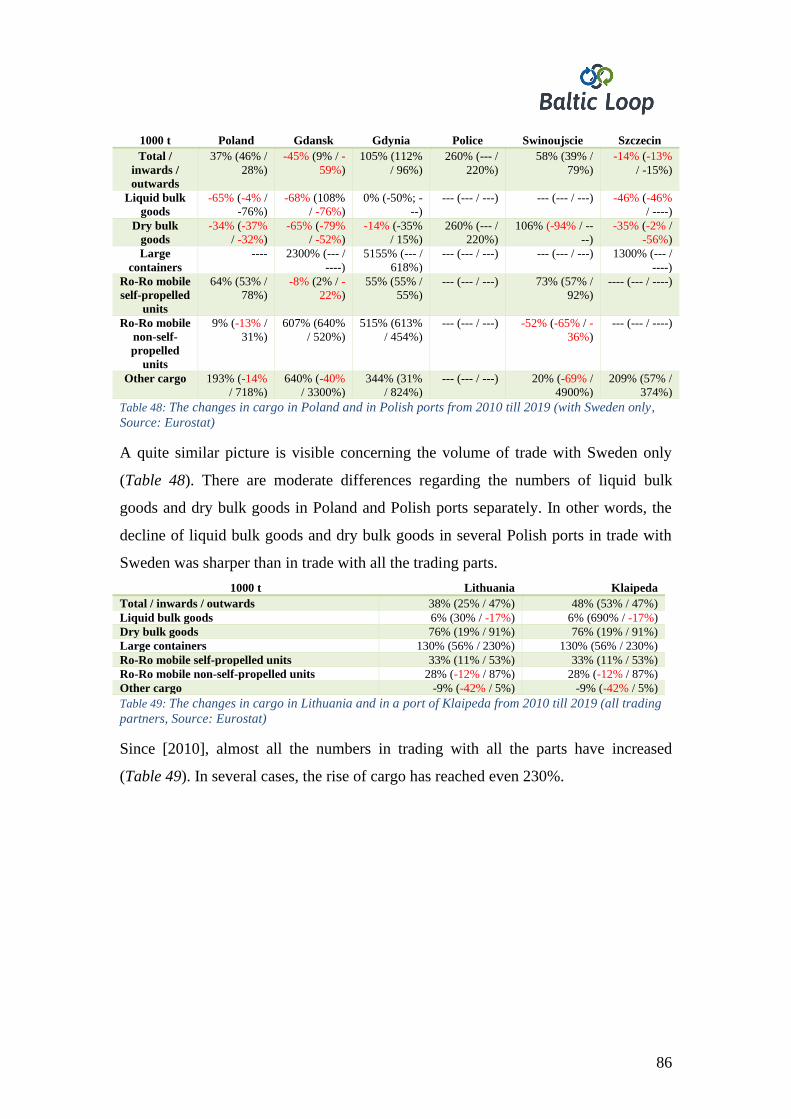
86
1000 t Poland Gdansk Gdynia Police Swinoujscie Szczecin
Total /
inwards /
outwards
37% (46% /
28%)
-45% (9% / -
59%)
105% (112%
/ 96%)
260% (--- /
220%)
58% (39% /
79%)
-14% (-13%
/ -15%)
Liquid bulk
goods
-65% (-4% /
-76%)
-68% (108%
/ -76%)
0% (-50%; -
--)
--- (--- / ---) --- (--- / ---) -46% (-46%
/ ----)
Dry bulk
goods
-34% (-37%
/ -32%)
-65% (-79%
/ -52%)
-14% (-35%
/ 15%)
260% (--- /
220%)
106% (-94% / --
--)
-35% (-2% /
-56%)
Large
containers
---- 2300% (--- /
----)
5155% (--- /
618%)
--- (--- / ---) --- (--- / ---) 1300% (--- /
----)
Ro-Ro mobile
self-propelled
units
64% (53% /
78%)
-8% (2% / -
22%)
55% (55% /
55%)
--- (--- / ---) 73% (57% /
92%)
---- (--- / ----)
Ro-Ro mobile
non-self-
propelled
units
9% (-13% /
31%)
607% (640%
/ 520%)
515% (613%
/ 454%)
--- (--- / ---) -52% (-65% / -
36%)
--- (--- / ----)
Other cargo 193% (-14%
/ 718%)
640% (-40%
/ 3300%)
344% (31%
/ 824%)
--- (--- / ---) 20% (-69% /
4900%)
209% (57% /
374%)
Table 48: The changes in cargo in Poland and in Polish ports from 2010 till 2019 (with Sweden only,
Source: Eurostat)
A quite similar picture is visible concerning the volume of trade with Sweden only
(Table 48). There are moderate differences regarding the numbers of liquid bulk
goods and dry bulk goods in Poland and Polish ports separately. In other words, the
decline of liquid bulk goods and dry bulk goods in several Polish ports in trade with
Sweden was sharper than in trade with all the trading parts.
1000 t Lithuania Klaipeda
Total / inwards / outwards 38% (25% / 47%) 48% (53% / 47%)
Liquid bulk goods 6% (30% / -17%) 6% (690% / -17%)
Dry bulk goods 76% (19% / 91%) 76% (19% / 91%)
Large containers 130% (56% / 230%) 130% (56% / 230%)
Ro-Ro mobile self-propelled units 33% (11% / 53%) 33% (11% / 53%)
Ro-Ro mobile non-self-propelled units 28% (-12% / 87%) 28% (-12% / 87%)
Other cargo -9% (-42% / 5%) -9% (-42% / 5%)
Table 49: The changes in cargo in Lithuania and in a port of Klaipeda from 2010 till 2019 (all trading
partners, Source: Eurostat)
Since [2010], almost all the numbers in trading with all the parts have increased
(Table 49). In several cases, the rise of cargo has reached even 230%.
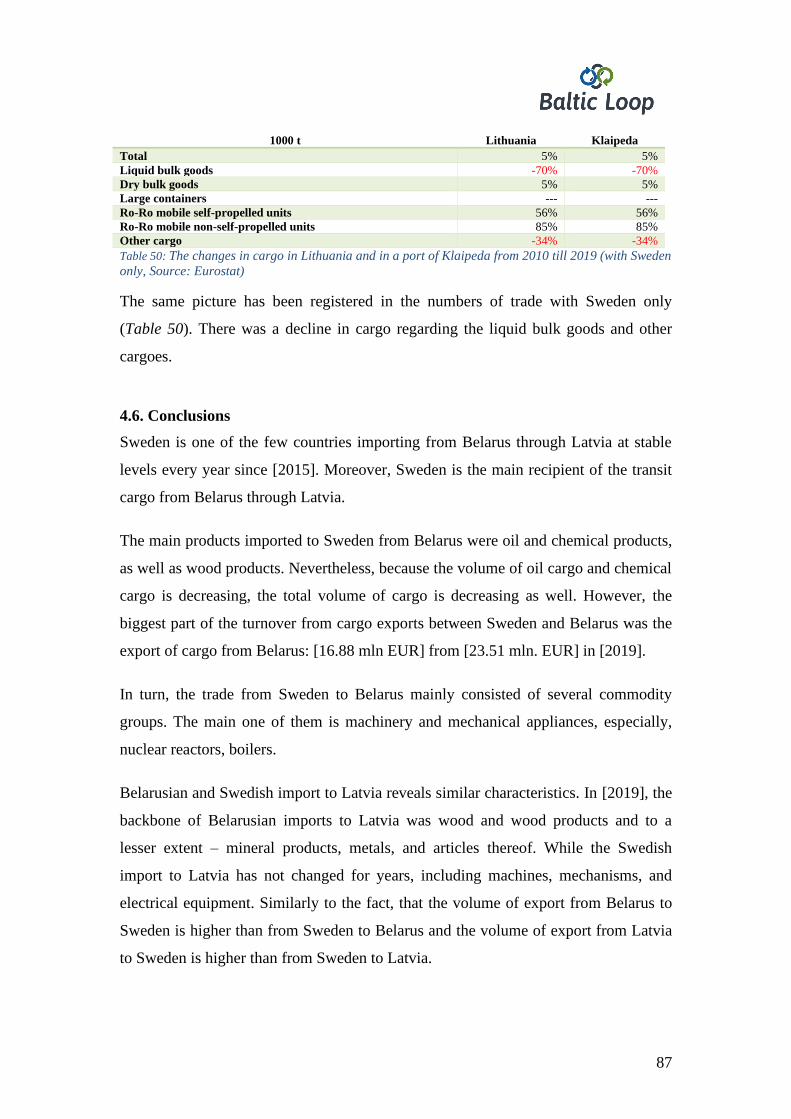
87
1000 t Lithuania Klaipeda
Total 5% 5%
Liquid bulk goods -70% -70%
Dry bulk goods 5% 5%
Large containers --- ---
Ro-Ro mobile self-propelled units 56% 56%
Ro-Ro mobile non-self-propelled units 85% 85%
Other cargo -34% -34%
Table 50: The changes in cargo in Lithuania and in a port of Klaipeda from 2010 till 2019 (with Sweden
only, Source: Eurostat)
The same picture has been registered in the numbers of trade with Sweden only
(Table 50). There was a decline in cargo regarding the liquid bulk goods and other
cargoes.
4.6. Conclusions
Sweden is one of the few countries importing from Belarus through Latvia at stable
levels every year since [2015]. Moreover, Sweden is the main recipient of the transit
cargo from Belarus through Latvia.
The main products imported to Sweden from Belarus were oil and chemical products,
as well as wood products. Nevertheless, because the volume of oil cargo and chemical
cargo is decreasing, the total volume of cargo is decreasing as well. However, the
biggest part of the turnover from cargo exports between Sweden and Belarus was the
export of cargo from Belarus: [16.88 mln EUR] from [23.51 mln. EUR] in [2019].
In turn, the trade from Sweden to Belarus mainly consisted of several commodity
groups. The main one of them is machinery and mechanical appliances, especially,
nuclear reactors, boilers.
Belarusian and Swedish import to Latvia reveals similar characteristics. In [2019], the
backbone of Belarusian imports to Latvia was wood and wood products and to a
lesser extent – mineral products, metals, and articles thereof. While the Swedish
import to Latvia has not changed for years, including machines, mechanisms, and
electrical equipment. Similarly to the fact, that the volume of export from Belarus to
Sweden is higher than from Sweden to Belarus and the volume of export from Latvia
to Sweden is higher than from Sweden to Latvia.
88
Despite the outgoing and potential political turmoil in Belarus and international
politics, there are several ways how to increase and develop the economic cooperation
between Latvia and Belarus, including the cargo volumes between the Freeport of
Ventspils and Belarus. The most important thing: many Belarusian private enterprises
are considering relocating to other countries. Thus, the Freeport of Ventspils should
develop a plan on attracting these companies. One more thing that in this case
characterises the connection between Latvia and Sweden as a promising and with
growth potential is the Stena Line’s decision to continue the business in BSR.
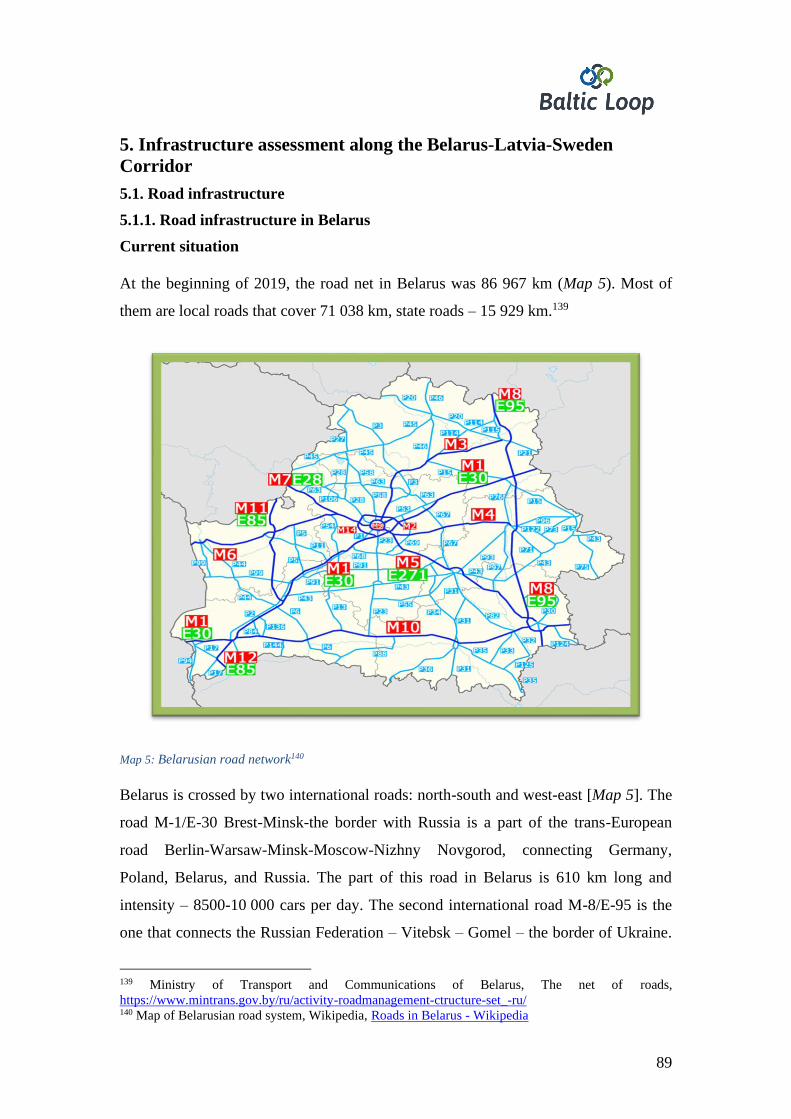
89
5. Infrastructure assessment along the Belarus-Latvia-Sweden
Corridor
5.1. Road infrastructure
5.1.1. Road infrastructure in Belarus
Current situation
At the beginning of 2019, the road net in Belarus was 86 967 km (Map 5). Most of
them are local roads that cover 71 038 km, state roads – 15 929 km.139
Map 5: Belarusian road network140
Belarus is crossed by two international roads: north-south and west-east [Map 5]. The
road M-1/E-30 Brest-Minsk-the border with Russia is a part of the trans-European
road Berlin-Warsaw-Minsk-Moscow-Nizhny Novgorod, connecting Germany,
Poland, Belarus, and Russia. The part of this road in Belarus is 610 km long and
intensity – 8500-10 000 cars per day. The second international road M-8/E-95 is the
one that connects the Russian Federation – Vitebsk – Gomel – the border of Ukraine.
139 Ministry of Transport and Communications of Belarus, The net of roads,
https://www.mintrans.gov.by/ru/activity-roadmanagement-ctructure-set_-ru/ 140 Map of Belarusian road system, Wikipedia, Roads in Belarus - Wikipedia
90
This road connects Finland, Lithuania, Russia, Belarus, Ukraine, Moldova, Romania,
Bulgaria, and Greece, and the territory of Belarus is 456 km long. The branch of this
road connects Gomel-Minsk-Vilnius-Klaipeda-Kaliningrad (in Belarus 468 km) and
ensures the flow of the cargo from Eastern Ukraine and Central Russia to the seaports
in Klaipeda, Ventspils, and Kaliningrad.141
Future development
Belarus permanently works on the improvement of the roads, especially, international
roads. The main attention is paid to safety and comfort.142
5.1.2. Road infrastructure in Latvia
Current situation143
The total length of roads and streets in Latvia contains 73 592 km (Map 6). Average
road network density – 1.139 km per 1 km2. Average state road network density –
0.312 km per 1 km2.
141 Ministry of Transport and Communications of Belarus, International Transport Corridors,
https://www.mintrans.gov.by/ru/activity-roadmanagement-ctructure-coridori-ru/ 142 Ibid 143 Latvijas Valsts celi, Information about facts, https://lvceli.lv/en/information-and-facts/
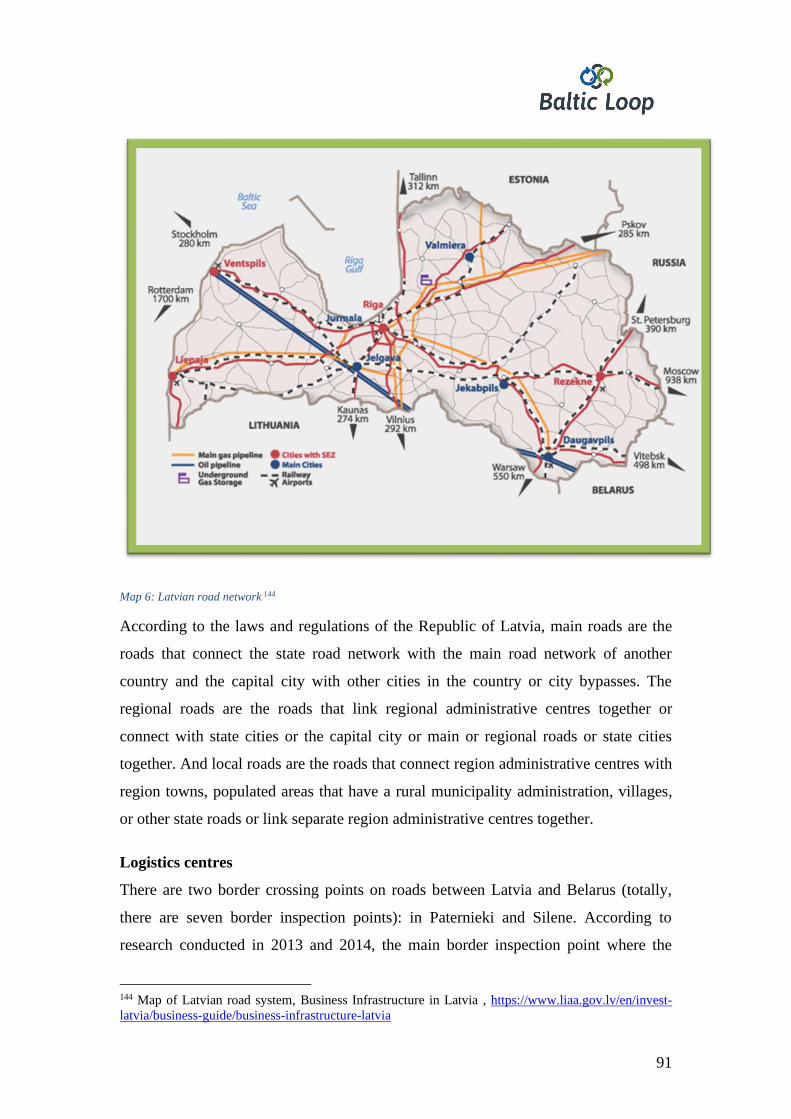
91
Map 6: Latvian road network 144
According to the laws and regulations of the Republic of Latvia, main roads are the
roads that connect the state road network with the main road network of another
country and the capital city with other cities in the country or city bypasses. The
regional roads are the roads that link regional administrative centres together or
connect with state cities or the capital city or main or regional roads or state cities
together. And local roads are the roads that connect region administrative centres with
region towns, populated areas that have a rural municipality administration, villages,
or other state roads or link separate region administrative centres together.
Logistics centres
There are two border crossing points on roads between Latvia and Belarus (totally,
there are seven border inspection points): in Paternieki and Silene. According to
research conducted in 2013 and 2014, the main border inspection point where the
144 Map of Latvian road system, Business Infrastructure in Latvia , https://www.liaa.gov.lv/en/invest-
latvia/business-guide/business-infrastructure-latvia
92
goods were transported from Belarus to Latvia or from Latvia to Belarus was
Paternieki. The main destinations of cargoes from Russia and Belarus were
Lithuanian cities Vilnius and Kaunas and Latvian capital Riga.145 In terms of transit,
Russian and Belarusian cargoes go to the border inspection points in Medumi and
Subate for entering Lithuania or the Freeport of Riga.146 From 150 trucks, 24 went to
or from the Freeport of Riga and two – to or from the port of Liepaja.
Most of these trucks usually have crossed the border point in Silene and then reached
the Freeport of Riga. They mostly use the transport bases of Maxima, Elvi, and the
Freeport of Ventspils.147
Those cargoes going to the ports in Latvia or the city of Riga both from Russia and
Belarus usually do not stop between the border and the destination because the
distance is too short. Therefore for many (specific numbers have not been indicated)
cargoes the logistics centres are in the Freeport of Riga. In one or couple cases, the
logistics centres are located in centres belonging to well-known enterprises like
Maxima (Kekavas parish, Abras148), SIA Kreiss (Marupe, Berzlapas street 5149), and
Rimi (Riga, Plavnieki, Deglava street 161150). In many cases, the drivers of the trucks
who participated in the research, answered that their starting point in Latvia on their
way back to Russia or Belarus was unspecified – some warehouse, storage, or
factory.151 Thus it is believable that these trucks supplied the commodities to Latvia
and Latvian companies and Latvian consumers.
145 “Tranzīta kravu pārvadājumu ar autotransportu caur Latviju izpēte” (“Research of transit cargo
transportation by road through Latvia”), P.50., BRD projekts, Rīga, 2014,
https://lvceli.lv/uncategorized/galvenie-tranzita-kravas-autotransporta-koridori-ir-grenctale-ainazi-un-
terehova-rezekne-medumi/ 146 Ibid 147 Ibid 148 „Maxima” atklāj modernizēto loģistikas centru, https://www.maxima.lv/preses-relizes/korporativa-
informacija/maxima-atklaj-modernizeto-logistikas-centru , 15.07.2020. 149 „Kreiss” (uzņēmuma mājas lapa), https://www.kreiss.lv/lv 150 „Atklāts „Rimi Baltic” jaunais loģistikas centrs”, https://www.rimi.lv/jaunumi/atklats-rimi-baltic-
jaunais-logistikas-centrs, 27.10.2020. 151 “Tranzīta kravu pārvadājumu ar autotransportu caur Latviju izpēte” (“Research of transit cargo
transportation by road through Latvia”), P.54., BRD projekts, Rīga, 2014,
https://lvceli.lv/uncategorized/galvenie-tranzita-kravas-autotransporta-koridori-ir-grenctale-ainazi-un-
terehova-rezekne-medumi/
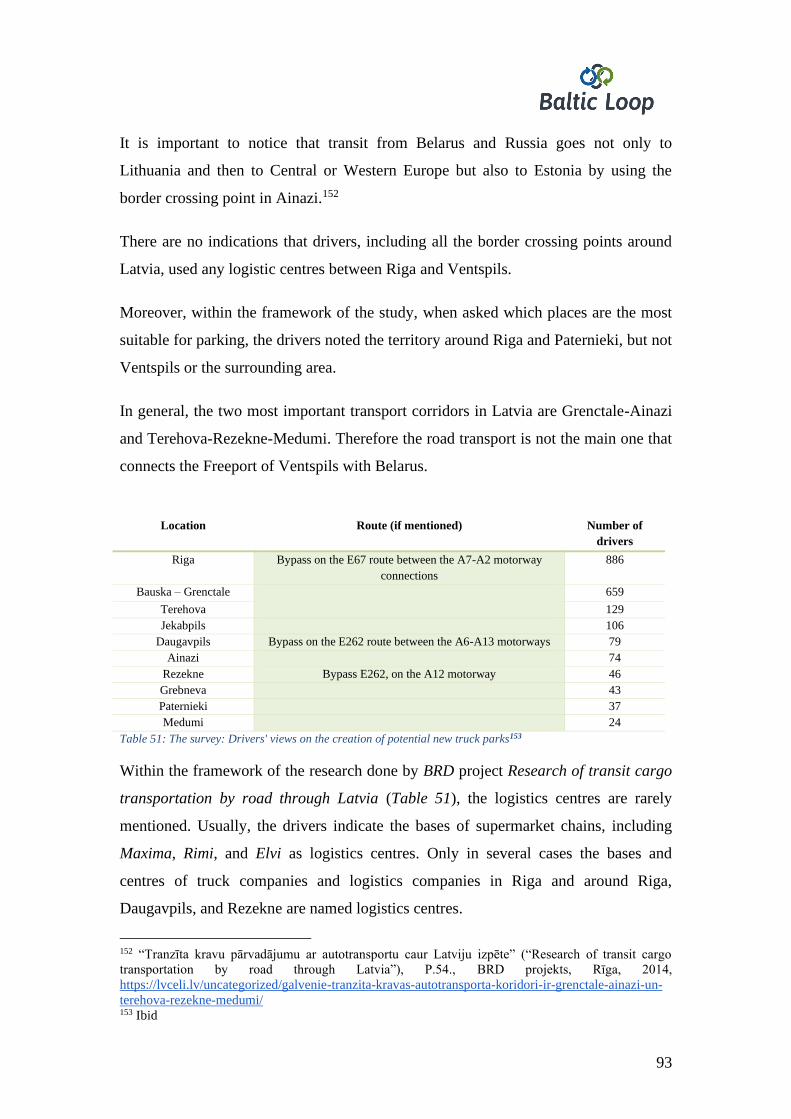
93
It is important to notice that transit from Belarus and Russia goes not only to
Lithuania and then to Central or Western Europe but also to Estonia by using the
border crossing point in Ainazi.152
There are no indications that drivers, including all the border crossing points around
Latvia, used any logistic centres between Riga and Ventspils.
Moreover, within the framework of the study, when asked which places are the most
suitable for parking, the drivers noted the territory around Riga and Paternieki, but not
Ventspils or the surrounding area.
In general, the two most important transport corridors in Latvia are Grenctale-Ainazi
and Terehova-Rezekne-Medumi. Therefore the road transport is not the main one that
connects the Freeport of Ventspils with Belarus.
Location Route (if mentioned) Number of
drivers
Riga Bypass on the E67 route between the A7-A2 motorway
connections
886
Bauska – Grenctale 659
Terehova 129
Jekabpils 106
Daugavpils Bypass on the E262 route between the A6-A13 motorways 79
Ainazi 74
Rezekne Bypass E262, on the A12 motorway 46
Grebneva 43
Paternieki 37
Medumi 24
Table 51: The survey: Drivers' views on the creation of potential new truck parks153
Within the framework of the research done by BRD project Research of transit cargo
transportation by road through Latvia (Table 51), the logistics centres are rarely
mentioned. Usually, the drivers indicate the bases of supermarket chains, including
Maxima, Rimi, and Elvi as logistics centres. Only in several cases the bases and
centres of truck companies and logistics companies in Riga and around Riga,
Daugavpils, and Rezekne are named logistics centres.
152 “Tranzīta kravu pārvadājumu ar autotransportu caur Latviju izpēte” (“Research of transit cargo
transportation by road through Latvia”), P.54., BRD projekts, Rīga, 2014,
https://lvceli.lv/uncategorized/galvenie-tranzita-kravas-autotransporta-koridori-ir-grenctale-ainazi-un-
terehova-rezekne-medumi/ 153 Ibid
94
Regarding the Freeport of Ventspils, it is important to notice that the city is a part of
one of the European transport hubs TEN-T. It means the opportunities to use the
services of the sea, road, rail and air traffic. Ventspils is also connected with the oil
pipeline system Polotsk - Ventspils. Thus, the city is connected with the Baltic States
and CIS countries by railway, and is a part of the East-West railway corridor, linking
Europe and Asia. Moreover, Ventspils is part of the highway UK-the Netherlands-
Germany-Sweden / Norrköping-Ventspils-Riga-Russia. And, finally, there is an
airport in Ventspils, specialising in general aviation flight services.154
Future development
Until 2023 it is planned to finalise the construction and building of the Kekava
bypass. Therefore there will be the new section of road A7 Riga-Bauska-the border of
Lithuania (Grenctale) from km 7 to km 25 and it will be a part of the international
road E67 Via Baltica (Helsinki-Tallinn-Riga-Panevežys-Kaunas-Warsaw-Prague). It
is planned that it will be the most efficient road connection between Riga and
Lithuania, and all of Europe. 155
5.1.3. Road infrastructure in Lithuania
Current situation
According to the statistics provided by the Ministry of Transport and communication
of Lithuania, the total length of the road network is equal to 84 000 km. All the roads
are divided into national, local, and urban roads156.
154 Transporta savienojumi. Ventspils osta, https://www.portofventspils.lv/lv/par-ostu/transporta-
savienojumi/ 155 PPP project „Kekava Bypass” /About project, VAS Latvijas Valsts celi,
https://lvceli.lv/en/projects/#kekava-bypass-ppp-project 156 Ministry of Transport of Communications of Lithuania, About the sector (about the road sector),
https://sumin.lrv.lt/en/sector-activities/roads-and-road-transport-1/about-the-sector
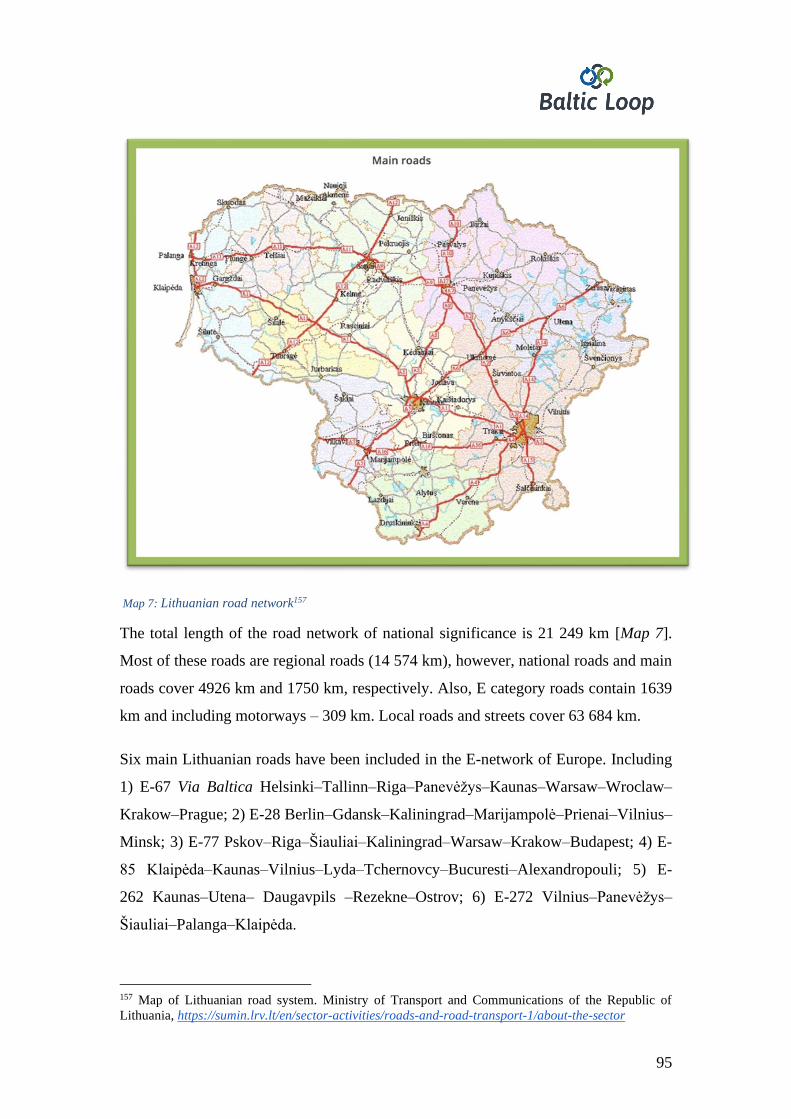
95
Map 7: Lithuanian road network157
The total length of the road network of national significance is 21 249 km [Map 7].
Most of these roads are regional roads (14 574 km), however, national roads and main
roads cover 4926 km and 1750 km, respectively. Also, E category roads contain 1639
km and including motorways – 309 km. Local roads and streets cover 63 684 km.
Six main Lithuanian roads have been included in the E-network of Europe. Including
1) E-67 Via Baltica Helsinki–Tallinn–Riga–Panevėžys–Kaunas–Warsaw–Wroclaw–
Krakow–Prague; 2) E-28 Berlin–Gdansk–Kaliningrad–Marijampolė–Prienai–Vilnius–
Minsk; 3) E-77 Pskov–Riga–Šiauliai–Kaliningrad–Warsaw–Krakow–Budapest; 4) E-
85 Klaipėda–Kaunas–Vilnius–Lyda–Tchernovcy–Bucuresti–Alexandropouli; 5) E-
262 Kaunas–Utena– Daugavpils –Rezekne–Ostrov; 6) E-272 Vilnius–Panevėžys–
Šiauliai–Palanga–Klaipėda.
157 Map of Lithuanian road system. Ministry of Transport and Communications of the Republic of
Lithuania, https://sumin.lrv.lt/en/sector-activities/roads-and-road-transport-1/about-the-sector
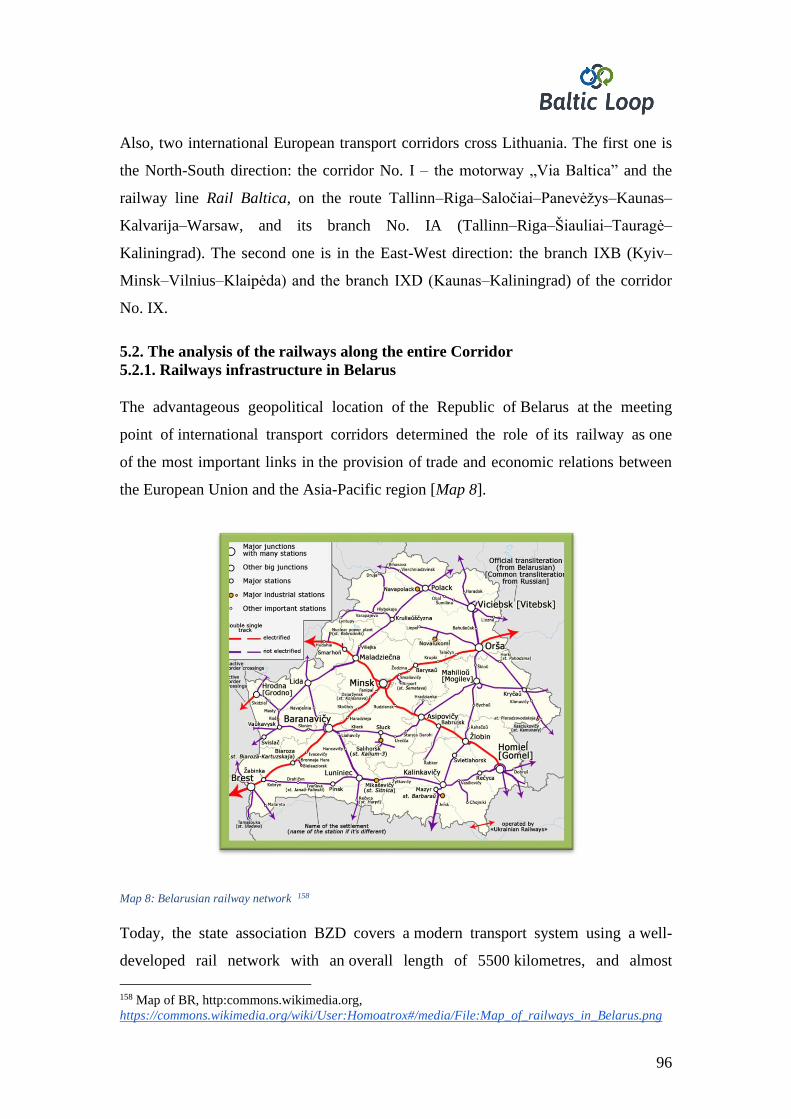
96
Also, two international European transport corridors cross Lithuania. The first one is
the North-South direction: the corridor No. I – the motorway „Via Baltica” and the
railway line Rail Baltica, on the route Tallinn–Riga–Saločiai–Panevėžys–Kaunas–
Kalvarija–Warsaw, and its branch No. IA (Tallinn–Riga–Šiauliai–Tauragė–
Kaliningrad). The second one is in the East-West direction: the branch IXB (Kyiv–
Minsk–Vilnius–Klaipėda) and the branch IXD (Kaunas–Kaliningrad) of the corridor
No. IX.
5.2. The analysis of the railways along the entire Corridor
5.2.1. Railways infrastructure in Belarus
The advantageous geopolitical location of the Republic of Belarus at the meeting
point of international transport corridors determined the role of its railway as one
of the most important links in the provision of trade and economic relations between
the European Union and the Asia-Pacific region [Map 8].
Map 8: Belarusian railway network 158
Today, the state association BZD covers a modern transport system using a well-
developed rail network with an overall length of 5500 kilometres, and almost
158 Map of BR, http:commons.wikimedia.org,
https://commons.wikimedia.org/wiki/User:Homoatrox#/media/File:Map_of_railways_in_Belarus.png
97
900 kilometres from them are electrified. The total length of single-track sections is
3900 kilometres and double-track sections cover 1600 kilometres. Transportation
is carried out by trains with a weight of up to 7000 tons and an overall length of up to
1500 meters.
Freight traffic is essential for the railway complex in Belarus, covering over a third
of the total traffic. The main transit cargo is coal [49%], oil cargo [24%], fertilizers
[5%] and ferrous metals [5%]. At present, about 90% of all transit goods through the
territory of the republic are carried at a fixed tariff. The rate level makes a constant
transport component in the price of goods and increases their competitiveness
in foreign markets. The largest volume of transit traffic is carried in the direction
of Russia, Latvia, Lithuania, Poland, and Ukraine.
The high-speed container trains Viking and ZUBR, operated by a cooperation between
the Belarusian railway, the Ukrainian railway, and the Baltic railways, form
an important link between the Baltic Sea and the Black Sea regions. The Belarusian
railway continuously works on a comprehensive analysis and studies new
perspectives on international freight transportations, while monitoring the
development of the current situation.
One of the key aspects of improving the transit efficiency of Belarus is optimising
control of goods movement across the customs border and speeding up customs
procedures. Together with The State Customs Committee, the Belarusian Railway
is involved in the realization of simplifying custom formalities by rail transportation.
The custom procedures are carried out by using modern information technologies,
including the use of digital signature.
Each year about 180 km-190 km of railway paths are being renewed, another average
of 350 km-400 km is repaired and about 400 switches are replaced.
5.2.2. Railway infrastructure in Latvia The length of the railway network reaches 1860 km (Map 9). The number of diesel
locomotives reaches 194 and the number of freight wagons – 5692.
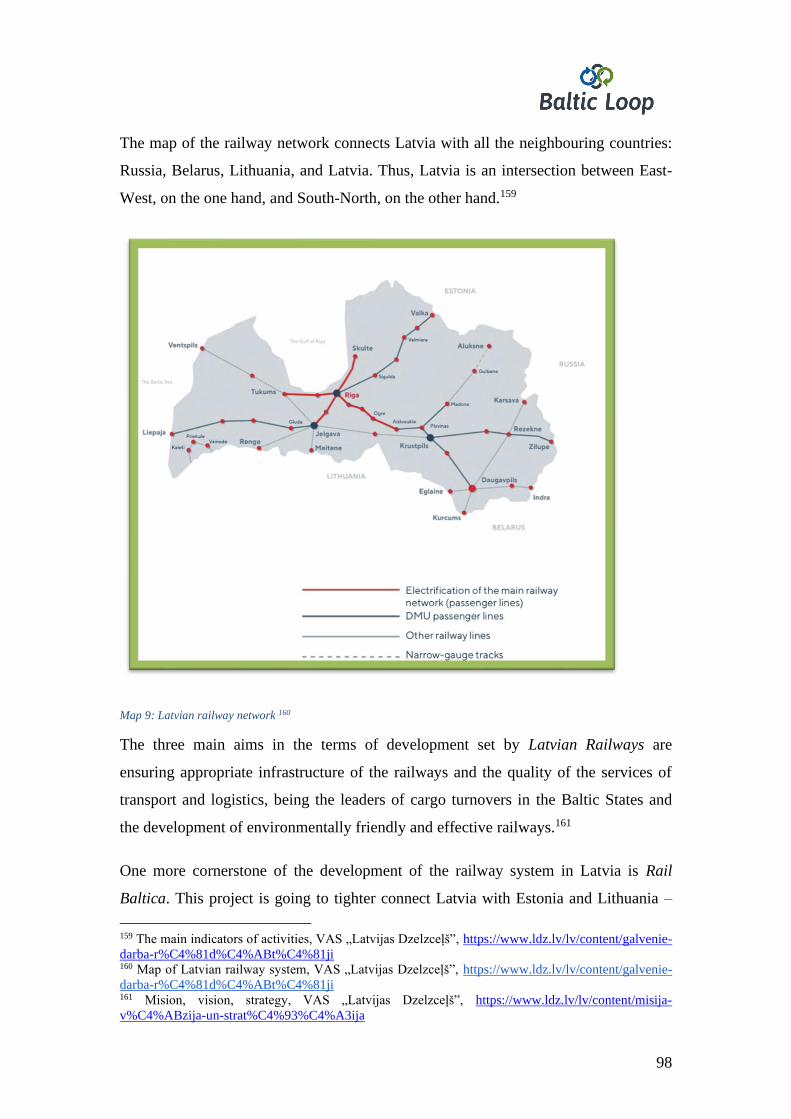
98
The map of the railway network connects Latvia with all the neighbouring countries:
Russia, Belarus, Lithuania, and Latvia. Thus, Latvia is an intersection between East-
West, on the one hand, and South-North, on the other hand.159
Map 9: Latvian railway network 160
The three main aims in the terms of development set by Latvian Railways are
ensuring appropriate infrastructure of the railways and the quality of the services of
transport and logistics, being the leaders of cargo turnovers in the Baltic States and
the development of environmentally friendly and effective railways.161
One more cornerstone of the development of the railway system in Latvia is Rail
Baltica. This project is going to tighter connect Latvia with Estonia and Lithuania –
159 The main indicators of activities, VAS „Latvijas Dzelzceļš”, https://www.ldz.lv/lv/content/galvenie-
darba-r%C4%81d%C4%ABt%C4%81ji 160 Map of Latvian railway system, VAS „Latvijas Dzelzceļš”, https://www.ldz.lv/lv/content/galvenie-
darba-r%C4%81d%C4%ABt%C4%81ji 161 Mision, vision, strategy, VAS „Latvijas Dzelzceļš”, https://www.ldz.lv/lv/content/misija-
v%C4%ABzija-un-strat%C4%93%C4%A3ija
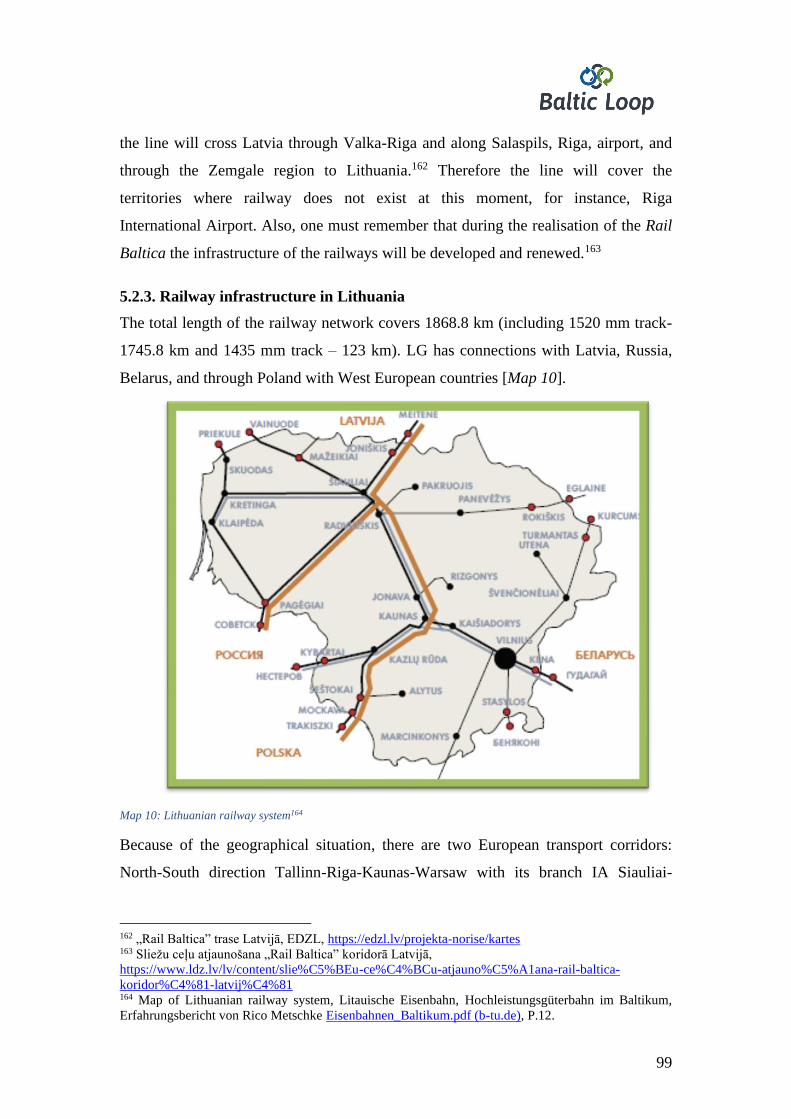
99
the line will cross Latvia through Valka-Riga and along Salaspils, Riga, airport, and
through the Zemgale region to Lithuania.162 Therefore the line will cover the
territories where railway does not exist at this moment, for instance, Riga
International Airport. Also, one must remember that during the realisation of the Rail
Baltica the infrastructure of the railways will be developed and renewed.163
5.2.3. Railway infrastructure in Lithuania
The total length of the railway network covers 1868.8 km (including 1520 mm track-
1745.8 km and 1435 mm track – 123 km). LG has connections with Latvia, Russia,
Belarus, and through Poland with West European countries [Map 10].
Map 10: Lithuanian railway system164
Because of the geographical situation, there are two European transport corridors:
North-South direction Tallinn-Riga-Kaunas-Warsaw with its branch IA Siauliai-
162 „Rail Baltica” trase Latvijā, EDZL, https://edzl.lv/projekta-norise/kartes 163 Sliežu ceļu atjaunošana „Rail Baltica” koridorā Latvijā,
https://www.ldz.lv/lv/content/slie%C5%BEu-ce%C4%BCu-atjauno%C5%A1ana-rail-baltica-
koridor%C4%81-latvij%C4%81 164 Map of Lithuanian railway system, Litauische Eisenbahn, Hochleistungsgüterbahn im Baltikum,
Erfahrungsbericht von Rico Metschke Eisenbahnen_Baltikum.pdf (b-tu.de), P.12.
100
Kaliningrad-Gdansk, and the branches IXB Kyiv-Minsk-Vilnius-Kaunas-Klaipeda
and IXD Kaunas-Kaliningrad of the East-West.165
The priority of the modernisation and development of the Lithuanian railway is given
to the renovation and modernisation of the railway sector infrastructure on the
international transport corridors. More precisely, the attention is given to ensure the
technical interoperability of Lithuanian railways with the European railways to meet
the contemporary requirements. Priorities of short terms are the modernisation of
Trans-European railway lines, renovation of signal and electricity supply systems,
reconstruction of Trans-European railways.
5.3. Conclusions
Belarus is at the crossroads of transitways between the Baltics and the Black Sea, and
Western Europe, and Russia, and even Far East Russia. Moreover, these connections
exist both in the form of railway and road transport. The Baltic States are connecting
Eastern Europe, Russia, on the one hand, and Scandinavia and Western Europe, on
the other hand.
In Latvia, the Belarusian cargo – export and transit – are coming through two border
inspection points, Paternieki and Silene. In most cases, because of the relatively short
distance, trucks with Belarusian cargo do not stop on the way from the border to the
destination – either one of the Latvian ports or the transport bases of large companies.
Latvia and Lithuania and their ports have different kinds of connections with Belarus.
While the link between the port of Klaipeda and Belarus is ensured by the highly
developed road infrastructure. On the other hand, the link between the port of
Ventspils and Belarus is ensured not only by road transport and trucks but also by the
railway infrastructure. However, one should keep in mind that connection with the
port of Klaipeda is more convenient for current Belarussian companies than with
Latvian ports, including the Freeport of Ventspils.
165 Ministry of Transport and Communications of Lithuania, About the sector (About the Lithuanian
Railway network), https://sumin.lrv.lt/en/sector-activities/railway-transport-1/about-the-sector-1
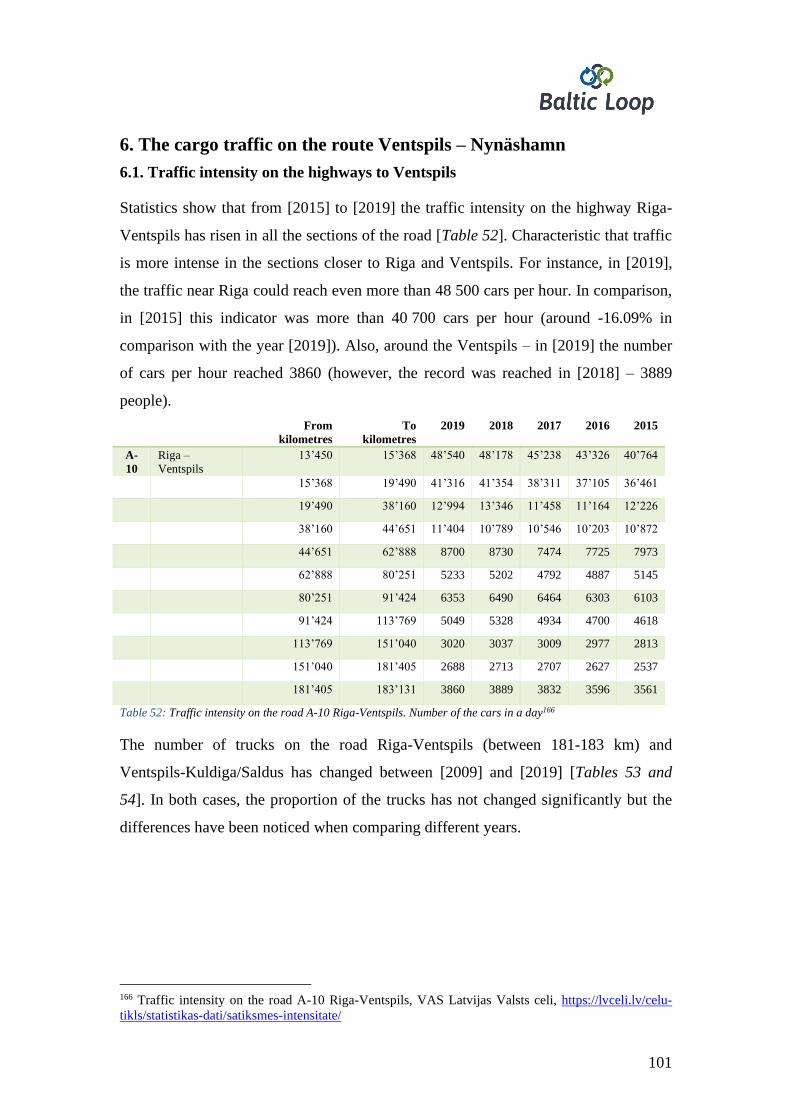
101
6. The cargo traffic on the route Ventspils – Nynäshamn
6.1. Traffic intensity on the highways to Ventspils
Statistics show that from [2015] to [2019] the traffic intensity on the highway Riga-
Ventspils has risen in all the sections of the road [Table 52]. Characteristic that traffic
is more intense in the sections closer to Riga and Ventspils. For instance, in [2019],
the traffic near Riga could reach even more than 48 500 cars per hour. In comparison,
in [2015] this indicator was more than 40 700 cars per hour (around -16.09% in
comparison with the year [2019]). Also, around the Ventspils – in [2019] the number
of cars per hour reached 3860 (however, the record was reached in [2018] – 3889
people).
Rr.
Road name From
kilometres
To
kilometres
2019 2018 2017 2016 2015
A-
10
Riga –
Ventspils
13’450 15’368 48’540 48’178 45’238 43’326 40’764
15’368 19’490 41’316 41’354 38’311 37’105 36’461
19’490 38’160 12’994 13’346 11’458 11’164 12’226
38’160 44’651 11’404 10’789 10’546 10’203 10’872
44’651 62’888 8700 8730 7474 7725 7973
62’888 80’251 5233 5202 4792 4887 5145
80’251 91’424 6353 6490 6464 6303 6103
91’424 113’769 5049 5328 4934 4700 4618
113’769 151’040 3020 3037 3009 2977 2813
151’040 181’405 2688 2713 2707 2627 2537
181’405 183’131 3860 3889 3832 3596 3561
Table 52: Traffic intensity on the road A-10 Riga-Ventspils. Number of the cars in a day166
The number of trucks on the road Riga-Ventspils (between 181-183 km) and
Ventspils-Kuldiga/Saldus has changed between [2009] and [2019] [Tables 53 and
54]. In both cases, the proportion of the trucks has not changed significantly but the
differences have been noticed when comparing different years.
166 Traffic intensity on the road A-10 Riga-Ventspils, VAS Latvijas Valsts celi, https://lvceli.lv/celu-
tikls/statistikas-dati/satiksmes-intensitate/
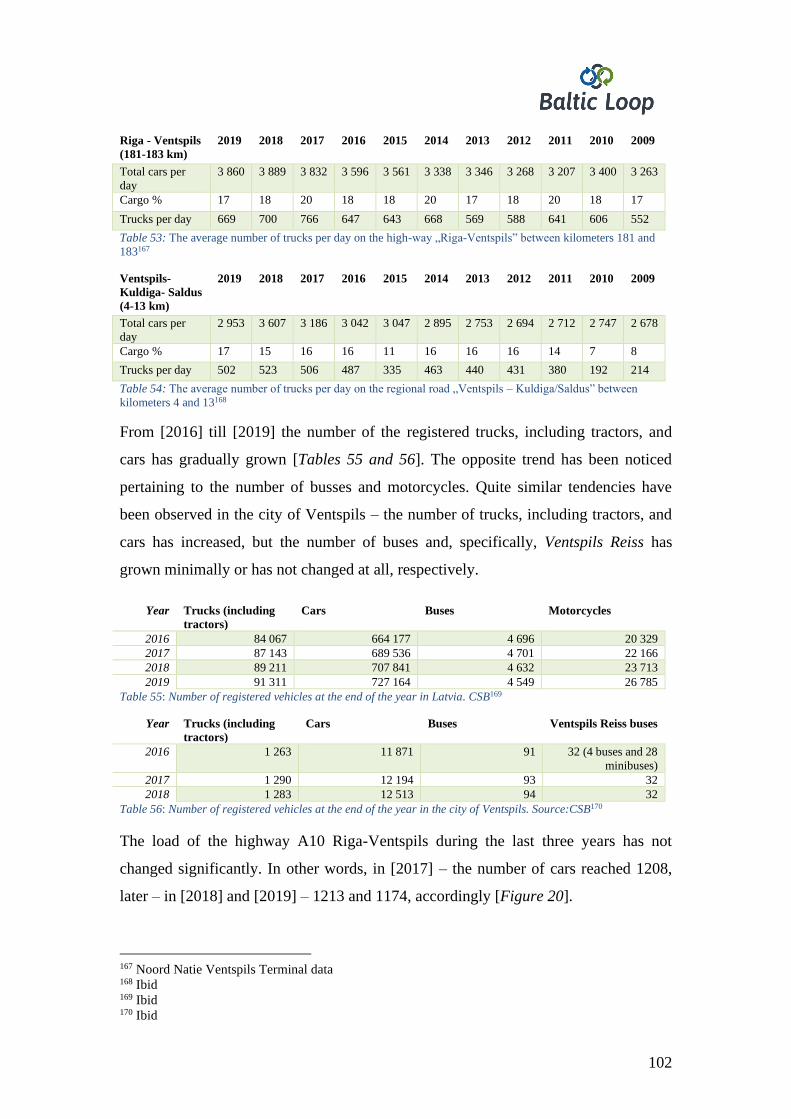
102
Riga - Ventspils
(181-183 km)
2019 2018 2017 2016 2015 2014 2013 2012 2011 2010 2009
Total cars per
day
3 860 3 889 3 832 3 596 3 561 3 338 3 346 3 268 3 207 3 400 3 263
Cargo % 17 18 20 18 18 20 17 18 20 18 17
Trucks per day 669 700 766 647 643 668 569 588 641 606 552
Table 53: The average number of trucks per day on the high-way „Riga-Ventspils” between kilometers 181 and
183167
Ventspils-
Kuldiga- Saldus
(4-13 km)
2019 2018 2017 2016 2015 2014 2013 2012 2011 2010 2009
Total cars per
day
2 953 3 607 3 186 3 042 3 047 2 895 2 753 2 694 2 712 2 747 2 678
Cargo % 17 15 16 16 11 16 16 16 14 7 8
Trucks per day 502 523 506 487 335 463 440 431 380 192 214
Table 54: The average number of trucks per day on the regional road „Ventspils – Kuldiga/Saldus” between
kilometers 4 and 13168
From [2016] till [2019] the number of the registered trucks, including tractors, and
cars has gradually grown [Tables 55 and 56]. The opposite trend has been noticed
pertaining to the number of busses and motorcycles. Quite similar tendencies have
been observed in the city of Ventspils – the number of trucks, including tractors, and
cars has increased, but the number of buses and, specifically, Ventspils Reiss has
grown minimally or has not changed at all, respectively.
Year Trucks (including
tractors)
Cars Buses Motorcycles
2016 84 067 664 177 4 696 20 329
2017 87 143 689 536 4 701 22 166
2018 89 211 707 841 4 632 23 713
2019 91 311 727 164 4 549 26 785
Table 55: Number of registered vehicles at the end of the year in Latvia. CSB169
Year Trucks (including
tractors)
Cars Buses Ventspils Reiss buses
2016 1 263 11 871 91 32 (4 buses and 28
minibuses)
2017 1 290 12 194 93 32
2018 1 283 12 513 94 32
Table 56: Number of registered vehicles at the end of the year in the city of Ventspils. Source:CSB170
The load of the highway A10 Riga-Ventspils during the last three years has not
changed significantly. In other words, in [2017] – the number of cars reached 1208,
later – in [2018] and [2019] – 1213 and 1174, accordingly [Figure 20].
167 Noord Natie Ventspils Terminal data 168 Ibid 169 Ibid 170 Ibid
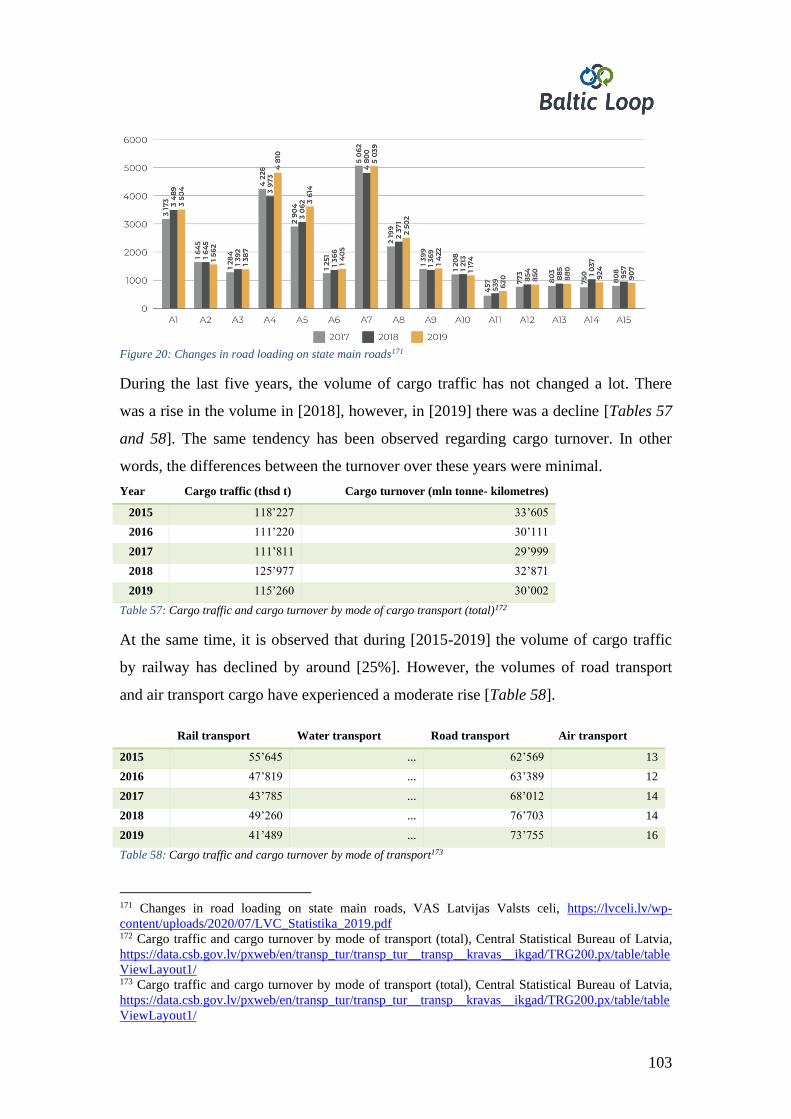
103
Figure 20: Changes in road loading on state main roads171
During the last five years, the volume of cargo traffic has not changed a lot. There
was a rise in the volume in [2018], however, in [2019] there was a decline [Tables 57
and 58]. The same tendency has been observed regarding cargo turnover. In other
words, the differences between the turnover over these years were minimal.
Year Cargo traffic (thsd t) Cargo turnover (mln tonne- kilometres)
2015 118’227 33’605
2016 111’220 30’111
2017 111’811 29’999
2018 125’977 32’871
2019 115’260 30’002
Table 57: Cargo traffic and cargo turnover by mode of cargo transport (total)172
At the same time, it is observed that during [2015-2019] the volume of cargo traffic
by railway has declined by around [25%]. However, the volumes of road transport
and air transport cargo have experienced a moderate rise [Table 58].
Rail transport Water transport Road transport Air transport
2015 55’645 ... 62’569 13
2016 47’819 ... 63’389 12
2017 43’785 ... 68’012 14
2018 49’260 ... 76’703 14
2019 41’489 ... 73’755 16
Table 58: Cargo traffic and cargo turnover by mode of transport173
171 Changes in road loading on state main roads, VAS Latvijas Valsts celi, https://lvceli.lv/wp-
content/uploads/2020/07/LVC_Statistika_2019.pdf 172 Cargo traffic and cargo turnover by mode of transport (total), Central Statistical Bureau of Latvia,
https://data.csb.gov.lv/pxweb/en/transp_tur/transp_tur__transp__kravas__ikgad/TRG200.px/table/table
ViewLayout1/ 173 Cargo traffic and cargo turnover by mode of transport (total), Central Statistical Bureau of Latvia,
https://data.csb.gov.lv/pxweb/en/transp_tur/transp_tur__transp__kravas__ikgad/TRG200.px/table/table
ViewLayout1/
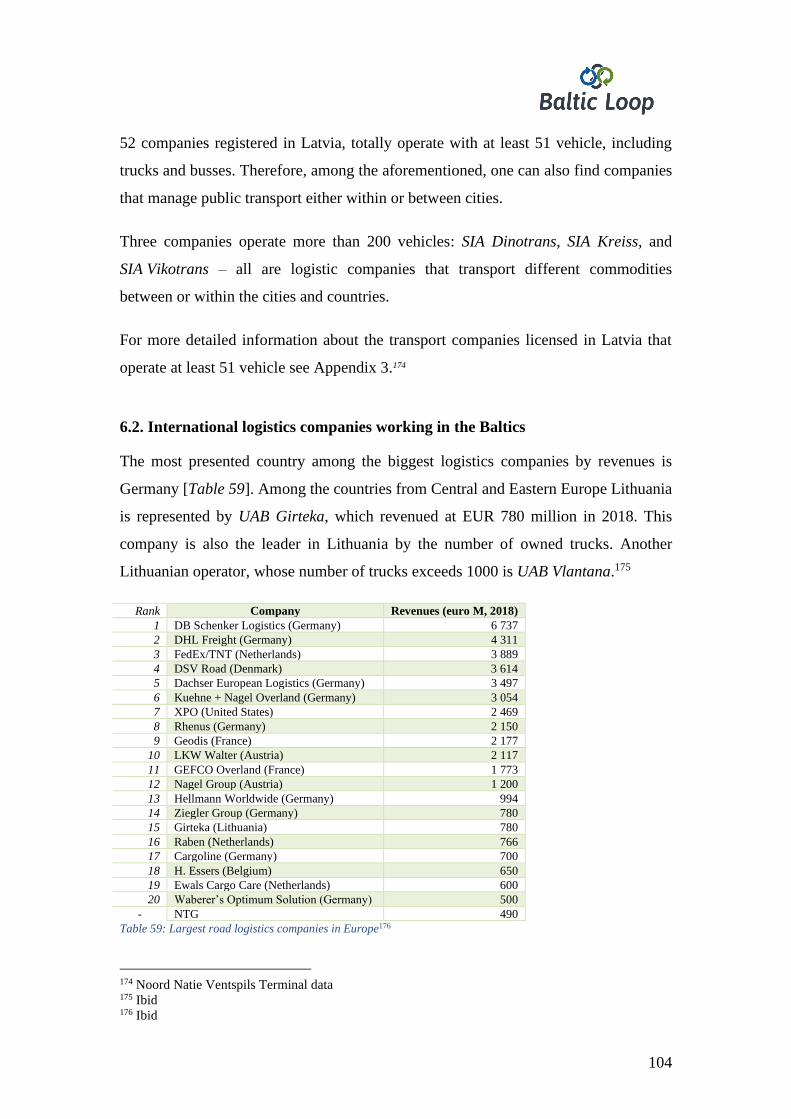
104
52 companies registered in Latvia, totally operate with at least 51 vehicle, including
trucks and busses. Therefore, among the aforementioned, one can also find companies
that manage public transport either within or between cities.
Three companies operate more than 200 vehicles: SIA Dinotrans, SIA Kreiss, and
SIA Vikotrans – all are logistic companies that transport different commodities
between or within the cities and countries.
For more detailed information about the transport companies licensed in Latvia that
operate at least 51 vehicle see Appendix 3.174
6.2. International logistics companies working in the Baltics
The most presented country among the biggest logistics companies by revenues is
Germany [Table 59]. Among the countries from Central and Eastern Europe Lithuania
is represented by UAB Girteka, which revenued at EUR 780 million in 2018. This
company is also the leader in Lithuania by the number of owned trucks. Another
Lithuanian operator, whose number of trucks exceeds 1000 is UAB Vlantana.175
Rank Company Revenues (euro M, 2018)
1 DB Schenker Logistics (Germany) 6 737
2 DHL Freight (Germany) 4 311
3 FedEx/TNT (Netherlands) 3 889
4 DSV Road (Denmark) 3 614
5 Dachser European Logistics (Germany) 3 497
6 Kuehne + Nagel Overland (Germany) 3 054
7 XPO (United States) 2 469
8 Rhenus (Germany) 2 150
9 Geodis (France) 2 177
10 LKW Walter (Austria) 2 117
11 GEFCO Overland (France) 1 773
12 Nagel Group (Austria) 1 200
13 Hellmann Worldwide (Germany) 994
14 Ziegler Group (Germany) 780
15 Girteka (Lithuania) 780
16 Raben (Netherlands) 766
17 Cargoline (Germany) 700
18 H. Essers (Belgium) 650
19 Ewals Cargo Care (Netherlands) 600
20 Waberer’s Optimum Solution (Germany) 500
- NTG 490
Table 59: Largest road logistics companies in Europe176
174 Noord Natie Ventspils Terminal data 175 Ibid 176 Ibid
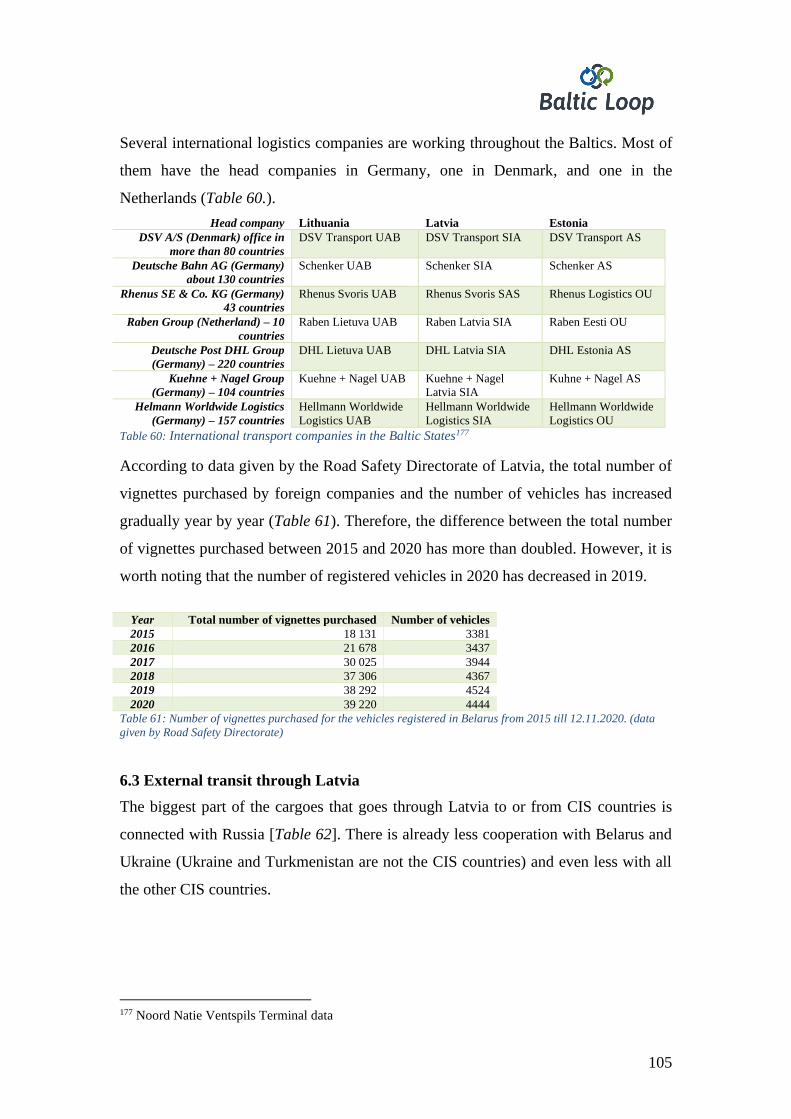
105
Several international logistics companies are working throughout the Baltics. Most of
them have the head companies in Germany, one in Denmark, and one in the
Netherlands (Table 60.).
Head company Lithuania Latvia Estonia
DSV A/S (Denmark) office in
more than 80 countries
DSV Transport UAB DSV Transport SIA DSV Transport AS
Deutsche Bahn AG (Germany)
about 130 countries
Schenker UAB Schenker SIA Schenker AS
Rhenus SE & Co. KG (Germany)
43 countries
Rhenus Svoris UAB Rhenus Svoris SAS Rhenus Logistics OU
Raben Group (Netherland) – 10
countries
Raben Lietuva UAB Raben Latvia SIA Raben Eesti OU
Deutsche Post DHL Group
(Germany) – 220 countries
DHL Lietuva UAB DHL Latvia SIA DHL Estonia AS
Kuehne + Nagel Group
(Germany) – 104 countries
Kuehne + Nagel UAB Kuehne + Nagel
Latvia SIA
Kuhne + Nagel AS
Helmann Worldwide Logistics
(Germany) – 157 countries
Hellmann Worldwide
Logistics UAB
Hellmann Worldwide
Logistics SIA
Hellmann Worldwide
Logistics OU
Table 60: International transport companies in the Baltic States177
According to data given by the Road Safety Directorate of Latvia, the total number of
vignettes purchased by foreign companies and the number of vehicles has increased
gradually year by year (Table 61). Therefore, the difference between the total number
of vignettes purchased between 2015 and 2020 has more than doubled. However, it is
worth noting that the number of registered vehicles in 2020 has decreased in 2019.
Year Total number of vignettes purchased Number of vehicles
2015 18 131 3381
2016 21 678 3437
2017 30 025 3944
2018 37 306 4367
2019 38 292 4524
2020 39 220 4444
Table 61: Number of vignettes purchased for the vehicles registered in Belarus from 2015 till 12.11.2020. (data
given by Road Safety Directorate)
6.3 External transit through Latvia
The biggest part of the cargoes that goes through Latvia to or from CIS countries is
connected with Russia [Table 62]. There is already less cooperation with Belarus and
Ukraine (Ukraine and Turkmenistan are not the CIS countries) and even less with all
the other CIS countries.
177 Noord Natie Ventspils Terminal data
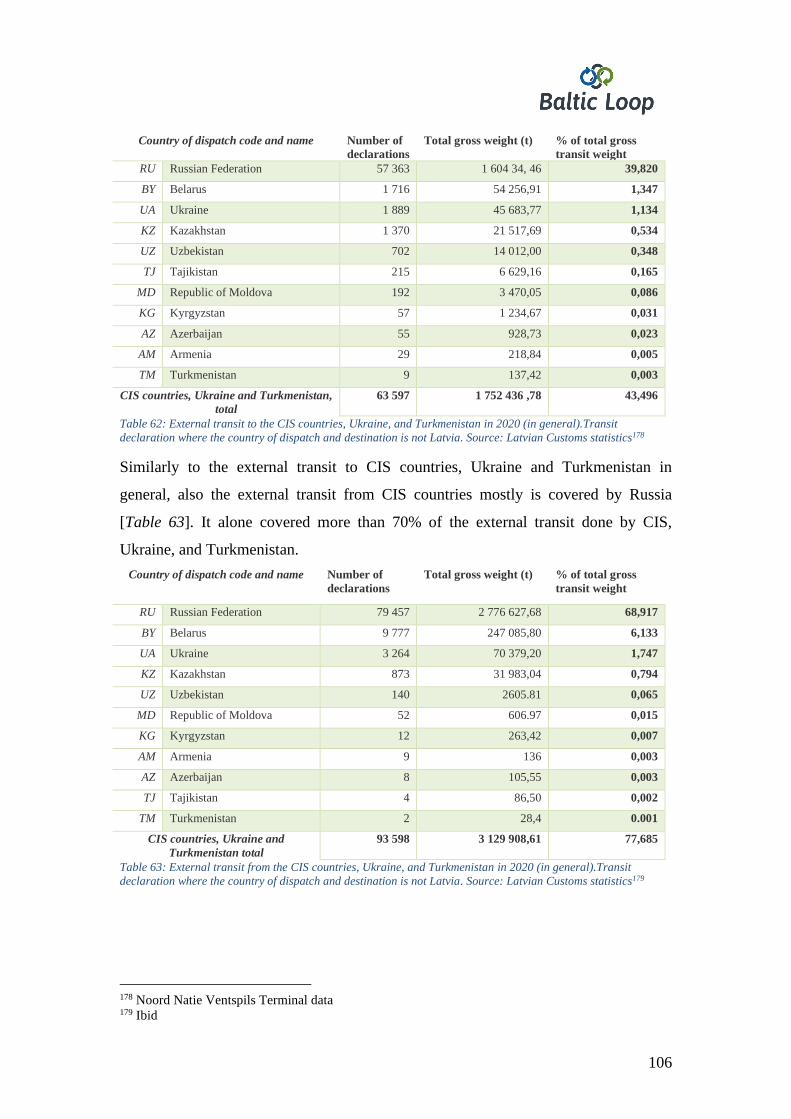
106
Country of dispatch code and name Number of
declarations
Total gross weight (t) % of total gross
transit weight
RU Russian Federation 57 363 1 604 34, 46 39,820
BY Belarus 1 716 54 256,91 1,347
UA Ukraine 1 889 45 683,77 1,134
KZ Kazakhstan 1 370 21 517,69 0,534
UZ Uzbekistan 702 14 012,00 0,348
TJ Tajikistan 215 6 629,16 0,165
MD Republic of Moldova 192 3 470,05 0,086
KG Kyrgyzstan 57 1 234,67 0,031
AZ Azerbaijan 55 928,73 0,023
AM Armenia 29 218,84 0,005
TM Turkmenistan 9 137,42 0,003
CIS countries, Ukraine and Turkmenistan,
total
63 597 1 752 436 ,78 43,496
Table 62: External transit to the CIS countries, Ukraine, and Turkmenistan in 2020 (in general).Transit
declaration where the country of dispatch and destination is not Latvia. Source: Latvian Customs statistics178
Similarly to the external transit to CIS countries, Ukraine and Turkmenistan in
general, also the external transit from CIS countries mostly is covered by Russia
[Table 63]. It alone covered more than 70% of the external transit done by CIS,
Ukraine, and Turkmenistan.
Country of dispatch code and name Number of
declarations
Total gross weight (t) % of total gross
transit weight
RU Russian Federation 79 457 2 776 627,68 68,917
BY Belarus 9 777 247 085,80 6,133
UA Ukraine 3 264 70 379,20 1,747
KZ Kazakhstan 873 31 983,04 0,794
UZ Uzbekistan 140 2605.81 0,065
MD Republic of Moldova 52 606.97 0,015
KG Kyrgyzstan 12 263,42 0,007
AM Armenia 9 136 0,003
AZ Azerbaijan 8 105,55 0,003
TJ Tajikistan 4 86,50 0,002
TM Turkmenistan 2 28,4 0.001
CIS countries, Ukraine and
Turkmenistan total
93 598 3 129 908,61 77,685
Table 63: External transit from the CIS countries, Ukraine, and Turkmenistan in 2020 (in general).Transit
declaration where the country of dispatch and destination is not Latvia. Source: Latvian Customs statistics179
178 Noord Natie Ventspils Terminal data 179 Ibid
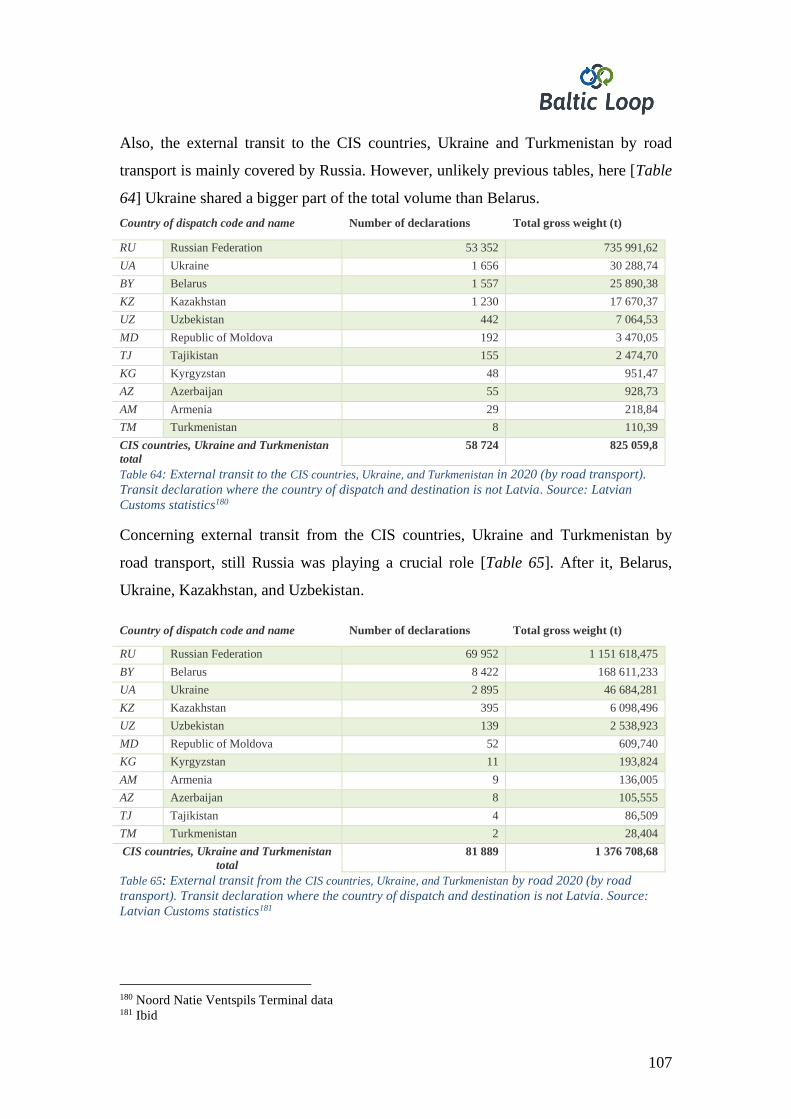
107
Also, the external transit to the CIS countries, Ukraine and Turkmenistan by road
transport is mainly covered by Russia. However, unlikely previous tables, here [Table
64] Ukraine shared a bigger part of the total volume than Belarus.
Country of dispatch code and name Number of declarations Total gross weight (t)
RU Russian Federation 53 352 735 991,62
UA Ukraine 1 656 30 288,74
BY Belarus 1 557 25 890,38
KZ Kazakhstan 1 230 17 670,37
UZ Uzbekistan 442 7 064,53
MD Republic of Moldova 192 3 470,05
TJ Tajikistan 155 2 474,70
KG Kyrgyzstan 48 951,47
AZ Azerbaijan 55 928,73
AM Armenia 29 218,84
TM Turkmenistan 8 110,39
CIS countries, Ukraine and Turkmenistan
total
58 724 825 059,8
Table 64: External transit to the CIS countries, Ukraine, and Turkmenistan in 2020 (by road transport).
Transit declaration where the country of dispatch and destination is not Latvia. Source: Latvian
Customs statistics180
Concerning external transit from the CIS countries, Ukraine and Turkmenistan by
road transport, still Russia was playing a crucial role [Table 65]. After it, Belarus,
Ukraine, Kazakhstan, and Uzbekistan.
Country of dispatch code and name Number of declarations Total gross weight (t)
RU Russian Federation 69 952 1 151 618,475
BY Belarus 8 422 168 611,233
UA Ukraine 2 895 46 684,281
KZ Kazakhstan 395 6 098,496
UZ Uzbekistan 139 2 538,923
MD Republic of Moldova 52 609,740
KG Kyrgyzstan 11 193,824
AM Armenia 9 136,005
AZ Azerbaijan 8 105,555
TJ Tajikistan 4 86,509
TM Turkmenistan 2 28,404
CIS countries, Ukraine and Turkmenistan
total
81 889 1 376 708,68
Table 65: External transit from the CIS countries, Ukraine, and Turkmenistan by road 2020 (by road
transport). Transit declaration where the country of dispatch and destination is not Latvia. Source:
Latvian Customs statistics181
180 Noord Natie Ventspils Terminal data 181 Ibid
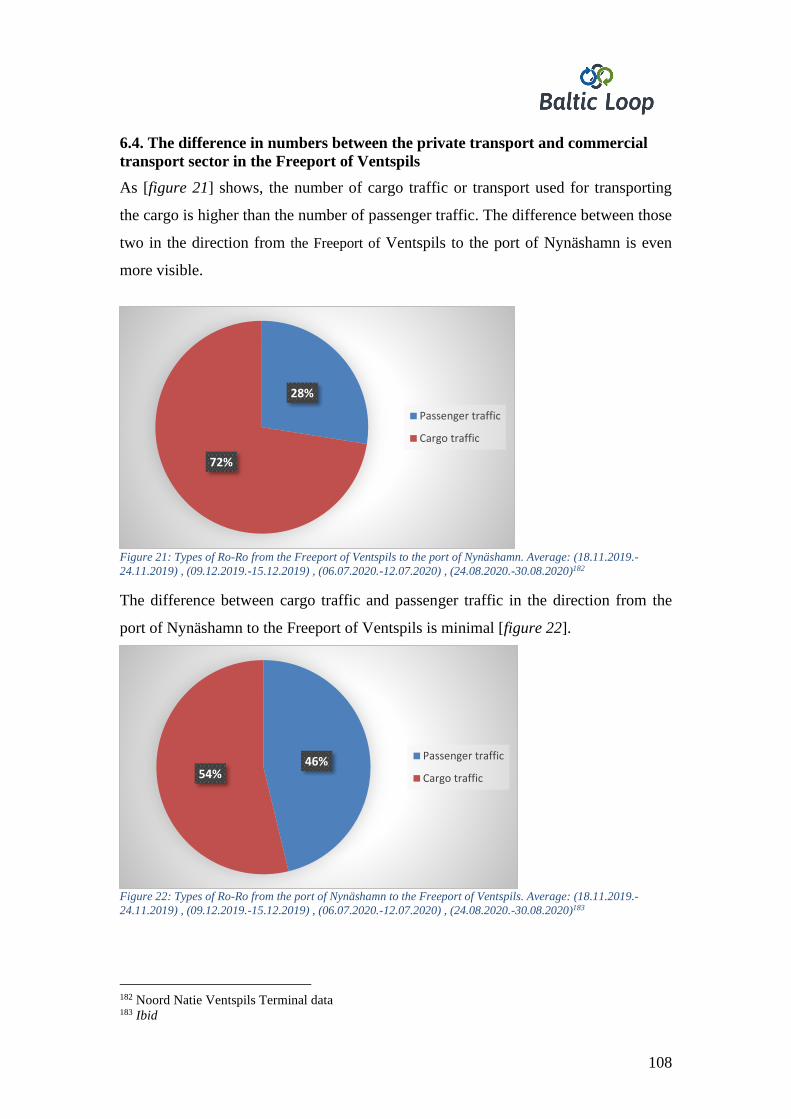
108
6.4. The difference in numbers between the private transport and commercial
transport sector in the Freeport of Ventspils
As [figure 21] shows, the number of cargo traffic or transport used for transporting
the cargo is higher than the number of passenger traffic. The difference between those
two in the direction from the Freeport of Ventspils to the port of Nynäshamn is even
more visible.
Figure 21: Types of Ro-Ro from the Freeport of Ventspils to the port of Nynäshamn. Average: (18.11.2019.-
24.11.2019) , (09.12.2019.-15.12.2019) , (06.07.2020.-12.07.2020) , (24.08.2020.-30.08.2020)182
The difference between cargo traffic and passenger traffic in the direction from the
port of Nynäshamn to the Freeport of Ventspils is minimal [figure 22].
Figure 22: Types of Ro-Ro from the port of Nynäshamn to the Freeport of Ventspils. Average: (18.11.2019.-
24.11.2019) , (09.12.2019.-15.12.2019) , (06.07.2020.-12.07.2020) , (24.08.2020.-30.08.2020)183
182 Noord Natie Ventspils Terminal data 183 Ibid
28%
72%
Passenger traffic
Cargo traffic
46%54%
Passenger traffic
Cargo traffic
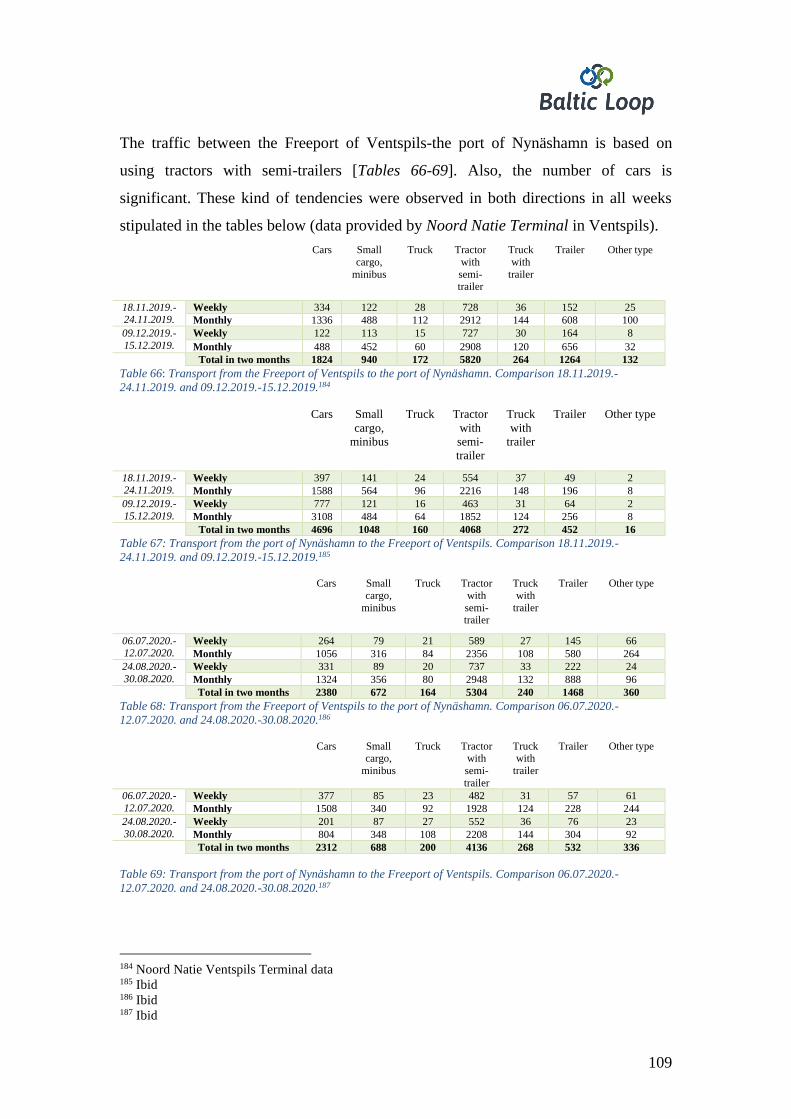
109
The traffic between the Freeport of Ventspils-the port of Nynäshamn is based on
using tractors with semi-trailers [Tables 66-69]. Also, the number of cars is
significant. These kind of tendencies were observed in both directions in all weeks
stipulated in the tables below (data provided by Noord Natie Terminal in Ventspils).
Cars Small
cargo,
minibus
Truck Tractor
with
semi- trailer
Truck
with
trailer
Trailer Other type
18.11.2019.-24.11.2019.
Weekly 334 122 28 728 36 152 25
Monthly 1336 488 112 2912 144 608 100
09.12.2019.-
15.12.2019.
Weekly 122 113 15 727 30 164 8
Monthly 488 452 60 2908 120 656 32 Total in two months 1824 940 172 5820 264 1264 132
Table 66: Transport from the Freeport of Ventspils to the port of Nynäshamn. Comparison 18.11.2019.-
24.11.2019. and 09.12.2019.-15.12.2019.184
Cars Small
cargo,
minibus
Truck Tractor
with
semi-
trailer
Truck
with
trailer
Trailer Other type
18.11.2019.-
24.11.2019.
Weekly 397 141 24 554 37 49 2
Monthly 1588 564 96 2216 148 196 8
09.12.2019.-
15.12.2019.
Weekly 777 121 16 463 31 64 2
Monthly 3108 484 64 1852 124 256 8 Total in two months 4696 1048 160 4068 272 452 16
Table 67: Transport from the port of Nynäshamn to the Freeport of Ventspils. Comparison 18.11.2019.-
24.11.2019. and 09.12.2019.-15.12.2019.185
Cars Small
cargo,
minibus
Truck Tractor
with
semi- trailer
Truck
with
trailer
Trailer Other type
06.07.2020.-12.07.2020.
Weekly 264 79 21 589 27 145 66
Monthly 1056 316 84 2356 108 580 264
24.08.2020.-
30.08.2020.
Weekly 331 89 20 737 33 222 24
Monthly 1324 356 80 2948 132 888 96
Total in two months 2380 672 164 5304 240 1468 360
Table 68: Transport from the Freeport of Ventspils to the port of Nynäshamn. Comparison 06.07.2020.-
12.07.2020. and 24.08.2020.-30.08.2020.186
Cars Small cargo,
minibus
Truck Tractor with
semi-
trailer
Truck with
trailer
Trailer Other type
06.07.2020.-
12.07.2020.
Weekly 377 85 23 482 31 57 61
Monthly 1508 340 92 1928 124 228 244
24.08.2020.-
30.08.2020.
Weekly 201 87 27 552 36 76 23
Monthly 804 348 108 2208 144 304 92
Total in two months 2312 688 200 4136 268 532 336
Table 69: Transport from the port of Nynäshamn to the Freeport of Ventspils. Comparison 06.07.2020.-
12.07.2020. and 24.08.2020.-30.08.2020.187
184 Noord Natie Ventspils Terminal data 185 Ibid 186 Ibid 187 Ibid
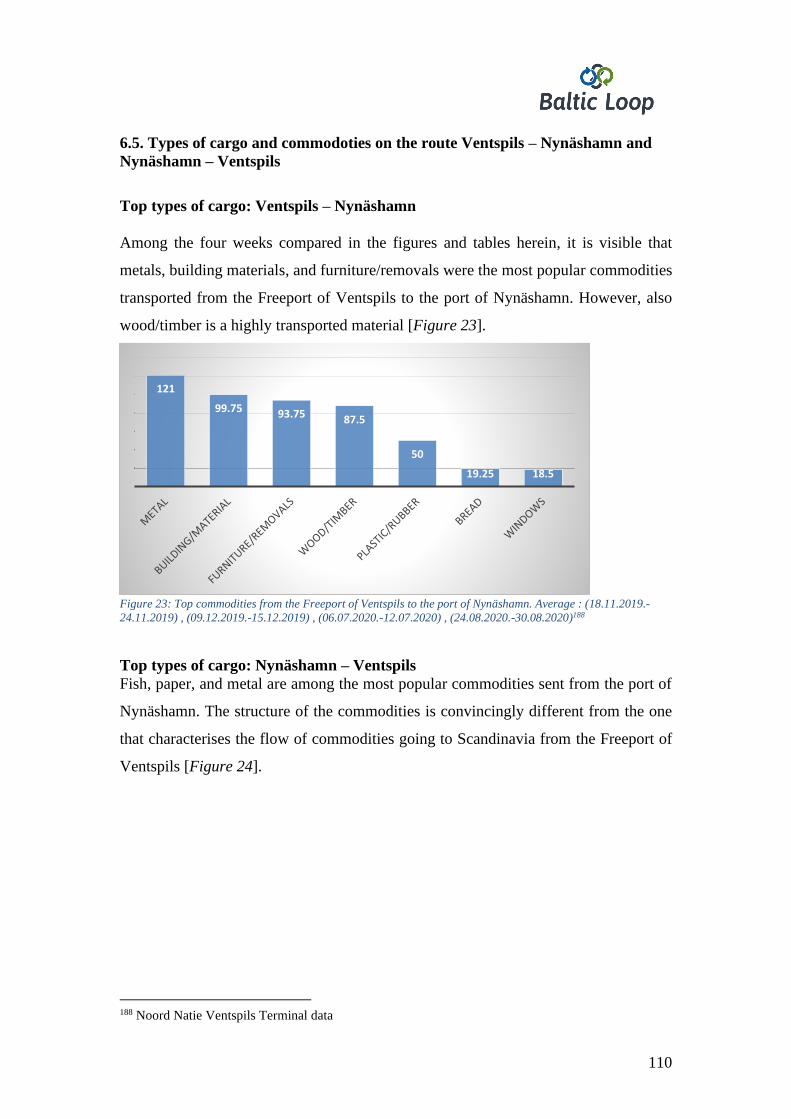
110
6.5. Types of cargo and commodoties on the route Ventspils – Nynäshamn and
Nynäshamn – Ventspils
Top types of cargo: Ventspils – Nynäshamn
Among the four weeks compared in the figures and tables herein, it is visible that
metals, building materials, and furniture/removals were the most popular commodities
transported from the Freeport of Ventspils to the port of Nynäshamn. However, also
wood/timber is a highly transported material [Figure 23].
Figure 23: Top commodities from the Freeport of Ventspils to the port of Nynäshamn. Average : (18.11.2019.-
24.11.2019) , (09.12.2019.-15.12.2019) , (06.07.2020.-12.07.2020) , (24.08.2020.-30.08.2020)188
Top types of cargo: Nynäshamn – Ventspils
Fish, paper, and metal are among the most popular commodities sent from the port of
Nynäshamn. The structure of the commodities is convincingly different from the one
that characterises the flow of commodities going to Scandinavia from the Freeport of
Ventspils [Figure 24].
188 Noord Natie Ventspils Terminal data
121
99.75 93.75 87.5
50
19.25 18.5
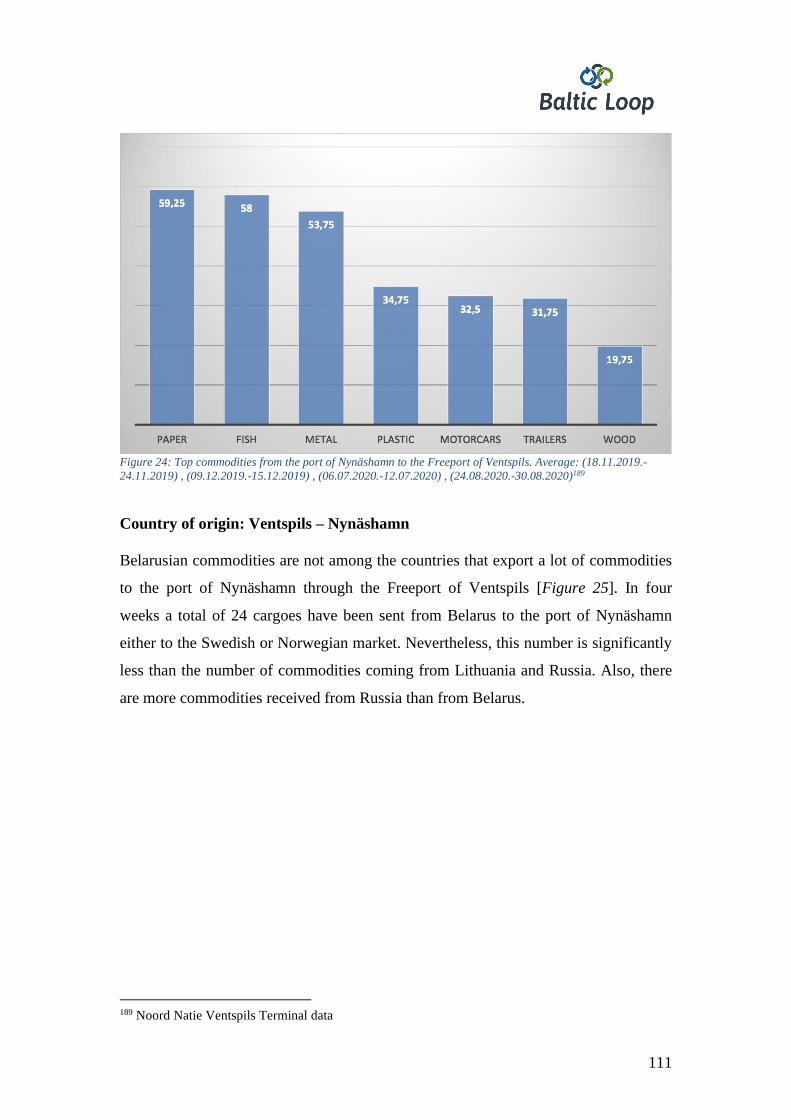
111
Figure 24: Top commodities from the port of Nynäshamn to the Freeport of Ventspils. Average: (18.11.2019.-
24.11.2019) , (09.12.2019.-15.12.2019) , (06.07.2020.-12.07.2020) , (24.08.2020.-30.08.2020)189
Country of origin: Ventspils – Nynäshamn
Belarusian commodities are not among the countries that export a lot of commodities
to the port of Nynäshamn through the Freeport of Ventspils [Figure 25]. In four
weeks a total of 24 cargoes have been sent from Belarus to the port of Nynäshamn
either to the Swedish or Norwegian market. Nevertheless, this number is significantly
less than the number of commodities coming from Lithuania and Russia. Also, there
are more commodities received from Russia than from Belarus.
189 Noord Natie Ventspils Terminal data
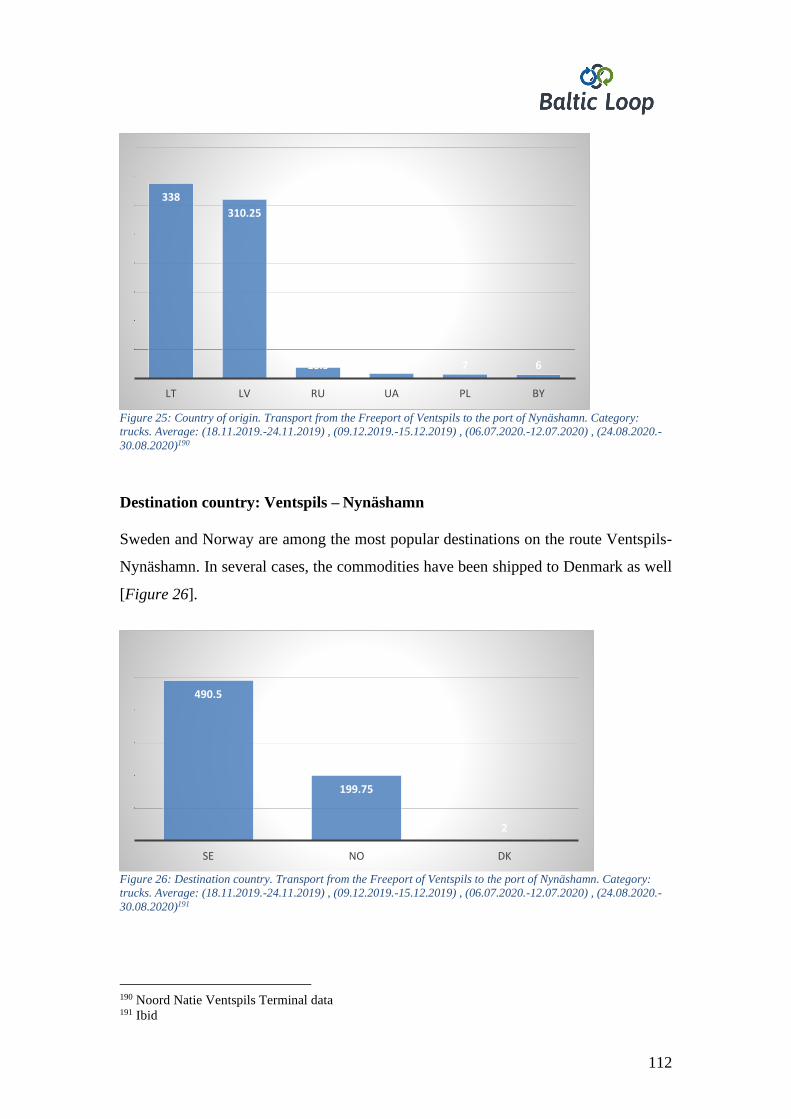
112
Figure 25: Country of origin. Transport from the Freeport of Ventspils to the port of Nynäshamn. Category:
trucks. Average: (18.11.2019.-24.11.2019) , (09.12.2019.-15.12.2019) , (06.07.2020.-12.07.2020) , (24.08.2020.-
30.08.2020)190
Destination country: Ventspils – Nynäshamn
Sweden and Norway are among the most popular destinations on the route Ventspils-
Nynäshamn. In several cases, the commodities have been shipped to Denmark as well
[Figure 26].
Figure 26: Destination country. Transport from the Freeport of Ventspils to the port of Nynäshamn. Category:
trucks. Average: (18.11.2019.-24.11.2019) , (09.12.2019.-15.12.2019) , (06.07.2020.-12.07.2020) , (24.08.2020.-
30.08.2020)191
190 Noord Natie Ventspils Terminal data 191 Ibid
338
310.25
18.5 8.25 7 6
LT LV RU UA PL BY
490.5
199.75
2
SE NO DK
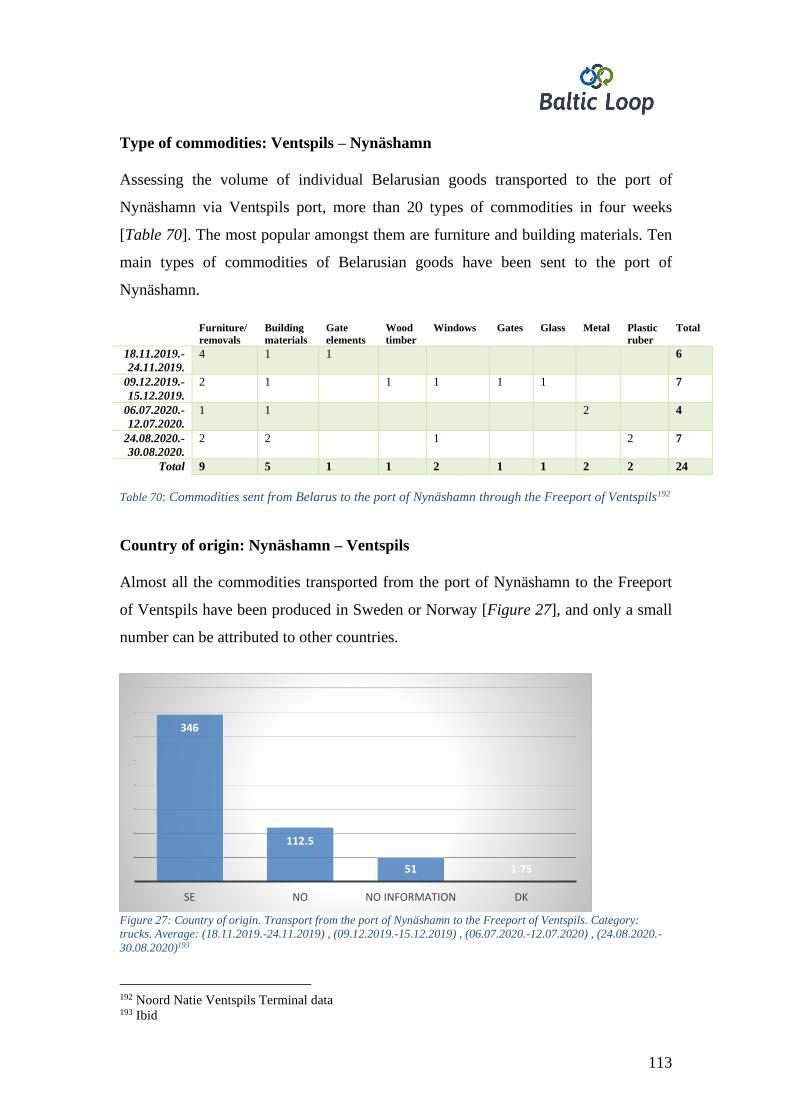
113
Type of commodities: Ventspils – Nynäshamn
Assessing the volume of individual Belarusian goods transported to the port of
Nynäshamn via Ventspils port, more than 20 types of commodities in four weeks
[Table 70]. The most popular amongst them are furniture and building materials. Ten
main types of commodities of Belarusian goods have been sent to the port of
Nynäshamn.
Furniture/
removals
Building
materials
Gate
elements
Wood
timber
Windows Gates Glass Metal Plastic
ruber
Total
18.11.2019.-
24.11.2019.
4 1 1 6
09.12.2019.-
15.12.2019.
2 1 1 1 1 1 7
06.07.2020.-
12.07.2020.
1 1 2 4
24.08.2020.-
30.08.2020.
2 2 1 2 7
Total 9 5 1 1 2 1 1 2 2 24
Table 70: Commodities sent from Belarus to the port of Nynäshamn through the Freeport of Ventspils192
Country of origin: Nynäshamn – Ventspils
Almost all the commodities transported from the port of Nynäshamn to the Freeport
of Ventspils have been produced in Sweden or Norway [Figure 27], and only a small
number can be attributed to other countries.
Figure 27: Country of origin. Transport from the port of Nynäshamn to the Freeport of Ventspils. Category:
trucks. Average: (18.11.2019.-24.11.2019) , (09.12.2019.-15.12.2019) , (06.07.2020.-12.07.2020) , (24.08.2020.-
30.08.2020)193
192 Noord Natie Ventspils Terminal data 193 Ibid
346
112.5
51 1.75
SE NO NO INFORMATION DK
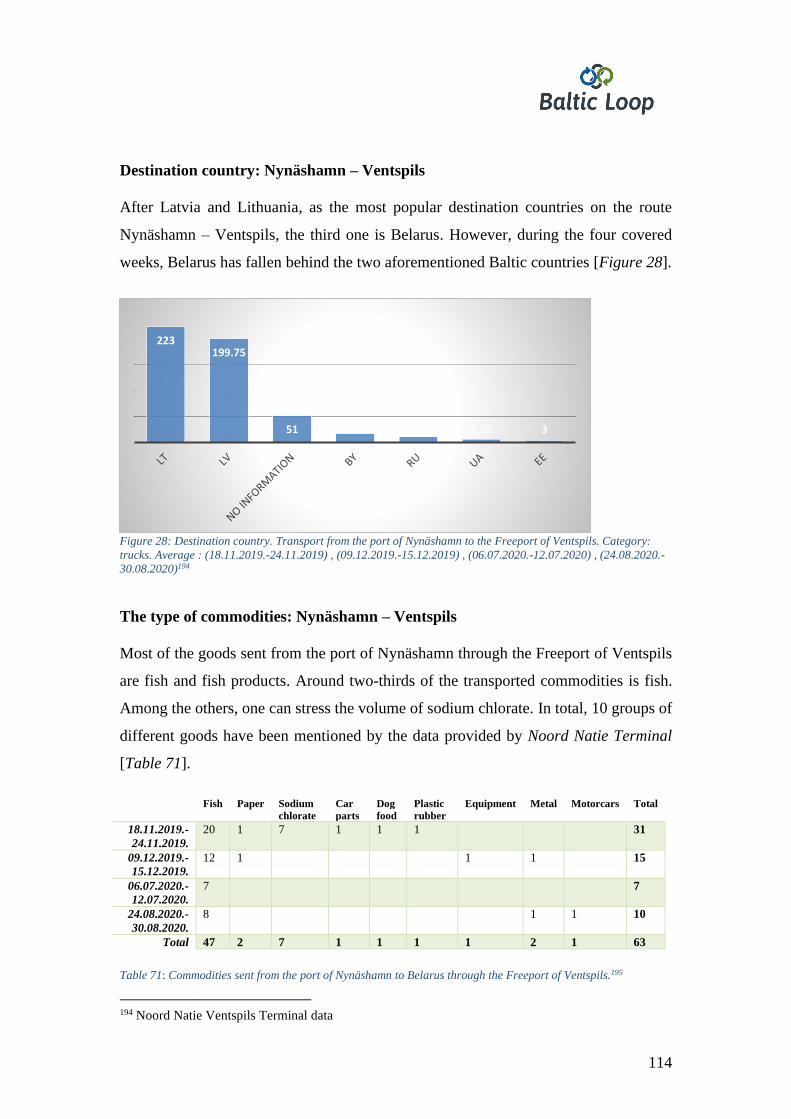
114
Destination country: Nynäshamn – Ventspils
After Latvia and Lithuania, as the most popular destination countries on the route
Nynäshamn – Ventspils, the third one is Belarus. However, during the four covered
weeks, Belarus has fallen behind the two aforementioned Baltic countries [Figure 28].
Figure 28: Destination country. Transport from the port of Nynäshamn to the Freeport of Ventspils. Category:
trucks. Average : (18.11.2019.-24.11.2019) , (09.12.2019.-15.12.2019) , (06.07.2020.-12.07.2020) , (24.08.2020.-
30.08.2020)194
The type of commodities: Nynäshamn – Ventspils
Most of the goods sent from the port of Nynäshamn through the Freeport of Ventspils
are fish and fish products. Around two-thirds of the transported commodities is fish.
Among the others, one can stress the volume of sodium chlorate. In total, 10 groups of
different goods have been mentioned by the data provided by Noord Natie Terminal
[Table 71].
Fish Paper Sodium
chlorate
Car
parts
Dog
food
Plastic
rubber
Equipment Metal Motorcars Total
18.11.2019.-
24.11.2019.
20 1 7 1 1 1 31
09.12.2019.-
15.12.2019.
12 1 1 1 15
06.07.2020.-
12.07.2020.
7 7
24.08.2020.-
30.08.2020.
8 1 1 10
Total 47 2 7 1 1 1 1 2 1 63
Table 71: Commodities sent from the port of Nynäshamn to Belarus through the Freeport of Ventspils.195
194 Noord Natie Ventspils Terminal data
223199.75
51 16.25 10.25 5.75 3
115
6.6. Conclusions
The Belarusian goods transported from the port of Nynäshamn to the Freeport of
Ventspils and vice versa are different. If the most popular commodities in the
direction of Nynäshamn are metals, furniture, and building materials, but vice versa –
fish, paper, and metal.
Nevertheless, Belarusian commodities are not among the most popular goods sent to
Ventspils, and Belarus is not the most popular destination in the direction of
Nynäshamn.
Regarding the transit through the Freeport of Ventspils to Sweden, one must mention
that most parts of the commodities are coming from Russia.
Typically, between Riga and Ventspils the busiest traffic is closer to Riga and
Ventspils. However, the load of the highway A10 Riga-Ventspils during the last three
years has not changed significantly.
There are three logistics companies in Latvia that operate more than 200 vehicles: SIA
Dinotrans, SIA Kreiss, and SIA Vikotrans. Nevertheless, on the European level, the
biggest logistics companies by revenues are coming from Germany, and among the
countries from Central and Eastern Europe, only Lithuania is represented by UAB
Girteka.
Data also are showing that between 2015 and 2020 the total number of vignettes
purchased by foreign companies has more than doubled.
For external transit, through Latvia, the biggest part of the cargoes to or from CIS and
other Eastern European and Central Asian countries is connected with Russia.
195 Noord Natie Ventspils Terminal data
116
7. Freight village development in Ventspils
7.1. The review of the freight villages around Europe
Within this research, the freight villages are logistics centres, where the cargoes from
different transport modes can be reloaded, compiled, and prepared for transportation.
Therefore, the freight villages bring together different transport modes (road, rail),
transport companies (forwarders, warehousing), supplementary transport services
(vehicle, consultancy services, etc.) as well as industrial and trading companies.196
Freight villages reflect a modern way of organising logistics, transport, and goods
distribution activities. Warehouses are a basic element in such building complexes,
and their efficient planning and operation are essential for the viability of the
system.197
The main function of the freight villages is the management of politically promoted
combined transport and the shifting of cargo traffic from road to rail. These villages
are characterised by the following features:
- Location of transport economical companies, logistic operators and industrial
and trading companies on the same industrial estate.
- Access to at least two transport modes, in particular, road and rail.
- Management of the local freight village companies, which also initiate and
facilitate cooperative activities.198
The freight villages are called in different ways depending on the country. For
instance, in Italy the „freight villages” are called Interporti [Interports - English], in
Denmark – Transport Centres, in Germany – Gunterverkehrszentren (GVZ) [Freight
centres - English] and in Spain – Zonas de Actividades Logisticas [Logistics Activity
196 What is Freight Village? DGG, https://www.gvz-org.de/en/freight-villages/ 197 Ibid 198 Ibid
117
Zones - English]. Behind each term is a different understanding of the logistics and
freight villages.199
The biggest freight villages are located outside of the Baltic Sea Region. For example,
one can find several of them in Russia and Poland: freight villages Vorsino and Rosva
in Kaluga Region200 and CLIP Logistics in Poznan201, respectively.
Freight village Vorsino is located on the border of New Moscow and Kaluga Region
as part of the Industrial Park Vorsino.202 [Table 72] Vorsino provides access to shared
facilities, equipment and performs management for long-term planning, investment,
governance, and other issues. Besides freight village, Vorsino provides a railway
terminal with a handling capacity of up to 350 000 TEU/year.
199 Office Prime, „Freight villages: Some European Models”,
http://www.officeprime.eu/2017/02/18/freight-villages/ 200 Freight Village RU, http://freightvillage.ru/ 201 „CLIP Logistics”, http://clip-group.com/en/strona-glowna-en-2/ 202 „Vorsino”, Freight village „Vorsino”, http://freightvillage.ru/en/vorsino
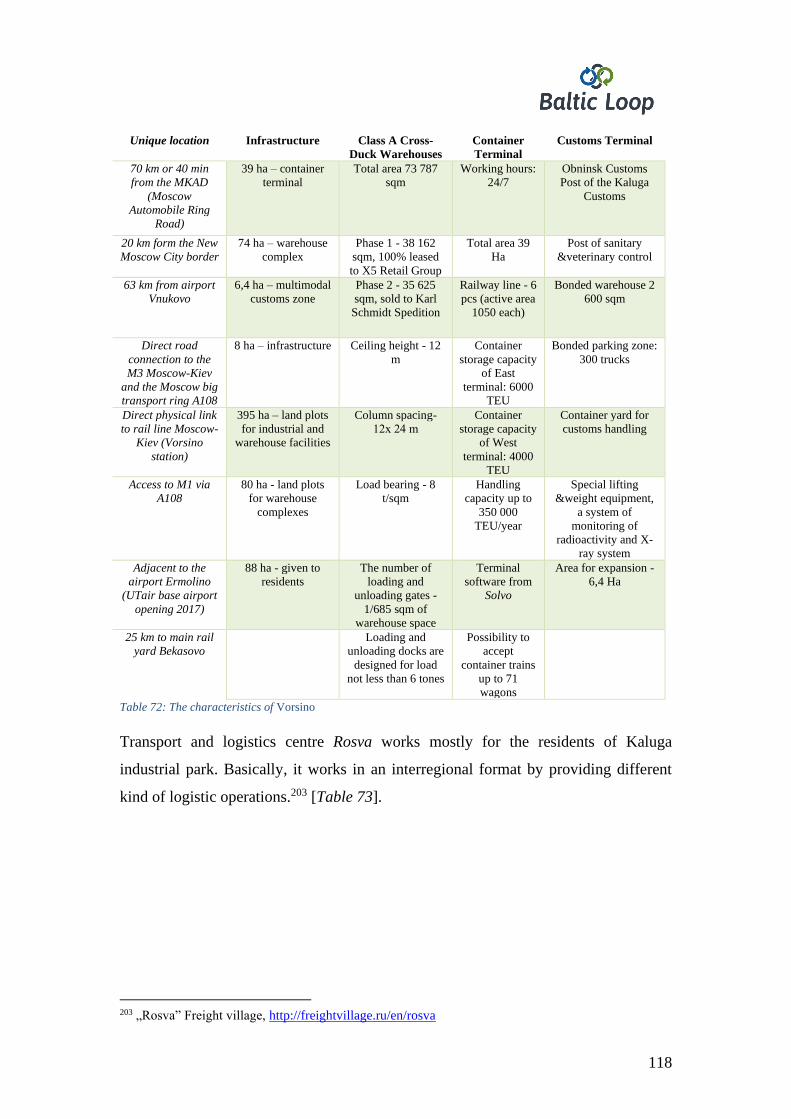
118
Unique location Infrastructure Class A Cross-
Duck Warehouses
Container
Terminal
Customs Terminal
70 km or 40 min
from the MKAD
(Moscow
Automobile Ring
Road)
39 ha – container
terminal
Total area 73 787
sqm
Working hours:
24/7
Obninsk Customs
Post of the Kaluga
Customs
20 km form the New
Moscow City border
74 ha – warehouse
complex
Phase 1 - 38 162
sqm, 100% leased
to X5 Retail Group
Total area 39
Ha
Post of sanitary
&veterinary control
63 km from airport
Vnukovo
6,4 ha – multimodal
customs zone
Phase 2 - 35 625
sqm, sold to Karl
Schmidt Spedition
Railway line - 6
pcs (active area
1050 each)
Bonded warehouse 2
600 sqm
Direct road
connection to the
M3 Moscow-Kiev
and the Moscow big
transport ring A108
8 ha – infrastructure
Ceiling height - 12
m
Container
storage capacity
of East
terminal: 6000
TEU
Bonded parking zone:
300 trucks
Direct physical link
to rail line Moscow-
Kiev (Vorsino
station)
395 ha – land plots
for industrial and
warehouse facilities
Column spacing-
12х 24 m
Container
storage capacity
of West
terminal: 4000
TEU
Container yard for
customs handling
Access to M1 via
A108
80 ha - land plots
for warehouse
complexes
Load bearing - 8
t/sqm
Handling
capacity up to
350 000
TEU/year
Special lifting
&weight equipment,
a system of
monitoring of
radioactivity and X-
ray system
Adjacent to the
airport Ermolino
(UTair base airport
opening 2017)
88 ha - given to
residents
The number of
loading and
unloading gates -
1/685 sqm of
warehouse space
Terminal
software from
Solvo
Area for expansion -
6,4 Ha
25 km to main rail
yard Bekasovo
Loading and
unloading docks are
designed for load
not less than 6 tones
Possibility to
accept
container trains
up to 71
wagons
Table 72: The characteristics of Vorsino
Transport and logistics centre Rosva works mostly for the residents of Kaluga
industrial park. Basically, it works in an interregional format by providing different
kind of logistic operations.203 [Table 73].
203 „Rosva” Freight village, http://freightvillage.ru/en/rosva
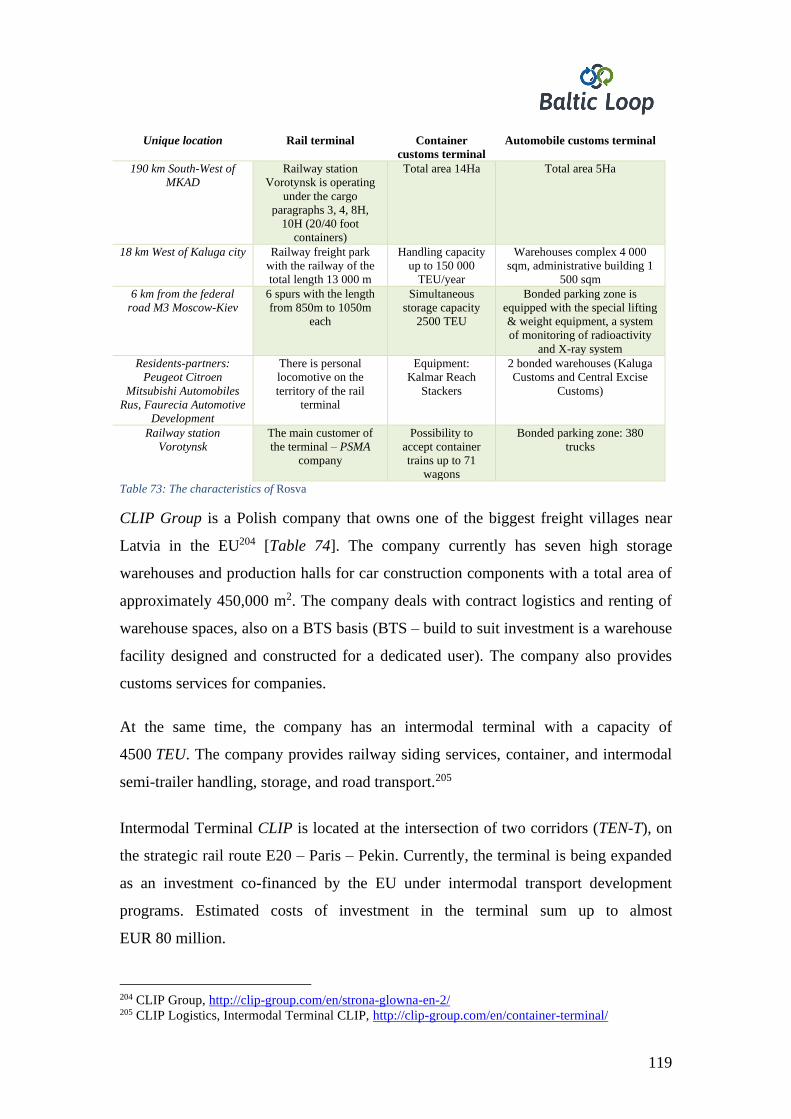
119
Unique location Rail terminal Container
customs terminal
Automobile customs terminal
190 km South-West of
MKAD
Railway station
Vorotynsk is operating
under the cargo
paragraphs 3, 4, 8H,
10H (20/40 foot
containers)
Total area 14Ha Total area 5Ha
18 km West of Kaluga city Railway freight park
with the railway of the
total length 13 000 m
Handling capacity
up to 150 000
TEU/year
Warehouses complex 4 000
sqm, administrative building 1
500 sqm
6 km from the federal
road M3 Moscow-Kiev
6 spurs with the length
from 850m to 1050m
each
Simultaneous
storage capacity
2500 TEU
Bonded parking zone is
equipped with the special lifting
& weight equipment, a system
of monitoring of radioactivity
and X-ray system
Residents-partners:
Peugeot Citroen
Mitsubishi Automobiles
Rus, Faurecia Automotive
Development
There is personal
locomotive on the
territory of the rail
terminal
Equipment:
Kalmar Reach
Stackers
2 bonded warehouses (Kaluga
Customs and Central Excise
Customs)
Railway station
Vorotynsk
The main customer of
the terminal – PSMA
company
Possibility to
accept container
trains up to 71
wagons
Bonded parking zone: 380
trucks
Table 73: The characteristics of Rosva
CLIP Group is a Polish company that owns one of the biggest freight villages near
Latvia in the EU204 [Table 74]. The company currently has seven high storage
warehouses and production halls for car construction components with a total area of
approximately 450,000 m2. The company deals with contract logistics and renting of
warehouse spaces, also on a BTS basis (BTS – build to suit investment is a warehouse
facility designed and constructed for a dedicated user). The company also provides
customs services for companies.
At the same time, the company has an intermodal terminal with a capacity of
4500 TEU. The company provides railway siding services, container, and intermodal
semi-trailer handling, storage, and road transport.205
Intermodal Terminal CLIP is located at the intersection of two corridors (TEN-T), on
the strategic rail route E20 – Paris – Pekin. Currently, the terminal is being expanded
as an investment co-financed by the EU under intermodal transport development
programs. Estimated costs of investment in the terminal sum up to almost
EUR 80 million.
204 CLIP Group, http://clip-group.com/en/strona-glowna-en-2/ 205 CLIP Logistics, Intermodal Terminal CLIP, http://clip-group.com/en/container-terminal/
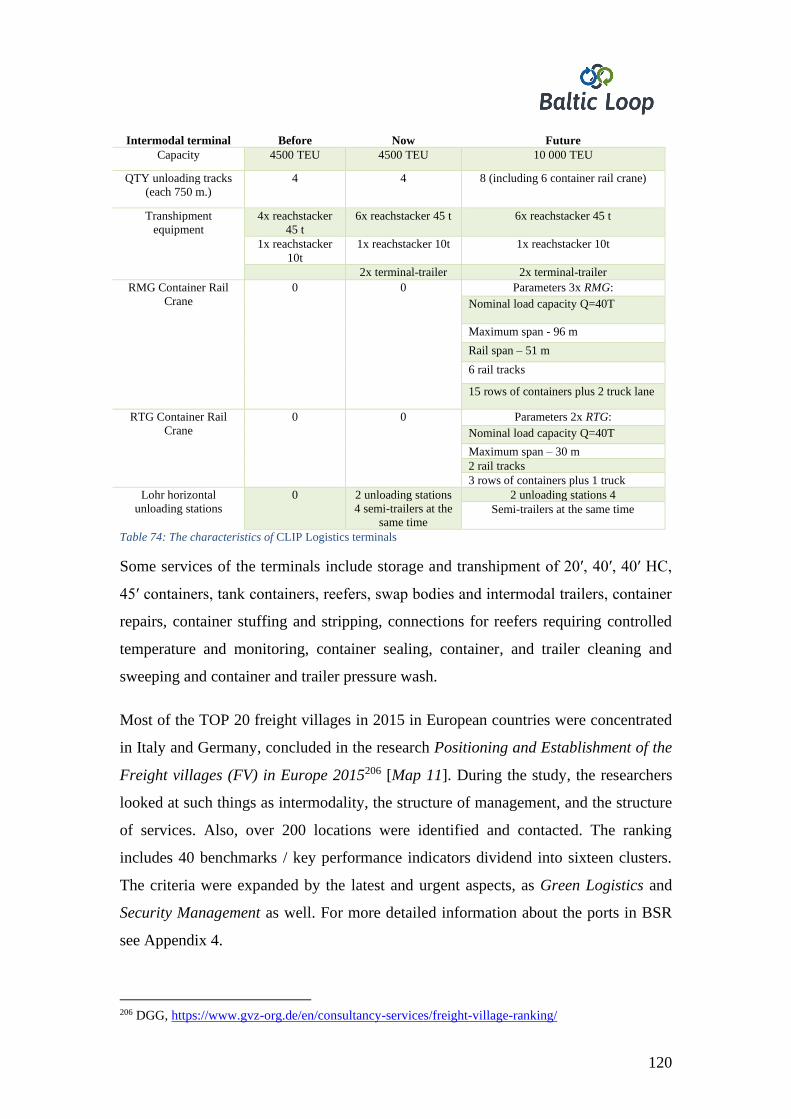
120
Intermodal terminal Before Now Future
Capacity 4500 TEU 4500 TEU 10 000 TEU
QTY unloading tracks
(each 750 m.)
4 4 8 (including 6 container rail crane)
Transhipment
equipment
4x reachstacker
45 t
6x reachstacker 45 t 6x reachstacker 45 t
1x reachstacker
10t
1x reachstacker 10t 1x reachstacker 10t
2x terminal-trailer 2x terminal-trailer
RMG Container Rail
Crane
0 0 Parameters 3x RMG:
Nominal load capacity Q=40T
Maximum span - 96 m
Rail span – 51 m
6 rail tracks
15 rows of containers plus 2 truck lane
RTG Container Rail
Crane
0 0 Parameters 2x RTG:
Nominal load capacity Q=40T
Maximum span – 30 m
2 rail tracks
3 rows of containers plus 1 truck
Lohr horizontal
unloading stations
0 2 unloading stations
4 semi-trailers at the
same time
2 unloading stations 4
Semi-trailers at the same time
Table 74: The characteristics of CLIP Logistics terminals
Some services of the terminals include storage and transhipment of 20′, 40′, 40′ HC,
45′ containers, tank containers, reefers, swap bodies and intermodal trailers, container
repairs, container stuffing and stripping, connections for reefers requiring controlled
temperature and monitoring, container sealing, container, and trailer cleaning and
sweeping and container and trailer pressure wash.
Most of the TOP 20 freight villages in 2015 in European countries were concentrated
in Italy and Germany, concluded in the research Positioning and Establishment of the
Freight villages (FV) in Europe 2015206 [Map 11]. During the study, the researchers
looked at such things as intermodality, the structure of management, and the structure
of services. Also, over 200 locations were identified and contacted. The ranking
includes 40 benchmarks / key performance indicators dividend into sixteen clusters.
The criteria were expanded by the latest and urgent aspects, as Green Logistics and
Security Management as well. For more detailed information about the ports in BSR
see Appendix 4.
206 DGG, https://www.gvz-org.de/en/consultancy-services/freight-village-ranking/
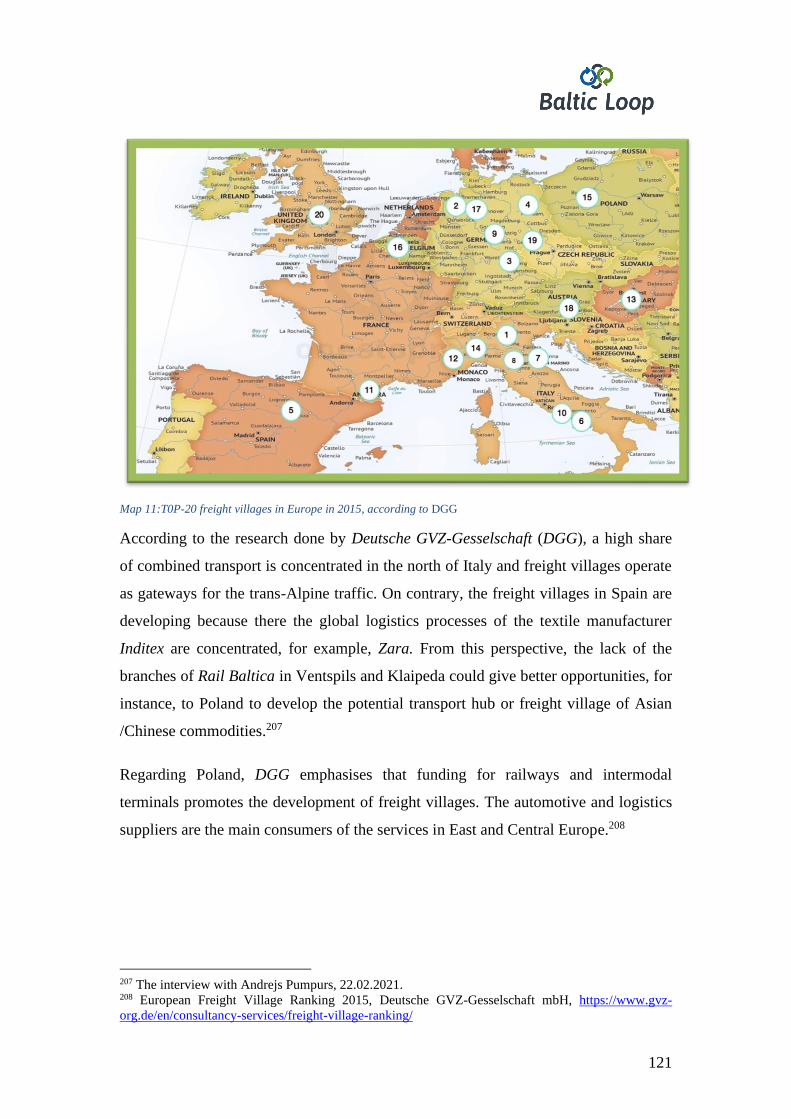
121
Map 11:T0P-20 freight villages in Europe in 2015, according to DGG
According to the research done by Deutsche GVZ-Gesselschaft (DGG), a high share
of combined transport is concentrated in the north of Italy and freight villages operate
as gateways for the trans-Alpine traffic. On contrary, the freight villages in Spain are
developing because there the global logistics processes of the textile manufacturer
Inditex are concentrated, for example, Zara. From this perspective, the lack of the
branches of Rail Baltica in Ventspils and Klaipeda could give better opportunities, for
instance, to Poland to develop the potential transport hub or freight village of Asian
/Chinese commodities.207
Regarding Poland, DGG emphasises that funding for railways and intermodal
terminals promotes the development of freight villages. The automotive and logistics
suppliers are the main consumers of the services in East and Central Europe.208
207 The interview with Andrejs Pumpurs, 22.02.2021. 208 European Freight Village Ranking 2015, Deutsche GVZ-Gesselschaft mbH, https://www.gvz-
org.de/en/consultancy-services/freight-village-ranking/
122
Overall all or, at least, many freight villages include such features as:
- Location at the crosspoint of major motorways connecting different European
regions or providing connections to non-European regions. This point is the
most important because it provides convenient and easy access that is crucially
important for all the interested parties;
- Different types or offer of transport modes, including, rail traffic, road traffic,
and services of the port;
- An opportunity to equip the factories and workshops;
- An opportunity to use the services of warehouses;
- An opportunity to park the transport (trucks, cars) for a long time;
- Continuous technological development and implementation.
Analysing the equipment of the transport hubs around the BSR and ports, one can
notice that there are many peculiarities. The ports around the BSR have most of these
qualities: different types of transport modes, warehouses, workshops or factories, and
continuous technological development. However, it is not clear do ports offer, for
instance, the opportunity to park transport vehicles for a long time. Besides, the BSR
ports usually are not on major roads of global or even regional importance. But it does
not mean that the Freeport of Ventspils does not have the chance or means to develop
a freight village. Overall, there are chances to make a freight village in Latvia and
Ventspils, however, probably, one must consider how to implement some know-how
in the daily work of the freight village that could be as a motivator for the companies
to relocate.209
7.2. The description of the Freeport of Ventspils for the companies willing to
expand or relocate
The total area of the Freeport of the Ventspils is 2451,39 ha, the port water area is
242,60 ha, and free industrial territories – 700 ha. Also, the maximum depth is 17,5 m
and the maximum length of vessels that can enter the port – liquid cargo, bulk cargo –
209 The interview with Oskars Osis, 19.02.2021.
123
275 m, and maximum length for general cargo, ro-ro, and container vessels –
240 m.210
Currently, there are various infrastructure and different kinds of companies that work
in different sectors in Ventspils and in the territory of the Freeport of Ventspils. As
several of the advantages why investors and companies searching for a place to
develop their business the Freeport stresses the following features: 1) convenient
import/export hub between the EU, CIS, and Central Asian markets; 2) customised
territories for all kinds of industrial production; 3) labour supply, high potential of
intellectual capital; 4) favourable business start-up attractive tax environment, the
special economic zone status; 5) ambitious business incubation system; 6) supportive
local government that is open for cooperation in every development stage of the
company; 7) comfortable and tidy urban environment.211
Overall, there are seven industrial areas in Ventspils and since 2005, the Freeport of
Ventspils has built production facilities in the area exceeding 40 000m². Moreover,
this area is home to tens of local and foreign companies, which have already created
more than 1700 new jobs. In addition to those seven industrial zones, there are also
the facilities operated by Ventspils High Technology Park, Fish&Food Processing
Area, Large Scale Industrial Sites, Riverside Industrial Area North, Riverside
Industrial Area South, Marina Industrial Area, and Ventspils Airport Industrial
Area.212
The total area of Ventspils High Technology Park (VHTP) is 40 ha, and vacant space
– 27 ha. There are available plots of land equipped with utilities, opportunities to
design and construct industrial buildings, access roads and parking lots, etc. The
companies working in the premises of VHTP, among others, include manufacturers of
electronic systems and components HansaMatrixVentspils, IT company Accenture,
manufacturer of flexible packing IMMER Digital, manufacturer of new generation
heating and cooling systems Wasserkabel Baltic, liquid crystal display factory
210 The Freeport of Ventspils, Port in General, https://www.portofventspils.lv/en/port-in-general/ 211 The Freeport of Ventspils, Invest in Ventspils, https://www.portofventspils.lv/en/invest-in-ventspils 212 The Freeport of Ventspils, Industrial sites and premises, https://www.portofventspils.lv/en/invest-in-
ventspils/industrial-sites-and-premises/
124
EUROLCDs, and other companies.213 VHTP also offers a lot of other services like
business consulting, property for rent, Digital Innovation Hub, etc.214
Similar work is taking place in other industrial areas where one can find companies
working on utility truck manufacturing, metal processing, modular construction,
wood-processing, fish industry, chocolate industry, etc. Therefore the city of
Ventspils and the Freeport of Ventspils have long-term experience in working with
investors both from Latvia and other countries in different kinds of fields.215
Also, it is important to note that the city and the Freeport are characterised by
different kinds of utilities (electric power, ICT infrastructure, gas supply, etc.)216, tax
incentives217, support programs for the investors218, etc. The municipality of Ventspils
also is realising its own investment projects.219
The freeport has approved different kinds of fees, including tonnage fee, canal fee,
cargo fee, pilot fee, small ship fee, sanitary fee, and others. Also, according to the
laws and regulations, the Freeport of Ventspils maintains the infrastructure, buildings,
cooperates with the municipality of Ventspils on questions about the infrastructure.220
Moreover, the Freeport of Ventspils can receive the biggest vessels that have the right
to enter the Baltic Sea.221
213 The Freeport of Ventspils, Ventspils High Technology Park,
https://www.portofventspils.lv/en/invest-in-ventspils/industrial-sites-and-premises/ 214 The Freeport of Ventspils, https://www.vatp.lv/en/home 215 The Freeport of Ventspils, Industrial sites and premises, https://www.portofventspils.lv/en/invest-in-
ventspils/industrial-sites-and-premises/ 216 The Freeport of Ventspils, Utilities, https://www.portofventspils.lv/en/invest-in-ventspils/utilities/ 217The Freeport of Ventspils, Tax incentives, https://www.portofventspils.lv/en/invest-in-ventspils/tax-
incentives/ 218 The Freeport of Ventspils, Support for Investors, https://www.portofventspils.lv/en/invest-in-
ventspils/support-for-investors/ 219 The city of Ventspils, Investment projects,
https://www.ventspils.lv/lat/investicijas_un_projekti/investiciju_projekti/ 220 „Elektronikas centra ražošanas ēkas būvniecība Ventspilī Eiropas Reģionālās attīstības fonda
darbības programmas „Uzņēmējdarbība un inovācijas” papildinājuma 2.3.2.2.2. apakšaktivitātes
„Atbalsts ieguldījumiem ražošanas telpu izveidei vai rekonstrukcijai” ietvaros”, Ventspils Brīvostas
pārvalde, 2013. pp. 7.-8. 221 ibid p.10.
125
Since [1997] the Freeport of Ventspils works as a special economical zone (SEZ)
where a number of enterprises are working and, depending on the status of the
company, may receive tax credits in certain cases.222
Today the Freeport of Ventspils, as an SEZ, offers particular conditions for foreign
investors. The Freeport provides considerable tax incentives that promote export and
industrial activities. Consequently, the Corporate Income Tax (CIT) and Real Estate
Tax (RET) is reduced by 80% until the company compensates up to 35% (55% for
small companies and 45% for medium-size companies) of the investments. It means
that during the compensation time the CIT rate is 4% and the RET rate is 0.3%. If, in
turn, dividends are distributed to a company in SEZ, the profit tax is 4% instead of the
usual 20%. Reliefs are also available on indirect taxes: Value Added Tax, excise, and
customs duties. The Freeport of Ventspils offers companies to receive a license to
operate until at least 2035.223
Regarding the ways how to attract Belarusian companies, several aspects must be
pointed out. First of all, this is the “speed of immigration”. In other words, how fast is
it possible to complete all the documents regarding the migration of Belarusian
specialists and their families. The second – marketing, and in particular, digital
marketing. For a long time, Latvian institutions have distributed various types of
information on social networks that Latvia is home to a number of different
Belarusian companies, popularising the idea that Latvia and Belarus have strong and
long-lasting ties. In addition, Latvia ensures a stable infrastructure and eco-system.224
In order to better understand the potential of the transit corridor Belarus-Latvia-
Sweden, the current study compiled a SWOT analysis about the Freeport of Ventspils
[Table 75].
222 „Elektronikas centra ražošanas ēkas būvniecība Ventspilī Eiropas Reģionālās attīstības fonda
darbības programmas „Uzņēmējdarbība un inovācijas” papildinājuma 2.3.2.2.2. apakšaktivitātes
„Atbalsts ieguldījumiem ražošanas telpu izveidei vai rekonstrukcijai” ietvaros”, Ventspils Brīvostas
pārvalde, 2013. p.9. 223 Tax Incentives, The Freeport of Ventspils https://www.portofventspils.lv/en/invest-in-ventspils/tax-
incentives 224 Ibid, p.10.
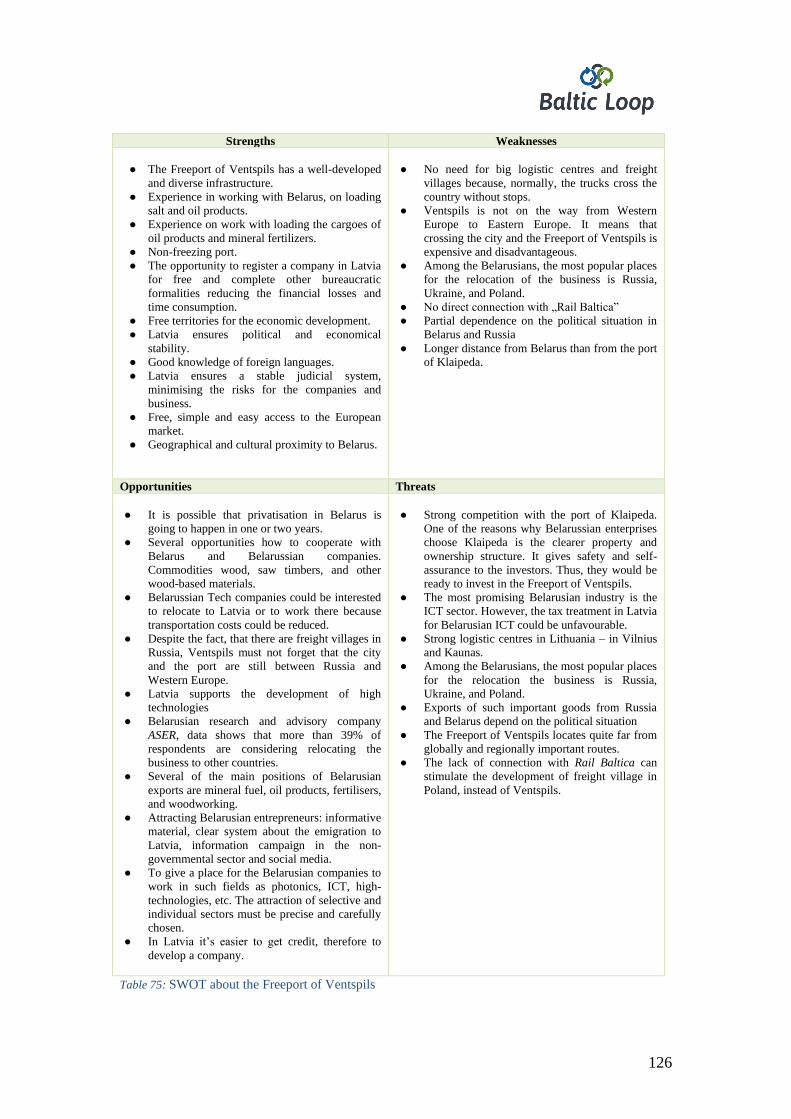
126
Strengths Weaknesses
● The Freeport of Ventspils has a well-developed
and diverse infrastructure.
● Experience in working with Belarus, on loading
salt and oil products.
● Experience on work with loading the cargoes of
oil products and mineral fertilizers.
● Non-freezing port.
● The opportunity to register a company in Latvia
for free and complete other bureaucratic
formalities reducing the financial losses and
time consumption.
● Free territories for the economic development.
● Latvia ensures political and economical
stability.
● Good knowledge of foreign languages.
● Latvia ensures a stable judicial system,
minimising the risks for the companies and
business.
● Free, simple and easy access to the European
market.
● Geographical and cultural proximity to Belarus.
● No need for big logistic centres and freight
villages because, normally, the trucks cross the
country without stops.
● Ventspils is not on the way from Western
Europe to Eastern Europe. It means that
crossing the city and the Freeport of Ventspils is
expensive and disadvantageous.
● Among the Belarusians, the most popular places
for the relocation of the business is Russia,
Ukraine, and Poland.
● No direct connection with „Rail Baltica”
● Partial dependence on the political situation in
Belarus and Russia
● Longer distance from Belarus than from the port
of Klaipeda.
Opportunities Threats
● It is possible that privatisation in Belarus is
going to happen in one or two years.
● Several opportunities how to cooperate with
Belarus and Belarussian companies.
Commodities wood, saw timbers, and other
wood-based materials.
● Belarussian Tech companies could be interested
to relocate to Latvia or to work there because
transportation costs could be reduced.
● Despite the fact, that there are freight villages in
Russia, Ventspils must not forget that the city
and the port are still between Russia and
Western Europe.
● Latvia supports the development of high
technologies
● Belarusian research and advisory company
ASER, data shows that more than 39% of
respondents are considering relocating the
business to other countries.
● Several of the main positions of Belarusian
exports are mineral fuel, oil products, fertilisers,
and woodworking.
● Attracting Belarusian entrepreneurs: informative
material, clear system about the emigration to
Latvia, information campaign in the non-
governmental sector and social media.
● To give a place for the Belarusian companies to
work in such fields as photonics, ICT, high-
technologies, etc. The attraction of selective and
individual sectors must be precise and carefully
chosen.
● In Latvia it’s easier to get credit, therefore to
develop a company.
● Strong competition with the port of Klaipeda.
One of the reasons why Belarussian enterprises
choose Klaipeda is the clearer property and
ownership structure. It gives safety and self-
assurance to the investors. Thus, they would be
ready to invest in the Freeport of Ventspils.
● The most promising Belarusian industry is the
ICT sector. However, the tax treatment in Latvia
for Belarusian ICT could be unfavourable.
● Strong logistic centres in Lithuania – in Vilnius
and Kaunas.
● Among the Belarusians, the most popular places
for the relocation the business is Russia,
Ukraine, and Poland.
● Exports of such important goods from Russia
and Belarus depend on the political situation
● The Freeport of Ventspils locates quite far from
globally and regionally important routes.
● The lack of connection with Rail Baltica can
stimulate the development of freight village in
Poland, instead of Ventspils.
Table 75: SWOT about the Freeport of Ventspils
127
The SWOT analysis allows to pay particular attention to potential opportunities and
threats in the future. The wider examination of these circumstances can help the
Freeport of Ventspils to attract more companies to move to its territory.
Opportunities
• It is possible that privatisation in Belarus is going to happen in one or two years.
Therefore, many large state-owned companies could be privatised and become private
or semi-private companies225. Until then the attraction of Belarusian state companies
is a utopia, since these enterprises have a social role, as well.226 Thus, they would be
more interested to work out of Belarus or to establish their branches in Latvia. The
city of Ventspils must be ready to attract these companies in the Freeport of Ventspils.
• However, there are several opportunities how to cooperate with Belarus and
Belarusian companies at this very moment as well. Looking at current top-export
commodities from Belarus to Latvia and Sweden, one can notice wood, saw timbers,
and other wood-based materials. By attracting the companies exporting these
commodities, the Freeport of Ventspils can develop the potential freight-village in
Ventspils.227 The Belarusian companies could open their branches or factories in
Ventspils producing, processing, and adapting materials to EU requirements.
Belarusian companies would also be interested in moving to Latvia or opening their
branches, thus avoiding Latvian intermediaries working between Belarus and timber
recipients in Western Europe or Scandinavia.
• Also, the Freeport of Ventspils can attract high-tech companies from Belarus.228 For
instance, companies in the electronics sector can relocate their production facilities to
Ventspils. Of course, this means to relocate the company to Latvia also legally, by
corresponding to the criteria of the EU. Ventspils can offer Belarusian electronics
enterprises also to open their branches in the facilities located or adjacent to the port.
Belarusian companies could be interested to relocate to Latvia or working there
because transportation costs of imported products from Belarus to the points of
225 Interview with Andris Spulis, 15.01.2021. 226 Interview with Toms Sturitis, 10.02.2021. 227 Interview with Andris Spulis, 15.01.2021. 228.Ibid
128
destination could be reduced. In addition, the product would already have been
produced in the EU adhering to corresponding standards.
• Adapting the electronic bill of lading system and EFTI regulation in general would
present Ventspils as a highly innovative port city and help reduce the bureaucratical
bottlenecks for the companies using the transport corridor.
• Since Latvia supports the development of high technologies, there is a favourable
environment for Belarusian technology companies and start-ups.
• According to the data provided by Belarusian research and advisory company ASER,
more than 39% of respondents noted that they are considering to relocate the business
to other countries.
• Several of the main positions of Belarusian exports are mineral fuel, oil products,
fertilisers, and woodworking – all these commodities can be either unloaded in the
Freeport, or loaded and developed according to EU standards in the Freeport of
Ventspils, including in the potential freight village.
• Several ways how to attract Belarusian entrepreneurs: informative materials about
doing business in Latvia, clear system about the emigration to Latvia, information
campaign in the non-governmental sector, and social media.
Threats
• The biggest threat is the strong competition by the port of Klaipeda. One of the
reasons why Belarusian enterprises choose Klaipeda is the clearer property and
ownership structure. It gives safety and self-assurance to the investors. Having
established similar guidelines and structures in Latvia, Belarusian companies would
be ready to invest in the Freeport of Ventspils.229
• The most promising Belarusian industry is the ICT sector. Nevertheless, Latvia and
the Freeport of Ventspils can face difficulties to attract companies working in ICT,
229 Interview with Maris Katranzi and Andris Spulis, 15.01.2021.
129
because of the tax treatment in Latvia and the competition created by Lithuania,
Poland, and Ukraine.
• More and more Russian commodities are diverted to Russian ports. The same
tendency can also be observed regarding Belarusian commodities. The decisions on
collaborating with Baltic ports could be based on political guidelines.
• Strong and developed logistics centres are already working in Vilnius and Kaunas
connecting Western and Central Europe on the one hand and Eastern Europe and
Russia, on the other hand.
7.3. The commodities with the highest development potential for manufacture in
Ventspils
In order to understand the industries that could relocate to Latvia, a rating assessment
of the industries was prepared within the current study. This rating was based on the
analysis of the market potential for the relocation of Belarusian companies, the
analysis of the export structure of Belarusian enterprises, and the developed portrait of
the target audience for business migration.
Also, the study found out which Belarusian companies were more interested in
relocation to Latvia through individual consultations. Finally, the study team got the
full list of Belarusian IT companies and offered to start the conversations about the
potential relocation. For attracting the Belarusians, the city of Ventspils must work
together with the Investment and development agency of Latvia (IDAL). Since the
agency already has successful experience in attracting Belarusian companies, this
would be promising if the two organisations work together. The current experience of
IDAL shows that companies from such sectors as photonics, smart materials, IT,
biotechnologies, and engineering would be ready to consider relocating to Latvia.230
IDAL could give its information, experience, advice, and contacts of Belarusian
companies to the Freeport of Ventspils if it is necessary. Thus, the Freeport of
230 Interview with Toms Sturitis, 10.02.2021.
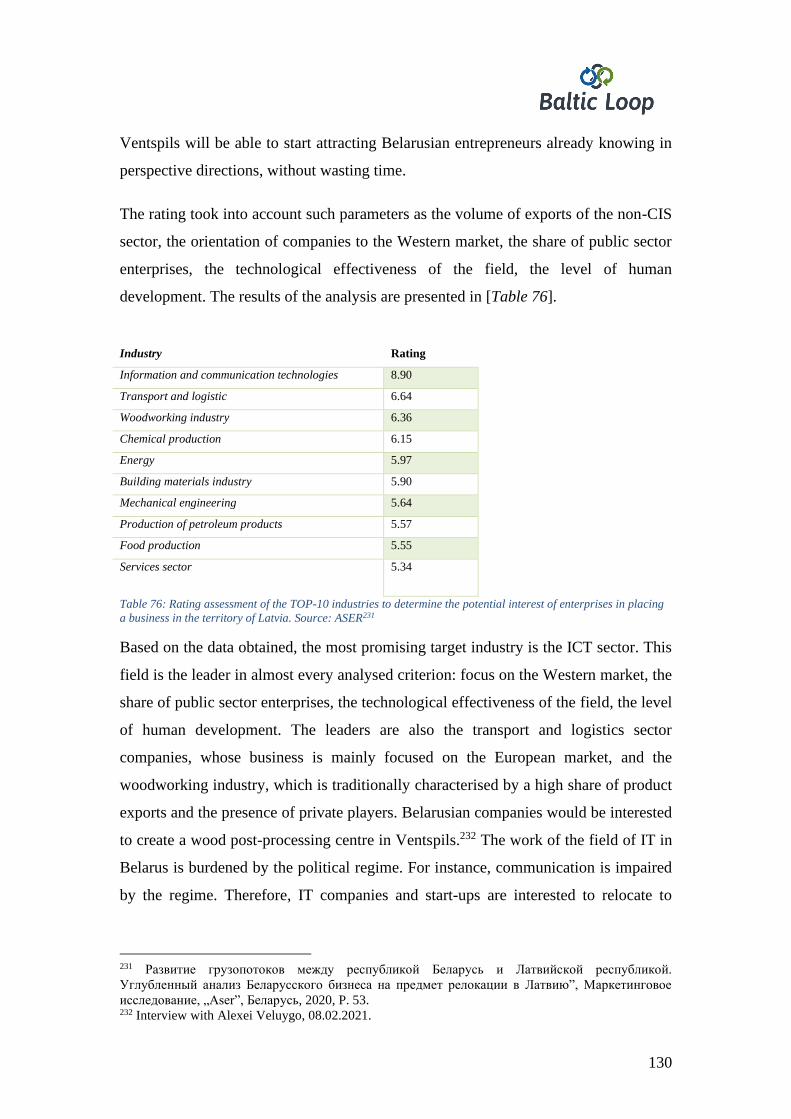
130
Ventspils will be able to start attracting Belarusian entrepreneurs already knowing in
perspective directions, without wasting time.
The rating took into account such parameters as the volume of exports of the non-CIS
sector, the orientation of companies to the Western market, the share of public sector
enterprises, the technological effectiveness of the field, the level of human
development. The results of the analysis are presented in [Table 76].
Industry Rating
Information and communication technologies 8.90
Transport and logistic 6.64
Woodworking industry 6.36
Chemical production 6.15
Energy 5.97
Building materials industry 5.90
Mechanical engineering 5.64
Production of petroleum products 5.57
Food production 5.55
Services sector 5.34
Table 76: Rating assessment of the TOP-10 industries to determine the potential interest of enterprises in placing
a business in the territory of Latvia. Source: ASER231
Based on the data obtained, the most promising target industry is the ICT sector. This
field is the leader in almost every analysed criterion: focus on the Western market, the
share of public sector enterprises, the technological effectiveness of the field, the level
of human development. The leaders are also the transport and logistics sector
companies, whose business is mainly focused on the European market, and the
woodworking industry, which is traditionally characterised by a high share of product
exports and the presence of private players. Belarusian companies would be interested
to create a wood post-processing centre in Ventspils.232 The work of the field of IT in
Belarus is burdened by the political regime. For instance, communication is impaired
by the regime. Therefore, IT companies and start-ups are interested to relocate to
231 Развитие грузопотоков между республикой Беларусь и Латвийской республикой.
Углубленный анализ Беларусского бизнеса на предмет релокации в Латвию”, Маркетинговое
исследование, „Aser”, Беларусь, 2020, P. 53. 232 Interview with Alexei Veluygo, 08.02.2021.
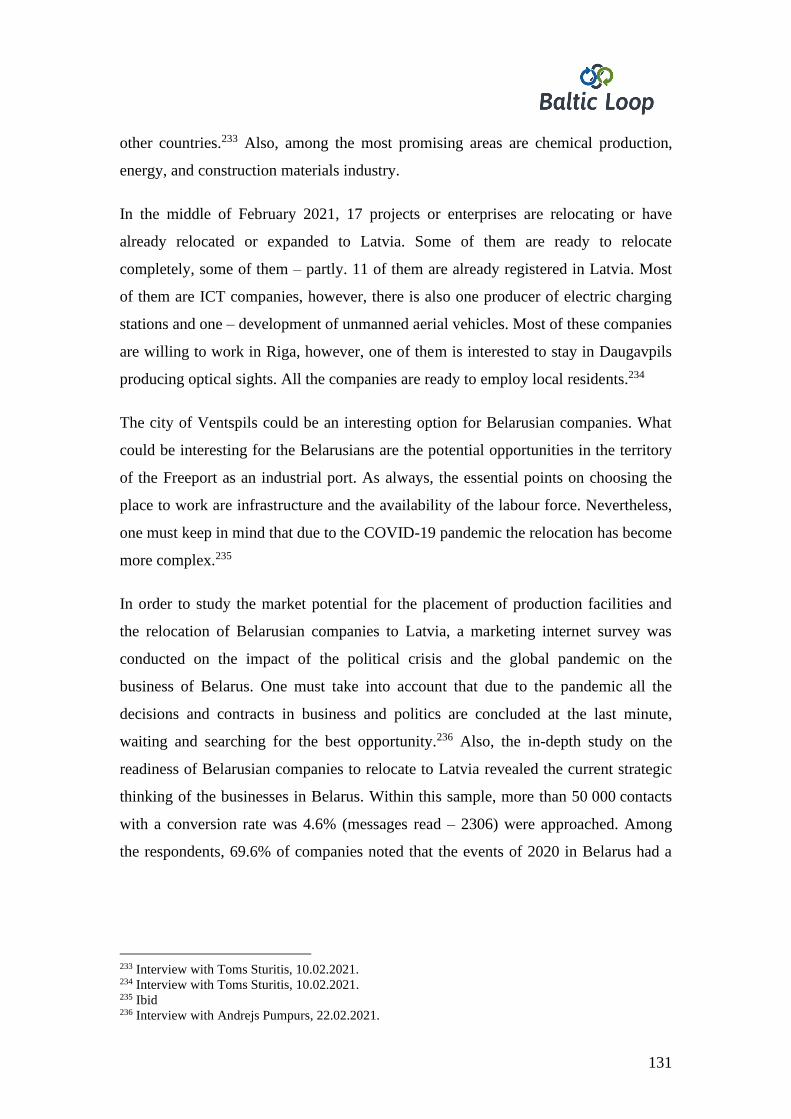
131
other countries.233 Also, among the most promising areas are chemical production,
energy, and construction materials industry.
In the middle of February 2021, 17 projects or enterprises are relocating or have
already relocated or expanded to Latvia. Some of them are ready to relocate
completely, some of them – partly. 11 of them are already registered in Latvia. Most
of them are ICT companies, however, there is also one producer of electric charging
stations and one – development of unmanned aerial vehicles. Most of these companies
are willing to work in Riga, however, one of them is interested to stay in Daugavpils
producing optical sights. All the companies are ready to employ local residents.234
The city of Ventspils could be an interesting option for Belarusian companies. What
could be interesting for the Belarusians are the potential opportunities in the territory
of the Freeport as an industrial port. As always, the essential points on choosing the
place to work are infrastructure and the availability of the labour force. Nevertheless,
one must keep in mind that due to the COVID-19 pandemic the relocation has become
more complex.235
In order to study the market potential for the placement of production facilities and
the relocation of Belarusian companies to Latvia, a marketing internet survey was
conducted on the impact of the political crisis and the global pandemic on the
business of Belarus. One must take into account that due to the pandemic all the
decisions and contracts in business and politics are concluded at the last minute,
waiting and searching for the best opportunity.236 Also, the in-depth study on the
readiness of Belarusian companies to relocate to Latvia revealed the current strategic
thinking of the businesses in Belarus. Within this sample, more than 50 000 contacts
with a conversion rate was 4.6% (messages read – 2306) were approached. Among
the respondents, 69.6% of companies noted that the events of 2020 in Belarus had a
233 Interview with Toms Sturitis, 10.02.2021. 234 Interview with Toms Sturitis, 10.02.2021. 235 Ibid 236 Interview with Andrejs Pumpurs, 22.02.2021.
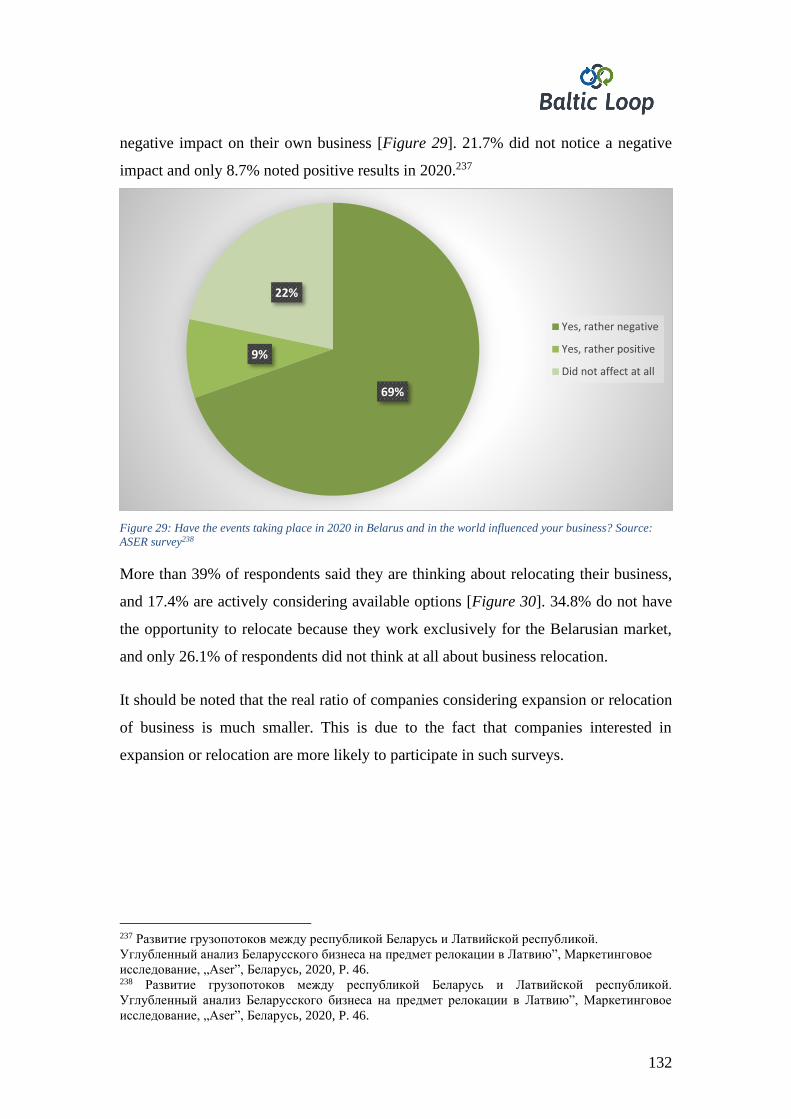
132
negative impact on their own business [Figure 29]. 21.7% did not notice a negative
impact and only 8.7% noted positive results in 2020.237
Figure 29: Have the events taking place in 2020 in Belarus and in the world influenced your business? Source:
ASER survey238
More than 39% of respondents said they are thinking about relocating their business,
and 17.4% are actively considering available options [Figure 30]. 34.8% do not have
the opportunity to relocate because they work exclusively for the Belarusian market,
and only 26.1% of respondents did not think at all about business relocation.
It should be noted that the real ratio of companies considering expansion or relocation
of business is much smaller. This is due to the fact that companies interested in
expansion or relocation are more likely to participate in such surveys.
237 Развитие грузопотоков между республикой Беларусь и Латвийской республикой.
Углубленный анализ Беларусского бизнеса на предмет релокации в Латвию”, Маркетинговое
исследование, „Aser”, Беларусь, 2020, P. 46. 238 Развитие грузопотоков между республикой Беларусь и Латвийской республикой.
Углубленный анализ Беларусского бизнеса на предмет релокации в Латвию”, Маркетинговое
исследование, „Aser”, Беларусь, 2020, P. 46.
69%
9%
22%
Yes, rather negative
Yes, rather positive
Did not affect at all
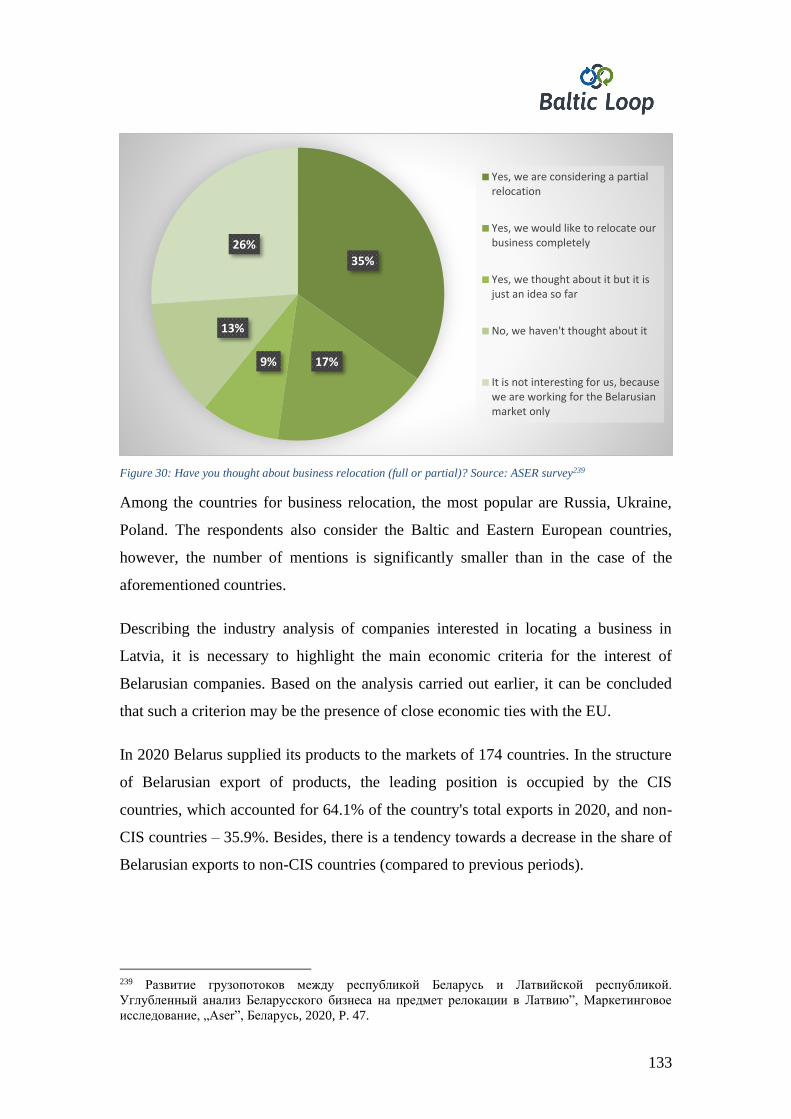
133
Figure 30: Have you thought about business relocation (full or partial)? Source: ASER survey239
Among the countries for business relocation, the most popular are Russia, Ukraine,
Poland. The respondents also consider the Baltic and Eastern European countries,
however, the number of mentions is significantly smaller than in the case of the
aforementioned countries.
Describing the industry analysis of companies interested in locating a business in
Latvia, it is necessary to highlight the main economic criteria for the interest of
Belarusian companies. Based on the analysis carried out earlier, it can be concluded
that such a criterion may be the presence of close economic ties with the EU.
In 2020 Belarus supplied its products to the markets of 174 countries. In the structure
of Belarusian export of products, the leading position is occupied by the CIS
countries, which accounted for 64.1% of the country's total exports in 2020, and non-
CIS countries – 35.9%. Besides, there is a tendency towards a decrease in the share of
Belarusian exports to non-CIS countries (compared to previous periods).
239 Развитие грузопотоков между республикой Беларусь и Латвийской республикой.
Углубленный анализ Беларусского бизнеса на предмет релокации в Латвию”, Маркетинговое
исследование, „Aser”, Беларусь, 2020, P. 47.
35%
17%9%
13%
26%
Yes, we are considering a partialrelocation
Yes, we would like to relocate ourbusiness completely
Yes, we thought about it but it isjust an idea so far
No, we haven't thought about it
It is not interesting for us, becausewe are working for the Belarusianmarket only
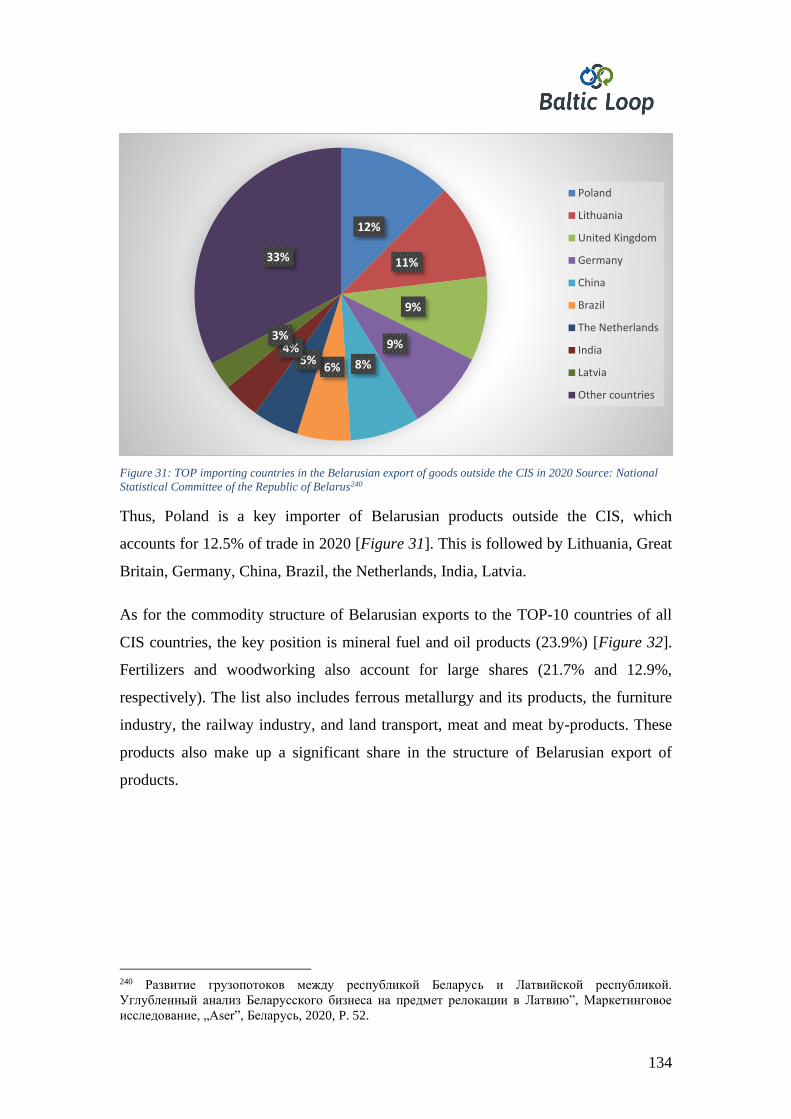
134
Figure 31: TOP importing countries in the Belarusian export of goods outside the CIS in 2020 Source: National
Statistical Committee of the Republic of Belarus240
Thus, Poland is a key importer of Belarusian products outside the CIS, which
accounts for 12.5% of trade in 2020 [Figure 31]. This is followed by Lithuania, Great
Britain, Germany, China, Brazil, the Netherlands, India, Latvia.
As for the commodity structure of Belarusian exports to the TOP-10 countries of all
CIS countries, the key position is mineral fuel and oil products (23.9%) [Figure 32].
Fertilizers and woodworking also account for large shares (21.7% and 12.9%,
respectively). The list also includes ferrous metallurgy and its products, the furniture
industry, the railway industry, and land transport, meat and meat by-products. These
products also make up a significant share in the structure of Belarusian export of
products.
240 Развитие грузопотоков между республикой Беларусь и Латвийской республикой.
Углубленный анализ Беларусского бизнеса на предмет релокации в Латвию”, Маркетинговое
исследование, „Aser”, Беларусь, 2020, P. 52.
12%
11%
9%
9%
8%6%5%
4%3%
33%
Poland
Lithuania
United Kingdom
Germany
China
Brazil
The Netherlands
India
Latvia
Other countries
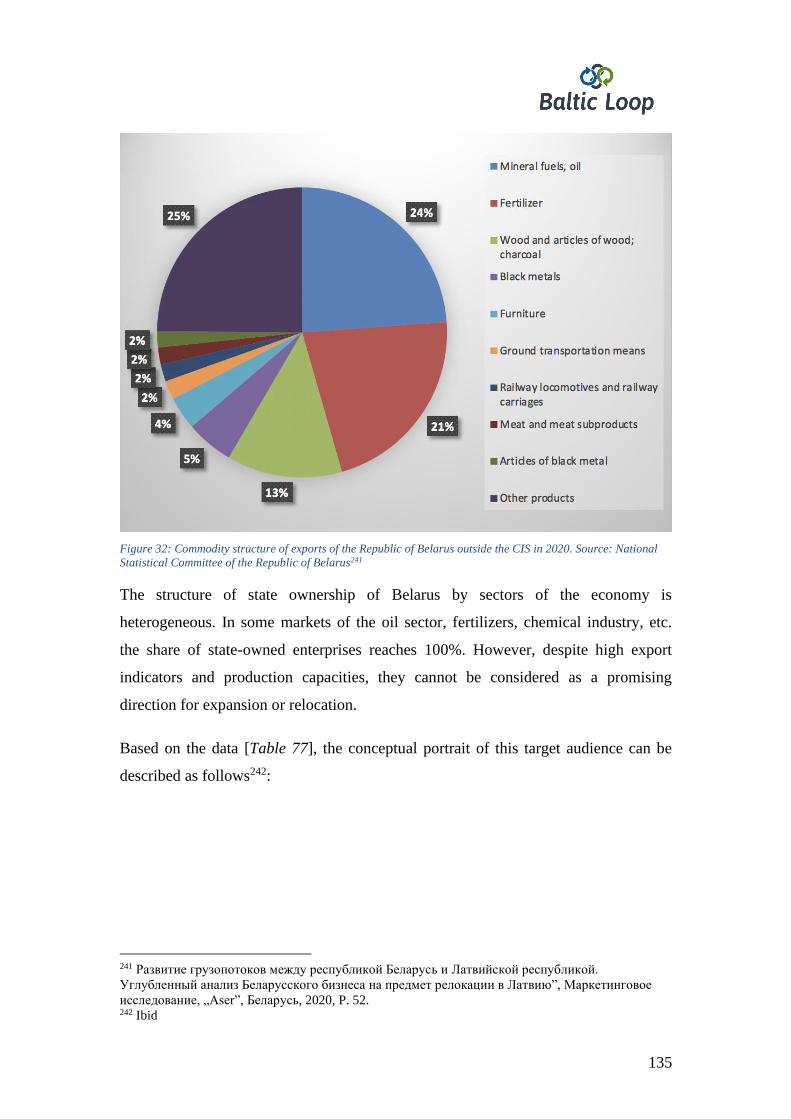
135
Figure 32: Commodity structure of exports of the Republic of Belarus outside the CIS in 2020. Source: National
Statistical Committee of the Republic of Belarus241
The structure of state ownership of Belarus by sectors of the economy is
heterogeneous. In some markets of the oil sector, fertilizers, chemical industry, etc.
the share of state-owned enterprises reaches 100%. However, despite high export
indicators and production capacities, they cannot be considered as a promising
direction for expansion or relocation.
Based on the data [Table 77], the conceptual portrait of this target audience can be
described as follows242:
241 Развитие грузопотоков между республикой Беларусь и Латвийской республикой.
Углубленный анализ Беларусского бизнеса на предмет релокации в Латвию”, Маркетинговое
исследование, „Aser”, Беларусь, 2020, P. 52. 242 Ibid
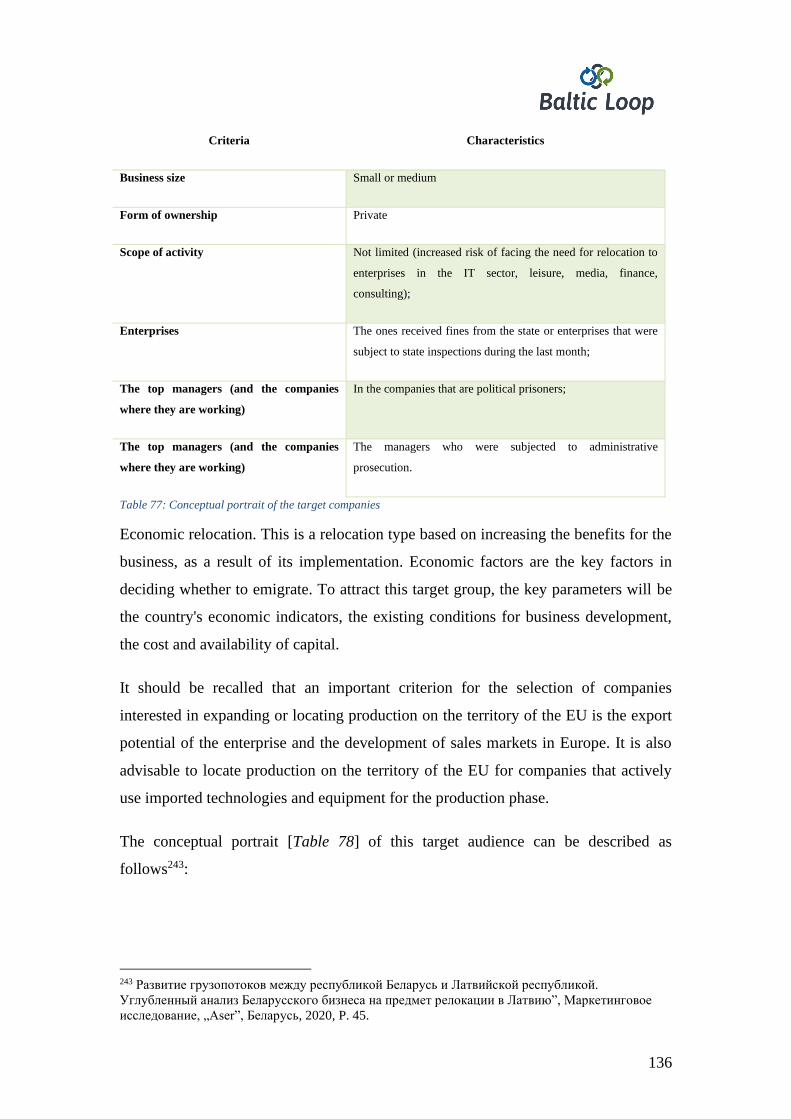
136
Criteria Characteristics
Business size Small or medium
Form of ownership Private
Scope of activity Not limited (increased risk of facing the need for relocation to
enterprises in the IT sector, leisure, media, finance,
consulting);
Enterprises The ones received fines from the state or enterprises that were
subject to state inspections during the last month;
The top managers (and the companies
where they are working)
In the companies that are political prisoners;
The top managers (and the companies
where they are working)
The managers who were subjected to administrative
prosecution.
Table 77: Conceptual portrait of the target companies
Economic relocation. This is a relocation type based on increasing the benefits for the
business, as a result of its implementation. Economic factors are the key factors in
deciding whether to emigrate. To attract this target group, the key parameters will be
the country's economic indicators, the existing conditions for business development,
the cost and availability of capital.
It should be recalled that an important criterion for the selection of companies
interested in expanding or locating production on the territory of the EU is the export
potential of the enterprise and the development of sales markets in Europe. It is also
advisable to locate production on the territory of the EU for companies that actively
use imported technologies and equipment for the production phase.
The conceptual portrait [Table 78] of this target audience can be described as
follows243:
243 Развитие грузопотоков между республикой Беларусь и Латвийской республикой.
Углубленный анализ Беларусского бизнеса на предмет релокации в Латвию”, Маркетинговое
исследование, „Aser”, Беларусь, 2020, P. 45.
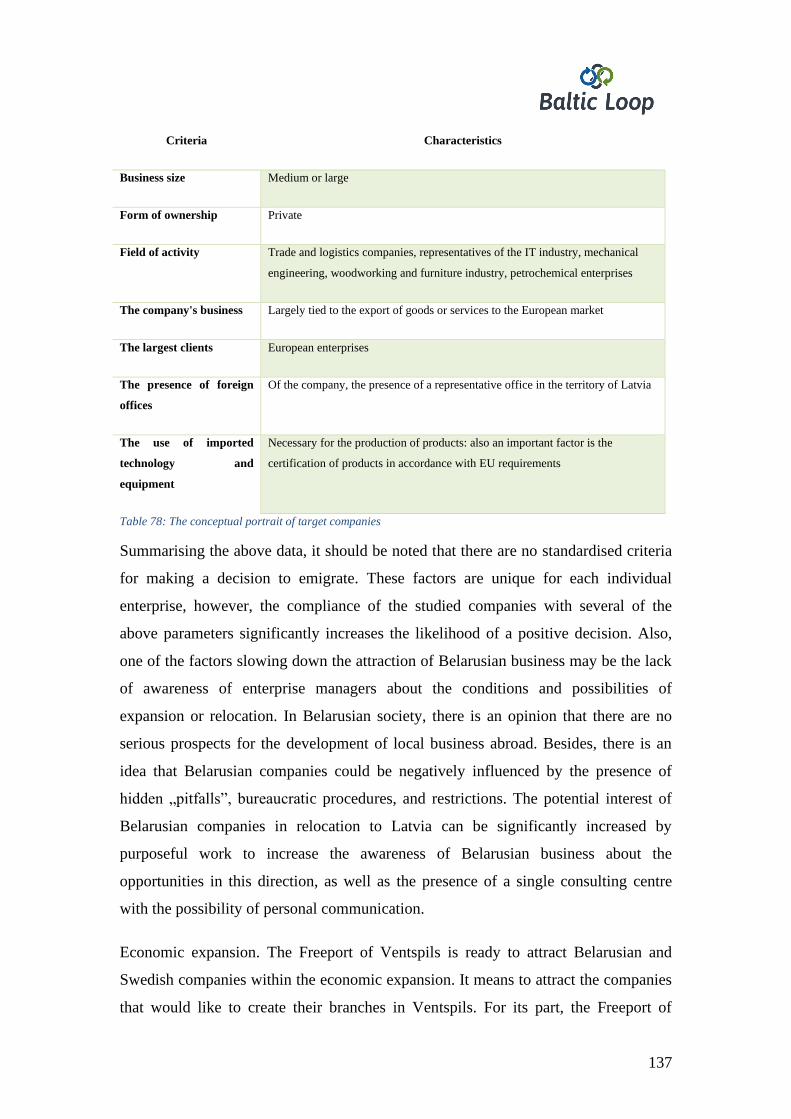
137
Criteria Characteristics
Business size Medium or large
Form of ownership Private
Field of activity Trade and logistics companies, representatives of the IT industry, mechanical
engineering, woodworking and furniture industry, petrochemical enterprises
The company's business Largely tied to the export of goods or services to the European market
The largest clients European enterprises
The presence of foreign
offices
Of the company, the presence of a representative office in the territory of Latvia
The use of imported
technology and
equipment
Necessary for the production of products: also an important factor is the
certification of products in accordance with EU requirements
Table 78: The conceptual portrait of target companies
Summarising the above data, it should be noted that there are no standardised criteria
for making a decision to emigrate. These factors are unique for each individual
enterprise, however, the compliance of the studied companies with several of the
above parameters significantly increases the likelihood of a positive decision. Also,
one of the factors slowing down the attraction of Belarusian business may be the lack
of awareness of enterprise managers about the conditions and possibilities of
expansion or relocation. In Belarusian society, there is an opinion that there are no
serious prospects for the development of local business abroad. Besides, there is an
idea that Belarusian companies could be negatively influenced by the presence of
hidden „pitfalls”, bureaucratic procedures, and restrictions. The potential interest of
Belarusian companies in relocation to Latvia can be significantly increased by
purposeful work to increase the awareness of Belarusian business about the
opportunities in this direction, as well as the presence of a single consulting centre
with the possibility of personal communication.
Economic expansion. The Freeport of Ventspils is ready to attract Belarusian and
Swedish companies within the economic expansion. It means to attract the companies
that would like to create their branches in Ventspils. For its part, the Freeport of
138
Ventspils is to ensure high skilled labour, experience on work on an international
level, versatile equipment, and experience on work with foreign enterprises in the
territory of the Freeport. From the viewpoint of the companies, the branch in
Ventspils could the connector not only between Scandinavia and Belarus, but also
Scandinavia, Western Europe on the one side, and Russia, CIS countries, China, and
Asia. Overall, the expansion of Belarusian or Swedish companies in the Freeport of
Ventspils is going to increase the economic activity in Ventspils.
7.4. The evaluation of companies willing to expand or relocate to the Freeport of
Ventspils
Below is a list of companies that have expressed interest and are considering the
possibility of partial relocation of their business to Latvia.
Short list of companies: - LLC Daber; - ODO Anadimtur; - LLC Energocomplekt; -
State of emergency Vitebsk lifts; - OJSC Aetsoft.
OOO Daber
Address: Vitebsk, Victory Avenue 15
Tel .: +375 (29) 780-58-23
Website: https://daber.by/
Industry: woodworking, trade
The company is based on the vast experience of investors and managers in the
construction industry. The main idea of the company's development is the design and
construction of offices, residential buildings, baths, guest and country houses on a
turnkey basis.
The main activities of the company are:
1. Development of design projects;
2. Development of modern models of furniture, buildings, and decorations;
3. Own production of metal products, natural wood, and laminated chipboard;
139
4. Trade-in products of our own and third-party production;
5. Construction of baths, houses, small architectural forms, and sheds in a modern
style.
ОДО Анадимтур
Address: Minsk, st. Rakovskaya, 34
Tel .: + 375 17 396 09 15
Mail: [email protected]
Website: http://anadimtour.by/
Industry: transport, tourism
The travel company Anadimtour was founded in 1996. All this time the company
Anadimtour has been successfully operating in the market of tourist services and
offers the population both rest and excursion tours. The campaign develops and offers
to the market such vacation destinations as Turkey, Egypt, Cyprus, Greece, Spain,
Bulgaria, Montenegro, Croatia, UAE, Thailand, Cuba, Dominican Republic,
Maldives, Indonesia, Goa, Malaysia, tours to Crimea, Ukraine, Lithuania, Latvia,
Poland, as well as an extensive excursion programme in the countries of Eastern and
Western Europe.
In addition, the company is actively involved in the development and promotion of
travel services in Belarus on the international market. For this purpose, specialists
develop excursion programs that are offered for both groups and individual tourists.
ООО Энергокомплект
Address: Vitebsk, Moskovsky prospect, 94B
Tel .: +37529 641 94 65
Website: https://vikab.by/
140
Industry: electrical
Association Energocomplekt is the largest enterprise in Belarus in this industry. The
main direction of its activity is the production and sale of cable and wire products, the
nomenclature of which today is more than 20 000 brand sizes. Today, the production
association Energocomplekt is the largest enterprise in Belarus for the production of
cables and wires and includes four production workshops with all the necessary
production infrastructure.
The enterprise employs about 600 qualified specialists and workers, of which 26% are
engineering and technical personnel. All management personnel has higher education,
workers - special technical.
ЧП Машиностроительная компания
Витебские подъемники
Address: Vitebsk, Beshenkovichskoe highway, 26/2
Tel .: +375 (212) 66-60-06
Mail: [email protected]
Website: http://agpvipo.com/
Branch: mechanical engineering
Today the machine-building plant Vitebsk elevators is the leading enterprise in
Belarus for the production of lifting and transport equipment.
The structure of the plant has its own design and technology center, equipped with the
latest, special equipment and software, allowing the implementation of design work of
any category of complexity. The main volume of products manufactured by the
company is sold to export markets, to the Russian Federation, Ukraine, Kazakhstan,
Kyrgyzstan, Uzbekistan, Tajikistan, Armenia, Georgia, Moldova. The partners are
leaders in the domestic engineering industry and leading foreign manufacturers: MAZ,
GAZ, KAMAZ, URAL, Isuzu, Hyundai.
141
In 2012, the company became the winner of the competition for innovative projects in
the nomination "The best innovative project of the Republic of Belarus". The
company's products were awarded the European Quality 2010 prize in Paris. The
enterprise won the Entrepreneur of the Year 2015 National Competition in the
Innovatively Active Business nomination. In 2017 awarded the I degree diploma of
the winner of the XIX republican competition of consumer preferences „Product of
2017” in the category „Hoisting-and-transport and special equipment”.
ОАО Aetsoft
Address: Мinsk, str. Zheleznodorzhnaya 33A/1-6
Tel.: + 375 25 500 88 99
Website: https://www.aetsoft.by/
Branch: IT
Aetsoft creates solutions to improve business efficiency and data security, reduce
dependence on intermediaries and increase customer profits.
The company provides a wide range of services, including consulting and
development of blockchain applications and solutions based on Data Science,
artificial intelligence, and machine learning with the ability to recognise and process
images. He has extensive experience in digitalising clients' businesses and
implementing the latest technologies to improve the efficiency of enterprises.
Оther Belarusian companies
As noted before, according to the publicly available information, the main
commodities exported from Sweden to Belarus are mechanisms and machinery and
electrical equipment. Belarussian exports to Sweden via Ventspils constitute wood
and wood products, metals and articles thereof. Also, the most shipped commodities
from the Freeport of Ventspils to the port of Nynäshamn are metals, building
materials, furniture, and wood timber. In the opposite direction are sent wood and
142
wood products, metals and articles thereof, fish of Norwegian origin244 and metal.
Thus, it can be assumed these fields are with the highest relocation potential to the
Freeport of Ventspils. Therefore, the companies operating in these sectors have the
highest relocation potential. Consequently, several Belarusian [Table 79] and Swedish
companies [Table 80] are shortlisted that can be targeted for cooperation by the
Freeport of Ventspils. With regard to Belarusian companies, it must be stressed that
emphasis must be on companies operating in the private sector, as forestry and wood
is a state-regulated sector. Consequently, the list of Belarusian companies includes the
enterprises that manufacture the products from wood and, in the vast majority of
cases, are engaged in exports. For both Swedish and Belarussian companies, the
potential presence in the Ventspils was assessed, either by their current presence in
Latvia or by economic interest, i.e. importing or exporting goods via Latvian ports.
The mentioned industries would benefit from specialised services along the way of
the transit corridor and the Freeport of Ventspils has preconditions to offer such
services. The Freeport of Ventspils can offer a different kinds of services for the
companies that would be ready to work or stay in the port. Among them are the
services provided by the terminals, shipping agencies, industrial diving, tugs,
bunkering, maritime waste management, ship chandler services, pilot motorboat, and
office rent.245 Besides the Freeport of Ventspils is providing different kinds of
opportunities how to build and develop the business in the territory of the port: to rent
the industrial buildings, to use the connectivity with the different kinds of modes of
transport, to use the industrial sites and premises, utilities, high skilled labour and tax
incentives and support programme for the investors.246 Therefore the Freeport of
Ventspils provides a different kind of tools for the development.
The following table (Table 79). shortlists other companies that can be targeted to
consider co-operation with or expansion to the Ventspils freeport.
No. Company Field Website
1. Agrotechkonmash
Manufactures metal constructions https://www.listcompany.org/A
grotechkonmash_Info.html 2. Allesta Kitchens manufacturer, garden https://www.fordaq.com/compa
244 Interview with an expert on port business Maris Katranzi, 01.02.2021. 245 The Freeport of Ventspils, Services at the port, https://www.portofventspils.lv/en/port-services 246 The Freeport of Ventspils, Invest in Ventspils, https://www.portofventspils.lv/en/invest-in-ventspils
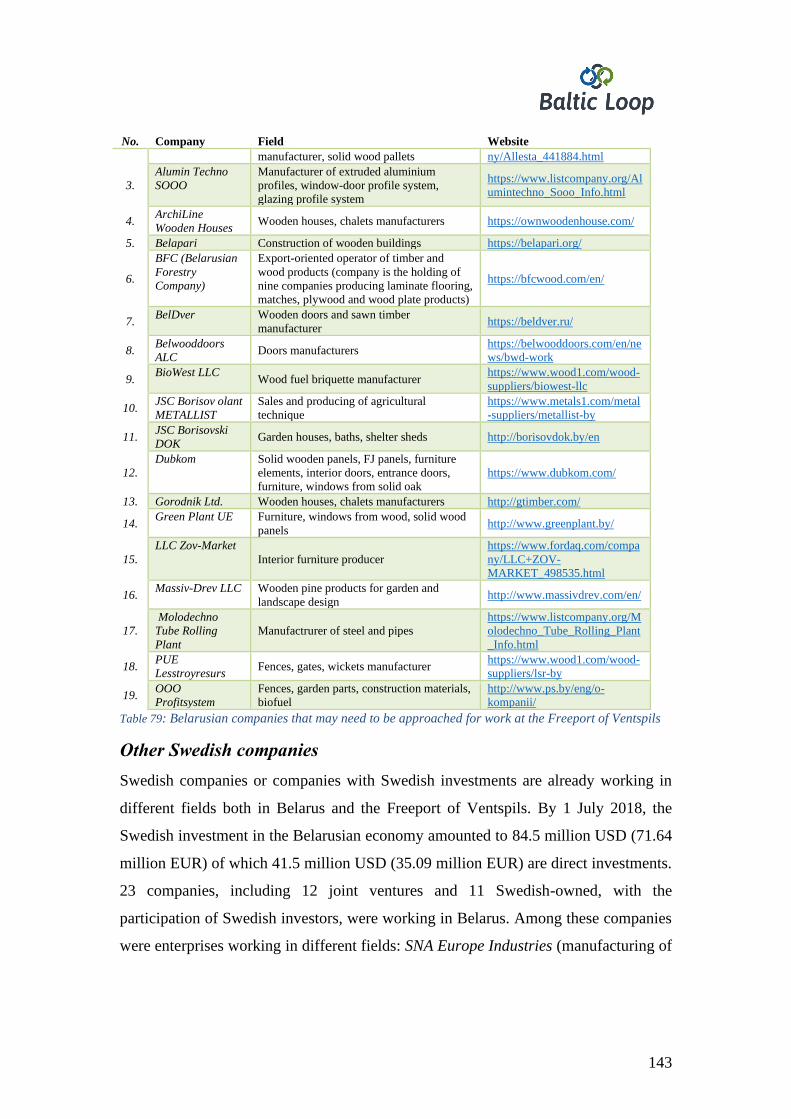
143
No. Company Field Website
manufacturer, solid wood pallets ny/Allesta_441884.html
3.
Alumin Techno
SOOO
Manufacturer of extruded aluminium
profiles, window-door profile system,
glazing profile system
https://www.listcompany.org/Al
umintechno_Sooo_Info.html
4. ArchiLine
Wooden Houses Wooden houses, chalets manufacturers https://ownwoodenhouse.com/
5. Belapari Construction of wooden buildings https://belapari.org/
6.
BFC (Belarusian
Forestry
Company)
Export-oriented operator of timber and
wood products (company is the holding of
nine companies producing laminate flooring,
matches, plywood and wood plate products)
https://bfcwood.com/en/
7. BelDver Wooden doors and sawn timber
manufacturer https://beldver.ru/
8. Belwooddoors
ALC Doors manufacturers
https://belwooddoors.com/en/ne
ws/bwd-work
9. BioWest LLC
Wood fuel briquette manufacturer https://www.wood1.com/wood-
suppliers/biowest-llc
10. JSC Borisov olant
METALLIST
Sales and producing of agricultural
technique
https://www.metals1.com/metal
-suppliers/metallist-by
11. JSC Borisovski
DOK Garden houses, baths, shelter sheds http://borisovdok.by/en
12.
Dubkom Solid wooden panels, FJ panels, furniture
elements, interior doors, entrance doors,
furniture, windows from solid oak
https://www.dubkom.com/
13. Gorodnik Ltd. Wooden houses, chalets manufacturers http://gtimber.com/
14. Green Plant UE Furniture, windows from wood, solid wood
panels http://www.greenplant.by/
15.
LLC Zov-Market
Interior furniture producer
https://www.fordaq.com/compa
ny/LLC+ZOV-
MARKET_498535.html
16. Massiv-Drev LLC Wooden pine products for garden and
landscape design http://www.massivdrev.com/en/
17.
Molodechno
Tube Rolling
Plant
Manufactrurer of steel and pipes
https://www.listcompany.org/M
olodechno_Tube_Rolling_Plant
_Info.html
18. PUE
Lesstroyresurs Fences, gates, wickets manufacturer
https://www.wood1.com/wood-
suppliers/lsr-by
19. OOO
Profitsystem
Fences, garden parts, construction materials,
biofuel
http://www.ps.by/eng/o-
kompanii/
Table 79: Belarusian companies that may need to be approached for work at the Freeport of Ventspils
Оther Swedish companies
Swedish companies or companies with Swedish investments are already working in
different fields both in Belarus and the Freeport of Ventspils. By 1 July 2018, the
Swedish investment in the Belarusian economy amounted to 84.5 million USD (71.64
million EUR) of which 41.5 million USD (35.09 million EUR) are direct investments.
23 companies, including 12 joint ventures and 11 Swedish-owned, with the
participation of Swedish investors, were working in Belarus. Among these companies
were enterprises working in different fields: SNA Europe Industries (manufacturing of
144
chinery)247, RindiBel (wood processing)248, Vireo Energy (landfill gas-to-power
installations)249, etc. Also, such well-known Swedish companies as IKEA (furniture),
Ericsson (telco), Trelleborg (different industries), and Sandvik (engineering company)
have their representative’s offices in Minsk.250
Currently several Swedish companies or companies with Swedish capital are working
in the Freeport of Ventspils. For example, EUROLCDS Ltd251(by engaging Swedish
investors Hornell Tehnikinvest and LC-TEC Display AB) producing liquid crystal
displays, Ventspils-Andren Ltd252, a joint venture of Latvian private persons and the
Swedish company Sten Andren AB, producing large-scale fiberglass reservoirs,
pipelines and other constructions for highly aggressive chemicals, Baltic Forest
Trading253, a company founded in Sweden, manufacturing wooden building materials,
and Arbo Windows254 (for which Sweden is one the main export markets).
Table 80 lists the Swedish companies which already have or might have interest to
intensify their cooperation with or expand their operations to the Freeport of
Ventspils. All the selected companies are characterised by several qualities that could
define their ambitions to work in the Freeport of Ventspils. Firstly, all the mentioned
companies are working internationally, discovering new markets and developing
existing ones. Secondly, all the companies are working in the fields that are already
interesting and existing on the route Belarus-Latvia-Sweden. Thirdly, according to the
information found on publicly available information, all the companies have limited
presence in Eastern Europe. Therefore the Baltics could be potentially new and
interesting markets for them. Finally, all the companies are stable, internationally
247 „SNA Europe Industries”, https://www.bahco.com/int_en/sna-europe 248 „RindiBel”, http://rindibel.by/en/ 249 „Viro Energy”, https://recovia.se/country-pages/belarus/ 250 Swedish companies demonstrante confidence in Belarus and invest in business development,
Embassy of the Republic of Belarus in the Kingdom of Sweden, 13.08.2018.,
https://sweden.mfa.gov.by/en/embassy/news/a32c86c617550d94.html 251 „EUROLCDS Ltd.”, The Freeport of Ventspils, https://www.portofventspils.lv/en/invest-in-
ventspils/industrial-clients/eurolcds/ 252 „Sten Andren AB”, https://www.portofventspils.lv/en/invest-in-ventspils/industrial-
clients/ventspils-andren/ 253 „Baltic Forest Trading”, https://www.portofventspils.lv/lv/razo-brivosta/rupnieciskie-klienti/baltic-
forest-trading/ 254 „Arbo Windows”, The Freepotrt of Ventspils, https://www.portofventspils.lv/en/invest-in-
ventspils/industrial-clients/arbo-windows/
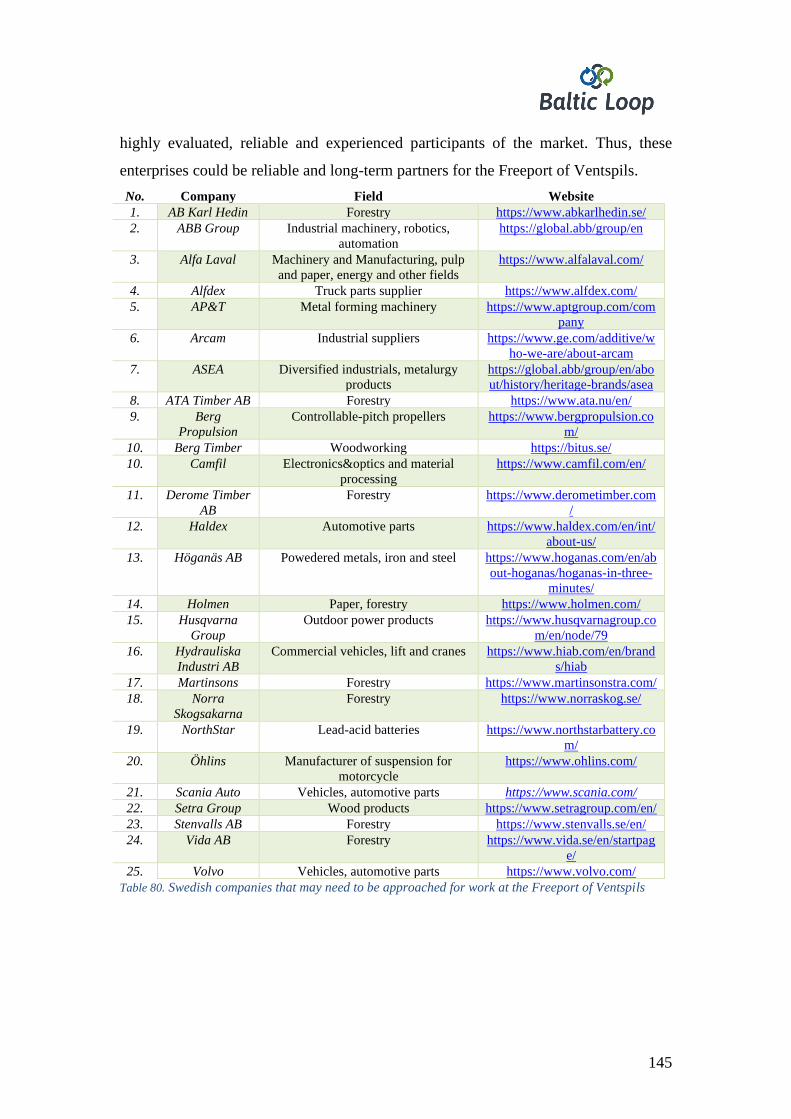
145
highly evaluated, reliable and experienced participants of the market. Thus, these
enterprises could be reliable and long-term partners for the Freeport of Ventspils.
No. Company Field Website
1. AB Karl Hedin Forestry https://www.abkarlhedin.se/
2. ABB Group Industrial machinery, robotics,
automation
https://global.abb/group/en
3. Alfa Laval Machinery and Manufacturing, pulp
and paper, energy and other fields
https://www.alfalaval.com/
4. Alfdex Truck parts supplier https://www.alfdex.com/
5. AP&T Metal forming machinery https://www.aptgroup.com/com
pany
6. Arcam Industrial suppliers https://www.ge.com/additive/w
ho-we-are/about-arcam
7. ASEA Diversified industrials, metalurgy
products
https://global.abb/group/en/abo
ut/history/heritage-brands/asea
8. ATA Timber AB Forestry https://www.ata.nu/en/
9. Berg
Propulsion
Controllable-pitch propellers https://www.bergpropulsion.co
m/
10. Berg Timber Woodworking https://bitus.se/
10. Camfil Electronics&optics and material
processing
https://www.camfil.com/en/
11. Derome Timber
AB
Forestry https://www.derometimber.com
/
12. Haldex Automotive parts https://www.haldex.com/en/int/
about-us/
13. Höganäs AB Powedered metals, iron and steel https://www.hoganas.com/en/ab
out-hoganas/hoganas-in-three-
minutes/
14. Holmen Paper, forestry https://www.holmen.com/
15. Husqvarna
Group
Outdoor power products https://www.husqvarnagroup.co
m/en/node/79
16. Hydrauliska
Industri AB
Commercial vehicles, lift and cranes https://www.hiab.com/en/brand
s/hiab
17. Martinsons Forestry https://www.martinsonstra.com/
18. Norra
Skogsakarna
Forestry https://www.norraskog.se/
19. NorthStar Lead-acid batteries https://www.northstarbattery.co
m/
20. Öhlins Manufacturer of suspension for
motorcycle
https://www.ohlins.com/
21. Scania Auto Vehicles, automotive parts https://www.scania.com/
22. Setra Group Wood products https://www.setragroup.com/en/
23. Stenvalls AB Forestry https://www.stenvalls.se/en/
24. Vida AB Forestry https://www.vida.se/en/startpag
e/
25. Volvo Vehicles, automotive parts https://www.volvo.com/
Table 80. Swedish companies that may need to be approached for work at the Freeport of Ventspils
146
7.5. Ways how to reach the Belarusian business niche in terms of relocation
The development of a marketing strategy is a complex and multifaceted task that
requires a systematic, planned approach, including the study of all modern trends in
the development of target markets. The formation of the company's marketing
strategy aimed at attracting Belarusian business should take into account the
peculiarities of both the fundamental features of the market and the trends that were
formed during 2020. The main strengths on which a strategic advantage should be
built are:
• The possibility of free access to the European market;
• Ease of business registration;
• Business conditions;
• Geographical and cultural proximity to Belarus.
The key task that needs to be solved by the current marketing strategy is the lack of
informing the Belarusian business about the possibilities and conditions of relocation,
since, in the current political and economic situation, in the near future, a decrease in
interest in this issue is not expected. Thus, a marketing strategy for attracting
Belarusian business should be aimed at:
• Ensuring that the heads of enterprises are informed about the possibilities and
conditions of relocation;
• Formation of an informative and accessible tool for obtaining complete information
about doing business in Latvia;
• Formation of a single reference centre for all emigration issues;
• Intensification of resources for the regions neighbouring Latvia and the city of
Minsk.
The promotional action plan may include:
• Targeting in the Belarusian internet space to management or top business managers;
• Participation in non-governmental business forums and conferences (participation as
a partner is possible);
• Use of PR promotion channels (work with local media in the issue of informing the
population, placement of ordered articles);
147
• Display advertising on YouTube (video topics: politics, economics, and business,
emigration);
• Monitoring of the Belarusian media space;
• Contacting with Belarusian business organisations and associations. For example,
Innovation Association Republican Centre for Technology Transfer255, Association of
legal entities Republican Confederation of Entrepreneurship256 or industrial park
Great stone257, Association of European Business258, EU-based research centre with
focus on CASE Belarus.259
Based on the political situation in Belarus, information about the relocation of
companies, as a rule, does not go beyond the industry news segment, and the search
for options for emigration occurs exclusively on a personal level. In this connection,
working with opinion leaders and experts in specific fields can become an effective
way to find the target audience for business migration from Belarus to Latvia. As
practice shows, the recommendation of potential candidates based on personal
communication or knowledge of the market can be the most effective search for target
companies in the market.
Similarly to market experts, it is recommended to consider interaction with human
rights organisations and opposition structures. They accumulate a large amount of
operational information about the ongoing repressions on the territory of Belarus and,
therefore, receive operational information about potential candidates for relocation.
Conceptual portrait of the target audience of business migration from Belarus to
Latvia.
During the last years, migration from Belarus is a stable trend, which has received a
strong new impetus in 2020. The main peak of these processes started after August
2020. According to the Department of Citizenship and Migration of Belarus, in
255 Innovation Association „Republican Centre for Technology Transfer”, https://ictt.by/rus/ 256 Association of legal entities „Republican Confederation of Entrepreneurship”,
https://een.ec.europa.eu/about/branches/by00832 257 Industrial park „Great park”, https://en.industrialpark.by/ 258 Association of European Business, http://www.aebbel.by/eng 259 CASE Belarus, https://case-belarus.eu/
148
September, more than 13 000 Belarusians left the country for Poland and Ukraine and
about 500 more went to Lithuania and Latvia.
This process was caused by several reasons:
• Inconsistent government policy regarding the fight against COVID-19. This policy
took several forms: 1) complete denials of the problems associated with the global
pandemic; 2) the lack of reliable statistics on morbidity; 3) the material and technical
unpreparedness of the health sector during the increased loads, thus a large part of the
population was faced with the fact that the state was unable to provide their basic
needs for safety and health protection.
• Deep political crisis in Belarus, which grew into an economic crisis. After the
presidential elections in Belarus, in August 2020, the country faced repressions
against its own population (more than 31 000 repressed). These events resulted in a
weakening of the Belarusian ruble (by 8.3%), a record decline in gold and foreign
exchange reserves (by USD 1,536.4 million, or 17.3%), an outflow of funds from the
banking system (over USD 1.5 billion), which ended in a liquidity crisis and a
reduction in bank lending. The brutal detentions and the persecution of people for
their political beliefs triggered a further increase in mistrust in the current government
and a sharp deterioration in the investment and economic climate in the country.
• The global economic crisis of 2020. As a small open economy relying on the export
of the different commodities, Belarus is heavily influenced by global shocks and
caused by dramatic contractions in the economic activity of its major trading partners,
including, falling oil prices and global financial instability associated with the
COVID-19 pandemic. Thus, a decrease in the growth rate of the Belarusian economy
(GDP for 9 months decreased by 1.3%) is not associated with the political crisis but is
a consequence of stagnation in foreign markets. The natural result of the activities of
the current regime is the largest increase in emigration in recent history, most of
which may become irrevocable.
149
7.6. Advantages of Latvia for attracting Belarusian entrepreneurs
According to the data of the National Statistical Committee, during August-
September 2020, totally, 1890 people left for Ukraine, 1751 people - for Poland, 435
people went to Lithuania, and 131 people went to Latvia. Based on the data of
August-September 2020, five times more Belarusians left for Poland than for the
entire 2019, almost twice as many to Ukraine, and about the same amount to
Lithuania and Latvia as for the whole last year.
There is a growing interest of Belarusian entrepreneurs in the possibility of the
collaboration with Latvia, as a neighbouring country-member of the European Union
(EU), for the development of their business activities. To achieve this aim, at the
government level in Latvia the initiative groups have been created. The purpose of
these groups is to maximally simplify the procedure for passing all state institutions
for business representatives from Belarus.
There are several factors that attract Belarusian businessmen to Latvia. Including
them, to register a company in Latvia for free, to open a current account for free, to
organize a full-fledged working office, to complete the formalities regarding the
headquarters in Belarus, thus reducing to a minimum the losses inevitable during the
move. Besides, there are several important competitive advantages that help attract
Belarusian businesses to Latvia as a place to develop their entrepreneurial activities:
• Latvia is a member of the most important international organisations - EU, NATO,
OECD, and the World Trade Organisation, which guarantees a safe environment for
entrepreneurship and investment protection.
• In Latvia, one can register a new company comparably fast.
• According to the results of the EU Eurobarometer, 95% of the population of Latvia
speaks at least one foreign language, 49% of the population speaks at least two
foreign languages, and 13% of the population speaks three foreign languages. In
addition, 44% of the surveyed population uses a foreign language every day. The
native language of around 30% of the population is Russian. This knowledge and

150
mutual understanding of cultures allow Belarusian entrepreneurs to transfer or start
their business in Latvia much easier than in any other EU member state.
• Latvia has one of the fastest internet performance indicators in the world.
• There are already 50 international business service centres operating in Latvia,
employing a total of 15 thousand people.
• In Latvia, special attention is paid to the development of high and medium-high
technologies. Thus, 70% of start-ups work in the field of fintech. In addition, special
government support tools are available for those working in these sectors.
• Quality education in foreign languages is available in Latvia.
• Latvia is the second „greenest” country in the EU, with a total coastline of 498 km.
It should be noted that the decision to relocate for the overwhelming majority of
Belarusian business would be a decision made under the pressure and formed under
the influence of internal or external factors when other options for the development of
events have already been rejected or are inaccessible. Therefore, the formation of a
portrait of the target audience for business migration requires a complex consideration
for a number of factors. One must separate factors that influence the decision to
relocate: political, economic, environmental factors, socio-cultural and legal,
technological, and, the last one, political relocation.
• Political. The political situation in Belarus affects the relationships between the
companies and their existing and potential customers. For more than 6 months, the
political situation has been shaping the main information agenda of Belarus. In view
of this, economic pressure is the main political instrument for persecuting business.
There are many cases when the Belarusian business was completely liquidated or
partially transferred due to constant economic persecution of the organisation, key
employees, or hindering its functioning with the help of unreasonable inspections. It is
also possible to change the relocation of Belarusian start-ups due to the discrepancy
between the political views of the main investors or parent organisations. Against the
backdrop of political events, the productivity of employees in most enterprises has
decreased. According to BICC and Regis Consult, this was noted by four of five
151
respondents (among 270 owners and managers of Belarusian companies). In
comparison, the remote work format reduced productivity for only half of the
employees.
• Economic. A key factor in deciding whether to migrate is appropriateness. During
the absence of personal political persecution or business persecution, the main target
audience for relocation are companies whose financial activities are largely tied to the
export of goods or services to the European market. The most promising sectors in
this area are trade and logistics companies, representatives of the IT industry,
mechanical engineering, woodworking.
Essential criteria influencing the possibility of transferring the company's activities to
Latvia is the presence of foreign offices of the company, in particular, the presence of
representative offices in Latvia.
The form of business ownership also imposes a number of restrictions on the ability
of enterprises to relocate. State-owned enterprises or companies in which the state is a
shareholder are more likely to be unable to emigrate, even if there is a real economic
benefit. Accordingly, the main target audience can be fully private enterprises of
Belarus only.
According to the Baltic Course, 17 Belarusian companies moved to Latvia in the first
nine months of 2020, creating a total of 1000 new jobs in Latvia. 15 of them work in
the field of information and communication technologies.
• Environmental factors. According to a study made by BICC and RegisConsult, in
October 2020, 52% of the surveyed owners and managers of Belarusian companies
note the emergence of additional difficulties in finding new projects and clients due to
the spread of the impact of the global pandemic on the economy [Figure 33]. Slightly
less than half of the respondents did not notice significant changes in the sales process
related to COVID-19. The remaining 4% believe it has become easier to attract
customers during COVID-19. These companies can be characterised by a small
number of employees, a relatively long existence in the market, as well as work in
outsourcing.
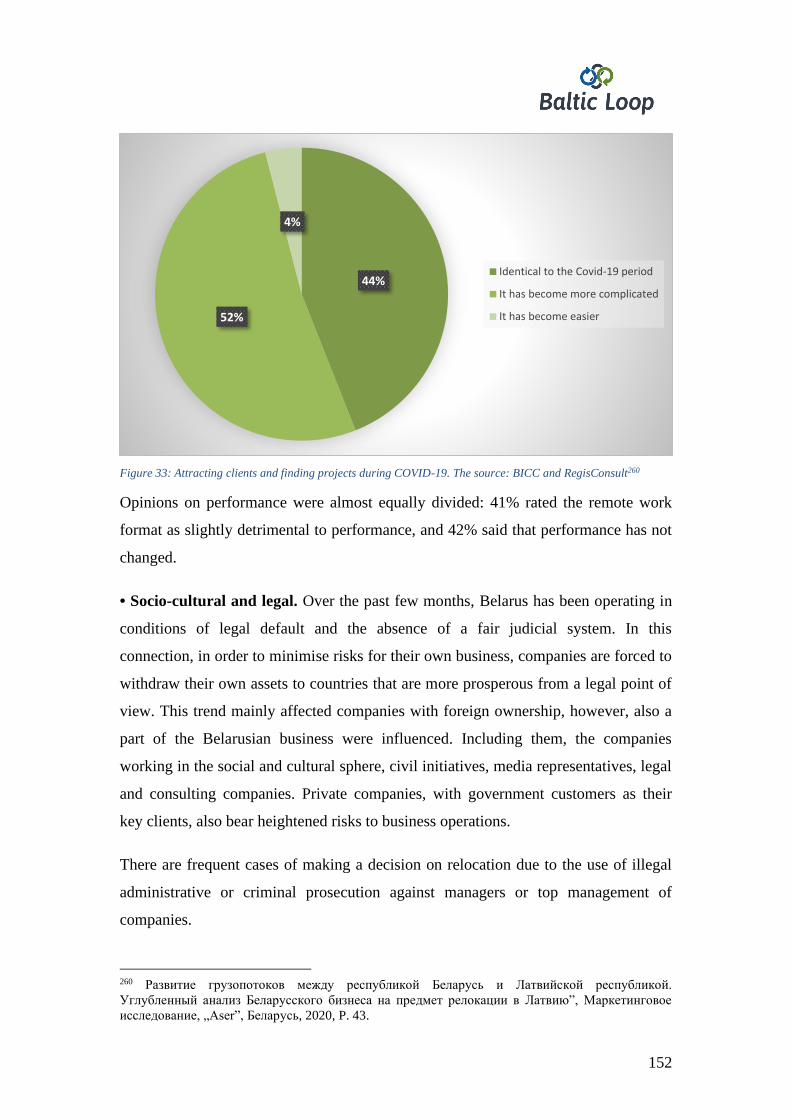
152
Figure 33: Attracting clients and finding projects during COVID-19. The source: BICC and RegisConsult260
Opinions on performance were almost equally divided: 41% rated the remote work
format as slightly detrimental to performance, and 42% said that performance has not
changed.
• Socio-cultural and legal. Over the past few months, Belarus has been operating in
conditions of legal default and the absence of a fair judicial system. In this
connection, in order to minimise risks for their own business, companies are forced to
withdraw their own assets to countries that are more prosperous from a legal point of
view. This trend mainly affected companies with foreign ownership, however, also a
part of the Belarusian business were influenced. Including them, the companies
working in the social and cultural sphere, civil initiatives, media representatives, legal
and consulting companies. Private companies, with government customers as their
key clients, also bear heightened risks to business operations.
There are frequent cases of making a decision on relocation due to the use of illegal
administrative or criminal prosecution against managers or top management of
companies.
260 Развитие грузопотоков между республикой Беларусь и Латвийской республикой.
Углубленный анализ Беларусского бизнеса на предмет релокации в Латвию”, Маркетинговое
исследование, „Aser”, Беларусь, 2020, P. 43.
44%
52%
4%
Identical to the Covid-19 period
It has become more complicated
It has become easier
153
• Technological. These factors are primarily associated with the unavailability of
certain technologies, equipment, or personnel required for effective functioning.
However, due to the underdevelopment of the Belarusian economy, there is also the
opposite situation with the lack of necessary target sales markets. This situation is
primarily typical for start-ups, or Belarusian high-tech industries. Depending on their
characteristics and motivations, the conceptual portrait of the target audience of
business migration from Belarus to Latvia can be divided into two groups:
• Political relocation. The main motivators for this type of relocation – popular in the
second part of 2020 - are political, socio-cultural, and legal factors. A distinctive
feature is the fact that market players, in this case, are ready to incur a number of
serious economic costs. Besides, they are also guided by the goals of personal safety
and business preservation, rather than maximising their own profits. For attracting this
business segment, the key factors of success are the prompt response rate of the
receiving party, minimisation of bureaucratic relocation procedures, conditions of
preferences or support for the business.
7.7. Conclusions
The biggest freight villages in Europe are concentrated in Italy and Germany. There is
only one freight village among them in Central or Eastern Europe. Therefore, the
closest freight villages to Latvia are in Poland and Russia. However, the ports around
the BSR also offer a lot of services and opportunities usually offered by freight
villages.
Latvia has already started to attract Belarusian companies. Besides more than
10 enterprises are already relocated to Latvia or are on their way. Therefore, probably,
the Freeport of Ventspils should collaborate with IDAL making and realising one
programme strategy. Also, the Freeport of Ventspils must be specialised in attracting
companies that work in one or a couple of fields. In other words, there must be
specialisation. As the most promising fields one can mention photonics, smart
materials, IT, biotechnologies, woodworking, chemical production, and others.
According to a survey done in Belarus, the companies working in different fields are
interested to relocate to the Freeport of Ventspils.
154
However, one must keep in mind that in the competition for the attraction of
Belarusian companies, the Freeport of Ventspils and Latvia, in general, must compete
with Russia, Ukraine, Poland, and Lithuania. The Freeport of Ventspils can attract the
Belarusian companies by its quality infrastructure, availability of labour force, free
and simple access to the European market, free territories for development and
manufacturing. As opportunities, one can mention the attraction process and
experience of Belarusian companies that have already started and the potential
privatisation of state companies in the next years. Therefore these companies could be
open to making their branches in other countries, including, Latvia.
However, the Freeport of Ventspils has several weaknesses and threats in a stronger
connection with Belarus. Including, geographical factors, distance from Rail Baltica,
and strong competition with the port of Klaipeda.
155
8. Recommendations
The chapter on recommendations is divided into three parts. The first one observes the
potential of the Belarus-Latvia-Sweden corridor. The second one points out and
observes the industries and companies willing to relocate and work in the Freeport of
Ventspils and the third one mentions and offers the ways how to attract the Belarusian
companies to relocate to Ventspils and Swedish companies to work in Ventspils. The
recommendations are based on the statistics obtained in the study, responses given by
Belarusian companies and opinions, and recommendations given by experts.
8.1. The potential of Belarus-Latvia-Sweden Corridor
The potential of the Belarus-Sweden-Latvia corridor depends both on economic and
political factors. Economically the corridor can become a significant gateway from
Asia, Belarus, Russia, and CIS to Scandinavia and Western Europe. Politically the
current diplomatic relationship between Latvia, Belarus and Russia allows to stress
the benefits of the Belarus-Sweden-Latvia corridor. Economically, there is a potential
for growth, since the Freeport of Ventspils has a geographically convenient location,
well-developed infrastructure, experience, and high-level specialists. Nevertheless,
one must keep in mind the competition, mainly from the port of Klaipeda and the
Freeport of Riga. Politically, it is important to note that the relationships between
Latvia and Belarus create a strong impact on decisions in economy and transit.
Two-thirds of the freight transport from Sweden are concentrated to the five major
North European transport corridors and one of these corridors is between the Eastern
Europe and the Baltic Sea coast. The port of Nynäshamn as a part of the port of
Stockholm is one of the closest points in Sweden to the Freeport of Ventspils and thus
also this corridor. The port of Visby in Gotland has even a closer location but since it
is located on the island of Gotland there are remarkably less connections with other
Swedish cities as there are in Nynäshamn and more modal shifts are necessary.
Geographical proximity is not the only reason why the port of Nynäshamn is a
favourable partner for the Freeport of Ventspils. Also, the region of Stockholm is
highly economically developed and densely populated with the largest consumer
156
market in Sweden. Finally, the port of Nynäshamn is the hub for the distribution of
commodities around Sweden, Scandinavia, and the Western Europe.
Therefore, the connection – the Freeport of Ventspils and the port of Nynäshamn – is
already a direct, fast, and cost-effective route. It allows reaching not only the Swedish
and Scandinavian but also the Western market. The port of Nynäshamn is connected
to other main corridors of the transit and freight in Sweden.
Major bottlenecks in transit of goods are political, bureaucratical and physical.
Obvious bottlenecks exist throughout the Sweden – Latvia – Belarus corridor due to
the shift in transport mode on both sides of the Baltic Sea. Political bottlenecks exist
with the current diplomatic challenges between the European Union and its Eastern
neighbours. Bureaucratical bottlenecks are obvious when import or export from
European Union is considered, but they are not found significant within this research.
The potential of the cargo flow and the general development perspective of the
Sweden – Latvia – Belarus corridor outweighs the bottleneck effect of the ports. The
opportunity to specialise and improve the excellence of services is also in favour of
investing resources to overcome the existing bottlenecks. For further improving the
efficiency of the Belarus – Latvia – Sweden transport corridor the following
guidelines are recommended:
1. The Freeport of Ventspils should review the competitiveness of its tariffs in
the Baltics. They should be more convenient than the ones provided by
competitors.
2. The Freeport of Ventspils must push for the introduction of the electronic bill
of lading system in the light of the EFTI regulation, which will be mandatory
for logistics industry starting in the near future.
3. The airport of Ventspils characterises the Freeport of Ventspils as a diverse
transport hub and potential freight village. Consequently, the airport could be
used in transporting different kinds of commodities or ensuring business
passenger flow. The opportunity and skills to offer this service must be
included also in the marketing and communication activities.
157
4. The Freeport of Ventspils must gain deeper insight on the development plans
of the business centre Great Stone in Minsk, Belarus. The Freeport of
Ventspils must attract the Chinese companies working in Belarus by specific
and targeted marketing, and communication activities. It is of highest
importance to discuss with Latvian officials about easier customs clearance on
Latvian borders for the Chinese commodities on the way from Belarus to
Sweden.
5. A locally owned container terminal and well-developed rail network to
Ventspils with a link to Rail Baltica would help grow the size and frequency
of the container cargo via Ventspils.
6. The Freeport of Ventspils must stress the advantages of cargo transported by
rail. Latvian railway infrastructure is one of the competitive advantages
compared to Lithuania, Port of Klaipeda.
7. Transparent and clear principles of cooperation must be communicated with
the potential business partners.
8. Additionally, the potential development of a freight village in the Ventspils
Port can serve as a magnet for the attraction of the international companies.
9. Finally, the development and the future of the Belarus – Latvia - Sweden
corridor will also be facilitated by attracting the Belarusian companies. That
would ensure regular cargo flow.
8.2. The industries and companies willing to expand or relocate of the Freeport
of Ventspils
Currently, the Freeport of Ventspils ensures the opportunity for companies from
various industries to work in its territory. The Freeport of Ventspils and the city of
Ventspils can thus also offer the infrastructure and space for various Belarusian
enterprises to potentially relocate or expand their operation and for various Swedish
enterprises to extend their activities.
The research shows that the biggest interest in the relocation to other countries is
expressing Belarusian companies working in the field of technologies. However, the
infrastructure and territory are appropriate also for the companies in other fields as
well.
158
According to the survey of 270 Belarusian companies and statistics provided by
various governmental institutions the following industries can be targeted to expand
their operation or relocate (see Chapter 7.4 for additional information):
1. The most favourable sectors of Belarusian business for relocation to the
Freeport of Ventspils are 1) woodworking, 2) high-tech, ICT innovations,
start-ups, 3) Belarusian companies working on an international scale willing to
open their branches;
1.1. According to statistics, the wood industry is one of the main fields
exporting their products to Scandinavia. Thus, the companies working in
this sector can create their branches in the territory of the Freeport and
manufacture the products according to EU standards. This will also help
companies avoid privatisation, which is foreseen in Belarus in a few years.
Consequently, the Freeport of Ventspils must be ready to start discussions
with these companies who work in government-controlled sectors.
1.2. Belarus is rich in promising high-tech and start-up companies. More than
10 of them have already relocated to Latvia, mainly to Riga. But contrary
to most Latvian cities and territories, the Freeport of Ventspils can offer
not only favourable and predictable state policy and easy registration of
companies but also suitable infrastructure. Companies, like those ones that
work on an international scale willing to open their branches, would be
interested to operate in Ventspils also because of geographical proximity
to Scandinavia.
1.3. According to the study, four new companies are ready to discuss the
chance to move to the Freeport of Ventspils: OOO Daber (woodworking),
ODO Anadimtur (transport, tourism), OOO Energokomplekt (electrical),
and Vitebsk Elevators (mechanical engineering).
2. Apart from that, wood chips are the perfect candidate for Scandinavian import
from Ventspils as a classic port operations platform. All necessary
infrastructure is there to accommodate this commodity now and to push for the
export flow of wood chip reallocation to Ventspils. Recent data shows that
there are now lots of (about nine) wood pellet production plants launched (or
to be launched in the closest time) which will generate over 1 million tons of
159
wood pellets. Wood pellets require hopper wagon operations and allocation of
cargoes in closed warehouses. In theory this can be accommodated by a large
terminal such as Kalija Parks provided that the shareholders of Kalija Parks
see it as a sufficient reason to restock or switch from potassium salt to wood
pellets. No free warehouses in the Freeport of Ventspils available now for the
allocation of wood pellet projects. In general, the territory of the Freeport
which is far away from the deep-water berths, can be utilised as private
warehouses for wood pellet allocation. This will require railway access roads
for hopper wagon operations, and carriers to invest in warehouses and to
conclude agreements with any terminal which is capable of handling wood
chips in bulk (VTO / NNVT / Ventplac / EUROHOME).
3. One of the most promising Belarusian industries in Latvia could also be
potash. Contrary to the sectors mentioned above the Freeport of Ventspils and
Belarus have had a huge and long-term experience in working together in this
field. Therefore, both sides know each other. In order to strengthen the ties,
the Freeport of Ventspils can offer to make this cooperation even deeper by
selling one of its terminals to a Belarusian company, in part or whole. Another
option is to utilise new potassium salt volumes which are to be developed in
Belarus as a potential candidate for stevedoring operations in the Freeport of
Ventspils. Especially now when the political situation with Lithuania is
worsening. The only challenge for Ventspils is the absence of container lines.
which can be a great drawback considering that large volumes of cargoes are
leaving the port not in bulk carriers, but in containers. The current container
terminals in Ventspils have enormous potential, and another advantage is the
closeness to the main container routes to/from St. Petersburg where any carrier
passing the Freeport of Ventspils on the Baltic route can enter the port to
deliver empty containers and pick up laden ones. This gives hope that this
extra service element can easily be added to potassium salt transhipment.
4. The food industry is not included in list of promising fields. There are no
significant volumes of food exported from Belarus to Sweden. Moreover,
there is no sign that there is an interest in the Belarusian food in Scandinavia
or Western countries. However, the fish industry is one of the main import
160
sectors from Scandinavia to Belarus, but one must keep in mind that these
products mostly are provided for the Russian market. Because of the
international sanctions, the fish products are exported to Russia from
Scandinavia through Belarus. There is also a great potential of Girteka freezer
warehouse usage in Ventspils assuming this does not interfere with sanitary/
veterinary norms for carriages of frozen fish products to CIS countries. This
option should be addressed to Norwegian and Swedish fish producers and
exporters. Maybe this can be an option to streamline and make deliveries of
food products faster / more available.
5. The petroleum and chemicals industry also is among the ones with potential.
Liquid petrochemical material handling in the Freeport of Ventspils is one of
the best in the Baltics, thus some end-product processing companies can be
looked upon as possible candidates for reallocation. A good example can be
seen with BioVenta using its shareholder terminal capacities for BioDiesel
production means. Several territories are located next to a chemical cluster of
Ventspils, which could accommodate more petrochemical plants related to
Sweden/ Norway.
6. Companies from Sweden representing tech fields can also operate in the
Freeport of Ventspils. According to statistics shown previously, one of the
main commodities imported to Belarus are machinery and mechanical
appliances. Therefore, companies working in these fields could open their
branches in Ventspils. Moreover, since Belarus has a developed high-tech
industry, Ventspils potentially could become the crosspoint for the Belarusian
and Swedish high-tech companies.
7. Those Swedish companies working in the wood sector or using wood as a raw
material could be interested to work in Ventspils because one of the most
popular products transported to Sweden from Belarus is wood.
Particular commodities with the highest development potential are the ones that are
already transported between Belarus and the Port of Nynäshamn via Port of Ventspils
most frequently (see Chapters 3.1 and 6.5 for additional information). During the four
weeks in November and December 2019 and July and August 2020 the most popular
161
commodities sent from Belarus to the port of Nynäshamn through the Freeport of
Ventspils were:
• furniture,
• building materials,
• windows,
• metal and plastic/rubber.
In the opposite direction, the most popular commodities sent from the port of
Nynäshamn in Sweden to Belarus through the Freeport of Ventspils were:
• fish,
• sodium chlorate,
• paper and metal.
First of all, the data on particular commodities reveals the potential for and industrial
park or freight village focused on wood products, as well as the further potential of
existing bulk terminals. A freight village with focus on wood products would help add
value to the timber coming from Belarus and the Baltics, serve as a logistics and
distribution centre for Swedish and other European companies, and most importantly
serve as a magnet for a cluster-like development of wood industry in Ventspils.
Secondly, at this moment, the Freeport of Ventspils must concentrate on such fields as
high-tech, IT, start-ups. This recommendation is based on the following arguments:
1) the companies working in these sectors either have already relocated to Latvia or
expressed a wish to relocate; 2) these companies are pessimistic about the
development of business in Belarus which strengthens their wish to relocate; 3) these
companies are more flexible not only to relocate but also to cooperate on an
international level and offer potentially very competitive products, thus they could
have a long-term vision to work in Latvia and employ the local workforce; 4) contrary
to other regions in Latvia, the Freeport of Ventspils can not only offer economic
stability but also the high-quality infrastructure that is an important criterion for
relocating technological companies.
162
8.3. The ways how to attract Belarusian and Swedish companies
Since the political crisis in Belarus in [2020], IDAL is purposefully working on
making contacts with different kinds of enterprises creating interest among them to
relocate to Latvia. Consequently, at the beginning of [March 2021], more than 10
Belarusian companies have already relocated to Latvia or are in the process of
expanding their businesses.
According to a survey conducted within the research, a significant number of
Belarusian companies are ready to completely or partially relocate to another country.
However, Latvia is not the only country that tries to attract Belarusian business.
Poland, Lithuania, Russia, and Ukraine also are among the countries where the
companies would be ready to operate.
Therefore, IDAL has already made a serious effort to create an interest in Latvia
within the Belarusian business society. Since IDAL has a track record in cooperating
with Belarus and experience in attracting Belarusian companies, the Freeport of
Ventspils should cooperate with IDAL and coordinate its activities with the plan of
action created and realised by IDAL. Thus, the recommendations provided for the
Freeport of Ventspils are partly connected with the work already carried out by IDAL
and common Latvian policies.
Concerning Swedish companies, it is important to attract them by promoting their
branches in Ventspils. The main attention is going to be paid to the companies that
work in such fields as wood, manufacturing of products using the wood as a raw
material, and high-tech/machinery.
1. Since the Freeport of Ventspils and IDAL are pursuing the same objectives,
both institutions must cooperate with each other in sharing the information and
experience and performing joint activities, thus helping each other. IDAL
already has significant experience in discussions with Belarusian companies,
therefore after acquiring this experience, the activities of the Freeport of
Ventspils will be more precise and productive;
2. The activities done by the Freeport of Ventspils must be precisely targeted to
specific areas. The survey carried out within the research shows that
163
companies working in such sectors as ICT and high-tech are more interested to
expand or relocate to other countries. Also, the current experience in Latvia
shows that exactly ICT and high-tech companies, e.g. the ones working in
photonics, are ready to relocate. At the same time, the Freeport of Ventspils
and VHTP have already proven their competence in working with high-tech
companies. Thus, the Freeport of Ventspils should target potential Belarusian
and Swedish cooperation partners by promoting not only its freeport territory
but also the stability of policies in economics and cultural similarities.
3. All potential investors and enterprises from Belarus and Sweden must be
addressed directly by the Freeport of Ventspils, via videos on social networks,
and by participating in various social events, even if they are in digital or
interactive format and environment.
4. Targeting is also necessary for the development of competition with the
Freeport of Riga, Port of Liepaja, Port of Klaipeda, and Port of Tallinn. The
Freeport of Ventspils must stress not only its experience but also its high level
and versatile infrastructure and professionality of its experts.
5. The Freeport of Ventspils must also highlight its connectivity with the
Swedish port of Nynäshamn emphasising the link with Scandinavia and
Europe, thus presenting itself as a serious competitor vs. the lines Liepaja-
Travemunde and Klaipeda-Karlshamn, provided by the port of Liepaja and the
port of Klaipeda respectively.
6. The Freeport of Ventspils should create a programme specifically targeted for
Swedish and Belarusian investors who would be ready and willing to acquire
land or facilities in the port territory. This way the Freeport of Ventspils gains
a long-term investor and partner who is interested in the development of the
Freeport. These companies could work in the fields of woodworking or could
be branches of some foreign companies willing to get into a Baltics market.
7. Since Ventspils is geographically close to Scandinavia, the Freeport of
Ventspils could serve Belarusian enterprises as a gate to other regions both
geographically and economically, because transportation costs from Belarus to
Latvia disappear. Besides, the attraction of long-term investors and
164
cooperation partners could become a broad step towards the idea and aim to
create a powerful transportation hub or freight village in BSR.
8. Finally, by using the marketing and communication activities and possibly
cooperating with IDAL, the Freeport of Ventspils can also attract companies
outside of the EU, which are willing to get into the markets of Belarus, CIS,
and Eastern Europe. For those companies and their branches the Freeport of
Ventspils could become a gateway to Eastern Europe and CIS.
To summarise, the Freeport of Ventspils must coordinate its activities with IDAL
since the agency has already done a huge job in communicating and collaborating
with Belarusian and Swedish companies. Therefore, the Freeport of Ventspils is not
supposed to start from zero. Latvia and especially Ventspils has several advantages
that could be interesting for the aforementioned partners: stability in economy and
politics, membership in the EU and other international organisations, cultural
closeness, geographical closeness both to Belarus and Scandinavia, and specifically,
in Ventspils: the status of a special economic zone, versatile infrastructure and experts
and experience in working with foreign investors and businesses. The Belarusian and,
also Swedish, companies could be reached via special activities matched with IDAL,
i.e. marketing activities on social networks and personal addresses to companies.
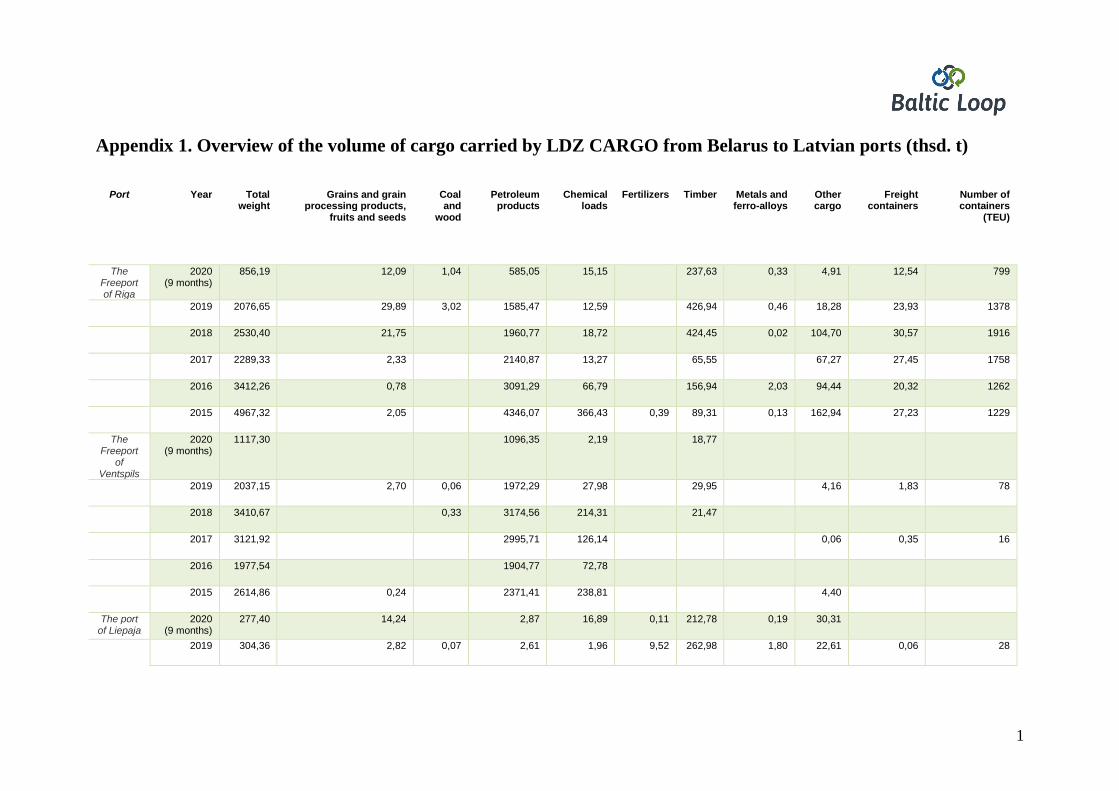
1
Appendix 1. Overview of the volume of cargo carried by LDZ CARGO from Belarus to Latvian ports (thsd. t)
Port Year Total weight
Grains and grain processing products,
fruits and seeds
Coal and
wood
Petroleum products
Chemical loads
Fertilizers Timber Metals and ferro-alloys
Other cargo
Freight containers
Number of containers
(TEU)
The Freeport of Riga
2020 (9 months)
856,19 12,09 1,04 585,05 15,15 237,63 0,33 4,91 12,54 799
2019 2076,65 29,89 3,02 1585,47 12,59 426,94 0,46 18,28 23,93 1378
2018 2530,40 21,75 1960,77 18,72 424,45 0,02 104,70 30,57 1916
2017 2289,33 2,33 2140,87 13,27 65,55 67,27 27,45 1758
2016 3412,26 0,78 3091,29 66,79 156,94 2,03 94,44 20,32 1262
2015 4967,32 2,05 4346,07 366,43 0,39 89,31 0,13 162,94 27,23 1229
The Freeport
of Ventspils
2020 (9 months)
1117,30 1096,35 2,19 18,77
2019 2037,15 2,70 0,06 1972,29 27,98 29,95 4,16 1,83 78
2018 3410,67 0,33 3174,56 214,31 21,47
2017 3121,92 2995,71 126,14 0,06 0,35 16
2016 1977,54 1904,77 72,78
2015 2614,86 0,24 2371,41 238,81 4,40
The port of Liepaja
2020 (9 months)
277,40 14,24 2,87 16,89 0,11 212,78 0,19 30,31
2019 304,36 2,82 0,07 2,61 1,96 9,52 262,98 1,80 22,61 0,06 28
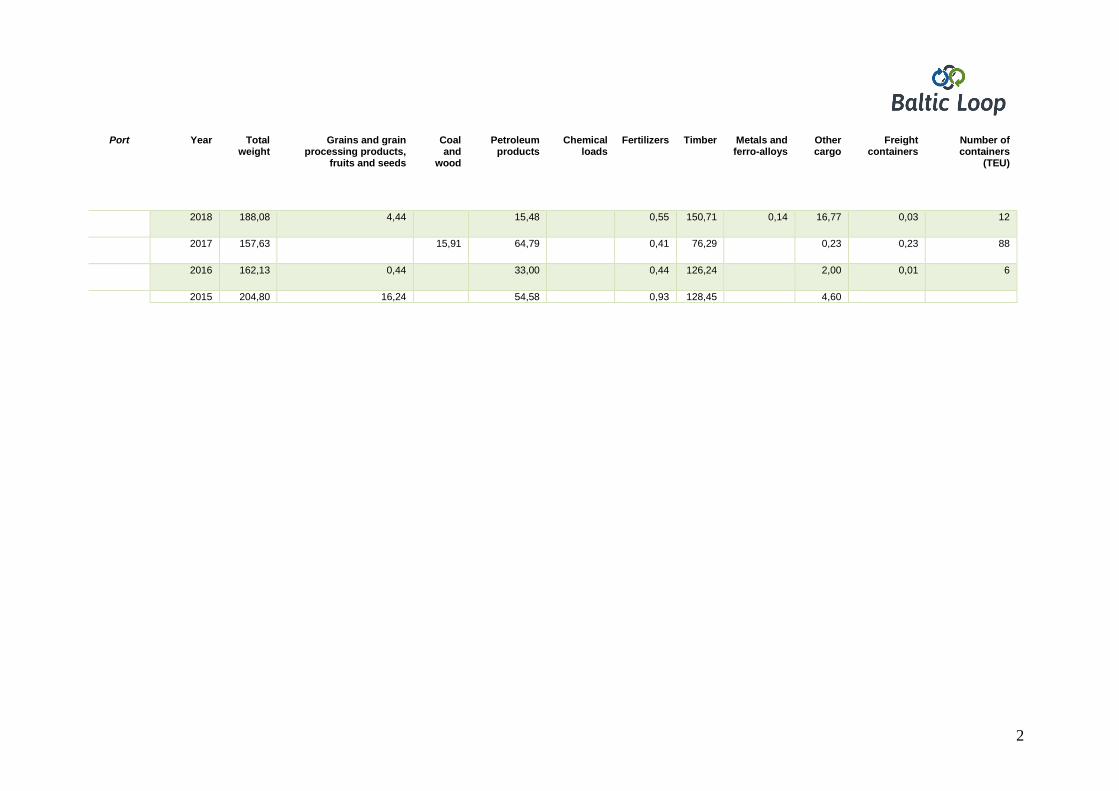
2
Port Year Total weight
Grains and grain processing products,
fruits and seeds
Coal and
wood
Petroleum products
Chemical loads
Fertilizers Timber Metals and ferro-alloys
Other cargo
Freight containers
Number of containers
(TEU)
2018 188,08 4,44 15,48 0,55 150,71 0,14 16,77 0,03 12
2017 157,63 15,91 64,79 0,41 76,29 0,23 0,23 88
2016 162,13 0,44 33,00 0,44 126,24 2,00 0,01 6
2015 204,80 16,24 54,58 0,93 128,45 4,60
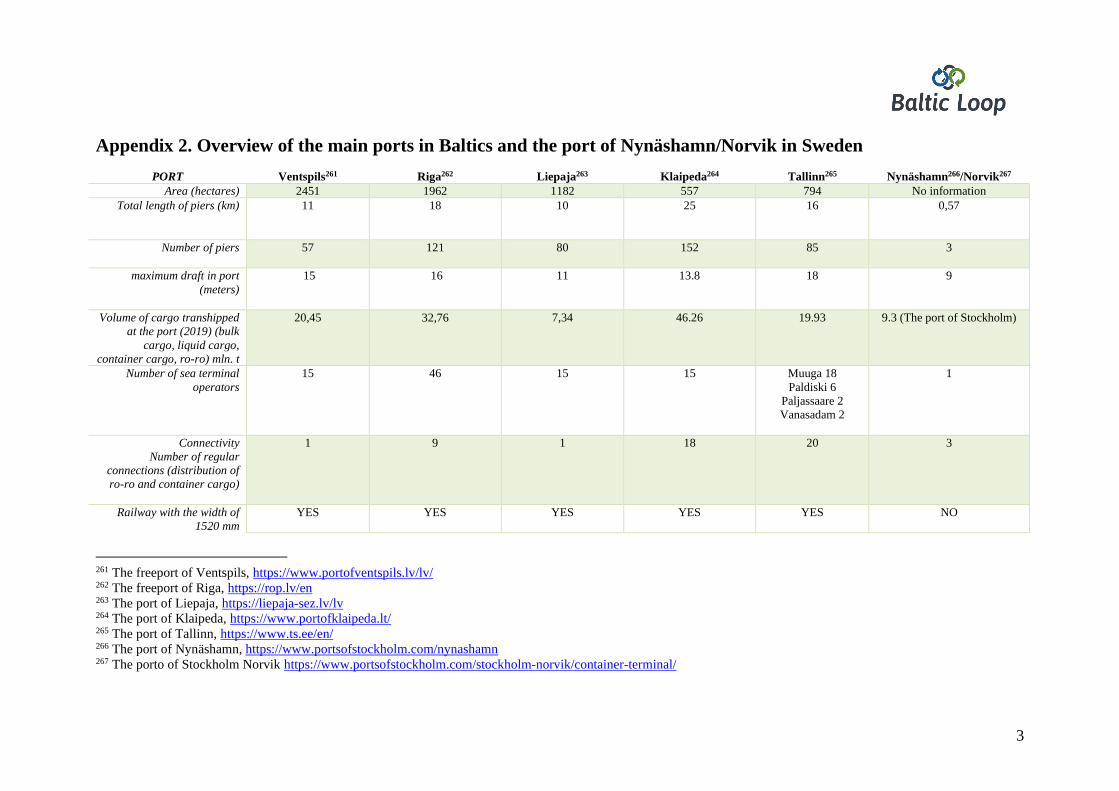
3
Appendix 2. Overview of the main ports in Baltics and the port of Nynäshamn/Norvik in Sweden
PORT Ventspils261 Riga262 Liepaja263 Klaipeda264 Tallinn265 Nynäshamn266/Norvik267
Area (hectares) 2451 1962 1182 557 794 No information
Total length of piers (km) 11 18 10 25 16 0,57
Number of piers 57 121 80 152 85 3
maximum draft in port
(meters)
15 16 11 13.8 18
9
Volume of cargo transhipped
at the port (2019) (bulk
cargo, liquid cargo,
container cargo, ro-ro) mln. t
20,45
32,76
7,34 46.26
19.93 9.3 (The port of Stockholm)
Number of sea terminal
operators
15 46 15 15 Muuga 18
Paldiski 6
Paljassaare 2
Vanasadam 2
1
Connectivity
Number of regular
connections (distribution of
ro-ro and container cargo)
1 9 1 18 20 3
Railway with the width of
1520 mm
YES YES YES YES YES NO
261 The freeport of Ventspils, https://www.portofventspils.lv/lv/ 262 The freeport of Riga, https://rop.lv/en 263 The port of Liepaja, https://liepaja-sez.lv/lv 264 The port of Klaipeda, https://www.portofklaipeda.lt/ 265 The port of Tallinn, https://www.ts.ee/en/ 266 The port of Nynäshamn, https://www.portsofstockholm.com/nynashamn 267 The porto of Stockholm Norvik https://www.portsofstockholm.com/stockholm-norvik/container-terminal/
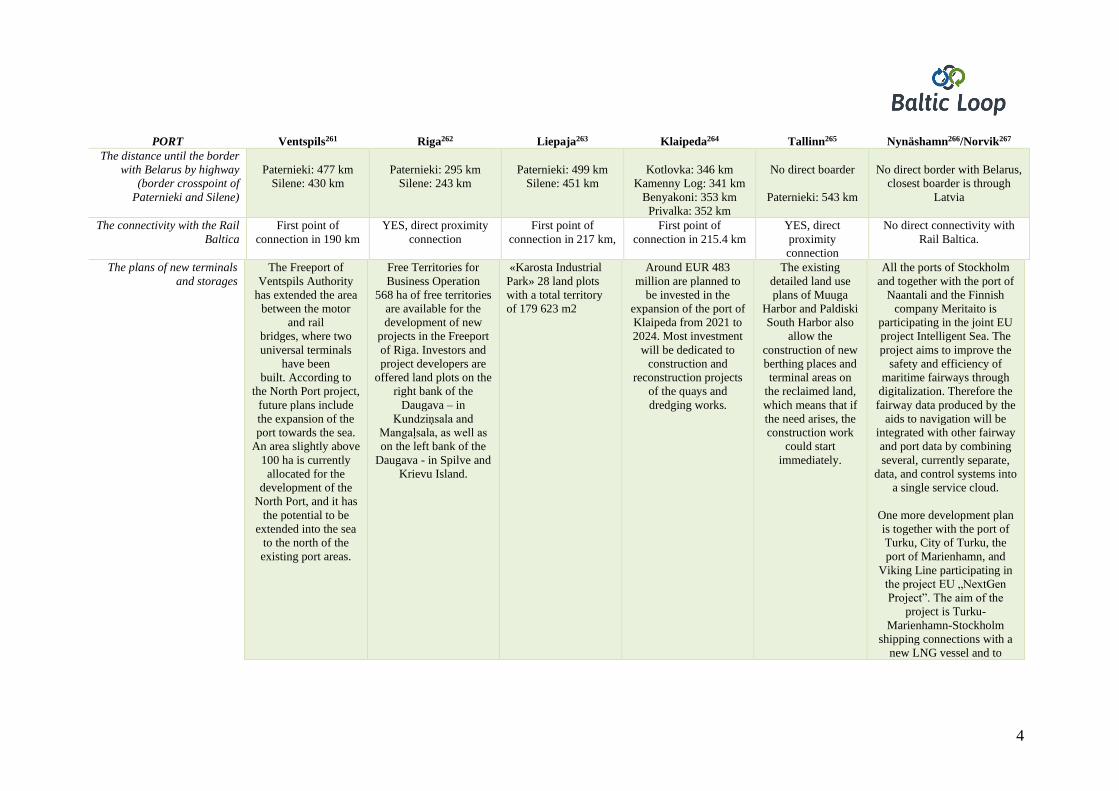
4
PORT Ventspils261 Riga262 Liepaja263 Klaipeda264 Tallinn265 Nynäshamn266/Norvik267
The distance until the border
with Belarus by highway
(border crosspoint of
Paternieki and Silene)
Paternieki: 477 km
Silene: 430 km
Paternieki: 295 km
Silene: 243 km
Paternieki: 499 km
Silene: 451 km
Kotlovka: 346 km
Kamenny Log: 341 km
Benyakoni: 353 km
Privalka: 352 km
No direct boarder
Paternieki: 543 km
No direct border with Belarus,
closest boarder is through
Latvia
The connectivity with the Rail
Baltica
First point of
connection in 190 km
YES, direct proximity
connection
First point of
connection in 217 km,
First point of
connection in 215.4 km
YES, direct
proximity
connection
No direct connectivity with
Rail Baltica.
The plans of new terminals
and storages
The Freeport of
Ventspils Authority
has extended the area
between the motor
and rail
bridges, where two
universal terminals
have been
built. According to
the North Port project,
future plans include
the expansion of the
port towards the sea.
An area slightly above
100 ha is currently
allocated for the
development of the
North Port, and it has
the potential to be
extended into the sea
to the north of the
existing port areas.
Free Territories for
Business Operation
568 ha of free territories
are available for the
development of new
projects in the Freeport
of Riga. Investors and
project developers are
offered land plots on the
right bank of the
Daugava – in
Kundziņsala and
Mangaļsala, as well as
on the left bank of the
Daugava - in Spilve and
Krievu Island.
«Karosta Industrial
Park» 28 land plots
with a total territory
of 179 623 m2
Around EUR 483
million are planned to
be invested in the
expansion of the port of
Klaipeda from 2021 to
2024. Most investment
will be dedicated to
construction and
reconstruction projects
of the quays and
dredging works.
The existing
detailed land use
plans of Muuga
Harbor and Paldiski
South Harbor also
allow the
construction of new
berthing places and
terminal areas on
the reclaimed land,
which means that if
the need arises, the
construction work
could start
immediately.
All the ports of Stockholm
and together with the port of
Naantali and the Finnish
company Meritaito is
participating in the joint EU
project Intelligent Sea. The
project aims to improve the
safety and efficiency of
maritime fairways through
digitalization. Therefore the
fairway data produced by the
aids to navigation will be
integrated with other fairway
and port data by combining
several, currently separate,
data, and control systems into
a single service cloud.
One more development plan
is together with the port of
Turku, City of Turku, the
port of Marienhamn, and
Viking Line participating in
the project EU „NextGen
Project”. The aim of the
project is Turku-
Marienhamn-Stockholm
shipping connections with a
new LNG vessel and to
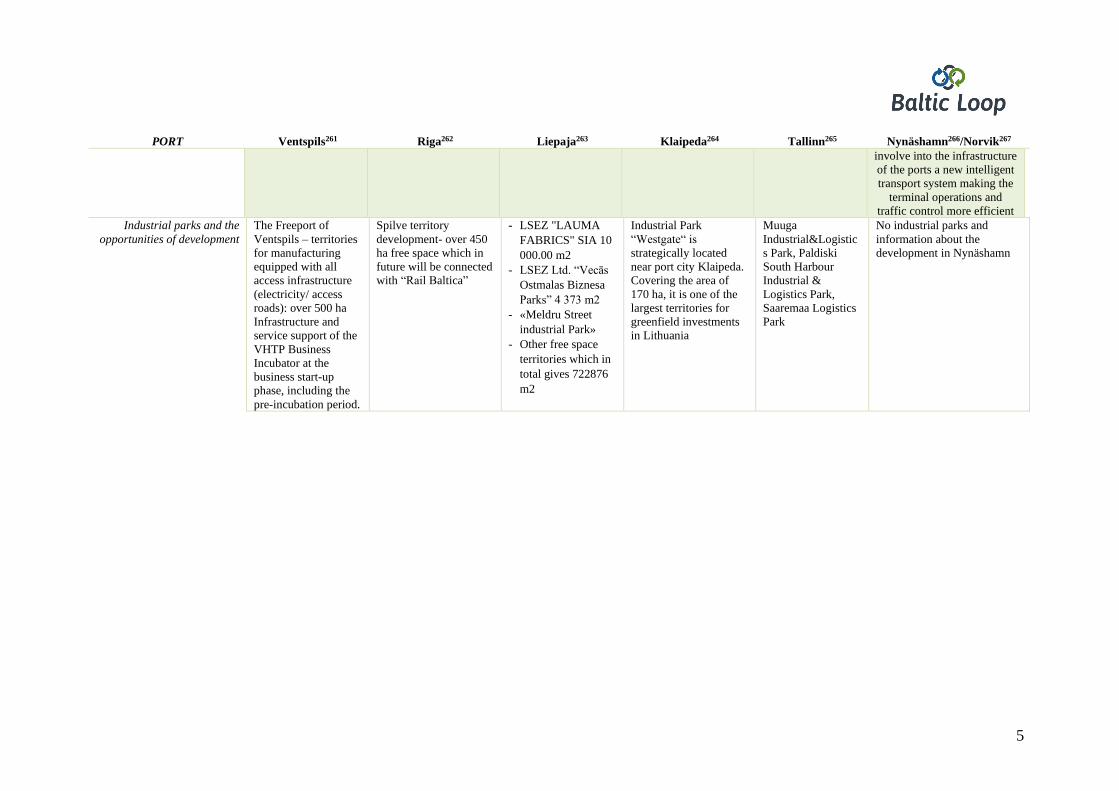
5
PORT Ventspils261 Riga262 Liepaja263 Klaipeda264 Tallinn265 Nynäshamn266/Norvik267
involve into the infrastructure
of the ports a new intelligent
transport system making the
terminal operations and
traffic control more efficient
Industrial parks and the
opportunities of development
The Freeport of
Ventspils – territories
for manufacturing
equipped with all
access infrastructure
(electricity/ access
roads): over 500 ha Infrastructure and
service support of the
VHTP Business
Incubator at the
business start-up
phase, including the
pre-incubation period.
Spilve territory
development- over 450
ha free space which in
future will be connected
with “Rail Baltica”
- LSEZ "LAUMA
FABRICS" SIA 10
000.00 m2
- LSEZ Ltd. “Vecās
Ostmalas Biznesa
Parks” 4 373 m2
- «Meldru Street
industrial Park»
- Other free space
territories which in
total gives 722876
m2
Industrial Park
“Westgate“ is
strategically located
near port city Klaipeda.
Covering the area of
170 ha, it is one of the
largest territories for
greenfield investments
in Lithuania
Muuga
Industrial&Logistic
s Park, Paldiski
South Harbour
Industrial &
Logistics Park,
Saaremaa Logistics
Park
No industrial parks and
information about the
development in Nynäshamn
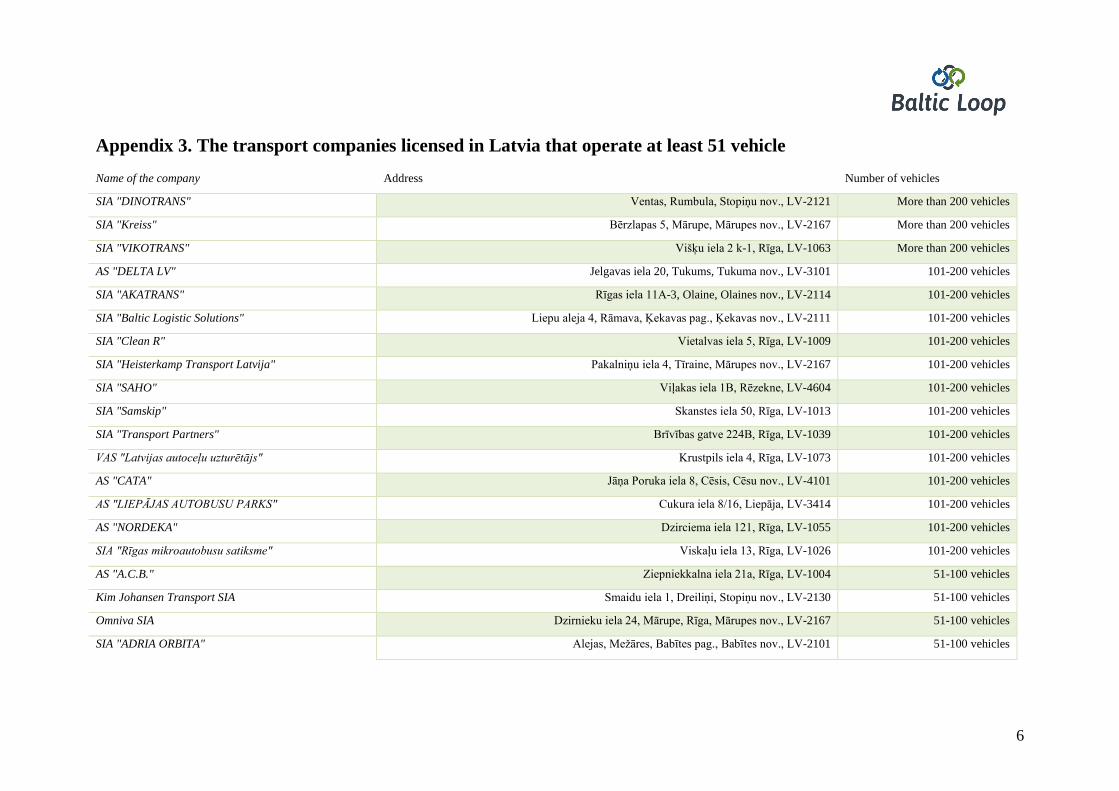
6
Appendix 3. The transport companies licensed in Latvia that operate at least 51 vehicle
Name of the company Address Number of vehicles
SIA "DINOTRANS" Ventas, Rumbula, Stopiņu nov., LV-2121 More than 200 vehicles
SIA "Kreiss" Bērzlapas 5, Mārupe, Mārupes nov., LV-2167 More than 200 vehicles
SIA "VIKOTRANS" Višķu iela 2 k-1, Rīga, LV-1063 More than 200 vehicles
AS "DELTA LV" Jelgavas iela 20, Tukums, Tukuma nov., LV-3101 101-200 vehicles
SIA "AKATRANS" Rīgas iela 11A-3, Olaine, Olaines nov., LV-2114 101-200 vehicles
SIA "Baltic Logistic Solutions" Liepu aleja 4, Rāmava, Ķekavas pag., Ķekavas nov., LV-2111 101-200 vehicles
SIA "Clean R" Vietalvas iela 5, Rīga, LV-1009 101-200 vehicles
SIA "Heisterkamp Transport Latvija" Pakalniņu iela 4, Tīraine, Mārupes nov., LV-2167 101-200 vehicles
SIA "SAHO" Viļakas iela 1B, Rēzekne, LV-4604 101-200 vehicles
SIA "Samskip" Skanstes iela 50, Rīga, LV-1013 101-200 vehicles
SIA "Transport Partners" Brīvības gatve 224B, Rīga, LV-1039 101-200 vehicles
VAS "Latvijas autoceļu uzturētājs" Krustpils iela 4, Rīga, LV-1073 101-200 vehicles
AS "CATA" Jāņa Poruka iela 8, Cēsis, Cēsu nov., LV-4101 101-200 vehicles
AS "LIEPĀJAS AUTOBUSU PARKS" Cukura iela 8/16, Liepāja, LV-3414 101-200 vehicles
AS "NORDEKA" Dzirciema iela 121, Rīga, LV-1055 101-200 vehicles
SIA "Rīgas mikroautobusu satiksme" Viskaļu iela 13, Rīga, LV-1026 101-200 vehicles
AS "A.C.B." Ziepniekkalna iela 21a, Rīga, LV-1004 51-100 vehicles
Kim Johansen Transport SIA Smaidu iela 1, Dreiliņi, Stopiņu nov., LV-2130 51-100 vehicles
Omniva SIA Dzirnieku iela 24, Mārupe, Rīga, Mārupes nov., LV-2167 51-100 vehicles
SIA "ADRIA ORBITA" Alejas, Mežāres, Babītes pag., Babītes nov., LV-2101 51-100 vehicles
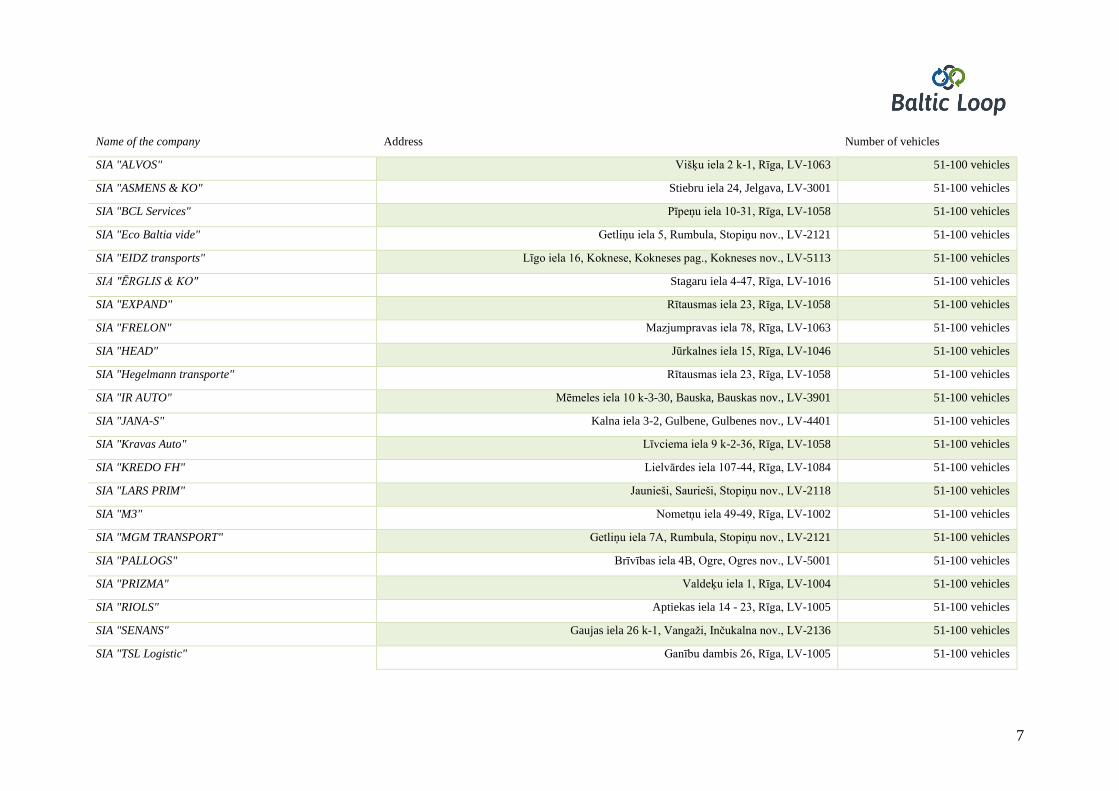
7
Name of the company Address Number of vehicles
SIA "ALVOS" Višķu iela 2 k-1, Rīga, LV-1063 51-100 vehicles
SIA "ASMENS & KO" Stiebru iela 24, Jelgava, LV-3001 51-100 vehicles
SIA "BCL Services" Pīpeņu iela 10-31, Rīga, LV-1058 51-100 vehicles
SIA "Eco Baltia vide" Getliņu iela 5, Rumbula, Stopiņu nov., LV-2121 51-100 vehicles
SIA "EIDZ transports" Līgo iela 16, Koknese, Kokneses pag., Kokneses nov., LV-5113 51-100 vehicles
SIA "ĒRGLIS & KO" Stagaru iela 4-47, Rīga, LV-1016 51-100 vehicles
SIA "EXPAND" Rītausmas iela 23, Rīga, LV-1058 51-100 vehicles
SIA "FRELON" Mazjumpravas iela 78, Rīga, LV-1063 51-100 vehicles
SIA "HEAD" Jūrkalnes iela 15, Rīga, LV-1046 51-100 vehicles
SIA "Hegelmann transporte" Rītausmas iela 23, Rīga, LV-1058 51-100 vehicles
SIA "IR AUTO" Mēmeles iela 10 k-3-30, Bauska, Bauskas nov., LV-3901 51-100 vehicles
SIA "JANA-S" Kalna iela 3-2, Gulbene, Gulbenes nov., LV-4401 51-100 vehicles
SIA "Kravas Auto" Līvciema iela 9 k-2-36, Rīga, LV-1058 51-100 vehicles
SIA "KREDO FH" Lielvārdes iela 107-44, Rīga, LV-1084 51-100 vehicles
SIA "LARS PRIM" Jaunieši, Saurieši, Stopiņu nov., LV-2118 51-100 vehicles
SIA "M3" Nometņu iela 49-49, Rīga, LV-1002 51-100 vehicles
SIA "MGM TRANSPORT" Getliņu iela 7A, Rumbula, Stopiņu nov., LV-2121 51-100 vehicles
SIA "PALLOGS" Brīvības iela 4B, Ogre, Ogres nov., LV-5001 51-100 vehicles
SIA "PRIZMA" Valdeķu iela 1, Rīga, LV-1004 51-100 vehicles
SIA "RIOLS" Aptiekas iela 14 - 23, Rīga, LV-1005 51-100 vehicles
SIA "SENANS" Gaujas iela 26 k-1, Vangaži, Inčukalna nov., LV-2136 51-100 vehicles
SIA "TSL Logistic" Ganību dambis 26, Rīga, LV-1005 51-100 vehicles
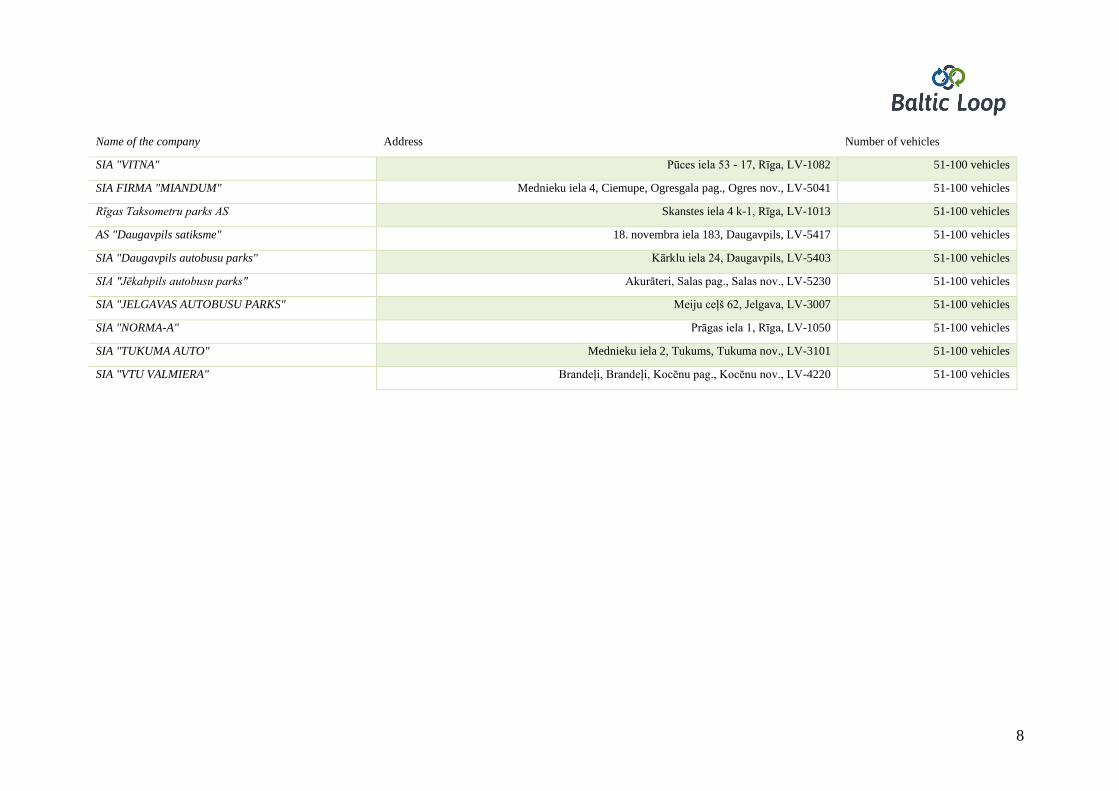
8
Name of the company Address Number of vehicles
SIA "VITNA" Pūces iela 53 - 17, Rīga, LV-1082 51-100 vehicles
SIA FIRMA "MIANDUM" Mednieku iela 4, Ciemupe, Ogresgala pag., Ogres nov., LV-5041 51-100 vehicles
Rīgas Taksometru parks AS Skanstes iela 4 k-1, Rīga, LV-1013 51-100 vehicles
AS "Daugavpils satiksme" 18. novembra iela 183, Daugavpils, LV-5417 51-100 vehicles
SIA "Daugavpils autobusu parks" Kārklu iela 24, Daugavpils, LV-5403 51-100 vehicles
SIA "Jēkabpils autobusu parks" Akurāteri, Salas pag., Salas nov., LV-5230 51-100 vehicles
SIA "JELGAVAS AUTOBUSU PARKS" Meiju ceļš 62, Jelgava, LV-3007 51-100 vehicles
SIA "NORMA-A" Prāgas iela 1, Rīga, LV-1050 51-100 vehicles
SIA "TUKUMA AUTO" Mednieku iela 2, Tukums, Tukuma nov., LV-3101 51-100 vehicles
SIA "VTU VALMIERA" Brandeļi, Brandeļi, Kocēnu pag., Kocēnu nov., LV-4220 51-100 vehicles
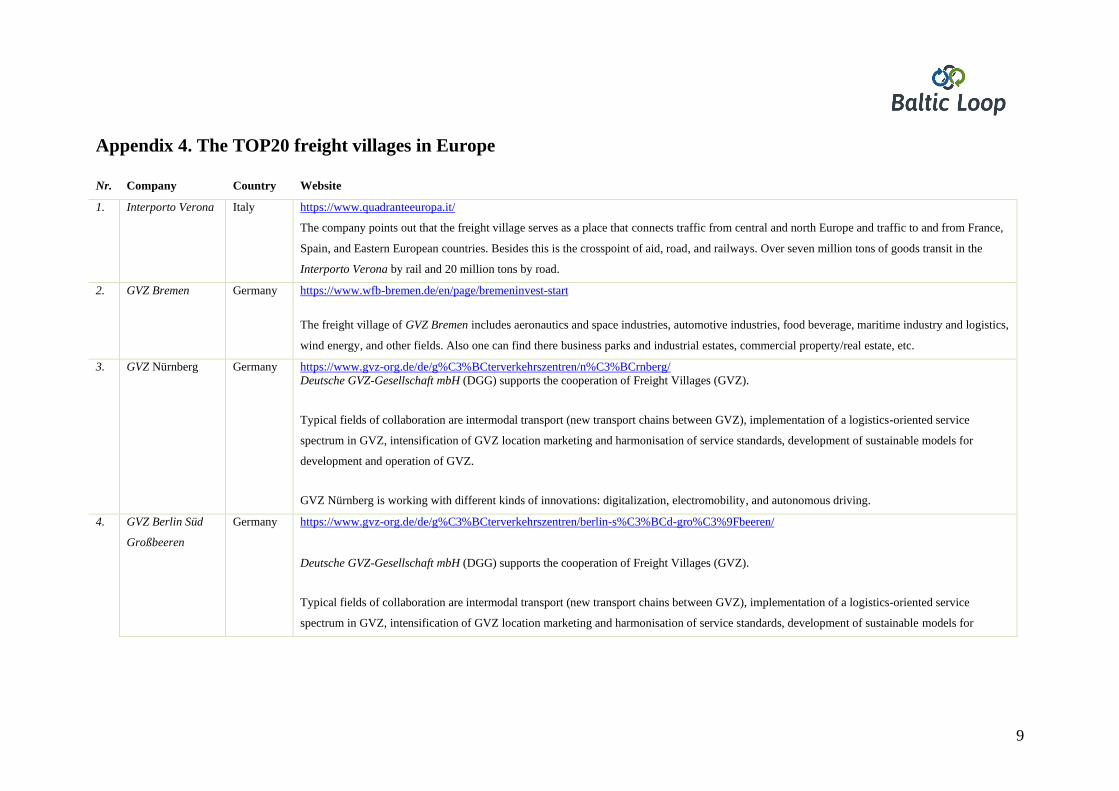
9
Appendix 4. The TOP20 freight villages in Europe
Nr. Company Country Website
1. Interporto Verona Italy https://www.quadranteeuropa.it/
The company points out that the freight village serves as a place that connects traffic from central and north Europe and traffic to and from France,
Spain, and Eastern European countries. Besides this is the crosspoint of aid, road, and railways. Over seven million tons of goods transit in the
Interporto Verona by rail and 20 million tons by road.
2. GVZ Bremen Germany https://www.wfb-bremen.de/en/page/bremeninvest-start
The freight village of GVZ Bremen includes aeronautics and space industries, automotive industries, food beverage, maritime industry and logistics,
wind energy, and other fields. Also one can find there business parks and industrial estates, commercial property/real estate, etc.
3. GVZ Nürnberg Germany https://www.gvz-org.de/de/g%C3%BCterverkehrszentren/n%C3%BCrnberg/
Deutsche GVZ-Gesellschaft mbH (DGG) supports the cooperation of Freight Villages (GVZ).
Typical fields of collaboration are intermodal transport (new transport chains between GVZ), implementation of a logistics-oriented service
spectrum in GVZ, intensification of GVZ location marketing and harmonisation of service standards, development of sustainable models for
development and operation of GVZ.
GVZ Nürnberg is working with different kinds of innovations: digitalization, electromobility, and autonomous driving.
4. GVZ Berlin Süd
Großbeeren
Germany https://www.gvz-org.de/de/g%C3%BCterverkehrszentren/berlin-s%C3%BCd-gro%C3%9Fbeeren/
Deutsche GVZ-Gesellschaft mbH (DGG) supports the cooperation of Freight Villages (GVZ).
Typical fields of collaboration are intermodal transport (new transport chains between GVZ), implementation of a logistics-oriented service
spectrum in GVZ, intensification of GVZ location marketing and harmonisation of service standards, development of sustainable models for
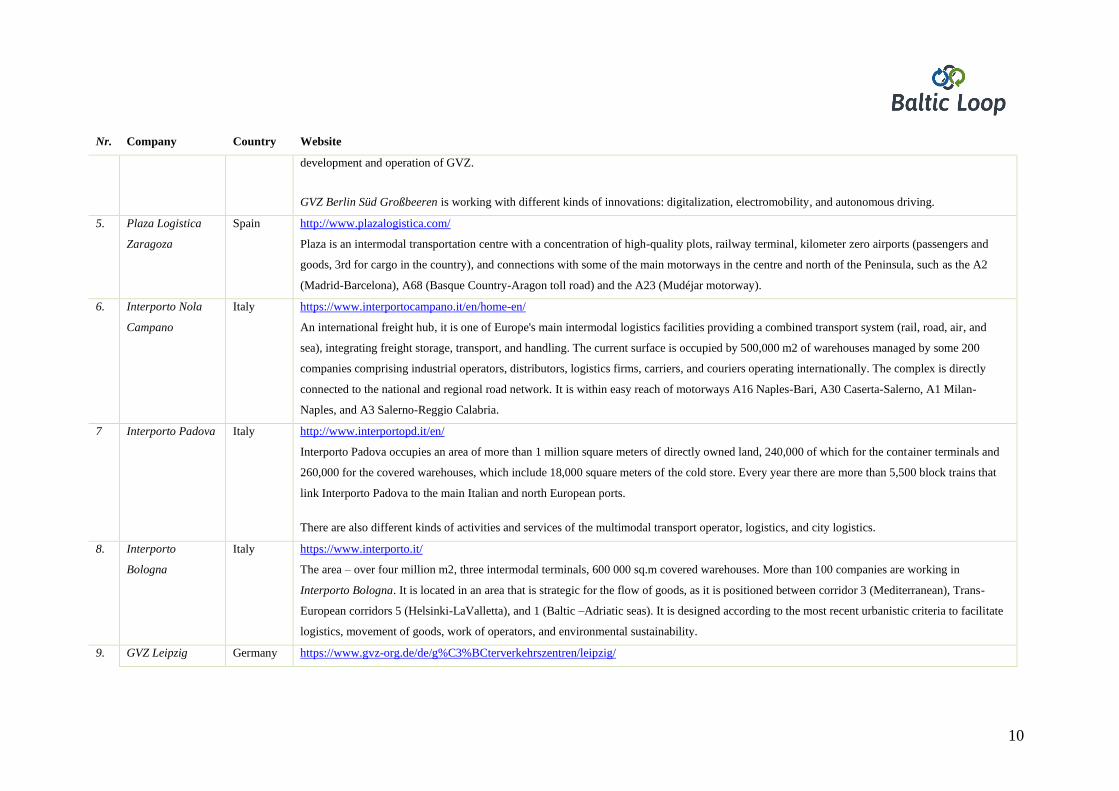
10
Nr. Company Country Website
development and operation of GVZ.
GVZ Berlin Süd Großbeeren is working with different kinds of innovations: digitalization, electromobility, and autonomous driving.
5. Plaza Logistica
Zaragoza
Spain http://www.plazalogistica.com/
Plaza is an intermodal transportation centre with a concentration of high-quality plots, railway terminal, kilometer zero airports (passengers and
goods, 3rd for cargo in the country), and connections with some of the main motorways in the centre and north of the Peninsula, such as the A2
(Madrid-Barcelona), A68 (Basque Country-Aragon toll road) and the A23 (Mudéjar motorway).
6. Interporto Nola
Campano
Italy https://www.interportocampano.it/en/home-en/
An international freight hub, it is one of Europe's main intermodal logistics facilities providing a combined transport system (rail, road, air, and
sea), integrating freight storage, transport, and handling. The current surface is occupied by 500,000 m2 of warehouses managed by some 200
companies comprising industrial operators, distributors, logistics firms, carriers, and couriers operating internationally. The complex is directly
connected to the national and regional road network. It is within easy reach of motorways A16 Naples-Bari, A30 Caserta-Salerno, A1 Milan-
Naples, and A3 Salerno-Reggio Calabria.
7 Interporto Padova Italy http://www.interportopd.it/en/
Interporto Padova occupies an area of more than 1 million square meters of directly owned land, 240,000 of which for the container terminals and
260,000 for the covered warehouses, which include 18,000 square meters of the cold store. Every year there are more than 5,500 block trains that
link Interporto Padova to the main Italian and north European ports.
There are also different kinds of activities and services of the multimodal transport operator, logistics, and city logistics.
8. Interporto
Bologna
Italy https://www.interporto.it/
The area – over four million m2, three intermodal terminals, 600 000 sq.m covered warehouses. More than 100 companies are working in
Interporto Bologna. It is located in an area that is strategic for the flow of goods, as it is positioned between corridor 3 (Mediterranean), Trans-
European corridors 5 (Helsinki-LaValletta), and 1 (Baltic –Adriatic seas). It is designed according to the most recent urbanistic criteria to facilitate
logistics, movement of goods, work of operators, and environmental sustainability.
9. GVZ Leipzig Germany https://www.gvz-org.de/de/g%C3%BCterverkehrszentren/leipzig/
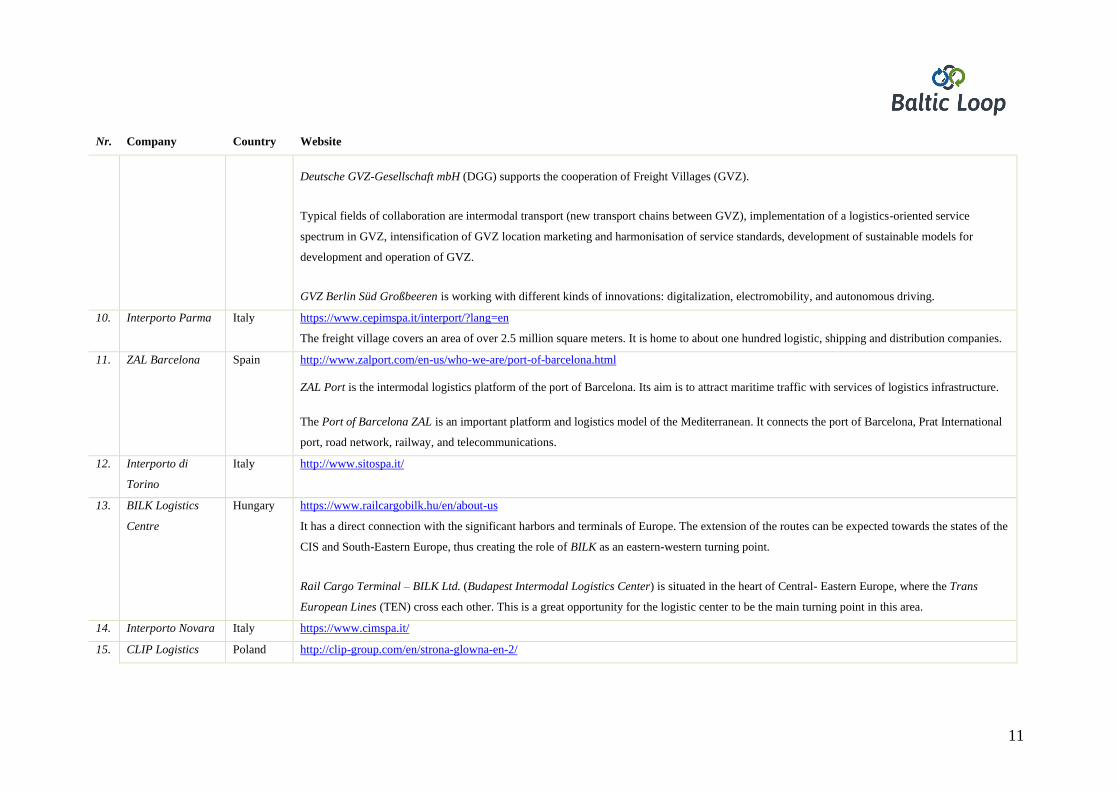
11
Nr. Company Country Website
Deutsche GVZ-Gesellschaft mbH (DGG) supports the cooperation of Freight Villages (GVZ).
Typical fields of collaboration are intermodal transport (new transport chains between GVZ), implementation of a logistics-oriented service
spectrum in GVZ, intensification of GVZ location marketing and harmonisation of service standards, development of sustainable models for
development and operation of GVZ.
GVZ Berlin Süd Großbeeren is working with different kinds of innovations: digitalization, electromobility, and autonomous driving.
10. Interporto Parma Italy https://www.cepimspa.it/interport/?lang=en
The freight village covers an area of over 2.5 million square meters. It is home to about one hundred logistic, shipping and distribution companies.
11. ZAL Barcelona Spain http://www.zalport.com/en-us/who-we-are/port-of-barcelona.html
ZAL Port is the intermodal logistics platform of the port of Barcelona. Its aim is to attract maritime traffic with services of logistics infrastructure.
The Port of Barcelona ZAL is an important platform and logistics model of the Mediterranean. It connects the port of Barcelona, Prat International
port, road network, railway, and telecommunications.
12. Interporto di
Torino
Italy http://www.sitospa.it/
13. BILK Logistics
Centre
Hungary https://www.railcargobilk.hu/en/about-us
It has a direct connection with the significant harbors and terminals of Europe. The extension of the routes can be expected towards the states of the
CIS and South-Eastern Europe, thus creating the role of BILK as an eastern-western turning point.
Rail Cargo Terminal – BILK Ltd. (Budapest Intermodal Logistics Center) is situated in the heart of Central- Eastern Europe, where the Trans
European Lines (TEN) cross each other. This is a great opportunity for the logistic center to be the main turning point in this area.
14. Interporto Novara Italy https://www.cimspa.it/
15. CLIP Logistics Poland http://clip-group.com/en/strona-glowna-en-2/
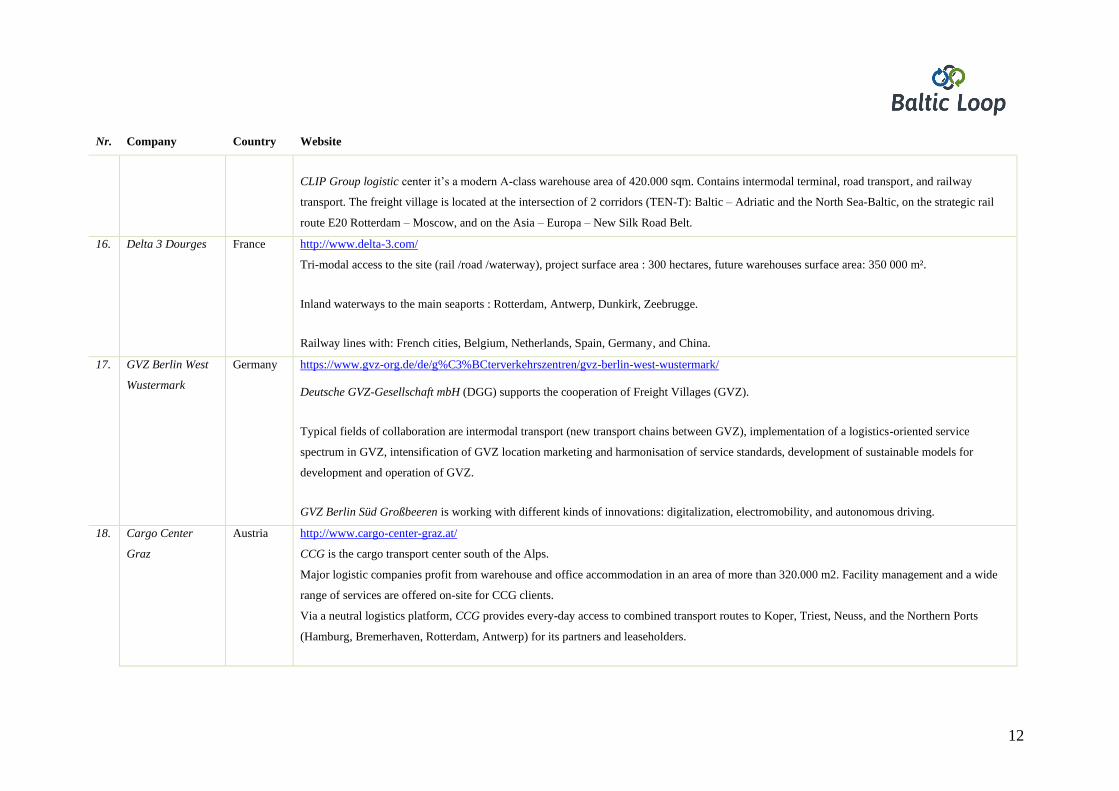
12
Nr. Company Country Website
CLIP Group logistic center it’s a modern A-class warehouse area of 420.000 sqm. Contains intermodal terminal, road transport, and railway
transport. The freight village is located at the intersection of 2 corridors (TEN-T): Baltic – Adriatic and the North Sea-Baltic, on the strategic rail
route E20 Rotterdam – Moscow, and on the Asia – Europa – New Silk Road Belt.
16. Delta 3 Dourges France http://www.delta-3.com/
Tri-modal access to the site (rail /road /waterway), project surface area : 300 hectares, future warehouses surface area: 350 000 m².
Inland waterways to the main seaports : Rotterdam, Antwerp, Dunkirk, Zeebrugge.
Railway lines with: French cities, Belgium, Netherlands, Spain, Germany, and China.
17. GVZ Berlin West
Wustermark
Germany https://www.gvz-org.de/de/g%C3%BCterverkehrszentren/gvz-berlin-west-wustermark/
Deutsche GVZ-Gesellschaft mbH (DGG) supports the cooperation of Freight Villages (GVZ).
Typical fields of collaboration are intermodal transport (new transport chains between GVZ), implementation of a logistics-oriented service
spectrum in GVZ, intensification of GVZ location marketing and harmonisation of service standards, development of sustainable models for
development and operation of GVZ.
GVZ Berlin Süd Großbeeren is working with different kinds of innovations: digitalization, electromobility, and autonomous driving.
18. Cargo Center
Graz
Austria http://www.cargo-center-graz.at/
CCG is the cargo transport center south of the Alps.
Major logistic companies profit from warehouse and office accommodation in an area of more than 320.000 m2. Facility management and a wide
range of services are offered on-site for CCG clients.
Via a neutral logistics platform, CCG provides every-day access to combined transport routes to Koper, Triest, Neuss, and the Northern Ports
(Hamburg, Bremerhaven, Rotterdam, Antwerp) for its partners and leaseholders.
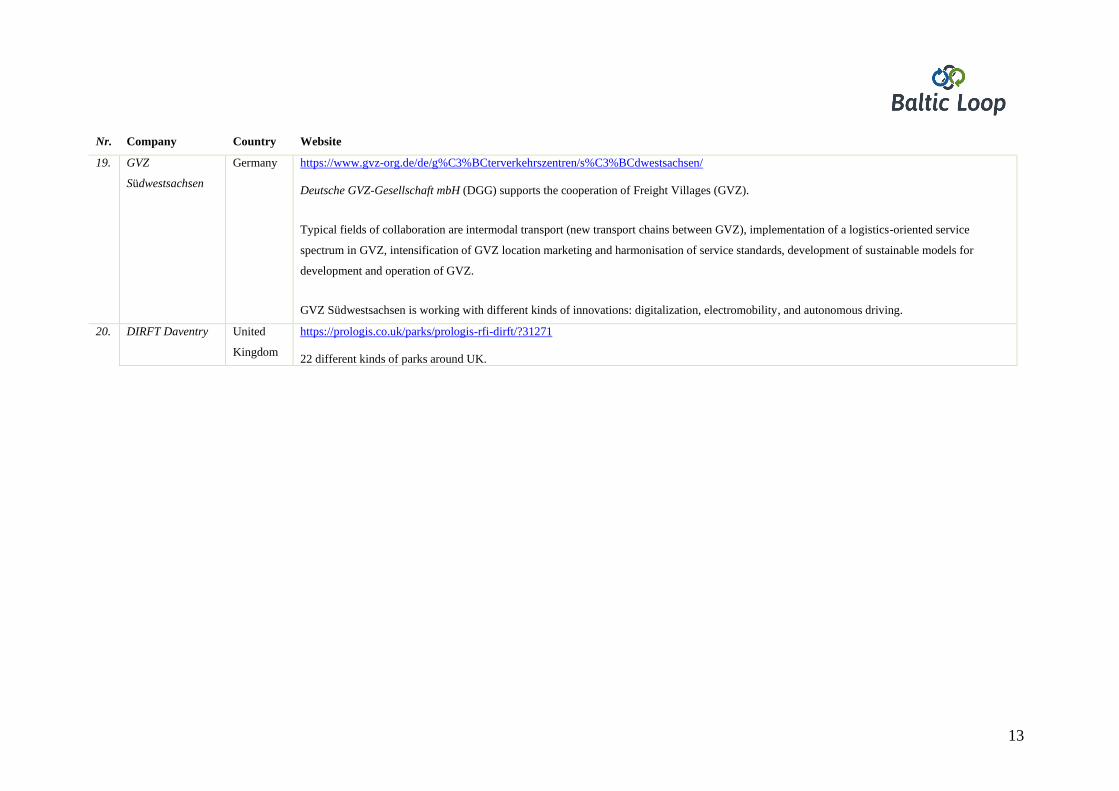
13
Nr. Company Country Website
19. GVZ
Südwestsachsen
Germany https://www.gvz-org.de/de/g%C3%BCterverkehrszentren/s%C3%BCdwestsachsen/
Deutsche GVZ-Gesellschaft mbH (DGG) supports the cooperation of Freight Villages (GVZ).
Typical fields of collaboration are intermodal transport (new transport chains between GVZ), implementation of a logistics-oriented service
spectrum in GVZ, intensification of GVZ location marketing and harmonisation of service standards, development of sustainable models for
development and operation of GVZ.
GVZ Südwestsachsen is working with different kinds of innovations: digitalization, electromobility, and autonomous driving.
20. DIRFT Daventry United
Kingdom
https://prologis.co.uk/parks/prologis-rfi-dirft/?31271
22 different kinds of parks around UK.
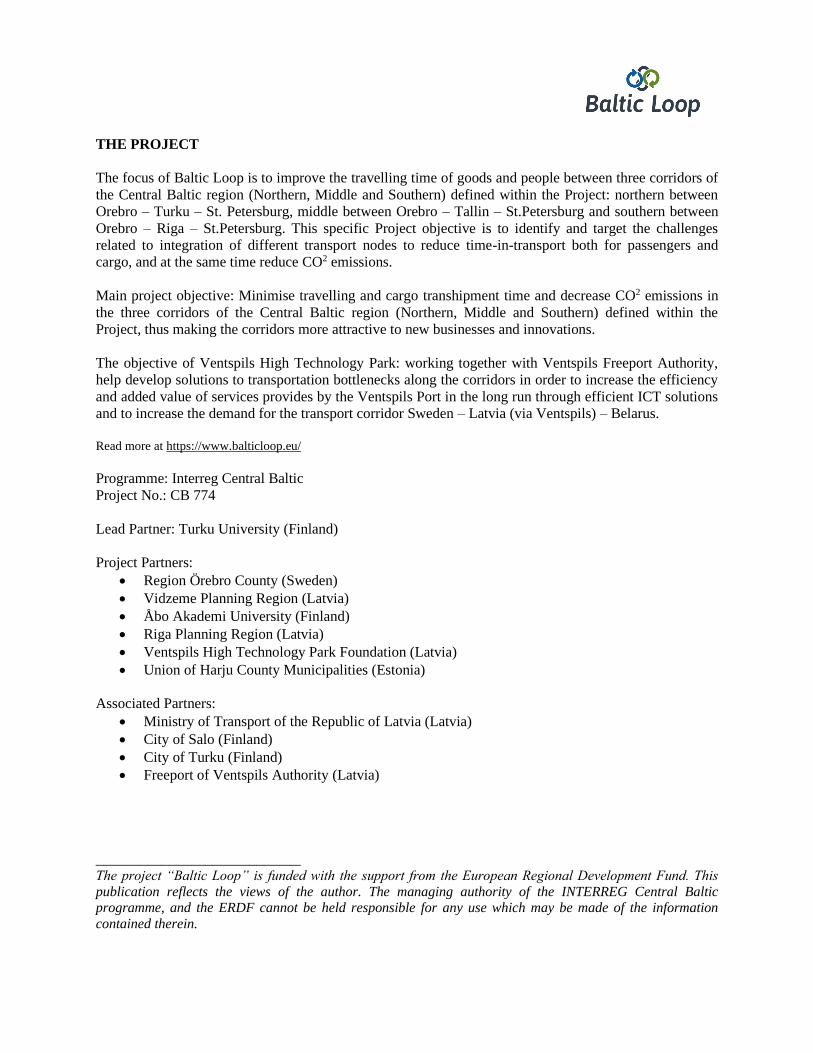
THE PROJECT
The focus of Baltic Loop is to improve the travelling time of goods and people between three corridors of
the Central Baltic region (Northern, Middle and Southern) defined within the Project: northern between
Orebro – Turku – St. Petersburg, middle between Orebro – Tallin – St.Petersburg and southern between
Orebro – Riga – St.Petersburg. This specific Project objective is to identify and target the challenges
related to integration of different transport nodes to reduce time-in-transport both for passengers and
cargo, and at the same time reduce CO2 emissions.
Main project objective: Minimise travelling and cargo transhipment time and decrease CO2 emissions in
the three corridors of the Central Baltic region (Northern, Middle and Southern) defined within the
Project, thus making the corridors more attractive to new businesses and innovations.
The objective of Ventspils High Technology Park: working together with Ventspils Freeport Authority,
help develop solutions to transportation bottlenecks along the corridors in order to increase the efficiency
and added value of services provides by the Ventspils Port in the long run through efficient ICT solutions
and to increase the demand for the transport corridor Sweden – Latvia (via Ventspils) – Belarus.
Read more at https://www.balticloop.eu/
Programme: Interreg Central Baltic
Project No.: CB 774
Lead Partner: Turku University (Finland)
Project Partners:
• Region Örebro County (Sweden)
• Vidzeme Planning Region (Latvia)
• Åbo Akademi University (Finland)
• Riga Planning Region (Latvia)
• Ventspils High Technology Park Foundation (Latvia)
• Union of Harju County Municipalities (Estonia)
Associated Partners:
• Ministry of Transport of the Republic of Latvia (Latvia)
• City of Salo (Finland)
• City of Turku (Finland)
• Freeport of Ventspils Authority (Latvia)
____________________________ The project “Baltic Loop” is funded with the support from the European Regional Development Fund. This
publication reflects the views of the author. The managing authority of the INTERREG Central Baltic programme, and the ERDF cannot be held responsible for any use which may be made of the information
contained therein.
Related Documents