Copyright © 2007 by The McGraw-Hill Companies, Inc. All rights reserve 3-1 Balanza de Pagos del Perú (Metodología del FMI y Estadísticas del BCRP) Curso: Finanzas Internacionales (Cuentas principales de la BP según BCRP): • I. Balanza en Cuenta Corriente • II. Cuenta Financiera • III. Financiamiento Excepcional • IV. Errores y Omisiones Netos • V. Flujo de Reservas Netas del BCRP

Welcome message from author
This document is posted to help you gain knowledge. Please leave a comment to let me know what you think about it! Share it to your friends and learn new things together.
Transcript
Copyright © 2007 by The McGraw-Hill Companies, Inc. All rights reserved. 3-1
Balanza de Pagos del Perú (Metodología del FMI y Estadísticas del BCRP)
Curso: Finanzas Internacionales(Cuentas principales de la BP según BCRP):•I. Balanza en Cuenta Corriente•II. Cuenta Financiera•III. Financiamiento Excepcional•IV. Errores y Omisiones Netos•V. Flujo de Reservas Netas del BCRP
Copyright © 2003 by The McGraw-Hill Companies, Inc. All rights reserved. 3-2
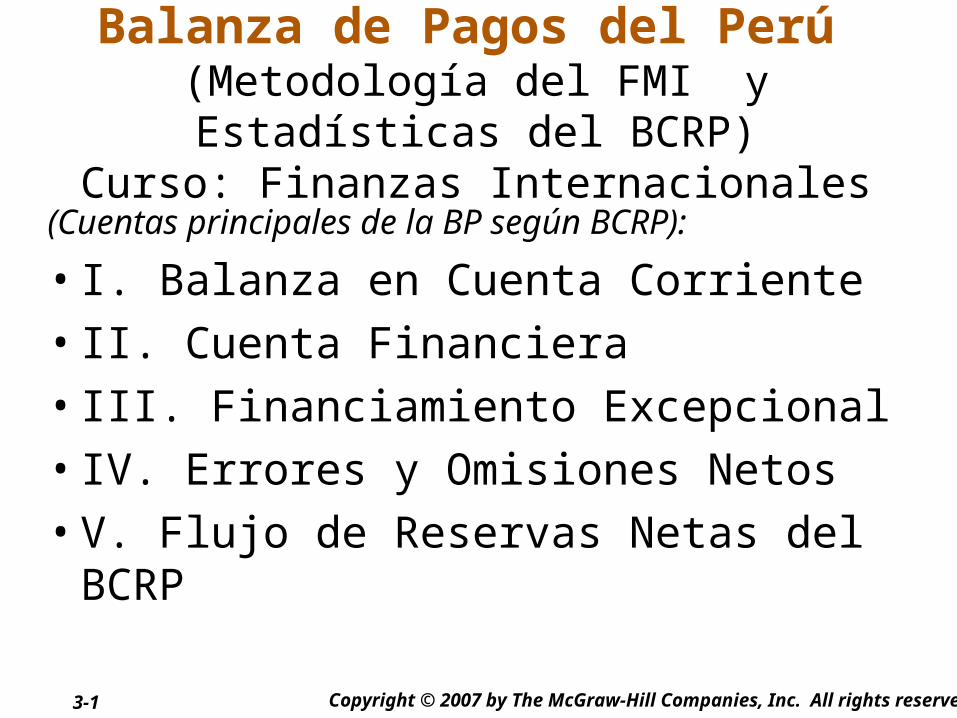
BALANZA DE PAGOS DEL PERÚBALANZA DE CUENTA CORRIENTE(Millones de U.S. dólares)
2002 2003 2004 2005
I. BALANZA EN CUENTA CORRIENTE - 1 094 - 930 60 1 159
1. Balanza comercial 321 886 3 004 5 286 a. Exportaciones de
Bienes (FOB) 7
714 9
091 12 809
17 368
b. Importaciones de Bienes (FOB)
- 7 393
- 8 205
- 9 805
- 12 082
2. Servicios-
994 -
900 - 732- -834
a. Exportaciones 1 455
1 716 1 993 2 289
b. Importaciones - 2 449
- 2 616
- 2 725
- 3 123
3. Renta de factores- 1 440
- 2 125
- 3 645
- 5 065
a. Privado - 751
- 1 301
- 2 758
- 4 238
b. Público - 690
- 825
- -888
- -827
4. Transferencias corrientes 1
019 1
209 1 433 1 772 De las que: Remesas del
exterior 705 869 1 133 1 440
Fuente: BCRP
Copyright © 2007 by The McGraw-Hill Companies, Inc. All rights reserved. 3-3
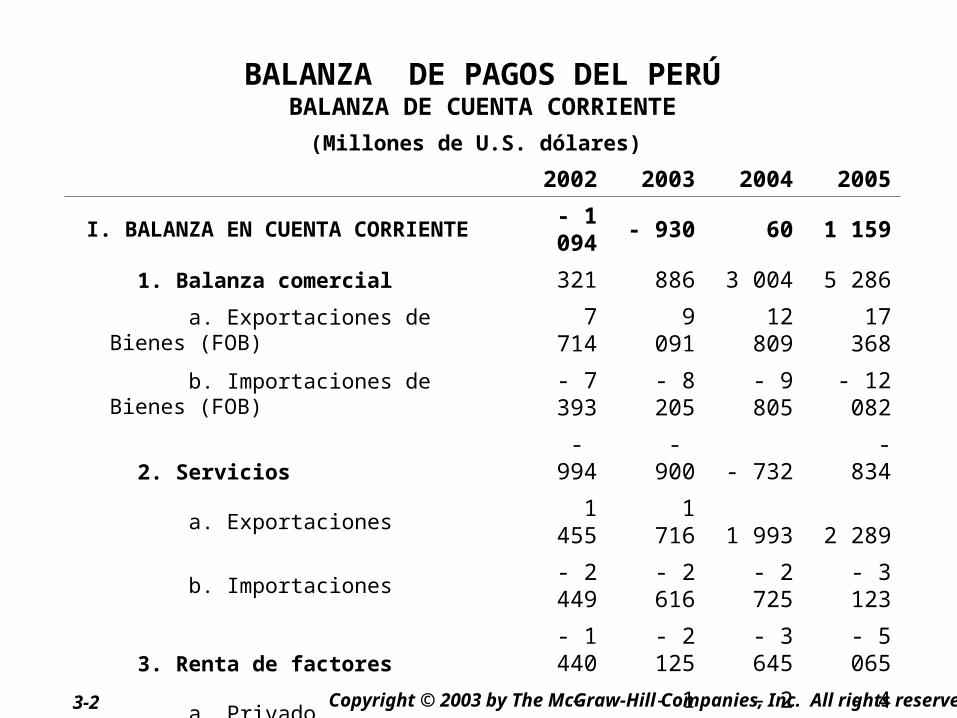
BALANZA DE PAGOS DEL PERÚ(Continuación)
(Millones de U.S. dólares)
2002 2003 2004 2005
II. CUENTA FINANCIERA 2 055 636 2091 211
1. Sector Privado 2 369 301 983 896
2. Sector Público 480 187 879 - 449 3. Capitales de corto
plazo - 794 147 230 -236
III. FINANCIAMIENTO EXCEPCIONAL 14 64 26 100
IV. ERRORES Y OMISIONES NETOS - 142 707 174 158V. FLUJO DE RESERVAS NETAS DEL
BCRP. (V = I + II + III + IV) 833 477 2 351 1 628
Fuente: BCRP
Copyright © 2003 by The McGraw-Hill Companies, Inc. All rights reserved. 3-4
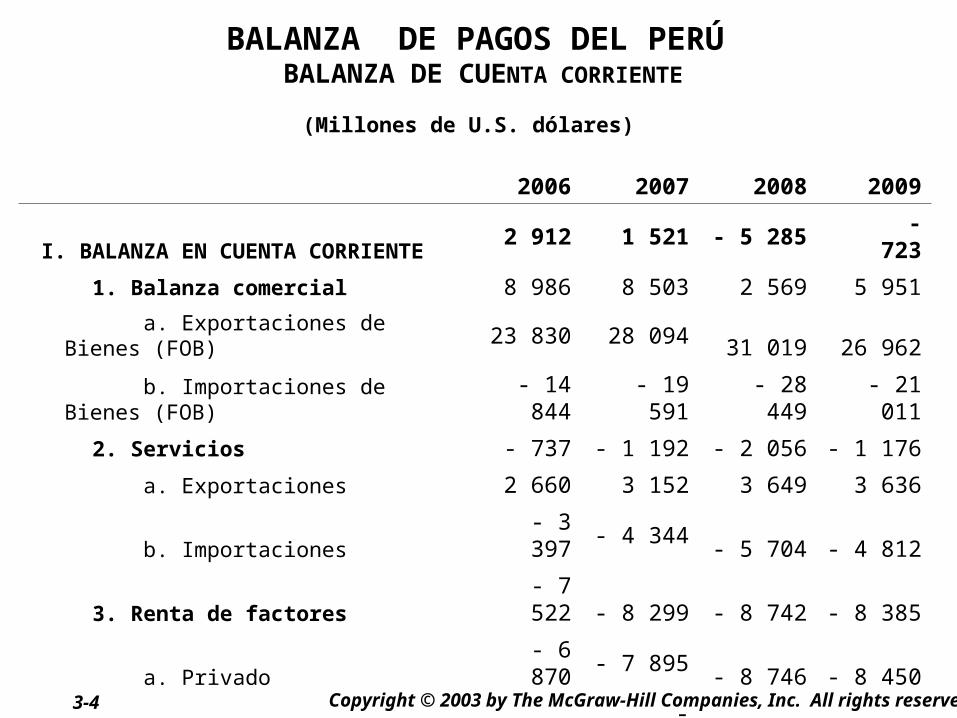
BALANZA DE PAGOS DEL PERÚ BALANZA DE CUENTA CORRIENTE
(Millones de U.S. dólares)
2006 2007 2008 2009
I. BALANZA EN CUENTA CORRIENTE 2 912 1 521 - 5 285 - - 723
1. Balanza comercial 8 986 8 503 2 569 5 951 a. Exportaciones de
Bienes (FOB) 23 830 28 094 31 019 26 962 b. Importaciones de
Bienes (FOB)- 14 844
- 19 591
- 28 449
- 21 011
2. Servicios - 737 - 1 192 - 2 056 - 1 176 a. Exportaciones 2 660 3 152 3 649 3 636
b. Importaciones- 3 397 - 4 344 - 5 704 - 4 812
3. Renta de factores- 7 522 - 8 299 - 8 742 - 8 385
a. Privado- 6 870 - 7 895 - 8 746 - 8 450
b. Público - 652 - - 403 4 65
4. Transferencias corrientes 2 185 2 508 2 943 2 887 De las que: Remesas del
exterior 1 837 2 131 2 444 2 409
Fuente: BCRP
Copyright © 2007 by The McGraw-Hill Companies, Inc. All rights reserved. 3-5
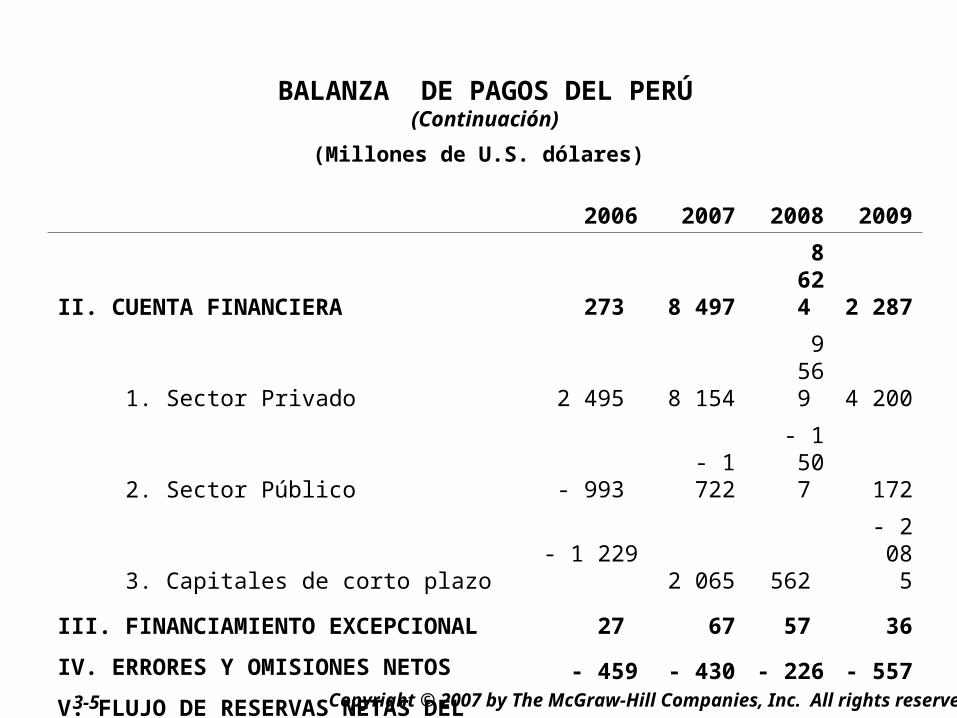
BALANZA DE PAGOS DEL PERÚ(Continuación)
(Millones de U.S. dólares)
2006 2007 2008 2009
II. CUENTA FINANCIERA 273 8 497
8 624 2 287
1. Sector Privado 2 495 8 154
9 569 4 200
2. Sector Público - 993 - 1 722
- 1 507 172
3. Capitales de corto plazo- 1 229
2 065 562
- 2 085
III. FINANCIAMIENTO EXCEPCIONAL 27 67 57 36IV. ERRORES Y OMISIONES NETOS - 459 - 430 - 226 - 557V. FLUJO DE RESERVAS NETAS DEL
BCRP. (V = I + II + III + IV) 2 753 9 654 3 169 1 043
Fuente: BCRP
Copyright © 2007 by The McGraw-Hill Companies, Inc. All rights reserved. 3-6
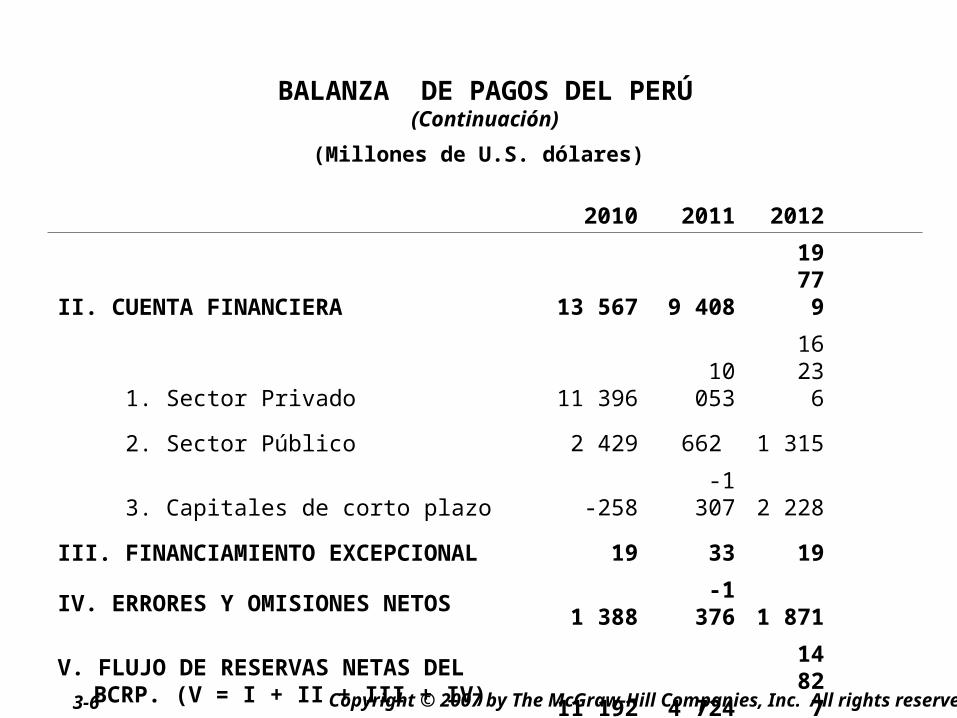
BALANZA DE PAGOS DEL PERÚ(Continuación)
(Millones de U.S. dólares)
2010 2011 2012
II. CUENTA FINANCIERA 13 567 9 408
19 779
1. Sector Privado 11 39610 053
16 236
2. Sector Público 2 429 662 1 315
3. Capitales de corto plazo -258-1 307 2 228
III. FINANCIAMIENTO EXCEPCIONAL 19 33 19
IV. ERRORES Y OMISIONES NETOS 1 388-1 376 1 871
V. FLUJO DE RESERVAS NETAS DEL BCRP. (V = I + II + III + IV) 11 192 4 724
14 827
Fuente: BCRP
Copyright © 2003 by The McGraw-Hill Companies, Inc. All rights reserved. 3-7
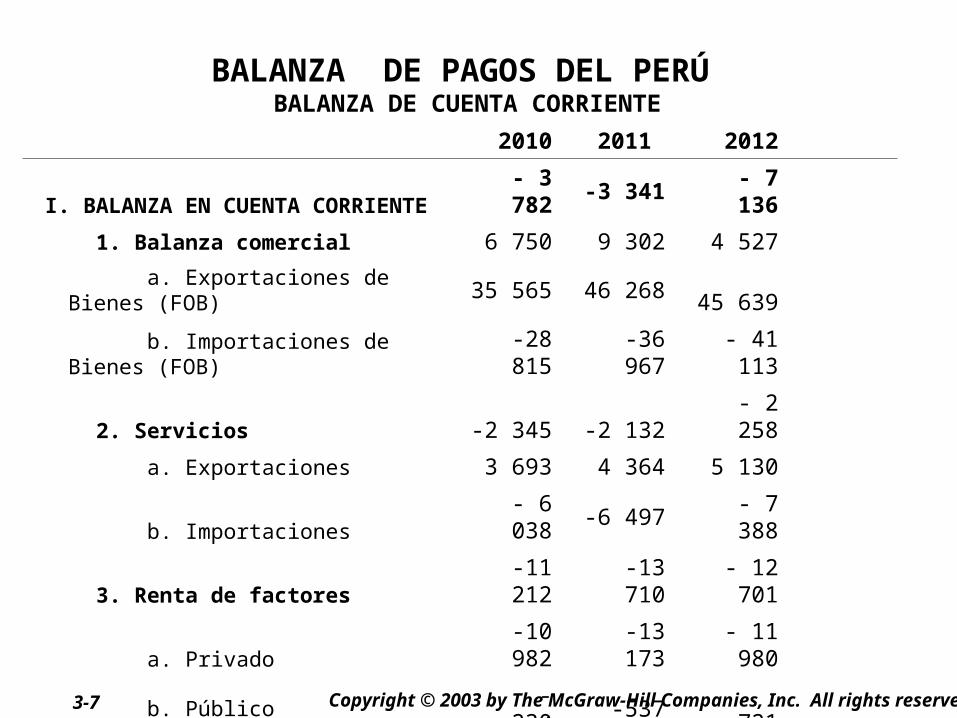
BALANZA DE PAGOS DEL PERÚ BALANZA DE CUENTA CORRIENTE
2010 2011 2012
I. BALANZA EN CUENTA CORRIENTE- 3 782 -3 341 - 7
136 1. Balanza comercial 6 750 9 302 4 527 a. Exportaciones de
Bienes (FOB) 35 565 46 268 45 639 b. Importaciones de
Bienes (FOB)-28 815
-36 967
- 41 113
2. Servicios -2 345 -2 132- 2 258
a. Exportaciones 3 693 4 364 5 130
b. Importaciones- 6 038 -6 497 - 7
388
3. Renta de factores-11 212
-13 710
- 12 701
a. Privado-10 982
-13 173
- 11 980
b. Público - -230 - -537 - -721
4. Transferencias corrientes 3 026 3 200 3 296 De las que: Remesas del
exterior 2 534 2 697 2 788
Fuente: BCRP
Copyright © 2007 by The McGraw-Hill Companies, Inc. All rights reserved. 3-8
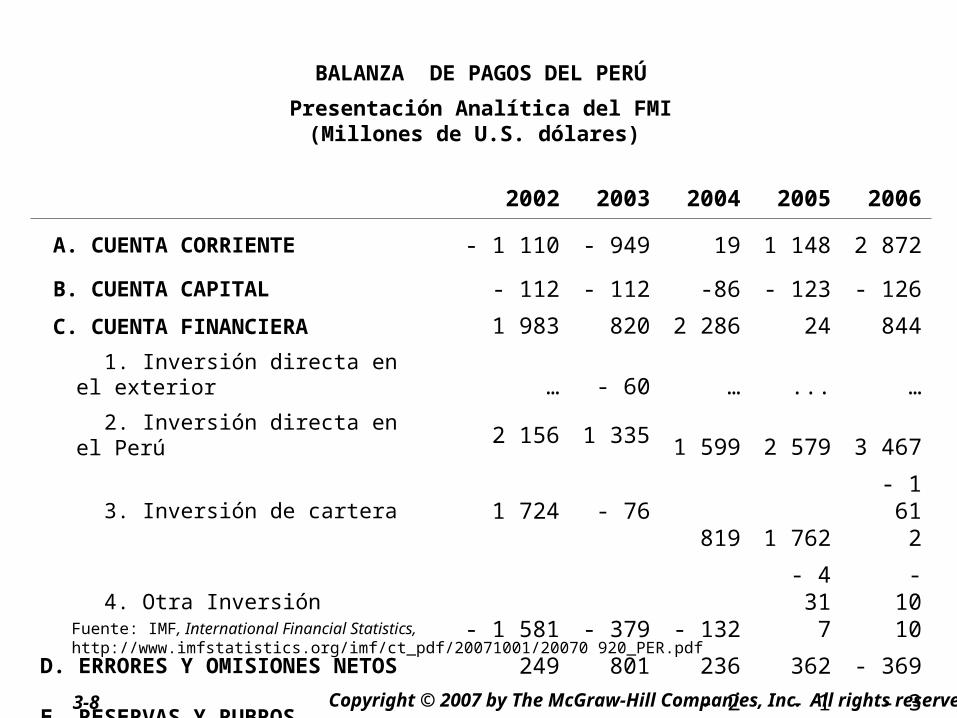
BALANZA DE PAGOS DEL PERÚPresentación Analítica del FMI(Millones de U.S. dólares)
2002 2003 2004 2005 2006
A. CUENTA CORRIENTE - 1 110 - 949 19 1 148 2 872 B. CUENTA CAPITAL - 112 - 112 -86 - 123 - 126 C. CUENTA FINANCIERA 1 983 820 2 286 24 844 1. Inversión directa en
el exterior … - 60 … ... … 2. Inversión directa en
el Perú 2 156 1 335 1 599 2 579 3 467
3. Inversión de cartera 1 724 - 76819 1 762
- 1 612
4. Otra Inversión- 1 581 - 379 - 132
- 4 317
- 1010
D. ERRORES Y OMISIONES NETOS 249 801 236 362 - 369
E. RESERVAS Y RUBROS RELACIONADOS - 1 010 - 561
- 2 456
- 1 411
- 3 221
Fuente: IMF, International Financial Statistics, http://www.imfstatistics.org/imf/ct_pdf/20071001/20070 920_PER.pdf
Copyright © 2007 by The McGraw-Hill Companies, Inc. All rights reserved. 3-9
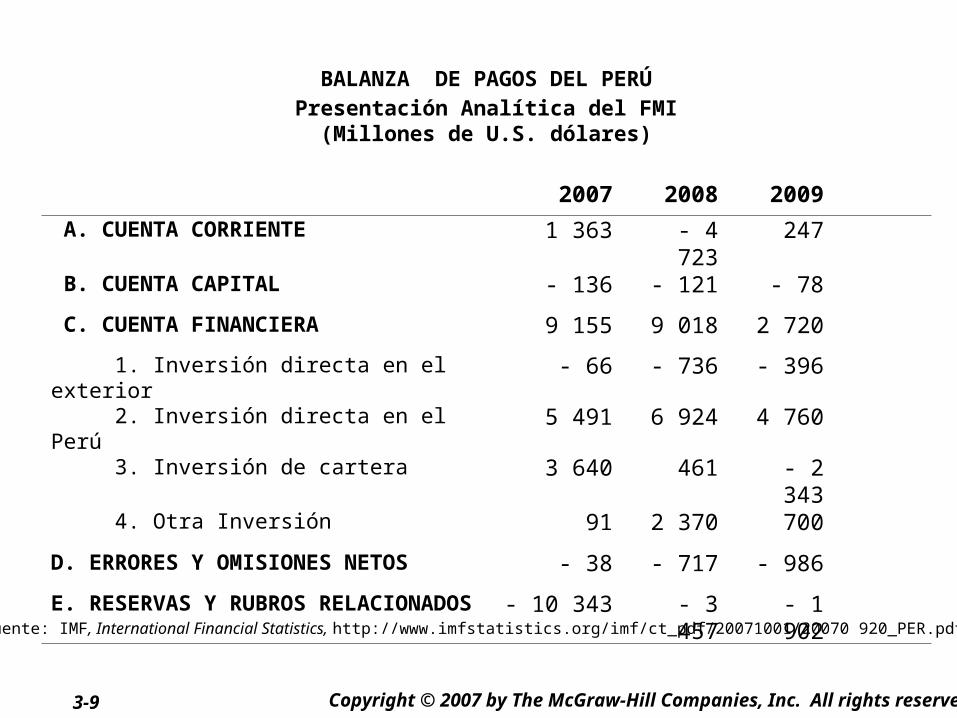
BALANZA DE PAGOS DEL PERÚPresentación Analítica del FMI
(Millones de U.S. dólares)
2007 2008 2009 A. CUENTA CORRIENTE 1 363 - 4
723247
B. CUENTA CAPITAL - 136 - 121 - 78 C. CUENTA FINANCIERA 9 155 9 018 2 720 1. Inversión directa en el exterior
- 66 - 736 - 396
2. Inversión directa en el Perú
5 491 6 924 4 760
3. Inversión de cartera 3 640 461 - 2 343
4. Otra Inversión 91 2 370 700D. ERRORES Y OMISIONES NETOS - 38 - 717 - 986E. RESERVAS Y RUBROS RELACIONADOS - 10 343 - 3
457- 1 902Fuente: IMF, International Financial Statistics, http://www.imfstatistics.org/imf/ct_pdf/20071001/20070 920_PER.pdf
Copyright © 2007 by The McGraw-Hill Companies, Inc. All rights reserved. 3-10
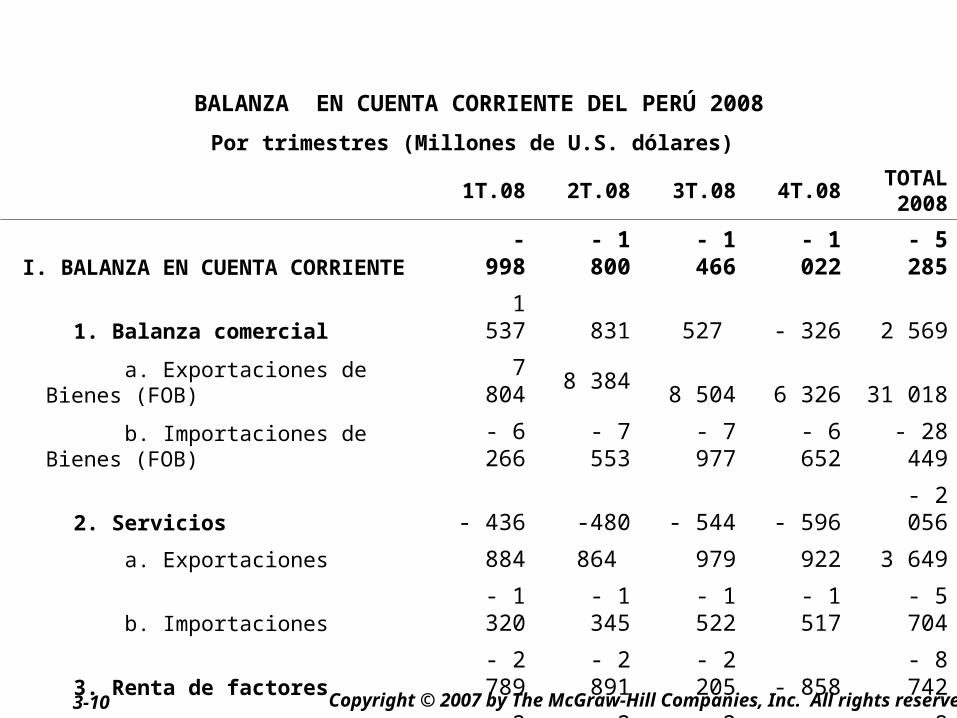
BALANZA EN CUENTA CORRIENTE DEL PERÚ 2008Por trimestres (Millones de U.S. dólares)
1T.08 2T.08 3T.08 4T.08 TOTAL
2008
I. BALANZA EN CUENTA CORRIENTE - 998
- 1 800
- 1 466
- 1 022
- 5 285
1. Balanza comercial 1 537 831 527 - 326 2 569
a. Exportaciones de Bienes (FOB)
7 804 8 384 8 504 6 326 31 018
b. Importaciones de Bienes (FOB)
- 6 266
- 7 553
- 7 977
- 6 652
- 28 449
2. Servicios - 436 -480 - 544 - 596- 2 056
a. Exportaciones 884 864 979 922 3 649
b. Importaciones- 1 320
- 1 345
- 1 522
- 1 517
- 5 704
3. Renta de factores- 2 789
- 2 891
- 2 205 - 858
- 8 742
a. Privado - 2 747
- 2 925
- 2 214 - 860
- 8 746
b. Público - 41 34 9 2 4
4. Transferencias corrientes 689 739 756 758 2 943
De las que: Remesas del Exterior 571 616 631 626 2 444
Fuente: BCRP
Copyright © 2007 by The McGraw-Hill Companies, Inc. All rights reserved. 3-11
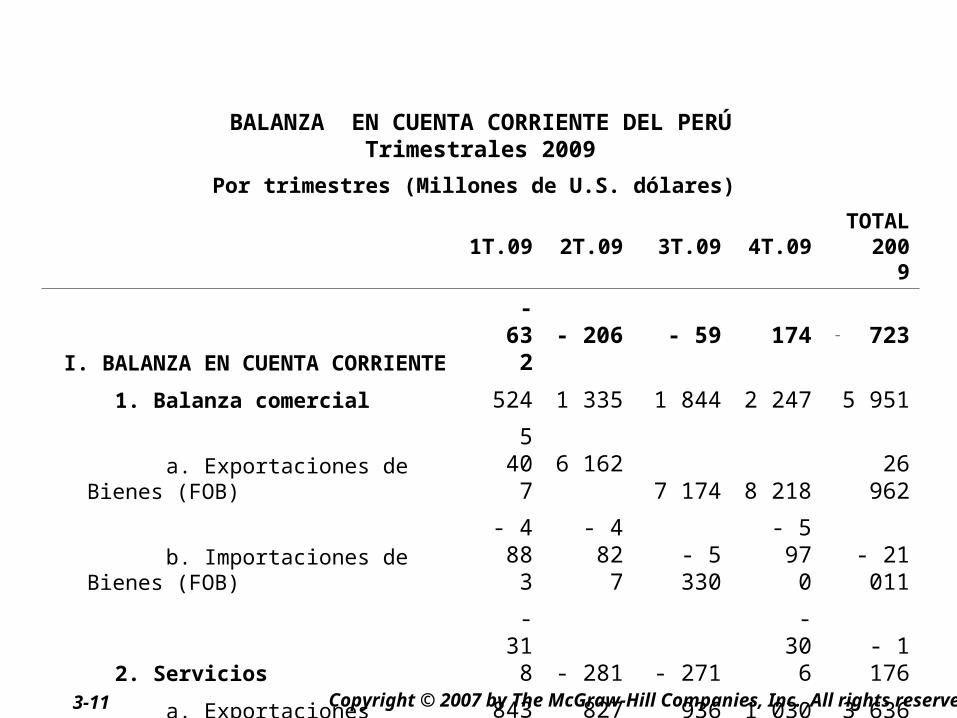
BALANZA EN CUENTA CORRIENTE DEL PERÚTrimestrales 2009
Por trimestres (Millones de U.S. dólares)
1T.09 2T.09 3T.09 4T.09
TOTAL 200
9
I. BALANZA EN CUENTA CORRIENTE
- 632
- 206 - 59 174 - 723
1. Balanza comercial 524 1 335 1 844 2 247 5 951
a. Exportaciones de Bienes (FOB)
5 407
6 1627 174 8 218
26 962
b. Importaciones de Bienes (FOB)
- 4 883
- 4 827
- 5 330
- 5 970
- 21 011
2. Servicios
- 318 - 281 - 271
- 306
- 1 176
a. Exportaciones 843 827 936 1 030 3 636
b. Importaciones
- 1 161
- 1 108
- 1 207
- 1 336
- 4 812
3. Renta de factores-1 507
- 1 961
-2 365
-2 552
-8 385
a. Privado- 1 542
-1 991
- 2 405
- 2 512
- 8 450
b. Público 36 30 39 - 40 65 4. Transferencias
corrientes 669 700 733 785 2 887 De los que: Remesas del
Exterior Fuente: BCRP 547 581 615 665 2 409
Copyright © 2007 by The McGraw-Hill Companies, Inc. All rights reserved. 3-12
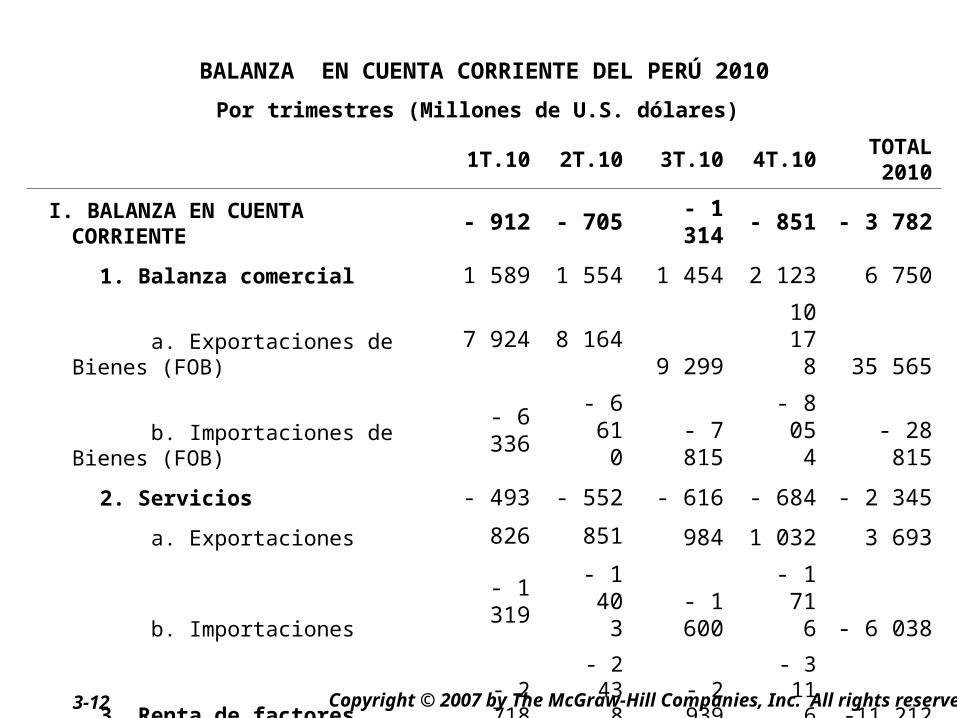
BALANZA EN CUENTA CORRIENTE DEL PERÚ 2010Por trimestres (Millones de U.S. dólares)
1T.10 2T.10 3T.10 4T.10 TOTAL
2010 I. BALANZA EN CUENTA
CORRIENTE - 912 - 705 - 1 314 - 851 - 3 782
1. Balanza comercial 1 589 1 554 1 454 2 123 6 750
a. Exportaciones de Bienes (FOB)
7 924 8 1649 299
10 178 35 565
b. Importaciones de Bienes (FOB)
- 6 336
- 6 610
- 7 815
- 8 054
- 28 815
2. Servicios - 493 - 552 - 616 - 684 - 2 345 a. Exportaciones 826 851 984 1 032 3 693
b. Importaciones- 1 319
- 1 403
- 1 600
- 1 716 - 6 038
3. Renta de factores- 2 718
- 2 438
- 2 939
- 3 116 -11 212
a. Privado - 2 684
- 2 421
- 2 848
- 3 028 -10 982
b. Público - 34 - 17 - 91 - 88 - 230 4. Transferencias
corrientes 711 732 758 826 3 026 De las que: Remesas
del exterior 588 609 636 701 2 534
Fuente: BCRP
Copyright © 2007 by The McGraw-Hill Companies, Inc. All rights reserved. 3-13
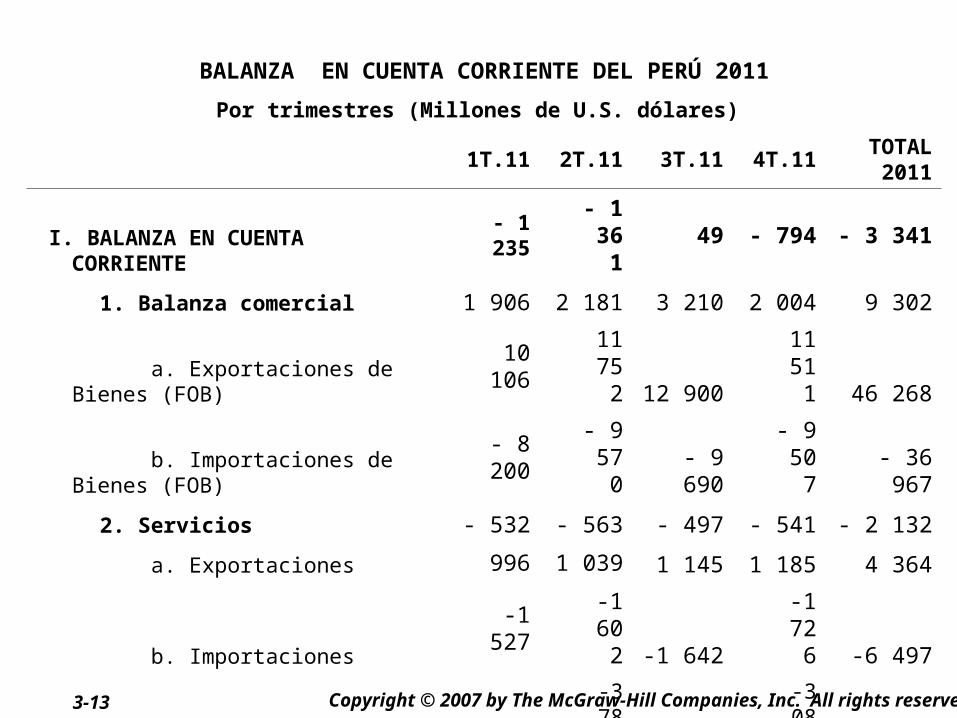
BALANZA EN CUENTA CORRIENTE DEL PERÚ 2011Por trimestres (Millones de U.S. dólares)
1T.11 2T.11 3T.11 4T.11 TOTAL
2011
I. BALANZA EN CUENTA CORRIENTE
- 1 235
- 1 361
49 - 794 - 3 341
1. Balanza comercial 1 906 2 181 3 210 2 004 9 302
a. Exportaciones de Bienes (FOB)
10 106
11 752 12 900
11 511 46 268
b. Importaciones de Bienes (FOB)
- 8 200
- 9 570
- 9 690
- 9 507
- 36 967
2. Servicios - 532 - 563 - 497 - 541 - 2 132 a. Exportaciones 996 1 039 1 145 1 185 4 364
b. Importaciones-1
527-1 602 -1 642
-1 726 -6 497
3. Renta de factores -3 372
-3 781 -3 469
-3 088 -13 710
a. Privado -3 200-3 721 -3 304
-2 948 -13 173
b. Público -172 -59 -165 -141 -537 4. Transferencias
corrientes 762 801 804 832 3200 De las que: Remesas
del exterior 634 675 680 708 2 697
Fuente: BCRP
Copyright © 2007 by The McGraw-Hill Companies, Inc. All rights reserved. 3-14
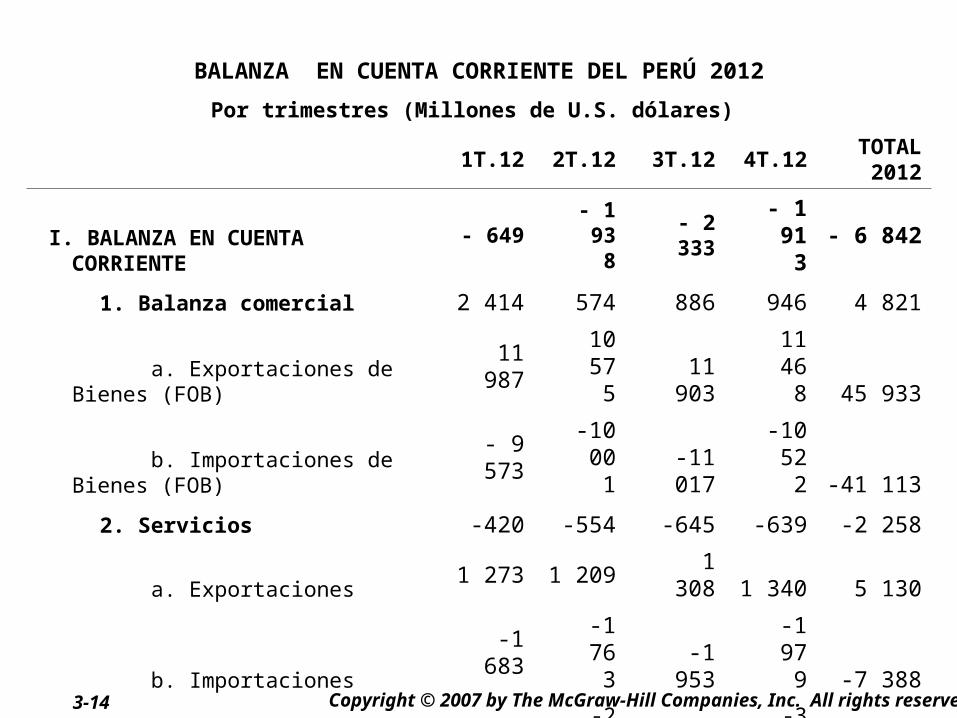
BALANZA EN CUENTA CORRIENTE DEL PERÚ 2012Por trimestres (Millones de U.S. dólares)
1T.12 2T.12 3T.12 4T.12 TOTAL
2012
I. BALANZA EN CUENTA CORRIENTE
- 649- 1 938
- 2 333
- 1 913
- 6 842
1. Balanza comercial 2 414 574 886 946 4 821
a. Exportaciones de Bienes (FOB)
11 987
10 575
11 903
11 468 45 933
b. Importaciones de Bienes (FOB)
- 9 573
-10 001
-11 017
-10 522 -41 113
2. Servicios -420 -554 -645 -639 -2 258
a. Exportaciones 1 273 1 209 1 308 1 340 5 130
b. Importaciones-1 683
-1 763
-1 953
-1 979 -7 388
3. Renta de factores -3 460
-2 773 -3 405
-3 063 -12 701
a. Privado -3 191-2 642 -3 145
-3 001 -11 980
b. Público -269 -131 -259 -62 -721 4. Transferencias
corrientes 808 815 830 843 3 296 De las que: Remesas
del exterior 678 690 704 717 2 788
Fuente: BCRP
Copyright © 2007 by The McGraw-Hill Companies, Inc. All rights reserved. 3-15
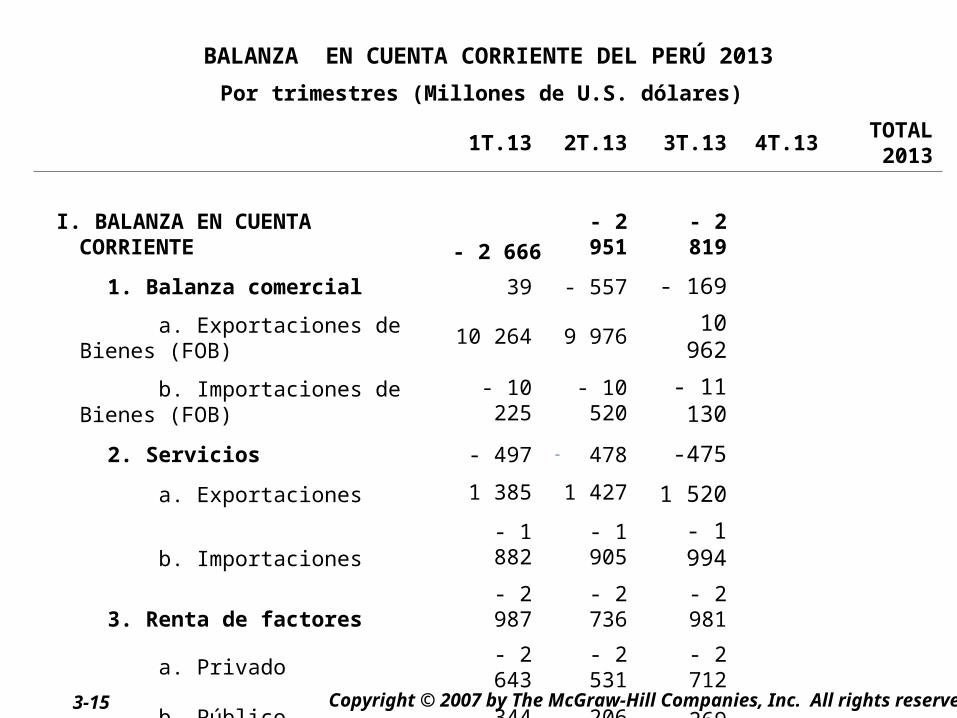
BALANZA EN CUENTA CORRIENTE DEL PERÚ 2013Por trimestres (Millones de U.S. dólares)
1T.13 2T.13 3T.13 4T.13 TOTAL 2013
I. BALANZA EN CUENTA CORRIENTE - 2 666
- 2 951
- 2 819
1. Balanza comercial 39 - 557 - 169 a. Exportaciones de
Bienes (FOB) 10 264 9 976 10 962
b. Importaciones de Bienes (FOB)
- 10 225
- 10 520
- 11 130
2. Servicios - 497 - 478 -475 a. Exportaciones 1 385 1 427 1 520
b. Importaciones- 1 882
- 1 905
- 1 994
3. Renta de factores- 2 987
- 2 736
- 2 981
a. Privado - 2 643
- 2 531
- 2 712
b. Público - 344 -206 -269 4. Transferencias
corrientes 778 820 805 De las que: Remesas
del exterior 639 687 677
Fuente: BCRP
Copyright © 2007 by The McGraw-Hill Companies, Inc. All rights reserved. 3-16
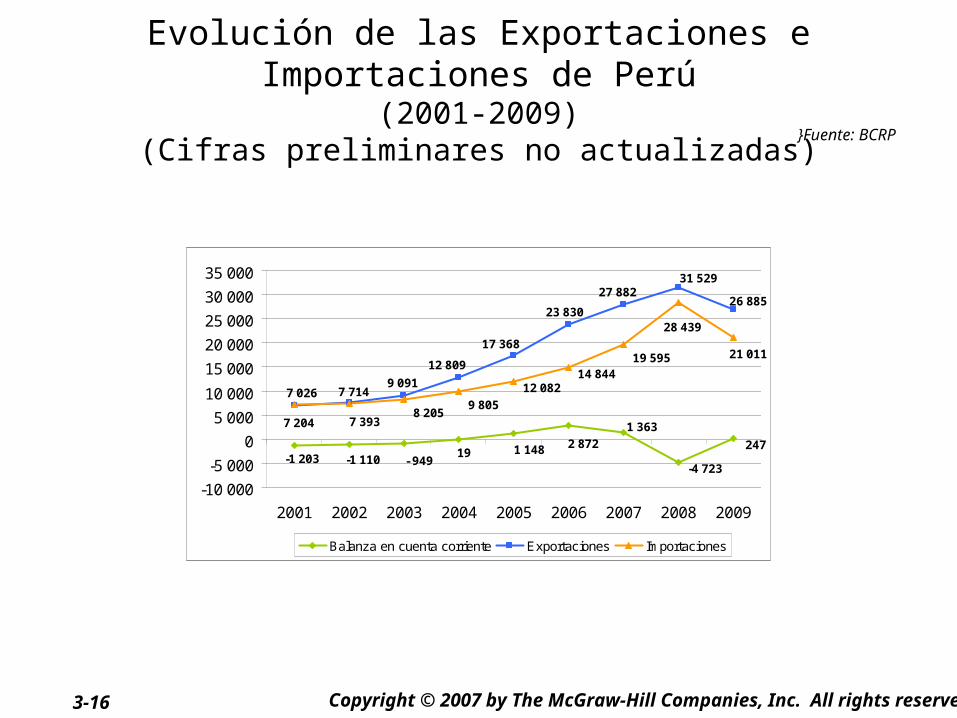
Evolución de las Exportaciones e Importaciones de Perú
(2001-2009)(Cifras preliminares no actualizadas)
-4 723 247
12 08214 844
-1 203 -1 110 - 949 19 1 148 2 8721 363
9 09112 809
17 368
23 83026 885
31 52927 882
7 7147 0268 205
19 595 21 011
28 439
7 3937 2049 805
-10 000-5 000
05 00010 00015 00020 00025 00030 00035 000
2001 2002 2003 2004 2005 2006 2007 2008 2009
Balanza en cuenta corriente Exportaciones Im portaciones
}Fuente: BCRP
Copyright © 2007 by The McGraw-Hill Companies, Inc. All rights reserved. 3-17
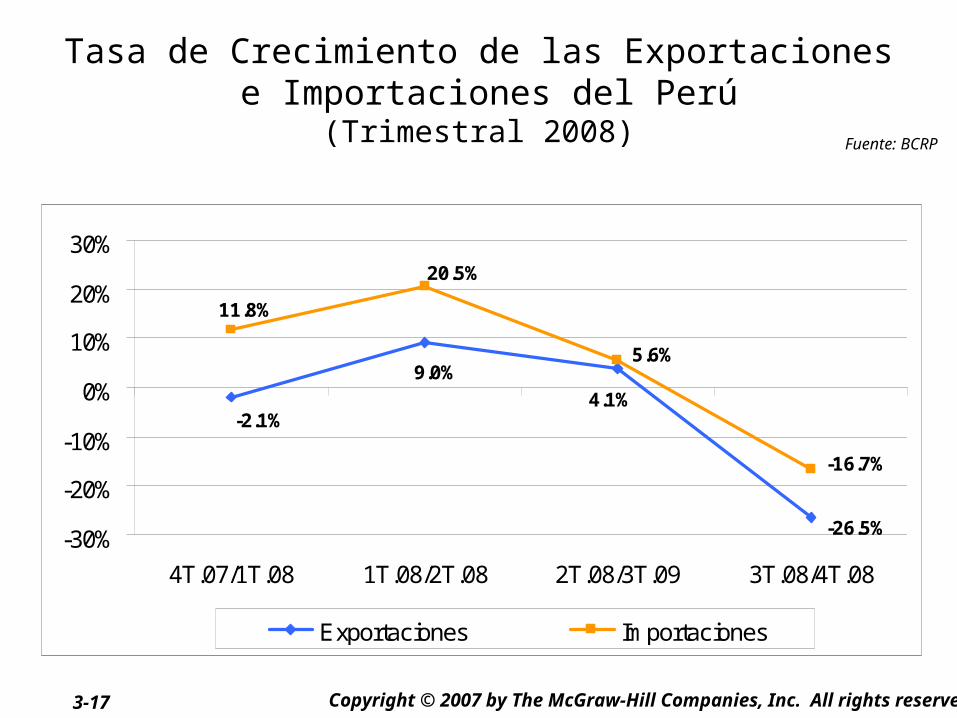
Tasa de Crecimiento de las Exportaciones e Importaciones del Perú
(Trimestral 2008)
-26.5%
5.6%
-16.7%
-2.1%
9.0%4.1%
11.8%20.5%
-30%
-20%-10%
0%
10%20%
30%
4T.07/1T.08 1T.08/2T.08 2T.08/3T.09 3T.08/4T.08
Exportaciones Im portaciones
Fuente: BCRP
Copyright © 2007 by The McGraw-Hill Companies, Inc. All rights reserved. 3-18
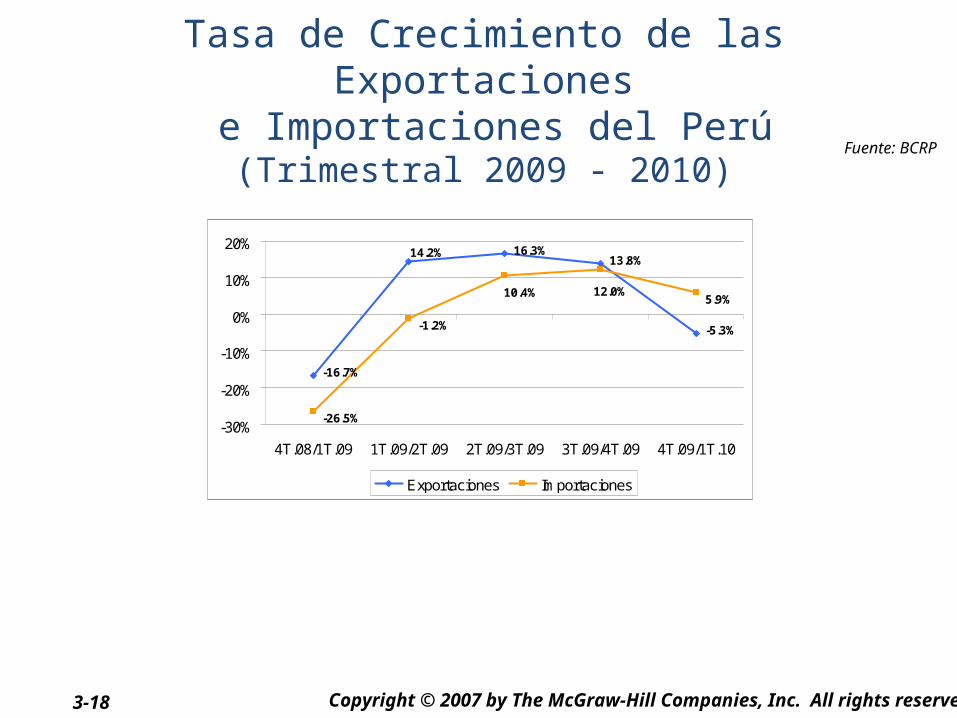
Tasa de Crecimiento de las Exportaciones
e Importaciones del Perú(Trimestral 2009 - 2010)
Fuente: BCRP
-16.7%
16.3%13.8%
-5.3%
-26.5%
-1.2%
5.9%
14.2%
12.0%10.4%
-30%
-20%
-10%
0%
10%
20%
4T.08/1T.09 1T.09/2T.09 2T.09/3T.09 3T.09/4T.09 4T.09/1T.10
Exportaciones Im portaciones
Related Documents