Balancing the Budget but Who’s Left to Budget the Balance: A Visual Representation of Professional Networks within Toronto East Local Immigration Partnership

Welcome message from author
This document is posted to help you gain knowledge. Please leave a comment to let me know what you think about it! Share it to your friends and learn new things together.
Transcript
Balancing the Budget but Who’s Left to Budget the Balance:A Visual Representation of Professional Networks within Toronto East Local Immigration Partnership

Balancing the Budget but who’s Left to Budget the Balance?2
Balancing the Budget but who’s Left to Budget the Balance: A Visual Representation of Professional Networks within Toronto East Local Immigration Partnership
October 2012
ISBN: 978-0-9916995-0-6
Produced by: Meta Strategies 401 Richmond St. West, Suite 206, Toronto, Ontario M5V 3A8 Copyright@ 2012 Meta Strategies
Partners:Factor-Inwentash Faculty of Social Work (FIFSW), University of Toronto
WoodGreen Community Services
Copies of this report may be reproduced non-commercially for building community awareness with appropriate recognition to Meta Strategies. In all other cases, permission must be sought from Meta Strategies.
Report AuthorsRaluca Bejan, FIFSW, University of Toronto
Christopher Black, Meta Strategies
Research SupportRupaleem Bhuyan, FIFSW, University of Toronto
Diane Dyson, WoodGreen Community Services
Sandra Guerra, WoodGreen Community Services
Lesley Johnston, Social Planning Toronto
Liz Rykert, Meta Strategies
Beth Wilson, Social Planning Toronto
Funding Support:This project was made possible via the financial support of:
October 2012 3
Table of Contents
Acknowledgments . . . . . . . . . . . . . . . . . . . . . . . . . . . . . . . . . . . . . . . . . . . . . . . . 4
Executive Summary . . . . . . . . . . . . . . . . . . . . . . . . . . . . . . . . . . . . . . . . . . . . . . . 5
Key Findings . . . . . . . . . . . . . . . . . . . . . . . . . . . . . . . . . . . . . . . . . . . . . . . . . . . . . . . . 6
Back to Square One . . . . . . . . . . . . . . . . . . . . . . . . . . . . . . . . . . . . . . . . . . . . . . . . . . 6
Recommendations . . . . . . . . . . . . . . . . . . . . . . . . . . . . . . . . . . . . . . . . . . . . . . . . . . . 7
Introduction . . . . . . . . . . . . . . . . . . . . . . . . . . . . . . . . . . . . . . . . . . . . . . . . . . . . 8
Context . . . . . . . . . . . . . . . . . . . . . . . . . . . . . . . . . . . . . . . . . . . . . . . . . . . . . . . . 9
Social Network Analysis as a Best Practice . . . . . . . . . . . . . . . . . . . . . . . . . . . . . 11
Methodology . . . . . . . . . . . . . . . . . . . . . . . . . . . . . . . . . . . . . . . . . . . . . . . . . . . 12
Survey Results . . . . . . . . . . . . . . . . . . . . . . . . . . . . . . . . . . . . . . . . . . . . . . . . . . 13
Summary of Respondents . . . . . . . . . . . . . . . . . . . . . . . . . . . . . . . . . . . . . . . . . . . . . 13
A Strong Configuration of Professional Linkages . . . . . . . . . . . . . . . . . . . . . . . . . . . . 15
LIP Paid Staff: the Partnership’s Bare Bones . . . . . . . . . . . . . . . . . . . . . . . . . . . . . . . 18
Network’s Sustainability: Uncertain without the Paid LIP Staff . . . . . . . . . . . . . . . . . . 19
Conclusion . . . . . . . . . . . . . . . . . . . . . . . . . . . . . . . . . . . . . . . . . . . . . . . . . . . . 21
Back to Square One . . . . . . . . . . . . . . . . . . . . . . . . . . . . . . . . . . . . . . . . . . . . . . . . . 21
Recommendations . . . . . . . . . . . . . . . . . . . . . . . . . . . . . . . . . . . . . . . . . . . . . . 24
References . . . . . . . . . . . . . . . . . . . . . . . . . . . . . . . . . . . . . . . . . . . . . . . . . . . . 25
Balancing the Budget but who’s Left to Budget the Balance?4
AcknowledgmentsThis project was conducted by Factor-Inwentash Faculty of Social Work at University of Toronto in collaboration with Meta Strategies. Partial funding was provided by MITACS Accelerate, a national internship program endowing financial support for project driven research collaborations between the private and the academic sectors. Meta Strategies, a company with a long history of assisting non-profit groups in developing creative approaches to their everyday working relationships, was the second financial contributor on the project.
Without the ongoing assistance provided by WoodGreen Community Services, the lead organization for the Toronto East Local Immigration Partnership (TE LIP), this project would still be in its infancy phase. The research team’s commitment, contributions and support, were equally essential to the success of this report: thank you, Sandra Guerra, Diane Dyson and Liz Rykert. Many thanks to Rupaleem Bhuyan, for her thoughtful guidance throughout all the stages of this research, as well as to Lesley Johnston and Beth Wilson, for their invaluable feedback on the final version of the report. Special thanks to Mohammad Hayat, Michelle Lopes, Sevgül Topkara-Sarsu and Tom Zizys, for being available over the busy winter holiday season, to test our network mapping survey prior to its official launch.
We would also like to extend our appreciation to the service providers, settlement workers, language trainers, community workers and all other TE LIP members, who took time out of their busy schedules to answer the survey. We hope that findings outlined in this report will add to their future professional work, as it particularly relates to the delivery of settlement services for newly arrived immigrants.
October 2012 5
Executive SummaryIn December 2011, Citizenship and Immigration Canada (CIC) put an end to the funding agreements previously supporting the creation and development of Toronto’s neighbourhood based Local Immigration Partnership (LIP) model, in favour of a larger regional structure of settlement services.
The neighbourhood based LIP settlement model came together at the end of 2009, following a joint call for proposals between CIC and the Provincial Ministry of Citizenship and Immigration (MCI), under the preceding Canada-Ontario Immigration Agreement (COIA). It aimed to better integrate and coordinate newcomers’ service delivery, by building alliances across settlement service providers. Seventeen LIPs across Toronto were formed, as networks of community stakeholders – settlement agencies, community organizations, language training providers, local associations, and members of school boards or municipal government. Locally, Toronto East (TE) LIP developed settlement based strategies within the geographically defined east neighbourhood of Toronto. Its catchment area was territorially delimited by the eastern portion of the Old City of Toronto and the district formerly known as the City of East York (WoodGreen Community Services, 2010).
On April 1st 2012, a new regional settlement model was implemented. It merged the initial seventeen neighbourhood based LIPs into four regional Partnerships. Simultaneously, it reduced the federally funded LIP workforce by 75% across the Partnerships. For instance, TE LIP lost half of its staff, the Downtown East LIP went from five to two members, whereas the Downtown West LIP decreased its personnel by about two thirds. At the start of this project, in September 2011, TE LIP was fully operational. By the end of it, it ceased to exist as an entity. It became part of a larger geographical Partnership, the Toronto South (TS) LIP. Primary TE LIP funded positions have been eliminated. New postings were announced in the spring, once CIC signed the new regional agreements with its lead partners. It is uncertain if the existing professional networks will be carried over to the newly created regional Partnership, the TS LIP.
Using a network centered process evaluation, this project aimed to:
■ Examine the current working relationships and desired future collaborations among professionals delivering immigrant and settlement services within the former TE LIP
■ Explore the possible impact of CIC ’s decision to restructure the LIP model, in relation to its resulting workforce reduction
We asked immigrant and settlement service providers within the Toronto East neighbourhood, to answer a survey about their occupational network. We invited them to identify those to whom they are professionally connected to, and those with whom they would like to form future working relationships. This report visually represents their patterns of collaboration. Next, it provides recommendations on how CIC could better support the coordination, planning and delivery of settlement services.
Since TE LIP was established with the goal of coordinating and integrating immigrant and settlement services, social network analysis (SNA) was deemed a fit methodology to assess the collaborative networks within the Partnership. SNA is a set of theories and tools, using relational data to examine network structures, to create visualizations of connections between people, and to visually explore how relationships shape collaboration flows. Network approaches are applicable in strengthening community partnerships and examining relational ties within a downsizing and outsourcing environment. Given the recent LIPs restructuring, we have chosen a SNA approach to structurally explore the possible impact of CIC’s decision to amalgamate the local LIPs into a regional model, as it particularly relates to their consequential staff reduction. We hope the TE LIP network’s analyses will help the Partnership as it transitions to the TS LIP.
Balancing the Budget but who’s Left to Budget the Balance?6
KEY FINDINGS
TE LIP: A Dense Network with a Strong Configuration of Professional Linkages ■ Respondents identified 246 colleagues with whom they have well-established working
relationships ■ Stakeholders were sustaining a dense configuration of 1466 professional linkages, crossing
many sectors and organizations and serving various geographic areas within the Toronto East neighbourhood
LIP Paid Staff: the Partnership’s Bare Bones ■ TE LIP paid staff played a vital role in connecting settlement service providers ■ Individuals whose positions were funded through CIC agreements, supported half of the
Partnership’s professional linkages (n=702), three times as many connections based on their proportional representation (16%) within the network
Network’s Sustainability: Uncertain without the Paid LIP Staff Following the removal of paid LIP positions:
■ 50 % of the Partnership’s collaborative relationships were no longer sustainable ■ Professional linkages halved to 764 from the initial 1466 ■ Nineteen stakeholders became completely isolated ■ Network’s overall density reduced by a quarter (26%) ■ The average path length (number of steps connecting professionals among them) increased
by 17%, suggestive of lengthier routes needed to form collaborative relationships ■ Network’s integration score decreased by 64%, indicative of less information spread within
the Partnership.
BACK TO SQUARE ONEThe LIP funded positions were vital to the Partnership’s operational performance. Our analysis indicates that network’s strategic positions were occupied by the paid LIP staff. Their roles were fundamental in sustaining a strong network of coordination and integration services, and setting up the basis for collaboration and knowledge sharing. Representing only 16% of the collaborative network, members directly funded through the LIP, supported 50% of the Partnership’s connections. Without them, the network’s density was reduced by a quarter, its professional linkages were halved and almost a tenth of service providers remained completely isolated.
Within the current restructuring process, TE LIP members are back to square one. Across the city, the amalgamated regional model contains up to 75% fewer paid LIP positions. This places the local professional networks in a weakened state. It rolls back the clock to 2009, when localized immigrant services were not yet integrated. Service providers are left to wonder if their previous years of localized settlement planning were in vain and if the regional model, with only one year of guaranteed funding, is worth their planning efforts. Proceeding with the amalgamation, without thoroughly exploring professional dynamics within the LIPs, may negatively impact the provision of settlement services for Toronto newcomers. It is uncertain if CIC’s stated objective of strengthening the local integration capacity for immigrant and settlement services, will match its adopted regional model. Will professional collaborations extend to the new regional Partnerships? Networks could possibly grow weaker, given the loss of the paid LIP staff’s cohesive role. How will this translate into the delivery of settlement services? Moreover, how will the regional LIPs respond to newcomers’ needs?
This report does not seek to critically assess the current regional settlement model. It simply notes that no prior evaluations guided the transition to a regional LIP model.
October 2012 7
RECOMMENDATIONS 1. Reinstate funding for the LIP neighbourhood based operational model. Restructuring the LIPs entails moving away from a neighbourhood based settlement model. Settlement services are sustained by relational processes. Relations take time to develop and could potentially be lost within the larger regional Partnerships. The consequential workforce reduction may also impede the provision of locally based immigrant services. It is uncertain if the regional model is well equipped to develop a comprehensive settlement service delivery plan for newly arrived immigrants. Perhaps Toronto, a city with half of its residents born outside Canada, is not the best place to test the regional model’s ability to address newcomers’ social, cultural and economic needs.
2. Make use of evidence informed evaluation research to guide the LIPs future developments. It is important for funders to increase their research capacity in order to better explore the collaborative and professional linkages within the LIP settlement model of service delivery. Restructuring the former neighbourhood based LIPs, without previously evaluating the coordination and integration of immigrant and settlement service delivery, indicates a lack of foresight in providing the best services for Canada’s newcomers. Cutting back investments that could improve newly arrived immigrants’ settlement process may have negative implications for their social and economic integration. Although CIC’s concerns of service duplication are well- founded, there is no evidence of services being doubled up. Moving away from the neighbourhood based settlement model on the fear of service duplication, could unfortunately translate into reduced service coordination for newcomers.
3. Adopt a long term perspective on the settlement and integration process. Immigrant and settlement service recipients would benefit from a long term Strategic Plan lead by CIC. A multi-sectorial and multi stakeholder community consultation process would best guide the future development, planning, coordination and integration of its proposed model of immigrant and settlement services.
Balancing the Budget but who’s Left to Budget the Balance?8
IntroductionToronto East Local Immigration Partnership (TE LIP) was established at the end of 2009, as a network of community stakeholders- settlement agencies, community organizations, language training providers, local associations, members of school boards and municipal government- with the purpose of coordinating newcomers’ services within the geographically defined Toronto East neighbourhood.
Using a network centered process evaluation (Pope & Lewis, 2008) this project aimed to:
■ Examine the current working relationships and desired future collaborations among professionals delivering immigrant and settlement services within the TE LIP
■ Explore the possible impact of Citizenship and Immigration Canada’s (CIC) decision to restructure the LIP model, in relation to its resulting workforce reduction
October 2012 9
ContextImmigration has been defined as an urban process (Grant & Sweetman, 2004). Metropolitan areas are magnets for immigrants (Galabuzi & Teeluckksingh, 2010) and almost three quarters of newcomers are making their home in one of Canada’s largest cities, Toronto, Vancouver or Montreal (Omidvar & Richmond, 2003). Toronto, with half of its residents born outside Canada, remains a primary destination for newly arrived immigrants (City of Toronto, 2011). Between 2000 and 2009, it received an average of 48 900 newcomers, representing twenty percent of all new immigrants to Canada (City of Toronto, 2011).
Newcomers experience social exclusion (Richmond & Shields, 2005), marginalization from the labour market and limited access to social services, such as housing, education or health care (Galabuzi & Teeluckksingh, 2010). Systemic barriers often impede on their ability to socially and economically participate within the Canadian society (Richmond & Shields, 2005; Simich, Beiser, Stewart & Mwakarimba 2005). These include: non-recognition of foreign credentials (George, 2002), lack of Canadian work experience, unfamiliarity with practices and behaviours existent within Canadian workplaces (Tufts, Lemoine, Phan, Kelly, Lo, Preston & Shields, 2010) lack of transferable skills (Schellenberg & Hou, 2008) or a lack of awareness about services, mainly due to real and perceived cultural bias and racism (Dowding & Razi, 2006) or to economic, linguistic, cultural and educational (Dowding & Razi, 2006; Simich, Beiser, Stewart & Mwakarimba, 2005) limitations or discrimination (Schellenberg & Hou, 2008).
Immigrant serving agencies (Dowding & Razi, 2006) and settlement services do facilitate newcomers’ integration (Burr, 2011) and their resettlement process (George, 2002). Mainly funded by the state (Landolt, Goldring & Bernhard, 2009) settlement services are provided via community based organizations or third sector agencies (Richmond & Shields, 2005). Although re-settlement is a long life process (Richmond & Shields, 2005), contact with these community organizations is usually established very soon upon arrival (Rose, Carrasco & Charbonneau, 1998). Service agencies assist newcomers across all settlement stages, with a variety of basic needs (Landolt, Goldring & Bernhard, 2009): advice (Rose, Carrasco & Charbonneau, 1998), language acquisition (George, 2002), access to public institutions (Dowding & Razi, 2006) employment, housing, health care (Dowding & Razi, 2006) or family counselling services (George, 2002), job seeking skills, (Rose, Carrasco & Charbonneau, 1998), community connections (George, 2002), career advancements, political and social participation (George, 2002) and cross cultural exchanges (Norquay, 2004). They help immigrant families integrate (Yan & Lauer, 2008), adjust (Norquay, 2004) and adapt to a new environment (Dowding & Razi, 2006; Yan & Lauer, 2008) and to the Canadian way of life (George, 2002; Norquay, 2004). Ultimately, they help newcomers get through familial or work related precarious circumstances (Rose, Carrasco & Charbonneau, 1998) and overcome social exclusion (Galabuzi & Teeluckksingh, 2010).
Within the last decades, the Canadian settlement model lost its core government financial support (Richmond & Shields, 2005) to contract restricted, short term funding (Simich, Beiser, Stewart & Mwakarimba, 2005). Coupled with recent recessionary effects of increased service demands and falling funding revenues (Hildebrandt & Wilson, 2010) these financial endowments left many organizations struggling to develop comprehensive service plans for newcomers (Richmond & Shields, 2005; Yan & Lauer, 2008).
In attempts to ameliorate immigrant service delivery, CIC developed a localized model of community partnership, aimed to build alliances across settlement service providers (Galabuzi & Teeluckksingh, 2010) and to integrate, coordinate, as well as incorporate immigration specific programs, information sources, referrals and services. At the end of 2009, following a joint call for proposals between CIC and the Provincial Ministry of Citizenship and Immigration (MCI), under the preceding Canada-Ontario Immigration Agreement (COIA), seventeen LIPs were formed across Toronto. A City Wide
Balancing the Budget but who’s Left to Budget the Balance?10
LIP (CW LIP) was additionally created. Ever since, TE LIP developed strategies to coordinate and integrate settlement services for newcomers within the Toronto East geographical neighbourhood. Its catchment area was territorially defined by the eastern portion of the Old City of Toronto and the district formerly known as the City of East York (WoodGreen Community Services, 2010).
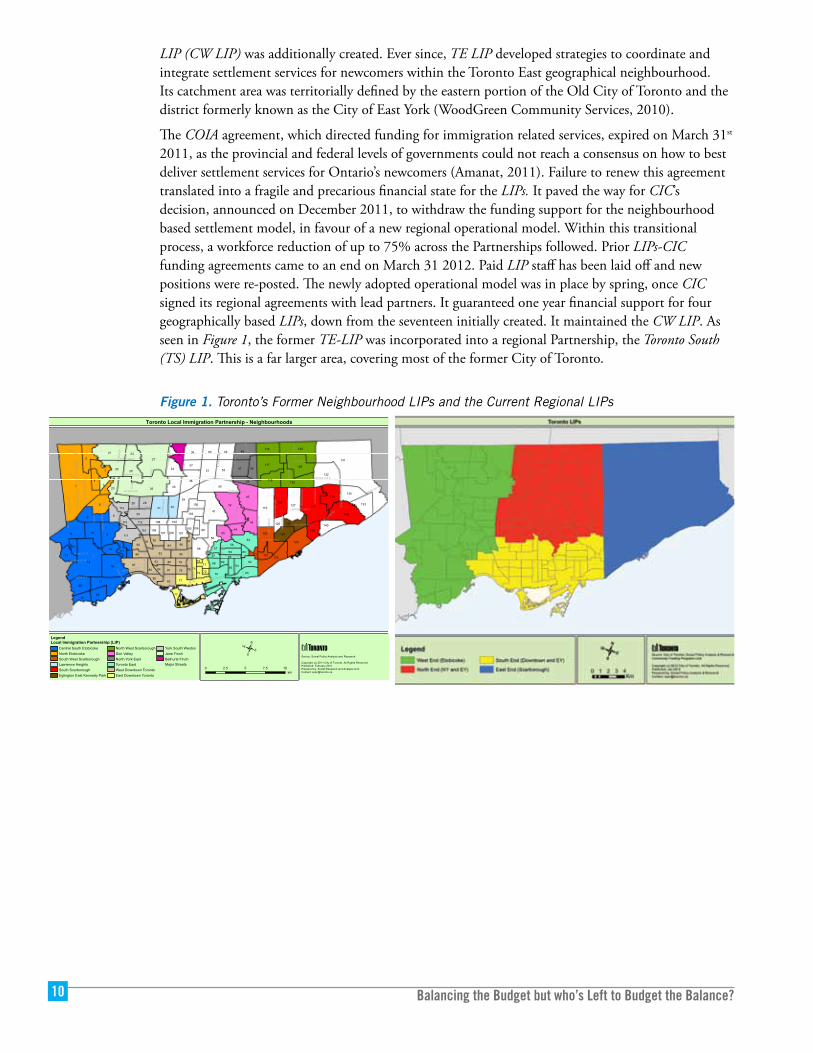
The COIA agreement, which directed funding for immigration related services, expired on March 31st 2011, as the provincial and federal levels of governments could not reach a consensus on how to best deliver settlement services for Ontario’s newcomers (Amanat, 2011). Failure to renew this agreement translated into a fragile and precarious financial state for the LIPs. It paved the way for CIC’s decision, announced on December 2011, to withdraw the funding support for the neighbourhood based settlement model, in favour of a new regional operational model. Within this transitional process, a workforce reduction of up to 75% across the Partnerships followed. Prior LIPs-CIC funding agreements came to an end on March 31 2012. Paid LIP staff has been laid off and new positions were re-posted. The newly adopted operational model was in place by spring, once CIC signed its regional agreements with lead partners. It guaranteed one year financial support for four geographically based LIPs, down from the seventeen initially created. It maintained the CW LIP. As seen in Figure 1, the former TE-LIP was incorporated into a regional Partnership, the Toronto South (TS) LIP. This is a far larger area, covering most of the former City of Toronto.
Figure 1. Toronto’s Former Neighbourhood LIPs and the Current Regional LIPs
1
131
14
26
27
7
9
6 42
70
11
2
41137
16
21
45
40
119
17
3
136
130
31
132
5
8
39
48
38
87
128
25 52
10
51
117
4
54
127
120
20
12934
43
12356
36
98
22
23
77
47
33
4950
126
122
118
135
93
111
35
133
63
30
32
24
18
134
116
5599
82
46
12
37
95
62
1590
53
77
140
29
44124
85
58
19
59
103
138
28
139
9692
88
113
68
13 57
81
94
65
101
6478
105
86
115
107
91
8071
73
7983
125112
114121
108
84
110
60
100
102
109
69
7276
89
75
106
97
6661
104
67
74
77
YON
GE S
T
JAN
E ST
KIPLIN
G AV
E
FINCH AVE W
BATHU
RST S
T
BAYV
IEW
AVE
SHEPPARD AVE E
STEELES AVE W
FINCH AVE E
KEELE
ST
LESLIE S
T
KEN
NED
Y RD
EGLINTON AVE E
WA
RD
EN
AVE
ISLIN
GTO
N AV
E
BRIM
LEY R
D
WILSON AVE
ALBION RD
MA
RK
HA
M R
D
STEELES AVE E
MID
LAN
D AV
E
VICTO
RIA PAR
K AVE
DO
N M
ILLS RD
HIG
HW
AY 27 SH
IGH
WAY 27 N
MC
CO
WA
N R
DDIXON RD
BIRC
HM
OU
NT R
D
SHEPPARD AVE W
WE
STON
RD
LAWRENCE AVE W
ST CLAIR AVE W
KING ST W
BAY ST
AVEN
UE
RD
DANFORTH AVE
YORK MILLS RD
QUEEN ST W
LAWRENCE AVE E
MA
RTIN
GR
OV
E R
D
EVANS AVE
REXDALE BLVD
BLOOR ST W
EGLINTON AVE W
WO
OD
BINE AV
E
MO
RN
ING
SIDE AV
E
DU
FFERIN
ST
LAKE SHORE BLVD E
PAPE
AVE
ST CLAIR AVE E
DUNDAS ST W
SCAR
LETT RD
CA
RLIN
GVIE
W D
R
DUPONT ST
KINGSTON RD
PARK
SIDE D
RTHE QUEENSWAY
LAIR
D D
R
RE
NFO
RTH
DR
PARK LAWN RD
YOR
K ST
KINGSTON RD
BLOOR ST W
KEELE
ST
AVEN
UE
RD
DO
N M
ILLS RD
DU
FFERIN
ST
DUPONT ST
Toronto Local Immigration Partnership - Neighbourhoods
LegendLocal Immigration Partnership (LIP)
Central South EtobicokeNorth EtobicokeSouth West ScarboroughLawrence HeightsSouth ScarboroughEglington East Kennedy Park
North West ScarboroughDon ValleyNorth York EastToronto EastWest Downtown TorontoEast Downtown Toronto
York South WestonJane FinchBathurst FinchMajor Streets
/0 2.5 5 7.5 10
km
Source: Social Policy Analysis and Research
Copyright (c) 2011 City of Toronto. All Rights Reserved.Published: February 2011Prepared by: Social Research and Analysis UnitContact: [email protected]
October 2012 11
Social Network Analysis as a Best Practice Relationships have been considered the cornerstone of effective community work (Brown and Hannis, 2008). They are channels for transferring resources and information among interdependent actors (Hoffer-Gittell & Weiss, 2004). In fact, it has been shown that social interactions have a significant effect on organizational value creation (Tsai & Ghoshal, 1998), that a cohesive, well-connected network is a resource to its members, by means of mutual trust and a willingness to cooperate (Flap & Volker, 2001), and that “who you know often has a great deal to do with what you came to know” (Cross, Borgatti & Parker, 2002).
Network theory is relevant to the study of relationships (Hoffer-Gittell & Weiss, 2004). As a set of theories and tools, social network analysis (SNA) uses relational data (Pope & Lewis, 2008) to create visualizations of structural connections between people (Hoppe & Reinelt, 2010). It sheds light upon large patterns of social interactions (Tsai & Ghosal, 1998) and identifies individuals’ structural specific roles and positions (Schultz-Jones & Cheung, 2008). One of its strengths is the ability to explore the organizational degree of interconnectedness (Oehler, Sheppard, Benjamin & Dworkin, 2007), the ways in which relationships shape information flows (Borgatti & Cross, 2003; Shah, 2000) and the way they add to existent organizational knowledge and future executive directions (Cross, Borgatti & Parker, 2002), particularly within community partnerships (Schultz-Jones & Cheung, 2008).
Partnerships’ effectiveness (Pope & Lewis, 2008; Valente, Chou & Pentz, 2007) and workforce reduction changes (Shah, 2000), have been previously assessed by network based research efforts. In fact, examinations of organizational relational ties showed a negative impact of downsizing and managerial layoffs on professional networks (Zyglidopoulos, 2005) particularly by disrupting existent working relationships (Moynihan & Pandey, 2007) and limiting regular organizational activities (Shah, 2000).
TE LIP was established in the name of coordinating and integrating immigrant and settlement services. A SNA approach, with its inherent examination of structures as networks of relations (Scott, 2010) is a fitting methodology to assess not only the collaboration networks within the Partnership, but also the possible impact of CIC ’s restructuring and its resulting staff reduction. We hope the network maps and analyses will additionally help the Partnership, as it transitions to the TS LIP.
Balancing the Budget but who’s Left to Budget the Balance?12
MethodologyThis project received approval from University of Toronto’s Office of Research Ethics. A network survey was administered with immigrant and settlement service providers within the TE LIP. Although survey respondents were representing organizations, the unit of analysis was not the individuals nor their organization, but rather the relationships between them.
Survey participants were professionals working within the broader community sector, either directly with newcomers, or indirectly on program and policy related issues.
■ In depth consultations and discussions with representatives from WoodGreen Community Services were instrumental in developing the survey instrument
■ A dataset containing 136 names was compiled by WoodGreen Community Services and served as the main contact list for those to receive the survey
■ The list included individuals directly involved within the TE LIP (i.e. Partnership Council members or those conducting their work within specific workgroups) but was also extended to contain members of local networks and neighbouring LIPs
■ The survey was tested for validity (if its content appropriately assesses TE LIP’s collaborative relationships) and reliability (inter-raters’ level of agreement regarding the wording, content and format of each survey question)
■ A convenience sample of five participants completed the online network mapping survey and rated its questions on a score card
■ Survey testing scores were analyzed with a statistical software program (SPSS) and informed the instrument’s revisions
■ 136 settlement service providers were invited to electronically complete the revised survey ■ Outreach was conducted through follow-up emails and phone calls ■ 70 professionals responded ■ Participants provided basic organizational information (type of organization, sector, length
of time worked within the sector, professional role), job details (geographic catchment areas, workgroups, affiliation to local networks, involvement in neighbouring LIPs) and were prompted to identify people to whom they are connected, by selecting them from a list of names
■ Service providers were asked to select their colleagues based on four dimensions of collaboration: current working relationship, innovation, leadership and potential cooperation
■ Respondents additionally identified collaborative relationships with 145 professionals not originally included in our dataset, giving us a total of 281 named stakeholders delivering settlement services within the TE LIP
■ Network maps were created with a network analysis software package (Smart Network Analyzer)
■ Data was further analyzed with In-Flow, a different social network analysis software, for density (number of connections as compared with the maximum number of possible connections), average path length (number of steps connecting individuals) and influence (stakeholders’ strategic position within the overall network) on all four collaboration dimensions and on a variety of demographic combinations
■ Maps are based either on respondents’ (n=70) or named stakeholders’ (n= 281) demographic or professional characteristics
■ Each map indicates the exact number of members supporting its professional linkages ■ Informal interviews (unstructured, hand written) were conducted with three TE LIP
stakeholders, in order to contextualize the Partnership’s restructuring process
October 2012 13
Survey Results
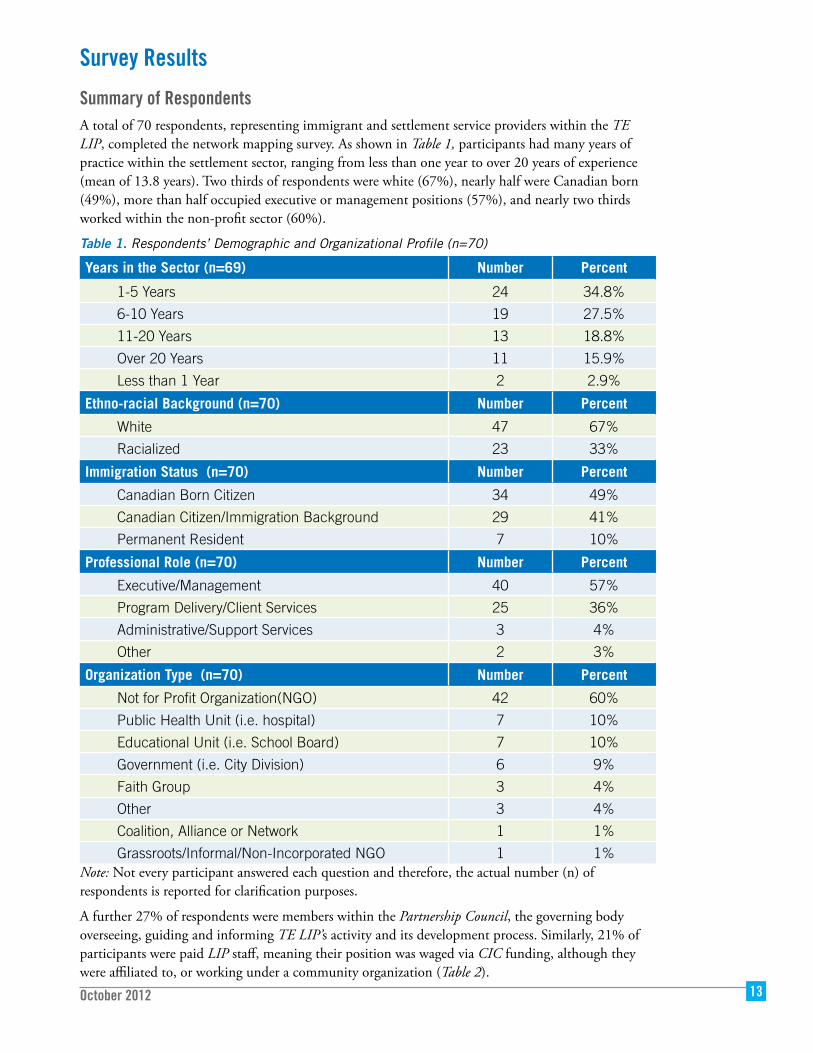
Summary of RespondentsA total of 70 respondents, representing immigrant and settlement service providers within the TE LIP, completed the network mapping survey. As shown in Table 1, participants had many years of practice within the settlement sector, ranging from less than one year to over 20 years of experience (mean of 13.8 years). Two thirds of respondents were white (67%), nearly half were Canadian born (49%), more than half occupied executive or management positions (57%), and nearly two thirds worked within the non-profit sector (60%).
Table 1. Respondents’ Demographic and Organizational Profile (n=70)
Years in the Sector (n=69) Number Percent
1-5 Years 24 34.8%
6-10 Years 19 27.5%
11-20 Years 13 18.8%
Over 20 Years 11 15.9%
Less than 1 Year 2 2.9%
Ethno-racial Background (n=70) Number Percent
White 47 67%
Racialized 23 33%
Immigration Status (n=70) Number Percent
Canadian Born Citizen 34 49%
Canadian Citizen/Immigration Background 29 41%
Permanent Resident 7 10%
Professional Role (n=70) Number Percent
Executive/Management 40 57%
Program Delivery/Client Services 25 36%
Administrative/Support Services 3 4%
Other 2 3%
Organization Type (n=70) Number Percent
Not for Profit Organization(NGO) 42 60%
Public Health Unit (i.e. hospital) 7 10%
Educational Unit (i.e. School Board) 7 10%
Government (i.e. City Division) 6 9%
Faith Group 3 4%
Other 3 4%
Coalition, Alliance or Network 1 1%
Grassroots/Informal/Non-Incorporated NGO 1 1%Note: Not every participant answered each question and therefore, the actual number (n) of respondents is reported for clarification purposes.
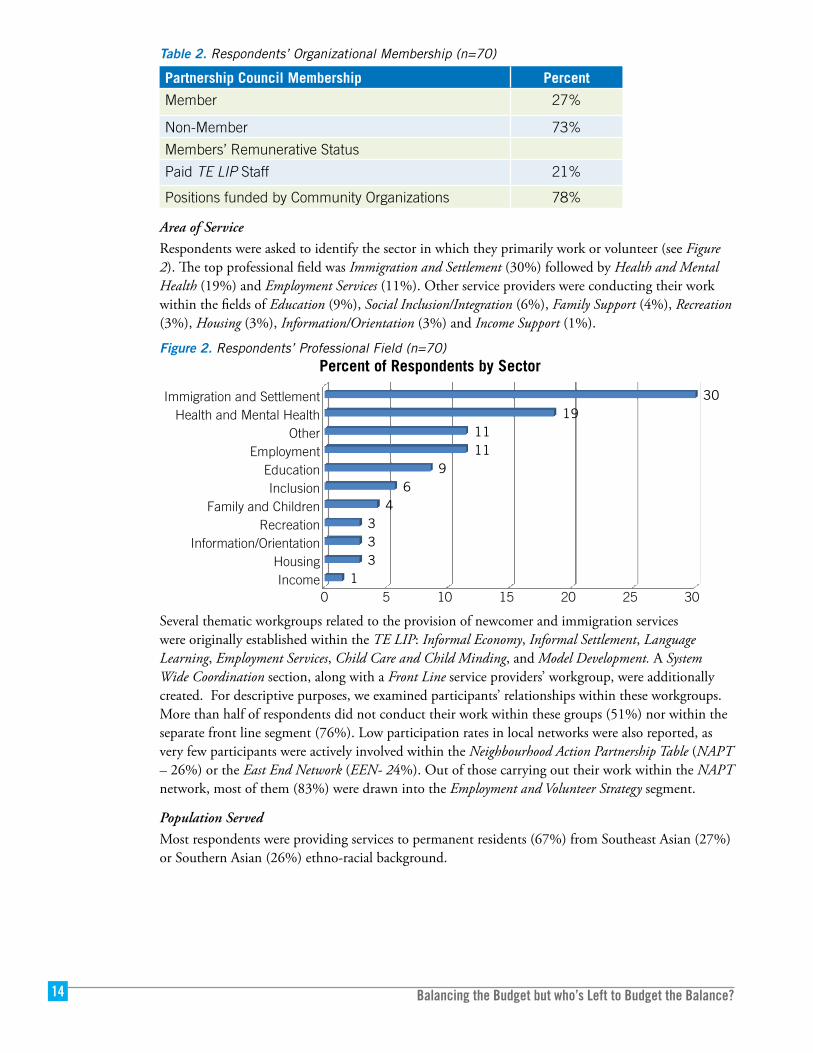
A further 27% of respondents were members within the Partnership Council, the governing body overseeing, guiding and informing TE LIP’s activity and its development process. Similarly, 21% of participants were paid LIP staff, meaning their position was waged via CIC funding, although they were affiliated to, or working under a community organization (Table 2).
Balancing the Budget but who’s Left to Budget the Balance?14
Table 2. Respondents’ Organizational Membership (n=70)
Partnership Council Membership Percent
Member 27%
Non-Member 73%
Members’ Remunerative Status
Paid TE LIP Staff 21%
Positions funded by Community Organizations 78%
Area of Service
Respondents were asked to identify the sector in which they primarily work or volunteer (see Figure 2). The top professional field was Immigration and Settlement (30%) followed by Health and Mental Health (19%) and Employment Services (11%). Other service providers were conducting their work within the fields of Education (9%), Social Inclusion/Integration (6%), Family Support (4%), Recreation (3%), Housing (3%), Information/Orientation (3%) and Income Support (1%).
Figure 2. Respondents’ Professional Field (n=70)
0 5 10 15 20 25 30Income
HousingInformation/Orientation
RecreationFamily and Children
InclusionEducation
EmploymentOther
Health and Mental HealthImmigration and Settlement
1333
46
91111
1930
Percent of Respondents by Sector
Several thematic workgroups related to the provision of newcomer and immigration services were originally established within the TE LIP: Informal Economy, Informal Settlement, Language Learning, Employment Services, Child Care and Child Minding, and Model Development. A System Wide Coordination section, along with a Front Line service providers’ workgroup, were additionally created. For descriptive purposes, we examined participants’ relationships within these workgroups. More than half of respondents did not conduct their work within these groups (51%) nor within the separate front line segment (76%). Low participation rates in local networks were also reported, as very few participants were actively involved within the Neighbourhood Action Partnership Table (NAPT – 26%) or the East End Network (EEN- 24%). Out of those carrying out their work within the NAPT network, most of them (83%) were drawn into the Employment and Volunteer Strategy segment.
Population Served
Most respondents were providing services to permanent residents (67%) from Southeast Asian (27%) or Southern Asian (26%) ethno-racial background.
October 2012 15
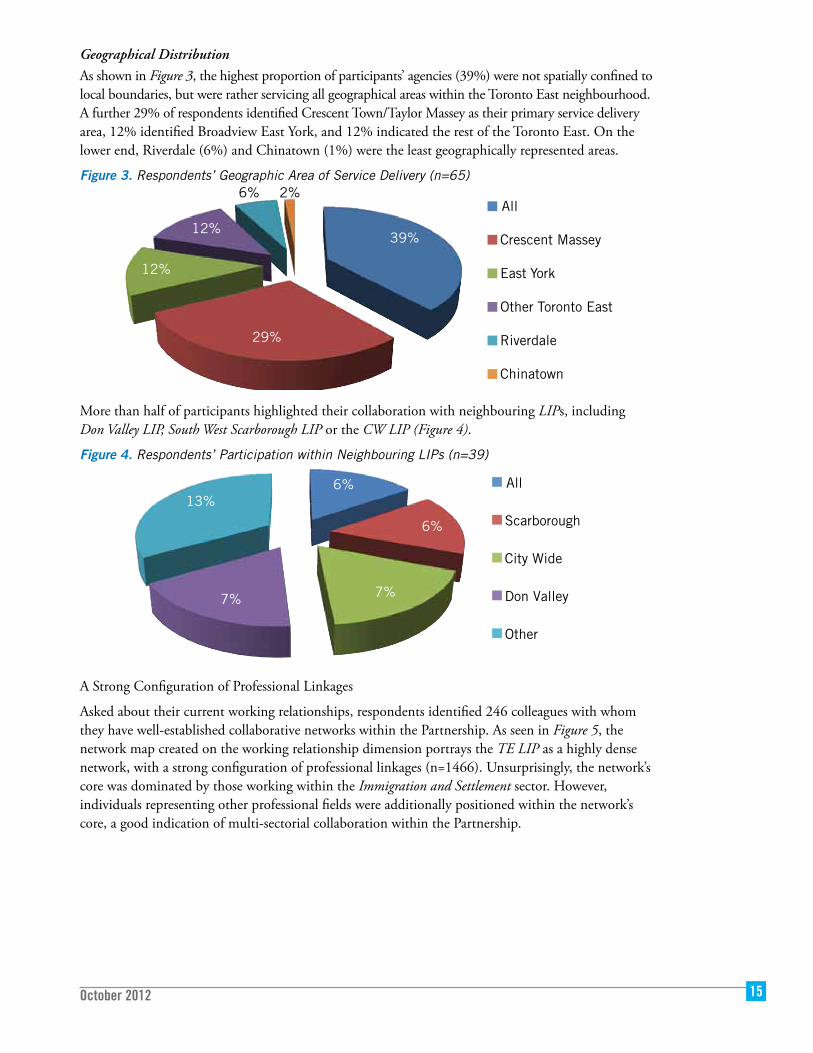
Geographical Distribution
As shown in Figure 3, the highest proportion of participants’ agencies (39%) were not spatially confined to local boundaries, but were rather servicing all geographical areas within the Toronto East neighbourhood. A further 29% of respondents identified Crescent Town/Taylor Massey as their primary service delivery area, 12% identified Broadview East York, and 12% indicated the rest of the Toronto East. On the lower end, Riverdale (6%) and Chinatown (1%) were the least geographically represented areas.
Figure 3. Respondents’ Geographic Area of Service Delivery (n=65)
39%
29%
12%
12%
6% 2% All
Crescent Massey
East York
Other Toronto East
Riverdale
Chinatown
More than half of participants highlighted their collaboration with neighbouring LIPs, including Don Valley LIP, South West Scarborough LIP or the CW LIP (Figure 4).
Figure 4. Respondents’ Participation within Neighbouring LIPs (n=39)
6%
6%
7% 7%
13% All
Scarborough
City Wide
Don Valley
Other
A Strong Configuration of Professional Linkages
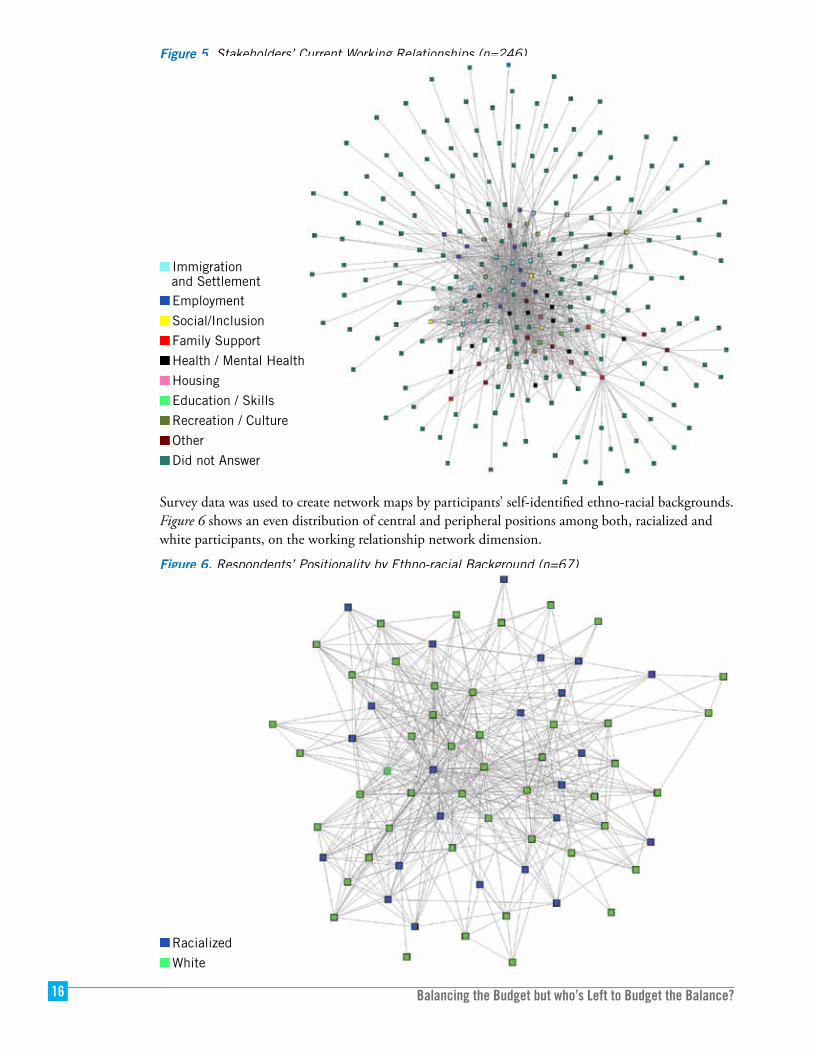
Asked about their current working relationships, respondents identified 246 colleagues with whom they have well-established collaborative networks within the Partnership. As seen in Figure 5, the network map created on the working relationship dimension portrays the TE LIP as a highly dense network, with a strong configuration of professional linkages (n=1466). Unsurprisingly, the network’s core was dominated by those working within the Immigration and Settlement sector. However, individuals representing other professional fields were additionally positioned within the network’s core, a good indication of multi-sectorial collaboration within the Partnership.
Balancing the Budget but who’s Left to Budget the Balance?16
Figure 5. Stakeholders’ Current Working Relationships (n=246)
Survey data was used to create network maps by participants’ self-identified ethno-racial backgrounds. Figure 6 shows an even distribution of central and peripheral positions among both, racialized and white participants, on the working relationship network dimension.
Figure 6. Respondents’ Positionality by Ethno-racial Background (n=67)
Immigration and Settlement Employment
Social/Inclusion
Family Support
Health / Mental Health
Housing
Education / Skills
Recreation / Culture
Other
Did not Answer
Racialized
White
October 2012 17
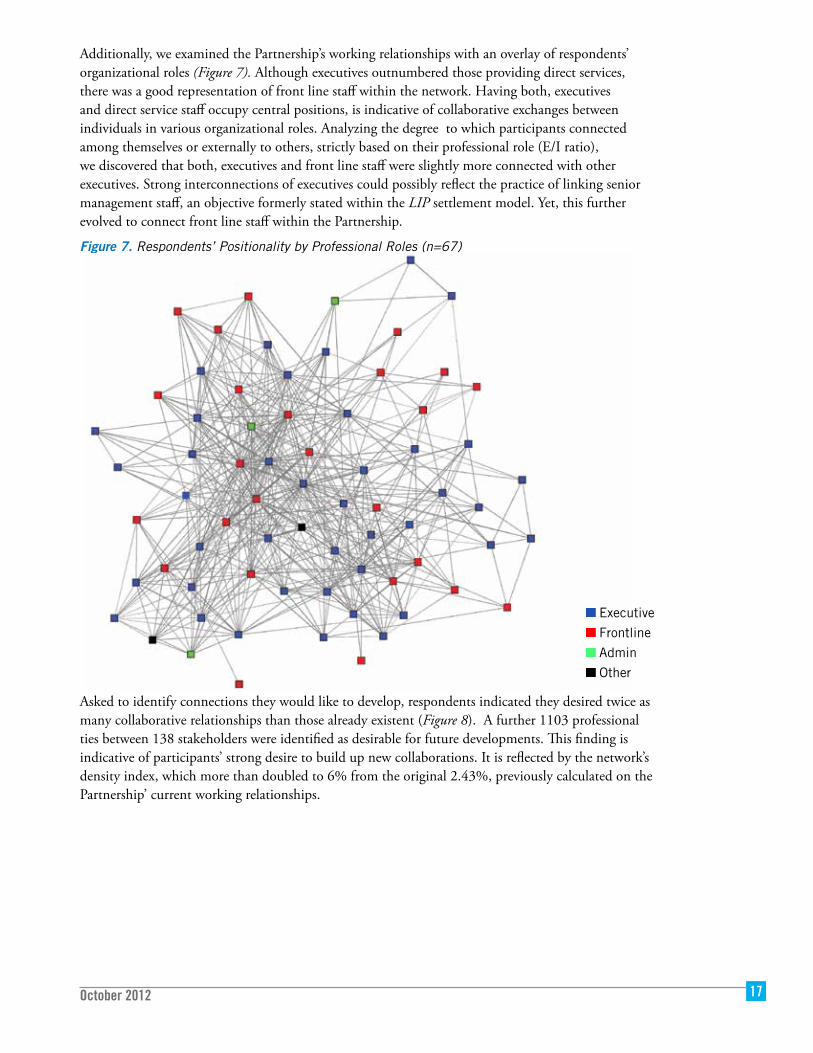
Additionally, we examined the Partnership’s working relationships with an overlay of respondents’ organizational roles (Figure 7). Although executives outnumbered those providing direct services, there was a good representation of front line staff within the network. Having both, executives and direct service staff occupy central positions, is indicative of collaborative exchanges between individuals in various organizational roles. Analyzing the degree to which participants connected among themselves or externally to others, strictly based on their professional role (E/I ratio), we discovered that both, executives and front line staff were slightly more connected with other executives. Strong interconnections of executives could possibly reflect the practice of linking senior management staff, an objective formerly stated within the LIP settlement model. Yet, this further evolved to connect front line staff within the Partnership.
Figure 7. Respondents’ Positionality by Professional Roles (n=67)
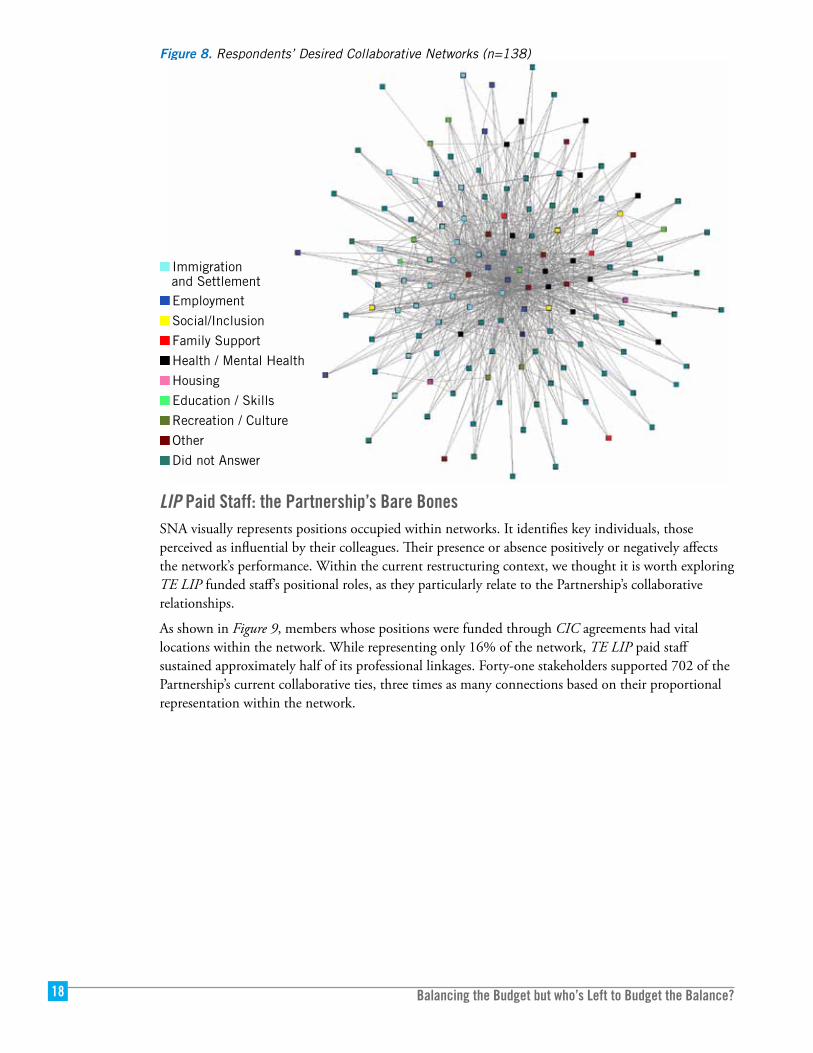
Asked to identify connections they would like to develop, respondents indicated they desired twice as many collaborative relationships than those already existent (Figure 8). A further 1103 professional ties between 138 stakeholders were identified as desirable for future developments. This finding is indicative of participants’ strong desire to build up new collaborations. It is reflected by the network’s density index, which more than doubled to 6% from the original 2.43%, previously calculated on the Partnership’ current working relationships.
Executive
Frontline
Admin
Other
Balancing the Budget but who’s Left to Budget the Balance?18
Figure 8. Respondents’ Desired Collaborative Networks (n=138)
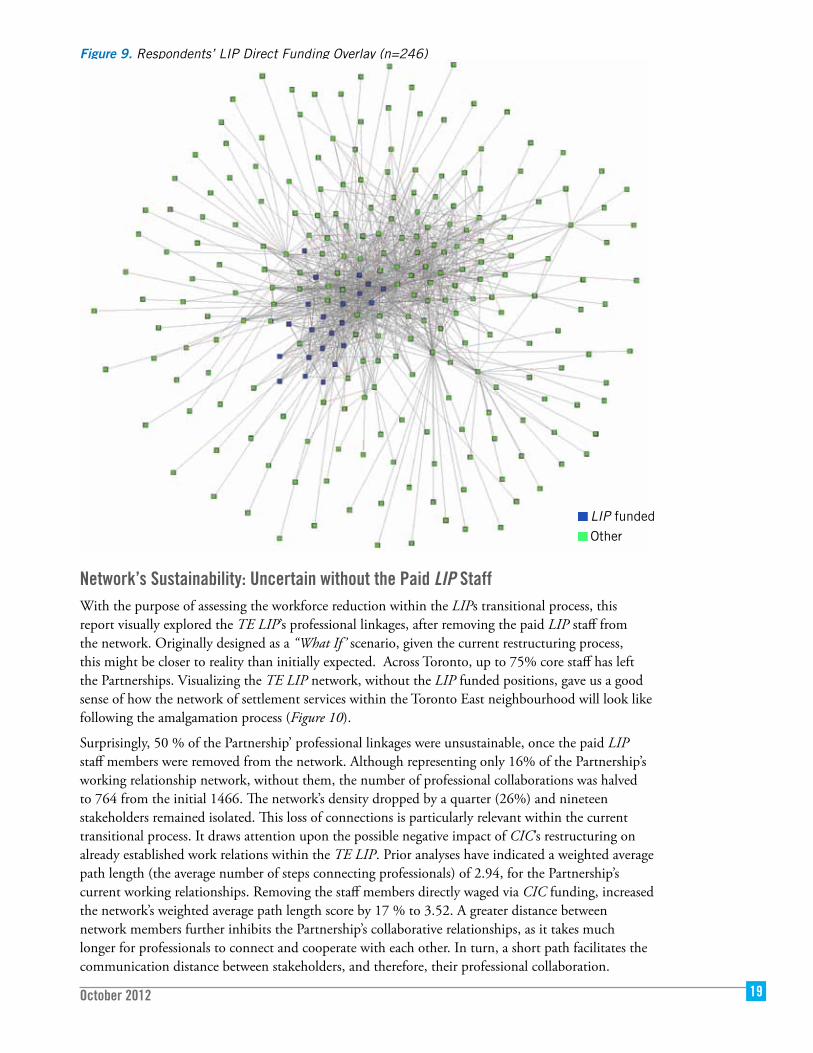
LIP Paid Staff: the Partnership’s Bare Bones SNA visually represents positions occupied within networks. It identifies key individuals, those perceived as influential by their colleagues. Their presence or absence positively or negatively affects the network’s performance. Within the current restructuring context, we thought it is worth exploring TE LIP funded staff’s positional roles, as they particularly relate to the Partnership’s collaborative relationships.
As shown in Figure 9, members whose positions were funded through CIC agreements had vital locations within the network. While representing only 16% of the network, TE LIP paid staff sustained approximately half of its professional linkages. Forty-one stakeholders supported 702 of the Partnership’s current collaborative ties, three times as many connections based on their proportional representation within the network.
Immigration and Settlement Employment
Social/Inclusion
Family Support
Health / Mental Health
Housing
Education / Skills
Recreation / Culture
Other
Did not Answer
October 2012 19
Figure 9. Respondents’ LIP Direct Funding Overlay (n=246)
Network’s Sustainability: Uncertain without the Paid LIP StaffWith the purpose of assessing the workforce reduction within the LIPs transitional process, this report visually explored the TE LIP’s professional linkages, after removing the paid LIP staff from the network. Originally designed as a “What If ’ scenario, given the current restructuring process, this might be closer to reality than initially expected. Across Toronto, up to 75% core staff has left the Partnerships. Visualizing the TE LIP network, without the LIP funded positions, gave us a good sense of how the network of settlement services within the Toronto East neighbourhood will look like following the amalgamation process (Figure 10).
Surprisingly, 50 % of the Partnership’ professional linkages were unsustainable, once the paid LIP staff members were removed from the network. Although representing only 16% of the Partnership’s working relationship network, without them, the number of professional collaborations was halved to 764 from the initial 1466. The network’s density dropped by a quarter (26%) and nineteen stakeholders remained isolated. This loss of connections is particularly relevant within the current transitional process. It draws attention upon the possible negative impact of CIC’s restructuring on already established work relations within the TE LIP. Prior analyses have indicated a weighted average path length (the average number of steps connecting professionals) of 2.94, for the Partnership’s current working relationships. Removing the staff members directly waged via CIC funding, increased the network’s weighted average path length score by 17 % to 3.52. A greater distance between network members further inhibits the Partnership’s collaborative relationships, as it takes much longer for professionals to connect and cooperate with each other. In turn, a short path facilitates the communication distance between stakeholders, and therefore, their professional collaboration.
LIP funded
Other
Balancing the Budget but who’s Left to Budget the Balance?20
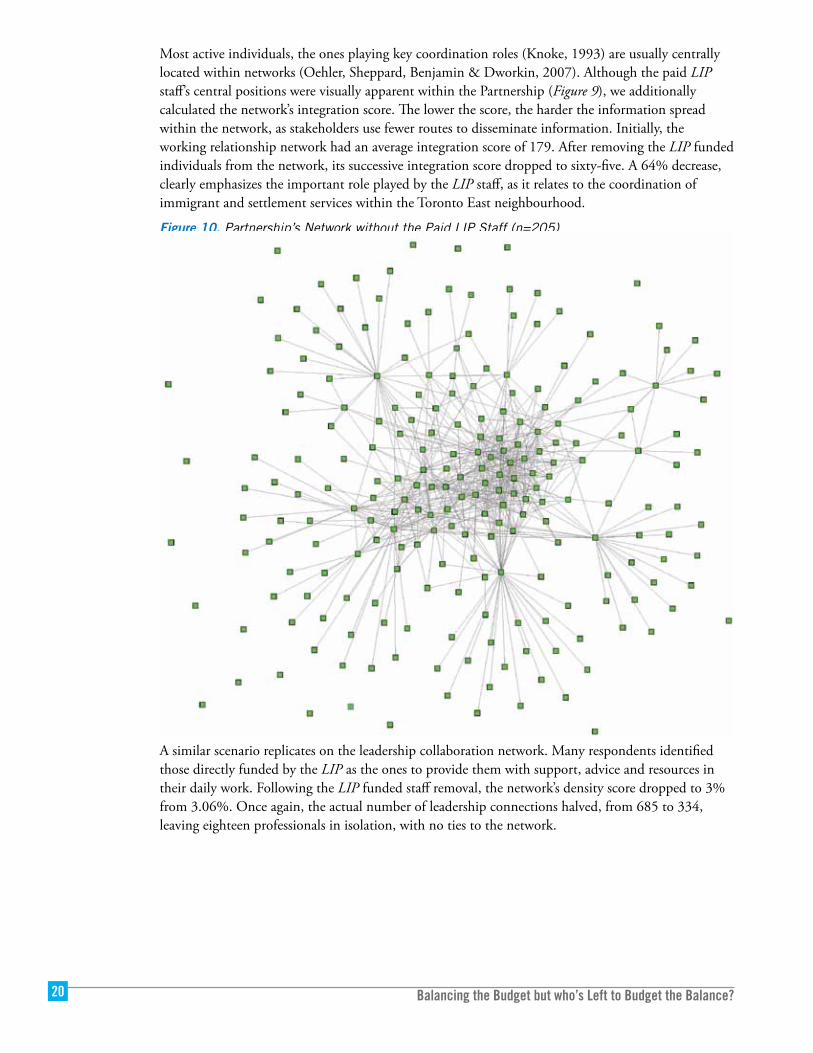
Most active individuals, the ones playing key coordination roles (Knoke, 1993) are usually centrally located within networks (Oehler, Sheppard, Benjamin & Dworkin, 2007). Although the paid LIP staff’s central positions were visually apparent within the Partnership (Figure 9), we additionally calculated the network’s integration score. The lower the score, the harder the information spread within the network, as stakeholders use fewer routes to disseminate information. Initially, the working relationship network had an average integration score of 179. After removing the LIP funded individuals from the network, its successive integration score dropped to sixty-five. A 64% decrease, clearly emphasizes the important role played by the LIP staff, as it relates to the coordination of immigrant and settlement services within the Toronto East neighbourhood.
Figure 10. Partnership’s Network without the Paid LIP Staff (n=205)
A similar scenario replicates on the leadership collaboration network. Many respondents identified those directly funded by the LIP as the ones to provide them with support, advice and resources in their daily work. Following the LIP funded staff removal, the network’s density score dropped to 3% from 3.06%. Once again, the actual number of leadership connections halved, from 685 to 334, leaving eighteen professionals in isolation, with no ties to the network.
October 2012 21
ConclusionBack to Square OneFindings outlined in this report demonstrate that community services for immigrants have reached a high level of integration within the geographically defined Toronto East neighbourhood. Partnership’s stakeholders established a dense and reachable network during its short period of operation, of just over two years. Relationships were diverse, in regards to participants’ racial and organizational background. Crossing sectors and organizations, traversing geographical communities and many neighbouring LIPs, the Partnership’s professional linkages reflected a highly integrated immigrant and settlement service provision. Stakeholders have indicated their aspirations to further build and develop the current working relationships, as they would like to develop twice as many connections than those already existent.
The roles played by the funded LIP staff were vital to the Partnership’s operational performance. Paid LIP positions were ‘brokering’ positions (Bender-deMoll, 2008), as defined by network mapping terminology. Highly central within the network, they were held by well-connected individuals, those likely to play a leading role in future collaborations. Bringing together professionals otherwise isolated, and connecting peripheral individuals with key network stakeholders, the paid LIP staff was vital in sustaining the coordination and integration of settlement services and setting up the Partnership’s future collaboration and knowledge sharing.
Representative of only 16% of the Partnership’s current professional collaborations, those holding LIP funded positions sustained 50% of its connections. In our hypothetical analysis, the collaborative relations within the Toronto East neighbourhood became fragmented without them: the network’s density was reduced by a quarter, its professional linkages halved, and almost a tenth of the network remained isolated. Within the current restructuring process, such a scenario is certainly possible, particularly as half of the LIP positions have been eliminated through the amalgamation process. It is indeed difficult to envision a successful regional LIP model of immigrant and settlement service coordination, without the very same key actors sustaining such professional linkages.
As dense networks smooth communication flows (Valente, Ping Chou & Pentz, 2007) it would be beneficial to enhance the LIP funded staff’s roles, by deliberately connecting them with peripheral members within the network (Stephenson, 2008). This would realize better returns on the multi-sectorial coordination and integration of immigrant services. It will also make better use of individuals’ central network positions and their professional linkages. Conversely, eliminating their positions and failing to support their already established connections, could lead to organizational failure (Cross, Borgatti & Parker, 2002) and could impair the network’s effectiveness and relationships’ development. As social interactions are manifestations of organizational resources (Tsai & Ghosal, 1998), we expect the CIC’s restructuring process and its subsequent workforce reduction to negatively impact the overall integration of settlement services within the Toronto East neighbourhood and within all other LIPs across the city. This change could result in not more with less but in less with fewer.
Asked about the LIP restructuring process, stakeholders worried their settlement service provision would be locally disentranced.
My problem is that we might be growing the project too big… so connections won’t be strong…less frequent and more formal…”
The semi informal interviews conducted with some of the Partnership’s stakeholders, highlighted the current TE LIP struggle in its transition to the regional model. Member agencies were left with no choice but to take on the restructuring process themselves. Disagreements were common at
Balancing the Budget but who’s Left to Budget the Balance?22
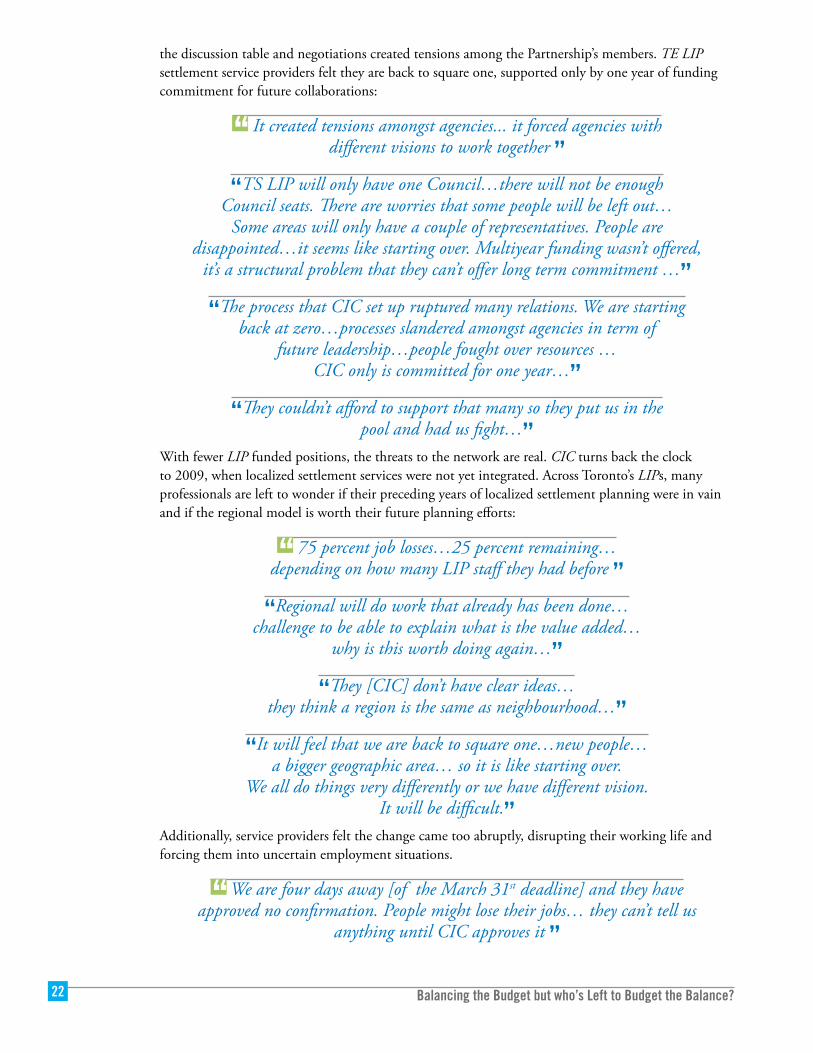
the discussion table and negotiations created tensions among the Partnership’s members. TE LIP settlement service providers felt they are back to square one, supported only by one year of funding commitment for future collaborations:
It created tensions amongst agencies... it forced agencies with different visions to work together ”
“TS LIP will only have one Council…there will not be enough Council seats. There are worries that some people will be left out…
Some areas will only have a couple of representatives. People are disappointed…it seems like starting over. Multiyear funding wasn’t offered,
it’s a structural problem that they can’t offer long term commitment …”
“The process that CIC set up ruptured many relations. We are starting back at zero…processes slandered amongst agencies in term of
future leadership…people fought over resources … CIC only is committed for one year…”
“They couldn’t afford to support that many so they put us in the pool and had us fight…”
With fewer LIP funded positions, the threats to the network are real. CIC turns back the clock to 2009, when localized settlement services were not yet integrated. Across Toronto’s LIPs, many professionals are left to wonder if their preceding years of localized settlement planning were in vain and if the regional model is worth their future planning efforts:
75 percent job losses…25 percent remaining… depending on how many LIP staff they had before ”
“Regional will do work that already has been done… challenge to be able to explain what is the value added…
why is this worth doing again…”
“They [CIC] don’t have clear ideas… they think a region is the same as neighbourhood…”
“It will feel that we are back to square one…new people… a bigger geographic area… so it is like starting over.
We all do things very differently or we have different vision. It will be difficult.”
Additionally, service providers felt the change came too abruptly, disrupting their working life and forcing them into uncertain employment situations.
We are four days away [of the March 31st deadline] and they have approved no confirmation. People might lose their jobs… they can’t tell us
anything until CIC approves it ”
October 2012 23
“Agencies also have protocols unionized …so everyone had to be laid off….two weeks ago…with the understanding that we do expect
something but we don’t know what and when,… but internally the HR stuff closed down, email accounts, clean up desk…They made the announcement before Christmas; that means they knew
before, but they didn’t give people enough time ”CIC’s decision to change the LIP neighbourhood based model, without evaluating its settlement services coordination, could possibly challenge the continuation of already established professional networks within Toronto East neighbourhood and potentially within all other areas across the city. To efficiently use social networks for social ends and connect people to achieve collective goals (Plastrik & Taylor, 2004), CIC could have continued to support the already established professional relationships, as a best practice for developing stronger collaborations in the future.
It is uncertain if CIC’s stated objective of sustaining and strengthening the local integration capacity of immigrant and settlement services will match its newly adopted regional model, or if the local professional collaborations will extend to the new regional Partnerships. Networks could possibly grow weaker, given the loss of the paid LIP staff’s cohesive role.
Newcomers experience economic and social changes first at the neighbourhood level (Galabuzi & Teeluckksingh, 2010) and often, local organizations are sites for addressing newly arrived immigrants’ social exclusion (Galabuzi & Teeluckksingh, 2010). They best support civic participation, facilitate long term integration, coordinate communication and maintain existing partnerships (Dowding & Razi, 2006). As proximal points of contact for people who seek help, they tend to represent flexible service hubs for ethno-cultural diverse immigrants in their community (Yan & Lauer, 2008). Neighbourhood organizations are best equipped to identify local needs and to mobilize community resources to respond to such needs (Jenson 2001). In fact, an exploratory study assessing the effectiveness of local neighborhood houses, showed their positive impact on newcomers’ ability to connect, integrate and settle within the community (Yan & Lauer, 2008). It is problematic that LIPs will no longer operate at the local level. Over and above, how will the regional coordination translate into the delivery of settlement services? Will the amalgamated LIPs continue to respond to newcomers’ needs?
Similar questions should be addressed by all funders when considering restructuring and downsizing strategies, to avoid entrenching an already marginalized settlement service system (Richmond & Shields, 2005). CIC’s proceeding with the amalgamation, without thoroughly assessing the professional dynamics within the neighboured based LIPs, could possibly impede the future of community-based planning, as it relates to newcomers’ service provision.
This report hopes to provide some baseline information on the structure of working relations within the settlement sector. It credits the TE LIP high level of integration and coordination of settlement services to the Partnership, although no previous relational assessments were conducted. It also raises questions about the LIPs transition to the regional model, in relation to newcomers’ needs, the very same needs that should be at the forefront of any settlement service delivery model. A renewed stated commitment (Jenson, 2001) with better funding and not just more funding (Richmond & Shields, 2005) is needed to create opportunities for newcomers’ integration (Dowding & Razi, 2006). It is desirable that funders will gain a structural understanding of the overall settlement system in order to advance valuable policies and strategies (Moore & Wesley, 2011). Bringing together different stakeholders, relying on community consultations, or developing participatory planning processes, could be useful ways for expanding a comprehensive vision of immigration policy to truly support newcomers’ settlement and integration.
Balancing the Budget but who’s Left to Budget the Balance?24
Recommendations 1. Reinstate funding for the LIP neighbourhood based operational model. Restructuring the LIPs entails moving away from a neighbourhood based settlement model. Settlement services are sustained by relational processes. Relations take time to develop and could potentially be lost within the larger regional Partnerships. The consequential workforce reduction may also impede the provision of locally based immigrant services. It is uncertain if the regional model is well equipped to develop a comprehensive settlement service delivery plan for newly arrived immigrants. Perhaps Toronto, a city with half of its residents born outside Canada, is not the best place to test the regional model’s ability to address newcomers’ social, cultural and economic needs.
2. Make use of evidence informed evaluation research to guide the LIPs future developments. It is important for funders to increase their research capacity in order to better explore the collaborative and professional linkages within the LIP settlement model of service delivery. Restructuring the former neighbourhood based LIPs, without previously evaluating the coordination and integration of immigrant and settlement service delivery, indicates a lack of foresight in providing the best services for Canada’s newcomers. Cutting back investments that could improve newly arrived immigrants’ settlement process may have negative implications for their social and economic integration. Although CIC’s concerns of service duplication are well-founded, there is no evidence of services being doubled up. Moving away from the neighbourhood based settlement model on the fear of service duplication, could unfortunately translate into reduced service coordination for newcomers.
3. Adopt a long term perspective on the settlement and integration process. Immigrant and settlement service recipients would benefit from a long term Strategic Plan lead by CIC. A multi-sectorial and multi stakeholder community consultation process would best guide the future development, planning, coordination and integration of its proposed model of immigrant and settlement services.
October 2012 25
References Amanat, A. (2011). Tory-Liberal Brawl Leaves Ontario’s Newcomers Nowhere. Retrieved May, 14, 2011 from www.sagennext.com/2011/04/12/tory-liberal-brawl-leaves-ontario%E2%80%99s-newcomers-nowhere.
Bender-deMoll, S. (2008). Potential Human Rights Uses of Network Analysis and Mapping: A report to the Science and Human Rights Program of the American Association for the Advancement of Science. Retrieved March 2 2011, from shr.aaas.org/networkmapping/Net_Mapping_Report.pdf
Brown, J., Hannis, D.(2008).Community Development in Canada. Toronto, ON: Pearson Education Canada.
Burr, K. (2011). Local Immigration Partnerships: Building Welcoming and Inclusive Communities through Multi-Level Governance. Retrieved March 2, 2011 from www.policyresearch.gc.ca/page.
City of Toronto (2011). MSW Field Practicum Orientation. An Overview. Toronto, ON: City of Toronto.
Cross, R., Borgatti, S.P., Parker, A. (2002). Making Invisible Work Visible: Using Social Network Analysis to Support Strategic Collaboration. California Management Review, 44 (2), 25- 46.
Dowding, J., Razi, F. (2006). A Call to Action: Leading the Way to Successful Immigrant Integration. In J.S. Frideres (ed.), Our Diverse Cities (pp. 162-168). Toronto, ON: Metropolis.
Flap, H., Volker, B. (2001).Goal Specific Social Capital and Job Satisfaction. Effects of Different Types of Networks Instrumental and Social Aspects of Work. Social Networks, 23, 297-320.
Galabuzi, G.E., Teeluckksingh, C. (2010). Social Cohesion, Social Exclusion, Social Capital. Region of Peel Immigration Discussion Paper. Mississauga, ON: Region of Peel Human Services.
George, U. (2002). A Needs Based Model for Settlement Service Delivery for Newcomers to Canada. International Social Work, 45(4), 465-480.
Grant, H., Sweetman, A. (2004). Introduction to Economic and Urban Issues in Canadian Immigration Policy. Canadian Journal of Urban Research, 3 (1): 1-24.
Hilderbrandt, T., Wilson, B. (2010). A Recovery- Free Zone: The Unyielding Impact of the Economic Downturn on Nonprofit Community Social Services in Ontario. Toronto, ON: Social Planning Toronto.
Hoffer-Gittell, J., Weiss, L. (2004). Coordination Networks Within and Across Organizations: A Multi-level Framework. Journal of Management Studies, 41(1), 127-153.
Hoppe, B., Reinelt, C. (2010). Social Network Analysis and the Evaluation of Leadership Networks. The Leadership Quarterly, 21, 600-619.
Jenson, J. (2001). Building Citizenship: Governance and Service Provision in Canada. Discussion paper No F| 17. Ottawa, ON: Canadian Policy Research Networks.
Landolt, P., Goldring, L., Bernhard, J. (2009). Between Grassroots Politics and the Ethnicizing Imperative of the Multicultural State: Latin American Immigrant Organizations in Toronto. CERIS Working Paper No.73. Toronto, ON: CERIS- The Ontario Metropolis Centre.
Mehler, P.A. (2010, December 3). Jobless Rate Up for Toronto Immigrants. The Globe and Mail (Toronto, ON). Retrieved February 3 2010 from www.theglobeandmail.com/news/national/toronto/jobless-rate-up-for-toronto-immigrants/article1825182/
Moore, M.L., Westley, F.R. (2011). Public Sector Policy and Strategies for Facilitating Social Innovation. Waterloo, ON: Horizons. Policy Research Initiatives.
Moynihan, D.P., Pandey, S.K. (2007). The Ties that Bind: Social Networks, Person-Organization Value Fit and Turnover Intention. Journal of Public Administration Research and Theory, 18, 205-227.
Balancing the Budget but who’s Left to Budget the Balance?26
Norquay, R. (2004). Immigrant Identity and the Non-profit: A Case Study of the Afghan Women’s Organization. CERIS Working Paper No.29. Toronto, ON: CERIS-The Ontario Metropolis Centre.
Oehler, K., Sheppard, S.C., Benjamin, B., Dworkin, L. K. (2007). Network Analysis and the Social Impact of Cultural Arts Organizations. North Adams, MA: Center for Creative Community Development.
Omidvar, R., Richmond, T. (2003). Perspectives on Social Inclusion. Immigrant Settlement and Social Inclusion in Canada. Toronto, ON: Laidlaw Foundation.
Plastrik, P., Taylor, M. (2004). Network Power for Philanthropy and Nonprofits. Boston, MA: Barr Foundation.
Pope, J., Lewis, J.M. (2008). Improving Partnership Governance: Using a Network Approach to Evaluate Partnerships in Victoria. The Australian Journal of Public Administration, 67 (4), 443-456.
Richmond, T., Shields, J. (2005). NGO-Government Relations Immigrant Services: Contradictions and Challenges. Journal of International Migration and Integration, 6 (3/4), 513-526.
Rose, D., Carassco, P., Charboneau, J. (1998). The Role of «Weak Ties» in the Settlement Experiences of Immigrant Women with Young Children: The Case of Central Americans in Montreal. CERIS Working Paper No.4. Toronto, ON: CERIS- The Ontario Metropolis Centre.
Schellenberg, G., Feng, H. (2008). The Economic Well- Being of Recent Immigrants to Canada. Retrieved 29 January 2011 from canada.metropolis.net/pdfs/econ_well_being_e.pdf.
Schultz-Jones, B., Cheung, N. (2008). Collaboration Networks in a Public Service Model: Dimensions of Effectiveness in Theory and Practice. Proceedings of the American Society for Information Science and Technology, 45 (1), 1-6.
Scott, J. (2000). Social Network Analysis. A Handbook. Sage, London, UK.
Shah, P.P. (2000). Network Destruction: The Structural Implications of Downsizing. The Academy of Management Journal, 43 (1), 101-112.
Simich, L., Beiser, M., Stewart, M., Mwakarimba, E. (2005). Providing Social Supports for Immigrants and Refugees in Canada. Journal of Immigrant Health, 7 (4), 259-267.
Stephenson, K. (2008). The Community Network Solution. Strategy+Business, 49, 1-6.
The Canada-Ontario Immigration Agreement (2005).Retrieved March 3, 2011 from www.cic.gc.ca/english/department/laws-policy/agreements/ontario/ont-2005-agree.asp
Tsai, W., Ghoshal, S. (1998). Social Capital and Value Creation: The Role of Intrafirm Networks. Academy of Management Journal, 41 (4), 464- 476.
Tufts, S., Lemoine, M., Phan, M., Kelly, P., Lo, L., Preston, V., Shields, J. (2010). What Are the Labour Market Outcomes for Immigrants Planning to Work in Regulated and Unregulated Occupations. Analytical Report 5. Toronto, ON: Toronto Immigrant Employment Data Initiative.
Valente, T.W., Chou, C. P., Pentz, M.A. (2007). Community Coalitions as a System: Effects of Network Change on Adoption of Evidence-Based Substance Abuse Prevention. American Journal of Public Health, 97 (5), 880-886.
Yan, M.C., Lauer, S. (2008). Social Capital and Ethno-Cultural Diverse Immigrants: A Canadian Study on Settlement House and Social Integration. Journal of Ethnic and Cultural Diversity in Social Work, 17 (3), 229-250.
WoodGreen Community Services.(2010). Final Report. Toronto East Local Immigration Partnership. Toronto, ON: WoodGreen Community Services.
Zyglidopoulos, S.C. (2005). The Impact of Downsizing on Corporate Reputation. British Journal of Management,16, 253-259.

metastrategies.com
Related Documents