Atmosphere 2021, 12, 115. https://doi.org/10.3390/atmos12010115 www.mdpi.com/journal/atmosphere Article Building Performance Evaluation of a New Hospital Building in the UK: Balancing Indoor Environmental Quality and Energy Performance Nishesh Jain 1,2, *, Esfand Burman 1 , Samuel Stamp 1 , Clive Shrubsole 1 , Roderic Bunn 3 , Tin Oberman 1 , Edward Barrett 1 , Francesco Aletta 1 , Jian Kang 1 , Peter Raynham 1 , Dejan Mumovic 1 and Mike Davies 1 1 UCL Institute for Environmental Design and Engineering, 14 Upper Woburn Place, London WC1H 0NN, UK; [email protected] (E.B.); [email protected] (S.S.); [email protected] (C.S.); [email protected] (T.O.); [email protected] (E.B.); [email protected] (F.A.); [email protected] (J.K.); [email protected] (P.R.); [email protected] (P.M.); [email protected] (M.D.) 2 DesignBuilder Software Limited, Stroud GL5 2AD, UK 3 WMEboom, 114 Whitechapel High St, London E1 7PT, UK; [email protected] * Correspondence: [email protected] Abstract: Hospitals are controlled yet complex ecosystems which provide a therapeutic environment that promotes healing, wellbeing and work efficiency for patients and staff. As these buildings accommodate the sick and vulnerable, occupant wellbeing and good indoor environmental quality (IEQ) that deals with indoor air quality (IAQ), thermal comfort, lighting and acoustics are important objectives. As the specialist nature of hospital function demands highly controlled indoor environments, this makes them energy intensive buildings due to the complex and varying specifications for their functions and operations. This paper reports on a holistic building performance evaluation covering aspects of indoor air quality, thermal comfort, lighting, acoustics, and energy use. It assesses the performance issues and inter-relationships between IEQ and energy in a new building on a hospital campus in the city of Bristol, United Kingdom. The empirical evidence collated from this case study and the feedback received from the hospital staff help identify the endemic issues and constraints related to hospital buildings, such as the need for robust ventilation strategies in hospitals in urban areas that mitigate the effect of indoor and outdoor air pollution and ensuring the use of planned new low-carbon technologies. Whilst the existing guidelines for building design provide useful instructions for the protection of hospital buildings against ingress of particulate matter from outdoors, more advanced filtration strategies may be required to enact chemical reactions required to control the concentration levels of pollutants such as nitrogen dioxide and benzene. Further lessons for improved performance in operation and maintenance of hospitals are highlighted. These include ensuring that the increasingly available metering and monitoring data in new buildings, through building management systems, is used for efficient and optimal building operations for better IEQ and energy management. Overall, the study highlights the need for an integrated and holistic approach to building performance to ensure that healthy environments are provided while energy efficiency targets are met. Keywords: building performance evaluation; indoor environmental quality (IEQ); indoor air quality (IAQ); energy performance; hospitals 1. Introduction Indoor environmental quality (IEQ) has a direct impact on occupants’ health and wellbeing [1]. This becomes even more important in hospitals, which are complex Citation: Jain, N.; Burman, E.; Stamp, S.; Shrubsole, C.; Bunn, R.; Oberman, T.; Barrett, E.; Aletta, F.; Kang, J.; Raynham, P.; Mumovic, D.; Davies, M. Building Performance Evaluation of a New Hospital Building in the UK: Balancing Indoor Environmental Quality and Energy Performance. Atmosphere 2021, 12, 115. https://doi.org/ 10.3390/atmos12010115 Received: 9 December 2020 Accepted: 8 January 2021 Published: 15 January 2021 Publisher’s Note: MDPI stays neutral with regard to jurisdictional claims in published maps and institutional affiliations. Copyright: © 2021 by the author. Licensee MDPI, Basel, Switzerland. This article is an open access article distributed under the terms and conditions of the Creative Commons Attribution (CC BY) license (http://creativecommons.org/licenses /by/4.0/).

Welcome message from author
This document is posted to help you gain knowledge. Please leave a comment to let me know what you think about it! Share it to your friends and learn new things together.
Transcript
Atmosphere 2021, 12, 115. https://doi.org/10.3390/atmos12010115 www.mdpi.com/journal/atmosphere
Article
Building Performance Evaluation of a New Hospital Building
in the UK: Balancing Indoor Environmental Quality and
Energy Performance
Nishesh Jain 1,2,*, Esfand Burman 1, Samuel Stamp 1, Clive Shrubsole 1, Roderic Bunn 3, Tin Oberman 1,
Edward Barrett 1, Francesco Aletta 1, Jian Kang 1, Peter Raynham 1, Dejan Mumovic 1 and Mike Davies 1
1 UCL Institute for Environmental Design and Engineering, 14 Upper Woburn Place,
London WC1H 0NN, UK; [email protected] (E.B.); [email protected] (S.S.);
[email protected] (C.S.); [email protected] (T.O.); [email protected] (E.B.);
[email protected] (F.A.); [email protected] (J.K.); [email protected] (P.R.); [email protected] (P.M.);
[email protected] (M.D.) 2 DesignBuilder Software Limited, Stroud GL5 2AD, UK 3 WMEboom, 114 Whitechapel High St, London E1 7PT, UK; [email protected]
* Correspondence: [email protected]
Abstract: Hospitals are controlled yet complex ecosystems which provide a therapeutic
environment that promotes healing, wellbeing and work efficiency for patients and staff. As these
buildings accommodate the sick and vulnerable, occupant wellbeing and good indoor
environmental quality (IEQ) that deals with indoor air quality (IAQ), thermal comfort, lighting and
acoustics are important objectives. As the specialist nature of hospital function demands highly
controlled indoor environments, this makes them energy intensive buildings due to the complex
and varying specifications for their functions and operations. This paper reports on a holistic
building performance evaluation covering aspects of indoor air quality, thermal comfort, lighting,
acoustics, and energy use. It assesses the performance issues and inter-relationships between IEQ
and energy in a new building on a hospital campus in the city of Bristol, United Kingdom. The
empirical evidence collated from this case study and the feedback received from the hospital staff
help identify the endemic issues and constraints related to hospital buildings, such as the need for
robust ventilation strategies in hospitals in urban areas that mitigate the effect of indoor and
outdoor air pollution and ensuring the use of planned new low-carbon technologies. Whilst the
existing guidelines for building design provide useful instructions for the protection of hospital
buildings against ingress of particulate matter from outdoors, more advanced filtration strategies
may be required to enact chemical reactions required to control the concentration levels of
pollutants such as nitrogen dioxide and benzene. Further lessons for improved performance in
operation and maintenance of hospitals are highlighted. These include ensuring that the
increasingly available metering and monitoring data in new buildings, through building
management systems, is used for efficient and optimal building operations for better IEQ and
energy management. Overall, the study highlights the need for an integrated and holistic approach
to building performance to ensure that healthy environments are provided while energy efficiency
targets are met.
Keywords: building performance evaluation; indoor environmental quality (IEQ); indoor air
quality (IAQ); energy performance; hospitals
1. Introduction
Indoor environmental quality (IEQ) has a direct impact on occupants’ health and
wellbeing [1]. This becomes even more important in hospitals, which are complex
Citation: Jain, N.; Burman, E.;
Stamp, S.; Shrubsole, C.; Bunn, R.;
Oberman, T.; Barrett, E.; Aletta, F.;
Kang, J.; Raynham, P.; Mumovic, D.;
Davies, M. Building Performance
Evaluation of a New Hospital
Building in the UK: Balancing
Indoor Environmental Quality and
Energy Performance. Atmosphere
2021, 12, 115. https://doi.org/
10.3390/atmos12010115
Received: 9 December 2020
Accepted: 8 January 2021
Published: 15 January 2021
Publisher’s Note: MDPI stays
neutral with regard to jurisdictional
claims in published maps and
institutional affiliations.
Copyright: © 2021 by the author.
Licensee MDPI, Basel, Switzerland.
This article is an open access article
distributed under the terms and
conditions of the Creative Commons
Attribution (CC BY) license
(http://creativecommons.org/licenses
/by/4.0/).
Atmosphere 2021, 12, 115 2 of 23
buildings that are often occupied 24 hours a day and 7 days a week (24/7), where most
occupants are vulnerable and have specialist medical needs. Therefore, the strict IEQ
control in hospitals especially focuses on ensuring that all aspects of IEQ, indoor air
quality (IAQ) and thermal comfort, along with lighting and acoustics, are within
acceptable standards. Owing to the critical function of hospitals, the primary focus for
building managers is to ensure reliable running of building and building services and the
compliance with the strict health and safety and other clinical requirements [2].
Consequently, energy use intensity in hospitals is one of the highest among non-domestic
buildings [3]. Yet, unlike critical issues of thermal comfort and IAQ, the academic research
regarding the energy use in hospitals and data for major hospital end uses, such as
cooling, heating, lighting, and plug loads, is sparse [4]. This paper reports the findings of
the building performance evaluation for IEQ and energy performance of a newly built
ward complex in a hospital campus in Bristol, UK.
The aim of this paper is to assess how the case study building is performing against
the industry standards and design intents. The paper further identifies the root causes of
underperformance in IEQ and energy based on empirical data, and feedback received
from the hospital staff through a building user survey. Finally, the findings are also linked
to the endemic issues and constraints within the construction industry and key lessons for
improved performance in the design and operation of hospital buildings are highlighted.
1.1. IAQ and Other Related IEQ Parameters
The relationship between occupant well-being, comfort and productivity and IEQ in
various building types is well established and documented [5–7]. However, the
underperformance for IEQ parameters such as temperature, relative humidity (RH), air
quality (pollutants), noise and lighting is widely reported across various building types
[8–11]. As people spend 90% of their time indoors, having good IEQ is particularly
important. For example, from a health perspective, long-term exposure to polluted air can
cause chronic conditions such as cardiovascular and respiratory diseases [12].
Pollutants commonly found indoors in urban areas include CO2, nitrogen oxides
(NOx), O3, particulate matter (PM), CO, volatile organic compounds (VOCs), radon,
environmental tobacco smoke (ETS), bio-effluents and biological contaminants [13].
Exposure to these can be attributed to both indoor and outdoor sources. Indoor sources
include human generated CO2 and bio-effluents, chemicals used in building materials,
furniture, and other items and everyday practices such as heating, catering, cleaning and
building repair. Managing of these sources require good ventilation practices and care in
material selection and cleaning practices. Outdoor pollution sources include road traffic,
industrial processes and combustion emissions (especially in urban areas). Amongst all
pollutants, NO2—primarily driven by outdoor sources, and PMs (PM2.5 and PM10)—
driven by both indoor and outdoor sources, are both considered to be major components
of air pollution and are linked to adverse health risks [12]. NO2 and PM levels are reported
as key problem areas with respect to ambient air quality, leading to severe health impacts
on the population in the UK [14,15] and also specifically in Bristol [16] where the case
study building is located.
Short-term exposure to PM and NO2, particularly at high concentrations, causes
respiratory irritation, breathing difficulties and cough. Prolonged exposure shows
associations of PM and NO2 in air with reduced lung development and respiratory
infections in early childhood and effects on lung function in adulthood, including
mortality from cardiovascular and respiratory diseases and from lung cancer [17]. While
the associations of these pollutants with adverse effects on health, including reduced life
expectancy is well documented, it is still unclear that the effect can be attributed to a
specific pollutant or a combination with other pollutants present at the same time [12].
Air quality in buildings is closely related to other IEQ parameters. In new buildings,
constructed to high energy standards, increased levels of insulation and airtightness
shows that poor ventilation not only leads to poor air quality (higher levels of certain
Atmosphere 2021, 12, 115 3 of 23
volatile organic compounds) but to overheating risks in summer [9,18–21]. Similarly,
provision of windows enables good daylight and, when they are operable, can be used for
natural ventilation and fresh air intake. However, in urban areas, where ambient air can
be polluted and outdoor noise levels higher, a balance is needed to ensure that lighting
comfort does not conflict with acoustic comfort and IAQ.
1.2. IEQ in Hospital Buildings
Hospitals should provide a safe indoor environment for patients and visitors along
with safe and healthy working environment for the workers. As many of the hospital
occupants are vulnerable and have specialist medical needs, there is a need for a strict
control over IEQ, especially, thermal comfort and IAQ as they are the most crucial IEQ
components in a hospital context.
In hospital buildings, building services and their controls are designed to provide a
comfortable and healthy indoor environment. Poor maintenance of mechanical building
services including heating, cooling and ventilation systems and traffic-related external
pollutants, such as NO2, if not managed, could cause underperformance issues for IEQ
[22]. Use of CO2 levels as the only determinant for regulating fresh air is insufficient as
external pollutants and some internal contaminants could exceed limits and might pose
occupant health risks [23]. Moreover, in the context of climate change, there is a need for
buildings and services to maintain good IEQ in the event of extreme weather scenarios,
e.g., severe heat and heatwaves [24].
In the UK, summer overheating, due to the lack of provision of comfort cooling via
air-conditioning, is a key issue observed in hospitals and can affect individuals who are
sensitive to high temperatures as well as those who cannot take action in the face of high
temperatures [25]. Very few existing buildings on the National Health Service (NHS)
Estate were designed to be air-conditioned; indeed, many are poorly insulated and often
over-glazed, leading to increased risk of summertime overheating [25]. In terms of air
quality, many big hospitals are located in dense urban areas, and therefore are exposed to
polluted ambient air. One in four hospitals in England are in areas where PM2.5 levels are
above the World Health Organization (WHO) limits [26] and three quarters of facilities in
inner London and a little less than half in outer London are in areas where NO2 levels are
above the legal limit [27]. Therefore, in all these places, whilst the outdoor air pollution is
dealt with at the city level, high envelope sealing, and robust filtration mechanisms need
to be in place when providing fresh air to buildings.
1.3. IEQ Performance Objectives in Hospital Buildings
The IEQ performance specifications in hospitals are determined by the activities and
special functions of the specific space. Suitable heating, ventilation and air conditioning
(HVAC) systems are necessary to provide a close control of hospitals’ internal climate,
especially with regards to thermal comfort and IAQ. In the UK, BS EN 16798 [28] (earlier
BS EN 15251:2007 [29]) recommends environmental input parameters for indoor air
quality, thermal environment, lighting, and acoustics. Additionally, HTM 03-01 [30] gives
comprehensive advice and guidance regarding specialised ventilation requirements in
healthcare buildings. Annex 68 of the International Energy Agency Energy in Buildings
and Communities programme (IEA EBC Annex 68 - although IEA EBC Annex 68 project
was primarily related to dwellings, the best practice exposure limit values for pollutants
identified in this project are based on potential health impacts and are not related to
building type) [31] and Public Health England’s (PHE) guidelines for VOCs [32] provide
exposure limit values (ELVs) for various IAQ parameters. This is also supplemented by
WHO guidelines [33,34] which provide limits for annual mean threshold for IAQ
parameters (such as NO2, PM2.5 and PM10). Additionally, BS EN 16798 [28] provides the
customary ranges recommended for CO2 levels. Combining all these values and
guidelines for indoor air quality, a comprehensive list of targeted pollutants can be
Atmosphere 2021, 12, 115 4 of 23
created. For acoustics performance, HTM 08-01 [35] offers guidance and additional
assessment methods for spaces occupied by people particularly vulnerable to noise levels.
1.4. Energy Related Performance and Potential Issues in Hospital Buildings
Energy use intensity in hospitals is one of the highest among non-domestic buildings
[3]. Maintaining satisfactory IEQ levels, which are generally more stringent than in other
building types, are partly responsible for energy use in hospitals to be higher when
compared against other buildings. To address this, guidance documents on energy
efficient hospitals [2] are widely available. However, a key issue in managing energy
performance of hospitals is that key performance indicators for actual energy performance
and operational benchmarks are not well defined and updated. Benchmarking of energy
use for hospitals in general is difficult because of the heterogeneous mix of buildings that
fall in this sector owing to the complexity and the differing set-ups of each hospital. A
typical hospital definition, for energy benchmarking purpose, is therefore difficult to
ascertain.
In the UK, attempts have been made to benchmark energy use in hospital buildings.
ECG72 [36] and CIBSE TM46 (CIBSE TM46 provides operational energy benchmarks for
all building types for the UK building stock) [37] provide typical and good practice
benchmarks for electricity and fossil-thermal energy use. Typical and good practice
benchmarks are meant to represent the median and 25th percentile of the building stock,
respectively. Besides this, actual energy use of building stock is also available from the
energy consumption figures provided through the mandatory UK Department of Health’s
ERIC data (Estates Return Information Collection (ERIC) data contains energy
consumption figures and site characteristics for all of NHS premises) [38] and also through
analysis of DEC data (the Display Energy Certificate (DEC) scheme in the UK rates a
building’s operational performance relative to a typical building) [3]. However,
information on different energy end-uses, important for the identification of how building
performance improvements could be achieved [39], remain very rare. Typically, hospital
energy demand in the UK is dominated by space heating and hot water use [40]. For
electricity, about two thirds is used for lighting, plug loads such as information technology
(IT) or medical equipment and the remaining part is accounted for by other building
services such as cooling, ventilation and elevators [40].
During the design stage, for hospital buildings in the UK, energy performance
calculations are done as a part of Part L of Building Regulations [41] compliance and as
per HTM 07-02-EnCO2de [2], specialist guidance on responsible energy use within the
health sector. The methodology presented in EnCO2de, which is hospital centric, is very
similar to CIBSE TM54 [42], which also provides guidance for estimating operational
energy use at the design-stage. There is a little documentation available for actual against
design energy consumption of various types of hospital buildings. One study, reviewing
150 general acute hospitals, reported that there is about 15–20% increase in operational
energy, compared to design estimates [43]. Furthermore, CarbonBuzz (a platform to
engage the stakeholders to voluntarily provide design and actual energy use [44])
provides design and actual energy use data for several hospitals across the UK. The
platform reports significant (seven-fold) increase in operational CO2 emissions compared
to design estimations for hospital buildings, based on a small sample of data. However,
in this case much of the design stage data provided are based on regulatory compliance
calculations and this demonstrates the prevalence of interchangeable and contentious use
of the outcomes of compliance calculations as design projections [45]. Further empirical
data is therefore required to have a better understanding of energy performance of
hospital buildings.
Atmosphere 2021, 12, 115 5 of 23
2. Method
2.1. Case Study Context
The paper investigates the design and operational performance of IEQ, as the output
of the environmental systems in a building, and energy, as the input, in the context of
hospital buildings, underpinned by findings and observations from a case study. The case
study hospital is an acute hospital building in Bristol in South-West England (acute
hospitals: as defined in ECG72 [36], most National Health Service (NHS) trusts are in this
group; or clinical and research hospital category defined in CIBSE TM46 [37].) This
building is a new ward complex for an existing hospital built in 2015. The building hosts
a medical assessment unit, dementia care, paediatric facilities, intensive treatment unit
(ITU) and two operating theatres. The building comprises seven new floors linked to other
existing health care facilities on site with a gross floor area of approximately 14,700 m2.
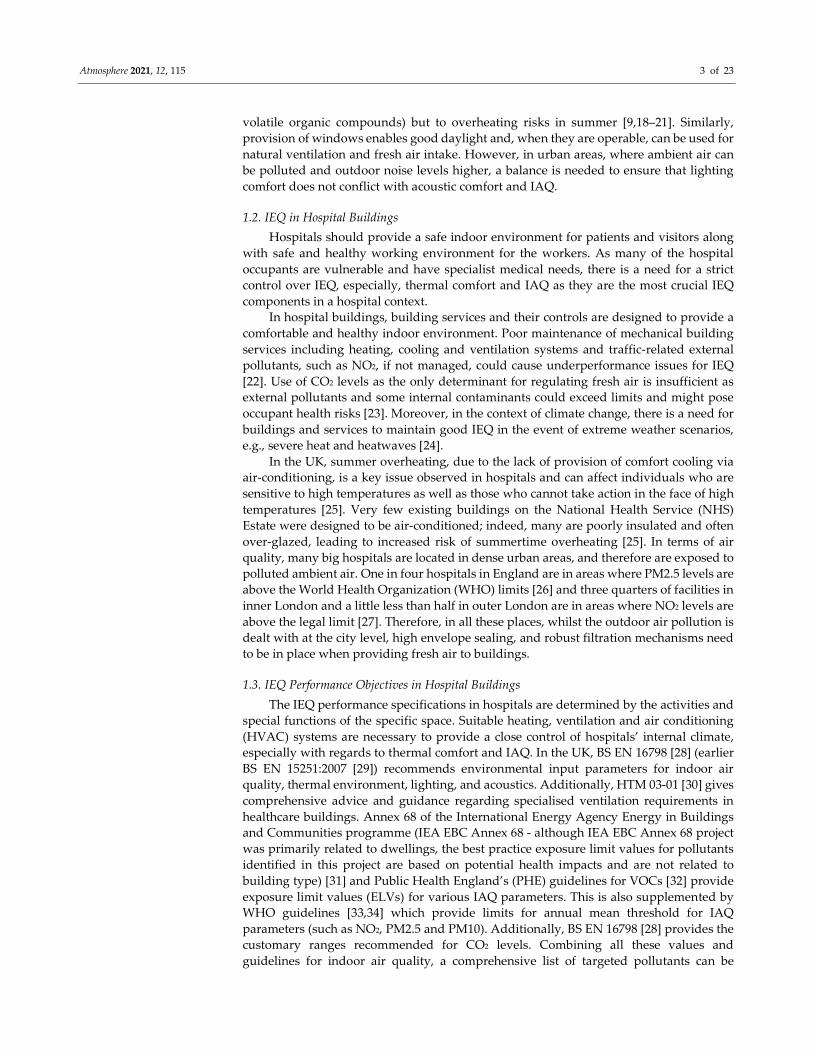
Figure 1 shows the hospital building.
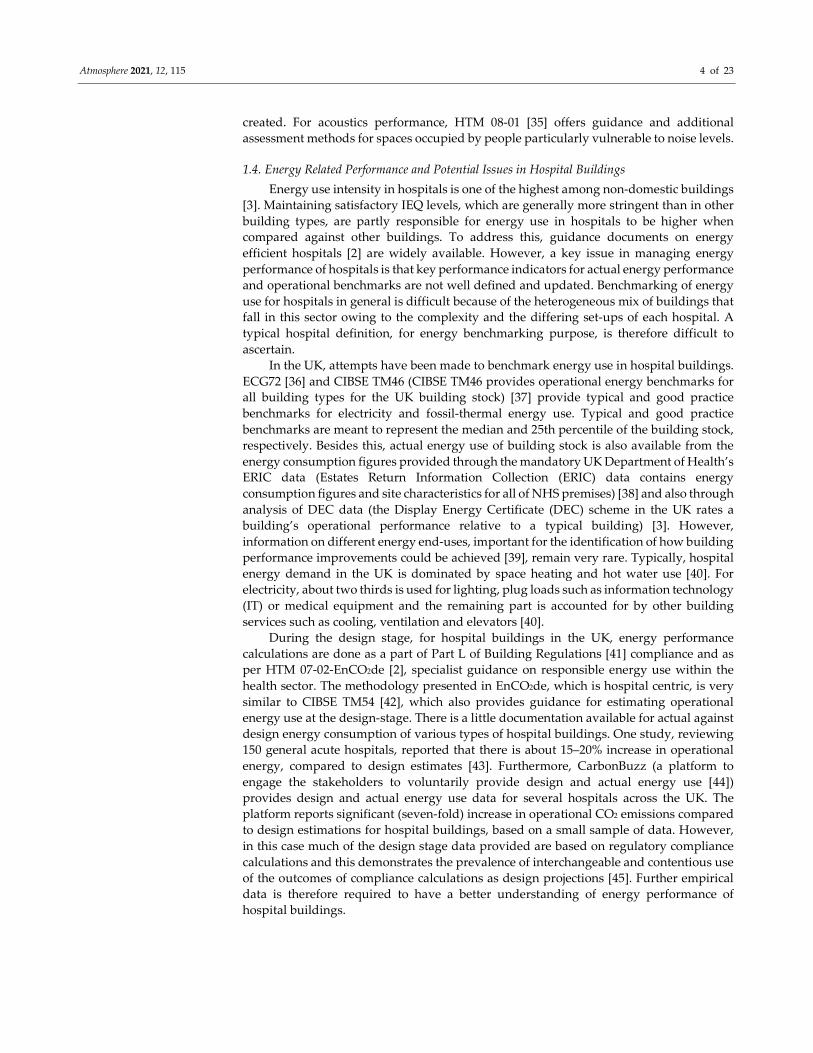
Bristol, where the building is located, is one of the 10 biggest cities in the UK and
studies have shown that NO2 and PM levels are problem areas with respect to ambient air
quality and their increased concentrations are contributing to adverse health impacts and
mortality in the city [16]. Monitoring shows that Bristol city centre exceeds the annual and
hourly concentration limits of 40 µg/m3 and 200 µg/m3 for NO2 respectively [46]. Figure 2
shows that NO2 concentration around the case study building area in 2019 exceeded the
annual mean limits [47].
Figure 1. External view of the case study hospital.
Figure 2. Annual mean NO2 levels around the case study (marked by the orange cross) in 2019
(Green: <40 µg/m3; Red: 40–60 µg/m3; Purple: >60 µg/m3).
Atmosphere 2021, 12, 115 6 of 23
2.2. Scope of Monitoring for the Case Study
Regular measurements, site visits and semi-structured interviews with the facility
managers at monthly or bimonthly intervals over a period of one year were used to collect
post-occupancy data and information from the new building. Metering and monitoring
recorded various performance parameters. Temperature, RH, CO2 (proxy for fresh air),
particulate matter (PM2.5, PM10), and NO2 (proxy for traffic driven pollutants) were
recorded. The passive sampling method using diffuser tubes was used to determine the
concentration levels of several VOCs such as benzene, formaldehyde, and
trichloroethylene as per IEA EBC Annex 68 [31] and Public Health England (PHE)
guidelines [32]. Previous studies in hospitals often used Total VOC (TVOC) as a proxy for
the effect of indoor sources of pollution [48]. However, TVOC does not necessarily
indicate health related issues and a more refined approach to VOCs may be required to
better understand the indoor sources of pollution within a hospital. Additionally, lighting
and acoustic performance of the building was also reviewed. As for energy use, monthly
electricity and gas use of the building were recorded.
The IEQ performance targets and energy performance predictions at the design stage
for the case study were compared against post-occupancy data and the relevant UK and
global standards. Subsequently, reasons for any underperformance were identified using
post occupancy investigations and discussions with the facility managers and hospital
staff. The root causes for the underperformance, and potential building specific and
industry wide mitigation measures were identified. The focus of the performance
evaluations was predominantly on IAQ and thermal comfort due to the significance of
these performance metrics in hospitals. However, lighting and acoustics were also
evaluated through post-occupancy investigations and a building user survey.
2.3. Building Design Characteristics
Construction and Occupancy Details: The building is of curtain wall construction
with concrete floor slabs. It is highly insulated and is heavy weight in terms of thermal
mass. Fabric U-values (W/m2K) are: Wall: 0.22; Window: 1.60; Roof: 0.23; Ground: 0.25;
and design airtightness is 5 m³/hr/m² @ 50 Pa. The building has a 23% window to wall
ratio and has solar control glass. There is no external shading besides the surrounding
buildings. Most of the building spaces are occupied 24/7 apart from consulting rooms and
offices, which are occupied on weekdays from 8 am to 6 pm.
Ventilation and Space Conditioning Details: This hospital building, in the city
centre, is a sealed envelope building with no operable window and the ventilation
strategy is based on mechanical ventilation with high air change rates in most spaces (10–
12 air changes per hour). The sealed envelope strategy is designed to protect patients and
hospital staff against external noise and outdoor sources of pollution depending on the
type of filters used in the air handling units and the maintenance regime. Based on CIBSE
Guide A [49] recommendations, F7–F9 filters (which can filter fine particulate matter) are
installed in the air handling units. Comfort cooling and heating are also provided to most
zones through the heating and cooling coils installed in the air handling units. The
mechanical ventilation system (along with heating and cooling) is controlled via a
building management system (BMS); however, individual spaces have analogue manual
override controls.
Primary Systems for Space Conditioning: While cooling is provided by dedicated
air-cooled chillers, heating is linked to a district system. Originally, the design intent was
to install a combined heat and power (CHP) system for the building. However, a decision
was taken that it would be better to install a new CHP plant for the campus following a
major renovation to maximise the efficiency savings across the hospital estate rather than
as a separate system only for the new building. The low efficiency steam-based central
heating network still served the building at the time of this investigation.
Atmosphere 2021, 12, 115 7 of 23
Lighting and Acoustics: The building was designed to have low energy artificial
lights, primarily T5 & CFL fluorescent lamps with automated lighting controls. A central
atrium allows natural daylight to penetrate deep into the building and has suspended
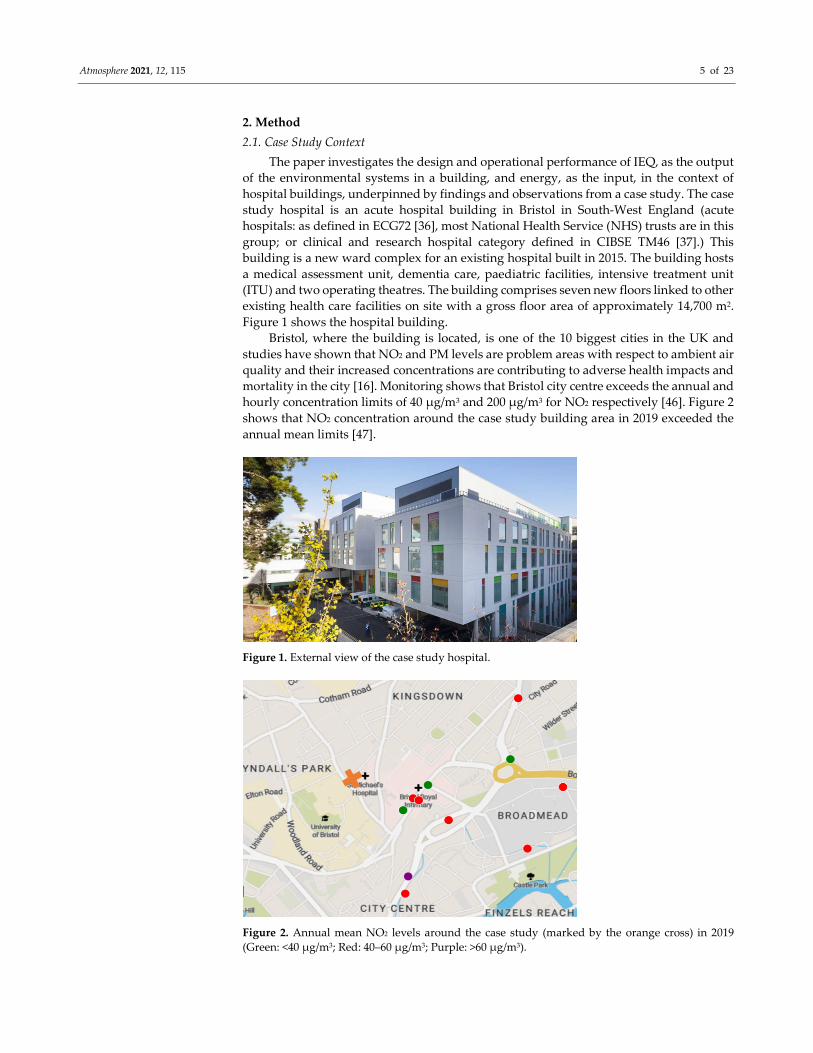
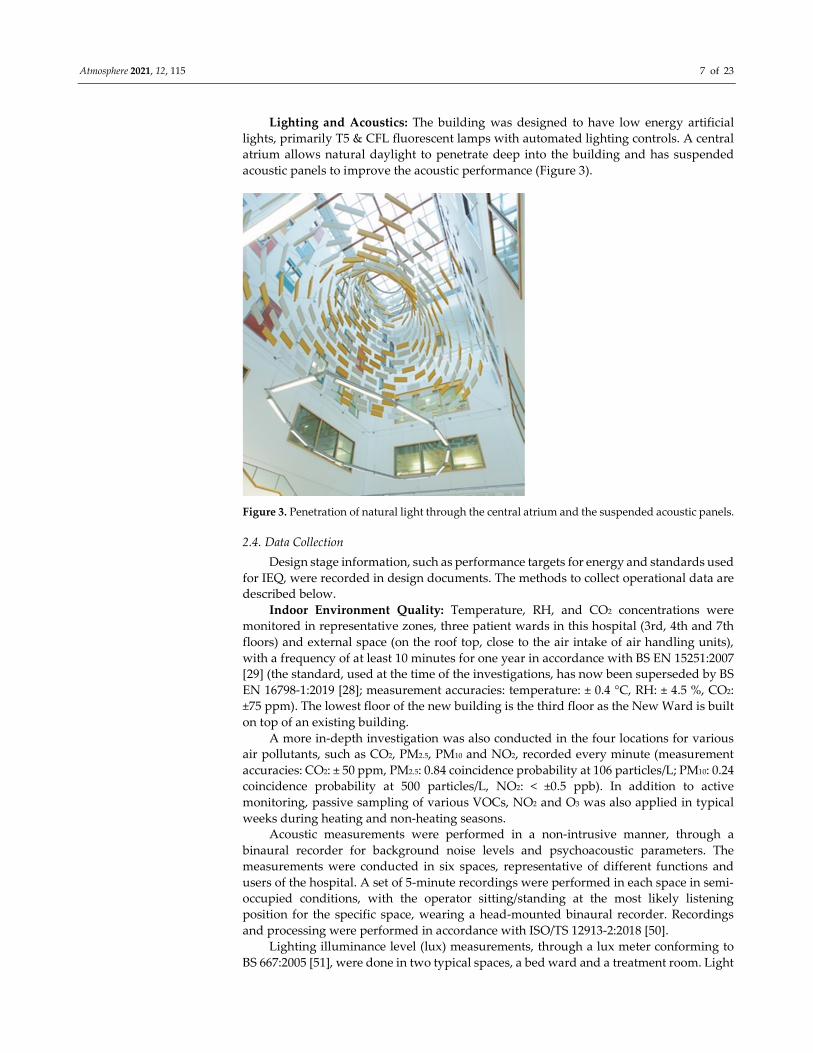
acoustic panels to improve the acoustic performance (Figure 3).
Figure 3. Penetration of natural light through the central atrium and the suspended acoustic panels.
2.4. Data Collection
Design stage information, such as performance targets for energy and standards used
for IEQ, were recorded in design documents. The methods to collect operational data are
described below.
Indoor Environment Quality: Temperature, RH, and CO2 concentrations were
monitored in representative zones, three patient wards in this hospital (3rd, 4th and 7th
floors) and external space (on the roof top, close to the air intake of air handling units),
with a frequency of at least 10 minutes for one year in accordance with BS EN 15251:2007
[29] (the standard, used at the time of the investigations, has now been superseded by BS
EN 16798-1:2019 [28]; measurement accuracies: temperature: ± 0.4 °C, RH: ± 4.5 %, CO2:
±75 ppm). The lowest floor of the new building is the third floor as the New Ward is built
on top of an existing building.
A more in-depth investigation was also conducted in the four locations for various
air pollutants, such as CO2, PM2.5, PM10 and NO2, recorded every minute (measurement
accuracies: CO2: ± 50 ppm, PM2.5: 0.84 coincidence probability at 106 particles/L; PM10: 0.24
coincidence probability at 500 particles/L, NO2: < ±0.5 ppb). In addition to active
monitoring, passive sampling of various VOCs, NO2 and O3 was also applied in typical
weeks during heating and non-heating seasons.
Acoustic measurements were performed in a non-intrusive manner, through a
binaural recorder for background noise levels and psychoacoustic parameters. The
measurements were conducted in six spaces, representative of different functions and
users of the hospital. A set of 5-minute recordings were performed in each space in semi-
occupied conditions, with the operator sitting/standing at the most likely listening
position for the specific space, wearing a head-mounted binaural recorder. Recordings
and processing were performed in accordance with ISO/TS 12913-2:2018 [50].
Lighting illuminance level (lux) measurements, through a lux meter conforming to
BS 667:2005 [51], were done in two typical spaces, a bed ward and a treatment room. Light
Atmosphere 2021, 12, 115 8 of 23
sensors were placed below the ceiling recessed luminaires in both rooms. Sensors were
also placed at the windows to measure the daylight (detailed daylight results have not
been analysed as the objective was to assess the lighting system in the context of its impact
and inter-relation with energy, and hence the focus was more on artificial lighting).
Illuminances were taken at the windows. An illuminance spectrophotometer was used to
determine colour rendering index (Ra) and correlated colour temperature (CCT) of the
luminaires. Light sensors sampled once per minute. To avoid giving weight to a particular
day of the week measurements were done over 14 days.
Occupant Feedback: An occupant survey of nursing and medical staff, related to IEQ
parameters in the building, was conducted with survey questions asking the occupants to
rate their perception of various IEQ parameters on a scale of 1 to 5 and also provide free
text comments. Out of the 154 survey requests 47 completed responses were received. This
is considered a 30% population sample rather than a response rate, due to the difficulties
inherent in polling intensively worked healthcare staff, along with the impracticalities of
surveying shift workers in a multi-storey 24/7 hospital building. Therefore, this feedback
can broadly represent the perceived environmental conditions, but the sample is not large
enough to guarantee that all occupied spaces on all floors have been covered, and at all
times of the day or night.
Energy: Operational stage electricity and gas use data were available from utility bills
and meter readings for one full year representative of the stable operation of the building.
Gas use in the facility was metered at the site level, with each building having its own heat
meter providing building-wide heat demand. The local (building-level) electricity meter
that could be accessed via the BMS was enabled to record hourly electricity use.
Disaggregated energy use for lights, small power, IT, pumps and fans and cooling was
also available. All meters were designed to be integrated into the BMS.
3. Building performance results
3.1. IEQ Performance
3.1.1. Indoor Air Quality
The hospital building is mechanically ventilated, and most spaces had an adequate
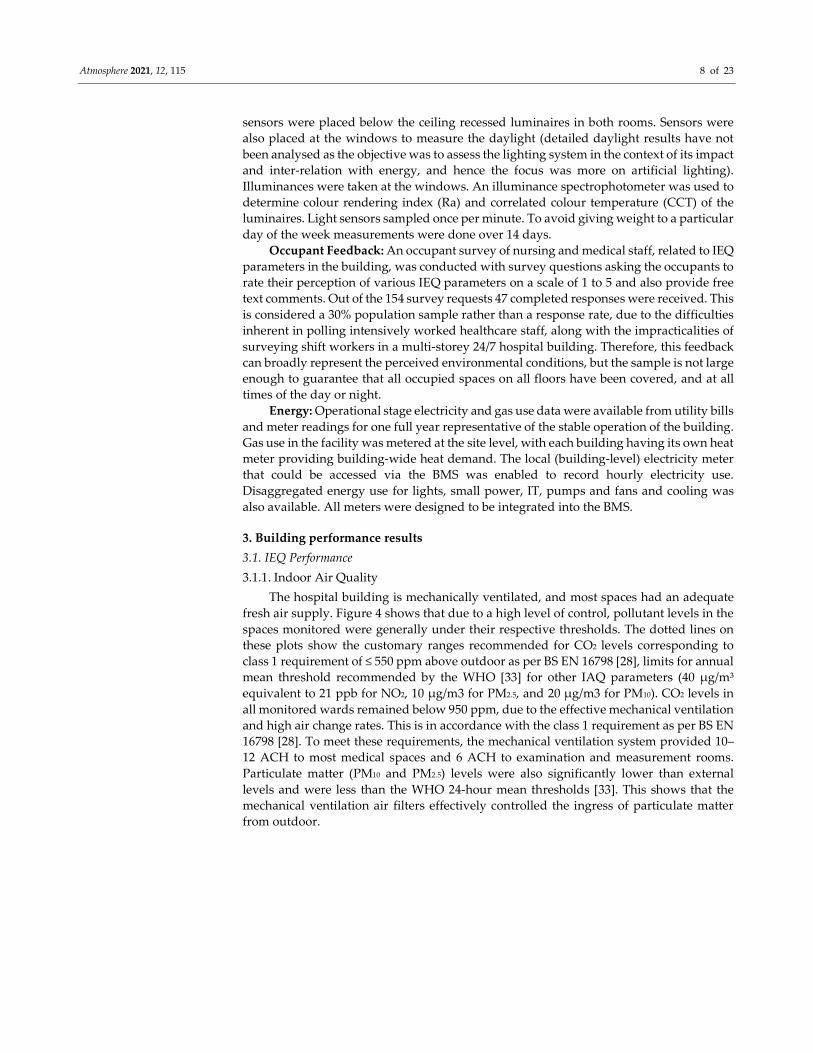
fresh air supply. Figure 4 shows that due to a high level of control, pollutant levels in the
spaces monitored were generally under their respective thresholds. The dotted lines on
these plots show the customary ranges recommended for CO2 levels corresponding to
class 1 requirement of ≤ 550 ppm above outdoor as per BS EN 16798 [28], limits for annual
mean threshold recommended by the WHO [33] for other IAQ parameters (40 µg/m³
equivalent to 21 ppb for NO2, 10 µg/m3 for PM2.5, and 20 µg/m3 for PM10). CO2 levels in
all monitored wards remained below 950 ppm, due to the effective mechanical ventilation
and high air change rates. This is in accordance with the class 1 requirement as per BS EN
16798 [28]. To meet these requirements, the mechanical ventilation system provided 10–
12 ACH to most medical spaces and 6 ACH to examination and measurement rooms.
Particulate matter (PM10 and PM2.5) levels were also significantly lower than external
levels and were less than the WHO 24-hour mean thresholds [33]. This shows that the
mechanical ventilation air filters effectively controlled the ingress of particulate matter
from outdoor.
Atmosphere 2021, 12, 115 9 of 23
Figure 4. Box plots showing the spread of indoor air quality (IAQ) parameters in the hospital wards.
Further analysis of indoor/outdoor (I/O) levels of various pollutants are shown in
Table 1 in form of I/O ratios and Figure 5 in form of scatter plots. The correlation of I/O
levels for PM in the scatter plots is low and their values in Table 1 are below 1. This shows
that the filtration of PMs is effective in comparison to measurements in other buildings
[52]. The I/O ratios for PM10 are slightly higher than PM2.5. This is because PM2.5 is
primarily driven by outdoor sources (combustion process) whereas PM10 is also driven by
internal sources such as dust and other suspended particles. However, the ratios are
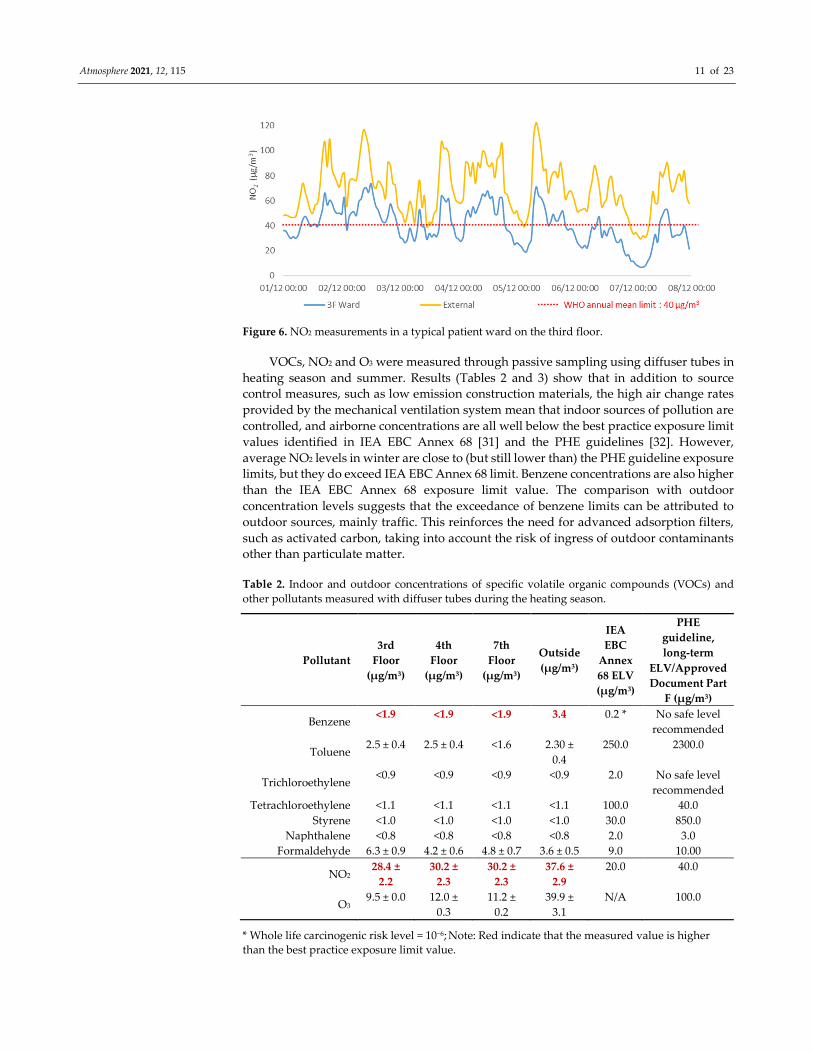
higher for NO2 and its levels and pattern are a potential issue. Indoor NO2 levels in all
monitored zones show that increased outdoor levels in winters led to increased indoor
levels (Figure 5). This trend can be better seen in the weekly time series reported in Figure
6 which shows the indoor levels closely follow the outdoor levels. The hospital’s building
Atmosphere 2021, 12, 115 10 of 23
services do not have an active measure to control indoor NO2, despite being in a congested
urban area. These recordings were below the WHO chronic threshold of 40 µg/m³ but
suggest a potential risk of exposure to more than the WHO recommended levels if the
external air becomes more polluted for prolonged periods. While the F7-F9 filters installed
in the air handling units are effective in protecting the indoor environment against
outdoor sourced particulate matter, there is no active measure such as molecular or
activated carbon filter to protect the indoor environment against high outdoor NO2 levels.
Table 1. Average indoor/outdoor (I/O) ratios of air pollutants for heating and non-heating seasons.
Season CO2 NO2 PM2.5 PM10
Non -Heating Season
3F Ward 1.05 0.66 0.04 0.20
4F Ward 1.10 1.12 0.12 0.35
7F Ward 1.00 0.49 0.17 0.36
Heating Season
3F Ward 1.05 0.61 0.05 0.18
4F Ward 1.03 1.04 0.12 0.28
7F Ward 1.07 0.51 0.19 0.30
Figure 5. Indoor/Outdoor scatter plots for various pollutants in a representative zone (4F Ward).
Atmosphere 2021, 12, 115 11 of 23
Figure 6. NO2 measurements in a typical patient ward on the third floor.
VOCs, NO2 and O3 were measured through passive sampling using diffuser tubes in
heating season and summer. Results (Tables 2 and 3) show that in addition to source
control measures, such as low emission construction materials, the high air change rates
provided by the mechanical ventilation system mean that indoor sources of pollution are
controlled, and airborne concentrations are all well below the best practice exposure limit
values identified in IEA EBC Annex 68 [31] and the PHE guidelines [32]. However,
average NO2 levels in winter are close to (but still lower than) the PHE guideline exposure
limits, but they do exceed IEA EBC Annex 68 limit. Benzene concentrations are also higher
than the IEA EBC Annex 68 exposure limit value. The comparison with outdoor
concentration levels suggests that the exceedance of benzene limits can be attributed to
outdoor sources, mainly traffic. This reinforces the need for advanced adsorption filters,
such as activated carbon, taking into account the risk of ingress of outdoor contaminants
other than particulate matter.
Table 2. Indoor and outdoor concentrations of specific volatile organic compounds (VOCs) and
other pollutants measured with diffuser tubes during the heating season.
Pollutant
3rd
Floor
(μg/m3)
4th
Floor
(μg/m3)
7th
Floor
(μg/m3)
Outside
(μg/m3)
IEA
EBC
Annex
68 ELV
(μg/m3)
PHE
guideline,
long-term
ELV/Approved
Document Part
F (μg/m3)
Benzene <1.9 <1.9 <1.9 3.4 0.2 * No safe level
recommended
Toluene 2.5 ± 0.4 2.5 ± 0.4 <1.6 2.30 ±
0.4
250.0 2300.0
Trichloroethylene <0.9 <0.9 <0.9 <0.9 2.0 No safe level
recommended
Tetrachloroethylene <1.1 <1.1 <1.1 <1.1 100.0 40.0
Styrene <1.0 <1.0 <1.0 <1.0 30.0 850.0
Naphthalene <0.8 <0.8 <0.8 <0.8 2.0 3.0
Formaldehyde 6.3 ± 0.9 4.2 ± 0.6 4.8 ± 0.7 3.6 ± 0.5 9.0 10.00
NO2 28.4 ±
2.2
30.2 ±
2.3
30.2 ±
2.3
37.6 ±
2.9
20.0 40.0
O3 9.5 ± 0.0 12.0 ±
0.3
11.2 ±
0.2
39.9 ±
3.1
N/A 100.0
* Whole life carcinogenic risk level = 10−6; Note: Red indicate that the measured value is higher
than the best practice exposure limit value.
Atmosphere 2021, 12, 115 12 of 23
Table 3. Indoor and outdoor concentrations of specific VOCs and other pollutants measured with
diffuser tubes during the non-heating season.
Pollutant
3rd
Floor
(μg/m3)
4th
Floor
(μg/m3)
7th
Floor
(μg/m3)
Outside
(μg/m3)
IEA
EBC
Annex
68 ELV
(μg/m3)
PHE guideline,
long-term
ELV/Approved
Document Part
F (μg/m3)
Benzene <1.1 <1.1 <1.1 <1.1 0.2 * No safe level
recommended
Toluene 2.0 ± 0.4 2.1 ± 0.4 <0.9 <0.9 250.0 2300.0
Trichloroethylene <0.5 <0.5 <0.5 <0.5 2.0 No safe level
recommended
Tetrachloroethylene <0.6 <0.6 <0.7 <0.7 100.0 40.0
Styrene <0.6 <0.6 <0.6 <0.6 30.0 850.0
Naphthalene 0.6 ± 0.1 <0.5 <0.5 <0.5 2.0 3.0
Formaldehyde 3.3 ± 0.5 2.7 ± 0.4 2.8 ± 0.4 1.8 ± 0.3 9.0 10.0
NO2 10.6 ±
0.8
11.0 ±
0.9
12.2 ±
1.0
10.9 ±
0.9
20.0 40.0
O3 16.0 ±
0.3
18.2 ±
0.5
16.1 ±
0.3
44.6 ±
3.2
N/A 100.0
* Whole life carcinogenic risk level = 10−6; Note: Red indicate that the measured value is higher
than the best practice exposure limit value.
3.1.2. Thermal Comfort
As the building operated with close control over the indoor environment and
provision of both comfort heating and cooling, no significant thermal comfort issues were
found (Figure 7).
Figure 7. Spread of air temperatures and relative humidity (RH) during non-heating and heating
seasons.
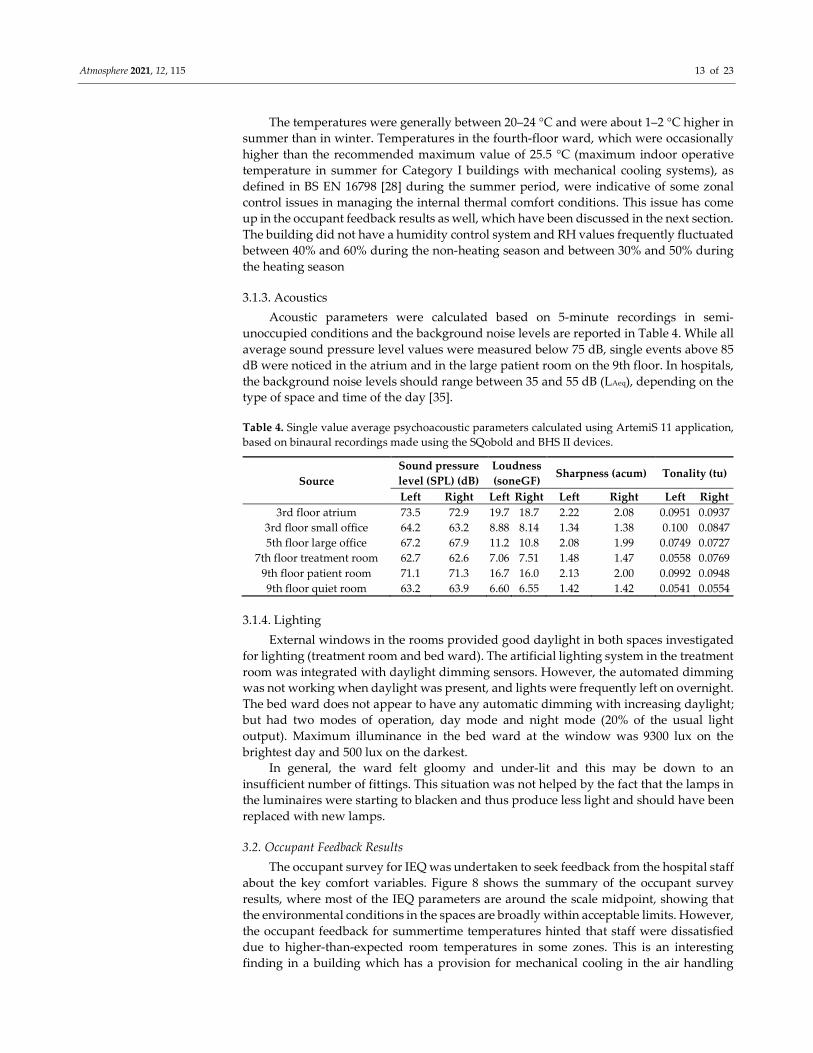
Atmosphere 2021, 12, 115 13 of 23
The temperatures were generally between 20–24 °C and were about 1–2 °C higher in
summer than in winter. Temperatures in the fourth-floor ward, which were occasionally
higher than the recommended maximum value of 25.5 °C (maximum indoor operative
temperature in summer for Category I buildings with mechanical cooling systems), as
defined in BS EN 16798 [28] during the summer period, were indicative of some zonal
control issues in managing the internal thermal comfort conditions. This issue has come
up in the occupant feedback results as well, which have been discussed in the next section.
The building did not have a humidity control system and RH values frequently fluctuated
between 40% and 60% during the non-heating season and between 30% and 50% during
the heating season
3.1.3. Acoustics
Acoustic parameters were calculated based on 5-minute recordings in semi-
unoccupied conditions and the background noise levels are reported in Table 4. While all
average sound pressure level values were measured below 75 dB, single events above 85
dB were noticed in the atrium and in the large patient room on the 9th floor. In hospitals,
the background noise levels should range between 35 and 55 dB (LAeq), depending on the
type of space and time of the day [35].
Table 4. Single value average psychoacoustic parameters calculated using ArtemiS 11 application,
based on binaural recordings made using the SQobold and BHS II devices.
Source
Sound pressure
level (SPL) (dB)
Loudness
(soneGF) Sharpness (acum) Tonality (tu)
Left Right Left Right Left Right Left Right
3rd floor atrium 73.5 72.9 19.7 18.7 2.22 2.08 0.0951 0.0937
3rd floor small office 64.2 63.2 8.88 8.14 1.34 1.38 0.100 0.0847
5th floor large office 67.2 67.9 11.2 10.8 2.08 1.99 0.0749 0.0727
7th floor treatment room 62.7 62.6 7.06 7.51 1.48 1.47 0.0558 0.0769
9th floor patient room 71.1 71.3 16.7 16.0 2.13 2.00 0.0992 0.0948
9th floor quiet room 63.2 63.9 6.60 6.55 1.42 1.42 0.0541 0.0554
3.1.4. Lighting
External windows in the rooms provided good daylight in both spaces investigated
for lighting (treatment room and bed ward). The artificial lighting system in the treatment
room was integrated with daylight dimming sensors. However, the automated dimming
was not working when daylight was present, and lights were frequently left on overnight.
The bed ward does not appear to have any automatic dimming with increasing daylight;
but had two modes of operation, day mode and night mode (20% of the usual light
output). Maximum illuminance in the bed ward at the window was 9300 lux on the
brightest day and 500 lux on the darkest.
In general, the ward felt gloomy and under-lit and this may be down to an
insufficient number of fittings. This situation was not helped by the fact that the lamps in
the luminaires were starting to blacken and thus produce less light and should have been
replaced with new lamps.
3.2. Occupant Feedback Results
The occupant survey for IEQ was undertaken to seek feedback from the hospital staff
about the key comfort variables. Figure 8 shows the summary of the occupant survey
results, where most of the IEQ parameters are around the scale midpoint, showing that
the environmental conditions in the spaces are broadly within acceptable limits. However,
the occupant feedback for summertime temperatures hinted that staff were dissatisfied
due to higher-than-expected room temperatures in some zones. This is an interesting
finding in a building which has a provision for mechanical cooling in the air handling
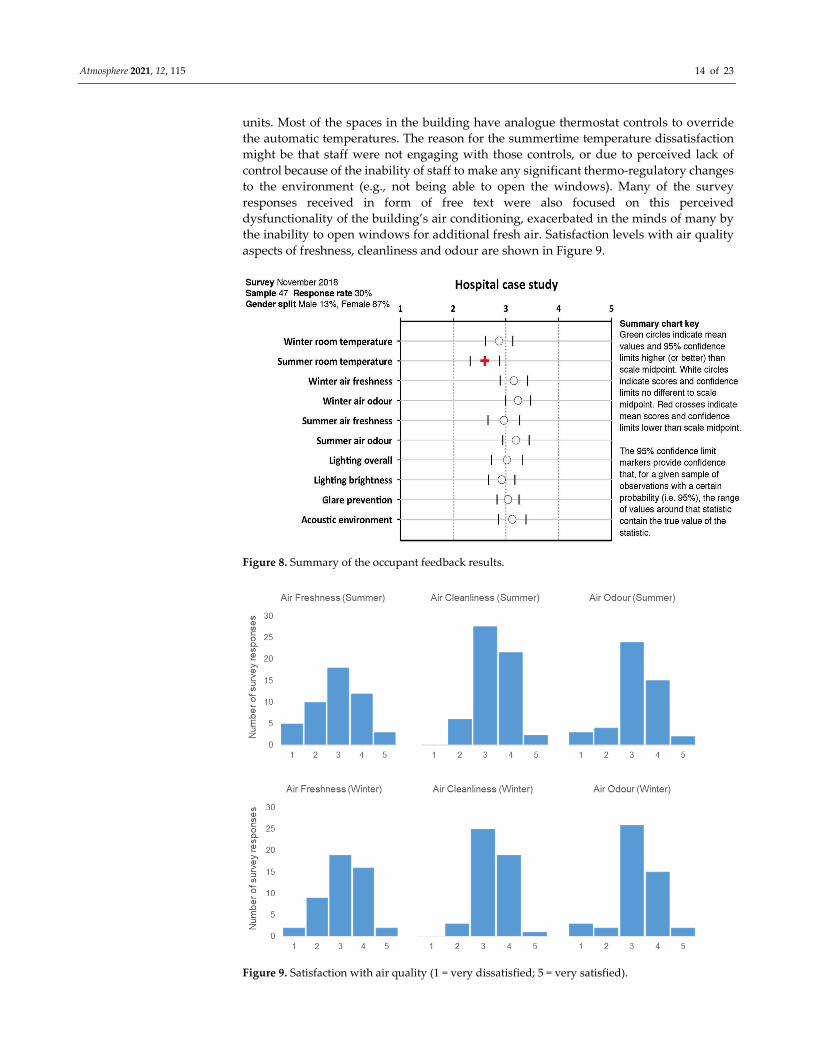
Atmosphere 2021, 12, 115 14 of 23
units. Most of the spaces in the building have analogue thermostat controls to override
the automatic temperatures. The reason for the summertime temperature dissatisfaction
might be that staff were not engaging with those controls, or due to perceived lack of
control because of the inability of staff to make any significant thermo-regulatory changes
to the environment (e.g., not being able to open the windows). Many of the survey
responses received in form of free text were also focused on this perceived
dysfunctionality of the building’s air conditioning, exacerbated in the minds of many by
the inability to open windows for additional fresh air. Satisfaction levels with air quality
aspects of freshness, cleanliness and odour are shown in Figure 9.
Figure 8. Summary of the occupant feedback results.
Figure 9. Satisfaction with air quality (1 = very dissatisfied; 5 = very satisfied).
Atmosphere 2021, 12, 115 15 of 23
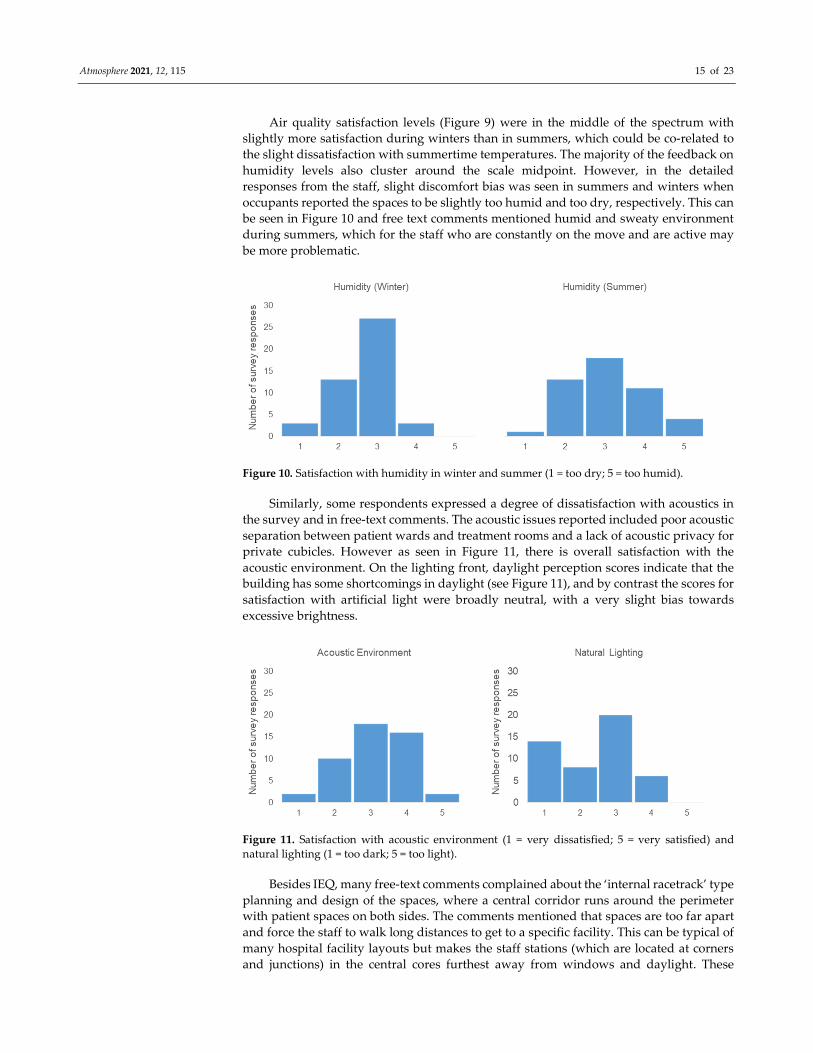
Air quality satisfaction levels (Figure 9) were in the middle of the spectrum with
slightly more satisfaction during winters than in summers, which could be co-related to
the slight dissatisfaction with summertime temperatures. The majority of the feedback on
humidity levels also cluster around the scale midpoint. However, in the detailed
responses from the staff, slight discomfort bias was seen in summers and winters when
occupants reported the spaces to be slightly too humid and too dry, respectively. This can
be seen in Figure 10 and free text comments mentioned humid and sweaty environment
during summers, which for the staff who are constantly on the move and are active may
be more problematic.
Figure 10. Satisfaction with humidity in winter and summer (1 = too dry; 5 = too humid).
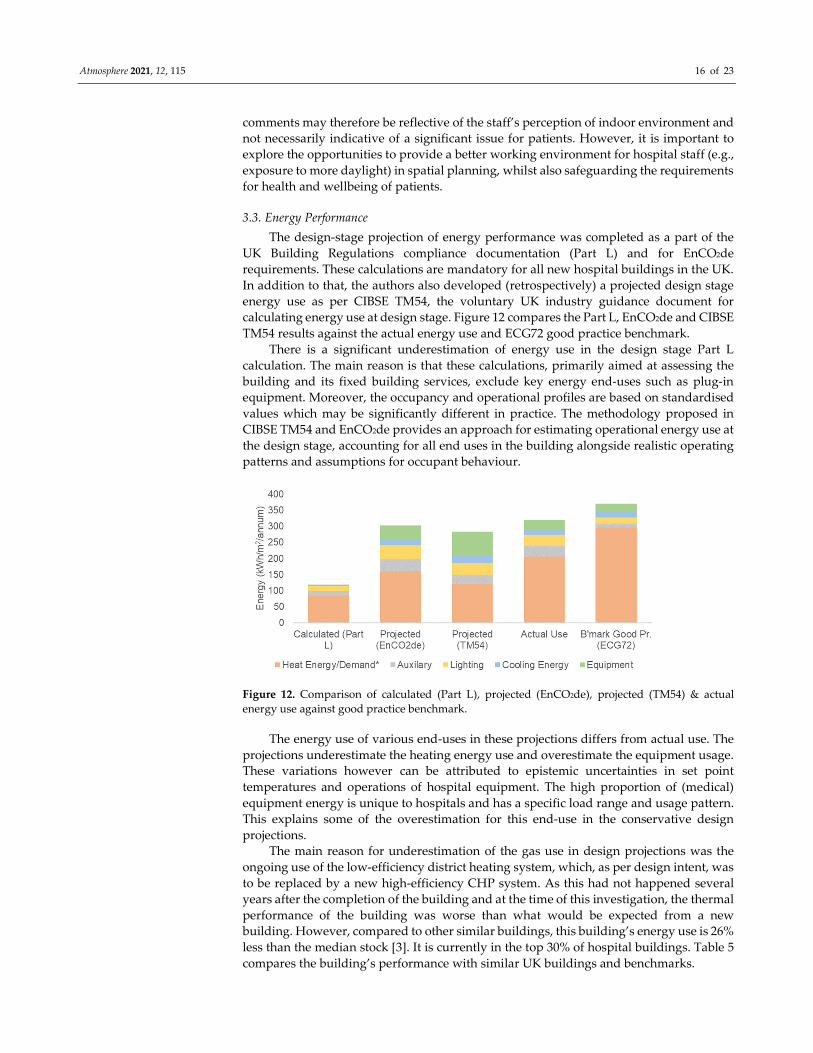
Similarly, some respondents expressed a degree of dissatisfaction with acoustics in
the survey and in free-text comments. The acoustic issues reported included poor acoustic
separation between patient wards and treatment rooms and a lack of acoustic privacy for
private cubicles. However as seen in Figure 11, there is overall satisfaction with the
acoustic environment. On the lighting front, daylight perception scores indicate that the
building has some shortcomings in daylight (see Figure 11), and by contrast the scores for
satisfaction with artificial light were broadly neutral, with a very slight bias towards
excessive brightness.
Figure 11. Satisfaction with acoustic environment (1 = very dissatisfied; 5 = very satisfied) and
natural lighting (1 = too dark; 5 = too light).
Besides IEQ, many free-text comments complained about the ‘internal racetrack’ type
planning and design of the spaces, where a central corridor runs around the perimeter
with patient spaces on both sides. The comments mentioned that spaces are too far apart
and force the staff to walk long distances to get to a specific facility. This can be typical of
many hospital facility layouts but makes the staff stations (which are located at corners
and junctions) in the central cores furthest away from windows and daylight. These
Atmosphere 2021, 12, 115 16 of 23
comments may therefore be reflective of the staff’s perception of indoor environment and
not necessarily indicative of a significant issue for patients. However, it is important to
explore the opportunities to provide a better working environment for hospital staff (e.g.,
exposure to more daylight) in spatial planning, whilst also safeguarding the requirements
for health and wellbeing of patients.
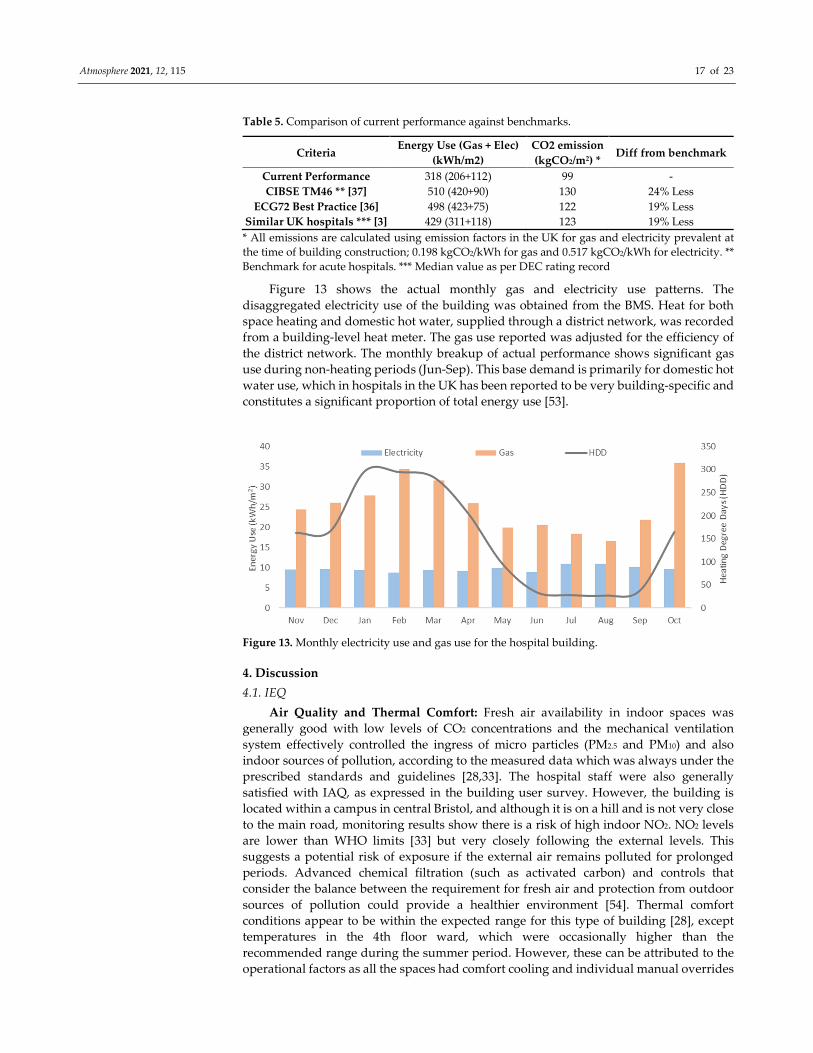
3.3. Energy Performance
The design-stage projection of energy performance was completed as a part of the
UK Building Regulations compliance documentation (Part L) and for EnCO2de
requirements. These calculations are mandatory for all new hospital buildings in the UK.
In addition to that, the authors also developed (retrospectively) a projected design stage
energy use as per CIBSE TM54, the voluntary UK industry guidance document for
calculating energy use at design stage. Figure 12 compares the Part L, EnCO2de and CIBSE
TM54 results against the actual energy use and ECG72 good practice benchmark.
There is a significant underestimation of energy use in the design stage Part L
calculation. The main reason is that these calculations, primarily aimed at assessing the
building and its fixed building services, exclude key energy end-uses such as plug-in
equipment. Moreover, the occupancy and operational profiles are based on standardised
values which may be significantly different in practice. The methodology proposed in
CIBSE TM54 and EnCO2de provides an approach for estimating operational energy use at
the design stage, accounting for all end uses in the building alongside realistic operating
patterns and assumptions for occupant behaviour.
Figure 12. Comparison of calculated (Part L), projected (EnCO2de), projected (TM54) & actual
energy use against good practice benchmark.
The energy use of various end-uses in these projections differs from actual use. The
projections underestimate the heating energy use and overestimate the equipment usage.
These variations however can be attributed to epistemic uncertainties in set point
temperatures and operations of hospital equipment. The high proportion of (medical)
equipment energy is unique to hospitals and has a specific load range and usage pattern.
This explains some of the overestimation for this end-use in the conservative design
projections.
The main reason for underestimation of the gas use in design projections was the
ongoing use of the low-efficiency district heating system, which, as per design intent, was
to be replaced by a new high-efficiency CHP system. As this had not happened several
years after the completion of the building and at the time of this investigation, the thermal
performance of the building was worse than what would be expected from a new
building. However, compared to other similar buildings, this building’s energy use is 26%
less than the median stock [3]. It is currently in the top 30% of hospital buildings. Table 5
compares the building’s performance with similar UK buildings and benchmarks.
Atmosphere 2021, 12, 115 17 of 23
Table 5. Comparison of current performance against benchmarks.
Criteria Energy Use (Gas + Elec)
(kWh/m2)
CO2 emission
(kgCO2/m2) * Diff from benchmark
Current Performance 318 (206+112) 99 -
CIBSE TM46 ** [37] 510 (420+90) 130 24% Less
ECG72 Best Practice [36] 498 (423+75) 122 19% Less
Similar UK hospitals *** [3] 429 (311+118) 123 19% Less
* All emissions are calculated using emission factors in the UK for gas and electricity prevalent at
the time of building construction; 0.198 kgCO2/kWh for gas and 0.517 kgCO2/kWh for electricity. **
Benchmark for acute hospitals. *** Median value as per DEC rating record
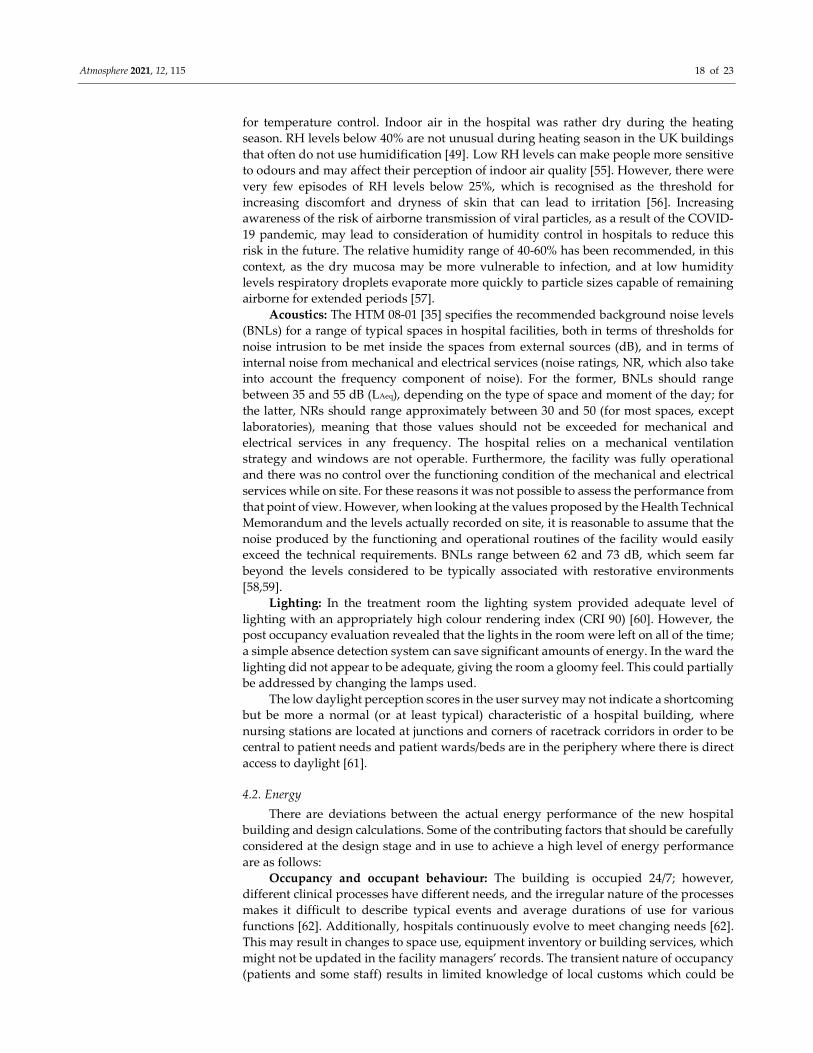
Figure 13 shows the actual monthly gas and electricity use patterns. The
disaggregated electricity use of the building was obtained from the BMS. Heat for both
space heating and domestic hot water, supplied through a district network, was recorded
from a building-level heat meter. The gas use reported was adjusted for the efficiency of
the district network. The monthly breakup of actual performance shows significant gas
use during non-heating periods (Jun-Sep). This base demand is primarily for domestic hot
water use, which in hospitals in the UK has been reported to be very building-specific and
constitutes a significant proportion of total energy use [53].
Figure 13. Monthly electricity use and gas use for the hospital building.
4. Discussion
4.1. IEQ
Air Quality and Thermal Comfort: Fresh air availability in indoor spaces was
generally good with low levels of CO2 concentrations and the mechanical ventilation
system effectively controlled the ingress of micro particles (PM2.5 and PM10) and also
indoor sources of pollution, according to the measured data which was always under the
prescribed standards and guidelines [28,33]. The hospital staff were also generally
satisfied with IAQ, as expressed in the building user survey. However, the building is
located within a campus in central Bristol, and although it is on a hill and is not very close
to the main road, monitoring results show there is a risk of high indoor NO2. NO2 levels
are lower than WHO limits [33] but very closely following the external levels. This
suggests a potential risk of exposure if the external air remains polluted for prolonged
periods. Advanced chemical filtration (such as activated carbon) and controls that
consider the balance between the requirement for fresh air and protection from outdoor
sources of pollution could provide a healthier environment [54]. Thermal comfort
conditions appear to be within the expected range for this type of building [28], except
temperatures in the 4th floor ward, which were occasionally higher than the
recommended range during the summer period. However, these can be attributed to the
operational factors as all the spaces had comfort cooling and individual manual overrides
Atmosphere 2021, 12, 115 18 of 23
for temperature control. Indoor air in the hospital was rather dry during the heating
season. RH levels below 40% are not unusual during heating season in the UK buildings
that often do not use humidification [49]. Low RH levels can make people more sensitive
to odours and may affect their perception of indoor air quality [55]. However, there were
very few episodes of RH levels below 25%, which is recognised as the threshold for
increasing discomfort and dryness of skin that can lead to irritation [56]. Increasing
awareness of the risk of airborne transmission of viral particles, as a result of the COVID-
19 pandemic, may lead to consideration of humidity control in hospitals to reduce this
risk in the future. The relative humidity range of 40-60% has been recommended, in this
context, as the dry mucosa may be more vulnerable to infection, and at low humidity
levels respiratory droplets evaporate more quickly to particle sizes capable of remaining
airborne for extended periods [57].
Acoustics: The HTM 08-01 [35] specifies the recommended background noise levels
(BNLs) for a range of typical spaces in hospital facilities, both in terms of thresholds for
noise intrusion to be met inside the spaces from external sources (dB), and in terms of
internal noise from mechanical and electrical services (noise ratings, NR, which also take
into account the frequency component of noise). For the former, BNLs should range
between 35 and 55 dB (LAeq), depending on the type of space and moment of the day; for
the latter, NRs should range approximately between 30 and 50 (for most spaces, except
laboratories), meaning that those values should not be exceeded for mechanical and
electrical services in any frequency. The hospital relies on a mechanical ventilation
strategy and windows are not operable. Furthermore, the facility was fully operational
and there was no control over the functioning condition of the mechanical and electrical
services while on site. For these reasons it was not possible to assess the performance from
that point of view. However, when looking at the values proposed by the Health Technical
Memorandum and the levels actually recorded on site, it is reasonable to assume that the
noise produced by the functioning and operational routines of the facility would easily
exceed the technical requirements. BNLs range between 62 and 73 dB, which seem far
beyond the levels considered to be typically associated with restorative environments
[58,59].
Lighting: In the treatment room the lighting system provided adequate level of
lighting with an appropriately high colour rendering index (CRI 90) [60]. However, the
post occupancy evaluation revealed that the lights in the room were left on all of the time;
a simple absence detection system can save significant amounts of energy. In the ward the
lighting did not appear to be adequate, giving the room a gloomy feel. This could partially
be addressed by changing the lamps used.
The low daylight perception scores in the user survey may not indicate a shortcoming
but be more a normal (or at least typical) characteristic of a hospital building, where
nursing stations are located at junctions and corners of racetrack corridors in order to be
central to patient needs and patient wards/beds are in the periphery where there is direct
access to daylight [61].
4.2. Energy
There are deviations between the actual energy performance of the new hospital
building and design calculations. Some of the contributing factors that should be carefully
considered at the design stage and in use to achieve a high level of energy performance
are as follows:
Occupancy and occupant behaviour: The building is occupied 24/7; however,
different clinical processes have different needs, and the irregular nature of the processes
makes it difficult to describe typical events and average durations of use for various
functions [62]. Additionally, hospitals continuously evolve to meet changing needs [62].
This may result in changes to space use, equipment inventory or building services, which
might not be updated in the facility managers’ records. The transient nature of occupancy
(patients and some staff) results in limited knowledge of local customs which could be
Atmosphere 2021, 12, 115 19 of 23
collected during site visits. While most occupancies and operations are standard, an
increased number of beds were observed in some of the patient wards during the site
visits.
Equipment, lighting and other loads and their operation: This is one of the most
uncertain areas for energy use estimation in hospitals. Different parts of the facility have
differing energy intensities of clinical processes and specialist medical equipment and of
building service requirements. Depending on the type of department, these loads can vary
significantly. For example, for consulting areas, field studies have shown loads to be
between 3–7 W/m2 [4], whereas UK NCM uses 27.31 W/m2. Therefore, it is difficult to
generalise typical operational trends of various spaces and their equipment loads.
Additionally, a detailed audit is difficult due to access restrictions.
HVAC system design and operations: Underestimation of fossil-thermal energy is
due to the low efficiency of the steam-based central heating network that serves the
building. A new, efficient, combined heat and power (CHP) plant was used in calculations
instead of the existing network. The new CHP plant was to be installed following a major
renovation to maximise the efficiency savings across the facility rather than as a separate
system for the new building only. As this had not happened at the time of this
investigation, the thermal performance of the building was much worse than expected
from a new building. Hospitals’ hot water energy use is reported to vary widely, ranging
from 10% of heating energy to up to 40% [63]. The actual daily demand in this hospital
was four times the UK NCM assumption of 3.4 l/m2, mostly due to clinical requirements.
To maintain appropriate IAQ through high air changes and filtration, energy used
by the auxiliary systems to supply fresh air was more than the design assumptions. Fans
and pumps provided this close control and used around 30% of total electricity, which, as
per the design, could have been more effective through an optimised demand-controlled
ventilation.
4.3. Lessons Learned
Most of the IEQ parameters in this hospital were within acceptable levels. However,
there were improvement opportunities in the filtration systems used for traffic-related
pollutants and underperformances in acoustics and lighting. Energy consumption, on the
other hand, is worse than projections made at the design stage. In this section, these issues
and their implications for hospital buildings are considered in a broader context.
Ventilation strategies in hospitals in urban areas: Mechanical ventilation systems
provide the necessary controls in hospitals and enable creation of more airtight envelopes.
In the controlled hospital environment, CO₂ levels in all monitored wards remained below
950 ppm [28] due to effective mechanical ventilation and high air change rates. In these
air supplies, filtration is used to provide a level of protection against outdoor sources of
pollution, such as particulate matter. However, some traffic-related pollutants, such as
NO2 and benzene, may not be mechanically filtered. Indoor NO2 levels recorded in a
patient ward on the third floor very closely followed the external levels, suggesting a
potential risk of chronic exposure if the external air remains polluted over prolonged
periods. The concentration levels of benzene were also higher than the best practice
exposure limit value [31]. Tertiary adsorption filters specified to chemically remove
specific pollutants can be used to manage the risk of ingress of pollutants identified as
high risk [54]. It should also be noted that maintaining high IEQ through high air changes
and filtration comes at an energy expense. Therefore, controls that consider the balance
between fresh air requirements and protection from outdoor sources of pollution could
provide a healthier environment, and at the same time save energy in mechanically
ventilated buildings [62].
Good IEQ for all building users in all building zones: There is some evidence of
low illuminance levels from daylight and artificial lighting in some zones. This issue was
also pointed out in the staff user survey. However, this issue may be more prevalent
among the staff rather than patients, as most patient wards have access to daylight either
Atmosphere 2021, 12, 115 20 of 23
through the external envelope glazing or the building’s central atrium. However, to meet
the functional design requirements, nursing stations and other staff occupied spaces are
located in more central locations, consequently making them furthest away from the
building periphery and sources of direct sunlight. Managing these issues require better
planning and ensuring that IEQ parameters are well defined and achieved for all building
occupants in all zones.
Use of advanced metering and monitoring data for optimal operations: New
buildings are now increasingly integrated with advanced metering and monitoring
strategies, linked via BMS systems. These strategies aim to monitor not just overall energy
use but disaggregated data for energy and IEQ parameters including temperature, and
CO2 levels and provide a potential to have better IEQ and energy performance, if used
properly. However, if the sub-meters are not functional or calibrated or are not regularly
monitored and benchmarked, as was the case in this hospital, this is a missed opportunity
given the level of metering present. Therefore, installing more meters and accumulation
of performance data will not bring environmental benefits, unless the metering strategy
is working as intended and the data are actually used for building monitoring and
targeting [64].
Safeguarding low-carbon technologies: The hospital case study was designed with
considerations about future upgrade of the campus-wide heating system. The current
energy performance of the building therefore does not represent the design intent and the
long-term potential of the building. To minimise the long-term impact of inefficient
systems, robust regulatory safeguards are needed to ensure that the proposed low or zero
carbon strategies and technologies will be used in practice, within acceptable timelines
[65].
Design projections and benchmarking of hospital energy performance: Use of
regulatory compliance calculations for projecting operational energy performance is not
appropriate as it generally leads to significant underestimation. Design stage energy
calculations need to account for realistically expected operating conditions [42]. Hospitals’
design stage projections for operational energy use should be calculated as per CIBSE
TM54 or EnCO2de in the UK, or other equivalent protocols internationally, accounting for
all end uses in the building alongside realistic operating patterns and behaviours.
However, it was noticed that even then there is significant variation in individual end-use
comparisons, when compared against typical hospital benchmarks [36,37]. As different
clinical processes have different energy demands, hospital benchmarking needs to look
beyond entire buildings and consider departments or other sub-spaces as unit of analysis
[40]. Measurement and verification of energy use post-occupancy can help establish a
robust operational baseline for performance reflective of the actual building loads and
functional requirements [64].
5. Conclusion
This study evaluated the IEQ and Energy performance of a hospital building and
identified several lessons that can be used to improve the current building’s performance
and also inform the design process for future buildings. While the findings regarding
performance issues might be specific to this case study, they concur with other evidence
in literature and therefore show applicability for other hospitals in general.
A key finding of this study is the vulnerability of building air quality in dense
(polluted) urban settings, where specific measures may be required to maintain good IAQ.
Depending on the level of pollution of the ambient air, it might be necessary to specify
advanced filters that, in addition to the particle arrest mechanism, can enact chemical
reactions necessary to remove pollutants prevalent in urban areas with adverse health
impact such as NO2 and benzene.
Adhering to the stringent IEQ requirements in hospitals comes at an energy expense
(e.g. filtration and conditioning of the high volumes of fresh air), and it is crucially
important to strike the right balance between these key performance objectives in the
Atmosphere 2021, 12, 115 21 of 23
context of a changing climate and the increasing focus to reduce energy use and
greenhouse gas emissions. Environmental control strategies can be adopted to balance
various performance objectives in buildings so that energy efficiency is not achieved at
the expense of IEQ and other aspects of building performance.
At the policy level, robust safeguards, such as measurement and verification of
building and system performance in the first few years, are required to ensure the
installed low or zero carbon strategies and technologies will be used in practice. This can
be supplemented by a Soft Landings [66] or performance contracting approach, in which
the designers, contractors and building managers are accountable and a stakeholder in
ensuring the operational performance of hospitals. The purview of performance
contracting should account for specific requirements for both IEQ and energy.
Author Contributions: Conceptualization, N.J., E.B. (Esfand Burman) and D.M.; methodology, E.B.
(Esfand Burman); formal analysis, N.J., E.B. (Esfand Burman), S.S., C.S., R.B., T.O., E.B. (Edward
Barrett) and F.A.; Writing—Original draft preparation, N.J. and E.B. (Esfand Burman); Writing—
Review and editing, S.S., C.S., R.B., T.O., E.B. (Edward Barrett), F.A., J.K., P.R., D.M. and M.D.;
supervision, J.K., P.R., D.M. and M.D.; project administration and funding acquisition, D.M. and
M.D. All authors have read and agreed to the published version of the manuscript.
Funding: The authors gratefully acknowledge the financial support from UCL Overseas Research
Scholarships (UCL-ORS), DesignBuilder Software Ltd., Innovate UK KTP project (Partnership
number 11615); the 'Total Performance’ of Low Carbon Buildings in China and the UK (‘TOP’)
project funded by EPSRC (EP/N009703/1) and the ERC Advanced Grant (55 740696).
Institutional Review Board Statement: The study was conducted according to the guidelines of the
Declaration of Helsinki and approved by the UCL Research Ethics Committee (Ethics Application
4891/001, Approved on 20 May 2016).
Informed Consent Statement: Informed consent was obtained from all subjects involved in the
study.
Data Availability Statement: Data is contained within this article.
Acknowledgments: The authors wish to express their gratitude to the designers, building managers
and users who engaged in research and supported the building performance evaluation.
Conflicts of Interest: The authors declare no conflict of interest.
References
1. Walton, H.; Dajnak, D.; Beevers, S.; Williams, M.; Watkiss, P.; Hunt, A. Understanding Health Impacts of Air Pollution in London;
King’s College London: London, UK, 2015.
2. Department of Health. Health Technical Memorandum 07-02: EnCO2de 2015—Making Energy Work in Healthcare; Department of
Health: London, UK, 2015.
3. Hong, S.-M.; Steadman, P. An Analysis of Display Energy Certificated for Public Buildings, 2008-2012; Chartered Institution of
Building Services Engineers (CIBSE): London, UK, 2013.
4. Sheppy, M.; Pless, S.; Kung, F. Healthcare Energy End-Use Monitoring; National Renewable Energy Laboratory (NREL): Golden,
Colorado, 2014.
5. Wyon, D.P.; Wargocki, P. How Indoor Environment Affects Performance. ASHRAE J. 2013, 55, 46-52.
6. Chatzidiakou, L.; Mumovic, D.; Dockrell, J. The Effects of Thermal Conditions and Indoor Air Quality on Health, Comfort and Cognitive
Performance of Students; The Bartlett, UCL Faculty of the Built Environment, UCL Institute for Environmental Design and
Engineering: London, UK, 2014.
7. Al Horr, Y.; Arif, M.; Katafygiotou, M.; Mazroei, A.; Kaushik, A.; Elsarrag, E. Impact of indoor environmental quality on
occupant well-being and comfort: A review of the literature. Int. J. Sustain. Built Environ. 2016, 5, 1–11.
8. Tuohy, P.G.; Murphy, G.B. Are current design processes and policies delivering comfortable low carbon buildings? Arch. Sci.
Rev. 2015, 58, 39-46.
9. Fabbri, K.; Tronchin, L. Indoor Environmental Quality in Low Energy Buildings. Energy Procedia 2015, 78, 2778-2783.
10. Phillips, T.J.; Levin, H. Indoor environmental quality research needs for low-energy homes. Sci. Technol. Built Environ. 2015, 21,
80-90.
11. Xie, H.; Kang, J.; Tompsett, R. The impacts of environmental noise on the academic achievements of secondary school students
in Greater London. Appl. Acoust. 2011, 72, 551–555.
12. Public Health England. Health Matters: Air Pollution; Public Health England: London, UK, 2018.
Atmosphere 2021, 12, 115 22 of 23
13. IOM (Institute of Medicine). Clearing the Air: Asthma and Indoor Air Exposures; National Academy Press: Washington, DC, USA,
2000.
14. COMEAP. The Mortality Effects of Long-Term Exposure to Particulate Air Pollution in the UK; Health Protection Agency and
Committee on the Medical Effects of Air Pollutants: London, UK, 2010.
15. COMEAP. Nitrogen Dioxide: Effects on Mortality; Public Health England and Committee on the Medical Effects of Air Pollutants:
London, UK, 2018.
16. BCC.; AQCL. Health Impacts of Air Pollution in Bristol; Bristol City Council has Commissioned Air Quality Consultants Ltd.:
Bristol, UK, 2017.
17. COMEAP. Review of the UK Air Quality Index: A Report by the Committee on the Medical Effects of Air Pollutants; Health Protection
Agency, The Committee on the Medical Effects of Air Pollutant: London, UK, 2011.
18. Larsen, T.S.; Daniels, O.; Jensen, R.L. Evaluation of the Indoor Environment in 8 Danish Passive Houses; In Proceedings of the
Passivhus Norden 2012, Trondheim, Norway, 2012.
19. Maivel, M.; Kurnitski, J.; Kalamees, T. Field survey of overheating problems in Estonian apartment buildings. Arch. Sci. Rev.
2015, 58, 1–10, doi:10.1080/00038628.2014.970610.
20. Logue, J.M.; McKone, T.E.; Sherman, M.H.; Singer, B.C. Hazard assessment of chemical air contaminants measured in
residences. Indoor Air 2011, 21, 92–109.
21. Abadie, M.; Wargocki, P. Indoor Air Quality Design and Control in Low-energy Residential Buildings, Subtask 1, Defining the metrics.
IEA EBC Annex 68, The Technical University of Denmark and International Energy Agency, INIVE EEIG, Lozenberg, Belgium
2017.
22. De Giuli, V.; Zecchin, R.; Salmaso, L.; Corain, L.; De Carli, M. Measured and perceived indoor environmental quality: Padua
Hospital case study. Build. Environ. 2013, 59, 211–226.
23. Fifield, L.-J. Monitoring UK Hospital Building Type Performance. PhD Thesis, Loughborough University, Loughborough, UK,
2016.
24. Public Health England (PHE). Heatwave Plan for England: Protecting Health and Reducing Harm from Severe Heat and Heatwaves;
Public Health England: London, UK, 2018.
25. Alan, S.C.; Lomas, K.J.; Giridharan, R.; Fair, A. Building resilience to overheating into 1960’s UK hospital buildings within the
constraint of the national carbon reduction target: Adaptive strategies. Build. Environ. 2012, 55, 73–95.
26. British Lung Foundation. Toxic Air at the Door of the NHS; British Lung Foundation: London, UK, 2018.
27. Castres, P.; Dajnak, D.; Lott, M.; Watts, N. Most London hospitals and clinics exceed air pollution limits. Br. Med J. 2017, 357,
j2855.
28. BSI. BS EN 16798-1:2019 Energy Performance of Buildings: Ventilation for Buildings. British Standards Institution: London, UK,
2019.
29. BSI. Indoor Environmental Input Parameters for Design and Assessment of Energy Performance of Buildings Addressing Indoor Air
Quality, Thermal Environment, Lighting and Acoustics; British Standards Institution: London, UK, 2007.
30. Department of Health. Heating and Ventilation Systems Health Technical Memorandum 03-01: Specialised Ventilation for Healthcare
Premises; Department of Health: London, UK, 2007.
31. IEA.; TUD. Indoor Air Quality Design and Control in Low-Energy Residential Buildings-Annex 68|Subtask 1: Defining the Metrics;
INIVE EEIG for International Energy Agency and The Technical University of Denmark: Lozenberg, UK, 2017.
32. PHE. Indoor Air Quality Guidelines for Selected Volatile Organic Compounds (VOCs) in the UK.; Public Health England: London, UK,
2019.
33. WHO. WHO Air Quality Guidelines for Particulate Matter, Ozone, Nitrogen Dioxide and Sulfur Dioxide; World Health Organisation
Regional Office for Europe: Copenhagen, Denmark, 2005.
34. WHO. WHO Guidelines for Indoor Air Quality: Selected Pollutants; World Health Organisation Regional Office for Europe:
Copenhagen, Denmark, 2010.
35. Department of Health. Acoustics Health Technical Memorandum 08-01; Department of Health: London, UK, 2013.
36. BRECSU. Energy Consumption Guide 72: Energy Consumption in Hospitals; Building Research Energy Conservation Support Unit
(BRECSU): Watford, UK, 1996.
37. CIBSE. TM 46: Energy Benchmarks; Chartered Institute of Building Services Engineers (CIBSE): London, UK, 2008.
38. NHS Digital, Estates Returns Information Collection. 2018. Available online: https://digital.nhs.uk/data-and-
information/publications/statistical/estates-returns-information-collection (accessed on 22 January 2019).
39. Burman, E.; Hong, S.-M.; Paterson, G.; Kimpian, J.; Mumovic, D. A comparative study of benchmarking approaches for non-
domestic buildings: Part 2—Bottom-up approach. Int. J. Sustain. Built Environ. 2014, 3, 247–261.
40. Morgenstern, P.; Raslan, R.; Ruyssevelt, P. Reducing Hospital Electricity Use: An End-Use Perspective; In proceedings of the 9th
International Conference on Improving Energy Efficiency in Commercial Buildings and Smart Communities, Frankfurt,
Germany, 16–18 March 2016.
41. DCLG. Approved Document L2A: Conservation of Fuel and Power in New Buildings Other Than Dwellings; Department for
Communities and Local Government: London, UK, 2013.
42. CIBSE. TM54: Evaluating Operational Energy Performance of Buildings at the Design Stage; The Chartered Institution of Building
Services Engineers (CIBSE): London, UK, 2013.
Atmosphere 2021, 12, 115 23 of 23
43. Morgenstern, P.; Li, M.; Raslan, R.; Ruyssevelt, P.; Wright, A. Benchmarking acute hospitals: Composite electricity targets based
on departmental consumption intensities? Energy Build. 2016, 118, 277–290.
44. Kimpian, J.; Chisholm, S. Tracking Design and Actual Energy Use: CarbonBuzz, an RIBA CIBSE platform. In Proceedings of the
PLEA 2011, Louvain-la-Neuve, Belgium, 13–15 July 2011.
45. Burman, E.; Rigamonti, D.; Kimpain, J.; Mumovic, D. Performance gap and thermal modelling: A comparison of simulation
results and actual energy performance for an academy in North-West England. In Proceedings of the First Building Simulation
and Optimization Conference, Loughborough, UK, 10–11 September 2012.
46. BCC. 2020 Air Quality Annual Status Report (ASR); Bristol City Council: Bristol, UK, 2020.
47. BCC, Air Quality Dashboard. Open Data Bristol. 2020. Available online: https://opendata.bristol.gov.uk/pages/air-quality-
dashboard-new/air-quality-now#map. (accessed on 20 November 2020).
48. Chamseddine, A.; Alameddine, I.; Hatzopoulou, M.; El-Fadel, M. Seasonal variation of air quality in hospitals with indoor-
outdoor correlations. Build. Environ. 2019, 148, 689–700.
49. CIBSE. CIBSE Guide A: Environmental Design; The Chartered Institution of Building Services Engineers: London, UK, 2015.
50. ISO/TS 12913-2:2018. Acoustics—Soundscape—Part 2: Data Collection and Reporting Requirements; International Organization for
Standardization: Geneva, Switzerland, 2018.
51. BSI. BS 667: Illuminance Meters. Requirements and Test Methods; British Standards Institution: London, UK, 2005.
52. Chen, C.; Zhao, B. Review of relationship between indoor and outdoor particles: I/O ratio, infiltration factor and penetration
factor. Atmospheric Environ. 2011, 45, 275–288.
53. DECC. Energy Consumption in the UK (2018) Chapter 5: Service Sector Energy Consumption in the UK between 1970 and 2017;
Department of Energy & Climate Change: UK, London, UK, 2018.
54. Kukadia, V.; Upton, S. Ensuring Good Indoor Air Quality in Buildings; BRE Trust: Watford, UK, 2019.
55. Fang, L.; Clausen, G.; Fanger, P.O. Impact of temperature and humidity on perception of indoor air quality. Indoor Air 1998, 8,
80–90.
56. Nathanson, T. Indoor Air Quality in Office Buildings: A Technical Guide; Minister of Supply and Services Canada: Ottawa, ON,
Canada, 1995.
57. Taylor, S. Using the Indoor Environment to Contain the Coronavirus; Engineered Systems: Troy, MI, USA, 2020.
58. Thomas, P.; Aletta, F.; Filipan, K.; Mynsbrugge, T.V.; De Geetere, L.; Dijckmans, A.; Botteldooren, D.; Petrovic, M.; Van De
Velde, D.; De Vriendt, P.; et al. Noise environments in nursing homes: An overview of the literature and a case study in Flanders
with quantitative and qualitative methods. Appl. Acoust. 2020, 159, 107103.
59. Kang, J.; Xie, H. The acoustic environment of intensive care wards based on long period nocturnal measurements. Noise Heal.
2012, 14, 230–236.
60. SLL. The SLL Code for Lighting; Society of Light and Lighting: London, UK, 2012.
61. Nazarian, M.; Price, A.; Demian, P. A Review of Different Approaches to Access and People Circulation within Health-Care Facilities
and the Application of Modelling, Simulation and Visualisation; Architectural Management in the Digital Arena (CIB-W096): Vienna,
Austria, 2011.
62. Jain, N.; Burman, E.; Stamp, S.; Mumovic, D.; Davies, M. Cross-sectoral assessment of the performance gap using calibrated
building energy performance simulation. Energy Build. 2020, 224, 110271.
63. Bawaneh, K.; Nezami, F.G.; Rasheduzzaman, M.; Deken, B. Energy Consumption Analysis and Characterization of Healthcare
Facilities in the United States. Energies 2019, 12, 3775.
64. CIBSE. TM63: Operational Performance: Building Performance Modelling; The Chartered Institution of Building Services Engineers
(CIBSE): London, UK, 2020.
65. CIBSE. TM61: Operational Performance of Building; The Chartered Institution of Building Services Engineers (CIBSE): London,
UK, 2020.
66. Way, M.; Bordass, B.; Leaman, A.; Bunn, R. The Soft Landings Framework; Building Services Research & Information Association
and Usable Build Trust: London, UK, 2009.
Related Documents