BAJAJ FINANCE LIMITED Q3 FY16 Presentation 3 rd February 2016

Welcome message from author
This document is posted to help you gain knowledge. Please leave a comment to let me know what you think about it! Share it to your friends and learn new things together.
Transcript

BAJAJ FINANCE LIMITED Q3 FY16 Presentation
3rd February 2016
PRESENTATION PATH
• Bajaj group structure 3
• Bajaj Finserv group - Executive summary 4
• What do we stand for 5
• Bajaj Finance Shareholder profile 6
• Financial snapshot 7
• Bajaj Finance Limited product suite 8
• Business/Product launch journey 9
• Executive summary 10
• Customer franchise 12
• Key portfolio metrics 13
• Strong distribution reach 14
• Key performance highlights for the quarter 15
• Summary financial statement Q3 FY16 16
• Management discussion 17
• Financial performance trends Q3 FY16 23
• Credit quality Portfolio composition 26
• PR coverage highlights for the quarter 29
• Disclaimer 32
BAJAJ GROUP STRUCTURE
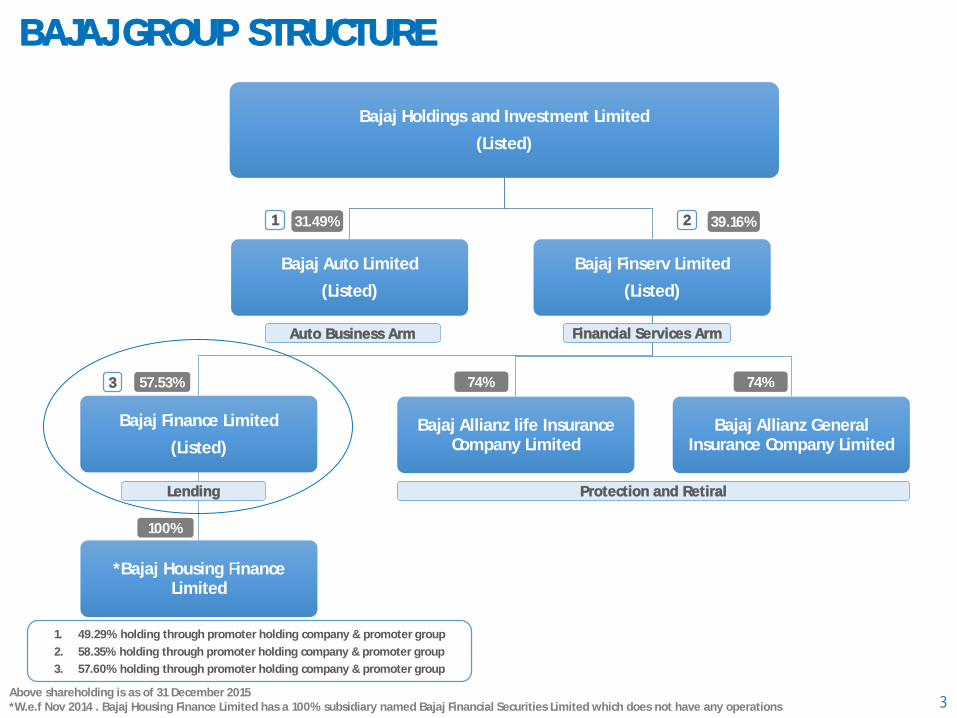
3Above shareholding is as of 31 December 2015 *W.e.f Nov 2014 . Bajaj Housing Finance Limited has a 100% subsidiary named Bajaj Financial Securities Limited which does not have any operations
Bajaj Holdings and Investment Limited
(Listed)
Bajaj Auto Limited
(Listed)
Bajaj Finserv Limited
(Listed)
Bajaj Finance Limited
(Listed)
*Bajaj Housing FinanceLimited
Bajaj Allianz life Insurance Company Limited
Bajaj Allianz General Insurance Company Limited
1. 49.29% holding through promoter holding company & promoter group
2. 58.35% holding through promoter holding company & promoter group
3. 57.60% holding through promoter holding company & promoter group
Auto Business Arm Financial Services Arm
31.49% 39.16%
57.53% 74%
100%
Lending Protection and Retiral
1 2
3 74%
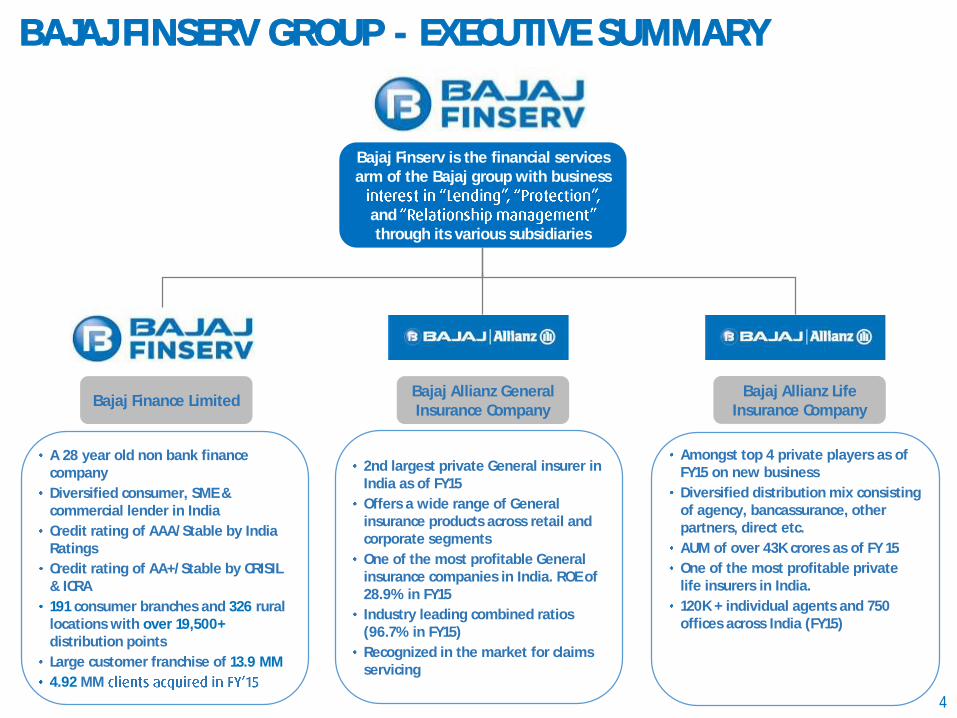
BAJAJ FINSERV GROUP - EXECUTIVE SUMMARY
4
2nd largest private General insurer in India as of FY15
Offers a wide range of General insurance products across retail and corporate segments
One of the most profitable General insurance companies in India. ROE of 28.9% in FY15
Industry leading combined ratios (96.7% in FY15)
Recognized in the market for claims servicing
Amongst top 4 private players as of FY15 on new business
Diversified distribution mix consisting of agency, bancassurance, other partners, direct etc.
AUM of over 43K crores as of FY 15
One of the most profitable private life insurers in India.
120K + individual agents and 750 offices across India (FY15)
A 28 year old non bank finance company
Diversified consumer, SME & commercial lender in India
Credit rating of AAA/Stable by India Ratings
Credit rating of AA+/Stable by CRISIL & ICRA
191 consumer branches and 326 rural locations with over 19,500+distribution points
Large customer franchise of 13.9 MM
4.92 MM
Bajaj Finserv is the financial services arm of the Bajaj group with business
and through its various subsidiaries
Bajaj Allianz General Insurance Company
Bajaj Allianz Life Insurance Company
Bajaj Finance Limited

WHAT DO WE STAND FOR
5
envisages an optimal mix of risk and profit to deliver a sustainable business model
a sustainable ROA of 3% & ROE of 18-20% in the medium term
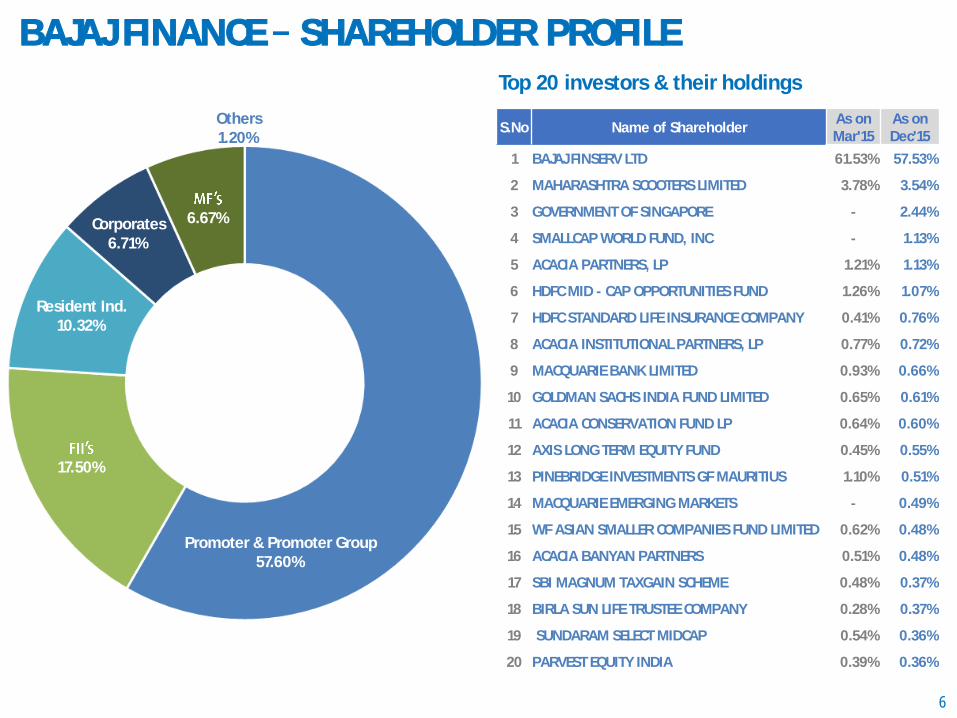
BAJAJ FINANCE SHAREHOLDER PROFILE
6
Top 20 investors & their holdings
Promoter & Promoter Group57.60%
Resident Ind.10.32%
Corporates6.71%
Others1.20%
17.50%
6.67%
S.No Name of ShareholderAs on Mar'15
As on Dec'15
1 BAJAJ FINSERV LTD 61.53% 57.53%
2 MAHARASHTRA SCOOTERS LIMITED 3.78% 3.54%
3 GOVERNMENT OF SINGAPORE - 2.44%
4 SMALLCAP WORLD FUND, INC - 1.13%
5 ACACIA PARTNERS, LP 1.21% 1.13%
6 HDFC MID - CAP OPPORTUNITIES FUND 1.26% 1.07%
7 HDFC STANDARD LIFE INSURANCE COMPANY 0.41% 0.76%
8 ACACIA INSTITUTIONAL PARTNERS, LP 0.77% 0.72%
9 MACQUARIE BANK LIMITED 0.93% 0.66%
10 GOLDMAN SACHS INDIA FUND LIMITED 0.65% 0.61%
11 ACACIA CONSERVATION FUND LP 0.64% 0.60%
12 AXIS LONG TERM EQUITY FUND 0.45% 0.55%
13 PINEBRIDGE INVESTMENTS GF MAURITIUS 1.10% 0.51%
14 MACQUARIE EMERGING MARKETS - 0.49%
15 WF ASIAN SMALLER COMPANIES FUND LIMITED 0.62% 0.48%
16 ACACIA BANYAN PARTNERS 0.51% 0.48%
17 SBI MAGNUM TAXGAIN SCHEME 0.48% 0.37%
18 BIRLA SUN LIFE TRUSTEE COMPANY 0.28% 0.37%
19 SUNDARAM SELECT MIDCAP 0.54% 0.36%
20 PARVEST EQUITY INDIA 0.39% 0.36%
FINANCIAL SNAPSHOT
7
YoY
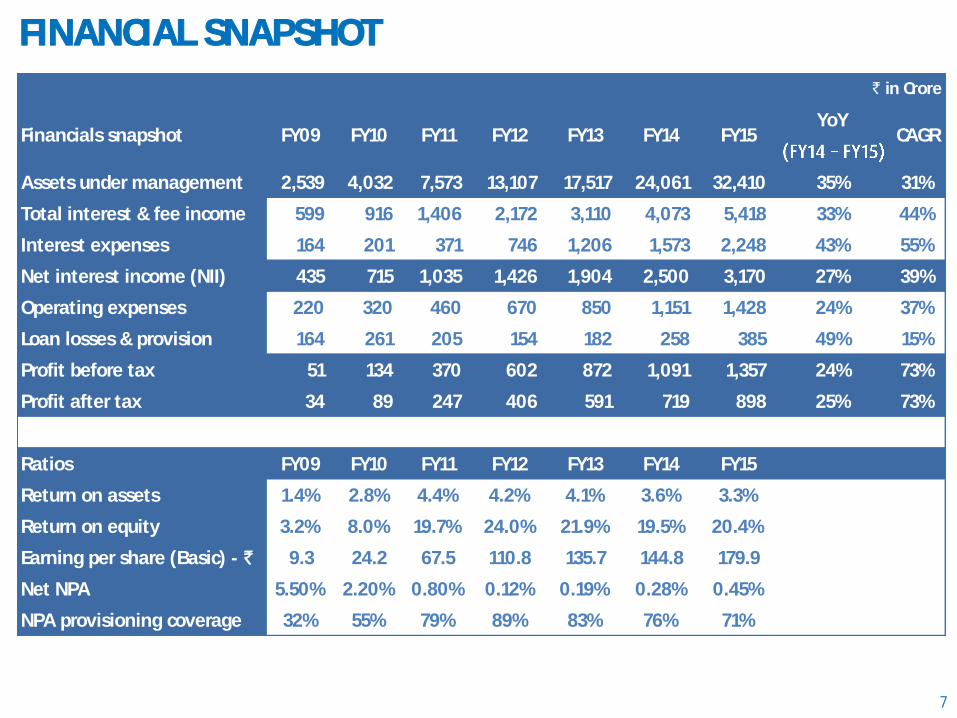
Assets under management 2,539 4,032 7,573 13,107 17,517 24,061 32,410 35% 31%
Total interest & fee income 599 916 1,406 2,172 3,110 4,073 5,418 33% 44%
Interest expenses 164 201 371 746 1,206 1,573 2,248 43% 55%
Net interest income (NII) 435 715 1,035 1,426 1,904 2,500 3,170 27% 39%
Operating expenses 220 320 460 670 850 1,151 1,428 24% 37%
Loan losses & provision 164 261 205 154 182 258 385 49% 15%
Profit before tax 51 134 370 602 872 1,091 1,357 24% 73%
Profit after tax 34 89 247 406 591 719 898 25% 73%
Ratios FY09 FY10 FY11 FY12 FY13 FY14 FY15
Return on assets 1.4% 2.8% 4.4% 4.2% 4.1% 3.6% 3.3%
Return on equity 3.2% 8.0% 19.7% 24.0% 21.9% 19.5% 20.4%
Earning per share (Basic) - ` 9.3 24.2 67.5 110.8 135.7 144.8 179.9
Net NPA 5.50% 2.20% 0.80% 0.12% 0.19% 0.28% 0.45%
NPA provisioning coverage 32% 55% 79% 89% 83% 76% 71%
` in Crore
Financials snapshot FY09 FY10 FY11 FY12 FY13 FY14 FY15 CAGR

BAJAJ FINANCE LIMITED PRODUCT SUITE
8* Paused Available through Digital channels as well
Bajaj Finance Limited
Consumer Lending
Small Business Lending
Commercial Lending
Rural Lending
RelationshipsDistribution
Services
CRISIL Rating
Co-Branded Credit Cards
Property SearchServices
Consumer Financial FitnessReport
SME Financial Fitness
Report
Infrastructure Financing *
Auto Component Vendor Financing
Large Value Lease Rental Discounting
Loans Against Securities
Loan Cross Sell
Term Deposits
Life Insurance Distribution
General InsuranceDistribution
Loans Against Property
Lease Rental Discounting
Business Loans
Home Loans for Self Employed
Professional Loans
Consumer Durable Financing
2W & 3W vehicle Financing
EMI Card
Home Loans for Salaried
Personal Loans to Salaried
Digital Product Financing
Lifestyle Product Financing
Gold Loans
Personal Loans
Asset Backed Refinancing
Business Loans
Consumer Durable Financing
Property FitnessReport
E-commerce Seller Finance
Mutual Fund DistributionFinancial
Institutions Lending Business Professional
Loans
Loans Against Property
Light Engineering Business
Corporate Finance Business
Insurance RiskReport
Personal Loans Cross Sell
BUSINESS/PRODUCT LAUNCH JOURNEY
9
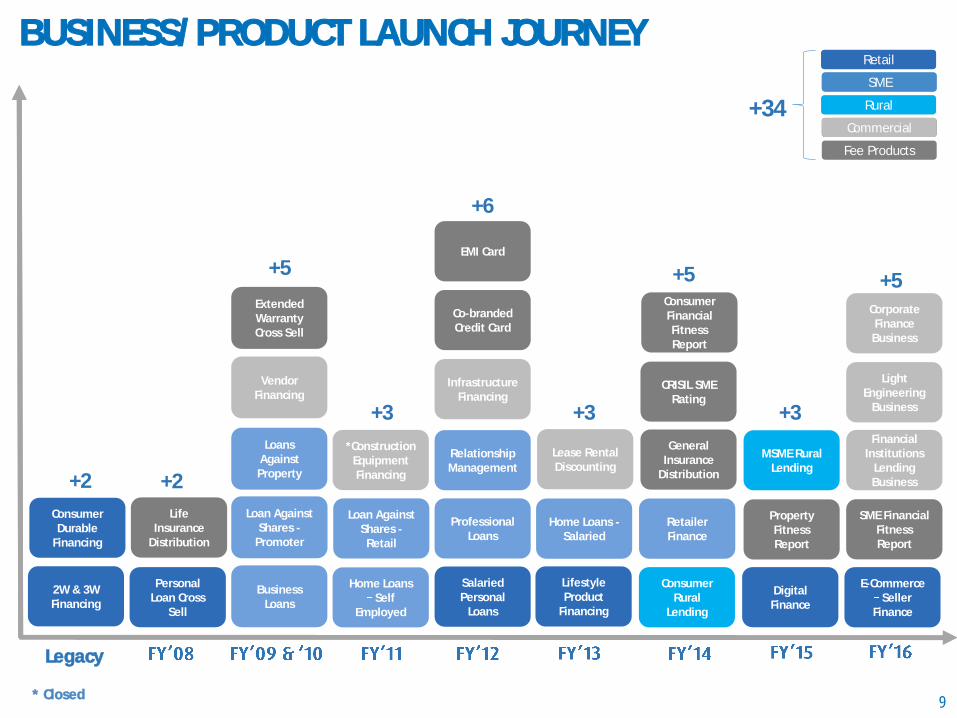
2W & 3W Financing
Consumer Durable
Financing
*Construction Equipment Financing
Home Loans Self
Employed
Loan Against Shares -Retail
Personal Loan Cross
Sell
Life Insurance
Distribution
Loans Against Property
Business Loans
Loan Against Shares -
Promoter
Vendor Financing
Extended Warranty Cross Sell
+2 +2
+5
+3
+6
+3
General Insurance
Distribution
Consumer Rural
Lending
Retailer Finance
Consumer Financial Fitness Report
CRISIL SME Rating
+3
Lifestyle Product
Financing
Home Loans -Salaried
Relationship Management
Salaried Personal
Loans
Infrastructure Financing
Co-branded Credit Card
EMI Card
Professional Loans
+5
Property Fitness Report
Digital Finance
* Closed
Legacy
E-Commerce Seller
Finance
Financial Institutions
Lending Business
SME
Retail
Fee Products
Commercial +34SME
Retail
Commercial
Rural
Fee Products
SME Financial Fitness Report
Lease Rental Discounting
MSME Rural Lending
Light Engineering
Business
+5Corporate Finance Business
EXECUTIVE SUMMARY
10
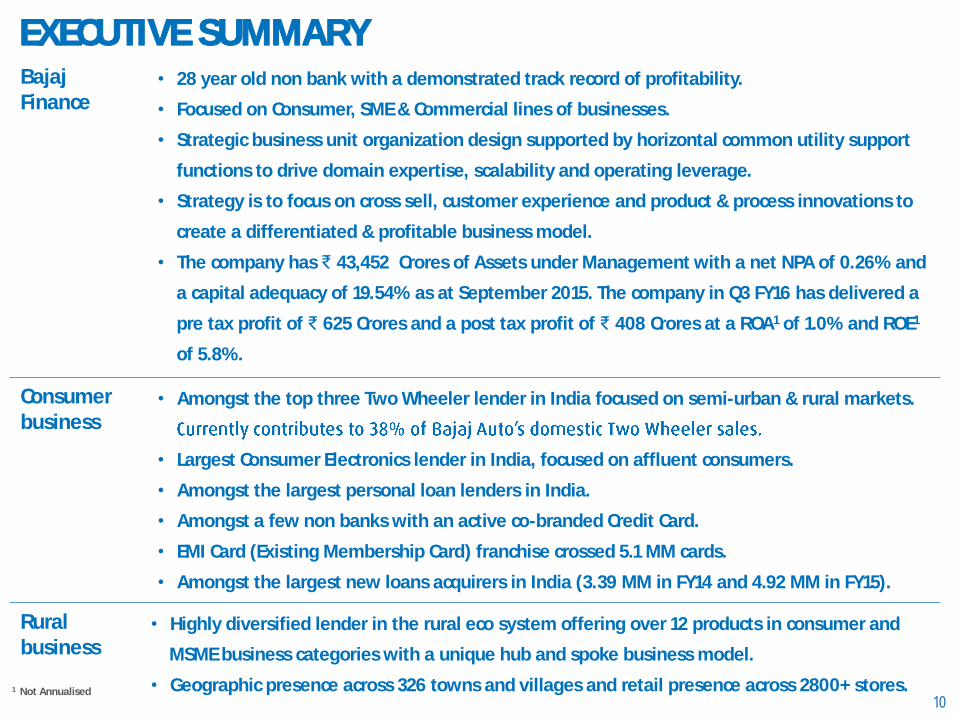
Bajaj Finance
• 28 year old non bank with a demonstrated track record of profitability.
• Focused on Consumer, SME & Commercial lines of businesses.
• Strategic business unit organization design supported by horizontal common utility support
functions to drive domain expertise, scalability and operating leverage.
• Strategy is to focus on cross sell, customer experience and product & process innovations to
create a differentiated & profitable business model.
• The company has ₹ 43,452 Crores of Assets under Management with a net NPA of 0.26% and
a capital adequacy of 19.54% as at September 2015. The company in Q3 FY16 has delivered a
pre tax profit of ₹ 625 Crores and a post tax profit of ₹ 408 Crores at a ROA1 of 1.0% and ROE1
of 5.8%.
Consumerbusiness
• Amongst the top three Two Wheeler lender in India focused on semi-urban & rural markets.
• Largest Consumer Electronics lender in India, focused on affluent consumers.
• Amongst the largest personal loan lenders in India.
• Amongst a few non banks with an active co-branded Credit Card.
• EMI Card (Existing Membership Card) franchise crossed 5.1 MM cards.
• Amongst the largest new loans acquirers in India (3.39 MM in FY14 and 4.92 MM in FY15).
Ruralbusiness
• Highly diversified lender in the rural eco system offering over 12 products in consumer and
MSME business categories with a unique hub and spoke business model.
• Geographic presence across 326 towns and villages and retail presence across 2800+ stores.1 Not Annualised
EXECUTIVE SUMMARY (CONTD.)
11
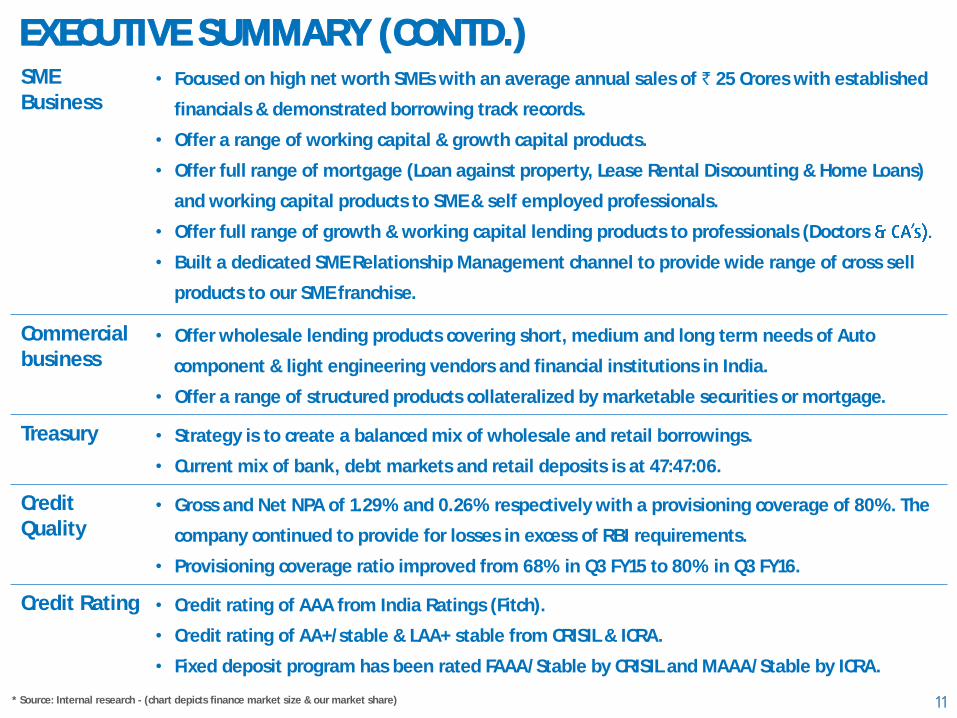
SME Business
• Focused on high net worth SMEs with an average annual sales of ` 25 Crores with established
financials & demonstrated borrowing track records.
• Offer a range of working capital & growth capital products.
• Offer full range of mortgage (Loan against property, Lease Rental Discounting & Home Loans)
and working capital products to SME & self employed professionals.
• Offer full range of growth & working capital lending products to professionals (Doctors
• Built a dedicated SME Relationship Management channel to provide wide range of cross sell
products to our SME franchise.
Commercialbusiness
• Offer wholesale lending products covering short, medium and long term needs of Auto
component & light engineering vendors and financial institutions in India.
• Offer a range of structured products collateralized by marketable securities or mortgage.
Treasury • Strategy is to create a balanced mix of wholesale and retail borrowings.
• Current mix of bank, debt markets and retail deposits is at 47:47:06.
Credit Quality
• Gross and Net NPA of 1.29% and 0.26% respectively with a provisioning coverage of 80%. The
company continued to provide for losses in excess of RBI requirements.
• Provisioning coverage ratio improved from 68% in Q3 FY15 to 80% in Q3 FY16.
Credit Rating • Credit rating of AAA from India Ratings (Fitch).
• Credit rating of AA+/stable & LAA+ stable from CRISIL & ICRA.
• Fixed deposit program has been rated FAAA/Stable by CRISIL and MAAA/Stable by ICRA.
* Source: Internal research - (chart depicts finance market size & our market share)
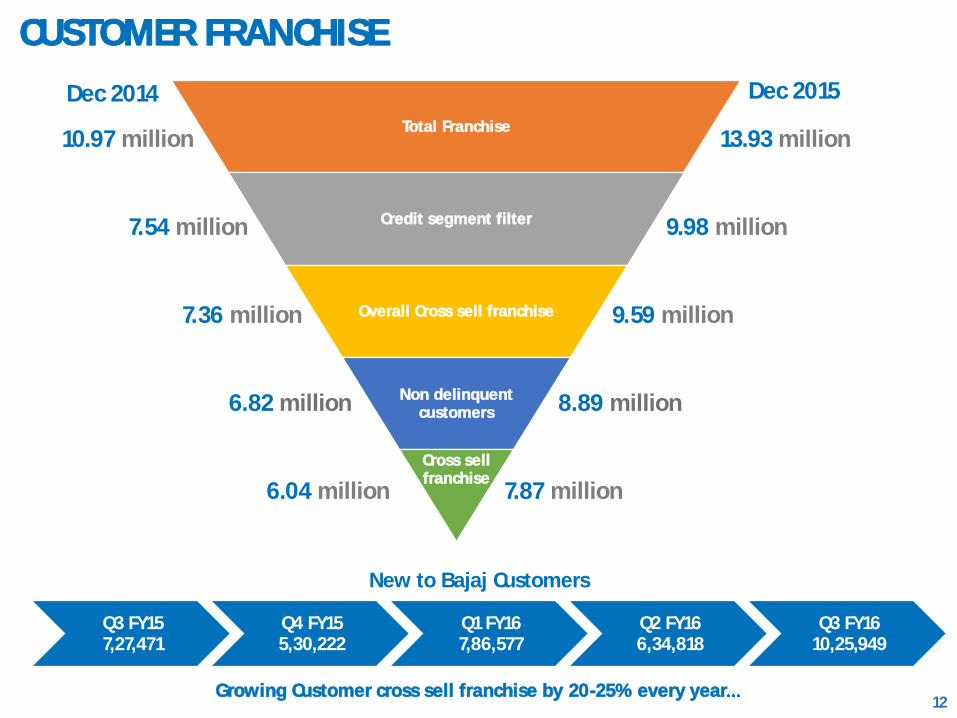
CUSTOMER FRANCHISE
12Growing Customer cross sell franchise by 20-25% every year
Q3 FY157,27,471
Q4 FY155,30,222
Q1 FY167,86,577
Q2 FY166,34,818
Q3 FY1610,25,949
New to Bajaj Customers
Dec 2015
Total Franchise
Credit segment filter
Overall Cross sell franchise
Non delinquent customers
Cross sell franchise
9.98 million
7.87 million
13.93 million
8.89 million
9.59 million
Dec 2014
7.54 million
10.97 million
7.36 million
6.04 million
6.82 million

KEY PORTFOLIO METRICS
13** Paused
Business Segment
AUM (₹ Crores)Deploy-ments
IRRTicket (Lacs)
Quarter gone by
Q3 FY15 Q1 FY16 Q2 FY16 Q3 FY 16 YoY Q3 FY16 Range
1. 2W & 3W finance 3,437 3,315 3,387 3,647 6% 973 22.0% 28.0% 0.50
2. Consumer durable finance 4,180 5,147 4,916 5,935 42% 5,844 24.0% 26.0% 0.29
3. Digital product finance 267 354 409 587 120% 518 24.0% 26.0% 0.28
4. Lifestyle product finance 165 211 275 366 122% 265 24.0% 26.0% 0.52
5. Personal loans cross sell 2,156 2,741 3,058 3,524 63% 848 16.0% 33.0% 1.17
6. Salaried personal loans 1,586 2,231 2,529 2,921 84% 872 14.0% 16.0% 4.50
7. Business loans (BL) 2,474 3,058 3,320 4,146 68% 1,470 17.0% 20.0% 15
8. Professional loans 532 737 845 985 85% 314 14.0% 17.0% 16
9. Loan against property (LAP) 7,802 8,424 8,985 8,890 14% 1,260 11.0% 12.0% 175
10. Home loans (Self employed - HL) 2,981 3,063 3,094 3,238 9% 506 10.0% 10.7% 100
11. Home loans (Salaried - HL) 755 938 1,096 1,339 77% 330 9.6% 10.5% 36
12. Loan against securities 1,395 1,516 1,704 2,352 69% - 10.8% 12.0% 200
13. RM Business (LAP, HL, BL) 1,111 1,360 1,572 1,844 66% 545 10.0% 20.0% 53
14. Vendor financing 1,075 1,333 1,322 1,472 37% - 10.0% 12.5% -
15. Financial institutions group - - 60 236 - 210 10.5% 12.0% -
16. Corporate finance - 75 247 314 - 73 10.5% 12.0% -
17. Infrastructure lending 442 398 355 312 (29%) - NA NA NA **
18. Rural lending 234 522 661 1,159 395% 773 14.0% 35.0% 0.40
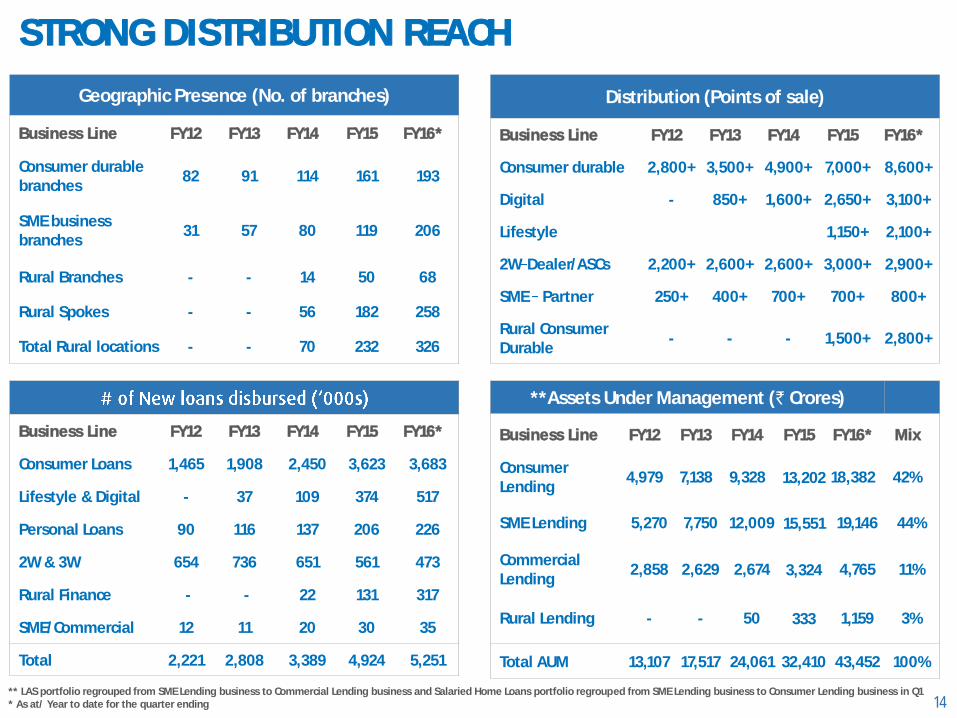
STRONG DISTRIBUTION REACH
14** LAS portfolio regrouped from SME Lending business to Commercial Lending business and Salaried Home Loans portfolio regrouped from SME Lending business to Consumer Lending business in Q1* As at/ Year to date for the quarter ending
Geographic Presence (No. of branches)
Business Line FY12 FY13 FY14 FY15 FY16*
Consumer durable branches
82 91 114 161 193
SME businessbranches
31 57 80 119 206
Rural Branches - - 14 50 68
Rural Spokes - - 56 182 258
Total Rural locations - - 70 232 326
Distribution (Points of sale)
Business Line FY12 FY13 FY14 FY15 FY16*
Consumer durable 2,800+ 3,500+ 4,900+ 7,000+ 8,600+
Digital - 850+ 1,600+ 2,650+ 3,100+
Lifestyle 1,150+ 2,100+
2W Dealer/ASCs 2,200+ 2,600+ 2,600+ 3,000+ 2,900+
SME Partner 250+ 400+ 700+ 700+ 800+
Rural Consumer Durable
- - - 1,500+ 2,800+
Business Line FY12 FY13 FY14 FY15 FY16*
Consumer Loans 1,465 1,908 2,450 3,623 3,683
Lifestyle & Digital - 37 109 374 517
Personal Loans 90 116 137 206 226
2W & 3W 654 736 651 561 473
Rural Finance - - 22 131 317
SME/Commercial 12 11 20 30 35
Total 2,221 2,808 3,389 4,924 5,251
**Assets Under Management (` Crores)
Business Line FY12 FY13 FY14 FY15 FY16* Mix
Consumer Lending
4,979 7,138 9,328 13,202 18,382 42%
SME Lending 5,270 7,750 12,009 15,551 19,146 44%
Commercial Lending
2,858 2,629 2,674 3,324 4,765 11%
Rural Lending - - 50 333 1,159 3%
Total AUM 13,107 17,517 24,061 32,410 43,452 100%
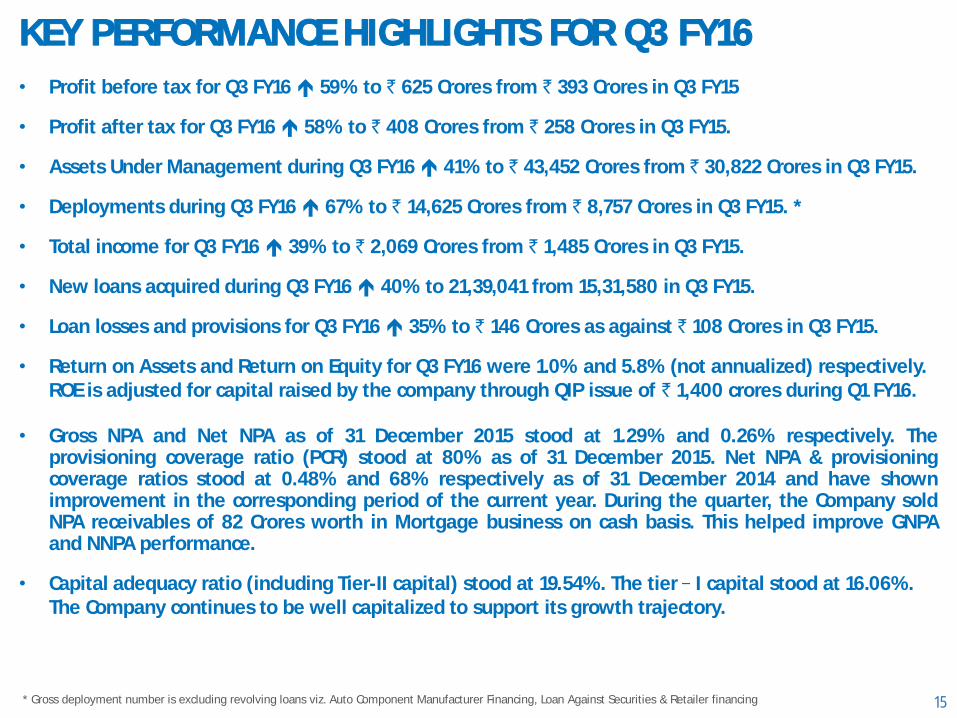
KEY PERFORMANCE HIGHLIGHTS FOR Q3 FY16
15
• Profit before tax for Q3 FY16 59% to ` 625 Crores from ` 393 Crores in Q3 FY15
• Profit after tax for Q3 FY16 58% to ` 408 Crores from ` 258 Crores in Q3 FY15.
• Assets Under Management during Q3 FY16 41% to ` 43,452 Crores from ` 30,822 Crores in Q3 FY15.
• Deployments during Q3 FY16 67% to ` 14,625 Crores from ` 8,757 Crores in Q3 FY15. *
• Total income for Q3 FY16 39% to ` 2,069 Crores from ` 1,485 Crores in Q3 FY15.
• New loans acquired during Q3 FY16 40% to 21,39,041 from 15,31,580 in Q3 FY15.
• Loan losses and provisions for Q3 FY16 35% to ` 146 Crores as against ` 108 Crores in Q3 FY15.
• Return on Assets and Return on Equity for Q3 FY16 were 1.0% and 5.8% (not annualized) respectively. ROE is adjusted for capital raised by the company through QIP issue of ` 1,400 crores during Q1 FY16.
• Gross NPA and Net NPA as of 31 December 2015 stood at 1.29% and 0.26% respectively. Theprovisioning coverage ratio (PCR) stood at 80% as of 31 December 2015. Net NPA & provisioningcoverage ratios stood at 0.48% and 68% respectively as of 31 December 2014 and have shownimprovement in the corresponding period of the current year. During the quarter, the Company soldNPA receivables of 82 Crores worth in Mortgage business on cash basis. This helped improve GNPAand NNPA performance.
• Capital adequacy ratio (including Tier-II capital) stood at 19.54%. The tier I capital stood at 16.06%. The Company continues to be well capitalized to support its growth trajectory.
* Gross deployment number is excluding revolving loans viz. Auto Component Manufacturer Financing, Loan Against Securities & Retailer financing
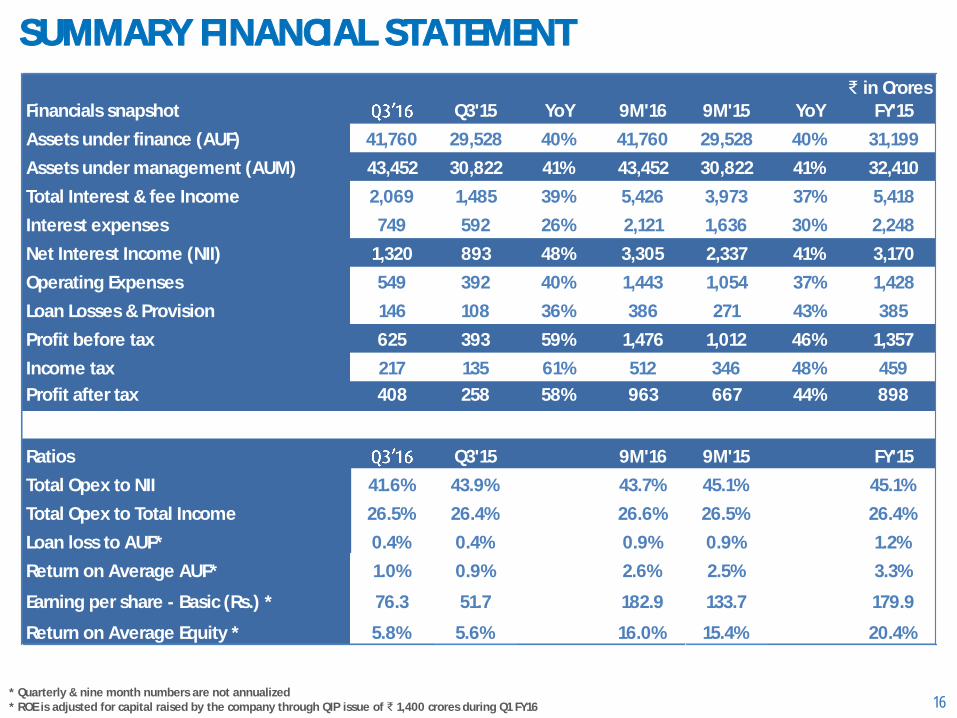
SUMMARY FINANCIAL STATEMENT
16* Quarterly & nine month numbers are not annualized* ROE is adjusted for capital raised by the company through QIP issue of ₹ 1,400 crores during Q1 FY16
Financials snapshot Q3'15 YoY 9M'16 9M'15 YoY FY'15
Assets under finance (AUF) 41,760 29,528 40% 41,760 29,528 40% 31,199
Assets under management (AUM) 43,452 30,822 41% 43,452 30,822 41% 32,410
Total Interest & fee Income 2,069 1,485 39% 5,426 3,973 37% 5,418
Interest expenses 749 592 26% 2,121 1,636 30% 2,248
Net Interest Income (NII) 1,320 893 48% 3,305 2,337 41% 3,170
Operating Expenses 549 392 40% 1,443 1,054 37% 1,428
Loan Losses & Provision 146 108 36% 386 271 43% 385
Profit before tax 625 393 59% 1,476 1,012 46% 1,357
Income tax 217 135 61% 512 346 48% 459
Profit after tax 408 258 58% 963 667 44% 898
Ratios Q3'15 9M'16 9M'15 FY'15
Total Opex to NII 41.6% 43.9% 43.7% 45.1% 45.1%
Total Opex to Total Income 26.5% 26.4% 26.6% 26.5% 26.4%
Loan loss to AUF* 0.4% 0.4% 0.9% 0.9% 1.2%
Return on Average AUF* 1.0% 0.9% 2.6% 2.5% 3.3%
Earning per share - Basic (Rs.) * 76.3 51.7 182.9 133.7 179.9
Return on Average Equity * 5.8% 5.6% 16.0% 15.4% 20.4%
₹ in Crores
17
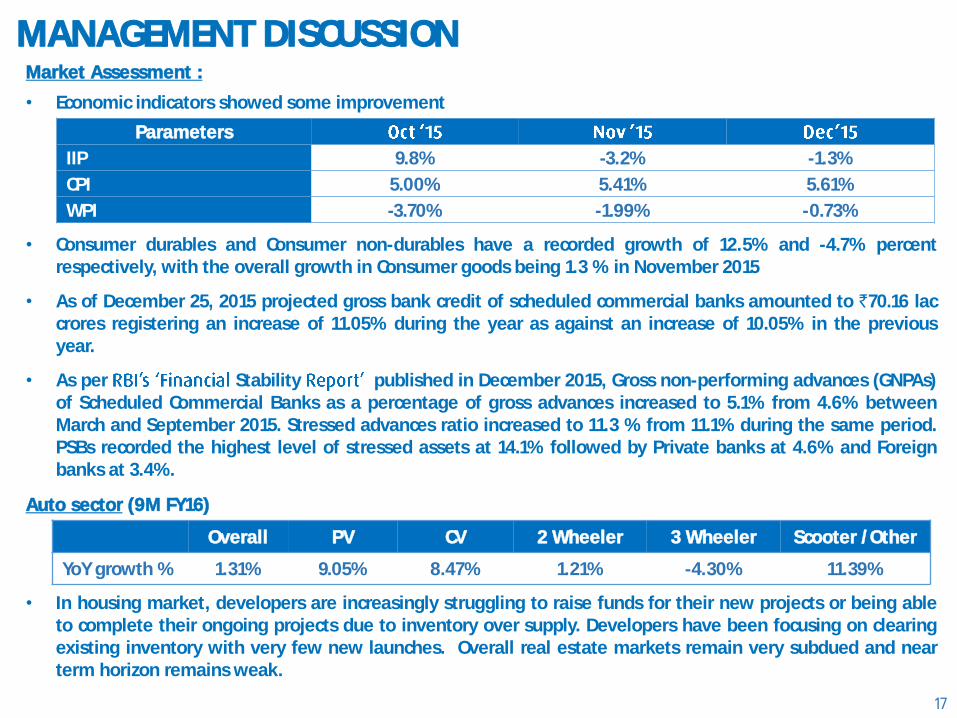
MANAGEMENT DISCUSSIONMarket Assessment :
• Economic indicators showed some improvement
• Consumer durables and Consumer non-durables have a recorded growth of 12.5% and -4.7% percentrespectively, with the overall growth in Consumer goods being 1.3 % in November 2015
• As of December 25, 2015 projected gross bank credit of scheduled commercial banks amounted to `70.16 laccrores registering an increase of 11.05% during the year as against an increase of 10.05% in the previousyear.
• As per Stability published in December 2015, Gross non-performing advances (GNPAs)of Scheduled Commercial Banks as a percentage of gross advances increased to 5.1% from 4.6% betweenMarch and September 2015. Stressed advances ratio increased to 11.3 % from 11.1% during the same period.PSBs recorded the highest level of stressed assets at 14.1% followed by Private banks at 4.6% and Foreignbanks at 3.4%.
Auto sector (9M FY16)
• In housing market, developers are increasingly struggling to raise funds for their new projects or being ableto complete their ongoing projects due to inventory over supply. Developers have been focusing on clearingexisting inventory with very few new launches. Overall real estate markets remain very subdued and nearterm horizon remains weak.
Overall PV CV 2 Wheeler 3 Wheeler Scooter /Other
YoY growth % 1.31% 9.05% 8.47% 1.21% -4.30% 11.39%
Parameters
IIP 9.8% -3.2% -1.3%
CPI 5.00% 5.41% 5.61%
WPI -3.70% -1.99% -0.73%
18
Business Commentary :
• Overall the strongest quarter for the company in last 2 years with granular growth across most lines ofbusinesses of the company.
• Two wheeler and Three wheeler financing business disbursed 971 Crs (21% YoY) during the quarter. TwoWheeler financing business disbursed 177K accounts in the quarter (11% YoY). Three Wheeler financingbusiness disbursed 8.5K accounts in the quarter (47% YoY). Two Wheeler financing penetration of Bajaj
domestic Two Wheeler sales increased to 38% from 37% in Q3 FY15. Three wheeler financingpenetration of Bajaj domestic Three Wheeler sales in Q3 was at 17%.
• Consumer Durable business showed strong momentum in Q3 disbursing 14.59 lac accounts (30% YoY) onaccount of a strong festive season. Marketing campaign for Bajaj Finserv Experia mobile app, throughwhich a customer can take loan approval online, also helped garner close to 200 K applications. Companywill be launching Version 2 of the app soon with a more sophisticated UI/UX. Company clocked a newmilestone of decisioning more than 81K applications on the day of Dhanteras across 200+ cities and towns.
• EMI card franchise crossed 5.1 MM cards in force. More than 50% of customers in Consumer Durablebusiness, Lifestyle Finance business and Digital Product Finance business come from EMI card franchise
• Retailer finance business for consumer durable business remained strong, disbursing 1,753 Crs (98% YoY).
• Digital product finance business disbursed 178 K accounts (76% YoY) during the quarter. Businessrelationships with top 3 high value phone OEMs (Apple, Samsung, Sony ) and laptop OEMs continued tostrengthen. Approximately 6% of Apple phones sold in India are financed by BFL now. Business also sawexpansion of tie ups with other mobile phone manufacturers
MANAGEMENT DISCUSSION (CONTD.)
19
• an online to offline partnership model with retailers, has been launched in Q3. BajajFinance Limited sold 50 phones via this channel as a test in December. The business is incorporating thelearnings of the initial launch to streamline the process. This line is expected to deliver higher growth innext fiscal.
• Lifestyle finance business disbursed 50.4 K accounts in Q3 (122% YoY). Furniture remains the largestlifestyle finance category. Entering new categories like mattresses, care credit to grow this business.Business continues to leverage EMI card franchise with nearly 70% business contribution from existingcustomers.
• Salaried personal loans had a strong quarter with disbursal of 727 Crs in Q3 (51% YoY). tocontribution in Q3 increased to 54% from 50% in Q2 as part of the strategy to grow direct
business. Business is expanding its geographical footprint to 15 new locations in Q4.
• Salaried home loans disbursed 330 Crs (112% YoY) in Q3. We are working on launching our 4th digitalproperty viz. Experia-Commerce which will help customers identify and buy property along with a loanfrom Bajaj Finance Limited. We expect to launch the same in the next fiscal.
• E-Commerce seller finance business disbursed 82.6 Crs in Q3 across 160+ sellers of Flipkart and Snapdeal.Business continues to explore opportunities with various E-commerce players to create solutions forconsumers as well as sellers of e-commerce companies.
• Personal loan cross sell business disbursed 802 Crs in Q3 (63% YoY). Growing customer franchise andinvestment in analytics capabilities has enabled this growth. Business contribution from Tier II hasincreased from 38% to 46% in last 12 months as part of the strategy to diversify the portfoliogeographically.
MANAGEMENT DISCUSSION (CONTD.)
20
• BFS Direct business has generated 174 Crs of volumes between four different business lines (PersonalLoans, Business Loans , Home Loans & Loan against Securities).
• Rural lending business continued to grow well in Q3 disbursing 624 Crs (271% YoY) owing to low base andsuperlative execution. The business added spokes to existing branches across states of Madhya Pradesh,Karnataka, Maharashtra and Gujarat during the quarter. The business is now present in 326 towns andvillages in less than 3 years of its launch. The business is well on track to launch its branches inRajasthan in Q4.
• MSME rural business disbursed 67 Crs in Q3 is yet to stabilise given first year of its launch.
• Business Loans had a strong quarter disbursing 1,266 Crs in Q3 (70% YoY). Portfolio performancecontinues to hold well across all parameters. Launch of Decision Support System enabled the business tobuild momentum for velocity and scale.
• Professional Loans continued to grow well and disbursed 310 Crs in Q3 (93% YoY). The pre-approvedmodel to lend to has been initiated. Decision Support System functionality hasalso been extended to Professional Loans to help build momentum and achieve scale.
• Loan against property business continued to remain in hyper competitive state. The business disbursed1,213 Crs in Q3 (1% YoY). LAP business has transitioned to 100% to in order to build alow cost & sustainable ROE business. As part of the to strategy, Bajaj Finance Limitedhenceforth, will only sell to its large existing customer franchise. Business is expected to de-grow duringthis transition but it should deliver growth from next fiscal. This change is a very significant change and ifsuccessful should help in delivering acquisition cost saves in the next fiscal
MANAGEMENT DISCUSSION (CONTD.)
21
• Self-employed home loan business disbursed 459 Crs in Q3 (de-growth of 20% YOY). The de-growth wason account of transition to a 100% to model. The D2C strategy has already starteddelivering results in terms of better acquisition and lower costs thereby improving profitability. Thischange is a very significant change and is helping to deliver a robust & sustainable mortgage business.
• Infra financing business continues to remain in pause mode due to sectoral stress. The outstandingportfolio is now down to 312 Crs comprising of 5 accounts. One account was fully provisioned in Q3.
• LAS business had a very good quarter with a net AR addition of 602 Crs catalyzed by growth in its retailsegment. The business despite tremendous volatility continues to hold its portfolio performance well.
• Auto component financing businesses continued to grow well in this quarter with a net AR addition of150 Crs.
• Corporate Finance, Financial Institutions (FIG) lending business & Light Engineering Business arebeginning to grow well and disbursed 248 Crs in Q3. The total AUM has increased to more than 550 Crs inthese businesses.
• Relationship management business which offers multiple products to clients across loans (secured andunsecured), wealth management and insurance products continued to gain momentum in last quarter.The business disbursed 537 Crs in Q3 (103% YoY).
• Fixed deposit business garnered 672 Crs of new fixed deposits during the Q3 taking the total depositbook to 2,038 Crs (218% YoY). The average deposit size stood at 3.3 lacs with a weighted tenor of 25months. Fixed Deposit now contributes to 5.9% of total borrowings.
MANAGEMENT DISCUSSION (CONTD.)
22
• IFA channel strategy to diversify our fixed deposit channel strategy is moving well with the businessempaneling 658 during the quarter in partnership with BAGIC & HDFC Life.
• Gross NPA and Net NPA as of 31 December 2015 stood at 1.29% (1.50% last year) and 0.26% (0.49% lastyear) respectively. The provisioning coverage ratio stood at 80%. During the quarter, the Company soldNPA receivables of 82 Crores worth in Mortgage business on cash basis. This has helped improve LAP &Self employed HL portfolio metrics.
• Interest cost for the company continues to remain significantly lower amongst its NBFC peers. Borrowingmix at the quarter end stood at 47:47:06 between banks, money markets and retail deposits respectively.
MANAGEMENT DISCUSSION (CONTD.)
39% YoY
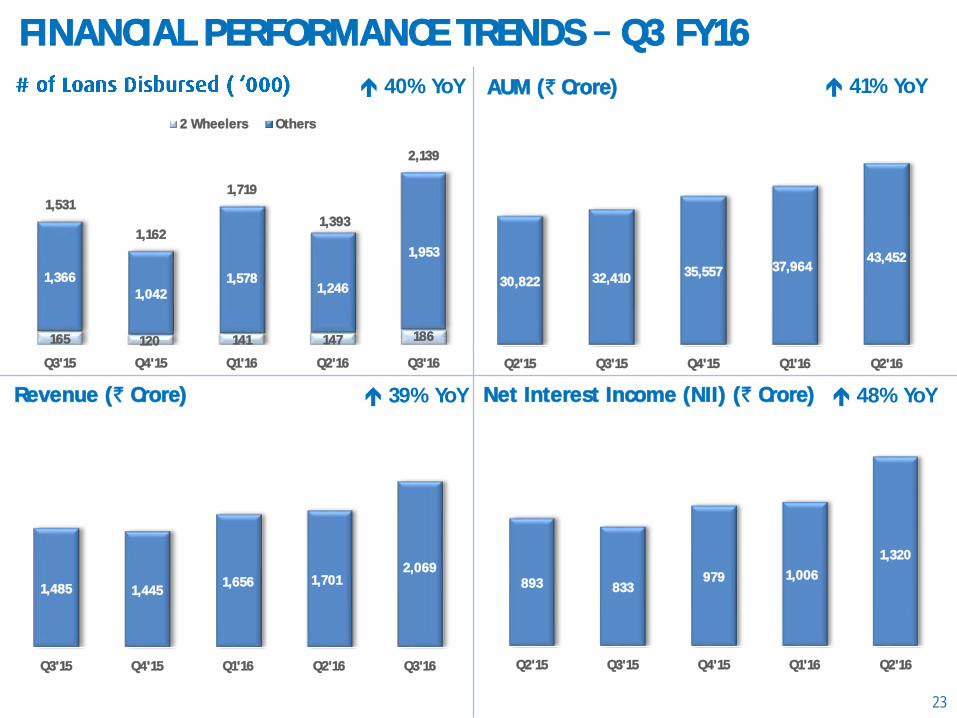
FINANCIAL PERFORMANCE TRENDS Q3 FY16
23
Revenue (` Crore)
AUM (` Crore)
Net Interest Income (NII) (` Crore) 48% YoY
40% YoY 41% YoY
165 120 141 147 186
1,366
1,0421,578
1,246
1,953
1,531
1,162
1,719
1,393
2,139
Q3'15 Q4'15 Q1'16 Q2'16 Q3'16
2 Wheelers Others
30,822 32,410 35,557 37,96443,452
Q2'15 Q3'15 Q4'15 Q1'16 Q2'16
1,485 1,4451,656 1,701
2,069
Q3'15 Q4'15 Q1'16 Q2'16 Q3'16
893 833979 1,006
1,320
Q2'15 Q3'15 Q4'15 Q1'16 Q2'16
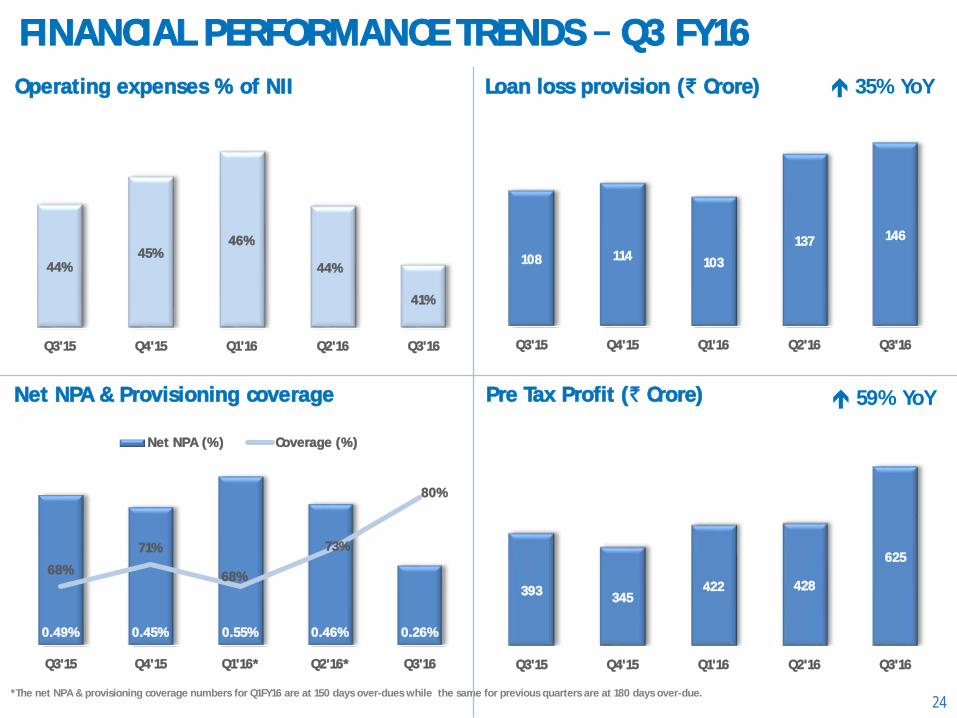
FINANCIAL PERFORMANCE TRENDS Q3 FY16
24
Operating expenses % of NII
Net NPA & Provisioning coverage
Loan loss provision (₹ Crore)
Pre Tax Profit (` Crore)
*The net NPA & provisioning coverage numbers for Q1FY16 are at 150 days over-dues while the same for previous quarters are at 180 days over-due.
35% YoY
59% YoY
44%45%
46%
44%
41%
Q3'15 Q4'15 Q1'16 Q2'16 Q3'16
108 114103
137 146
Q3'15 Q4'15 Q1'16 Q2'16 Q3'16
0.49% 0.45% 0.55% 0.46% 0.26%
68%
71%
68%
73%
80%
Q3'15 Q4'15 Q1'16* Q2'16* Q3'16
Net NPA (%) Coverage (%)
393345
422 428
625
Q3'15 Q4'15 Q1'16 Q2'16 Q3'16
Earnings per share Basic (`)
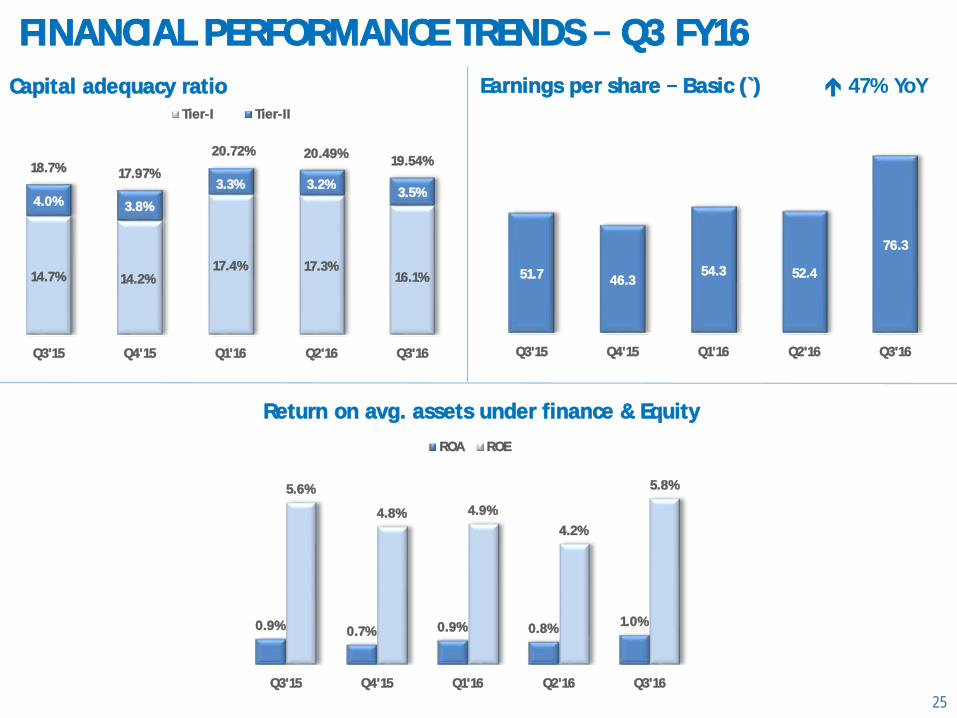
FINANCIAL PERFORMANCE TRENDS Q3 FY16
25
Capital adequacy ratio
Return on avg. assets under finance & Equity
47% YoY
14.7% 14.2%17.4% 17.3%
16.1%
4.0% 3.8%
3.3% 3.2%3.5%
18.7% 17.97%
20.72% 20.49%19.54%
Q3'15 Q4'15 Q1'16 Q2'16 Q3'16
Tier-I Tier-II
51.7 46.354.3 52.4
76.3
Q3'15 Q4'15 Q1'16 Q2'16 Q3'16
0.9% 0.7% 0.9% 0.8%1.0%
5.6%
4.8% 4.9%
4.2%
5.8%
Q3'15 Q4'15 Q1'16 Q2'16 Q3'16
ROA ROE
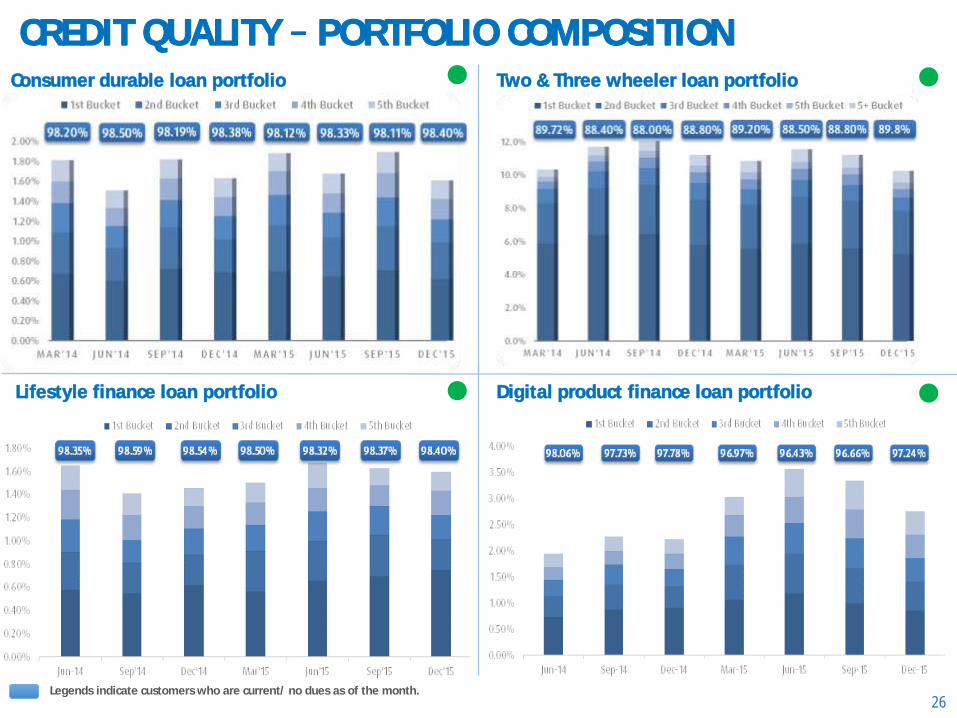
CREDIT QUALITY PORTFOLIO COMPOSITION
26Legends indicate customers who are current/ no dues as of the month.
Consumer durable loan portfolio Two & Three wheeler loan portfolio
Lifestyle finance loan portfolio Digital product finance loan portfolio

CREDIT QUALITY PORTFOLIO COMPOSITION
27Legends indicate customers who are current/ no dues as of the month.
Small business loan portfolio
Personal loan cross sell portfolio Salaried personal loan portfolio
Loan against property portfolio
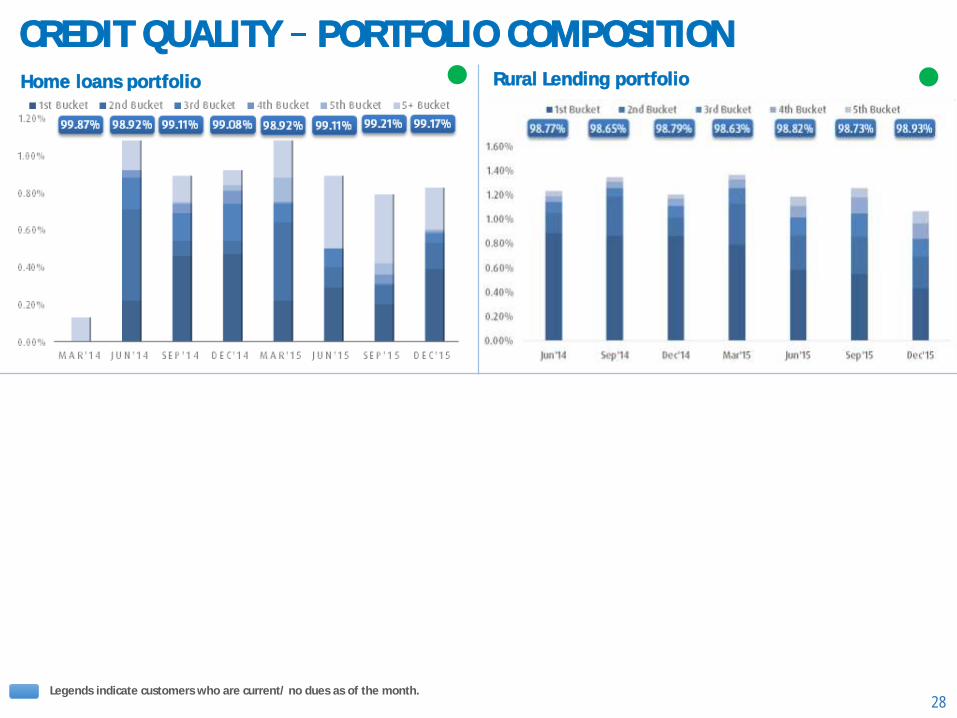
CREDIT QUALITY PORTFOLIO COMPOSITION
28
Home loans portfolio
Legends indicate customers who are current/ no dues as of the month.
Rural Lending portfolio
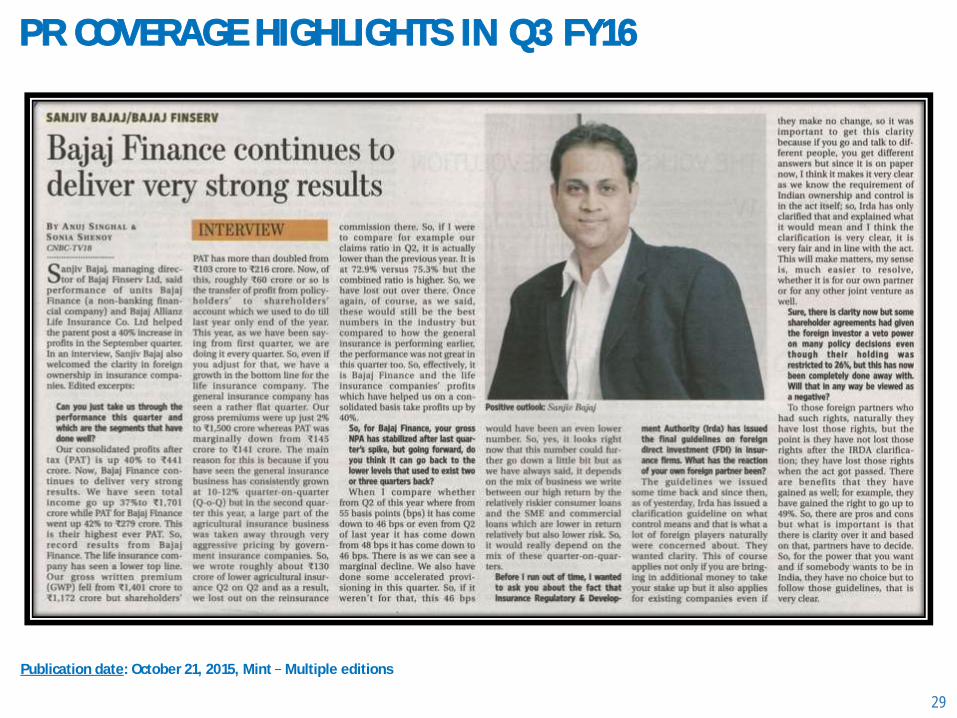
PR COVERAGE HIGHLIGHTS IN Q3 FY16
29
Publication date: October 21, 2015, Mint Multiple editions

30
PR COVERAGE HIGHLIGHTS IN Q3 FY16 (CONTD.)
Publication date: October 27, 2015, Economic Times Multiple editionsArticle access: http://economictimes.indiatimes.com/opinion/interviews/et-500-why-nbfc-bajaj-finance-is-on-the-road-to-a-scorching-pace-of-growth/articleshow/49515880.cms
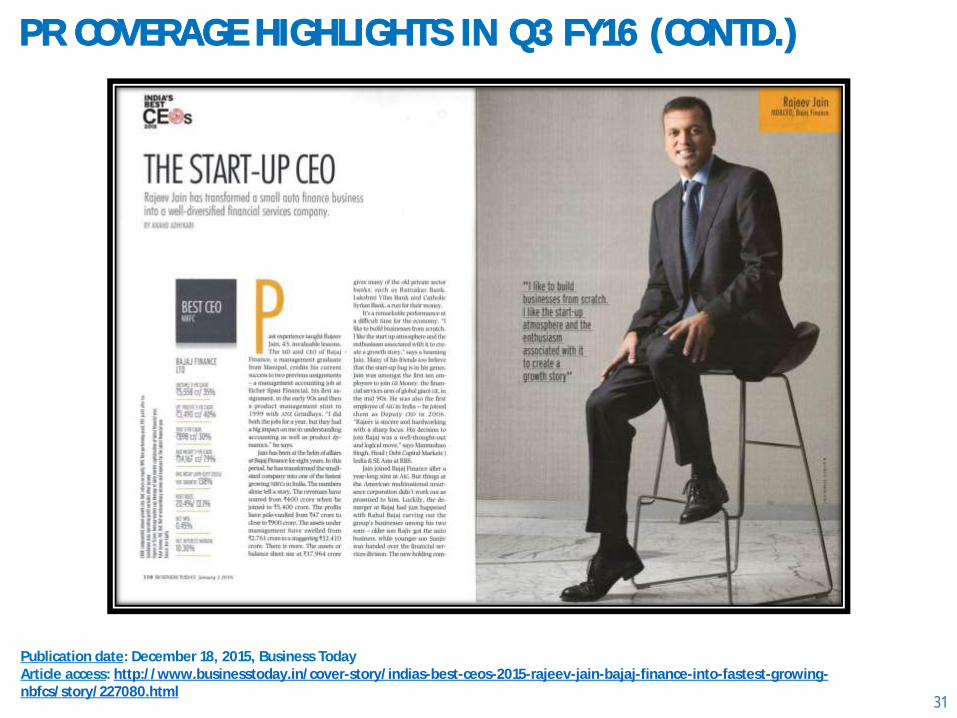
PR COVERAGE HIGHLIGHTS IN Q3 FY16 (CONTD.)
31
Publication date: December 18, 2015, Business TodayArticle access: http://www.businesstoday.in/cover-story/indias-best-ceos-2015-rajeev-jain-bajaj-finance-into-fastest-growing-nbfcs/story/227080.html
DISCLAIMER
32
This presentation has been prepared by and is the sole responsibility of Bajaj Finance Limited (together with its subsidiaries, referred to as the Company or
. By accessing this presentation, you are agreeing to be bound by the trailing restrictions.
This presentation does not constitute or does not intend to constitute or form part of any offer or invitation or inducement to sell, or any solicitation of any
offer or recommendation to purchase, any securities of the Company, nor shall it or any part of it or the fact of its distribution form the basis of, or be relied
on in connection with, any contract or commitment therefor. In particular, this presentation is not intended to be a prospectus or offer document under the
applicable laws of any jurisdiction, including India. No representation or warranty, express or implied, is made as to, and no reliance should be placed on, the
fairness, accuracy, completeness or correctness of the information or opinions contained in this presentation. Such information and opinions are in all events
not current after the date of this presentation. There is no obligation to update, modify or amend this communication or to otherwise notify the recipient if
information, opinion, projection, forecast or estimate set forth herein, changes or subsequently becomes inaccurate. However, the Company may alter,
modify or otherwise change in any manner the content of this presentation, without obligation to notify any person of such change or changes.
These materials are being given solely for your information and may not be copied, reproduced or redistributed to any other person in any manner. The
distribution of these materials in certain jurisdictions may be restricted by law and persons into whose possession these materials comes should inform
themselves about and observe any such restrictions. Certain statements contained in this presentation that are not statements of historical fact constitute
-looking statements. You can generally identify forward-looking statements by terminology such as
or other
words or phrases of similar import. These forward-looking statements involve known and unknown risks, uncertainties, assumptions and other factors that
may cause the actual results, performance or achievements to be materially different from any future results, performance or achievements
expressed or implied by such forward-looking statements or other projections. Important factors that could cause actual results, performance or
achievements to differ materially include, among others: (a) material changes in the regulations governing the businesses; (b) the Company's
ability to comply with the capital adequacy norms prescribed by the RBI; (c) decreases in the value of the Company's collateral or delays in enforcing the
Company's collateral upon default by borrowers on their obligations to the Company; (d) the Company's ability to control the level of NPAs in the Company's
portfolio effectively; (e) internal or external fraud, operational errors, systems malfunctions, or cyber security incidents; (f) volatility in interest rates and
other market conditions; and (g) any adverse changes to the Indian economy.
This presentation is for general information purposes only, without regard to any specific objectives, financial situations or informational needs of any
particular person. The information contained in this presentation is only current as of its date and the Company does not undertake any obligation to update
the information as a result of new information, future events or otherwise.
BAJAJ FINANCE LIMITED Q3 FY16 Presentation
THANK YOU

ANNEXURE
34
35
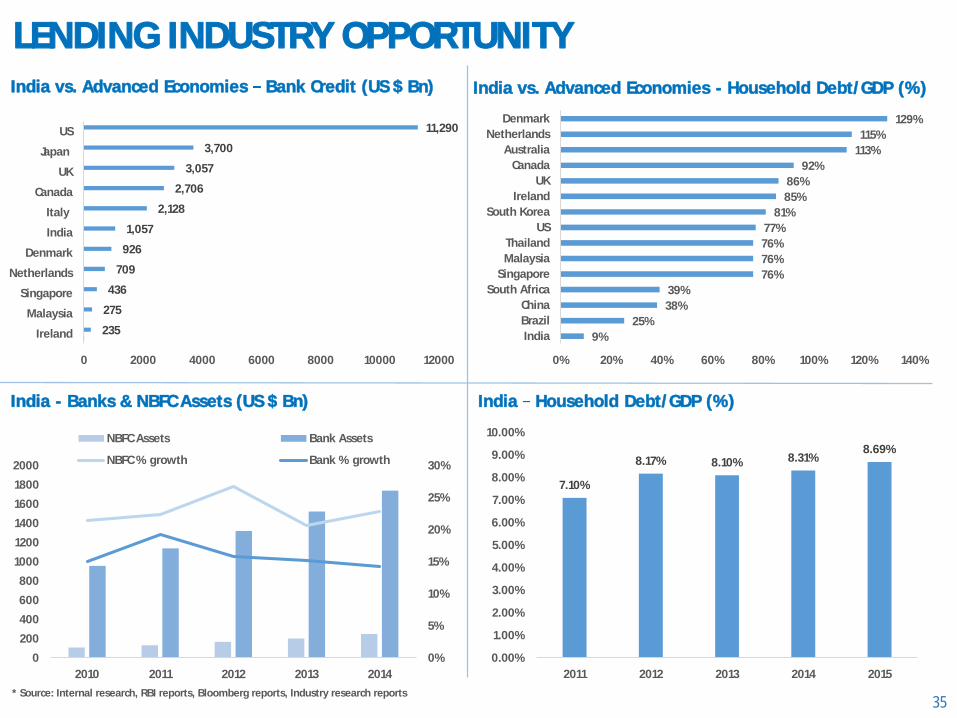
India vs. Advanced Economies Bank Credit (US $ Bn)
India - Banks & NBFC Assets (US $ Bn)
India vs. Advanced Economies - Household Debt/GDP (%)
India Household Debt/GDP (%)
* Source: Internal research, RBI reports, Bloomberg reports, Industry research reports
LENDING INDUSTRY OPPORTUNITY
9%
25%
38%
39%
76%
76%
76%
77%
81%
85%
86%
92%
113%
115%
129%
0% 20% 40% 60% 80% 100% 120% 140%
India
Brazil
China
South Africa
Singapore
Malaysia
Thailand
US
South Korea
Ireland
UK
Canada
Australia
Netherlands
Denmark
235
275
436
709
926
1,057
2,128
2,706
3,057
3,700
11,290
0 2000 4000 6000 8000 10000 12000
Ireland
Malaysia
Singapore
Netherlands
Denmark
India
Italy
Canada
UK
Japan
US
7.10%
8.17% 8.10% 8.31%8.69%
0.00%
1.00%
2.00%
3.00%
4.00%
5.00%
6.00%
7.00%
8.00%
9.00%
10.00%
2011 2012 2013 2014 2015
0%
5%
10%
15%
20%
25%
30%
0
200
400
600
800
1000
1200
1400
1600
1800
2000
2010 2011 2012 2013 2014
NBFC Assets Bank Assets
NBFC % growth Bank % growth
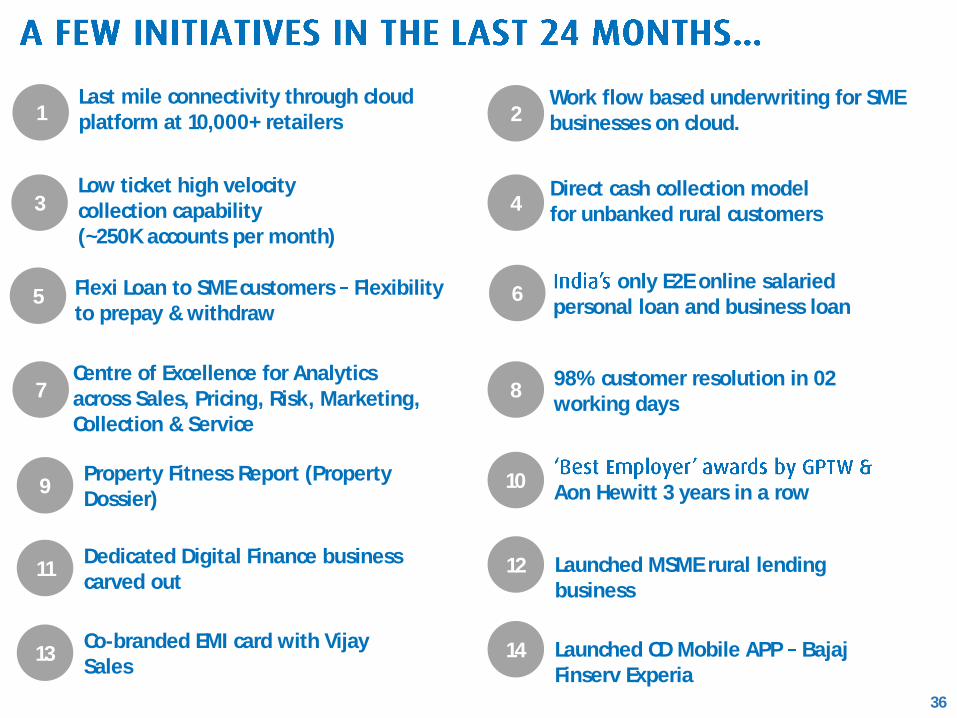
36
Last mile connectivity through cloud platform at 10,000+ retailers1
Direct cash collection model for unbanked rural customers4
Low ticket high velocity collection capability (~250K accounts per month)
3
Work flow based underwriting for SME businesses on cloud. 2
Flexi Loan to SME customers Flexibility to prepay & withdraw
5only E2E online salaried
personal loan and business loan6
98% customer resolution in 02 working days
8Centre of Excellence for Analytics across Sales, Pricing, Risk, Marketing, Collection & Service
7
Property Fitness Report (Property Dossier)
9 10Aon Hewitt 3 years in a row
Dedicated Digital Finance business carved out
11 Launched MSME rural lending business
12
Co-branded EMI card with Vijay Sales
13 Launched CD Mobile APP Bajaj Finserv Experia
14
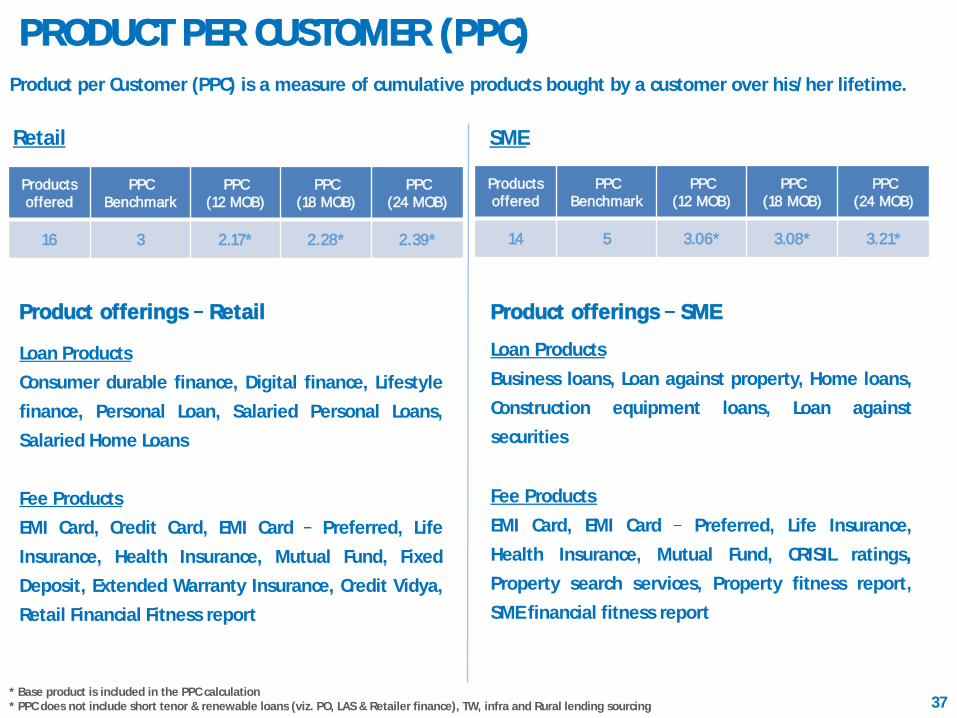
PRODUCT PER CUSTOMER (PPC)
37
Product per Customer (PPC) is a measure of cumulative products bought by a customer over his/her lifetime.
* Base product is included in the PPC calculation* PPC does not include short tenor & renewable loans (viz. PO, LAS & Retailer finance), TW, infra and Rural lending sourcing
Products offered
PPCBenchmark
PPC(12 MOB)
PPC(18 MOB)
PPC(24 MOB)
16 3 2.17* 2.28* 2.39*
Products offered
PPCBenchmark
PPC(12 MOB)
PPC(18 MOB)
PPC(24 MOB)
14 5 3.06* 3.08* 3.21*
Retail
Product offerings Retail
Loan Products
Consumer durable finance, Digital finance, Lifestyle
finance, Personal Loan, Salaried Personal Loans,
Salaried Home Loans
Fee Products
EMI Card, Credit Card, EMI Card Preferred, Life
Insurance, Health Insurance, Mutual Fund, Fixed
Deposit, Extended Warranty Insurance, Credit Vidya,
Retail Financial Fitness report
Product offerings SME
Loan Products
Business loans, Loan against property, Home loans,
Construction equipment loans, Loan against
securities
Fee Products
EMI Card, EMI Card Preferred, Life Insurance,
Health Insurance, Mutual Fund, CRISIL ratings,
Property search services, Property fitness report,
SME financial fitness report
SME

PRODUCT PER CUSTOMER (PPC)
38
Retail
SME
Disbursed Value (` Crore) Fresh v/s Repeat Mix Product Per Customer (PPC)
Disbursed Value (` Crore) Fresh v/s Repeat Mix Product Per Customer (PPC)
* Base product is included in the PPC calculation* PPC does not include short tenor & renewable loans (viz. PO, LAS & Retailer finance), TW, Infra and Rural lending sourcing
41% 42% 39% 41%
59% 58% 61% 59%
Q4'14 Q1'15 Q2'15 Q3'15
Fresh Sourcing Repeat Sourcing
59% 56% 59% 54%
41% 44% 41% 46%
Q4'14 Q1'15 Q2'15 Q3'15
Fresh Sourcing Repeat Sourcing
1.18 1.27 1.37
1.00 1.02 1.02
Upto 12 MOB Upto 18 MOB Upto 24 MOB
Loan Product Fee Product
1.06 1.13 1.24
2.01 1.95 1.97
Upto 12 MOB Upto 18 MOB Upto 24 MOB
Loan Product Fee Product
4,6723,717 5,449 6,711
2,4252,090 2,343 2,6043.213.06 3.08
2.392.17 2.28
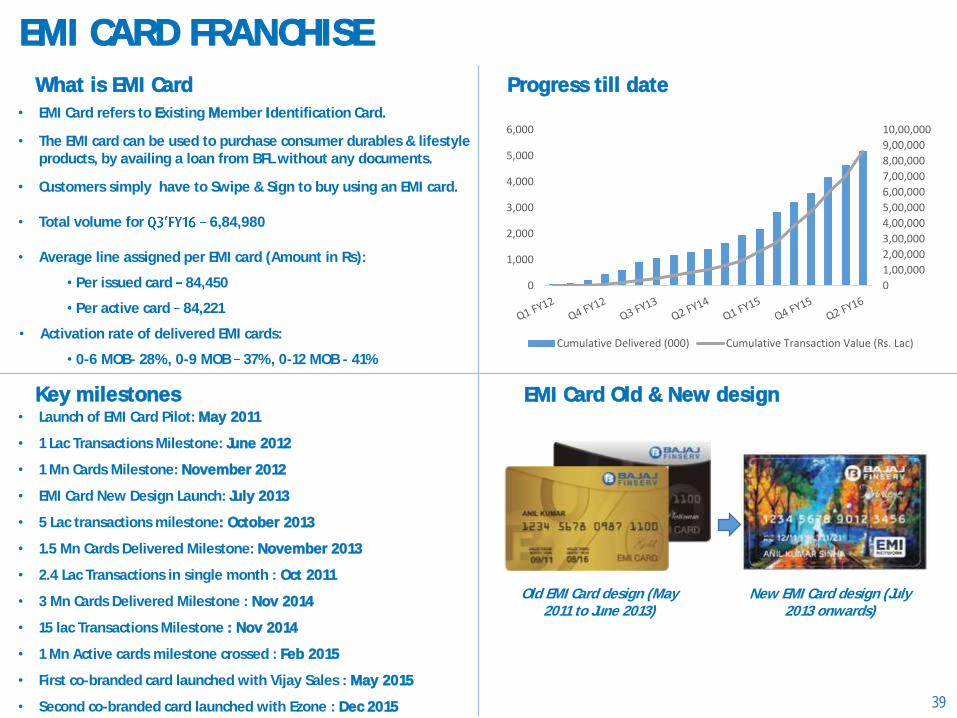
EMI CARD FRANCHISE
39
What is EMI Card Progress till date
EMI Card Old & New design
Old EMI Card design (May 2011 to June 2013)
New EMI Card design (July 2013 onwards)
• Launch of EMI Card Pilot: May 2011
• 1 Lac Transactions Milestone: June 2012
• 1 Mn Cards Milestone: November 2012
• EMI Card New Design Launch: July 2013
• 5 Lac transactions milestone: October 2013
• 1.5 Mn Cards Delivered Milestone: November 2013
• 2.4 Lac Transactions in single month : Oct 2011
• 3 Mn Cards Delivered Milestone : Nov 2014
• 15 lac Transactions Milestone : Nov 2014
• 1 Mn Active cards milestone crossed : Feb 2015
• First co-branded card launched with Vijay Sales : May 2015
• Second co-branded card launched with Ezone : Dec 2015
Key milestones
• EMI Card refers to Existing Member Identification Card.
• The EMI card can be used to purchase consumer durables & lifestyle products, by availing a loan from BFL without any documents.
• Customers simply have to Swipe & Sign to buy using an EMI card.
• Total volume for 6,84,980
• Average line assigned per EMI card (Amount in Rs):
• Per issued card 84,450
• Per active card 84,221
• Activation rate of delivered EMI cards:
• 0-6 MOB- 28%, 0-9 MOB 37%, 0-12 MOB - 41%
0
1,00,000
2,00,000
3,00,000
4,00,000
5,00,000
6,00,000
7,00,000
8,00,000
9,00,000
10,00,000
0
1,000
2,000
3,000
4,000
5,000
6,000
Cumulative Delivered (000) Cumulative Transaction Value (Rs. Lac)

40
ALM STRATEGY
Loan Book (` Crs) Behaviourilised ALM (` Crs)
Borrowings Sept ` 30,071 Crs)Borrowings ` 34,214 Crs)
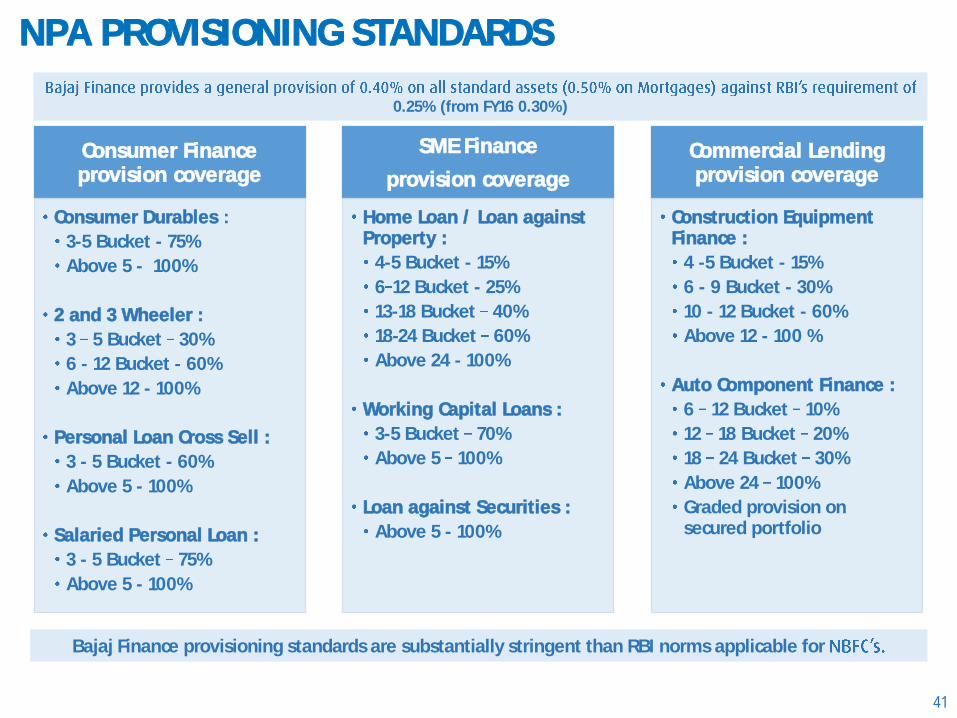
41
Consumer Finance provision coverage
Consumer Durables :
3-5 Bucket - 75%
Above 5 - 100%
2 and 3 Wheeler :
3 5 Bucket 30%
6 - 12 Bucket - 60%
Above 12 - 100%
Personal Loan Cross Sell :
3 - 5 Bucket - 60%
Above 5 - 100%
Salaried Personal Loan :
3 - 5 Bucket 75%
Above 5 - 100%
SME Finance
provision coverage
Home Loan / Loan against Property :
4-5 Bucket - 15%
6 12 Bucket - 25%
13-18 Bucket 40%
18-24 Bucket 60%
Above 24 - 100%
Working Capital Loans :
3-5 Bucket 70%
Above 5 100%
Loan against Securities :
Above 5 - 100%
Commercial Lending provision coverage
Construction Equipment Finance :
4 -5 Bucket - 15%
6 - 9 Bucket - 30%
10 - 12 Bucket - 60%
Above 12 - 100 %
Auto Component Finance :
6 12 Bucket 10%
12 18 Bucket 20%
18 24 Bucket 30%
Above 24 100%
Graded provision on secured portfolio
0.25% (from FY16 0.30%)
Bajaj Finance provisioning standards are substantially stringent than RBI norms applicable for
NPA PROVISIONING STANDARDS
Related Documents