BAJAJ FINANCE LIMITED Q3 FY18 Investor Presentation 1 February 2018

Welcome message from author
This document is posted to help you gain knowledge. Please leave a comment to let me know what you think about it! Share it to your friends and learn new things together.
Transcript

BAJAJ FINANCE LIMITED Q3 FY18 Investor Presentation
1 February 2018

PRESENTATION PATH
• Bajaj group structure 3
• Bajaj Finserv group - Executive summary 4
• What do we stand for 5
• Key strategic differentiators 6
• Bajaj Finance Shareholder profile 7
• Financial snapshot 8
• Bajaj Finance Limited product suite 9
• Executive summary 10
• Key performance highlights for Q3 FY18 12
• Non financial commentary 13
• Business Segment wise AUM 14
• Customer franchise 15
• Strong distribution reach 16
• Financial statement summary 17
• Financial performance trends Q3 FY18 18
• Credit quality Portfolio composition 21
• Credit quality Provisioning coverage 24
• Disclaimer 25
• Annexures 27
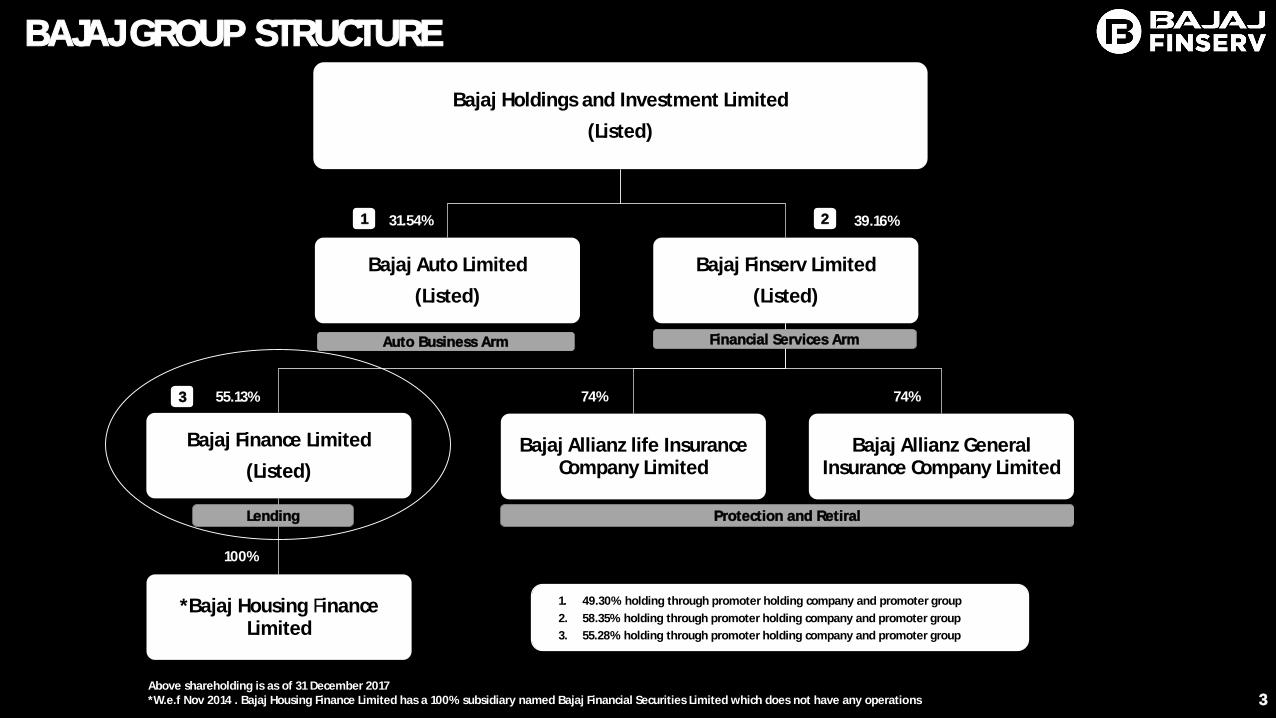
BAJAJ GROUP STRUCTURE
3Above shareholding is as of 31 December 2017*W.e.f Nov 2014 . Bajaj Housing Finance Limited has a 100% subsidiary named Bajaj Financial Securities Limited which does not have any operations
Bajaj Holdings and Investment Limited
(Listed)
Bajaj Auto Limited
(Listed)
Bajaj Finserv Limited
(Listed)
Bajaj Finance Limited
(Listed)
*Bajaj Housing FinanceLimited
Bajaj Allianz life Insurance Company Limited
Bajaj Allianz General Insurance Company Limited
1. 49.30% holding through promoter holding company and promoter group
2. 58.35% holding through promoter holding company and promoter group
3. 55.28% holding through promoter holding company and promoter group
Auto Business Arm Financial Services Arm
31.54% 39.16%
55.13% 74%
100%
Lending Protection and Retiral
1 2
3 74%

BAJAJ FINSERV GROUP - EXECUTIVE SUMMARY
4
2nd largest private General insurer in India as of FY17
Offers a wide range of General insurance products across retail and corporate segments
Highest profit after tax among private players in FY17. ROE of 23% in FY17
Combined ratio of 96.8% in FY17
Recognized in the market for claims servicing
FY17 PAT of ₹ 728 crores
Amongst top 5 private players as of FY17 on new business
Deep pan India distribution reach
Diversified distribution mix consisting of agency, bank assurance, other partners, direct etc.
AUM of over 49K crores as of FY 17
Net worth of ₹ 8,476 cr as of 31st March 2017
One of the most profitable private life insurers in India.
FY17 PAT of ₹ 836 Crs
A 30 year old non bank finance company
Diversified Consumer, SME, Rural & Commercial lender in India
Credit rating is AAA/Stable by CRISIL, India Ratings, CARE Ratings and ICRA
Credit rating for Short Term Debt Program is A1+ by CRISIL, ICRA & India Ratings
529 urban locations and 588 rural locations with over 53,500+ distribution points
Large customer franchise of 24.81 MM
4.53 MM new loans acquired in Q3 FY18
onssubsidiaries
Bajaj Allianz General Insurance Company
Bajaj Allianz Life Insurance CompanyBajaj Finance Limited
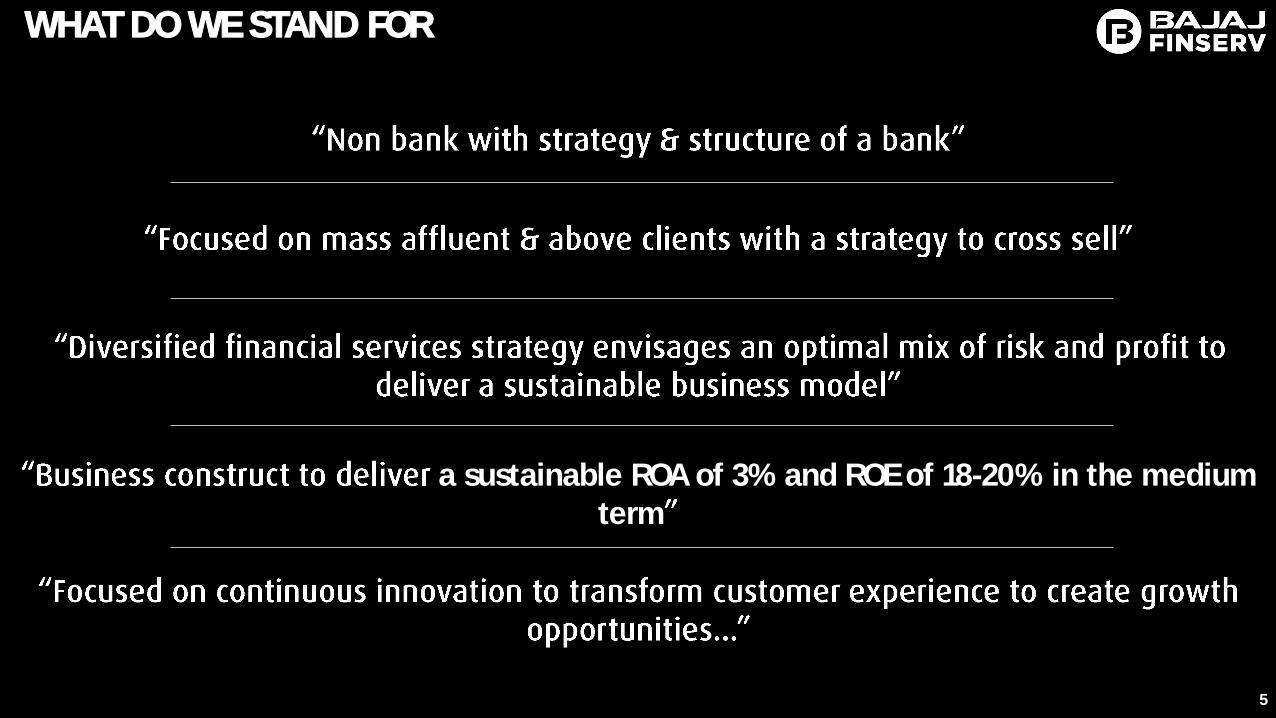
WHAT DO WE STAND FOR
5
a sustainable ROA of 3% and ROE of 18-20% in the medium term

KEY STRATEGIC DIFFERENTIATORS
Part of the Bajaj Group one of the oldest & most respected business houses
A trusted brand with strong brand equity
Focus on mass affluent and above clients Overall franchise of 24.81 MM and Cross sell client base of 14.37 MM
Strong focus on cross selling assets, insurance and wealth products to existing customer
Centre of Excellence for each business vertical to bring efficiencies across businesses and improve cross sell opportunity
Diversified lending strategyConsolidated AUM mix for Consumer : SME : Commercial : Rural stood at 47.9% : 31.5% : 13.5% : 7.1%
Highly agile & highly innovativeContinuous improvements in product features and digital technologies to maintain competitive edge
Deep investment in technology and analyticsHas helped establish a highly metricised company and manage risk & controllership effectively
6

7
BAJAJ FINANCE SHAREHOLDER PROFILE
Top 20 investors & their holdings
S.No Name of ShareholderAs on 31 Mar'17
As on 30 As on 31 Dec'17
1 BAJAJ FINSERV LTD 57.80% 55.13% 55.13%
2 GOVERNMENT OF SINGAPORE 2.56% 3.99% 3.94%
3 MAHARASHTRA SCOOTERS 3.45% 3.29% 3.29%
4 SMALLCAP WORLD FUND, INC 1.11% 1.06% 1.06%
5 NEW HORIZON OPPORTUNITIES MASTER FUND 0.89% 0.84% 0.81%
6 AXIS LONG TERM EQUITY FUND 0.82% 0.69% 0.69%
7 NOMURA INDIA INVESTMENT MOTHER FUND - 0.37% 0.57%
8 NEW WORLD FUND 0.55% 0.61% 0.56%
9 STEADVIEW CAPITAL MAURITIUS LTD. 0.39% 0.44% 0.52%
10VANGUARD EMERGING MARKETS STOCK INDEX FUND
0.49% 0.50% 0.50%
11 MOTILAL OSWAL FOCUSSED MULTICAP 35 FUND 0.43% 0.47% 0.42%
12VANGUARD TOTAL INTERNATIONAL STOCK INDEX FUND
0.36% 0.36% 0.41%
13 ADITYA BIRLA SUNLIFE TRUSTEE PVT. LTD. 0.34% 0.46% 0.39%
14 ISHARES INDIA INDEX MAURITIUS COMPANY 0.36% 0.34% 0.33%
15 GOLDMAN SACHS INDIA LTD. 0.39% 0.32% 0.32%
16 BNY MELLON TRUST AND DEPOSITARY LTD. 0.19% 0.27% 0.31%
17 SBI ETF NIFTY - - 0.29%
18 UTI EQUITY FUND - - 0.29%
19 KOTAK SELECT FOCUS FUND 0.29% 0.28% 0.28%
20 BFL EMPLOYEE WELFARE TRUST 0.56% 0.31% 0.28%
PROMOTERS & PROMOTER GROUP
55.28%
FII & FPI
20.41%
RESIDENT IND.10.05%
MF
7.00%
CORPORATES5.93%
OTHERS1.33%

FINANCIAL SNAPSHOT
8
As per the RBI regulations, NBFCs were required to transition to 5 months overdue by March 2016 and 4 months overdue by March 2017. Hence NPA numbers are not comparable*The net NPA & provisioning coverage numbers for FY16 are at 5 months overdue while the same for previous years are at 6 months overdue**The net NPA & provisioning coverage numbers for FY17 are at 4 months overdue^ EPS numbers adjusted for bonus and split
*^
₹ in Crs
Financials snapshot FY08 FY09 FY10 FY11 FY12 FY13 FY14 FY15 FY16 FY17YoY CAGR
(10 years)FY16 FY17
Assets under management 2,478 2,539 4,032 7,573 13,107 17,517 24,061 32,410 44,229 60,194 36% 43%
Income from operations 503 599 916 1,406 2,172 3,110 4,073 5,418 7,333 9,989 36% 39%
Interest expenses 170 164 201 371 746 1,206 1,573 2,248 2,927 3,803 30% 41%
Net Interest Income (NII) 332 435 715 1,035 1,426 1,904 2,500 3,170 4,406 6,186 40% 38%
Operating Expenses 193 220 320 460 670 850 1,151 1,428 1,898 2,564 35% 33%
Loan Losses & Provision 109 164 261 205 154 182 258 385 543 804 48% 25%
Profit before tax 30 51 134 370 602 872 1,091 1,357 1,965 2,818 43% 66%
Profit after tax 21 34 89 247 406 591 719 898 1,279 1,837 44% 65%
Ratios FY08 FY09 FY10 FY11 FY12 FY13 FY14 FY15 FY16 FY17
Opex to NII 58.1% 50.6% 44.8% 44.4% 47.0% 44.6% 46.0% 45.0% 43.1% 41.4%
Return on assets 0.9% 1.4% 2.8% 4.4% 4.2% 4.1% 3.6% 3.3% 3.5% 3.7%
Return on equity 2.0% 3.2% 8.0% 19.7% 24.0% 21.9% 19.5% 20.4% 20.9% 21.6%
Earning per share (Basic) - ` 0.56 0.93 2.42 6.75 11.08 13.57 14.48 17.99 24.23 34.01
Net NPA 7.05% 5.50% 2.20% 0.80% 0.12% 0.19% 0.28% 0.45% *0.28% **0.44%
NPA provisioning coverage 29% 32% 55% 79% 89% 83% 76% 71% 77% 74%

• Consumer Durable Loans
• Digital Product Loans (1)
• Lifestyle Product Loans
• EMI Cards
• EMI cards - Retail Spend Financing
• 2-Wheeler & 3-Wheeler Loans
• Personal Loan Cross-Sell
• Salaried Personal Loans (1)
• Salaried Home Loans (1) *
• E-Commerce - Consumer Finance
• Retailer Finance
• Loan against property to
Salaried *
• Urban Gold Loans
Consumer
• Unsecured Working Capital Loans (1)
• Loans to Professionals (1)
• Loan Against Property *
• Home Loans to Self
Employed *
• Lease Rental Discounting
• SME Cross-Sell (SE-Magnus)
• Developer Finance *
SME
• Securities Lending
• Large Value Lease Rental Discounting
• Vendor Financing
• Financial Institutions Lending
• Light Engineering Lending
• Corporate Finance Loans
• Warehouse Financing
• Consumer Durable Loans
• Digital Product Loans
• Personal Loans Cross Sell
• Salaried Personal Loans
• Gold Loans
• Unsecured Working Capital Loans
• Loans to Professionals
• Loans Against Property *
• Home Loans *
• Retail Term Deposits
• Corporate Term Deposits
• Life Insurance Distribution
• General Insurance Distribution
• Co-Branded Credit Card
• Co-Branded Wallet
• Financial Fitness Report
(1) Also available through digital channels
9
BAJAJ FINANCE LIMITED PRODUCT SUITE
* Hosted in Bajaj Housing Finance Ltd.
Commercial Rural DepositsPartnerships &
Services

EXECUTIVE SUMMARY
10
Bajaj Finance • 30 year old non bank with a demonstrated track record of profitability
• Focused on Consumer, Rural, SME & Commercial lines of businesses
• Consolidated AUM mix for Consumer : SME : Commercial : Rural stood at 47.9% : 31.5% : 13.5 : 7.1%
• Strategic business unit organization design supported by horizontal common utility functions to drive domain expertise, scalability and operating leverage
• Strategy is to focus on cross sell, customer experience and product & process innovations to create a differentiated & profitable business model
• The company has ₹ 77,970 Crs of consolidated Assets Under Management with net NPA of 0.53% (3 months overdue) and a capital adequacy of 24.84% as of 31 Dec 2017. The company in Q3 FY18 has delivered a post tax profit of ₹ 767 Crs which is a 38% growth at an ROA* of 1.1% and ROE* of 5.0%
Consumerbusiness
•
K accounts
• Present in 529 locations with 46,000+ active distribution point of sale
• Largest consumer electronics, digital products & furniture lender in India
• Amongst the largest personal loan lenders in India
• EMI Card franchise crossed 11.4 MM cards (CIF)
• Bajaj Finance Limited and RBL Bank co-branded credit card CIF stood at 255 K as of 31 Dec 2017
• Bajaj Finserv Mobikwik net active wallet users stood at 0.47 MM as of 31 Dec 2017
• Amongst the largest new loans acquirers in India (4.53 MM in Q3 FY18)
Ruralbusiness
• Highly diversified lender in the rural locations offering 9 loan products in consumer and RSME business categories with a uniquehub and spoke business model
• Geographic presence across 588 towns and villages with retail presence across 7,200+ stores* Not annualised

SME Business • Focused on affluent SMEs with an average annual sales of ₹ 10-12 Crores with established financials & demonstrated borrowing track records
• Offer a range of working capital & growth capital products and mortgage (Loan against property, Lease Rental Discounting & Home Loans) products to SME & self employed professionals
• Offer full range of growth & working capital lending products to professionals (doctors, CAs & engineers)
• Dedicated SME Relationship Management strategy to provide wide range of cross sell products to SME franchise
Commercialbusiness
• Offer wholesale lending products covering short, medium and long term needs of Auto component & Light Engineering companies and Financial institutions in India
• Offer a range of structured products collateralized by marketable securities or mortgage
Treasury • Strategy is to create a balanced mix of wholesale and retail borrowings
• ₹ 57,901 Crs with a mix of 32 : 57 : 11 between banks, money markets and deposits as of 31 Dec 2017
Credit Quality • Gross NPA and Net NPA as of 31 Dec 2017 stood at 1.67% and 0.53% respectively. The comparable Gross & Net NPA on 4 months overdue stood at 1.43% & 0.41% respectively as against 1.47% & 0.39% respectively as of 31 Dec 2016
• Provisioning coverage ratio stood at 68% as of 31 Dec 2017.
Credit Rating Bajaj Finance Limited• Credit rating for Long Term Debt Program is AAA/Stable by CRISIL, ICRA, CARE & India Ratings• Credit rating for Short Term Debt Program is A1+ by CRISIL, ICRA & India Ratings• Credit rating for FD program is FAAA/Stable by CRISIL & MAAA (Stable) by ICRA
Bajaj Housing Finance Limited• Credit rating for Long Term Debt Program is AAA/Stable by CRISIL & India Ratings• Credit rating for Short Term Debt Program is A1+ by CRISIL & India Ratings
11
EXECUTIVE SUMMARY
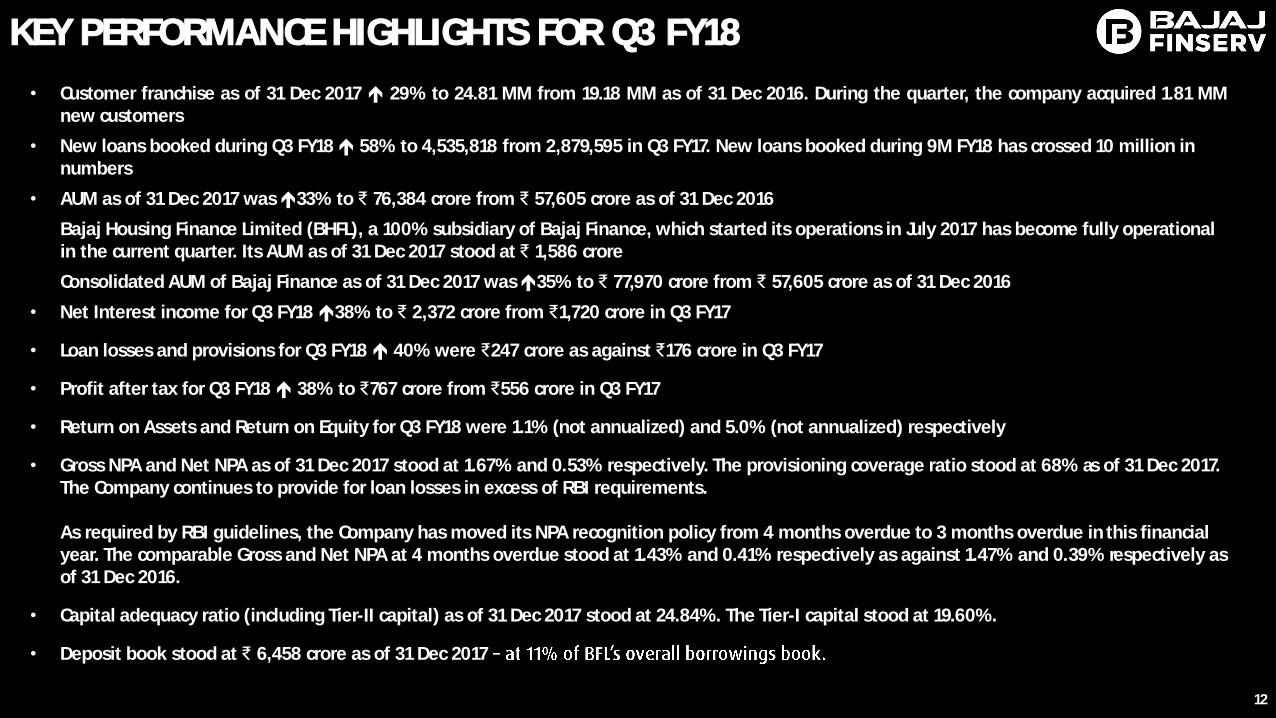
KEY PERFORMANCE HIGHLIGHTS FOR Q3 FY18
• Customer franchise as of 31 Dec 2017 29% to 24.81 MM from 19.18 MM as of 31 Dec 2016. During the quarter, the company acquired 1.81 MMnew customers
• New loans booked during Q3 FY18 58% to 4,535,818 from 2,879,595 in Q3 FY17. New loans booked during 9M FY18 has crossed 10 million in numbers
• AUM as of 31 Dec 2017 was 33% to ₹ 76,384 crore from ₹ 57,605 crore as of 31 Dec 2016
Bajaj Housing Finance Limited (BHFL), a 100% subsidiary of Bajaj Finance, which started its operations in July 2017 has become fully operational in the current quarter. Its AUM as of 31 Dec 2017 stood at ₹ 1,586 crore
Consolidated AUM of Bajaj Finance as of 31 Dec 2017 was 35% to ₹ 77,970 crore from ₹ 57,605 crore as of 31 Dec 2016
• Net Interest income for Q3 FY18 38% to ₹ 2,372 crore from ₹1,720 crore in Q3 FY17
• Loan losses and provisions for Q3 FY18 40% were ₹247 crore as against ₹176 crore in Q3 FY17
• Profit after tax for Q3 FY18 38% to ₹767 crore from ₹556 crore in Q3 FY17
• Return on Assets and Return on Equity for Q3 FY18 were 1.1% (not annualized) and 5.0% (not annualized) respectively
• Gross NPA and Net NPA as of 31 Dec 2017 stood at 1.67% and 0.53% respectively. The provisioning coverage ratio stood at 68% as of 31 Dec 2017. The Company continues to provide for loan losses in excess of RBI requirements.
As required by RBI guidelines, the Company has moved its NPA recognition policy from 4 months overdue to 3 months overdue in this financial year. The comparable Gross and Net NPA at 4 months overdue stood at 1.43% and 0.41% respectively as against 1.47% and 0.39% respectively as of 31 Dec 2016.
• Capital adequacy ratio (including Tier-II capital) as of 31 Dec 2017 stood at 24.84%. The Tier-I capital stood at 19.60%.
• Deposit book stood at ₹ 6,458 crore as of 31 Dec 2017
12

NON FINANCIAL COMMENTARY
• Plan to book all incremental mortgage assets in Bajaj Housing Finance Limited by March 2018
• New leadership team from within Bajaj Finance Limited has been identified for Bajaj Housing Finance Limited
• Mortgage and Payments business to be key drivers of growth in the next few years. Expect these businesses to grow faster than Bajaj FinanceLimited growth rates over the next few years
• New category expansion, geographic expansion and rural business expansion to drive growth in near and medium term for B2B Sales Financingbusinesses
• Geographic expansion to continue at 15-20% annual growth rate
• Management of costs (Opex to NIM) to mitigate margin compression. Company has invested deeply over the last 18 months and is well invested intalent and technology to drive growth and operating leverage in medium term, while delivering better Opex to NIM
• Company has managed its ALM well and in the event of interest rates hardening, company is well placed from a P&L standpoint to manage itsimpact
• Portfolio quality is at its record best in the current fiscal, except some pressures in self employed mortgages (LAP & SEHL)
13

14
Assets Under ManagementAs of 31 Dec 2017
BFL Consolidated as of 31 Dec 2016
Growth BFL Standalone BHFL Standalone BFL Consolidated
Consumer B2B Businesses 17,136 - 17,136 13,714 25%
Consumer B2C Businesses 18,943 1,303 20,246 13,284 52%
SME Businesses 24,259 283 24,542 21,079 16%
Commercial Businesses 10,549 - 10,549 6,954 52%
Rural Business 5,497 - 5,497 2,575 113%
Total 76,384 1,586 77,970 57,605 35%
Mortgages 21,109 1,586 22,695 18,751 21%
BUSINESS SEGMENT WISE AUM
₹ crore

Growing customer cross sell franchise by 25-
Q3 FY17
11,74,444
Q4 FY17
9,56,224
Total Franchise
Credit segment filter
Overall Cross sell franchise
Non delinquent customers
Cross sell franchise
Q1 FY18
15,58,612
Q2 FY18
13,20,627
Q2 FY18
16.97 MM
22.99 MM
16.14 MM
14.71 MM
13.21 MM
Q3 FY18
18,14,427
CUSTOMER FRANCHISE
Q3 FY17
19.18 MM
13.55 MM
12.86 MM
11.91 MM
10.30 MM
Q3 FY18
18.56 MM
24.81 MM
17.69 MM
16.12 MM
14.37 MM
New to Bajaj Finance Customers
15
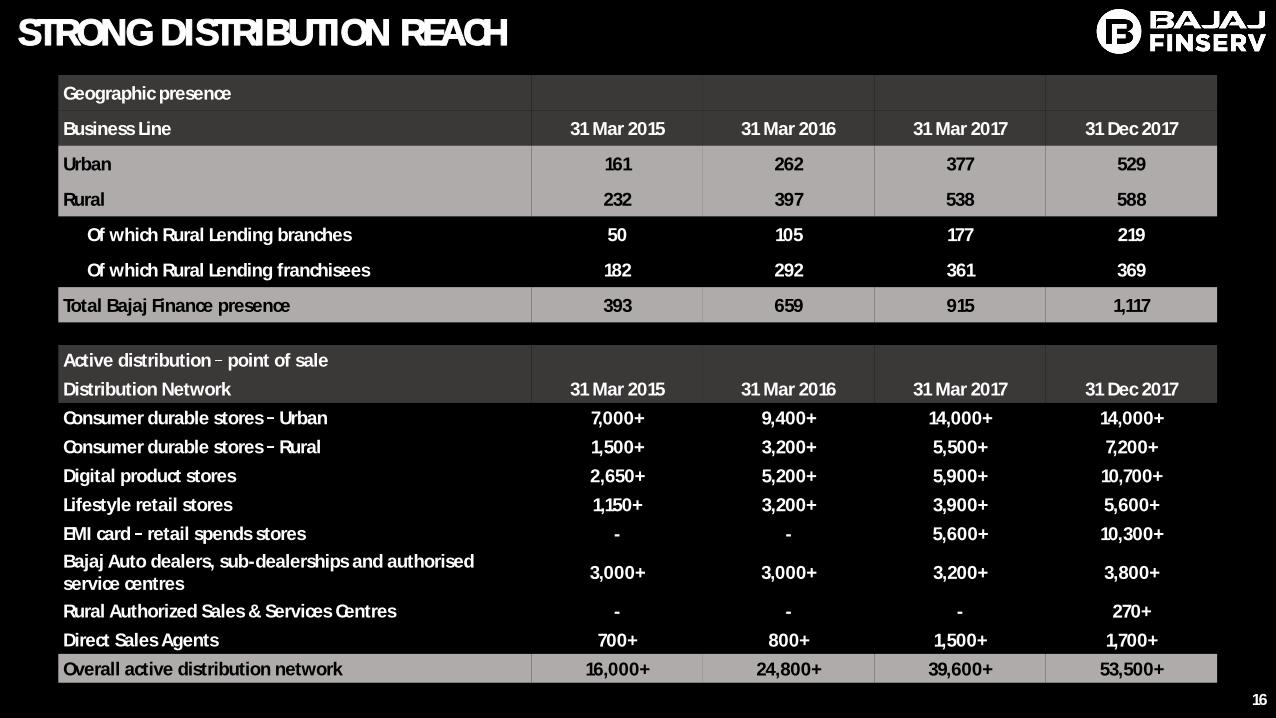
Geographic presence
Business Line 31 Mar 2015 31 Mar 2016 31 Mar 2017 31 Dec 2017
Urban 161 262 377 529
Rural 232 397 538 588
Of which Rural Lending branches 50 105 177 219
Of which Rural Lending franchisees 182 292 361 369
Total Bajaj Finance presence 393 659 915 1,117
16
Active distribution point of sale
Distribution Network 31 Mar 2015 31 Mar 2016 31 Mar 2017 31 Dec 2017
Consumer durable stores Urban 7,000+ 9,400+ 14,000+ 14,000+
Consumer durable stores Rural 1,500+ 3,200+ 5,500+ 7,200+
Digital product stores 2,650+ 5,200+ 5,900+ 10,700+
Lifestyle retail stores 1,150+ 3,200+ 3,900+ 5,600+
EMI card retail spends stores - - 5,600+ 10,300+
Bajaj Auto dealers, sub-dealerships and authorised service centres
3,000+ 3,000+ 3,200+ 3,800+
Rural Authorized Sales & Services Centres - - - 270+
Direct Sales Agents 700+ 800+ 1,500+ 1,700+
Overall active distribution network 16,000+ 24,800+ 39,600+ 53,500+
STRONG DISTRIBUTION REACH

FINANCIAL STATEMENT SUMMARY
17* Not annualized
₹ in crore
Financials snapshot Q3 FY18 Q3 FY17 YoY 9M'18 9M'17 YoY FY17
Assets under management (AUM) 76,384 57,605 33% 76,384 57,605 33% 60,194
Assets under management (Consol.) 77,970 57,605 35% 77,970 57,605 35% 60,194
Total Interest & fee Income 3,543 2,700 31% 9,772 7,319 34% 9,989
Interest expenses 1,171 980 19% 3,393 2,820 20% 3,803
Net Interest Income (NII) 2,372 1,720 38% 6,379 4,499 42% 6,186
Operating Expenses 949 694 37% 2,666 1,854 44% 2,564
Loan Losses & Provision 247 176 40% 756 517 46% 804
Profit before tax 1,176 850 38% 2,957 2,128 39% 2,818
Income tax 409 294 39% 1,031 741 39% 981
Profit after tax 767 556 38% 1,926 1,387 39% 1,837
Ratios Q3 FY18 Q3 FY17 9M'18 9M'17 FY17
Total Opex to NII 40.0% 40.3% 41.8% 41.2% 41.4%
Total Opex to Total Income 26.8% 25.7% 27.3% 25.3% 25.7%
Loan loss to AUF* 0.3% 0.3% 1.0% 0.9% 1.4%
Return on Average AUF* 1.1% 1.1% 3.0% 2.9% 3.7%
Earning per share - Basic (Rs.) * 13.3 10.3 34.5 25.8 34.0
Return on Average Equity * 5.0% 6.4% 15.2% 16.7% 21.6%

31% YoY
FINANCIAL PERFORMANCE TRENDS Q3 FY18
18
Revenue (` crore)
AUM (` crore)
Net Interest Income (NII) (` crore) 38% YoY
58% YoY 35% YoY
2,1772,880
2,496
3,771 3,231
4,536
Q2'17 Q3'17 Q4'17 Q1'18 Q2'18 Q3'18
2,3412,700 2,673
3,126 3,1023,543
Q2'17 Q3'17 Q4'17 Q1'18 Q2'18 Q3'18
1,3851,720 1,689
2,048 1,958
2,372
Q2'17 Q3'17 Q4'17 Q1'18 Q2'18 Q3'18
52,332 57,605 60,19468,883 72,139 76,384
1,586
Q2'17 Q3'17 Q4'17 Q1'18 Q2'18 Q3'18
BFL AUM BHFL AUM
*
* Consolidated for Q3 FY18
77,970

FINANCIAL PERFORMANCE TRENDS Q3 FY18
19
Operating Expenses % of NII
Net NPA & Provisioning Coverage
Loan Loss Provision (` crore)
Profit Before Tax (` crore) 38% YoY
40% YoY
42.9%
41.1%42.0% 42.0%
44.6%
40.0%
Q2'17 Q3'17 Q4'17 Q1'18 Q2'18 Q3'18
165 176
290 282
228 247
Q2'17 Q3'17 Q4'17 Q1'18 Q2'18 Q3'18
0.43% 0.39% 0.44% 0.53% 0.51% 0.53%
73%
74% 74%
69%
70%
68%
Q2'17 Q3'17 Q4'17 Q1'18 Q2'18 Q3'18
Net NPA (%) Coverage (%)
626850
690925 856
1,176
Q2'17 Q3'17 Q4'17 Q1'18 Q2'18 Q3'18

FINANCIAL PERFORMANCE TRENDS Q3 FY18
20
Capital Adequacy Ratio Earnings per share Basic (₹) 30% YoY
7.6
10.38.2
11.0 10.1
13.3
Q2'17 Q3'17 Q4'17 Q1'18 Q2'18 Q3'18
14.97% 15.26% 14.56% 14.20%19.86% 19.60%
6.51% 6.00%5.74% 5.95%
5.56% 5.24%21.48% 21.26% 20.30% 20.15%
25.42% 24.84%
Q2'17 Q3'17 Q4'17 Q1'18 Q2'18 Q3'18
Tier-I Tier-II

CREDIT QUALITY PORTFOLIO COMPOSITION
21
CD loan portfolio Two & Three wheeler loan portfolio
Lifestyle finance loan portfolio Digital product finance loan portfolio
0.00%
1.00%
2.00%
3.00%
Mar'16 Jun'16 Sep'16 Dec'16 Mar'17 Jun'17 Sep'17 Dec'17
1st Bucket 2nd Bucket 3rd Bucket 4th Bucket 5th Bucket
98.06% 98.11% 97.72% 98.07% 97.83% 98.38% 98.58% 98.83%
1.66% 1.11% 1.34% 1.19% 1.35% 0.95% 0.83% 0.69%
Bkt 0
30+
0.0%
4.0%
8.0%
12.0%
16.0%
20.0%
Mar'16 Jun'16 Sep'16 Dec'16 Mar'17 Jun'17 Sep'17 Dec'17
1st Bucket 2nd Bucket 3rd Bucket 4th Bucket 5th Bucket 5+ Bucket
89.92% 89.34% 89.15% 83.93% 85.67% 85.88% 85.82% 87.85%
4.81% 4.84% 4.88% 7.04% 6.84% 6.98% 7.14% 6.21%
Bkt 0
30+
0.00%
1.00%
2.00%
3.00%
Mar'16 Jun'16 Sep'16 Dec'16 Mar'17 Jun'17 Sep'17 Dec'17
1st Bucket 2nd Bucket 3rd Bucket 4th Bucket 5th Bucket
98.29% 97.48% 97.18% 97.41% 97.32% 97.32% 98.35% 98.63%
0.93% 1.35% 1.61% 1.67% 1.70% 1.71% 0.94% 0.75%
Bkt 0
30+
0.00%
1.00%
2.00%
3.00%
4.00%
5.00%
Mar'16 Jun'16 Sep'16 Dec'16 Mar'17 Jun'17 Sep'17 Dec'17
1st Bucket 2nd Bucket 3rd Bucket 4th Bucket 5th Bucket
96.89% 96.52% 96.12% 96.84% 97.27% 97.87% 98.68% 98.86%
2.07% 2.26% 2.38% 2.19% 1.72% 1.30% 0.74% 0.60%
Bkt 0
30+

CREDIT QUALITY PORTFOLIO COMPOSITION
22
Personal Loans Cross Sell portfolio Salaried Personal Loans portfolio
Business Loans portfolio * Loan Against Property portfolio
0.00%
1.00%
2.00%
3.00%
Mar'16 Jun'16 Sep'16 Dec'16 Mar'17 Jun'17 Sep'17 Dec'17
1st Bucket 2nd Bucket 3rd Bucket 4th Bucket 5th Bucket
97.28% 97.21% 97.21% 97.81% 97.29% 97.18% 97.26% 97.46%
1.43% 1.48% 1.47% 1.21% 1.38% 1.50% 1.45% 1.36%
Bkt 0
30+
0.00%
0.20%
0.40%
0.60%
Mar'16 Jun'16 Sep'16 Dec'16 Mar'17 Jun'17 Sep'17 Dec'17
1st Bucket 2nd Bucket 3rd Bucket 4th Bucket 5th Bucket
99.53% 99.50% 99.43% 99.47% 99.52% 99.50% 99.57% 99.63%
0.34% 0.34% 0.38% 0.34% 0.31% 0.37% 0.30% 0.27%
Bkt 0
30+
0.00%
0.50%
1.00%
1.50%
2.00%
Mar'16 Jun'16 Sep'16 Dec'16 Mar'17 Jun'17 Sep'17 Dec'17
1st Bucket 2nd Bucket 3rd Bucket 4th Bucket 5th Bucket
98.93% 98.69% 98.76% 98.86% 98.68% 98.51% 98.60% 98.55%
0.72% 0.81% 0.84% 0.75% 0.92% 1.03% 0.94% 0.98%
Bkt 0
30+
0.00%
0.50%
1.00%
1.50%
2.00%
Mar'16 Jun'16 Sep'16 Dec'16 Mar'17 Jun'17 Sep'17 Dec'17
1st Bucket 2nd Bucket 3rd Bucket 4th Bucket 5th Bucket 5+ Bucket
99.19% 99.21% 99.30% 99.12% 99.24% 99.07% 98.55% 98.27%
0.67% 0.62% 0.49% 0.57% 0.72% 0.88% 1.41% 1.57%
Bkt 0
30+
* Number restated as Business Loans to professionals added

CREDIT QUALITY PORTFOLIO COMPOSITION
23
Home Loans portfolio Rural Lending portfolio
0.00%
0.50%
1.00%
1.50%
Mar'16 Jun'16 Sep'16 Dec'16 Mar'17 Jun'17 Sep'17 Dec'17
1st Bucket 2nd Bucket 3rd Bucket 4th Bucket 5th Bucket 5+ Bucket
98.99% 98.95% 99.03% 99.38% 99.02% 98.91% 98.82% 98.96%
0.73% 0.92% 0.89% 0.50% 0.90% 0.92% 0.93% 0.80%
Bkt 0
30+
0.00%
0.50%
1.00%
1.50%
2.00%
Mar'16 Jun'16 Sep'16 Dec'16 Mar'17 Jun'17 Sep'17 Dec'17
1st Bucket 2nd Bucket 3rd Bucket 4th Bucket 5th Bucket
98.89% 98.43% 98.53% 98.82% 99.15% 99.17% 99.21% 99.17%
0.58% 0.90% 0.96% 0.76% 0.65% 0.57% 0.53% 0.57%
Bkt 0
30+

CREDIT QUALITY PROVISIONING COVERAGE
24
PCR Provisioning Coverage Ratio
Business Segment (Values in ₹ Cr)
Consolidated AUM(Crs.)
GNPA(Crs.)
NNPA PCR (%) GNPA NNPA
Consumer Business 37,382 795 231 71% 2.12% 0.63%
SME Business 24,542 396 138 65% 1.82% 0.64%
Commercial Business 10,549 3 2 29% 0.03% 0.02%
Rural Business 5,497 60 25 58% 1.09% 0.47%
Bajaj Finance 77,970 1,254 397 68% 1.67% 0.53%

DISCLAIMER
25
This presentation has been prepared by and is the sole responsibility of Bajaj Finance Limited (together with its subsidiaries, referred to as the Company or . By
accessing this presentation, you are agreeing to be bound by the trailing restrictions.
This presentation does not constitute or does not intend to constitute or form part of any offer or invitation or inducement to sell, or any solicitation of any offer or
recommendation to purchase, any securities of the Company, nor shall it or any part of it or the fact of its distribution form the basis of, or be relied on in connection with, any
contract or commitment therefor. In particular, this presentation is not intended to be a prospectus or offer document under the applicable laws of any jurisdiction, including
India. No representation or warranty, express or implied, is made as to, and no reliance should be placed on, the fairness, accuracy, completeness or correctness of the
information or opinions contained in this presentation. Such information and opinions are in all events not current after the date of this presentation. There is no obligation to
update, modify or amend this communication or to otherwise notify the recipient if information, opinion, projection, forecast or estimate set forth herein, changes or
subsequently becomes inaccurate. However, the Company may alter, modify or otherwise change in any manner the content of this presentation, without obligation to notify
any person of such change or changes.
These materials are being given solely for your information and may not be copied, reproduced or redistributed to any other person in any manner. The distribution of these
materials in certain jurisdictions may be restricted by law and persons into whose possession these materials comes should inform themselves about and observe any such
restrictions. Certain statements contained in this presentation that are not statements of historical fact constitute -looking statements. You can generally identify
forward-looking statements by terminology such as
or other words or phrases of similar import. These forward-looking statements involve known and unknown risks,
uncertainties, assumptions and other factors that may cause the actual results, performance or achievements to be materially different from any future results,
performance or achievements expressed or implied by such forward-looking statements or other projections. Important factors that could cause actual results, performance or
achievements to differ materially include, among others: (a) material changes in the regulations governing the businesses; (b) the Company's ability to comply with
the capital adequacy norms prescribed by the RBI; (c) decreases in the value of the Company's collateral or delays in enforcing the Company's collateral upon default by
borrowers on their obligations to the Company; (d) the Company's ability to control the level of NPAs in the Company's portfolio effectively; (e) internal or external fraud,
operational errors, systems malfunctions, or cyber security incidents; (f) volatility in interest rates and other market conditions; and (g) any adverse changes to the Indian
economy.
This presentation is for general information purposes only, without regard to any specific objectives, financial situations or informational needs of any particular person. The
information contained in this presentation is only current as of its date and the Company does not undertake any obligation to update the information as a result of new
information, future events or otherwise.

BAJAJ FINANCE LIMITED Q3 FY18 Investor Presentation
Thank You

ANNEXURES
27

GLOSSARY
2W Two Wheeler IRR Internal Rate of Return
3W Three Wheeler LAP Loan Against Property
ACMF Auto Components Manufacturer Financing LAS Loan Against Securities
ALM Asset & Liability Management MF Mutual Fund
AR Assets Receivable MM Million
ARU Activation, Retention & Usage MSME Micro, Small & Medium Enterprise
ASC Authorized Service Centers NII Net Interest Income
AUF Assets Under Finance NNPA Net Non Performing Assets
AUM Assets Under Management NTB New to Bajaj Finance
B2B Business to Business Opex Operating Expenses
B2C Business to Customer PAT Profit After Tax
BL Business Loan PBT Profit Before Tax
CAGR Compounded Annual Growth Rate POS Point of Sale
CIF Cards in Force PPC Products Per Customer
CPI Consumer Price Index RBI Reserve Bank of India
EMI Existing Member Identification ROA Return on Assets
EPS Earnings Per Share ROE Return on Equity
FIG Financial Institutions Group SE Self Employed
FII Foreign Institutional Investor SME Small & Medium Enterprise
FPI Foreign Portfolio Investment TAT Turn Around Time
GNPA Gross Non Performing Assets TTD Through the Door
HL Home Loan WPI Wholesale Price Index
IFA Independent Financial Advisor
28

ALM STRATEGY (Standalone)
Behaviourilised ALM (₹ Crs)
Borrowings ₹ 57,901 Crs) Borrowings ₹ 52,891 Crs)
*Numbers as of 31 Dec 2017
18,73632%
26,49546%
3,9387%
6,45811%
1,5393%
7351% Banks
NCDs
Subordinate Debt
Deposits
CPs
CBLO
15,66030%
24,63647%
3,9387%
5,51710%
2,7055%
4351% Banks
NCDs
Subordinate Debt
Deposits
CPs
CBLO
Behaviourilised ALM (₹ Crs)
24,114
29,221
8,378
23,974
50,309
22,328
5,816 7,233
<= 1 year 1-3 years 3-5 years > 5 years
Liabilities Assets
29
24,176 26,077
10,357
22,184
48,181
21,404
5,5647,647
<= 1 year 1-3 years 3-5 years >5 years
Liabilities Assets

NPA PROVISIONING STANDARDS
30
Consumer Durable Loans, EMI Cards
Retail Spends Financing, and Digital
Product Loans:
• 3 5 MOD 75%
• Above 5 MOD 100%
Lifestyle loans:
• 3 5 MOD 65%
• Above 5 MOD 100%
2 and 3 Wheeler Loans:
• 3 5 MOD - 40%
• 6 12 MOD 60%
• Above 12 MOD 100%
Personal Loan Cross-Sell and Salaried
Personal Loans:
• 3 5 MOD - 75%
• Above 5 MOD 100%
Salaried Home Loans:
• Home
Loans, Loans against Property, Lease
Consumer Lending SME Lending
Home Loans, Loans against Property,
Lease Rental Discounting:
• 3 5 MOD - 15%
• 6 12 MOD 25%
• 13 18 MOD 40%
• 19 24 MOD 60%
• Above 24 MOD 100%
Working Capital Loans/
Loans to Professionals:
• 3 5 MOD 75%
• Above 5 MOD 100%
Commercial Lending
Vendor Financing:
• 3 8 MOD 10%
• 9 14 MOD 20%
• Above 14 MOD - 100%
• Graded provision on secured portfolio
Infrastructure Finance, Securities
Lending, Financial Institution Lending,
Light Engineering Lending and
Corporate Finance Loans:
• As per RBI norms
• Additionally, we assess impairment in
the value of securities & provide for
the uncovered portion, where
considered necessary.
Construction Equipment Finance:
• 3 5 MOD - 15%
• 6 9 MOD - 30%
• 10 12 MOD - 60%
• Above 12 MOD - 100%
Rural Lending
Consumer Durable Loans and Digital
Product Loans:
• 3 5 MOD 75%
• Above 5 MOD 100%
Personal Loan Cross-Sell and Salaried
Personal Loans:
• 3 5 MOD 75%
• Above 5 MOD 100%
Working Capital Loans, and Loans to
Professionals:
• 3 5 MOD 75%
• Above 5 MOD 100%
Loans Against Property and Home Loans:
• Home
Loans/Loans against Property/Lease
We provide a general provision of 0.40% on all standard assets (0.50% on Loan against property, Lease rental discounting and Developer Finance)
MOD - Months overdue
Related Documents