Geo-spatial Data Analysis, Quality Assessment and Visualization Yong Ge Hexiang Bai Sanping Li Institute of Geographic Science & Natural Resources Research, Chinese Academy of Sciences, China [email protected] 6/31/2008

Welcome message from author
This document is posted to help you gain knowledge. Please leave a comment to let me know what you think about it! Share it to your friends and learn new things together.
Transcript

Geo-spatial Data Analysis, Quality Assessment and
Visualization
Yong Ge Hexiang Bai Sanping Li
Institute of Geographic Science &Natural Resources Research, Chinese Academy of Sciences, [email protected] 6/31/2008

What we have faced in geomatics engineering?
in situ sensing
Multi-level Data AcquisitionMulti-platform, multi-sensor, multi-resolution/scales, multi-formats, multi-owners and multi-temporal data
Landuse
DEM
We are drowning in data but starving for knowledge

Geospatial Data
Information
Knowledge
GIS M
odeling
Data --Knowledge

HEC-RAS
Runoff DEM and River River Bank
OpenHydro ArcGIS
Flood Plain Mapping
E
rro
r p
rop
agat
ion
DBMS DBMS DBMS DBMS DBMSData
Prepro
cessing
SDA
Output
Input
Spatial Data Analysis
and
Uncertainty Analysis
Error
Uncertainty
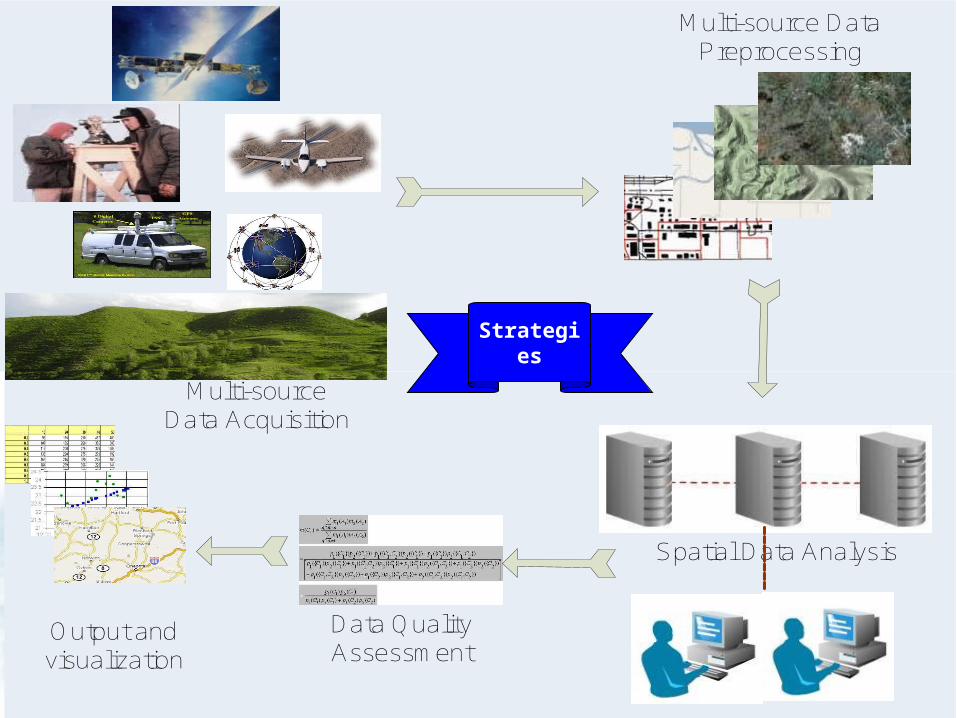
Multi-source Data Acquisition
Spatial Data Analysis
Data Quality Assessment
Output and visualization
Multi-source Data Preprocessing
Strategies

Uncertainty Analysis---Types
Randomness ── Uncertainty of Random phenomenon
Fuzziness ── Uncertainty of Fuzzy concept
Roughness ── Uncertainty of Knowledge in
information system
BG SD SM UA FP

Randomness, Fuzziness and Roughness in SDA
SDA
GIS data sources Evidence maps Modeling
Posterior Prob.
Fuzzy boundary
Random error
Missing data
Randomness
Fuzziness
Roughness

Error factorsLimitations of data acquisition
& processing
Uncertainty Analysis
Input
(Geospatial data)
Output
(Decision +
Uncertainty Analysis)
Population
….
Temperature Data
River Gauge Station
DEM
SDA
Geospatial data
Geospatial data
with error
Environment disturbance
Fuzziness of definition
Knowledge incompleteness

Uncertainty measurement
Accuracy assessment
Error propagation in spatial data
Exploring and weakening uncertaintyError propagation in GIS operation
Error propagation in multi-source data integration
Uncertainty visualization
Integration SDSS with uncertainty
Uncertainty in the integration of GIS and remote sensing
Uncertainty analysis in remote sensing information
Attribute and positional uncertainty analysis
Sensitivity analysis
Uncertainty analysis in spatio-temporal data

Assessment of data quality for original data Accuracy of attribute and position
Raw data
Error propagation models for data preprocessing Assessment of data quality for preprocessed data Accuracy of attribute and position
Preprocessing
Error propagation models for data preprocessing Assessment of data quality for preprocessed data Accuracy of attribute and position
Data analysis
Quality assessment of outcome Accuracy of attribute and position….
Result from spatial data analysis
Multi-level Geo-spatial Data Acquisition
Land surveying: land use and soil type
Land surveying: land use and soil type
Photogrammetry and Remote sensingPhotogrammetry and Remote sensing
Mobile mapping and Mobile surveying
Mobile mapping and Mobile surveying
Measured data: TINs, hydrography, stream stage and precipitation
Measured data: TINs, hydrography, stream stage and precipitation
Geo-spatial Data Preprocessing
Atmospheric Correction, Geometric Correction and Image enhancementAtmospheric Correction, Geometric Correction and Image enhancement
Data format conversion, Projection transformation, Map edit
Data format conversion, Projection transformation, Map edit
Geo-spatial Data Analysis
Classification: Statistics Methods, Neural Methods and Knowledge-
based Methods
Classification: Statistics Methods, Neural Methods and Knowledge-
based Methods
Map operations: AND, OR and MULTIPLEMap operations: AND, OR and MULTIPLE
EDA, Spatial autocorrelation, Fusion, Integration and Information
extraction
EDA, Spatial autocorrelation, Fusion, Integration and Information
extraction
Quality assessment
Geo-spatial data visualization
Geo-spatial data analysis, quality assessment and visualization
Error propagation will
accompany with each
sub-process
Uncertainty analysis and
measurement will accompany
with each sub-process as well

Uncertainty Analysis---Measurement

Existing Methods
There are two fashions to measure attribute
uncertainty of classified remotely sensed imagery:
(1)categorical scale;(2) pixel scale

Three Levels Measurement on Classified Remotely Sensed Imagery
Pixel Class/Object Image
BG SD SM UA FP
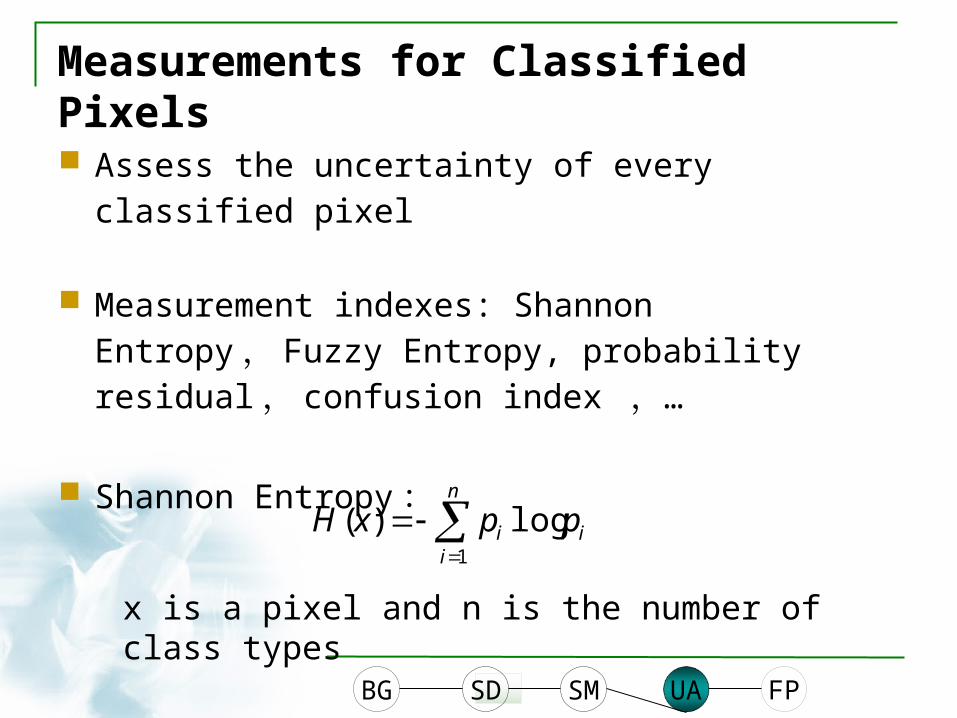
Measurements for Classified Pixels
Assess the uncertainty of every classified pixel
Measurement indexes: Shannon Entropy , Fuzzy Entropy, probability residual , confusion index ,…
Shannon Entropy:
n
iii ppxH
1
log)(
x is a pixel and n is the number of class types
BG SD SM UA FP

Rough degree of rough set X
Rough entropy of rough set X
The more rough degree/entropy is approaching to 0, the smaller the uncertainty of X is.
||||||||
11))((XXPPXXPP
XXAA 11))((00 XXAA
))||||
1log
||||
||||)()((())((
11
mm
ii ii
iiAAAA
RUUR
XXE ||||log))((00 UXEAA
Measurements for Classes or Objects
BG SD SM UA FP

Accuracy of approximation
Quality of
approximation
Measurements for an Image
n
ii
n
ii
P
XP
XP
1
1
||
||)(
||
||)( 1
U
XPn
ii
P
BG SD SM UA FP
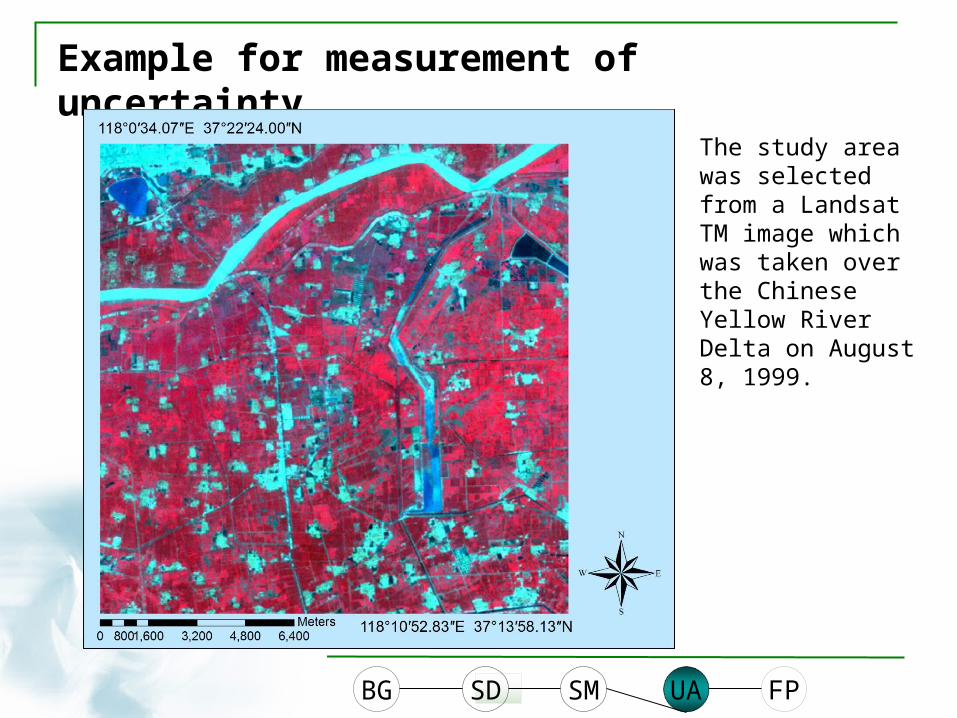
Example for measurement of uncertainty
The study area was selected from a Landsat TM image which was taken over the Chinese Yellow River Delta on August 8, 1999.
BG SD SM UA FP

Classification from MLC
BG SD SM UA FP

1.00
Shannon Entropy
0.00
BG SD SM UA FP
0Degree of Uncertainty
1 (0.00, 0.20]2 (0.20, 0.40]3 (0.40, 0.60]4 (0.60, 0.80]5 (0.80, 1.00]
Uncertainty for Pixels

Rough Degree
0.0000
0.2000
0.4000
0.6000
0.8000
1.0000
1.00 0.95 0.90 0.85 0.80 0.75 0.70 0.65 0.60
Threshold
Water
Agriculture_1
Agriculture_2
Urban
Bottomland
Bareground
Rough Entropy
0.0000
0.2000
0.4000
0.6000
0.8000
1.0000
1.00 0.95 0.90 0.85 0.80 0.75 0.70 0.65 0.60
Threshold
Water
Agriculture_1
Agriculture_2
Urban
Bottomland
Bareground
Uncertainty Measurements for Classes or Objects
BG SD SM UA FP

α=1.0
α=0.8
Rough Degree
α=0.6
BG SD SM UA FP

Rough Entropy
α=1.0
α=0.8
α=0.6
BG SD SM UA FP

0.0000
0.2000
0.4000
0.6000
0.8000
1.0000
1.00 0.95 0.90 0.85 0.80 0.75 0.70 0.65 0.60
Threshold
Quality of Approximation Accuracy of Approximation
BG SD SM UA FP
Uncertainty Measurements for Image
Uncertainty Analysis---Visualization
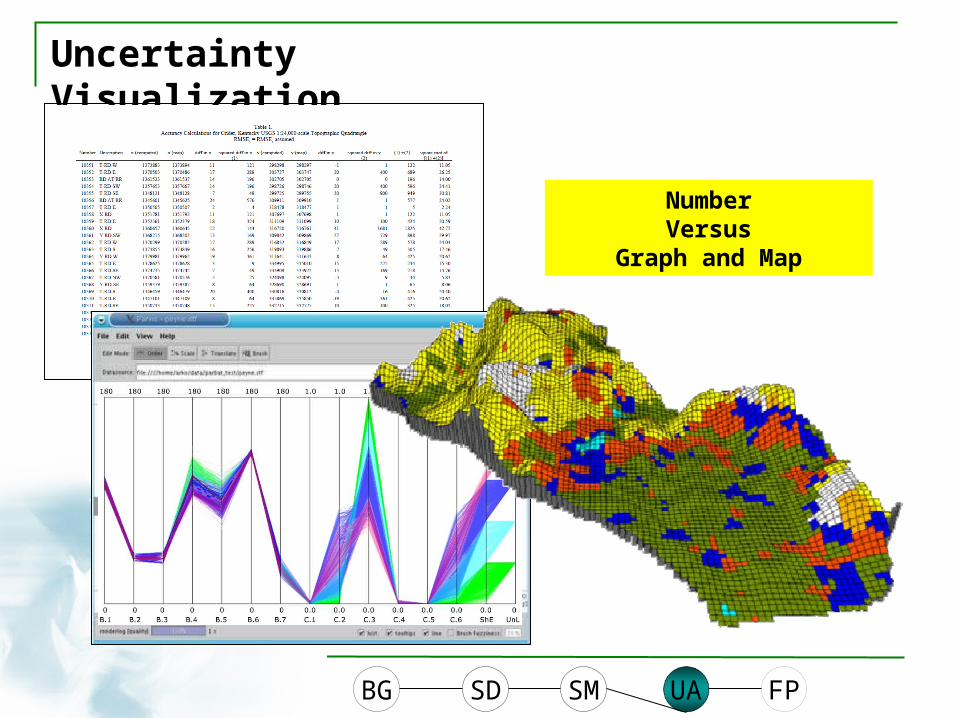
Uncertainty Visualization
BG SD SM UA FP
NumberVersus
Graph and Map

Visualization--- Static Visualization
3D visualization of uncertainty in water class
BG SD SM UA FP

Visualization--- Dynamic Visualization
BG SD SM UA FP
Class of water: pixels with low uncertainty degree in PCP
Class of water: pixels with high uncertainty degree in PCP

Visualization--- Feature Visualization Sample data clustering in 3D
space
Bottomland
Water
Urban
Agriculture_1
Agriculture_2
Bareground
BG SD SM UA FP
Probability DistributionProbability Distribution

Software development--RASRS – a reliability assessment system for remote sensing information

Thanks!

Explanation of Threshold
NEGATIVENEGATIVE
BoundaryBoundary
Lower
Approximation
Lower
Approximation
Class(x)=i
P(Class(x)=i) > Threshold => Lower
P(Class(x)=i) > 1-Threshold => Upper
P(Class(x)=i) < 1-Threshold => Upper
0<=Threshold<=0.5
Class(x)=i
P(Class(x)=i) > Threshold => Lower
P(Class(x)=i) > 1-Threshold => Upper
P(Class(x)=i) < 1-Threshold => Upper
0<=Threshold<=0.5
Related Documents


![[123doc.vn] Bai Tap Trac Nghiem Tieng Anh 12 Tu Bai de Bai 7 0476](https://static.cupdf.com/doc/110x72/55cf8f51550346703b9b23a1/123docvn-bai-tap-trac-nghiem-tieng-anh-12-tu-bai-de-bai-7-0476.jpg)


