Welcome message from author
This document is posted to help you gain knowledge. Please leave a comment to let me know what you think about it! Share it to your friends and learn new things together.
Transcript

Family Advancement for Life and Health
(FALAH)
Bahawalpur Baseline Household Survey
May 2010
Muhammad Jamil Arshad Irfan Masood
ii
The Population Council, an international, non‐profit, non‐governmental organization established in 1952, seeks to improve the well‐being and reproductive health of current and future generations around the world and to help achieve a humane, equitable, and sustainable balance between people and resources.
The Council analyzes population issues and trends; conducts research in the reproductive sciences; develops new contraceptives; works with public and private agencies to improve the quality and outreach of family planning and reproductive health services; helps governments design and implement effective population policies; communicates the results of research in the population field to diverse audiences; and helps strengthen professional resources in developing countries through collaborative research and programs, technical exchange, awards, and fellowships.
The Population Council reserves all rights of ownership of this document. No part of this publication may be reproduced, stored or transmitted in any form by any means‐electronic, photocopying, recording or otherwise‐without the permission of the Population Council.
For inquiries, please contact:
Population Council
# 7, Street 62, F‐6/3, Islamabad, Pakistan
Tel: 92 51 8445566
Fax: 92 51 2821401
Email: [email protected]
Web: http://www.popcouncil.org
http://www.falah.org.pk
Layout and Design: Ali Ammad
Published: May, 2010
Disclaimer
“This study/report is made possible by the generous support of the American people through the United States
Agency for International Development (USAID). The contents are the responsibility of the Population Council,
Islamabad and do not necessarily reflect the views of USAID or the United States Government.”
iii
Table of Contents
Acknowledgements ....................................................................................................................... xiii
Glossary of Terms ........................................................................................................................... xv
Executive Summary ...................................................................................................................... xvii
Chapter 1 .......................................................................................................................................... 1
Introduction ...................................................................................................................................... 1
Background .................................................................................................................................. 1 The FALAH Project ................................................................................................................... 1 Bahawalpur District ................................................................................................................. 2
The Bahawalpur Baseline Household Survey .......................................................................... 3 Objectives ................................................................................................................................ 3 Methodology ........................................................................................................................... 3
Chapter 2 .......................................................................................................................................... 7
Household Characteristics ................................................................................................................ 7
Geographic Distribution .............................................................................................................. 7 Age‐Sex Distribution .................................................................................................................... 8 Marital Status .............................................................................................................................. 9 Household Characteristics and Wealth Indicators .................................................................... 10
Physical Characteristics of Households ................................................................................. 11 Ownership of Household Assets ........................................................................................... 13 Standard of Living Index ........................................................................................................ 15
Chapter 3 ........................................................................................................................................ 17
Respondent Characteristics ............................................................................................................ 17
Age ............................................................................................................................................. 17 Education and Literacy .............................................................................................................. 18 Occupation and Work Status ..................................................................................................... 19 Female Mobility ......................................................................................................................... 21 Mass Media Access and Exposure to Family Planning Messages ............................................. 21
Chapter 4 ........................................................................................................................................ 23
Fertility ........................................................................................................................................ 23
Cumulative Fertility ................................................................................................................... 23
iv
Children Ever Born and Living ............................................................................................... 23 Differentials in Children Ever Born and Surviving ................................................................. 25
Current Fertility ......................................................................................................................... 27 Crude Birth Rate .................................................................................................................... 27 Age‐specific Fertility Rates and Total Fertility Rate .............................................................. 28
Mothers with Children Under Five Years .................................................................................. 28 Preceding Birth Interval ......................................................................................................... 29
Chapter 5 ........................................................................................................................................ 33
Maternal and Neonatal Care .......................................................................................................... 33
Antenatal Care ........................................................................................................................... 33 Tetanus Immunization ............................................................................................................... 37 Location and Attendance at Delivery ........................................................................................ 38 Postpartum Care ........................................................................................................................ 41 Breastfeeding ............................................................................................................................ 41
Chapter 6 ........................................................................................................................................ 43
Preference for Children .................................................................................................................. 43
Ideal Number of Children .......................................................................................................... 43 Desire for More Children ........................................................................................................... 44
Levels of Desire for More Children ........................................................................................ 44 Socioeconomic Correlates of Desire for Children ................................................................. 46
Son Preference .......................................................................................................................... 47 Strength of Preference .............................................................................................................. 47 Attitude towards Last Pregnancy .............................................................................................. 49 Women’s Perception of Husband’s Fertility Preferences ......................................................... 49
Chapter 7 ........................................................................................................................................ 51
Contraceptive Knowledge and Use ................................................................................................ 51
Knowledge ................................................................................................................................. 51 Use of Contraceptive Methods ................................................................................................. 52
Levels of Ever Use and Current Use ...................................................................................... 52 Current Use and Desire for Children ..................................................................................... 54 Correlates of Contraceptive Use ........................................................................................... 55
Source of Method ...................................................................................................................... 58 Chapter 8 ........................................................................................................................................ 59
Experience with Contraceptive Methods ....................................................................................... 59
v
Reasons for Method Choice ...................................................................................................... 59 Cost, Distance and Time to Reach a Facility .............................................................................. 61 Treatment by Provider .............................................................................................................. 64 Information Provided ................................................................................................................ 64 Treatment at Facility ................................................................................................................. 65 Side Effects ................................................................................................................................ 65
Chapter 9 ........................................................................................................................................ 67
Reasons for Non‐use ...................................................................................................................... 67
Hindrances to Use ..................................................................................................................... 67 Past Users .............................................................................................................................. 68 Reasons for Discontinuing Contraceptive Use ...................................................................... 68 Reasons for Current Non‐use ................................................................................................ 69
Never Users ............................................................................................................................... 70 Reasons for Non‐use ................................................................................................................. 70
Attitude towards Birth Spacing and Limiting ........................................................................ 71 Knowledge of Contraceptive Users, Methods and Facilities ................................................. 72 Intent to Use .......................................................................................................................... 74 Inter‐spousal Communication ............................................................................................... 75
Chapter 10 ...................................................................................................................................... 77
Unmet Need ................................................................................................................................... 77
Levels and Correlates ................................................................................................................ 77 Total Demand ............................................................................................................................ 79 Strength of Preference .............................................................................................................. 79 Reasons for Non‐use ................................................................................................................. 80 Unmet Need for Spacing: Profile ............................................................................................. 82 Unmet Need for Limiting: Profile ........................................................................................... 84 Chapter 11 ................................................................................................................................ 85
Reproductive Preferences and Behavior of Men ........................................................................... 85
Background Characteristics ....................................................................................................... 86 Contraceptive Knowledge and Use ........................................................................................... 87 Source of Contraceptive Methods............................................................................................. 90 Approval of Family Planning ...................................................................................................... 90 Satisfaction Level of Current Users ........................................................................................... 91 Inter‐spousal Communication ................................................................................................... 92 Potential Users .......................................................................................................................... 93

vi
Fertility Desire ........................................................................................................................... 95 Mass Media Access and Exposure to FP Messages ................................................................... 96
References ...................................................................................................................................... 99
vii
List of Tables
Table 1.1: Results of households and eligible women(MWRA) interviews ...................................... 5
Table 2.1: Distribution of population in sample households by residence and tehsil ..................... 7
Table 2.2: Distribution of sample household population by age and sex ........................................ 9
Table 2.3: Distribution of household population by marital status, sex and age .......................... 10
Table 2.4: Distribution of households with selected physical characteristics by residence .......... 12
Table 2.5: Percentage of sample households owning selected items according by residence ..... 14
Table 2.6: Distribution of sample households by residence and standard of living index ............. 15
Table 3.1: Age distribution of female respondents by residence .................................................. 17
Table 3.2: Distribution of MWRA and husbands by educational achievement, literacy status, age and residence .......................................................................................................... 18
Table 3.3: Distribution of occupational categories of respondents' husbands by residence ........ 20
Table 3.4: Women’s reports regarding mobility outside the home by degree of permission and destination .............................................................................................................. 21
Table 4.1: Distribution of MWRA by age of mother and number of children ever born (CEB)...... 24
Table 4.2: Distribution of MWRA by age of mother and number of living children (LC) ............... 24
Table 4.3: Mean number of children ever born and children surviving by sex of child and age of mother ....................................................................................................................... 25
Table 4.4: Mean number of children ever born, living and dead by background characteristics .. 26
Table 4.5: Mean number of children ever born and living by age and literacy of mother ............ 27
Table 4.6: Number of women in sample households and number of births during the last three years before the survey, by age of women, and ASFRs, TFR and CBR ................. 28
Table 4.7: Distribution of mothers by pregnancy status and number of children under 5 years .. 29
Table 4.8: Distribution of women with preceding birth intervals (birth to birth) by background characteristics ............................................................................................ 30
Table 5.1: Distribution of ANC check‐ups during last pregnancy by residence.............................. 34
Table5.2: Facilities/service providers mentioned for one or more antenatal visits by residence ........................................................................................................................ 36
Table 5.3: Tetanus immunization at last delivery .......................................................................... 37
Table5.4: Distribution of mothers by place of last delivery and residence .................................... 39
Table 5.5: Distribution of mothers by attendant at last delivery and residence ........................... 40
Table 5.6: Distribution of mothers by status of postnatal check‐up and place of delivery ........... 41
Table 6.1: Distribution of MWRA with ideal number of children for their family by residence .... 44
viii
Table 6.2: Distribution of MWRA by desire for next child and current number of living children .......................................................................................................................... 45
Table 6.3: Distribution of MWRA by reported desire for more children and background characteristics ................................................................................................................ 46
Table 6.4: Son and daughter preferences by the respondents ...................................................... 47
Table 6.5: Distribution of MWRA who did not want more children soon by reaction if become pregnant in near future ................................................................................................. 48
Table 6.6: Distribution of MWRA who do not want more children soon by problem faced if they became pregnant .................................................................................................. 48
Table 6.7 Distribution of MWRA according to perception of husband’s desire for more children by woman’s ideal family size ............................................................................ 50
Table 7.1: Distribution of MWRA by knowledge (prompted) of contraceptive methods, by method and residence ................................................................................................... 52
Table 7.2: Percentage distribution of MWRA by contraceptive use status and residence ............ 53
Table 7.3: Distribution of women by contraceptive use status and selected characteristics ........ 57
Table 7.4: Distribution of ever users of specific contraceptive method by most recent source of supply ........................................................................................................................ 58
Table 8.1: Distribution of ever users of specific contraceptive method by reason for choosing that method ................................................................................................................... 60
Table 8.2: Distribution of MWRA using traditional methods by reasons for not using modern contraceptive methods ................................................................................................. 60
Table 8.3: Distribution of costs of current specific contraceptive method .................................... 61
Table 8.4: Distribution of current contraceptive users by time to reach specific contraceptive service ............................................................................................................................ 63
Table 8.5: Distribution of ever users of contraceptives by information provided at acceptance for method ..................................................................................................................... 64
Table 8.6: Percent current users responding positively on treatment at last visit, by aspect of treatment ...................................................................................................................... 65
Table 9.1: Distribution of opinions of MWRA regarding hindrances faced by couples wanting to avoid or space a birth, by family planning use status ............................................... 68
Table 9.2: Distribution of past contraceptive users by reason for discontinuing last method ...... 69
Table 9.3: Distribution of past users by reason for current non‐use ............................................. 70
Table 9.4: Distribution of never users by reason for never use ..................................................... 71
Table 9.5: Distribution of never users by attitude towards spacing and limiting birth ................. 71
Table 9.6: Distribution of never users by knowledge of contraceptive methods .......................... 73
Table 9.7: Knowledge of sources of contraception of never users by source of supply ................ 73
ix
Table 9.8: Distribution of never users by intent to use a method in future and number of living children ................................................................................................................ 75
Table 10.1: Distribution of women with unmet need for spacing and limiting by background characteristics ............................................................................................................. 78
Table 10.2: Distribution of non‐pregnant women with unmet need for spacing and limiting, by strength of desire to avoid pregnancy .................................................................... 80
Table 10.3: Women with unmet need for spacing and limiting by stated reasons for non‐use of contraception .......................................................................................................... 81
Table 10.4: Percent distribution of MWRA in unmet need for spacing and limiting by selected characteristics ............................................................................................................. 83
Table 11.1: Background characteristics of male respondents ....................................................... 87
Table 11.2: Distribution of male respondents by contraceptive knowledge, use status ............... 88
Table 11.3: Percentage of male respondents reporting ever use or current use of a contraceptive method, by selected background characteristics ................................ 89
Table 11.4: Distribution of male ever users by the last reported source of contraceptive supply ........................................................................................................................... 90
Table 11.5: Distribution of male respondents’ attitude towards spacing and use of contraceptives for spacing ........................................................................................... 91
Table 11.6: Level of male respondents’ satisfaction with their current method ........................... 91
Table 11.7: Percentage distribution of male past contraceptive users by reason for discontinuing last method and residence ................................................................... 92
Table 11.8: Distribution of male never users by intent to use contraceptive methods in future . 94
Table 11.9: Distribution of male never users according to reasons for not intending to use contraceptive methods in future................................................................................. 94
Table 11.10: Distribution of male never users who intend to use specific contraceptive methods in the future ................................................................................................ 95
Table 11.11: Distribution of male respondents by desired timing for next child and number of living children ............................................................................................................. 96
x
List of Figures
Figure 2.1: Rural‐ urban distribution of population in sample households by residence and tehsil ............................................................................................................................... 8
Figure 2.2: Distribution of water supply for Bahawalpur households ........................................... 13
Figure 2.3: Toilet facilities for Bahawalpur households ................................................................. 13
Figure 3.1: Literacy status of women and their husbands ............................................................. 19
Figure 3.2: Type of work of women working for pay (N=213) ....................................................... 20
Figure 3.3: Distribution of MWRA according to exposure to media and FP messages, by type of media ....................................................................................................................... 22
Figure 5.1: Distribution of MWRA by number of antenatal visits during last pregnancy .............. 34
Figure 5.2: Distribution of MWRA by reason of first antenatal visit during last pregnancy .......... 35
Figure 5.3: Distribution of MWRA by gestational age at first antenatal visit during last pregnancy ..................................................................................................................... 35
Figure 5.4: Locations where respondents made one or more antenatal visits .............................. 36
Figure 5.5: Tetanus immunization at last delivery ......................................................................... 38
Figure 5.6: Distribution of mothers by location of last delivery ..................................................... 39
Figure 5.7: Distribution of mothers by attendant at last delivery .................................................. 40
Figure 5.8: Distribution of mothers by reasons for discontinuing breastfeeding (N=121) ............ 42
Figure 6.1: Distribution of women by desire for more children in the future ............................... 45
Figure 6.2: Distribution of MWRA by attitude towards their last pregnancy ................................ 49
Figure 7.1: Distribution of current users by method mix ............................................................... 54
Figure 7.2: Current use and desire for children ............................................................................. 55
Figure 7.3: Contraceptive prevalence rate by age ......................................................................... 56
Figure7.4: Current contraceptive use by number of living children .............................................. 56
Figure 8.1A: Cost in rupees of contraceptive supply for current method ..................................... 62
Figure 8.1B: Attitude towards service charges for current method other than contraceptive ..... 62
Figure 8.2: Travel time (in minutes) for contraceptive supplies .................................................... 63
Figure 8.3: Percent ever users who experienced side effects by method used ............................. 66
Figure 8.4: Distribution of provider responses upon consultation for side effects among past users (N=37) ................................................................................................................. 66
Figure9.1: Percent of never users who knew some woman who had ever used any FP method .......................................................................................................................... 72
xi
Figure 9.2: Mode of transportation to the nearest facility/provider ............................................. 74
Figure 9.3: Time taken to go to the nearest facility/provider ........................................................ 74
Figure 9.4: Women’s reports regarding ease of approach to husband to discuss family planning ........................................................................................................................ 76
Figure 10.1: Need and demand for family planning ....................................................................... 79
Figure 11.1: Men’s reports of ease of approach by their wives to discuss FP ............................... 93
Figure 11.2: Frequency of discussion on FP with wife in last year ................................................. 93
Figure 11.3: Distribution of male respondents according to exposure to media and FP messages, by type of media ....................................................................................... 97

Acknowledgements
The FALAH project is a five year project funded by USAID to improve the survival and health of women and children in Pakistan and the well‐being of families, communities and the country through increased demand and utilization of births spacing and quality family planning services. Population Council is leading a consortium of national and international NGOs to support family planning activities in both the public and private sector in Pakistan. The consortium members include Greenstar Social Marketing, Health and Nutrition Development Society (HANDS), Jhpiego, Mercy Corps, Rural Support Programmes Network (RSPN) and Save the Children US. The partners bring together a blend of technical expertise combined with a rich experience of working within Pakistan and internationally.
As with any major project, it is important to have a baseline study in order to assess the progress of the project in meeting the set goals and objectives over a 5‐year period. The report is a collaborative effort involving partners, Population Council staff and district officials/workers who joined their hands to make this endeavor possible.
The Population Council was primarily responsible for designing the baseline study and managing the collection of data, its analysis and for producing the reports for the project districts. We are grateful to Chief of Party of the FALAH project who strongly encouraged and facilitated the baseline survey process. Dr. Zeba Sathar, Country Director Population Council Islamabad provided invaluable input and was instrumental in the quality of the report produced.
The baseline surveys were designed and implemented under the guidance and encouragement of Dr. Arshad Mahmood, Director Monitoring and Evaluation. Several staff of the Population Council contributed substantially at various stages of producing this report and we would like to thank them individually. At the level of the training of the field staff and monitoring the quality of the data collected, we would like to particularly acknowledge the efforts of Dr. Munir Afridi, Ms. Nayyer Farooq, Ms. Ashfa Hashmi and Mr. Muhammad Ashraf. Mr. Abdul Kashif dealt with all the financial matters during the survey process and Mr. Rahim Dad Malik was responsible for making the logistical arrangements for the survey. We thank Mr. Nadeem Akhtar and Mr. Imran Rashid who were involved at various stages of the survey.
xiv
We are grateful to Mr. Peter C. Miller and Dr. Arshad Mahmood for developing the main template for the report. Mr. Muhammad Jamil Arshad prepared the first draft of the Bahawalpur report. Dr. Yasir Bin Nisar reviewed the report. Mr. Irfan Masood tabulated the data and figures for the report. Ali Ammad developed the report layout and design. We thank these colleagues for their immense contributions.
Finally, we must acknowledge the women and men of the households in the district Bahawalpur for sharing their lives and their information and giving life to the survey. We hope very much that our effort will be of use to provide the necessary information to improve the quality of peoples’ lives and to provide better reproductive health and family planning services.
xv
Glossary of Terms
ANC Antenatal Care
ASFRs Age-specific Fertility Rates
BHU Basic Health Unit
CBR Crude Birth Rate
CEB Children Ever Born
CPR Contraceptive Prevalence Rate
DHQ District Headquarter
EC Emergency Contraception
ECP Emergency Contraception Pill
EmOC Emergency Obstetric Care
FALAH Family Advancement for Life and Health
FP Family Planning
HANDS Health and Nutrition Development Society
IEC Information Education Communication
IUD Intra Uterine Device
LAM Lactational Amenorrhea Method
LHW Lady Health Worker
MCH Maternal and Child Health
MNH Maternal and Neonatal Health
MoH Ministry of Health
MoPW Ministry of Population Welfare
MSU Mobile Service Unit
MWRA Married Women of Reproductive Age
NGO Non Governmental Organization
NIPS National Institute of Population Studies
PAIMAN Pakistan Initiative for Mothers and Newborns

xvi
PC Population Council
PDHS Pakistan Demographic and Health Survey
PNC Postnatal Care
PSLMS Pakistan Social and Living Standard Measurement Survey
PSU Primary Sampling Unit
Pvt. Private
RH Reproductive Health
RHC Rural Health Center
RHSC(A) Reproductive Health Services Center- A
RSPN Rural Support Programmes Network
SMAM Singulate Mean Age at Marriage
TBA/Dai Traditional Birth Attendant
TFR Total Fertility Rate
THQ Tehsil Headquarter
ToR Terms of Reference
TT Tetanus Toxoid
UC Union Council
UNDP United Nations Development Program
USAID United States Agency for International Development
WHO World Health Organization
Executive Summary
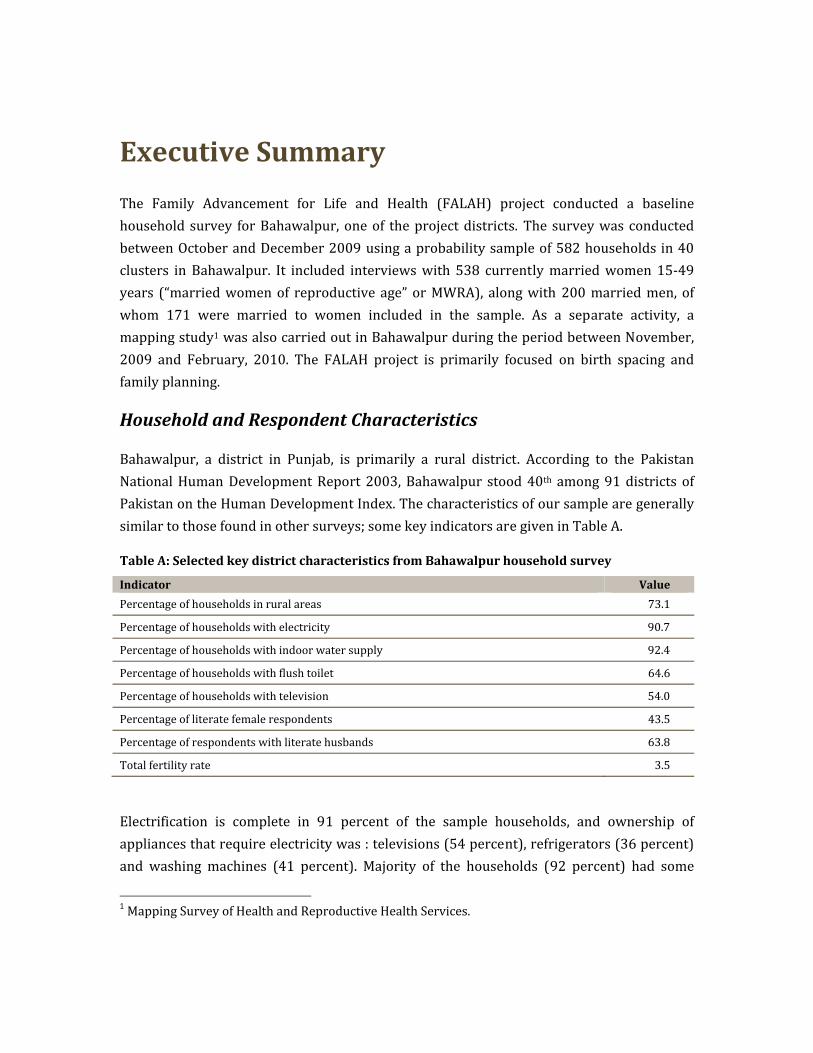
The Family Advancement for Life and Health (FALAH) project conducted a baseline household survey for Bahawalpur, one of the project districts. The survey was conducted between October and December 2009 using a probability sample of 582 households in 40 clusters in Bahawalpur. It included interviews with 538 currently married women 15‐49 years (“married women of reproductive age” or MWRA), along with 200 married men, of whom 171 were married to women included in the sample. As a separate activity, a mapping study1 was also carried out in Bahawalpur during the period between November, 2009 and February, 2010. The FALAH project is primarily focused on birth spacing and family planning.
Household and Respondent Characteristics
Bahawalpur, a district in Punjab, is primarily a rural district. According to the Pakistan National Human Development Report 2003, Bahawalpur stood 40th among 91 districts of Pakistan on the Human Development Index. The characteristics of our sample are generally similar to those found in other surveys; some key indicators are given in Table A.
Table A: Selected key district characteristics from Bahawalpur household survey
Indicator Value
Percentage of households in rural areas 73.1
Percentage of households with electricity 90.7
Percentage of households with indoor water supply 92.4
Percentage of households with flush toilet 64.6
Percentage of households with television 54.0
Percentage of literate female respondents 43.5
Percentage of respondents with literate husbands 63.8
Total fertility rate 3.5
Electrification is complete in 91 percent of the sample households, and ownership of appliances that require electricity was : televisions (54 percent), refrigerators (36 percent) and washing machines (41 percent). Majority of the households (92 percent) had some
1 Mapping Survey of Health and Reproductive Health Services.
xviii
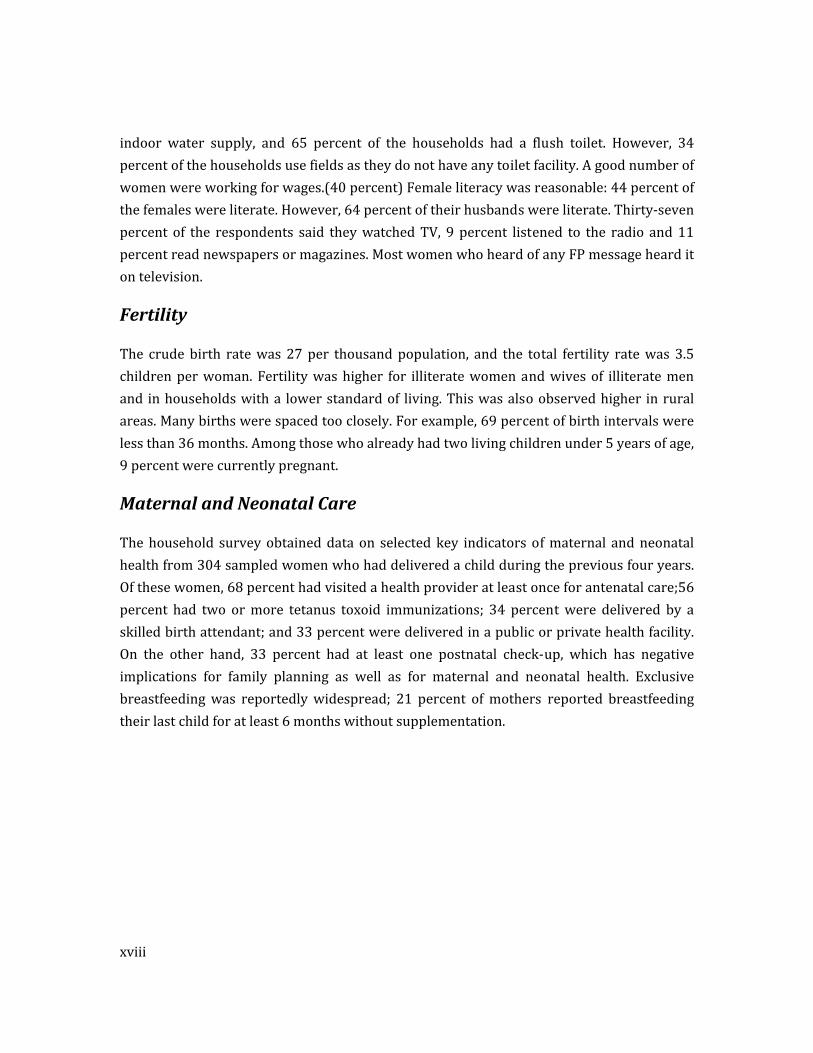
indoor water supply, and 65 percent of the households had a flush toilet. However, 34 percent of the households use fields as they do not have any toilet facility. A good number of women were working for wages.(40 percent) Female literacy was reasonable: 44 percent of the females were literate. However, 64 percent of their husbands were literate. Thirty‐seven percent of the respondents said they watched TV, 9 percent listened to the radio and 11 percent read newspapers or magazines. Most women who heard of any FP message heard it on television.
Fertility
The crude birth rate was 27 per thousand population, and the total fertility rate was 3.5 children per woman. Fertility was higher for illiterate women and wives of illiterate men and in households with a lower standard of living. This was also observed higher in rural areas. Many births were spaced too closely. For example, 69 percent of birth intervals were less than 36 months. Among those who already had two living children under 5 years of age, 9 percent were currently pregnant.
Maternal and Neonatal Care
The household survey obtained data on selected key indicators of maternal and neonatal health from 304 sampled women who had delivered a child during the previous four years. Of these women, 68 percent had visited a health provider at least once for antenatal care;56 percent had two or more tetanus toxoid immunizations; 34 percent were delivered by a skilled birth attendant; and 33 percent were delivered in a public or private health facility. On the other hand, 33 percent had at least one postnatal check‐up, which has negative implications for family planning as well as for maternal and neonatal health. Exclusive breastfeeding was reportedly widespread; 21 percent of mothers reported breastfeeding their last child for at least 6 months without supplementation.
xix
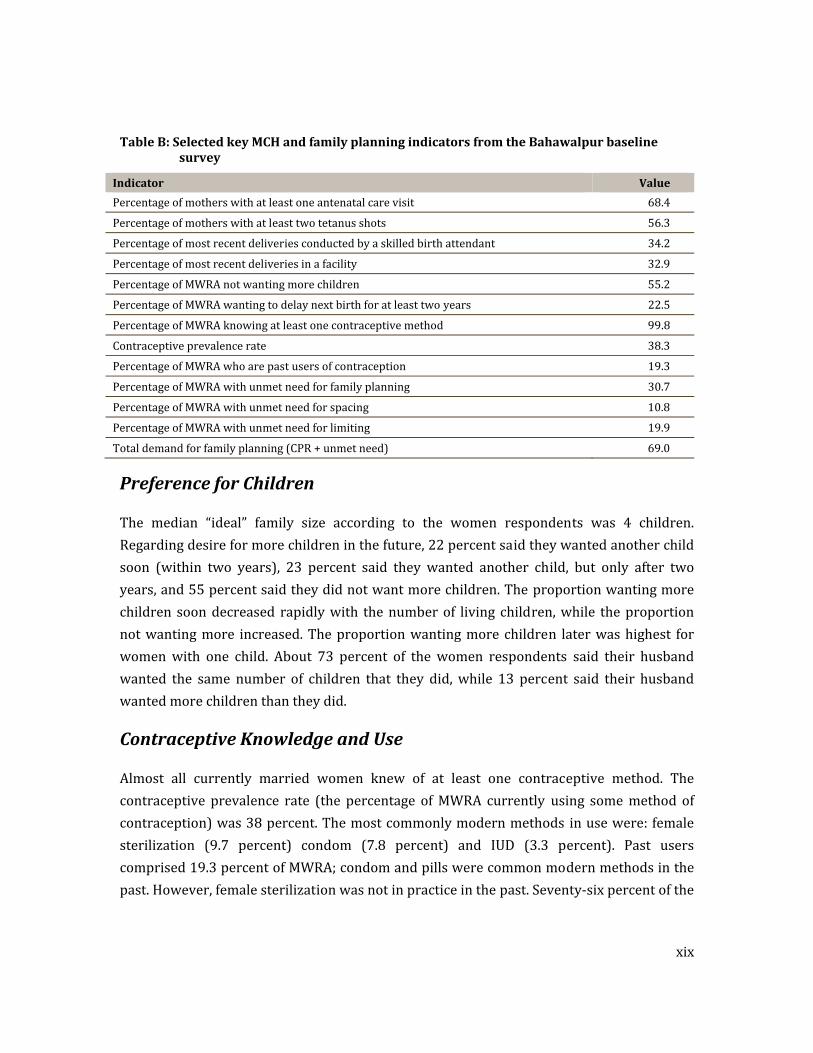
Table B: Selected key MCH and family planning indicators from the Bahawalpur baseline survey
Indicator Value
Percentage of mothers with at least one antenatal care visit 68.4
Percentage of mothers with at least two tetanus shots 56.3
Percentage of most recent deliveries conducted by a skilled birth attendant 34.2
Percentage of most recent deliveries in a facility 32.9
Percentage of MWRA not wanting more children 55.2
Percentage of MWRA wanting to delay next birth for at least two years 22.5
Percentage of MWRA knowing at least one contraceptive method 99.8
Contraceptive prevalence rate 38.3
Percentage of MWRA who are past users of contraception 19.3
Percentage of MWRA with unmet need for family planning 30.7
Percentage of MWRA with unmet need for spacing 10.8
Percentage of MWRA with unmet need for limiting 19.9
Total demand for family planning (CPR + unmet need) 69.0
Preference for Children
The median “ideal” family size according to the women respondents was 4 children. Regarding desire for more children in the future, 22 percent said they wanted another child soon (within two years), 23 percent said they wanted another child, but only after two years, and 55 percent said they did not want more children. The proportion wanting more children soon decreased rapidly with the number of living children, while the proportion not wanting more increased. The proportion wanting more children later was highest for women with one child. About 73 percent of the women respondents said their husband wanted the same number of children that they did, while 13 percent said their husband wanted more children than they did.
Contraceptive Knowledge and Use
Almost all currently married women knew of at least one contraceptive method. The contraceptive prevalence rate (the percentage of MWRA currently using some method of contraception) was 38 percent. The most commonly modern methods in use were: female sterilization (9.7 percent) condom (7.8 percent) and IUD (3.3 percent). Past users comprised 19.3 percent of MWRA; condom and pills were common modern methods in the past. However, female sterilization was not in practice in the past. Seventy‐six percent of the
xx
current users did not want more children, while 24 percent wanted more, but at a later time. Most users reported obtaining their supplies from LHWs or their husbands obtained the supplies.
Experience with Contraceptive Methods
Stated reasons for a respondent’s choice of her current or past method varied by method but commonly cited reasons included convenience of use, suitability for respondent and husband and easy availability. Costs were generally low (only 15 percent paid more than Rs.50 the last time they obtained their method) and did not appear to be a major obstacle to contraceptive use. Similarly, travel time was usually not excessive; 25 percent reported requiring more than 30 minutes to reach their service. As regards provision of information at the time of acceptance of a method, a few were provided information on side effects. Clients generally reported being reasonably treated by providers, but 49 percent respondents viewed that providers were unable to deal with side effects. A variety of side effects was reported by current and past users; 27 percent were treated with medicine.
Reasons for Nonuse About 97 percent of never users mentioned husband’s possible disapproval while a great majority acknowledged fear of side effects, and the problems of managing side effects. Past users were most likely to discontinue use because they wanted more children; experience of side effects was also cited as an important reason; their reasons for current non‐use were most often: infrequent sex/husband away, breastfeeding/lactational amenorrhea, desire of another child , currently pregnant and rest from method. Never users were most likely to say they were not using contraceptives for the desire of more children but women were more likely to cite fear of side effects, breast‐feeding, shy to consult about FP and cost not affordable as significant reasons for not using contraceptives. Knowledge of at least one service provider was 39 percent among never users. A large majority of female current and past users said they could discuss family planning easily with their husbands, but 76 percent of the never users said they could do so. Thirty‐six percent of the never users expressed their intent not to use contraceptives in the future, while 45 percent said they would do so. However,18 percent were unsure who might be future prospectus users.
xxi
Unmet Need for Family Planning
A woman is said to be in “unmet need” for family planning if she says she does not want more children, or wants them later, and is at the risk of conceiving but is not using any method of contraception. By this definition,31 percent of the women in this sample were in unmet need, 19.9 percent for limiting and 10.8 percent for spacing. Unmet need for limiting was higher in rural areas, among illiterate women, and among women with medium low standard of living. However, unmet need for spacing was higher among literate women and those with high standard of living.
Reproductive Preferences and Behavior of Men
The findings reveal that 76 percent of the men knew at least one modern contraceptive method. Least known contraceptive methods among men were norplant (2 percent) and male sterilization (8 percent) . More than 45 percent of the men did not want more children in the future and 17 percent wanted to delay the next pregnancy. Forty‐six percent of the male respondents reported that they or their wives were currently using any family planning method, and 31 percent were using modern contraceptive methods. Among the current users, 90 percent were very satisfied with their current contraceptive method.
Of those who were not using a contraceptive method, it is pertinent to mention that 52 percent reported that they were not intending to use any FP method in the future. The main reason for not intending to use any method was desire of more children (64 percent).Of those who did intend to use contraceptives in the future, pills was the most preferred method. It would be important to include specific interventions aimed at influencing men’s attitude towards their role and responsibility in the overall health of the family and in birth spacing and limiting needs.
Conclusion
In Bahawalpur district knowledge and approval of family planning were high but contraceptive prevalence stands at 38 percent. Unmet need for family planning remains at 31 percent. Therefore, there is much need for improvement. Among the important reasons that should be addressed in an improved program are husbands’ attitude, inter‐spousal communication, fear of side effects, and knowledge of various contraceptive methods and their sources. Also, the concept of birth spacing needs to be stressed to lengthen birth intervals, which are often too short.

Chapter 1
Introduction
Background
The FALAH Project
The Family Advancement for Life and Health (FALAH) project is a 5‐year project funded by the United States Agency for International Development (USAID) to support birth spacing and family planning in Pakistan. The FALAH Project works with the Government of Pakistan (particularly the Ministry of Population Welfare and the Ministry of Health) at federal, provincial, and district levels, as well as the private sector, to improve birth spacing information and services.
The FALAH project will specifically focus on 26 districts. These are:
• Balochistan: Gwadar, Jaffarabad, Khuzdar, Lasbela, Quetta, Kech and Zhob;
• Khyber Pakhtunkhwa: Charsadda, Mansehra, Mardan and Swabi;
• Punjab: Bahawalpur, Dera Ghazi Khan, Jhelum, Khanewal, Multan and Rajanpur;
• Sindh: Dadu, Ghotki, Jacobabad, Karachi (townships of Godap, Liyari, Orangi), Larkana, Sanghar, Shikarpur, Sukkur, and Thatta.
The aims of the FALAH project are:
a) To increase demand for and practice of birth spacing;
b) To increase access to and quality of family planning services in the public sector;
c) To increase the coverage and quality of family planning services in the private sector;
FALAH Baseline Household Survey
2
d) To increase the coverage of social marketing of contraceptives and provide support to the commercial sector for marketing contraceptives to strengthen contraceptive security;
At the district level, FALAH is working to integrate communication and services through a “whole district” approach involving all available resources in the public and private sectors. FALAH is being implemented by a team of seven partner organizations: Population Council (as lead agency), Jhpiego, Greenstar Social Marketing, Save the Children (US), Mercy Corps, Health and Nutrition Development Society (HANDS), and the Rural Support Programmes Network (RSPN). FALAH is also coordinating its activities with the PAIMAN maternal and neonatal health project, especially in the PAIMAN districts, and with other projects as appropriate. In Bahawalpur, district level activities are being coordinated by Save the Children (US) with Greenstar providing information and service through social marketing and other partners supporting specific activities as needed.
Bahawalpur District
The district is bounded on the north by Multan, Lodhran and Vehari districts ,on the east by Bahawalnagar district and India, on the south also by India and on the west by Rahimyar Khan and Muzaffargarh districts.
Migration trends are important in analyzing the economic and social development of communities. According to the 1998 census, the total lifetime in‐migrants in Bahawalpur district were 6.2 percent of population of the district. Of total district migrants 77.2 percent came from other districts of Punjab, 4.3 percent were from Sindh, Khyber Pakhtunkhwa and Balochistan, while 18.5 percent were Pakistanis who repatriated from other countries.
According to the Pakistan National Human Development Report 2003,2 Bahawalpur stood ‐40th among 91 districts in Pakistan; within Punjab it stood 22nd of 29th districts (UNDP, 2003). In the UNDP Millennium Development Goals report (United Nations, 2006), district‐level data (based on the Pakistan Social and Living Standards Measurement Survey 2004‐05) were shown for various measures of education, gender equity, infant mortality, and environmental sustainability. In these comparisons, Bahawalpur stood 62nd on literacy, 76th 2 The districts of Pakistan were ranked according to a Human Development Index in 2003. Districts were ranked based on literacy rates, enrolment ratios, immunization ratios, infant survival ratios, real GDP per capita, educational attainment index, health index, and income index.
Introduction
3
on immunization, 34th on water supply and 65th on sanitation nationally (Planning Commission, Government of Pakistan, 2006).
The Bahawalpur Baseline Household Survey In Bahawalpur (as in other FALAH project districts), Population Council conducted a baseline sampled household survey to learn about knowledge, attitude, and practices regarding fertility, reproductive health and child spacing/family planning. This represents one of two major studies to establish baseline indicators for the FALAH project. The other is a mapping exercise to compile complete, digitized maps of all facilities providing reproductive health services, including maternal health, neonatal and child health, and birth spacing/family planning. Baseline survey results will be compared with an end line survey toward the end of the project to assess progress.
Objectives
The objectives of the Bahawalpur Baseline Household Survey are:
• To obtain baseline measurements for those FALAH indicators that can best be measured through such surveys;
• To obtain detailed information on the knowledge, attitudes and practices of married couples of Bahawalpur district regarding reproductive health, so as to meet their needs more effectively;
• More specifically, to obtain information needed to improve reproductive health services and to design appropriate social mobilization activities.
Methodology
Study Population
FALAH is primarily a district‐level project that intends to improve the health of women and children of the district over a five‐year period. The baseline household survey covers married women of reproductive age (15‐49 years old) and their husbands living in the community. The objective is to understand and measure general knowledge, attitudes and practices of these married couples regarding family planning.
FALAH Baseline Household Survey
4
Sample Design and Size
The systematic stratified sample technique was used to select a representative sample of the district. The universe consisted of all urban and rural households of the district. A total of 40 blocks/villages were selected, with 15 households selected per block/village. The selection procedure is described below.
Urban Sample
The required numbers of enumeration blocks were selected with probability proportional to size (number of circles) by adopting a multistage stratified sampling design. The “enumeration circles,” i.e., the smallest units available in the 1998 Population District Census Reports, as demarcated by the Population Census Organization, were then selected. The maps of these circles, obtained from the Population Census Organization, were already divided into blocks of approximately 250‐300 households depending upon the number of households in each circle. One block was then randomly selected from each circle. The household listing of each randomly chosen block was carried out by the enumeration teams before selecting the sampled households. A fixed number of 15 households was drawn from each sample enumeration block using systematic random sampling.
Rural Sample
The 1998 Population Census list of villages was used as the sampling frame for the selection of the rural sample. Villages in rural areas have been treated as primary sampling units (PSU). Sample PSUs were selected with probability proportional to size (number of households). Households within the sample PSUs were considered secondary sampling units. The household listing of each village was then prepared by the enumeration teams before selecting the sampled households. A fixed number of 15 households were selected from each sample enumeration village by the systematic random technique.
Selection of Respondents
Within each household, all married women of reproductive age (MWRA) 15‐49 were interviewed. In addition, husbands of MWRA who were present were also interviewed to a maximum of 5 per block; if fewer than 5 husbands could be interviewed from the 15 sampled households, additional interviews were sought from neighboring households.
Introduction
5
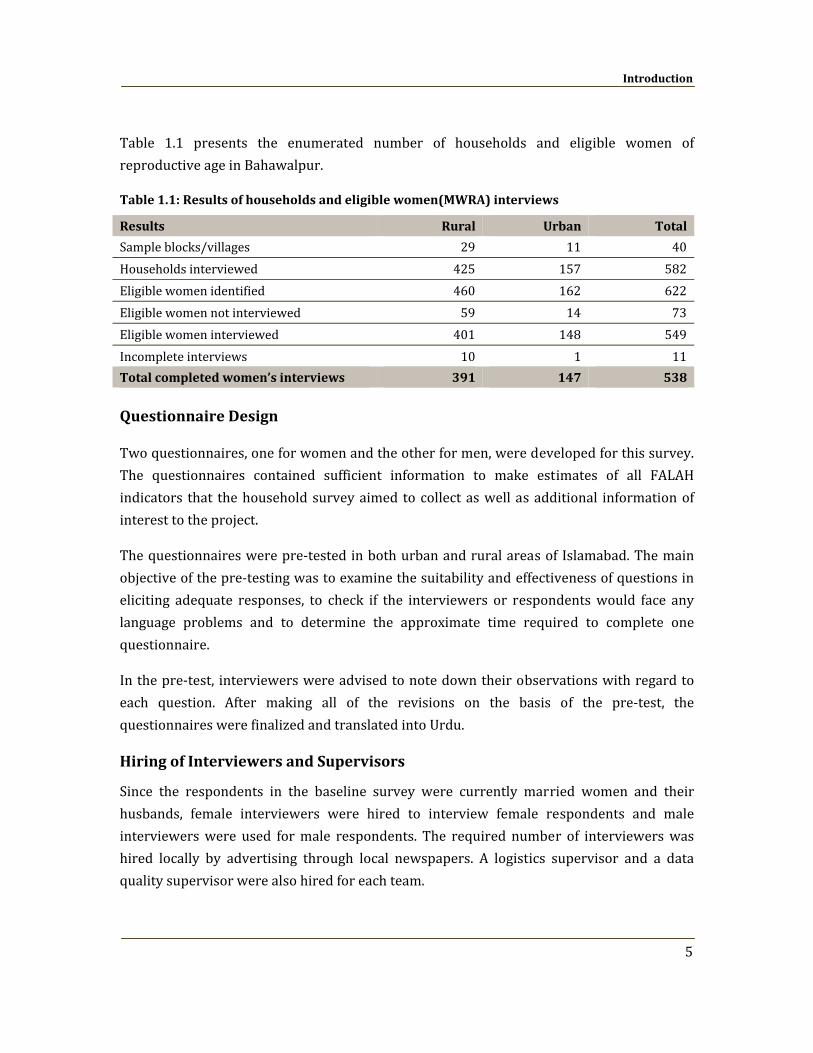
Table 1.1 presents the enumerated number of households and eligible women of reproductive age in Bahawalpur.
Table 1.1: Results of households and eligible women(MWRA) interviews
Results Rural Urban Total
Sample blocks/villages 29 11 40Households interviewed 425 157 582Eligible women identified 460 162 622Eligible women not interviewed 59 14 73Eligible women interviewed 401 148 549Incomplete interviews 10 1 11Total completed women’s interviews 391 147 538
Questionnaire Design
Two questionnaires, one for women and the other for men, were developed for this survey. The questionnaires contained sufficient information to make estimates of all FALAH indicators that the household survey aimed to collect as well as additional information of interest to the project.
The questionnaires were pre‐tested in both urban and rural areas of Islamabad. The main objective of the pre‐testing was to examine the suitability and effectiveness of questions in eliciting adequate responses, to check if the interviewers or respondents would face any language problems and to determine the approximate time required to complete one questionnaire.
In the pre‐test, interviewers were advised to note down their observations with regard to each question. After making all of the revisions on the basis of the pre‐test, the questionnaires were finalized and translated into Urdu.
Hiring of Interviewers and Supervisors
Since the respondents in the baseline survey were currently married women and their husbands, female interviewers were hired to interview female respondents and male interviewers were used for male respondents. The required number of interviewers was hired locally by advertising through local newspapers. A logistics supervisor and a data quality supervisor were also hired for each team.
FALAH Baseline Household Survey
6
Training of Interviewers and Supervisors
In order to ensure that the training provided for interviewers was of high quality, and that interviewers understood the definitions and concepts underlying the language of the questions, a two‐week training of the Bahawalpur team was conducted by the Population Council in Islamabad. During the training, interviewers conducted 2‐3 field interviews in order to prepare for the actual interview process.
Training regarding the importance of the criterion for the selection of primary sampling units, mapping and listing procedures, sample selection, field operation procedures, and selection of particular households and respondents was also provided by specialists.
Quality Assurance
To ensure the quality of the data, Population Council staff monitored the fieldwork by accompanying the field teams. While supervising the fieldwork, Population Council supervisory staff members were also available to provide on‐the‐spot guidance to interviewers in the event that any part of the questionnaire was unclear to them. This ensured the completeness and accuracy of each questionnaire.
Data Entry and Edit Procedures
Data processing was initiated in the field with the checking of the questionnaires. Each team leader completed on‐the‐spot checks and preliminary editing of questionnaires during the enumeration period. Team supervisors were provided with editing instructions emphasizing the importance of completing each questionnaire, correctly identifying each eligible respondent, and the completeness of household composition. Each team leader was engaged in preliminary editing of completed questionnaires during the enumeration period. On receipt of the questionnaires at the Islamabad office, a special team of experienced staff edited the completed questionnaires. After the completion of the editing and coding process, the questionnaires were dispatched to a data entry center. The data were then analyzed using SPSS for Windows.
Fieldwork
Fieldwork for Bahawalpur district was carried out between September 29 and November 18, 2009.
Chapter 2
Household Characteristics
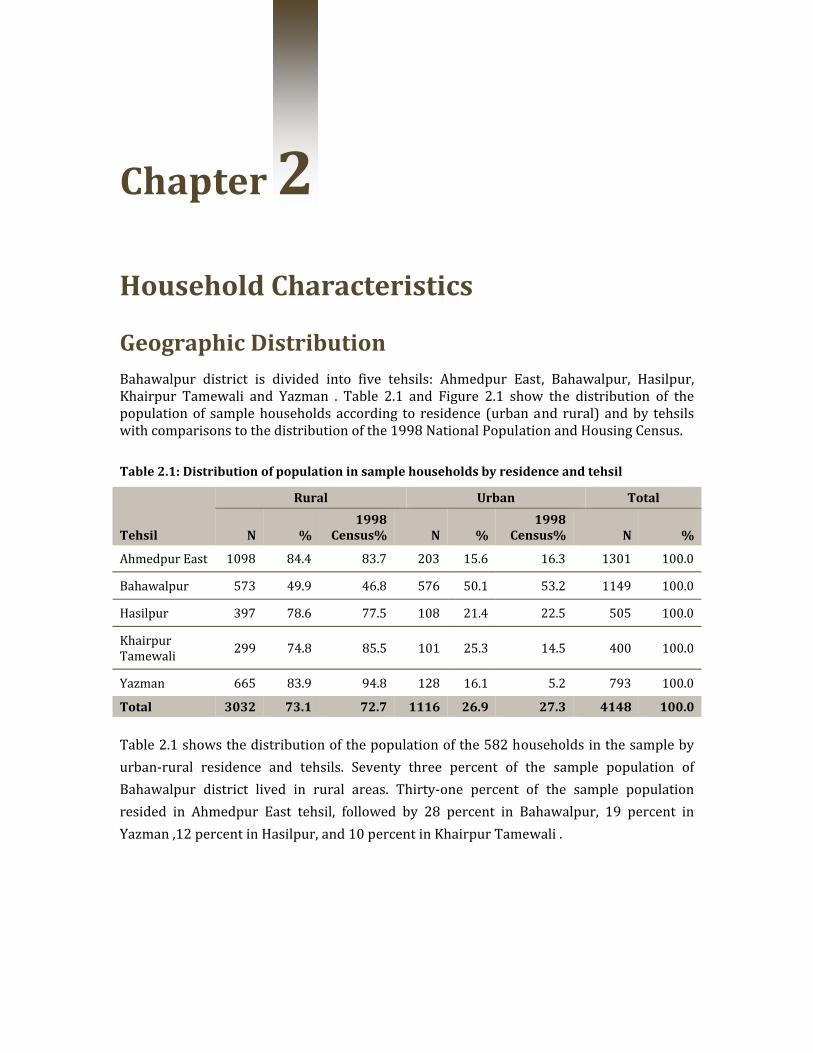
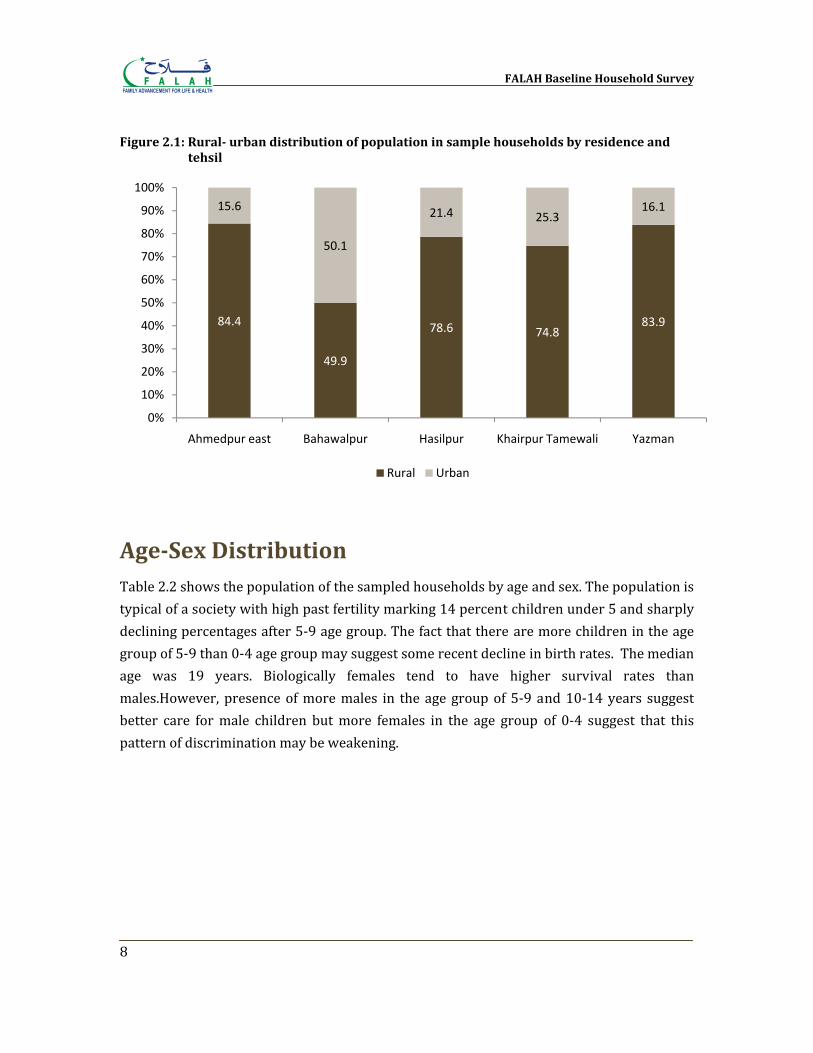
Geographic Distribution Bahawalpur district is divided into five tehsils: Ahmedpur East, Bahawalpur, Hasilpur, Khairpur Tamewali and Yazman . Table 2.1 and Figure 2.1 show the distribution of the population of sample households according to residence (urban and rural) and by tehsils with comparisons to the distribution of the 1998 National Population and Housing Census.
Table 2.1: Distribution of population in sample households by residence and tehsil
Tehsil
Rural Urban Total
N % 1998
Census% N % 1998
Census% N %
Ahmedpur East 1098 84.4 83.7 203 15.6 16.3 1301 100.0
Bahawalpur 573 49.9 46.8 576 50.1 53.2 1149 100.0
Hasilpur 397 78.6 77.5 108 21.4 22.5 505 100.0
Khairpur Tamewali 299 74.8 85.5 101 25.3 14.5 400 100.0
Yazman 665 83.9 94.8 128 16.1 5.2 793 100.0
Total 3032 73.1 72.7 1116 26.9 27.3 4148 100.0
Table 2.1 shows the distribution of the population of the 582 households in the sample by urban‐rural residence and tehsils. Seventy three percent of the sample population of Bahawalpur district lived in rural areas. Thirty‐one percent of the sample population resided in Ahmedpur East tehsil, followed by 28 percent in Bahawalpur, 19 percent in Yazman ,12 percent in Hasilpur, and 10 percent in Khairpur Tamewali .
FALAH Baseline Household Survey
8
Figure 2.1: Rural urban distribution of population in sample households by residence and tehsil
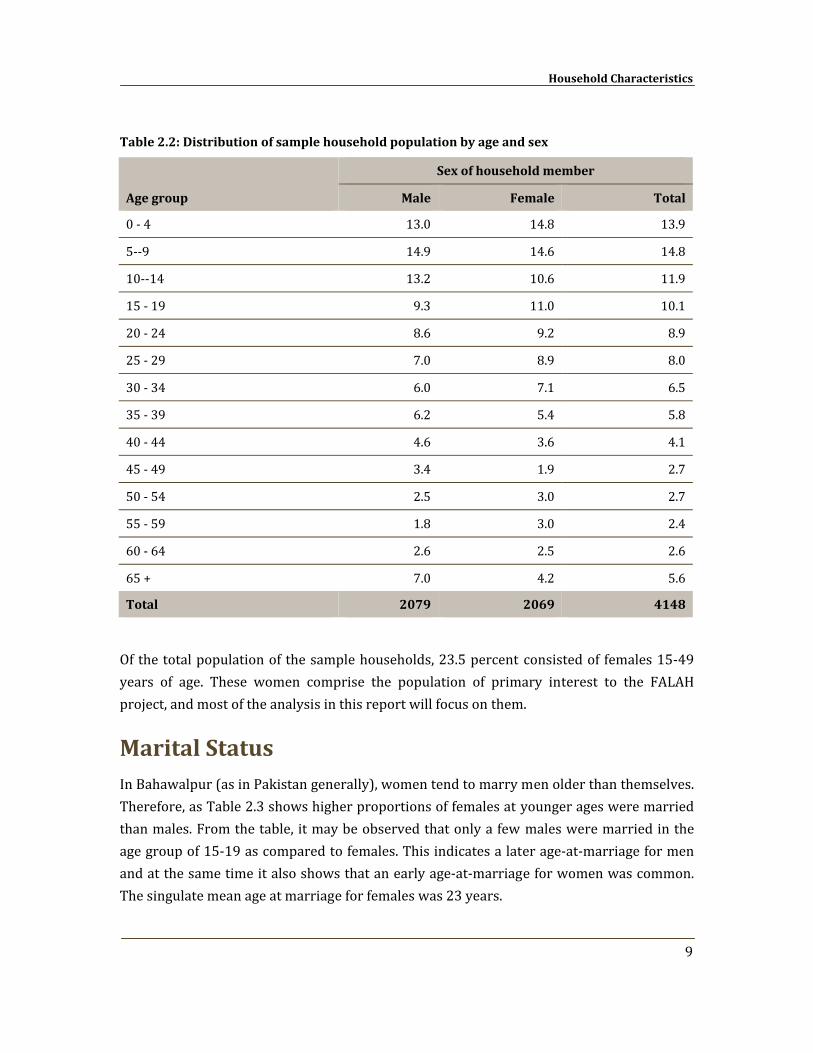
AgeSex Distribution Table 2.2 shows the population of the sampled households by age and sex. The population is typical of a society with high past fertility marking 14 percent children under 5 and sharply declining percentages after 5‐9 age group. The fact that there are more children in the age group of 5‐9 than 0‐4 age group may suggest some recent decline in birth rates. The median age was 19 years. Biologically females tend to have higher survival rates than males.However, presence of more males in the age group of 5‐9 and 10‐14 years suggest better care for male children but more females in the age group of 0‐4 suggest that this pattern of discrimination may be weakening.
84.4
49.9
78.6 74.883.9
15.6
50.1
21.4 25.316.1
0%
10%
20%
30%
40%
50%
60%
70%
80%
90%
100%
Ahmedpur east Bahawalpur Hasilpur Khairpur Tamewali Yazman
Rural Urban
Household Characteristics
9
Table 2.2: Distribution of sample household population by age and sex
Age group
Sex of household member
Male Female Total
0 ‐ 4 13.0 14.8 13.9
5‐‐9 14.9 14.6 14.8
10‐‐14 13.2 10.6 11.9
15 ‐ 19 9.3 11.0 10.1
20 ‐ 24 8.6 9.2 8.9
25 ‐ 29 7.0 8.9 8.0
30 ‐ 34 6.0 7.1 6.5
35 ‐ 39 6.2 5.4 5.8
40 ‐ 44 4.6 3.6 4.1
45 ‐ 49 3.4 1.9 2.7
50 ‐ 54 2.5 3.0 2.7
55 ‐ 59 1.8 3.0 2.4
60 ‐ 64 2.6 2.5 2.6
65 + 7.0 4.2 5.6
Total 2079 2069 4148
Of the total population of the sample households, 23.5 percent consisted of females 15‐49 years of age. These women comprise the population of primary interest to the FALAH project, and most of the analysis in this report will focus on them.
Marital Status In Bahawalpur (as in Pakistan generally), women tend to marry men older than themselves. Therefore, as Table 2.3 shows higher proportions of females at younger ages were married than males. From the table, it may be observed that only a few males were married in the age group of 15‐19 as compared to females. This indicates a later age‐at‐marriage for men and at the same time it also shows that an early age‐at‐marriage for women was common. The singulate mean age at marriage for females was 23 years.
FALAH Baseline Household Survey
10
Table 2.3: Distribution of household population by marital status, sex and age
Age group
Married
Widow/Divorced/ Separated
Never married
Men Women Men Women Men Women
15 ‐ 19 3.1 16.7 1.0 0.0 95.9 83.3
20 ‐ 24 17.3 48.7 1.1 2.1 81.6 49.2
25 ‐ 29 54.1 80.5 1.4 2.7 44.5 16.8
30 ‐ 34 84.0 90.4 0.8 3.4 15.2 6.2
35 ‐ 39 93.8 93.7 1.6 3.6 4.7 2.7
40 ‐ 44 91.6 93.2 4.2 4.1 4.2 2.7
45 ‐ 49 92.9 87.5 5.7 10.0 1.4 2.5
50 ‐ 54 96.1 92.1 3.9 6.3 0.0 1.6
55 ‐ 59 97.3 77.8 2.7 20.6 0.0 1.6
60 ‐ 64 89.1 70.6 9.1 29.4 1.8 0.0
65 ‐ 69 94.6 71.1 5.4 28.9 0.0 0.0
70 ‐ 74 83.9 37.9 12.5 55.2 3.6 6.9
75 + 61.5 28.6 38.5 71.4 0.0 0.0
All ages 15+ 60.5 65.1
4.4 8.0
35.0 26.9
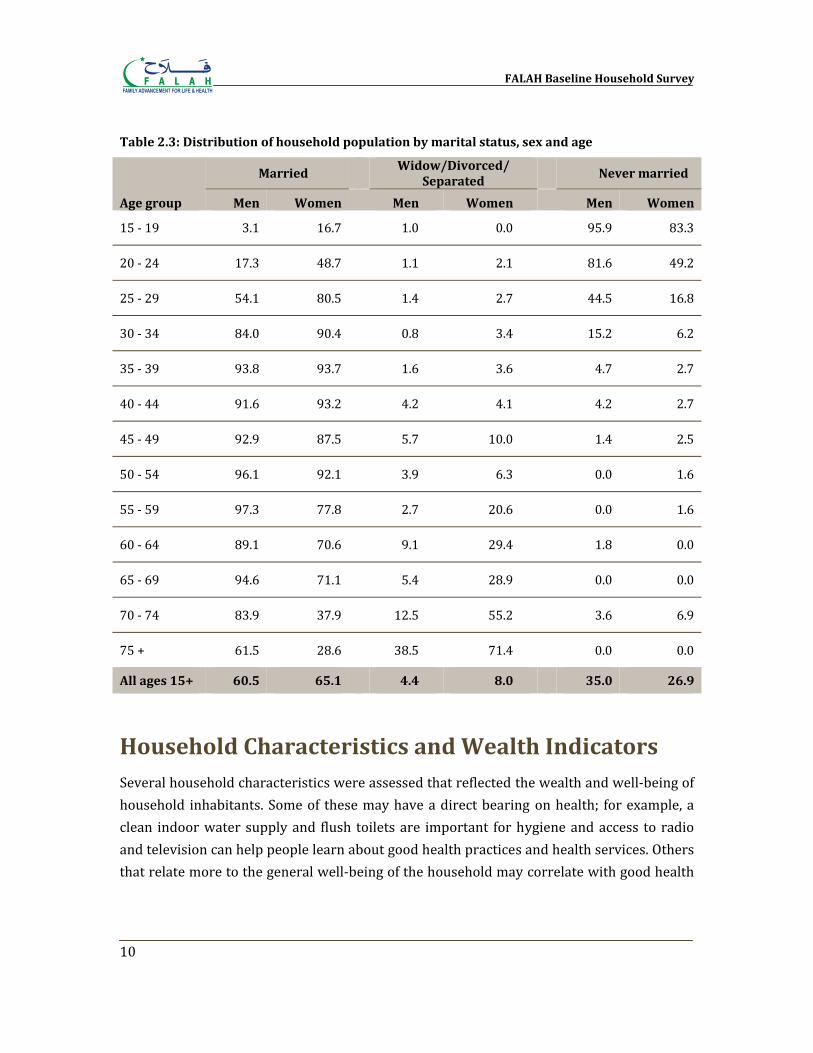
Household Characteristics and Wealth Indicators Several household characteristics were assessed that reflected the wealth and well‐being of household inhabitants. Some of these may have a direct bearing on health; for example, a clean indoor water supply and flush toilets are important for hygiene and access to radio and television can help people learn about good health practices and health services. Others that relate more to the general well‐being of the household may correlate with good health
Household Characteristics
11
– for example, by indicating the ability to buy sufficient food for good nutrition or pay for quality health care.
Physical Characteristics of Households
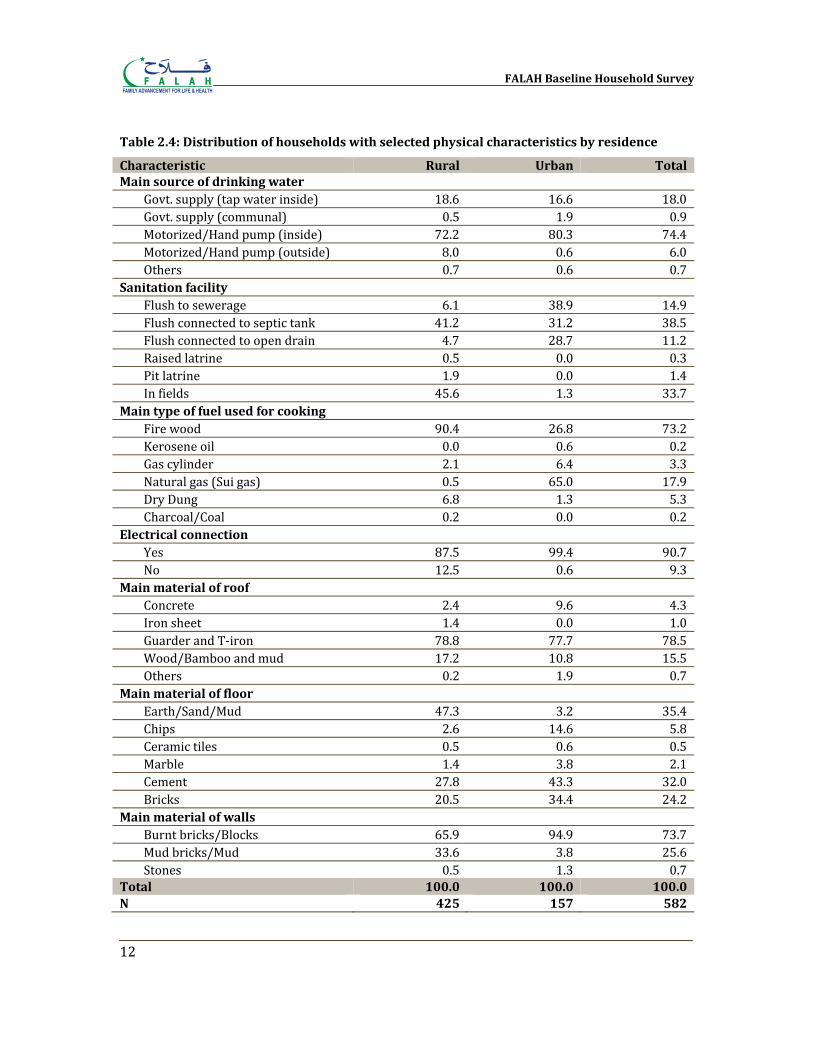
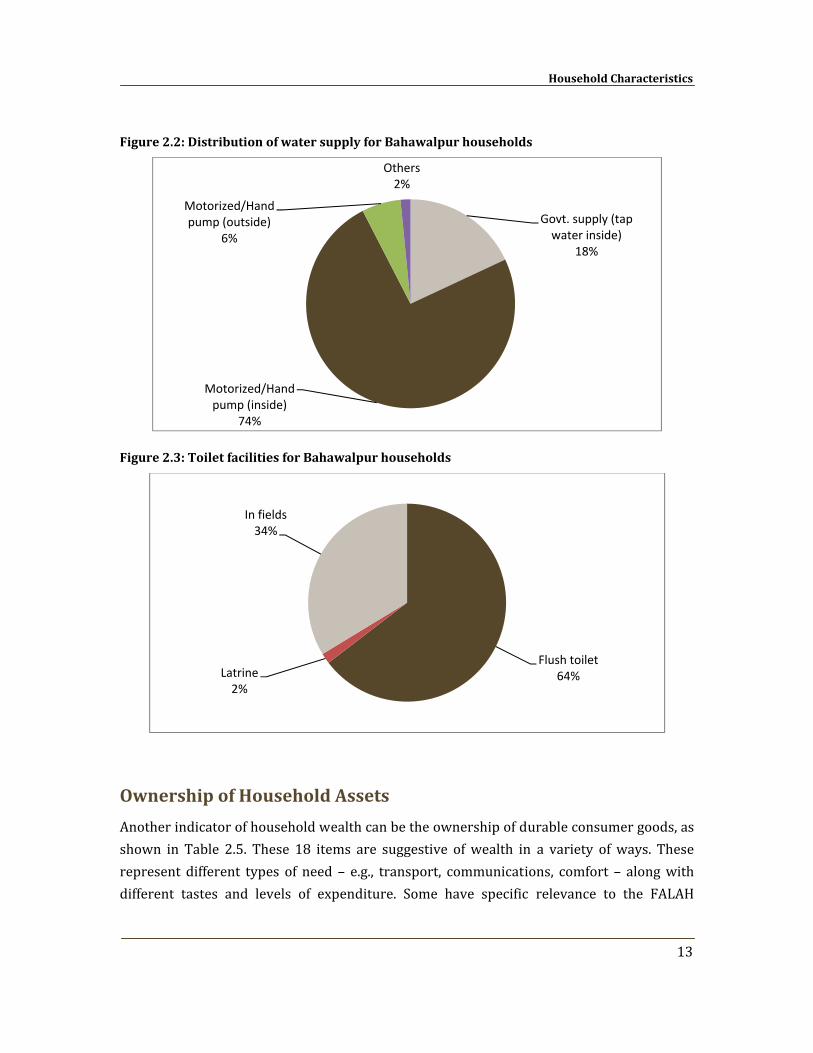
Table 2.4 shows selected physical characteristics of the sample households. Majority of households (92.4 percent) had an indoor water supply, although in 18 percent of the households this consisted of an inside Govt. supply. Sixty‐five percent of the households had flush toilets. However, the number was very low for pit latrines. A considerable number of households (34 percent) were using fields as toilets. As a whole, a large majority of households used firewood for cooking (73 percent) but the majority of these were rural households (90 percent) while on the other hand 65 percent urban households were using natural gas. Almost all households in urban areas (99 percent) were enjoying electricity while this was available to 88 percent rural households. Most houses were roofed with Guarder or T‐iron sheets (79 percent) while 74 percent of the walls were made of burnt bricks or blocks.
FALAH Baseline Household Survey
12
Table 2.4: Distribution of households with selected physical characteristics by residence
Characteristic Rural Urban Total Main source of drinking water
Govt. supply (tap water inside) 18.6 16.6 18.0Govt. supply (communal) 0.5 1.9 0.9Motorized/Hand pump (inside) 72.2 80.3 74.4Motorized/Hand pump (outside) 8.0 0.6 6.0Others 0.7 0.6 0.7
Sanitation facility Flush to sewerage 6.1 38.9 14.9Flush connected to septic tank 41.2 31.2 38.5Flush connected to open drain 4.7 28.7 11.2Raised latrine 0.5 0.0 0.3Pit latrine 1.9 0.0 1.4In fields 45.6 1.3 33.7
Main type of fuel used for cooking Fire wood 90.4 26.8 73.2Kerosene oil 0.0 0.6 0.2Gas cylinder 2.1 6.4 3.3Natural gas (Sui gas) 0.5 65.0 17.9Dry Dung 6.8 1.3 5.3Charcoal/Coal 0.2 0.0 0.2
Electrical connection Yes 87.5 99.4 90.7No 12.5 0.6 9.3
Main material of roof Concrete 2.4 9.6 4.3Iron sheet 1.4 0.0 1.0Guarder and T‐iron 78.8 77.7 78.5Wood/Bamboo and mud 17.2 10.8 15.5Others 0.2 1.9 0.7
Main material of floor Earth/Sand/Mud 47.3 3.2 35.4Chips 2.6 14.6 5.8Ceramic tiles 0.5 0.6 0.5Marble 1.4 3.8 2.1Cement 27.8 43.3 32.0Bricks 20.5 34.4 24.2
Main material of walls Burnt bricks/Blocks 65.9 94.9 73.7Mud bricks/Mud 33.6 3.8 25.6Stones 0.5 1.3 0.7
Total 100.0 100.0 100.0 N 425 157 582
Household Characteristics
13
Figure 2.2: Distribution of water supply for Bahawalpur households
Figure 2.3: Toilet facilities for Bahawalpur households
Ownership of Household Assets
Another indicator of household wealth can be the ownership of durable consumer goods, as shown in Table 2.5. These 18 items are suggestive of wealth in a variety of ways. These represent different types of need – e.g., transport, communications, comfort – along with different tastes and levels of expenditure. Some have specific relevance to the FALAH
Govt. supply (tap water inside)
18%
Motorized/Hand pump (inside)
74%
Motorized/Hand pump (outside)
6%
Others2%
Flush toilet64%Latrine
2%
In fields34%
FALAH Baseline Household Survey
14
objectives; for example, electronic media can be used to access health messages, vehicles to reach health facilities, and telephones to summon help when needed. Others are suggestive of more general well‐being.
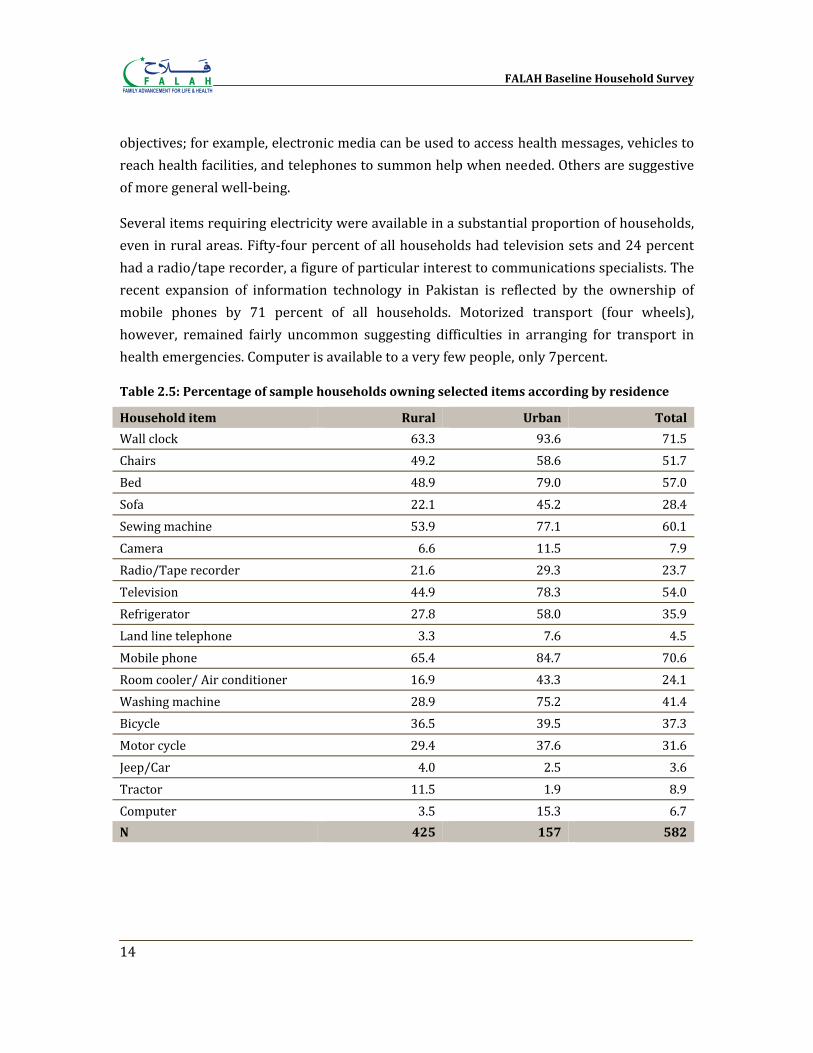
Several items requiring electricity were available in a substantial proportion of households, even in rural areas. Fifty‐four percent of all households had television sets and 24 percent had a radio/tape recorder, a figure of particular interest to communications specialists. The recent expansion of information technology in Pakistan is reflected by the ownership of mobile phones by 71 percent of all households. Motorized transport (four wheels), however, remained fairly uncommon suggesting difficulties in arranging for transport in health emergencies. Computer is available to a very few people, only 7percent.
Table 2.5: Percentage of sample households owning selected items according by residence
Household item Rural Urban Total
Wall clock 63.3 93.6 71.5Chairs 49.2 58.6 51.7Bed 48.9 79.0 57.0Sofa 22.1 45.2 28.4Sewing machine 53.9 77.1 60.1Camera 6.6 11.5 7.9Radio/Tape recorder 21.6 29.3 23.7Television 44.9 78.3 54.0Refrigerator 27.8 58.0 35.9Land line telephone 3.3 7.6 4.5Mobile phone 65.4 84.7 70.6Room cooler/ Air conditioner 16.9 43.3 24.1Washing machine 28.9 75.2 41.4Bicycle 36.5 39.5 37.3Motor cycle 29.4 37.6 31.6Jeep/Car 4.0 2.5 3.6Tractor 11.5 1.9 8.9Computer 3.5 15.3 6.7N 425 157 582
Household Characteristics
15
Standard of Living Index
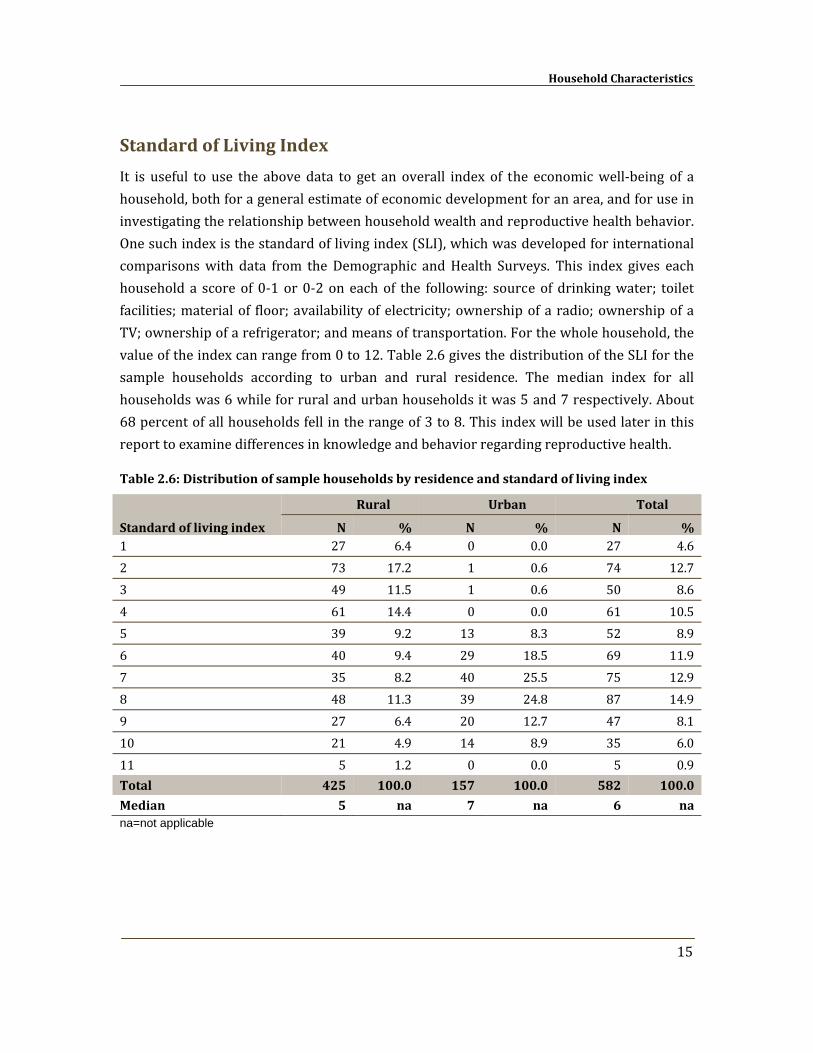
It is useful to use the above data to get an overall index of the economic well‐being of a household, both for a general estimate of economic development for an area, and for use in investigating the relationship between household wealth and reproductive health behavior. One such index is the standard of living index (SLI), which was developed for international comparisons with data from the Demographic and Health Surveys. This index gives each household a score of 0‐1 or 0‐2 on each of the following: source of drinking water; toilet facilities; material of floor; availability of electricity; ownership of a radio; ownership of a TV; ownership of a refrigerator; and means of transportation. For the whole household, the value of the index can range from 0 to 12. Table 2.6 gives the distribution of the SLI for the sample households according to urban and rural residence. The median index for all households was 6 while for rural and urban households it was 5 and 7 respectively. About 68 percent of all households fell in the range of 3 to 8. This index will be used later in this report to examine differences in knowledge and behavior regarding reproductive health.
Table 2.6: Distribution of sample households by residence and standard of living index
Standard of living index
Rural Urban Total
N % N % N % 1 27 6.4 0 0.0 27 4.62 73 17.2 1 0.6 74 12.73 49 11.5 1 0.6 50 8.64 61 14.4 0 0.0 61 10.55 39 9.2 13 8.3 52 8.96 40 9.4 29 18.5 69 11.97 35 8.2 40 25.5 75 12.98 48 11.3 39 24.8 87 14.99 27 6.4 20 12.7 47 8.110 21 4.9 14 8.9 35 6.011 5 1.2 0 0.0 5 0.9Total 425 100.0 157 100.0 582 100.0
Median 5 na 7 na 6 na na=not applicable

Chapter 3
Respondent Characteristics
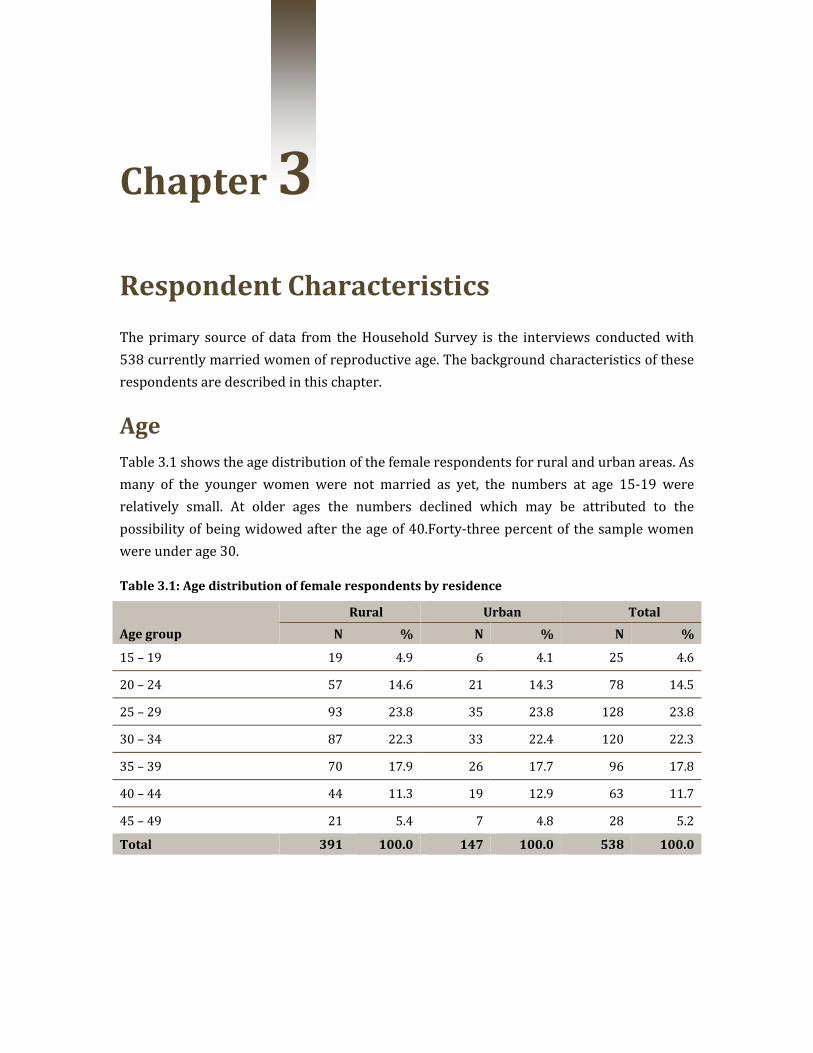
The primary source of data from the Household Survey is the interviews conducted with 538 currently married women of reproductive age. The background characteristics of these respondents are described in this chapter.
Age Table 3.1 shows the age distribution of the female respondents for rural and urban areas. As many of the younger women were not married as yet, the numbers at age 15‐19 were relatively small. At older ages the numbers declined which may be attributed to the possibility of being widowed after the age of 40.Forty‐three percent of the sample women were under age 30.
Table 3.1: Age distribution of female respondents by residence
Age group
Rural Urban Total
N % N % N %
15 – 19 19 4.9 6 4.1 25 4.6
20 – 24 57 14.6 21 14.3 78 14.5
25 – 29 93 23.8 35 23.8 128 23.8
30 – 34 87 22.3 33 22.4 120 22.3
35 – 39 70 17.9 26 17.7 96 17.8
40 – 44 44 11.3 19 12.9 63 11.7
45 – 49 21 5.4 7 4.8 28 5.2
Total 391 100.0 147 100.0 538 100.0
FALAH Baseline Household Survey
18
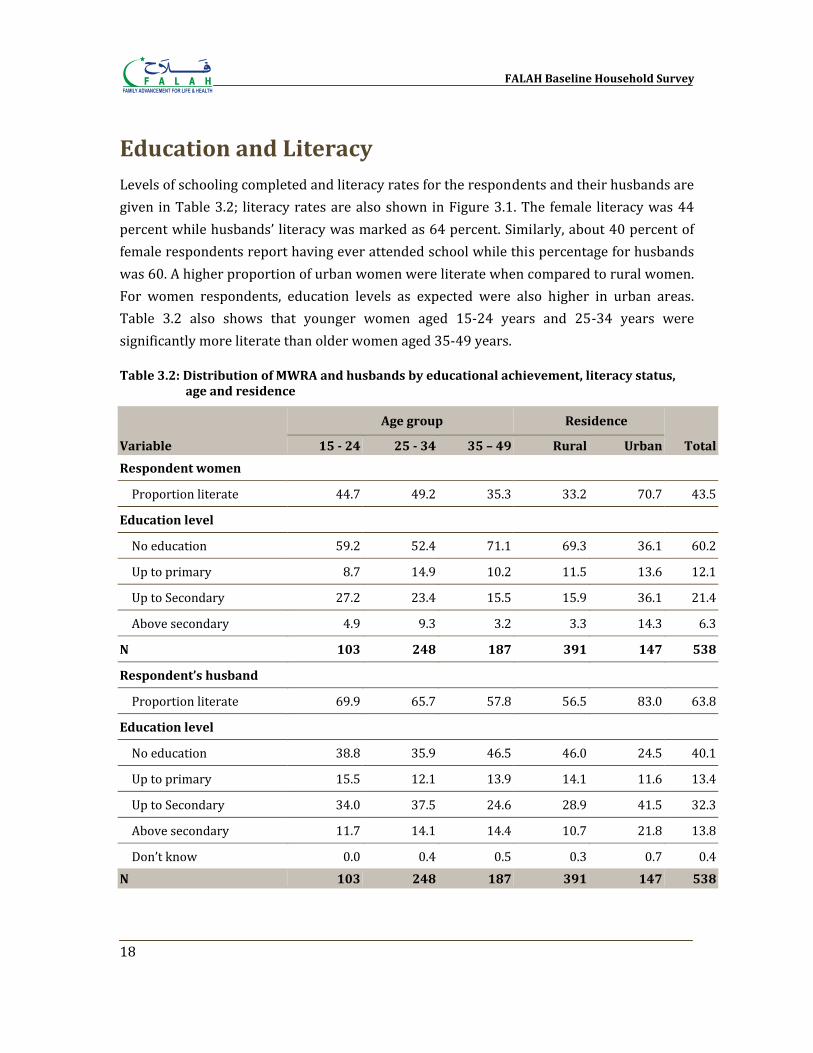
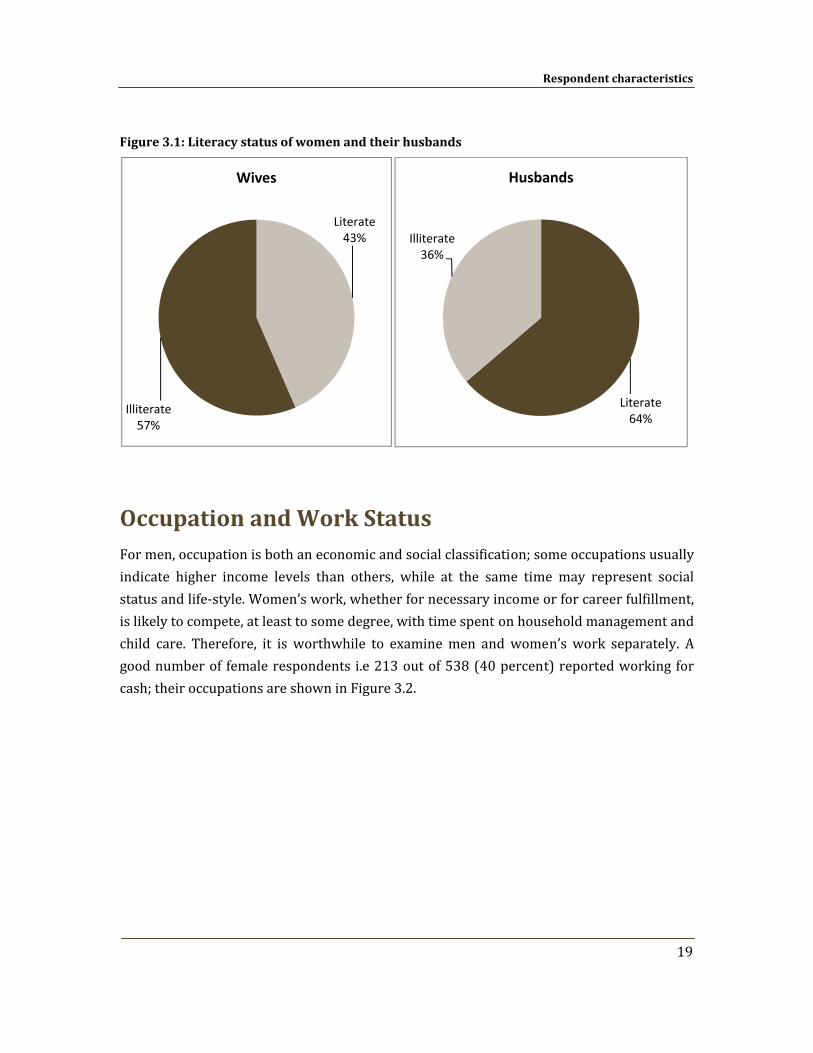
Education and Literacy Levels of schooling completed and literacy rates for the respondents and their husbands are given in Table 3.2; literacy rates are also shown in Figure 3.1. The female literacy was 44 percent while husbands’ literacy was marked as 64 percent. Similarly, about 40 percent of female respondents report having ever attended school while this percentage for husbands was 60. A higher proportion of urban women were literate when compared to rural women. For women respondents, education levels as expected were also higher in urban areas. Table 3.2 also shows that younger women aged 15‐24 years and 25‐34 years were significantly more literate than older women aged 35‐49 years.
Table 3.2: Distribution of MWRA and husbands by educational achievement, literacy status, age and residence
Variable
Age group Residence
Total 15 24 25 34 35 – 49 Rural Urban
Respondent women
Proportion literate 44.7 49.2 35.3 33.2 70.7 43.5
Education level
No education 59.2 52.4 71.1 69.3 36.1 60.2
Up to primary 8.7 14.9 10.2 11.5 13.6 12.1
Up to Secondary 27.2 23.4 15.5 15.9 36.1 21.4
Above secondary 4.9 9.3 3.2 3.3 14.3 6.3
N 103 248 187 391 147 538
Respondent’s husband
Proportion literate 69.9 65.7 57.8 56.5 83.0 63.8
Education level
No education 38.8 35.9 46.5 46.0 24.5 40.1
Up to primary 15.5 12.1 13.9 14.1 11.6 13.4
Up to Secondary 34.0 37.5 24.6 28.9 41.5 32.3
Above secondary 11.7 14.1 14.4 10.7 21.8 13.8
Don’t know 0.0 0.4 0.5 0.3 0.7 0.4N 103 248 187 391 147 538
Respondent characteristics
19
Figure 3.1: Literacy status of women and their husbands
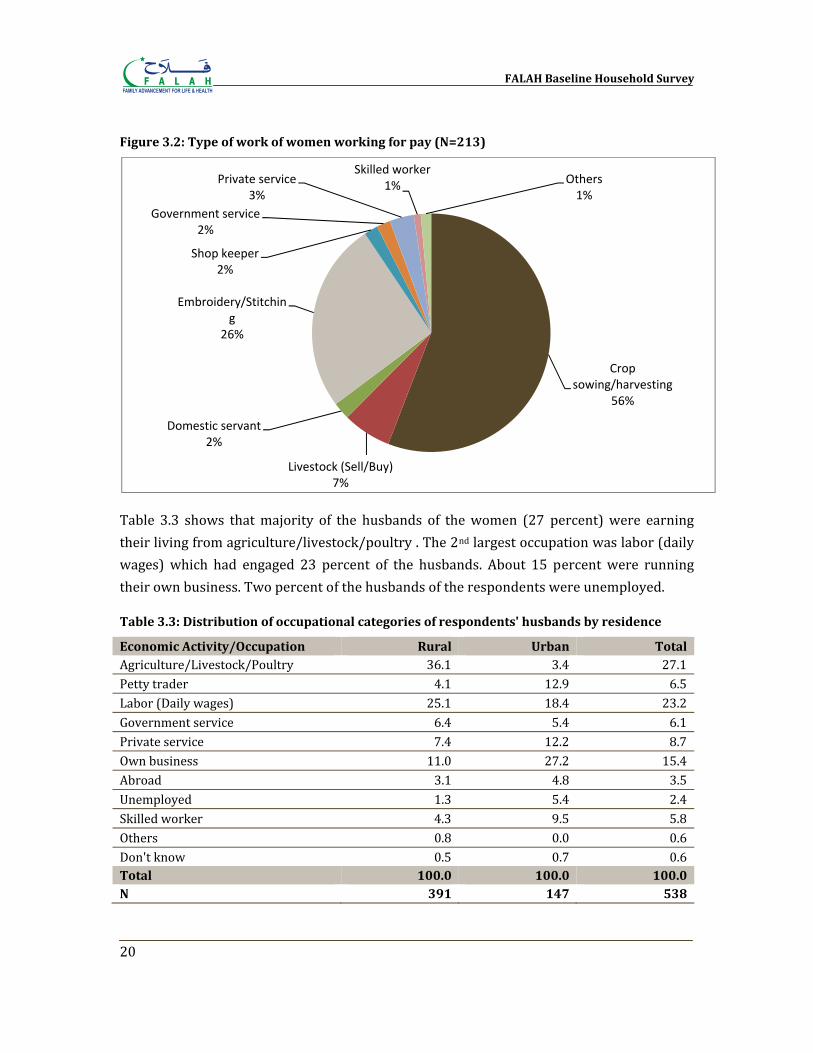
Occupation and Work Status For men, occupation is both an economic and social classification; some occupations usually indicate higher income levels than others, while at the same time may represent social status and life‐style. Women’s work, whether for necessary income or for career fulfillment, is likely to compete, at least to some degree, with time spent on household management and child care. Therefore, it is worthwhile to examine men and women’s work separately. A good number of female respondents i.e 213 out of 538 (40 percent) reported working for cash; their occupations are shown in Figure 3.2.
Literate43%
Illiterate57%
Wives
Literate64%
Illiterate36%
Husbands
FALAH Baseline Household Survey
20
Figure 3.2: Type of work of women working for pay (N=213)
Table 3.3 shows that majority of the husbands of the women (27 percent) were earning their living from agriculture/livestock/poultry . The 2nd largest occupation was labor (daily wages) which had engaged 23 percent of the husbands. About 15 percent were running their own business. Two percent of the husbands of the respondents were unemployed.
Table 3.3: Distribution of occupational categories of respondents' husbands by residence
Economic Activity/Occupation Rural Urban Total Agriculture/Livestock/Poultry 36.1 3.4 27.1Petty trader 4.1 12.9 6.5Labor (Daily wages) 25.1 18.4 23.2Government service 6.4 5.4 6.1Private service 7.4 12.2 8.7Own business 11.0 27.2 15.4Abroad 3.1 4.8 3.5Unemployed 1.3 5.4 2.4Skilled worker 4.3 9.5 5.8Others 0.8 0.0 0.6Don't know 0.5 0.7 0.6Total 100.0 100.0 100.0 N 391 147 538
Crop sowing/harvesting
56%
Livestock (Sell/Buy)7%
Domestic servant2%
Embroidery/Stitching
26%
Shop keeper2%
Government service2%
Private service3%
Skilled worker1% Others
1%
Respondent characteristics
21
Female Mobility Women respondents were asked about their ability to go to places outside their homes and what degree of permission was required (Table 3.4). Only a few women reported being able to go to any of the places named without permission. On the other hand the number was also very low for the women not being able to go at all to any of the places. For each of the named destinations, a majority said they could go with someone.
Table 3.4: Women’s reports regarding mobility outside the home by degree of permission and destination
Destination
Degree of permission Total
Without permission
With permission
With someone
Can’t go/ doesn’t go % N
Market 3.5 13.4 78.3 4.8 100.0 538
Health center 3.5 9.9 85.7 0.9 100.0 538
Relatives/friends 5.8 20.4 73.0 0.7 100.0 538
Out of village/ town 4.8 14.7 78.1 2.4 100.0 538
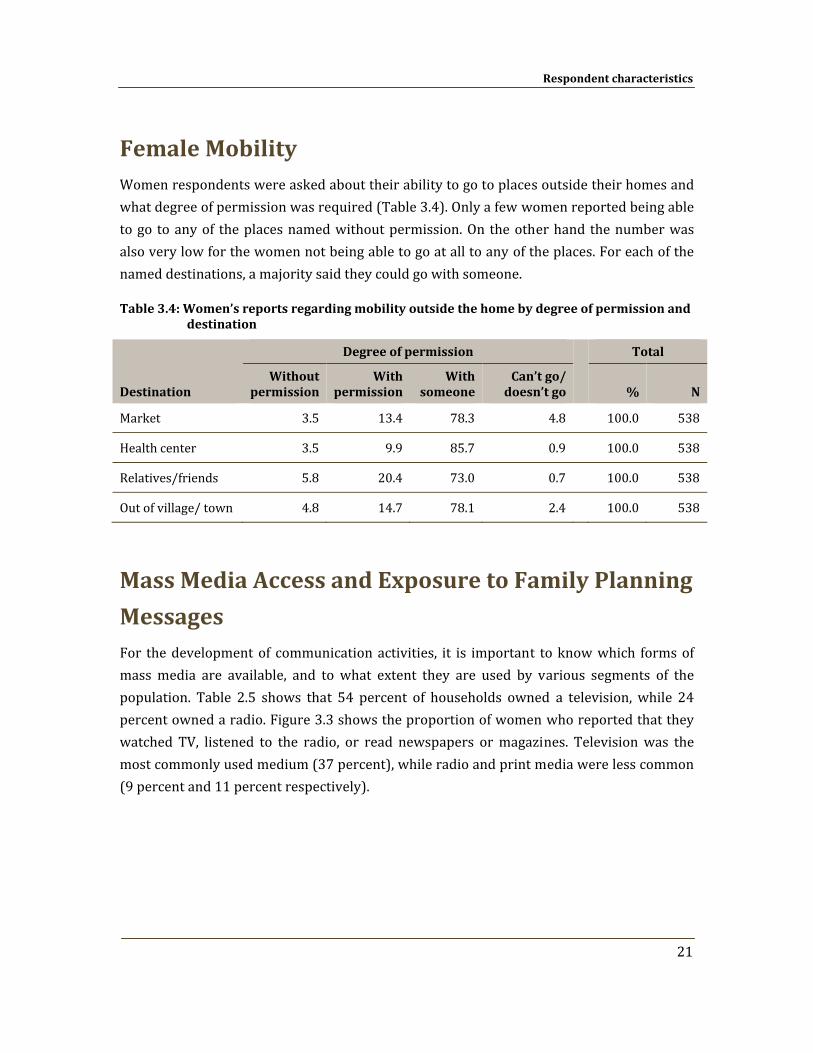
Mass Media Access and Exposure to Family Planning
Messages For the development of communication activities, it is important to know which forms of mass media are available, and to what extent they are used by various segments of the population. Table 2.5 shows that 54 percent of households owned a television, while 24 percent owned a radio. Figure 3.3 shows the proportion of women who reported that they watched TV, listened to the radio, or read newspapers or magazines. Television was the most commonly used medium (37 percent), while radio and print media were less common (9 percent and 11 percent respectively).
FALAH Baseline Household Survey
22
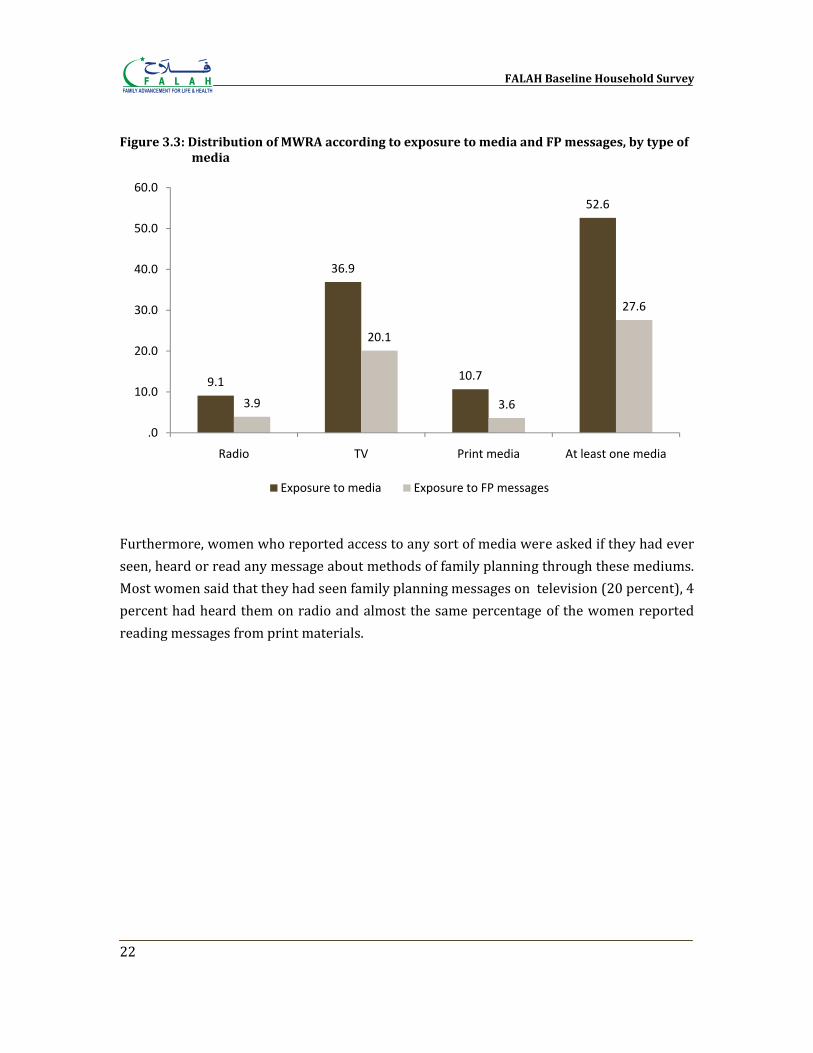
Figure 3.3: Distribution of MWRA according to exposure to media and FP messages, by type of media
Furthermore, women who reported access to any sort of media were asked if they had ever seen, heard or read any message about methods of family planning through these mediums. Most women said that they had seen family planning messages on television (20 percent), 4 percent had heard them on radio and almost the same percentage of the women reported reading messages from print materials.
9.1
36.9
10.7
52.6
3.9
20.1
3.6
27.6
.0
10.0
20.0
30.0
40.0
50.0
60.0
Radio TV Print media At least one media
Exposure to media Exposure to FP messages
Chapter 4
Fertility The main objective of this baseline survey was to seek information on the level of knowledge and acceptance of using birth spacing methods to improve maternal and child health. Some information on fertility, such as the number of children ever born and living children, was collected from the currently married women. This information was used to obtain the level of cumulative fertility.
Other information collected in this baseline survey included the date of birth for all live births and whether those children were still alive at the time of the survey. If a mother was unable to remember the date of birth, she was asked how long ago her last live birth was. From these responses, births that occurred during the last three years were ascertained. The numbers of births obtained through this procedure were then used to analyze current fertility. For a family planning program, it is essential to be informed about fertility levels to better understand couples’ responses to family planning.
Cumulative Fertility
Children Ever Born and Living
The number of children a woman has ever borne reflects fertility in the past; it provides a somewhat different picture of fertility levels, trends and differentials than do period measures of fertility, such as CBR and TFR. Table 4.1 shows the percent distribution of all currently married women by the number of children ever born (CEB). The table shows this distribution by the age of the woman at the time of the survey.
,
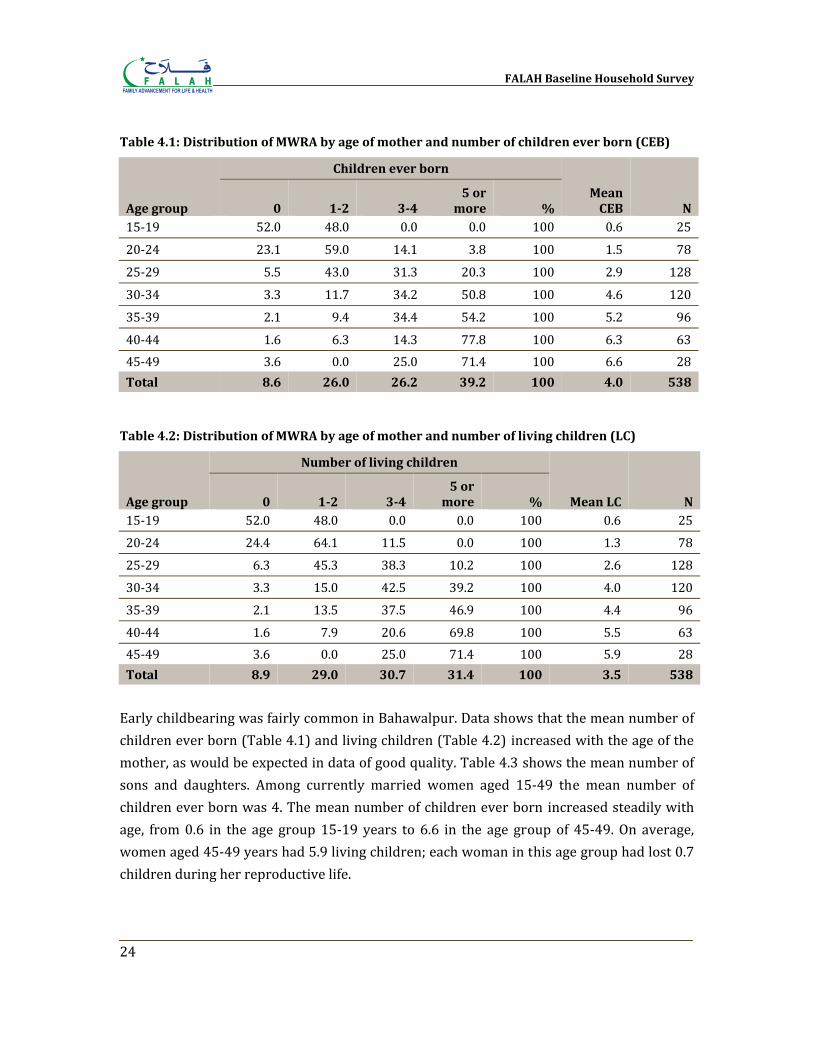
FALAH Baseline Household Survey
24
Table 4.1: Distribution of MWRA by age of mother and number of children ever born (CEB)
Age group
Children ever born
Mean CEB N 0 12 34
5 or more %
15‐19 52.0 48.0 0.0 0.0 100 0.6 25
20‐24 23.1 59.0 14.1 3.8 100 1.5 78
25‐29 5.5 43.0 31.3 20.3 100 2.9 128
30‐34 3.3 11.7 34.2 50.8 100 4.6 120
35‐39 2.1 9.4 34.4 54.2 100 5.2 96
40‐44 1.6 6.3 14.3 77.8 100 6.3 6345‐49 3.6 0.0 25.0 71.4 100 6.6 28Total 8.6 26.0 26.2 39.2 100 4.0 538
Table 4.2: Distribution of MWRA by age of mother and number of living children (LC)
Age group
Number of living children
Mean LC N 0 12 34 5 or more %
15‐19 52.0 48.0 0.0 0.0 100 0.6 2520‐24 24.4 64.1 11.5 0.0 100 1.3 78
25‐29 6.3 45.3 38.3 10.2 100 2.6 128
30‐34 3.3 15.0 42.5 39.2 100 4.0 120
35‐39 2.1 13.5 37.5 46.9 100 4.4 96
40‐44 1.6 7.9 20.6 69.8 100 5.5 6345‐49 3.6 0.0 25.0 71.4 100 5.9 28Total 8.9 29.0 30.7 31.4 100 3.5 538
Early childbearing was fairly common in Bahawalpur. Data shows that the mean number of children ever born (Table 4.1) and living children (Table 4.2) increased with the age of the mother, as would be expected in data of good quality. Table 4.3 shows the mean number of sons and daughters. Among currently married women aged 15‐49 the mean number of children ever born was 4. The mean number of children ever born increased steadily with age, from 0.6 in the age group 15‐19 years to 6.6 in the age group of 45‐49. On average, women aged 45‐49 years had 5.9 living children; each woman in this age group had lost 0.7 children during her reproductive life.
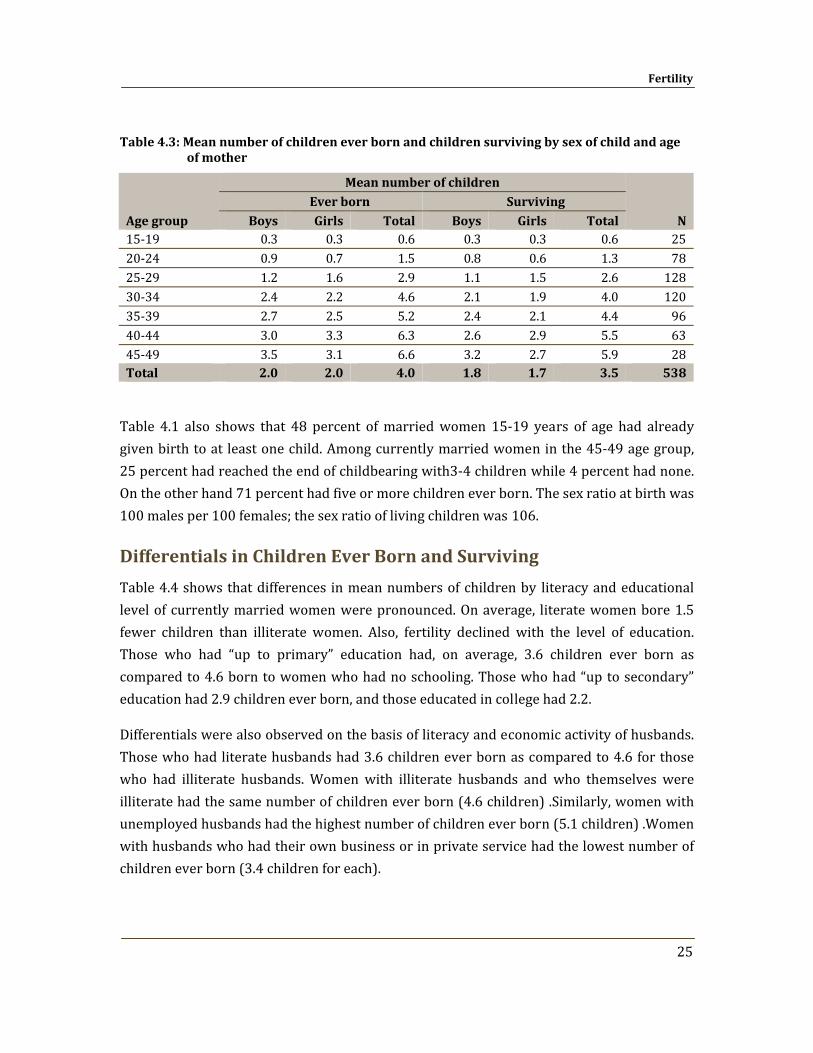
Fertility
25
Table 4.3: Mean number of children ever born and children surviving by sex of child and age of mother
Age group
Mean number of children
N Ever born Surviving
Boys Girls Total Boys Girls Total 15‐19 0.3 0.3 0.6 0.3 0.3 0.6 25 20‐24 0.9 0.7 1.5 0.8 0.6 1.3 78 25‐29 1.2 1.6 2.9 1.1 1.5 2.6 128 30‐34 2.4 2.2 4.6 2.1 1.9 4.0 120 35‐39 2.7 2.5 5.2 2.4 2.1 4.4 96 40‐44 3.0 3.3 6.3 2.6 2.9 5.5 63 45‐49 3.5 3.1 6.6 3.2 2.7 5.9 28 Total 2.0 2.0 4.0 1.8 1.7 3.5 538
Table 4.1 also shows that 48 percent of married women 15‐19 years of age had already given birth to at least one child. Among currently married women in the 45‐49 age group, 25 percent had reached the end of childbearing with3‐4 children while 4 percent had none. On the other hand 71 percent had five or more children ever born. The sex ratio at birth was 100 males per 100 females; the sex ratio of living children was 106.
Differentials in Children Ever Born and Surviving
Table 4.4 shows that differences in mean numbers of children by literacy and educational level of currently married women were pronounced. On average, literate women bore 1.5 fewer children than illiterate women. Also, fertility declined with the level of education. Those who had “up to primary” education had, on average, 3.6 children ever born as compared to 4.6 born to women who had no schooling. Those who had “up to secondary” education had 2.9 children ever born, and those educated in college had 2.2.
Differentials were also observed on the basis of literacy and economic activity of husbands. Those who had literate husbands had 3.6 children ever born as compared to 4.6 for those who had illiterate husbands. Women with illiterate husbands and who themselves were illiterate had the same number of children ever born (4.6 children) .Similarly, women with unemployed husbands had the highest number of children ever born (5.1 children) .Women with husbands who had their own business or in private service had the lowest number of children ever born (3.4 children for each).
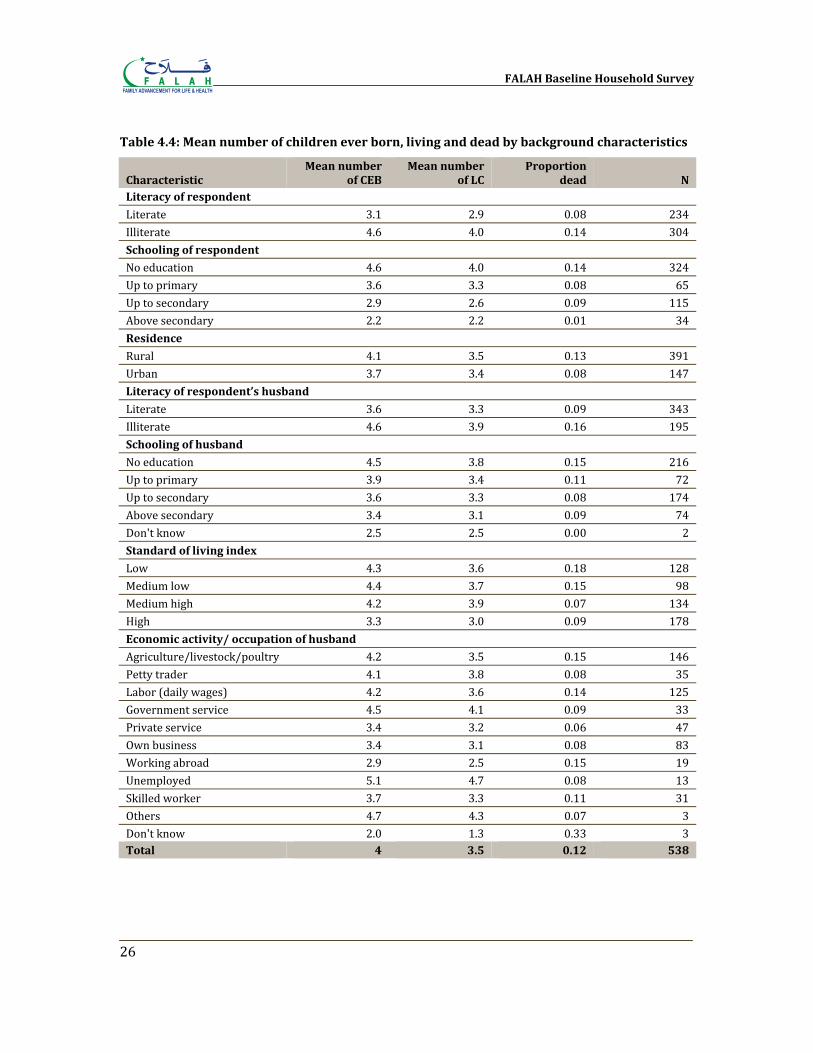
FALAH Baseline Household Survey
26
Table 4.4: Mean number of children ever born, living and dead by background characteristics
Characteristic Mean number
of CEB Mean number
of LC Proportion
dead N Literacy of respondent Literate 3.1 2.9 0.08 234 Illiterate 4.6 4.0 0.14 304 Schooling of respondent
No education 4.6 4.0 0.14 324 Up to primary 3.6 3.3 0.08 65 Up to secondary 2.9 2.6 0.09 115 Above secondary 2.2 2.2 0.01 34 Residence
Rural 4.1 3.5 0.13 391 Urban 3.7 3.4 0.08 147 Literacy of respondent’s husband
Literate 3.6 3.3 0.09 343 Illiterate 4.6 3.9 0.16 195 Schooling of husband
No education 4.5 3.8 0.15 216 Up to primary 3.9 3.4 0.11 72 Up to secondary 3.6 3.3 0.08 174 Above secondary 3.4 3.1 0.09 74 Don't know 2.5 2.5 0.00 2 Standard of living index
Low 4.3 3.6 0.18 128 Medium low 4.4 3.7 0.15 98 Medium high 4.2 3.9 0.07 134 High 3.3 3.0 0.09 178 Economic activity/ occupation of husband
Agriculture/livestock/poultry 4.2 3.5 0.15 146 Petty trader 4.1 3.8 0.08 35 Labor (daily wages) 4.2 3.6 0.14 125 Government service 4.5 4.1 0.09 33 Private service 3.4 3.2 0.06 47 Own business 3.4 3.1 0.08 83 Working abroad 2.9 2.5 0.15 19 Unemployed 5.1 4.7 0.08 13 Skilled worker 3.7 3.3 0.11 31 Others 4.7 4.3 0.07 3 Don't know 2.0 1.3 0.33 3 Total 4 3.5 0.12 538
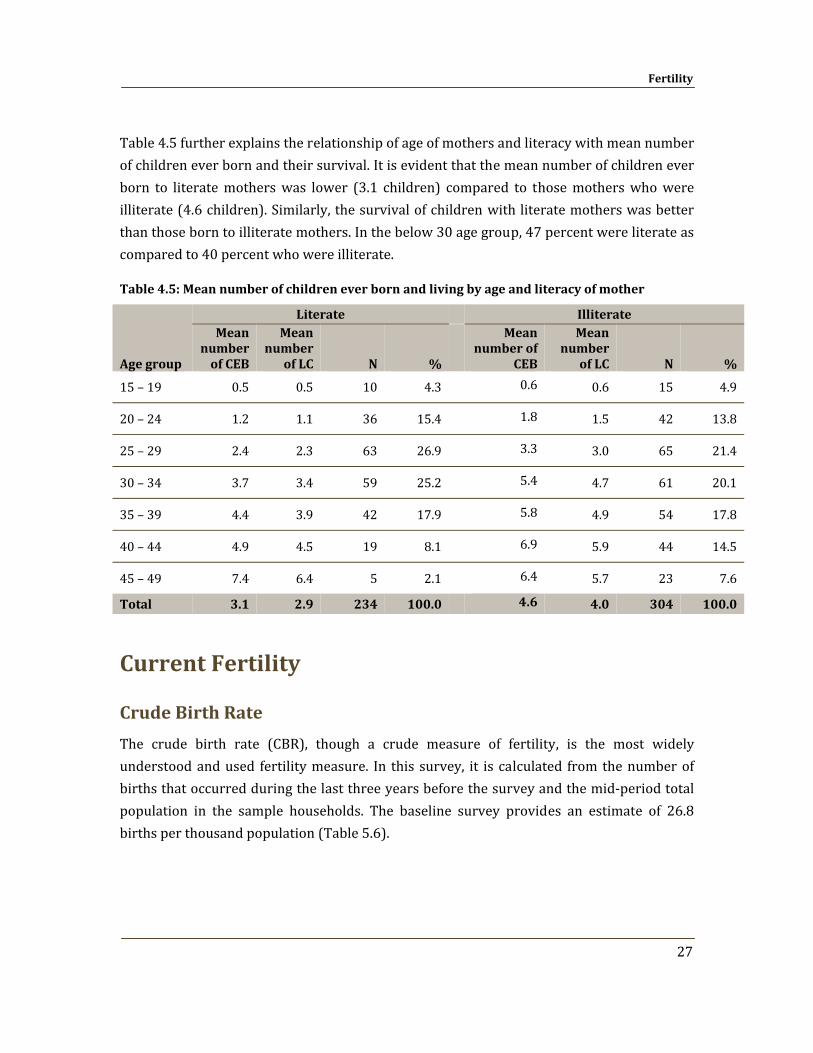
Fertility
27
Table 4.5 further explains the relationship of age of mothers and literacy with mean number of children ever born and their survival. It is evident that the mean number of children ever born to literate mothers was lower (3.1 children) compared to those mothers who were illiterate (4.6 children). Similarly, the survival of children with literate mothers was better than those born to illiterate mothers. In the below 30 age group, 47 percent were literate as compared to 40 percent who were illiterate.
Table 4.5: Mean number of children ever born and living by age and literacy of mother
Age group
Literate
Illiterate Mean
number of CEB
Mean number
of LC N %
Mean number of
CEB
Mean number
of LC N %
15 – 19 0.5 0.5 10 4.3 0.6 0.6 15 4.9
20 – 24 1.2 1.1 36 15.4 1.8 1.5 42 13.8
25 – 29 2.4 2.3 63 26.9 3.3 3.0 65 21.4
30 – 34 3.7 3.4 59 25.2 5.4 4.7 61 20.1
35 – 39 4.4 3.9 42 17.9 5.8 4.9 54 17.8
40 – 44 4.9 4.5 19 8.1 6.9 5.9 44 14.5
45 – 49 7.4 6.4 5 2.1 6.4 5.7 23 7.6
Total 3.1 2.9 234 100.0
4.6 4.0 304 100.0
Current Fertility
Crude Birth Rate
The crude birth rate (CBR), though a crude measure of fertility, is the most widely understood and used fertility measure. In this survey, it is calculated from the number of births that occurred during the last three years before the survey and the mid‐period total population in the sample households. The baseline survey provides an estimate of 26.8 births per thousand population (Table 5.6).
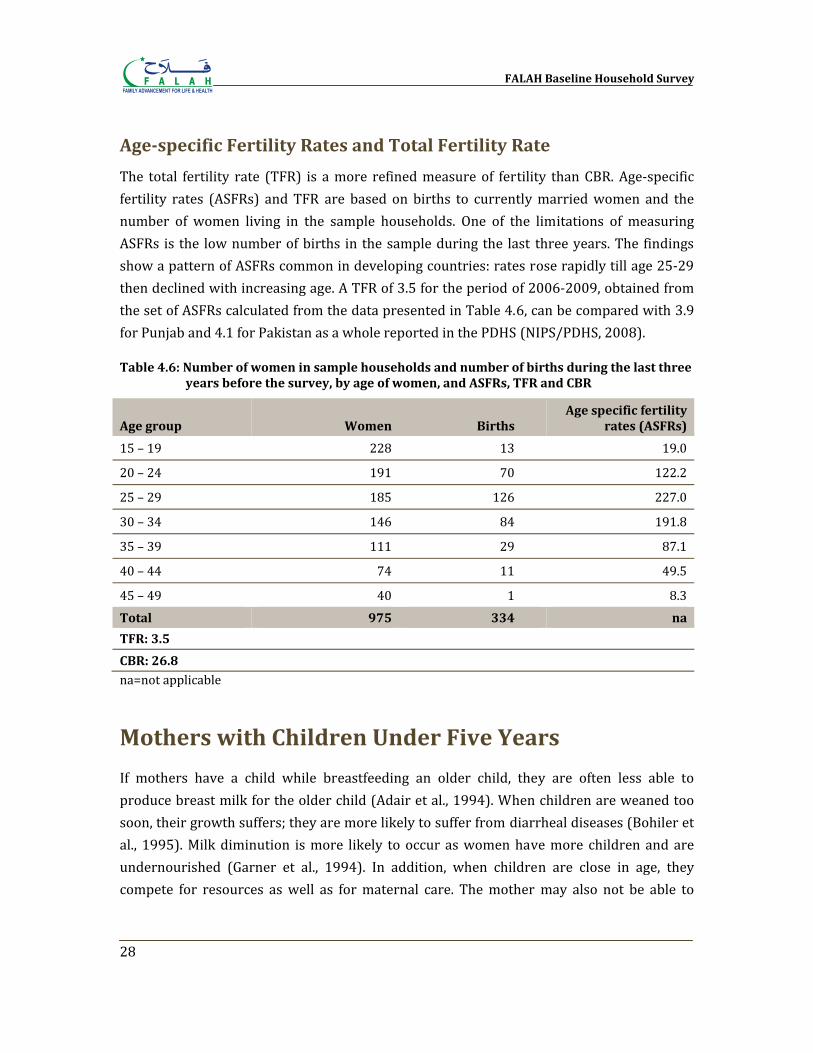
FALAH Baseline Household Survey
28
Agespecific Fertility Rates and Total Fertility Rate
The total fertility rate (TFR) is a more refined measure of fertility than CBR. Age‐specific fertility rates (ASFRs) and TFR are based on births to currently married women and the number of women living in the sample households. One of the limitations of measuring ASFRs is the low number of births in the sample during the last three years. The findings show a pattern of ASFRs common in developing countries: rates rose rapidly till age 25‐29 then declined with increasing age. A TFR of 3.5 for the period of 2006‐2009, obtained from the set of ASFRs calculated from the data presented in Table 4.6, can be compared with 3.9 for Punjab and 4.1 for Pakistan as a whole reported in the PDHS (NIPS/PDHS, 2008).
Table 4.6: Number of women in sample households and number of births during the last three years before the survey, by age of women, and ASFRs, TFR and CBR
Age group Women Births Age specific fertility
rates (ASFRs)
15 – 19 228 13 19.0
20 – 24 191 70 122.2
25 – 29 185 126 227.0
30 – 34 146 84 191.8
35 – 39 111 29 87.1
40 – 44 74 11 49.5
45 – 49 40 1 8.3Total 975 334 na
TFR: 3.5
CBR: 26.8 na=not applicable
Mothers with Children Under Five Years
If mothers have a child while breastfeeding an older child, they are often less able to produce breast milk for the older child (Adair et al., 1994). When children are weaned too soon, their growth suffers; they are more likely to suffer from diarrheal diseases (Bohiler et al., 1995). Milk diminution is more likely to occur as women have more children and are undernourished (Garner et al., 1994). In addition, when children are close in age, they compete for resources as well as for maternal care. The mother may also not be able to
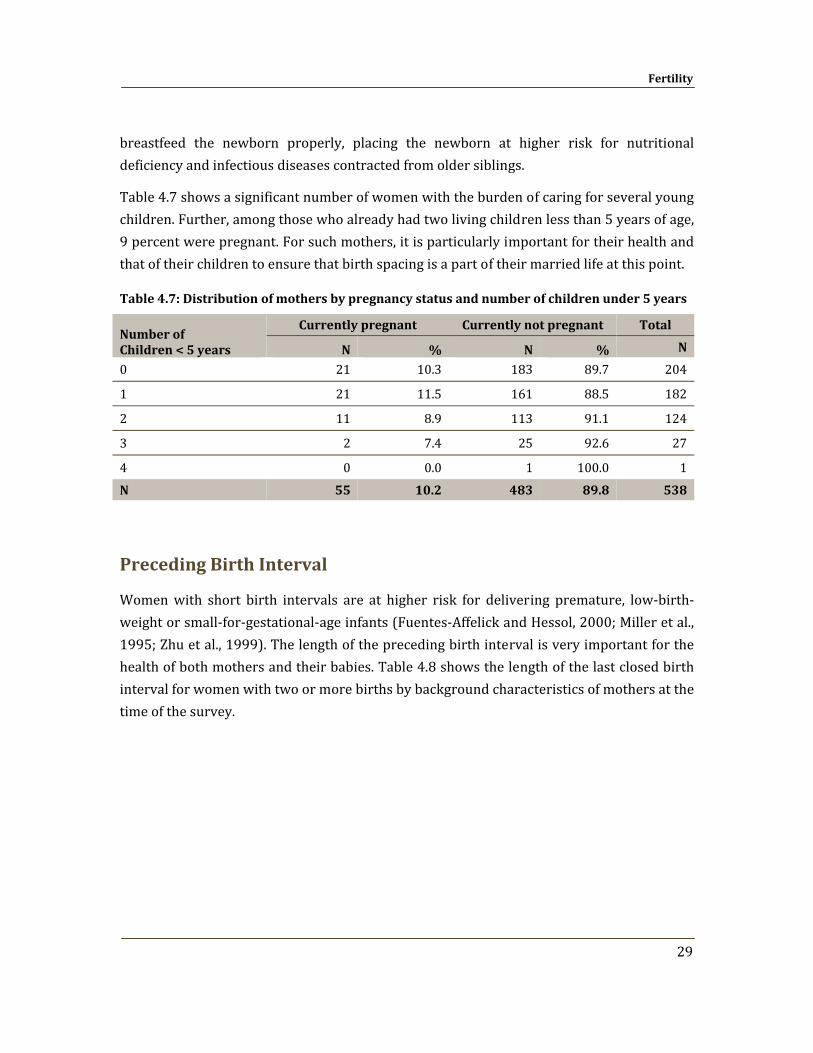
Fertility
29
breastfeed the newborn properly, placing the newborn at higher risk for nutritional deficiency and infectious diseases contracted from older siblings.
Table 4.7 shows a significant number of women with the burden of caring for several young children. Further, among those who already had two living children less than 5 years of age, 9 percent were pregnant. For such mothers, it is particularly important for their health and that of their children to ensure that birth spacing is a part of their married life at this point.
Table 4.7: Distribution of mothers by pregnancy status and number of children under 5 years
Number of Children < 5 years
Currently pregnant Currently not pregnant Total
N % N % N
0 21 10.3 183 89.7 204
1 21 11.5 161 88.5 182
2 11 8.9 113 91.1 124
3 2 7.4 25 92.6 27
4 0 0.0 1 100.0 1N 55 10.2 483 89.8 538
Preceding Birth Interval
Women with short birth intervals are at higher risk for delivering premature, low‐birth‐weight or small‐for‐gestational‐age infants (Fuentes‐Affelick and Hessol, 2000; Miller et al., 1995; Zhu et al., 1999). The length of the preceding birth interval is very important for the health of both mothers and their babies. Table 4.8 shows the length of the last closed birth interval for women with two or more births by background characteristics of mothers at the time of the survey.
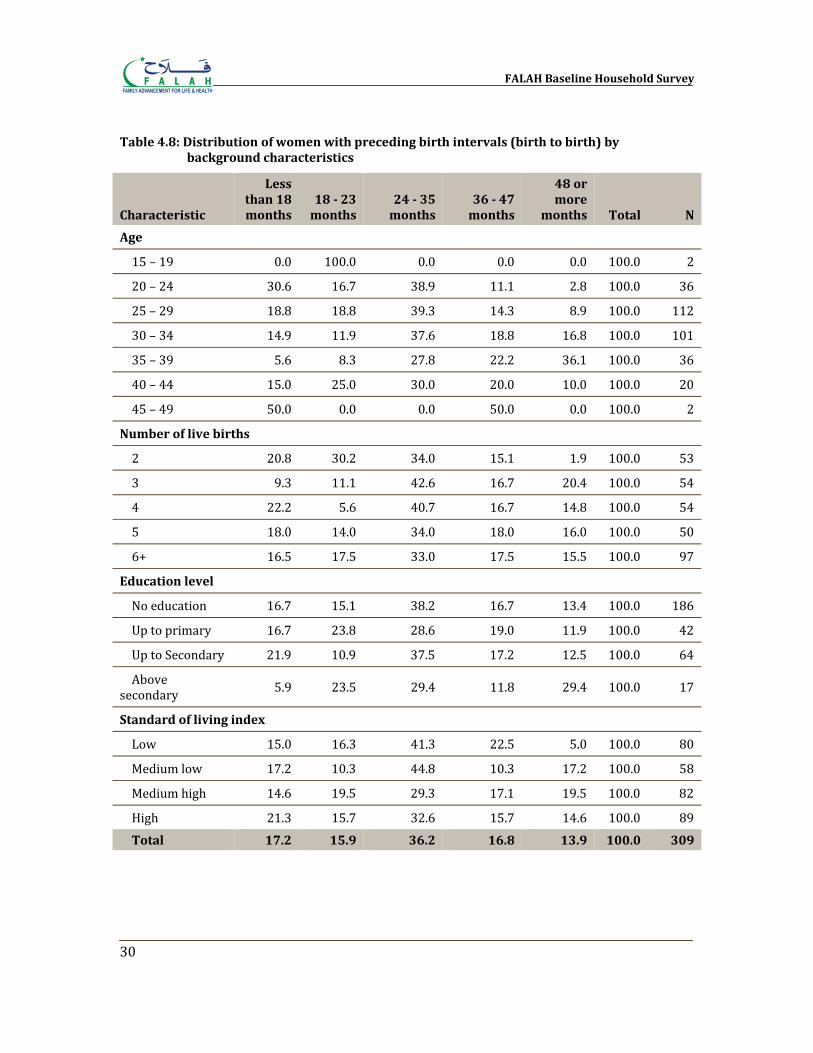
FALAH Baseline Household Survey
30
Table 4.8: Distribution of women with preceding birth intervals (birth to birth) by background characteristics
Characteristic
Less than 18 months
18 23 months
24 35 months
36 47 months
48 or more
months Total N
Age
15 – 19 0.0 100.0 0.0 0.0 0.0 100.0 2
20 – 24 30.6 16.7 38.9 11.1 2.8 100.0 36
25 – 29 18.8 18.8 39.3 14.3 8.9 100.0 112
30 – 34 14.9 11.9 37.6 18.8 16.8 100.0 101
35 – 39 5.6 8.3 27.8 22.2 36.1 100.0 36
40 – 44 15.0 25.0 30.0 20.0 10.0 100.0 20
45 – 49 50.0 0.0 0.0 50.0 0.0 100.0 2
Number of live births
2 20.8 30.2 34.0 15.1 1.9 100.0 53
3 9.3 11.1 42.6 16.7 20.4 100.0 54
4 22.2 5.6 40.7 16.7 14.8 100.0 54
5 18.0 14.0 34.0 18.0 16.0 100.0 50
6+ 16.5 17.5 33.0 17.5 15.5 100.0 97
Education level
No education 16.7 15.1 38.2 16.7 13.4 100.0 186
Up to primary 16.7 23.8 28.6 19.0 11.9 100.0 42
Up to Secondary 21.9 10.9 37.5 17.2 12.5 100.0 64
Above secondary 5.9 23.5 29.4 11.8 29.4 100.0 17
Standard of living index
Low 15.0 16.3 41.3 22.5 5.0 100.0 80
Medium low 17.2 10.3 44.8 10.3 17.2 100.0 58
Medium high 14.6 19.5 29.3 17.1 19.5 100.0 82
High 21.3 15.7 32.6 15.7 14.6 100.0 89Total 17.2 15.9 36.2 16.8 13.9 100.0 309
Fertility
31
A short interval has traditionally been viewed as a risk factor for poor pregnancy outcomes, particularly neonatal mortality, in developing countries (Cleland and Sathar, 1984). It has been observed in several studies that the death risks of an index child whose birth closes a short birth interval are higher than those experienced by an index child whose birth closes a longer birth interval (Mahmood, 2002). It has been found that children born within the preceding interval of 18 months experienced higher mortality risks during infancy than those born in an interval of two to three years (Cleland and Sathar, 1984).
Table 4.8 shows that 17 percent of children were born with a birth interval of less than 18 months. Sixty‐nine percent were born with a birth interval of less than 36 months, while 31 percent were born after three years or more. The differentials by mother’s age, educational level and standard of living index are also shown.

Chapter 5
Maternal and Neonatal Care
Birth spacing is an integral part of maternal and neonatal care. Adequate spacing of births improves the health of mothers and babies; at the same time, the survival of mothers and babies allows for longer birth intervals. In this survey, a small battery of questions was asked regarding the most recent child born during the past four years, reflecting some of the essential indicators of maternal and neonatal care. A total of 304 women out of 538 women interviewed had borne a child during the past four years, and these women were asked additional questions about maternal and neonatal care.
Antenatal Care Antenatal check‐ups allow for skilled health personnel to advise expecting mothers as to how to best take care of themselves and their unborn baby during pregnancy, to prepare them for childbirth and care of the newborn, and to identify possible problems during both pregnancy and delivery. The Ministry of Health recommends at least three antenatal visits during pregnancy, preferably four. Traditionally, many women, understanding childbirth as a natural experience and perhaps not finding health providers nearby, have not gone to skilled providers for antenatal care, but in recent years those proportions have been increasing in Pakistan. Table 5.1 and Figure 5.1 show the number of ANC visits for the last birth of women who had delivered during the previous four years. About 68 percent of the sample respondents had received at least one antenatal care visit during the last pregnancy. Thirty‐three percent had at least three such visits and 23 percent had four or more ANC visits.
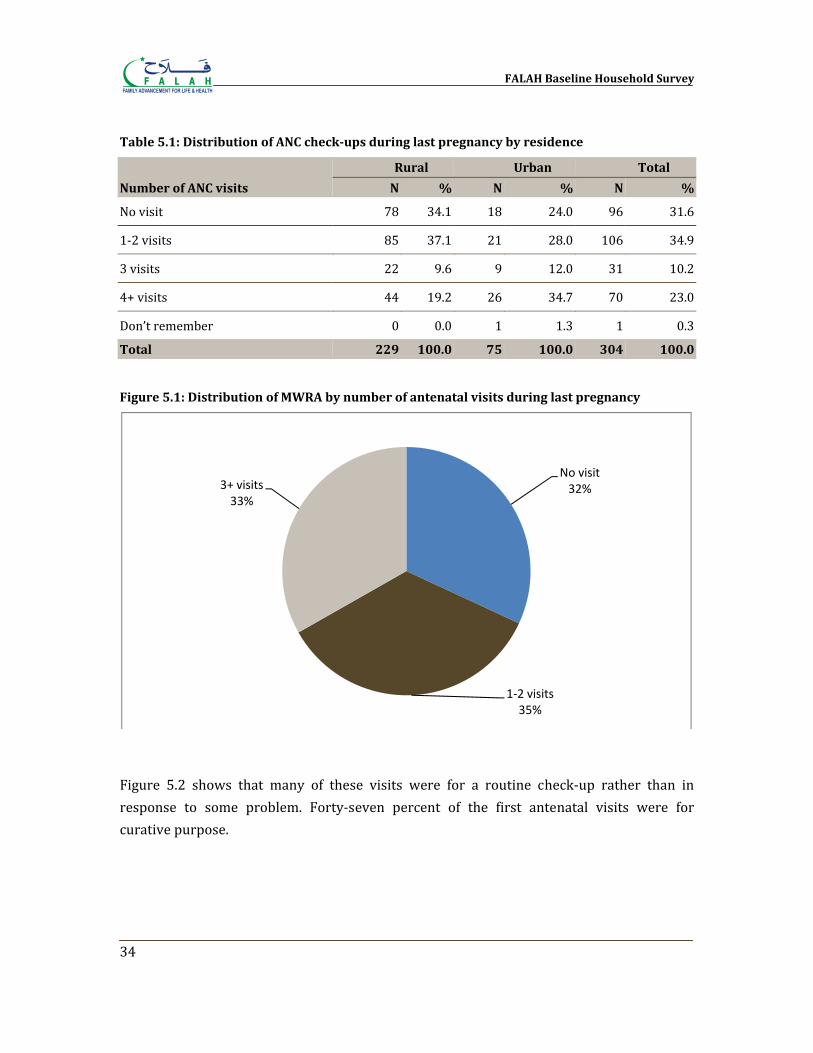
FALAH Baseline Household Survey
34
Table 5.1: Distribution of ANC checkups during last pregnancy by residence
Number of ANC visits
Rural Urban Total
N % N % N %
No visit 78 34.1 18 24.0 96 31.6
1‐2 visits 85 37.1 21 28.0 106 34.9
3 visits 22 9.6 9 12.0 31 10.2
4+ visits 44 19.2 26 34.7 70 23.0
Don’t remember 0 0.0 1 1.3 1 0.3
Total 229 100.0 75 100.0 304 100.0
Figure 5.1: Distribution of MWRA by number of antenatal visits during last pregnancy
Figure 5.2 shows that many of these visits were for a routine check‐up rather than in response to some problem. Forty‐seven percent of the first antenatal visits were for curative purpose.
No visit32%
1‐2 visits35%
3+ visits33%
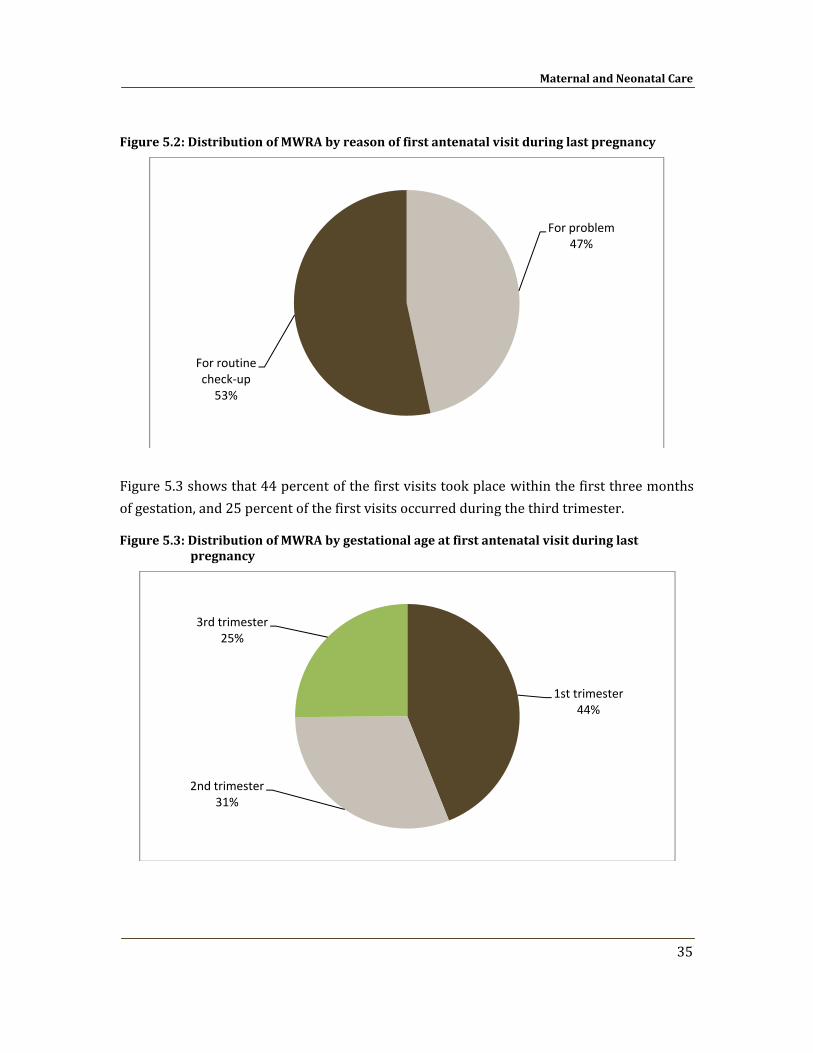
Maternal and Neonatal Care
35
Figure 5.2: Distribution of MWRA by reason of first antenatal visit during last pregnancy
Figure 5.3 shows that 44 percent of the first visits took place within the first three months of gestation, and 25 percent of the first visits occurred during the third trimester.
Figure 5.3: Distribution of MWRA by gestational age at first antenatal visit during last pregnancy
For problem47%
For routine check‐up53%
1st trimester44%
2nd trimester31%
3rd trimester25%
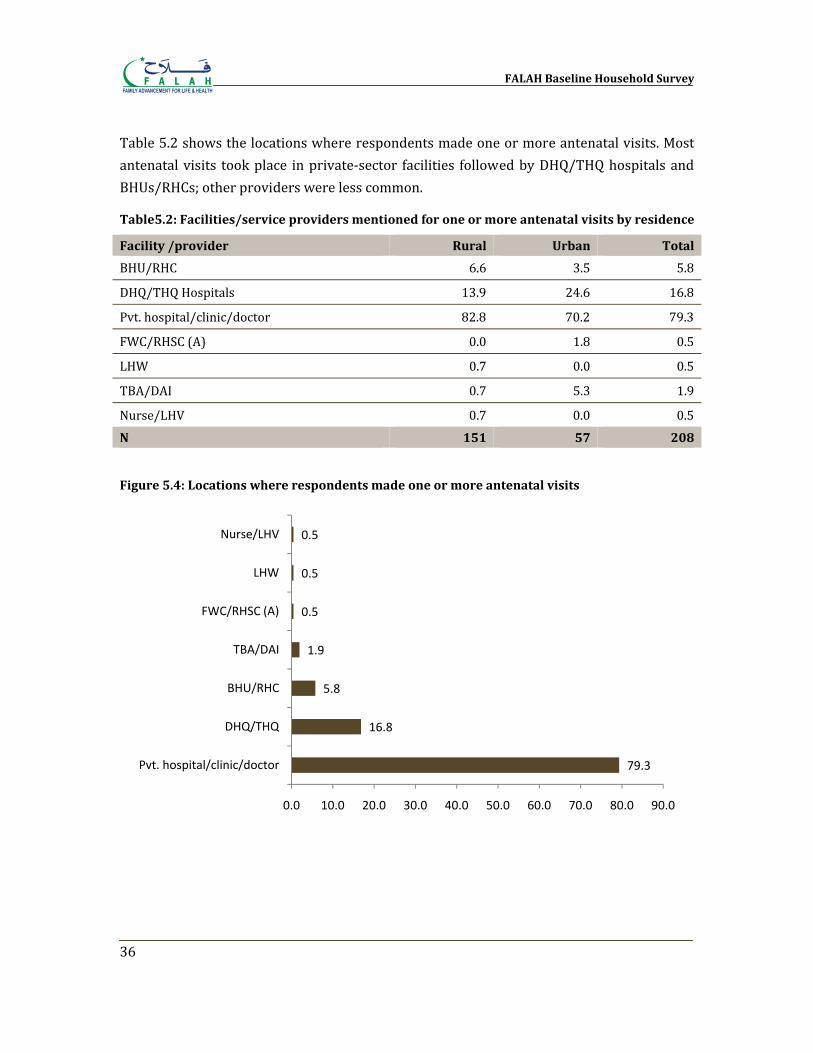
FALAH Baseline Household Survey
36
Table 5.2 shows the locations where respondents made one or more antenatal visits. Most antenatal visits took place in private‐sector facilities followed by DHQ/THQ hospitals and BHUs/RHCs; other providers were less common.
Table5.2: Facilities/service providers mentioned for one or more antenatal visits by residence
Facility /provider Rural Urban Total
BHU/RHC 6.6 3.5 5.8
DHQ/THQ Hospitals 13.9 24.6 16.8
Pvt. hospital/clinic/doctor 82.8 70.2 79.3
FWC/RHSC (A) 0.0 1.8 0.5
LHW 0.7 0.0 0.5
TBA/DAI 0.7 5.3 1.9
Nurse/LHV 0.7 0.0 0.5N 151 57 208
Figure 5.4: Locations where respondents made one or more antenatal visits
79.3
16.8
5.8
1.9
0.5
0.5
0.5
0.0 10.0 20.0 30.0 40.0 50.0 60.0 70.0 80.0 90.0
Pvt. hospital/clinic/doctor
DHQ/THQ
BHU/RHC
TBA/DAI
FWC/RHSC (A)
LHW
Nurse/LHV
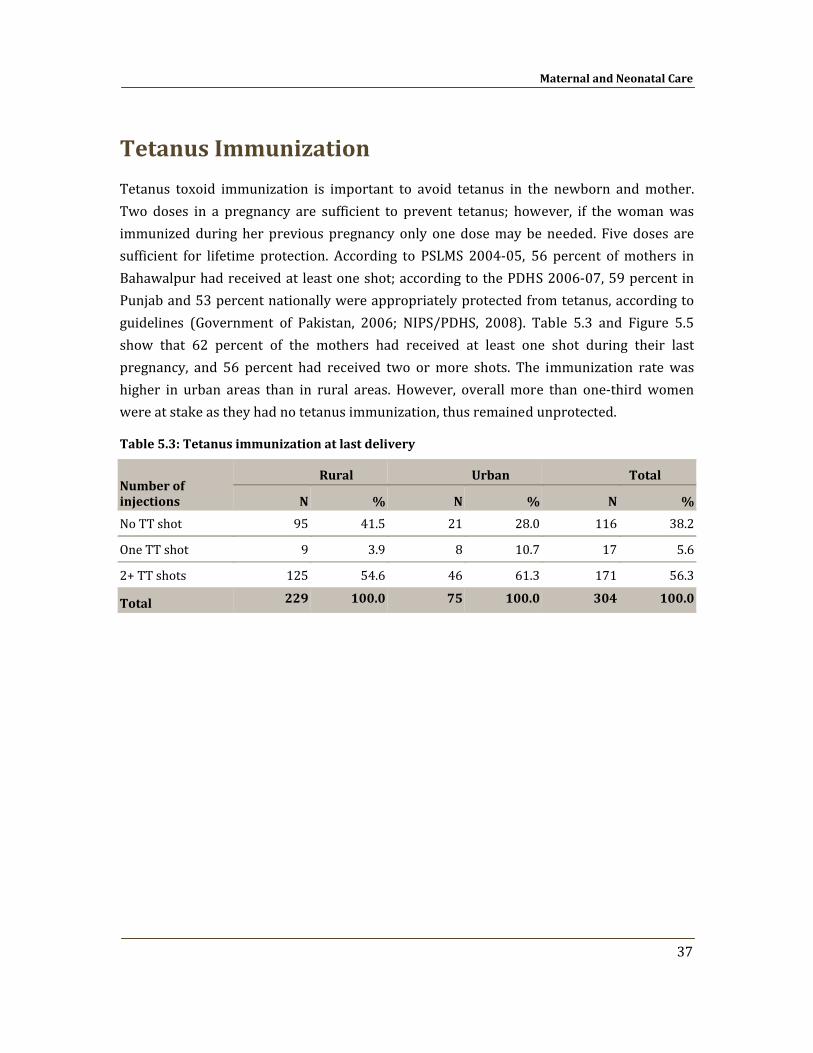
Maternal and Neonatal Care
37
Tetanus Immunization
Tetanus toxoid immunization is important to avoid tetanus in the newborn and mother. Two doses in a pregnancy are sufficient to prevent tetanus; however, if the woman was immunized during her previous pregnancy only one dose may be needed. Five doses are sufficient for lifetime protection. According to PSLMS 2004‐05, 56 percent of mothers in Bahawalpur had received at least one shot; according to the PDHS 2006‐07, 59 percent in Punjab and 53 percent nationally were appropriately protected from tetanus, according to guidelines (Government of Pakistan, 2006; NIPS/PDHS, 2008). Table 5.3 and Figure 5.5 show that 62 percent of the mothers had received at least one shot during their last pregnancy, and 56 percent had received two or more shots. The immunization rate was higher in urban areas than in rural areas. However, overall more than one‐third women were at stake as they had no tetanus immunization, thus remained unprotected.
Table 5.3: Tetanus immunization at last delivery
Number of injections
Rural Urban Total
N % N % N %
No TT shot 95 41.5 21 28.0 116 38.2
One TT shot 9 3.9 8 10.7 17 5.6
2+ TT shots 125 54.6 46 61.3 171 56.3
Total 229 100.0 75 100.0 304 100.0
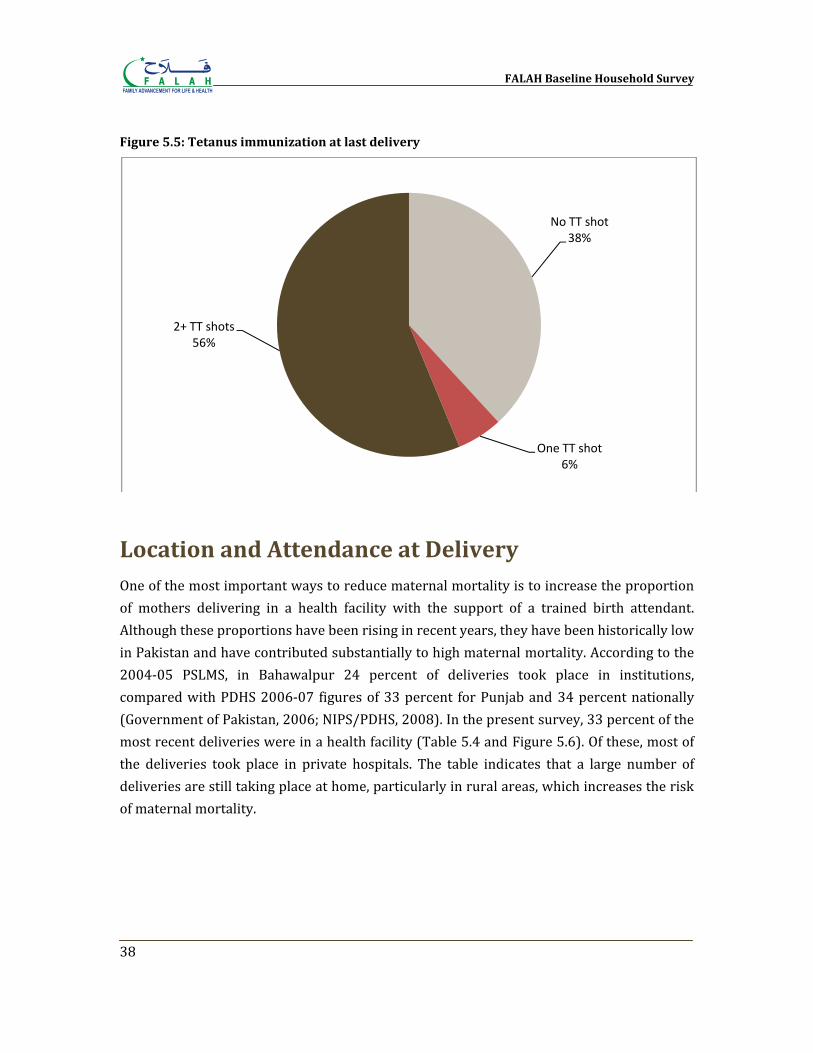
FALAH Baseline Household Survey
38
Figure 5.5: Tetanus immunization at last delivery
Location and Attendance at Delivery One of the most important ways to reduce maternal mortality is to increase the proportion of mothers delivering in a health facility with the support of a trained birth attendant. Although these proportions have been rising in recent years, they have been historically low in Pakistan and have contributed substantially to high maternal mortality. According to the 2004‐05 PSLMS, in Bahawalpur 24 percent of deliveries took place in institutions, compared with PDHS 2006‐07 figures of 33 percent for Punjab and 34 percent nationally (Government of Pakistan, 2006; NIPS/PDHS, 2008). In the present survey, 33 percent of the most recent deliveries were in a health facility (Table 5.4 and Figure 5.6). Of these, most of the deliveries took place in private hospitals. The table indicates that a large number of deliveries are still taking place at home, particularly in rural areas, which increases the risk of maternal mortality.
No TT shot38%
One TT shot6%
2+ TT shots56%
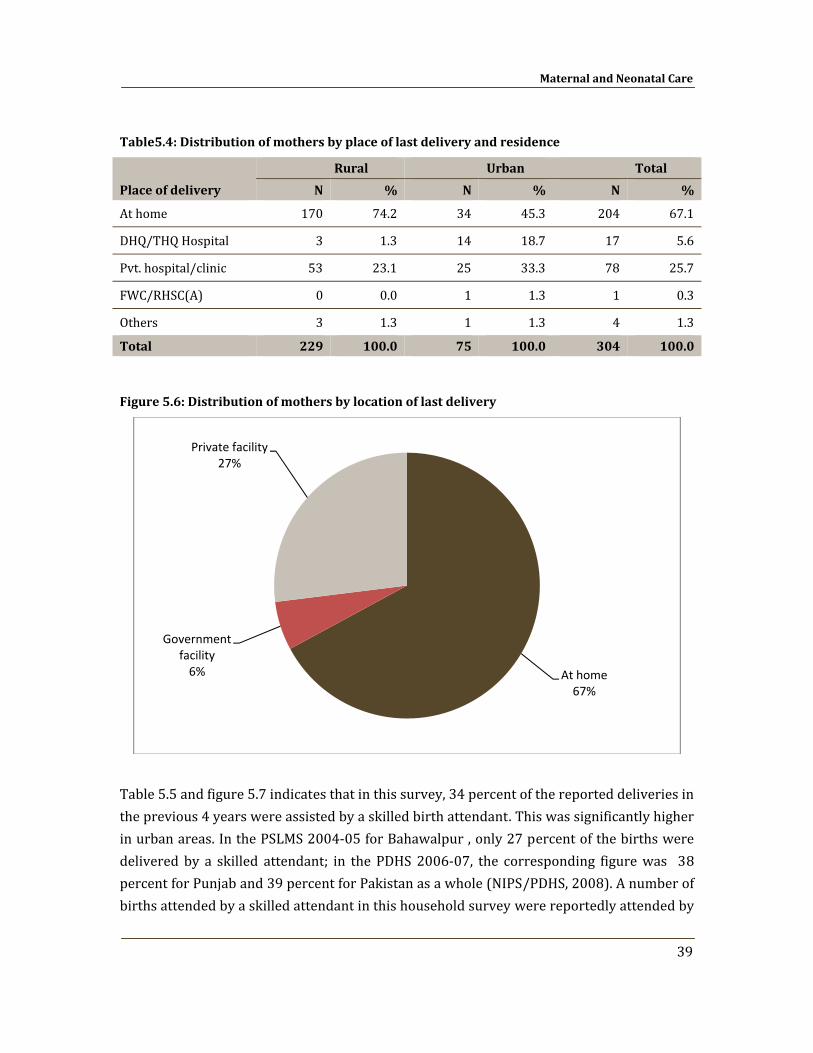
Maternal and Neonatal Care
39
Table5.4: Distribution of mothers by place of last delivery and residence
Place of delivery Rural Urban Total
N % N % N %
At home 170 74.2 34 45.3 204 67.1
DHQ/THQ Hospital 3 1.3 14 18.7 17 5.6
Pvt. hospital/clinic 53 23.1 25 33.3 78 25.7
FWC/RHSC(A) 0 0.0 1 1.3 1 0.3
Others 3 1.3 1 1.3 4 1.3
Total 229 100.0 75 100.0 304 100.0
Figure 5.6: Distribution of mothers by location of last delivery
Table 5.5 and figure 5.7 indicates that in this survey, 34 percent of the reported deliveries in the previous 4 years were assisted by a skilled birth attendant. This was significantly higher in urban areas. In the PSLMS 2004‐05 for Bahawalpur , only 27 percent of the births were delivered by a skilled attendant; in the PDHS 2006‐07, the corresponding figure was 38 percent for Punjab and 39 percent for Pakistan as a whole (NIPS/PDHS, 2008). A number of births attended by a skilled attendant in this household survey were reportedly attended by
At home67%
Government facility6%
Private facility27%
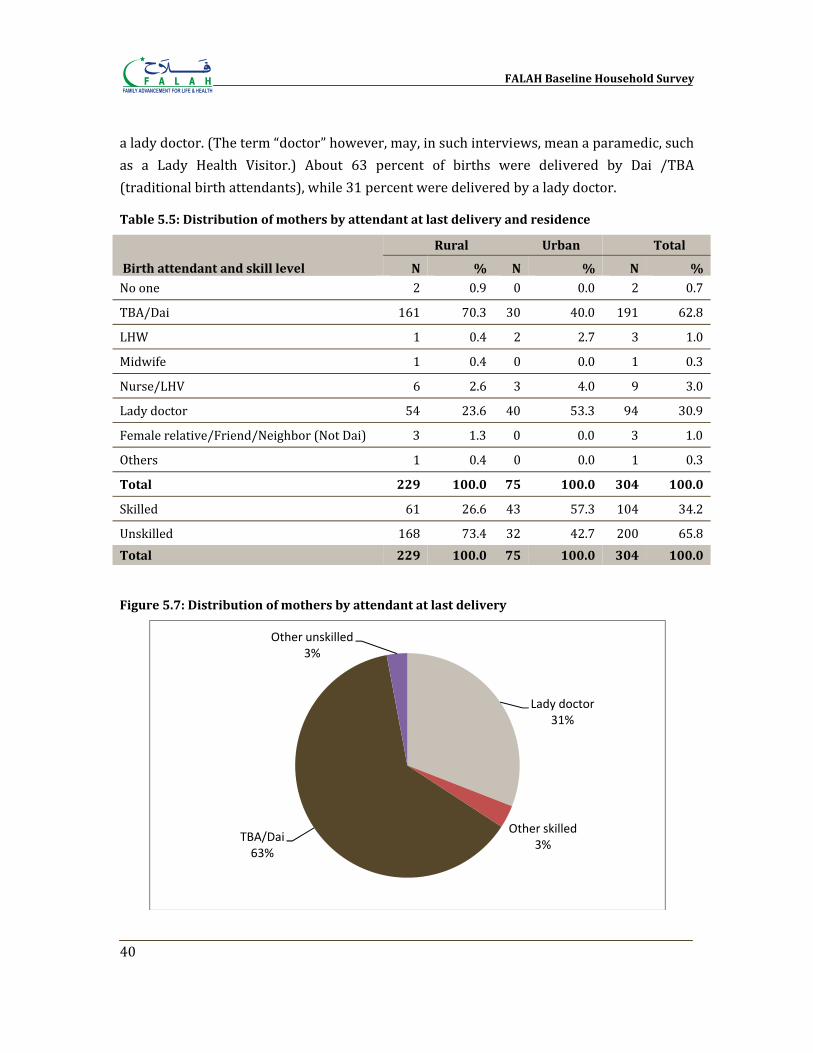
FALAH Baseline Household Survey
40
a lady doctor. (The term “doctor” however, may, in such interviews, mean a paramedic, such as a Lady Health Visitor.) About 63 percent of births were delivered by Dai /TBA (traditional birth attendants), while 31 percent were delivered by a lady doctor.
Table 5.5: Distribution of mothers by attendant at last delivery and residence
Birth attendant and skill level
Rural Urban Total
N % N % N %
No one 2 0.9 0 0.0 2 0.7
TBA/Dai 161 70.3 30 40.0 191 62.8
LHW 1 0.4 2 2.7 3 1.0
Midwife 1 0.4 0 0.0 1 0.3
Nurse/LHV 6 2.6 3 4.0 9 3.0
Lady doctor 54 23.6 40 53.3 94 30.9
Female relative/Friend/Neighbor (Not Dai) 3 1.3 0 0.0 3 1.0
Others 1 0.4 0 0.0 1 0.3
Total 229 100.0 75 100.0 304 100.0
Skilled 61 26.6 43 57.3 104 34.2
Unskilled 168 73.4 32 42.7 200 65.8Total 229 100.0 75 100.0 304 100.0
Figure 5.7: Distribution of mothers by attendant at last delivery
Lady doctor31%
Other skilled3%
TBA/Dai63%
Other unskilled3%
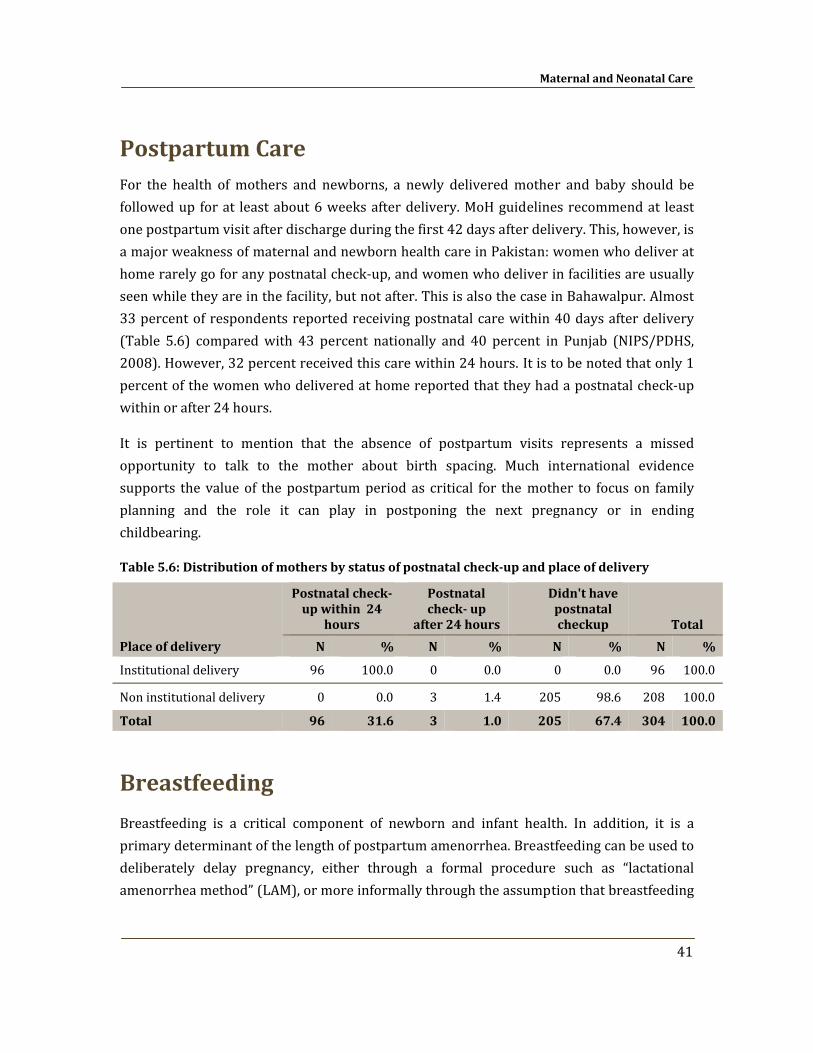
Maternal and Neonatal Care
41
Postpartum Care For the health of mothers and newborns, a newly delivered mother and baby should be followed up for at least about 6 weeks after delivery. MoH guidelines recommend at least one postpartum visit after discharge during the first 42 days after delivery. This, however, is a major weakness of maternal and newborn health care in Pakistan: women who deliver at home rarely go for any postnatal check‐up, and women who deliver in facilities are usually seen while they are in the facility, but not after. This is also the case in Bahawalpur. Almost 33 percent of respondents reported receiving postnatal care within 40 days after delivery (Table 5.6) compared with 43 percent nationally and 40 percent in Punjab (NIPS/PDHS, 2008). However, 32 percent received this care within 24 hours. It is to be noted that only 1 percent of the women who delivered at home reported that they had a postnatal check‐up within or after 24 hours.
It is pertinent to mention that the absence of postpartum visits represents a missed opportunity to talk to the mother about birth spacing. Much international evidence supports the value of the postpartum period as critical for the mother to focus on family planning and the role it can play in postponing the next pregnancy or in ending childbearing.
Table 5.6: Distribution of mothers by status of postnatal checkup and place of delivery
Place of delivery
Postnatal check up within 24
hours
Postnatal check up
after 24 hours
Didn't have postnatal checkup Total
N % N % N % N %
Institutional delivery 96 100.0 0 0.0 0 0.0 96 100.0
Non institutional delivery 0 0.0 3 1.4 205 98.6 208 100.0
Total 96 31.6 3 1.0 205 67.4 304 100.0
Breastfeeding
Breastfeeding is a critical component of newborn and infant health. In addition, it is a primary determinant of the length of postpartum amenorrhea. Breastfeeding can be used to deliberately delay pregnancy, either through a formal procedure such as “lactational amenorrhea method” (LAM), or more informally through the assumption that breastfeeding
FALAH Baseline Household Survey
42
protects against pregnancy. Virtually all Pakistani women breastfeed their children to some extent; in our sample, only 15 of 287 respondents reported not having breastfed their last child at all. Breastfeeding is normally done for a substantial period of time; the median length of breastfeeding for the last baby (not currently being breastfed) was 18 months. Five main reasons were given for discontinuing breastfeeding: poor health of mother or child (27 percent); child was old enough (26 percent); no or insufficient milk (20 percent) ; mother became pregnant (11 percent) and child stopped (10 percent).
Figure 5.8: Distribution of mothers by reasons for discontinuing breastfeeding (N=121)
No/Insufficient milk20%
Poor health of mother/child
27%
Child was old enough to
stop/Switched to another food
26%
Became pregnant11%
Child stopped10%
Others6%
Chapter 6
Preference for Children
In order to meet the family planning needs of couples, it is essential to understand how they feel about the number and timing of children they want. Couples’ views typically evolve over the course of their reproductive years; in the beginning, they want their first children quickly, while toward the end of their reproductive lives, they are quite sure they want to stop. At some point in the middle, they may go through a period of ambivalence where their views are uncertain and conflicted. Husbands and wives may or may not agree on these matters, and may or may not communicate well. Often it is difficult to learn what couples truly feel about these issues because they themselves may not be certain. We can, however, ask questions, record responses, and investigate in as much depth as possible.
Ideal Number of Children One way of investigating fertility preference is to ask respondents, regardless of current fertility status, how many children they would ideally want. The exact wording, asked of female respondents is (English translation): “If you could choose exactly the number of children to have in your whole life, how many would that be?” Table 6.1 shows the responses.
The median “ideal” number, in the sense indicated above, was 4 children; 75 percent of the respondents wanted 4 or fewer children. However, only 10 percent said they wanted 2 children. These proportions varied according to residence; 1 percent urban women gave non–numeric answers while 3 percent of the rural women responded in non‐numeric answers to the ideal number of children they would like to have.
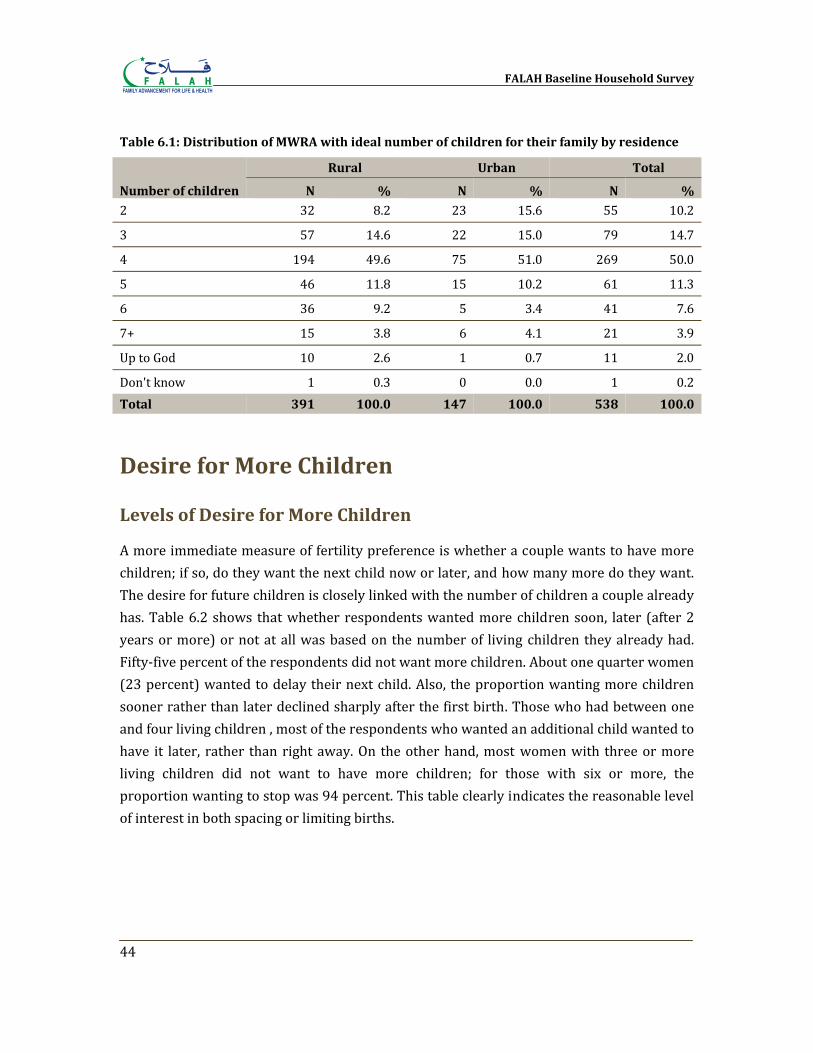
FALAH Baseline Household Survey
44
Table 6.1: Distribution of MWRA with ideal number of children for their family by residence
Number of children
Rural Urban Total
N % N % N %
2 32 8.2 23 15.6 55 10.2
3 57 14.6 22 15.0 79 14.7
4 194 49.6 75 51.0 269 50.0
5 46 11.8 15 10.2 61 11.3
6 36 9.2 5 3.4 41 7.6
7+ 15 3.8 6 4.1 21 3.9
Up to God 10 2.6 1 0.7 11 2.0
Don't know 1 0.3 0 0.0 1 0.2Total 391 100.0 147 100.0 538 100.0
Desire for More Children
Levels of Desire for More Children
A more immediate measure of fertility preference is whether a couple wants to have more children; if so, do they want the next child now or later, and how many more do they want. The desire for future children is closely linked with the number of children a couple already has. Table 6.2 shows that whether respondents wanted more children soon, later (after 2 years or more) or not at all was based on the number of living children they already had. Fifty‐five percent of the respondents did not want more children. About one quarter women (23 percent) wanted to delay their next child. Also, the proportion wanting more children sooner rather than later declined sharply after the first birth. Those who had between one and four living children , most of the respondents who wanted an additional child wanted to have it later, rather than right away. On the other hand, most women with three or more living children did not want to have more children; for those with six or more, the proportion wanting to stop was 94 percent. This table clearly indicates the reasonable level of interest in both spacing or limiting births.
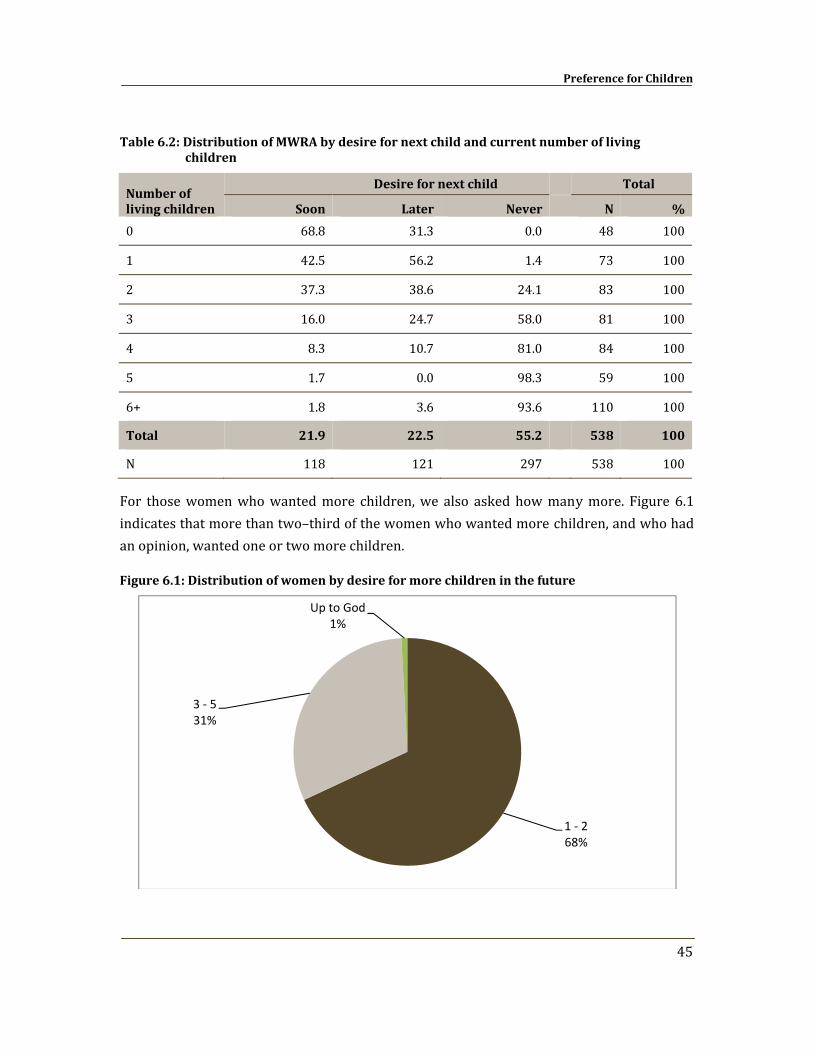
Preference for Children
45
Table 6.2: Distribution of MWRA by desire for next child and current number of living children
Number of living children
Desire for next child
Total
Soon Later Never N %
0 68.8 31.3 0.0 48 100
1 42.5 56.2 1.4 73 100
2 37.3 38.6 24.1 83 100
3 16.0 24.7 58.0 81 100
4 8.3 10.7 81.0 84 100
5 1.7 0.0 98.3 59 100
6+ 1.8 3.6 93.6 110 100
Total 21.9 22.5 55.2
538 100
N 118 121 297 538 100
For those women who wanted more children, we also asked how many more. Figure 6.1 indicates that more than two–third of the women who wanted more children, and who had an opinion, wanted one or two more children.
Figure 6.1: Distribution of women by desire for more children in the future
1 ‐ 268%
3 ‐ 531%
Up to God1%
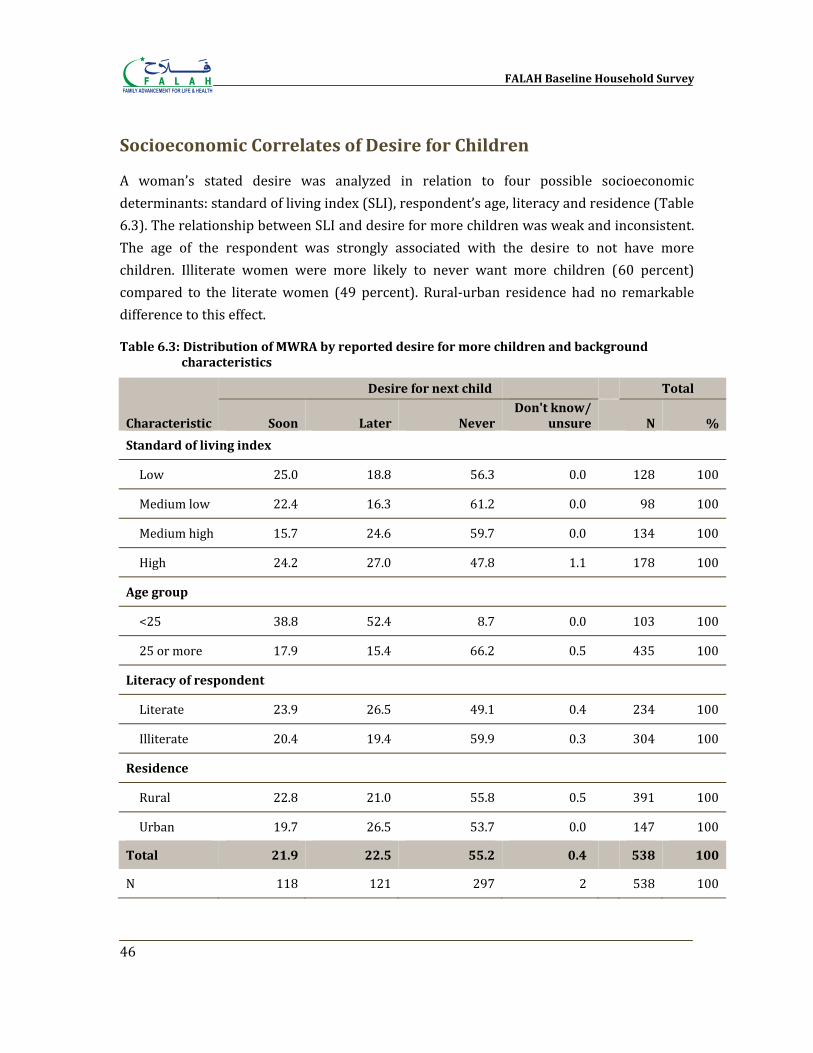
FALAH Baseline Household Survey
46
Socioeconomic Correlates of Desire for Children
A woman’s stated desire was analyzed in relation to four possible socioeconomic determinants: standard of living index (SLI), respondent’s age, literacy and residence (Table 6.3). The relationship between SLI and desire for more children was weak and inconsistent. The age of the respondent was strongly associated with the desire to not have more children. Illiterate women were more likely to never want more children (60 percent) compared to the literate women (49 percent). Rural‐urban residence had no remarkable difference to this effect.
Table 6.3: Distribution of MWRA by reported desire for more children and background characteristics
Characteristic
Desire for next child Total
Soon Later Never Don't know/
unsure N %
Standard of living index
Low 25.0 18.8 56.3 0.0 128 100
Medium low 22.4 16.3 61.2 0.0 98 100
Medium high 15.7 24.6 59.7 0.0 134 100
High 24.2 27.0 47.8 1.1 178 100
Age group
<25 38.8 52.4 8.7 0.0 103 100
25 or more 17.9 15.4 66.2 0.5 435 100
Literacy of respondent
Literate 23.9 26.5 49.1 0.4 234 100
Illiterate 20.4 19.4 59.9 0.3 304 100
Residence
Rural 22.8 21.0 55.8 0.5 391 100
Urban 19.7 26.5 53.7 0.0 147 100
Total 21.9 22.5 55.2 0.4
538 100
N 118 121 297 2 538 100
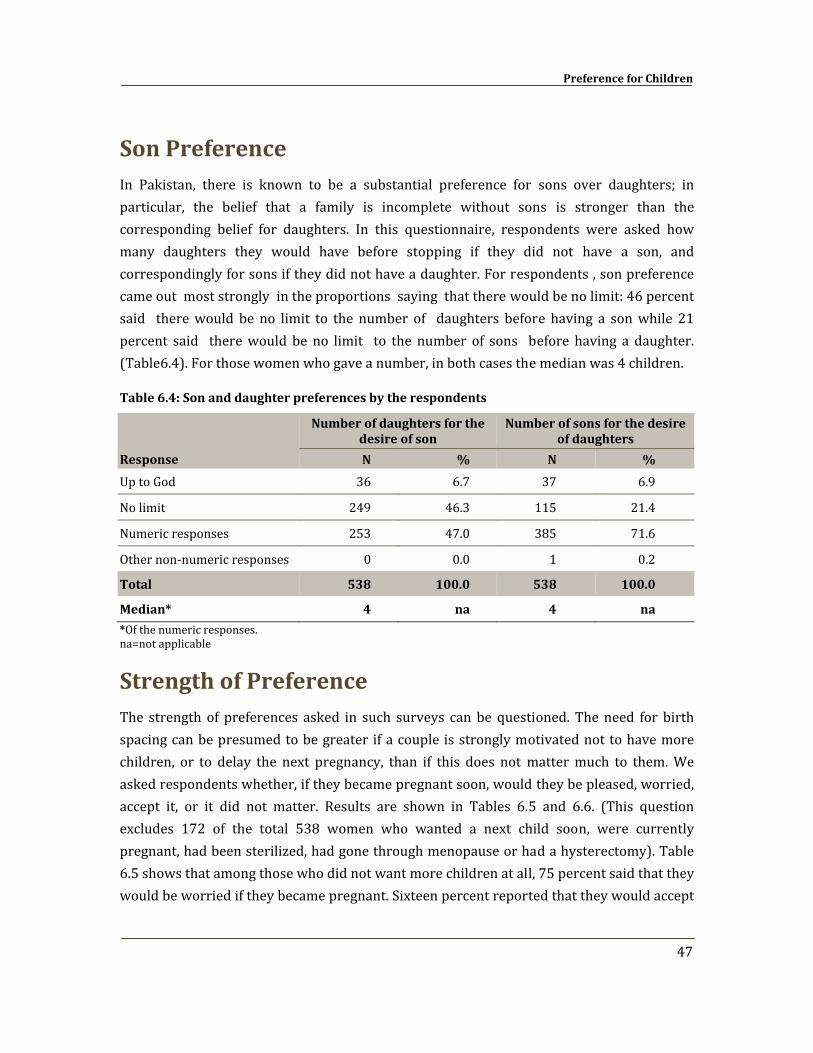
Preference for Children
47
Son Preference In Pakistan, there is known to be a substantial preference for sons over daughters; in particular, the belief that a family is incomplete without sons is stronger than the corresponding belief for daughters. In this questionnaire, respondents were asked how many daughters they would have before stopping if they did not have a son, and correspondingly for sons if they did not have a daughter. For respondents , son preference came out most strongly in the proportions saying that there would be no limit: 46 percent said there would be no limit to the number of daughters before having a son while 21 percent said there would be no limit to the number of sons before having a daughter. (Table6.4). For those women who gave a number, in both cases the median was 4 children.
Table 6.4: Son and daughter preferences by the respondents
Response
Number of daughters for the desire of son
Number of sons for the desire of daughters
N % N %
Up to God 36 6.7 37 6.9
No limit 249 46.3 115 21.4
Numeric responses 253 47.0 385 71.6
Other non‐numeric responses 0 0.0 1 0.2
Total 538 100.0 538 100.0
Median* 4 na 4 na
*Of the numeric responses. na=not applicable
Strength of Preference The strength of preferences asked in such surveys can be questioned. The need for birth spacing can be presumed to be greater if a couple is strongly motivated not to have more children, or to delay the next pregnancy, than if this does not matter much to them. We asked respondents whether, if they became pregnant soon, would they be pleased, worried, accept it, or it did not matter. Results are shown in Tables 6.5 and 6.6. (This question excludes 172 of the total 538 women who wanted a next child soon, were currently pregnant, had been sterilized, had gone through menopause or had a hysterectomy). Table 6.5 shows that among those who did not want more children at all, 75 percent said that they would be worried if they became pregnant. Sixteen percent reported that they would accept
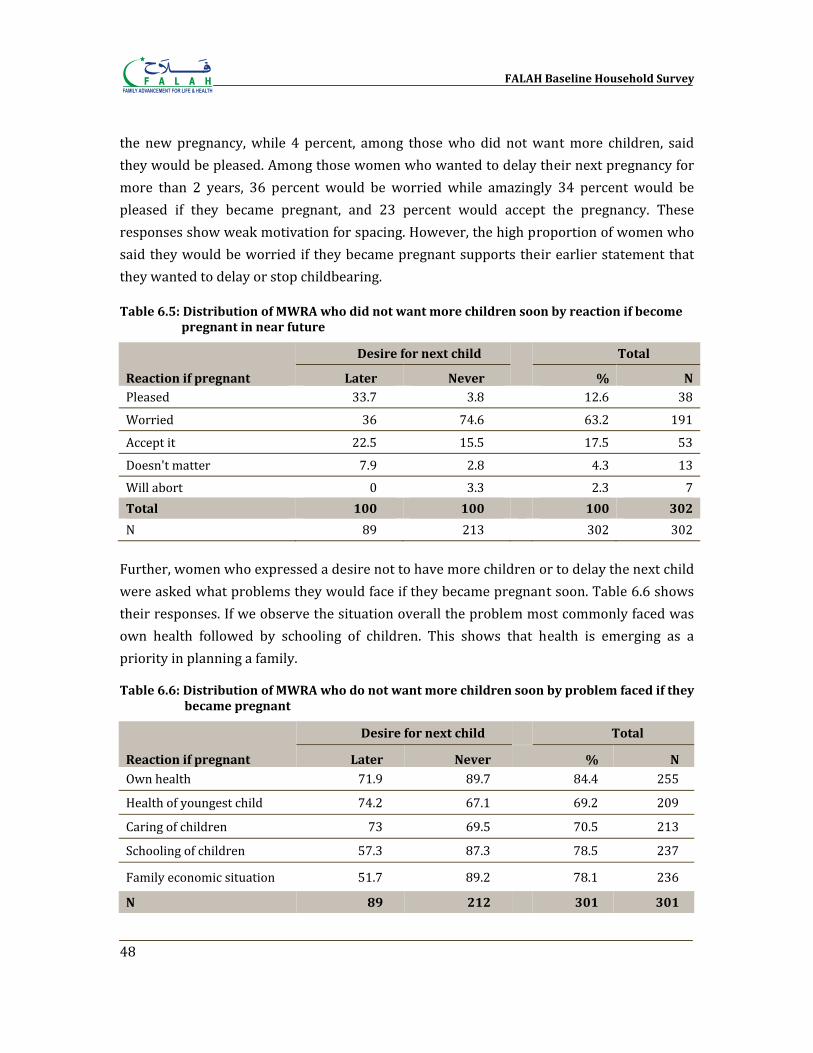
FALAH Baseline Household Survey
48
the new pregnancy, while 4 percent, among those who did not want more children, said they would be pleased. Among those women who wanted to delay their next pregnancy for more than 2 years, 36 percent would be worried while amazingly 34 percent would be pleased if they became pregnant, and 23 percent would accept the pregnancy. These responses show weak motivation for spacing. However, the high proportion of women who said they would be worried if they became pregnant supports their earlier statement that they wanted to delay or stop childbearing.
Table 6.5: Distribution of MWRA who did not want more children soon by reaction if become pregnant in near future
Reaction if pregnant
Desire for next child
Total
Later Never % N Pleased 33.7 3.8 12.6 38
Worried 36 74.6 63.2 191
Accept it 22.5 15.5 17.5 53
Doesn't matter 7.9 2.8 4.3 13Will abort 0 3.3 2.3 7Total 100 100
100 302
N 89 213 302 302 Further, women who expressed a desire not to have more children or to delay the next child were asked what problems they would face if they became pregnant soon. Table 6.6 shows their responses. If we observe the situation overall the problem most commonly faced was own health followed by schooling of children. This shows that health is emerging as a priority in planning a family.
Table 6.6: Distribution of MWRA who do not want more children soon by problem faced if they became pregnant
Reaction if pregnant
Desire for next child
Total
Later Never % N Own health 71.9 89.7 84.4 255
Health of youngest child 74.2 67.1 69.2 209
Caring of children 73 69.5 70.5 213
Schooling of children 57.3 87.3 78.5 237
Family economic situation 51.7 89.2 78.1 236
N 89 212
301 301
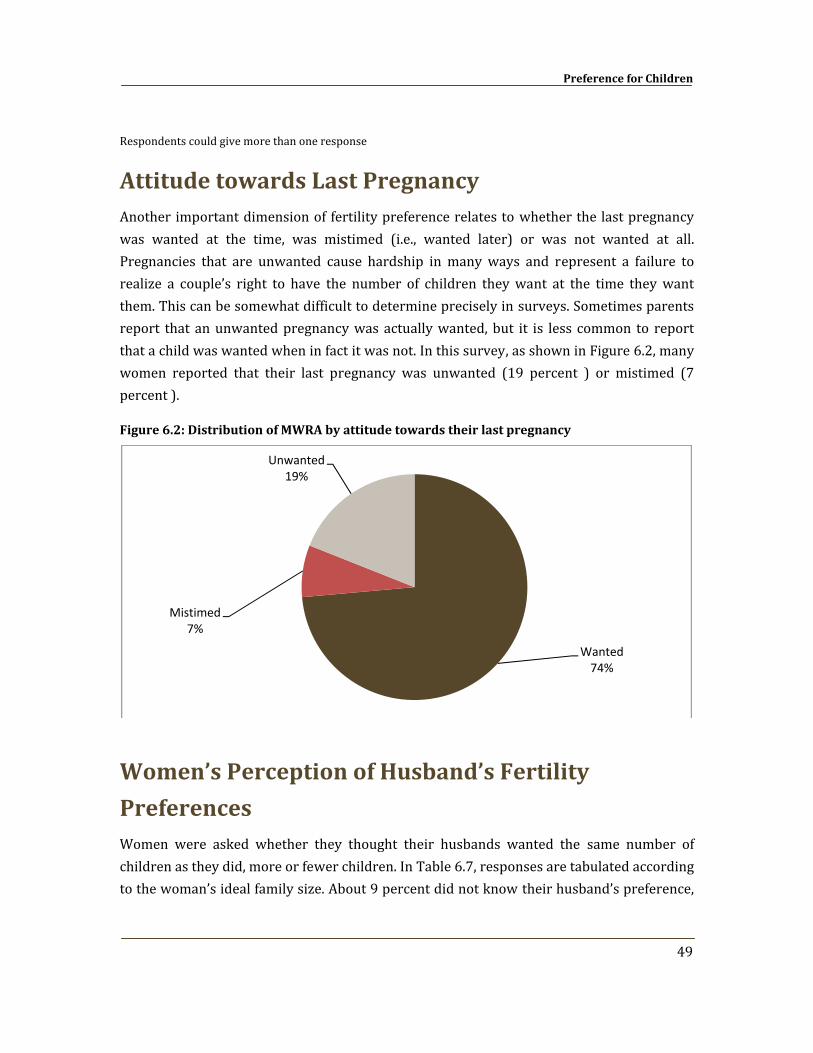
Preference for Children
49
Respondents could give more than one response
Attitude towards Last Pregnancy Another important dimension of fertility preference relates to whether the last pregnancy was wanted at the time, was mistimed (i.e., wanted later) or was not wanted at all. Pregnancies that are unwanted cause hardship in many ways and represent a failure to realize a couple’s right to have the number of children they want at the time they want them. This can be somewhat difficult to determine precisely in surveys. Sometimes parents report that an unwanted pregnancy was actually wanted, but it is less common to report that a child was wanted when in fact it was not. In this survey, as shown in Figure 6.2, many women reported that their last pregnancy was unwanted (19 percent ) or mistimed (7 percent ).
Figure 6.2: Distribution of MWRA by attitude towards their last pregnancy
Women’s Perception of Husband’s Fertility
Preferences Women were asked whether they thought their husbands wanted the same number of children as they did, more or fewer children. In Table 6.7, responses are tabulated according to the woman’s ideal family size. About 9 percent did not know their husband’s preference,
Wanted74%
Mistimed7%
Unwanted19%
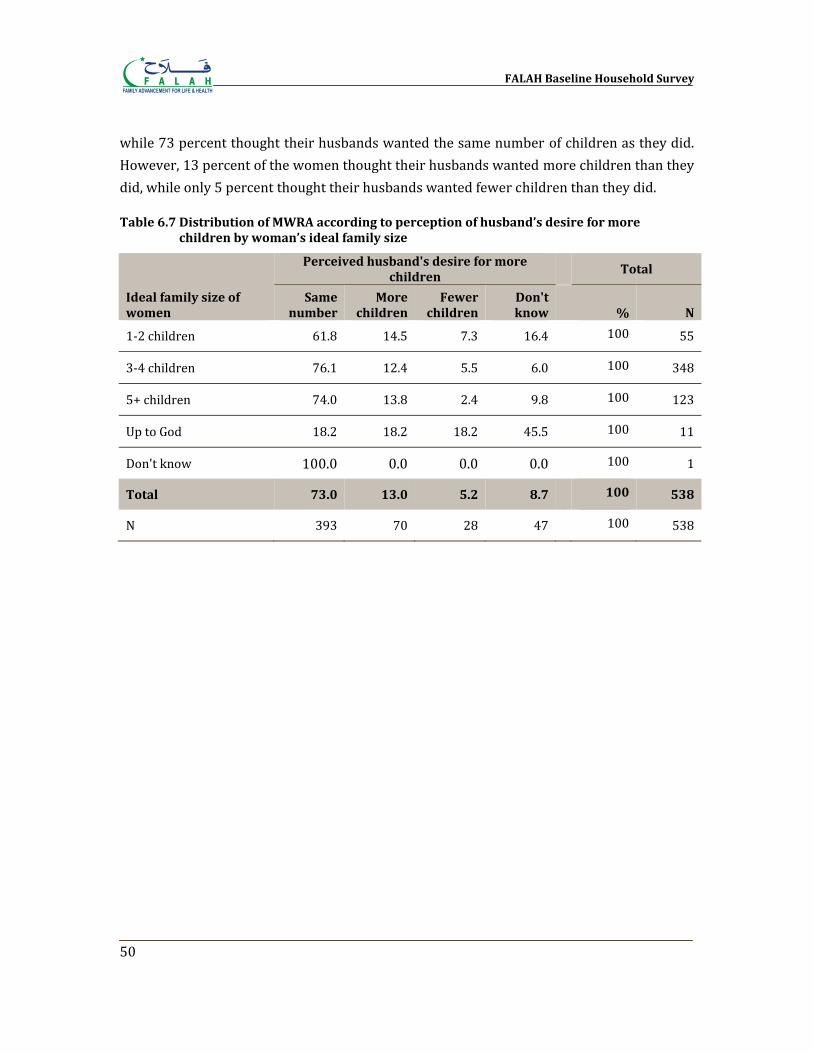
FALAH Baseline Household Survey
50
while 73 percent thought their husbands wanted the same number of children as they did. However, 13 percent of the women thought their husbands wanted more children than they did, while only 5 percent thought their husbands wanted fewer children than they did.
Table 6.7 Distribution of MWRA according to perception of husband’s desire for more children by woman’s ideal family size
Ideal family size of women
Perceived husband's desire for more children
Total
Same number
More children
Fewer children
Don't know % N
1‐2 children 61.8 14.5 7.3 16.4 100 55
3‐4 children 76.1 12.4 5.5 6.0 100 348
5+ children 74.0 13.8 2.4 9.8 100 123
Up to God 18.2 18.2 18.2 45.5 100 11
Don't know 100.0 0.0 0.0 0.0 100 1
Total 73.0 13.0 5.2 8.7
100 538
N 393 70 28 47 100 538
Chapter 7
Contraceptive Knowledge and Use
The FALAH baseline household survey obtained data on contraceptive knowledge and use by first asking what methods respondents knew, if any (spontaneous knowledge). Then, for each method not mentioned, that method was named by the interviewer and described, and the respondent was asked if she knew that method, if she had ever used it, and if she was using it currently. This approach is standard in such surveys in Pakistan and elsewhere. In addition, respondents were asked to report their most recent source for contraceptive methods.
Knowledge
At least 95 percent of married women of reproductive age in Pakistan have known of at least one method of contraception for many years. Table 7.1 shows that this holds true for Bahawalpur as well where almost all respondents knew of at least one FP method. A majority of the female respondents knew of the most commonly used program methods – female sterilization, pills, injections, IUD and condoms. Male sterilization, Norplant, and emergency pills were relatively less known. Natural methods were also less known. Variations in knowledge between rural and urban women are shown in Table 7.1.
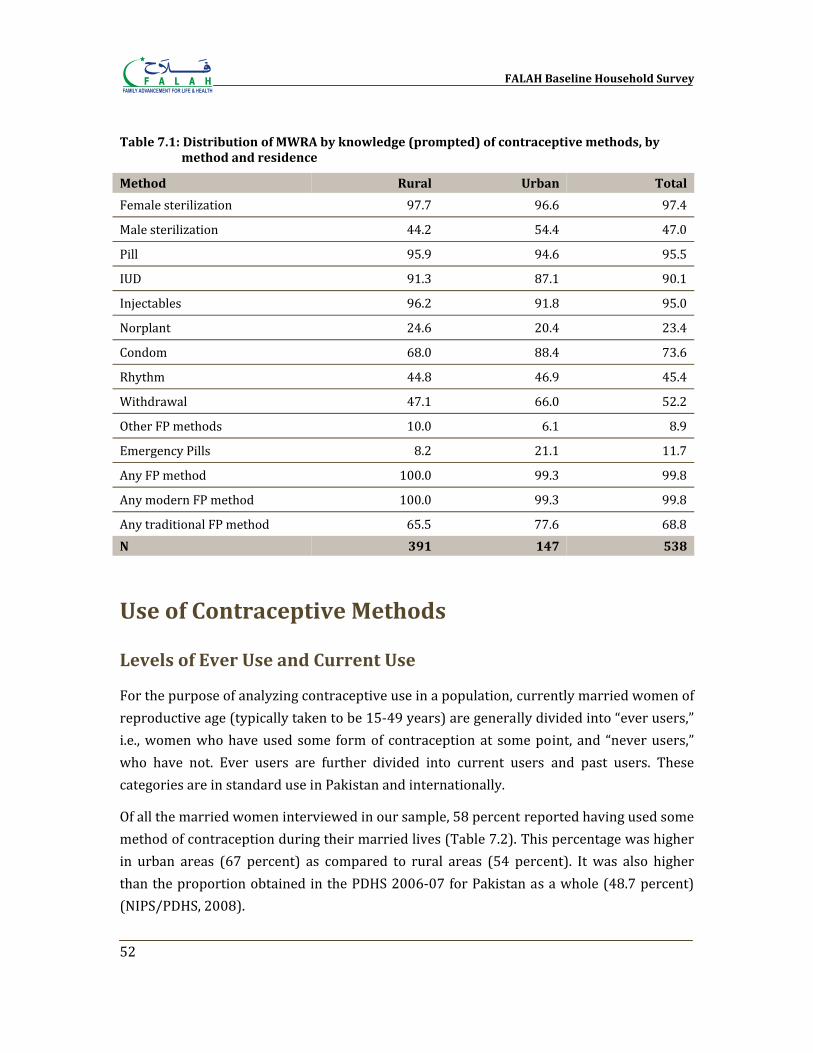
FALAH Baseline Household Survey
52
Table 7.1: Distribution of MWRA by knowledge (prompted) of contraceptive methods, by method and residence
Method Rural Urban Total
Female sterilization 97.7 96.6 97.4
Male sterilization 44.2 54.4 47.0
Pill 95.9 94.6 95.5
IUD 91.3 87.1 90.1
Injectables 96.2 91.8 95.0
Norplant 24.6 20.4 23.4
Condom 68.0 88.4 73.6
Rhythm 44.8 46.9 45.4
Withdrawal 47.1 66.0 52.2
Other FP methods 10.0 6.1 8.9
Emergency Pills 8.2 21.1 11.7
Any FP method 100.0 99.3 99.8
Any modern FP method 100.0 99.3 99.8
Any traditional FP method 65.5 77.6 68.8N 391 147 538
Use of Contraceptive Methods
Levels of Ever Use and Current Use
For the purpose of analyzing contraceptive use in a population, currently married women of reproductive age (typically taken to be 15‐49 years) are generally divided into “ever users,” i.e., women who have used some form of contraception at some point, and “never users,” who have not. Ever users are further divided into current users and past users. These categories are in standard use in Pakistan and internationally.
Of all the married women interviewed in our sample, 58 percent reported having used some method of contraception during their married lives (Table 7.2). This percentage was higher in urban areas (67 percent) as compared to rural areas (54 percent). It was also higher than the proportion obtained in the PDHS 2006‐07 for Pakistan as a whole (48.7 percent) (NIPS/PDHS, 2008).
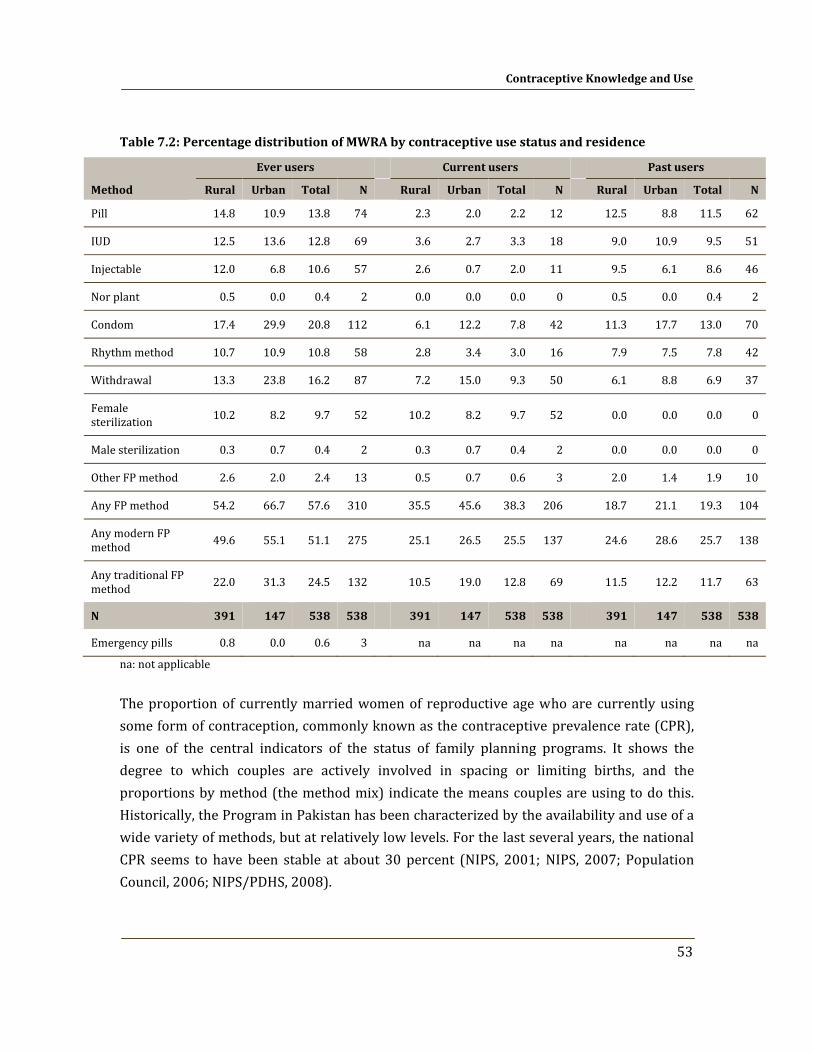
Contraceptive Knowledge and Use
53
Table 7.2: Percentage distribution of MWRA by contraceptive use status and residence
Method
Ever users
Current users
Past users
Rural Urban Total N Rural Urban Total N Rural Urban Total N
Pill 14.8 10.9 13.8 74 2.3 2.0 2.2 12 12.5 8.8 11.5 62
IUD 12.5 13.6 12.8 69 3.6 2.7 3.3 18 9.0 10.9 9.5 51
Injectable 12.0 6.8 10.6 57 2.6 0.7 2.0 11 9.5 6.1 8.6 46
Nor plant 0.5 0.0 0.4 2 0.0 0.0 0.0 0 0.5 0.0 0.4 2
Condom 17.4 29.9 20.8 112 6.1 12.2 7.8 42 11.3 17.7 13.0 70
Rhythm method 10.7 10.9 10.8 58 2.8 3.4 3.0 16 7.9 7.5 7.8 42
Withdrawal 13.3 23.8 16.2 87 7.2 15.0 9.3 50 6.1 8.8 6.9 37
Female sterilization 10.2 8.2 9.7 52
10.2 8.2 9.7 52
0.0 0.0 0.0 0
Male sterilization 0.3 0.7 0.4 2 0.3 0.7 0.4 2 0.0 0.0 0.0 0
Other FP method 2.6 2.0 2.4 13 0.5 0.7 0.6 3 2.0 1.4 1.9 10
Any FP method 54.2 66.7 57.6 310 35.5 45.6 38.3 206 18.7 21.1 19.3 104
Any modern FP method 49.6 55.1 51.1 275
25.1 26.5 25.5 137
24.6 28.6 25.7 138
Any traditional FP method 22.0 31.3 24.5 132
10.5 19.0 12.8 69
11.5 12.2 11.7 63
N 391 147 538 538
391 147 538 538
391 147 538 538
Emergency pills 0.8 0.0 0.6 3 na na na na na na na na
na: not applicable
The proportion of currently married women of reproductive age who are currently using some form of contraception, commonly known as the contraceptive prevalence rate (CPR), is one of the central indicators of the status of family planning programs. It shows the degree to which couples are actively involved in spacing or limiting births, and the proportions by method (the method mix) indicate the means couples are using to do this. Historically, the Program in Pakistan has been characterized by the availability and use of a wide variety of methods, but at relatively low levels. For the last several years, the national CPR seems to have been stable at about 30 percent (NIPS, 2001; NIPS, 2007; Population Council, 2006; NIPS/PDHS, 2008).
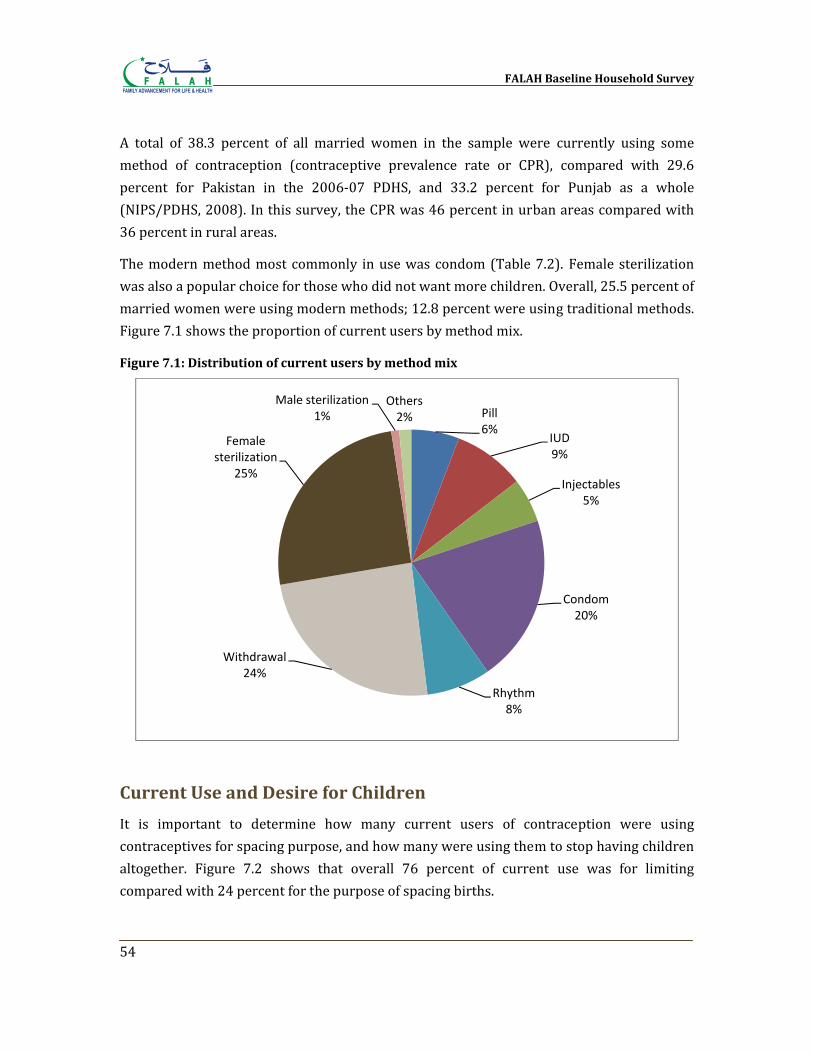
FALAH Baseline Household Survey
54
A total of 38.3 percent of all married women in the sample were currently using some method of contraception (contraceptive prevalence rate or CPR), compared with 29.6 percent for Pakistan in the 2006‐07 PDHS, and 33.2 percent for Punjab as a whole (NIPS/PDHS, 2008). In this survey, the CPR was 46 percent in urban areas compared with 36 percent in rural areas.
The modern method most commonly in use was condom (Table 7.2). Female sterilization was also a popular choice for those who did not want more children. Overall, 25.5 percent of married women were using modern methods; 12.8 percent were using traditional methods. Figure 7.1 shows the proportion of current users by method mix.
Figure 7.1: Distribution of current users by method mix
Current Use and Desire for Children
It is important to determine how many current users of contraception were using contraceptives for spacing purpose, and how many were using them to stop having children altogether. Figure 7.2 shows that overall 76 percent of current use was for limiting compared with 24 percent for the purpose of spacing births.
Pill6%
IUD9%
Injectables5%
Condom20%
Rhythm8%
Withdrawal24%
Female sterilization
25%
Male sterilization1%
Others2%
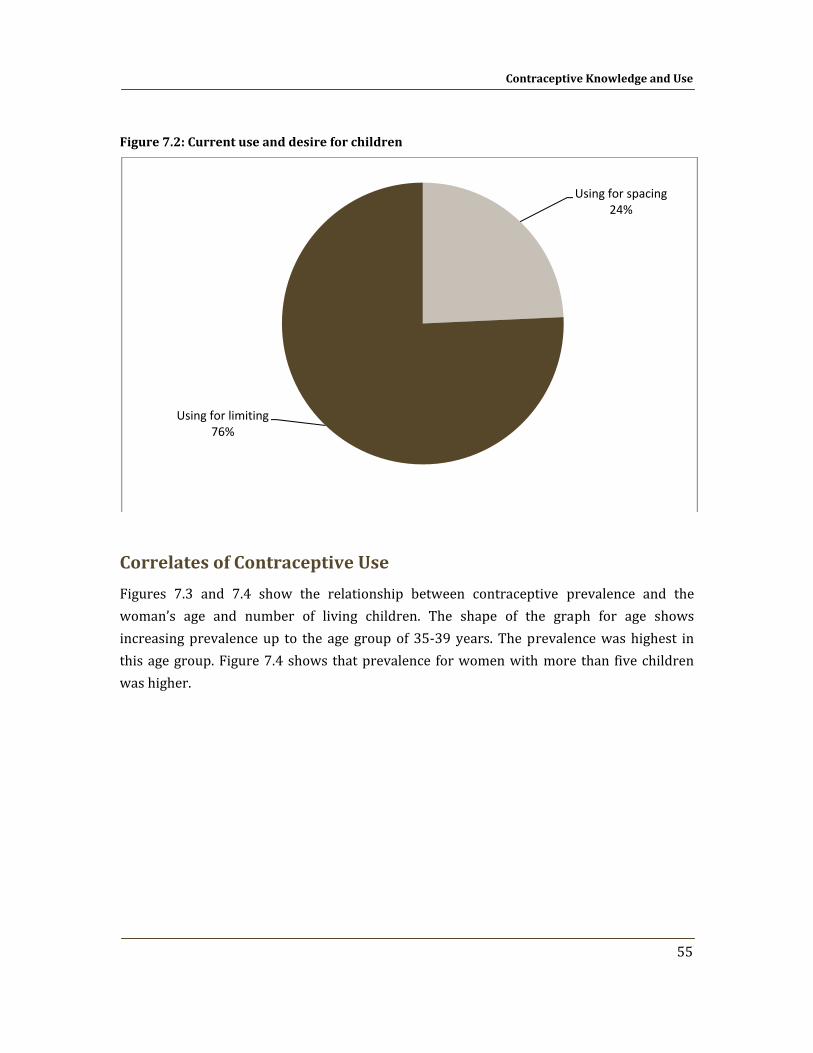
Contraceptive Knowledge and Use
55
Figure 7.2: Current use and desire for children
Correlates of Contraceptive Use
Figures 7.3 and 7.4 show the relationship between contraceptive prevalence and the woman’s age and number of living children. The shape of the graph for age shows increasing prevalence up to the age group of 35‐39 years. The prevalence was highest in this age group. Figure 7.4 shows that prevalence for women with more than five children was higher.
Using for spacing24%
Using for limiting76%
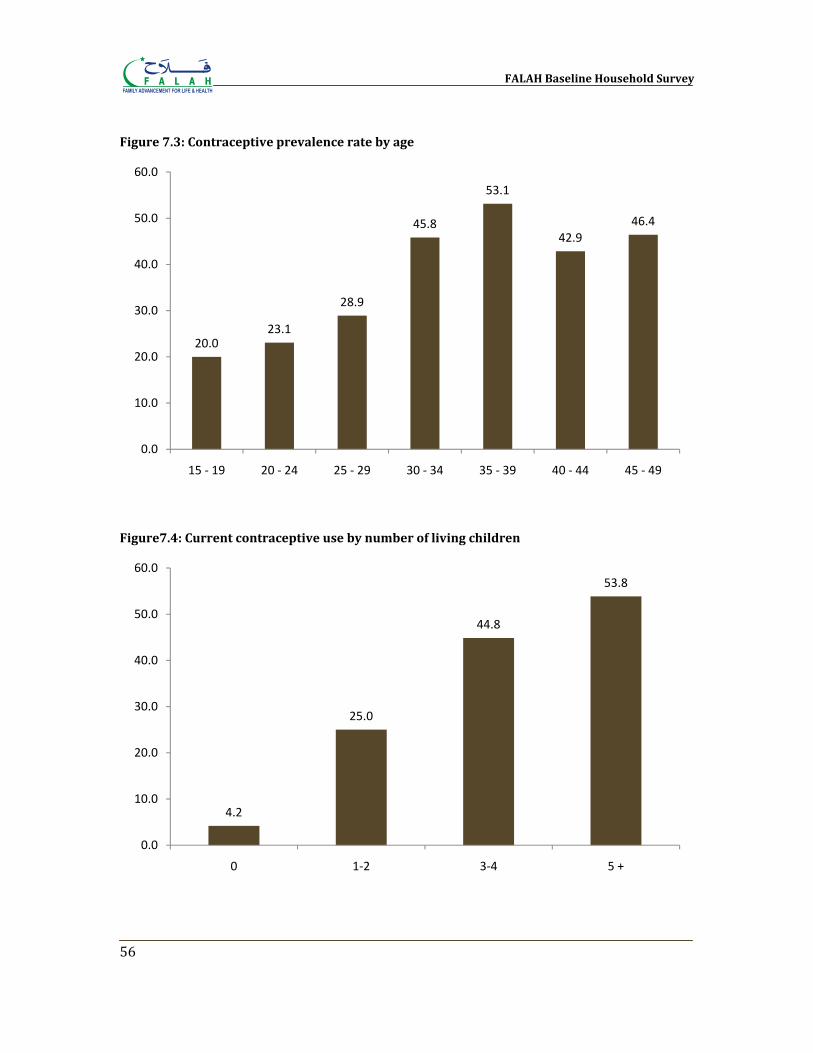
FALAH Baseline Household Survey
56
Figure 7.3: Contraceptive prevalence rate by age
Figure7.4: Current contraceptive use by number of living children
20.023.1
28.9
45.8
53.1
42.946.4
0.0
10.0
20.0
30.0
40.0
50.0
60.0
15 ‐ 19 20 ‐ 24 25 ‐ 29 30 ‐ 34 35 ‐ 39 40 ‐ 44 45 ‐ 49
4.2
25.0
44.8
53.8
0.0
10.0
20.0
30.0
40.0
50.0
60.0
0 1‐2 3‐4 5 +
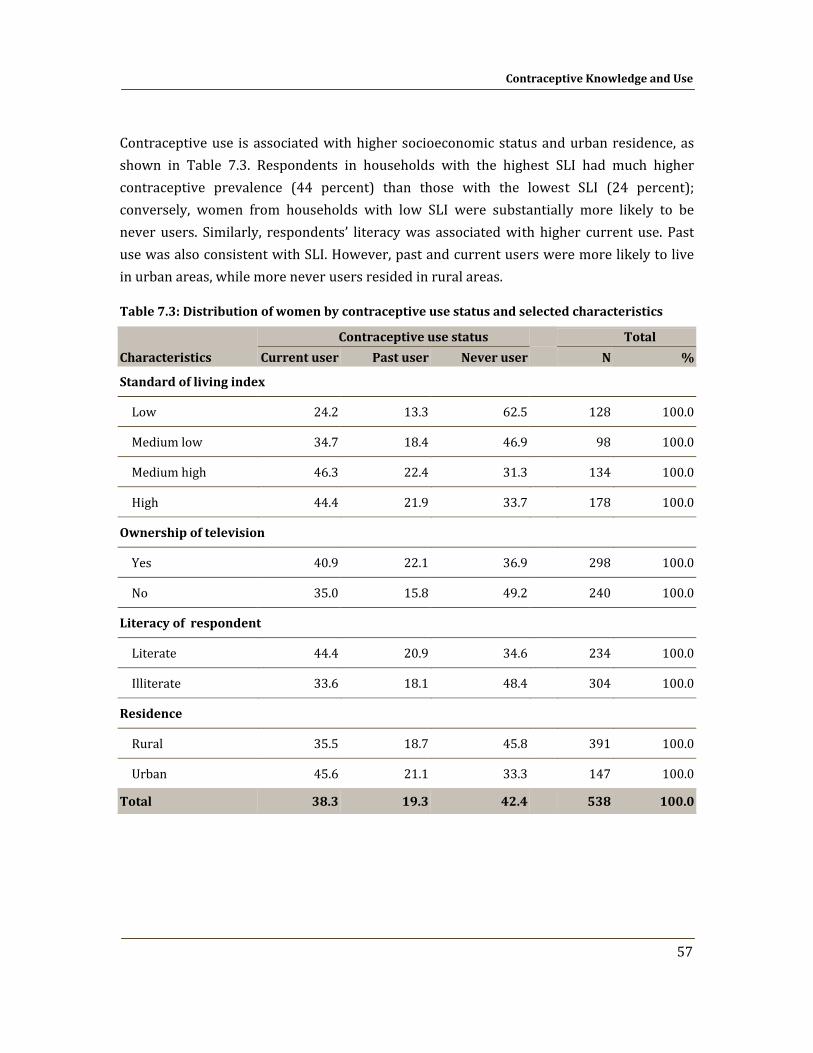
Contraceptive Knowledge and Use
57
Contraceptive use is associated with higher socioeconomic status and urban residence, as shown in Table 7.3. Respondents in households with the highest SLI had much higher contraceptive prevalence (44 percent) than those with the lowest SLI (24 percent); conversely, women from households with low SLI were substantially more likely to be never users. Similarly, respondents’ literacy was associated with higher current use. Past use was also consistent with SLI. However, past and current users were more likely to live in urban areas, while more never users resided in rural areas.
Table 7.3: Distribution of women by contraceptive use status and selected characteristics
Characteristics
Contraceptive use status Total
Current user Past user Never user N %
Standard of living index
Low 24.2 13.3 62.5 128 100.0
Medium low 34.7 18.4 46.9 98 100.0
Medium high 46.3 22.4 31.3 134 100.0
High 44.4 21.9 33.7 178 100.0
Ownership of television
Yes 40.9 22.1 36.9 298 100.0
No 35.0 15.8 49.2 240 100.0
Literacy of respondent
Literate 44.4 20.9 34.6 234 100.0
Illiterate 33.6 18.1 48.4 304 100.0
Residence
Rural 35.5 18.7 45.8 391 100.0
Urban 45.6 21.1 33.3 147 100.0
Total 38.3 19.3 42.4 538 100.0
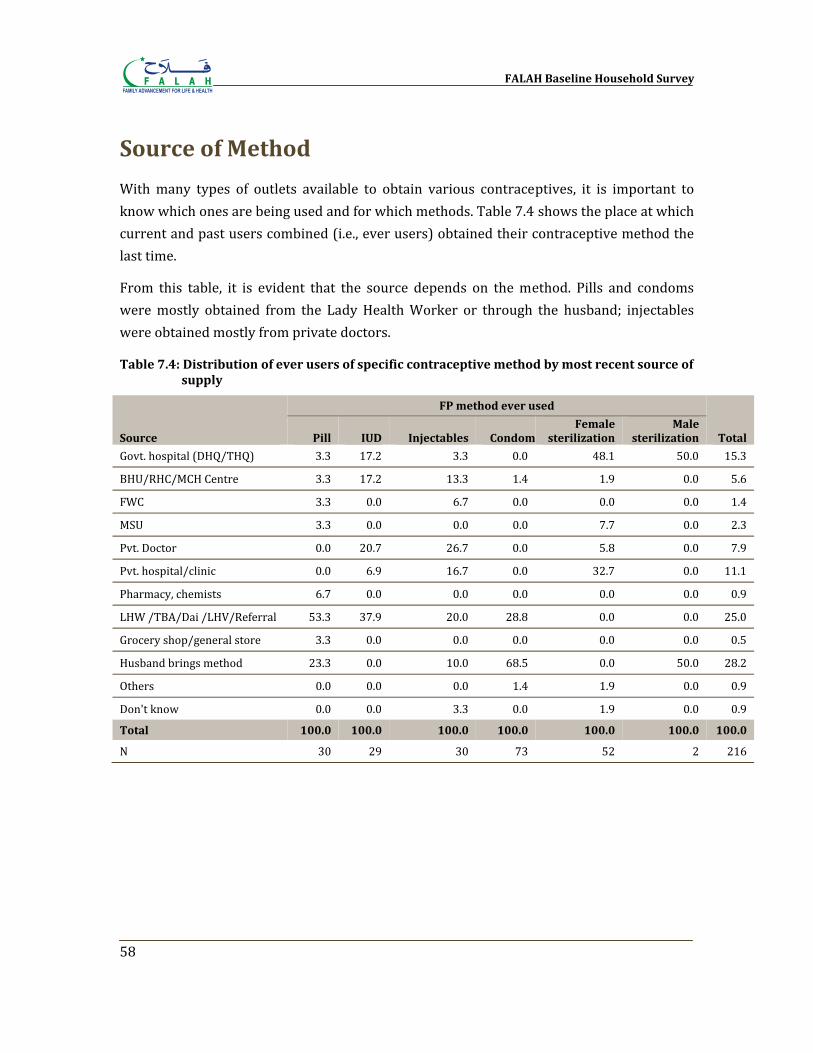
FALAH Baseline Household Survey
58
Source of Method
With many types of outlets available to obtain various contraceptives, it is important to know which ones are being used and for which methods. Table 7.4 shows the place at which current and past users combined (i.e., ever users) obtained their contraceptive method the last time.
From this table, it is evident that the source depends on the method. Pills and condoms were mostly obtained from the Lady Health Worker or through the husband; injectables were obtained mostly from private doctors.
Table 7.4: Distribution of ever users of specific contraceptive method by most recent source of supply
Source
FP method ever used
Total Pill IUD Injectables Condom Female
sterilization Male
sterilization
Govt. hospital (DHQ/THQ) 3.3 17.2 3.3 0.0 48.1 50.0 15.3
BHU/RHC/MCH Centre 3.3 17.2 13.3 1.4 1.9 0.0 5.6
FWC 3.3 0.0 6.7 0.0 0.0 0.0 1.4
MSU 3.3 0.0 0.0 0.0 7.7 0.0 2.3
Pvt. Doctor 0.0 20.7 26.7 0.0 5.8 0.0 7.9
Pvt. hospital/clinic 0.0 6.9 16.7 0.0 32.7 0.0 11.1
Pharmacy, chemists 6.7 0.0 0.0 0.0 0.0 0.0 0.9
LHW /TBA/Dai /LHV/Referral 53.3 37.9 20.0 28.8 0.0 0.0 25.0
Grocery shop/general store 3.3 0.0 0.0 0.0 0.0 0.0 0.5
Husband brings method 23.3 0.0 10.0 68.5 0.0 50.0 28.2
Others 0.0 0.0 0.0 1.4 1.9 0.0 0.9
Don't know 0.0 0.0 3.3 0.0 1.9 0.0 0.9
Total 100.0 100.0 100.0 100.0 100.0 100.0 100.0
N 30 29 30 73 52 2 216
Chapter 8
Experience with Contraceptive Methods
An important part of the success of a birth spacing program is to ensure that users are able to choose the method that is appropriate for them and to provide sufficient information and support for that method. All methods have their strengths and weaknesses, and no method is deemed to be appropriate for everyone. In looking carefully at the experience of those who have used contraceptive methods, both currently and in the past, we can gain insights into the problems users face and how to solve them. We asked a series of questions regarding the experience of current and past users; for past users who had used more than one method, we asked about their most recent method.
Reasons for Method Choice In the survey, current and past users were asked the reasons why they chose a particular method. The list of possible reasons was read out to them; the results are shown in Table 8.1. Overall, the reasons for current and past users were similar, so the data were combined. Among the most common reasons for choosing a method were: convenience of use, suitability for respondent and husband, and easy availability. For female sterilization and IUD users, suitability of use for a long period of time was often cited. Least cited reason was “No other method available “. This means that clients had access to a variety of methods. They tended to make decisions according to the known attributes of the various methods, but not always. For example, 63 percent of pill users cited lack of side effects, even though pills are in fact associated with a number of common side effects.
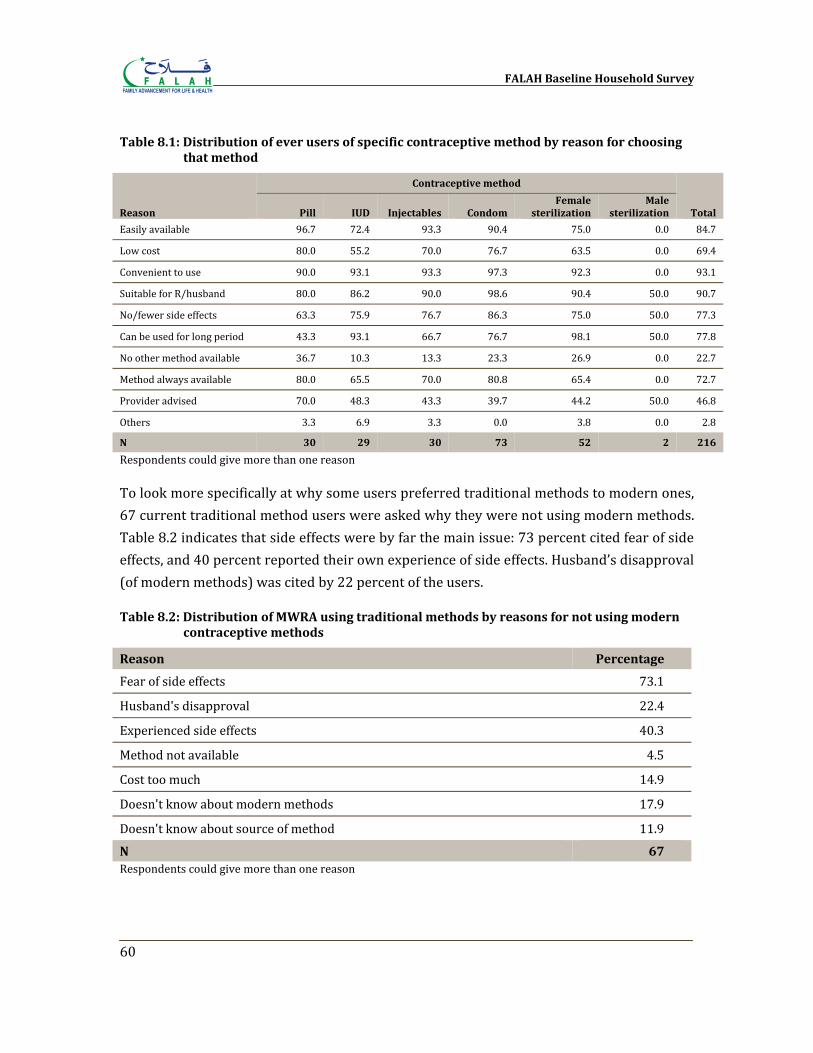
FALAH Baseline Household Survey
60
Table 8.1: Distribution of ever users of specific contraceptive method by reason for choosing that method
Reason
Contraceptive method
Total Pill IUD Injectables Condom Female
sterilization Male
sterilization
Easily available 96.7 72.4 93.3 90.4 75.0 0.0 84.7
Low cost 80.0 55.2 70.0 76.7 63.5 0.0 69.4
Convenient to use 90.0 93.1 93.3 97.3 92.3 0.0 93.1
Suitable for R/husband 80.0 86.2 90.0 98.6 90.4 50.0 90.7
No/fewer side effects 63.3 75.9 76.7 86.3 75.0 50.0 77.3
Can be used for long period 43.3 93.1 66.7 76.7 98.1 50.0 77.8
No other method available 36.7 10.3 13.3 23.3 26.9 0.0 22.7
Method always available 80.0 65.5 70.0 80.8 65.4 0.0 72.7
Provider advised 70.0 48.3 43.3 39.7 44.2 50.0 46.8
Others 3.3 6.9 3.3 0.0 3.8 0.0 2.8
N 30 29 30 73 52 2 216
Respondents could give more than one reason
To look more specifically at why some users preferred traditional methods to modern ones, 67 current traditional method users were asked why they were not using modern methods. Table 8.2 indicates that side effects were by far the main issue: 73 percent cited fear of side effects, and 40 percent reported their own experience of side effects. Husband’s disapproval (of modern methods) was cited by 22 percent of the users.
Table 8.2: Distribution of MWRA using traditional methods by reasons for not using modern contraceptive methods
Reason Percentage
Fear of side effects 73.1
Husband's disapproval 22.4
Experienced side effects 40.3
Method not available 4.5
Cost too much 14.9
Doesn't know about modern methods 17.9
Doesn't know about source of method 11.9
N 67 Respondents could give more than one reason
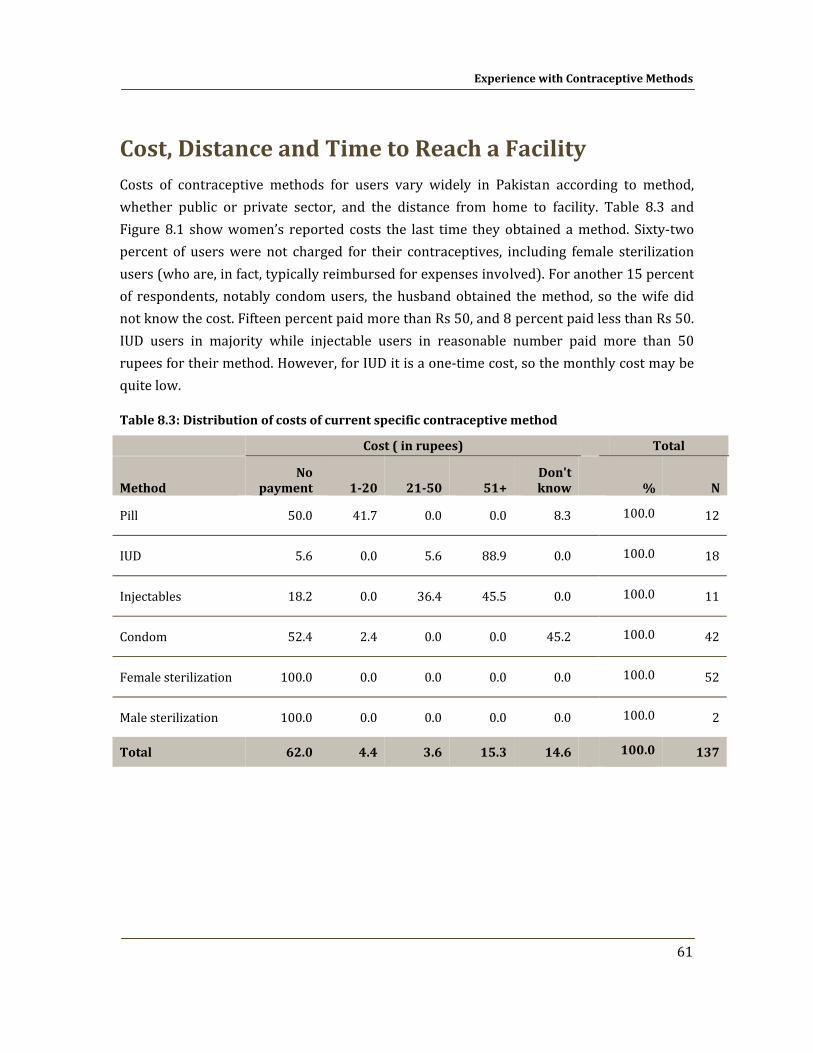
Experience with Contraceptive Methods
61
Cost, Distance and Time to Reach a Facility Costs of contraceptive methods for users vary widely in Pakistan according to method, whether public or private sector, and the distance from home to facility. Table 8.3 and Figure 8.1 show women’s reported costs the last time they obtained a method. Sixty‐two percent of users were not charged for their contraceptives, including female sterilization users (who are, in fact, typically reimbursed for expenses involved). For another 15 percent of respondents, notably condom users, the husband obtained the method, so the wife did not know the cost. Fifteen percent paid more than Rs 50, and 8 percent paid less than Rs 50. IUD users in majority while injectable users in reasonable number paid more than 50 rupees for their method. However, for IUD it is a one‐time cost, so the monthly cost may be quite low.
Table 8.3: Distribution of costs of current specific contraceptive method
Cost ( in rupees) Total
Method No
payment 120 2150 51+ Don't know % N
Pill 50.0 41.7 0.0 0.0 8.3 100.0 12
IUD 5.6 0.0 5.6 88.9 0.0 100.0 18
Injectables 18.2 0.0 36.4 45.5 0.0 100.0 11
Condom 52.4 2.4 0.0 0.0 45.2 100.0 42
Female sterilization 100.0 0.0 0.0 0.0 0.0 100.0 52
Male sterilization 100.0 0.0 0.0 0.0 0.0 100.0 2
Total 62.0 4.4 3.6 15.3 14.6
100.0 137
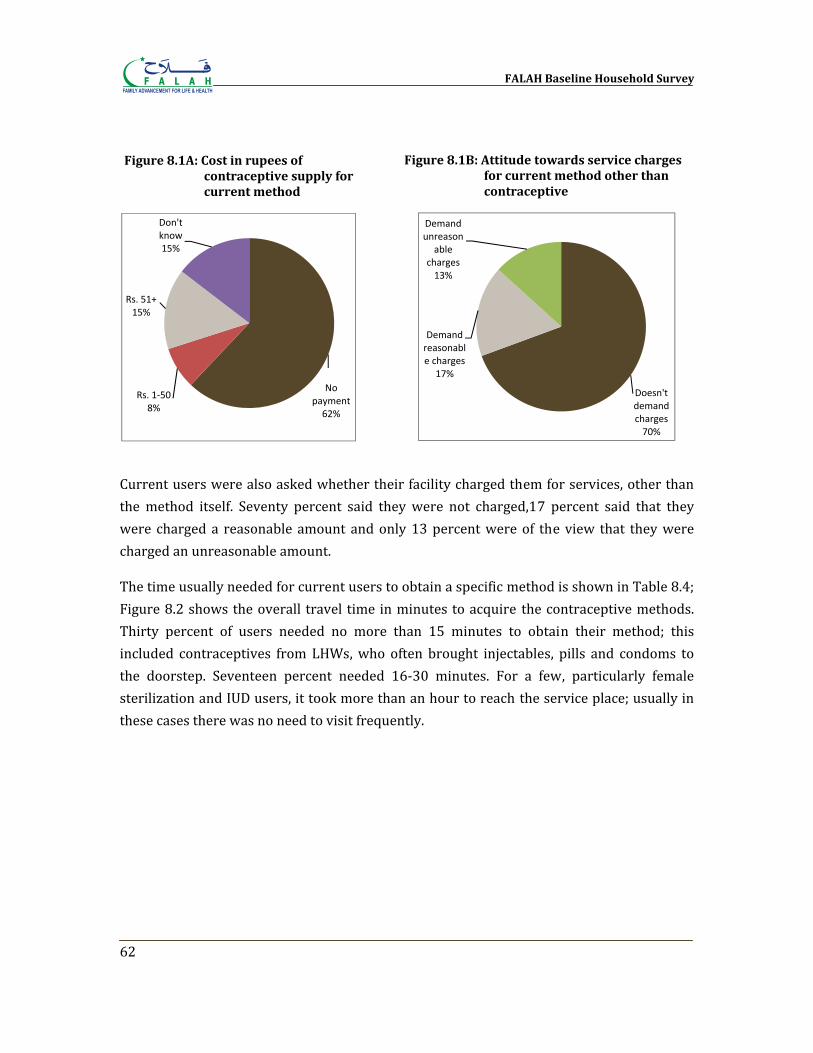
FALAH Baseline Household Survey
62
Current users were also asked whether their facility charged them for services, other than the method itself. Seventy percent said they were not charged,17 percent said that they were charged a reasonable amount and only 13 percent were of the view that they were charged an unreasonable amount.
The time usually needed for current users to obtain a specific method is shown in Table 8.4; Figure 8.2 shows the overall travel time in minutes to acquire the contraceptive methods. Thirty percent of users needed no more than 15 minutes to obtain their method; this included contraceptives from LHWs, who often brought injectables, pills and condoms to the doorstep. Seventeen percent needed 16‐30 minutes. For a few, particularly female sterilization and IUD users, it took more than an hour to reach the service place; usually in these cases there was no need to visit frequently.
No payment62%
Rs. 1‐508%
Rs. 51+15%
Don't know15%
Figure 8.1A: Cost in rupees of contraceptive supply for current method
Figure 8.1B: Attitude towards service charges for current method other than contraceptive
Doesn't demand charges70%
Demand reasonable charges
17%
Demand unreason
able charges13%
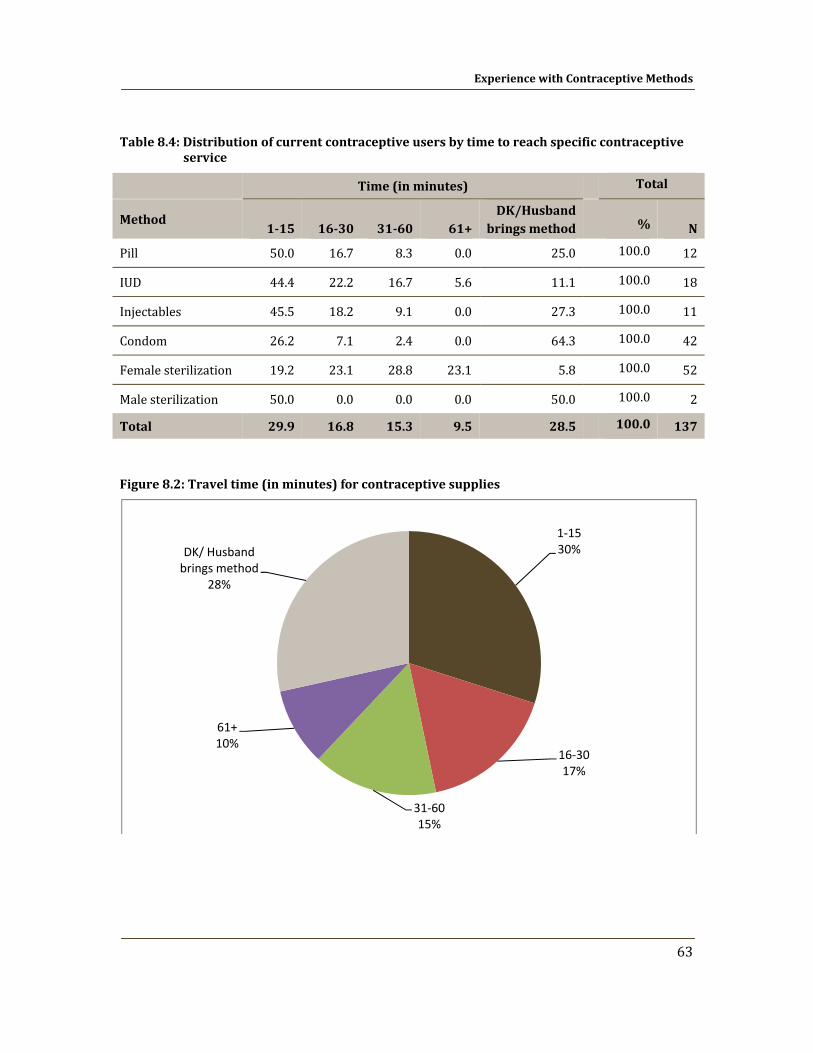
Experience with Contraceptive Methods
63
Table 8.4: Distribution of current contraceptive users by time to reach specific contraceptive service
Time (in minutes)
Total
Method 115 1630 3160 61+
DK/Husband brings method % N
Pill 50.0 16.7 8.3 0.0 25.0 100.0 12
IUD 44.4 22.2 16.7 5.6 11.1 100.0 18
Injectables 45.5 18.2 9.1 0.0 27.3 100.0 11
Condom 26.2 7.1 2.4 0.0 64.3 100.0 42
Female sterilization 19.2 23.1 28.8 23.1 5.8 100.0 52
Male sterilization 50.0 0.0 0.0 0.0 50.0 100.0 2
Total 29.9 16.8 15.3 9.5 28.5
100.0 137
Figure 8.2: Travel time (in minutes) for contraceptive supplies
1‐1530%
16‐3017%
31‐6015%
61+10%
DK/ Husband brings method
28%
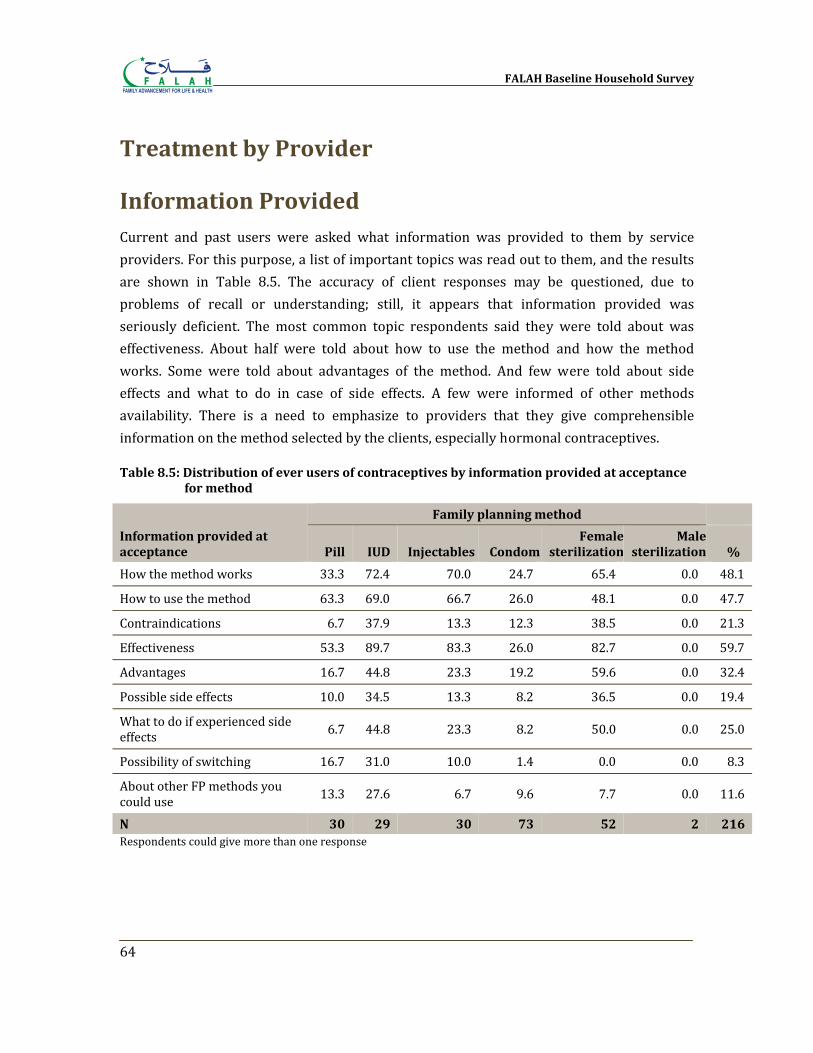
FALAH Baseline Household Survey
64
Treatment by Provider
Information Provided Current and past users were asked what information was provided to them by service providers. For this purpose, a list of important topics was read out to them, and the results are shown in Table 8.5. The accuracy of client responses may be questioned, due to problems of recall or understanding; still, it appears that information provided was seriously deficient. The most common topic respondents said they were told about was effectiveness. About half were told about how to use the method and how the method works. Some were told about advantages of the method. And few were told about side effects and what to do in case of side effects. A few were informed of other methods availability. There is a need to emphasize to providers that they give comprehensible information on the method selected by the clients, especially hormonal contraceptives.
Table 8.5: Distribution of ever users of contraceptives by information provided at acceptance for method
Information provided at acceptance
Family planning method
Pill IUD Injectables Condom Female
sterilizationMale
sterilization %
How the method works 33.3 72.4 70.0 24.7 65.4 0.0 48.1
How to use the method 63.3 69.0 66.7 26.0 48.1 0.0 47.7
Contraindications 6.7 37.9 13.3 12.3 38.5 0.0 21.3
Effectiveness 53.3 89.7 83.3 26.0 82.7 0.0 59.7
Advantages 16.7 44.8 23.3 19.2 59.6 0.0 32.4
Possible side effects 10.0 34.5 13.3 8.2 36.5 0.0 19.4
What to do if experienced side effects 6.7 44.8 23.3 8.2 50.0 0.0 25.0
Possibility of switching 16.7 31.0 10.0 1.4 0.0 0.0 8.3
About other FP methods you could use 13.3 27.6 6.7 9.6 7.7 0.0 11.6
N 30 29 30 73 52 2 216 Respondents could give more than one response
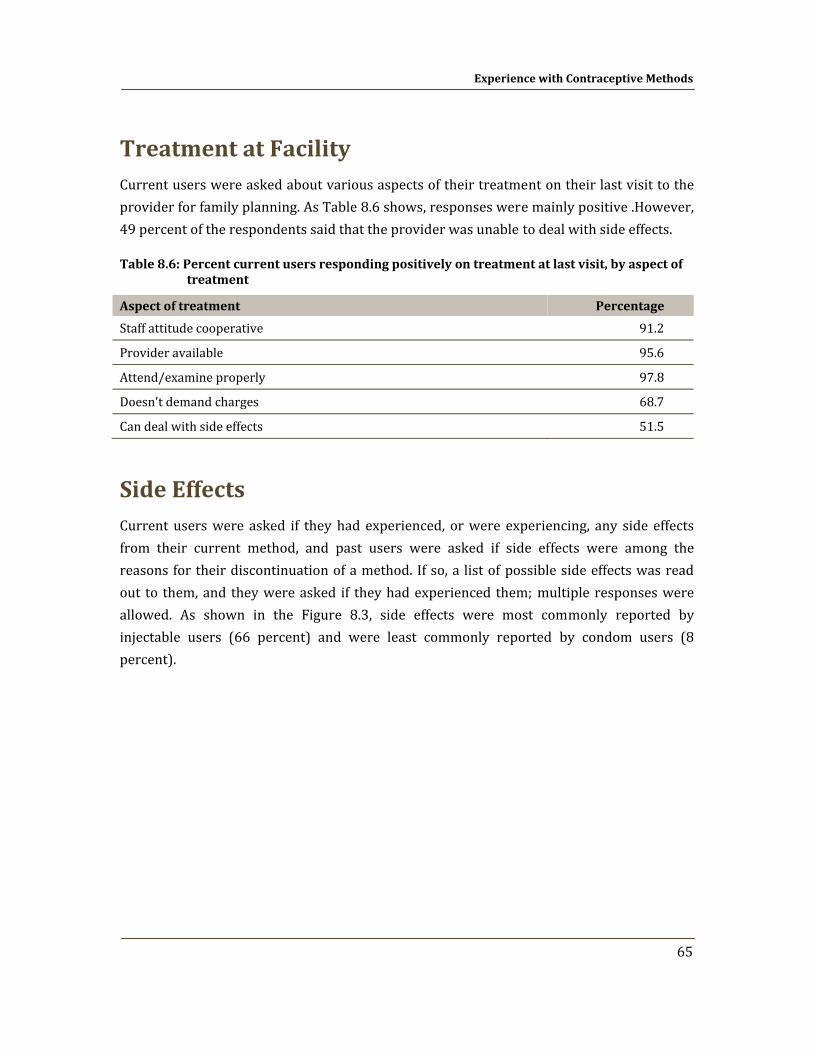
Experience with Contraceptive Methods
65
Treatment at Facility Current users were asked about various aspects of their treatment on their last visit to the provider for family planning. As Table 8.6 shows, responses were mainly positive .However, 49 percent of the respondents said that the provider was unable to deal with side effects.
Table 8.6: Percent current users responding positively on treatment at last visit, by aspect of treatment
Aspect of treatment Percentage
Staff attitude cooperative 91.2
Provider available 95.6
Attend/examine properly 97.8
Doesn't demand charges 68.7
Can deal with side effects 51.5
Side Effects Current users were asked if they had experienced, or were experiencing, any side effects from their current method, and past users were asked if side effects were among the reasons for their discontinuation of a method. If so, a list of possible side effects was read out to them, and they were asked if they had experienced them; multiple responses were allowed. As shown in the Figure 8.3, side effects were most commonly reported by injectable users (66 percent) and were least commonly reported by condom users (8 percent).
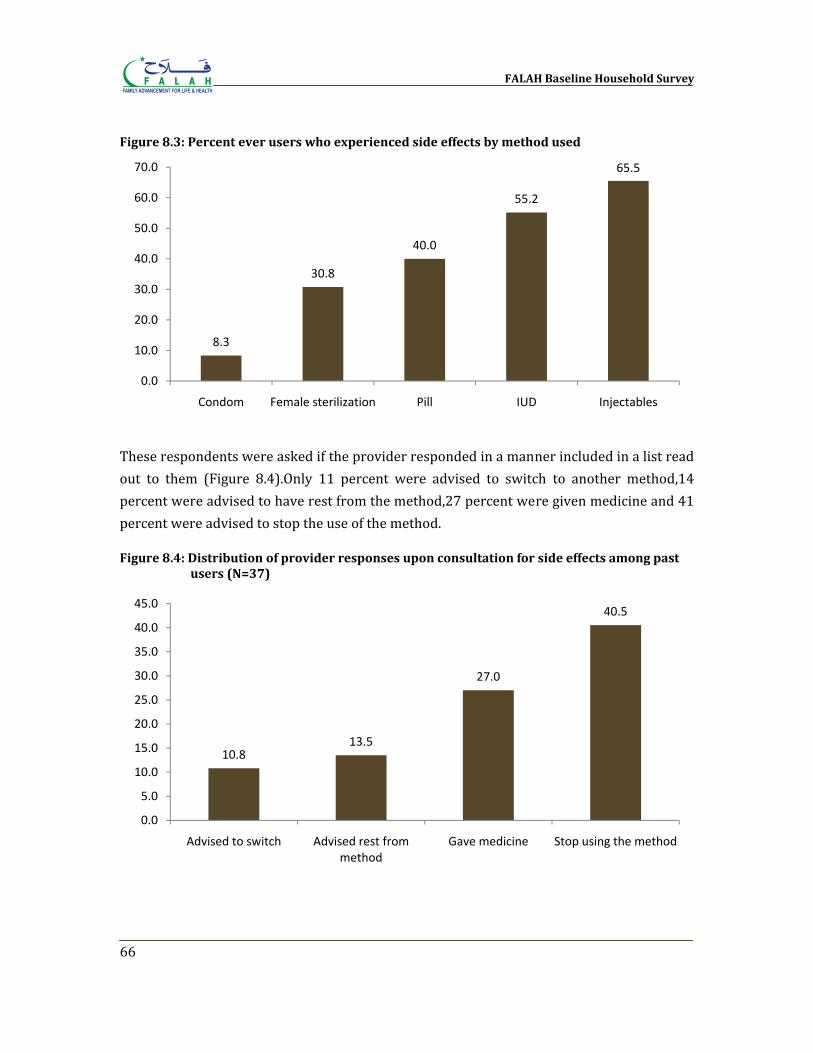
FALAH Baseline Household Survey
66
Figure 8.3: Percent ever users who experienced side effects by method used
These respondents were asked if the provider responded in a manner included in a list read out to them (Figure 8.4).Only 11 percent were advised to switch to another method,14 percent were advised to have rest from the method,27 percent were given medicine and 41 percent were advised to stop the use of the method.
Figure 8.4: Distribution of provider responses upon consultation for side effects among past users (N=37)
8.3
30.8
40.0
55.2
65.5
0.0
10.0
20.0
30.0
40.0
50.0
60.0
70.0
Condom Female sterilization Pill IUD Injectables
10.813.5
27.0
40.5
0.0
5.0
10.0
15.0
20.0
25.0
30.0
35.0
40.0
45.0
Advised to switch Advised rest from method
Gave medicine Stop using the method
Chapter 9
Reasons for Nonuse
There are many reasons why a couple may not be practicing birth spacing at any given time. The woman may already be pregnant, the couple may want another child soon, the woman may already have passed menopause or she may believe herself to be sterile. Other reasons may prevent couples from using contraceptives even if they want to avoid having more children. Reasons may include: lack of knowledge of methods or inability to obtain them; fear of side effects; opposition of husband or family; and concern that birth spacing may be against religion or somehow wrong and so on. To understand how best to meet the needs of such people, it is important to understand the reasons why couples are not practicing birth spacing in relation to the situation they are currently in.
Hindrances to Use One way to understand common hindrances to contraceptive use is to ask respondents about their understanding of the concerns of people in general, with the view that people may feel less need to conceal their real concerns than when they are discussing their own situation. All respondents were asked, “If a couple wants to avoid or space a birth, which of the following hindrances might they face?” Each item on the list was read out to the respondent. Table 9.1 shows the responses of the female respondents, according to whether they were current users, past users or never users.
Some obstacles that couples might face were almost universally acknowledged. Ninety‐seven percent never user users mentioned husband’s possible disapproval while 95 percent cited fear of side effects and 96 percent mentioned the problem of managing side effects. Other reasons were relatively less rated.
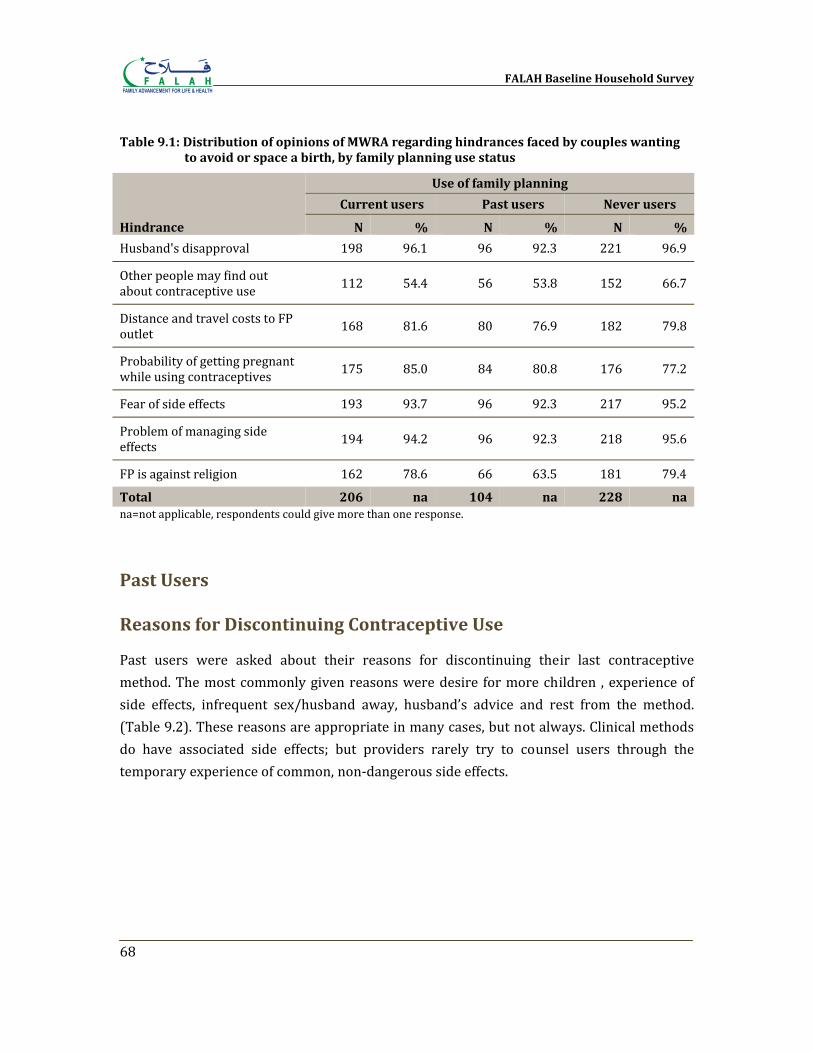
FALAH Baseline Household Survey
68
Table 9.1: Distribution of opinions of MWRA regarding hindrances faced by couples wanting to avoid or space a birth, by family planning use status
Hindrance
Use of family planning
Current users Past users Never users
N % N % N %
Husband's disapproval 198 96.1 96 92.3 221 96.9
Other people may find out about contraceptive use 112 54.4 56 53.8 152 66.7
Distance and travel costs to FP outlet 168 81.6 80 76.9 182 79.8
Probability of getting pregnant while using contraceptives 175 85.0 84 80.8 176 77.2
Fear of side effects 193 93.7 96 92.3 217 95.2
Problem of managing side effects 194 94.2 96 92.3 218 95.6
FP is against religion 162 78.6 66 63.5 181 79.4
Total 206 na 104 na 228 na na=not applicable, respondents could give more than one response.
Past Users
Reasons for Discontinuing Contraceptive Use
Past users were asked about their reasons for discontinuing their last contraceptive method. The most commonly given reasons were desire for more children , experience of side effects, infrequent sex/husband away, husband’s advice and rest from the method. (Table 9.2). These reasons are appropriate in many cases, but not always. Clinical methods do have associated side effects; but providers rarely try to counsel users through the temporary experience of common, non‐dangerous side effects.
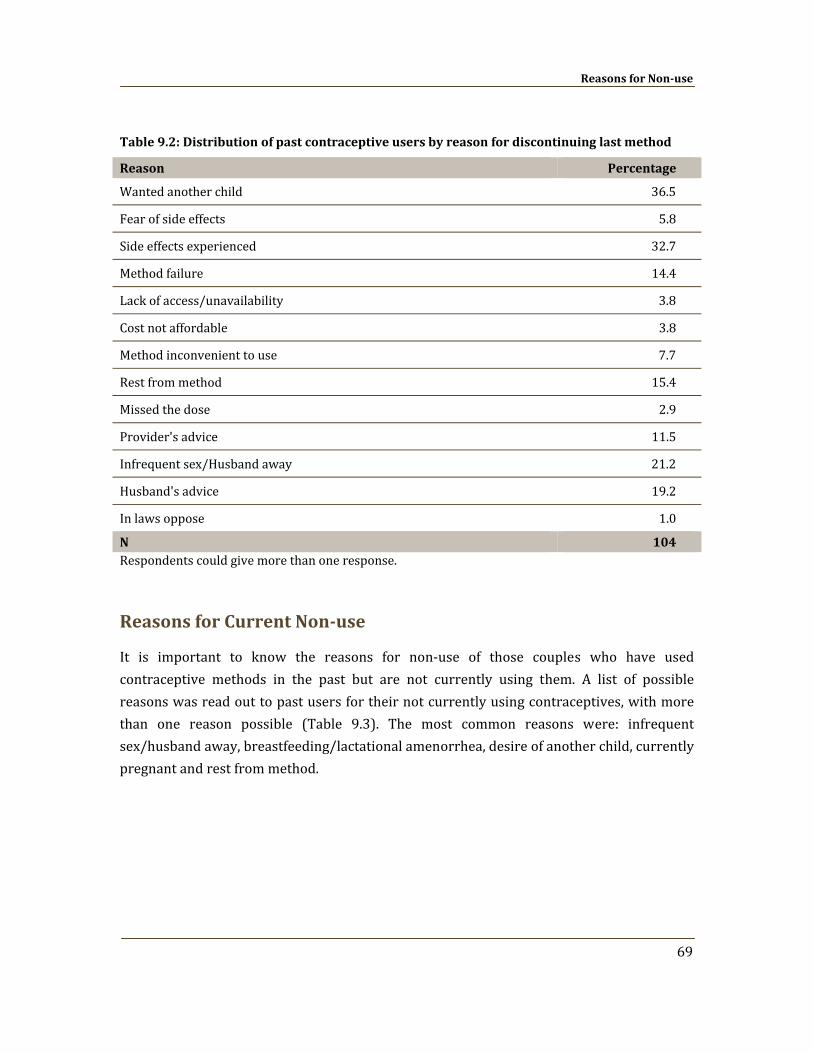
Reasons for Nonuse
69
Table 9.2: Distribution of past contraceptive users by reason for discontinuing last method
Reason Percentage
Wanted another child 36.5
Fear of side effects 5.8
Side effects experienced 32.7
Method failure 14.4
Lack of access/unavailability 3.8
Cost not affordable 3.8
Method inconvenient to use 7.7
Rest from method 15.4
Missed the dose 2.9
Provider's advice 11.5
Infrequent sex/Husband away 21.2
Husband's advice 19.2
In laws oppose 1.0
N 104 Respondents could give more than one response.
Reasons for Current Nonuse
It is important to know the reasons for non‐use of those couples who have used contraceptive methods in the past but are not currently using them. A list of possible reasons was read out to past users for their not currently using contraceptives, with more than one reason possible (Table 9.3). The most common reasons were: infrequent sex/husband away, breastfeeding/lactational amenorrhea, desire of another child, currently pregnant and rest from method.
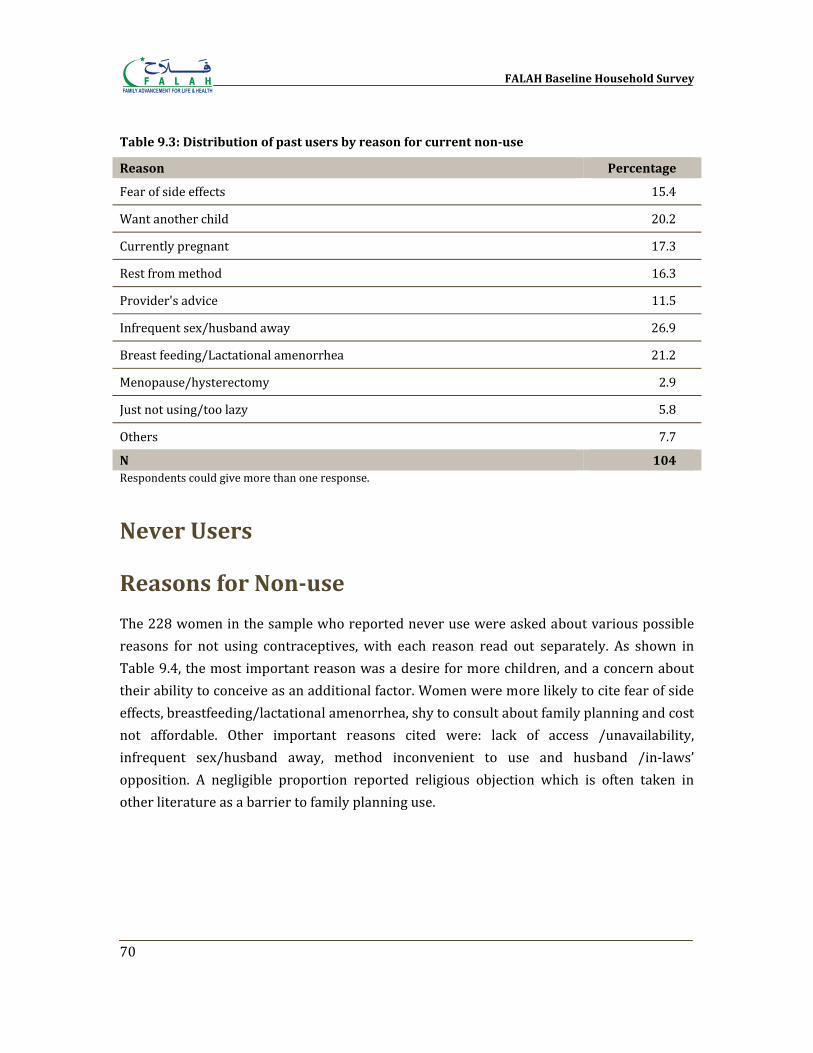
FALAH Baseline Household Survey
70
Table 9.3: Distribution of past users by reason for current nonuse
Reason Percentage
Fear of side effects 15.4
Want another child 20.2
Currently pregnant 17.3
Rest from method 16.3
Provider's advice 11.5
Infrequent sex/husband away 26.9
Breast feeding/Lactational amenorrhea 21.2
Menopause/hysterectomy 2.9
Just not using/too lazy 5.8
Others 7.7
N 104 Respondents could give more than one response.
Never Users
Reasons for Nonuse
The 228 women in the sample who reported never use were asked about various possible reasons for not using contraceptives, with each reason read out separately. As shown in Table 9.4, the most important reason was a desire for more children, and a concern about their ability to conceive as an additional factor. Women were more likely to cite fear of side effects, breastfeeding/lactational amenorrhea, shy to consult about family planning and cost not affordable. Other important reasons cited were: lack of access /unavailability, infrequent sex/husband away, method inconvenient to use and husband /in‐laws’ opposition. A negligible proportion reported religious objection which is often taken in other literature as a barrier to family planning use.
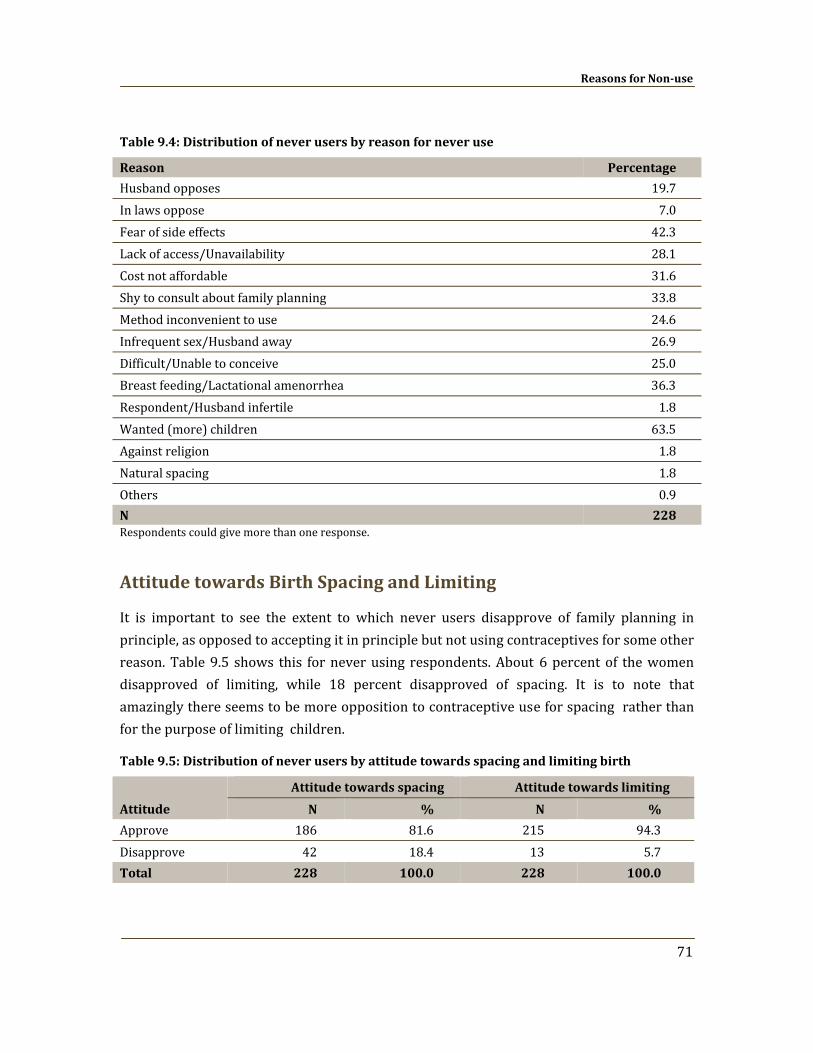
Reasons for Nonuse
71
Table 9.4: Distribution of never users by reason for never use
Reason Percentage
Husband opposes 19.7 In laws oppose 7.0 Fear of side effects 42.3 Lack of access/Unavailability 28.1 Cost not affordable 31.6 Shy to consult about family planning 33.8 Method inconvenient to use 24.6 Infrequent sex/Husband away 26.9 Difficult/Unable to conceive 25.0 Breast feeding/Lactational amenorrhea 36.3 Respondent/Husband infertile 1.8 Wanted (more) children 63.5 Against religion 1.8 Natural spacing 1.8 Others 0.9 N 228 Respondents could give more than one response.
Attitude towards Birth Spacing and Limiting
It is important to see the extent to which never users disapprove of family planning in principle, as opposed to accepting it in principle but not using contraceptives for some other reason. Table 9.5 shows this for never using respondents. About 6 percent of the women disapproved of limiting, while 18 percent disapproved of spacing. It is to note that amazingly there seems to be more opposition to contraceptive use for spacing rather than for the purpose of limiting children.
Table 9.5: Distribution of never users by attitude towards spacing and limiting birth
Attitude
Attitude towards spacing Attitude towards limiting
N % N %
Approve 186 81.6 215 94.3 Disapprove 42 18.4 13 5.7 Total 228 100.0 228 100.0
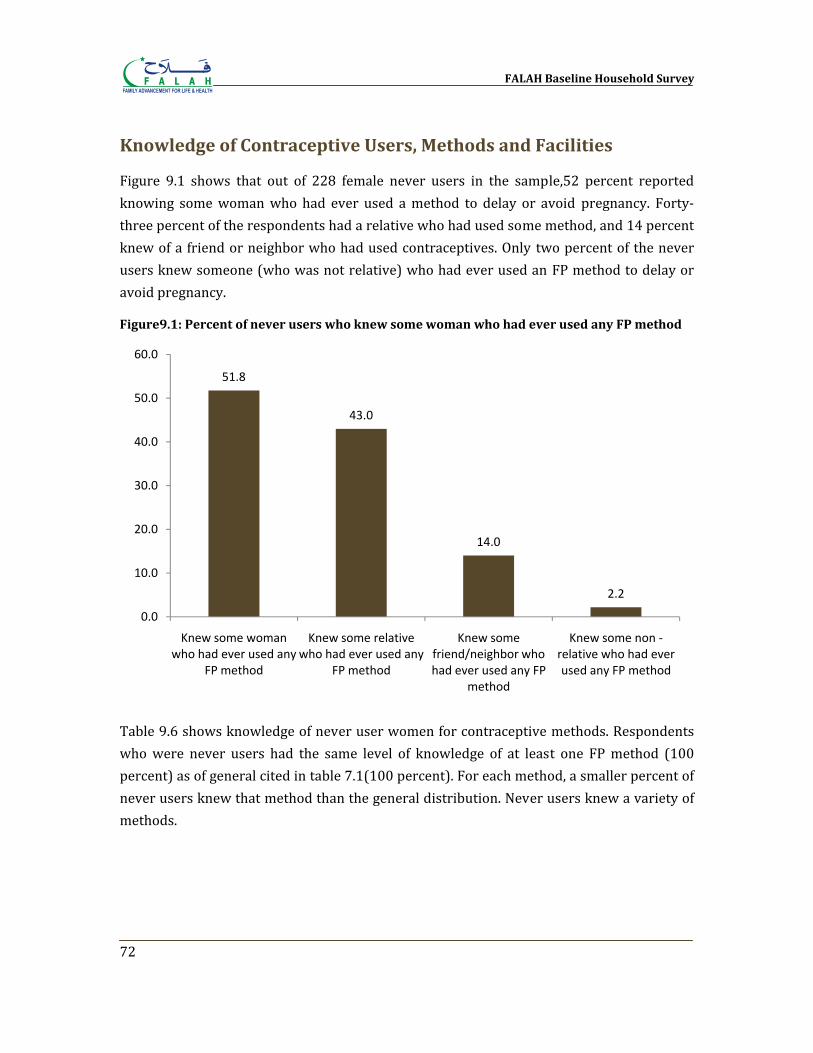
FALAH Baseline Household Survey
72
Knowledge of Contraceptive Users, Methods and Facilities
Figure 9.1 shows that out of 228 female never users in the sample,52 percent reported knowing some woman who had ever used a method to delay or avoid pregnancy. Forty‐three percent of the respondents had a relative who had used some method, and 14 percent knew of a friend or neighbor who had used contraceptives. Only two percent of the never users knew someone (who was not relative) who had ever used an FP method to delay or avoid pregnancy.
Figure9.1: Percent of never users who knew some woman who had ever used any FP method
Table 9.6 shows knowledge of never user women for contraceptive methods. Respondents who were never users had the same level of knowledge of at least one FP method (100 percent) as of general cited in table 7.1(100 percent). For each method, a smaller percent of never users knew that method than the general distribution. Never users knew a variety of methods.
51.8
43.0
14.0
2.2
0.0
10.0
20.0
30.0
40.0
50.0
60.0
Knew some woman who had ever used any
FP method
Knew some relative who had ever used any
FP method
Knew some friend/neighbor who had ever used any FP
method
Knew some non ‐relative who had ever used any FP method
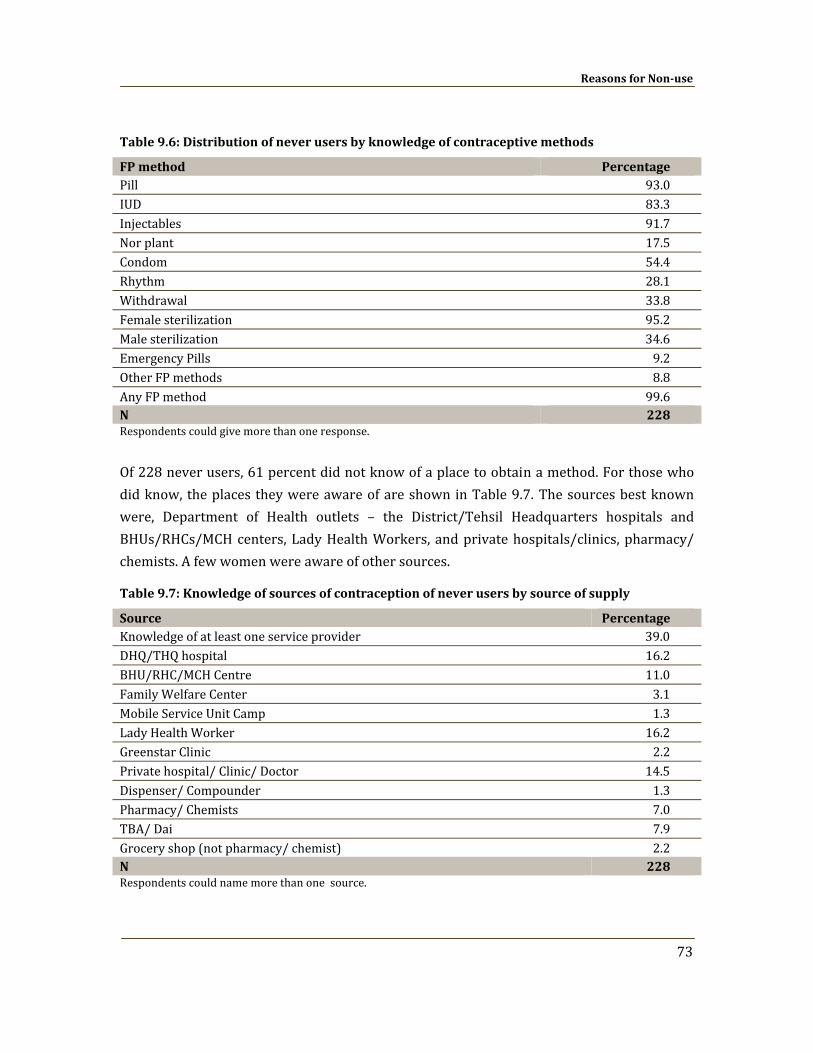
Reasons for Nonuse
73
Table 9.6: Distribution of never users by knowledge of contraceptive methods
FP method Percentage Pill 93.0 IUD 83.3 Injectables 91.7 Nor plant 17.5 Condom 54.4 Rhythm 28.1 Withdrawal 33.8 Female sterilization 95.2 Male sterilization 34.6 Emergency Pills 9.2 Other FP methods 8.8 Any FP method 99.6 N 228 Respondents could give more than one response.
Of 228 never users, 61 percent did not know of a place to obtain a method. For those who did know, the places they were aware of are shown in Table 9.7. The sources best known were, Department of Health outlets – the District/Tehsil Headquarters hospitals and BHUs/RHCs/MCH centers, Lady Health Workers, and private hospitals/clinics, pharmacy/ chemists. A few women were aware of other sources.
Table 9.7: Knowledge of sources of contraception of never users by source of supply
Source Percentage Knowledge of at least one service provider 39.0 DHQ/THQ hospital 16.2 BHU/RHC/MCH Centre 11.0 Family Welfare Center 3.1 Mobile Service Unit Camp 1.3 Lady Health Worker 16.2 Greenstar Clinic 2.2 Private hospital/ Clinic/ Doctor 14.5 Dispenser/ Compounder 1.3 Pharmacy/ Chemists 7.0 TBA/ Dai 7.9 Grocery shop (not pharmacy/ chemist) 2.2 N 228 Respondents could name more than one source.
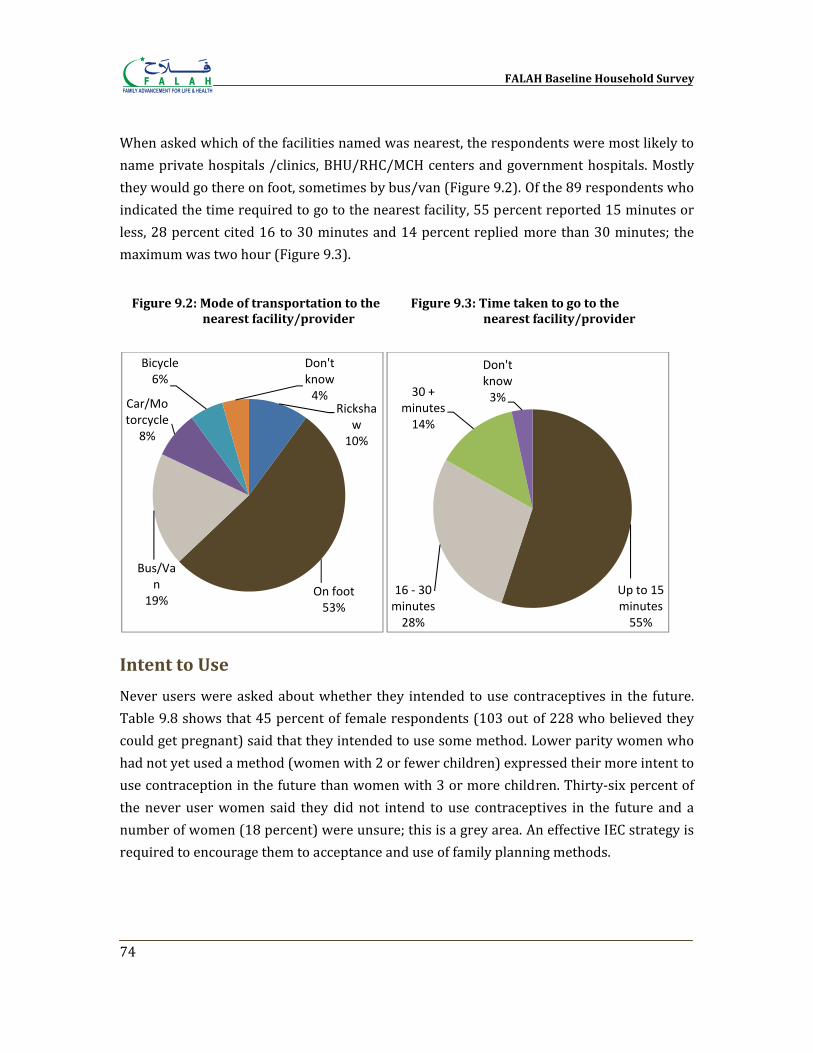
FALAH Baseline Household Survey
74
When asked which of the facilities named was nearest, the respondents were most likely to name private hospitals /clinics, BHU/RHC/MCH centers and government hospitals. Mostly they would go there on foot, sometimes by bus/van (Figure 9.2). Of the 89 respondents who indicated the time required to go to the nearest facility, 55 percent reported 15 minutes or less, 28 percent cited 16 to 30 minutes and 14 percent replied more than 30 minutes; the maximum was two hour (Figure 9.3).
Intent to Use
Never users were asked about whether they intended to use contraceptives in the future. Table 9.8 shows that 45 percent of female respondents (103 out of 228 who believed they could get pregnant) said that they intended to use some method. Lower parity women who had not yet used a method (women with 2 or fewer children) expressed their more intent to use contraception in the future than women with 3 or more children. Thirty‐six percent of the never user women said they did not intend to use contraceptives in the future and a number of women (18 percent) were unsure; this is a grey area. An effective IEC strategy is required to encourage them to acceptance and use of family planning methods.
Rickshaw
10%
On foot53%
Bus/Van
19%
Car/Motorcycle8%
Bicycle6%
Don't know4%
Up to 15 minutes55%
16 ‐ 30 minutes28%
30 + minutes14%
Don't know3%
Figure 9.2: Mode of transportation to the nearest facility/provider
Figure 9.3: Time taken to go to the nearest facility/provider
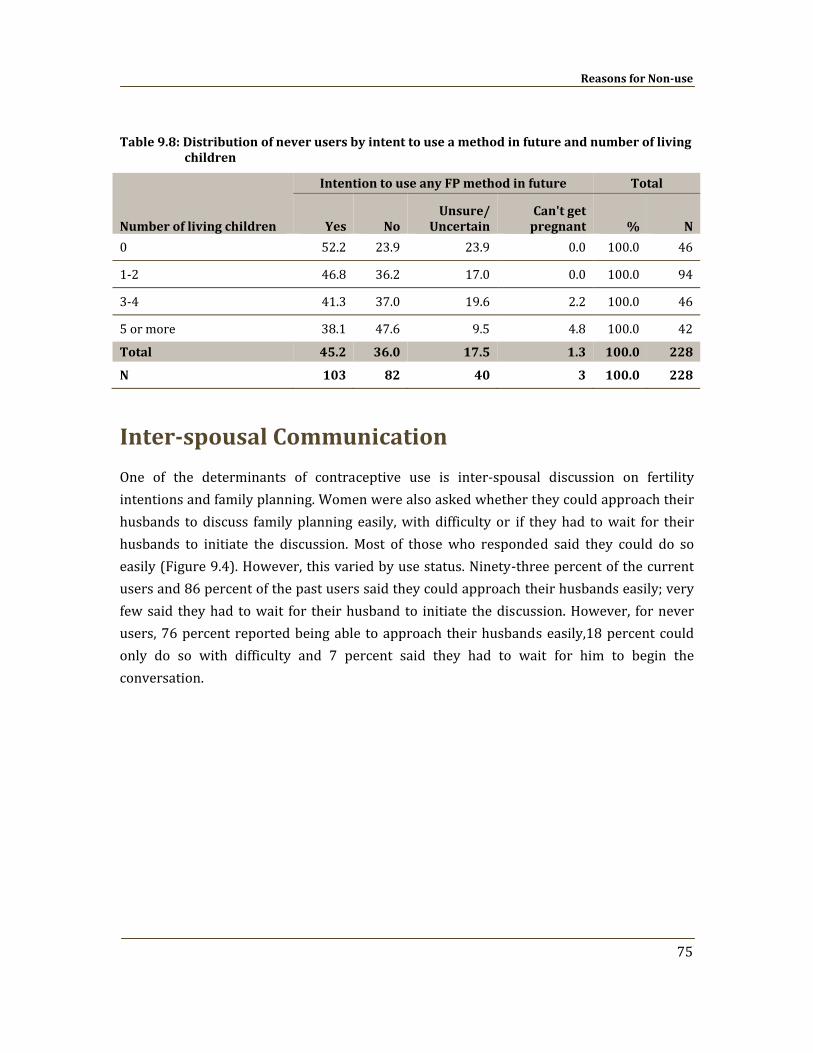
Reasons for Nonuse
75
Table 9.8: Distribution of never users by intent to use a method in future and number of living children
Number of living children
Intention to use any FP method in future Total
Yes No Unsure/
Uncertain Can't get pregnant % N
0 52.2 23.9 23.9 0.0 100.0 46
1‐2 46.8 36.2 17.0 0.0 100.0 94
3‐4 41.3 37.0 19.6 2.2 100.0 46
5 or more 38.1 47.6 9.5 4.8 100.0 42
Total 45.2 36.0 17.5 1.3 100.0 228
N 103 82 40 3 100.0 228
Interspousal Communication
One of the determinants of contraceptive use is inter‐spousal discussion on fertility intentions and family planning. Women were also asked whether they could approach their husbands to discuss family planning easily, with difficulty or if they had to wait for their husbands to initiate the discussion. Most of those who responded said they could do so easily (Figure 9.4). However, this varied by use status. Ninety‐three percent of the current users and 86 percent of the past users said they could approach their husbands easily; very few said they had to wait for their husband to initiate the discussion. However, for never users, 76 percent reported being able to approach their husbands easily,18 percent could only do so with difficulty and 7 percent said they had to wait for him to begin the conversation.
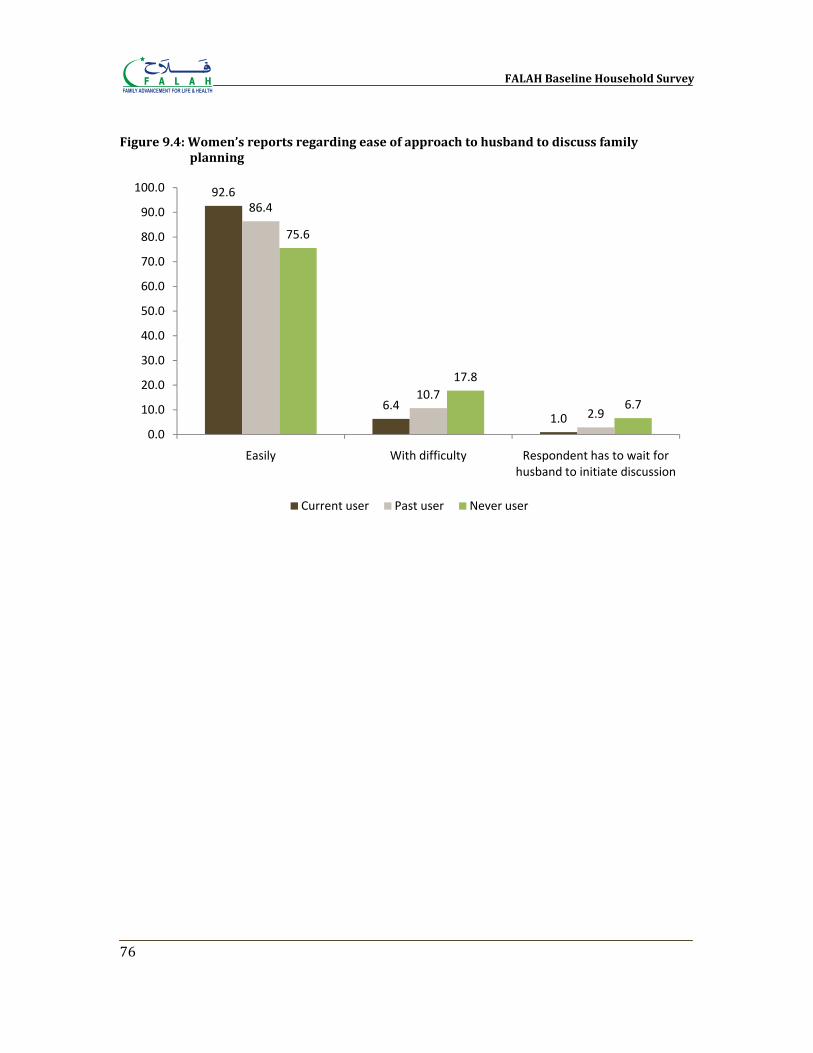
FALAH Baseline Household Survey
76
Figure 9.4: Women’s reports regarding ease of approach to husband to discuss family planning
92.6
6.41.0
86.4
10.7
2.9
75.6
17.8
6.7
0.0
10.0
20.0
30.0
40.0
50.0
60.0
70.0
80.0
90.0
100.0
Easily With difficulty Respondent has to wait for husband to initiate discussion
Current user Past user Never user
Chapter 10
Unmet Need
“Unmet need” for family planning is a term long used to help focus attention in a family planning program on those who need it. Conceptually, unmet need refers to women who say they do not want more children, or want them later, and are at risk of conceiving, but are not currently using contraceptives. Women currently pregnant or who are experiencing postpartum amenorrhea are said (in this formulation) to be in unmet need if their current (if pregnant) or last (if amenorrheic) pregnancy was said to be unwanted or mistimed. Women who want to delay their next pregnancy are said to be in unmet need of spacing; those who do not want more children at all are said to be in unmet need of limiting. Women in unmet need in this sense are those for whom there is an inconsistency between what they say they want and what they are doing; these women would appear to be in need of some support to avoid unwanted pregnancies.
Levels and Correlates
Table 10.1 shows the levels of unmet need for spacing and limiting among married women of reproductive age in Bahawalpur. Of the 538 women, 31 percent were judged to be in unmet need. This proportion is lower than is typically found in Pakistan, where unmeet need tends to be around 37 percent of MWRA. Of the 31 percent of the women who had unmet need, 11 percent were for spacing and 20 percent for limiting. Unmet need for spacing was concentrated among younger women and women with one or two children. Unmet need for limiting, unsurprisingly, was highest among women with five or more children, because at that stage couples do not want to have more children.
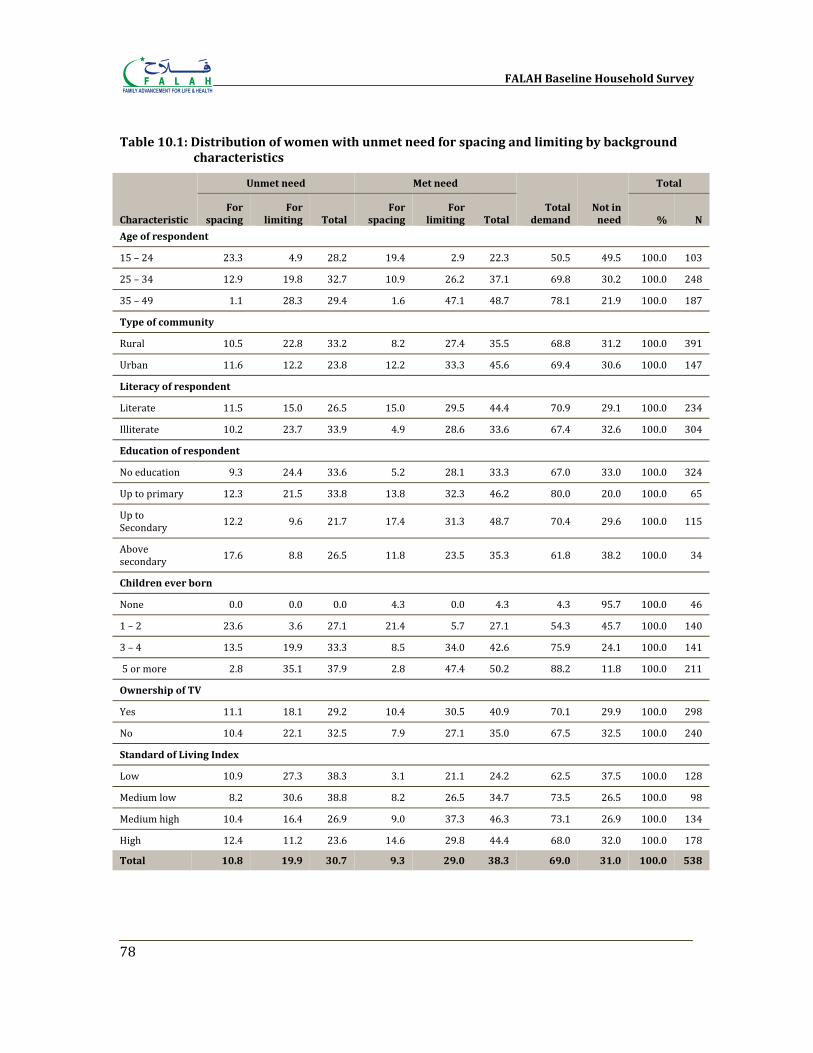
FALAH Baseline Household Survey
78
Table 10.1: Distribution of women with unmet need for spacing and limiting by background characteristics
Characteristic
Unmet need Met need
Total demand
Not in need
Total
For spacing
For limiting Total
For spacing
For limiting Total % N
Age of respondent
15 – 24 23.3 4.9 28.2 19.4 2.9 22.3 50.5 49.5 100.0 103
25 – 34 12.9 19.8 32.7 10.9 26.2 37.1 69.8 30.2 100.0 248
35 – 49 1.1 28.3 29.4 1.6 47.1 48.7 78.1 21.9 100.0 187
Type of community
Rural 10.5 22.8 33.2 8.2 27.4 35.5 68.8 31.2 100.0 391
Urban 11.6 12.2 23.8 12.2 33.3 45.6 69.4 30.6 100.0 147
Literacy of respondent
Literate 11.5 15.0 26.5 15.0 29.5 44.4 70.9 29.1 100.0 234
Illiterate 10.2 23.7 33.9 4.9 28.6 33.6 67.4 32.6 100.0 304
Education of respondent
No education 9.3 24.4 33.6 5.2 28.1 33.3 67.0 33.0 100.0 324
Up to primary 12.3 21.5 33.8 13.8 32.3 46.2 80.0 20.0 100.0 65
Up to Secondary 12.2 9.6 21.7 17.4 31.3 48.7 70.4 29.6 100.0 115
Above secondary 17.6 8.8 26.5 11.8 23.5 35.3 61.8 38.2 100.0 34
Children ever born
None 0.0 0.0 0.0 4.3 0.0 4.3 4.3 95.7 100.0 46
1 – 2 23.6 3.6 27.1 21.4 5.7 27.1 54.3 45.7 100.0 140
3 – 4 13.5 19.9 33.3 8.5 34.0 42.6 75.9 24.1 100.0 141
5 or more 2.8 35.1 37.9 2.8 47.4 50.2 88.2 11.8 100.0 211
Ownership of TV
Yes 11.1 18.1 29.2 10.4 30.5 40.9 70.1 29.9 100.0 298
No 10.4 22.1 32.5 7.9 27.1 35.0 67.5 32.5 100.0 240
Standard of Living Index
Low 10.9 27.3 38.3 3.1 21.1 24.2 62.5 37.5 100.0 128
Medium low 8.2 30.6 38.8 8.2 26.5 34.7 73.5 26.5 100.0 98
Medium high 10.4 16.4 26.9 9.0 37.3 46.3 73.1 26.9 100.0 134
High 12.4 11.2 23.6 14.6 29.8 44.4 68.0 32.0 100.0 178
Total 10.8 19.9 30.7 9.3 29.0 38.3 69.0 31.0 100.0 538
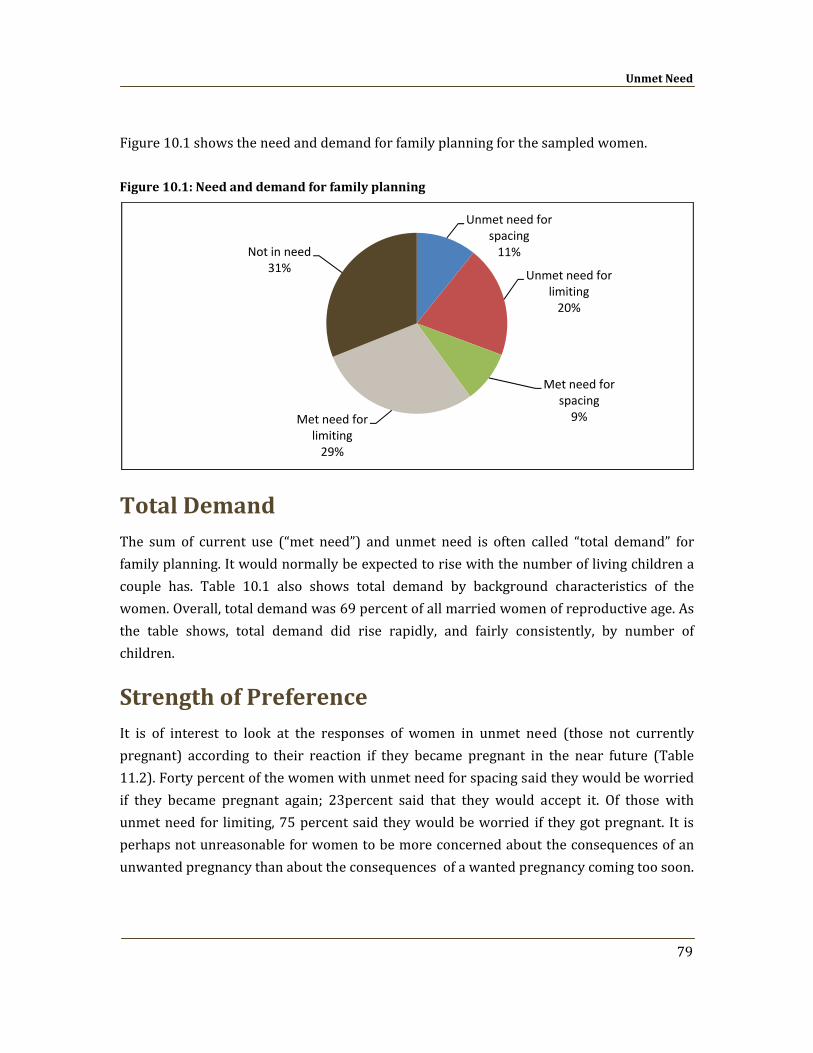
Unmet Need
79
Figure 10.1 shows the need and demand for family planning for the sampled women.
Figure 10.1: Need and demand for family planning
Total Demand The sum of current use (“met need”) and unmet need is often called “total demand” for family planning. It would normally be expected to rise with the number of living children a couple has. Table 10.1 also shows total demand by background characteristics of the women. Overall, total demand was 69 percent of all married women of reproductive age. As the table shows, total demand did rise rapidly, and fairly consistently, by number of children.
Strength of Preference It is of interest to look at the responses of women in unmet need (those not currently pregnant) according to their reaction if they became pregnant in the near future (Table 11.2). Forty percent of the women with unmet need for spacing said they would be worried if they became pregnant again; 23percent said that they would accept it. Of those with unmet need for limiting, 75 percent said they would be worried if they got pregnant. It is perhaps not unreasonable for women to be more concerned about the consequences of an unwanted pregnancy than about the consequences of a wanted pregnancy coming too soon.
Unmet need for spacing11%
Unmet need for limiting20%
Met need for spacing9%Met need for
limiting29%
Not in need31%
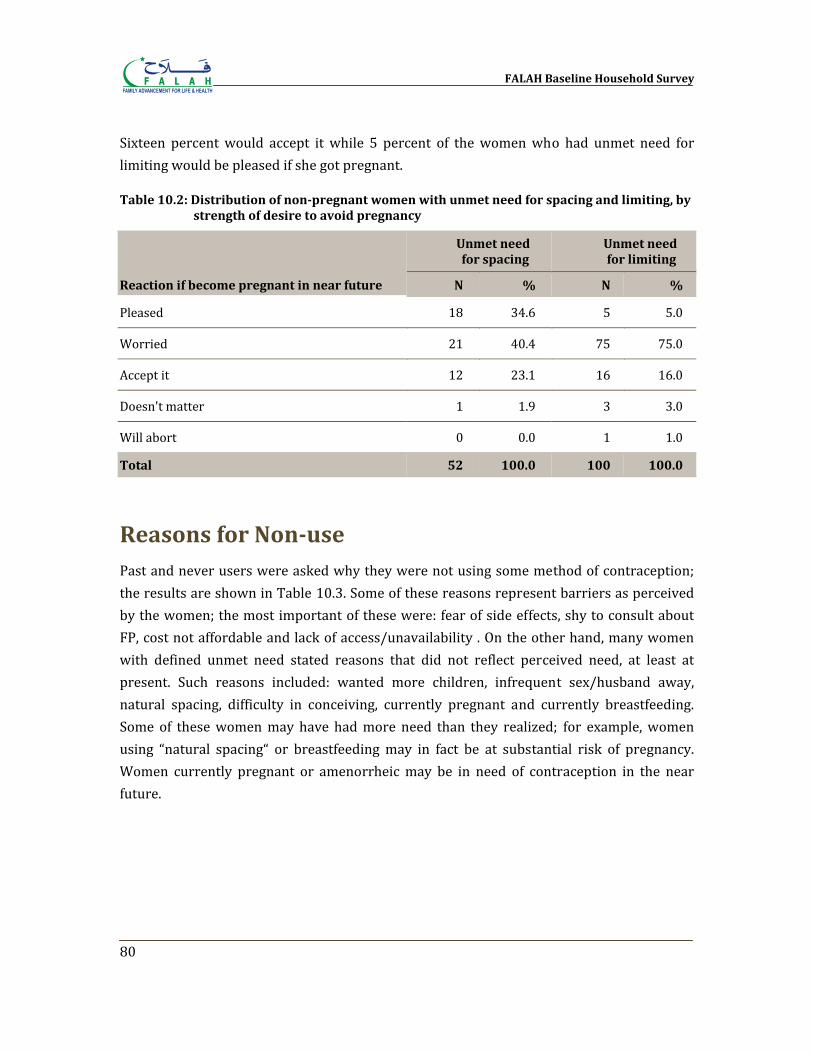
FALAH Baseline Household Survey
80
Sixteen percent would accept it while 5 percent of the women who had unmet need for limiting would be pleased if she got pregnant.
Table 10.2: Distribution of nonpregnant women with unmet need for spacing and limiting, by strength of desire to avoid pregnancy
Reaction if become pregnant in near future
Unmet need for spacing
Unmet need for limiting
N % N %
Pleased 18 34.6 5 5.0
Worried 21 40.4 75 75.0
Accept it 12 23.1 16 16.0
Doesn't matter 1 1.9 3 3.0
Will abort 0 0.0 1 1.0
Total 52 100.0 100 100.0
Reasons for Nonuse Past and never users were asked why they were not using some method of contraception; the results are shown in Table 10.3. Some of these reasons represent barriers as perceived by the women; the most important of these were: fear of side effects, shy to consult about FP, cost not affordable and lack of access/unavailability . On the other hand, many women with defined unmet need stated reasons that did not reflect perceived need, at least at present. Such reasons included: wanted more children, infrequent sex/husband away, natural spacing, difficulty in conceiving, currently pregnant and currently breastfeeding. Some of these women may have had more need than they realized; for example, women using “natural spacing“ or breastfeeding may in fact be at substantial risk of pregnancy. Women currently pregnant or amenorrheic may be in need of contraception in the near future.
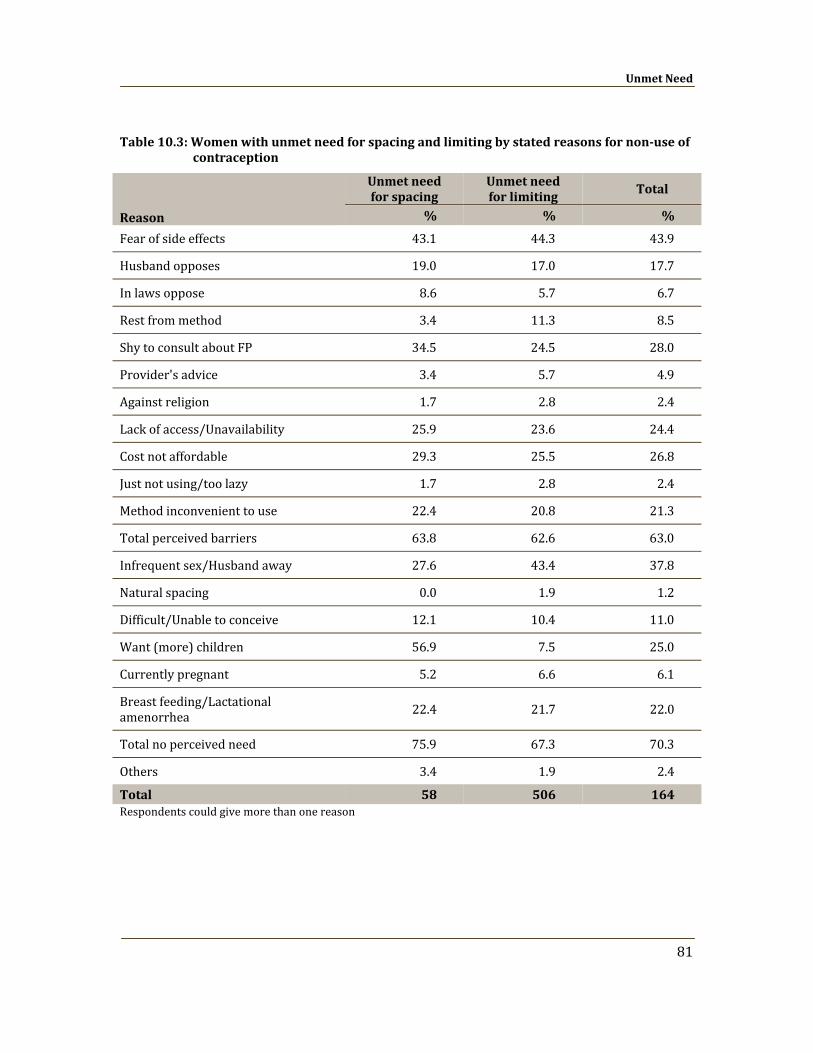
Unmet Need
81
Table 10.3: Women with unmet need for spacing and limiting by stated reasons for nonuse of contraception
Respondents could give more than one reason
Reason
Unmet need for spacing
Unmet need for limiting
Total
% % %
Fear of side effects 43.1 44.3 43.9
Husband opposes 19.0 17.0 17.7
In laws oppose 8.6 5.7 6.7
Rest from method 3.4 11.3 8.5
Shy to consult about FP 34.5 24.5 28.0
Provider's advice 3.4 5.7 4.9
Against religion 1.7 2.8 2.4
Lack of access/Unavailability 25.9 23.6 24.4
Cost not affordable 29.3 25.5 26.8
Just not using/too lazy 1.7 2.8 2.4
Method inconvenient to use 22.4 20.8 21.3
Total perceived barriers 63.8 62.6 63.0
Infrequent sex/Husband away 27.6 43.4 37.8
Natural spacing 0.0 1.9 1.2
Difficult/Unable to conceive 12.1 10.4 11.0
Want (more) children 56.9 7.5 25.0
Currently pregnant 5.2 6.6 6.1
Breast feeding/Lactational amenorrhea 22.4 21.7 22.0
Total no perceived need 75.9 67.3 70.3
Others 3.4 1.9 2.4
Total 58 506 164
FALAH Baseline Household Survey
82
Unmet Need for Spacing: Profile
Women with unmet need for spacing comprise 10.8 percent of MWRA. As shown in Table 10.4, they were characterized by:
• Living Children: Most (66 percent) had 1 or 2 living children.
• Family Planning Use: More never users (74 percent) than past users (26 percent).
• Strength of Preference: Low (40 percent “worried” if they became pregnant earlier than they wanted compared to those who were pleased (35 percent) or would accept (23 percent) the unwanted pregnancy).
• Intent to use FP method in Future: High (59 percent intended to use an FP method in future).
• Approval of FP: High (85 percent approved of using an FP method for spacing purpose).
• FP Communication with Husband: Moderate (35 percent had communicated with husbands on FP in the past one year; while 19 percent said approaching the husband was “difficult”).
• Obstacles to FP Use: Fear of side effects (43 percent); husband and in‐laws opposition (19 percent and 9 percent respectively) (Table 10.3).
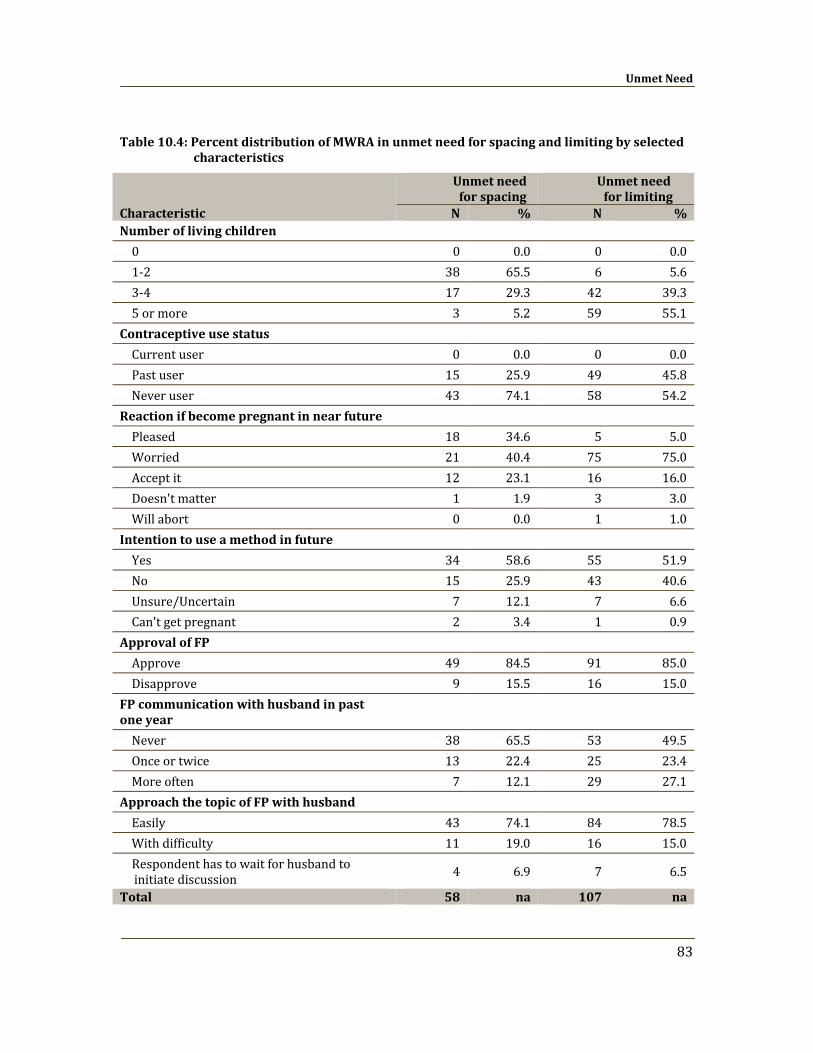
Unmet Need
83
Table 10.4: Percent distribution of MWRA in unmet need for spacing and limiting by selected characteristics
Characteristic
Unmet need for spacing
Unmet need for limiting
N % N % Number of living children
0 0 0.0 0 0.01‐2 38 65.5 6 5.63‐4 17 29.3 42 39.35 or more 3 5.2 59 55.1
Contraceptive use status
Current user 0 0.0 0 0.0Past user 15 25.9 49 45.8Never user 43 74.1 58 54.2
Reaction if become pregnant in near future
Pleased 18 34.6 5 5.0Worried 21 40.4 75 75.0Accept it 12 23.1 16 16.0Doesn't matter 1 1.9 3 3.0Will abort 0 0.0 1 1.0
Intention to use a method in future
Yes 34 58.6 55 51.9No 15 25.9 43 40.6Unsure/Uncertain 7 12.1 7 6.6Can't get pregnant 2 3.4 1 0.9
Approval of FP
Approve 49 84.5 91 85.0Disapprove 9 15.5 16 15.0
FP communication with husband in past one year Never 38 65.5 53 49.5Once or twice 13 22.4 25 23.4More often 7 12.1 29 27.1
Approach the topic of FP with husband
Easily 43 74.1 84 78.5With difficulty 11 19.0 16 15.0Respondent has to wait for husband to initiate discussion 4 6.9 7 6.5
Total 58 na 107 na
FALAH Baseline Household Survey
84
Unmet Need for Limiting: Profile Women with unmet need for limiting comprise 19.9 percent of MWRA. As shown in Table 10.4, they were characterized by:
• Living Children: A strongly positive association with number of living children;55 percent had 5+ living children.
• Family Planning Use: More never users ((54 percent )than past users( 46 percent)
• Strength of Preference: High (75 percent would be “worried” if they became pregnant compared to those who would accept (16 percent) the unwanted pregnancy.
• Intent to use FP method in Future: High (52 percent intended to use an FP method in future.
• Approval of FP: High (85 percent approved of FP for limiting purpose).
• FP Communication with Husband: Moderate (51 percent had communication with husband on FP in the past year; while 15 percent said approaching the husband was “difficult”).
• Obstacles to FP Use: Fear of side effects (44 percent); husbands and in‐laws opposition (17 percent and 6 percent respectively) (Table 10.3).
Chapter 11
Reproductive Preferences and Behavior of
Men
It is often the case that in matters relating to family planning the focus has too often been more on women, despite the fact that husbands are equal partners in the reproductive process and often have greater responsibility for decision‐making in the family. In addition, women often mention their husbands as a constraint to the use of contraception (NIPS/PDHS, 2008; Population Council, 1995).The objectives of interviewing husbands/men in the FALAH baseline survey were to explore their perspectives on birth spacing/family planning and to use the information obtained to design the communication strategy for the FALAH project. Overall, the planned sample size was 200 husbands in each district. The intention was to interview as many husbands as possible who were available when the household interviews were undertaken. Knowing that some husbands might be at their places of work during the timing of the interviews, the plan was to then make up for any of the husbands who were unavailable by interviewing other married men available in the selected communities in order to come as close as possible to meeting the objective of interviewing 200 husbands/men in each FALAH district. In Bahawalpur, the field team was able to interview 171 men who were husbands of the married women of reproductive age interviewed for the survey plus 29 married men living in selected areas but were not husbands of the female respondents. In this chapter, the results for the respondents’ husbands and the other married men who were interviewed (N = 200) are always grouped together, whether the reference is to “men,” “male respondents,” “married men,” or “husbands.”
A husband’s approval of family planning is a powerful factor in explaining contraceptive use (Tawiah, 1997). In families, fertility decisions occur within specific social contexts and according to prevailing social norms that restrict individual decisions on fertility and
FALAH Baseline Household Survey
86
behaviors related to spacing of births, stopping childbearing and using contraception. Earlier studies suggest that the husband’s approval of and discussion about family planning are important predictors of a woman’s contraceptive use and fertility desire (Bongaarts and Bruce, 1995; Mahmood and Ringheim, 1997).
This baseline survey investigates social and demographic differentials, and knowledge, ever use and current use of family planning methods. It also explores how approval and discussion of birth spacing/family planning influence the use of contraceptive methods. Traditionally, the measurement of contraceptive use has been based on women's self‐reports of current use. The rationale for interviewing men was to investigate their perspective on the issues of fertility and family planning.
Background Characteristics
Table 11.1 shows the background characteristics of the men interviewed in the survey. It shows that 8 percent of the men were under 25 years of age and only 2 percent were 50 years of age and above.
As shown in Table 11.1, the men were much better educated than the sampled currently married women of reproductive age. Thirty‐one percent of the men had not been to school, compared to 60 percent of the currently married women (Table 3.2). It also shows that only 10 percent of the men had above secondary education, whereas 6 percent of the currently married women had attained that level of education (Table 3.2).
The occupations of men are also presented in Table 11.1.The highest proportion (38 percent) of men were engaged in agriculture/livestock/poultry,24 percent were laborers while 24 percent were also running their own business. Interestingly, unemployment was very low, only 0.5 percent.
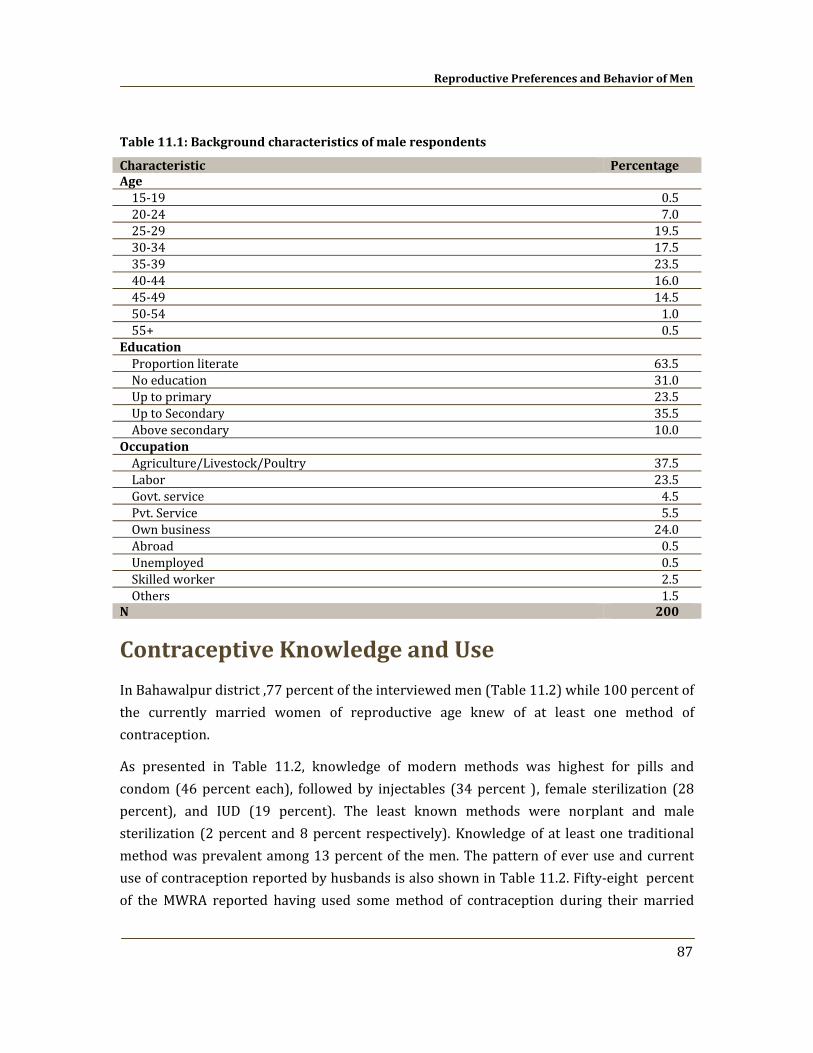
Reproductive Preferences and Behavior of Men
87
Table 11.1: Background characteristics of male respondents
Characteristic Percentage Age 15‐19 0.520‐24 7.025‐29 19.530‐34 17.535‐39 23.540‐44 16.045‐49 14.550‐54 1.055+ 0.5
Education Proportion literate 63.5No education 31.0Up to primary 23.5Up to Secondary 35.5Above secondary 10.0
Occupation Agriculture/Livestock/Poultry 37.5Labor 23.5Govt. service 4.5Pvt. Service 5.5Own business 24.0Abroad 0.5Unemployed 0.5Skilled worker 2.5Others 1.5
N 200
Contraceptive Knowledge and Use
In Bahawalpur district ,77 percent of the interviewed men (Table 11.2) while 100 percent of the currently married women of reproductive age knew of at least one method of contraception.
As presented in Table 11.2, knowledge of modern methods was highest for pills and condom (46 percent each), followed by injectables (34 percent ), female sterilization (28 percent), and IUD (19 percent). The least known methods were norplant and male sterilization (2 percent and 8 percent respectively). Knowledge of at least one traditional method was prevalent among 13 percent of the men. The pattern of ever use and current use of contraception reported by husbands is also shown in Table 11.2. Fifty‐eight percent of the MWRA reported having used some method of contraception during their married
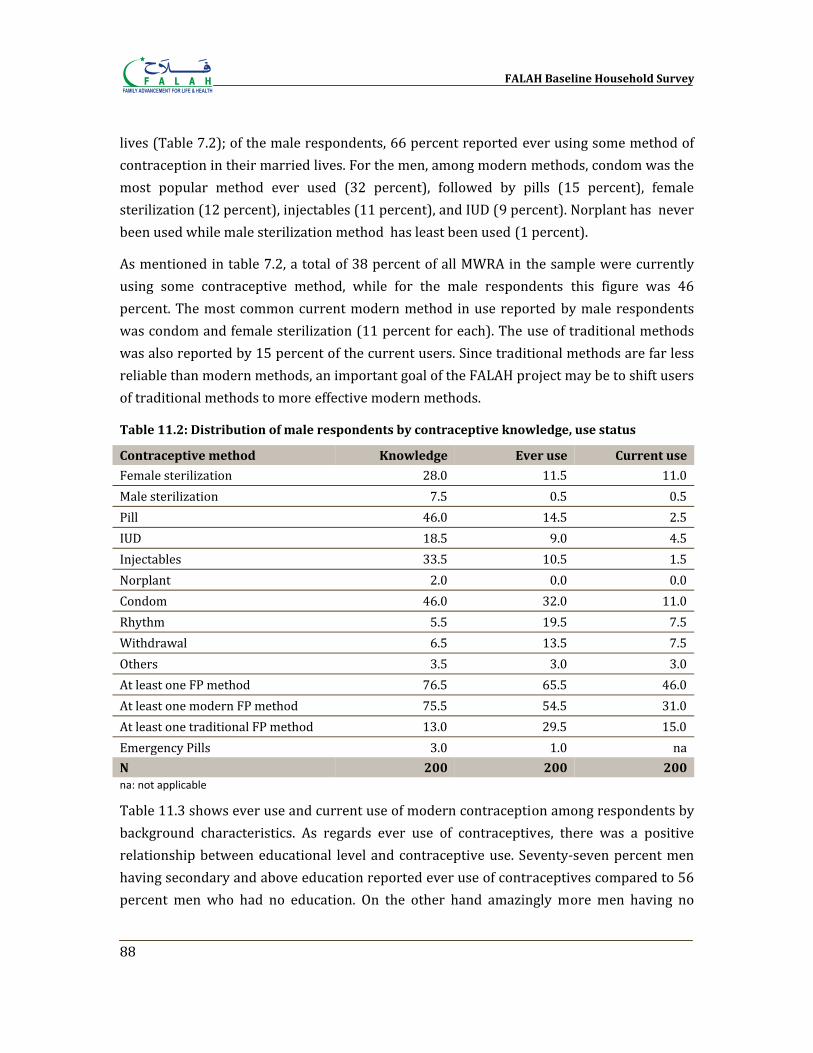
FALAH Baseline Household Survey
88
lives (Table 7.2); of the male respondents, 66 percent reported ever using some method of contraception in their married lives. For the men, among modern methods, condom was the most popular method ever used (32 percent), followed by pills (15 percent), female sterilization (12 percent), injectables (11 percent), and IUD (9 percent). Norplant has never been used while male sterilization method has least been used (1 percent).
As mentioned in table 7.2, a total of 38 percent of all MWRA in the sample were currently using some contraceptive method, while for the male respondents this figure was 46 percent. The most common current modern method in use reported by male respondents was condom and female sterilization (11 percent for each). The use of traditional methods was also reported by 15 percent of the current users. Since traditional methods are far less reliable than modern methods, an important goal of the FALAH project may be to shift users of traditional methods to more effective modern methods.
Table 11.2: Distribution of male respondents by contraceptive knowledge, use status
Contraceptive method Knowledge Ever use Current use
Female sterilization 28.0 11.5 11.0Male sterilization 7.5 0.5 0.5Pill 46.0 14.5 2.5IUD 18.5 9.0 4.5Injectables 33.5 10.5 1.5Norplant 2.0 0.0 0.0Condom 46.0 32.0 11.0Rhythm 5.5 19.5 7.5Withdrawal 6.5 13.5 7.5Others 3.5 3.0 3.0At least one FP method 76.5 65.5 46.0At least one modern FP method 75.5 54.5 31.0At least one traditional FP method 13.0 29.5 15.0Emergency Pills 3.0 1.0 naN 200 200 200 na: not applicable
Table 11.3 shows ever use and current use of modern contraception among respondents by background characteristics. As regards ever use of contraceptives, there was a positive relationship between educational level and contraceptive use. Seventy‐seven percent men having secondary and above education reported ever use of contraceptives compared to 56 percent men who had no education. On the other hand amazingly more men having no
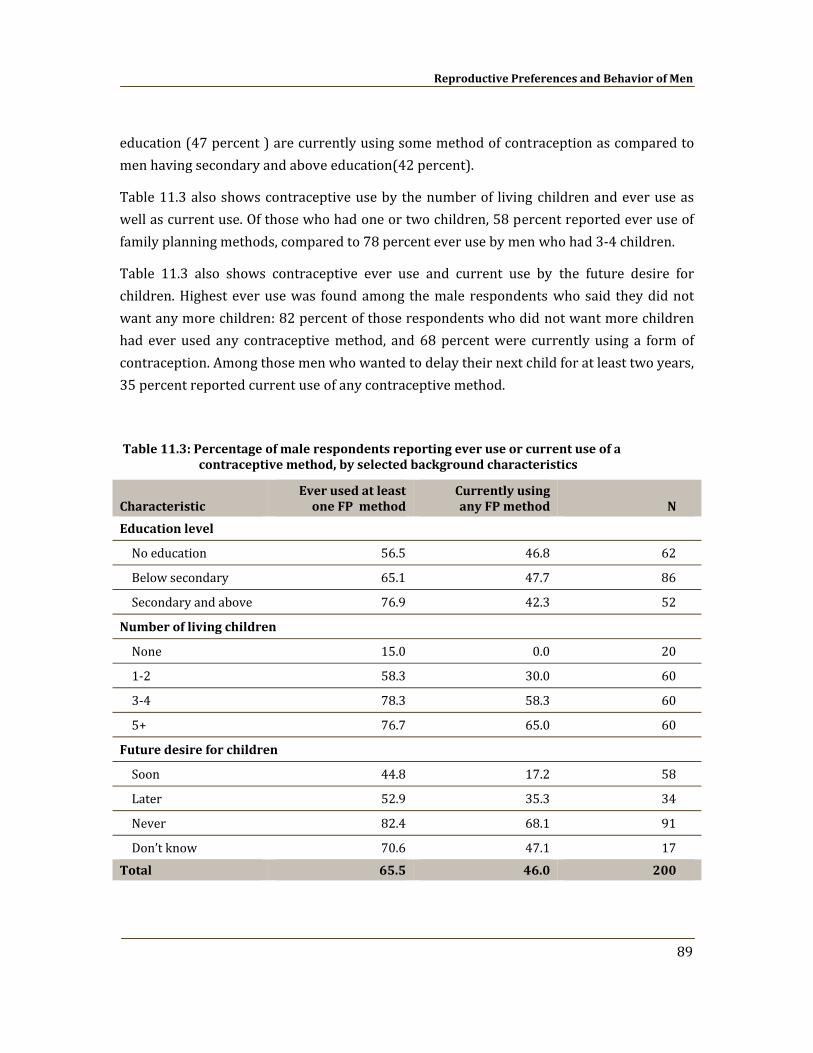
Reproductive Preferences and Behavior of Men
89
education (47 percent ) are currently using some method of contraception as compared to men having secondary and above education(42 percent).
Table 11.3 also shows contraceptive use by the number of living children and ever use as well as current use. Of those who had one or two children, 58 percent reported ever use of family planning methods, compared to 78 percent ever use by men who had 3‐4 children.
Table 11.3 also shows contraceptive ever use and current use by the future desire for children. Highest ever use was found among the male respondents who said they did not want any more children: 82 percent of those respondents who did not want more children had ever used any contraceptive method, and 68 percent were currently using a form of contraception. Among those men who wanted to delay their next child for at least two years, 35 percent reported current use of any contraceptive method.
Table 11.3: Percentage of male respondents reporting ever use or current use of a contraceptive method, by selected background characteristics
Characteristic Ever used at least one FP method
Currently using any FP method N
Education level
No education 56.5 46.8 62
Below secondary 65.1 47.7 86
Secondary and above 76.9 42.3 52
Number of living children
None 15.0 0.0 20
1‐2 58.3 30.0 60
3‐4 78.3 58.3 60
5+ 76.7 65.0 60
Future desire for children
Soon 44.8 17.2 58
Later 52.9 35.3 34
Never 82.4 68.1 91
Don’t know 70.6 47.1 17 Total 65.5 46.0 200
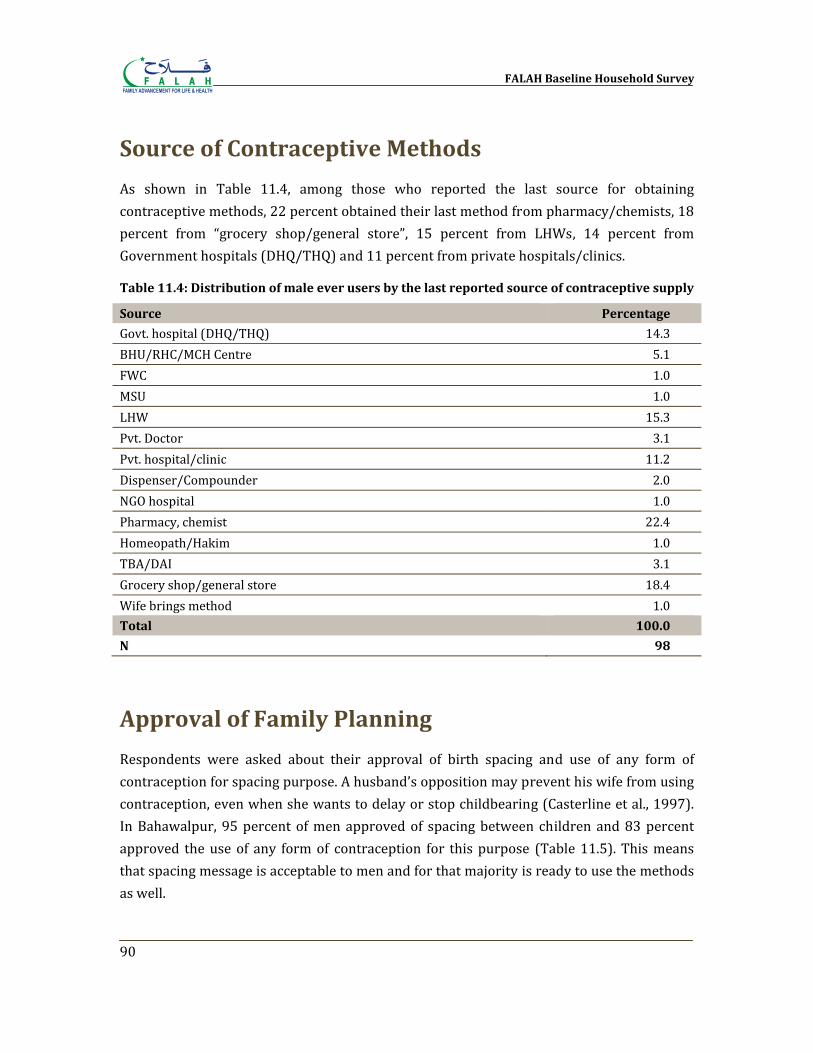
FALAH Baseline Household Survey
90
Source of Contraceptive Methods
As shown in Table 11.4, among those who reported the last source for obtaining contraceptive methods, 22 percent obtained their last method from pharmacy/chemists, 18 percent from “grocery shop/general store”, 15 percent from LHWs, 14 percent from Government hospitals (DHQ/THQ) and 11 percent from private hospitals/clinics.
Table 11.4: Distribution of male ever users by the last reported source of contraceptive supply
Source Percentage
Govt. hospital (DHQ/THQ) 14.3 BHU/RHC/MCH Centre 5.1 FWC 1.0 MSU 1.0 LHW 15.3 Pvt. Doctor 3.1 Pvt. hospital/clinic 11.2 Dispenser/Compounder 2.0 NGO hospital 1.0 Pharmacy, chemist 22.4 Homeopath/Hakim 1.0 TBA/DAI 3.1 Grocery shop/general store 18.4 Wife brings method 1.0 Total 100.0
N 98
Approval of Family Planning
Respondents were asked about their approval of birth spacing and use of any form of contraception for spacing purpose. A husband’s opposition may prevent his wife from using contraception, even when she wants to delay or stop childbearing (Casterline et al., 1997). In Bahawalpur, 95 percent of men approved of spacing between children and 83 percent approved the use of any form of contraception for this purpose (Table 11.5). This means that spacing message is acceptable to men and for that majority is ready to use the methods as well.
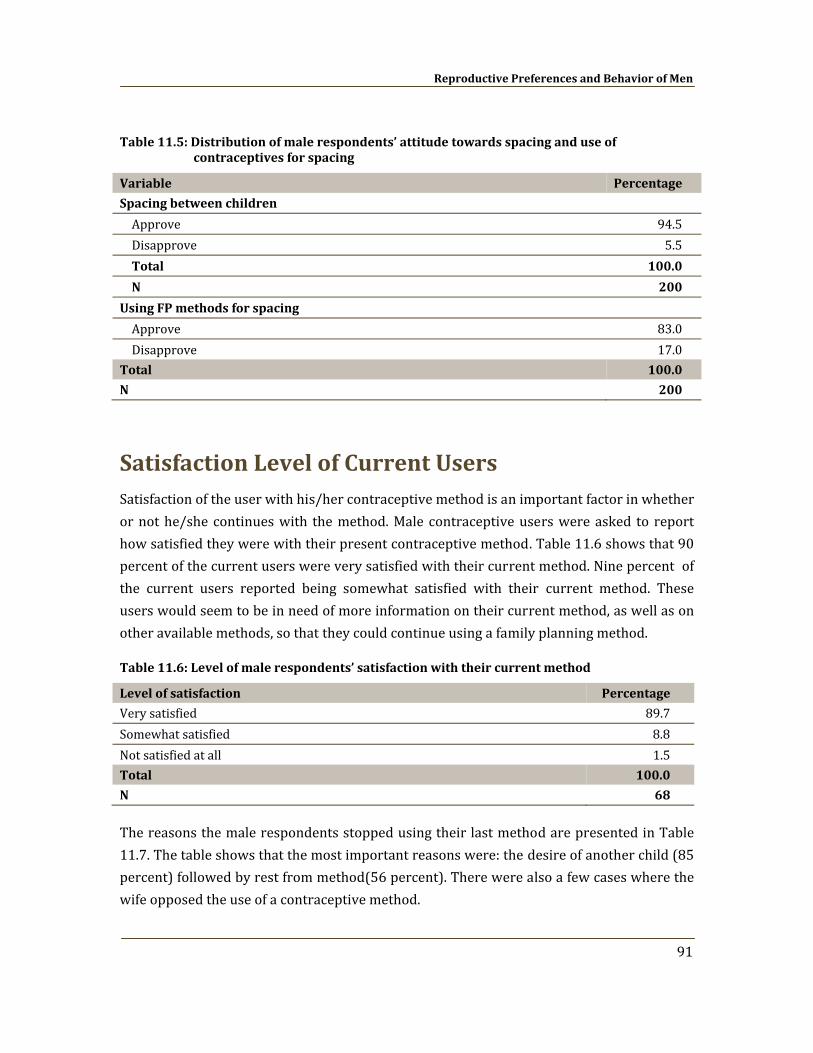
Reproductive Preferences and Behavior of Men
91
Table 11.5: Distribution of male respondents’ attitude towards spacing and use of contraceptives for spacing
Variable Percentage
Spacing between children
Approve 94.5 Disapprove 5.5 Total 100.0
N 200
Using FP methods for spacing
Approve 83.0 Disapprove 17.0
Total 100.0
N 200
Satisfaction Level of Current Users Satisfaction of the user with his/her contraceptive method is an important factor in whether or not he/she continues with the method. Male contraceptive users were asked to report how satisfied they were with their present contraceptive method. Table 11.6 shows that 90 percent of the current users were very satisfied with their current method. Nine percent of the current users reported being somewhat satisfied with their current method. These users would seem to be in need of more information on their current method, as well as on other available methods, so that they could continue using a family planning method.
Table 11.6: Level of male respondents’ satisfaction with their current method
Level of satisfaction Percentage
Very satisfied 89.7 Somewhat satisfied 8.8 Not satisfied at all 1.5 Total 100.0
N 68
The reasons the male respondents stopped using their last method are presented in Table 11.7. The table shows that the most important reasons were: the desire of another child (85 percent) followed by rest from method(56 percent). There were also a few cases where the wife opposed the use of a contraceptive method.
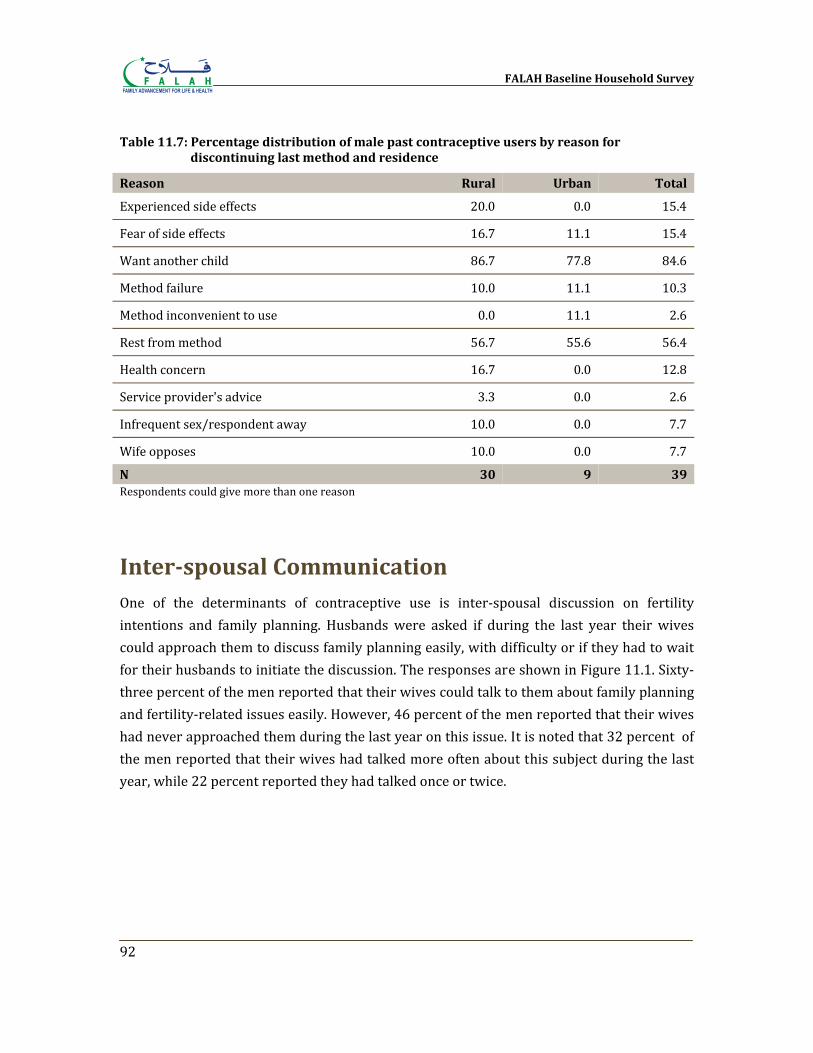
FALAH Baseline Household Survey
92
Table 11.7: Percentage distribution of male past contraceptive users by reason for discontinuing last method and residence
Reason Rural Urban Total
Experienced side effects 20.0 0.0 15.4
Fear of side effects 16.7 11.1 15.4
Want another child 86.7 77.8 84.6
Method failure 10.0 11.1 10.3
Method inconvenient to use 0.0 11.1 2.6
Rest from method 56.7 55.6 56.4
Health concern 16.7 0.0 12.8
Service provider's advice 3.3 0.0 2.6
Infrequent sex/respondent away 10.0 0.0 7.7
Wife opposes 10.0 0.0 7.7
N 30 9 39 Respondents could give more than one reason
Interspousal Communication One of the determinants of contraceptive use is inter‐spousal discussion on fertility intentions and family planning. Husbands were asked if during the last year their wives could approach them to discuss family planning easily, with difficulty or if they had to wait for their husbands to initiate the discussion. The responses are shown in Figure 11.1. Sixty‐three percent of the men reported that their wives could talk to them about family planning and fertility‐related issues easily. However, 46 percent of the men reported that their wives had never approached them during the last year on this issue. It is noted that 32 percent of the men reported that their wives had talked more often about this subject during the last year, while 22 percent reported they had talked once or twice.
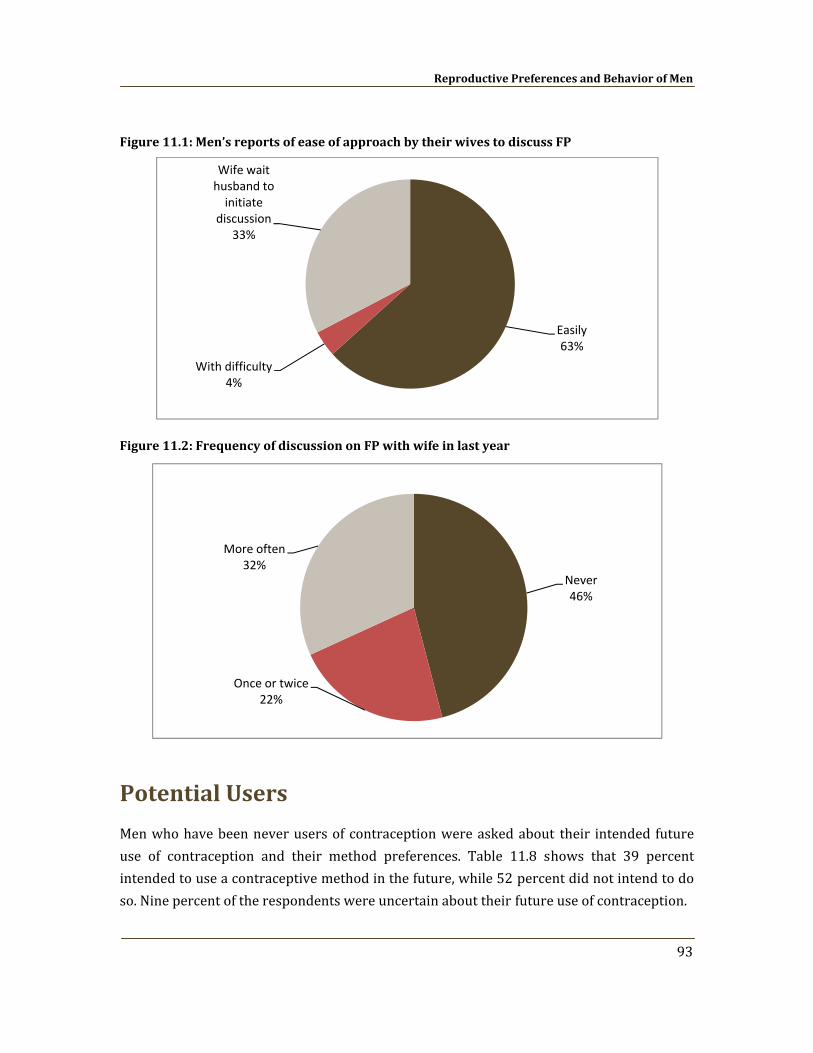
Reproductive Preferences and Behavior of Men
93
Figure 11.1: Men’s reports of ease of approach by their wives to discuss FP
Figure 11.2: Frequency of discussion on FP with wife in last year
Potential Users
Men who have been never users of contraception were asked about their intended future use of contraception and their method preferences. Table 11.8 shows that 39 percent intended to use a contraceptive method in the future, while 52 percent did not intend to do so. Nine percent of the respondents were uncertain about their future use of contraception.
Easily63%
With difficulty4%
Wife wait husband to initiate
discussion33%
Never46%
Once or twice22%
More often32%
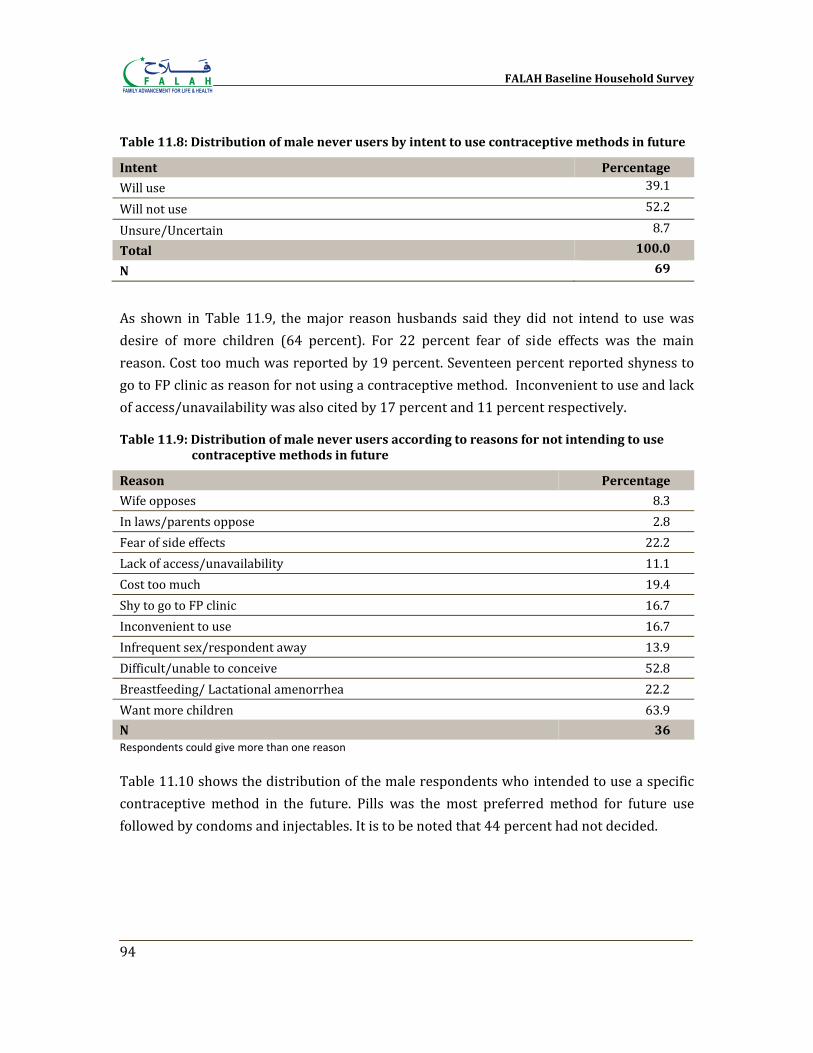
FALAH Baseline Household Survey
94
Table 11.8: Distribution of male never users by intent to use contraceptive methods in future
Intent Percentage
Will use 39.1
Will not use 52.2
Unsure/Uncertain 8.7
Total 100.0
N 69
As shown in Table 11.9, the major reason husbands said they did not intend to use was desire of more children (64 percent). For 22 percent fear of side effects was the main reason. Cost too much was reported by 19 percent. Seventeen percent reported shyness to go to FP clinic as reason for not using a contraceptive method. Inconvenient to use and lack of access/unavailability was also cited by 17 percent and 11 percent respectively.
Table 11.9: Distribution of male never users according to reasons for not intending to use contraceptive methods in future
Reason Percentage
Wife opposes 8.3 In laws/parents oppose 2.8 Fear of side effects 22.2 Lack of access/unavailability 11.1 Cost too much 19.4 Shy to go to FP clinic 16.7 Inconvenient to use 16.7 Infrequent sex/respondent away 13.9 Difficult/unable to conceive 52.8 Breastfeeding/ Lactational amenorrhea 22.2 Want more children 63.9 N 36 Respondents could give more than one reason Table 11.10 shows the distribution of the male respondents who intended to use a specific contraceptive method in the future. Pills was the most preferred method for future use followed by condoms and injectables. It is to be noted that 44 percent had not decided.
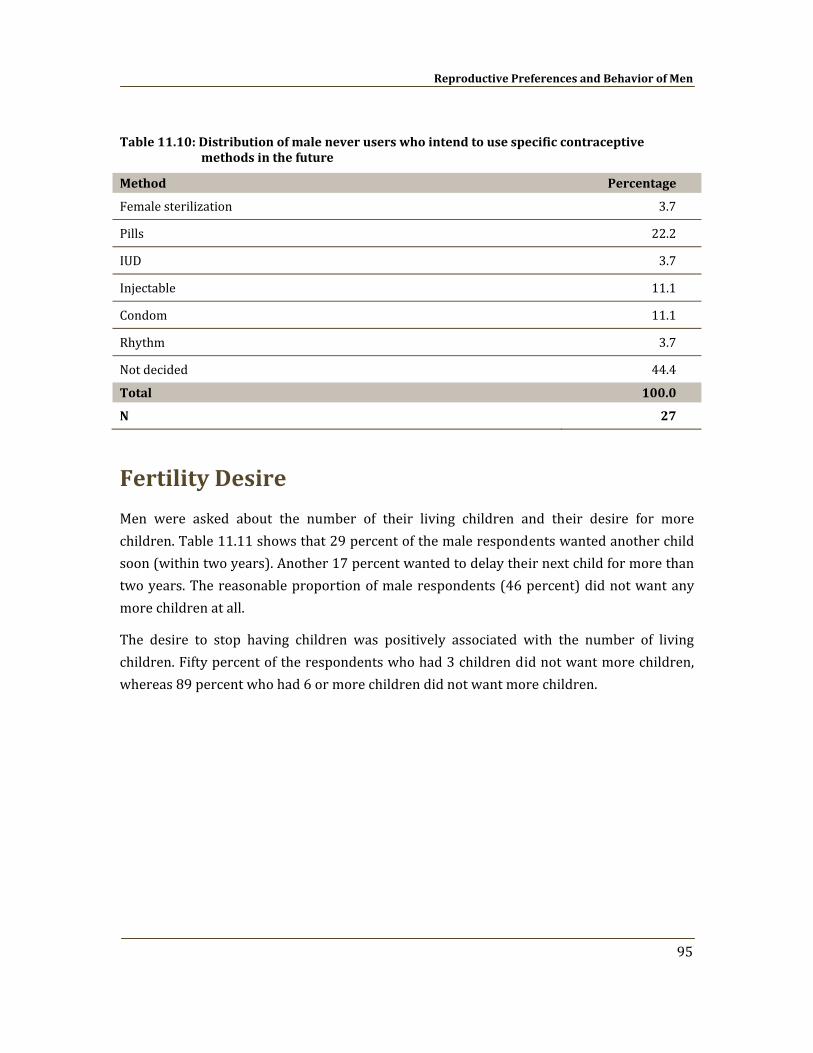
Reproductive Preferences and Behavior of Men
95
Table 11.10: Distribution of male never users who intend to use specific contraceptive methods in the future
Method Percentage
Female sterilization 3.7
Pills 22.2
IUD 3.7
Injectable 11.1
Condom 11.1
Rhythm 3.7
Not decided 44.4
Total 100.0
N 27
Fertility Desire
Men were asked about the number of their living children and their desire for more children. Table 11.11 shows that 29 percent of the male respondents wanted another child soon (within two years). Another 17 percent wanted to delay their next child for more than two years. The reasonable proportion of male respondents (46 percent) did not want any more children at all.
The desire to stop having children was positively associated with the number of living children. Fifty percent of the respondents who had 3 children did not want more children, whereas 89 percent who had 6 or more children did not want more children.
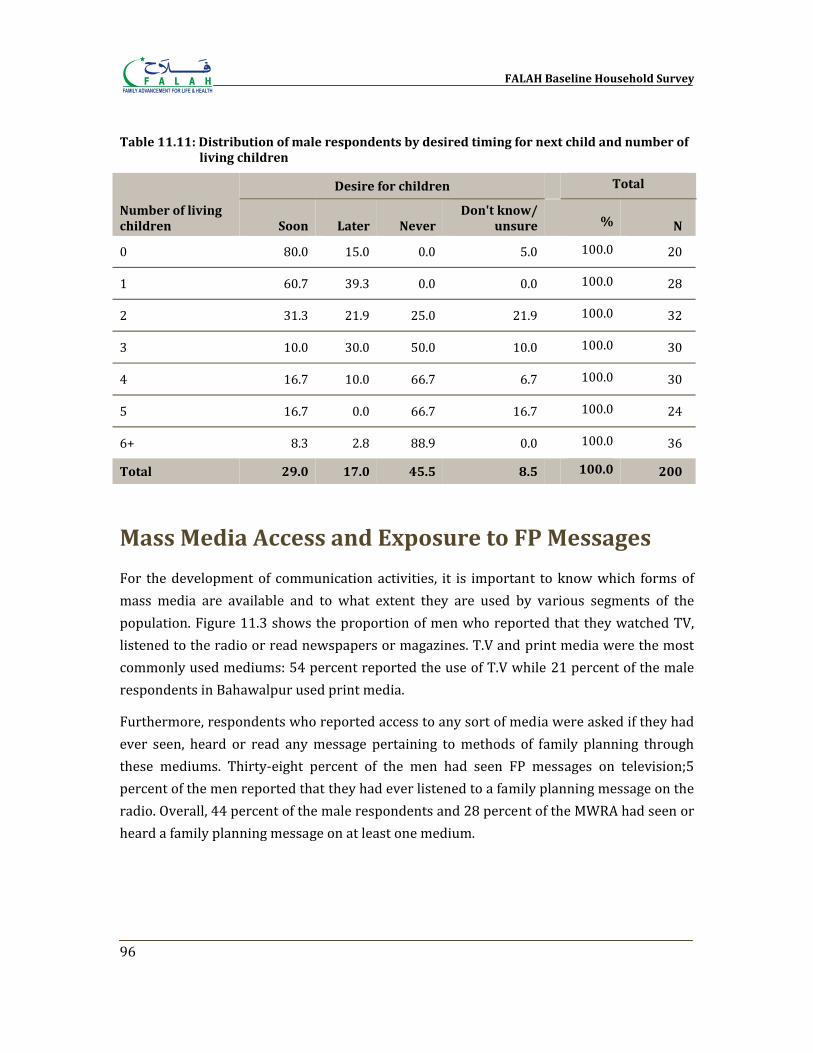
FALAH Baseline Household Survey
96
Table 11.11: Distribution of male respondents by desired timing for next child and number of living children
Number of living children
Desire for children
Total
Soon Later Never Don't know/
unsure % N
0 80.0 15.0 0.0 5.0 100.0 20
1 60.7 39.3 0.0 0.0 100.0 28
2 31.3 21.9 25.0 21.9 100.0 32
3 10.0 30.0 50.0 10.0 100.0 30
4 16.7 10.0 66.7 6.7 100.0 30
5 16.7 0.0 66.7 16.7 100.0 24
6+ 8.3 2.8 88.9 0.0 100.0 36
Total 29.0 17.0 45.5 8.5
100.0 200
Mass Media Access and Exposure to FP Messages
For the development of communication activities, it is important to know which forms of mass media are available and to what extent they are used by various segments of the population. Figure 11.3 shows the proportion of men who reported that they watched TV, listened to the radio or read newspapers or magazines. T.V and print media were the most commonly used mediums: 54 percent reported the use of T.V while 21 percent of the male respondents in Bahawalpur used print media.
Furthermore, respondents who reported access to any sort of media were asked if they had ever seen, heard or read any message pertaining to methods of family planning through these mediums. Thirty‐eight percent of the men had seen FP messages on television;5 percent of the men reported that they had ever listened to a family planning message on the radio. Overall, 44 percent of the male respondents and 28 percent of the MWRA had seen or heard a family planning message on at least one medium.
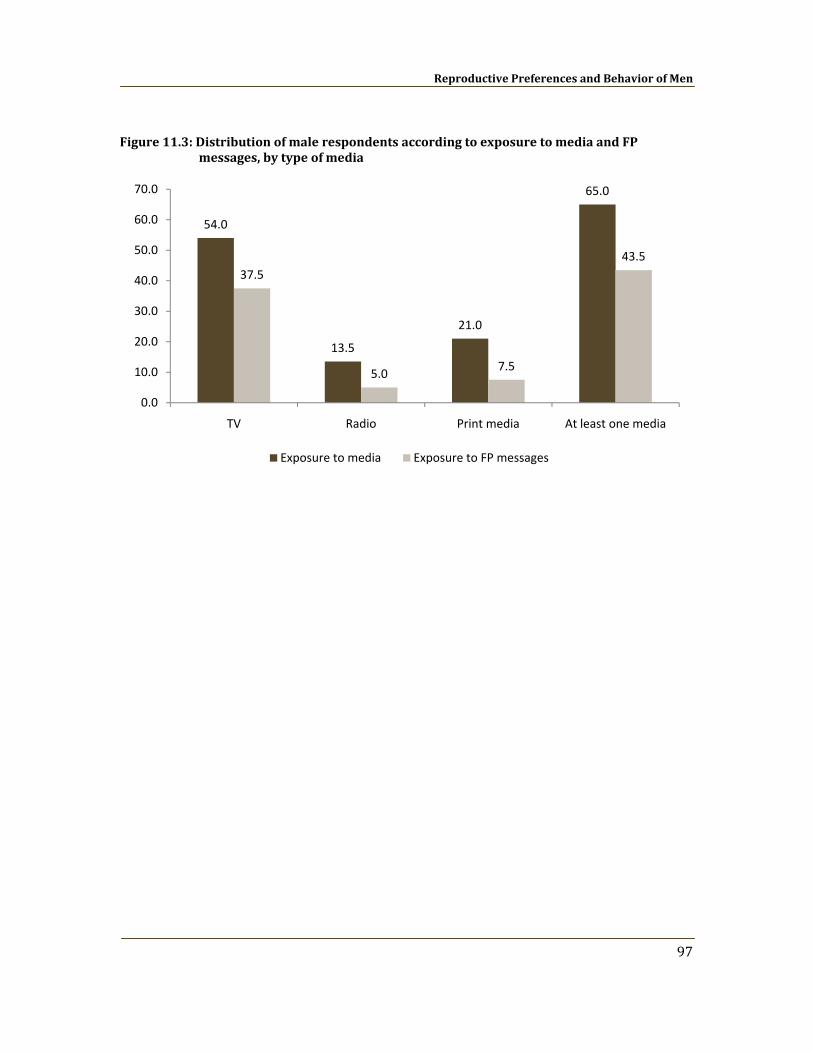
Reproductive Preferences and Behavior of Men
97
Figure 11.3: Distribution of male respondents according to exposure to media and FP messages, by type of media
54.0
13.5
21.0
65.0
37.5
5.0 7.5
43.5
0.0
10.0
20.0
30.0
40.0
50.0
60.0
70.0
TV Radio Print media At least one media
Exposure to media Exposure to FP messages

References
Adair, L., B. Popkin and D. Guilkey. 1994. The duration of breastfeeding: How is it affected by biological, socioeconomic, health sector, and food industry factors? Demography 30(1): 63.
Bohiler, E. and S. Bergstrom. 1995. Subsequent pregnancy affects morbidity of previous child. Journal of Biosocial Science 27(4): 431‐442. Oct. 1995.
Bongaarts, J. and J. Bruce. 1995. The Causes of Unmet Need for Contraception and the Social Content of Services. Studies in Family Planning 26(2): 57‐75.
Caldwell, J.C. 1976. Toward a Restatement of Demographic Transition Theory. Population and Development Review 2(3‐4): 321‐366.
Casterline, J.B., A.E. Perez and A.E. Biddlecom. 1997. Factors Underlying Unmet Need in the Philippines. Studies in Family Planning 28(3): 173‐191.
Casterline, J.B., Z. Sathar and M. ul Haque. 2001. Obstacles to Contraceptive Use in Pakistan: A Study in Punjab. Studies in Family Planning 32(2): 95‐110.
Cleland, J. and Z. Sathar. 1984. The Effect of Birth Spacing on Childhood Mortality in Pakistan. Population Studies, Vol. 38, No. 3 (Nov., 1984), pp. 401‐418.
Fuentes‐Affelick, E. and N.A. Hessol. 2000. Interpregnancy interval and the risk of premature infants. Obstetrics and Gynecology 95(3): 383‐390. Mar. 2000.
Garner, P., T. Smith, M. Baea, D. Lai and P. Heywood. 1994. Maternal nutritional depletion in a rural area of Papua New Guinea. Tropical and Geographical Medicine 46(3): 169‐171. 1994.
Government of Pakistan. 2005. Pakistan Social and Living Standards Measurement Survey 200405: National/Provincial. Islamabad: Federal Bureau of Statistics.
Government of Pakistan. 2006. Pakistan Social and Living Standards Measurement Survey 200405: Provincial/District. Islamabad: Federal Bureau of Statistics.
FALAH Baseline Household Survey
100
Mahmood, Arshad. 2002. Determinants of Neonatal and PostNeonatal Mortality in Pakistan. The Pakistan Development Review, Vol. 41, No. 4, Part (Winter 2002), pp.723‐744.
Mahmood, N. and K. Ringheim. 1997. Knowledge, Approval and Communication about Family Planning as Correlates of Desired Fertility among Spouses in Pakistan. International Family Planning Perspectives 23(3): 122‐129, 145.
Miller, J.E. 1994. Birth Order, Interpregnancy Interval and Birth Outcomes among Filipino Infants. Journal of Biosocial Science 26(2): 243‐259. Apr. 1994.
NIPS (National Institute of Population Studies). 2001. Pakistan Reproductive Health and Family Planning Survey 200001. Islamabad.
NIPS (National Institute of Population Studies). 2007. Status of Women, Reproductive Health and Family Planning Survey: Main Report. Islamabad.
NIPS/DHS (National Institute of Population Studies and MEASURE DHS, Macro International). 2007. Pakistan Demographic and Health Survey 200607: Preliminary Report. Calverton, Maryland: Macro International Inc.
Planning Commission of Pakistan. 2006. Pakistan Millennium Development Goals Report 2006. Islamabad: Center for Research on Poverty and Income Distribution.
Population Census Organization. 2000. District Census Report of Bahawalpur, Islamabad: Statistics Division Government of Pakistan.
Population Council. 1997. The Gap between Reproductive Intentions and Behavior: A Study of Punjab Men and Women. Islamabad: Population Council.
Population Council. 2006. Women’s Health in Pakistan 2005. Islamabad: Population Council. Unpublished.
Population Council. 2007. Diversification of Family Planning Activities in Pakistan (DFPAP): Performance Monitoring Plan. Islamabad: Population Council. Unpublished.
Population Council. 2008. Communication, Advocacy and Mobilization (CAM) Strategy for the FALAH Project: A Draft Strategy. Islamabad: Population Council. Unpublished.
Rutstein, S.O. and K. Johnson. 2004. The DHS Wealth Index. DHS Comparative Report No. 6. Calverton, Maryland, USA: ORC Macro.
References
101
Tawiah, E.O. 1997. Factors Affecting Contraceptive Use in Ghana. Journal of Biosocial Science 29(2): 141‐149.
UNDP (United Nations Development Program). 2003. Pakistan National Human Development Report 2003. Karachi.
UNFPA/PC (United Nations Population Fund and Population Council). 2007. Report of the Seminar on Unpacking Unmet Need for Family Planning in Pakistan. Islamabad: The Population Council.
United Nations. 2006. Millennium Development Goals Report 2006. New York: United Nations Department of Economic and Social Affairs.
Westoff C. F. and A. Bankole A. 1999. Mass Media and Reproductive Behavior in Pakistan, India, and Bangladesh. Demographic and Health Surveys Analytic Reports No.10. Calverton, Maryland: Macro International Inc.
WHO (World Health Organization). 2006. Policy Brief on Birth Spacing Report from a World Health Organization Technical Consultation. WHO Department of Reproductive Health and Research and Department of Making Pregnancy Safe.
Zhu, B.P., R.T. Rolfs, B.E. Nangle and J.M. Horan. 1999. Effect of the Interval between Pregnancies on Perinatal Outcomes. New England Journal of Medicine 340(8): 589‐594. Feb 25, 1999.
Related Documents