Bacterially mediated removal of phosphorus and cycling of nitrate and sulfate in the waste stream of a “zero-discharge” recirculating mariculture system M.D. Krom a,b , A. Ben David c , E.D. Ingall d , L.G. Benning a , S. Clerici a , S. Bottrell a , C. Davies a , N.J. Potts a , R.J.G. Mortimer a , J. van Rijn c, * a School of Earth and Environment, Leeds University, UK b Charney School of Marine Sciences, Haifa University, Israel c The Robert H. Smith Faculty of Agriculture, Food and Environment, The Hebrew University of Jerusalem, Rehovot, Israel d School of Earth and Atmospheric Sciences, Georgia Institute of Technology, Atlanta, USA article info Article history: Received 20 September 2013 Received in revised form 20 February 2014 Accepted 26 February 2014 Available online 11 March 2014 Keywords: Aquaculture Anaerobic sludge Phosphorus removal Denitrification Apatite formation Sulfur cycling abstract Simultaneous removal of nitrogen and phosphorus by microbial biofilters has been used in a variety of water treatment systems including treatment systems in aquaculture. In this study, phosphorus, nitrate and sulfate cycling in the anaerobic loop of a zero-discharge, recirculating mariculture system was investigated using detailed geochemical measure- ments in the sludge layer of the digestion basin. High concentrations of nitrate and sulfate, circulating in the overlying water (w15 mM), were removed by microbial respiration in the sludge resulting in a sulfide accumulation of up to 3 mM. Modelling of the observed S and O isotopic ratios in the surface sludge suggested that, with time, major respiration processes shifted from heterotrophic nitrate and sulfate reduction to autotrophic nitrate reduction. The much higher inorganic P content of the sludge relative to the fish feces is attributed to conversion of organic P to authigenic apatite. This conclusion is supported by: (a) X-ray diffraction analyses, which pointed to an accumulation of a calcium phosphate mineral phase that was different from P phases found in the feces, (b) the calculation that the pore waters of the sludge were highly oversaturated with respect to hydroxyapatite (saturation index ¼ 4.87) and (c) there was a decrease in phosphate (and in the Ca/Na molar ratio) in the pore waters simultaneous with an increase in ammonia showing there had to be an additional P removal process at the same time as the heterotrophic breakdown of organic matter. ª 2014 Elsevier Ltd. All rights reserved. * Corresponding author. The Robert H. Smith Faculty of Agriculture, Food and Environment, The Hebrew University of Jerusalem, P.O.Box 12, Rehovot 76100, Israel. Tel.: þ972 8 9489302; fax: þ972 8 9489024. E-mail address: [email protected] (J. van Rijn). Available online at www.sciencedirect.com ScienceDirect journal homepage: www.elsevier.com/locate/watres water research 56 (2014) 109 e121 http://dx.doi.org/10.1016/j.watres.2014.02.049 0043-1354/ª 2014 Elsevier Ltd. All rights reserved.

Welcome message from author
This document is posted to help you gain knowledge. Please leave a comment to let me know what you think about it! Share it to your friends and learn new things together.
Transcript
ww.sciencedirect.com
wat e r r e s e a r c h 5 6 ( 2 0 1 4 ) 1 0 9e1 2 1
Available online at w
ScienceDirect
journal homepage: www.elsevier .com/locate/watres
Bacterially mediated removal of phosphorus andcycling of nitrate and sulfate in the waste streamof a “zero-discharge” recirculating mariculturesystem
M.D. Kroma,b, A. Ben David c, E.D. Ingall d, L.G. Benning a, S. Clerici a,S. Bottrell a, C. Davies a, N.J. Potts a, R.J.G. Mortimer a, J. van Rijn c,*a School of Earth and Environment, Leeds University, UKbCharney School of Marine Sciences, Haifa University, IsraelcThe Robert H. Smith Faculty of Agriculture, Food and Environment, The Hebrew University of Jerusalem,
Rehovot, IsraeldSchool of Earth and Atmospheric Sciences, Georgia Institute of Technology, Atlanta, USA
a r t i c l e i n f o
Article history:
Received 20 September 2013
Received in revised form
20 February 2014
Accepted 26 February 2014
Available online 11 March 2014
Keywords:
Aquaculture
Anaerobic sludge
Phosphorus removal
Denitrification
Apatite formation
Sulfur cycling
* Corresponding author. The Robert H. Smith12, Rehovot 76100, Israel. Tel.: þ972 8 94893
E-mail address: [email protected]://dx.doi.org/10.1016/j.watres.2014.02.0490043-1354/ª 2014 Elsevier Ltd. All rights rese
a b s t r a c t
Simultaneous removal of nitrogen and phosphorus by microbial biofilters has been used in
a variety of water treatment systems including treatment systems in aquaculture. In this
study, phosphorus, nitrate and sulfate cycling in the anaerobic loop of a zero-discharge,
recirculating mariculture system was investigated using detailed geochemical measure-
ments in the sludge layer of the digestion basin. High concentrations of nitrate and sulfate,
circulating in the overlying water (w15 mM), were removed by microbial respiration in the
sludge resulting in a sulfide accumulation of up to 3 mM. Modelling of the observed S and O
isotopic ratios in the surface sludge suggested that, with time, major respiration processes
shifted from heterotrophic nitrate and sulfate reduction to autotrophic nitrate reduction.
The much higher inorganic P content of the sludge relative to the fish feces is attributed to
conversion of organic P to authigenic apatite. This conclusion is supported by: (a) X-ray
diffraction analyses, which pointed to an accumulation of a calcium phosphate mineral
phase that was different from P phases found in the feces, (b) the calculation that the pore
waters of the sludge were highly oversaturated with respect to hydroxyapatite (saturation
index ¼ 4.87) and (c) there was a decrease in phosphate (and in the Ca/Na molar ratio) in
the pore waters simultaneous with an increase in ammonia showing there had to be an
additional P removal process at the same time as the heterotrophic breakdown of organic
matter.
ª 2014 Elsevier Ltd. All rights reserved.
Faculty of Agriculture, Food and Environment, The Hebrew University of Jerusalem, P.O.Box02; fax: þ972 8 9489024..il (J. van Rijn).
rved.
wat e r r e s e a r c h 5 6 ( 2 0 1 4 ) 1 0 9e1 2 1110
1. Introduction
Fish cages, a widely used industrial mariculture technology,
typically discharge up to 80% of the nitrogen and phosphorus
that is supplied in the feed into the environment (Naylor et al.,
1998; van Rijn, 2013). Land based mariculture offers more
control of the waste, but is often limited by the shortage of
coastal sites and the cost of inland pumping of seawater and
its discharge. The “Zero-Discharge System” (ZDS) is a recently
developed sustainable mariculture system (Gelfand et al.,
2003) which uses natural microbial processes to control
water quality (Cytryn et al., 2003; Gelfand et al., 2003; Neori
et al., 2007). The system operates in a completely sealed
way, meaning that only a small amount of freshwater is used
to replace losses by evaporation. There is no continuous or
even intermittent discharge of aqueous effluent to the envi-
ronment as exists in other mariculture systems. Although the
advantages of ZDS mariculture systems in terms of waste
output are clear, the mechanisms behind the nitrogen, sulfur
and phosphorus cycling in such systems are not well
understood.
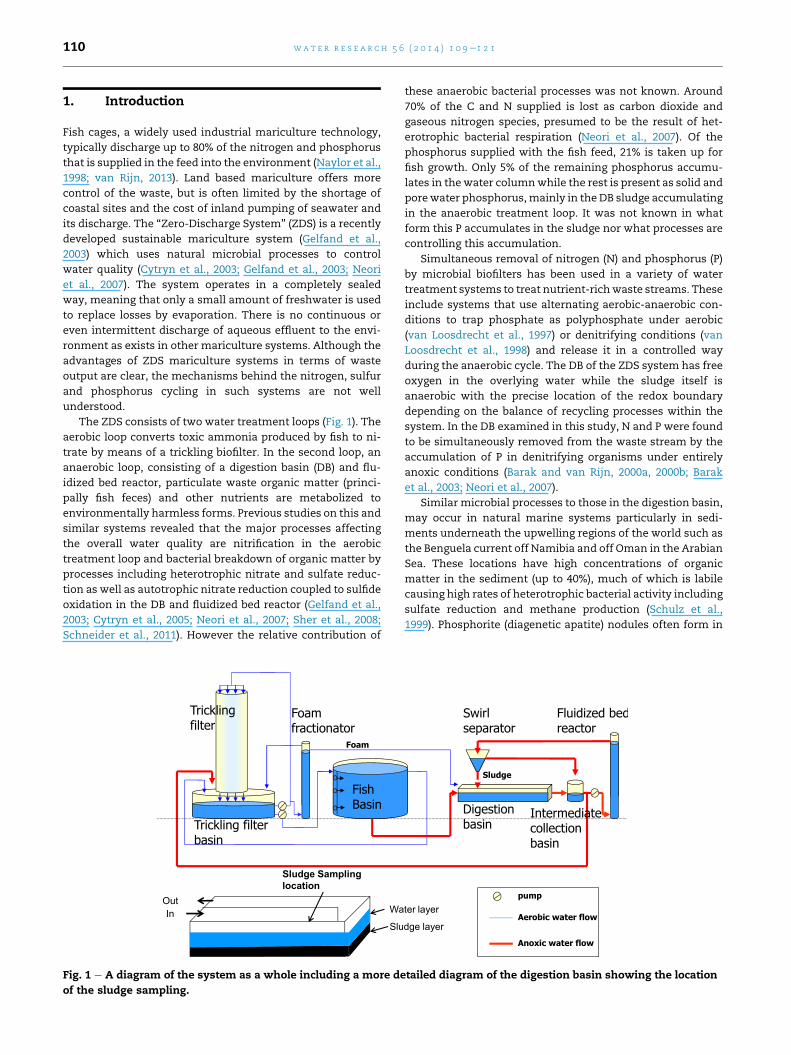
The ZDS consists of two water treatment loops (Fig. 1). The
aerobic loop converts toxic ammonia produced by fish to ni-
trate by means of a trickling biofilter. In the second loop, an
anaerobic loop, consisting of a digestion basin (DB) and flu-
idized bed reactor, particulate waste organic matter (princi-
pally fish feces) and other nutrients are metabolized to
environmentally harmless forms. Previous studies on this and
similar systems revealed that the major processes affecting
the overall water quality are nitrification in the aerobic
treatment loop and bacterial breakdown of organic matter by
processes including heterotrophic nitrate and sulfate reduc-
tion as well as autotrophic nitrate reduction coupled to sulfide
oxidation in the DB and fluidized bed reactor (Gelfand et al.,
2003; Cytryn et al., 2005; Neori et al., 2007; Sher et al., 2008;
Schneider et al., 2011). However the relative contribution of
Fig. 1 e A diagram of the system as a whole including a more de
of the sludge sampling.
these anaerobic bacterial processes was not known. Around
70% of the C and N supplied is lost as carbon dioxide and
gaseous nitrogen species, presumed to be the result of het-
erotrophic bacterial respiration (Neori et al., 2007). Of the
phosphorus supplied with the fish feed, 21% is taken up for
fish growth. Only 5% of the remaining phosphorus accumu-
lates in the water columnwhile the rest is present as solid and
porewater phosphorus,mainly in the DB sludge accumulating
in the anaerobic treatment loop. It was not known in what
form this P accumulates in the sludge nor what processes are
controlling this accumulation.
Simultaneous removal of nitrogen (N) and phosphorus (P)
by microbial biofilters has been used in a variety of water
treatment systems to treat nutrient-richwaste streams. These
include systems that use alternating aerobic-anaerobic con-
ditions to trap phosphate as polyphosphate under aerobic
(van Loosdrecht et al., 1997) or denitrifying conditions (van
Loosdrecht et al., 1998) and release it in a controlled way
during the anaerobic cycle. The DB of the ZDS system has free
oxygen in the overlying water while the sludge itself is
anaerobic with the precise location of the redox boundary
depending on the balance of recycling processes within the
system. In the DB examined in this study, N and P were found
to be simultaneously removed from the waste stream by the
accumulation of P in denitrifying organisms under entirely
anoxic conditions (Barak and van Rijn, 2000a, 2000b; Barak
et al., 2003; Neori et al., 2007).
Similar microbial processes to those in the digestion basin,
may occur in natural marine systems particularly in sedi-
ments underneath the upwelling regions of the world such as
the Benguela current off Namibia and off Oman in the Arabian
Sea. These locations have high concentrations of organic
matter in the sediment (up to 40%), much of which is labile
causing high rates of heterotrophic bacterial activity including
sulfate reduction and methane production (Schulz et al.,
1999). Phosphorite (diagenetic apatite) nodules often form in
tailed diagram of the digestion basin showing the location
wat e r r e s e a r c h 5 6 ( 2 0 1 4 ) 1 0 9e1 2 1 111
the sediments beneath these upwelling regions. Two pro-
cesses have been suggested for this apatite formation.
Schenau et al. (2000) suggested that diagenic apatite was
formed in pore waters where phosphate released by hetero-
trophic respiration of organic matter created high enough
phosphate concentrations to overcome the kinetic barrier to
apatite formation (Van Cappellen and Berner, 1991). More
recently, an alternative process has been suggested in which
bacteria, particularly sulfide oxidizing bacteria, accumulate
polyphosphate, which is then rapidly converted into diage-
netic apatite (Goldhammer et al., 2010). Both processes
represent a shunt of P from its dissolved form into bacterial
biofilms, which is subsequently converted into mineral
apatite.
This study examines the types and location of processes
that control nitrate, sulfate and phosphorus cyclingwithin the
sludge of the anaerobic loop in the ZDS system. The major
microbial transformations in the DB were determined using
detailed geochemical measurements of the depth distribution
of relevant geochemical parameters and their stable isotope
composition in the DB sludge layer and the overlying water.
Detailed measurements of P in the sludge, pore and overlying
waters were made using geochemical and mineralogical
methods to determine the P speciation and its changes with
depth. The identified P cycling processes are compared and
contrasted with similar processes in natural and engineered
systems.
2. Material and methods
2.1. System description
The zero discharge system (ZDS) in this study was an
enlarged version of the system previously described in detail
by Gelfand et al. (2003). Briefly, the system comprised a fish
basin (5 m3) stocked with the gilthead seabream (Sparus
aurata) from which water was circulated through aerobic
and anaerobic treatment compartments (Fig. 1). The aerobic
compartment consisted of a trickling filter with a volume of
8 m3 and a surface area of 1920 m2. Water from the trickling
filter was collected in a trickling filter basin (3 m3) which was
situated directly underneath the trickling filter. Surface
water from the fish basin was circulated through the aerobic
compartment at a rate of 10 m3 h�1. The digestion basin (DB,
gross volume: 5.4 m3) was the main part of the anaerobic
treatment compartment. Water from the bottom of the fish
basin was drained continuously (0.8 m3 h�1) into the DB.
Effluent water from the DB was recirculated (0.8 m3 h�1)
through a fluidized bed reactor (FBR, volume: 13 L) before
being returned to the Intermediate Collection Basin. The FBR
removes any sulfide or other reduced potentially toxic
compounds by microbial oxidation before they reach the fish
tank. The DB, with a total surface area of 3.64 m2 (2.6 m
length; 1.4 m width), contained a partition in the middle of
the basin causing the incoming water to flow over a total
length of 5.2 m before leaving the basin. Total depth of water
and sludge in the DB was 80 cm and sludge thickness ranged
between 30 and 50 cm (i.e. the water layer overlying the
sludge varied in thickness from 30 to 50 cm). As no
continuous water exchange is required, the system can be
operated away from a seawater source. In the absence of
such a source and to meet the desired water salinity, solid
sea salt was added. During the initial experimental set up,
prior to fish being introduced, solid sea salt (Red Sea pHarm
Ltd., Israel) was added to the DB. It was allowed to dissolve
there and diffuse into the overlying circulating water to a
final concentration of w8500 mgNa/L (i.e. 20 � 2 ppt). The
fish were introduced after the salinity in the recirculating
water had reached equilibrium. During the experimental
period, local Rehovot tap water was periodically added to
the system to compensate for evaporative losses. The sys-
tem was started in October 2011 with sludge already present
from previous operations of the ZDS over the past seven
years. This was done to avoid an unacceptably long induc-
tion period since we added small fish at first and thus there
was limited waste organic matter being supplied to the DB.
On October 31, 2010, 738 fish were stocked with an initial
weight of 1.5 g and on October 16, 2011, 668 fish were har-
vested with an average weight of 237.6 g. Feed addition over
this period was 241 kg. Hence, the feed conversion coeffi-
cient (i.e. total feed addition divided by to the total fish
weight gained) was 1.53.
2.2. In situ sampling
Water quality parameters sampled in the fish basin were
recorded for a period of 360 days starting in October 2011.
Oxygen and temperature were measured daily while
ammonia, nitrite, nitrate, phosphate, pH and alkalinity were
analysed weekly. The sediment system was sampled when
anaerobic conditions had been clearly established in the DB
sludge (based on removal of nitrate from the overlying water;
see Fig S1).
Core samples of sludge from the DB were taken four times
from the same location in the digestion basin (see Fig. 1) using
a custom-built corer with a rubber diaphragm to seal the
bottom. These cores were used for subsequent solid and
macropore water analysis. Cores were taken during the
morning of July 12th (pore water chemistry and solid ana-
lyses), July 13th (for pH) and two cores for isotopic analyses
were taken on August 4th (Core A) and February 2nd, 2012
(core B). The first collected core (July 12th, 2011) was taken
back to the laboratory and frozen at �20 �C. After 24 h the
frozen core was partially thawed (w20 min) and sections of
1 cm each were extruded from the bottom of the core and
sliced off with a metal saw. The largest part of the sludge disk
was placed in a pre-weighed 50 ml centrifuge tube. It was
weighed (wet weight) and then centrifuged for 15 min at
3500 rpm at 4 �C. The supernatant pore waters were filtered
through a 0.45 mm filter for phosphate, ammonia and nitrate
determination. A subsample was refrozen for subsequent
analysis. After thawing, a small known amount of acid was
added to the tubes. The acidified sampleswellmixed, weighed
accurately so that the volume of dilution by acid could be
determined, and analysed by Inductively Coupled Plasma
Atomic Emission Spectroscopy (ICP-AES) for Na, Ca, Mg, P and
S. A wet sludge subsample was weighed for porosity deter-
mination and then frozen for subsequent freeze-drying. The
freeze-dried samples were used for all subsequent solid

wat e r r e s e a r c h 5 6 ( 2 0 1 4 ) 1 0 9e1 2 1112
samples chemical determinations (see below). A further sub-
sample of each sludge disk was placed immediately into a
centrifuge tube containing 5% zinc acetate solution for sulfide
determination. In addition, in July, 2011, a sample of fish feces
was taken from several fish together with samples of the fish
feed for analysis.
The core sampled on July 13th, 2011 for pH measurements
was brought back to the lab and sludge samples were
siphoned off from the top of the core into a beaker inwhich pH
was measured at the ambient temperature (w26 �C). In addi-
tion, one sample from the overlying water was taken for pH
measurement.
The two cores collected on August 4th, 2011 (Core A) and
February 2nd, 2012 (Core B) were immediately frozen after
sampling and transported to Leeds with dry ice. In Leeds, the
cores were extruded frozen, cut into the required depth in-
tervals for analysis, and trimmed. The ice formed from
overlying water at the top of each core was melted for anal-
ysis and sulfate recovery. Each sample was split into two and
each refrozen. One aliquot was weighed, dried at 110 �C and
reweighed to determine water content. The other aliquot was
placed frozen into a sealed extraction cell and flushed with
N2. Pore-water components were extracted by diffusional
exchange (Bottrell et al., 2000; Spence et al., 2005) for chem-
ical analysis and recovery of sulfate as BaSO4. Freezing of
core may cause redistribution of solutes during freezing;
however the effects are minimized since the cores are sub-
sampled at a coarse resolution and completely thawed to
extract solutes. Freezing prevents both post-sampling
oxidation of S species and physical disturbance/mixing of
the core during transport, each of which would introduce far
greater artefacts.
2.3. Pore water and solid sludge determinations
Pore water samples were determined for major cations and
anions by ICP-AES and ion chromatography. Samples used for
analysis of cations were acidified with two drops of HCl (37%).
Deionized water was added to some of the samples to facili-
tate the dissolution of any observed precipitate. Elemental
concentrations were measured using a Side-On-Plasma ICP-
AES model ‘ARCOS’ (Spectro GmbH, Germany). Samples for
determination of nitrate, sulfate, chloride, and phosphate
were forced through Reverse Phase filters and through 0.25 mm
membrane filters to remove organic material. The above an-
ions were determined using an ICS-3000 Ion Chromatograph
(Dionex Corporation, Sunnyvale, California), with an AS17
analytical column, an AG17 guard column, and an ASRS-Ultra
II Anion Micromembrane Suppressor. Total ammonia (NH3,
NH4þ), from here on referred to as ammonia, was determined
with the salicylate-hypochlorite method as described by
Bower and Holm-Hansen (1980). Dissolved sulfide was ana-
lysed on samples fixed with ZnAc with the methylene blue
method of Cline (1969).
Freeze dried sludge samples, feed and fish feces were ana-
lysed for P speciation using the procedure of Aspila et al. (1976)
to determine total P and inorganic P (and hence by difference:
organic P). In addition, adsorbed P was determined using the
first step of the SEDEX P speciation procedure of Ruttenberg
(1992) involving extraction by MgCl2. Extracted samples were
determined for phosphate using the molybdate blue reaction
(Golterman et al., 1978). The standard error (1s) of these ana-
lyses was adsorbed P 3% (n ¼ 12), inorganic P 8% (n ¼ 16) and
organic P 4% (n ¼ 16). An additional solid subsample of sludge
was analysed for major elements on fused glass beads pre-
pared from ignited powders using a sample to flux ratio of 1:10
(Lithium tetraborate) on PANalytical XRF spectrometer at
University of Leicester, UK. Quantification of inorganic poly-
phosphate was accomplished using a fluorometric technique
based on the interaction of inorganic polyphosphatewith 40,60-Diamidino-2-phenylindole (DAPI) (Aschar-Sobbi et al., 2008;
Diaz and Ingall, 2010). DAPI is commonly used as a stain for
nucleic acid but will also bind to polyphosphate, which is then
detected using a combination of incident and observed
wavelengthsoptimized for polyphosphate (Aschar-Sobbi et al.,
2008). Inorganic polyphosphate of at least 15 P atoms in size is
quantified independently of chain length to a detection limit of
0.5 mM (Diaz and Ingall, 2010). Typical errors associated with
this technique are �15% (Diaz and Ingall, 2010).
For the isotope cores, after pore-water extraction, acid-
volatile (AVS ¼ dissolved sulfides and solid monosulfides)
and chromium reducible sulfur (CRS ¼ pyrite sulfur and
elemental sulfur) were extracted from the solid phase and
recovered as a single CuS precipitate for isotopic analysis. The
mass of S recovered was determined titrimetrically (Newton
et al., 1995). Residual sulfur in the solid phase is presumed
to be organic-bound S and was converted to BaSO4 by Eschka
fusion and determined gravimetrically. In addition, the ‘Red
Sea salt’ and Rehovot tap water used to create half seawater
conditions in the system were sampled. The Red Sea salt was
dissolved for chemical analysis and sulfate recovered as
BaSO4 for both S and O isotopic analysis.
The oxygen isotopic composition of aqueous sulfate was
determined on BaSO4 precipitates using themethod described
by McCarthy et al. (1998) and using a VG SIRA 10 gas source
isotope rationmass spectrometer. Data are reported as d18O in
per mille (&) relative to the Vienna Standard Mean Ocean
Water (V-SMOW); reproducibility (2 x standard error), esti-
mated from replicate analyses of standards, is 0.3& or better.
Sulfur extracts and fish feed samples were quantitatively
converted to SO2 by combustion at 1150 �C in the presence of
pure oxygen (N5.0) injected into a stream of helium (CP grade).
The combustion gases were quantitatively converted to N2,
CO2 and SO2 by passing them through tungstic oxide. Excess
oxygen was removed by reaction with hot copper wires at
850 �C and water was removed in amagnesium perchlorate or
Sicapent trap. All solid reagents were sourced from Elemental
Microanalysis, UK, and all gases were sourced from BOC, UK.
N2 continued through the system unchecked, whilst CO2 and
SO2 were removed from, and re-injected into, the gas stream
using temperature controlled adsorption/desorption columns.
The d34S was derived using the integrated mass 64 and 66
signals relative to those in a pulse of SO2 reference gas (N3.0).
These ratios are calibrated to the international V-CDT scale
using an internal laboratory barium sulfate standard derived
from seawater (SWS-3), which has been analysed against the
international standards NBS-127 (þ20.3&), NBS-123
(þ17.01&), IAEA S-1 (�0.30&) and IAEA S-3 (�32.06&) and
assigned a value of þ20.3&, and an inter-lab chalcopyrite
standard CP-1 assigned a value of �4.56&. If samples were
wat e r r e s e a r c h 5 6 ( 2 0 1 4 ) 1 0 9e1 2 1 113
more 34S depleted than CP-1, the IAEA S-3 standard was used
instead. The precision obtained for repeat analyses of stan-
dard materials was generally better than 0.3& d34SREF (1
standard deviation).
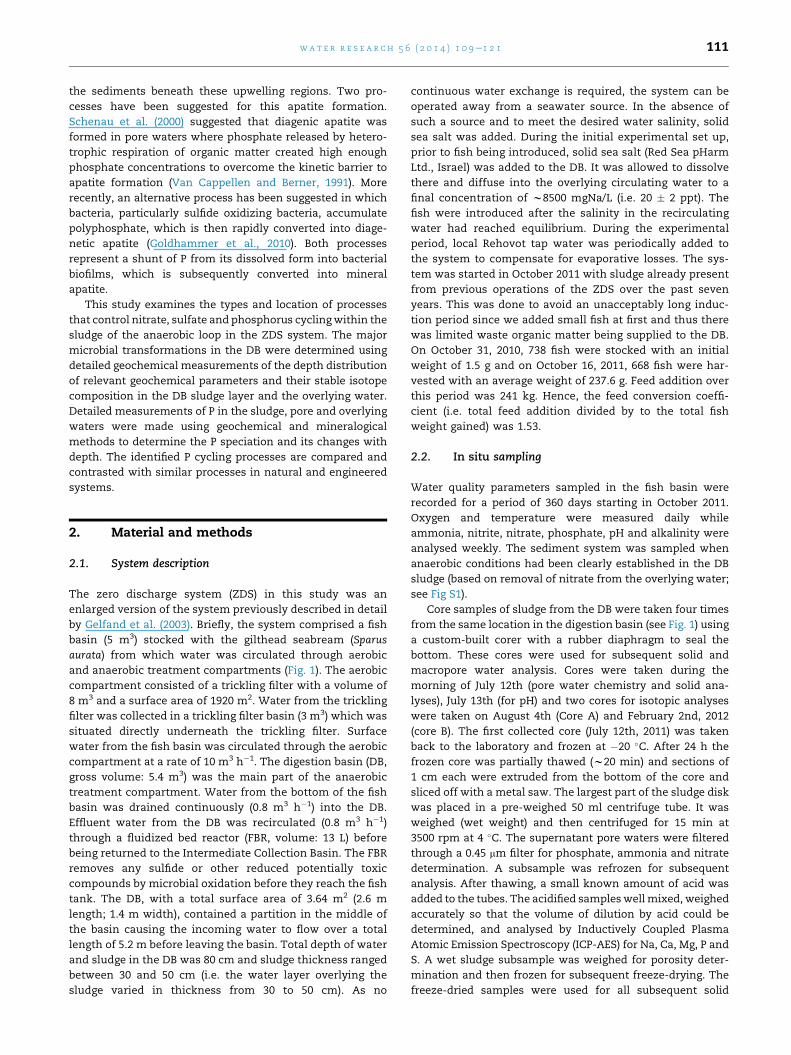
Fig. 2 e Pore water concentration of A) Sulfate/Na and
{Total dissolved S (measured by ICP) minus dissolved
Sulfide}/Na concentration ratio (mmolesS/moleNa) and B)
Dissolved Sulfide (molesS/l) in the pore waters of the
sludge. Measured value for sulfate/Na molar ratio in the
overlying water (OW) is given. There was no sulfide
detected in the overlying water.
3. Results
3.1. Water analyses
The water quality was determined weekly in the circulating
water of the ZDS system (Fig. S1). The detailed sampling took
place on July 12th, when main water quality parameters had
stabilized and ammonia, phosphate, nitrate and nitrite values
were 0.02 mM, 1.03 mM, 16.1 mM and 0.017 mM, respectively.
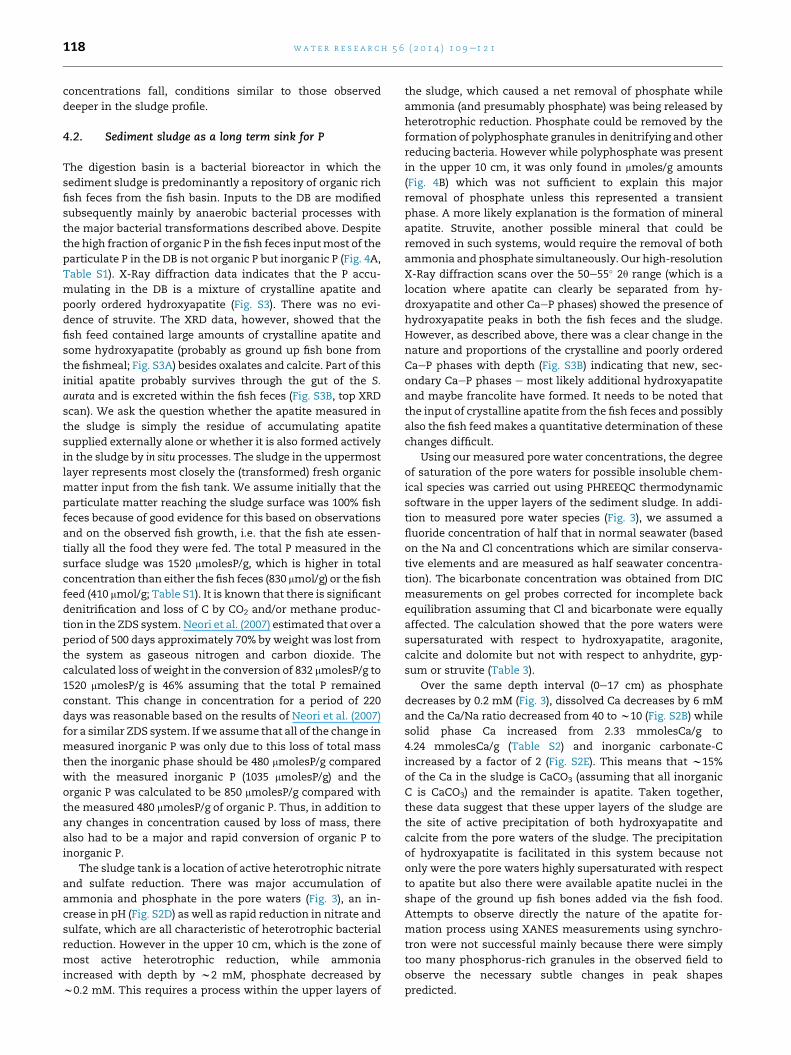
The nitrate concentration in the overlying water at the time of
sampling (17.4 mM) was much higher than in the surface
sludge. There was a decrease in nitrate such that the nitrate
concentration below 20 cmwas close to or below the practical
limit of detection. The nitrate decrease within the sludge can
be explained by the fact that under anoxic conditions nitrate is
reduced by bacteria, which oxidise organic matter and other
reduced compounds.
Sulfate is also respired under anoxic conditions within the
sludge. In order to recognize biologically mediated changes in
sulfate in the sludge, it was necessary to compare its con-
centration to that of sodium since the former compound is
found in measurable amounts in the sea salt added to the
system. There was a systematic increase in Na observed with
depth with values increasing from w50% seawater concen-
tration at the surface to 4 times higher concentration at the
base of the sludge core (Fig. S2A). This increase was most
probably caused by the specific manner in which sea salt was
added to the system prior to the experimental period. Salt was
added to the DB with a working volume of 2.9 m3 (approxi-
mately 25% of the total water volume in the system). Although
intended to completely dissolve in the total system water, it
appears that as a result of thismode of salt addition, relatively
more salt accumulated in the bottom layers of the DB. Despite
the high porosity of the sludge (0.95 in the top layers and
decreasing to 0.85 at 35 cm depth), there was no evidence of
physical mixing (Fig. S2C). Sulfate decreased rapidly from a
value of 60.1 (SO4mM/NaM) in the overlying water to 14.8 (SO4
mM/Na M) at 2.5 cm depth (Fig. 2A). The ratio continued to
decrease with depth to a minimum value of 4.3 (SO4 mM/Na
M) at 14.5 cm and then increased to 43.9 (SO4 mM/NaM) at the
lowest point sampled (33.5 cm). A similar profile was obtained
when (total dissolved sulfur minus dissolved sulfide)/Na was
plotted with depth (Fig. 2A). There was no measurable sulfide
in the overlyingwater; it increased to amaximumof 3.8mMat
15.5 cm and then decreased to a value of 1.1 mM at 34.5 cm
(Fig. 2B).
In order to understand the diagenetic processes in the
sludge, the concentration of relevant chemical species and
parameters were measured. Phosphate and ammonia are
commonly measured as the products of the heterotrophic
anaerobic respiration of organic matter. However, the con-
centration of these chemical species depends on the sumof all
diagenetic processes in the sludge. Thus, the dissolved phos-
phate in the sludge depth profile (Fig. 3A) was lower in the
uppermost layers (1.12 mM) compared with the overlying
water (1.4 mM) and decreased with depth to values of
w0.7 mM at 35 cm. By contrast, ammonia (Fig. 3B) was much
higher in the surface sludge compared with the overlying
water. The ammonia concentrations in the upper 20 cm were
roughly constant in the range of 13e15 mM, which then
decreased to w10 mM below 25 cm.
Further information about the nature of the diagenetic
processes in the sediment comes from measurements of pH.
In the sludge, the pH increased from 6.35 in the overlying
water to a maximum of 6.8 just below the sediment water
interface (SWI) and then decreasedwith depth to a value of 6.5
at the base of the sludge (Fig. S2D).
The concentration ratios of Ca/Na and Mg/Na were deter-
mined to provide information about the possible precipitation
of inorganic P minerals in the sludge. The molar ratio in the
overlying waters (21.96) was within error the samemolar ratio
of Ca/Na (mM/M) in normal seawater (Fig. S2B). The ratio
increased just below the sludgeewater interface to 40.7 and
then decreased with depth reaching values of w5 at 35 cm.
The Mg/Na (mM/M) remained essentially constant at 60e78
over the depth profile analysed (not shown).

Fig. 4 e Phosphate in sludge: (A) Changes in P speciation
with depth in sludge of the sedimentation basin together
with the P speciation of the fish feces which is the main
input of particulate matter to the digestion basin; (B)
Polyphosphate concentrations (mmole/g) with depth.
Fig. 3 e Pore water nutrient concentrations of dissolved
phosphate, ammonia and nitrate vs depth together with
corresponding values for these nutrients in the overlying
water. Note that the concentration of nitrate in the
overlying water is 17.4 mM as noted in the data point
description.
wat e r r e s e a r c h 5 6 ( 2 0 1 4 ) 1 0 9e1 2 1114
3.2. Solid sludge phase
The P speciation and content of the sludgewas comparedwith
feces (themajor input) and fish feed (a possibleminor input) to
characterise the transformations which have occurred in the
DB. The total P in the sludge varies from w1500 mmolesP/g in
the surface layers increasing to amaximumof 2090 mmolesP/g
at 15.5 cm and decreasing to 1100 mmolesP/g at the base of the
sludge (Fig. 4A). Inorganic P was themajor phase in the sludge
and increased from surface values of 1030 mmolesP/g to
>1500 mmol/g before decreasing to 1120 mmol/g at 35.5 cm. By
contrast, organic P was relatively constant over the upper
20 cm at w400e500 mmolesP/g and then decreased to
<50 mmol/g at the base of the sludge (Fig. 4A). The total P
content of the fish feed (410 mmolesP/g) was lower than the
fish feces (830 mmolesP/g), which is the main source of par-
ticulate matter to the sludge. In contrast to the sludge, the
organic P content of the fish feces (465 mmolesP/g) was higher
than its inorganic P content (260 mmolesP/g; Fig. 4a; Table S1).
The principal major element in the sludge was Ca, which
increased from 2.3 mmolesCa/g (9.3 wt%Ca) at the surface to
3.2e4.1 mmolesCa/g (12.8e16.4 wt%Ca) at depth (Table S2).
Other elements, which might bind with P (Fe and Al), were
present only in mmoles/g concentrations (Table S2).
3.2.1. Sulfur mass balanceSulfur mass balance can be assessed in the cores used for S
isotopic determinations as concentrations were also
measured (Table 1). Data are presented as aqueous concen-
trations for dissolved species and corrected to concentrations

Table 1 e Sulfur species concentrations in sludge cores (average of two cores). NB: centred values are aqueousconcentrations, right adjusted values in bold are recalculated to total sludge volume, taking account of porosity changes.
Dissolved phase Solid phase
Depth range Sulfate Sulfide Total S Organic S CRS Total S
cm mM mmol/Lsludge
mM mmol/Lsludge
mmol/Lsludge
mmol/Lsludge
mmol/Lsludge
mmol/Lsludge
Overlying water 14.2 14.2 0 0 14.2 0 0 0
0 to 2.5 7.8 7.4 0.4 0.4 7.8 128 453 581
2.5 to 5 7.0 6.6 1.1 1.0 7.6 51 539 589
5 to 10 5.9 5.5 1.4 1.3 6.8 90 506 597
10 to 15 4.2 3.8 2.1 1.9 5.7 210 720 930
15 to 19 2.5 2.2 3.5 3.1 5.3 112 855 968
19 to 23 0.7 0.6 2.9 2.6 3.4 228 862 1091
23 to 26 1.4 1.2 2.7 2.3 3.5 378 1271 1649
26 to 29 2.5 2.1 2.7 2.3 4.4 410 967 1377
29 to 32 4.8 4.1 1.5 1.3 5.4 377 815 1191
wat e r r e s e a r c h 5 6 ( 2 0 1 4 ) 1 0 9e1 2 1 115
in total sludge for all species (assuming a linear transition
between measured porosities of 0.95 at core top and 0.85 at
core base). As noted above, sulfate concentrations decline
with depth in the upper part of the core (14.2 mM in the
overlying water, 7.8 mM in the uppermost core, declining to a
minimum of 0.7 mM at w20 cm depth). However, although
sulfide concentrations increase over a similar interval (0 mM
in the overlying water, 0.4 mM in the uppermost core, reach-
ing amaximumof 3.5mM atw17 cm depth) they never match
the losses in sulfate and thus total dissolved S decreases with
depth over this interval. This imbalance is explained by the
general increase in concentration of solid phase S species over
the same depth interval (fromw590 mmol S/L of sludge in the
upper core to >1000 mmol S/L of sludge in the deepest core;
Table 1), as sulfide reacts with solid phase components to
produce new organic S and CRS species. Elemental S may be a
product of sulfide reoxidation (e.g. Jiang et al., 2009) and this is
analysed within the CRS fraction.
3.3. Stable isotope ratios
3.3.1. Inputs to the systemThe ‘Red Sea salt’ used to make up the tank water contained
sulfate with isotopic compositions of d34S ¼ �1.5& and
d18O¼ 10.0& (Fig. 5); this is not a typicalmarine sulfate isotope
composition as the sulfate is sourced from terrestrial sulfate
deposits. The local Rehovot tap water used to fill the tank
contains 0.16 mM sulfate with isotopic composition of
d34S¼ 6.9& and d18O¼ 7.8&. As the circulating tankwater was
made up to 50% seawater chloride concentration, the dis-
solved sulfate was dominated by the added Red Sea salt. Fresh
water resources (both groundwater and river waters) in Israel
typically have a narrow range of d18O between �4& and �6&(Gat and Dansgaard, 1972) and the tap water used should be in
this range. The other main source of S to the system was the
fish food, which containsw0.7 wt% S; two different batches of
food were analysed and had slightly different d34S isotopic
compositions, 6.5& and 8.9& (Fig. 5).
3.3.2. Solid phase sulfur isotopic compositionThe combined acid-volatile (AVS) and chromium reducible
sulfur (CRS) content of the sludge was similar in both cores
and showed no systematic variation with depth, ranging from
3.45 to 10.5 mg g�1. Organic-S contents were lower
(0.81e3.54 mg g�1) and again showed no strong depth trend
(Table S3). Both forms of S in the sludge show a similar and
quite narrow range of S isotopic composition
(AVSþ CRS¼ 1.4&e8.2&; Org-S¼ 3.6&e8.3&, Fig. 5, Table S3)
and no systematic variation with depth. The S isotopic
composition of pore-water sulfate was broadly similar in both
cores, particularly so in the upper part of each core (Fig. 5). The
lowest d34S value occurred in the shallowest pore-water
sample and was lighter than the sulfate in the overlying
water (7.3& vs. 8.8& in core A and 8.0& vs. 10.2& in core B,
differences of 1.5& and 2.2&). Below this, sulfate d34S
remained near constant with depth down to 17 cm and had
values closely similar to the sulfate in the overlying water.
Below 17 cm depth the two profiles diverged somewhat,
though in general there was a tendency to higher d34S in the
lower part of the profiles. Sulfate d18O in the shallowest pore-
waters was lower than in the overlying water but initially
increased with depth in both profiles. In the deeper pore-
waters there is more variability in sulfate d18O and Core A
tended to more elevated values (>þ10&) while core B tended
to lighter values (wþ2&); it should be noted that SO4/Cl was
different for the two cores in their deeper parts.
3.3.3. Calculation of the amount of total P in the sludge andthe fraction accumulated during the present phase of pondoperationThe total sludge volume was calculated to be 960,000 cm3
based on a tank surface area of 2.4 m2 and a depth of sludge of
40 cm. With an average sludge porosity of 0.9, it could be
calculated that the DB contained 96,000 cm3 of sediment
particles. Assuming a dry density of 1.4 g/cm3, this equals
134,400 g of sediment. Using 1535 mmolesP/g as the average
total P content of the sediment, it is calculated that the sludge
contains 206 mol P. Our calculation of the total P supplied to
the ZDS as fish feed minus the fish growth during the present
run (October 2010 until July 2011) was 65 mol P. This figure
assumes that the only location for P accumulation is the DB
and that there was no major residual P build up in the nitri-
fying filter or elsewhere. As a result, this is a minimum esti-
mate. Since P in the sludge cannot go anywhere, this implies
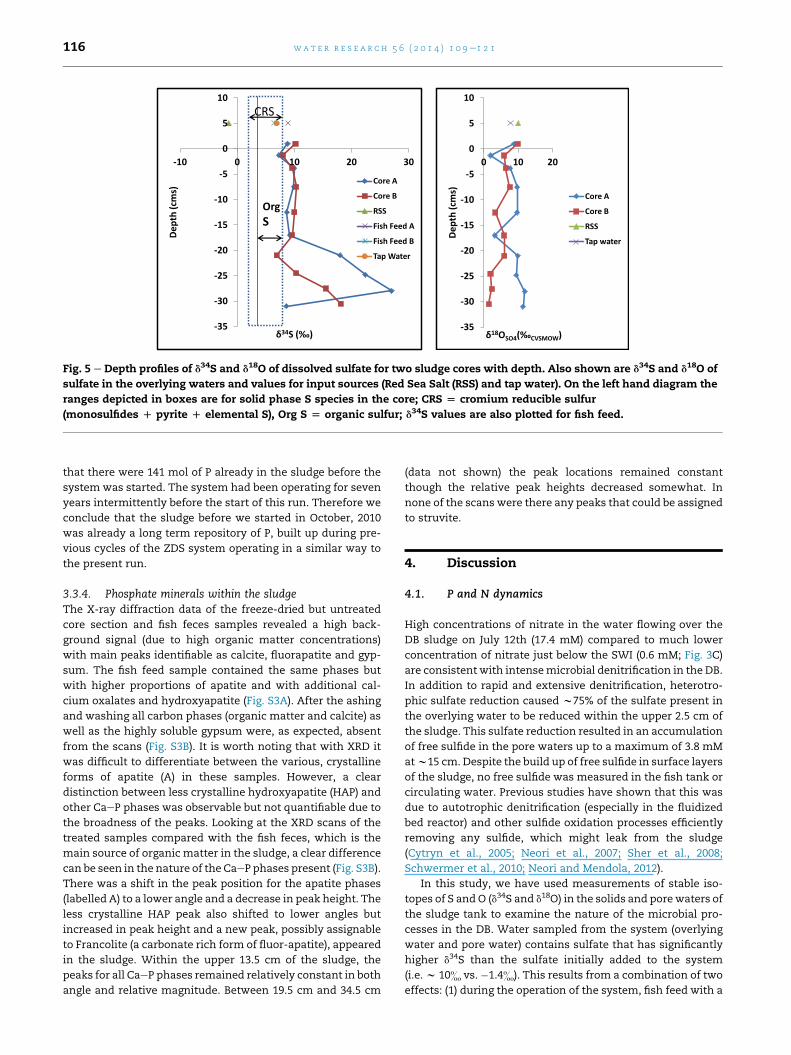
Fig. 5 e Depth profiles of d34S and d18O of dissolved sulfate for two sludge cores with depth. Also shown are d34S and d18O of
sulfate in the overlying waters and values for input sources (Red Sea Salt (RSS) and tap water). On the left hand diagram the
ranges depicted in boxes are for solid phase S species in the core; CRS [ cromium reducible sulfur
(monosulfides D pyrite D elemental S), Org S [ organic sulfur; d34S values are also plotted for fish feed.
wat e r r e s e a r c h 5 6 ( 2 0 1 4 ) 1 0 9e1 2 1116
that there were 141 mol of P already in the sludge before the
system was started. The system had been operating for seven
years intermittently before the start of this run. Therefore we
conclude that the sludge before we started in October, 2010
was already a long term repository of P, built up during pre-
vious cycles of the ZDS system operating in a similar way to
the present run.
3.3.4. Phosphate minerals within the sludgeThe X-ray diffraction data of the freeze-dried but untreated
core section and fish feces samples revealed a high back-
ground signal (due to high organic matter concentrations)
with main peaks identifiable as calcite, fluorapatite and gyp-
sum. The fish feed sample contained the same phases but
with higher proportions of apatite and with additional cal-
cium oxalates and hydroxyapatite (Fig. S3A). After the ashing
and washing all carbon phases (organic matter and calcite) as
well as the highly soluble gypsum were, as expected, absent
from the scans (Fig. S3B). It is worth noting that with XRD it
was difficult to differentiate between the various, crystalline
forms of apatite (A) in these samples. However, a clear
distinction between less crystalline hydroxyapatite (HAP) and
other CaeP phases was observable but not quantifiable due to
the broadness of the peaks. Looking at the XRD scans of the
treated samples compared with the fish feces, which is the
main source of organic matter in the sludge, a clear difference
can be seen in the nature of the CaeP phases present (Fig. S3B).
There was a shift in the peak position for the apatite phases
(labelled A) to a lower angle and a decrease in peak height. The
less crystalline HAP peak also shifted to lower angles but
increased in peak height and a new peak, possibly assignable
to Francolite (a carbonate rich form of fluor-apatite), appeared
in the sludge. Within the upper 13.5 cm of the sludge, the
peaks for all CaeP phases remained relatively constant in both
angle and relative magnitude. Between 19.5 cm and 34.5 cm
(data not shown) the peak locations remained constant
though the relative peak heights decreased somewhat. In
none of the scans were there any peaks that could be assigned
to struvite.
4. Discussion
4.1. P and N dynamics
High concentrations of nitrate in the water flowing over the
DB sludge on July 12th (17.4 mM) compared to much lower
concentration of nitrate just below the SWI (0.6 mM; Fig. 3C)
are consistent with intensemicrobial denitrification in the DB.
In addition to rapid and extensive denitrification, heterotro-
phic sulfate reduction caused w75% of the sulfate present in
the overlying water to be reduced within the upper 2.5 cm of
the sludge. This sulfate reduction resulted in an accumulation
of free sulfide in the pore waters up to a maximum of 3.8 mM
atw15 cm. Despite the build up of free sulfide in surface layers
of the sludge, no free sulfide was measured in the fish tank or
circulating water. Previous studies have shown that this was
due to autotrophic denitrification (especially in the fluidized
bed reactor) and other sulfide oxidation processes efficiently
removing any sulfide, which might leak from the sludge
(Cytryn et al., 2005; Neori et al., 2007; Sher et al., 2008;
Schwermer et al., 2010; Neori and Mendola, 2012).
In this study, we have used measurements of stable iso-
topes of S and O (d34S and d18O) in the solids and porewaters of
the sludge tank to examine the nature of the microbial pro-
cesses in the DB. Water sampled from the system (overlying
water and pore water) contains sulfate that has significantly
higher d34S than the sulfate initially added to the system
(i.e.w 10& vs. �1.4&). This results from a combination of two
effects: (1) during the operation of the system, fish feed with a

wat e r r e s e a r c h 5 6 ( 2 0 1 4 ) 1 0 9e1 2 1 117
more elevated d34S has been constantly added and processing
of this sulfur may have added sulfate with higher d34S to the
sulfate pool and (2) at the present time, S accumulating in the
solid phase (both as AVS þ CRS and Org-S) has lower d34S than
the sulfate in the system (Fig. 5). If this solid phase pool has
gradually accumulated S with lower d34S than the contem-
poraneous sulfate, then this will have driven the aqueous
sulfate to progressively higher d34S.
The d34S of pore-water sulfate in the upper 17 cm varies
little from that of the overlying water. However, the chemical
data for pore-waters show large decreases in SO4/Cl in the
upper parts of both cores, which would normally imply
removal of sulfate by microbial sulfate reduction. This pro-
cess is usually accompanied by a large sulfur isotope frac-
tionation (e.g. Canfield, 2001) with sulfide produced typically
20&e45& depleted in 34S compared to sulfate. However, in
this particular reactor this process seems to operate with
much smaller fractionation. Firstly, there is only a small
offset between pore-water sulfate compositions and average
solid phase sulfide, with onlyw5& depletion in 34S in the
sulfide product and secondly there is no large systematic in-
crease in sulfate d34S as SO4/Cl falls in the upper parts of both
cores (data not shown but similar to the SO4/Na profile
(Fig. 2A). However, the sulfate in the pore-water is not inert, as
there are large changes in sulfate d18O over this interval in
both profiles (Fig. 5). Rather, sulfide produced must be near-
quantitatively reoxidized to sulfate and there is little net
conversion of sulfate to reduced forms such as AVS, CRS or
Org-S (e.g. Bottrell et al., 2009). However, as sulfate is reduced
and reoxidized the re-formed sulfate contains oxygen atoms
from different sources and with different d18O to the original
sulfate. The fact that sulfate in the shallowest pore-water has
slightly lower d34S than the overlying water or deeper pore-
water indicates that production of sulfate by reoxidation of34S-depleted sulfide dominates at this level. The d18O of this
sulfate is lower than the overlying waters (by 6.8& in Core A
and 4.0& in Core B, Fig. 5). Such a shift to lower d18O in sulfate
rules out molecular oxygen as the oxidizing agent as it is
highly 18O enriched, but rather indicates that the oxygen
atoms incorporated into sulfate during sulfide oxidation are
derived from water molecules with negative d18O (McCarthy
et al., 1998; Bottrell and Tranter, 2002; Bottrell et al., 2009)
and thus sulfide oxidation was driven by an alternative elec-
tron acceptor, most likely nitrate, based on the chemical
profiles (Fig. 3C). Thus, it is concluded that in the upper layers
of the DB there is rapid heterotrophic sulfate reduction, which
is approximately balanced by autotrophic nitrate reduction.
Table 2 e Output data for model runs. The two values in each gnitrate reduction before consumption by autotrophic nitrate renitrate was consumed before autotrophic NR became dominanreduction becomes dominant (or final sulfide concentration for
Heterotrophic SRrate/HeterotrophicNR rate
Aut
1
1 8.8%; 1.01 mM
0.33 40.8%; 1.01 mM
0.1 73.1%; 1.01 mM
0.03 89.3%; 0.69 mM*
Heterotrophic nitrate reduction is a relatively lesser process.
To test the feasibility of such a scenario the system was
investigated using a simple model of the fate of S and N
species.
The model considers the budgets of sulfur and nitrogen
species in a system where heterotrophic sulfate reduction
(HSR), heterotrophic nitrate reduction (HNR) and autotrophic
nitrate reduction (ANR, using sulfide as an electron donor)
may occur. Starting compositions were those of the overlying
water (15 mM sulfate, 15 mM nitrate and zero sulfide); re-
actions were modelled as first-order with respect to these
components. Concentration of organic substrate for hetero-
trophic respiration was not considered to limit those re-
actions. The model describes the evolution of an aliquot of
pore-water as its composition is modified by these reactions.
Model runs were performed with different ratios of reaction
rates, i.e. RHSR/RHNR and RANR/RHNR. Because sulfate is a lower
energy-yielding electron acceptor, under similar conditions
RHSR is generally lower than RHNR, so all runs were made with
RHSR/RHNR �1. Experimental determination of the effect of
sulfide on nitrate reducing systems shows that RANR > RHNR,
with autotrophic activity often effectively eliminating het-
erotrophic activity as long as sulfide is present (e.g. Sher et al.,
2008; Shijie et al., 2010), so all model runs were made with
RANR/RHNR �1.
Model results are presented in Table 2. During most runs
initially heterotrophic NR dominated, but as sulfide concen-
tration increased due to SR, rates of autotrophic NR increased
and became dominant (except in runs with very low hetero-
trophic SR/heterotrophic NR where nitrate was consumed
before autotrophic NR became dominant). Where the rate of
autotrophic NR is much greater than that of heterotrophic NR,
little nitrate is consumed by heterotrophic NR before auto-
trophic NR becomes dominant and sulfide concentrations are
low (and sulfate concentrations remain high) until all nitrate
is consumed. Thus, undermany realistic scenarios the system
evolves such that SR is the dominant heterotrophic respira-
tion mechanism and the sulfide generated then accounts for
themajority of NR via an autotrophic pathway. This pattern is
consistent with the observed chemistry and stable isotope
compositions that show that sulfate is cycled but not
consumed in the sludge over the interval where nitrate is
consumed. Also shown in Table 2 are the sulfide concentra-
tions at which autotrophic NR becomes dominant; these are
lower than the observed concentrations in the sludge profile,
indicating that ample sulfide is available to drive autotrophic
NR. Sulfide concentrations rise in the model runs after nitrate
rid square give: (1) % of nitrate consumed by heterotrophicduction becomes dominant (* indicates runs where allt); (2) concentration of sulfide at which autotrophic nitrateruns marked*).
otrophic NR rate/heterotrophic NR rate
10 100
1.1%; 0.15 mM 0.4%; 0.15 mM
26.7%; 0.15 mM 1.2%; 0.05 mM
63.3%; 0.11 mM 4.1%; 0.015 mM
86.0%; 0.38 mM* 52.7%; 0.005 mM*
wat e r r e s e a r c h 5 6 ( 2 0 1 4 ) 1 0 9e1 2 1118
concentrations fall, conditions similar to those observed
deeper in the sludge profile.
4.2. Sediment sludge as a long term sink for P
The digestion basin is a bacterial bioreactor in which the
sediment sludge is predominantly a repository of organic rich
fish feces from the fish basin. Inputs to the DB are modified
subsequently mainly by anaerobic bacterial processes with
the major bacterial transformations described above. Despite
the high fraction of organic P in the fish feces inputmost of the
particulate P in the DB is not organic P but inorganic P (Fig. 4A,
Table S1). X-Ray diffraction data indicates that the P accu-
mulating in the DB is a mixture of crystalline apatite and
poorly ordered hydroxyapatite (Fig. S3). There was no evi-
dence of struvite. The XRD data, however, showed that the
fish feed contained large amounts of crystalline apatite and
some hydroxyapatite (probably as ground up fish bone from
the fishmeal; Fig. S3A) besides oxalates and calcite. Part of this
initial apatite probably survives through the gut of the S.
aurata and is excreted within the fish feces (Fig. S3B, top XRD
scan). We ask the question whether the apatite measured in
the sludge is simply the residue of accumulating apatite
supplied externally alone or whether it is also formed actively
in the sludge by in situ processes. The sludge in the uppermost
layer represents most closely the (transformed) fresh organic
matter input from the fish tank. We assume initially that the
particulate matter reaching the sludge surface was 100% fish
feces because of good evidence for this based on observations
and on the observed fish growth, i.e. that the fish ate essen-
tially all the food they were fed. The total P measured in the
surface sludge was 1520 mmolesP/g, which is higher in total
concentration than either the fish feces (830 mmol/g) or the fish
feed (410 mmol/g; Table S1). It is known that there is significant
denitrification and loss of C by CO2 and/or methane produc-
tion in the ZDS system. Neori et al. (2007) estimated that over a
period of 500 days approximately 70% by weight was lost from
the system as gaseous nitrogen and carbon dioxide. The
calculated loss of weight in the conversion of 832 mmolesP/g to
1520 mmolesP/g is 46% assuming that the total P remained
constant. This change in concentration for a period of 220
days was reasonable based on the results of Neori et al. (2007)
for a similar ZDS system. If we assume that all of the change in
measured inorganic P was only due to this loss of total mass
then the inorganic phase should be 480 mmolesP/g compared
with the measured inorganic P (1035 mmolesP/g) and the
organic P was calculated to be 850 mmolesP/g compared with
the measured 480 mmolesP/g of organic P. Thus, in addition to
any changes in concentration caused by loss of mass, there
also had to be a major and rapid conversion of organic P to
inorganic P.
The sludge tank is a location of active heterotrophic nitrate
and sulfate reduction. There was major accumulation of
ammonia and phosphate in the pore waters (Fig. 3), an in-
crease in pH (Fig. S2D) as well as rapid reduction in nitrate and
sulfate, which are all characteristic of heterotrophic bacterial
reduction. However in the upper 10 cm, which is the zone of
most active heterotrophic reduction, while ammonia
increased with depth by w2 mM, phosphate decreased by
w0.2 mM. This requires a process within the upper layers of
the sludge, which caused a net removal of phosphate while
ammonia (and presumably phosphate) was being released by
heterotrophic reduction. Phosphate could be removed by the
formation of polyphosphate granules in denitrifying and other
reducing bacteria. However while polyphosphate was present
in the upper 10 cm, it was only found in mmoles/g amounts
(Fig. 4B) which was not sufficient to explain this major
removal of phosphate unless this represented a transient
phase. A more likely explanation is the formation of mineral
apatite. Struvite, another possible mineral that could be
removed in such systems, would require the removal of both
ammonia and phosphate simultaneously. Our high-resolution
X-Ray diffraction scans over the 50e55� 2q range (which is a
location where apatite can clearly be separated from hy-
droxyapatite and other CaeP phases) showed the presence of
hydroxyapatite peaks in both the fish feces and the sludge.
However, as described above, there was a clear change in the
nature and proportions of the crystalline and poorly ordered
CaeP phases with depth (Fig. S3B) indicating that new, sec-
ondary CaeP phases e most likely additional hydroxyapatite
and maybe francolite have formed. It needs to be noted that
the input of crystalline apatite from the fish feces and possibly
also the fish feedmakes a quantitative determination of these
changes difficult.
Using our measured pore water concentrations, the degree
of saturation of the pore waters for possible insoluble chem-
ical species was carried out using PHREEQC thermodynamic
software in the upper layers of the sediment sludge. In addi-
tion to measured pore water species (Fig. 3), we assumed a
fluoride concentration of half that in normal seawater (based
on the Na and Cl concentrations which are similar conserva-
tive elements and are measured as half seawater concentra-
tion). The bicarbonate concentration was obtained from DIC
measurements on gel probes corrected for incomplete back
equilibration assuming that Cl and bicarbonate were equally
affected. The calculation showed that the pore waters were
supersaturated with respect to hydroxyapatite, aragonite,
calcite and dolomite but not with respect to anhydrite, gyp-
sum or struvite (Table 3).
Over the same depth interval (0e17 cm) as phosphate
decreases by 0.2 mM (Fig. 3), dissolved Ca decreases by 6 mM
and the Ca/Na ratio decreased from 40 to w10 (Fig. S2B) while
solid phase Ca increased from 2.33 mmolesCa/g to
4.24 mmolesCa/g (Table S2) and inorganic carbonate-C
increased by a factor of 2 (Fig. S2E). This means that w15%
of the Ca in the sludge is CaCO3 (assuming that all inorganic
C is CaCO3) and the remainder is apatite. Taken together,
these data suggest that these upper layers of the sludge are
the site of active precipitation of both hydroxyapatite and
calcite from the pore waters of the sludge. The precipitation
of hydroxyapatite is facilitated in this system because not
only were the pore waters highly supersaturated with respect
to apatite but also there were available apatite nuclei in the
shape of the ground up fish bones added via the fish food.
Attempts to observe directly the nature of the apatite for-
mation process using XANES measurements using synchro-
tron were not successful mainly because there were simply
too many phosphorus-rich granules in the observed field to
observe the necessary subtle changes in peak shapes
predicted.

Table 3 e Calculated degree of saturation of the major minerals most likely to be formed by diagenetic processes in thesedimentation basin sludge. The calculations were carried out using PHREEQC thermodynamic software and the porewater datameasured in this study (see text). Note that minerals with a positive Saturation Index (SI) are oversaturated andpotentially able to precipitate depending on the kinetics of precipitation. IAP is the Ion Activity Product and can be used tocalculate the solubility constant (log KT) by the relationship (log KT [ Log (IAP) e SI).
Phase Saturation index (SI) Log IAP Log KT Mineral formula
Anhydrite �1.16 �5.52 �4.36 CaSO4
Aragonite 1.74 �6.60 �8.34 CaCO3
Calcite 1.88 �6.60 �8.48 CaCO3
Dolomite 4.15 �12.94 �17.09 CaMg(CO3)2Gypsum �0.96 �5.44 �4.58 CaSO4
.2H2O
Hydroxyapatite 6.86 3.44 �3.42 Ca5(PO4)3OH
Struvite �1.94 2.72 �13.5 Mg(NH4)(PO4). H2O
wat e r r e s e a r c h 5 6 ( 2 0 1 4 ) 1 0 9e1 2 1 119
Our data also shows that in the longer term there was a
conversion of organic P to apatite within the digestion basin.
At the time of the start up of this particular ZDS run, there
was sludge in the DB, which was the residue from seven
years of pond operation in various different modes i.e.
different masses and sizes of fish but fundamentally still
being operated as a ZDS system. This residual sludge was
expected to contain the end products of ZDS processes. The
observed depth profile of the sludge showed an increase in
inorganic P (i.e. apatite P) with depth and a synchronous
decrease in the proportion of organic P within the system
particularly in the lower layers (>25 cm) where the almost all
of the organic P appears to have converted in a process
analogous to the sink switching observed in recent marine
sediments (Ruttenberg and Berner, 1993) into inorganic
apatite.
4.3. Synthesis comparing processes in DB to othersystems
The ZDS was designed to use natural bacterial processes
found inmarine systems, particularly inmarine sediments, to
control water quality conditions over long periods of time
(several months to years). These processes, which include
nitrification, oxic respiration, heterotrophic nitrate and sul-
fate reduction and autotrophic nitrate reduction by sulphide,
are balanced in such a way as to keep the water quality con-
ditions in the fishpond within levels acceptable for fish
growth. Our results here suggest that the closest natural
analogue for P cycling processes in the DB are the sediments
beneathmodern upwelling regions such as off Namibia and in
the Arabian Sea (e.g. Goldhammer et al., 2011; Schenau et al.,
2000). These are sediments with very high levels of organic
matter (up to 40%OM). They are locationswith intense rates of
heterotrophic bacterial respiration including both oxic pro-
cesses and sulfate reduction. The sediments underneath up-
welling currents are the major areas for phosphorite (apatite)
formation. Schenau et al. (2000) observed high rates of authi-
genic apatite formation, which they suggest, are induced by
high rates of organicmatter degradation producing phosphate
in the pore waters. They also suggest that dissolution of fish
debris acts as an additional source of dissolved phosphate.
The high concentration of dissolved phosphate together with
normal levels of calcium in the pore waters result in sufficient
over saturation with respect to apatite (francolite) precipita-
tion to overcome the kinetic barrier known to exist in less
organic rich ‘normal’ marine sediments (Van Cappellen and
Berner, 1991).
An alternative mechanism for apatite precipitation has
been suggested by Goldhammer et al. (2010, 2011) who suggest
that polyphosphate present in sulfide oxidizing bacteria is
rapidly converted to apatite. This process occurs under anoxic
conditions and they calculate that the rate of phosphate to
apatite conversion by this process exceeds the rate of phos-
phorus release during organic matter mineralisation. It is
possible that both of these processes are occurring in the DB
since there is direct evidence of both heterotrophic break-
down of organicmatter and extensive oxidation of sulfide and
the presence of polyphosphate in the uppermost active layers
of the DB. It is however not possible with the data collected in
this study to determine which of these processes dominate in
the formation of apatite.
The phosphate that is removed from the recirculating
system and accumulates in the DB is mineral apatite.
Apatite is the form of phosphate, which is most commonly
used as the primary mineral for commercial phosphate ap-
plications. In a world with dwindling exploitable reserves of
phosphorite and other phosphate minerals it is important to
recycle phosphorus. Since apatite is acid soluble, the con-
version of solid apatite from the sludge into dissolved P
would be relatively easy. Thus the P accumulated in this
system could be easily recovered and converted into a form
of phosphorus that could be used in such applications as
fertilizers.
5. Conclusions
The following conclusions can be derived from the results
presented in this study:
� The digestion basin of a zero-discharge recirculating
mariculture system is a major sink of phosphorus as well
as the main site for the removal of nitrogen as a result of
the conversion of nitrate to gaseous nitrogen by denitrifi-
cation initially heterotrophic but eventually mainly
autotrophic.
� Inorganic sulfur in the digestion basin is rapidly recycled
through heterotrophic sulfate reduction and autotrophic
sulfide oxidation.
� In the upper sludge layers of the digestion basin with
ample levels of labile carbon, dissolved sulfate and nitrate,
wat e r r e s e a r c h 5 6 ( 2 0 1 4 ) 1 0 9e1 2 1120
bacterial heterotrophic respiration is dominated by sulfate
reducers providing sulfide for subsequent use in the pro-
cess of autotrophic denitrification.
� Under anoxic, nitrate and sulfate-rich conditions, inor-
ganic phosphate is removed from the pore waters in the
sludge layers through apatite formation. Authigenic
apatite is precipitated from the pore waters, which are
supersaturated with respect to hydroxyapatite. Two
possible pathways are suggested for this authigenic apatite
formation: (1) precipitation of apatite from phosphate
released by heterotrophic respiration of organic matter
containing P combining with Ca from seawater in the
presence of apatite nuclei added via the fish food or (2)
nucleation of apatite involving bacterial polyphosphate as
a transient but crucial phase. Our data were not able to
differentiate between these two possible pathways.
Acknowledgements
We would like to thank David Ashley for his help and advice
withmany aspects of the chemical analyses carried out in this
project and in particular for the inspirationalway in which he
carried out sampling and analysis late into the night during
themajor sampling trip in Israel.We also thankAmir Neori for
his useful comments on the text. This work was funded by a
UKeIsrael BIRAX grant (BY2/BIO/01) to JvR and MDK and by a
USAeIsrael Binational Science Foundation grant (2008216) to
JvR and EI. LGB would also like to acknowledge part support
for her work during this project through a UK Natural Envi-
ronment Research Council award (NE/C004566/1).
Appendix A. Supplementary data
Supplementary data related to this article can be found at
http://dx.doi.org/10.1016/j.watres.2014.02.049.
r e f e r e n c e s
Aschar-Sobbi, R., Abramov, A.Y., Diao, C., Kargacin, M.E.,Kargacin, G.J., French, R.J., Pavlov, E., 2008. High sensitivity,quantitative measurements of polyphosphate using a newDAPI-based approach. J. Fluoresc. 18, 859e866. http://dx.doi.org/10.1007/s10895-008-0315-4.
Aspila, K.I., Aqemian, H., Chau, A.S.Y., 1976. A semi-automatedmethod for the determination of inorganic, organic and totalphosphate in sediments. Analyst 101, 187e197.
Barak, Y., van Rijn, J., 2000a. Biological phosphorus removal in aprototype recirculating aquaculture system. Aquac. Eng. 22,121e136.
Barak, Y., van Rijn, J., 2000b. Atypical polyphosphateaccumulation by the denitrifying bacterium Paracoccusdenitrificans. Appl. Environ. Microbiol. 66, 1209e1212.
Barak, Y., Cytryn, E., Gelfand, I., Krom, M., van Rijn, J., 2003.Phosphate removal in a marine prototype recirculatingaquaculture system. Aquaculture 220, 313e326.
Bottrell, S.H., Tranter, M., 2002. Sulphide oxidation under partiallyanoxic conditions at the bed of the Haut Glacier d’Arolla,Switzerland. Hydrol. Process. 16, 2363e2368.
Bottrell, S.H., Parkes, R.J., Cragg, B.A., Raiswell, R., 2000.Isotopic evidence for deep anoxic pyrite oxidation andstimulation of bacterial sulphate reduction. J. Geol. Soc. 157,711e714.
Bottrell, S.H., Mortimer, R.J.G., Davies, I.M., Harvey, S.M.,Krom, M.D., 2009. Sulphur cycling in organic-rich marinesediments from a Scottish fjord. Sedimentology 56,1159e1173.
Bower, C., Holm-Hansen, T., 1980. A salicylate-hypochloritemethod for determining ammonia in seawater. Can. J. Fish.Aq. Sci. 37, 794e798.
Canfield, D.E., 2001. Isotope fractionation by natural populationsof sulfate-reducing bacteria. Geochim. Cosmochim. Acta 65,1117e1124.
Cline, J.D., 1969. Spectrophotometric determination ofhydrogen sulfide in natural waters. Limnol. Oceanogr. 14(3), 454e458.
Cytryn, E., Barak, Y., Gelfand, I., van Rijn, J., Minz, D., 2003.Diversity of microbial communities correlated tophysiochemical parameters in a digestion basin of a zero-discharge mariculture system. Environ. Microbiol. 5, 55e63.
Cytryn, E., van Rijn, J., Schramm, A., Gieseke, A., de Beer, D.,Minz, D., 2005. Identification of bacterial communitiespotentially responsible for oxic and anoxic sulfide oxidation inbiofilters of a recirculating mariculture system. Appl. Environ.Microbiol. 71, 6134e6141.
Diaz, J., Ingall, E.D., 2010. Fluorometric quantification of naturalinorganic polyphosphate. Environ. Sci. Technol. 44,4665e4671. http://dx.doi.org/10.1021/es100191h.
Gat, J.R., Dansgaard, W., 1972. Stable isotope survey of the freshwater occurrences in Israel and the northern Jordan rift valley.J. Hydrol. 16, 177e212.
Gelfand, I., Barak, Y., Even-Chen, Z., Cytryn, E., Krom, M.,Neori, A., van Rijn, J., 2003. A novel zero-discharge intensiveseawater recirculating system for culture of marine fish.J. World Aquac. Soc. 34, 344e358.
Goldhammer, T., Bruchert, V., Ferdelman, T.G., Zabel, M., 2010.Microbial sequestration of phosphorus in anoxic upwellingsediments. Nat. Geosci. 3 (8), 557e561.
Goldhammer, T., Brunner, B., Bernaconi, S.M., 2011. Phosphateoxygen isotopes: Insights into sedimentary phosphoruscycling from the Benguela upwelling system. Geochim.Cosmochim. Acta 75 (13), 3741e3756.
Golterman, H.L., Clymo, R.S., Ohnstad, M.A.M., 1978. Methodsfor Physical and Chemical Analyses of Freshwaters, seconded. In: International Biological Programme Handbooks; no. 8.Blackwell Scientific Publ, Oxford, U.K, p. 210.
Jiang, G., Sharma, K.R., Guissola, A., Keller, J., Yuan, Z., 2009.Sulfur transformation in rising main sewers receiving nitratedosage. Water Res. 43, 4430e4440.
McCarthy, M.D.B., Newton, R.J., Bottrell, S.H., 1998. Oxygenisotopic compositions of sulphate from coals: implications forprimary sulphate sources and secondary weatheringprocesses. Fuel 77, 677e682.
Naylor, R.L., Goldberg, R.J., Mooney, H., Beveridge, M.C., Clay, J.,Folk, C., Kautsky, N., Lubchenco, J., Primavera, J., Williams, M.,1998. Nature’s subsidies to shrimp and salmon farming.Nature 282, 883e884.
Neori, A., Krom, M.D., van Rijn, J., 2007. Biochemical processes inintensive zero-effluent marine fish culture with recirculatingaerobic and anaerobic biofilters. J. Exp. Mar. Biol. Ecol. 349,235e247.
Neori, A., Mendola, D., 2012. An anaerobic slurry module forsolids digestion and denitrification in recirculating, minimaldischarge marine fish culture systems. J. World Aquac. Soc. 43,859e868.
Newton, R.J., Bottrell, S.H., Dean, S.P., Hatfield, D., Raiswell, R.,1995. An evaluation of the chromous chloride reduction
wat e r r e s e a r c h 5 6 ( 2 0 1 4 ) 1 0 9e1 2 1 121
method for isotopic analyses of pyrite in rocks and sediment.Chem. Geol. 125, 317e320.
Ruttenberg, K.C., 1992. Development of a sequential extractionmethod for different forms of phosphorus in marinesediments. Limnol. Oceanogr. 37, 1460e1482.
Ruttenberg, K.C., Berner, R.A., 1993. Authigenic apatite formationand burial in sediments from non-upwelling, continentalmargin environments. Geochim. Cosmochim. Acta 57,991e1007.
Schenau, S., Slomp, C.P., DeLange, G.J., 2000. Phosphogenesisand active phosphorite formation in sediments from theArabian Sea oxygen minimum zone. Mar. Geol. 169 (1e2),1e20.
Schneider, K., Sher, Y., Erez, J., van Rijn, J., 2011. Carbon cycling ina zero-discharge mariculture system. Water Res. 45 (7),2375e2382.
Shijie, A., Tang, K., Nemati, M., 2010. Simultaneousbiodesulphurization and denitrification using an oilreservoir microbial culture: effects of sulphide loading rateand sulphide to nitrate loading ratio. Water Res. 44,1531e1541.
Sher, Y., Schneider, K., Schwermer, C.U., van Rijn, J., 2008. Sulfideinduced nitrate reduction in the sludge of an anaerobictreatment stage of a zero-discharge recirculating mariculturesystem. Water Res. 42, 4386e4392.
Schulz, H.N., Brinkhoff, T., Ferdelman, T.G., Marine, M.H.,Teske, A., Jorgensen, B.B., 1999. Dense populations of a giantsulfur bacterium in Namibian shelf sediments. Science 284,493e495.
Spence, M.J., Thornton, S.F., Bottrell, S.H., Spence, K.H., 2005.Determination of interstitial water chemistry and porosity inconsolidated aquifer materials by diffusion equilibrium-exchange. Environ. Sci. Technol. 39, 1158e1166.
Schwermer, C.U., Ferdelman, T.G., Stief, P., Gieseke, A.,Rezakhani, N., van Rijn, J., de Beer, D., Schramm, A., 2010.Effect of nitrate on sulfur transformations in sulfidogenicsludge of a marine aquaculture biofilter. FEMS Microbiol. Ecol.72, 476e484.
Van Cappellen, P., Berner, R.A., 1991. Fluorapatite crystal growthfrom modified seawater solutions. Geochim. Cosmochim.Acta 55, 1219e1234.
van Loosdrecht, M.C.M., Brandse, F.A.M., de Vries, A.C., 1998.Upgrading of wastewater treatment processes for integratednutrient removal e the BCFS process. Water Sci. Technol. 37,209e217.
van Loosdrecht, M.C.M., Hooijmans, C.M., Brdjanovitch, D.,Heijnen, J.J., 1997. Biological phosphate removal processes.Appl. Microbiol. Biotechnol. 48, 289e296.
van Rijn, J., 2013. Waste treatment in recirculating aquaculturesystems. Aquac. Eng. 53, 49e56.
Related Documents