1 Bacterial survival in microscopic surface wetness Maor Grinberg 1* , Tomer Orevi 1* , Shifra Steinberg 1 , Nadav Kashtan 1† 1 Department of Plant Pathology and Microbiology, Robert H. Smith Faculty of Agriculture, Food, and Environment, Hebrew University, Rehovot, 76100 Israel * These authors contributed equally to this work † Corresponding author: Nadav Kashtan [email protected] Plant leaves constitute a huge microbial habitat of global importance. How microorganisms survive the dry daytime on leaves and avoid desiccation is not well understood. There is evidence that microscopic surface wetness in the form of thin films and micrometer-sized droplets, invisible to the naked eye, persists on leaves during daytime due to deliquescence – the absorption of water until dissolution – of hygroscopic aerosols. Here we study how such microscopic wetness affects cell survival. We show that, on surfaces drying under moderate humidity, stable microdroplets form around bacterial aggregates due to capillary pinning and deliquescence. Notably, droplet-size increases with aggregate-size, and cell survival is higher the larger the droplet. This phenomenon was observed for 13 bacterial species, two of which – Pseudomonas fluorescens and P. putida – were studied in depth. Microdroplet formation around aggregates is likely key to bacterial survival in a variety of unsaturated microbial habitats, including leaf surfaces. The phyllosphere – the aerial parts of plants – is a vast microbial habitat that is home to diverse microbial communities (Lindow and Leveau, 2002, Lindow and Brandl, 2003, Vorholt, 2012, Leveau, 2015, Bringel and Couée, 2015, Vacher et al., 2016). These communities, dominated by bacteria, play a major role in the function and health of their host plant, and take part in global biogeochemical cycles. Hydration conditions on plant leaf surfaces vary considerably over the diurnal cycle, typically with wet nights and dry days (Brewer and Smith, 1997, Klemm

Welcome message from author
This document is posted to help you gain knowledge. Please leave a comment to let me know what you think about it! Share it to your friends and learn new things together.
Transcript
1
Bacterial survival in microscopic surface wetness Maor Grinberg1*, Tomer Orevi1*, Shifra Steinberg1, Nadav Kashtan1†
1 Department of Plant Pathology and Microbiology, Robert H. Smith Faculty of Agriculture, Food, and Environment, Hebrew University, Rehovot, 76100 Israel
* These authors contributed equally to this work † Corresponding author: Nadav Kashtan [email protected]
Plant leaves constitute a huge microbial habitat of global importance. How
microorganisms survive the dry daytime on leaves and avoid desiccation is not well
understood. There is evidence that microscopic surface wetness in the form of thin films
and micrometer-sized droplets, invisible to the naked eye, persists on leaves during
daytime due to deliquescence – the absorption of water until dissolution – of hygroscopic
aerosols. Here we study how such microscopic wetness affects cell survival. We show that,
on surfaces drying under moderate humidity, stable microdroplets form around bacterial
aggregates due to capillary pinning and deliquescence. Notably, droplet-size increases
with aggregate-size, and cell survival is higher the larger the droplet. This phenomenon
was observed for 13 bacterial species, two of which – Pseudomonas fluorescens and P.
putida – were studied in depth. Microdroplet formation around aggregates is likely key
to bacterial survival in a variety of unsaturated microbial habitats, including leaf
surfaces.
The phyllosphere – the aerial parts of plants – is a vast microbial habitat that is home to diverse
microbial communities (Lindow and Leveau, 2002, Lindow and Brandl, 2003, Vorholt, 2012,
Leveau, 2015, Bringel and Couée, 2015, Vacher et al., 2016). These communities, dominated
by bacteria, play a major role in the function and health of their host plant, and take part in
global biogeochemical cycles. Hydration conditions on plant leaf surfaces vary considerably
over the diurnal cycle, typically with wet nights and dry days (Brewer and Smith, 1997, Klemm

2
et al., 2002, Magarey et al., 2005, Beattie, 2011). An open question is how bacteria survive the
dry daytime on leaves and avoid desiccation.
While leaf surfaces may appear to be completely dry during the day, there is increasing
evidence that they are frequently covered by thin liquid films or micrometer-sized droplets that
are invisible to the naked eye (Burkhardt and Hunsche, 2013, Burkhardt and Eiden, 1994,
Burkhardt et al., 2001) (Figure 1A). This microscopic wetness results, in large part, from the
deliquescence of hygroscopic particles that absorb moisture until they dissolve in the absorbed
water and form a solution. One ubiquitous source of deliquescent compounds on plant leaf
surfaces is aerosols (Pöschl, 2005, Tang and Munkelwitz, 1993, Tang, 1979). Notably, during
the day, the relative humidity (RH) in the boundary layer close to the leaf surface is typically
higher than that in the surrounding air, due to transpiration through open stomata. Thus, in
many cases the RH is above the deliquescent point, leading to the formation of highly
concentrated solutions in the form of thin films (< a few µms) and microscopic droplets
(Burkhardt and Hunsche, 2013). The phenomenon of deliquescence-associated microscopic
surface wetness is under-studied, and little is known about its impact on microbial ecology of
the phyllosphere and on its contribution to desiccation avoidance and cell survival during the
dry daytime.
The microscopic hydration conditions around bacterial cells are expected to significantly affect
cell survival in the largest terrestrial microbial habitats – soil, root, and leaf surfaces – that
experience recurring wet-dry cycles. Only a few studies have attempted to characterize the
microscopic hydration conditions surrounding cells on a drying surface under moderate RH
and the involvement of deliquescent substrates in this process. Bacterial survival in
deliquescent wetness has mainly been studied in extremely dry deserts (Davila et al., 2008,
Davila et al., 2013) and on Mars analog environments (Nuding et al., 2017, Stevens et al.,
2019). Soft liquid-like substances wrapped around cells, whose formation was suggested to be
3
due to deliquescence of solute components, were reported (Méndez-Vilas et al., 2011)). Yet,
the interplay between droplet formation, bacterial surface colonization, and survival, has not
been studied systematically.
Bacterial cells on leaf surfaces are observed in solitary and aggregated forms. The majority of
cells are typically found within surface-attached aggregates, i.e., biofilms (Monier and Lindow,
2004, Morris et al., 1997). This is consistent with the reported increased survival rate in
aggregates under dry conditions on leaves, and poor survival of solitary cells (Monier and
Lindow, 2003, Rigano et al., 2007, Yu et al., 1999). The conventional explanation for the
increased survival in aggregates is the protective role of the extracellular polymeric substances
(EPS), a matrix that acts as a hydrogel (Chang et al., 2007, Or et al., 2007, Roberson and
Firestone, 1992, Ophir and Gutnick, 1994). Here, we ask if aggregation plays additional roles
in protection from desiccation. We hypothesize that the resulting microscale hydration
conditions around cells on a drying surface depend on cellular organization (i.e.,
solitary/aggregated cells and aggregate size) and that the microscale hydration conditions (i.e.,
droplet size) affect cell survival.
To this end, we designed an experimental system that creates deliquescent microscopic wetness
on artificial surfaces. This system conserves some basic important features of natural leaf
microscopic wetness while eliminating some of the complexities of studying leaf surfaces
directly. The system enabled us to perform a systematic microscopic analysis of the interplay
between bacteria’s cellular organization on a surface, microscopic wetness, and cell survival
on surfaces drying under moderate humidity.
We observed that bacterial cells – aggregates in particular – retained a hydrated micro-
environment in the form of stable microscopic droplets (of tens of µms in diameter) while the
surface was macroscopically dry. We then quantitatively analyzed the distribution of droplet

4
size, its correlation with aggregate size, and the fraction of live and dead cells in each droplet.
The significance of our results is discussed in the context of survival strategies on drying
surfaces, microbial ecology of the phyllosphere, and possible relevance to other habitats.
Results
Drying experiments on bacteria-colonized surfaces
Studying bacteria in microscopic surface wetness directly on leaves poses a significant
technological challenge due to strong auto-fluorescence, surface roughness, and transparency
of films and microdroplets. We therefore constructed a simple experimental system, accessible
to microscopy, that enables studying the interplay between bacterial surface colonization, cell
survival, and microscopic wetness on artificial surfaces. This system enables capturing
microscopic leaf wetness central properties, including contribution of deliquescent substrates,
and droplet persistence, thickness, and patchiness (Figure 1B - see Methods). We studied in
depth two model bacterial strains – Pseudomonas fluorescens A506 (a leaf surface dweller
strain (Wilson and Lindow, 1993, Hagen et al., 2009) and P. putida KT2440 (a soil and root
bacterial strain extensively studied under unsaturated hydration conditions(Molina et al., 2000,
Nelson et al., 2002, Espinosa-Urgel et al., 2002, Van De Mortel and Halverson, 2004).
Qualitatively similar results were observed for 16 additional strains (13 bacterial species in
total - see Methods). Briefly, bacterial cells were inoculated in diluted M9 minimal media onto
hollowed stickers applied to the glass substrate of multi-well plates and placed inside an
environmental chamber under constant temperature and RH (28oC; 70% or 85% RH) (Figure
1B - Methods). Results shown here are from 85% RH though 70% RH yielded qualitatively
similar results.

5
Figure 1 Microscopic wetness: Experimental setup (A) Plant leaf surfaces are usually wet at night with visible macroscopic wetness (e.g., dewdrops). During the day, leaf surfaces are typically dry, with microscopic wetness invisible to the naked eye. (B) A thin, round sticker is placed in the center of each well in a glass-bottom, multi-well plate. The hollow part of the sticker is loaded with a medium containing suspended bacteria cells. The well-plate is placed under constant temperature, RH, and air circulation. Water gradually evaporates from the medium while bacteria grow, divide, and colonize the surface of the well until the surface becomes macroscopically dry and microscopic surface wetness forms.
Microscopic droplet formation around bacterial cells and aggregates
At 85% RH, it took about 14±1h for the bulk water to evaporate. During this time, for both
studied strains, some of the cells attached to the surface and, over time, grew and formed
aggregates. Other cells formed cell clusters at the liquid-air interface (pellicles). The rest of the
cells remained solitary: either surface-attached, or planktonic. The glass substrate appeared dry
to the naked eye after 14±1h of incubation. We then examined the surface of the wells under
the microscope (see Methods). Remarkably, the surface was covered by stable microscopic

6
droplets, mainly around bacterial aggregates (Figures 2A-B). Notably, while solitary cells were
surrounded by miniscule droplets (possibly similar to those reported by Mendez-Vilas et al.
(Méndez-Vilas et al., 2011), larger aggregates (of ~100 cells) were surrounded by large droplets
measuring tens of µms in diameter. Microscopic wetness was retained around bacterial cells
for more than 24h, while uncolonized surface areas appeared completely dry.
In order to assess the distribution of droplet size and the correlation between droplet size and
aggregate size, we scanned a large area of the surface (~10 mm2) to collect and analyze
information on thousands of microdroplets (Methods). We found that droplet size (measured
by droplet area) follows a power law distribution with similar exponents for the two studied
strains (Figure 2C). When droplet size was plotted as a function of area covered by cells within
each droplet (as a proxy for cell number - see Methods), a clear positive correlation between
cell abundance and droplet size emerged (Figure 2D). Experiments using hydrophobic
polystyrene substrate rather than glass also yielded qualitatively similar results (Figure 2—
Figure Supplement 1).
The underlying mechanisms of droplet formation
To understand how these microdroplets form, we tested what components of the system were
essential to this process. First, we repeated the experiments with fluorescent beads (2µms in
diameter) instead of bacteria. Interestingly, we found that microdroplets formed even around
beads (Figure 2—Figure Supplement 2) with a similar droplet-size distribution, as in
experiments with bacteria; and a surprisingly similar correlation between the size of the droplet
and the number of beads therein (Figure 2C-D). In a control experiment without any
particulates – bacterial cells or beads – a much smaller number of droplets formed (<1 droplets
of >10µm2 area per mm2, as opposed to >100 droplets of that size in experiments with bacteria).
These results indicate that the presence of particles is necessary for droplet formation, whereas
biological activity is not. Last, we repeated the beads experiment with pure water instead of

7
M9 medium. This time we did not observe any droplets (Figure 2—Figure Supplement 2),
indicating that the solutes control droplet formation and retention through their deliquescent
properties.
Figure 2 Microdroplets form around bacterial cells and aggregates (A-B) Representative sections of the surface imaged 24h after macroscopically dry conditions were established. Bacterial cells (green) that colonized the surface during the wet phase of the experiment are engulfed by microdroplets, while uncolonized portions of the surface appear to be dry. Solitary cells are engulfed by very small microdroplets, while large aggregates are engulfed by larger droplets (white arrows). Images show a 0.66 x 0.66mm section from an experiment with P. fluorescens (A) and P. putida (B). (C) Droplet-size distributions at 24h: Droplets from both strains show power law distributions with relatively similar exponents (γ = -1.2±0.15

8
(mean±SEM) and -1.0±0.45 for P. fluorescens and P. putida respectively). (D) Droplet size as a function of cell abundance within the droplet (estimated by area covered by cells): Droplet size increases with cell abundance within the droplet. Error bars in (C) and (D) are standard errors. (E) A time-lapse series capturing the formation of microdroplets around bacterial aggregates: The thin (a few µms) liquid receding front clears out from the surface, leaving behind microdroplets whenever it encounters bacterial cells or aggregates (see also Video 1-3).
To observe the surface’s final drying phase, we used time-lapse imaging, enabling us to capture
the receding front of the remaining thin liquid layer and the formation of microdroplets.
Retention of droplets around aggregates as well as solitary cells, through pinning of the liquid-
air interface, is clearly evident (Figure 2E, Videos 1-3). The cause of this pinning is the strong
capillary forces acting on the rough surfaces produced by the presence of particulates (Bonn et
al., 2009, Herminghaus et al., 2008) . This phenomenon supports the notion that aggregate sizes
(but possibly also other properties) determine droplet size. We note that under our experimental
conditions, the droplets were not formed through the wetting ‘direction’ of a deliquescence
process, by which solid salts absorb water until dissolution. Rather, the deliquescent properties
of the solutes prevented complete evaporation at RH above the point of deliquescence of the
salts mixture. In summary, both particulates and deliquescent solutes are essential for the
differential formation and retention of microscopic wetness around cells and aggregates.
Microdroplets are highly concentrated solutions
Direct measurements of the solute concentrations within microdroplets constitute a technical
challenge. To overcome that challenge, we added a fluorescent dye (Alexa Fluor™ 647) to the
initial M9 medium, as a reporter for the solute concentration induced by evaporation. We
compared the fluorescent intensity of dye-labeled microdroplets to a calibration curve built by
measuring the intensities of known concentrations of the standard M9 supplemented with
Alexa 647 (See Methods, Figure 2—Figure Supplement 3). We found that the microdroplet
solution is highly concentrated – as can be expected from deliquescent wetness – and is

9
estimated to be 23.3±3.5 (mean±SD) more concentrated than a standard M9 (~50 times more
concentrated than the diluted X2 M9 used in our experiments) (See Methods, Figure. 2—Figure
Supplement 3). The high estimated mean osmolarity within the droplets (~6.7 Osm/L, see
Supplementary Table 1) likely imposes severe osmotic stress on cells within them. Indeed,
growth curves of the two strains (P. fluorescens and P. putida) in liquid cultures of equivalent
concentrated M9 and M9+NaCl media showed delayed or complete growth inhibition (Figure.
3—Figure Supplement 5, Supplementary Table 2). This result accords with the observation
that cell divisions within droplets was rarely seen in our experiments (at 85% RH).
Cell survival rate increases with droplet size
As cells inhabit a heterogeneous landscape of droplets of various sizes, we next asked whether
droplet size affects cell survival. We applied a standard bacterial viability assay by adding
propidium iodide (PI) to the medium (see Methods). Thus, live cells emit green-yellow
fluorescence, while dead cells exhibit red emission (Figure 3 A,B). The assay’s validity was
further confirmed by the observation that following further incubation at 95% RH, YFP-
expressing cells were dividing (some were even motile), while red cells lacked signs of
physiological activity (Figure 3—Figure Supplement 1, Video 4,5). Notably, although the
overall population distribution along droplet size was strain specific, survival of cells was
nearly exclusively restricted to large droplets for both strains (>103µm2 area; Figure 3 C,D,
Methods). P. putida showed higher overall survival than did P. fluorescens (16% vs. 7%, 24h
after drying). We note that the overall survival often varied between experiments, and in some
cases P. fluorescens had higher survival than did P. putida. Importantly, regardless of this
stochasticity, common to all experiments was a clear trend for both strains: The fraction of live
cells within droplets increases with droplet size (Figure 3E). Accordingly, survival
probabilities in small droplets (<102 µm2 area) were poor (<5%), in contrast to > 50% survival
of both strains in the largest droplets (>104 µm2).

10
Figure 3 Bacterial survival increases with droplet size. (A-B) A section of the surface covered with droplets (experiment with P. fluorescens (A) and P .putida (B), 24h after macroscopic drying): Live cells are green, and dead cells (cells with damaged membrane) are red. Live cells were mostly observed in large droplets. (C-D) P. fluorescens (C) and P. putida (D) cell distributions, binned by droplet size: The green and red colored bars indicate the fraction of live and dead cells respectively. (E) Fraction of live cells as a function of droplet size. Survival rate increases with droplet size in both studied strains. Error bars represent standard errors. Each dot in the background represents a single droplet. (F) P. fluorescens survival rates as a function of aggregate size and droplet size: The height of the bars indicates

11
all cellular-object (aggregates or solitary cells) mean survival rates within a given bin of aggregate and droplet size. The inset above shows the same data, but presented differently, with each line representing an aggregate-size bin. Note that there is no pronounced difference between lines, indicating that aggregate size has only minor effect on P. fluorescens survival. (G) Same as (F) but for P. putida: Note the pronounced difference between lines, indicating that aggregate size contributes to P. putida’s survival (larger aggregates have higher survival); yet droplet size contributes to survival more profoundly than does aggregation (see also Figure 3—Figure Supplement 3).
Next, we sought to understand what the net contribution of droplet size is to cell survival.
Analysis of cell survival rates as a function of both aggregate size (which by itself affects
survival (Monier and Lindow, 2003), cf. Figure 3—Figure Supplement 2) and the size of the
droplet they inhabit, shows that for both strains, droplet size strongly affects survival, whereas
aggregate size has only a marginal (P. fluorescens) or moderate (P. putida) effect on survival
(Figure 3F,G). The relative contribution of each of these two variables was also assessed by a
multinomial logistic regression model, giving significantly higher weight to droplet size in
comparison to aggregate size, for both strains (Figure 3—Figure Supplement 3).
To further study droplet size’s effect on survival, we repeated the drying experiment, but
inoculated the cells into the drying medium only at a later stage – closer to the macroscopic
drying stage – so that the cells did not have time to grow and form aggregates, and were thus
mostly solitary. Notably, live cells were observed nearly exclusively in large droplets (>103
µm2 area, cf. Figure 3—Figure Supplement 4), and survival increased with droplet size. These
results indicate that large droplets promote cell survival even when aggregates are absent.
Experiments with 16 additional strains, including Gram-negative and Gram-positive bacteria
from a variety of microbial habitats, yielded qualitatively similar results to those described in
the preceding paragraphs (Table 1). Although not all the strains formed aggregates under our
experimental conditions, the general picture was same for all strains: Larger droplets were
observed around aggregates or surface areas more densely populated by cells (for strains that
did not form aggregates), and higher survival was observed in larger droplets.

12
Formation of droplets using dissolved solutes and microbiota from natural leaves
Lastly, we repeated our experiments using solutes and microbiota extracted from the surface
of a natural leaf. We found that stable microdroplets also formed around natural microbiota
cells, in some cases only at higher RH (>85%) or at lower temperatures, suggesting that
condensation is involved in microdroplet formation. Furthermore, the microscopic wetness
from natural leaf wash was visibly similar to those in our experiments with inoculated bacteria
and a synthetic medium (Figure 4, Figure 4—Figure Supplement 1).
Figure 4 Microscopic wetness forming with natural leaf washes. (A) ivy leaf wash. (B) orange leaf wash. In both leaf washes, droplet formation around microbiota cells including fungi, yeast, and bacteria can be observed. Leaf wash protocols and drying conditions are described in Methods.
Discussion
Our study demonstrates that stable microdroplets of concentrated liquid solutions form around
cells and aggregates on bacterial-colonized surfaces that are drying under moderate to high RH.
We show that bacterial cell organization on a surface strongly affects the microscopic hydration
conditions around cells, and that droplet size strongly affects cell survival. We reveal an

13
additional function of bacterial aggregation: improving hydration by retaining large stable
droplets (> tens of µms in diameter) around aggregates. Why survival is enhanced in larger
droplets remains an open question. We hypothesize that larger droplets provide favorable
conditions due to higher water potential; further research is required to test this hypothesis.We
note that the evaporation dynamics of a drop of a liquid solution – even without bacteria – is a
surprisingly rich and complex physical process and a subject of intensive research (De Gennes
et al., 2013, Bonn et al., 2009). Our results point to two central mechanisms promoting the
formation and stability of microdroplets around bacterial aggregates: The first is pinning of the
liquid < > air interface due to the large interfacial tension force associated with the rough
surfaces of particulate aggregates (Herminghaus et al., 2008, Bonn et al., 2009), as observed in
Videos 1-3. The second is the deliquescent property of solutes that prohibits complete
evaporation of the pinned droplets at RH that is higher than the point of deliquescence of the
solutes, such that the droplets are in equilibrium with the surrounding humid air.
We suggest that bacterial self-organization on a surface can improve survival in environments
with recurrent drying that lead to microscopic wetness. A simple conceptual model that
captures the system’s main components and their interactions is depicted in Figure 5A.
Aggregation is an important feature that can affect self-organization, and in turn, the resulting
waterscape, by increasing the fraction of the population that ends up in large droplets.
Preliminary evidence for this is provided by the comparison of the fraction of the population
residing in droplets above a given size, using beads, ‘solitary’ and ‘aggregated’ cells as
particles (Figure. 5B, Figure 5—Figure Supplement 1). The interplay between self-
organization, waterscape, and survival is an intriguing open question that merits further
research.

14
Figure 5 The interplay between self-organization, waterscape, and survival (A) Suggested conceptual model: The self-organization of cells on the surface affects the microscopic waterscape and the microscopic hydration conditions around cells, which in turn, together with cellular organization (i.e., aggregation) affects survival. (B) The three lines represent the fraction of the population residing above a given droplet size (that is, the ratio between the area covered by cells residing in droplets larger than a given size, to the total area covered by cells) of the solitary (late-inoculation) experiment, the bead experiment, and the standard “aggregated“ experiment on P. fluorescens. Inset: Aggregate-size distributions of these three experiments. Aggregation results in a larger fraction of the population ending up in large droplets with increased survival rates for cells therein.
Interestingly, the ecological origin of the strains (Table 1) did not always predict their survival
rates. Some phyllospheric bacteria (mostly plant pathogens) exhibited low survival, soil
bacteria exhibited variable survival rates, E. coli exhibited a surprising medium survival, and
the aquatic strain P. veronii exhibited high survival. Survival in microscopic surface wetness
is likely a complex trait that combines physiological adaptation of the individual cell and
collective protection that results from self-organization and cooperation (i.e., aggregation). In

15
nature, bacteria live in complex communities comprised of many bacterial species, and are
exposed to various chemical and physical environmental cues. Thus, our single-strain
experiments, with M9 medium on glass-bottom wells, may not capture survival strategies that
might be triggered by environmental cues and that rely on other members of the community.
For example, joining existing aggregates of other species can be a beneficial strategy in
environments with recurrent drying events (Grinberg et al., 2019, Steinberg et al., 2019).
Obviously, there are more differences between natural leaf surfaces and our simplified
experimental system. Firstly, leaf surfaces have heterogeneous 3D topography due to leaf
microscale anatomy such as the cavities between epidermal cells, stomata openings, and
trichomes (Koch et al., 2008). This microscale topography affects drying and wetting of the
leaf surface, and hence can impact droplet formation both by its effect on interfacial forces and
pinning as well as imposing stronger flow upon topological sinks. Secondly, leaf surfaces tend
to be hydrophobic to a degree that varies among plant species (Koch et al., 2008). The impact
of both microscale topography and surface hydrophobicity on drying and droplet formation can
be studied using artificial leaves (Doan and Leveau, 2015, Soffe et al., 2019) or leaf cuticle
peels (Schönherr and Riederer, 1986, Remus-Emsermann et al., 2011). Finally, the chemical
composition of leaf surface wetness varies considerably with multiple factors including plant
species, soil characteristics (e.g., salinity), geography, and environmental variables that affect
atmospheric aerosol composition, deposition, and retention, such as wind and rain (Pöschl,
2005, Tang and Munkelwitz, 1993, Tang, 1979). All of these factors are likely to affect the
formation and retention of microscopic leaf wetness.
Our results suggest that microscopic surface wetness, predicted to occur globally on plant
leaves (Burkhardt and Hunsche, 2013), can explain how microorganisms survive on leaf
surfaces during daytime by avoiding complete desiccation. Yet, they also imply that
phyllospheric bacteria have evolved mechanisms to cope with the highly concentrated solutions

16
associated with deliquescent wetness. The ability to tolerate periods of such high salinities
could thus be a ubiquitous and necessary trait for phyllospheric bacteria. Better understanding
of bacterial survival in microscopic deliquescent surface wetness, and how it is affected by
agricultural practices and anthropogenic aerosol emissions, is thus of great importance to
microbial ecology of the phyllosphere and to plant pathology.
Finally, as deliquescent substances are prevalent in many other microbial habitats, it is safe to
assume that deliquescent microscopic wetness occurs in many microbial habitats, including
soil and rock surfaces (Davila et al., 2008, Davila et al., 2013), the built environment, human
and animal skin, and even extraterrestrial systems (e.g., Mars (Nuding et al., 2017, Stevens et
al., 2019). Moreover, microscopic surface wetness is likely to have a significant impact not
only on survival, but also on additional key aspects of bacterial life, including motility,
communication, competition, interactions, and exchange of genetic material, as demonstrated
for soil and other porous media (Tecon et al., 2018, Or et al., 2007). Microbial life in
deliquescent microscopic surface wetness remains to be further explored.
Methods Experimental design
A simple experimental system, accessible to microscopy, that enables studying the interplay
between bacterial surface colonization, cell survival, and microscopic wetness on artificial
surfaces was built (see Figure 1B and section Drying surface experiments). Fluorescently-
tagged bacterial cells are inoculated in liquid media onto hollowed stickers adhered to the glass
substrate of multi-well plates and placed inside an environmental chamber under constant
temperature and RH (Figure 1B, and Drying surface experiments and Strains and culture
condition). After macroscopic drying is achieved, plates are examined under the microscope
(see Microscopy) and microscopic wetness, bacterial surface colonization, and cell survival

17
are analyzed (see Image analysis, Statistical analysis, and Estimation of solution
concentrations within droplets). Similar experiments with natural leaf washes are described
in the section Natural leaf washes.
Drying surface experiments
Imaging spacers (20mm SecureSeal™ SS1X20, Grace Bio-Labs) were used to confine the
inoculum on the surface of 6-well glass bottom plates (CellVis) (Figure 1B). The spacer was
used to reduce flow dynamics effects that result in transfer of biomass to the edge of an
evaporating body of liquid drops on flat surfaces (e.g., coffee ring effect (Deegan et al., 1997,
Larson, 2017). Reduction of flow was achieved through a more spatially uniform evaporation
rate. The corners of the spacer were cut to fit the well, adhesive liner was removed from one
side of the spacer, and the exposed adhesive was applied to the center of the well by applying
gentle pressure against the glass using a sterile disposable cell spreader. The upper liner was
removed and the hollow of the spacer was loaded with 340 µls of diluted suspended cells
(~2x10³ cell/ml) at half-strength M9 medium (with 2mM glucose conc.). For survival assay,
propidium iodide (component B, LIVE/DEAD Bac-Light Bacterial Viability Kit, L-7012,
Molecular Probes) was added to the starting inoculum to obtain a final concentration of 20nM.
The typical “live” SYTO dye was not used; instead, we used the constitutive YFP expression
of live cells (see below) as indication of living cells. In the experiments with fluorescent beads,
rhodamine-tagged micro particles (2µms) based on melamine resin were used (melamine-
formaldehyde resin, FLUKA). The plates were placed, with the plastic lid open, on the
uppermost shelf of a temperature- and humidity-controlled growth chamber
(FitoClima 600 PLH, Aralab). Temperature was set to 28oC, RH to 70% or 85%, and fan speed
to 100%. Prior to the microscopy imaging acquisition, ddH2O was added to the empty spaces
between the wells of the plate, plates were covered with the plastic lid, and the plate’s perimeter
was sealed with a stretchable sealing tape to maintain a humid environment (>95% RH).

18
Bacterial strains and culture conditions
Pseudomonas fluorescens A506 (Wilson and Lindow, 1993, Hagen et al., 2009) and
Pseudomonas putida KT2440 (Nelson et al., 2002) (ATCC® 47054™) were chromosomally
tagged with YFP using the mini-Tn7 system (Choi and Schweizer, 2006) (Plasmid pUC18T-
mini-Tn7T-Gm-eyfp and pTNS1, Addgene plasmid # 65031, and # 64967 respectively (Choi
et al., 2005). Prior to the gradual drying experiments, strains were grown in LB Lennox broth
(Conda) supplemented with gentamicin 30 µg/ml for 12h (agitation set at 220 rpm; at 28oC).
50 µls of the 12h batch culture was transferred into 3 ml of fresh LB medium, and incubated
for an additional 3-6h (until OD reached a value of ~0.5-0.7). Suspended cells were transferred
to a half-strength M9 medium supplemented with glucose by a two-step washing protocol
(centrifuge at 6,000 rcf for 2 min., and resuspension of the pellet in 500 µls medium). The half-
strength M9 medium consisted of 5.64 g M9 Minimal Salts Base 5x (Formedium), 60 mgs of
MgSO4, and 5.5 mgs of CaCl2 per liter of de-ionized water supplemented with 360 mgs
glucose as a carbon source (final glucose concentration of 2mM). The full list of strains used
in this study is given in Table 1.
Microscopy
Microscopic inspection and image acquisition were performed using an Eclipse Ti-E inverted
microscope (Nikon) equipped with 40x/(0.95 N.A.) air objective. An LED light source (SOLA
SE II, Lumencor) was used for fluorescence excitation. YFP fluorescence was excited with a
470/40 filter, and emission was collected with a T495lpxr dichroic mirror and a 525/50 filter.
Propidium iodide fluorescence was excited with a 560/40 filter, and emission was collected
with a T585lpxr dichroic mirror and a 630/75 filter (filters and dichroic mirror from Chroma).
A motorized encoded scanning stage (Märzhäuser Wetzlar GmbH) was used to collect multiple
stage positions. In each well, 5 xy positions were randomly chosen, and 5x5 adjacent fields of
view (with a 5% overlap) were scanned. Images were acquired with an SCMOS camera (ZYLA

19
4.2PLUS, Andor). NIS Elements 5.02 software was used for acquisition and basic image
processing.
Genus Species Strain Gram
+/- Major
Habitat Aggrega
tion Survival at 24h
Gifted from
Pseudomonas syringae B728a - phyllosphere No low S. Lindow
Pseudomonas syringae DC3000 - phyllosphere No low O. Bahar
Pseudomonas fluorescens A506 - phyllosphere Yes medium S. Lindow
Pseudomonas fluorescens NT133 - rhizosphere Yes low D. Minz
Pseudomonas putida KT2440 - soil Yes medium
Purchased from
ATCC
Pseudomonas putida KT2442 - soil Yes medium Y.
Friedman
Pseudomonas putida IsoF101 - soil Yes medium L. Eberl
Pseudomonas citronellolis 13674
(ATCC) - soil Yes low Y.
Friedman
Pseudomonas aurantiaca 33663
(ATCC) - soil Yes medium Y.
Friedman
Pseudomonas veronii 700474 (ATCC) - water Yes high
Y. Friedman
Pantoea agglomerans 299r - phyllosphere No low S. Lindow
Pantoea agglomerans BRT98 - soil Yes high Z. Cardon
Escherichia coli K-12
MG1655 - human gut No medium Y. Helman
Xanthomoas campestris 85-10 - phyllosphere No low G. Sessa
Burkholderia cenocepacia H111 - human Yes low Y. Helman
Acidovorax citrulli M6 - phyllosphere No low S.
Burdman
Bacillus subtilis 3610 + soil No low Y. Helman
Clavibacter michiganens
is + soil Yes low S.
Burdman
Table 1. Strains used in this study. ‘Aggregation’ was determined as ‘yes’ if the majority of cells (>~50%) were observed in clusters of more than 5 individual cells, and ‘no’ otherwise. Survival level was estimated as follows: ‘low’: almost no survival (<3% of cells); ‘medium’: survival of 3% to 50% of the cells; ‘high’: >50% of all cells survived.
Image analysis

20
The images were exported from NIS Elements as four separate 16-bit grayscale images per
image: bright field (BF), YFP fluorescence (green), propidium fluorescence (red), and a shorter
wavelength fluorescence that highlights the droplets (blue). Image analysis was performed in
MATLAB. The droplets were segmented by processing the blue fluorescence channel. Droplets
were segmented by setting thresholds on the image intensity and gradient following Gaussian
filtering (the centers of the droplets are brighter than their periphery and background, and the
gradient is more pronounced at the periphery). The two resulting masks were combined, and
holes in the connected components were removed. Live and dead cells within each droplet were
segmented by the histogram-based threshold of the green and red fluorescent channels
respective intensities, producing binary segmentation and live/dead classification of the
cells. The segmented droplet image was then used to assign cells and aggregates to their ‘host’
droplet, and to quantify the live/dead surface coverage within each droplet and aggregate.
Our analysis relies on the projected 2D features of 3D objects: droplets and bacterial cells and
aggregates. Although some information is lost in the projection, it was deemed a necessary
tradeoff for the analysis of the large scanned area and the quantity of data involved. We assume
that the relationship between droplet area and volume is monotonous, and that the great
majority of cellular aggregates are single layered. To affirm these assumptions, we performed
3D analysis using z-stacking and 3D deconvolution on a small surface area. This analysis
verified that our droplet identification and segmentation does not capture flat discolorations as
droplets, and that indeed the cells within the droplets are generally arranged in a single layer
on the surface, or suspended in the liquid at densities low enough to maintain the validity of
2D projections.
Statistical Analysis
Data analyses and statistics for experiments with bacterial cells were based on microscopy
images of five different surface sections (each of an area of 2.5 mm2) per well. Data analyses

21
and statistics for experiments with beads were based on microscopy images of surface sections
of areas of 10 mm2. For statistical analysis of mean values and standard errors, droplets and
aggregates were binned by their size on a logarithmic scale. In Figure 2C, standard errors are
based on the 5 surface sections (of 2.5 mm2) per strain (n=5) and 9 different surface sections
(of 1.1 mm2) for the beads experiment (n=9). In Figure 2D and Figure 3E, standard errors are
calculated for all droplets within each bin (size range of droplets) of the combined data of the
5 surface sections for experiments with bacteria. In Fig 3B, C and Figure 4B, data is combined
for all 5 surface sections. In Figure 3F,G standard errors are calculated for all aggregates within
each bin of the combined data of the 5 surface sections.
Estimation of solution concentrations within droplets
Calibration curves: Concentrated stock solutions of: (1) M9 salts 100x, Alexa Fluor™ 647
dissolved in diH20 were prepared (M9 minimal salts base, 5x, ForMedium™; sodium chloride,
J.T.Baker®; Alexa Fluor™ 647 carboxylic acid, tris (triethylammonium) salt, Invitrogen™),
and (2) NaCl 4M, Alexa Fluor™ 647 100µM in diH20. In order to build concentration
calibration curves (i.e., a graph that describes the fluorescence intensity versus known
concentration of M9 or NaCl solutions), the stock solutions were diluted (in diH2O) by the
following factors: 1.11, 1.25, 1.43, 1.6, 2, 2.5, 3.33, 5, 10 and 20. A 5µl drop was pipetted out
of each diluted sample and placed on the glass surface (thickness 0.15mm) of a 24-well plate
that was pre-equilibrated with a reservoir of tap water to maintain humid conditions. Drops
were imaged by confocal microscopy. Droplets concentration: Droplets from M9 (x2 and x20)
and NaCl (16mM, 40mM) solutions were formed through our standard drying surface
experiments with 2μm beads, as described previously. Droplets were imaged by confocal
microscopy 18h after the plates were placed in the growth chamber (28oC, 85% RH). Confocal
microscopy: Confocal imaging was acquired using a LEICA SP8 (CTR6000) microscope with
a Leica HC PL APO CS2 40x (1.10 N.A.) water objective. Lasers line 638nm was used for

22
excitation of Alexa 647, and emission was collected between 656-684nm. All images were
collected with a PMT detector (laser intensity 0.01 or 0.05 and Gain 680 or 640 for M9 or NaCl
calibration curves, respectively). Image processing and data analysis: The calibration curves
were obtained by measuring the mean intensity of the 5µl drops of known concentrations, for
M9 and NaCl separately. For each solute fixed resolution, laser intensity and photomultiplier
gain values were used. The intensity of the drops was defined as the mean intensity of
1,000x1,000 pixels (109μm x 109μm area) within the drop, without overlapping with the drop
edges. The series of intensity-concentration pair data points were used to build the calibration
curves, by piecewise-linear interpolation. The concentrations of microdroplets from the drying
surface experiments were estimated by measuring their intensity and converting this value to
concentrations using the calibration curves. Microdroplet intensity was measured by imaging
a 520 μm x 520 μm square with the same resolution, laser intensity, and photomultiplier gain
values as for the 5µl drops of the respective solute (M9 or NaCl). The microdroplets were
segmented by setting a threshold value higher than that of the background intensity. The
intensity value for each microdroplet was calculated by averaging the intensity of the entire
microdroplet, excluding a ~1μm-wide boundary, and the area occupied by the beads
(determined by BF intensity threshold).
Natural leaf washes
We employed two different methods for the extraction and drying of leaf washes: Method I: A
single ivy and orange leaf were submerged in separate sterile petri dishes filled with 10-15mL
autoclaved ddH2O. The leaves were gently rubbed while submerged to remove particles on the
leaf surface. 340μls of the leaf wash solution was loaded into a sticker in a 6-well plate and
dried overnight in a growth chamber at 28oC and 85% RH. After macroscopic drying, water
was added to the spacers in between the wells, the plate was sealed with tape and returned to
incubation at 28oC and ~95% RH. Images in Figure. 4 are after 48h of incubation. This method

23
was used to obtain images in Figure. 4. Method II: several 200µls ddH20 drops were loaded
onto the abaxial surface of an ivy leaf, and left for 2h (room temperature). A volume of 340µls
sampled from several drops was aspired with a pipette, transferred to our standard surface
drying platform, and left to dry using our described protocol (28oC, 85% RH). This method
was used to obtain images in Figure. 4—supplemented Figure. 1.
Acknowledgements
We thank Y. Helman, Y. Friedman, Y. Hadar, E. Jurkevitch, O. Yarden, R. Holtzman, O.
Bäumchen, D. Sher, A. Bren, and S. Itzkovitz for valuable comments and discussions. We
thank S. Lindow, L. Eberl, Z. Cardon, D. Minz, O. Bahar, G. Sessa, S. Burdman, Y. Helman,
and Y. Friedman, for kindly providing bacterial strains. This work was supported by research
grants to N. K. from the James S. McDonnell Foundation (Studying Complex Systems Scholar
Award, Grant #220020475) and from the Israel Science Foundation (ISF #1396/19).
References BEATTIE, G. A. 2011. Water Relations in the Interaction of Foliar Bacterial Pathogens with Plants.
Annual Review of Phytopathology, 49, 533-555. BONN, D., EGGERS, J., INDEKEU, J., MEUNIER, J. & ROLLEY, E. 2009. Wetting and spreading. Reviews
of modern physics, 81, 739. BREWER, C. A. & SMITH, W. K. 1997. Patterns of leaf surface wetness for montane and subalpine
plants. Plant, Cell & Environment, 20, 1-11. BRINGEL, F. & COUéE, I. 2015. Pivotal roles of phyllosphere microorganisms at the interface between
plant functioning and atmospheric trace gas dynamics. Frontiers in microbiology, 6, 486. BURKHARDT, J. & EIDEN, R. 1994. Thin water films on coniferous needles: a new device for the study
of water vapour condensation and gaseous deposition to plant surfaces and particle samples. Atmospheric Environment, 28, 2001-2011.
BURKHARDT, J. & HUNSCHE, M. 2013. “Breath figures” on leaf surfaces—formation and effects of microscopic leaf wetness. Frontiers in plant science, 4, 422.
BURKHARDT, J., KOCH, K. & KAISER, H. 2001. Deliquescence of deposited atmospheric particles on leaf surfaces. J Water, Air and Soil Pollution: Focus, 1, 313-321.
CHANG, W.-S., VAN DE MORTEL, M., NIELSEN, L., NINO DE GUZMAN, G., LI, X. & HALVERSON, L. J. 2007. Alginate Production by Pseudomonas putida Creates a Hydrated Microenvironment

24
and Contributes to Biofilm Architecture and Stress Tolerance under Water-Limiting Conditions. Journal of Bacteriology, 189, 8290-8299.
CHOI, K.-H., GAYNOR, J. B., WHITE, K. G., LOPEZ, C., BOSIO, C. M., KARKHOFF-SCHWEIZER, R. R. & SCHWEIZER, H. P. 2005. A Tn7-based broad-range bacterial cloning and expression system. Nature Methods, 2, 443.
CHOI, K.-H. & SCHWEIZER, H. P. 2006. mini-Tn7 insertion in bacteria with single attTn7 sites: example Pseudomonas aeruginosa. Nature Protocols, 1, 153.
DAVILA, A. F., GóMEZ-SILVA, B., DE LOS RIOS, A., ASCASO, C., OLIVARES, H., MCKAY, C. P. & WIERZCHOS, J. 2008. Facilitation of endolithic microbial survival in the hyperarid core of the Atacama Desert by mineral deliquescence. Journal of Geophysical Research: Biogeosciences, 113.
DAVILA, A. F., HAWES, I., ASCASO, C. & WIERZCHOS, J. 2013. Salt deliquescence drives photosynthesis in the hyperarid A tacama D esert. Environmental microbiology reports, 5, 583-587.
DE GENNES, P.-G., BROCHARD-WYART, F. & QUéRé, D. 2013. Capillarity and wetting phenomena: drops, bubbles, pearls, waves, Springer Science & Business Media.
DEEGAN, R. D., BAKAJIN, O., DUPONT, T. F., HUBER, G., NAGEL, S. R. & WITTEN, T. A. 1997. Capillary flow as the cause of ring stains from dried liquid drops. Nature, 389, 827.
DOAN, H. K. & LEVEAU, J. H. 2015. Artificial surfaces in phyllosphere microbiology. Phytopathology, 105, 1036-1042.
ESPINOSA-URGEL, M., KOLTER, R. & RAMOS, J.-L. 2002. Root colonization by Pseudomonas putida: love at first sight. Microbiology, 148, 341-343.
GRINBERG, M., OREVI, T. & KASHTAN, N. 2019. Bacterial surface colonization, preferential attachment and fitness under periodic stress. PLoS computational biology, 15, e1006815.
HAGEN, M. J., STOCKWELL, V. O., WHISTLER, C. A., JOHNSON, K. B. & LOPER, J. E. 2009. Stress Tolerance and Environmental Fitness of Pseudomonas fluorescens A506, Which Has a Mutation in rpoS. Phytopathology, 99, 679-688.
HERMINGHAUS, S., BRINKMANN, M. & SEEMANN, R. 2008. Wetting and dewetting of complex surface geometries. Annu. Rev. Mater. Res., 38, 101-121.
KLEMM, O., MILFORD, C., SUTTON, M. A., SPINDLER, G. & VAN PUTTEN, E. 2002. A climatology of leaf surface wetness. Theoretical and Applied Climatology, 71, 107-117.
KOCH, K., BHUSHAN, B. & BARTHLOTT, W. 2008. Diversity of structure, morphology and wetting of plant surfaces. Soft Matter, 4, 1943-1963.
LARSON, R. G. 2017. Twenty years of drying droplets. Nature, 550, 466. LEVEAU, J. H. 2015. Life of microbes on aerial plant parts. Principles of Plant-Microbe Interactions.
Springer. LINDOW, S. E. & BRANDL, M. T. 2003. Microbiology of the phyllosphere. Applied and environmental
microbiology, 69, 1875-1883. LINDOW, S. E. & LEVEAU, J. H. 2002. Phyllosphere microbiology. Current Opinion in Biotechnology,
13, 238-243. MAGAREY, R., SEEM, R., WEISS, A., GILLESPIE, T. & HUBER, L. 2005. Estimating surface wetness on
plants. Agronomy Monograph, Micrometeorology in Agricultural Systems. MéNDEZ-VILAS, A., LABAJOS-BRONCANO, L., PERERA-NúñEZ, J. & GONZáLEZ-MARTíN, M. L. 2011.
Are the Soft, Liquid-Like Structures Detected around Bacteria by Ambient Dynamic Atomic Force Microscopy Capsules? Applied and Environmental Microbiology, 77, 3102-3114.
MOLINA, L., RAMOS, C., DUQUE, E., RONCHEL, M. C., GARCıA, J. M., WYKE, L. & RAMOS, J. L. 2000. Survival of Pseudomonas putida KT2440 in soil and in the rhizosphere of plants under greenhouse and environmental conditions. Soil Biology and Biochemistry, 32, 315-321.
MONIER, J.-M. & LINDOW, S. E. 2003. Differential survival of solitary and aggregated bacterial cells promotes aggregate formation on leaf surfaces. Proceedings of the National Academy of Sciences, 100, 15977-15982.

25
MONIER, J.-M. & LINDOW, S. E. 2004. Frequency, Size, and Localization of Bacterial Aggregates on Bean Leaf Surfaces. Applied and Environmental Microbiology, 70, 346-355.
MORRIS, C. E., MONIER, J. & JACQUES, M. 1997. Methods for observing microbial biofilms directly on leaf surfaces and recovering them for isolation of culturable microorganisms. Applied and Environmental Microbiology, 63, 1570-6.
NELSON, K. E., WEINEL, C., PAULSEN, I. T., DODSON, R. J., HILBERT, H., MARTINS DOS SANTOS, V. A. P., FOUTS, D. E., GILL, S. R., POP, M., HOLMES, M., BRINKAC, L., BEANAN, M., DEBOY, R. T., DAUGHERTY, S., KOLONAY, J., MADUPU, R., NELSON, W., WHITE, O., PETERSON, J., KHOURI, H., HANCE, I., LEE, P. C., HOLTZAPPLE, E., SCANLAN, D., TRAN, K., MOAZZEZ, A., UTTERBACK, T., RIZZO, M., LEE, K., KOSACK, D., MOESTL, D., WEDLER, H., LAUBER, J., STJEPANDIC, D., HOHEISEL, J., STRAETZ, M., HEIM, S., KIEWITZ, C., EISEN, J., TIMMIS, K. N., DüSTERHöFT, A., TüMMLER, B. & FRASER, C. M. 2002. Complete genome sequence and comparative analysis of the metabolically versatile Pseudomonas putida KT2440. Environmental Microbiology, 4, 799-808.
NUDING, D. L., GOUGH, R. V., VENKATESWARAN, K. J., SPRY, J. A. & TOLBERT, M. A. 2017. Laboratory investigations on the survival of Bacillus subtilis spores in deliquescent salt Mars analog environments. Astrobiology, 17, 997-1008.
OPHIR, T. & GUTNICK, D. L. 1994. A Role for Exopolysaccharides in the Protection of Microorganisms from Desiccation. Applied and Environmental Microbiology, 60, 740-745.
OR, D., SMETS, B. F., WRAITH, J. M., DECHESNE, A. & FRIEDMAN, S. P. 2007. Physical constraints affecting bacterial habitats and activity in unsaturated porous media – a review. Advances in Water Resources, 30, 1505-1527.
PöSCHL, U. 2005. Atmospheric aerosols: composition, transformation, climate and health effects. Angewandte Chemie International Edition, 44, 7520-7540.
REMUS-EMSERMANN, M. N., DE OLIVEIRA, S., SCHREIBER, L. & LEVEAU, J. H. 2011. Quantification of lateral heterogeneity in carbohydrate permeability of isolated plant leaf cuticles. Frontiers in microbiology, 2, 197.
RIGANO, L. A., SICILIANO, F., ENRIQUE, R., SENDíN, L., FILIPPONE, P., TORRES, P. S., QüESTA, J., DOW, J. M., CASTAGNARO, A. P., VOJNOV, A. A. & MARANO, M. R. 2007. Biofilm Formation, Epiphytic Fitness, and Canker Development in Xanthomonas axonopodis pv. citri. Molecular Plant-Microbe Interactions, 20, 1222-1230.
ROBERSON, E. B. & FIRESTONE, M. K. 1992. Relationship between Desiccation and Exopolysaccharide Production in a Soil Pseudomonas sp. Applied and Environmental Microbiology, 58, 1284-1291.
SCHöNHERR, J. & RIEDERER, M. 1986. Plant cuticles sorb lipophilic compounds during enzymatic isolation. Plant, Cell & Environment, 9, 459-466.
SOFFE, R., ALTENHUBER, N., BERNACH, M., REMUS-EMSERMANN, M. N. & NOCK, V. 2019. Comparison of replica leaf surface materials for phyllosphere microbiology. PloS one, 14, e0218102.
STEINBERG, S., BEITELMAN, M., GRINBERG, M., PEIXOTO, J., OREVI, T. & KASHTAN, N. 2019. Microscale interactions between immigrant bacteria and plant leaf microbiota as revealed by live imaging. BioRxiv, 695734.
STEVENS, A. H., CHILDERS, D., FOX-POWELL, M., NICHOLSON, N., JHOTI, E. & COCKELL, C. S. 2019. Growth, Viability, and Death of Planktonic and Biofilm Sphingomonas desiccabilis in Simulated Martian Brines. Astrobiology, 19, 87-98.
TANG, I. N. 1979. Deliquescence properties and particle size change of hygroscopic aerosols. Brookhaven National Lab., Upton, NY (USA).
TANG, I. N. & MUNKELWITZ, H. R. 1993. Composition and temperature dependence of the deliquescence properties of hygroscopic aerosols. Atmospheric Environment. Part A. General Topics, 27, 467-473.
26
TECON, R., EBRAHIMI, A., KLEYER, H., LEVI, S. E. & OR, D. 2018. Cell-to-cell bacterial interactions promoted by drier conditions on soil surfaces. Proceedings of the National Academy of Sciences, 115, 9791-9796.
VACHER, C., HAMPE, A., PORTé, A. J., SAUER, U., COMPANT, S. & MORRIS, C. E. 2016. The phyllosphere: microbial jungle at the plant–climate interface. Annual Review of Ecology, Evolution, and Systematics, 47, 1-24.
VAN DE MORTEL, M. & HALVERSON, L. J. 2004. Cell envelope components contributing to biofilm growth and survival of Pseudomonas putida in low-water-content habitats. Molecular microbiology, 52, 735-750.
VORHOLT, J. A. 2012. Microbial life in the phyllosphere. Nature Reviews Microbiology, 10, 828. WILSON, M. & LINDOW, S. 1993. Interactions between the biological control agent Pseudomonas
fluorescens A506 and Erwinia amylovora in pear blossoms. Phytopathology, 83, 117-123. YU, J., PEñALOZA-VáZQUEZ, A., CHAKRABARTY, A. M. & BENDER, C. L. 1999. Involvement of the
exopolysaccharide alginate in the virulence and epiphytic fitness of Pseudomonas syringae pv. syringae. Molecular Microbiology, 33, 712-720.

27
Supplementary Figures and Tables Bacterial survival in microscopic droplets
M. Grinberg et al. 11 Supplementary Figures
Supplementary Tables 1, 2
Captions for Videos 1 to 5

28
Figure 2—Figure Supplement 1. The formation of microdroplets on polystyrene substrate. (A) Drying surface experiment with P. fluorescens on a polystyrene 6-well plate (Costar® 6-well Plate, Corning). Representative sections of the surface imaged 48h after macroscopically dry conditions were established. Solitary cells are engulfed by small-size droplets, while aggregates are found in larger droplets. (B) Same as in (A) but with P. putida.

29
Figure 2—Figure Supplement 2. Drying surface experiment with fluorescent beads (2μms in diameter). (A) Drying experiments were performed under same conditions as the experiments with bacteria (M9 diluted X2, 28oC, 85% RH; see Methods). (B) Drying experiment with fluorescent beads suspended in pure water (28oC, 85% RH). In the absence of deliquescent substrates, no droplets formed.

30
Figure 2—Figure Supplement 3. Estimating the solute concentrations in microdroplets in comparison to standard M9 medium. (A) In order to estimate the solute concentrations in the microdroplets, several drops of M9 medium concentrated to known ‘concentration factors’ (relative to standard M9) were imaged by a confocal microscope, and their mean intensities were measured (see Methods). The relationship between the drop concentration and fluorescence intensity constituted the calibration curve. (B-C) Microdroplet concentration factor was estimated by extracting the mean intensity of the microdroplets formed on a drying surface with beads, and interpolating the corresponding M9 concentration factors. The concentration factor and area of the individual microdroplets are shown as red circles; the concentration factor’s histogram is shown in gray bars. (B) Initial medium was half-strength M9 (diluted x2), similarly to the experiments presented in Results. Microdroplet concentration factor was 23.3±3.5 (Mean±SD) relative to standard M9. Pearson correlation coefficient of droplet area and concentration is 0.005 (p-value = 0.97). (C) Initial medium was x20 diluted M9. Microdroplet concentration factor was 20.0±3.4 (Mean±SD) relative to standard M9. Pearson correlation coefficient of droplet area and concentration is 0.05 (p-value = 0.64). (D-

31
F) The M9 calibration curve in (A) is not monotonous over the entire concentration factor range, and changes from increasing intensities for concentration factors <40, to decreasing at >40 (likely due to one or more of the medium substrates that affect fluorescence intensity). The appropriate range for calibration was determined by testing whether the intensity increases or decreases following induced changes to concentration factors. To that end, stable microdroplets that formed at 85% RH were placed under higher RH conditions (~95%). (D) Bright field and Alexa fluorescence images at t = 0 and t = 35 minutes following raise in RH. Four droplets (marked by numbers 1 to 4) at t = 0, 20, 35 minutes after the change in RH. (E) Microdroplet areas (and presumably volumes) increased by absorbing water from the environment, and (F) Microdroplet mean intensities decreased (line colors match the microdroplet tags in (D)). This result indicates that, at these settings, correlation between intensities and concentration is positive, in turn indicating that the appropriate calibration range is for concentration factors below 40, relative to standard M9.

32
Figure 2—Figure Supplement 4. Estimating NaCl concentrations in microdroplets (medium containing diH2 + NaCl only). (A) In order to estimate the concentration of NaCl in the microdroplets, several drops of known NaCl concentrations were imaged by a confocal microscope, and their mean intensity was measured (see Methods). The relationship between the drop concentration and fluorescence intensity constituted the calibration curve. (B-C) Microscopic droplet concentration factor was estimated by extracting the mean intensity of the microdroplets formed on a drying surface with beads, and interpolating the corresponding NaCl concentration. The concentration factor and area of the individual droplets are shown as red circles; the concentration factors histogram is shown in gray bars. (B) Initial NaCl medium

33
concentration was 16mM. NaCl concentrations in microdroplets was 650±170 mM (Mean±SD). Pearson correlation coefficient of microdroplet area and concentration was 0.47 (p-value < 0.01). (C) Initial NaCl concentration was medium was 40mM. NaCl concentrations in microdroplets was 600±140 mM (Mean±SD). Pearson correlation coefficient of microdroplet area and concentration is 0.8 (p-value < 0.01). These results were in contrast to the lack of concentrations < > area correlations in experiments with M9. Further research is required to understand what factors determine these differences in correlations.

34
Figure 3—Figure Supplement 1. Viability of cells within microdroplets. (A) A section of the surface covered with droplets (experiment with P. fluorescens, 10h after macroscopic drying 28oC, 70% RH). Live cells are green; dead cells (cells with damaged membranes) are red. Live cells were mostly observed in large droplets. (B) Same section of the surface 34h after drying, incubated at 28oC, ˃95% RH. Red cells in small droplets remain red (dead), while green cells within large droplets disperse (within the droplet boundaries) and divide (though slowly – division time was 23h±2).

35
Figure 3—Figure Supplement 2. Survival as a function of aggregate size. Survival rate increases with aggregate size in both studied strains. Standard errors are calculated for all aggregates within each bin (size range of aggregates) of the combined data of the 5 surface sections (each of an area = 2.5 mm2). Each dot in the background represents a single aggregate (solitary cells are aggregates of size ~1-2 μm2).
36
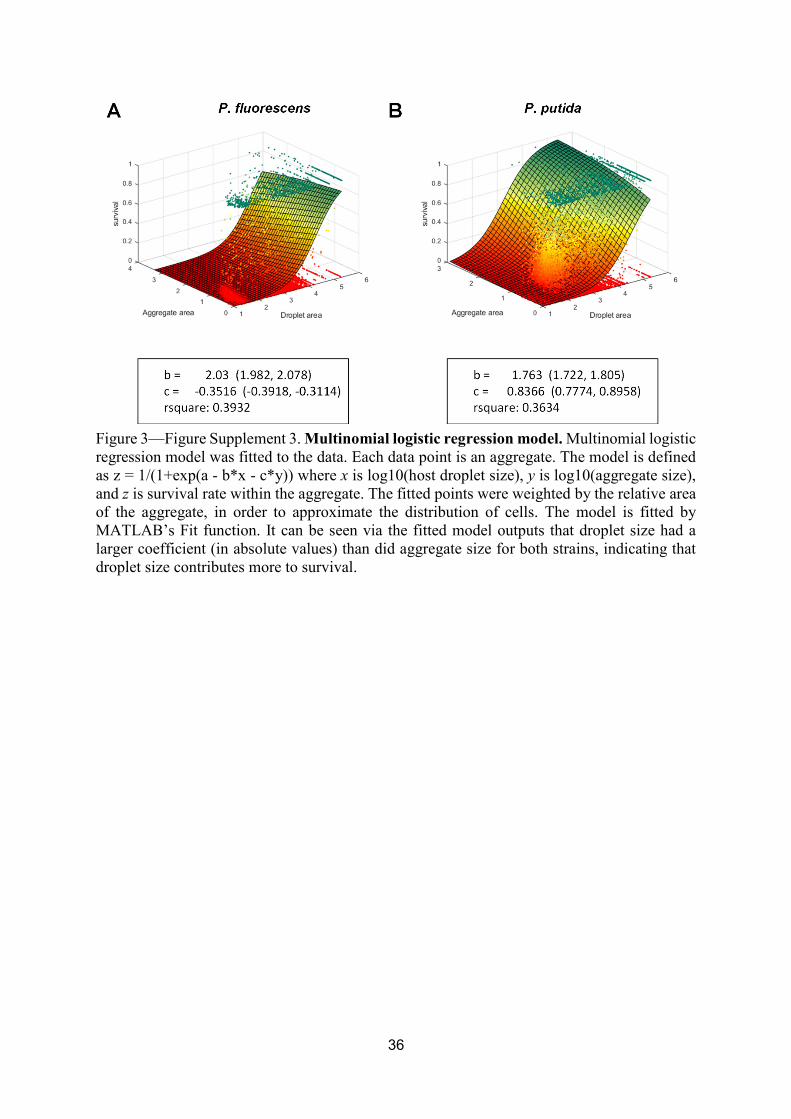
Figure 3—Figure Supplement 3. Multinomial logistic regression model. Multinomial logistic regression model was fitted to the data. Each data point is an aggregate. The model is defined as z = 1/(1+exp(a - b*x - c*y)) where x is log10(host droplet size), y is log10(aggregate size), and z is survival rate within the aggregate. The fitted points were weighted by the relative area of the aggregate, in order to approximate the distribution of cells. The model is fitted by MATLAB’s Fit function. It can be seen via the fitted model outputs that droplet size had a larger coefficient (in absolute values) than did aggregate size for both strains, indicating that droplet size contributes more to survival.

37
Figure 3—Figure Supplement 4. Survival rate of solitary cells increases with droplet size. In this experiment, cells were inoculated at a later stage, close to macroscopic drying (at time = 10h from the beginning of the experiment), and thus did not have enough time to form large aggregates. (A) A section of the surface covered with droplets (experiment with P. fluorescens, 24h after macroscopic drying). Live cells are green and dead cells (cells with damaged membranes) are red. (B) The same section of the surface following another 30h at high RH (~95%). Cell recovery was mostly observed in large droplets. (C) Survival rate of solitary cells (of both strains) increases with droplet size. Note that overall survival in these experiments was much lower than in the original experiment, pointing to the contribution of aggregation (or self-organization in general) and/or physiological acclimation to overall survival. Standard errors are calculated for all aggregates within each bin of the combined data of the 5 surface sections (each of an area=2.5 mm2).
38
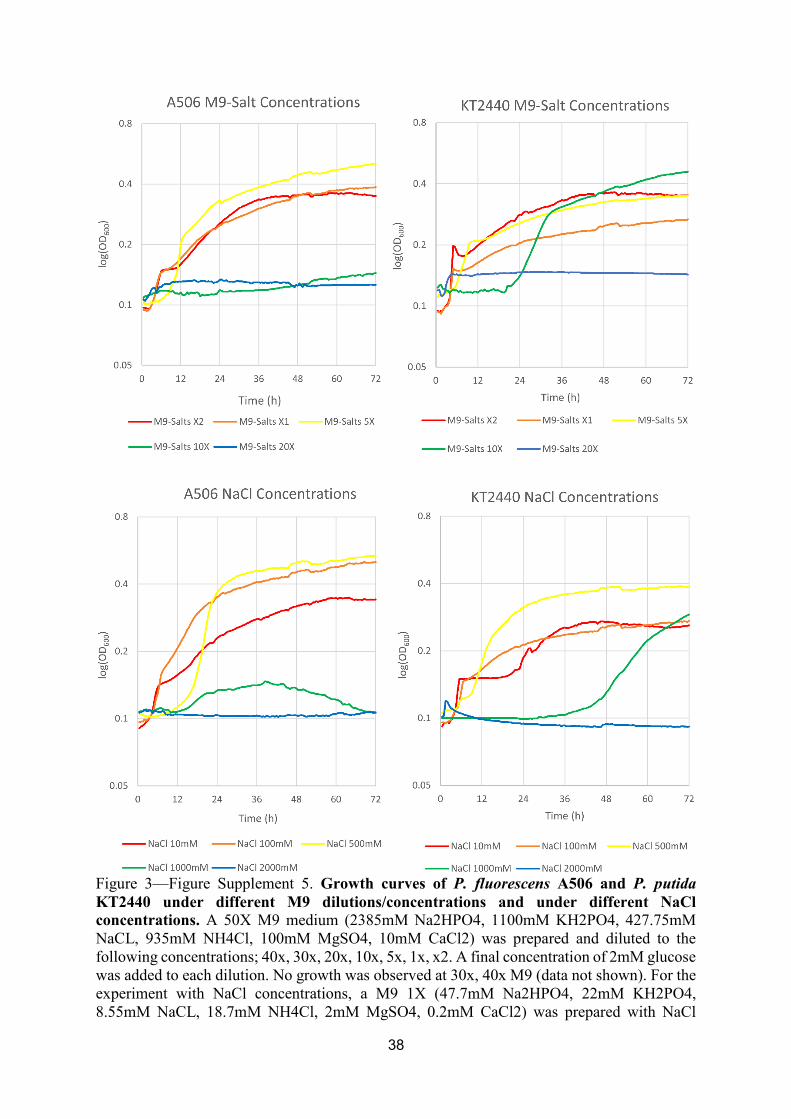
Figure 3—Figure Supplement 5. Growth curves of P. fluorescens A506 and P. putida KT2440 under different M9 dilutions/concentrations and under different NaCl concentrations. A 50X M9 medium (2385mM Na2HPO4, 1100mM KH2PO4, 427.75mM NaCL, 935mM NH4Cl, 100mM MgSO4, 10mM CaCl2) was prepared and diluted to the following concentrations; 40x, 30x, 20x, 10x, 5x, 1x, x2. A final concentration of 2mM glucose was added to each dilution. No growth was observed at 30x, 40x M9 (data not shown). For the experiment with NaCl concentrations, a M9 1X (47.7mM Na2HPO4, 22mM KH2PO4, 8.55mM NaCL, 18.7mM NH4Cl, 2mM MgSO4, 0.2mM CaCl2) was prepared with NaCl

39
added to the following final concentrations: 2,000mM, 1,000mM, 500mM, 100mM, 10mM. A final concentration of 2mM glucose was added to each dilution. P. fluorescens A506 YFP and P. putida KT2440 YFP were grown overnight in LB Gm30 at 28oC, 300RPM. 3mL LB Gm30 was inoculated with 100μls of the overnight stock and grown until OD ~1.0. The bacteria were centrifuged, resuspended in D2H20, and diluted 1:20 once loaded into the 96-well plate. There were triplicates of each condition for A506 YFP and KT2440 YFP, and duplicates for the controls. Estimated growth rates, lag times, and maximal OD, based on the growth curves, are shown in Supplementary Table 2.

40
Figure 4—Figure Supplement 1. Microscopic surface wetness forming with natural leaf washes. A few diH20 drops were loaded onto the abaxial surface of an ivy leaf, and left for 2h at room temperature. A volume of 340µl was aspired with a pipette, transferred to our standard surface drying platform, and left to dry using our described protocol (28oC, 85% RH, see Methods). The plate surface was imaged ~5 h after macroscopic drying of the well.

41
Figure 5—Figure Supplement 1. Aggregation and self-organization affect survival. (A) The cumulative cell abundance distribution residing above a given droplet size. (B) Aggregate-size distributions. In both (A) and (B), the bold lines represent combined data of all 5 surface sections (9 in case of the beads experiment), while the thin lines represent individual surface sections.

42
Supplementary Table 1. Molar concentration and osmolarity of M9 salts. Calculated molarity and osmolarity of salt components in M9 medium at the standard concentration (M9 1x) and in estimated concentrations within microdroplets (M9 23.3x).
M9 1x M9 23.3x
Salt Molar concentration
[mM]
Osmolarity
[mOsm/L]
Molar concentration
[mM]
Osmolarity
[mOsm/L]
4HPO2Na 47.8 143.3 1113.7 3338.89
4PO2KH 22.0 88.2 512.6 2055.06
NaCl 8.6 17.1 200.4 398.43
Cl4NH 18.7 37.4 435.7 871.42
Total 286.0 6663.8

43
Supplementary Table 2. Growth curve analysis of P. fluorescens A506 and P. putida KT2440 at different M9 concentrations and NaCl concentrations. Plate Reader (Synergy™ H1, BioTek™) screen results were analyzed using GrowthRate and GRplot programs (Mira, P., M. Barlow, and B. G. Hall. Statistical Package for Growth Rates Made Easy. Mol. Biol. Evol. 34:3303-3309, 2017). Results of zero growth were omitted from this table. In both strains, the general picture was that higher salt concentrations led to a decrease in growth rate, a decrease in final OD, and an increase in lag time. ‘*’: R is lower than 0.99.
Condition Growth Rate
R Max OD
Doubling time [min]
(Mean±SD)
Lag time [hours]
A506 M9-salts x2 0.0077 0.9994 0.2812 90 ± 2 3 A506 M9-salts x1 0.0090 0.9962 0.3049 78 ± 4 3 A506 M9-salts 5x 0.0082 0.9922 0.4234 85 ± 7 10 A506 M9-salts 10x 0.0005 0.9934 0.0542 1490 ± 81 1 A506 M9-salts 20x NA NA 0.0339 NA NA A506 NaCl 10mM 0.0100 0.9906 0.2616 69 ± 6 5 A506 NaCl 100mM 0.0072 0.9967 0.4216 96 ± 4 5 A506 NaCl 500mM 0.0050 0.9985 0.4572 139 ± 4 17 A506 NaCl 1000mM 0.0017 0.9991 0.0649 403 ± 9 16 A506 NaCl 2000mM NA NA 0.0276 NA NA KT2440 M9-salts x2 0.0193 0.9838* 0.2826 36 ± 4 4 KT2440 M9-salts x1 0.0150 0.9891* 0.1859 47 ± 4 4 KT2440 M9-salts 5x 0.0045 0.9978 0.2672 154 ± 5 6 KT2440 M9-salts 10x 0.0033 0.9993 0.3689 210 ± 4 26 KT2440 M9-salts 20x NA NA 0.0472 NA NA KT2440 NaCl 10mM 0.0089 0.9993 0.1849 79 ± 2 5 KT2440 NaCl 100mM 0.0087 0.9970 0.1902 80 ± 4 5 KT2440 NaCl 500mM 0.0039 0.9995 0.3102 180 ± 3 10 KT2440 NaCl 1000mM 0.0023 0.9985 0.2089 311 ± 7 46 KT2440 NaCl 2000mM NA NA 0.0372 NA NA

44
Video 1. The formation of microdroplets around bacterial cells. The thin (a few μms thick) liquid’s receding front clears out from the surface, leaving behind microdroplets whenever it encounters solitary cells, surface-attached aggregates, or floating pellicles. Videos taken from an experiment with P. fluorescens cells. Video was imaged with a 20x objective. The video plays at the real-time speed.
Video 2. The formation of microdroplets around bacterial cells. The thin (a few μms thick) liquid’s receding front clears out from the surface, leaving behind microdroplets whenever it encounters solitary cells, surface-attached aggregates, or floating pellicles. Videos taken from an experiment with P. fluorescens cells. Video was imaged with a 40x objective. The video plays at the real-time speed.
Video 3. The formation of microdroplets around bacterial cells. The thin (a few μms thick) liquid’s receding front clears out from the surface, leaving behind microdroplets whenever it encounters solitary cells, surface-attached aggregates, or floating pellicles. Videos taken from an experiment with P. fluorescens cells. Video was imaged with a 10x objective. The video plays at the real-time speed. Video 4. Viability of cells within a microdroplet. Some P. fluorescens cells can be seen swimming, confined within the droplet. Cells were recovered for 84h at 95% RH after our standard surface drying experiment (85% RH). The video plays at the real-time speed. Video 5. Viability of cells within a microdroplet. Some P. fluorescens cells can be seen swimming, confined within the droplet. Cells were recovered for 48h at 95% RH after our standard surface drying experiment (85% RH). The video plays at the real-time speed.
Related Documents