Bacterial Growth on Allochthonous Carbon in Humic and Nutrient-enriched Lakes: Results from Whole-Lake 13 C Addition Experiments Emma S. Kritzberg, 1 * Jonathan J. Cole, 2 Michael M. Pace, 2 and Wilhelm Grane ´li 1 1 Department of Ecology/Limnology, Ecology Building, Lund University, S-223 62 Lund, Sweden; 2 Institute of Ecosystem Studies, Box AB, Millbrook, New York 12545, USA ABSTRACT Organic carbon (C) in lakes originates from two distinct sources—primary production from within the lake itself (autochthonous supply) and importation of organic matter from the terrestrial watershed (allochthonous supply). By manipulat- ing the 13 C of dissolved inorganic C, thereby labeling within-lake primary production, we examined the relative importance of autochtho- nous and allochthonous C in supporting bacterial production. For 35 days, NaH 13 CO 3 was added daily to two small, forested lakes. One of the lakes (Peter) was fertilized so that primary production exceeded total respiration in the epilimnion. The other lake (Tuesday), in contrast, was low in productivity and had high levels of colored dis- solved organic C (DOC). To obtain bacterial C isotopes, bacteria were regrown in situ in particle- free lake water in dialysis tubes. The contribution of allochthonous C to bacterial biomass was cal- culated by applying a two-member mixing model. In the absence of a direct measurement, the iso- topic signature of the autochthonous end-member was estimated indirectly by three different ap- proaches. Although there was excess primary production in Peter Lake, bacterial biomass con- sisted of 43–46% allochthonous C. In Tuesday Lake more than 75% of bacterial growth was supported by allochthonous C. Although bacteria used autochthonous C preferentially over allo- chthonous C, DOC from the watershed contrib- uted significantly to bacterial production. In combination with results from similar experiments in different lakes, our findings suggest that the contribution of allochthonous C to bacterial pro- duction can be predicted from ratios of chromo- phoric dissolved organic matter (a surrogate for allochthonous supply) and chlorophyll a (a sur- rogate for autochthonous supply). Key words: lakes; bacteria; dissolved organic carbon; allochthonous carbon; autochthonous carbon; stable isotope. INTRODUCTION In many lakes, respiration (R) exceeds gross primary production (GPP, Cole and others 1994, 2000; del Giorgio and Peters 1994; Riera and others 1999; Received 15 September 2004; accepted 19 May 2005; published online 13 April 2006. *Corresponding author; e-mail: [email protected] Ecosystems (2006) 9: 489–499 DOI: 10.1007/s10021-005-0115-5 489

Welcome message from author
This document is posted to help you gain knowledge. Please leave a comment to let me know what you think about it! Share it to your friends and learn new things together.
Transcript

Bacterial Growth onAllochthonous Carbon in Humic
and Nutrient-enriched Lakes:Results from Whole-Lake13C Addition Experiments
Emma S. Kritzberg,1* Jonathan J. Cole,2 Michael M. Pace,2 andWilhelm Graneli1
1Department of Ecology/Limnology, Ecology Building, Lund University, S-223 62 Lund, Sweden; 2Institute of Ecosystem Studies,
Box AB, Millbrook, New York 12545, USA
ABSTRACT
Organic carbon (C) in lakes originates from two
distinct sources—primary production from within
the lake itself (autochthonous supply) and
importation of organic matter from the terrestrial
watershed (allochthonous supply). By manipulat-
ing the 13C of dissolved inorganic C, thereby
labeling within-lake primary production, we
examined the relative importance of autochtho-
nous and allochthonous C in supporting bacterial
production. For 35 days, NaH13CO3 was added
daily to two small, forested lakes. One of the lakes
(Peter) was fertilized so that primary production
exceeded total respiration in the epilimnion. The
other lake (Tuesday), in contrast, was low in
productivity and had high levels of colored dis-
solved organic C (DOC). To obtain bacterial C
isotopes, bacteria were regrown in situ in particle-
free lake water in dialysis tubes. The contribution
of allochthonous C to bacterial biomass was cal-
culated by applying a two-member mixing model.
In the absence of a direct measurement, the iso-
topic signature of the autochthonous end-member
was estimated indirectly by three different ap-
proaches. Although there was excess primary
production in Peter Lake, bacterial biomass con-
sisted of 43–46% allochthonous C. In Tuesday
Lake more than 75% of bacterial growth was
supported by allochthonous C. Although bacteria
used autochthonous C preferentially over allo-
chthonous C, DOC from the watershed contrib-
uted significantly to bacterial production. In
combination with results from similar experiments
in different lakes, our findings suggest that the
contribution of allochthonous C to bacterial pro-
duction can be predicted from ratios of chromo-
phoric dissolved organic matter (a surrogate for
allochthonous supply) and chlorophyll a (a sur-
rogate for autochthonous supply).
Key words: lakes; bacteria; dissolved organic
carbon; allochthonous carbon; autochthonous
carbon; stable isotope.
INTRODUCTION
In many lakes, respiration (R) exceeds gross primary
production (GPP, Cole and others 1994, 2000; del
Giorgio and Peters 1994; Riera and others 1999;
Received 15 September 2004; accepted 19 May 2005; published online
13 April 2006.
*Corresponding author; e-mail: [email protected]
Ecosystems (2006) 9: 489–499DOI: 10.1007/s10021-005-0115-5
489
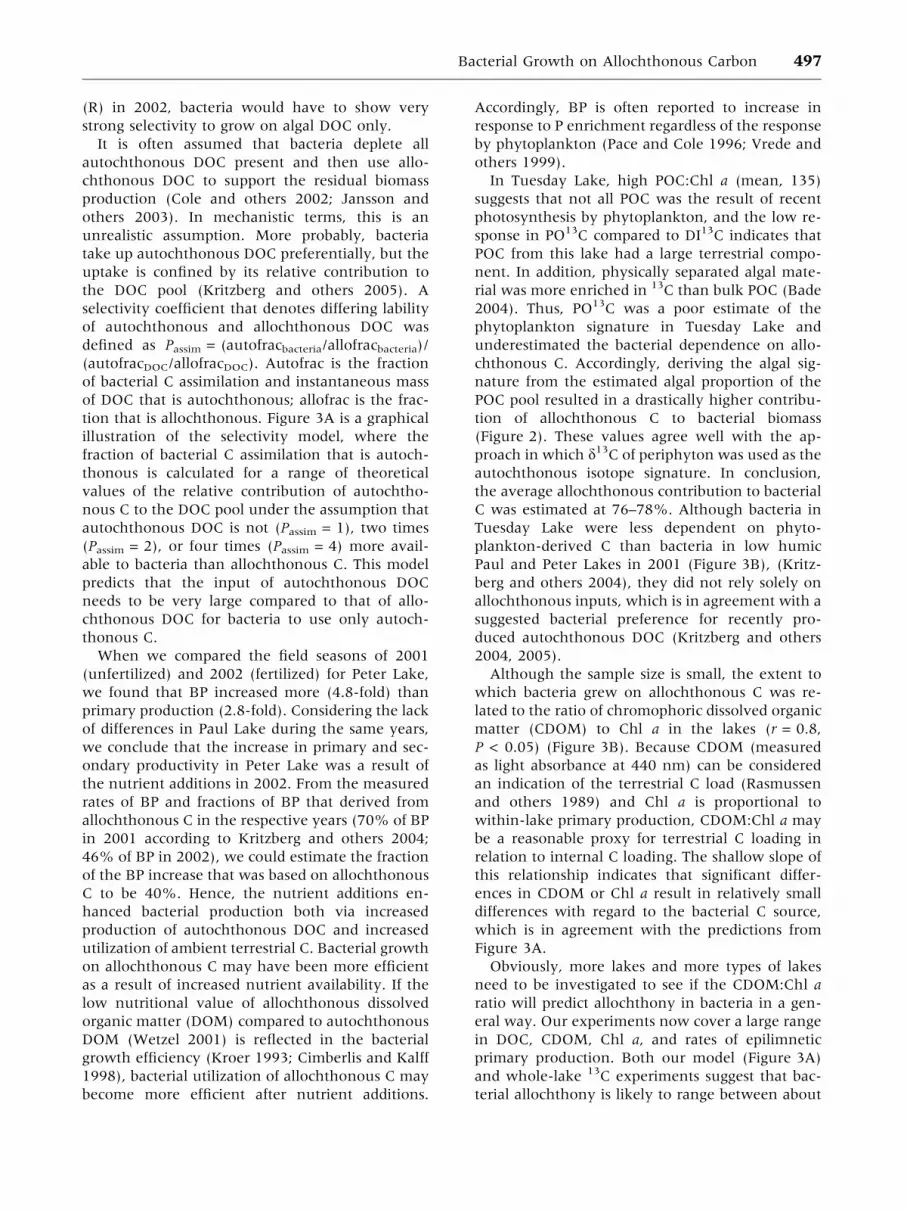
Hanson and others 2003). Negative net ecosystem
production (NEP = GPP ) R) implies the presence
of an important carbon (C) source in addition to that
supplied by within-lake primary producers. Metab-
olism in many lakes is significantly subsidized by
terrestrial (allochthonous) sources of organic C
based on studies both of relative rates of GPP and R
(above) and whole-lake C budgets (see, for example,
Dillon and Molot 1994; Wetzel 1995; del Giorgio and
others 1999). Less information is available on the
fate of the allochthonous C and its importance to the
secondary production of pelagic food webs.
Because most terrestrial C enters lakes as dis-
solved organic C (DOC), bacteria are a possible link
transferring allochthonous C to phagotrophic
organisms. Although there is some direct evidence
that planktonic bacteria use allochthonous C for
the production of new biomass (Coffin and
Cifuentes 1999; Kritzberg and others 2004), other
studies suggest that bacteria respire large amounts
of terrestrially derived DOC but pass very little of
this organic C up the food web (Ducklow and
others 1986; Cole and others 2002; Kritzberg and
others 2005). Thus, pelagic bacteria may be more of
a respiratory sink for this C than a link between
terrestrial DOC and organisms higher on the
aquatic food web (Pomeroy 1974). Our goal is to
understand the role that pelagic bacteria play in
both respiring and transferring DOC of autochtho-
nous and allochthonous origin to organisms higher
on the food web. To accomplish this goal, we need
to determine the extent to which C from each
source (allochthonous or autochthonous) is actu-
ally used by bacteria.
By adding inorganic 13C to two small, unpro-
ductive, low humic forest lakes and tracing its
subsequent uptake by phytoplankton and on to
bacteria, Kritzberg and others (2004) found that
pelagic bacteria to a large extent derive their bio-
mass from allochthonous C. Yet autochthonous
DOC was used preferentially relative to terrestrial
DOC. In theory, the terrestrial contribution of or-
ganic C to bacterial biomass (allochthony) should
be lower in a lake with similar terrestrial loading
but higher internal primary productivity. Corre-
spondingly, in a lake with high terrestrial loading
and relatively low primary productivity, bacteria
should derive more of their biomass from allo-
chthonous C.
We tested this theory by adding nutrients to one
of the lakes used in the previous experiment
(Kritzberg and others 2004). The aim was to make
the mixed layer of the lake net autotrophic (GPP
greater than R) to see if this would make bacteria
independent of allochthonous C. As a contrast, we
compared the relative importance of autochtho-
nous and allochthonous C to bacteria in an oligo-
trophic humic lake. Would the comparatively large
pool size of terrestrial DOC uncouple bacteria from
autochthonous DOC completely?
To produce a marked contrast between the 13C of
terrestrial and aquatic primary production, we
made sustained, whole-lake additions of NaH13CO3.
The design of the experiment largely followed that
described by Kritzberg and others (2004) and Pace
and others (2004). In addition, one of the lakes was
fertilized by daily additions of nitrogen (N) and
phosphorus (P) to make the epilimnion of the lake
strongly net autotrophic for the duration of the
experiment. The isotopic signature of pelagic bac-
teria was obtained by in situ bacterial regrowth
experiments in dialysis tubes (Kritzberg and others
2004; Herndl and others 1993) and in vitro bacterial
regrowth cultures in particle-free water (see, for
example, Coffin and others 1989).
METHODS
Lake Description
The experiments were conducted in Peter and
Tuesday lakes at the University of Notre Dame
Environmental Research Center near Land
O’ Lakes, Wisconsin, USA (89�32¢W, 46�13¢N).
Peter and Tuesday are small kettle lakes (surface
areas of 2.5 and 0.9 ha, respectively) with forested
watersheds dominated by sugar maple (Acer sac-
charum), yellow birch (Betula lutea), and balsam fir
(Abies balsamea) and wetlands dominated by
Sphagnum spp., ericaceous shrubs, and sedges
(Carpenter and Kitchell 1993). When unfertilized,
both lakes are moderately unproductive and similar
with regard to epilimnetic total phosphorus (TP)
concentration (surface means of TP from May
through August of 2001 were 8 and 10 mg P m)3)
and chlorophyll a (Chl a) (4.1 and 5.3 mg m)3).
Also, the pelagic food webs are similar, with
extensive minnow populations [for example, fat-
head minnows (Pimephales promelas), finescale dace
(Phoxinus neogaussay)] as well as sticklebacks (Gast-
erosteus aculeatus). Neither lake has significant
populations of piscivorous fish. Peter and Tuesday
lakes differ, however, with regard to DOC (4.5 and
8.4 g C m)3) and color (1.3 and 3.5 m)1; absorbanceat 440 nm) consistent with the area of wetlands sur-rounding Tuesday Lake being greater than PeterLake. As a reference lake, to check for treatmenteffects between 2001 and 2002 in Peter Lake, we usedPaul Lake. Paul and Peter lakes are separated by adike; when unfertilized, the two lakes have very
490 E. S. Kritzberg and others

similar lake characteristics (Table 1; data for 2001),although Paul Lake has piscivorous fish [largemouthbass (Micropterus salmoides)], and few minnows, andzooplankton are dominated by large-bodied cladoc-erans.
Whole-Lake 13C Experiment
The present experiment was performed in 2002
and followed the protocols and methods in a
whole-lake 13C addition in 2001 (Kritzberg and
others 2004; Pace and others 2004). The main dif-
ference was the enrichment of Peter Lake by
additions of liquid fertilizer containing NH4, NO3,
and PO4 at an atomic N:P ratio of 25. We made an
initial addition of 23 and 265 mg N m)2 on 3 June.
From 10 June to 25 August, additions corre-
sponding to a P-loading rate of 3.3 mg P m)2 d)1
were made daily from a moving boat. From 17
June through 21 July, we increased the 13C of
epilimnetic dissolved inorganic C (DIC) by daily
additions of NaH13CO3 (more than 99 13C atom
percent; ISOTEC). At early morning (6–8 A.M.),
NaH13CO3 dissolved in lake water was discharged
at 0.5-m depth by continuous pumping into the
epilimnion of each lake from a moving boat to
enhance spatial mixing. Tuesday Lake received
28 lmol m)2 d)1 and Peter Lake received 24 lmol
m)2 d)1. Samples for 13C of major C pools were
taken from 28 May through 4 September. During
the period of isotope enrichment, sampling for
DI13C, DO13C, and particulate organic 13C (PO13C)
was done prior to the daily NaH13CO3 addition.
Although a wide variety of stable isotope pools
were followed over the course of this experiment,
only bacteria and data from weekly sampling of
DIC, DOC, particulate organic C (POC), and
periphyton are included here. Periphyton was
scraped off at midday from acid-cleaned tiles that
were suspended at 0.5 m for 1-week colonization
periods. For details on collection and treatment of
samples (see Kritzberg and others 2004).
Bacterial Growth Experiments
Dialysis Cultures. To separate bacteria for isotope
analyses, bacteria were cultured in dialysis tubes
in situ on four occasions in each lake. The initial
incubations were done right before the onset of 13C
additions; the other three were done during the
course of 13C additions. Procedures for these incu-
bations have previously been described in detail
(Kritzberg and others 2004) and will be summa-
rized only briefly here. Three replicate dialysis
tubes (Spectra Por 2, cutoff 12,000–14,000 D, 45-
mm flat width, d13C of the membrane—24.8&)
were filled with 1,080 ml of 0.2-lm filtered (Supor-
200, PALL Life Sciences, NY, USA) and 120 ml of a
grazer free inoculum (9:1 vol:vol), which was made
by filtering lake water through Whatman GF/D
filters (nominal pore size, 2.7 lm). The sealed tubes
were incubated in situ and suspended at 0.5-m
depth. After 48 h of in situ incubation, bacteria
were harvested by filtering the water through 25-
mm Whatman GF/F filters (nominal pore size,
0.7 lm). The filters were dried at 60�C for 24 h and
stored in desiccators for subsequent analysis of
d13C. To confirm the growth of bacteria, we sam-
pled for bacterial abundance and organic C. The
dialysis tubes contained, on average, 400% more
bacterial cells and 450% more organic C at the end
of the incubation than at the start.
One additional 0.5-m dialysis tube, with water
filtered as for the dialysis cultures, was incubated to
evaluate the possibility that phytoplankton growth
occurred in the tubes. Filtration of the water used
for incubations reduced the Chl a concentration to
less than 1% of the concentration in the unfiltered
lake water. During the course of incubation, Chl a
decreased, on average, 58%, to an average of
0.06 lg L)1 (SD = 0.07; n = 8). Microscopic
inspection revealed no presence of cyanobacteria or
small eukaryotic algae in either the inocula or the
incubated cultures. Thus, growth of phytoplankton
in the tubes was insignificant, and phytoplankton
POC did not significantly contaminate the bacterial
regrowth cultures.
Batch Cultures. For comparison with the dialysis
incubations, synchronous batch cultures were also
run. The batch cultures were made following a
modified version of the method described by Coffin
and others (1989) using water collected for dialysis
cultures. Lake water filtered through 0.2-lm and
GF/D filters (9:1 vol:vol) was incubated in triplicate
glass bottles (1.2 L), in darkness at in situ temper-
ature for 48 h. Bacterial d13C from dialysis tubes
and batch cultures were similar and overlapping
both in Peter Lake (r = 0.97, P < 0.05; paired t-test
P = 0.40, n = 4) and Tuesday Lake (r = 0.995,
P < 0.01; paired t-test P = 0.66, n = 4).
Analytical Methods
Gross primary production (GPP) and respiration (R)
were estimated from continuous measurements of
dissolved oxygen in the mixed layer using an
instrument with pulsed oxygen electrodes and a
thermisitor recording data at 5-min intervals (YSI-
Endeco sondes model 6000, MA, USA) (see, Cole
and others 2000, 2002; Hanson and others 2003).
Respiration was estimated as the diffusion cor-
Bacterial Growth on Allochthonous Carbon 491

rected change in oxygen during night. During day,
the diffusion-corrected change in oxygen is a
measure of net ecosystem production (GPP–R) in
the mixed layer, and GPP was calculated assuming
that R in the dark and light were equal. Diffusion
was estimated from measurements of gas piston
velocity (k600) based on whole-lake sulfur hexa-
fluoride additions and continuous measurements of
lakeside wind (Wanninkhof and others 1985).
Oxygen flux was then calculated for each temper-
ature from the estimate of k600 and the ratio of the
Schmidt numbers (Jahne and others 1987). The
oxygen in the mixed layer is affected by both pe-
lagic and benthic processes to the depth of the
mixed layer; hence our data represent an inte-
grated measure of pelagic and benthic processes in
these lakes. To enable comparison with bacterial
production, oxygen was converted to C, assuming
respiratory and photosynthetic quotients of 1.
Using microcentrifuge tubes as described by
Smith and Azam (1992), bacterial production (BP)
was estimated for four depths (from 0.5 to 5 m) in
the upper layer of each lake by measuring the
incorporation of 3H-leucine (Kirchman 1993).
Water samples (1.5 mL; four replicates and one
killed control) were incubated with 35 nM final
concentration of 3H-leucine (42.5 Ci/mmol) at
in situ temperature for 45 min. The incubation was
terminated with 30 lL of 50% TCA. The samples
were then centrifuged at 17,000g for 10 min, and
the pellet was rinsed with 1.5 mL of 5% TCA. After
addition of 0.5 mL scintillation cocktail (Scintiverse
BD, Fisher Scientific, New Jersey, US), samples
were mixed vigorously and 3H-activity was mea-
sured with a Beckman LS, Beckman Instruments
Inc., CA, USA 6500 scintillation counter. We cal-
culated BP according to Smith and Azam (1992).
Areal values were calculated by trapezoidal inte-
gration and included only measurements from the
epilimnion.
Bacterial abundance in the dialysis tubes was
measured using the acridine orange direct count
method with 1% formalin preservation (Hobbie
and others 1977). Ten grids with a minimum of 40
cells were counted from duplicate slides. After Chl a
samples were filtered onto Whatman GF/F filters,
they were frozen and extracted in methanol, and
the chlorophyll was determined flourometrically
(Carpenter and others 1996). After prefiltration
through 153 lm to remove large zooplankton, POC
was collected on GF/F filters and analyzed using a
Carlo Erba CN analyzer. We measured DOC
(Pt-catalyzed high-temperature combustion meth-
od) on GF/F filtered samples using a Schimadzu
TOC-5000 carbon analyzer, Schimadzu Corpora-
tion, Tokyo, Japan. We measured TP on a Lachat
AE, Lachat Instruments, WI, USA autoanalyzer
after persulfate digestion using the molybdate blue
method. For TN, unfiltered water was digested in
basic persulfate (D’Elia and others 1977), and the
resulting nitrate was measured by the sulfanil-
amide method modified for an Alpkem Autoana-
lyzer, Technicon Instruments, SK, Canada.
Carbon isotopes were measured using elemental
analysis–isotope ratio mass spectrometry (EA–
IRMS), (Fry and others 1992). We analyzed DI13C
using a Micromass Isochrome GC-C-IRMS, GV In-
struments, Manchester, UK at the University of
Waterloo, OT, Canada. Analysis of d13C for bacteria
was carried out using an ANCA–NT system and a 20–
20 Stable Isotope Analyzer (PDZ Europa) at the
Ecology Department, University of Lund, Sweden.
Dissolved organic carbon (after acidification and
drying), POC, and periphyton were analyzed for
isotope content at the University of Alaska–Fair-
banks stable isotope facility, using a Carlo Erba Ele-
mental Analyzer (NC2500) and a Finnigan MAT
Conflo II/III interface with a Delta+ Mass Spec-
trometer.
To reduce the potential of organic C contamina-
tion, all glass fiber filters were precombusted at
450�C, and all membrane filters were prerinsed
with deionized water.
RESULTS
Metabolic Measurements
Table 1 shows selected physical, chemical, and
biological parameters measured in the three lakes
in 2001 and 2002. The nutrient additions to Peter
Lake resulted in significant increases in TP (Mann–
Whitney U test P < 0.001, n = 14–15) and TN
(P < 0.001, n = 14) that in turn caused a large in-
crease in whole-system gross primary production
(Mann–Whitney U test P < 0.001, n = 92) and Chl
a concentrations (Mann–Whitney U test P < 0.001,
n = 14–15) as compared to 2001. Consequently,
the upper mixed layer (benthic plus pelagic com-
ponents) of Peter Lake changed from a net het-
erotrophic system in 2001 to a net autotrophic
system in 2002 (NEP > 0; one-sample t-test
P < 0.001, n = 92). Also, pelagic BP in the mixed
layer increased from 1.0 to 4.7 mmol C m)2 d)1
compared to the previous year (Mann–Whitney U
test P < 0.001, n = 13–14). Gross primary produc-
tion increased from 33.2 to 92.5 mmol C m)2 d)1.
Thus, BP showed a greater response (4.8-fold) to
the nutrient additions than did GPP (2.8-fold).
Water temperature between the 2 years was similar
492 E. S. Kritzberg and others

(ANOVA P = 0.39, df = 182), so temperature does
not account for differences in GPP or BP. In Paul
Lake, the only measured parameter that showed a
significant difference between the 2 years was TN,
which declined in 2002 relative to 2001 (ANOVA
TN P < 0.01, df = 26; TP P = 0.85, df = 26; Chl a
P = 0.173, df = 26; BP P = 0.79, df = 25). The
general similarity of Paul Lake in 2002 relative to
2001 indicates that the differences in Peter Lake
during the 2 years were mainly a result of the
nutrient additions rather than climatic variation or
other changes.
Tuesday Lake was more productive than Peter or
Paul under ambient conditions (Table 1). The
average of daily NEP was negative, suggesting that
Tuesday Lake tended to be net heterotrophic. Daily
variability in NEP was, however, large enough that
the 95% confidence interval on daily NEP includes
NEP = 0. Thus, Tuesday Lake was not as strongly
net heterotrophic as Peter Lake or Paul Lake in 2001
and was probably close to balance in GPP and R.
d13C Dynamics of Major C Pools
The NaH13CO3 additions greatly increased the d13C
of DIC (preaddition and maximum values were )16
and +21& in Peter Lake and )19 and +22& in
Tuesday Lake), but they increased the total DIC by
less than 1% and did not measurably change pH.
The DI13C enrichment resulted in noticeable
changes in the PO13C, indicating that phytoplank-
ton became enriched in response to the 13C
manipulations (Figure 1). Although the absolute
increase in PO13C was similar to that in DI13C in
Peter Lake, in Tuesday Lake POC became only
about half as 13C-enriched as did DIC.
Periphyton were also labeled as a result of the
NaH13CO3 additions (Figure 1). In Peter Lake, the
d13C of the periphyton dynamics was very similar
to that of POC (PO13C = 0.935 · 13C-periphyton
)4.5, r = 0.93, P < 0.001); whereas in Tuesday
Lake, the periphyton responded more strongly to
the enrichment than POC (PO13C = 0.37 · 13C-
periphyton )20.4, r = 0.97, P < 0.001).
The pre-addition d13C values of the DOC were
)27.3 and )28.6& in Peter and Tuesday lakes,
respectively, similar to reported values for terres-
trially produced organic C (Lajtha and Michener
1994). The marked 13C-enrichment of the DOC in
Peter Lake (9.5&) and the slight enrichment in
Tuesday Lake (1.5&) reflect inputs of C from
internal autotrophic pathways such as losses of la-
beled DOC by algae and heterotrophs.
Pre-addition d13C values of bacteria were similar
to PO13C. Measurements of bacterial d13C made
during the course of additions followed the same
pattern as PO13C, but with less enrichment
(Figure 1). The relative contribution of allochtho-
nous C to bacterial biomass was calculated by using
a two end-member mixing model:
% allochthonous C¼ðd13Cbacteria�d13CautochthonousÞ=ðd13Callochthonous�d13CautochthonousÞ�100
For d13Cbacteria, we used values from the dialysis
incubations, and the allochthonous end-member
was estimated at )28&, after Lajtha and Michener
(1994), and similar to measurements of terrestrial
vegetation in the area (mean = )29&, SD = 1.7).
We estimated the autochthonous end-member
Table 1. Physical, Chemical, and Biological Parameters Measured in the Three Lakes
Tuesday (2002) Peter (2001) Peter (2001) Paul (2001) Paul (2002)
Nutrient status Ambient Ambient Amended Ambient Ambient
TP (mg P m)3) 12.1 (2.5) 8.1 (1.2) 26.4 (8.1) 9.6 (1.9) 9.6 (2.5)
TN (mg N m)3) 399.0 (60.2) 424.2 (32.2) 653.8 (98.0) 376.6 (50.4) 232.4 (37.8)
DOC (g C m)3) 8.5 (1.1) 4.5 (0.2) 5.8 (0.8) 3.8 (0.4) 4.6 (0.7)
Chl a (mg m)3) 6.8 (3.2) 3.1 (1.5) 42.3 (30.4) 3.9 (1.4) 5.9 (5.2)
BP (mmol C m)2 d)1) 1.5 (0.7) 1.0 (0.4) 4.7 (2.6) 1.2 (0.6) 1.1 (0.5)
GPP (mmol C m)2 d)1) 51.2 (26.5) 33.2 (19.8) 92.5 (45.2) 47.0 (21.6) —
R (mmol C m)2 d)1) 53.2 (24.5) 43.2 (22.6) 65.8 (47.3) 61.9 (21.0) —
NEP (mmol C m)2 d)1) )2.0 (16.5) )10.0 (10.4) 26.6 (26.4) )14.8 (11.6) —
Temperature (�C) 23.7 (2.5) 22.7 (3.0) 23.1 (3.0) 22.6 (3.2) —
TP, total phosphorus; TN, total nitrogen; DOC, dissolved organic carbon; Chl a, chlorophyll a; BP, bacterial production; GPP, gross primary production; R, respiration; NEP,net ecosystem production.Bacterial production (BP) was measured in the pelagic of the mixed layer; GPP, R, and NEP were measured in the mixed layer, including the benthic zone.Values in parentheses are standard deviation.
Bacterial Growth on Allochthonous Carbon 493

indirectly by three approaches. The first approach
assumed that POC was 100% autochthonous and
that the PO13C value was the same as that of
phytoplankton. To the extent that POC was of
terrestrial origin, this approach underestimates the13C content of phytoplankton. This approach yiel-
ded the lowest contribution of allochthonous C to
bacterial biomass. The means and range (in
parentheses) for three dates in each lake were 43%
(35–45%) and 20% (0–43%) in Peter and Tuesday
lakes, respectively (Figure 2).
The second approach assumed that the algal
signature could be derived by calculating the algal
proportion of POC from a fixed POC:Chl a ratio of
40. We presumed that the algal fraction of POC had
an autochthonous signature and that the rest was
allochthonous. The bacterial biomass would then
be 44% (39–49%) and 76% (70–83%) allochtho-
nous in Peter and Tuesday lakes, respectively
(Figure 2).
The third approach assumed that periphyton
collected from tile recolonization experiments had
the d13C of phytoplankton. Because periphyton
tend to deplete local carbon dioxide (CO2) concen-
trations, isotopic fractionation tends to be lower
than that of phytoplankton, so this approach
Figure 1. d13C of particulate
organic carbon (POC),
periphyton (peri), dissolved
organic carbon (DOC), and
bacteria in (A) Peter and (B)
Tuesday lakes. The first set of bars
show values prior to isotope
additions; the second set show
averages after enrichment. Error
bars represent SD (n = 5 except
for bacteria, where n = 3).
494 E. S. Kritzberg and others

may overestimate the d13C of phytoplankton.
This approach gave an estimated allochthonous
contribution to bacterial C of 46% (31–60%)
and 78% (76–79%) in Peter and Tuesday lakes,
respectively.
DISCUSSION
If pelagic bacteria were entirely supported by DOC
of allochthonous origin, their d13C would not have
changed in response to the whole-lake 13C addi-
tions, except to the minor extent that bacteria take
up some CO2 in the anapleurotic reactions of the
tricarboxylic acid cycle. If bacteria were supported
entirely by autochthonous C, their labeling would
have been equal to that of phytoplankton. In both
Peter and Tuesday lakes, the dynamics of bacterial
d13C changed markedly and paralleled those of
PO13C and periphyton d13C, but with significantly
less enrichment. Thus bacteria must have utilized
both allochthonous and autochthonous C sources.
The pattern of bacterial signatures in relation to
the PO13C and DO13C pools confirms the main
conclusions from previous whole-lake experiments
(Kritzberg and others 2004). First, bacteria in both
Peter and Tuesday lakes grew on a mixture of
autochthonous and allochthonous C. Second, bac-
teria were consistently enriched compared to DOC,
suggesting that although DOC of recent autoch-
thonous origin was a small part of the total DOC
pool, it was used preferentially by bacteria over
DOC of terrestrial origin. Finally, part of phyto-
plankton C remained in the DOC pool, as shown by
the increasing d13C signature of DOC. Thus, bac-
teria did not deplete the entire supply of DOC of
phytoplankton origin (see Bade 2004).
In our earlier work, we estimated the contribu-
tion of allochthonous and autochthonous C to
bacteria in two lakes with very similar GPP and
DOC (Kritzberg and others 2004). The present
study extends the range of observations to a more
humic and a more eutrophic lake. Because there is
uncertainty in the d13C of phytoplankton, the
autochthonous end-member, we erected three
models to calculate the allochthonous and
autochthonous C used by bacteria. Although all
three approaches have their limitations, estimates
based on the first (POC) and third (periphyton)
approaches represent the theoretically least and
largest contributions of allochthonous C to bacteria.
Moreover, the reasonableness of using POC as the
autochthonous end-member can be evaluated (see
below). All three approaches indicate very sub-
stantial allochthonous subsidies to the bacteria of
both eutrophic Peter Lake and humic Tuesday
Lake. Because of the time and effort involved in
making the dialysis incubations, the analysis of
bacterial C use is based on measurements of the
d13C of bacteria on only four dates in each lake.
Hence, there were too few observations to enable
comparison of dynamic models with d13C time
series of bacteria as used for other ecosystem con-
stituents (see, for example, Pace and others 2004).
However, an ecosystem C flow model that esti-
mates the utilization of allochthonous C by all
constituents of the food web was developed (see
Figure 2. Different estimates of
the relative contribution of
allochthonous carbon (C) to
bacterial biomass. PO13C, a value
derived from the algal fraction of
the particulate organic carbon
(POC), and d13C of periphyton
were used as the isotope
signature of the autochthonous
end-member. The bars show
mean values; error bars indicate
the range from three sampling
dates.
Bacterial Growth on Allochthonous Carbon 495

Carpenter and others 2005), and this model pro-
duced estimates consistent with the analysis of this
paper.
The first approach assumed that POC was en-
tirely composed of algae so that PO13C could re-
place a measured phytoplankton signature. In Peter
Lake, PO13C was a good measure of the autoch-
thonous end-member, as POC:Chl a was low (43)
and PO13C showed a strong response to the isotope
additions. Also, d13C of physically separated algal
material and bulk POC were similar (Bade 2004).
The second approach, deriving the algal signature
from the estimated algal proportion of the POC
pool, had a similar outcome (Figure 2). These
estimates were further supported by the third ap-
proach, which assumed that periphyton had the
d13C of phytoplankton (Figure 2). In conclusion,
the allochthonous contribution to bacterial biomass
could be well constrained to be between 43 and
46%. Thus, even though nutrient additions re-
sulted in substantially increased primary produc-
tion, which exceeded total respiration (seasonal
mean GPP:R = 1.4:1), bacterial autochthony only
increased from 30% in 2001 to 54% in 2002 (using
periphyton as the autochthonous end-member).
Compared to 2001, the absolute increase in GPP
(approximately 60 mmol C m)2 d)1) was consid-
erably larger than that of BP (approximately 4
mmol C m)2 d)1). However, if we assume that 10%
of GPP was respired by the phytoplankton, and that
13% of net primary production entered the DOC
pool (Baines and Pace 1991; Bade 2004), only 7
mmol C m)2 d)1 became available as a potential
substrate to bacteria. Thus, although this is a rough
calculation, the amount of phytoplankton-derived
DOC available to bacteria was not as large as it
appears by looking at the absolute increase in GPP
and BP. Moreover, the autochthonous portion of
DOC inputs to Peter Lake was estimated at 17 and
41% of total DOC input in 2001 and in 2002,
respectively (Bade 2004). So although there was
more algal C produced (GPP) than was consumed
Figure 3. A The relative
contribution of autochthonous
carbon (C) to bacterial C
assimilation at different ratios of
autochthonous and
allochthonous dissolved organic
carbon (DOC). B The relative
contribution of allochthonous C
to bacterial biomass in Peter and
Tuesday lakes in 2002 (this
study) and 2001 (data from
Kritzberg and others 2004)
against chromophoric dissolved
organic matter (CDOM) to
chlorophyll a (Chl a). d13C of
periphyton was used as the
isotope signature of the
autochthonous end-member.
496 E. S. Kritzberg and others
(R) in 2002, bacteria would have to show very
strong selectivity to grow on algal DOC only.
It is often assumed that bacteria deplete all
autochthonous DOC present and then use allo-
chthonous DOC to support the residual biomass
production (Cole and others 2002; Jansson and
others 2003). In mechanistic terms, this is an
unrealistic assumption. More probably, bacteria
take up autochthonous DOC preferentially, but the
uptake is confined by its relative contribution to
the DOC pool (Kritzberg and others 2005). A
selectivity coefficient that denotes differing lability
of autochthonous and allochthonous DOC was
defined as Passim = (autofracbacteria/allofracbacteria)/
(autofracDOC/allofracDOC). Autofrac is the fraction
of bacterial C assimilation and instantaneous mass
of DOC that is autochthonous; allofrac is the frac-
tion that is allochthonous. Figure 3A is a graphical
illustration of the selectivity model, where the
fraction of bacterial C assimilation that is autoch-
thonous is calculated for a range of theoretical
values of the relative contribution of autochtho-
nous C to the DOC pool under the assumption that
autochthonous DOC is not (Passim = 1), two times
(Passim = 2), or four times (Passim = 4) more avail-
able to bacteria than allochthonous C. This model
predicts that the input of autochthonous DOC
needs to be very large compared to that of allo-
chthonous DOC for bacteria to use only autoch-
thonous C.
When we compared the field seasons of 2001
(unfertilized) and 2002 (fertilized) for Peter Lake,
we found that BP increased more (4.8-fold) than
primary production (2.8-fold). Considering the lack
of differences in Paul Lake during the same years,
we conclude that the increase in primary and sec-
ondary productivity in Peter Lake was a result of
the nutrient additions in 2002. From the measured
rates of BP and fractions of BP that derived from
allochthonous C in the respective years (70% of BP
in 2001 according to Kritzberg and others 2004;
46% of BP in 2002), we could estimate the fraction
of the BP increase that was based on allochthonous
C to be 40%. Hence, the nutrient additions en-
hanced bacterial production both via increased
production of autochthonous DOC and increased
utilization of ambient terrestrial C. Bacterial growth
on allochthonous C may have been more efficient
as a result of increased nutrient availability. If the
low nutritional value of allochthonous dissolved
organic matter (DOM) compared to autochthonous
DOM (Wetzel 2001) is reflected in the bacterial
growth efficiency (Kroer 1993; Cimberlis and Kalff
1998), bacterial utilization of allochthonous C may
become more efficient after nutrient additions.
Accordingly, BP is often reported to increase in
response to P enrichment regardless of the response
by phytoplankton (Pace and Cole 1996; Vrede and
others 1999).
In Tuesday Lake, high POC:Chl a (mean, 135)
suggests that not all POC was the result of recent
photosynthesis by phytoplankton, and the low re-
sponse in PO13C compared to DI13C indicates that
POC from this lake had a large terrestrial compo-
nent. In addition, physically separated algal mate-
rial was more enriched in 13C than bulk POC (Bade
2004). Thus, PO13C was a poor estimate of the
phytoplankton signature in Tuesday Lake and
underestimated the bacterial dependence on allo-
chthonous C. Accordingly, deriving the algal sig-
nature from the estimated algal proportion of the
POC pool resulted in a drastically higher contribu-
tion of allochthonous C to bacterial biomass
(Figure 2). These values agree well with the ap-
proach in which d13C of periphyton was used as the
autochthonous isotope signature. In conclusion,
the average allochthonous contribution to bacterial
C was estimated at 76–78%. Although bacteria in
Tuesday Lake were less dependent on phyto-
plankton-derived C than bacteria in low humic
Paul and Peter Lakes in 2001 (Figure 3B), (Kritz-
berg and others 2004), they did not rely solely on
allochthonous inputs, which is in agreement with a
suggested bacterial preference for recently pro-
duced autochthonous DOC (Kritzberg and others
2004, 2005).
Although the sample size is small, the extent to
which bacteria grew on allochthonous C was re-
lated to the ratio of chromophoric dissolved organic
matter (CDOM) to Chl a in the lakes (r = 0.8,
P < 0.05) (Figure 3B). Because CDOM (measured
as light absorbance at 440 nm) can be considered
an indication of the terrestrial C load (Rasmussen
and others 1989) and Chl a is proportional to
within-lake primary production, CDOM:Chl a may
be a reasonable proxy for terrestrial C loading in
relation to internal C loading. The shallow slope of
this relationship indicates that significant differ-
ences in CDOM or Chl a result in relatively small
differences with regard to the bacterial C source,
which is in agreement with the predictions from
Figure 3A.
Obviously, more lakes and more types of lakes
need to be investigated to see if the CDOM:Chl a
ratio will predict allochthony in bacteria in a gen-
eral way. Our experiments now cover a large range
in DOC, CDOM, Chl a, and rates of epilimnetic
primary production. Both our model (Figure 3A)
and whole-lake 13C experiments suggest that bac-
terial allochthony is likely to range between about
Bacterial Growth on Allochthonous Carbon 497

40 and 80%. Because they are the primary organ-
isms that use DOC, bacteria can potentially link
consumers with this otherwise ‘‘lost’’ pool of or-
ganic matter (Pomeroy 1974; Paerl 1978). Our
study suggests that bacteria would link their con-
sumers to C of both terrestrial and aquatic origin.
ACKNOWLEDGEMENTS
We are grateful for financial support from the Na-
tional Science Foundation (DEB 9509595), the
Swedish Research Council (VR; contract B 5103-
649), and the Crafoord Foundation. We thank M.
Van de Bogert, D. Bade, G. Birgersson, and C.
Fankhauser for technical assistance. Work at the
University of Notre Dame Environmental Research
Center was facilitated by R. Hellenthal, J. Runde,
G. Belovsky, and J. Caudel, and we thank B.
Montgomery at ISOTEC for assistance with the
purchase of the large quantity of 13C required for
these experiments. Finally, we thank Robert
Wetzel, Erik Jeppessen, and an anonymous re-
viewer for greatly improving a previous version of
this paper. This is a contribution to the Department
of Ecology/Limnology at Lund University and the
Institute of Ecosystem Studies.
REFERENCES
Bade DL. 2004. Ecosystem carbon cycles: whole-lake fluxes
estimated with multiple isotopes [thesis]. Madison: University
of Wisconsin.
Baines BB, Pace ML. 1991. The production of dissolved organic
matter by phytoplankton and its importance to bacteria: pat-
terns across marine and freshwater systems. Limnol Oceanogr
36:1078–90.
Carpenter SR, Kitchell JF, Eds. 1993. The trophic cascade in
lakes. Cambridge (UK): Cambridge University Press, 385 p.
Carpenter SR, Kitchell JF, Cottingham KL, Schindler DE,
Christensen DL, Post DM, Voichick N. 1996. Chlorophyll
variability, nutrient input and grazing: evidence from whole-
lake experiments. Ecology 77:725–35.
Carpenter SR, Cole JJ, Pace ML, Van de Bogert M, Bade DL,
Bastviken D, Gille C, and others. 2005. Ecosystem subsidies:
terrestrial support of aquatic food webs from 13C addition to
contrasting lakes. Ecology, 86:2737–2750.
Cimberlis ACP, Kalff J. 1998. Planktonic bacterial respiration as a
function of C:N:P ratios across temperate lakes. Hydrobiologia
384:89–100.
Coffin RB, Cifuentes LA. 1999. Stable isotope analysis of carbon
cycling in the Perdido Estuary, Florida. Estuaries 22:917–26.
Coffin RB, Fry B, Peterson BJ, Wright RT. 1989. Carbon isotopic
compositions of estuarine bacteria. Limnol Oceanogr 34:
1305–10.
Cole JJ, Caraco NF, Kling GW, Kratz TK. 1994. Carbon dioxide
supersaturation in the surface waters of lakes. Science
265:1568–70.
Cole JJ, Pace ML, Carpenter SR, Kitchell JF. 2000. Persis-
tence of net heterotrophy in lakes during nutrient addi-
tion and food web manipulations. Limnol Oceanogr 45:
1718–30.
Cole JJ, Carpenter SR, Kitchell JF, Pace ML. 2002. Pathways of
organic carbon utilization in small lakes: results from whole-
lake 13C addition and coupled model. Limnol Oceanogr
47:1664–75.
D’Elia CF, Steudler PA, Corwin N. 1977. Determination of total
nitrogen in aqueous samples using persulfate digestion. Lim-
nol Oceanogr 22:760–4.
Dillon PJ, Molot LA. 1994. Dissolved organic and inorganic
carbon mass balances in central Ontario lakes. Biogeochem-
istry 36:29–42.
Ducklow HW, Purdie DA, Williams PJleB, Davies JM. 1986.
Bacterioplankton: a sink for carbon in a coastal marine
plankton community. Science 232:865–7.
Fry B, Brand W, Mersch FJ, Tholke K, Garritt RH. 1992. Auto-
mated analysis system for coupled 13C and 15N measurements.
Anal Chem 64:289–91.
del Giorgio PA, Peters RH. 1994. Patterns in planktonic P:R ratios
in lakes: influence of lake trophy and dissolved organic car-
bon. Limnol Oceanogr 39:772–87.
del Giorgio PA, Cole JJ, Caraco NF, Peters RH. 1999. Linking
planktonic biomass and metabolism to net gas fluxes in
northern temperate lakes. Ecology 88:1422–31.
Hanson PC, Bade DL, Carpenter SR. 2003. Lake metabolism:
relationships with dissolved organic carbon and phosphorus.
Limnol Oceanogr 48:1112–9.
Herndl GJ, Kaltenbock E, Muller-Niklas G. 1993. Dialysis bag
incubation as a non-radiolabeling technique to estimate bac-
terioplankton production in situ. In: Kemp PF, Sherr BF, Sherr
EB, Cole JJ, Eds. Handbook of methods in aquatic microbial
ecology. Lewis, p 553–6.
Hobbie JE, Daley RJ, Jasper S. 1977. Use of Nuclepore filters for
counting bacteria by fluorescence microscopy. Appl Environ
Microbiol 33:1225–8.
Jahne B, Munnich KO, Bosinger R, Dutzi A, Huber W, Libner P.
1987. On parameters influencing air-water gas exchange. J
Geophys Res 92:1937–49.
Jansson M, Karlsson J, Blomqvist P. 2003. Allochthonous or-
ganic carbon decreases pelagic energy mobilization in lakes.
Limnol Oceanogr 48:1711–6.
Kirchman DL. 1993. Leucine incorporation as a measure of bio-
mass production by heterotrophic bacteria. In: Kemp PF, Sherr
BF, Sherr EB, Cole JJ, Eds. Handbook of methods in aquatic
microbial ecology. Lewis: Boca Raton, Florida, USA, p 509–12.
Kritzberg ES, Cole JJ, Pace ML, Graneli W, Bade D. 2004.
Autochthonous versus allochthonous carbon sources to bac-
teria: results from whole-lake 13C addition experiments.
Limnol Oceanogr 49:588–96.
Kritzberg ES, Cole JJ, Pace ML, Graneli W. 2005. Does autoch-
thonous primary production drive variability in bacterial
metabolism and growth efficiency in lakes dominated by ter-
restrial C inputs? Aquat Microb Ecol 38:103–11.
Kroer N. 1993. Bacterial growth efficiency on natural dissolved
organic matter. Limnol Oceanogr 38:1282–90.
Lajtha K, Michener RH. 1994. Sources of variation in the stable
isotopic composition of plants. In: Lajtha K, Michener RH,
Eds. Stable isotopes in ecology and environmental science.
Blackwell: Oxford, p 1–21.
Pace ML, Cole JJ. 1996. Regulation of bacteria by resources and
predation tested in whole-lake experiments. Limnol Oceanogr
41:1448–60.
498 E. S. Kritzberg and others
Pace ML, Cole JJ, Carpenter SR, Kitchell JF, Hodgson JR, Van de
Bogert MC, Bade DL, and others. 2004. Whole-lake carbon-13
additions reveal terrestrial support of aquatic food webs.
Nature 427:240–3.
Paerl HW. 1978. Microbial organic carbon recovery in aquatic
ecosystems. Limnol Oceanogr 23:927–35.
Pomeroy LR. 1974. The ocean food web: a changing paradigm.
Bioscience 24:499–504.
Rasmussen JB, Godbout L, Schallenberg M. 1989. The humic
content of lake water and its relationship to watershed and
lake morphometry. Limnol Oceanogr 34:1336–43.
Riera JL, Schindler JE, Kratz TK. 1999. Seasonal dynamics of
carbon dioxide and methane in two clear-water lakes and two
bog lakes in Northern Wisconsin, USA. Can J Fish Aquat Sci
56:265–74.
Smith DC, Azam F. 1992. A simple, economical method for
measuring bacterial protein synthesis rates in sea water using3H-leucine. Mar Microb Food Webs 6:107–9.
Vrede K, Vrede T, Isaksson A, Karlsson A. 1999. Effects of
nutrients (phosphorus, nitrogen, and carbon) and zooplank-
ton on bacterioplankton and phytoplankton — a seasonal
study. Limnol Oceanogr 44:1616–24.
Wanninkhof R, Ledwell JR, Broecker WS. 1985. Gas-exchange –
wind speed relation measured with sulfur hexafluoride on a
lake. Science 227:1224–6.
Wetzel RG. 1995. Death, detritus and energy flow in aquatic
ecosystems. Freshw Biol 33:83–9.
Wetzel RG. 2001. Limnology: lake and river ecosystems. 3rd ed.
New York: Academic Press, 1006 p.
Bacterial Growth on Allochthonous Carbon 499
Related Documents