Background Paper 3 March 2005 1 Demand and Supply on the Global Market for Emission Certificates Wolfgang Sterk, Maike Bunse, Bettina Wittneben, Michael Gybas, Stefan Lechtenböhmer Under the Kyoto Protocol, which has recently come into effect, several industrialised countries have committed themselves to reducing their greenhouse gas emissions by various degrees. These commitments can be met through national policies and measures and through acquiring emission certificates on the global market. Most Western European states as well as non-European states such as Canada and Japan have already announced that they intend to include the latter option in their plans to reach their Kyoto Protocol reduction target. Whether the resulting demand will be sat- isfied by global supply of emission certificates is becoming a question that can be addressed, as countries are slowly declaring their interest in selling and buying certificates. In this paper, we ana- lyse the most recent information available (as of February 2005) to determine whether it will be a seller’s or a buyer’s market. The first section of this paper analyses the potential demand for emission certificates. Countries that belong to the EU-15 group have submitted their National Allocation Plans that indicate their emission shortfall or surplus in comparison with their respective Kyoto target. On the basis of these documents as well as the data provided by the European Environment Agency, we have been able to compile the aggregate potential demand for emission certificates from EU-15 countries. In addition, the paper also discusses potential demand from non-European states, such as Canada. In the second section, we tackle estimating the potential supply of emission certificates. Emission certificates can be generated by introducing unused emission allowances or by conducting Clean Development Mechanism (CDM) or Joint Implementation (JI) projects. The paper in turn analyses supply by the new EU Member states and EU Accession countries, supply by Russia and the Ukraine as well as supply from CDM projects. The last section of this paper is dedicated to drawing conclusions from the data presented in na- tional reports and purchasing programmes. This is the third paper in a series of four papers commissioned by the Ministry of the Environment of Japan and elaborated jointly with the Institute for Global Environmental Strategies.

Welcome message from author
This document is posted to help you gain knowledge. Please leave a comment to let me know what you think about it! Share it to your friends and learn new things together.
Transcript

Background Paper 3 March 2005
1
Demand and Supply on the Global Market for Emission Certificates
Wolfgang Sterk, Maike Bunse, Bettina Wittneben, Michael Gybas, Stefan Lechtenböhmer
Under the Kyoto Protocol, which has recently come into effect, several industrialised countries have committed themselves to reducing their greenhouse gas emissions by various degrees. These commitments can be met through national policies and measures and through acquiring emission certificates on the global market. Most Western European states as well as non-European states such as Canada and Japan have already announced that they intend to include the latter option in their plans to reach their Kyoto Protocol reduction target. Whether the resulting demand will be sat-isfied by global supply of emission certificates is becoming a question that can be addressed, as countries are slowly declaring their interest in selling and buying certificates. In this paper, we ana-lyse the most recent information available (as of February 2005) to determine whether it will be a seller’s or a buyer’s market.
The first section of this paper analyses the potential demand for emission certificates. Countries that belong to the EU-15 group have submitted their National Allocation Plans that indicate their emission shortfall or surplus in comparison with their respective Kyoto target. On the basis of these documents as well as the data provided by the European Environment Agency, we have been able to compile the aggregate potential demand for emission certificates from EU-15 countries. In addition, the paper also discusses potential demand from non-European states, such as Canada.
In the second section, we tackle estimating the potential supply of emission certificates. Emission certificates can be generated by introducing unused emission allowances or by conducting Clean Development Mechanism (CDM) or Joint Implementation (JI) projects. The paper in turn analyses supply by the new EU Member states and EU Accession countries, supply by Russia and the Ukraine as well as supply from CDM projects.
The last section of this paper is dedicated to drawing conclusions from the data presented in na-tional reports and purchasing programmes.
This is the third paper in a series of four papers commissioned by the Ministry of the Environment of Japan and elaborated jointly with the Institute for Global Environmental Strategies.
2
1 Demand
1.1 EU-15 Demand
1.1.1 General Situation The “old” 15 EU Member States’ (EU-15) demand for emission certicates is increasingly taking shape. According to the latest technical report of the European Environment Agency (EEA) greenhouse gas (GHG) emissions in the EU-15 have fallen by 2.9% since 1990. However, projections for 2010 expect a reverse tendency of rising aggregate emissions up to only 1.0% below 1990 levels. Considering the EU’s emission reduction target of 8%, this implies a gap of 7% (EEA 2004: 19). The situation at the Member State level varies, as displayed in Table 1.
Country Base Year Emissions
(for projections) Projected gap (over-delivery (+) or shortfall (-)) between target and projected emis-sions in 2010
Projected gap (over-delivery (+) or shortfall (-)) between target and projected emissions in 2010
Based on existing domestic policies and measures (PAMs)
Based on additional domestic policies and measures (PAMs)
Mt CO2e Mt CO2e Mt CO2e
Austria 77.6 -16.9 -3 Belgium 141.0 -19.7 -5.9 Denmark 69.0 -25.3 n.a. Finland 77.2 -12.7 +0.4 France 545.0 -49.3 +9 Germany 1218.2 -15.4 n.a. Greece 109.3 -14.8 +2.9 Ireland 53.4 -8.7 +5.1 Italy 521.0 -53.0 -16.1 Luxembourg 12.7 -0.7 n.a. Netherlands 212.0 -19.7 n.a. Portugal 65.1 -17.0 -12.2 Spain 207.0 -68.9 -26.9 Sweden 71.9 +3.0 n.a. United Kingdom 744.7 +10.7 +74.3 Total EU-15 4125.1 -308,4 +28,2
n.a. – not available
Table 1: Gaps between burden-sharing target and projected emissions in 2010 of EU 15 countries, Source: EEA 2004.
The EEA reports follow the format required for the National Communications (NCs) under the United Nations Framework Convention on Climate Change in that they provide two of the three different
3
scenarios usually contained in the NCs: “with measures” and “with additional measures”. The scenario “with measures” usually reflects the impacts of already implemented or currently planned policies and measures and can thus be regarded as the baseline, whereas the scenario “with additional measures” includes policies and measures that have been suggested but have not yet been introduced into the domestic political process. As pointed out in Paper 2, the labelling of the scenarios is not consistent across countries, the level of detail and reliability varies to a great extent and the emission reductions attributed to policies and measures (PAMs) are not always credible. Still, the EEA reports are among the most comprehensive data sources available. Further in-depth analysis of the individual country reports is beyond the scope of this paper.
As will be outlined in more detail below, some EU-15 Member States expect to meet their commit-ments through domestic policies and measures alone. A few states, such as Sweden and the UK, even expect to gain a surplus. Other states have rather grim prospects of meeting their respective commit-ments unless they implement significant additional measures. Some of these countries are therefore already taking steps to utilise the project-based mechanisms. The situation is becoming increasingly transparent because the National Allocation Plans (NAPs) under the EU emission trading system (EU ETS) not only contain the allocation of EU Allowances to the regulated installations but also a de-scription of how the country is planning to meet its Kyoto target. Several countries already stated their intention to use the Clean Development Mechanism (CDM) and Joint Implementation (JI) and launched national programmes or invested in carbon funds as a means to acquire Certified Emission Reductions (CERs) and/or Emission Reduction Units (ERUs).
In the following, an approximate estimation of the CER and ERU demand by each EU-15 Member State will be presented. We have taken into consideration the following data points: the emission pro-jections outlined in Table 1, the intended use of the flexible mechanisms described in the NAPs, pur-chase targets of national CDM/JI-programmes, as well as participation in carbon funds. We multiplied the projected emission gaps for 2010 by five to make them comparable with the reduction targets for the first Kyoto commitment period of 2008-2012 and with the purchase targets for CERs/ERUs that have been announced.
In some cases the available information only indicated the budget of a programme but not the purchase target. In these cases we translated the monetary amounts into amounts of certificates, applying a moderate price of 5 EUR per t CO2e. This estimate is based on 2004 prices for CERs/ERUs which ranged between 3.95 – 6.00 EUR.1 We assume that countries used this price estimate to budget their financial support of the carbon funds. An investment amount divided by the estimated price of 5 EUR therefore indicates their perceived demand for certificates. It should be noted, however, that this pro-cedure limits calculations of demand for certificates when the data provided is in monetary terms in at least two ways: First, future price developments may run counter to our calculations, i.e. rising prices will mean less certificates for the buyers and vice versa. Second, it is probable that a certain share of a programme’s budget will be used to cover transaction costs in which case less certificates will be pur-chased than we had calculated.
It bears noting that direct purchases are not the only channel through which the EU Member States will acquire CERs and ERUs. Companies covered by the EU ETS will be able to surrender CERs/ERUs to their governments to comply with their domestic commitments, which the govern-
1 Current prices can for example be found at the Point Carbon Website: http://www.pointcarbon.com.

4
ments can then use to comply with their Kyoto commitments (see Paper 2 for further details). The total demand of a country is therefore the sum of its government’s procurement programmes plus the pur-chases by its companies. It is not yet clear to what extent EU companies will take advantage of this option.
1.1.2 Country-by-Country Analysis
1.1.2.1 Austria
Description EU Burden-sharing target 2008-2012
Projected gap (over-delivery (+) or shortfall (-)) with existing do-mestic PAMs
Projected gap (over-delivery (+) or shortfall (-))with addi-tional PAMs
2010 2008-2012 2010 2008-2012
% Mt CO2e Mt CO2e Mt CO2e Mt CO2e
- 13 -16.9 -84.5 -3.0 -15
Table 2: Emission Projections for Austria, Source: EEA 2004: 110
The Austrian NAP stipulates a purchase target of 3-5 Mt CO2 in 2005-2007; data for the commitment period of 2008-2012 is not yet available (Austria 2004: 13). The Austrian Government already launched a JI/CDM programme which is managed by the public bank Kommunalkredit. This pro-gramme has a target of 35 Mt CO2e for 2008-2012 and can dispose of a budget of EUR 11 million in 2004, EUR 24 million in 2005, and EUR 36 million in 2006.2
Evaluation
Comparing the required amount for closing the gap of 16.9 Mt CO2e in 2010 and 84.5 Mt CO2e for 2008-2012 in the scenario with existing PAMs with the intended purchase of 35 Mt CO2e leaves a deficit of 49.5 Mt CO2e. The scenario with additional PAMs shows an over-delivery of 20 Mt CO2e in the period from 2008 to 2012.
1.1.2.2 Belgium
Description EU Burden-sharing target 2008-2012
Projected gap (over-delivery (+) or shortfall (-))with existing domestic PAMs
Projected gap (over-delivery (+) or shortfall (-))with additional PAMs
2010 2008-2012 2010 2008-2012
% Mt CO2e Mt CO2e Mt CO2e Mt CO2e - 7.5 -19.7 -98,5 -5.9 -29.5
Table 3: Emission Projections for Belgium, Sources: EEA 2004: 111
2 Österreichisches JI/CDM-Programm: http://www.klimaschutzprojekte.at [15.02.2005].

5
Belgium plans to use the project-based Kyoto mechanisms to achieve its EU burden-sharing commit-ments (Belgium 2004: 5). The Belgian NAP is subdivided into three parts, distributing the reduction target to the regions of Flanders (-7.5%), Wallonia (-5.2%), and the Brussels Capital Region (-3.475%). The shortfall for complying with the national target will be set off by the national govern-ment through the purchase of certificates from CDM/JI. Flanders and Wallonia also decided to fall back on the use of the project-based mechanisms.
According to the NAP, the federal level intends to purchase an amount of 12.3 Mt CO2e during 2008-2012, while Wallonia intends to purchase 5.5 Mt CO2e in 2005-2007 and Flanders 2.0 Mt CO2e in 2005-2007 (Belgium 2004: 6). These plans have already been partly implemented: The federal gov-ernment launched a JI/CDM Tender, and the Flemish government also launched its own tender. The federal government JI/CDM Tender intends to purchase an amount of 12.3 Mt CO2e in 2008-2012, i.e. an annual amount of 2.46 Mt CO2e (Belgium 2004: 6). The first tender will start in April 2005 with a budget of EUR 10 million.3 The Flemish Tender started in September 2004 and intends to purchase 23.93 Mt CO2e until 2012.4
Evaluation
The projected gap for Belgium in the scenario with existing measures amounts to 19.7 Mt CO2e in 2010 and 98.5 Mt CO2e for 2008-2012, facing a purchase target of 36.23 Mt CO2e (not including pos-sible purchases by Wallonia). Therefore, a shortfall of about 62.27 Mt CO2e remains. In the scenario with additional PAMs, a shortfall of 29.5 Mt CO2e faces a purchase target of 36.23 Mt CO2e, which leads to an over-delivery of 6.73 Mt CO2e.
1.1.2.3 Denmark
Description EU Burden-sharing target 2008-2012
Projected gap (over-delivery (+) or shortfall (-))with exist-ing domestic PAMs
Projected gap (over-delivery (+) or shortfall (-))with additional PAMs
2010 2008-2012 2010 2008-2012
% Mt CO2e Mt CO2e Mt CO2e Mt CO2e - 21 -25.3 -126.5 n.a. n.a.
Table 4: Emission Projections for Denmark, Source: EEA 2004: 113
Denmark also plans to use CDM/JI (Denmark 2004: 15). The NAP stipulates a purchase target of 18.7 Mt CO2e for 2008-12, i.e. an annual amount of 3.7 Mt CO2e. The Danish Government purchases emis-sion reduction certificates through the tender window DanishCarbon.dk, which is administered by the Danish Environmental Protection Agency (DEPA). The first tender round has alreay been successfully conducted from June 15 to September 15, 2004. The second tender round was running till February 15, 2005 and the third tender round is expected to start soon.5
3 Belgian JI/CDM Tender: http://www.climat.be/jicdmtender/index.htm [16.02.2005]. 4 tender by the Flemish Region for CDM and JI projects focusing on the purchase of emission credits from project developers:
http://193.190.148.16/ned/sites/economie/energiesparen/paginas/fxm/fxm_beginpagina_en.htm [16.02.2005]. 5 DanishCarbon.dk: http://www.danishcarbon.dk [16.02.2005].

6
Evaluation
Comparing the projected gap of 25.3 Mt CO2e in 2010, corresponding to 126.5 Mt CO2e for the whole first commitment period, with planned purchases of 18.7 Mt CO2e still leaves a significant gap of 107.8 Mt CO2e. There is no information available on potential additional PAMs.
1.1.2.4 Finland
Description EU Burden-sharing target 2008-2012
Projected gap (over-delivery (+) or shortfall (-)) with exist-ing domestic PAMs
Projected gap (over-delivery (–) or shortfall (+)) with additional PAMs
2010 2008-2012 2010 2008-2012
% Mt CO2e Mt CO2e Mt CO2e Mt CO2e +- 0 -12.7 -63.5 +0.4 +2.0
Table 5: Emission Projections for Finland, Source: EEA 2004: 115
Finland also intends to meet a certain part of its target through the use of CDM/JI (Finland 2004: 31f.). No concrete data is given in the NAP, but a JI and small-scale CDM pilot programme, directed by the Ministry of Foreign Affairs, has already been launched. The purchase target amounts to 1.0-1.4 Mt CO2e for 2008-12. Since the beginning of the pilot programme in 1999, Finland invested EUR 20 mil-lion, half of which went to the Prototype Carbon Fund of the World Bank. Assuming a price of EUR 5 per certificate, this estimates a demand of approximately 2 Mt CO2e. Within in the framework of the pilot programme, Finland also invested in the Testing Ground Facility of the Baltic Sea Region Energy Cooperation (BASREC)6.
Evaluation
Considering the projected gap of 12.7 Mt CO2e in 2010 or 63.5 Mt CO2e in 2008-2012 in the with existing measures scenario and the purchase target of about 3 Mt CO2e, there is still a deficit of about 60.5 Mt CO2e. The scenario with additional PAMs shows a small over-delivery of 3 Mt CO2e.
1.1.2.5 France
Description EU Burden-sharing target 2008-2012
Projected gap (over-delivery (+) or shortfall (-))with exist-ing domestic PAMs
Projected gap (over-delivery (+) or shortfall (-))with additional PAMs
2010 2008-2012 2010 2008-2012
% Mt CO2e Mt CO2e Mt CO2e Mt CO2e +- 0 -49.3 -246.5 +9 +45
Table 6: Emission Projections for France, Source: EEA 2004: 117 6 Finnish CDM/JI Pilot Programme: http://global.finland.fi/english/projects/cdm/ [16.02.2005].
BASREC was established by the energy ministers of the Baltic Sea Region Countries (Denmark, Estonia, Finland, Germany, Iceland, Latvia, Lithuania, Norway, Poland, Russia and Sweden) and the European Commission at their conference in Helsinki in October 1999. It has its own secretariat and mainly serves as forum for exchange of information and coordination of energy policy strategies (http://www.cbss.st/basrec/).
7
France committed to stabilising its GHG emissions at 1990 levels. France is striving to meet its emis-sion target by domestic measures alone (France 2004: 6). So far, there are no governmental purchase activities. The projections for the first commitment period show an immense shortfall for the scenario with existing domestic PAMs; on the other hand, the scenario with additional PAMs projects an over-delivery.
1.1.2.6 Germany
Description EU Burden-sharing target 2008-2012
Projected gap (over-delivery (+) or shortfall (-))with exist-ing domestic PAMs
Projected gap (over-delivery (+) or shortfall (-))with additional PAMs
2010 2008-2012 2010 2008-2012
% Mt CO2e Mt CO2e Mt CO2e Mt CO2e - 21 -15.4 -77 n.a. n.a.
Table 7: Emission Projections for Germany, Source: EEA 2004: 119
Germany aims to meet its reduction target through domestic reductions alone (Germany 2004: 13). Nevertheless, Germany aims to stimulate the project-based mechanisms by investing EUR 5 million in the Testing Ground Facility (TGF) of the Baltic Sea Region Energy Cooperation (BASREC). In addi-tion, Germany plans to invest EUR 8 million into the KfW Banking Group’s Carbon Fund.7 Assuming a price of EUR 5 per certificate, these investments can be estimated to yield 2.6 Mt CO2e.
Evaluation
Comparing the projected gap of 77 Mt CO2e in the scenario with existing domestic PAMs in the pe-riod of 2008-2012 with a purchase of 2.6 Mt CO2e, a shortfall of 74.4 Mt CO2e remains.
1.1.2.7 Greece
Description EU Burden-sharing target 2008-2012
Projected gap (over-delivery (+) or shortfall (-))with exist-ing domestic PAMs
Projected gap (over-delivery (+) or shortfall (-))with additional PAMs
2010 2008-2012 2010 2008-2012
% Mt CO2e Mt CO2e Mt CO2e Mt CO2e + 25 -14.8 -74 +2.9 +14.5
Table 8: Emission Projections for Greece, Source: EEA 2004: 121
Evaluation
Governmental procurement programmes have not been implemented so far. A shortfall of 74 Mt CO2e with existing PAMs and an over-delivery of 14.5 Mt CO2e with additional PAMs is expected for the first commitment period.
7 KfW Bankengruppe – Der KfW-Klimaschutzfonds: http://www.kfw.de/klimaschutzfonds [15.02.2005]
8
1.1.2.8 Ireland
Description EU burden-sharing target 2008-2012
Projected gap (over-delivery (+) or shortfall (-))with exist-ing domestic PAMs
Projected gap (over-delivery (+) or shortfall (-))with additional PAMs
2010 2008-2012 2010 2008-2012
% Mt CO2e Mt CO2e Mt CO2e Mt CO2e + 13 -8.7 -43.5 +5.1 +25.5
Table 9: Emission Projections for Ireland, Source: EEA 2004: 123
Ireland also plans to use CDM/JI in addition to domestic measures to meet its target (Ireland 2004: 10f.). The NAP stipulates an annual CDM/JI purchase of 3.7 Mt CO2e, i.e. an amount of 18.5 Mt CO2e in 2008-2012. However, no concrete action has been taken so far.
Evaluation
Comparing the expected gap of 43.5 Mt CO2e in 2008-2012 with the anticipated purchase of 18.5 Mt CO2e, there is still a deficit of 25.0 Mt CO2e in the scenario with existing PAMs. Conversely, the sce-nario with additional PAMs projects an over-delivery of 44 Mt CO2e.
1.1.2.9 Italy
Description EU burden-sharing target 2008-2012
Projected gap (over-delivery (+) or shortfall (-))with exist-ing domestic PAMs
Projected gap (over-delivery (–) or shortfall (+))with additional PAMs
2010 2008-2012 2010 2008-2012
% Mt CO2e Mt CO2e Mt CO2e Mt CO2e - 6.5 -53 -265 -16.1 -80.5
Table 10: Source: EEA 2004: 125
Italy also intends to purchase CERs/ERUs as one means of reaching its target (Italy 2004: 5). An ear-lier draft of the NAP stipulated an annual amount of 57 Mt CO2e, i.e. 285 Mt CO2e in 2008-2012, to be purchased (Gilbert / Bode / Phylipsen 2004: 37).
So far, the Italian Ministry for the Environment and Territory entered into an agreement with the World Bank to create a fund to purchase greenhouse gas emission reductions: the Italian Carbon Fund (ICF). Italy invested USD 15 million in the ICF and additionally USD 7 million in World Bank’s Community Development Carbon Fund (CDCF).8 Assuming a price of EUR 5 (USD 1 = EUR 0.77 as of 07.02.2005) per certificate, these investments will translate into 5.7 Mt. CO2e.
8 Italian Carbon Fund: http://carbonfinance.org [17.02.2005] News and Events: Italy Brings the Community Development Carbon Fund Closer to Reality:
http://carbonfinance.org/cdcf/router.cfm?Page=NewsArchives [17.02.2005]
9
Evaluation
Comparing the projected gap of 53.0 Mt CO2e in 2010 / 265.0 Mt CO2e in 2008-2012 in the scenario with existing PAMs with the intended purchase of 285 Mt CO2e, an over-delivery of 20 Mt CO2e can be expected. Considering the scenario with additional PAMs yields an over-delivery of 204.5 Mt CO2e. However, Italy has so far secured only 2% of the intended purchase.
1.1.2.10 Luxembourg
Description EU burden-sharing target 2008-2012
Projected gap (over-delivery (+) or shortfall (-))with exist-ing domestic PAMs
Projected gap (over-delivery (+) or shortfall (-))with additional PAMs
2010 2008-2012 2010 2008-2012
% Mt CO2e Mt CO2e Mt CO2e Mt CO2e - 28 -0.7 -3.5 n.a. n.a.
Table 11: Emission Projections for Luxembourg, Source: EEA 2004: 126
Luxembourg also plans to purchase CDM/JI certificates in addition to domestic action (Luxemburg 2004: 15). As pointed out in its NAP, 3 Mt CO2e are supposed to be purchased in 2008-12. However, so far no concrete action has been taken.
Evaluation
Considering the projected gap in the scenario with existing measures and the target for CDM/JI, it can be expected that a small shortfall of 0.5 Mt CO2e will remain.
1.1.2.11 Netherlands
Description EU burden-sharing target 2008-2012
Projected gap (over-delivery (+) or shortfall (-)) with exist-ing domestic PAMs
Projected gap (over-delivery (+) or shortfall (-))with additional PAMs
2010 2008-2012 2010 2008-2012
% Mt CO2e Mt CO2e Mt CO2e Mt CO2e - 6 -19.7 -98.5 n.a. n.a.
Table 12: Emission Projections for the Netherlands, Source: EEA 2004: 128
The Dutch NAP envisages an annual purchase of 20 Mt CO2e of CERs/ERUs in 2008-2012 (The Netherlands 2004: 15), i.e. 100 Mt CO2e in total.
In the Netherlands, the Ministry of Economic Affairs is responsible for the implementation of the flexible Kyoto mechanisms. The Ministry of Economic Affairs has contracted SenterNovem, a gov-ernmental agency, to purchase Emission Reductions through two public procurement procedures called CERUPT (Certified Emission Reduction Units Procurement Tender) targeting CDM projects and ERUPT (Emission Reduction Units Procurement Tender) targeting JI projects. In October 2004,

10
the fifth end last round of ERUPT closed. In total, the portfolio of SenterNovem holds 24 JI and CDM projects with a total contracted volume of more than 14 Mt CO2e.9
Apart from own tenders, the Netherlands also invest in carbon funds of the World Bank (The Nether-lands 2004: 16). In 2002, the Netherlands CDM Facility was launched. The Facility’s initial target was to purchase 16.0 Mt CO2e during the first two years of the agreement. The agreement has now been extended, with a firm commitment to purchase an additional 5 Mt CO2e by mid-2005. The agreement also allows for a further purchase of up to approximately 11 Mt CO2e.10 In total, this sums up to a pur-chase target of 32 Mt CO2e. Additionally, the Netherlands invested USD 10 million (≈ 2.0 Mt CO2e) in the Prototype Carbon Fund (PCF) and contracted 4.0 Mt CO2e with the Community Development Carbon Fund (CDCF).
Furthermore, the Netherlands agreed to purchase certificates with several financial institutions (The Netherlands 2004: 16). This includes agreements with the International Finance Corporation (IFC), where the Netherlands has allocated EUR 44 million and agreed a target of 10 Mt CO2e, the Andean Development Corporation (CAF) with a target of up to 10 Mt CO2e, the International Bank for Recon-struction and Development (IBRD) with a budget of EUR 70 million (≈ 14 Mt CO2e), the European Bank for Reconstruction and Development (EBRD) with a budget of EUR 32 million (≈ 6.4 Mt CO2e), and the Rabobank with a contract of 10 Mt CO2e.
Evaluation
Due to the number of agreements and differences in content it is not easy to accurately estimate the amounts already contracted. However, regarding the detailed table of contracts and plans included in the NAP (The Netherlands 2004: 16) and an approximate translation of budgets into certificates, the intended purchase of 100 Mt CO2e seems to be reachable. Summing up all contracts and agreements, the anticipated purchase actually totals approximately 104.4 Mt CO2e. Since the projected shortfall in the period 2008-2012 amounts to 98.5 Mt CO2e in the scenario with existing domestic PAMs, the Netherlands should be able to reach their Kyoto target.
1.1.2.12 Portugal
Description EU burden-sharing target 2008-2012
Projected gap (over-delivery (+) or shortfall (-)) with exist-ing domestic PAMs
Projected gap (over-delivery (+) or shortfall (-))with additional PAMs
2010 2008-2012 2010 2008-2012
% Mt CO2e Mt CO2e Mt CO2e Mt CO2e + 27 -17 -85 -12.2 -61
Table 13: Emission Projections for Portugal, Source: EEA 2004: 130
Portugal also plans to include the purchase of CERs/ERUs into its efforts to meet its target. According to the NAP, up to 5.1 Mt CO2e of CERs/ERUs should be purchased annually in 2008-2012, i.e. a total of 25.5 Mt CO2e. This number was derived from an assumed deficit of 5.1 Mt CO2e in 2010 (Portugal
9 SenterNovem – CarbonCredits.nl: http://www.senternovem.nl/Carboncredits/index.asp [15.02.2005]. 10 Carbon Finance at the World Bank: Netherlands Clean Development Facility: http://carbonfinance.org/NetherlandsClean.htm [15.02.2005].
11
2004: 11) that is supposed to be offset by the flexible mechanisms, the EU ETS and, possibly, by new national policies and measures. However, no concrete action regarding the project-based mechanisms can be identified so far.
Evaluation
It is questionable whether the projected deficit of 5.1 Mt CO2e assumed in the NAP is still valid as the latest projections of the European Environment Agency show a much higher deficit. Comparing this projected shortfall of 85.0 Mt CO2e in 2008-2012 in the scenario with existing PAMs with the pur-chase target of 25.5 Mt CO2e, a deficit of 59.5 Mt CO2e remains. The scenario with additional PAMs also shows a shortfall, which amounts to 35.5 Mt CO2e.
1.1.2.13 Spain
Description EU burden-sharing target 2008-2012
Projected gap (over-delivery (+) or shortfall (-)) with exist-ing domestic PAMs
Projected gap (over-delivery (+) or shortfall (-)) with additional PAMs
2010 2008-2012 2010 2008-2012
% Mt CO2e Mt CO2e Mt CO2e Mt CO2e + 15 -68.9 -344.5 -26.9 -134.5
Table 14: Emission Projections for Spain, Source: EEA 2004: 132
Spain also included the use of the flexible mechanisms into its climate strategy. According to the NAP, an amount equal to 7% of 1990 emissions, i.e. 100 Mt CO2e, should be purchased for the period 2008-2012 (Spain 2004: 24ff.). Recently, Spain started negotiations to create a Spanish Carbon Fund to be managed by the World Bank. This fund is supposed to cover 40% of the total planned purchase of CERs/ERUs. The capital investment amounts to EUR 170 million with the intention to purchase 34.0 Mt CO2e at a maximum price of EUR 5 per tonne. Additionally, the fund will participate in the World Bank’s CDCF to obtain 4.0 Mt CO2e for EUR 20 million, as well as in the Bio Carbon Fund to obtain 2.0 Mt CO2e for EUR 10 million. Another 2.5% of the planned purchase will be covered by the Car-bon Finance Asset program.11
Evaluation
Regarding the estimated shortfall of 68.9 Mt CO2e in 2010, i.e. 344.5 for 2008-2012, in the scenario with existing PAMs, and an intended purchase of 100 Mt CO2e, a gap of 244.5 Mt CO2e remains. The scenario with additional PAMs still indicates a deficit of 34.5 Mt CO2e.
11 Ana Gutierrez Dewar: 02.12.2004 World Bank to manage €200 million Spanish Carbon Fund:
http://www.pointcarbon.com/article.php?articleID=5514 [16.02.2005].

12
1.1.2.14 Sweden
Description EU burden-sharing target 2008-2012
Projected gap (over-delivery (+) or shortfall (-)) with exist-ing domestic PAMs
Projected gap (over-delivery (+) or shortfall (-)) with additional PAMs
2010 2008-2012 2010 2008-2012
% Mt CO2e Mt CO2e Mt CO2e Mt CO2e + 4 +3 +15 n.a. n.a.
Table 15: Emission Projections for Sweden, Source: EEA 2004: 143
Sweden also intends to purchase CERs/ERUs (Sweden 2004: 11f.). Although no data or purchase plan regarding the flexible mechanisms is discussed in the NAP, a CDM and JI programme has already been launched. The CDM and JI tenders under the Swedish International Climate-Investment Program (SICLIP-CDM and SICLIP-JI) are operated by the Swedish Energy Agency (STEM) under a mandate from the Swedish Ministry of Industry. The budget for 2005 amounts to EUR 2.2 million for 2005; the same amount is expected for 2006 and 2007. Assuming a price of EUR 5 per certificate, the invest-ments in these three years will translate into approximately 1.32 Mt CO2e. Additionally, Sweden in-vested USD 10 million in the PCF and EUR 4 million in the BASREC’s TGF, which translates into about 2.8 Mt CO2e.12
Evaluation
Considering the estimated surplus of 15 Mt CO2e in the scenario with existing policies and measures and the intended purchase of 4.12 Mt CO2e leads to a surplus of 19.12 Mt CO2e.
1.1.2.15 United Kingdom
Evaluation
EU burden-sharing target 2008-2012
Projected gap (over-delivery (+) or shortfall (-)) with exist-ing domestic PAMs
Projected gap (over-delivery (+) or shortfall (-)) with additional PAMs
2010 2008-2012 2010 2008-2012
% Mt CO2e Mt CO2e Mt CO2e Mt CO2e - 12.5 +10.7 +53.5 +74.3 +371.5
Table 16: Emission Projections for the United Kingdom, Source: EEA 2004: 136
Evaluation
As projections show that the reduction target can be reached by domestic measures in the UK, there is no intention to include the flexible mechanisms into the climate strategy. Considering the projections, a surplus of 53.5 Mt CO2e in the period of 2008-2012 can be expected according to the scenario with existing PAMs and of 371.5 Mt CO2e in the scenario with additional PAMs.
12 SICLIP – Swedish International Climate Investment Programme:
http://www.stem.se/WEB/STEMEx01Eng.nsf/F_PreGen01?ReadForm&MenuSelect=1CD39988A74C248BC1256E78002E5CDD&WT=International%20#Climate%20Investments.SICLIP [17.02.2005].

13
1.1.3 Overall EU-15 Demand
The following table gives an overview of the officially stated purchase targets as opposed to the activ-ity that has actually taken place so far. Evidently, the programmes that have already been initiated do not cover even half of the officially stated purchase targets. One also has to take into account that sev-eral countries still show a significant compliance gap even if the intended purchases were carried out, as outlined in the tables further below. These countries would therefore have to take additional domes-tic measures or increase their purchase targets.
However, there is a limit to the amounts the EU Member States can purchase if they want to remain true to the supplementarity principle they championed during the negotiations at the UN level, i.e. the principle that domestic action should constitute at least half of the effort made by a country to meet its Kyoto target. The general principle is contained in both the Kyoto Protocol and in the Marrakesh Ac-cords, but despite the efforts by the EU neither document contains a concrete numerical definition. As outlined in Paper 2, the principle was reaffirmed in the Linking Directive, but it leaves it up to the individual Member States to decide the concrete definition. These will have to elaborate it in their NAPs for the trading period 2008-2012. This definition will have to cover both direct government procurement as well as the extent up to which companies covered by the EU ETS may use CERs/ERUs to comply with their commitments.
Country Purchase target for 2008-
2012 as stated in NAP Covered by existing national CDM/JI-purchasing activities for 2008-2012
Mt CO2e Mt CO2e
Austria 3-5 in 20 05-2007
35
Belgium 19.8 36.23 Denmark 18.7 6 Finland No quantification 3 France 0 0 Germany 0 2.6 Greece No quantification 0 Ireland 18.5 0 Italy 285 5.7 Luxembourg 3 0 Netherlands 100 104.4 Portugal Up to 25.5 0 Spain 100 40 Sweden No quantification 4.12 UK 0 0 Total EU-15 566.0-568.0 234.63
Table 17: Overview of Stated Purchase Plans
To get a workable figure, this paper adopts the formulation of the supplementarity requirement as sug-gested by the EU during the UN negotiations. The EU formulation was far from precise, but in essence it stated that each party should acquire and surrender no more emission certificates than the equivalent

14
of 50% of the difference between five times the emissions in one of the years between 1994 and 2002, on the one hand, and its number of Assigned Amount Units (AAUs), on the other (EU 1999). Based on this formula, Langrock and Sterk (2004: 14) calculated a supplementarity cap for each EU Member State as well as for the EU-15 as a whole. This is merely a hypothetical value but the only one avail-able until the NAPs have been elaborated.
Table 18 shows the projected emissions for the first commitment period based on existing policies and measures, the supplementarity caps as calculated by Langrock and Sterk as well as the purchase tar-gets that have been announced by governments so far. It becomes apparent that among the countries showing a compliance gap, Germany is the only one which could close this gap completely through the purchase of certificates, if the supplementarity principle is to be upheld. The projected deficits of the other countries are all in excess of the supplementarity cap. If supplementarity is to be maintained, these countries could therefore not buy their way out of non-compliance but would have to take mean-ingful further action to reduce emissions domestically.
It also becomes apparent that the purchases intended by the governments of Italy, Luxembourg, the Netherlands and Portugal are in conflict with the supplementarity requirement. This situation is further exacerbated by the fact that the companies covered by the EU ETS will also purchase CERs and ERUs for complying with their commitments. These purchases will be in addition to those made by the na-tional governments. If the supplementarity principle is to be upheld, Italy, Luxembourg, the Nether-lands and Portugal will therefore have to lower their purchase targets and instead implement domestic measures to achieve the corresponding amount of emission reductions.
Country Projected gap (over-delivery
(+) or shortfall (-)) for 2008-2012 based on existing do-mestic policies and measures
Supplementarity Cap
(Source: Langrock / Sterk 2004: 14)
To be covered by CDM/JI in 2008-2012
Remaining Gap in 2008-2012
Mt CO2e Mt CO2e Mt CO2e Mt CO2e
Austria -84.5 44.3 35.0 -49.5 Belgium -98.5 58.9 36.23 -62.27 Denmark -126.5 89.6 18.7 -107.8 Finland -63.5 12.2 3.0 -60.5 France -246.5 59.2 0 -246.5 Germany -77.0 292.8 2.6 -74.4 Greece -74.0 -4.31) 0 -74.0 Ireland -43.5 24.1 18.5 -25.0 Italy -265.0 176.6 285 +20.0 Luxembourg -3.5 1.4 3.0 -0.5 Netherlands -98.5 86.1 100.0 +1.5 Portugal -85.0 14.5 25.5 -59.5 Spain -344.5 134.4 100.0 -244.5 Sweden +15.0 7.3 4.12 +19.12 United Kingdom +53.5 138.2 0 +53.5 Total EU-15 -1542 1135.5 631.65 -910.35 1) The negative figure for Greece is due to the formula proposed by the EU, which was not yet sufficiently elaborated.
Table 18: Projected deficit / surplus in 2008-2012 based on existing policies and measures with considera-tion of the supplementarity requirement
15
Table 19 details the situation for the countries where scenarios including additional domestic policies and measures are available. In this case the remaining deficits would stay below the supplementarity cap for all countries, except for Portugal and Spain. Actually, most countries would achieve a massive surplus when adding the announced purchase targets to the projected domestic emission reductions.
However, there are several caveats. First, it should be noted that we have not critically examined the emission reductions projected in the scenarios with additional policies and measures. Governments may be overestimating the climate benefit these policies and measures could achieve. Second, is un-clear to what extent it will be politically feasible to implement these policies and measures. The debate about the EU ETS, which will probably deliver far fewer emission reductions than initially expected, serves as a pertinent example. Third, given these political difficulties it can be assumed that govern-ments will not aim for the overcompliance emerging from Table 19 but only effect additional domestic measures and purchases up to the level required for compliance with Kyoto.
Country Projected gap (over-
delivery (+) or shortfall (-)) for 2008-2012 based on additional domestic PAMs
Supplementarity Cap (Source: Lan-grock / Sterk 2004: 14)
To be covered by CDM/JI in 2008-2012
Remaining Gap in 2008-2012
Mt CO2e Mt CO2e Mt CO2e Mt CO2e
Austria -15.0 44.3 35.0 +20.0 Belgium -29.5 58.9 36.23 +6.73 Finland +2.0 12.2 3.0 +5.0 France +45.0 59.2 0 +45.0 Greece +14.5 -4.31) 0 +14.5 Ireland +25.5 24.1 18.5 +44.0 Italy -80.5 176.6 285 +204.5 Portugal -61.0 14.5 25.5 -35.5 Spain -134.5 134.4 100.0 -34.5 United Kingdom +371.5 138.2 0 +371.5 Total EU-15 138 527.2 482.83 +641.23 1) The negative figure for Greece is due to the formula proposed by the EU, which was not yet sufficiently elaborated.
Table 19: Projected deficit / surplus in 2008-2012 based on additional policies and measures with consid-eration of the supplementarity requirement
Three archetypical policy scenarios for potential EU demand representing a lower, a medium and a higher estimate seem plausible:
Scenario 1: Meaningful Domestic Action
The EU-15 Member States take meaningful domestic action as indicated in the scenarios with addi-tional policies and measures. In this case the deficits and surpluses of the individual countries will probably balance each other out, i.e. the EU 15 as a whole would be in compliance with its joint com-mitment in accordance with Art. 4 of the Kyoto Protocol. However, the question is whether the coun-tries with surpluses (projected for Finland, France, Greece, Ireland, Sweden and the United Kingdom) would indeed be willing to yield these surpluses to cover the deficits of the other countries. One can rather expect that the countries with surpluses would prefer to bank them; at a minimum the countries

16
with deficits would probably have to buy them. We therefore disregard the surpluses of individual countries and assume that the potential EU 15 demand in the scenario with additional policies and measures is equal to the combined deficits of Austria, Belgium, Italy, Portugal and Spain, i.e. 320.5 Mt CO2e for the whole commitment period and 64.1 Mt CO2e per year. One has to note that this figure would probably be higher if figures were available for all countries.
Scenario 2: Maintaining Supplementarity
The EU-15 Member States take domestic action to ensure that they stay within their supplementarity caps but purchase certificates up to this limit. Based on the supplementarity formula proposed by the EU at the UN negotiations this would amount to a demand of about 1,135.5 Mt CO2e for the whole commitment period.
However, 292.8 Mt CO2e relate to Germany which has announced that it does not intend to establish a procurement programme. Another 138.2 Mt CO2e relate to the United Kingdom, but according to their projections they have even less need to resort to the Kyoto mechanisms. This leaves about 700 Mt CO2e.
On the other hand, the companies in these countries which fall under the EU ETS will certainly cover part of their commitments via CERs and ERUs, which will in turn be used by their governments for their Kyoto compliance. In the first commitment period, Germany allocated roughly 500 Mt CO2 per year and the UK 240 Mt CO2 to their companies (Germany 2004; UK 2004). Assuming that the alloca-tion for the second trading period will be in the same range and that companies’ use of CERs/ERUs will be capped at 6% of this amount as proposed in the first version of the Linking Directive (see Pa-per 2), the companies from these two countries could utilise a maximum of about 45 million CERs/ERUs per year, i.e. 225 million for the whole commitment period. For the other countries we assume that governments will cap their companies’ use of CDM/JI such that the total purchases will stay within the supplementarity cap. We therefore estimate a potential demand of about 925 Mt CO2e for the whole commitment period, i.e. 185 Mt CO2e per year, for this scenario.
Scenario 3: No Additional Domestic Action
The EU-15 takes no additional domestic action but covers its deficits via purchases. Assuming that the countries with surpluses will not yield them to cover the deficits of other countries, projected EU de-mand would be 1,610.5 Mt CO2e for the whole commitment period, i.e. 322.1 Mt CO2e per year.
As outlined in Table 17, the actual demand from the governmental procurement programmes that have been established so far amounts to 234.63 Mt CO2e.
1.2 Demand from Non-EU Annex B Buyer Countries
1.2.1 Overview Table 20 details the projected compliance gaps of the Non-EU Annex B buyer countries as outlined in their National Communications (NCs). Evidently, all of these countries face a serious compliance gap in the scenario with existing policies and measures. Even the optimistic forecast in the scenario with

17
additional measures amounts to about two thirds of the most pessimistic forecast for the EU-15. The total deficit projected for these countries in the with existing policies and measures scenarios is one third above the deficit projected for the EU-15 in this scenario.
Projected gap (over-delivery (–) or shortfall
(+)) with existing PAMs Projected gap (over-delivery (–) or shortfall (+)) with additional PAMs
2010 2008-2012 2010 2008-2012
Canada -238.0 -1,190.0 -159.0 -795.0 Iceland -0.2 -1 +0.3 +1.5 Japan -162.0 -810.0 -18.0 -90.0 New Zealand -15.0 -75.0 +-0 +-0 Norway -10.7 -53.5 -5.4 -27.0 Switzerland -0.4 -2.0 +2.6 +13.0 Total -426.3 -2,131.5 -179.5 -897.5
Table 20: Demand from Non-EU Annex B buyer countries, Source: Compilation from National Communica-tions
Given their emission volumes, especially Canada and Japan warrant a more detailed analysis. The below gives an overview of the situation in Canada whereas the Japanese situation is extensively dealt with in Paper 1.
1.2.2 Canada
Description Kyoto target 2008-2012
Projected gap (over-delivery (–) or shortfall (+)) with existing domestic PAMs
Projected gap (over-delivery (–) or shortfall (+)) with additional PAMs
2010 2008-2012 2010 2008-2012
% Mt CO2e Mt CO2e Mt CO2e Mt CO2e - 6 -238,0 -1190,0 -159,0 -795,0
Table 21: Emission Projections for Canada, Sources: Canada 2001, UNFCCC 2003
In its third National Communication (NC3), Canada estimated its 2010 emissions to be 770 Mt CO2e under the business-as-usual GHG emissions projection (Canada 2001: 59). This was corrected upward to 809 Mt CO2e by the in-depth review of the UNFCCC (UNFCCC 2003: 22). The Kyoto target is 571 Mt CO2e. Considering the corrected numbers, this leaves a shortfall of 238 Mt CO2e. Despite the ur-gency that these numbers elicit, the Canadian government has not laid out specific plans to overcome the Kyoto gap. The Action Plan 2000 has indicated the intended purchase of certificates totalling 20 Mt CO2e from JI and CDM, which will hardly close Canada’s emission gap. The UNFCCC review team believed that the reduction assumptions for the Action Plan 2000 in general were too optimistic (UNFCCC 2003: 18). In the NC3 scenario with additional measures, Canada plans to purchase certifi-cates in the emission trading market with a heavy emphasis on “hot air” worth up to 75 Mt CO2e

18
(UNFCCC 2003: 23). Canada established a Clean Development Mechanism and Joint Implementation (CDM & JI) Office in 1998 but its activity has been rather insignificant.13
Evaluation
Canada faces an immense task to reach its Kyoto target and will most certainly be a buyer in the emis-sion certificate market. Bringing down emissions by domestic policies and measures would be an enormous task. In NC3, Canada estimates to buy certificates totalling between 20 and 75 Mt CO2e (UNFCCC 2003). It is very likely that this figure will end up being much higher.
1.3 Overall Demand
Table 22 summarises the emission deficits established in this paper. The potential demand from the Annex B buyer countries ranges from 286.1 to 789.9 Mt CO2e. The question is to what extent avail-able supply will be able to cover this projected demand.
Deficits in 2010 (Mt CO2e) With existing PAMs With additional PAMs EU Supplementarity
EU-15 322,1 64.1 185 Other Annex B buyer countries 426.3 179.5 Total 748.4 243.6
Table 22: Summary of lower and upper estimates of total emission deficits in Annex B buyer countries
2 Supply
2.1 Supply Sources
The potential supply of from the Kyoto Mechanisms can be broken down into four source categories, each of which will be discussed in turn: • JI supply from the new EU Member States and the EU Accession Countries • AAU supply from the EU Accession Countries under Art. 17 of the Kyoto Protocol • JI and AAU supply from Russia and the Ukraine • CDM supply
13 Canada’s Clean Development Mechanism & Joint Implementation Office: http://www.dfait-maeci.gc.ca/cdm-ji/ [16.02.2005].

19
2.2 JI Supply from the New EU Member States and the EU Ac-cession Countries
As pointed out in Paper 2, potentials for reducing greenhouse gas emissions in Central and Eastern European countries are substantial. However, the interplay of the introduction of the EU ETS in the new EU Member States and the EU Accession Countries and the baseline and double counting provi-sions of the Linking Directive significantly reduces this potential.
Of the reduction potentials that are in principle suitable for JI and have been quantified in the literature surveyed in Paper 2, about 60 Mt CO2e do not seem to be affected by EU Accession. They chiefly relate to renovating buildings and district heating systems as well as afforestation. Adding measures featuring indirect linkage with the EU ETS, which are mainly renewable energy projects, raises the potential to about 130 Mt CO2e.
Conversely, 100 Mt CO2e of the quantified potential now fall directly under the EU ETS. JI projects in these areas are in theory still possible but are now in direct competition with financing emission reduc-tions via the EU ETS. Moreover, some host countries have indicated that they are not favourable to-wards these kinds of projects.
One has to note that the figures in the documents surveyed for Paper 2 usually only refer to technical potentials, but it is not clear to what extent these are feasible. This is especially true for renewable energy projects. On the other hand, many possible reduction measures were not quantified at all in the documents surveyed. The above figures are therefore only of a limited value.
Another issue is that the eligibility of a country to participate in any of the Kyoto mechanisms is “de-pendent on its compliance with methodological and reporting requirements under Article 5, paragraph 1 and 2, and Article 7, paragraphs 1 and 4, of the Kyoto Protocol.”14 If the Central and Eastern Euro-pean countries met these requirements they would qualify for the JI 1st track, which essentially leaves the whole project procedure to the discretion of the host country. Otherwise projects would have to be carried out according to the 2nd track which will entail an international procedure under the yet to be established JI Supervisory Committee and will thus be more cumbersome.15 Since the details for both tracks are still to be worked out, it is at the moment not possible to estimate the transaction costs JI will entail and to what extent they will further reduce the market potential.
2.3 AAU Supply from the New EU Member States and the EU Ac-cession Countries
During their transition to a market economy, the gross domestic product (GDP) in Central and Eastern European countries sharply declined, which in most countries was accompanied by a significant drop in GHG emissions. Table 23 provides data regarding the Kyoto targets, the historic emission surpluses, as well as the projected surpluses during the first commitment period. Unless otherwise stated, all fig-
14 Paragraph 5 of Draft decision -/CMP.1 (Mechanisms), Principles, nature and scope of the mechanisms pursuant to Articles 6, 12 and 17 of
the Kyoto Protocol. 15 Annex of Decision 16/CP.7, Guidelines for the implementation of Article 6 of the Kyoto Protocol.

20
ures were drawn from the Third National Communications (NCs) of each country and are expressed in Mt CO2e.
Among the non-EU Accession Central and Eastern European countries, only Croatia, the Russian Fed-eration and the Ukraine are Annex B Countries and could therefore be potential suppliers of AAUs. Croatia has yet to ratify the Kyoto Protocol and will therefore not be included in this paper. The situa-tion in the Ukraine and the Russian Federation will be discussed in the following section.
Although reliable data concerning projections for GHG emissions in 2010 is not available for all coun-tries, it seems safe to say that all new EU Member States and EU Accession Countries, except for Hungary and Slovenia, will not only meet their Kyoto commitments but will indeed be below, in some cases far below, their GHG emission target.
The accumulated surpluses of all countries amount to 151.6 Mt CO2e annually in the scenarios with existing measures, but one has to note that data is available for only nine countries. In the scenarios with additional measures, the total surplus amounts to 227.5 Mt CO2e, taking into consideration that data is available for only eight countries.
It has to be noted that the criteria for eligibility to participate in the Kyoto mechanisms mentioned in the preceding section also apply here. Moreover, the Modalities, rules and guidelines for emissions trading under Article 17 of the Kyoto Protocol list further eligibility requirements to transfer and / or acquire Kyoto Units. These relate especially to putting in place a national system for the estimation of anthropogenic emissions by sources and removals by sinks of GHGs, submitting an annual inventory of GHGs and supplying additional information on the assigned amount.16 It remains to be seen in how far the Central and Eastern European countries will be able to meet these requirements.
16 Paragraph 2 of the Annex to Decision 18/CP.7, Modalities, rules and guidelines for emissions trading under Article 17 of the Kyoto Proto-
col.

21
Bul-
garia Czech Repu-blic
Estonia Hunga-ry
Lat-via
Lithuania a)
Po-land
Romania b)
Slova-kia
Slove-nia
Base year 1998 1990 1990 Avg. 1985-1987
1990 1990 1988 1989 1990 1986
Base year emissions
157.1 186.3 37.2 101.6 31.1 51.1 460.0 286.1c) 72.5 20.2
Com-mitment
-8 -8 -8 -6 -8 -8 -6 -8 -8 -8
Assigned Amount
144.5 172.5 34.2 95.5 28.6 47.4 433.6 264.9c) 66.7 18.6
Historic emission surpluses
1991 41.3 16.0 3.8 13.7 6.2 n.a. 21.8 85.5 8.6 0.9
1992 53.4 31.1 15.1 22.5 10.6 n.a. 20.2 57.8 13.4 1.1
1993 54.3 37.2 23.4 22.6 14.3 n.a. 29.4 67.7 17.5 0.5
1994 64.5 42.9 20.3 24.4 15.7 n.a. 20.4 74.4 20.5 0.4
59.0 43.5 22.7 23.6 17.7 n.a. 42.7 52.5 18.8 -0.4
1996 62.4 36.1 23.4 22.4 18.4 n.a. 22.8 57.9 19.0 -1.2
1997 67.3 34.5 22.6 24.7 19.1 n.a. 33.1 63.7 19.0 n.a.
1998 75.7 41.5 24.2 17.9 19.0 23.9 56.7 85.7 21.1 n.a.
1999 79.4 48.6 25.6 15.0 19.7 n.a. n.a. n.a. 20.1 n.a.
2000 n.a. n.a. n.a. n.a. 20.1 n.a. n.a. n.a. n.a. n.a.
Projected surpluses in 2010
With measures
10.8 30.8 25.5 -4.8 15.8a) n.a. 39.4d) 17 15.3 -2.5
With additio-nal measures
19.0 37.3 28.1 -2.2 n.a. n.a. 61.6d) 55.8 20.7 -1.5
a) Source: EEA 2004 b) Source: Second National Communication c) Source: http://www.unfccc.int d) Figures only refer to energy-related emissions, Source: EEA 2004
n.a. – not available
Table 23: GHG emissions in EU Accession Countries, Source: Compilation from Third National Communi-cations
22
2.4 JI and AAU Supply from Russia and the Ukraine
The Russian Federation and the Ukraine are committed to stabilising their GHG emissions at the 1990 level. Like in most other Central and Eastern European countries, the GHG emissions from these two countries have declined sharply due to the economic collapse in the 1990s. Table 24 provides relevant data for the period from 1990 to 1999 for the Russian Federation and from 1990 to 1997 for the Ukraine.
The Russian Federation The Ukraine
1990 1999 1990 1997
GHG emissions (Mt CO2e)
3,048 1,877 932 336
GDP (in%) 100 64 100 42
GHG emissions per GDP (kg CO2e/$)
2.27 2.30 n.a. n.a.
Population (million) 148.29 146.31 60.99 51.69
Total Primary En-ergy Supply (TPES in Mtoe)
868 603 262 150
TPES by source Gas 42% Oil 30% Coal 21% Nuclear 4% Renewables 3%
Gas 52% Oil 21% Coal 18% Nuclear 5% Renewables 4%
Gas 36% Oil 24% Coal 32% Nuclear 8% Renewables 0%
Gas 44% Oil 12% Coal 29% Nuclear 14% Renewables 1%
Final Energy Con-sumption (Mtoe)
566 410 220 76.8
Table 24: General economic data for Russia and the Ukraine in the 90´s, Source: Russian Federation 2002; Ukraine 1998.
The following part provides details for the GHG emission reduction and JI potential, if available, by sector for each country individually.
2.4.1 Russian Federation
2.4.1.1 Emission projections The Russian Federation has so far submitted three National Communications, the most recent in No-vember 2002. GHG emission projections in NC3 are mainly based on one positive and one unfavour-able scenario. In detail, the assumptions for the period 2001 to 2020 are (Russian Federation 2002: 73): • Annual GDP growth of 5-5.2% in the positive scenario and 3.3 in the unfavourable scenario, • Decrease of energy intensity by 3.7% or by 2.5-2.6% annually, • Energy consumption grows by 1.5% or 0.7-0.8%.
23
Additionally, a third scenario is provided, estimating the GDP growth at 4,5% annually, the energy intensity decrease at 2.0% annually and the increase of final energy consumption at 2.5% annually (Russian Federation 2002: 73).
The Russian Federation states that a baseline or business-as-usual scenario would not make too much sense regarding the given conditions of the Russian Federation as a country in transition to a market economy, where naturally projections of economic growth are uncertain. (Russian Federation 2002: 71)
Explicit projections are only given for carbon dioxide in percentage of the 1990 level (Russian Federa-tion 2002: 73f): • The positive scenario sees CO2 emissions in 2008 at 78%, in 2010 at 80.4% and in 2012 at 82.8%
of the 1990 level. This indicates that for the whole commitment period there would be a surplus of at least 524.26 Mt CO2.
• The unfavourable scenario shows CO2 emissions in 2008 at 73.8%, in 2010 at 75.04% and in 2012 at 76.2% of the 1990 level, which equals a surplus of 725.42 Mt CO2.
• The additional scenario forecasts CO2 emissions in 2008 at 84.5%, in 2010 at 88.9% and in 2012 at 93.4% of the 1990 level, which would result in a minimum surplus of 201.16 Mt CO2.
2.4.1.2 Reduction Potential by Sector
2.4.1.2.1 Conventional Energy Supply and Industry
The Russian Federation has a high percentage of the world´s energy reserves on its territory (Russian Federation 2002: 25): • 12% of world oil reserves, • 34% of world natural gas reserves, • 20% of world hard coal reserves, • 32% of world brown coal reserves. The policy measures to reduce GHG emissions outlined in NC3 mainly focus on CO2 emissions from combusting fossil fuels (Russia 2002: 55). Here, two main programmes need to be mentioned: • The Basic Provision for the Energy Strategy for Russia for the period to 2020, • The Energy Efficient Economy. The general aims of these programmes are: • Efficient use of natural resources, • Increase of energy use efficiency, • Replacing GHG intensive energy production capacity with less GHG intensive capacity such as
renewable energies and nuclear power, • Structural optimisation of power generating facilities, • Decrease losses in energy transportation system. Divided by sector, the measures in the two programmes are supposed to eventually result in the fol-lowing reductions of energy consumption (Russian Federation 2002: 61f): • Energy intensive industries 1,465 – 1,583 PJ, • Agriculture: 176 – 205 PJ, • Rural Area: 1,114 PJ,

24
• Transport: 272 - 307 PJ, of which 147 PJ from railway transport, • Federal Institutions: 243PJ, • Energy branches: 1,2879PJ. Implementation would yield annual emission reductions of 330 Mt CO2e by 2010 (Russian Federation 2002: 61). The total investment needs for the programme until the year 2020 are estimated at 550-700 billion USD (UNFCCC 2004: 23).
There is also potential in CH4 mitigation from coal mining since 68% of CH4 emissions are related to fugitive emissions from coalmines. The government plans to switch from underground mining to open pit mining, which should include 75% of all mines in the future. A decrease of underground mining by 1% reduces methane emissions by 2.1%. Further potential lies in utilising the methane extracted by degassing and vent systems for energy purposes (Russia 2002: 65f).
Excursus: JI potential in the Russian gas industry
The Russian Federation, with proven gas reserves of 47 trillion m3, is the world’s largest pro-ducer (580 billion m3/a) of natural gas and the main natural gas supplier to the EU (115 billion m3/a) (BP 2004) The market leader Gazprom, which is partly state-owned, operates one of the largest long-distance gas networks in the world with about 153,000 km of gas mains that have been installed mainly during the 1970’s, 80’s and 1990’s.
Recent results on the volume of greenhouse gas emissions
Due to leakages and accidents but also during regular operation significant amounts of natural gas (consisting mainly of the potent greenhouse gas CH4) are released to the atmosphere at pro-duction and processing sites as well as during transport and distribution. Results of an intensive measurement campaign in Russia carried out in 2003 by the Wuppertal Institute and the Max Planck Institute indicate an overall loss during transport within Russia of 0.7% of gas delivered, with a range of 0.4-1.6% (Lelieveld et al. 2005; Lechtenböhmer et al. 2005). For gas spills at the wells (for which only little information is available) the same leakage as in the USA, i.e. about 30% of overall emissions, with a large uncertainty range of 0.2-1.0% was assumed (Lelieveld et al. 2005). In absolute terms this means that during production, processing and long distance transport of Russian natural gas between 3.5 and 15 billion m3 of natural gas are emitted to the atmosphere per year, representing an economic value of about 350 to 1,500 million EUR and greenhouse gas emissions ranging from 50 to 225 Mt CO2e.
Due to the high energy needs of the pipeline system the CO2 emissions from compressor drives amount to about 68 to 81 Mt CO2 annually (estimate based on Lechtenböhmer et al. 2005).
Estimates on JI Potential
In spite of improvements made by Gazprom in the past decade there are still great possibilities to reduce CH4 emissions from the Russian natural gas system. Robinson, Fernandez and Kantama-neni (2003) list quite a number of technical measures that could be implemented in Russia. The measures cover the production and the transportation segment of the natural gas industry and are derived from US experience with the extensive Natural Gas Star program. They include the in-stallation of flare systems and green completions at wells, replacement of high bleed pneumatics
25
with low bleed systems, introduction of directed inspection & maintenance at compressor sta-tions, retrofitting of fuel gas recovery for blowdown valves and composite wrap repairs for pipe-line tubes. Robinson, Fernandez and Kantamaneni estimate that more than 30 % of the CH4 emis-sions could be mitigated at costs below 10 US-$/t CO2e. Experiences of the Rusagas Carbon Off-set Project between TransCanada and Gazprom who carried out directed inspection & mainte-nance at two Russian compressor stations as a test for possible JI projects confirm the existence of significant and cost efficient CH4 mitigation potentials (Venugopal 2003).
Regarding the CO2 emissions from energy use Ruhrgas and Gazprom have carried out a JI pilot project where they attained 1.5 bln kWh reduction of gas consumption for turbines by computer-based load optimisation. They are currently planning to expand the project to the whole Gazprom system, with expected emission reductions of about 4.5 Mt of CO2.
Conclusion
There is significant potential to reduce greenhouse gas emissions in the Russian gas industry. Es-pecially for CH4 there are cost efficient mitigation options available that have not been fully im-plemented by Gazprom. A conservative estimate arrives at 15 Mt tons of CO2e annually that can be mitigated at costs below 10 US-$ per ton, most of it at even much lower prices. Drive energy reduction and the huge distribution system offer further large mitigation potentials.
These facts and the long-term need by Gazprom to secure funds for maintenance and re-investment of its huge operating system are probably the main reasons why Gazprom has been among the early supporters of the ratification of the Kyoto Protocol (cf. Grubb / Safonov 2003).
2.4.1.2.2 Renewable Energy
Concerning renewable energies, large hydro electricity production is supposed to increase from 175.1 TWh in 2001 to 181 TWh in 2010. Non-traditional renewables, i.e. biomass, wind, solar and geother-mal energy and small hydro, are also to be further developed. In total, renewables are supposed to contribute 3-5 Mtoe to energy supply in 2010 (Russian Federation 2002: 61).
2.4.1.2.3 District Heating and Residential Sector
NC3 gives little detail regarding the residential sector, only some information on energy efficiency plans up to 2005. Measures such as energy controls and regulating devices, efficient light bulbs, auto-mation of heating devices and replacement of boilers are supposed to have yielded emission reductions of 40 Mt CO2e per year (Russian Federation 2002: 63).
2.4.1.2.4 Transport
As for the transport sector, fuel consumption could be reduced by up to 40% by modernising the vehi-cle fleet, introducing modern oil additives and high-octane petrol (Russian Federation 2002: 65).
2.4.1.2.5 Waste Management
Concerning waste management, NC3 only refers to waste in the construction industry which is of little climate relevance (Russian Federation 2002: 70).

26
2.4.1.2.6 Overall JI Potential
It is not clear which part of the reduction potential mentioned could be tapped by JI. But given the financial and administrative difficulties of the Russian state it is unclear which part of the government programmes mentioned will actually be realised. Projects therefore stand a good chance of being addi-tional and the theoretical JI potential could range in the hundreds of Mt CO2e per year. Moreover, Russia is interested in early trading based on AAUs so that certificates could already be generated pre-2008 (World Bank 1999: 34).
2.4.2 The Ukraine
2.4.2.1 Emission projections The Ukraine handed in the first NC in 1998. In this NC, the Ukraine provided data according to a baseline scenario, an optimistic scenario and a pessimistic scenario. The underlying assumptions are not transparently presented for all parameters in NC1 but were further clarified by the UNFCCC in-depth review (Ukraine 1998: 1-5; UNFCCC 2000: 20f) : • GDP level compared to 1990: in 2005 –20.1%; in 2010 +14.2%; in 2015 +32%, • The GDP for the optimistic scenario in 2010 would be +24.7 and for the pessimistic scenario -9.1%
compared to the 1990 level, • The amount of fuel combustion is expected to remain below the 1990 level until 2015, • Population will start to increase in the new millennium and reach the 1990 level in 2015, after a
sharp decline at the beginning of the 1990´s, • Final energy consumption in 2015 would be 205 Mtoe according to the baseline scenario, 235 Mtoe
according to the optimistic scenario and 180 Mtoe according to the pessimistic scenario. In all scenarios GHG emissions are projected to remain below the 1990 level. In the baseline scenario 2015 emissions are about 15.7% below the 1990 level, in the pessimistic one 27% and in the optimis-tic scenario 10.7% (Ukraine 1998: 6-40 – 6-41). The main difference, besides economic growth, be-tween the pessimistic and the optimistic scenario is the volume of energy savings. In the optimistic scenario, energy savings are expected to be 10-12% higher than in the baseline scenario, whereas in the pessimistic scenario they are assumed to be 25-30% lower (Ukraine 1998: 1-5). Only the baseline scenario provides a figure for the year 2010, with GHG emissions being 18% lower than in 1990, which would mean a surplus of 168 Mt CO2e annually, i.e. 840 Mt CO2e for the whole commitment period (Ukraine 1998: 6-40).
However, all projections in these scenarios are based on the assumption of economic growth from 1995, whereas in fact the Ukrainian economy only started to grow from the year 2000 onwards. Due to this delay in economic growth the GHG emission figures mentioned above might also be reached five years later if the economy grows with the same velocity as predicted. So the actual emission surplus for the first commitment period is very likely to be higher than stated in NC1. The UNFCCC in-depth review also argued that the GDP estimates in the baseline scenario might be too high (UNFCCC 2000: 20). Indeed, the National Strategy for Joint Implementation and Emissions Trading expects an annual surplus of 300 Mt CO2e (Ukraine 2003: 13).

27
2.4.2.2 Reduction potential by Sector
2.4.2.2.1 Conventional Energy Supply and Industry
Since most of the energy and industrial infrastructure is rather deteriorated, there is great potential for energy efficiency. This sector is also considered to be the one where measures could be realised with least costs. Relatively straightforward energy efficiency measures alone could yield annual reductions of 27 Mt CO2e (Point Carbon/ Vertis 2003).
The total available reduction potential from energy efficiency measures is probably much higher. NC1 provides a list of 28 measures which would lead to annual GHG emission reductions of 377 Mt CO2e by 2015 (Ukraine 1998: 5-24 – 5-29). The implementation of these measures is estimated to require around 29-32 billion USD and therefore depends on acquiring the necessary funding (Ukraine 1998: 1-5).
2.4.2.2.2 Renewables
The Ukraine offers quite some potential regarding renewables, especially for biomass and wind energy. For the latter, the Ukraine aims to achieve an installed capacity of 200 MW by 2010 and has passed legislation on the purchase of electricity from renewables. Currently around 40 MW are being in-stalled. Although the biomass sector is rather negligible at the moment, it is supposed to contain a large potential for growth. Concrete figures on the related emission reduction potential, however, were not provided (Point Carbon/Vertis 2003).
The potential of hydropower on the other hand has already been developed to a large degree with an installed capacity of 4,700 MW (UNFCCC 2000: 11f)
2.4.2.2.3 District Heating and Residential Sector
There are thousands of boilers for central heat supply which could be upgraded to combined heat and power systems. Concrete figures regarding the emission reduction potential were not available (UNFCCC 2000: 12).
2.4.2.2.4 Waste Management
Waste is another sector with a large reduction potential. By the end of the last millennium over 90% of waste was deposited in about 700 landfills, none of which had a collection system for landfill gas. The rest of the waste was incinerated in 4 incineration plants. Large investments need to be undertaken since all equipment is rather obsolete. The Ukrainian goal in waste policy is an equal share of waste to be incinerated and waste to be disposed of in landfills by 2015 (UNFCCC 2000: 18).
2.4.2.2.5 Transport
Not many measures are mentioned in NC1 concerning the transport sector. GHG emission reductions are considered to be very costly in this sector. Since energy intensity in transport is expected to in-crease by 10-30% in the coming years, there seems to be a high theoretical potential for reducing emission. Possible measures include upgrading the electric vehicle fleet in public transport (UNFCCC 2000: 16).

28
2.4.2.3 Overall JI Potential The Ukraine has a high potential for further GHG emission reduction measures. Energy efficiency measures which are viable for JI could yield an annual 100 Mt CO2e. The total potential of all meas-ures which are viable for JI have been estimated at 150 Mt per year, i.e. 750 Mt CO2e for the whole commitment period.17
Since financing these measures seems to be a major problem, most of these projects would probably be additional. As a matter of fact, the UNFCCC review team noted in its report that most measures planned by the government could be postponed or even completely cancelled due to these financial problems (UNFCCC 2000: 22-24).
2.4.3 Overall Supply from Russia and the Ukraine Russia and the Ukraine dispose of vast emission surpluses; even at a conservative estimate the com-bined total easily exceeds 500 Mt CO2e per year. Moreover, emission reductions through JI could theoretically yield another 500 Mt CO2e. However, several caveats have to be mentioned.
First, both countries are not considered to be the best address concerning foreign direct investment. A good business environment depends, inter alia, on the integrity of public and private agents, the ab-sence of crime and corruption, political and economic stability, as well as an effective infrastructure and a well-functioning financial sector. Russia and the Ukraine, however, feature for instance a weak judiciary which can render foreign companies unable to enforce contracts, corruption which often reaches to the highest levels of government and a poorly developed capital market offering only lim-ited access to finance (Point Carbon/Vertis 2003; Fankhauser/Lavric 2003: 15-17).
Secondly, the necessary institutional infrastructure for the implementation of JI projects is also sorely lacking. The Ukraine did not even host any projects during Activities Implemented Jointly (AIJ) pilot phase (Fankhauser/Lavric 2003: 12). The Russian Federation participated actively in the AIJ pilot phase and established the Interagency Commission of the Russian Federation on Climate Change Problems to facilitate projects (World Bank 1999: 40-42). But the JI infrastructure still leaves a lot to be desired (Point Carbon 2005: 4f).
Finally, Russia and the Ukraine will need to fulfill the eligibility criteria for participating in the Kyoto mechanism outlined in the previous sections. It remains to be seen in how far they will be able to do so.
Due to the generally poor investment climate and JI-specific institutional shortcomings, Point Carbon (2005: 7-9) estimates that the combined amount of ERUs from both countries will probably not exceed 30 million per year. They are also sceptical as to which part of their AAU surplus will actually reach the market. First, they will have to meet the eligibility criteria for participating in Art. 17 emissions trading. Even if they manage to qualify, Russia might limit sales to 2-3% of its surplus and the Ukraine to 30%. Given the estimates outlined above, this might mean an annual supply of about 100 million AAUs.
17 Ukraine (2005): Canada-Ukraine Environmental Cooperation Program, Joint Implementation Project Database: http://www.ji.org.ua/
[18.02.2005].

29
2.5 CDM Supply
2.5.1 Methodology The size of the CDM market depends on a number of factors. On the supply side these are: • implementation costs, • transaction costs, • baseline setting, • additionality criteria, • specific situation in the host country concerning investment climate and CDM infrastructure. On the demand side these are mainly: • the gap between Kyoto targets and actual GHG emissions in Annex B countries, • the amount of hot air supply, • the amount of ERU supply. Based on these factors, several studies have estimated the potential size of the CDM market. The esti-mates range from 67 to 723 Mt CO2e annually. (Criqui / Kitous 2003; Ellis / Corfee-Morlot / Winkler 2004; Haites 2004; Jotzo / Michaelowa 2002; Zhang 2000; Zhang 2003).
However, most studies used different parameters for their scenarios, for example, concerning inclusion of the USA, different regional splitting, different figures for the factors mentioned above or also inclu-sion of countries that have not yet ratified the Kyoto Protocol.
We therefore recalculated these studies according to the following parameters and took the average of the resulting figures.
For the expected compliance gaps or overcompliance of the individual countries, we took the figures established in this paper: • Given current emission trends in the Annex B buyer countries, we followed the scenarios with ex-
isting measures, which yield a potential annual demand from Annex B countries of 748.4 Mt CO2e. • Conversely, the 520.76 Mt CO2e of total emissions surpluses in the new EU Member States, Russia
and the Ukraine projected in the scenarios with existing measures are the result of a very pessimis-tic forecast, combining relatively high economic growth with very small improvements in energy efficiency. In fact, hot air supply should in theory be more than sufficient to fully cover any de-mand. However, as outlined above Russia and the Ukraine might in practice sell only a small part of their surplus on the market. Besides, the EU but also other countries might establish (unofficial) rules to cap or to totally ban the purchase of hot air (Laroui / Tellegen / Tourilova 2004: 905). We therefore disregarded the potential hot air supply for our calculation.
Moreover, we again assumed a market price of 5 EUR per certificate. Finally, we only included coun-tries that ratified the KP up to February 2005.
Recalculating the studies mentioned above according to these parameters, the average of the results from these recalculations is a total annual CDM supply of 423.85 Mt CO2e. The shares of this overall market potential for the different regions will be outlined in the following section.

30
2.5.2 CDM Potential by Region We divided the countries into regions mainly according to the continent they belong to but made one exception in the case of Asia, where we established three categories which are rather political than geographical: Middle East, Former Soviet Union and Asia. North and Central Amer-ica
Africa South-Pacific Asia
Antigua and Barbuda Benin Fiji Bangladesh Bahamas Botswana Marshall Islands Bhutan Belize Burundi Cook islands Cambodia Costa Rica Cameroon Kiribati China Cuba Djibouti Micronesia India Dominican Republic Equatorial Guinea Nauru Laos El Salvador Gambia Niue Malaysia Grenada Ghana Palau Maldives Guatemala Guinea Papua New Guinea Mongolia Honduras Lesotho Samoa Myanmar Jamaica Liberia Seychelles Philippines Nicaragua Madagascar Solomon Islands Republic of Korea Panama Malawi Tuvalu Sri Lanka Saint Lucia Mali Vanuatu Thailand Saint Vincent and the Grenadines
Mauritius Vietnam
Trinidad and Tobago Morocco Middle East
Mozambique Israel Former Soviet Union
South America Namibia Jordan Armenia
Argentina Niger Oman Azerbaijan Bolivia Nigeria Qatar Georgia Brazil Rwanda Saudi Arabia Kyrgyzstan Chile Senegal United Arabian Emirates Moldova Colombia South Africa Yemen Turkmenistan Ecuador Sudan Uzbekistan
Guyana Togo Europe Paraguay Tunisia Cyprus Peru Uganda Macedonia, FYR Uruguay Tanzania Malta
Table 25: Non-Annex B Countries having ratified the Kyoto Protocol by February 2005b, Source: http://unfccc.int/essential_background/kyoto_protocol/status_of_ratification/items/2613.php [17.02.2005]
31
2.5.2.1 Africa Recalculating the studies mentioned yields an annual potential of 36.2 Mt CO2e. Of these, South Af-rica is expected to supply the largest share of about 5.81 Mt CO2e (1.37% of global CDM supply), followed by Egypt with 2.54 Mt CO2e (0.6%).
However, this potential might fail to actually be realised due to institutional inadequacies. At the time of writing only six of the 29 countries listed above had officially notified a Designated National Au-thority (DNA) to the UNFCCC: Egypt, Madagascar, Mali, Mauritius, Morocco and Niger.18 One rea-son may be that 19 of these countries belong to the category of least developed countries as defined by the UN, as a result of which they may not dispose of the necessary technical and financial capacity.
2.5.2.2 Asia Asia hosts the three countries that are expected to supply the largest shares of the worldwide CDM market. • China with an estimated volume of 204.46Mt CO2e (48.24%), • India with an estimated volume of 52.09 MtCO2e (12.29%), • Indonesia with an estimated volume of 12.93 MtCO2e (3.05%). Other Asian countries are estimated to contribute 43.36 MtCO2e (10.23%) annually of the global CDM supply. Among these, the Republic of Korea is expected to gain a share of 4.83 Mt CO2e (1.14%).
All countries from this region except for Indonesia and Pakistan have already notified a DNA to the UNFCCC.19
2.5.2.3 South Pacific The countries in the South Pacific region are without exception rather small islands. Among these countries, only Fiji has so far established an official DNA. Specific studies on these countries are not available, and since they will most probably not supply large amounts of CERs, they will not be fur-ther analysed here.
2.5.2.4 Europe The Non-Annex B Parties in Europe are Cyprus, Malta and the Former Yugoslav Republic of Mace-donia. However, all are relatively small states. Recalculating the studies mentioned yields an estimated CDM potential of 2.25 Mt CO2e, equal to 0.53% of global supply.
2.5.2.5 Former Soviet Union (without Russia and Ukraine) What was written regarding Russia and the Ukraine regarding reduction potentials to a lesser extent also counts for these countries. Kazakhstan as the largest country has not yet ratified the Kyoto Proto-col.
18 CDM: Designated National Authorities (DNA): http://cdm.unfccc.int/DNA [17.02.2005]. 19 Ibid.

32
Recalculating the studies mentioned yields an estimated potential CDM supply of 15.81 Mt CO2e, equal to 3.73% of global CER supply. If Kazakhstan were to be included, the amount would rise up to around 17.58 Mt CO2e.
2.5.2.6 North and Central America With the notable exception of Mexico, which is in theory supposed to become the most important host country in North and Central America, this region has so far been quite active concerning the CDM. During the AIJ phase there have been numerous projects, mostly in Costa Rica, Honduras, Guatemala and Nicaragua. These countries also have a relatively high share of the CDM projects which are cur-rently being planned. This large share, however, refers to the absolute number of projects. The share expressed in reduction of GHGs is relatively small due to the rather small size of these countries (Ellis / Corfee-Morlot / Winkler 2004: 19-22; 40-45).
According to the recalculation of the studies mentioned, Mexico will supply 12.16 Mt CO2e, equal to 2.87% of global supply. The supply from the rest of the North and Central American countries amounts to 7.12 Mt CO2e, equal to 1.68%.
2.5.2.7 Middle East Until the end of 2004 only three countries from this region had ratified the Kyoto Protocol: Israel, Jordan and Yemen. Most recently another four countries also decided to ratify. Given this situation we estimate the potential from this region to be 15.43 Mt CO2e, equal to 3.64% of global supply.
2.5.2.8 South America Brazil is expected to supply the largest contribution from this region to the global CER supply, namely 8.82 Mt CO2e (2.08%)
As for the other countries, our recalculation puts their CER supply at 8.39 Mt CO2e, or 1.98% of global supply.
2.5.3 Overall CDM Supply Table 26 gives an overview of the findings, ranking the countries and regions in alphabetical order.
It bears noticing that at the time of writing only two CDM projects had been officially registered. The elaborate CDM project cycle could thus turn out to be a significant bottleneck factor, not only con-cerning the Executive Board but also concerning the establishment and functioning of the DNAs and the approval procedures in the parties involved. Many countries, especially host countries, still have to establish their national institutions and regulations. Lack of capacity might thus prove a serious obsta-cle to speedy project approval.
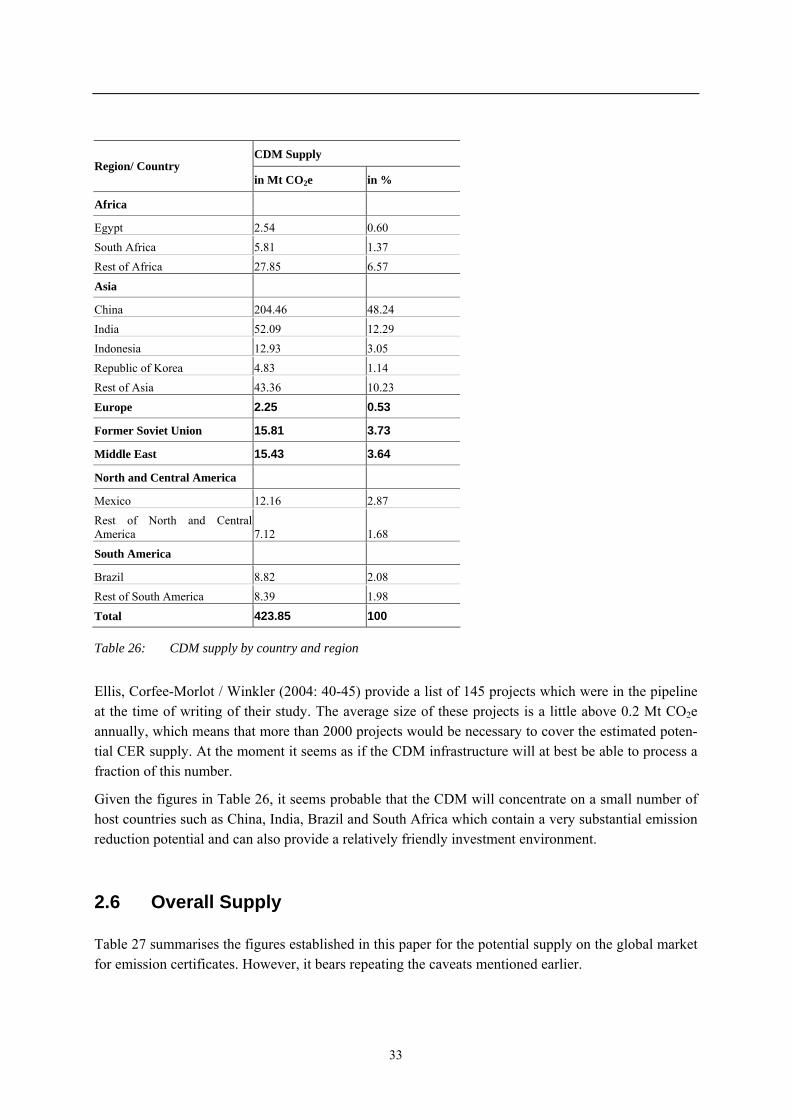
33
CDM Supply Region/ Country
in Mt CO2e in %
Africa
Egypt 2.54 0.60 South Africa 5.81 1.37 Rest of Africa 27.85 6.57
Asia
China 204.46 48.24 India 52.09 12.29 Indonesia 12.93 3.05 Republic of Korea 4.83 1.14 Rest of Asia 43.36 10.23
Europe 2.25 0.53
Former Soviet Union 15.81 3.73
Middle East 15.43 3.64
North and Central America
Mexico 12.16 2.87 Rest of North and Central America 7.12 1.68
South America
Brazil 8.82 2.08 Rest of South America 8.39 1.98
Total 423.85 100
Table 26: CDM supply by country and region
Ellis, Corfee-Morlot / Winkler (2004: 40-45) provide a list of 145 projects which were in the pipeline at the time of writing of their study. The average size of these projects is a little above 0.2 Mt CO2e annually, which means that more than 2000 projects would be necessary to cover the estimated poten-tial CER supply. At the moment it seems as if the CDM infrastructure will at best be able to process a fraction of this number.
Given the figures in Table 26, it seems probable that the CDM will concentrate on a small number of host countries such as China, India, Brazil and South Africa which contain a very substantial emission reduction potential and can also provide a relatively friendly investment environment.
2.6 Overall Supply
Table 27 summarises the figures established in this paper for the potential supply on the global market for emission certificates. However, it bears repeating the caveats mentioned earlier.

34
As already pointed out, the estimates for the emission surpluses in the Central and Eastern European Countries vary widely. Moreover, it is unclear whether these countries will meet the eligibility criteria for participating in Art. 17 emissions trading, especially in the cases of Russia and the Ukraine. Even if they did, they may decide to bank the major part of their surpluses for the second commitment pe-riod.
JI supply from the new EU Member States and EU Accession countries is also a rather hypothetical figure since the literature surveyed for Paper 2 was very vague on concrete figures. The theoretical JI potential in Russia and the Ukraine is massive, but in practice it is severely curtailed by the unfavour-able business environment.
The same probably also holds for the CDM. In all likelihood the theoretical potential of 423.85 Mt CO2e we established in this paper will only be partially realised due to insufficient capacity at the na-tional level as well as at the CDM Executive Board.
Annual Supply (Mt CO2e) Lower Estimate Upper Estimate
Hot Air from New EU Member States and EU Accession Countries
151.6 227.5
Hot Air from Russia 201.16 725.42 Hot Air from the Ukraine 168 300 JI in the New EU Member States and EU Accession Countries
n.a. 130
JI in Russia and the Ukraine 30 500 CDM n.a. 423.85 Total 550.76 2306.77
Table 27: Summary of supply estimates
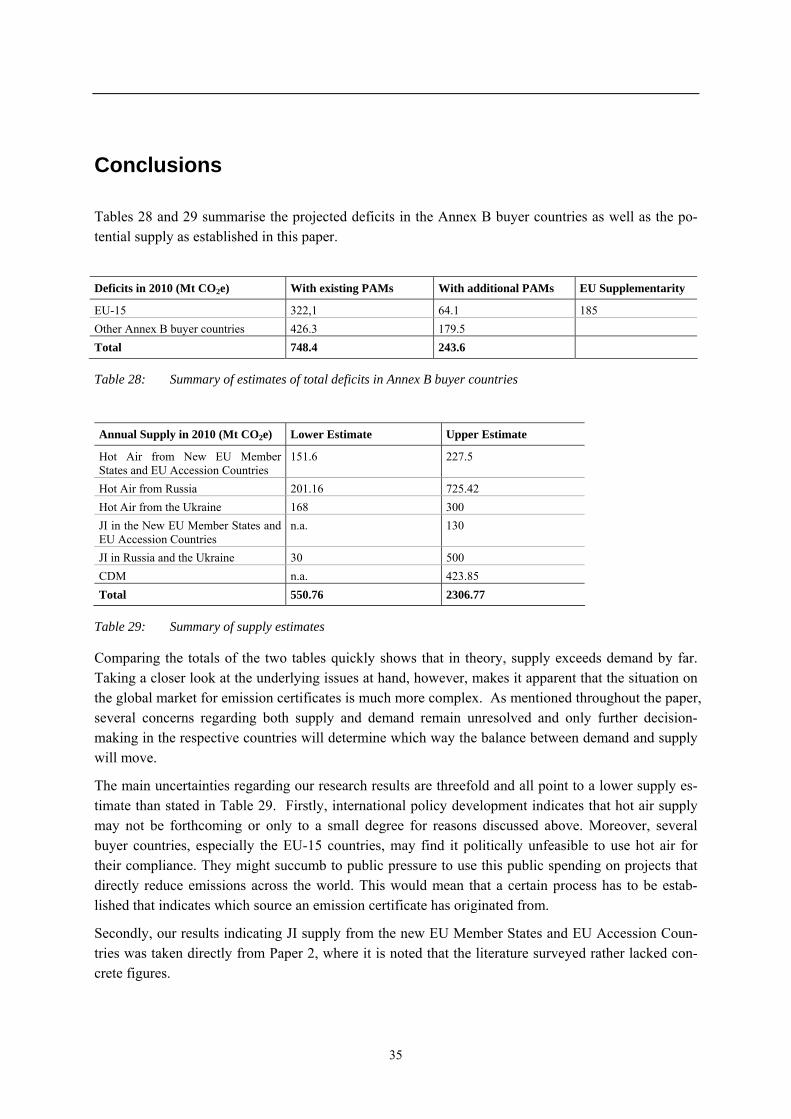
35
Conclusions
Tables 28 and 29 summarise the projected deficits in the Annex B buyer countries as well as the po-tential supply as established in this paper.
Deficits in 2010 (Mt CO2e) With existing PAMs With additional PAMs EU Supplementarity
EU-15 322,1 64.1 185 Other Annex B buyer countries 426.3 179.5 Total 748.4 243.6
Table 28: Summary of estimates of total deficits in Annex B buyer countries
Annual Supply in 2010 (Mt CO2e) Lower Estimate Upper Estimate
Hot Air from New EU Member States and EU Accession Countries
151.6 227.5
Hot Air from Russia 201.16 725.42 Hot Air from the Ukraine 168 300 JI in the New EU Member States and EU Accession Countries
n.a. 130
JI in Russia and the Ukraine 30 500 CDM n.a. 423.85 Total 550.76 2306.77
Table 29: Summary of supply estimates
Comparing the totals of the two tables quickly shows that in theory, supply exceeds demand by far. Taking a closer look at the underlying issues at hand, however, makes it apparent that the situation on the global market for emission certificates is much more complex. As mentioned throughout the paper, several concerns regarding both supply and demand remain unresolved and only further decision-making in the respective countries will determine which way the balance between demand and supply will move.
The main uncertainties regarding our research results are threefold and all point to a lower supply es-timate than stated in Table 29. Firstly, international policy development indicates that hot air supply may not be forthcoming or only to a small degree for reasons discussed above. Moreover, several buyer countries, especially the EU-15 countries, may find it politically unfeasible to use hot air for their compliance. They might succumb to public pressure to use this public spending on projects that directly reduce emissions across the world. This would mean that a certain process has to be estab-lished that indicates which source an emission certificate has originated from.
Secondly, our results indicating JI supply from the new EU Member States and EU Accession Coun-tries was taken directly from Paper 2, where it is noted that the literature surveyed rather lacked con-crete figures.

36
Thirdly, as discussed earlier, our research that yielded the CDM figure in Table 29 indicates a maxi-mum available potential, whereas the actual CDM supply will probably be only a fraction of this. Lack of funding of the CDM process as well as uncertainty surrounding the determination of addition-ality, sustainable development value and transaction costs among other concerns are proving to mount considerable barriers to CDM planning and implementation.
It can therefore be concluded that, in practice, supply will most likely be able to cover only a fraction of the demand that will arise if the buyer countries do not rein in their emissions. One should also note that supply will probably concentrate on very few countries. If they qualify for Art. 17 emissions trad-ing, Russia and the Ukraine will dispose of about more than two thirds of available hot air supply, whereas the CDM is likely to be dominated by the large developing countries such as China and India. This could put the sellers into a very favourable position, and ever more so the nearer the end of the first commitment period comes and the more the buyer countries fail to rein in their emissions.
Just like other buyer countries, the Japanese government should therefore consider implementing fur-ther measures to reduce emissions domestically so as to reduce its dependence on the international market.
As for buying certificates, given the uncertainties regarding the potential supply on the one hand and the enormous potential demand on the other, the Japanese government would be well advised to quickly move to secure the amounts it needs. The following aspects can be noted for the individual supply sources:
Art. 17 emission trading currently seems to be the most unreliable source. Seller countries will first have to fulfil the eligibility criteria for participating in international emissions trading. Even if they succeed at qualifying, they may well prefer to bank a major part of their surpluses for the second commitment period.
Russia and the Ukraine offer a vast potential for cost-efficient emission reduction projects but a poor business environment. Still, JI opportunities should be further explored.
Conversely, the new EU Member States and the EU Accession Countries provide a relatively good business environment and substantial potential for cost-effective emission reductions. Projects without linkage to the EU ETS, such as projects in the district heating sector, are still possible without further complications. Projects with indirect or direct linkage to the EU ETS are also still possible but will probably entail increased transaction costs due to the necessity to avoid double counting.
As for the CDM, the first projects are finally being registered and supply is constantly increasing. The CDM has the advantage of being internationally regulated, which offers a degree of certainty and reli-ability, and provides a significant theoretical emission reduction potential. On the downside, at least at the moment the process is still very cumbersome and many host countries offer only a poor business environment. The easiest route seems to be to focus on the large host countries with large emission reduction potentials and a good investment climate. However, focussing on less attractive countries and providing them with the necessary capacity building within the framework of a formalised coop-eration could possibly have the advantage of being able to realise the reduction potentials in these countries without too much competition from other countries.
Besides these “established” mechanisms which have been examined in this paper, there are also more novel instruments which warrant further study: Green Investment Schemes (GIS) and the linking of

37
domestic emission trading systems. Whereas the former could be a means to endow the purchase of AAUs with actual environmental benefits, the latter could be a means to access the emission reduction potentials in the Central and Eastern European energy and industry sectors, which seem to have been removed from JI by the EU ETS, as elaborated in Paper 2. These instruments will be examined more closely in Paper 4.
To sum up, it seems advisable for a buyer country such as Japan to reduce dependence on the interna-tional market by implementing further domestic action. As for covering remaining deficits via pur-chases, all opportunities provided by the project-based mechanisms should be used in order to diver-sify risk and secure the amounts needed as early as possible. Being well prepared and establishing a sound Kyoto strategy will also serve to avoid a last-minute rush for AAUs which would allow the sellers to dictate the terms.
This paper is a contribution by Wolfgang Sterk, Maike Bunse, Bettina Wittneben, Michael Gybas and Stefan
Lechtenböhmer (all Wuppertal Institute for Climate, Environment and Energy). The authors would like to
express their gratitude to Rie Watanabe (Climate Policy Project of Institute for Global Environmental Strategies
(IGES)) for her comments. Any remaining errors are the sole responsibility of the authors.
38
References
Austria. 2004. National Allocation Plan for Austria. Federal Ministry of Agriculture, Forestry, Envi-ronment and Water Management.
Belgium. 2004. Belgian National Allocation Plan. Brussels: Federal Public Service of Public Health, Food Chain Safety and Environment, 23.06.2004.
British Petroleum(BP). 2004. Statistical review of world energy 2004. London: BP.
Bulgaria. 2002. Third National Communication on Climate Change, United Nations Framework on Climate Change. Sofia.
Canada. 2001. Canada´s Third National Report on Climate Change. Actions to Meet Commitments under the United Nations Framework Convention on Climate Change. Ministry of Public Works and Government Services.
Criqui, P., and A. Kitous 2003. Kyoto Protocol Implementation, KPI Technical Report: Impacts of Linking JI and CDM Credits to the European Emission Allowance Trading Scheme, May 2003.
Czech Republic. 2001. The Czech Republic’s Third National Communication on the UN Framework Convention on Climate Change. Prague: Ministry of the Environment of the Czech Republic / Czech Hydrometeorological Institute.
Denmark. 2004. Danish National Allocation Plan. Ministry of the Environment, March 2004.
European Environment Agency (EEA). 2004. Analysis of greenhouse gas emission trends and projec-tions in Europe 2004, EEA Technical Report No. 7/2004, Final draft version, 30 November, Annex 1, Actual and projected greenhouse gas emissions by EU-15 Member States. Luxembourg: Office for Official Publications of the European Communities.
Ellis, J., J. Corfee-Morlot, and H. Winkler. 2004. Taking Stock of Progress under the Clean Develop-ment Mechanism (CDM). Paris: International Energy Agency / Organisation for Economic Coop-eration and Development, COM/ENV/EPOC/IEA/SLT(2004)4/FINAL, 15.06.2004.
Estonia. 2001. Estonia’s Third National Communication Under the UN Framework Convention on Climate Change. Talinn: Ministry of the Environment / Institute of Ecology, Talinn Pedagogical University.
EU. 1999. Submission by Germany on behalf of the European Community, its Member States and Bulgaria, Croatia, Czech Republic, Estonia, Hungary, Latvia, Lithuania, Poland, Slovak Republic and Slovenia on the Clean Development Mechanism (Art.12 KP). In: UNFCCC (1999): Principles, Modalities, Rules and Guidelines for the Mechanisms under Article 6, 12 and 17 of the Kyoto Pro-tocol: Submissions from the Parties: Note by the secretariat: Addendum. FCCC/SB/1999/MISC.3/Add.3, 04.06.1999.
Finland. 2004. Government Decision on the Proposal for a National Allocation Plan, Made in Helsinki on 19 August 2004 made by virtue of section 34 of the Emissions Trading Act (683/2004), Finnish Proposal for a National Allocation Plan for Emission Allowances for the Years 2005-2007 Subject to Directive 2003/87/EC and the Emissions Trading Act 683/2004 Adopted to Implement the Di-rective.
France. 2004. Plan Nationale d’Affectation des Quotas, Période de Réference 2005-2007. Paris, 06.07.2004.

39
Fankhauser, S., and L. Lavric. 2003. The investment climate for climate investment: Joint Implemen-tation in transition countries. London: European Bank for Reconstruction and Development (Work-ing paper No. 779).
Germany. 2004. National Allocation Plan for the Federal Republic of Germany 2005-2007. Federal Ministry for the Environment, Nature Conservation and Nuclear Safety, 31.03.2004.
Gilbert, A., J.W. Bode, and D. Phylipsen. 2004. Analysis of the National Allocation Plans for the EU Emissions Trading Scheme, Austria, Belgium, Denmark, Estonia, Finland, France, Germany, Ire-land, Italy Latvia, Lithuania, Luxembourg, Portugal, The Netherlands, Slovenia, Spain, Sweden, United Kingdom. London: Ecofys UK, 18.08.2004.
Grubb, M., and Y. Safonov. 2003. Why is Russia Dragging its Feet on Kyoto? In: The Financial Times, 14 July 2003, 19.
Haites, E. 2004. Estimating the Market Potential for the Clean Development Mechanism: Review of Models and Lessons Learned. Washington DC: World Bank Carbon Finance Business. PCF Plus Report 15, June 2004.
Hungary. 2002. Hungary, 3rd National Communication for the UNFCCC. Systemexpert Consulting Ltd.
Italy. 2004. “Directive 2003/87/EC of 13 October 2003, establishing a scheme for greenhouse gas emission allowance trading within the Community and amending Council Directive 96/61/EC”, National Allocation Plan.
International Energy Agency (IEA). 2004. Website of the International Energy Agency: http://www.iea.org [22.11.2004]
Ireland. 2004. Ireland’s National Allocation Plan 2005-2007, 2nd Public Consultation. Dublin: Envi-ronmental Protection Agency, 30.09.2004.
Jotzo, F., and A. Michaelowa. 2002. Estimating the CDM market under the Marrakech Accords. In: Climate Policy, Vol. 2, no. 2:179-196.
Langrock, T., and W. Sterk. 2004. The Supplementarity Challenge: CDM, JI and EU Emissions Trad-ing. Wuppertal: Wuppertal Institute for Climate, Environment and Energy. (JIKO Policy Paper 1/2004).
Laroui, F., E. Tellegen, and K. Tourilova. 2004. Joint Implementation in Energy between the EU and Russia, Outlook and Potential. In: Energy Policy, Vol. 32, no. 7:899-914.
Latvia. 2001. The Third National Communication of the Republic of Latvia under United Nations Framework Convention on Climate Change. Riga: Ministry of Environmental Protection and Re-gional Development.
Lechtenböhmer, S., et al. 2005. Greenhouse Gas Emissions from the Russian Natural Gas Export Pipe-line System, Results and Extrapolation of Measurements and Surveys in Russia, A Project on be-half of E.ON Ruhrgas AG. Wuppertal / Mainz: Wuppertal Institute for Climate, Environment, En-ergy / Max-Planck-Institute for Chemistry.
Lelieveld, J., et al. 2005. Low methane leakage from gas pipelines, A switch from coal or oil to natural gas could mitigate climate effects in the short term. In: Nature, Vol. 434, 14 April 2005, 841f.
Lithuania. 2003. Lithuania’s second national communication under the Framework Convention on Climate Change. Ministry of the Environment.
Luxembourg. 2004. Nationaler Allokationsplan für Luxemburg. Luxembourg: Ministère de l’Environnement, 06.04.2004.
40
The Netherlands. 2004. Allocation plan for CO2 emission allowances 2005–2007. Dutch National allocation plan regarding the allocation of greenhouse gas emission allowances to companies. 16.04.2004.
Point Carbon / Vertis Environmental Finance. 2003. Ukraine, Country Report, 06.10.03.
Point Carbon. 2005. Will the giants awake? Russia and the Ukraine in the future carbon market. Car-bon Market Analyst, 22.03.2005.
Poland. 2001. Third National Communication to the Conference of the Parties to the United Nations Framework Convention on Climate Change. Warsaw: Instytute of Environmental Protection.
Portugal. 2004. European Emission Trading Scheme (EU-ETS), Directive 2003/87/CE of the Euro-pean Parliament and of the Council of 13 October 2003, National Allocation Plan for CO2 Emis-sions Allowances (NAP) 2005-2007, Version to European Commision. Ministério Da Economia / Ministério Das Cidades Ordenamento Do Território E Ambiente, 04.05.2004.
Robinson, D., R. Fernandez, and R. Kantamaneni. 2003. Methane Emissions Mitigation Options in the Global Oil and Natural Gas Industries. In: 3rd International Methane & Nitrous Oxide Mitigation Conference, Beijing, China, November 17th-21th 2003, Beijing, 923-933.
Romania. 1998. Second National Communication to the United Nations Framework Convention on Climate Change. Bucharest: Ministry of Waters, Forests and Environmental Protection.
Russian Federation. 2002. Third National Communication of the Russian Federation, Submitted in Accordance with Articles 4 and 12 of the United Nations Framework on Climate Change. Moscow: Interagency Commission of the Russian Federation on Climate Change.
Slovakia. 2001. The Third National Communication on Climate Change. Bratislava: The Ministry of Environment of the Slovak Republic.
Slovenia. 2004. Slovenia’s Second and Third National Communication to the Conference of the Par-ties of the United Nations Framework Convention on Climate Change. Ljubljana: Ministry of the Environment, Spatial Planning and Energy.
Sweden. 2004. Sweden’s National Allocation Plan. Ministry of Industry, Employment and Communi-cations, 22.04.2004.
United Kingdom of Great Britain and Northern Ireland (UK). 2004. EU Emissions Trading Scheme, UK National Allocation Plan 2005-2007. Department for Environment, Food and Rural Affairs.
Ukraine. 1998. The First National Communication on Climate Change, The United Nations Frame-work on Climate Change. Kiev.
_______. 2003. The National Strategy of Ukraine for Joint Implementation and Emissions Trading. Kiev: Ministry of the Environment and Natural Resources.
UNFCCC. 2000. Report on the in-depth review of the First National Communication of Ukraine. FCCC/IDR.1/UKR, 15.11.2005.
_______. 2003. Report on the in-depth review of the Third National Communication of Canada. FCCC/IDR.3/CAN, 01.12.2003.
_______. 2004. Report on the in-depth review of the Third National Communication of the Russian Federation. FCCC/IDR.3/RUS, 10.06.2004.
Venugopal, S. 2003. Potential Methane Emissions Reductions and Carbon Offset Opportunities in Russia. In: 3rd International Methane & Nitrous Oxide Mitigation Conference, Beijing, China, No-vember 17th-21th 2003, - Beijing, pp. 906-913.
World Bank. 1999. Study on Russian National Strategy of Green House Gas Emission Reductions. Washington, D.C.: World Bank Bureau of Economic Analysis.

41
Zhang, Z.X. 2000. Estimating the size of the Potential Market for the Kyoto Flexibility Mechanisms. Groningen: University of Groningen.
_______. 2003. Meeting the Kyoto Targets: the importance of developing country participation. Gron-ingen: University of Groningen.
Related Documents