1 The Technical Decision for The Technical Decision for Transportation Management Transportation Management System System by KUANG YANG KOU ASSOCIATE PROFESSOR DEPARTMENT OF TRAFFIC SCIENCE IN CENTRAL POLICE UNIVERSITY

Background : 1.Impact : economy, air quality, energy use, land use, and quality of life.
Dec 31, 2015
The Technical Decision for Transportation Management System by KUANG YANG KOU ASSOCIATE PROFESSOR DEPARTMENT OF TRAFFIC SCIENCE IN CENTRAL POLICE UNIVERSITY. Background : 1.Impact : economy, air quality, energy use, land use, and quality of life. 2.Resource : finance ; fund. - PowerPoint PPT Presentation
Welcome message from author
This document is posted to help you gain knowledge. Please leave a comment to let me know what you think about it! Share it to your friends and learn new things together.
Transcript

11
The Technical Decision for The Technical Decision for Transportation Management Transportation Management
SystemSystem
by
KUANG YANG KOUASSOCIATE PROFESSOR
DEPARTMENT OF TRAFFIC SCIENCE IN CENTRAL POLICE UNIVERSITY

22
BackgroundBackground ::1.Impact : economy, air quality, energy use, land
use, and quality of life.
2.Resource : finance ; fund.
3.Management : effective way balanced transportation systems that serve the diverse population equally.

33
ObjectivesObjectives ::1. Develop monitoring systems that provides data on w
hich subsequent analyses, evaluations, and objective decision-making is based.
2. Create performance evaluations that assemble all the benefits, costs, and impacts of alternatives, so that informed judgments can be made concerning the merits of alternative actions.
3. Identify improvement strategies comprising of broad transportation choices available for evaluation.
4. Create a state-of-the-art decision support tools for prioritizing, programming, and implementing projects.

44
FIGURE 1FIGURE 1Institutional StructureInstitutional Structure
Surface Transportation System

55
FIGURE 2FIGURE 2Interagency CoordinationInteragency Coordination
Freeway
Principal
UrbanLocal
66
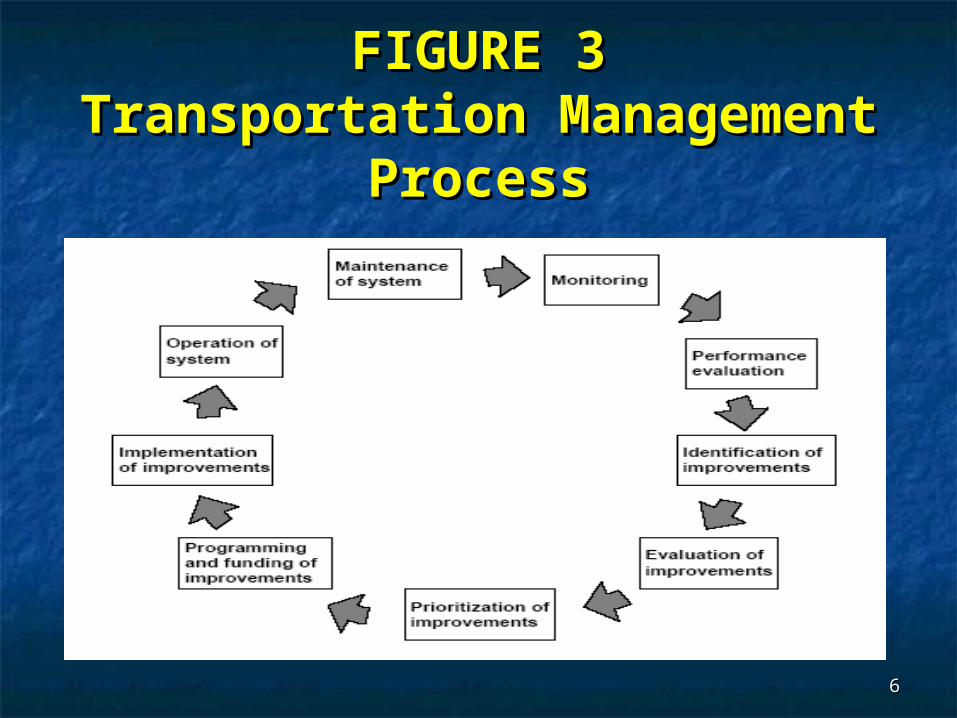
FIGURE 3FIGURE 3Transportation Transportation
Management ProcessManagement Process
77
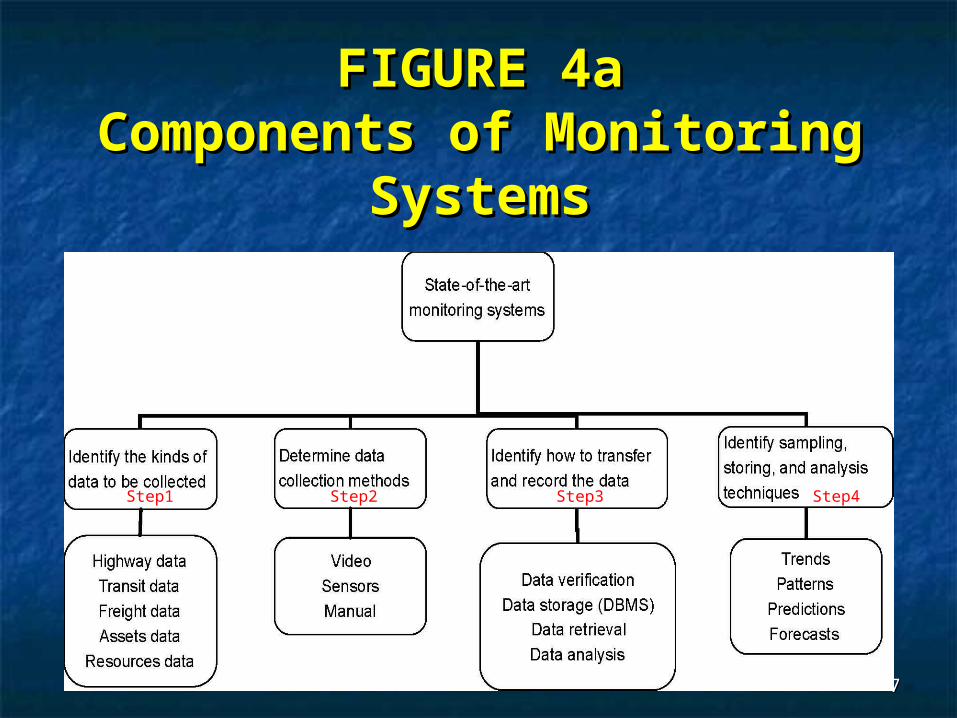
FIGURE 4aFIGURE 4aComponents of Monitoring Components of Monitoring
SystemsSystems
Step1 Step2 Step3 Step4

88
FIGURE 4bFIGURE 4bData Collected for Highway Data Collected for Highway
and Transitand TransitType Data Purpose Method
Highway
Volume Widen Lane Project Sensor (in)
Speed Geography Curve Design Sensor (in)
Weight Safety Pavement Design Sensor (in)
Crash Safety Manual
Resource Maintenance ( Labor , Equipment ) Manual
Transit( Bus, MRT, Commut
er Rail )
Passenger Mobility * Peak and Off Peak Sensor (non)
Load Quality Service Sensor (non)
Crash Safety Manual
Resource Maintenance ( Labor , Equipment ) Manual
Sensor(non)
Camera, Video
Sensor(in)
Automated Vehicle Identification SysGeographic Position Sys
Manual Human Being
Step3 Step4

99
FIGURE 4aFIGURE 4aComponents of Monitoring Components of Monitoring
SystemsSystems
Step1 Step2 Step3 Step4
1010
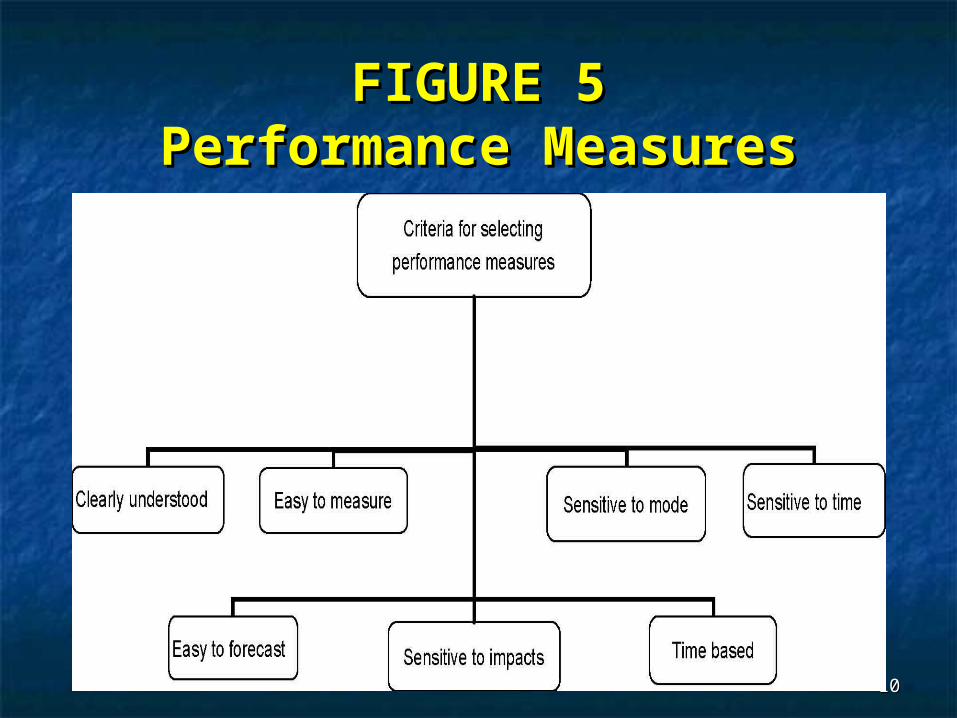
FIGURE 5FIGURE 5Performance MeasuresPerformance Measures

1111
FIGURE 6aFIGURE 6aIdentification of StrategiesIdentification of Strategies
Identification of Strategies
Supply Strategies
Operational Improvements
Intelligent Transportation Systems
( Table1)
Added Capacity
Access Management
Information Systems( Traffic Condition)
Parking Management( Policy)
Travel Demand Management
Incident Management
Demand Strategies

1212
FIGURE 6bFIGURE 6bExample of StrategiesExample of Strategies
Operational Improvements
Added Capacity
Widen Road
Build MRT Line
Build More Train
Travel Demand Management
Incentives
Subsidies
Policy
Incident Management
Detection
Response
Removal
Arterial Traffic Management
Freeway Traffic Management
Pedestrian and Bicycle Improvements
Freight/Goods Movement Improvement Programs
Transit Improvements.
Supply Type Demand Type

1313
FIGURE 7FIGURE 7Evaluation of StrategiesEvaluation of Strategies

1414
Project
Goal and Performance Measure Scores
Sum of scores
Rank
Mobility Safety and Security Economic Dev. Environmental
No. of Persons
Person-miles traveled
( Reduced)No. of Crashes
( Reduced)
No. of Exposures
No. of Jobs
created
Increase in Tax
Revenue
Impacts on lands
Air Pollution(CO, NO)
High-Occupant-Vehicle Lane on Highway 1
8 5 7 8 3 6 7 2 46 3
Widening of Highway 15 North
5 7 6 9 5 5 4 4 45 4
North-South Freight Rail Line
5 6 4 3 4 5 5 3 35 7
Realignment of Route 44 and Safety Improvements
6 5 8 8 3 2 6 5 43 6
Install Advance Traffic Management Systems
4 7 4 6 2 8 7 6 44 5
Purchase 200 CNG Buses for MTA
7 8 6 9 7 4 4 3 48 2
Purchase 100 Rapid Transit Cars for MTA
9 6 5 4 7 7 6 6 50 1
Table 2Table 2An Example of Project An Example of Project
PrioritizationPrioritization
Scoring is based on a scale of 1 through 10; 1 = lowest score and 10 = highest score.
1515
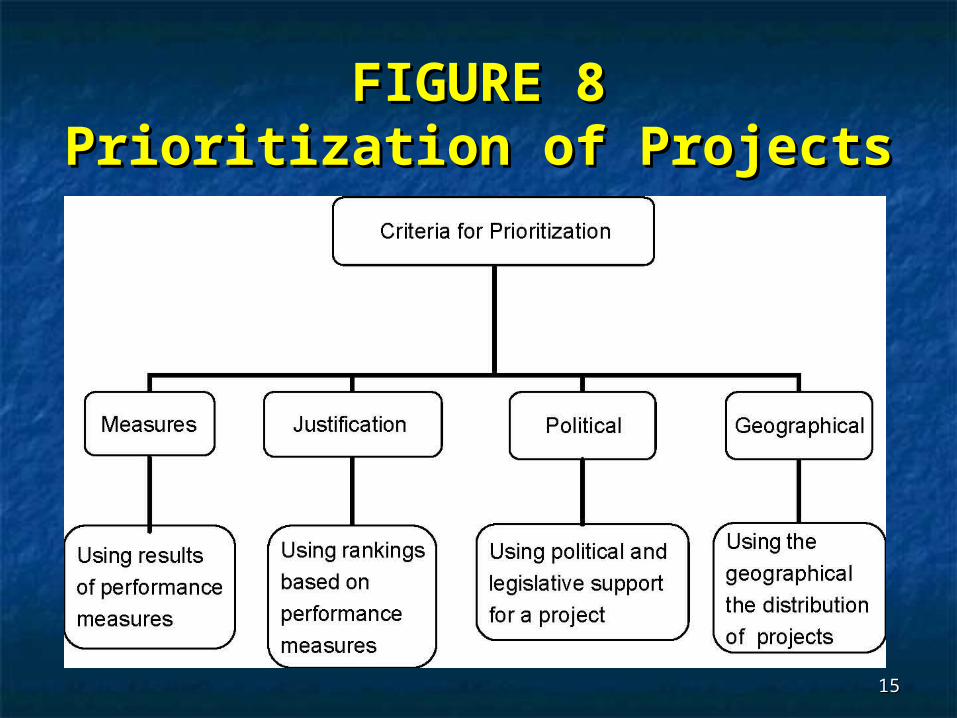
FIGURE 8FIGURE 8Prioritization of ProjectsPrioritization of Projects

1616
FIGURE 9FIGURE 9Programming of ProjectsProgramming of Projects

1717
FIGURE 10FIGURE 10ImplementationImplementation
Related Documents


