ultrahigh temperature GSA Data Repository 2017 Backarc origin of Neoarchean metamorphism and orogenic root growth Gregory Dumond, Michael L. Williams, Michael J. Jercinovic, Julia A. Baldwin Analytical methods for electron microprobe major element silicate analyses High-resolution X–ray mapping of garnet was carried out prior to analysis with the Cameca ® SX50 EPMA at the University of Massachusetts-Amherst. Maps were generated at 15 kV and 150–200 nA with 4–10 μm pixel step sizes and 50–100 ms dwell times. Quantitative analyses, guided by the X–ray maps, were collected at 15 kV and 20 nA with a focused beam for garnet and a defocused beam (5 μm diameter) for biotite (Table DR1). Count times were 20 s on peak and 10 s on background. Calibrations were made using common natural and synthetic standards. Analytical methods for electron microprobe monazite major and trace element analyses The procedure for Th–U–total Pb monazite geochronology and trace element analysis by EPMA in this study follows the work of Jercinovic & Williams (2005), Williams et al. (2006; 2007), Jercinovic et al. (2008), and Dumond et al. (2008; see Table DR2). Calibrated overlap correction factors for peak interferences of YLγ on PbMα, ThMζ1 and ThMζ2 on PbMα, 2nd order LaLα on PbMα, ThMγ on UMβ, KKα on UMβ, NdLβ3 on EuLα, and PrLβ on EuLα were applied prior to ZAF corrections during the analytical sessions (see Donovan et al., 1993; Pyle et al., 2002; 2005; Jercinovic & Williams, 2005; Jercinovic et al., 2008). Full thin-section X-ray maps were collected via EPMA to identify all monazite grains (following Williams & Jercinovic, 2012). Monazite grains were mapped at high spatial resolution (0.3–0.5 μm step sizes) at 15 kV and 200 nA for 70– 100 ms/pixel on a Cameca ® SX50 electron microprobe. X-ray maps for YLα, CaKα, ThMα, and UMβ were processed both simultaneously and then, individually to identify similar and compositionally distinct domains to guide subsequent quantitative analysis. Details regarding the analytical methods for monazite trace element analysis via the Cameca SX100 ® Ultrachron at the University of Massachusetts-Amherst and the determination of each domain-specific date and error are summarized in Williams et al. (2006) and Dumond et al. (2008). All dates are plotted as weighted means with 2σ uncertainties (95% confidence interval). Calibrations were periodically throughout the analytical session by analyzing a “consistency standard” (Williams et al., 2006). The standard used in this study is the Moacir Brazilian pegmatite monazite with a weighted mean 207 Pb/ 235 U age of 504.3 ± 0.2 Ma (2σ, MSWD = 0.64) (Gasquet et al., 2010). Analytical methods for whole rock bulk geochemistry Whole rock geochemistry for major and rare earth elements was obtained through Activation Laboratories, Ltd. in Ancaster, Ontario, Canada via ICP-OES and ICP-MS techniques following a lithium metaborate-tetraborate fusion of each sample at their facility (Table DR3).

Welcome message from author
This document is posted to help you gain knowledge. Please leave a comment to let me know what you think about it! Share it to your friends and learn new things together.
Transcript
ultrahigh temperature
GSA Data Repository 2017
Backarc origin of Neoarchean metamorphism and orogenic root growth
Gregory Dumond, Michael L. Williams, Michael J. Jercinovic, Julia A. Baldwin
Analytical methods for electron microprobe major element silicate analyses
High-resolution X–ray mapping of garnet was carried out prior to analysis with the Cameca® SX50 EPMA at the University of Massachusetts-Amherst. Maps were generated at 15 kV and 150–200 nA with 4–10 μm pixel step sizes and 50–100 ms dwell times. Quantitative analyses, guided by the X–ray maps, were collected at 15 kV and 20 nA with a focused beam for garnet and a defocused beam (5 μm diameter) for biotite (Table DR1). Count times were 20 s on peak and 10 s on background. Calibrations were made using common natural and synthetic standards.
Analytical methods for electron microprobe monazite major and trace element analyses
The procedure for Th–U–total Pb monazite geochronology and trace element analysis by EPMA in this study follows the work of Jercinovic & Williams (2005), Williams et al. (2006; 2007), Jercinovic et al. (2008), and Dumond et al. (2008; see Table DR2). Calibrated overlap correction factors for peak interferences of YLγ on PbMα, ThMζ1 and ThMζ2 on PbMα, 2nd order LaLα on PbMα, ThMγ on UMβ, KKα on UMβ, NdLβ3 on EuLα, and PrLβ on EuLα were applied prior to ZAF corrections during the analytical sessions (see Donovan et al., 1993; Pyle et al., 2002; 2005; Jercinovic & Williams, 2005; Jercinovic et al., 2008). Full thin-section X-ray maps were collected via EPMA to identify all monazite grains (following Williams & Jercinovic, 2012). Monazite grains were mapped at high spatial resolution (0.3–0.5 μm step sizes) at 15 kV and 200 nA for 70–100 ms/pixel on a Cameca® SX50 electron microprobe. X-ray maps for YLα, CaKα, ThMα, and UMβ were processed both simultaneously and then, individually to identify similar and compositionally distinct domains to guide subsequent quantitative analysis. Details regarding the analytical methods for monazite trace element analysis via the Cameca SX100® Ultrachron at the University of Massachusetts-Amherst and the determination of each domain-specific date and error are summarized in Williams et al. (2006) and Dumond et al. (2008). All dates are plotted as weighted means with 2σ uncertainties (95% confidence interval). Calibrations were periodically throughout the analytical session by analyzing a “consistency standard” (Williams et al., 2006). The standard used in this study is the Moacir Brazilian pegmatite monazite with a weighted mean 207Pb/235U age of 504.3 ± 0.2 Ma (2σ, MSWD = 0.64) (Gasquet et al., 2010).
Analytical methods for whole rock bulk geochemistry
Whole rock geochemistry for major and rare earth elements was obtained through Activation Laboratories, Ltd. in Ancaster, Ontario, Canada via ICP-OES and ICP-MS techniques following a lithium metaborate-tetraborate fusion of each sample at their facility (Table DR3).

References Donovan, J. J., Snyder, D. A. and Rivers, M. L., 1993, An improved interference correction for
trace element analysis: Microbeam Analysis, v. 2, p. 23–28. Dumond, G., McLean, N., Williams, M. L., Jercinovic, M. J. and Bowring, S. A., 2008, High-
resolution dating of granite petrogenesis and deformation in a lower crustal shear zone: Athabasca granulite terrane, western Canadian Shield: Chemical Geology, v. 254, p. 175–196.
Gasquet, D., Bertrand, J.-M., Paquette, J.–L., Lehmann, J., Ratzov, G., de Ascenção Guedes, R.,
Tiepolo, M., Boullier, A.-M., Scaillet, S. and Nomade, S., 2010, Miocene to Messinian deformation and hydrothermal activity in a pre-Alpine basement massif of the French western Alps: new U–Th–Pb and Ar ages from the Lauzière massif: Bulletin de la Société Géologique de France, v. 181, p. 227–241.
Jercinovic, M. J. and Williams, M. L., 2005, Analytical perils (and progress) in electron
microprobe trace element analysis applied to geochronology: Background acquisition, interferences, and beam irradiation effects: American Mineralogist, v. 90, p. 526–546.
Jercinovic, M. J., Williams, M. L. and Lane, E. D., 2008, In-situ trace element analysis of monazite
and other fine-grained accessory minerals by EPMA: Chemical Geology, v. 254, p. 197–215.
Pyle, J. M., Spear, F. S. & Wark, D. A., 2002, Electron microprobe analysis of REE in Apatite,
Monazite, and Xenotime: Protocols and Pitfalls, in Kohn, M. J., Rakovan, J. and Hughes, J. M., eds., Reviews in Mineralogy and Geochemistry: Washington, D.C., Mineralogical Society of America, p. 337–362,
Pyle, J. M., Spear, F. S., Wark, D. A., Daniel, C. G. and Storm, L. C., 2005, Contributions to
precision and accuracy of chemical ages of monazite: American Mineralogist, v. 90, p. 547–577.
Williams, M. L. and Jercinovic, M. J., 2012, Tectonic interpretation of metamorphic tectonites:
integrating compositional mapping, microstructural analysis and in situ monazite dating. Journal of Metamorphic Geology, v. 30, p. 739–752.
Williams, M. L., Jercinovic, M. J., Goncalves, P. and Mahan, K., 2006, Format and philosophy for
collecting, compiling, and reporting microprobe monazite ages: Chemical Geology, v. 225, p. 1–15.
Williams, M. L., Jercinovic, M. J. and Hetherington, C. J., 2007, Microprobe Monazite
Geochronology: Understanding Geologic Processes by Integrating Composition and Chronology: Annual Review of Earth and Planetary Sciences, v. 35, p. 137–175.

Table DR1. Electron microprobe silicate analyses for 07G-030-H2AOxide(wt%) Grt core* Grt rim* Bt*FeO 23.68 20.10 9.55MgO 12.85 10.48 16.19MnO 0.27 0.39 0.01CaO 1.52 7.37 b.d.†
Na2O b.d. 0.01 0.08K2O n.a.# n.a. 8.92TiO2 0.020 0.03 5.53Al2O3 23.15 23.00 16.7SiO2 39.84 39.54 36.72P2O5 0.05 0.05 n.a.Total 101.41 100.97 93.69
Cations 12 12 11Fe 1.471 1.258 0.589Mg 1.423 1.166 1.780Mn 0.017 0.020 0.000Ca 0.121 0.591 b.d.Na b.d. 0.001 0.011K n.a. n.a. 0.839Ti 0.001 0.001 0.306Al 2.026 2.026 1.451Si 2.958 2.955 2.708P 0.003 0.003 n.a.
* average composition of several analyses# n.a. = not analyzed† b.d. = below detection
07G-030-H2A
200 m
A
B
3-m8
3-m10
3-m123-m8
3-m10
3-m12
3-m73-m7
3-m73-m7
Ca KCa K
HIGHHIGHLOWLOW
GrtGrt
QtzQtz
OpxOpx
PlPl
residual Grt-richfelsic granulite
residual Grt-richfelsic granulite
3-m183-m18
3-m213-m213-m223-m22
3-m133-m133-m153-m153-m163-m163-m173-m17
3-m113-m11
retrogressed cuspate-lobatecontact zone adjacent
to eclogite
3 mm
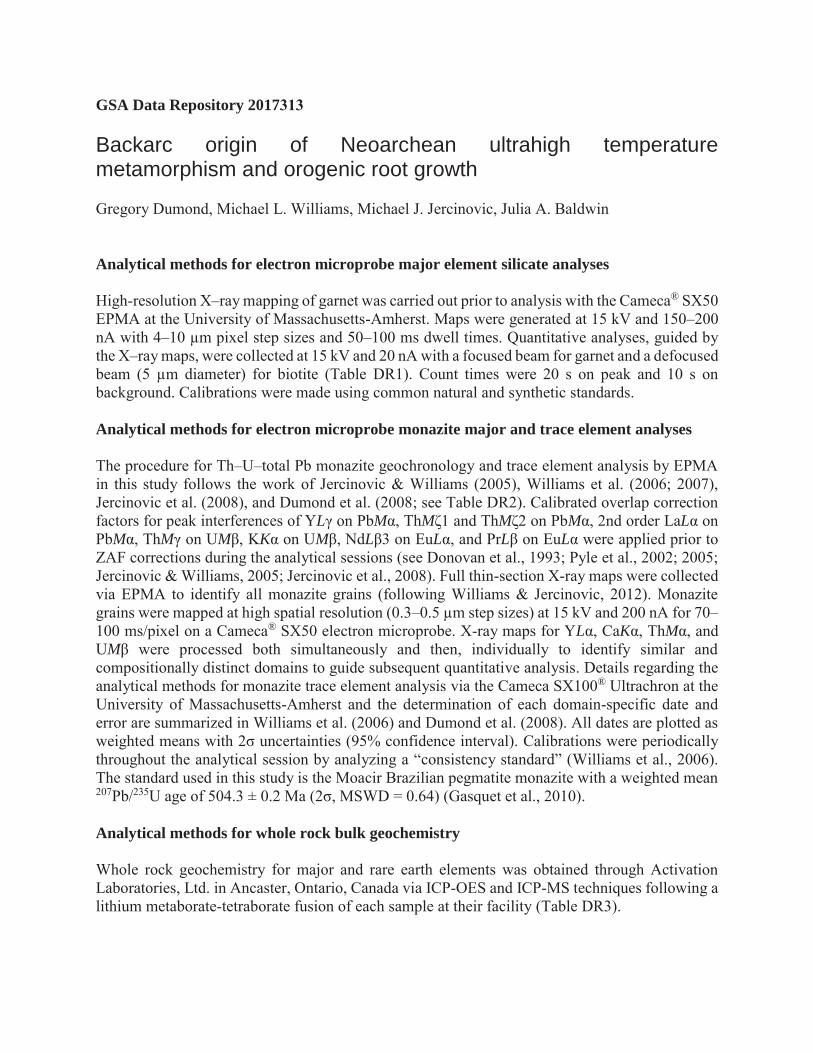
Figure DR1. A) Figure 2B from the main paper illustrating the location of monazite grain 3-m7 and the image in B. B) Backscattered electron image displaying resorbed garnet and the location of monazite grain 3-m7. Garnet exhibits a corona texture with symplectites and a mantle of Opx + Pl + Qtz.
Th M
Th M Y L
Zrn
Mnz1-m1
Qtz
Ap
high-Ca Grtrim Grs19Pl
Ca K1-m1 rim
1836 ppm Th2534 +/- 66 Ma
1-m1 core1.18 wt.% ThO2
2541 +/- 33 Ma
50 m
200 m
500 m
100 m 20 m
3 mm
3-m13-m1
3-m13-m1
rim1894 +/- 16Ma
rim1894 +/- 16Ma
low-Y core2593 +/- 20 Ma
low-Y core2593 +/- 20 Ma
high-Y core2615 +/- 34 Ma
high-Y core2615 +/- 34 Ma
1-m11-m1
3-m13-m1
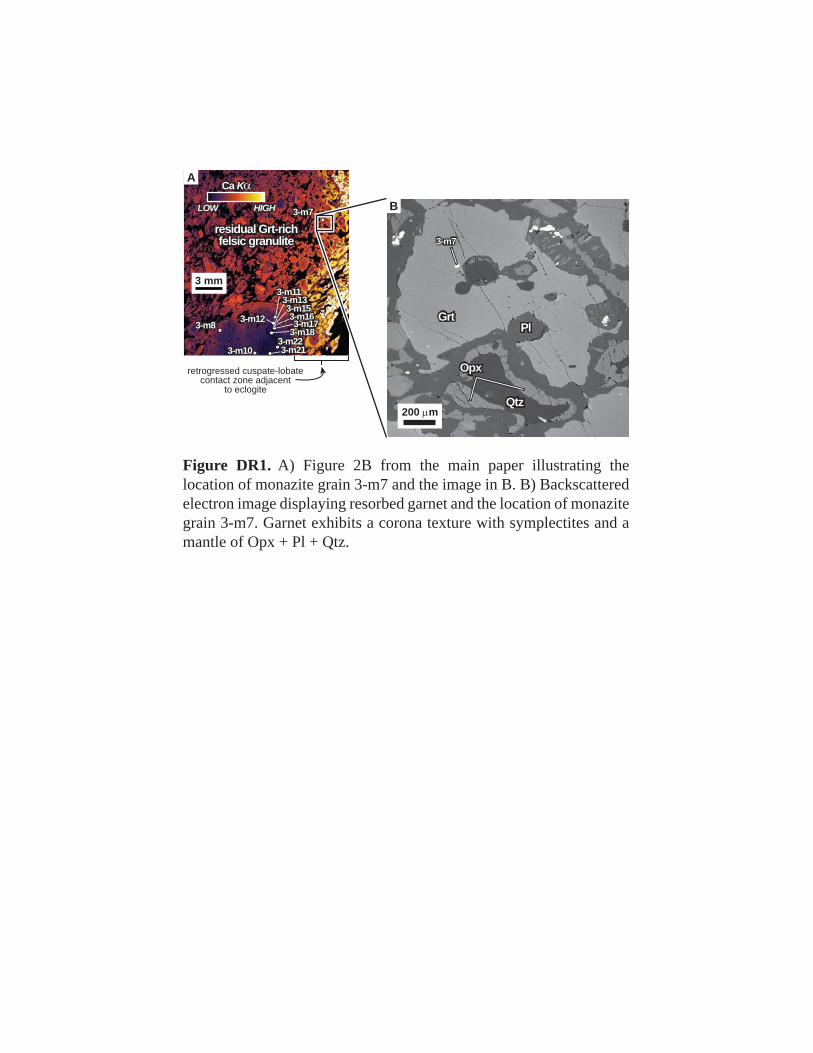
Figure DR2. Context for monazite grains 1-m1 and 3-m1 which are not in the field of view in Fig. 2. A) Backscattered electron image of 1-m1 included in high grossular garnet rim (note approximate location of image in Fig. DR2D. Grain 1-m1 is from a second serial thin-section adjacent to the section in D. B) and C) X-ray maps of 1-m1 showing setting and Th-U-total Pb dates. D) Full thin-section scan depicting locations of Figs. 2A, DR1A, and DR2E. E) Plane polarized photomicrograph of garnet with inclusion of monazite grain 3-m1. Note abundant cracks, including crack adjacent to grain 3-m1 in Fig. DR2F. F) Backscattered electron image showing setting of monazite grain 3-m1 and abundant cracks. G) X-ray maps of 3-m1 with Th-U-total Pb EPMA dates for a domain 1 high-Y core, a domain 2 low-Y core, and a domain 4 rim.
A
D
F
G
E
B
C
GrtGrt
GrtGrt BtBtPlPl
QtzQtz PlPl
GrtGrt
GrtGrt
Fig. 2AFig. 2A
Fig. DR2EFig. DR2E
Fig. DR2AFig. DR2AGrtGrtGrtGrt
GrtGrt
CracksCracks
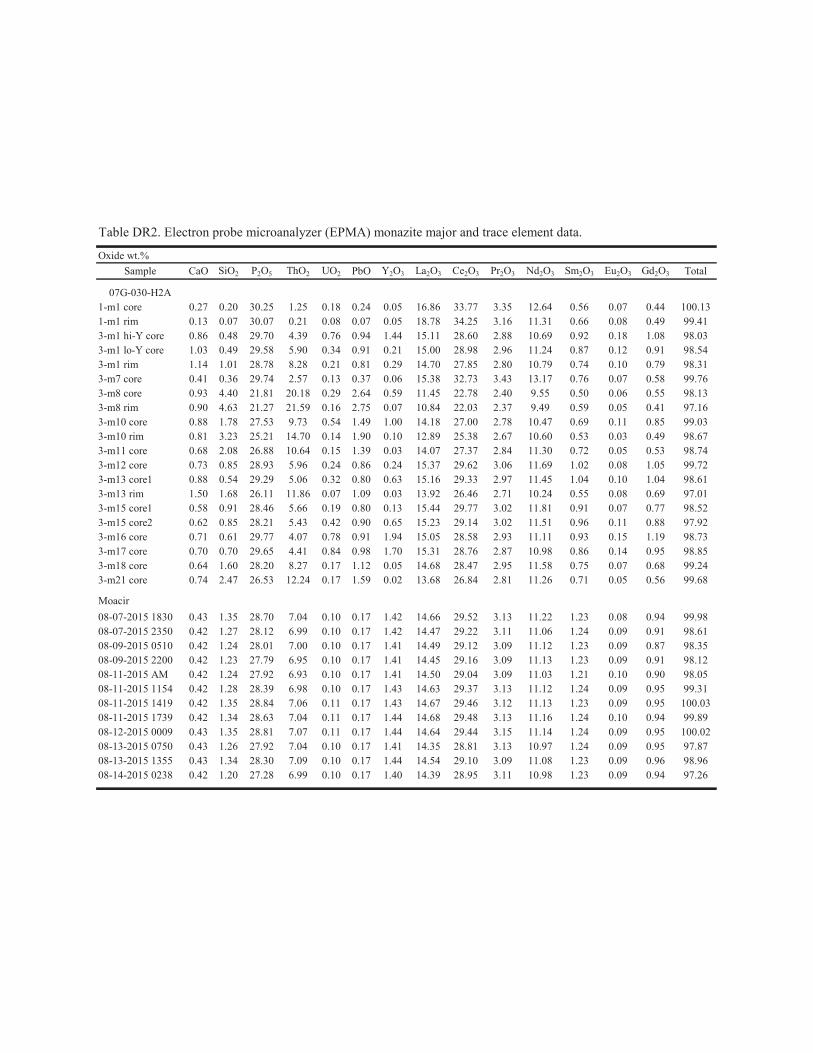
Table DR2. Electron probe microanalyzer (EPMA) monazite major and trace element data.
Oxide wt.%Sample CaO SiO2 P2O5 ThO2 UO2 PbO Y2O3 La2O3 Ce2O3 Pr2O3 Nd2O3 Sm2O3 Eu2O3 Gd2O3 Total
07G-030-H2A1-m1 core 0.27 0.20 30.25 1.25 0.18 0.24 0.05 16.86 33.77 3.35 12.64 0.56 0.07 0.44 100.131-m1 rim 0.13 0.07 30.07 0.21 0.08 0.07 0.05 18.78 34.25 3.16 11.31 0.66 0.08 0.49 99.413-m1 hi-Y core 0.86 0.48 29.70 4.39 0.76 0.94 1.44 15.11 28.60 2.88 10.69 0.92 0.18 1.08 98.033-m1 lo-Y core 1.03 0.49 29.58 5.90 0.34 0.91 0.21 15.00 28.98 2.96 11.24 0.87 0.12 0.91 98.543-m1 rim 1.14 1.01 28.78 8.28 0.21 0.81 0.29 14.70 27.85 2.80 10.79 0.74 0.10 0.79 98.313-m7 core 0.41 0.36 29.74 2.57 0.13 0.37 0.06 15.38 32.73 3.43 13.17 0.76 0.07 0.58 99.763-m8 core 0.93 4.40 21.81 20.18 0.29 2.64 0.59 11.45 22.78 2.40 9.55 0.50 0.06 0.55 98.133-m8 rim 0.90 4.63 21.27 21.59 0.16 2.75 0.07 10.84 22.03 2.37 9.49 0.59 0.05 0.41 97.163-m10 core 0.88 1.78 27.53 9.73 0.54 1.49 1.00 14.18 27.00 2.78 10.47 0.69 0.11 0.85 99.033-m10 rim 0.81 3.23 25.21 14.70 0.14 1.90 0.10 12.89 25.38 2.67 10.60 0.53 0.03 0.49 98.673-m11 core 0.68 2.08 26.88 10.64 0.15 1.39 0.03 14.07 27.37 2.84 11.30 0.72 0.05 0.53 98.743-m12 core 0.73 0.85 28.93 5.96 0.24 0.86 0.24 15.37 29.62 3.06 11.69 1.02 0.08 1.05 99.723-m13 core1 0.88 0.54 29.29 5.06 0.32 0.80 0.63 15.16 29.33 2.97 11.45 1.04 0.10 1.04 98.613-m13 rim 1.50 1.68 26.11 11.86 0.07 1.09 0.03 13.92 26.46 2.71 10.24 0.55 0.08 0.69 97.013-m15 core1 0.58 0.91 28.46 5.66 0.19 0.80 0.13 15.44 29.77 3.02 11.81 0.91 0.07 0.77 98.523-m15 core2 0.62 0.85 28.21 5.43 0.42 0.90 0.65 15.23 29.14 3.02 11.51 0.96 0.11 0.88 97.923-m16 core 0.71 0.61 29.77 4.07 0.78 0.91 1.94 15.05 28.58 2.93 11.11 0.93 0.15 1.19 98.733-m17 core 0.70 0.70 29.65 4.41 0.84 0.98 1.70 15.31 28.76 2.87 10.98 0.86 0.14 0.95 98.853-m18 core 0.64 1.60 28.20 8.27 0.17 1.12 0.05 14.68 28.47 2.95 11.58 0.75 0.07 0.68 99.243-m21 core 0.74 2.47 26.53 12.24 0.17 1.59 0.02 13.68 26.84 2.81 11.26 0.71 0.05 0.56 99.68
Moacir08-07-2015 1830 0.43 1.35 28.70 7.04 0.10 0.17 1.42 14.66 29.52 3.13 11.22 1.23 0.08 0.94 99.9808-07-2015 2350 0.42 1.27 28.12 6.99 0.10 0.17 1.42 14.47 29.22 3.11 11.06 1.24 0.09 0.91 98.6108-09-2015 0510 0.42 1.24 28.01 7.00 0.10 0.17 1.41 14.49 29.12 3.09 11.12 1.23 0.09 0.87 98.3508-09-2015 2200 0.42 1.23 27.79 6.95 0.10 0.17 1.41 14.45 29.16 3.09 11.13 1.23 0.09 0.91 98.1208-11-2015 AM 0.42 1.24 27.92 6.93 0.10 0.17 1.41 14.50 29.04 3.09 11.03 1.21 0.10 0.90 98.0508-11-2015 1154 0.42 1.28 28.39 6.98 0.10 0.17 1.43 14.63 29.37 3.13 11.12 1.24 0.09 0.95 99.3108-11-2015 1419 0.42 1.35 28.84 7.06 0.11 0.17 1.43 14.67 29.46 3.12 11.13 1.23 0.09 0.95 100.0308-11-2015 1739 0.42 1.34 28.63 7.04 0.11 0.17 1.44 14.68 29.48 3.13 11.16 1.24 0.10 0.94 99.8908-12-2015 0009 0.43 1.35 28.81 7.07 0.11 0.17 1.44 14.64 29.44 3.15 11.14 1.24 0.09 0.95 100.0208-13-2015 0750 0.43 1.26 27.92 7.04 0.10 0.17 1.41 14.35 28.81 3.13 10.97 1.24 0.09 0.95 97.8708-13-2015 1355 0.43 1.34 28.30 7.09 0.10 0.17 1.44 14.54 29.10 3.09 11.08 1.23 0.09 0.96 98.9608-14-2015 0238 0.42 1.20 27.28 6.99 0.10 0.17 1.40 14.39 28.95 3.11 10.98 1.23 0.09 0.94 97.26
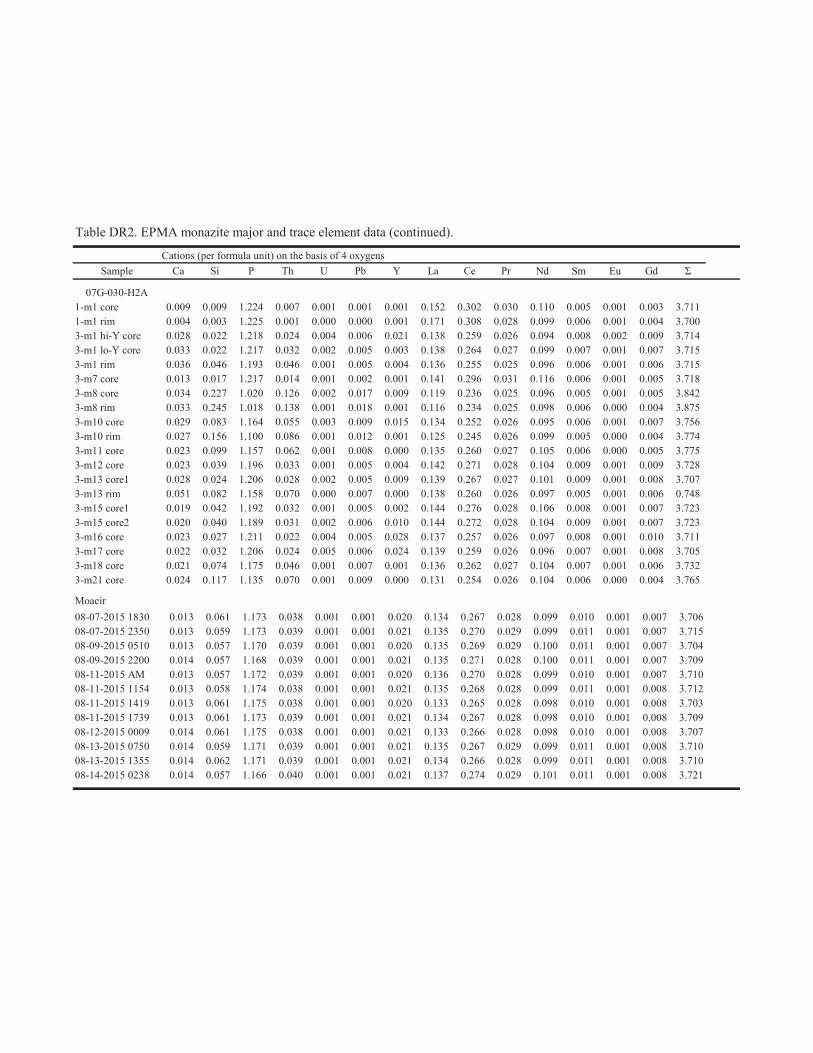
Table DR2. EPMA monazite major and trace element data (continued).
Cations (per formula unit) on the basis of 4 oxygensSample Ca Si P Th U Pb Y La Ce Pr Nd Sm Eu Gd Σ
07G-030-H2A1-m1 core 0.009 0.009 1.224 0.007 0.001 0.001 0.001 0.152 0.302 0.030 0.110 0.005 0.001 0.003 3.7111-m1 rim 0.004 0.003 1.225 0.001 0.000 0.000 0.001 0.171 0.308 0.028 0.099 0.006 0.001 0.004 3.7003-m1 hi-Y core 0.028 0.022 1.218 0.024 0.004 0.006 0.021 0.138 0.259 0.026 0.094 0.008 0.002 0.009 3.7143-m1 lo-Y core 0.033 0.022 1.217 0.032 0.002 0.005 0.003 0.138 0.264 0.027 0.099 0.007 0.001 0.007 3.7153-m1 rim 0.036 0.046 1.193 0.046 0.001 0.005 0.004 0.136 0.255 0.025 0.096 0.006 0.001 0.006 3.7153-m7 core 0.013 0.017 1.217 0.014 0.001 0.002 0.001 0.141 0.296 0.031 0.116 0.006 0.001 0.005 3.7183-m8 core 0.034 0.227 1.020 0.126 0.002 0.017 0.009 0.119 0.236 0.025 0.096 0.005 0.001 0.005 3.8423-m8 rim 0.033 0.245 1.018 0.138 0.001 0.018 0.001 0.116 0.234 0.025 0.098 0.006 0.000 0.004 3.8753-m10 core 0.029 0.083 1.164 0.055 0.003 0.009 0.015 0.134 0.252 0.026 0.095 0.006 0.001 0.007 3.7563-m10 rim 0.027 0.156 1.100 0.086 0.001 0.012 0.001 0.125 0.245 0.026 0.099 0.005 0.000 0.004 3.7743-m11 core 0.023 0.099 1.157 0.062 0.001 0.008 0.000 0.135 0.260 0.027 0.105 0.006 0.000 0.005 3.7753-m12 core 0.023 0.039 1.196 0.033 0.001 0.005 0.004 0.142 0.271 0.028 0.104 0.009 0.001 0.009 3.7283-m13 core1 0.028 0.024 1.206 0.028 0.002 0.005 0.009 0.139 0.267 0.027 0.101 0.009 0.001 0.008 3.7073-m13 rim 0.051 0.082 1.158 0.070 0.000 0.007 0.000 0.138 0.260 0.026 0.097 0.005 0.001 0.006 0.7483-m15 core1 0.019 0.042 1.192 0.032 0.001 0.005 0.002 0.144 0.276 0.028 0.106 0.008 0.001 0.007 3.7233-m15 core2 0.020 0.040 1.189 0.031 0.002 0.006 0.010 0.144 0.272 0.028 0.104 0.009 0.001 0.007 3.7233-m16 core 0.023 0.027 1.211 0.022 0.004 0.005 0.028 0.137 0.257 0.026 0.097 0.008 0.001 0.010 3.7113-m17 core 0.022 0.032 1.206 0.024 0.005 0.006 0.024 0.139 0.259 0.026 0.096 0.007 0.001 0.008 3.7053-m18 core 0.021 0.074 1.175 0.046 0.001 0.007 0.001 0.136 0.262 0.027 0.104 0.007 0.001 0.006 3.7323-m21 core 0.024 0.117 1.135 0.070 0.001 0.009 0.000 0.131 0.254 0.026 0.104 0.006 0.000 0.004 3.765
Moacir08-07-2015 1830 0.013 0.061 1.173 0.038 0.001 0.001 0.020 0.134 0.267 0.028 0.099 0.010 0.001 0.007 3.70608-07-2015 2350 0.013 0.059 1.173 0.039 0.001 0.001 0.021 0.135 0.270 0.029 0.099 0.011 0.001 0.007 3.71508-09-2015 0510 0.013 0.057 1.170 0.039 0.001 0.001 0.020 0.135 0.269 0.029 0.100 0.011 0.001 0.007 3.70408-09-2015 2200 0.014 0.057 1.168 0.039 0.001 0.001 0.021 0.135 0.271 0.028 0.100 0.011 0.001 0.007 3.70908-11-2015 AM 0.013 0.057 1.172 0.039 0.001 0.001 0.020 0.136 0.270 0.028 0.099 0.010 0.001 0.007 3.71008-11-2015 1154 0.013 0.058 1.174 0.038 0.001 0.001 0.021 0.135 0.268 0.028 0.099 0.011 0.001 0.008 3.71208-11-2015 1419 0.013 0.061 1.175 0.038 0.001 0.001 0.020 0.133 0.265 0.028 0.098 0.010 0.001 0.008 3.70308-11-2015 1739 0.013 0.061 1.173 0.039 0.001 0.001 0.021 0.134 0.267 0.028 0.098 0.010 0.001 0.008 3.70908-12-2015 0009 0.014 0.061 1.175 0.038 0.001 0.001 0.021 0.133 0.266 0.028 0.098 0.010 0.001 0.008 3.70708-13-2015 0750 0.014 0.059 1.171 0.039 0.001 0.001 0.021 0.135 0.267 0.029 0.099 0.011 0.001 0.008 3.71008-13-2015 1355 0.014 0.062 1.171 0.039 0.001 0.001 0.021 0.134 0.266 0.028 0.099 0.011 0.001 0.008 3.71008-14-2015 0238 0.014 0.057 1.166 0.040 0.001 0.001 0.021 0.137 0.274 0.029 0.101 0.011 0.001 0.008 3.721
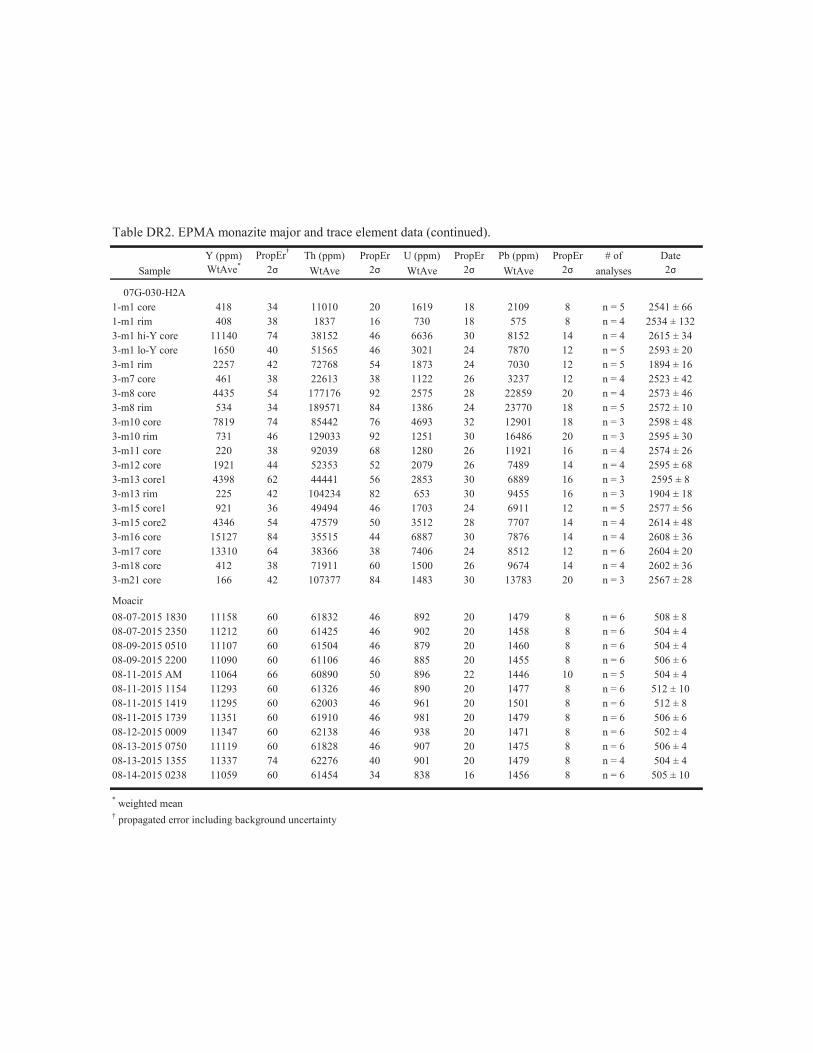
Table DR2. EPMA monazite major and trace element data (continued).
Y (ppm) PropEr† Th (ppm) PropEr U (ppm) PropEr Pb (ppm) PropEr # of DateSample WtAve* 2σ WtAve 2σ WtAve 2σ WtAve 2σ analyses 2σ
07G-030-H2A1-m1 core 418 34 11010 20 1619 18 2109 8 n = 5 2541 ± 661-m1 rim 408 38 1837 16 730 18 575 8 n = 4 2534 ± 1323-m1 hi-Y core 11140 74 38152 46 6636 30 8152 14 n = 4 2615 ± 343-m1 lo-Y core 1650 40 51565 46 3021 24 7870 12 n = 5 2593 ± 203-m1 rim 2257 42 72768 54 1873 24 7030 12 n = 5 1894 ± 163-m7 core 461 38 22613 38 1122 26 3237 12 n = 4 2523 ± 423-m8 core 4435 54 177176 92 2575 28 22859 20 n = 4 2573 ± 463-m8 rim 534 34 189571 84 1386 24 23770 18 n = 5 2572 ± 103-m10 core 7819 74 85442 76 4693 32 12901 18 n = 3 2598 ± 483-m10 rim 731 46 129033 92 1251 30 16486 20 n = 3 2595 ± 303-m11 core 220 38 92039 68 1280 26 11921 16 n = 4 2574 ± 263-m12 core 1921 44 52353 52 2079 26 7489 14 n = 4 2595 ± 683-m13 core1 4398 62 44441 56 2853 30 6889 16 n = 3 2595 ± 83-m13 rim 225 42 104234 82 653 30 9455 16 n = 3 1904 ± 183-m15 core1 921 36 49494 46 1703 24 6911 12 n = 5 2577 ± 563-m15 core2 4346 54 47579 50 3512 28 7707 14 n = 4 2614 ± 483-m16 core 15127 84 35515 44 6887 30 7876 14 n = 4 2608 ± 363-m17 core 13310 64 38366 38 7406 24 8512 12 n = 6 2604 ± 203-m18 core 412 38 71911 60 1500 26 9674 14 n = 4 2602 ± 363-m21 core 166 42 107377 84 1483 30 13783 20 n = 3 2567 ± 28
Moacir08-07-2015 1830 11158 60 61832 46 892 20 1479 8 n = 6 508 ± 808-07-2015 2350 11212 60 61425 46 902 20 1458 8 n = 6 504 ± 408-09-2015 0510 11107 60 61504 46 879 20 1460 8 n = 6 504 ± 408-09-2015 2200 11090 60 61106 46 885 20 1455 8 n = 6 506 ± 608-11-2015 AM 11064 66 60890 50 896 22 1446 10 n = 5 504 ± 408-11-2015 1154 11293 60 61326 46 890 20 1477 8 n = 6 512 ± 1008-11-2015 1419 11295 60 62003 46 961 20 1501 8 n = 6 512 ± 808-11-2015 1739 11351 60 61910 46 981 20 1479 8 n = 6 506 ± 608-12-2015 0009 11347 60 62138 46 938 20 1471 8 n = 6 502 ± 408-13-2015 0750 11119 60 61828 46 907 20 1475 8 n = 6 506 ± 408-13-2015 1355 11337 74 62276 40 901 20 1479 8 n = 4 504 ± 408-14-2015 0238 11059 60 61454 34 838 16 1456 8 n = 6 505 ± 10
* weighted mean† propagated error including background uncertainty
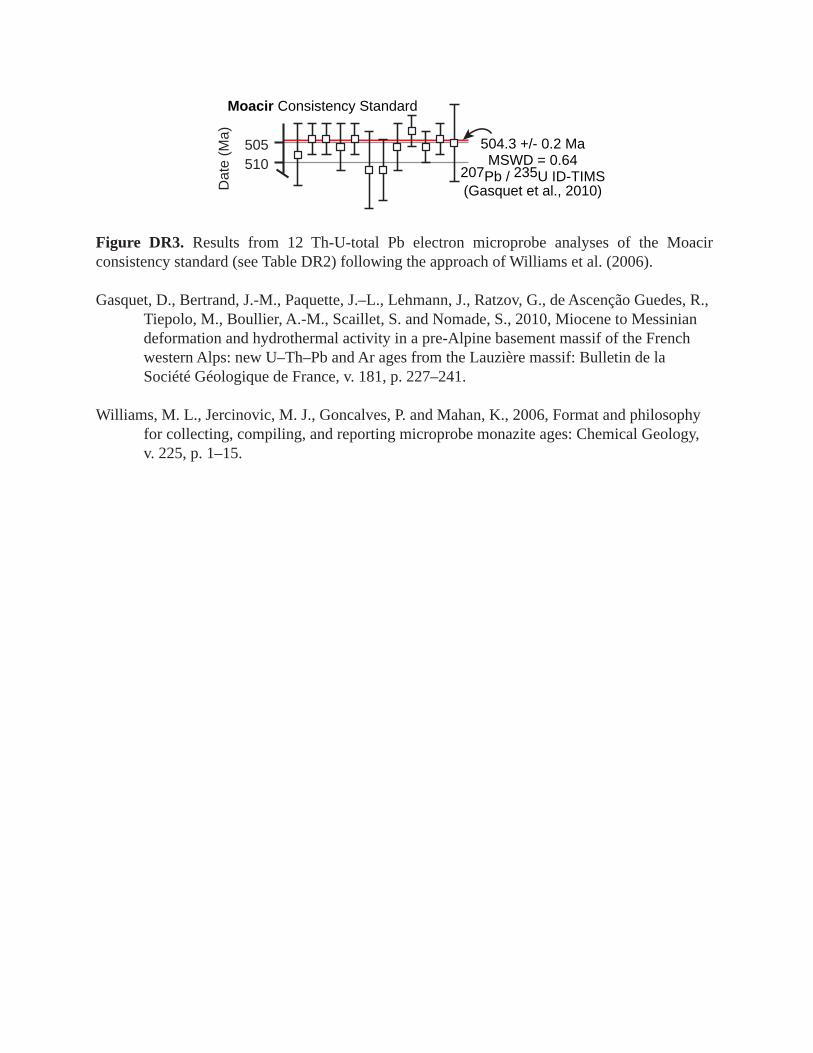
Figure DR3. Results from 12 Th-U-total Pb electron microprobe analyses of the Moacir consistency standard (see Table DR2) following the approach of Williams et al. (2006).
Gasquet, D., Bertrand, J.-M., Paquette, J.–L., Lehmann, J., Ratzov, G., de Ascenção Guedes, R., Tiepolo, M., Boullier, A.-M., Scaillet, S. and Nomade, S., 2010, Miocene to Messinian deformation and hydrothermal activity in a pre-Alpine basement massif of the French western Alps: new U–Th–Pb and Ar ages from the Lauzière massif: Bulletin de la Société Géologique de France, v. 181, p. 227–241.
Williams, M. L., Jercinovic, M. J., Goncalves, P. and Mahan, K., 2006, Format and philosophy for collecting, compiling, and reporting microprobe monazite ages: Chemical Geology, v. 225, p. 1–15.
Dat
e (M
a)
Moacir Consistency Standard
504.3 +/- 0.2 MaMSWD = 0.64
207Pb / 235U ID-TIMS(Gasquet et al., 2010)
505510
Sam
ple/
Prim
itive
MO
RB
C D
= mafic granulites = eclogites
= mafic granulites = eclogites
= 85 backarc basalts (EarthChem PetDB)
0.01
0.1
1
10
La
Ce
Pr
Nd
Sm
Eu
Gd
Tb
Dy
Ho
Er
Tm Lu
La
Ce
Pr
Nd
Sm
Eu
Gd
Tb
Dy Er Yb
Ho Tm Lu
Yb
F [FeOT]
[MgO] MA [Na2O + K2O]
tholeiitic
= 6 mafic granulites = 7 eclogites
calc-alkaline
Sam
ple/
Prim
itive
Arc
And
esiteA B = primitive MORB
0.1
1
10
Rb
Ba
Th
U
K
Ta
Nb
La
Ce
Pr
Sr
Nd
Zr
Hf
Sm
Eu
Gd
Ti
Dy
Y Lu
Yb
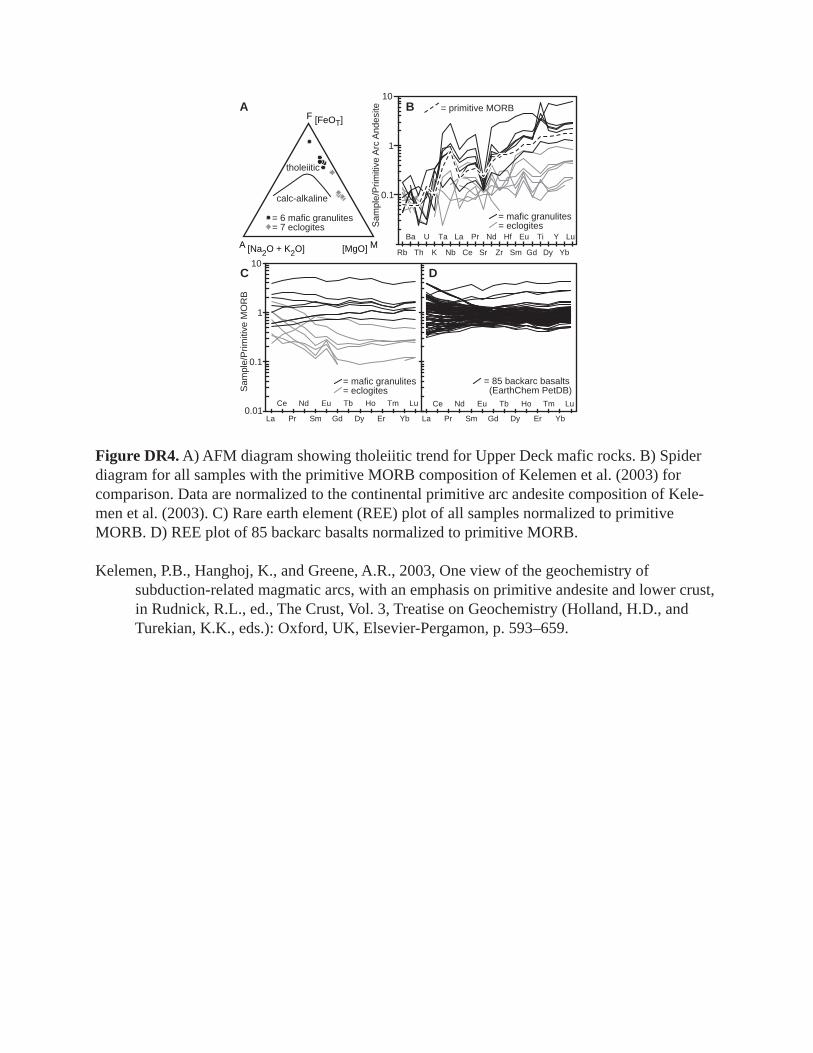
Figure DR4. A) AFM diagram showing tholeiitic trend for Upper Deck mafic rocks. B) Spider diagram for all samples with the primitive MORB composition of Kelemen et al. (2003) for comparison. Data are normalized to the continental primitive arc andesite composition of Kele-men et al. (2003). C) Rare earth element (REE) plot of all samples normalized to primitive MORB. D) REE plot of 85 backarc basalts normalized to primitive MORB.
Kelemen, P.B., Hanghoj, K., and Greene, A.R., 2003, One view of the geochemistry of subduction-related magmatic arcs, with an emphasis on primitive andesite and lower crust, in Rudnick, R.L., ed., The Crust, Vol. 3, Treatise on Geochemistry (Holland, H.D., and Turekian, K.K., eds.): Oxford, UK, Elsevier-Pergamon, p. 593–659.
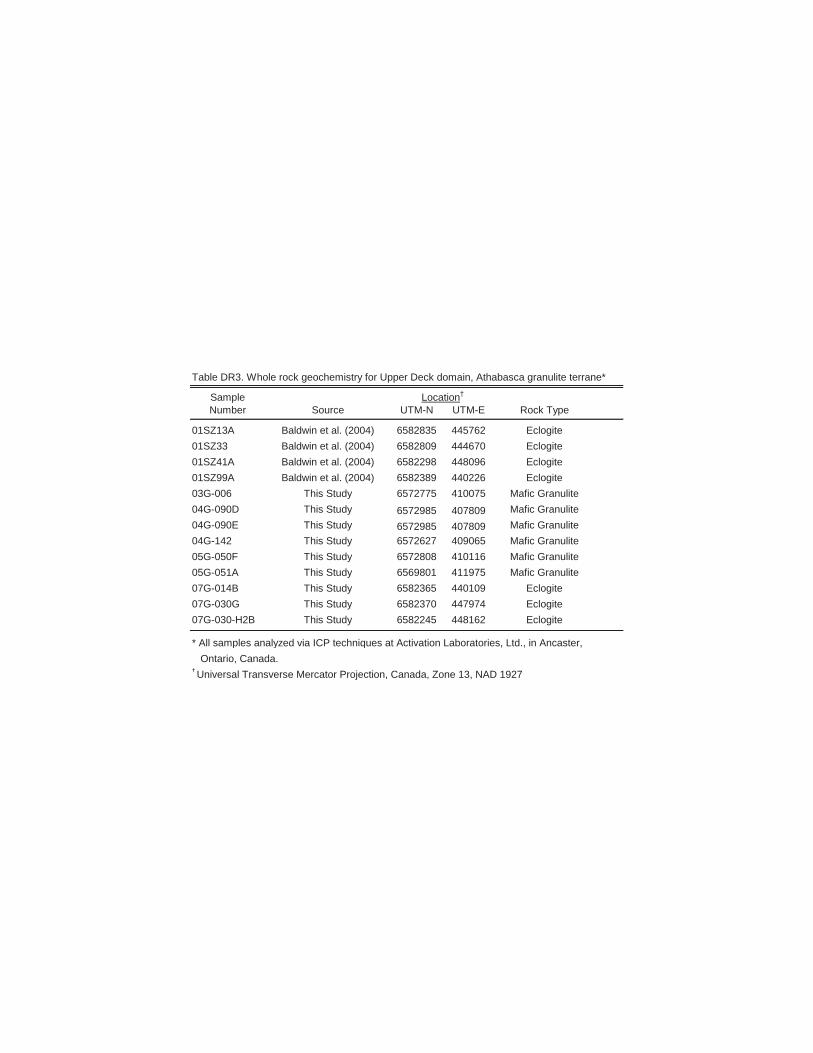
Table DR3. Whole rock geochemistry for Upper Deck domain, Athabasca granulite terrane*
SampleNumber Source UTM-N UTM-E Rock Type
01SZ13A Baldwin et al. (2004) 6582835 445762 Eclogite01SZ33 Baldwin et al. (2004) 6582809 444670 Eclogite01SZ41A Baldwin et al. (2004) 6582298 448096 Eclogite01SZ99A Baldwin et al. (2004) 6582389 440226 Eclogite03G-006 This Study 6572775 410075 Mafic Granulite04G-090D This Study 6572985 407809 Mafic Granulite04G-090E This Study 6572985 407809 Mafic Granulite04G-142 This Study 6572627 409065 Mafic Granulite05G-050F This Study 6572808 410116 Mafic Granulite05G-051A This Study 6569801 411975 Mafic Granulite07G-014B This Study 6582365 440109 Eclogite07G-030G This Study 6582370 447974 Eclogite07G-030-H2B This Study 6582245 448162 Eclogite
* All samples analyzed via ICP techniques at Activation Laboratories, Ltd., in Ancaster, Ontario, Canada.† Universal Transverse Mercator Projection, Canada, Zone 13, NAD 1927
Location†
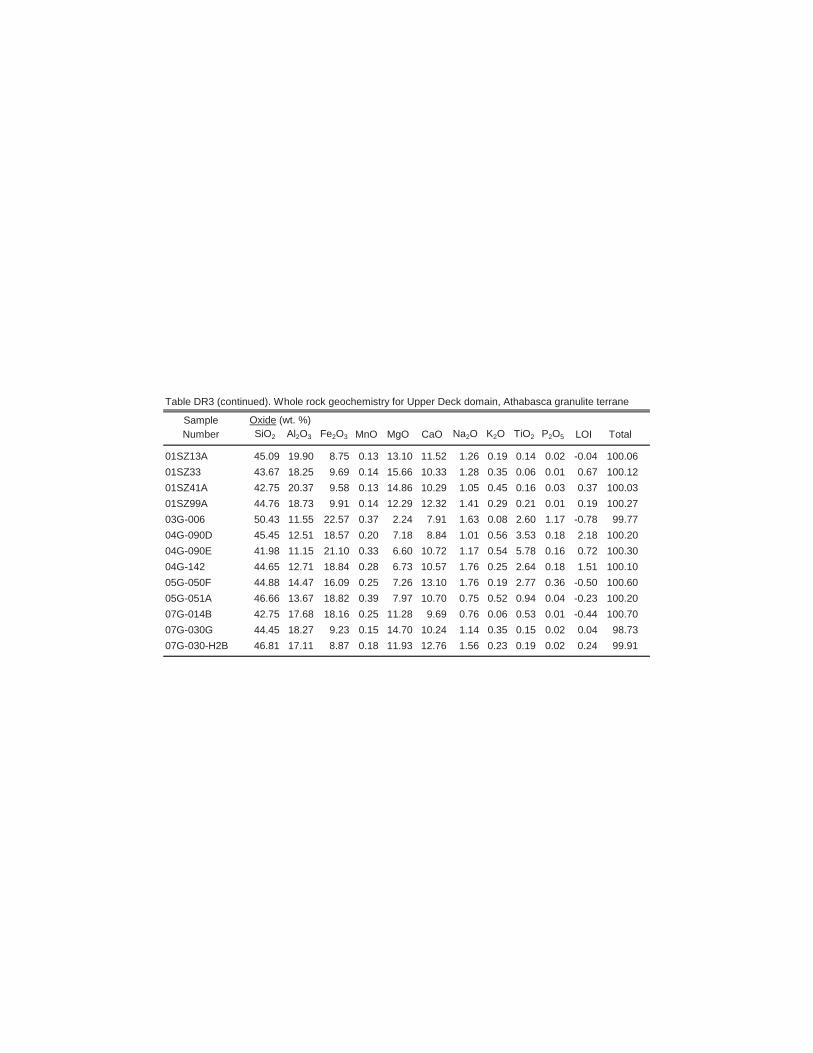
Table DR3 (continued). Whole rock geochemistry for Upper Deck domain, Athabasca granulite terrane
Sample Oxide (wt. %)Number SiO2 Al2O3 Fe2O3 MnO MgO CaO Na2O K2O TiO2 P2O5 LOI Total
01SZ13A 45.09 19.90 8.75 0.13 13.10 11.52 1.26 0.19 0.14 0.02 -0.04 100.0601SZ33 43.67 18.25 9.69 0.14 15.66 10.33 1.28 0.35 0.06 0.01 0.67 100.1201SZ41A 42.75 20.37 9.58 0.13 14.86 10.29 1.05 0.45 0.16 0.03 0.37 100.0301SZ99A 44.76 18.73 9.91 0.14 12.29 12.32 1.41 0.29 0.21 0.01 0.19 100.2703G-006 50.43 11.55 22.57 0.37 2.24 7.91 1.63 0.08 2.60 1.17 -0.78 99.7704G-090D 45.45 12.51 18.57 0.20 7.18 8.84 1.01 0.56 3.53 0.18 2.18 100.2004G-090E 41.98 11.15 21.10 0.33 6.60 10.72 1.17 0.54 5.78 0.16 0.72 100.3004G-142 44.65 12.71 18.84 0.28 6.73 10.57 1.76 0.25 2.64 0.18 1.51 100.1005G-050F 44.88 14.47 16.09 0.25 7.26 13.10 1.76 0.19 2.77 0.36 -0.50 100.6005G-051A 46.66 13.67 18.82 0.39 7.97 10.70 0.75 0.52 0.94 0.04 -0.23 100.2007G-014B 42.75 17.68 18.16 0.25 11.28 9.69 0.76 0.06 0.53 0.01 -0.44 100.7007G-030G 44.45 18.27 9.23 0.15 14.70 10.24 1.14 0.35 0.15 0.02 0.04 98.7307G-030-H2B 46.81 17.11 8.87 0.18 11.93 12.76 1.56 0.23 0.19 0.02 0.24 99.91
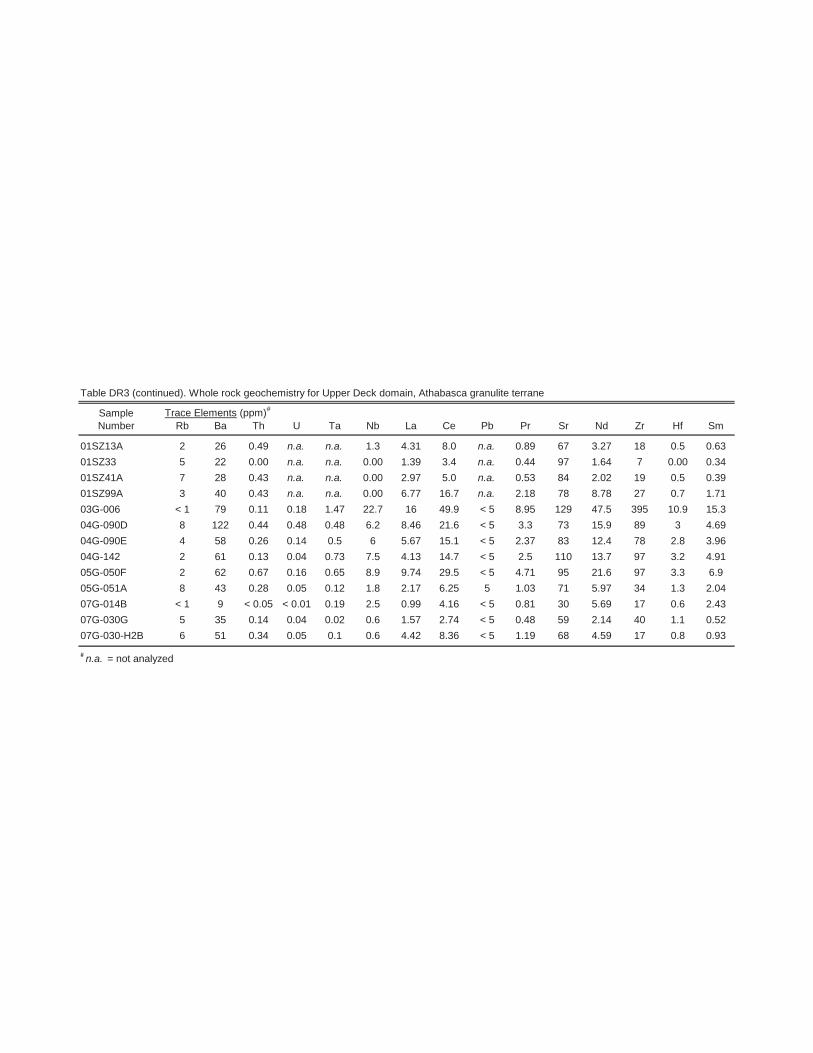
Table DR3 (continued). Whole rock geochemistry for Upper Deck domain, Athabasca granulite terrane
Sample Trace Elements (ppm)#
Number Rb Ba Th U Ta Nb La Ce Pb Pr Sr Nd Zr Hf Sm
01SZ13A 2 26 0.49 n.a. n.a. 1.3 4.31 8.0 n.a. 0.89 67 3.27 18 0.5 0.6301SZ33 5 22 0.00 n.a. n.a. 0.00 1.39 3.4 n.a. 0.44 97 1.64 7 0.00 0.3401SZ41A 7 28 0.43 n.a. n.a. 0.00 2.97 5.0 n.a. 0.53 84 2.02 19 0.5 0.3901SZ99A 3 40 0.43 n.a. n.a. 0.00 6.77 16.7 n.a. 2.18 78 8.78 27 0.7 1.7103G-006 < 1 79 0.11 0.18 1.47 22.7 16 49.9 < 5 8.95 129 47.5 395 10.9 15.304G-090D 8 122 0.44 0.48 0.48 6.2 8.46 21.6 < 5 3.3 73 15.9 89 3 4.6904G-090E 4 58 0.26 0.14 0.5 6 5.67 15.1 < 5 2.37 83 12.4 78 2.8 3.9604G-142 2 61 0.13 0.04 0.73 7.5 4.13 14.7 < 5 2.5 110 13.7 97 3.2 4.9105G-050F 2 62 0.67 0.16 0.65 8.9 9.74 29.5 < 5 4.71 95 21.6 97 3.3 6.905G-051A 8 43 0.28 0.05 0.12 1.8 2.17 6.25 5 1.03 71 5.97 34 1.3 2.0407G-014B < 1 9 < 0.05 < 0.01 0.19 2.5 0.99 4.16 < 5 0.81 30 5.69 17 0.6 2.4307G-030G 5 35 0.14 0.04 0.02 0.6 1.57 2.74 < 5 0.48 59 2.14 40 1.1 0.5207G-030-H2B 6 51 0.34 0.05 0.1 0.6 4.42 8.36 < 5 1.19 68 4.59 17 0.8 0.93
# n.a. = not analyzed
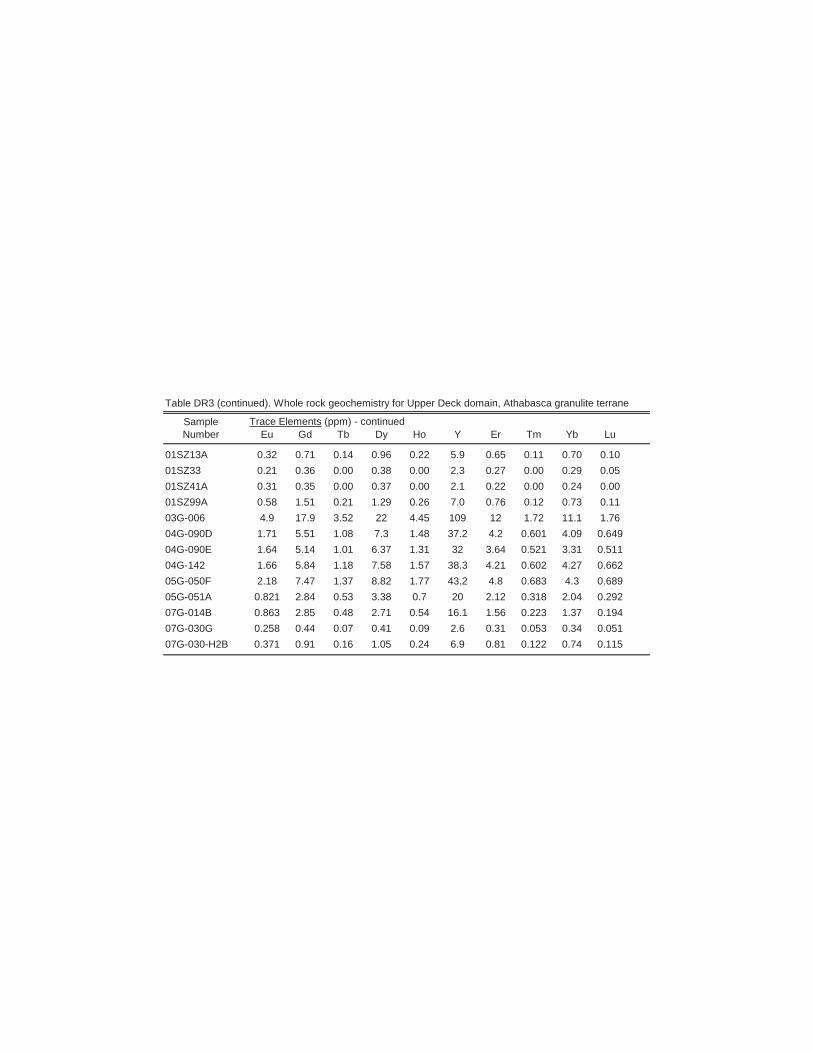
Table DR3 (continued). Whole rock geochemistry for Upper Deck domain, Athabasca granulite terrane
Sample Trace Elements (ppm) - continuedNumber Eu Gd Tb Dy Ho Y Er Tm Yb Lu
01SZ13A 0.32 0.71 0.14 0.96 0.22 5.9 0.65 0.11 0.70 0.1001SZ33 0.21 0.36 0.00 0.38 0.00 2.3 0.27 0.00 0.29 0.0501SZ41A 0.31 0.35 0.00 0.37 0.00 2.1 0.22 0.00 0.24 0.0001SZ99A 0.58 1.51 0.21 1.29 0.26 7.0 0.76 0.12 0.73 0.1103G-006 4.9 17.9 3.52 22 4.45 109 12 1.72 11.1 1.7604G-090D 1.71 5.51 1.08 7.3 1.48 37.2 4.2 0.601 4.09 0.64904G-090E 1.64 5.14 1.01 6.37 1.31 32 3.64 0.521 3.31 0.51104G-142 1.66 5.84 1.18 7.58 1.57 38.3 4.21 0.602 4.27 0.66205G-050F 2.18 7.47 1.37 8.82 1.77 43.2 4.8 0.683 4.3 0.68905G-051A 0.821 2.84 0.53 3.38 0.7 20 2.12 0.318 2.04 0.29207G-014B 0.863 2.85 0.48 2.71 0.54 16.1 1.56 0.223 1.37 0.19407G-030G 0.258 0.44 0.07 0.41 0.09 2.6 0.31 0.053 0.34 0.05107G-030-H2B 0.371 0.91 0.16 1.05 0.24 6.9 0.81 0.122 0.74 0.115
Related Documents


