This is a repository copy of Back-analysis of a raft in overconsolidated stiff clay. White Rose Research Online URL for this paper: http://eprints.whiterose.ac.uk/82372/ Proceedings Paper: Pillai, A, Fuentes, R and Ferreira, P (2013) Back-analysis of a raft in overconsolidated stiff clay. In: Anagnostopoulos, A, Pachakis, M and Tsatsanifos, C, (eds.) Proceedings of the 15th European Conference on Soil Mechanics and Geotechnical Engineering. 15th European Conference on Soil Mechanics and Geotechnical Engineering, 12-15 September 2011, Athens, Greece. IOS Press , 781 - 786 (7). ISBN 978-1-60750-800-7 [email protected] https://eprints.whiterose.ac.uk/ Reuse Unless indicated otherwise, fulltext items are protected by copyright with all rights reserved. The copyright exception in section 29 of the Copyright, Designs and Patents Act 1988 allows the making of a single copy solely for the purpose of non-commercial research or private study within the limits of fair dealing. The publisher or other rights-holder may allow further reproduction and re-use of this version - refer to the White Rose Research Online record for this item. Where records identify the publisher as the copyright holder, users can verify any specific terms of use on the publisher’s website. Takedown If you consider content in White Rose Research Online to be in breach of UK law, please notify us by emailing [email protected] including the URL of the record and the reason for the withdrawal request.

Welcome message from author
This document is posted to help you gain knowledge. Please leave a comment to let me know what you think about it! Share it to your friends and learn new things together.
Transcript

This is a repository copy of Back-analysis of a raft in overconsolidated stiff clay.
White Rose Research Online URL for this paper:http://eprints.whiterose.ac.uk/82372/
Proceedings Paper:Pillai, A, Fuentes, R and Ferreira, P (2013) Back-analysis of a raft in overconsolidated stiff clay. In: Anagnostopoulos, A, Pachakis, M and Tsatsanifos, C, (eds.) Proceedings of the 15th European Conference on Soil Mechanics and Geotechnical Engineering. 15th European Conference on Soil Mechanics and Geotechnical Engineering, 12-15 September2011, Athens, Greece. IOS Press , 781 - 786 (7). ISBN 978-1-60750-800-7
[email protected]://eprints.whiterose.ac.uk/
Reuse Unless indicated otherwise, fulltext items are protected by copyright with all rights reserved. The copyright exception in section 29 of the Copyright, Designs and Patents Act 1988 allows the making of a single copy solely for the purpose of non-commercial research or private study within the limits of fair dealing. The publisher or other rights-holder may allow further reproduction and re-use of this version - refer to the White Rose Research Online record for this item. Where records identify the publisher as the copyright holder, users can verify any specific terms of use on the publisher’s website.
Takedown If you consider content in White Rose Research Online to be in breach of UK law, please notify us by emailing [email protected] including the URL of the record and the reason for the withdrawal request.

Back-analysis of a basement with a raft foundation in overconsolidated stiff clay
Back-analyse d'un sous-sol avec un radier en argile raide surconsolidée
A. Pillai Arup, UK
R. Fuentes1, UCL and Arup, UK
P. Ferreira & A. Swain UCL, UK
ABSTRACT
This paper presents details on the construction of a deep basement where a raft foundation was used. A detailed three dimen-sional back-analysis has been carried out using the BRICK updated soil parameters. The results show that the �most probable�parameters match reality reasonably well, providing confidence in their description of the actual soil-structure interaction. The field measurements show that the control movements were excellent during construction and fall within the low bound values ofhistorical data presented in the literature for similar conditions.
RÉSUMÉ
Cet article présente des détails sur la construction d'un sous-sol profond où un radier a été utilisé. A trois pas en arrière détaillée dimensions-analyse a été effectuée en utilisant les paramètres BRICK sols mis à jour. Les résultats montrent que les paramètres «plus probable» correspondent à la réalité assez bien, donner confiance dans leur description de l'interaction sol-structure réelle. Les mesures sur le terrain montrent que les mouvements de contrôle ont été excellents pendant la construction et à l'automnedans les valeurs limite basse de données historiques présentées dans la littérature pour des conditions similaires.
Keywords: Deep basement, soil-structure interaction, numerical analysis, raft, settlement, monitoring, instrumentation
1 Corresponding Author. UCL and ARUP Geotechnics.
1 INTRODUCTION
The paper presents the case study of a deep ex-cavation in the city of London where the main objective is the validation of the �most probable� BRICK parameters in a three dimensional nu-merical analysis.
2 SITE DESCRIPTION
The existing ground level around the site rises from approximately +14.0mOD to +15.5mOD in the north/south direction.
The new development consisted in the con-struction of a basement using a secant pile wall with a depth between 10m and 11.5m to a forma-tion level of +4.0mOD.
The built raft was 1.5m deep. The site was oc-cupied by two existing buildings. Both had a one level basement at approximately +11.0mOD and +10.5mOD. These buildings were demolished for the new development, and the basements backfilled to create a platform for piling.
Figure 1 shows a site plan. At the east side, a London Underground line runs through a for-merly open cut almost parallel to the new base-ment wall. In the south side, an existing subway

passes beneath St Botolph Street and Hounds-ditch. At the south west corner this is less than 1m away from the proposed wall. In order to avoid all the complexities introduced by these structures, the north west corner was selected as an object of study in this paper. The area is marked by a dashed line in Figure 1. The dash and dotted line represents the line of the pro-posed wall approximately, which covers an area of 90m x 55m approximately in plan.
Table 1. Soil stratigraphy and geotechnical parameters
Soil
Type
Elevation top of strata
(mOD)
Unit weight
(kN/m3)
E�, (MPa)
Ȟ ij', (deg)
Ko
Made Ground
+15.5 to +14.5
18 1.0 0.2 25 0.58
Terrace deposits
+10.2 20 3.5 0.2 35 0.43
London Clay
+4.2 20 BRICK - - -
Harwich Formation
-27.5 20 150 0.2 39 0.37
Thanet Sand
-45 20 150 0.2 39 0.37
3 GROUND & POREWATER CONDITIONS
The ground investigation comprised the follow-ing: (i) Three boreholes drilled by cable percus-sive methods to an average depth of 45m below ground level; (ii) four observation pits to a maximum depth of 2.1m to investigate areas of potential contamination; (iii) six horizontal con-crete cores to investigate existing basement walls; (iv) six vertical cores to investigate the ex-isting basement structure; (v) four inclined cores and one vertical core drilled using a Beretta T41 track mounted rotary rig to investigate the ge-ometry and composition of the LUL reclined wall and to prove the top of the London Clay in the northern boundary of the site; (vi) nine trial pits to locate utility services within the surround-ing pavements; (vii) installation of two vibrating wire piezometers and one standpipe in the bore-holes.
Figure 1. Site map and location of instruments
From the investigation above, the initial soil
stratigraphy and parameters were derived as shown in Table 1. The derivation of these pa-rameters is outside the scope of this paper.
The BRICK soil model was used to model the behaviour of London clay. This model was firstly introduced by Simpson [1], later reviewed by Pil-lai [2] and lastly finalised in a 3D version devel-oped by Brian Simpson, which has been recently developed by Ellison et al [3]. This model is a non-linear elasto-plastic model, which is strain based. The model generates the Ko profile based on the stress history assumed for the site. Details are given by Simpson [1] and Ellison [3].
A hydrostatic profile from level +8mOD was taken for the model before demolition of existing buildings began.
The installed piezometers showed an under-drained profile at the London Clay, with a slope of approximately 20% of the hydrostatic full pro-file. The porewater pressures followed a hydro-static profile for the deposits below the London Clay.
4 CONSTRUCTION SEQUENCE
Table 2 shows the construction sequence based on �as built� records focusing in the north west corner. Stages 1 to 4 cover the site history and the construction of the existing buildings. Stages 5 to 15 cover the works carried out for the con-struction of the new development up to the end

of September 2008. The numerical analysis was carried out for this work up to Stage 12. Table 2. Modelled and actual construction sequence
Stage Description
1 Initialisation.
2
Wish in place gravity wall, old building wall on
the perimeter of the excavation zone and old
building ground floor slab. (Undr.).
3
Installation of existing basement slab at
10.2mOD, application of the spread load of pre-
vious building. (Undr.).
4 Apply new pwp profile (Dr.).
5 Demolition of existing building (Undr.).
6 Backfill materials into existing basement (Undr.).
7 Wish in place new secant wall (Undr.).
8
05/03/08 � Wish in place king posts and props to
existing retaining wall. Excavation of north side
to +11.8moD. (Undr.).
9 23/04/08 � Wish in place first row of corner
props. Further excavation to +7.9mOD. (Undr.).
10 21/05/08 � Construction of access ramp in north
side of the site. (Undr.).
11
26/06/08 � Wish in place second row of props in
corner. All site reduced to level +7.9mOD except
access ramp in north side. (Undr.).
12
28/07/08 � Excavation to formation level
(+4.0mOD approx.), removal of access ramp.
Foundations for tower cranes being built.
(Undr.).
13
03/09/08 � Tower cranes in place. North core
starts to be built. Wish in place raking props at
minipiles. Raft cast. (Undr.).
14
16/09/08 � Further progress on raft construction
up to half way into minipiles location in west
wall. (Undr.).
15
29/09/08 � Access ramp reduced even further.
Removal of first corner prop in NW corner.
(Undr.).
It is important to highlight that less than 10
days went by between excavation to formation level and casting of the raft in the north west corner of the site.
The temporary works consisted of 660mm di-ameter circular hollow sections (CHS) corner props mounted on 305x305x118 universal col-umns (UC) king posts and tie beams, and 152x152x30 UC raking props connected to wal-ing beams in the minipiles areas as shown in Figure 2. Details of the above sections in the UK can be found in the SCI Blue Book [4].
Figure 2. Propping system on 21/07/08 in the north-east cor-ner.
5 MONITORING
A comprehensive monitoring scheme was im-plemented on site, which consisted of: (i) 37 No. precise levelling studs on surrounding pave-ments, subways, footpaths and structures for measurement of vertical displacement; ii) 14 No. reflective survey targets on adjacent buildings façades for measurement of horizontal and verti-cal displacement; iii) 4 No. tiltmeters and 4 No. reflective survey targets for an adjacent under-ground tunnel retaining wall to measure horizon-tal and vertical displacement; iv) 8 No. incli-nometers installed within the new secant pile wall for measurement of wall deflection profiles; and v) 8 No. reflective survey targets on the se-cant pile wall capping beam to measure wall de-flection. Figure 1 shows the location of the in-strumentation.
It was assumed that the inclinometers were fixed at the bottom and therefore, no further cor-rection was needed.
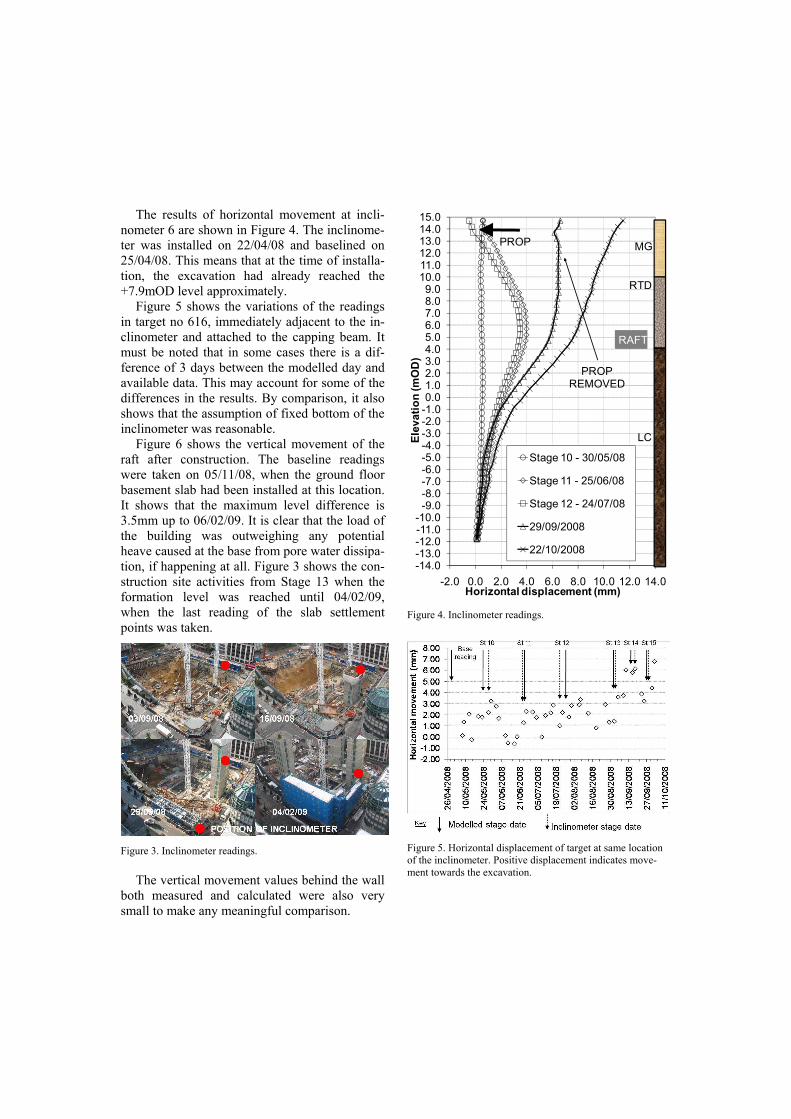
The results of horizontal movement at incli-nometer 6 are shown in Figure 4. The inclinome-ter was installed on 22/04/08 and baselined on 25/04/08. This means that at the time of installa-tion, the excavation had already reached the +7.9mOD level approximately.
Figure 5 shows the variations of the readings in target no 616, immediately adjacent to the in-clinometer and attached to the capping beam. It must be noted that in some cases there is a dif-ference of 3 days between the modelled day and available data. This may account for some of the differences in the results. By comparison, it also shows that the assumption of fixed bottom of the inclinometer was reasonable.
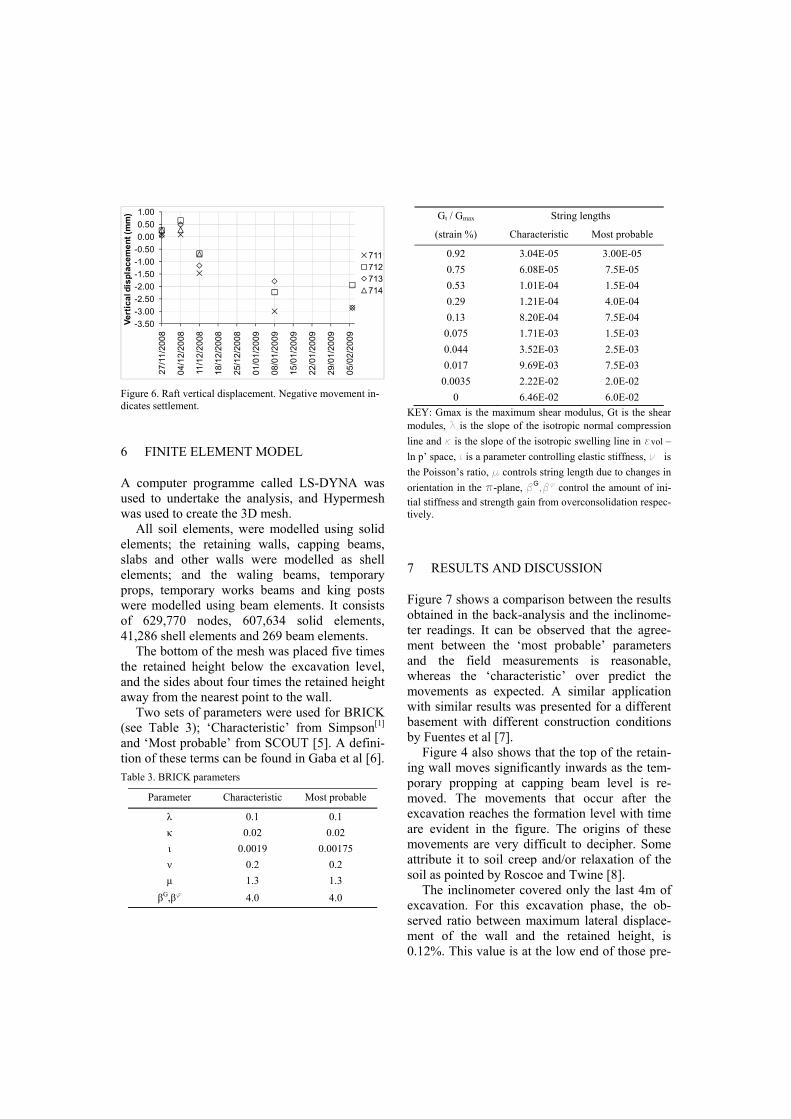
Figure 6 shows the vertical movement of the raft after construction. The baseline readings were taken on 05/11/08, when the ground floor basement slab had been installed at this location. It shows that the maximum level difference is 3.5mm up to 06/02/09. It is clear that the load of the building was outweighing any potential heave caused at the base from pore water dissipa-tion, if happening at all. Figure 3 shows the con-struction site activities from Stage 13 when the formation level was reached until 04/02/09, when the last reading of the slab settlement points was taken.
Figure 3. Inclinometer readings.
The vertical movement values behind the wall
both measured and calculated were also very small to make any meaningful comparison.
-14.0-13.0-12.0-11.0-10.0
-9.0-8.0-7.0-6.0-5.0-4.0-3.0-2.0-1.00.01.02.03.04.05.06.07.08.09.0
10.011.012.013.014.015.0
-2.0 0.0 2.0 4.0 6.0 8.0 10.0 12.0 14.0
Ele
vati
on
(m
OD
)
Horizontal displacement (mm)
Stage 10 - 30/05/08
Stage 11 - 25/06/08
Stage 12 - 24/07/08
29/09/2008
22/10/2008
RAFT
MG
RTD
LC
PROP
PROPREMOVED
Figure 4. Inclinometer readings.
Figure 5. Horizontal displacement of target at same location of the inclinometer. Positive displacement indicates move-ment towards the excavation.
-3.50
-3.00
-2.50
-2.00
-1.50
-1.00
-0.50
0.00
0.50
1.00
27
/11
/20
08
04
/12
/20
08
11
/12
/20
08
18
/12
/20
08
25
/12
/20
08
01
/01
/20
09
08
/01
/20
09
15
/01
/20
09
22
/01
/20
09
29
/01
/20
09
05
/02
/20
09
Ve
rtic
al d
isp
lac
em
en
t (m
m)
711
712
713
714
Figure 6. Raft vertical displacement. Negative movement in-dicates settlement.
6 FINITE ELEMENT MODEL
A computer programme called LS-DYNA was used to undertake the analysis, and Hypermesh was used to create the 3D mesh.
All soil elements, were modelled using solid elements; the retaining walls, capping beams, slabs and other walls were modelled as shell elements; and the waling beams, temporary props, temporary works beams and king posts were modelled using beam elements. It consists of 629,770 nodes, 607,634 solid elements, 41,286 shell elements and 269 beam elements.
The bottom of the mesh was placed five times the retained height below the excavation level, and the sides about four times the retained height away from the nearest point to the wall.
Two sets of parameters were used for BRICK (see Table 3); �Characteristic� from Simpson[1] and �Most probable� from SCOUT [5]. A defini-tion of these terms can be found in Gaba et al [6]. Table 3. BRICK parameters
Parameter Characteristic Most probable
Ȝ 0.1 0.1
ț 0.02 0.02
Ț 0.0019 0.00175
Ȟ 0.2 0.2
ȝ 1.3 1.3
ȕG,ȕf 4.0 4.0
Gt / Gmax String lengths
(strain %) Characteristic Most probable
0.92 3.04E-05 3.00E-05
0.75 6.08E-05 7.5E-05
0.53 1.01E-04 1.5E-04
0.29 1.21E-04 4.0E-04
0.13 8.20E-04 7.5E-04
0.075 1.71E-03 1.5E-03
0.044 3.52E-03 2.5E-03
0.017 9.69E-03 7.5E-03
0.0035 2.22E-02 2.0E-02
0 6.46E-02 6.0E-02
KEY: Gmax is the maximum shear modulus, Gt is the shear modules, λ is the slope of the isotropic normal compression
line and κ is the slope of the isotropic swelling line in evol �
ln p� space, ι is a parameter controlling elastic stiffness, ν is
the Poisson�s ratio, μ controls string length due to changes in
orientation in the p-plane, βG,βf control the amount of ini-
tial stiffness and strength gain from overconsolidation respec-tively.
7 RESULTS AND DISCUSSION
Figure 7 shows a comparison between the results obtained in the back-analysis and the inclinome-ter readings. It can be observed that the agree-ment between the �most probable� parameters and the field measurements is reasonable, whereas the �characteristic� over predict the movements as expected. A similar application with similar results was presented for a different basement with different construction conditions by Fuentes et al [7].
Figure 4 also shows that the top of the retain-ing wall moves significantly inwards as the tem-porary propping at capping beam level is re-moved. The movements that occur after the excavation reaches the formation level with time are evident in the figure. The origins of these movements are very difficult to decipher. Some attribute it to soil creep and/or relaxation of the soil as pointed by Roscoe and Twine [8].
The inclinometer covered only the last 4m of excavation. For this excavation phase, the ob-served ratio between maximum lateral displace-ment of the wall and the retained height, is 0.12%. This value is at the low end of those pre-
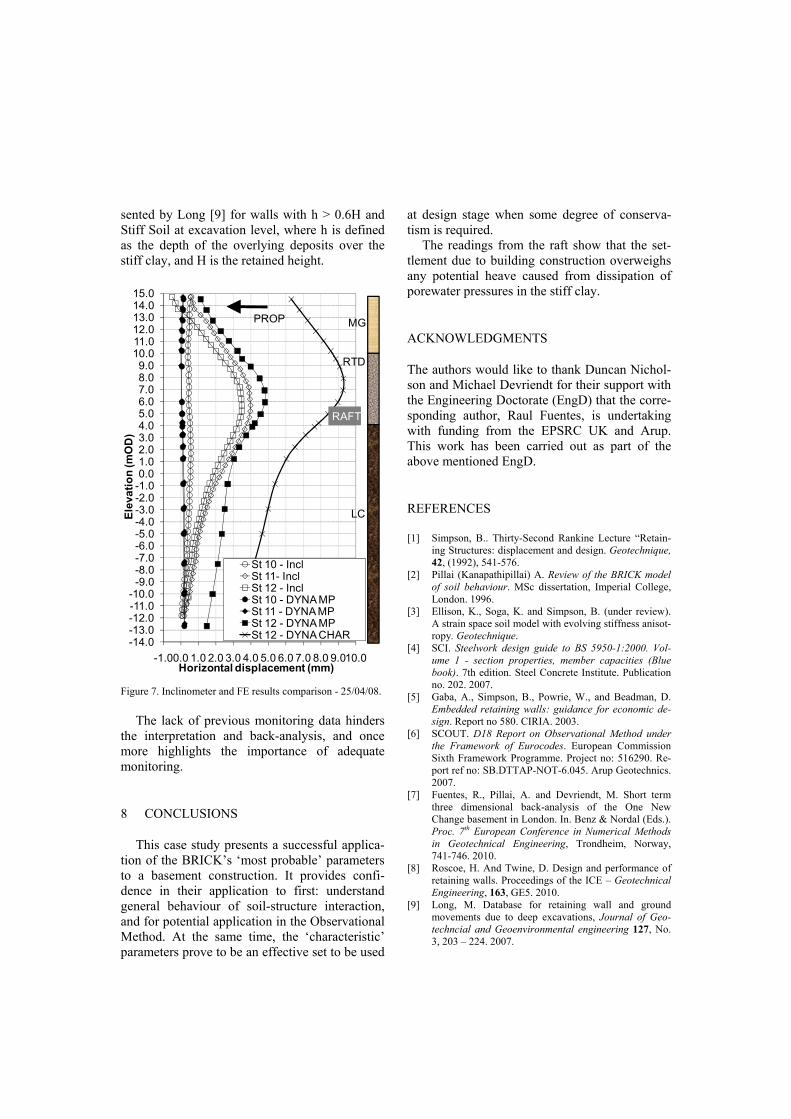
sented by Long [9] for walls with h > 0.6H and Stiff Soil at excavation level, where h is defined as the depth of the overlying deposits over the stiff clay, and H is the retained height.
-14.0-13.0-12.0-11.0-10.0
-9.0-8.0-7.0-6.0-5.0-4.0-3.0-2.0-1.00.01.02.03.04.05.06.07.08.09.0
10.011.012.013.014.015.0
-1.00.0 1.0 2.0 3.0 4.0 5.0 6.0 7.0 8.0 9.010.0
Ele
va
tio
n (m
OD
)
Horizontal displacement (mm)
St 10 - InclSt 11- InclSt 12 - InclSt 10 - DYNA MPSt 11 - DYNA MPSt 12 - DYNA MPSt 12 - DYNA CHAR
RAFT
MG
RTD
LC
PROP
Figure 7. Inclinometer and FE results comparison - 25/04/08.
The lack of previous monitoring data hinders
the interpretation and back-analysis, and once more highlights the importance of adequate monitoring.
8 CONCLUSIONS
This case study presents a successful applica-tion of the BRICK�s �most probable� parameters to a basement construction. It provides confi-dence in their application to first: understand general behaviour of soil-structure interaction, and for potential application in the Observational Method. At the same time, the �characteristic� parameters prove to be an effective set to be used
at design stage when some degree of conserva-tism is required.
The readings from the raft show that the set-tlement due to building construction overweighs any potential heave caused from dissipation of porewater pressures in the stiff clay.
ACKNOWLEDGMENTS
The authors would like to thank Duncan Nichol-son and Michael Devriendt for their support with the Engineering Doctorate (EngD) that the corre-sponding author, Raul Fuentes, is undertaking with funding from the EPSRC UK and Arup. This work has been carried out as part of the above mentioned EngD.
REFERENCES
[1] Simpson, B.. Thirty-Second Rankine Lecture �Retain-ing Structures: displacement and design. Geotechnique,
42, (1992), 541-576. [2] Pillai (Kanapathipillai) A. Review of the BRICK model
of soil behaviour. MSc dissertation, Imperial College, London. 1996.
[3] Ellison, K., Soga, K. and Simpson, B. (under review). A strain space soil model with evolving stiffness anisot-ropy. Geotechnique.
[4] SCI. Steelwork design guide to BS 5950-1:2000. Vol-
ume 1 - section properties, member capacities (Blue
book). 7th edition. Steel Concrete Institute. Publication no. 202. 2007.
[5] Gaba, A., Simpson, B., Powrie, W., and Beadman, D. Embedded retaining walls: guidance for economic de-
sign. Report no 580. CIRIA. 2003. [6] SCOUT. D18 Report on Observational Method under
the Framework of Eurocodes. European Commission Sixth Framework Programme. Project no: 516290. Re-port ref no: SB.DTTAP-NOT-6.045. Arup Geotechnics. 2007.
[7] Fuentes, R., Pillai, A. and Devriendt, M. Short term three dimensional back-analysis of the One New Change basement in London. In. Benz & Nordal (Eds.). Proc. 7th European Conference in Numerical Methods
in Geotechnical Engineering, Trondheim, Norway, 741-746. 2010.
[8] Roscoe, H. And Twine, D. Design and performance of retaining walls. Proceedings of the ICE � Geotechnical
Engineering, 163, GE5. 2010. [9] Long, M. Database for retaining wall and ground
movements due to deep excavations, Journal of Geo-
techncial and Geoenvironmental engineering 127, No. 3, 203 � 224. 2007.
Related Documents