APPLICATION OF EICHHORNIA CRASSIPES ROOT EXTRACT AS AN ACID-BASE INDICATOR BY NHAPI COURAGE T R125797A Submitted in partial fulfillment of the requirements for the degree of Bachelor of Science Honours in Chemical Technology Department of Chemical Technology in the Faculty of Science and Technology at the Midlands State University Supervisor: Mr. T. Nharingo Co-Supervisor: Mrs. N. Zinyama June 2016

Welcome message from author
This document is posted to help you gain knowledge. Please leave a comment to let me know what you think about it! Share it to your friends and learn new things together.
Transcript
APPLICATION OF EICHHORNIA CRASSIPES ROOT EXTRACT AS
AN ACID-BASE INDICATOR
BY
NHAPI COURAGE T
R125797A
Submitted in partial fulfillment of the requirements for the degree of
Bachelor of Science Honours in Chemical Technology
Department of Chemical Technology in the
Faculty of Science and Technology at the
Midlands State University
Supervisor: Mr. T. Nharingo
Co-Supervisor: Mrs. N. Zinyama
June 2016
i
DEDICATION
This research report has been dedicated to the Chemical Technology profession as a whole and
everything that is affected by it. Most of all; for all individuals, groups, mentors, advisors,
lecturers, students, supervisors, colleagues, family, friends and foes alike; and above all else
God omnipotent. My mother, uncles, aunts and relatives fall in into the above mentioned
categories somehow; however theirs is a special mention.
For Chemical Technology aspects, production aspects, mechanical aspects, instrumentation
aspects, innovation, professionalism, knowledge acquired, relationships forged, love, life,
peace, joy, happiness, pleasure, sorrow, prosperity, ingenuity, trust, loyalty, faith, hope, vision,
aspirations and everything in between and not explicitly mentioned.

ii
ACKNOWLEDGEMENTS
Firstly I acknowledge my creator, almighty God for his guidance, protection, provision and
favour throughout the course of my first degree. I would also like to pay due homage and
appreciation to the impartation and wisdom given to me by my supervisors, family, friends and
colleagues alike. This research report and the experiences gained in the period specified would
not have been possible without the energy, resilience and continued effort of the following
individuals:
Mr. Nharingo T. (Project main supervisor)
Mrs. Zinyama N. (Project co-supervisor)
Dr Guyo U. (lecturer)
Philip Machinya
Fellow students
iii
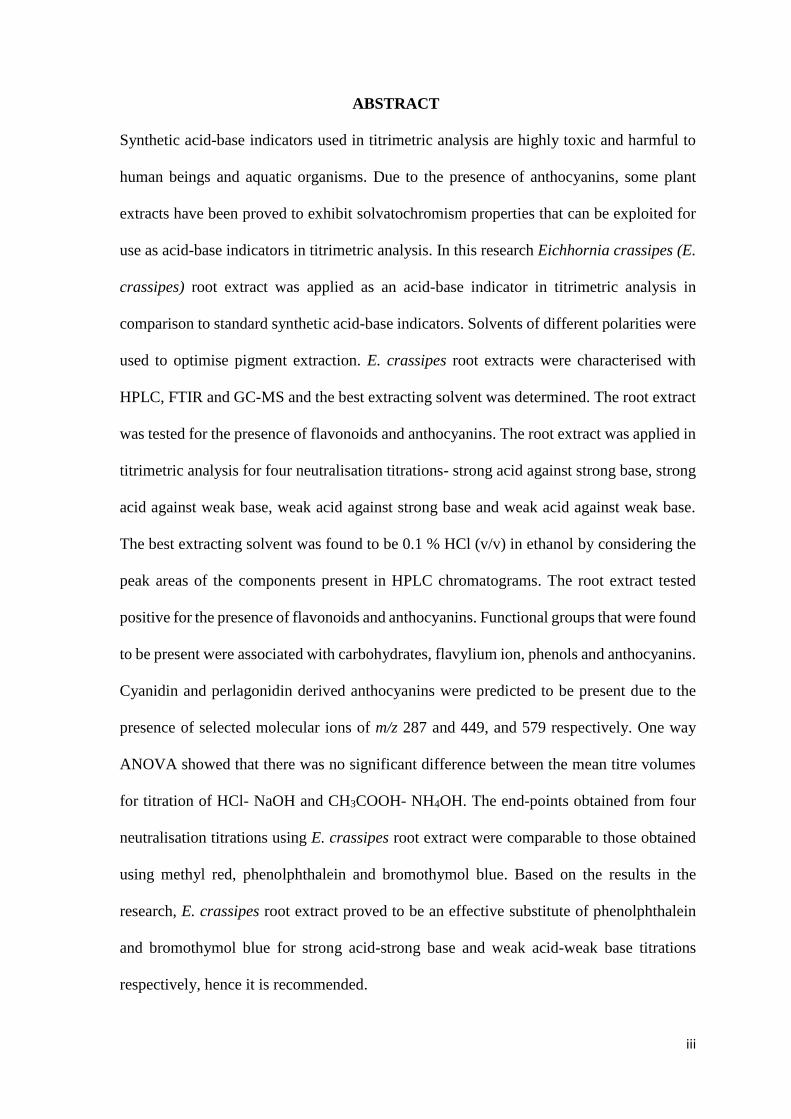
ABSTRACT
Synthetic acid-base indicators used in titrimetric analysis are highly toxic and harmful to
human beings and aquatic organisms. Due to the presence of anthocyanins, some plant
extracts have been proved to exhibit solvatochromism properties that can be exploited for
use as acid-base indicators in titrimetric analysis. In this research Eichhornia crassipes (E.
crassipes) root extract was applied as an acid-base indicator in titrimetric analysis in
comparison to standard synthetic acid-base indicators. Solvents of different polarities were
used to optimise pigment extraction. E. crassipes root extracts were characterised with
HPLC, FTIR and GC-MS and the best extracting solvent was determined. The root extract
was tested for the presence of flavonoids and anthocyanins. The root extract was applied in
titrimetric analysis for four neutralisation titrations- strong acid against strong base, strong
acid against weak base, weak acid against strong base and weak acid against weak base.
The best extracting solvent was found to be 0.1 % HCl (v/v) in ethanol by considering the
peak areas of the components present in HPLC chromatograms. The root extract tested
positive for the presence of flavonoids and anthocyanins. Functional groups that were found
to be present were associated with carbohydrates, flavylium ion, phenols and anthocyanins.
Cyanidin and perlagonidin derived anthocyanins were predicted to be present due to the
presence of selected molecular ions of m/z 287 and 449, and 579 respectively. One way
ANOVA showed that there was no significant difference between the mean titre volumes
for titration of HCl- NaOH and CH3COOH- NH4OH. The end-points obtained from four
neutralisation titrations using E. crassipes root extract were comparable to those obtained
using methyl red, phenolphthalein and bromothymol blue. Based on the results in the
research, E. crassipes root extract proved to be an effective substitute of phenolphthalein
and bromothymol blue for strong acid-strong base and weak acid-weak base titrations
respectively, hence it is recommended.

iv
DECLARATION
I, Nhapi Courage T., hereby declare that I am the sole author of this dissertation. I
authorize Midlands State University to lend this dissertation to other institutions or individuals
for the purpose of scholarly research.
Signature ………………………………
Date ………………………………….

v
APPROVAL
This dissertation entitles “Application of Eicchornia crassipes (water hyacinth) root extract
as an acid-base indicator” by Nhapi Courage T. meets the regulations governing the award
of the degree of Bachelor of Science in Chemical Technology Honours of the Midlands
State University, and is approved for its contribution to knowledge and literal presentation.
Supervisor ………………………………………
Date …………………………………………….

vi
Table of Contents
DEDICATION........................................................................................................................... i
ACKNOWLEDGEMENTS .................................................................................................... ii
ABSRTACT ........................................................................................................................ iii
DECLARATION..................................................................................................................... iv
APPROVAL ............................................................................................................................. v
LIST OF FIGURES ............................................................................................................... xii
LIST OF TABLES ................................................................................................................ xiv
LIST OF ABBREVATIONS ................................................................................................ xvi
CHAPTER ONE ...................................................................................................................... 1
INTRODUCTION.................................................................................................................... 1
1.0 Background ...................................................................................................................... 1
1.1 Aims ................................................................................................................................. 3
1.2 Objectives ......................................................................................................................... 3
1.3 Problem statement ............................................................................................................ 4
1.4 Justification ...................................................................................................................... 5
CHAPTER TWO ..................................................................................................................... 6
LITERATURE REVIEW ....................................................................................................... 6
2.0 Introduction .................................................................................................................... 6
2.1 Acid-base indicators and their use in volumetric analysis ............................................. 6
2.2 Synthetic acid-base indicators (dyes) and their effects to humans and aquatic organism
7
vii
2.2.1 Toxic degradation products of methyl red acid-base indicator ............................. 10
2.3 Application of green chemistry for sustainable development ...................................... 11
2.3.1 Review of studies that were carried out on natural acid-base indicators ............... 11
2.4 Eichhornia Crassipes (water hyacinth) features and its life cycle ................................ 19
2.4.1 Effects of E. crassipes to the environment, humans and aquatic organisms ......... 21
2.4.2 Methods implemented to prevent the spread of E. crassipes in water bodies ....... 21
2.4.3 Application of green chemistry in environmental monitoring e.g. use of E. crassipes
plant .................................................................................................................................. 21
CHAPTER THREE ............................................................................................................... 23
METHODOLOGY ................................................................................................................ 23
3.0 Introduction .................................................................................................................. 23
3.1 E. crassipes sample collection and preparation ........................................................... 23
3.2 Extraction of the pigments using solvents of different polarities................................. 23
3.3 HPLC and GC-MS analysis of the crude extracts ........................................................ 24
3.3.1 Preparation of samples for HPLC analysis ............................................................ 24
3.3.2 HPLC analysis of the crude extracts ...................................................................... 24
3.3.3 GC-MS analysis of the crude extracts ................................................................... 24
3.4 Identification of the best solvent .................................................................................. 25
3.5 Bulk extraction using acidified ethanol (0.1 % HCl in ethanol (v/v)) ......................... 25
3.6 Phytochemical test on crude extract ............................................................................. 26
3.6.1 Test for flavonoids in acidified ethanol extract ..................................................... 26
3.6.2 Test for anthocyanins in acidified ethanol extract ................................................. 26

viii
3.7 Application of the E. crassipes root extract and standard indicators in acid-base titration
26
3.7.1 Determination of colour change of E. crassipes root extract at different pH ........ 26
3.7.2 Titration using E. crassipes root extract, methyl red, phenolphthalein and
bromothymol blue indicators. ........................................................................................... 27
3.8 Data treatment .............................................................................................................. 27
CHAPTER FOUR .................................................................................................................. 28
RESULTS AND DISCUSSION ............................................................................................ 28
4.0 Introduction .................................................................................................................. 28
4.1 Selection of the best extracting solvent results ............................................................ 28
4.2 HPLC results of the crude extracts ............................................................................... 29
4.3 GC-MS results of the crude extracts ............................................................................ 31
4.4 FTIR results of the acidified ethanol extract ................................................................ 35
4.5 Colours of E. crassipes root extract in buffered solutions ........................................... 36
4.5 Phytochemical results for the acidified ethanol crude extract..................................... 37
4.6 Titration results using E. crassipes root extract, methyl red, phenolphthalein and
bromothymol blue as indicators ........................................................................................... 38
4.5.1 Statistical analysis of generated data ..................................................................... 40
CHAPTER FIVE ................................................................................................................... 42
CONCLUSIONS AND RECOMMENDATIONS ............................................................... 42
5.1 Conclusion .................................................................................................................... 42
5.2 Recommendations ..................................................................................................... 43
ix
5.2.1 Further research ....................................................................................................... 43
REFERENCES ....................................................................................................................... 44
a) Apparatus .................................................................................................................. 54
b) Reagents .................................................................................................................... 54
c) Instrumentation.......................................................................................................... 55
APPENDIX B ......................................................................................................................... 56
a) Preparation of extracting solvents ............................................................................. 56
Preparation of 1M hydrochloric acid ................................................................................ 56
Preparation of acidified methanol ..................................................................................... 56
Preparation of acidified ethanol ........................................................................................ 56
Preparation of butan-2-ol: glacial acetic acid: water (BAW) ........................................... 56
Preparation of ethanol ....................................................................................................... 56
Preparation of 4.5 % formic acid in water ........................................................................ 57
b) Preparation of solvent to be used as the mobile phase in HPLC analysis ................. 57
Preparation of 90 % acetonitrile ....................................................................................... 57
c) Preparation of buffer solutions .................................................................................. 57
Preparation of Glycine-NaOH buffer (pH 8.53 – 12.9) .................................................... 57
Preparation of Na2HPO4 – citric acid buffer (pH 2.2 – 8.0) ............................................. 58
d) Preparation of phytochemical test solutions.............................................................. 59
Preparation of 1 M and 2 M sodium hydroxide (NaOH) ................................................. 59
Preparation of 1 M hydrochloric acid (HCl) .................................................................... 59

x
Preparation of 1 M lead acetate [(CH3COO) 2 Pb. 3H2O] ................................................ 59
e) Preparation of titration solutions ............................................................................... 59
Preparation of 1 M hydrochloric acid (HCl) .................................................................... 59
Preparation of 1 M sodium hydroxide (NaOH) ................................................................ 59
Preparation of 1 M acetic acid (CH3COOH) .................................................................... 60
Preparation of 1 M ammonium hydroxide (NH4OH) ....................................................... 60
APPENDIX C ......................................................................................................................... 61
RESULTS ............................................................................................................................... 61
Extracts of different solvents................................................................................................ 61
HPLC results ........................................................................................................................ 61
GC-MS results ...................................................................................................................... 65
Fourier transform infrared spectrometry (FTIR) results ...................................................... 68
Colour changes of the extract at different pH values. .......................................................... 70
Titration results .................................................................................................................... 70
a) Strong acid vs strong base (1 M HCl vs 1 M NaOH) ............................................... 70
b) Strong acid vs weak base (1 M HCl vs 1 M NH4OH) .............................................. 71
c) Weak acid vs strong base (1 M CH3COOH vs 1 M NaOH) ..................................... 72
d) Weak acid vs weak base (1 M CH3COOH vs 1 M NH4OH) .................................... 73
One way ANOVA and t-test results......................................................................................... 75
APPENDIX D ......................................................................................................................... 82
Equations ................................................................................................................................ 82

xi
D1 - Mean............................................................................................................................. 82
D2- Standard deviation......................................................................................................... 82
D3- t-Test ............................................................................................................................. 82
D4-One way ANOVA .......................................................................................................... 82
xii
LIST OF FIGURES
Fig. 2.1: Methyl red and its toxic metabolites………………………………………………...11
Fig. 2.2: General structure of anthocyanin……………………………………………………14
Fig. 2.3: Structure of cyanidins in aqueous solution under varying pH……………………….16
Fig. 2.4: Changes that occur to anthocyanin structure as pH changes………………………...17
Fig. 2.5: Colour changes as a result of Rubus occidentalis extracts in buffer solutions of pH 1
to 12…………………………………………………………………………………………..17
Fig. 2.6: HPLC chromatogram for mulberry fruit extract……………………………………18
Fig. 2.7: Picture of E. carssipes flowers, leaves and roots……………………………………20
Fig. 4.1: HPLC chromatograms (a) with calculated peak area and (b) without area of acidified
ethanolic extract………………………………………………………………………………30
Fig. 4.2: Acidified ethanol extract (0.1 % HCl in ethanol (v/v)) GC-MS chromatogram…….32
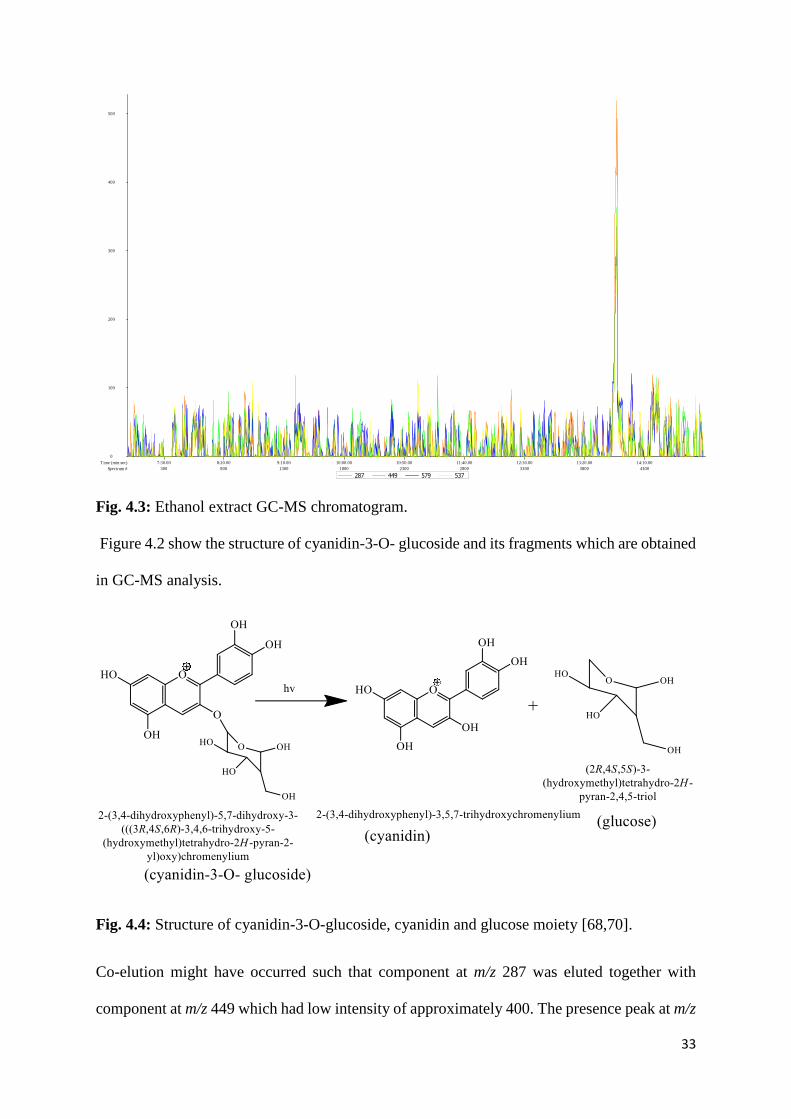
Fig. 4.3: Ethanol extract GC-MS chromatogram……………………………………………..33
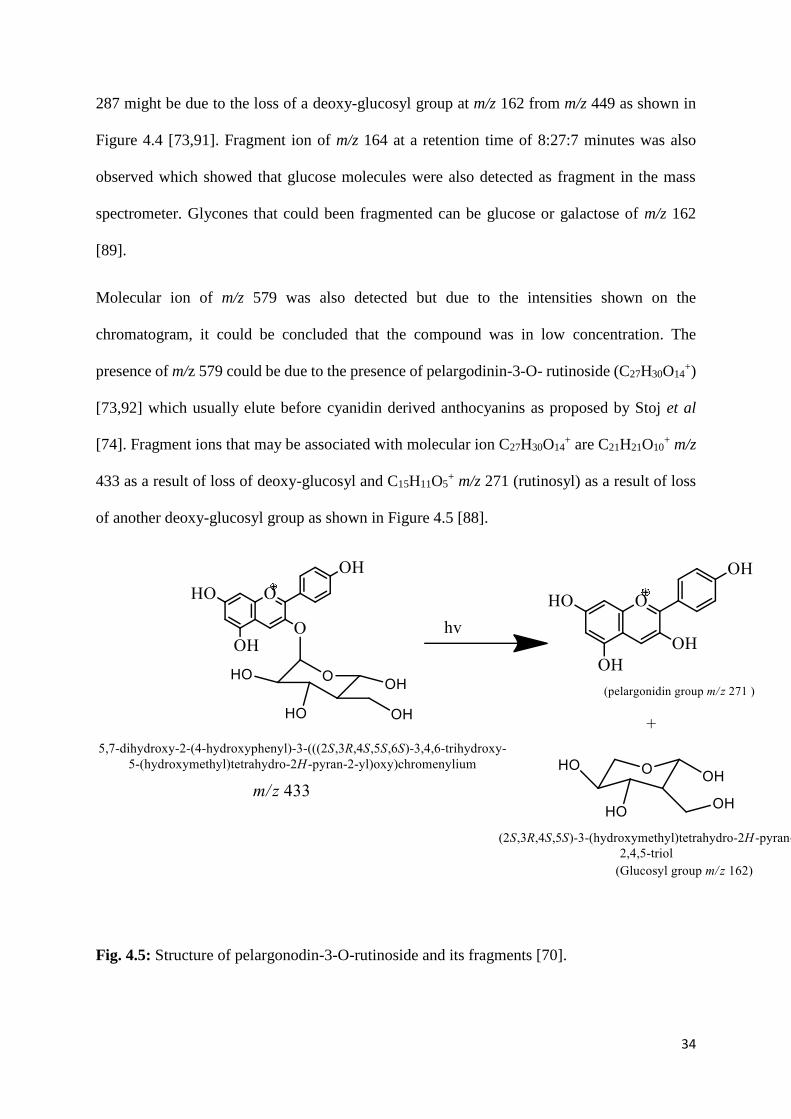
Fig. 4.4: Structure of cyanidin-3-O-glucoside, cyanidin and glucose moiety………………...33
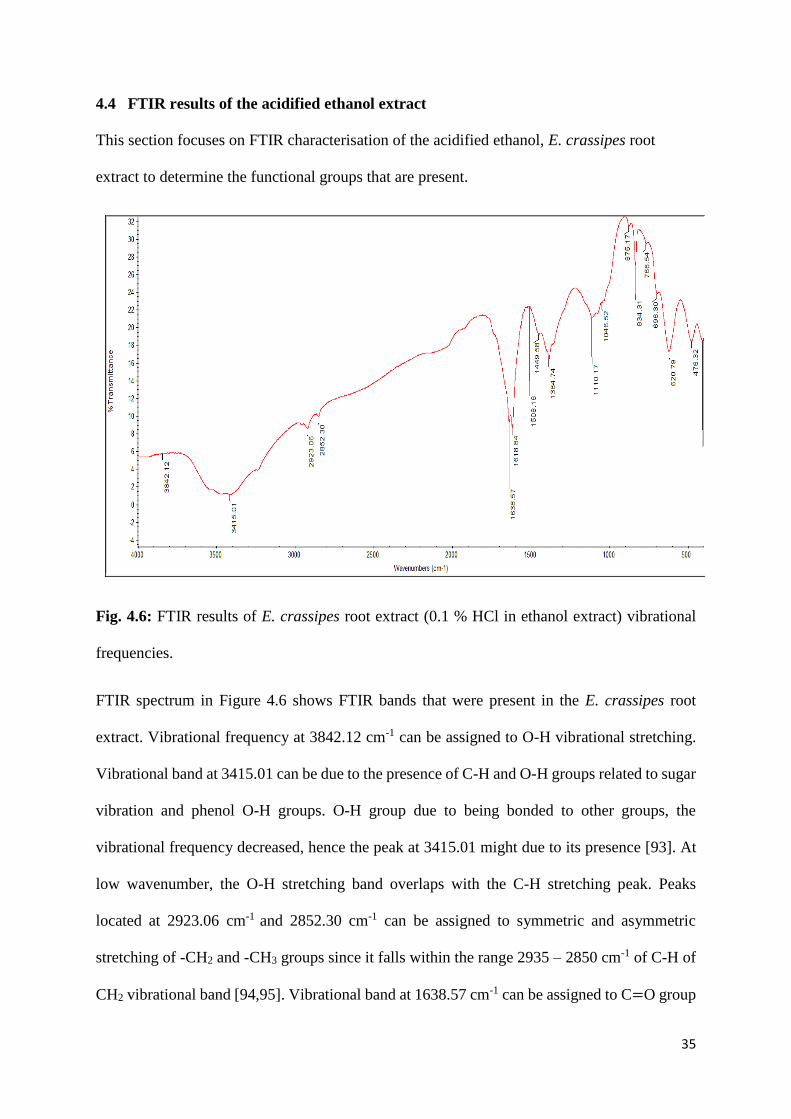
Fig. 4.5: Structure of pelargonodin-3-O-rutinoside and its fragments………………………..34
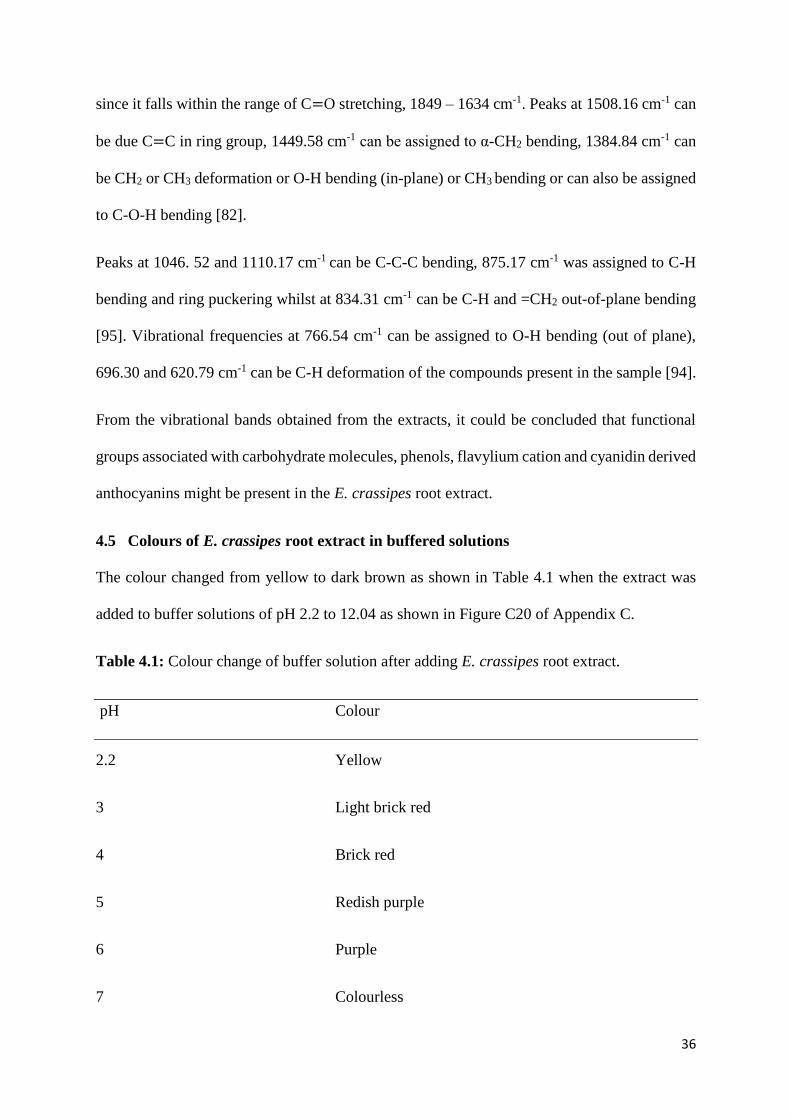
Fig. 4.6: FTIR results of E. crassipes roots extract (0.1 5 HCl in ethanol) vibrational
frequencies…………………………………………………………………………………...35
Fig. 4.7: Mean titre volumes obtained during four titration processes, HCl-NaOH, HCl-
NH4OH, CH3COOH-NaOH and CH3COOH-NH4OH…..........................................................41
Fig. C1: Extracts obtained from different extracting solvents……………………………….63
Fig. C2: HPLC chromatogram with calculated area for 4.5 % formic acid in water extract…64
xiii
Fig. C3: HPLC chromatogram for 4.5 % formic acid in water extract………………………64
Fig. C4: HPLC chromatogram with calculated area for acidified ethanol extract…………….65
Fig. C5: HPLC chromatogram for acidified ethanol extract………………………………...65
Fig. C6: HPLC chromatogram with calculated area for acidified methanol extract………...65
Fig. C7: HPLC chromatogram for acidified methanol extract………....................................66
Fig. C8: HPLC chromatogram with calculated area for BAW extract………........................66
Fig. C9: HPLC chromatogram for BAW extract………..........................................................66
Fig. C10: HPLC chromatogram with calculated area for ethanol extract………....................67
Fig. C11: HPLC chromatogram for ethanol extract………......................................................67
Fig. C12: GC-MS chromatogram for acidified ethanol extract……….....................................68
Fig. C13: GC-MS chromatogram for ethanol extract………...................................................68
Fig. C14: GC-MS chromatogram for acidified methanol extract……….................................69
Fig. C15: GC-MS chromatogram for 4.5 % formic acid in water extract………......................69
Fig. C16: GC-MS chromatogram for BAW extract……….....................................................70
Fig. C17: FTIR vibrational frequencies of E. crassipes roots extract………………………..71
Fig. C18: Colour changes observed when E. crassipes roots extract was added to buffer
solutions of pH 2.2 to 12.04…………………………………………………………………..72
xiv
LIST OF TABLES
Table 1.1: Synthetic indicators and their effects………………………………………………8
Table 4.1: Colour change of buffer solution after adding E. crassipes root extract…………...36
Table 4.2: Colour change from phytochemical test…………………………………………..37
Table 4.3: End points mean titre volumes and colour change for the four titrations using E.
crassipes root extract, methyl red, phenolphthalein and bromothymol blue………………….38
Table A1: Reagents used……………………………………………………………………..56
Table A2: Instrumentation used……………………………………………………………...57
Table B1: Volumes used to make Glycine-NaOH beffer solutions of pH 9.31 to 12.04……...60
Table B2: Volumes used to make NaOH- citric acid buffer of pH 2.2 to 2.8……………….60
Table C1: Titration of HCl vs NaOH using methyl red as an indicator……………………..72
Table C2: Titration of HCl vs NaOH using phenolphthalein as an indicator…………………73
Table C3: Titration of HCl vs NaOH using bromothymol blue as an indicator………………73
Table C4: Titration of HCl vs NaOH using E. crassipes roots extracts as an indicator……….73
Table C5: Titration of HCl vs NH4OH using methyl red as an indicator……………………..73
Table C6: Titration of HCl vs NH4OH using phenolphthalein as an indicator………………74
Table C7: Titration of HCl vs NH4OH using bromothymol blue as an indicator……………74
Table C8: Titration of HCl vs NH4OH using E. crassipes roots extract as an indicator………74
Table C9: Titration of CH3COOH vs NaOH using methyl red as an indicator……………….75
Table C10: Titration of CH3COOH vs NaOH using phenolphthalein as an indicator………75
xv
Table C11: Titration of CH3COOH vs NaOH using bromothymol blue as an indicator……75
Table C12: Titration of CH3COOH vs NaOH using E. crassipes roots extract as an indicator.75
Table C13: Titration of CH3COOH vs NH4OH using methyl red as an indicator…………….76
Table C14: Titration of CH3COOH vs NH4OH using phenolphthalein as an indicator……..76
Table C15: Titration of CH3COOH vs NH4OH using bromothymol blue as an indicator……76
Table C16: Titration of CH3COOH vs NH4OH using E. crassipes roots extract as an
indicator………………………………………………………………………………………77
Table C17: T-test results of HCl-NH4OH using E. crassipes root extract and methyl red……77
Table C18: T-test results of HCl-NH4OH titration using E. crassipes root extract and
phenolphthalein………………………………………………………………………………78
Table C19: T-test results of CH3COOH-NH4OH titration using E. crassipes root extract and
methyl red…………………………………………………………………………………….79
Table C20: T-test of CH3OH-NH4OH titration using E. crassipes root extract and
phenolphthalein………………………………………………………………………………80
Table C21: T-test of CH3COOH-NH4OH titration using E. crassipes root extract and
bromothymol blue…………………………………………………………………………….81
Table C22: One way ANOVA results of HCl-NaOH titration……………………………...81
Table C23: One way ANOVA results of HCl-NH4OH titration…………………………….82
Table C24: One way ANOVA results of CH3COOH-NaOH titration………………………82
Table C25: One way ANOVA results of CH3COOH-NH4OH titration……………………83
xvi
LIST OF ABBREVATIONS
HPLC High performance liquid chromatograph
GC-MS Gas chromatography- mass spectrometer
FTIR Fourier transform infrared spectrometer
NTP National Toxicology Programme
UV-Vis Ultra violet- visible spectrometer
H+NMR Proton nuclear magnetic resonance
ZimAlloys Zimbabwe Alloys
BAW Butan-1-ol: acetic acid: water
NIST National Institute of Standards and Technology
ANOVA Analysis of variance
t-Test Test statistics
ACE Associated Chemical Enterprises
MSU Midlands State University
1
CHAPTER ONE
INTRODUCTION
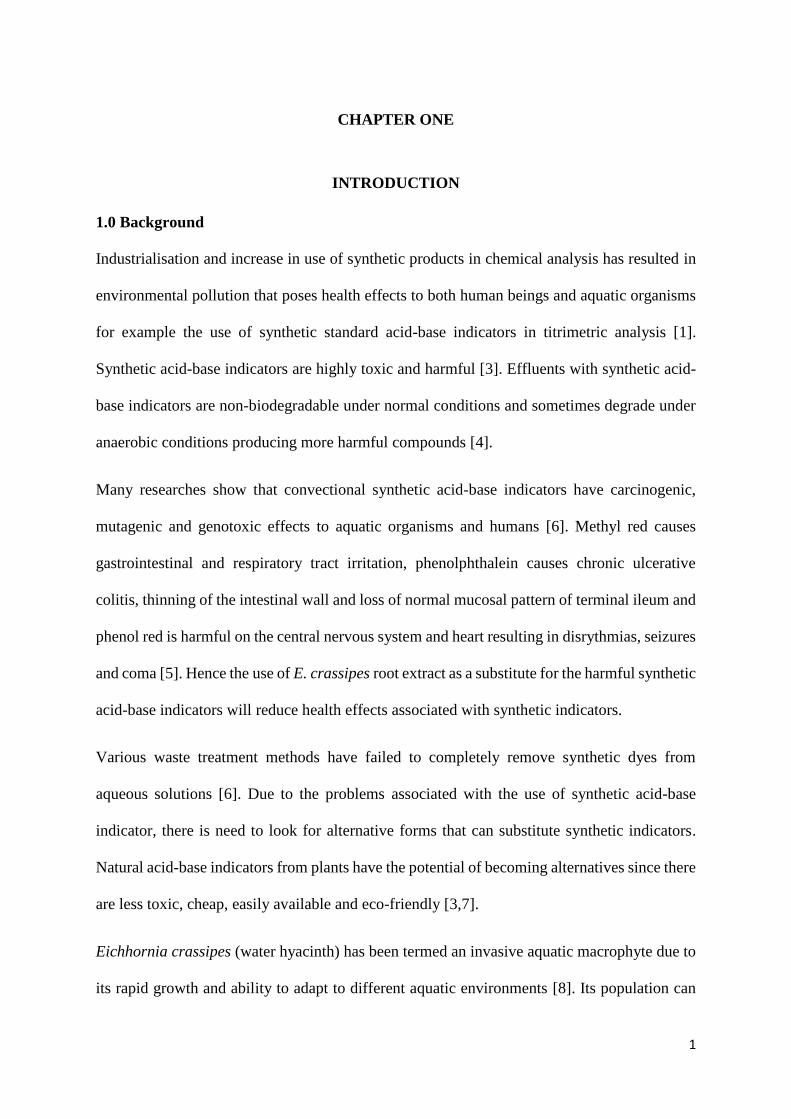
1.0 Background
Industrialisation and increase in use of synthetic products in chemical analysis has resulted in
environmental pollution that poses health effects to both human beings and aquatic organisms
for example the use of synthetic standard acid-base indicators in titrimetric analysis [1].
Synthetic acid-base indicators are highly toxic and harmful [3]. Effluents with synthetic acid-
base indicators are non-biodegradable under normal conditions and sometimes degrade under
anaerobic conditions producing more harmful compounds [4].
Many researches show that convectional synthetic acid-base indicators have carcinogenic,
mutagenic and genotoxic effects to aquatic organisms and humans [6]. Methyl red causes
gastrointestinal and respiratory tract irritation, phenolphthalein causes chronic ulcerative
colitis, thinning of the intestinal wall and loss of normal mucosal pattern of terminal ileum and
phenol red is harmful on the central nervous system and heart resulting in disrythmias, seizures
and coma [5]. Hence the use of E. crassipes root extract as a substitute for the harmful synthetic
acid-base indicators will reduce health effects associated with synthetic indicators.
Various waste treatment methods have failed to completely remove synthetic dyes from
aqueous solutions [6]. Due to the problems associated with the use of synthetic acid-base
indicator, there is need to look for alternative forms that can substitute synthetic indicators.
Natural acid-base indicators from plants have the potential of becoming alternatives since there
are less toxic, cheap, easily available and eco-friendly [3,7].
Eichhornia crassipes (water hyacinth) has been termed an invasive aquatic macrophyte due to
its rapid growth and ability to adapt to different aquatic environments [8]. Its population can
2
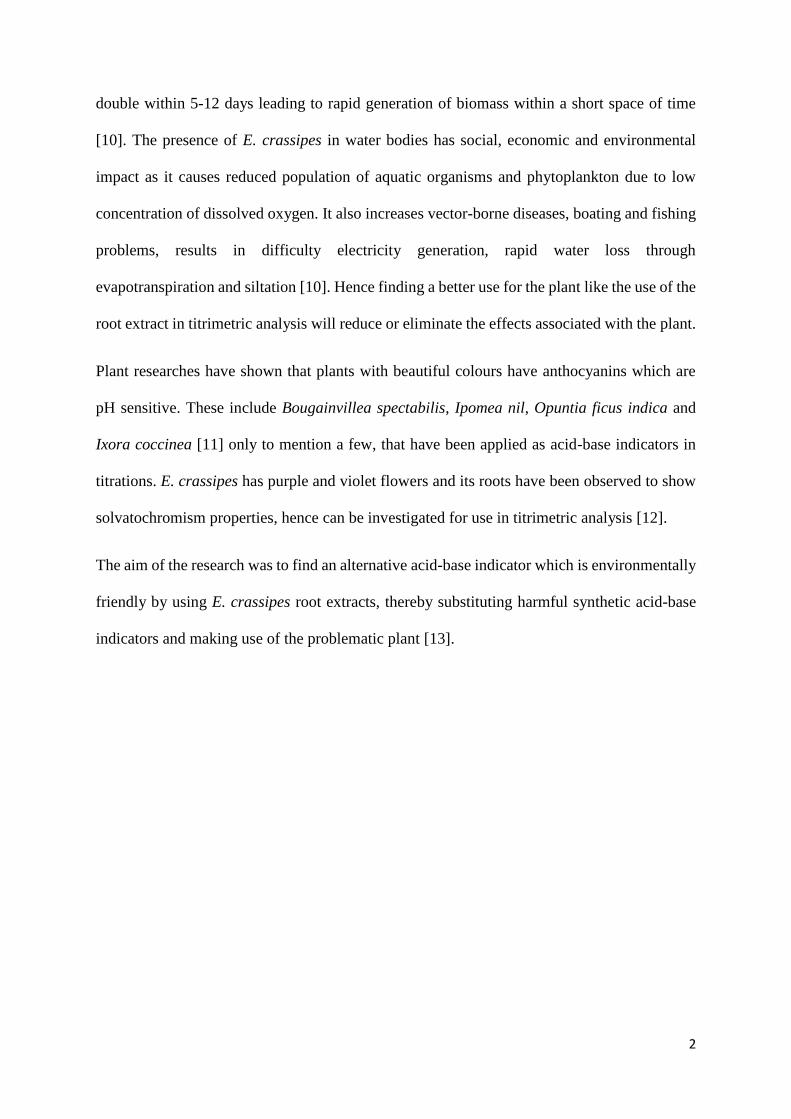
double within 5-12 days leading to rapid generation of biomass within a short space of time
[10]. The presence of E. crassipes in water bodies has social, economic and environmental
impact as it causes reduced population of aquatic organisms and phytoplankton due to low
concentration of dissolved oxygen. It also increases vector-borne diseases, boating and fishing
problems, results in difficulty electricity generation, rapid water loss through
evapotranspiration and siltation [10]. Hence finding a better use for the plant like the use of the
root extract in titrimetric analysis will reduce or eliminate the effects associated with the plant.
Plant researches have shown that plants with beautiful colours have anthocyanins which are
pH sensitive. These include Bougainvillea spectabilis, Ipomea nil, Opuntia ficus indica and
Ixora coccinea [11] only to mention a few, that have been applied as acid-base indicators in
titrations. E. crassipes has purple and violet flowers and its roots have been observed to show
solvatochromism properties, hence can be investigated for use in titrimetric analysis [12].
The aim of the research was to find an alternative acid-base indicator which is environmentally
friendly by using E. crassipes root extracts, thereby substituting harmful synthetic acid-base
indicators and making use of the problematic plant [13].
3
1.1 Aims
To optimise the extraction of pigments from E. crassipes roots.
To apply the pigment as an indicator in acid-base titrations in comparison to standard
synthetic indicators.
1.2 Objectives
To extract E. crassipes root pigments using solvents of different polarities.
To characterise the components of the crude extract using high performance liquid
chromatography (HPLC), gas chromatography mass spectrometer (GC-MS) and Fourier
transform infrared spectrometer (FTIR).
To determine the end-point using extracted pigment in comparison to standard synthetic
acid-base indicators in volumetric analysis.
4
1.3 Problem statement
Synthetic acid-base indicators that are currently used in titrimetric analysis are toxic to the
environment, humans and aquatic organisms. They are carcinogenic and mutagenic to living
organisms and there are also expensive, Shih et al [4], hence there is need for substituting them.
E. crassipes is a problematic, invasive plant that has social, economic and environmental
problems to both humans and aquatic organisms [15]. Physical, chemical and biological
methods have failed to eliminate the plant due to its high proliferation rate and drug resistance.
There is massive generation of biomass that lowers oxygen concentration in water, prevent
sunlight to phytoplankton, increase vector-borne diseases, cause problems in hydroelectric
power generation systems, interfere with navigation of water flow, decrease water quality,
cause decline in temperature, pH, nutrient level, increase in transportation costs, water loss
through evapotranspiration and siltation [10]. Some of these problems have caused death of
fish in Lake Chivero, Harare and Lake Victoria, Kenya [10]. Due to the problems associated
with E. crassipes there is need to make use of the plant e.g. applying the root extract as acid-
base indicator in titrimetric analysis.
5
1.4 Justification
The use of E. crassipes root extract as natural acid-base indicator in titrimetric analysis had
provided an alternative to the use of toxic synthetic acid-base indicators [17]. Natural indicators
are cheap, less toxic and environmentally friendly as compared to the synthetic indicators [18].
Once E. crassipes root extract have been established to show the indicator properties, they can
find a broad spectrum of application including the textile industry.
Application of E. crassipes root extract as an acid-base indictor will make the problematic plant
useful, thereby substituting toxic synthetic acid-base indicator. According to Zhang et al [19],
E. crassipes have high proliferation rate, therefore there is always rapid generation of biomass
that can be extracted and used in titrations.
Due to the effects associated with synthetic standard acid-base indicators, green chemistry can
be applied to reduce or to eliminate production of toxic products, generation of large volumes
of waste and use of too much energy [20]. The research seeks to eliminate or substitute use of
synthetic acid-base indicators with E. crassipes root extract for sustainable development.
6
CHAPTER TWO
LITERATURE REVIEW
2.0 Introduction
The chapter focuses on the use of acid-base indicators in titrimetric analysis, synthetic acid-
base indicators and their effects to humans and aquatic organisms. Review of studies that were
carried out on the use of plant extracts as acid-base indicators and application of green
chemistry for sustainable development are also discussed in this chapter. The sections also
covers problems associated with E. crassipes and its possible application in the research and
application of plant extracts in acid-base titrations.
2.1 Acid-base indicators and their use in volumetric analysis
A pH indicator is a halo-chromic chemical compound that is added in small amounts to the
solution or analyst sample so that the acidity or alkalinity can be determined [18]. Bart and Pilz
[21] defined pH indicators as chemical detectors of hydronium ions (H3O+) or hydrogen ions
(H+) in the Arrhenius model that changes colour depending on the concentration of these ions.
There are usually weak acids or bases which have their acid or conjugate base forms with
different colours due to differences in their absorption spectra [22]. Acid-base indicators
changes colour over a range of pH e.g. methyl red pH range is from 4.2 to 6.2 and
phenolphthalein from 8.3 to 10. The ability of the indicators to donate or accept electrons
results in change of colour with change in pH (acidity or alkalinity).
Volumetric analysis is quantitative determination of the unknown substance by determining
the volume of a solution of known concentration that reacts quantitatively with a measured
volume of solution to be determined [5]. In volumetric analysis, pH indicators are used to
determine the end-point of the reactions.
7
2.2 Synthetic acid-base indicators (dyes) and their effects to humans and aquatic
organism
Organic dyes from industrial effluents are pollutants which makes it difficult in waste water
treatment systems [6]. These dyes and their degradation products are toxic, mutagenic and
carcinogenic to humans and aquatic organisms. This is due to the presence of carcinogens such
as benzidine, naphthalene and other phenolic compounds which can remain in the environment
for a long period of time [6]. Many synthetic dyes are highly soluble in water hence can be
discharged with waste water in water bodies. Most of the dyes are resistant to normal treatment
of waste water process i.e. bio-treatment of the effluents is ineffective due inability of the dye
or acid-base indicator to degrade aerobically while anaerobic degradation yields carcinogenic
aromatic amines as by-products [27].
Most acid-base indicators and dyes used in the pigmentation and titration processes in many
industrial applications are derived from azo dyes as reported by Mahmoud et al [28]. Azo dyes
are xenobiotic compounds which have one or more azo linkages and aromatic rings. They
constitute the largest class of dyes with greatest colour varieties. There are electron-deficient
xenobiotic compounds due to the presence of the azo linkage (N=N) and sulphonic (SO3-)
groups which are electron withdrawing groups that generate electron deficiency within the
molecule making the dye less susceptible to bio-degradation [31]. Azo dyes include methyl
red, methyl orange, acid orange 6 and acid orange 7. In the human body synthetic azo
compounds are metabolized by enzyme azoreductase in the intestines and liver to aromatic
amines. Aromatic amine, benzidine induce urinary bladder cancer in humans and tumours in
some experimental animals. Under anaerobic conditions, azo dyes can be reduced to aromatic
amines which are toxic, mutagenic and carcinogenic [31]. Examples of azo dyes and other dyes
that are applied as acid-base indicators in titrimetric analysis are shown in Table 1.1 together
with health effects associated with them.
8
Due to chemical structures of dyes, they resist fading on exposure to UV light, water and many
chemicals which makes them not easily degraded in the environment. Wastewater containing
dyes causes intense colouration to water bodies which reduce sunlight transmission into water
and also decreases solubility of gases in water hence affecting aquatic organisms and plants
[32]. This occurs by preventing penetration of sunlight thereby preventing photosynthesis and
other algal based biological treatment systems.
Coloured wastewater in the ecosystem causes aesthetic pollution, eutrophication and
perturbations in aquatic life. Isiuk et al [25] and Luo et al [35] postulated that dyes are difficult
to remove from waste water because they are stable to light, heat and oxidising agent, hence
they are not easily degradable. These dyes require adequate treatment to abate them which
increases the expenses of wastewater treatment processes.
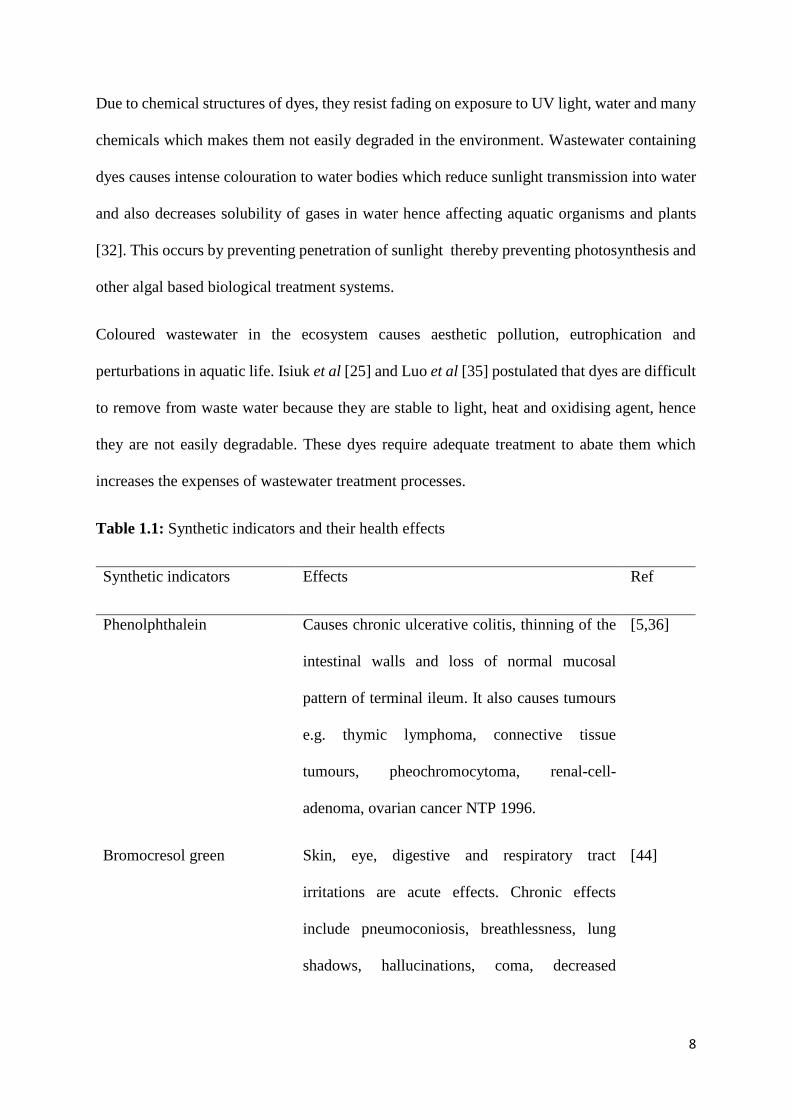
Table 1.1: Synthetic indicators and their health effects
Synthetic indicators Effects Ref
Phenolphthalein Causes chronic ulcerative colitis, thinning of the
intestinal walls and loss of normal mucosal
pattern of terminal ileum. It also causes tumours
e.g. thymic lymphoma, connective tissue
tumours, pheochromocytoma, renal-cell-
adenoma, ovarian cancer NTP 1996.
[5,36]
Bromocresol green Skin, eye, digestive and respiratory tract
irritations are acute effects. Chronic effects
include pneumoconiosis, breathlessness, lung
shadows, hallucinations, coma, decreased
[44]
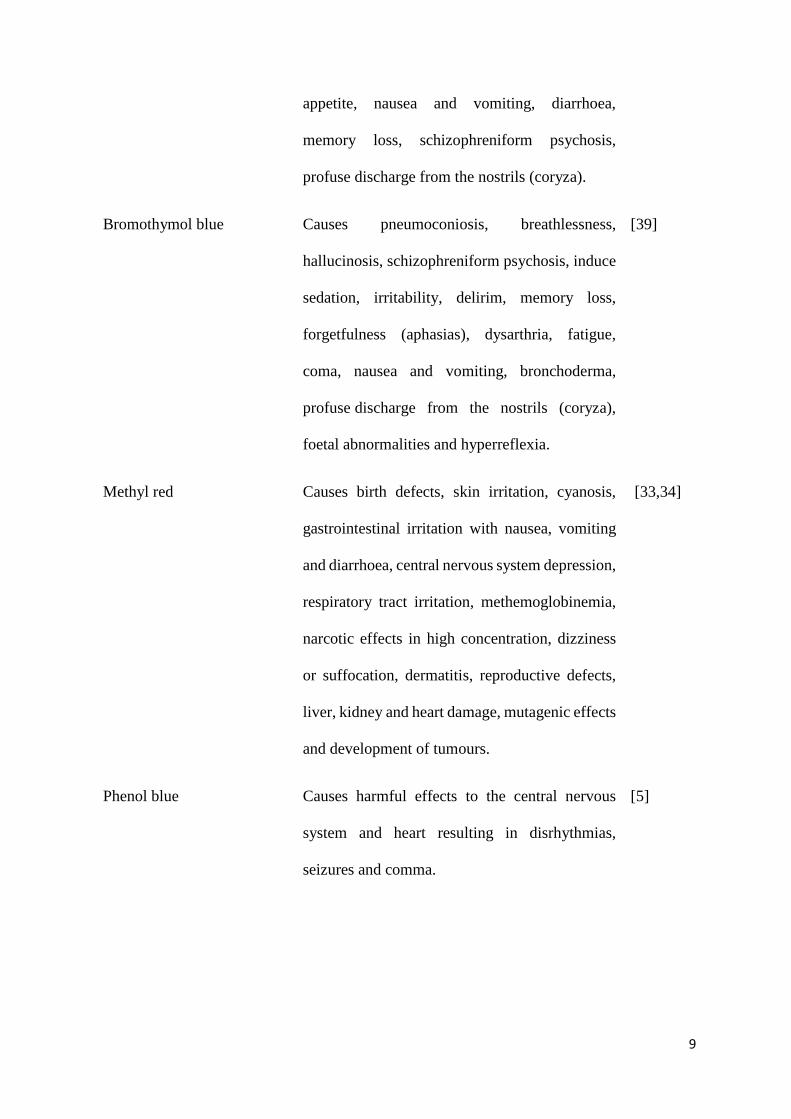
9
appetite, nausea and vomiting, diarrhoea,
memory loss, schizophreniform psychosis,
profuse discharge from the nostrils (coryza).
Bromothymol blue Causes pneumoconiosis, breathlessness,
hallucinosis, schizophreniform psychosis, induce
sedation, irritability, delirim, memory loss,
forgetfulness (aphasias), dysarthria, fatigue,
coma, nausea and vomiting, bronchoderma,
profuse discharge from the nostrils (coryza),
foetal abnormalities and hyperreflexia.
[39]
Methyl red Causes birth defects, skin irritation, cyanosis,
gastrointestinal irritation with nausea, vomiting
and diarrhoea, central nervous system depression,
respiratory tract irritation, methemoglobinemia,
narcotic effects in high concentration, dizziness
or suffocation, dermatitis, reproductive defects,
liver, kidney and heart damage, mutagenic effects
and development of tumours.
[33,34]
Phenol blue Causes harmful effects to the central nervous
system and heart resulting in disrhythmias,
seizures and comma.
[5]
10
Methyl orange Causes eye and skin irritation, gastrointestinal
irritation, vomiting and respiratory tract irritation,
tumour formation, mutation that occur due to
prolonged exposure may lead to development of
bladder cancer, liver carcinomas, lung adenomas
and hepatomas.
[48]
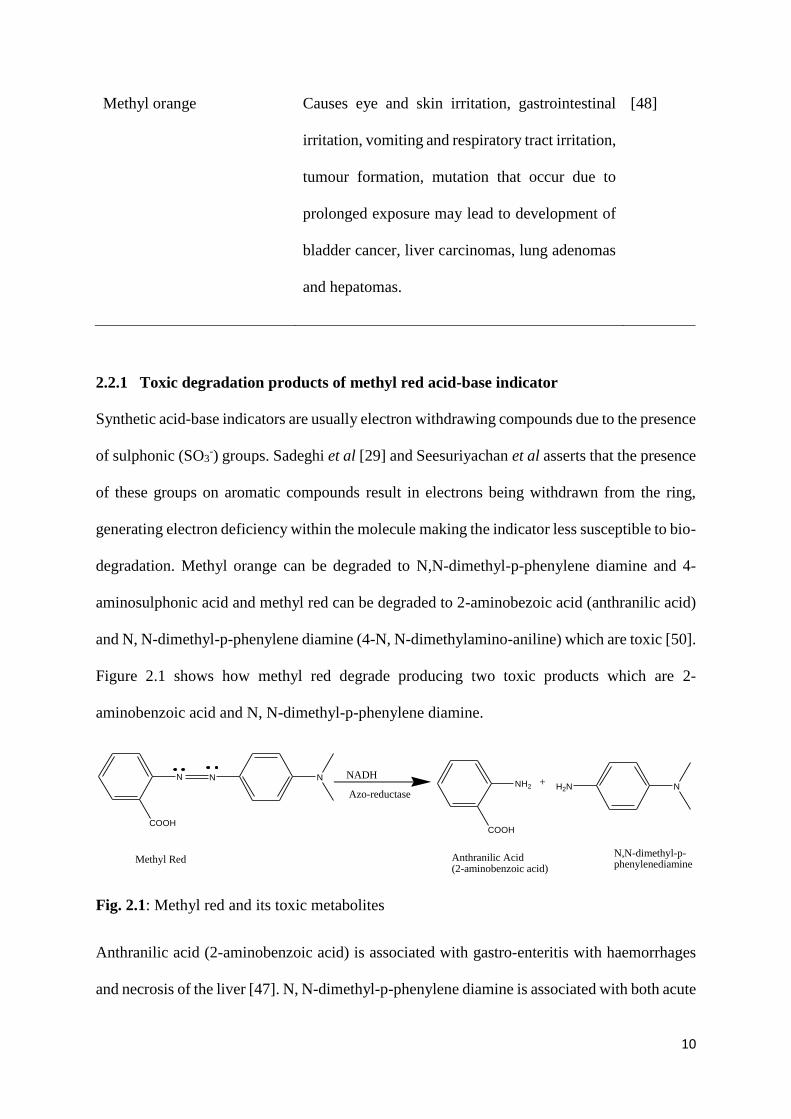
2.2.1 Toxic degradation products of methyl red acid-base indicator
Synthetic acid-base indicators are usually electron withdrawing compounds due to the presence
of sulphonic (SO3-) groups. Sadeghi et al [29] and Seesuriyachan et al asserts that the presence
of these groups on aromatic compounds result in electrons being withdrawn from the ring,
generating electron deficiency within the molecule making the indicator less susceptible to bio-
degradation. Methyl orange can be degraded to N,N-dimethyl-p-phenylene diamine and 4-
aminosulphonic acid and methyl red can be degraded to 2-aminobezoic acid (anthranilic acid)
and N, N-dimethyl-p-phenylene diamine (4-N, N-dimethylamino-aniline) which are toxic [50].
Figure 2.1 shows how methyl red degrade producing two toxic products which are 2-
aminobenzoic acid and N, N-dimethyl-p-phenylene diamine.
COOH
N N N NADH
Azo-reductase
COOH
NH2+ H2N N
Methyl Red Anthranilic Acid(2-aminobenzoic acid)
N,N-dimethyl-p-phenylenediamine
Fig. 2.1: Methyl red and its toxic metabolites
Anthranilic acid (2-aminobenzoic acid) is associated with gastro-enteritis with haemorrhages
and necrosis of the liver [47]. N, N-dimethyl-p-phenylene diamine is associated with both acute
11
and chronic health effects. Acute health effects include fatality if swallowed due to
methaeglobinemia as the substance can bind to haemoglobin inhibiting normal oxygen uptake.
It can also produce toxic effects if inhaled. Chronic effects are irreversible i.e. mutations have
been reported upon exposure long period of time, formation of sarcomas in the spleen, liver
and kidney of humans [55].
2.3 Application of green chemistry for sustainable development
Green chemistry is a potential approach toward scientifically based environment protection.
The application of green chemistry in chemical processes has significant impact on improving
environmental monitoring. Application of green chemistry e.g. the use of natural dyes goes
back to 1664 when sir Robert Boyle reported his collection assays on colours [50]. The research
seeks to make use of E. crassipes root extracts by applying them as acid-base indicators,
thereby improving environmental monitoring and enhancing sustainable development.
2.3.1 Review of studies that were carried out on natural acid-base indicators
2.3.1.0 Introduction
This section covers studies that have carried out, methodologies employed, extracting solvents
used and data interpretation from the results generated.
2.3.1.1 Plants used to extract acid-base indicators
Many studies have been carried out on the use of plant extracts as substitute of synthetic acid-
base indicators in titrations. Natural indicators have been extracted from Aspilia Africana and
Urena Labata (Mgbo) flowers by Eze and Ogbuefi [20], Gerbera jamasonii and Tagertes
erecta flowers by Shivaji et al, flowers of Ipomea nil and ipomea biloba by Abbas [7], flowers
of Bougainvillea Spectabilis by Bagul et al, Jacaranda acutifolia and Ixora Coccinea flowers
by Patrakar et al [14], flower sap of China rose by Gupta et al [50], petal sap of Delonix regia
12
by Jain [5], golden beet root, mangifera indica seed by Onwuachi et al [53] and blood leaf
(Iresine herbstii) by Doctor [54].
2.3.1.2 Extraction methods employed to extract the acid-base indicators
The methods of extraction that were employed by many researchers on plant flowers are almost
the same. They only differ in that some researchers used fresh flowers and some used dried
flowers. The method used for fresh flowers include washing of the flowers with distilled water,
maceration with the extracting solvent e.g. ethanol, water or methanol, then filtration and
finally use of the crude extract as an indicator in titrimetric analysis [11,12].
In some cases where dried flowers were used, the method differed on that the flowers were
grinded to fine powder using either a mechanical blender or a pestle and mortar. Extraction
using an appropriate solvent, filtration and use of the crude extract as an indicator [5] are the
basic methodological steps that were employed. Deshpande et al [11], Eze et al [18] and
Patrakar et al [52] dried their samples away from the direct sunlight as they tried to prevent
photo-degradation and oxidative loss of the dye [59], but Gupta et al dried the flower samples
on direct sunlight [50] and they both found positive results.
Some researchers used other parts of plants to extract the indicators like the use of seeds, leaves
and roots [60]. Methods employed for extraction of the dye were almost the same since drying
of the sample was done for all these parts, extraction using a suitable solvents and use of the
crude extracts as indicators in volumetric analysis. Suva [20] used fresh Opuntia ficus indica
fruits to extract the pigment that was used as an indicator. In the research, E. crassipes roots
were investigated for the acid-base indicator properties.
Of all studies that were carried out, very few isolated the active components that give the acid-
base indicator properties [60]. The compounds that were being isolated were anthocyanins from
the crude sample. Bondre et al [61] and Singh et al used n-butanol: acetic acid: water in a ratio
13
of 4:1:5 and separated the sample using thin layer chromatography (TLC). Separation of the
anthocyanins from sample were also done in Food Science researches. The extracts were fully
characterised with UV-Vis spectroscopy, Fourier Transform Infrared Spectroscopy (FTIR),
high performance liquid chromatography (HPLC), gas chromatography- mass spectrometer
(GC-MS) and proton nuclear magnetic resonance (H+ NMR).
2.3.1.3 Solvents used to extract anthocyanins (pH sensitive compounds)
Anthocyanins are mostly extracted with acidified solvents like water, acetone, ethanol,
methanol or mixtures of aqueous solvents. The acid will breakdown the cell membranes and
release the anthocyanins, but harsh chemical treatment may break the innate anthocyanin
structure like use of mineral acids such as 1% HCl. However, acidification with organic acids
e.g. formic or acetic acid does not destroy the anthocyanin structure [64]. Many studies have
shown that extraction of anthocyanins is more effective with acidified solvents than non-
acidified solvents. Methanol is an environmental pollutant and more toxic as compared to other
alcohols, hence ethanol is preferred by many researchers for the recovery of anthocyanins from
plant material [64]. Sulphur water (aqueous SO2) has also been used to extract anthocyanin
from plant material such as red grape and black currents.
Solvents that were used in this research are 0.1 % HCl in ethanol, 0.1 % HCl in methanol, 4.5
% formic acid in water, butan-2-ol: glacial acetic acid: water (5:3:2) and ethanol.
2.3.1.4 Results generated from reviewed studies
Colour changes at different pH values of natural indicators has been attributed to the presence
of anthocyanins and flavonoids which are pH sensitive [20]. Anthocyanins are organic
compounds that are usually found in the aqueous sap of the vacuole of the epidermal plant
cells. These compounds have a complex structure consisting of an aromatic three-ring
molecular region, one or more attached sugar molecules and sometimes acyl groups attached
14
to the sugar molecules. Anthocyanins are water soluble and are usually more stable in acidic
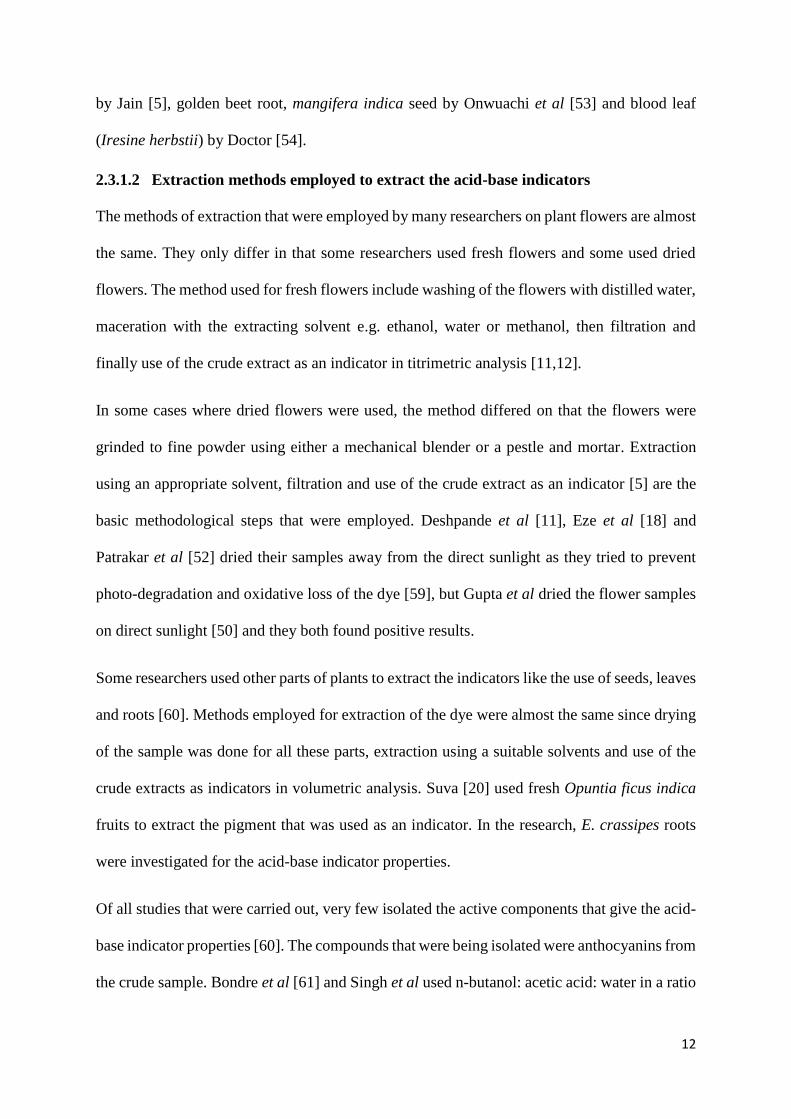
media than in alkaline solutions [3]. A general structure of an anthocyanin is shown in Figure
2.2.
Fig. 2.2: General structure of anthocyanin.
Almost any plant that have blue, violet, purple or red flowered colours contains organic
pigments, anthocyanins that changes colour with change in pH [50]. The colour stability of
anthocyanins depend on structure of the anthocyanins, pH, temperature, oxygen, light and
water activity [61]. They tend to be red in a more acidic solution and blue in basic solution.
Anthocyanins have several biological activities which include antioxidant,
antihepatocarcinogenic, anti-inflammatory, anti-tumour, hypolidemic, cardioprotective and
cancer chemopreventive, hence they are safe to use in acid-base titration [74].
2.3.1.4.1 Action of anthocyanins at different pH
The colour of anthocyanin pigments depend on pH, thus the acidity of the medium [61]. At
acidic pH (1-3), anthocyanins exist predominantly in the form of the red or orange flavylium
cation (2-phenylchromenylium cation). The colour intensity decrease as pH increases and also
15
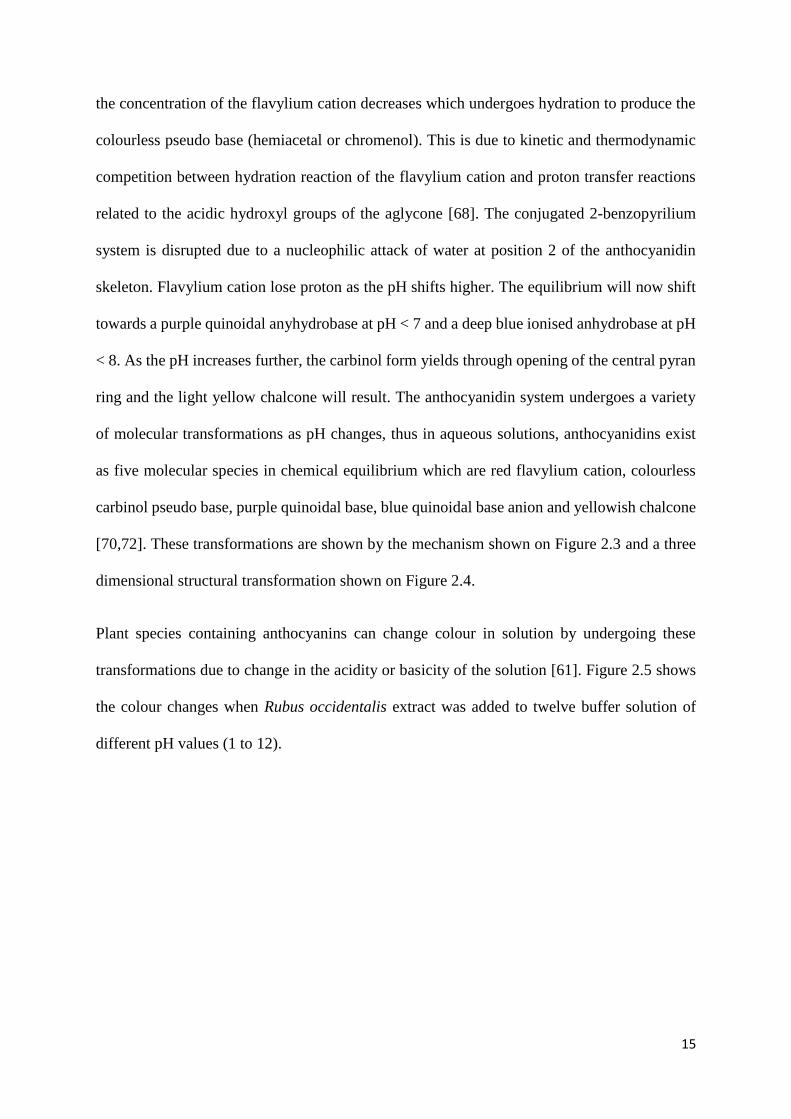
the concentration of the flavylium cation decreases which undergoes hydration to produce the
colourless pseudo base (hemiacetal or chromenol). This is due to kinetic and thermodynamic
competition between hydration reaction of the flavylium cation and proton transfer reactions
related to the acidic hydroxyl groups of the aglycone [68]. The conjugated 2-benzopyrilium
system is disrupted due to a nucleophilic attack of water at position 2 of the anthocyanidin
skeleton. Flavylium cation lose proton as the pH shifts higher. The equilibrium will now shift
towards a purple quinoidal anyhydrobase at pH < 7 and a deep blue ionised anhydrobase at pH
< 8. As the pH increases further, the carbinol form yields through opening of the central pyran
ring and the light yellow chalcone will result. The anthocyanidin system undergoes a variety
of molecular transformations as pH changes, thus in aqueous solutions, anthocyanidins exist
as five molecular species in chemical equilibrium which are red flavylium cation, colourless
carbinol pseudo base, purple quinoidal base, blue quinoidal base anion and yellowish chalcone
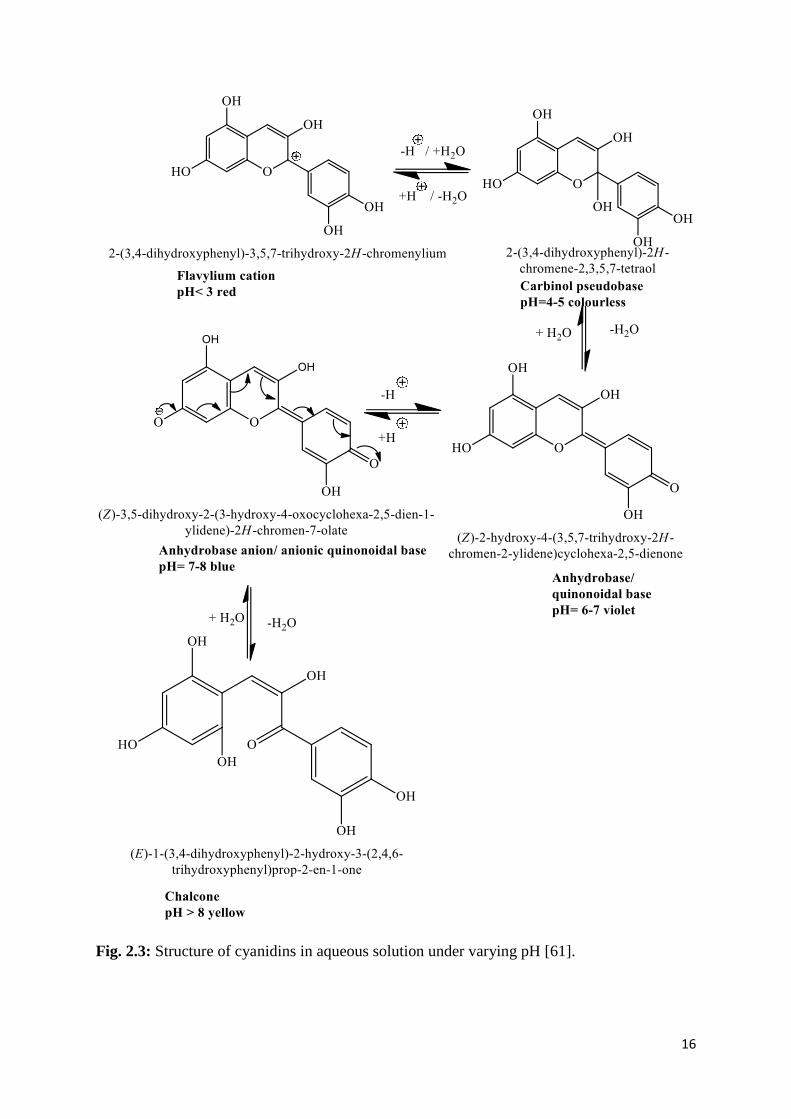
[70,72]. These transformations are shown by the mechanism shown on Figure 2.3 and a three
dimensional structural transformation shown on Figure 2.4.
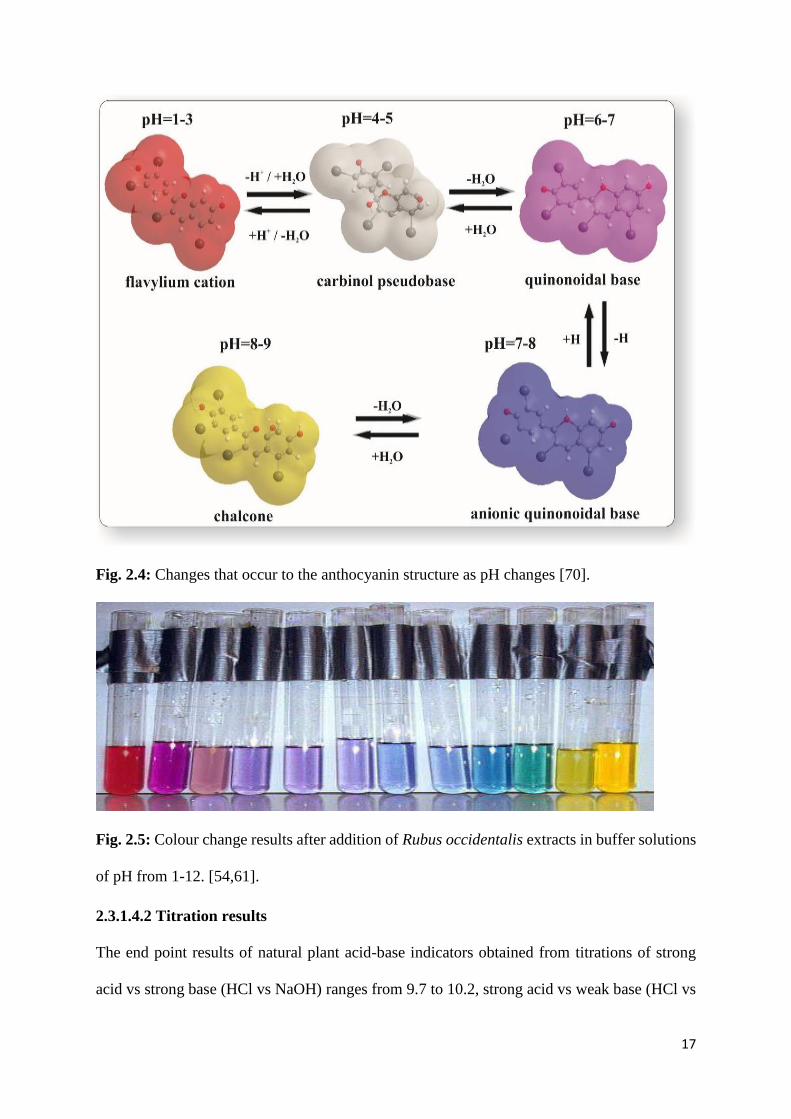
Plant species containing anthocyanins can change colour in solution by undergoing these
transformations due to change in the acidity or basicity of the solution [61]. Figure 2.5 shows
the colour changes when Rubus occidentalis extract was added to twelve buffer solution of
different pH values (1 to 12).
16
Fig. 2.3: Structure of cyanidins in aqueous solution under varying pH [61].
17
Fig. 2.4: Changes that occur to the anthocyanin structure as pH changes [70].
Fig. 2.5: Colour change results after addition of Rubus occidentalis extracts in buffer solutions
of pH from 1-12. [54,61].
2.3.1.4.2 Titration results
The end point results of natural plant acid-base indicators obtained from titrations of strong
acid vs strong base (HCl vs NaOH) ranges from 9.7 to 10.2, strong acid vs weak base (HCl vs
18
NH4OH) ranges from 9.4 to 10.7, weak acid vs strong base (CH3COOH vs NaOH) ranges from
9.46 to 9 9 and weak acid vs weak base (CH3COOH vs NH4OH) ranges from 9.7 to 11.4 when
10 ml of the titrate were used [7,12,14,62,68]. The results obtained from the natural plant acid-
base indicators were compared with the results obtained from standard synthetic indicators.
Almost all researches showed that the natural indicators can substitute the harmful standard
synthetic indicators as the results were almost the same or had a slight deviation.
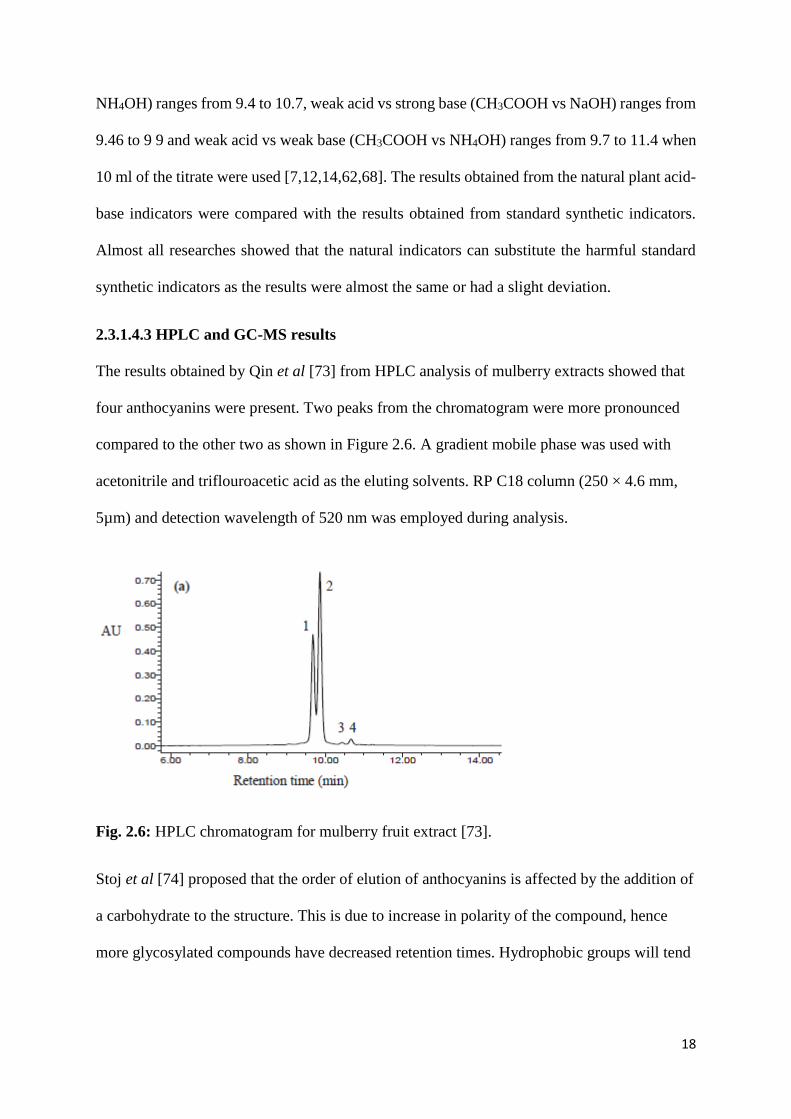
2.3.1.4.3 HPLC and GC-MS results
The results obtained by Qin et al [73] from HPLC analysis of mulberry extracts showed that
four anthocyanins were present. Two peaks from the chromatogram were more pronounced
compared to the other two as shown in Figure 2.6. A gradient mobile phase was used with
acetonitrile and triflouroacetic acid as the eluting solvents. RP C18 column (250 × 4.6 mm,
5µm) and detection wavelength of 520 nm was employed during analysis.
Fig. 2.6: HPLC chromatogram for mulberry fruit extract [73].
Stoj et al [74] proposed that the order of elution of anthocyanins is affected by the addition of
a carbohydrate to the structure. This is due to increase in polarity of the compound, hence
more glycosylated compounds have decreased retention times. Hydrophobic groups will tend
19
to increase retention times at which the compounds are eluted. The order of elution of
aglycones: delphinidin < cyanidin < pelargodinin.
2.3.1.4.4 FTIR results
Infrared spectrometer was used in the analysis of vibrational frequencies of functional groups
presence in plant extracts. The normal O-H stretching band occurs at 3634 cm-1 when not
hydrogen bonded. The frequencies decrease when the hydroxyl group becomes involved in
hydrogen bonding. The greater the strength of the hydrogen bond, the lower the absorption
frequency. Vibrational frequencies between 3400-3300 can usually be related to sugar
vibration and phenol OH groups. Bands from 2900 to 3450 cm-1 are usually assigned to CH
and OH vibrational groups [75]. O-H stretching in glucose usually occur between 3876 to 3005
cm-1, C-C and C=O usually produce several closely absorption bands between 1100 and 1000
cm-1 in the spectra of carbohydrates [75]. Absorption band at 840 and 898 cm-1 can be assigned
CH and CH2 complex vibrational modes of anomeric forms. CH2, C-O-H and C-C-H groups
are usually observed at 1432, 1334 and 1263 cm-1 respectively.
2.4 Eichhornia Crassipes (water hyacinth) features and its life cycle
Eichhornia crassipes also known as water hyacinth is a monocotyledonous freshwater aquatic
plant, native of Brazil and some parts of South America [76]. The plant belongs to:
Kingdom: Plantae
Order: Commelnales
Family: Pontederiaceae
Genus: Eichhornia
Species: crassipes
20
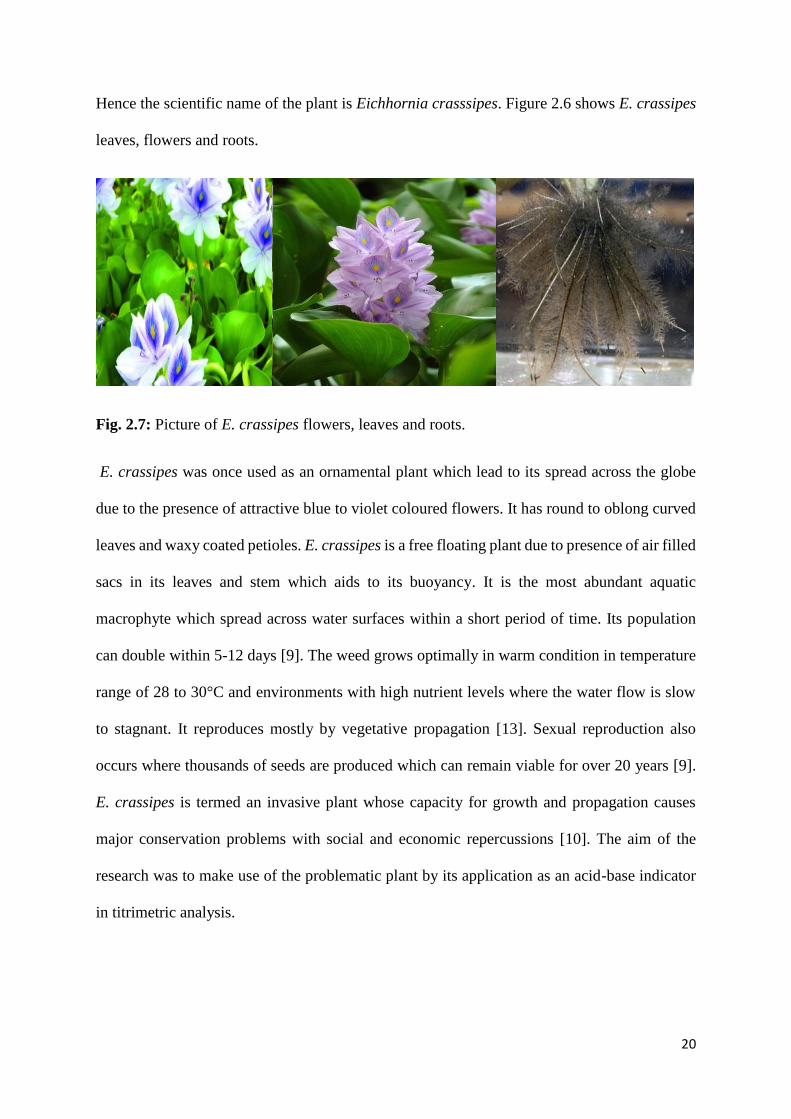
Hence the scientific name of the plant is Eichhornia crasssipes. Figure 2.6 shows E. crassipes
leaves, flowers and roots.
Fig. 2.7: Picture of E. crassipes flowers, leaves and roots.
E. crassipes was once used as an ornamental plant which lead to its spread across the globe
due to the presence of attractive blue to violet coloured flowers. It has round to oblong curved
leaves and waxy coated petioles. E. crassipes is a free floating plant due to presence of air filled
sacs in its leaves and stem which aids to its buoyancy. It is the most abundant aquatic
macrophyte which spread across water surfaces within a short period of time. Its population
can double within 5-12 days [9]. The weed grows optimally in warm condition in temperature
range of 28 to 30°C and environments with high nutrient levels where the water flow is slow
to stagnant. It reproduces mostly by vegetative propagation [13]. Sexual reproduction also
occurs where thousands of seeds are produced which can remain viable for over 20 years [9].
E. crassipes is termed an invasive plant whose capacity for growth and propagation causes
major conservation problems with social and economic repercussions [10]. The aim of the
research was to make use of the problematic plant by its application as an acid-base indicator
in titrimetric analysis.
21
2.4.1 Effects of E. crassipes to the environment, humans and aquatic organisms
E. crassipes has high proliferation rate which results in massive generation of biomass that
covers water surface interfering with water flow navigation and increased rate of water loss
through evapotranspiration. The plant interfere with power generation, decreased temperature,
pH, biological oxygen demand and chemical oxygen demand, affect water transport and fishing
industry. E. crassipes forms marts on water surface restricting sunlight penetration that
underwater native plants need for growth and photosynthesis and it is also a prime habitat for
disease causing vectors such as mosquitoes, parasitic flatworms (schistosome) and even snakes
[10].
2.4.2 Methods implemented to prevent the spread of E. crassipes in water bodies
Various researches have been carried out in Zimbabwe and Kenya on the effects of the noxious
aquatic weed to the environment. In 1998 Zimbabwe held the First Global Working Group
Meeting for the Biological and Integrated Control of E. crassipes in Harare in a way to combat
the E. crassipes problems at Lake Chivero and Manyame [16]. Chemical, physical and
biological control strategies have been employed, but the aquatic weed proved to be resilient
to these strategies. Some chemicals that are used are of synthetic origin that increase
environmental pollution. Despite all the efforts that are being undertaken to reduce infestation
of E. crassipes, it still remains the world’s most problematic waterweed [81]. Physical removal
of E. crassipes from water bodies is being implemented at Lake Chivero in Zimbabwe. The
plant seeds can be viable for more than 20 years, so the plant remains a problem. Making use
of plant can reduce biomass generated in water bodies.
2.4.3 Application of green chemistry in environmental monitoring e.g. use of E. crassipes
plant
Green chemistry can be applied to abate environmental pollution like in the removal of heavy
metals, synthetic dyes and other contaminants. Mahamadi and Nharingo [95] used Eirchhornia

22
crassipes as a sorbent in the removal of heavy metals. Dyes were also removed using the plant
e.g. methyl red and other cationic dyes [98]. Various researches where E. crassipes was applied
in heavy metals have been carried out. The research focused on the application of E. crassipes
root extract as acid-base indicator in titrimetric analysis.
23
CHAPTER THREE
METHODOLOGY
3.0 Introduction
This chapter focuses on the chronological steps that were carried out to generate data that
answers the objectives of the study. The steps include sampling and preparation of E. crassipes
roots and extraction of the pigment using solvents of different polarities. Characterisation,
application of root extracts in acid-base titrations and data treatment were also discussed in this
chapter. All experimental steps were carried out using apparatus, reagents and instruments
listed in appendix A.
3.1 E. crassipes sample collection and preparation
E. Crassipes roots were collected from Mucheke River in Masvingo, Zimbabwe. The roots
were removed by hand from the plant. The samples were washed and cleaned with tap water
and then rinsed with distilled water. E. crassipes roots were placed in a room and left to dry
for two months. The dried samples were pulverised at Zimbabwe Alloys (ZimAlloys) in
Gweru, Zimbabwe. The powder was sieved through 75 µm test sieve and stored in a
polyethylene bag before use [53].
3.2 Extraction of the pigments using solvents of different polarities
Powdered E. crassipes roots (1 g) were placed into a 250 ml volumetric flask. A volume of 50
ml of water was added and mixed with reciprocating vortex shaker for 2 h. The mixture was
then filtered by vacuum suction filtration. The filtrate was collected and stored for analysis in
high performance liquid chromatography (HPLC) and gas chromatography-mass spectrometry
(GC-MS). The procedure was repeated using ethanol, butan-2-ol: glacial acetic acid: water
(BAW) (5:3:2) [20], 0.1 % HCl in methanol (v/v), 4.5 % formic acid in water (v/v) and 0.1 %
HCl in ethanol (v/v).
24
3.3 HPLC and GC-MS analysis of the crude extracts
The section focuses on characterisation of E. crassipes root extracts using HPLC and GC-MS
to obtain information which include determining the number of components present, the peak
areas of the separated components and the presence of selected molecular ion in the root
extracts.
3.3.1 Preparation of samples for HPLC analysis
A volume of 1 mL was taken from each of the extracts, 0.1 % HCl in ethanol extract, 0.1 %
HCl in methanol extract, 4.5 % formic acid in water extract, ethanol extract and butan-2-ol:
glacial acetic acid: water (5:3:2) extract and placed in six 50 mL volumetric flasks. The flasks
were topped to the mark with HPLC grade acetonitrile and sonicated for 2 minutes. The
samples were then analysed with GBC scientific HPLC (LC 200).
3.3.2 HPLC analysis of the crude extracts
GBC scientific HPLC with LC 200 UV-Vis detector, LC 1120 HPLC pump and Winchrome
Lite software was used for analysing the following extracts: 0.1 % HCl in ethanol (v/v), 0.1 %
HCl in methanol (v/v), 4.5 % formic acid in water (v/v), ethanol and butan-2-ol: glacial acetic
acid: water (5:3:2) (v/v). RP C18 column (150×4.6 mm ID×5 µm), UV-Vis detector at 520 nm
was used. The mobile phase of 90 % acetonitrile: 10 % water was used as the eluent solvents.
The flow rate of 1 mL/min, injection volume of 20 µm and the ambient temperature (18-25
°C) were used [87]. Data were collected and processed with Winchrome Lite software in a
personal computer.
3.3.3 GC-MS analysis of the crude extracts
Extracts of 0.1 % HCl in ethanol (v/v), 0.1 % HCl in methanol (v/v), 4.5 % formic acid in water
(v/v), ethanol, butan-2-ol and glacial acetic acid: water (5:3:2) (v/v) were analysed with GC-
MS.
25
Agilent ® 7890 Gas chromatograph was used with a capillary column length of 29.790 m,
internal diameter of 320 µm, maximum temperature of 350 °C and film thickness of 0.25 µm
with HPS phase. Helium carrier gas was used with a splitless front Intel mode. A constant
pressure of 14 200000 psig was applied for the entire run with front Intel purge flow of 3
ml/minute. Temperature profile used was from initial temperature with a target temperature of
50 °C for 1 minute, initial rate of 20 °C/min with a target temperature of 170 °C and an initial
rate of 8.75 °C/min with a target temperature of 240 °C. The transfer line temperature to mass
spectrometer (MS) was set at 300 °C.
An acquisition time of 6 minutes was used for the MS detector to start detecting components
separated by GC. A start mass of 50 and an end mass of 800 was set with an acquisition rate of
30 spectra per second. The detector voltage was set at 200 V with an electron energy of +70
volts. Temperature for the ion source was set at 250 °C.
3.4 Identification of the best solvent
The best solvent was determined basing on the total peak areas obtained from the
chromatograms of HPLC analysis. Peak area under the chromatograms is proportional to
concentration of the components present, hence solvent with the largest total peak area was
found to be the best solvent. The best solvent was found to be acidified ethanol (0.1 % HCl in
ethanol (v/v)).
3.5 Bulk extraction using acidified ethanol (0.1 % HCl in ethanol (v/v))
A mass of 100 g of powdered E. crassipes roots were placed in a 500 mL conical flask. A
volume of 250 ml acidified ethanol (0.1 % HCl in ethanol (v/v)) was added to the sample and
mixed with a reciprocating vortex shaker for 4 h. The mixture was then filtered by vacuum
suction filtration. The filtrate was collected and stored for phytochemical test and titration
processes.

26
3.6 Phytochemical test on crude extract
3.6.1 Test for flavonoids in acidified ethanol extract
i. NaOH test: A volume of 1 mL of the extract was treated with NaOH and HCl and the
colour change was observed and recorded.
ii. Lead acetate test: A volume of 1 mL of the extract was treated with lead acetate and
the colour change was observed and recorded.
iii. H2SO4 test: A volume of 1 mL of the extract was treated with concentrated H2SO4 and
the colour change was observed and recorded [62,63].
3.6.2 Test for anthocyanins in acidified ethanol extract
i. NaOH test: A volume of 1 mL of the extract was treated with 2 M NaOH and the colour
change was observed and recorded [62,63].
3.7 Application of the E. crassipes root extract and standard indicators in acid-base
titration
The section focuses on determining colour changes of E. crassipes root extract when subjected
to buffer solutions of different pH values and titration using the E. crassipes root extract and
standard indicators.
3.7.1 Determination of colour change of E. crassipes root extract at different pH
Buffer solutions of pH 2.2 to 12.04 were prepared as shown in Table B1 and B2 of Appendix
B. A volume of 2 ml of each buffer solution was placed in a test tube and a few drops of E.
crassipes root extract were added [17,57]. The buffer solution and the root extract were mixed
by swirling and the colours of the solutions were noted.
27
3.7.2 Titration using E. crassipes root extract, methyl red, phenolphthalein and
bromothymol blue indicators.
Four titrations were performed i.e. strong acid vs strong base, strong acid vs weak base, weak
acid vs strong base and weak acid vs weak base. The titrations were conducted in the order HCl
and NaOH; HCl and NH4OH; CH3COOH and NaOH and CH3COOH and NH4OH. A volume
of 10 ml of 1 M NaOH was placed in an Erlenmeyer flask and three drops of E. crassipes root
extract indicator were added. HCl (1 M) was placed in a burette. The titrant (HCl) was added
to titrate (NaOH) until a colour change was observed. Titrations were conducted in five
replicate analyses [52,58]. The procedure was repeated for all titrations i.e. HCl-NH4OH,
CH3COOH-NaOH and CH3COOH-NH4OH.
The procedure was repeated using methyl red, phenolphthalein and bromothymol blue
respectively. The same aliquots were used for both titrations, hence the same set of glassware
was used. The end point was noted and recorded in Appendix C.
3.8 Data treatment
All titrations were conducted in five replicate analyses, hence the mean and standard deviation
were calculated. Standard test statistics (t-test) was used to analyse the mean titre volume of
the natural indicator and that of each synthetic indicator relative to the equivalence point. One
way ANOVA was used to test the mean and variance of the extracted natural bio-indicator and
the synthetic indicators (phenolphthalein, methyl red and bromothymol blue). Differences at p
< 0.05 were considered to be significant. Comparison of the data obtained from the use of
extracted indicator and standard synthetic indicators during acid-base titrations was conducted.
28
CHAPTER FOUR
RESULTS AND DISCUSSION
4.0 Introduction
The chapter focuses on presentation of results in different forms, evaluation and interpretation
of experimental data, comparison of the results obtained using E. crassipes root extract and
those obtained using synthetic acid-base indicators. It also focuses on significance,
implications and conclusions of the findings.
4.1 Selection of the best extracting solvent results
The different extracting solvents used in an effort to determine the best extracting solvent
indicated that the components of the extracts were pH sensitive. Acidified ethanol E. crassipes
root extract was brick red, acidified methanol extract was faint yellow, 4.5 % formic acid in
water extract was faint orange, butan-2-ol: glacial acetic acid: water (5:3:2) extract was brown
and ethanol extract was yellow in colour. It showed that change of colour of the root extracts
depended on the acidity or alkalinity of the extracting solvent. The pH sensitivity exhibited by
the extracts can be attributed to the presence of anthocyanins. According to Khoddami et al
[64] , acidified solvents were good extracting solvents for anthocyanins and flavonoids. It is
also reported that optimum anthocyanin extraction is observed to occur when concentration of
less than 1 % of strong mineral acids like HCl, HNO3 and H2SO4 are used, hence 0.1 % HCl
was used in this research [64].
The extracts obtained from different extracting solvents were observed to have different
colours depending on the acidity of the solvent. During preliminary test, ethanol and acidified
ethanol (0.1 % HCl in ethanol) produced distinct colour change after being subjected to
solutions of different pH values. Ethanol extract showed brown colour in basic solutions and
light yellow colour in acidic solutions. Acidified ethanol extract showed dark brown colour in
29
basic solutions and colourless in acidic solutions. This showed that ethanol and acidified
ethanol solvents were able to extract the compounds that give acid-base characteristics more
as compared to other solvents.
4.2 HPLC results of the crude extracts
Two components were observed to be present from all extracts as shown in HPLC
chromatograms in Figure C2 to Figure C11 of Appendix C. The retention times for these two
distinct peaks range from 1.55 minutes to 2.16 minutes for all extracts. Acidified ethanol extract
produced five peaks with retention times of 1.26, 1.70, 1.94, 2.40 and 4.33 minutes. The two
most pronounced peaks occurred at 1.70 and 1.94 minutes. Ethanol extract produced eight
peaks with retention times of 1.63, 1.86, 2.22, 3.09, 3.47, 4.63, 5.73 and 8.00 minutes. The two
most pronounced peaks occurred at 1.63 and 1.86 minutes. The extract of 4.5 % formic acid in
water produced four peaks with retention times of 0.37, 2.16, 2.43 and 5.46 minutes. The two
most pronounced peaks occurred at 2.16 and 2.43 minutes. Acidified methanol extract
produced four peaks with retention times of 1.66, 1.86, 4.31 and 5.96 minutes. The two most
pronounced peaks occurred at 1.66 and 1.86 minutes. BAW extract produced five peaks with
retention times of 1.55, 1.75, 3.211, 4.41 and 9.96 minutes. The two most pronounced peaks
occurred at 1.55 and 1.75 minutes.
The differences in retention times of the components in the extracts could be attributed to how
the components interacted with the mobile and stationary phase. Due to differences in polarities
of the extracting solvents used the retention times of the components present varied. This can
be attributed to different components being eluted at different rate. The extracts that were
extracted might be different that resulted in different retention times being observed.
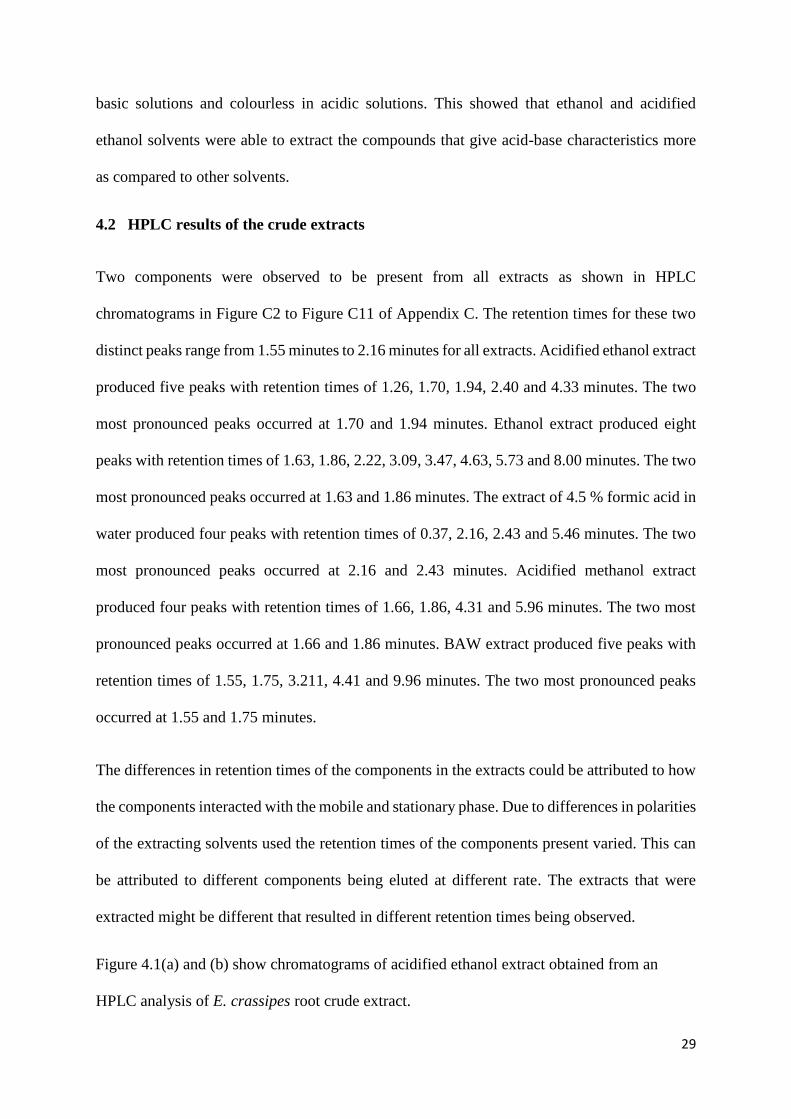
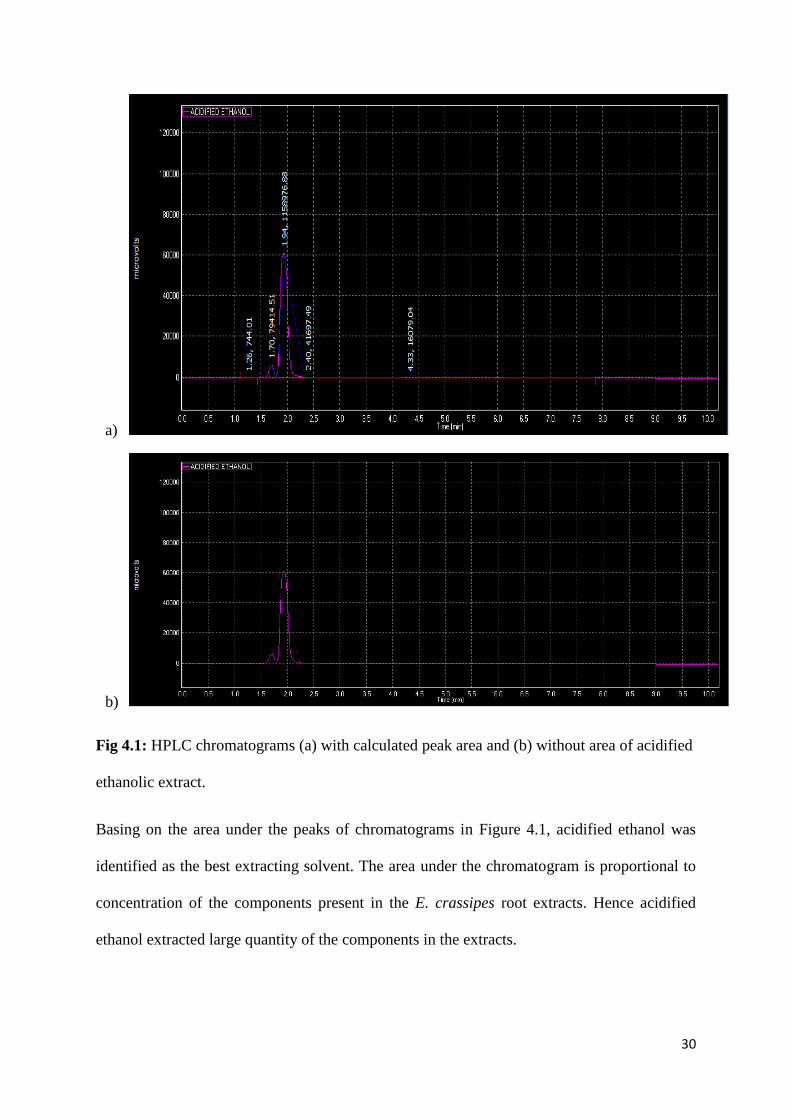
Figure 4.1(a) and (b) show chromatograms of acidified ethanol extract obtained from an
HPLC analysis of E. crassipes root crude extract.
30
a)
b)
Fig 4.1: HPLC chromatograms (a) with calculated peak area and (b) without area of acidified
ethanolic extract.
Basing on the area under the peaks of chromatograms in Figure 4.1, acidified ethanol was
identified as the best extracting solvent. The area under the chromatogram is proportional to
concentration of the components present in the E. crassipes root extracts. Hence acidified
ethanol extracted large quantity of the components in the extracts.
31
The experimental results showed that the components that were present in the extracts might
be anthocyanins. The HPLC chromatograms obtained in this research were almost similar to
those obtained by Qin et al [73] from mulberry fruit extract which showed two most
pronounced peaks and two which were not more pronounced. The retention times of the results
obtained from this research differed from those obtained by Qin et al. This might be due to that
different plant extracts were used in the two researches. According to Qin et al cyanidin and
pelargonidin were found to be present in mulberry fruit extract. These might be the same
compounds present in E. crassipes root extract which were observed in the chromatograms.
Differences in retention times might also be due to differences in the column parameters used,
the eluting solvents used and the HPLC pump used. Qin et al used a longer column (250 × 4.6
mm, 5 µm), triflouroacetic acid and acetonitrile as the eluting solvents. In this research a shorter
column (150 × 4.6 mm, 5 µm) and acetonitrile solvent was used. The mobile phases that were
employed in this research was an isocratic mobile phase whilst in literature gradient mobile
phase was used.
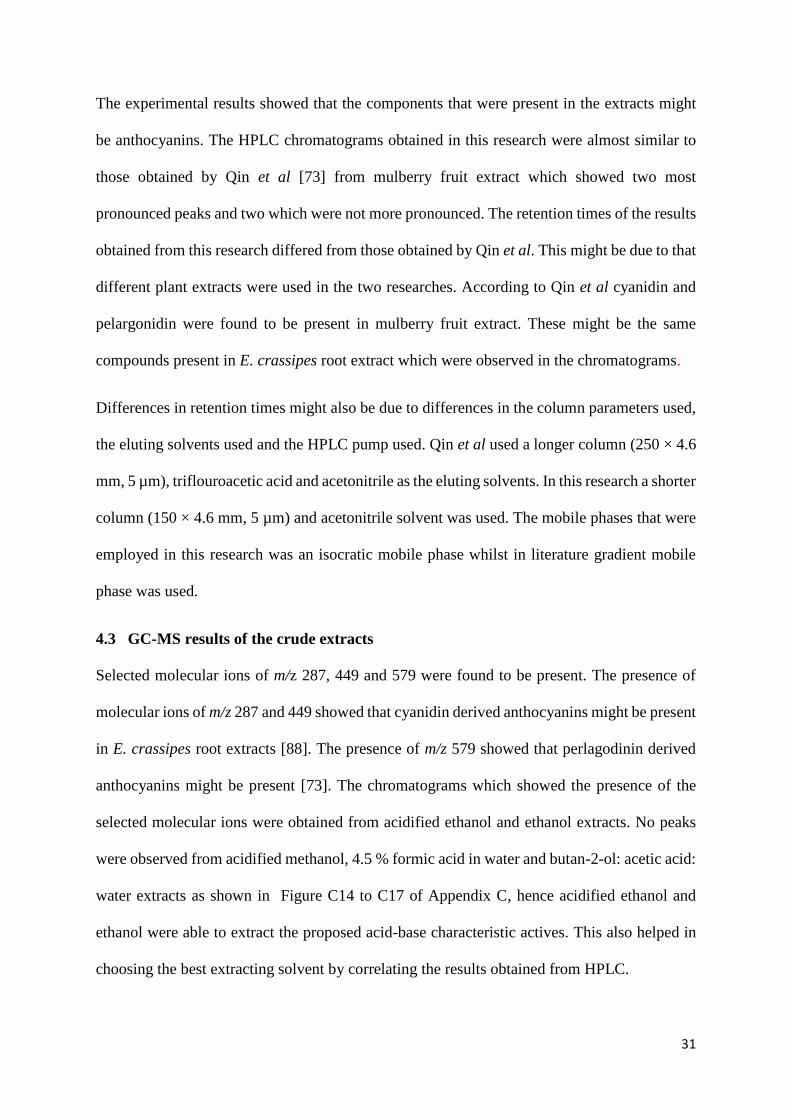
4.3 GC-MS results of the crude extracts
Selected molecular ions of m/z 287, 449 and 579 were found to be present. The presence of
molecular ions of m/z 287 and 449 showed that cyanidin derived anthocyanins might be present
in E. crassipes root extracts [88]. The presence of m/z 579 showed that perlagodinin derived
anthocyanins might be present [73]. The chromatograms which showed the presence of the
selected molecular ions were obtained from acidified ethanol and ethanol extracts. No peaks
were observed from acidified methanol, 4.5 % formic acid in water and butan-2-ol: acetic acid:
water extracts as shown in Figure C14 to C17 of Appendix C, hence acidified ethanol and
ethanol were able to extract the proposed acid-base characteristic actives. This also helped in
choosing the best extracting solvent by correlating the results obtained from HPLC.
32
Fragments associated with elimination of known moieties attached to aglycon parent molecule
of E. crassipes anthocyanin which might be present were observed [89,90]. Peaks observed at
a retention times of 14:06:4 min for acidified ethanol (unknown 48) and 14:06:1 min for ethanol
extract (unknown 54) as shown in Figure 4.2 and 4.3 respectively showed that flavylium cation
(2-(3,4-dihydroxyphenyl)-3,5,7-trihydroxy-2H-chromenylium) might be present. From NIST
library the compounds were identified as unknowns with chemical formula of C15H11O6, for
both acidified ethanol and ethanol extract, but based on literature the chemical formula
C15H11O6+ showed the presence of cyanidin derived anthocyanins.
Fig. 4.2: Acidified ethanol (0.1 % HCl in ethanol (v/v)) extract GC-MS chromatogram.
300
7:30.00
800
8:20.00
1300
9:10.00
1800
10:00.00
2300
10:50.00
2800
11:40.00
3300
12:30.00
3800
13:20.00
4300
14:10.00
4800
15:00.00
0
100
200
300
400
500
600
Time (min:sec)
Spectrum #
287 449 579 537
33
Fig. 4.3: Ethanol extract GC-MS chromatogram.
Figure 4.2 show the structure of cyanidin-3-O- glucoside and its fragments which are obtained
in GC-MS analysis.
Fig. 4.4: Structure of cyanidin-3-O-glucoside, cyanidin and glucose moiety [68,70].
Co-elution might have occurred such that component at m/z 287 was eluted together with
component at m/z 449 which had low intensity of approximately 400. The presence peak at m/z
300
7:30.00
800
8:20.00
1300
9:10.00
1800
10:00.00
2300
10:50.00
2800
11:40.00
3300
12:30.00
3800
13:20.00
4300
14:10.00
0
100
200
300
400
500
Time (min:sec)
Spectrum #
287 449 579 537
34
287 might be due to the loss of a deoxy-glucosyl group at m/z 162 from m/z 449 as shown in
Figure 4.4 [73,91]. Fragment ion of m/z 164 at a retention time of 8:27:7 minutes was also
observed which showed that glucose molecules were also detected as fragment in the mass
spectrometer. Glycones that could been fragmented can be glucose or galactose of m/z 162
[89].
Molecular ion of m/z 579 was also detected but due to the intensities shown on the
chromatogram, it could be concluded that the compound was in low concentration. The
presence of m/z 579 could be due to the presence of pelargodinin-3-O- rutinoside (C27H30O14+)
[73,92] which usually elute before cyanidin derived anthocyanins as proposed by Stoj et al
[74]. Fragment ions that may be associated with molecular ion C27H30O14+ are C21H21O10
+ m/z
433 as a result of loss of deoxy-glucosyl and C15H11O5+ m/z 271 (rutinosyl) as a result of loss
of another deoxy-glucosyl group as shown in Figure 4.5 [88].
Fig. 4.5: Structure of pelargonodin-3-O-rutinoside and its fragments [70].
35
4.4 FTIR results of the acidified ethanol extract
This section focuses on FTIR characterisation of the acidified ethanol, E. crassipes root
extract to determine the functional groups that are present.
Fig. 4.6: FTIR results of E. crassipes root extract (0.1 % HCl in ethanol extract) vibrational
frequencies.
FTIR spectrum in Figure 4.6 shows FTIR bands that were present in the E. crassipes root
extract. Vibrational frequency at 3842.12 cm-1 can be assigned to O-H vibrational stretching.
Vibrational band at 3415.01 can be due to the presence of C-H and O-H groups related to sugar
vibration and phenol O-H groups. O-H group due to being bonded to other groups, the
vibrational frequency decreased, hence the peak at 3415.01 might due to its presence [93]. At
low wavenumber, the O-H stretching band overlaps with the C-H stretching peak. Peaks
located at 2923.06 cm-1 and 2852.30 cm-1 can be assigned to symmetric and asymmetric
stretching of -CH2 and -CH3 groups since it falls within the range 2935 – 2850 cm-1 of C-H of
CH2 vibrational band [94,95]. Vibrational band at 1638.57 cm-1 can be assigned to C=O group
36
since it falls within the range of C=O stretching, 1849 – 1634 cm-1. Peaks at 1508.16 cm-1 can
be due C=C in ring group, 1449.58 cm-1 can be assigned to α-CH2 bending, 1384.84 cm-1 can
be CH2 or CH3 deformation or O-H bending (in-plane) or CH3 bending or can also be assigned
to C-O-H bending [82].
Peaks at 1046. 52 and 1110.17 cm-1 can be C-C-C bending, 875.17 cm-1 was assigned to C-H
bending and ring puckering whilst at 834.31 cm-1 can be C-H and =CH2 out-of-plane bending
[95]. Vibrational frequencies at 766.54 cm-1 can be assigned to O-H bending (out of plane),
696.30 and 620.79 cm-1 can be C-H deformation of the compounds present in the sample [94].
From the vibrational bands obtained from the extracts, it could be concluded that functional
groups associated with carbohydrate molecules, phenols, flavylium cation and cyanidin derived
anthocyanins might be present in the E. crassipes root extract.
4.5 Colours of E. crassipes root extract in buffered solutions
The colour changed from yellow to dark brown as shown in Table 4.1 when the extract was
added to buffer solutions of pH 2.2 to 12.04 as shown in Figure C20 of Appendix C.
Table 4.1: Colour change of buffer solution after adding E. crassipes root extract.
pH Colour
2.2 Yellow
3 Light brick red
4 Brick red
5 Redish purple
6 Purple
7 Colourless
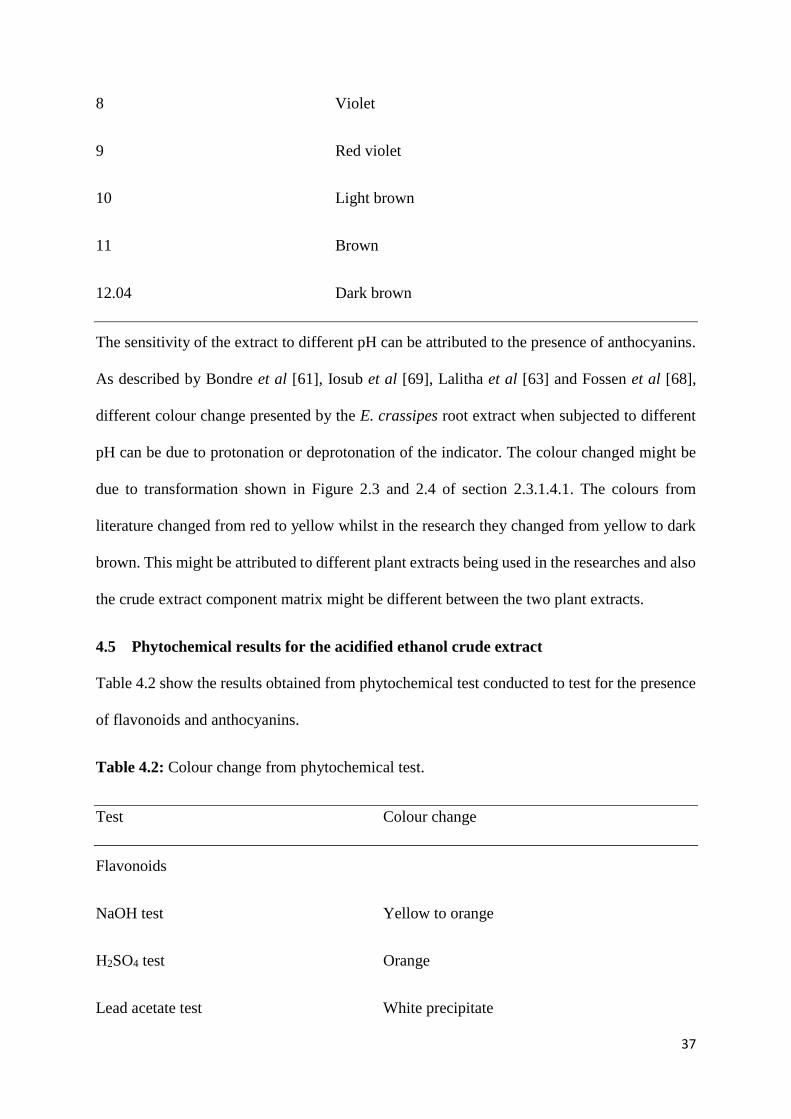
37
8 Violet
9 Red violet
10 Light brown
11 Brown
12.04 Dark brown
The sensitivity of the extract to different pH can be attributed to the presence of anthocyanins.
As described by Bondre et al [61], Iosub et al [69], Lalitha et al [63] and Fossen et al [68],
different colour change presented by the E. crassipes root extract when subjected to different
pH can be due to protonation or deprotonation of the indicator. The colour changed might be
due to transformation shown in Figure 2.3 and 2.4 of section 2.3.1.4.1. The colours from
literature changed from red to yellow whilst in the research they changed from yellow to dark
brown. This might be attributed to different plant extracts being used in the researches and also
the crude extract component matrix might be different between the two plant extracts.
4.5 Phytochemical results for the acidified ethanol crude extract
Table 4.2 show the results obtained from phytochemical test conducted to test for the presence
of flavonoids and anthocyanins.
Table 4.2: Colour change from phytochemical test.
Test Colour change
Flavonoids
NaOH test Yellow to orange
H2SO4 test Orange
Lead acetate test White precipitate
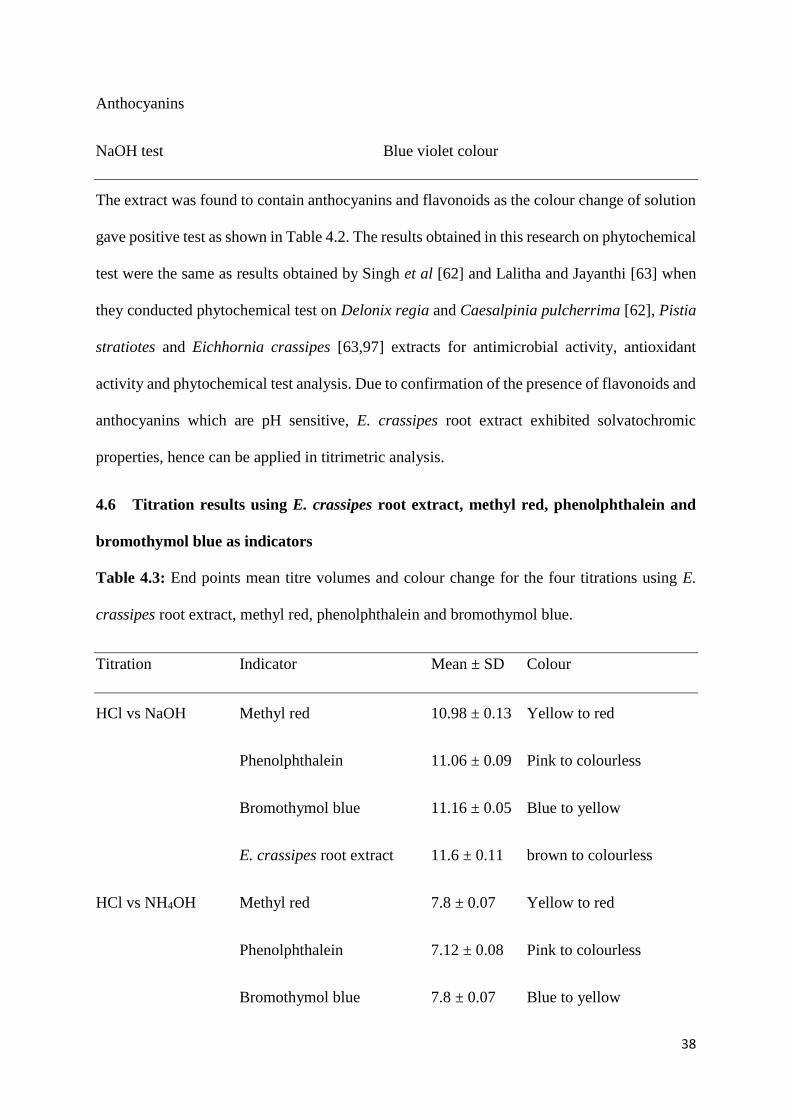
38
Anthocyanins
NaOH test Blue violet colour
The extract was found to contain anthocyanins and flavonoids as the colour change of solution
gave positive test as shown in Table 4.2. The results obtained in this research on phytochemical
test were the same as results obtained by Singh et al [62] and Lalitha and Jayanthi [63] when
they conducted phytochemical test on Delonix regia and Caesalpinia pulcherrima [62], Pistia
stratiotes and Eichhornia crassipes [63,97] extracts for antimicrobial activity, antioxidant
activity and phytochemical test analysis. Due to confirmation of the presence of flavonoids and
anthocyanins which are pH sensitive, E. crassipes root extract exhibited solvatochromic
properties, hence can be applied in titrimetric analysis.
4.6 Titration results using E. crassipes root extract, methyl red, phenolphthalein and
bromothymol blue as indicators
Table 4.3: End points mean titre volumes and colour change for the four titrations using E.
crassipes root extract, methyl red, phenolphthalein and bromothymol blue.
Titration Indicator Mean ± SD Colour
HCl vs NaOH Methyl red 10.98 ± 0.13 Yellow to red
Phenolphthalein 11.06 ± 0.09 Pink to colourless
Bromothymol blue 11.16 ± 0.05 Blue to yellow
E. crassipes root extract 11.6 ± 0.11 brown to colourless
HCl vs NH4OH Methyl red 7.8 ± 0.07 Yellow to red
Phenolphthalein 7.12 ± 0.08 Pink to colourless
Bromothymol blue 7.8 ± 0.07 Blue to yellow
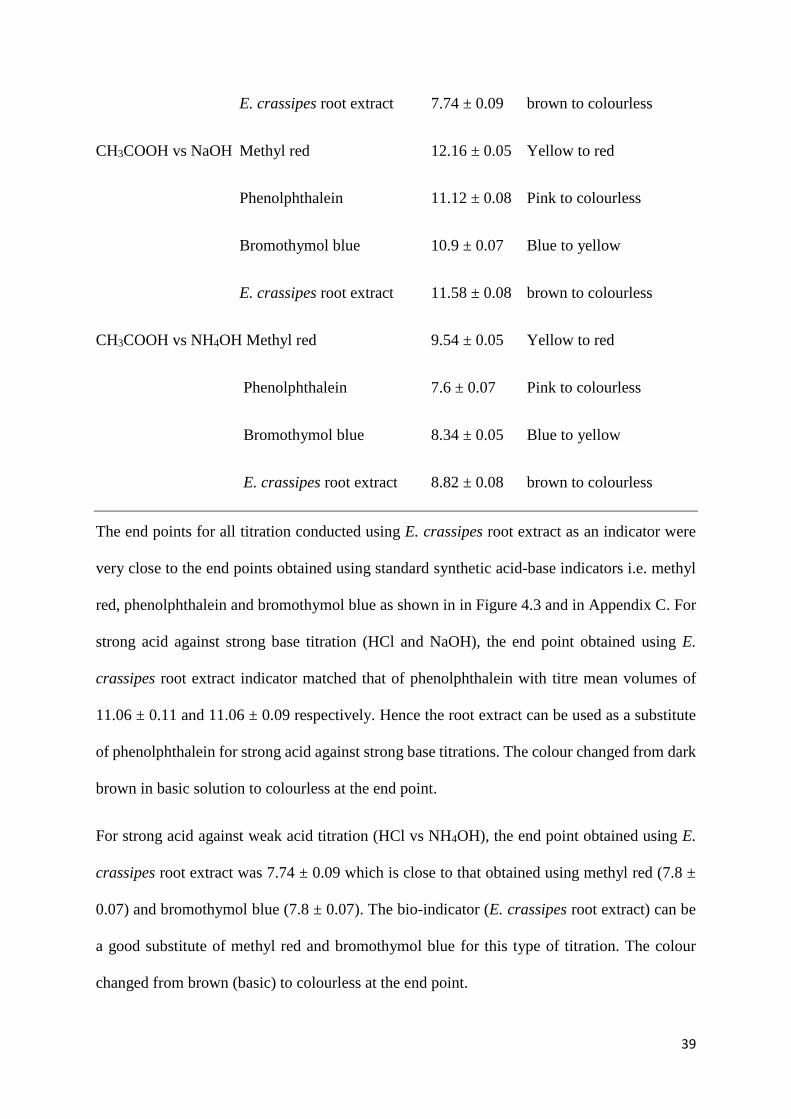
39
E. crassipes root extract 7.74 ± 0.09 brown to colourless
CH3COOH vs NaOH Methyl red 12.16 ± 0.05 Yellow to red
Phenolphthalein 11.12 ± 0.08 Pink to colourless
Bromothymol blue 10.9 ± 0.07 Blue to yellow
E. crassipes root extract 11.58 ± 0.08 brown to colourless
CH3COOH vs NH4OH Methyl red 9.54 ± 0.05 Yellow to red
Phenolphthalein 7.6 ± 0.07 Pink to colourless
Bromothymol blue 8.34 ± 0.05 Blue to yellow
E. crassipes root extract 8.82 ± 0.08 brown to colourless
The end points for all titration conducted using E. crassipes root extract as an indicator were
very close to the end points obtained using standard synthetic acid-base indicators i.e. methyl
red, phenolphthalein and bromothymol blue as shown in in Figure 4.3 and in Appendix C. For
strong acid against strong base titration (HCl and NaOH), the end point obtained using E.
crassipes root extract indicator matched that of phenolphthalein with titre mean volumes of
11.06 ± 0.11 and 11.06 ± 0.09 respectively. Hence the root extract can be used as a substitute
of phenolphthalein for strong acid against strong base titrations. The colour changed from dark
brown in basic solution to colourless at the end point.
For strong acid against weak acid titration (HCl vs NH4OH), the end point obtained using E.
crassipes root extract was 7.74 ± 0.09 which is close to that obtained using methyl red (7.8 ±
0.07) and bromothymol blue (7.8 ± 0.07). The bio-indicator (E. crassipes root extract) can be
a good substitute of methyl red and bromothymol blue for this type of titration. The colour
changed from brown (basic) to colourless at the end point.
40
For weak acid against strong base titration (CH3COOH vs NaOH), the end point obtained using
the natural E. crassipes root extract was 11.58 ± 0.08 that is deviate significantly from the
results other indicators. Hence the natural indicator cannot be used as a substitute of any of the
indicators under study. The colour changed from dark brown to colourless at the end point.
For weak acid against weak base titration (CH3COOH vs NH4OH), the end point obtained
using E. crassipes root extract as an indicator was 8.82 ± 0.08 that was close to the end point
obtained using bromothymol blue 8.34 ± 0.05 as compared to the other standard indicators
used. Hence the root extract can be used as a substitute for bromothymol blue in weak acid
against weak base titrations. The colour changed from brown (basic) to colourless at the end
point.
It was also observed that the extract act reversibly and gave distinct colour change in both
directions when exposed to different solutions of varying pH [56].
4.5.1 Statistical analysis of generated data
The experimental data generated from titration was statistically analysed using one way
ANOVA. The results are shown in Table C22 to C25 of Appendix C. From the results obtained
from titrations of HCl-NaOH and CH3COOH-NH4OH, there was statistical significant
evidence at 5 % confidence interval to show that there were no significant differences between
the mean titre volumes of the four indicators (methyl red, phenolphthalein, bromothymol blue
and E. crassipes root extract). For the titrations of strong acid against weak base and weak acid
against strong acid, it was found that there were significant differences between the mean titre
volumes of the four indicators [3].
Standard t-test was conducted for the titration combinations that showed that there were
significant differences between the mean titre volumes form one way ANOVA, HCl-NH4OH
and CH3COOH-NaOH. The results of t-test are shown in Table C17 to C21 of Appendix C.
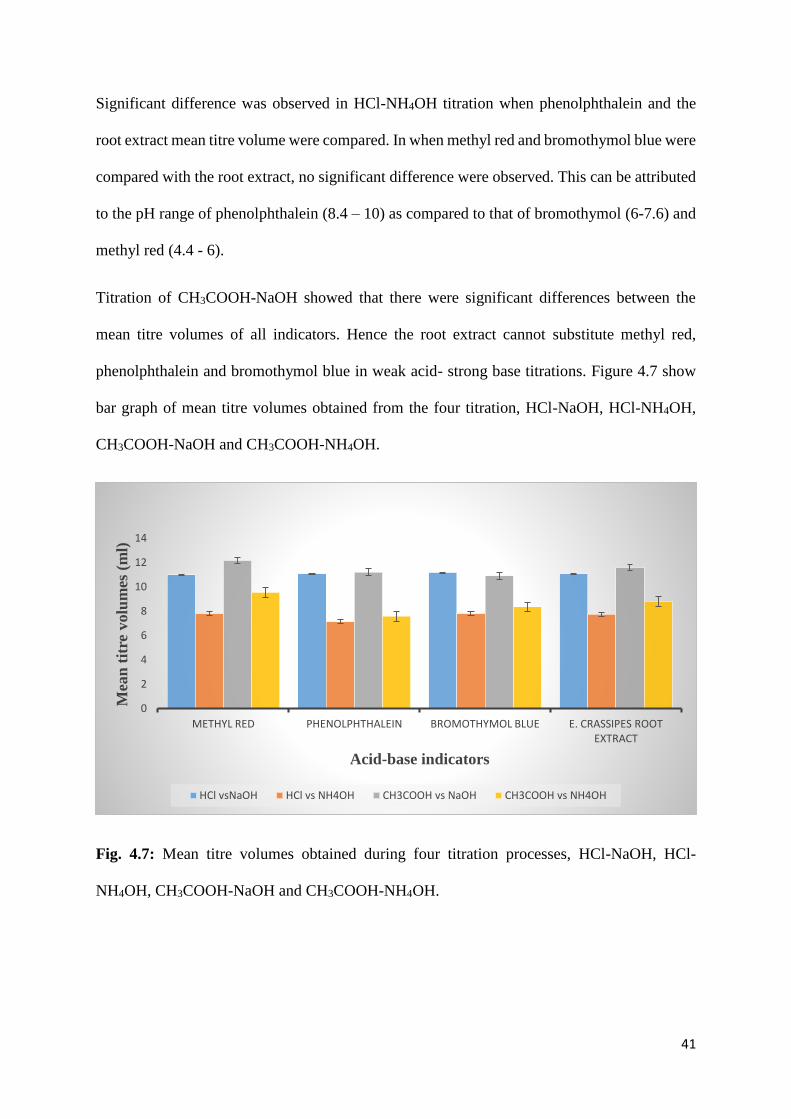
41
Significant difference was observed in HCl-NH4OH titration when phenolphthalein and the
root extract mean titre volume were compared. In when methyl red and bromothymol blue were
compared with the root extract, no significant difference were observed. This can be attributed
to the pH range of phenolphthalein (8.4 – 10) as compared to that of bromothymol (6-7.6) and
methyl red (4.4 - 6).
Titration of CH3COOH-NaOH showed that there were significant differences between the
mean titre volumes of all indicators. Hence the root extract cannot substitute methyl red,
phenolphthalein and bromothymol blue in weak acid- strong base titrations. Figure 4.7 show
bar graph of mean titre volumes obtained from the four titration, HCl-NaOH, HCl-NH4OH,
CH3COOH-NaOH and CH3COOH-NH4OH.
Fig. 4.7: Mean titre volumes obtained during four titration processes, HCl-NaOH, HCl-
NH4OH, CH3COOH-NaOH and CH3COOH-NH4OH.
0
2
4
6
8
10
12
14
METHYL RED PHENOLPHTHALEIN BROMOTHYMOL BLUE E. CRASSIPES ROOT EXTRACT
Mea
n t
itre
volu
mes
(m
l)
Acid-base indicators
HCl vsNaOH HCl vs NH4OH CH3COOH vs NaOH CH3COOH vs NH4OH
42
CHAPTER FIVE
CONCLUSIONS AND RECOMMENDATIONS
5.1 Conclusion
Pigments from E. crassipes root extract were extracted and tested for their acid-base indicator
properties. The best extracting solvent was found to be 0.1 % HCl in ethanol (v/v), hence bulk
extraction was done use acidified ethanol. The root extract tested positive for the presence of
flavonoids and anthocyanins. From GC-MS analysis it was predicted that cyanidin and
pelargodinin derived anthocyanins were present. The extract proved to be a good substitute
acid-base indicator to the synthetic indicators as the end point values were not significantly
different. One way ANOVA showed that there was no significant difference between the mean
titre volumes of the synthetic indicators and that of the extract for strong acid against strong
base and weak acid against weak base titration. Standard t-test showed that there was
significant difference between the means of E. crassipes root extract and phenolphthalein from
weak acid against strong base titration. No significant difference was observed on all indicators
under study from strong acid and weak base titration. Hence it could be concluded that E.
crassipes root extract can be used as an effective substitute of phenolphthalein in strong acid-
strong base titration and also bromothymol blue in weak acid- weak base titrations.
43
5.2 Recommendations
Based on the findings of this research, use of Eichhornia crassipes root extract as acid-
base indicator for strong acid against strong base titration as a substitute of
phenolphthalein and for weak acid against weak base titration as a substitute of
bromothymol is recommended.
5.2.1 Further research
Isolation and identifying the active components of the extract.
Exploring acid-base titrations using E. crassipes root extract in comparison to other
synthetic acid-base indicators not used in the research.
44
REFERENCES
[1] Puvaneswari N, Muthukrishnan J, Gunasekaran P. Toxicity assessment and microbial
degradation of azo dyes. Indian J Exp Biol 2006;44:618–26.
[2] Lavanya C, Dhankar R, Chhikara S, Sheoran S. Degradation of toxic dyes. Int J Curr
Microbiol Appl Sci 2014;3:189–99.
[3] Mohd P, Khan A, Farooqui M. Analytical applications of plant extract as natural pH
indicator. J Adv Sci Res 2011;2:20–7.
[4] Shih Y, Tso C, Tung L. Rapid degradation of methyl orange with nanoscale zerovalent
iron particles. J Environ Eng Manag 2010;20:137–43.
[5] Jain PK, Jain P, Jain P. Green chemistry: petal sap of Delonix regia as a substitute for
hazardous internal indicators in volumetric analysis. Biosci Biotechnol Res Commun
2013;6:186–9.
[6] Sarangerel D, Altangerel A, Munkhzaya T, Sukhbaatar B, Amarzaya B. Equilibrium
and kinetic studies for reval of reactive blue 50 from aqueous media using zero valent
Iron. Int J Civ Environ Eng 2014;14:38–45.
[7] Abbas SK. Study of acid-base indicator property of flowers of Ipomoea biloba. Int
Curr Pharm J 2012;1:420–2. doi:10.3329/icpj.v1i12.12452.
[8] Kateregga E, Sterner T. Indicators for an invasive species : Water hyacinths in Lake
Victoria. Ecol Indic 2007;7:362–70. doi:10.1016/j.ecolind.2006.02.008.
[9] Moyo P, Chapungu L, Mudzengi B. Integrated management approach to the control of
water hyacinth, The case of Shagashe river in Masvingo, Zimbabwe. Greener J Phys
Sci 2013;3:229–40.
[10] Téllez TR, Martín E, López DR, Granado GL, Pérez EA, López RM, et al. The Water
45
Hyacinth , Eichhornia crassipes, an invasive plant in the Guadiana River Basin
(Spain). Reabic Aquat Invasions 2008;3:42–53. doi:10.3391/ai.2008.3.1.8.
[11] Deshpande A, Jadge D, Dhawale S, Patrakar R, Gadgul A. Flower extract of Ixora
coccinea as a natural indicator in acid base titration. J Pharm Res 2010;3:2512–3.
[12] Mwangi T. Water hyacinth – Can its aggressive invasion be controlled. UNEP Glob
Environ Alert Serv 2013:1–17.
[13] Rezania S, Ponraj M, Talaiekhozani A, Mohamad SE, Md Din MF, Taib SM, et al.
Perspectives of phytoremediation using water hyacinth for removal of heavy metals,
organic and inorganic pollutants in wastewater. J Environ Manage 2015;163:125–33.
doi:10.1016/j.jenvman.2015.08.018.
[14] Masoud MS, Hagagg SS, Ali AE, Nasr NM. Solvatochromic behavior of the electronic
absorption spectra of gallic acid and some of its azo derivatives. Spectrochim Acta Part
A 2012;94:256–64. doi:10.1016/j.saa.2012.03.037.
[15] Aloo P, Ojwang W, Omondi R, Njiru JM, Oyugi D. A review of the impacts of
invasive aquatic weeds on the bio-diversity of some tropical water bodies with special
reference to Lake Victoria (Kenya). Biodivers J 2013;4:471–82.
[16] Chikwenhere GP. Current strategies for the management of water hyacinth on the
Manyame river system in Zimbabwe. Plant Prot Res Inst 2001;102:105–8.
[17] Abbas SK. A study on pH indicator property of flowers of Ipomea nil. J Innov Pharm
Biol Sci 2014;1:72–6.
[18] Eze SO, Ogbuefi RA. Analytical potontials of dye extarcts from Aspilia. Asian J Nat
Appl Sci 2014;3:54–60.
[19] Zhang Y-Y, Zhang D-Y, Barrett SC. Genetic uniformity characterizes the invasive
spread of water hyacinth (Eichhornia crassipes), a clonal aquatic plant. Mol Ecol
46
2010;19:1774–86. doi:10.1111/j.1365-294X.2010.04609.x.
[20] Suva MA. Opuntia ficus indica ( L .) fruit extract as Natural Indicator in acid-base
titration. J PharmaSciTech 2014;3:3–5.
[21] Bart HJ, Pilz S. Industrial scale natural products extraction. Ind Scale Nat Prod Extr
2011:1–26. doi:10.1002/9783527635122.
[22] Bhise SH, Shinde NG, Surve BS, Pimpodkar N V, Shikalgar SS. Acalypha wilkesiana
as natural pH indicator. Int J Nat Prod Res 2014;4:33–5.
[23] Pimpodkar N V, Surve BS, Bhise SH. Use of Argyreia cuneata flower extract as a
natural indicator in acid base titration. J Curr Pharma Res 2014;4:1124–7.
[24] Carmen Z, Daniela S. Textile organic dyes-characteristics, polluting effects and
separation/ elimination procedures from industrial effluents. Org Pollut Ten Years
After Stock Conv – Environ Anal Updat 2012:55–86.
[25] Isiuku B, Horsfall M, Spiff A. Removal of methyl red from aqueous solution by
NaOH-activated Cassava peels carbon in a fixed-bed column. Res J Appl Sci
2014;9:238–43.
[26] Surve BS, Humbe P V, Kale RG. Use of Cordyline fruticosa leaves extract as a natural
jndicator in acid-base titration. Int J Curr Pharm Sci 2015;1:194–7.
[27] Piroi D, Magureanu M, Mandache N, Parvulescu V. Decomposition of organic dyes in
water using non-thermal plasma. Bucharest: 2009.
[28] Mahmoud MA, Poncheri A, Badr Y, Wahed MGA El. Photocatalytic degradation of
methyl red dye. S Afr J Sci 2009;105:299–303.
[29] Sadeghi A, Aboutaleb M, Bazardehi K, Raffe S, Zarif B. Biotransformation of
carmoisine and reactive black 5 dyes using saccharomyces cerevisiae. J Sci Res
47
2014;6:859–64.
[30] Sahasrabudhe M, Pathade G. Decolourization and degradation of C. I. reactive red 195
by Georgenia sp. CC-NMPT-T3. Indian J Exp Biol 2012;50:290–9.
[31] Vijaya, P P, Padmavathy P, Sandhya S. Decolourization and Biodegradation of
Reactive Azo Dyes by Mixed Culture. Indian J Biotechnol 2003;2:259–63.
[32] Kumar M, Prakash SO, Kumar SM. Photochemical treatment of methyl red waste
water by Photo-Fenton reagent. Int J Res Chem Environ 2012;2:87–92.
[33] Dim PE. Adsorption of methyl red and methyl orange using different tree bark powder.
Acad Res Int 2013;4:330–8.
[34] Giwa A, Giwa FJ, Ifu BJ. Microbial decolourization of an anthraquinone dye C. I.
reactive blue 19 using Bacillus cereus. Am Chem Sci J 2012;2:60–8.
[35] Luo X, Zhan Y, Huang Y, Yang L, Tu X, Luo S. Removal of water-soluble acid dyes
from water environment using a novel magnetic molecularly imprinted polymer. J
Hazard Mater 2011;187:274–82. doi:10.1016/j.jhazmat.2011.01.009.
[36] NTP. Report on carcinogens, Thirteenth edition. 2010.
[37] Breckland Scientific Supplies. Safety data sheet-bromocresol green. BSB Sci Solut
2015.
[38] International V. Bromocresol indicator ACS , Reag . Ph Eur. MSDS. Chemwatch
Mater Saf Data Sheet 2012:1–7.
[39] Biotechnology SC. Material safety data sheet bromothymol blue. St Cruz Biotechnol
2011:1–11.
[40] Chen H, Hopper SL, Cerniglia CE. Biochemical and molecular characterization of an
azoreductase from Staphylococcus aureus, a tetrameric NADPH-dependent
48
flavoprotein. J Microbiol 2005;151:1433–41. doi:10.1099/mic.0.27805-0.
[41] LabChem. Material safety data sheet of methyl red-methylene blue. LabChem 2010:1–
8.
[42] MSDS P. Material safety data sheet methyl orange 2006:1–3.
[43] Santa Cruz Biotechnology. Material safety data sheet Methyl orange 2011:1–11.
[44] Mas RH, Haris M, Sathasivam K. The removal of methyl red from aqueous solutions
using banana pseudostem fibers. Am J Appl Sci 2009;6:1690–700.
[45] Ramya M, Iyappan S, Manju A, S JJ. Biodegradation and decolorization of acid red by
Acinetobacter radioresistens. J Bioremediation Biodegrad 2010;1:1–6.
doi:10.4172/2155-6199.1000105.
[46] So K, Wong P, Chan K. Decolourization and Biodegradaation of Methyl Red by
Acetobacter Liquefaciens. Toxic Assess An Int J 1990;5:221–35.
[47] Sanner T. Scientific committee on consumer products (SCCP) Opinion on 4-
Aminobenzoic acid (PABA). 2006.
[48] Biotechnology SC. Material data sheet N,N-Dimethyl-p-phenylenediamine 2012:1–9.
[49] America T. Material safety data sheet of N,N-dimethyl-1,4-phenylenediamine 2005:1–
6.
[50] Gupta P, Jain P, Jain PK. Flower sap : A natural resource as indicator in acidimetry
and alkalimetry. Int J CheTech Res 2012;4:1619–22.
[51] Eze S, Obguefi R. Analytical potentials of dye extracts from Urena lobata (Mgbo)
flowers. Commun Appl Sci 2014;2:25–35.
[52] Patrakar R, Gond N, Jadge D. Flower extract of Jacaranda acutifolia used as a natural
indicator in acid base titration. Int J PharmTech Res 2010;2:1954–7.
49
[53] Onwuachu UI, Aboh UJUA, Iwuoha G. Extraction, characterisation and workability of
some local plant dyes as acid-base indicators. Internatin J Res Applied, Nat Soc Sci
2014;2:1–6.
[54] Doctor T, Cababat R. Blood leaf (Iresine herstii) extract used as an indicator of soil
pH. Internatin J Sci Res Publ 2014;4:10–4.
[55] Bagul SB, Dabhade MP, Dabhade P, Bhamare TD. “A herbal pH indicator from bracts
extract of Bougainvillea spectabilis.” A Genes J Pharmagene 2012;2:11–3.
[56] Shivaji PT, Rajaram PS, Singh S, Shyale SS. Acid-Base indicator property of Dye
obtained from Gerbera jamesonii and Tagertes erecta 2014;3:1–4.
[57] Saptarini NM, Suryasaputra D, Nurmalia H. Application of butterfly bea (Clitoria
ternatea Linn) extract as an indicator of acid-base titration. J Chem Pharm Res
2015;7:275–80.
[58] Kadam S, Yadav A, Raje V, Waghmare K. Comparative study of natural and synthetic
indicators. Der Pharma Chem 2013;5:296–9.
[59] Paul C, Chakraborty DD, Ghosh A, Chakraborty P. Natural indicator as a substitute to
synthetic indicator-A developmental approach. J Appl Pharm Sci 2014;4:120–2.
doi:10.7324/JAPS.2014.40921.
[60] Thote P, Mandir GV. Green chemistry, study of acid-base indicator property. Int J Res
Granthaalayah 2015;3:1–6.
[61] Bondre S, Patil P, Kulkarni A, Pillai MM. Study on isolation and purification of
anthocyanins and its applications as pH indicator. Int J Adv Biotechnol Res
2012;3:698–702.
[62] Singh S, Bothara SB, Singh S, Patel R, Ughreja R. Preliminary pharmaceutical
characterization of some flowers as natural indicator, acid-base titration. Pharmacogn J
50
2011;3:39–43. doi:10.5530/pj.2011.22.8.
[63] Lalitha P, Jayanthi P. Preliminary studies on phytochemicals and antimicrobial activity
of solvent extracts of Eichhornia crassipes (Mart.) Solms. Asian J Plant Sci Res
2012;2:115–22.
[64] Khoddami A, Wilkes MA, Roberts TH. Techniques for analysis of plant phenolic
compounds. Molecules 2013;18:2328–75. doi:10.3390/molecules18022328.
[65] Aishah B, Nursabrina M, Noriham A, Norizzah AR, Shahrimi MH. Anthocyanins from
Hibiscus sabdariffa, Melastoma malabathricum and Ipomoea batatas and its colour
properties. Int Food Res J 2013;20:827–34.
[66] He F, Liang N, Mu L, Pan Q, Wang J, Reeves MJ, et al. Anthocyanins and their
variation in red wines I. monomeric anthocyanins and their color expression.
Molecules 2012;17:1571–601. doi:10.3390/molecules17021571.
[67] Raki VP, Ota AM, Skrt MA, Miljkovi MN, Kosti DA, Sokolovi DT, et al.
Investigation of fluorescence properties of cyanidin and cyanidin 3-O-β-
glucopyranoside. Hem Ind 2015;69:155–63. doi:10.2298/HEMIND140203030R.
[68] Fossen T, Cabrita L, Andersen M. Colour and stability of pure anthocyanins infuenced
by pH including the alkaline region. Food Chem 1998;63:435–40.
[69] Iosub SD, Meghea A, Geana I. Solvatochromic parameters of some anthocyanin
derivatives concentrated from selected natural extracts. UPB Sci Bull, Ser B
2014;76:25–34.
[70] Ananga A, Georgiev V, Ochieng J, Phills B, Tsolova V. Production of anthocyanins in
grape cell cultures, potential source of raw material for Pharmaceutical, Food and
Cosmetic industries. Mediterr. Genet. Code-Grapvine Olive, Florida: 2013, p. 247–87.
[71] Agrawal S, Chouhan K, Raj CN, Jain S, Balasubramaniam A. Isolation of herbal acid-
51
base indicator from the seeds of Punica granatum. J Chem Pharm Res 2011;3:168–71.
[72] Elumalai A, Eswaraiah MC, Kasarla R, Ravi P. An alternative to synthetic acid base
indicator- Tagetes erecta linn. Asian J Res Chem 2012;5:218–20.
[73] Qin C, Li Y, Niu W, Ding Y, Zhang R. Analysis and characterisation of anthocyanins
in Mulberry fruit. Czech J Food Sci 2010;28:117–26.
[74] Stój A, Malik A, Targoński Z. Comparative analysis of anthocyanin composition of
juices obtained from selected spicies of berry fruits. Polish J Food Nutr Sci
2006;15:401–7.
[75] Ibrahim M, Alaam M, El-haes H, Jalbout AF, Leon A De. Analysis of the structure and
vibrational spectra of glucose and fructose. Eclet Quim 2006;31:15–22.
[76] Kunatsa T, Mufundirwa A. Biogas production from water hyacinth case of Lake
Chivero- Zimbabwe. Int J Recent Technol Eng 2013;2:138–42.
[77] Dellagreca M, Previtera L, Zarrelli A. Structures of new phenylphenalene-related
compounds from Eichhornia crassipes (water hyacinth). Tetrahedron 2009;65:8206–8.
doi:10.1016/j.tet.2009.07.069.
[78] Adebayo AA, Briski E, Kalaci O, Hernandez M, Ghabooli S, Beric B, et al. Water
hyacinth (Eichhornia crassipes) and water lettuce (Pistia stratiotes) in the Great Lake.
Aquat Invasions 2011;6:91–6. doi:10.3391/ai.2011.6.1.11.
[79] Mironga JM. Lessons for effective management of water hyacinth (Eichhornia
crassipes (Mart.) solms) in Kenya. Int J Humanit Soc Sci 2014;4:118–26.
[80] Mironga JM. The effect of water hyacinth, Eichhornia crassipes, infestation on
phytoplankton productivity in Lake Naivasha and the status of control. 2003.
[81] Mironga JM, Mathooko JM, Onywere SM. Effects of spreading patterns of water
52
hyacinth (Eichhornia crassipes) on zooplankton population in lake Naivasha, Kenya.
Int J Dev Sustain 2014;3:1971–87.
[82] Mahamadi C, Nharingo T. Modelling the kinetics and equilibrium properties of
cadmium biosorption by river green alga and water hyacinth weed. Toxicol Environ
Chem 2007;89:297–305. doi:10.1080/02772240601010063.
[83] Mahamadi C, Nharingo T. Competitive adsorption of Pb2+, Cd2+ and Zn2+ ions onto
Eichhornia crassipes in binary and ternary systems. Bioresour Technol 2010;3:859–
64. doi:10.1016/j.biortech.2009.08.097.
[84] Mahamadi C, Nharingo T. Utilization of water hyacinth weed (Eichhornia crassipes)
for the removal of Pb (II), Cd (II) and Zn (II) from aquatic environments : An
adsorption isotherm study. Environ Technol 2010;31:1221–8.
doi:10.1080/09593331003646604.
[85] Abdullah N. Removal of methyl red from aqueous solution using dried water hyacinth.
Univ Malaysia J 2010:1–25.
[86] Saltabas O, Teker M, Konuk Z. Biosorption of cationic dyes from aqueous solution by
water hyacinth roots. Glob NEST J 2012;14:24–31.
[87] Baublis A, Spomer A, Berber-Jimenez MD. Anthocyanin pigments : Comparison of
extract stability. Urbana: 2000.
[88] Junqueira-gonçalves MP, Yáñez L, Morales C, Navarro M, Contreras RA, Zúñiga GE.
Isolation and characterization of phenolic compounds and anthocyanins from Murta
(Ugni molinae Turcz.) fruits. assessment of antioxidant and antibacterial activity.
Molecules 2015;20:5698–713. doi:10.3390/molecules20045698.
[89] Guimarães R, Barros L, Carvalho AM, Queiroz MJRP, Santos-buelga C, Ferreira
ICFR. Characterization of phenolic compounds in wild fruits from North eastern
53
Portugal. Minho, Portugal, 2014.
[90] Aza-gonzález C, Ochoa-Ajelo N. Characterization of anthocyanins from fruits of two
Mexican chili peppers (Capsicum annuum L .). J Mex Chem Soc 2012;56:149–51.
[91] Dias ALS, Rozet E, Chataigné G, Oliveira AC, Rabelo CAS, Hubert P, et al. A rapid
validated UHPLC–PDA method for anthocyanins quantification from Euterpe
oleracea fruits. J Chromatogr B 2012;907:108–16.
doi:10.1016/j.jchromb.2012.09.015.
[92] Shah NM, Morris M, Grijalva A, Chapman JM. Characterization of anthocyanins and
flavonol glycosides from Delonix regia and Ixora casei hance by LC-ESI-MS-MS.
2006.
[93] Venkatesan S, Pugazhendy K, Sangeetha D, Vasantharaja C, Prabakaran S,
Meenambal M. Fourier transform infrared (FT-IR) spectoroscopic analysis of
Spirulina. Int J Pharm Biol Arch 2012;3:969–72.
[94] Kiefer J, Frank K, Zehentbauer FM, Schuchmann HP. Infrared spectroscopy of
Bilberry extract water-in-oil emulsions sensing the water-oil interface. Biosensors
2016:1–13.
[95] Stelian R, Chirugiu L. Physico-chemical research on Sambucus emulus L. species.
University of Medicine and Pharmacy of Craiova, 2014.
[96] Nikonenko N, Buslov D, Sushko N, Zhbankov R. Analysis of the structure of
carbohydrates with useof the regularized deconvolution method of vibrational spectra.
BAU Fen Bil Enst Derg 2002;4:13–6.
[97] Tulika T, Mala A. Pharmaceutical potential of aquatic plant Pistia stratiotes (L) and
Eichhornia crassipes. J Plant Sci 2015;3:10–8.
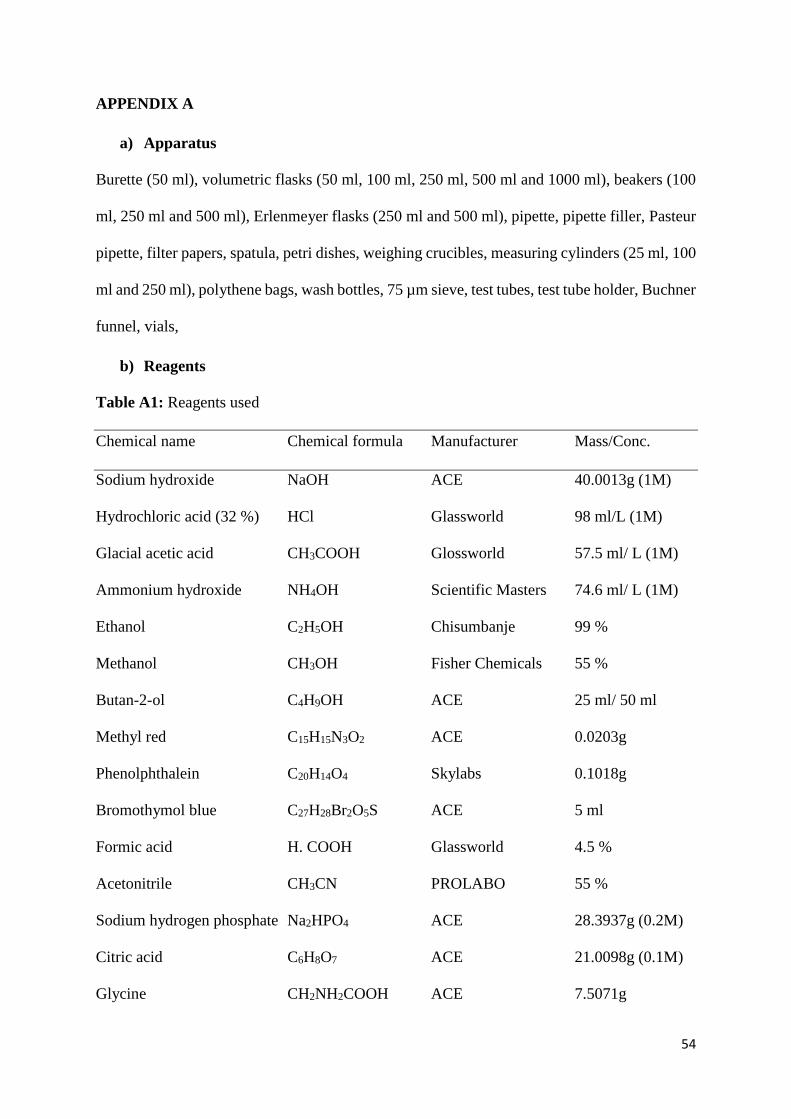
54
APPENDIX A
a) Apparatus
Burette (50 ml), volumetric flasks (50 ml, 100 ml, 250 ml, 500 ml and 1000 ml), beakers (100
ml, 250 ml and 500 ml), Erlenmeyer flasks (250 ml and 500 ml), pipette, pipette filler, Pasteur
pipette, filter papers, spatula, petri dishes, weighing crucibles, measuring cylinders (25 ml, 100
ml and 250 ml), polythene bags, wash bottles, 75 µm sieve, test tubes, test tube holder, Buchner
funnel, vials,
b) Reagents
Table A1: Reagents used
Chemical name Chemical formula Manufacturer Mass/Conc.
Sodium hydroxide NaOH ACE 40.0013g (1M)
Hydrochloric acid (32 %) HCl Glassworld 98 ml/L (1M)
Glacial acetic acid CH3COOH Glossworld 57.5 ml/ L (1M)
Ammonium hydroxide NH4OH Scientific Masters 74.6 ml/ L (1M)
Ethanol C2H5OH Chisumbanje 99 %
Methanol CH3OH Fisher Chemicals 55 %
Butan-2-ol C4H9OH ACE 25 ml/ 50 ml
Methyl red C15H15N3O2 ACE 0.0203g
Phenolphthalein C20H14O4 Skylabs 0.1018g
Bromothymol blue C27H28Br2O5S ACE 5 ml
Formic acid H. COOH Glassworld 4.5 %
Acetonitrile CH3CN PROLABO 55 %
Sodium hydrogen phosphate Na2HPO4 ACE 28.3937g (0.2M)
Citric acid C6H8O7 ACE 21.0098g (0.1M)
Glycine CH2NH2COOH ACE 7.5071g
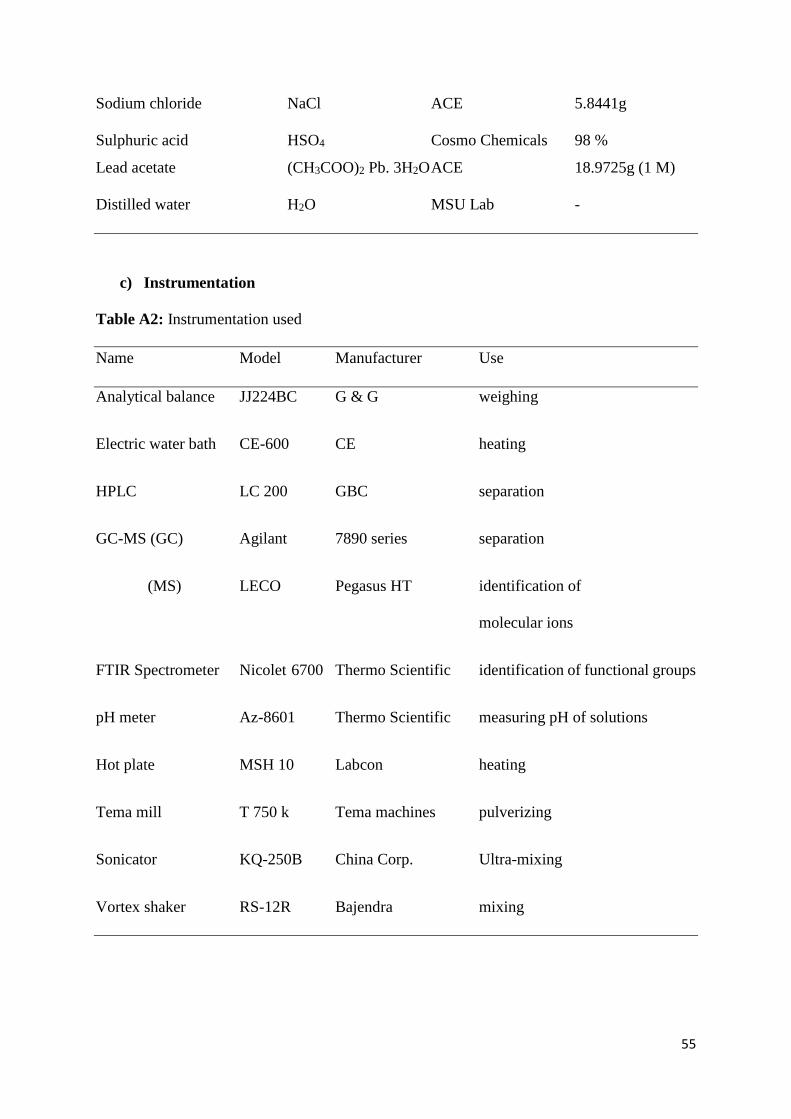
55
Sodium chloride NaCl ACE 5.8441g
Sulphuric acid HSO4 Cosmo Chemicals 98 %
Lead acetate (CH3COO)2 Pb. 3H2O ACE 18.9725g (1 M)
Distilled water H2O MSU Lab -
c) Instrumentation
Table A2: Instrumentation used
Name Model Manufacturer Use
Analytical balance JJ224BC G & G weighing
Electric water bath CE-600 CE heating
HPLC LC 200 GBC separation
GC-MS (GC) Agilant 7890 series separation
(MS) LECO Pegasus HT identification of
molecular ions
FTIR Spectrometer Nicolet 6700 Thermo Scientific identification of functional groups
pH meter Az-8601 Thermo Scientific measuring pH of solutions
Hot plate MSH 10 Labcon heating
Tema mill T 750 k Tema machines pulverizing
Sonicator KQ-250B China Corp. Ultra-mixing
Vortex shaker RS-12R Bajendra mixing
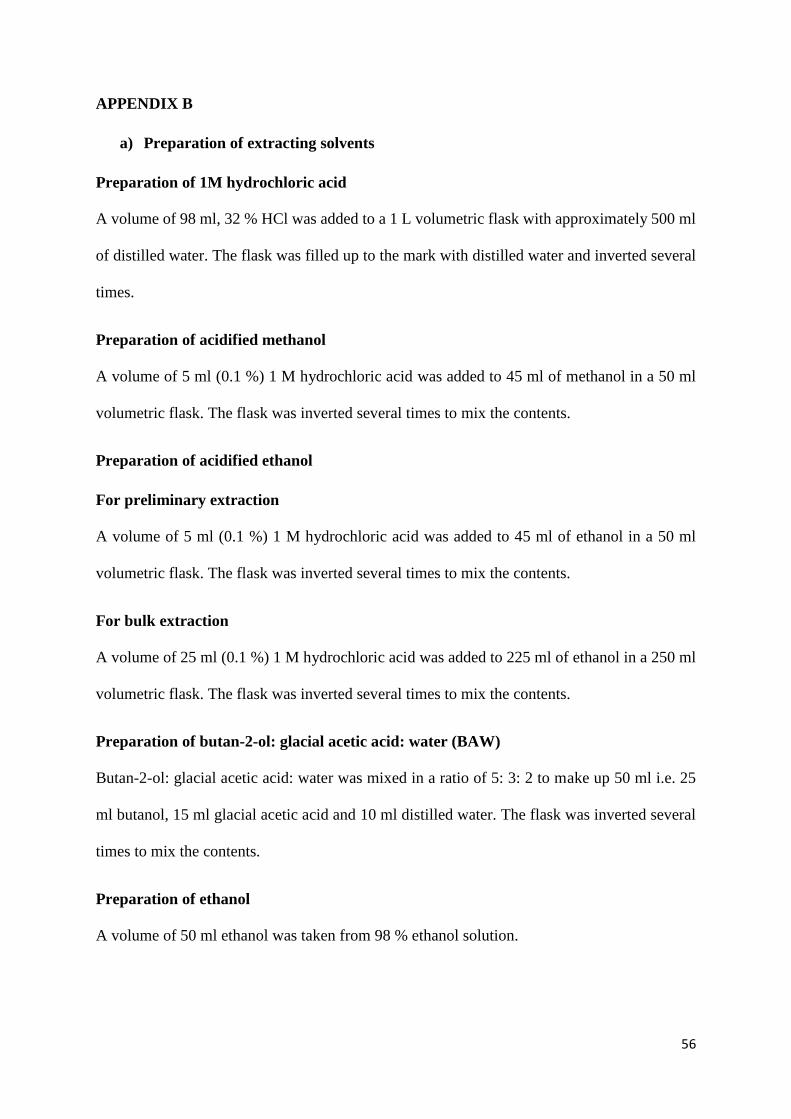
56
APPENDIX B
a) Preparation of extracting solvents
Preparation of 1M hydrochloric acid
A volume of 98 ml, 32 % HCl was added to a 1 L volumetric flask with approximately 500 ml
of distilled water. The flask was filled up to the mark with distilled water and inverted several
times.
Preparation of acidified methanol
A volume of 5 ml (0.1 %) 1 M hydrochloric acid was added to 45 ml of methanol in a 50 ml
volumetric flask. The flask was inverted several times to mix the contents.
Preparation of acidified ethanol
For preliminary extraction
A volume of 5 ml (0.1 %) 1 M hydrochloric acid was added to 45 ml of ethanol in a 50 ml
volumetric flask. The flask was inverted several times to mix the contents.
For bulk extraction
A volume of 25 ml (0.1 %) 1 M hydrochloric acid was added to 225 ml of ethanol in a 250 ml
volumetric flask. The flask was inverted several times to mix the contents.
Preparation of butan-2-ol: glacial acetic acid: water (BAW)
Butan-2-ol: glacial acetic acid: water was mixed in a ratio of 5: 3: 2 to make up 50 ml i.e. 25
ml butanol, 15 ml glacial acetic acid and 10 ml distilled water. The flask was inverted several
times to mix the contents.
Preparation of ethanol
A volume of 50 ml ethanol was taken from 98 % ethanol solution.
57
Preparation of 4.5 % formic acid in water
A volume of 11.1 ml of formic acid was transferred into a 50 ml volumetric flask containing
approximately 35 ml of distilled water. Distilled water was added up to the mark and the flask
was inverted to mix the contents.
b) Preparation of solvent to be used as the mobile phase in HPLC analysis
Preparation of 90 % acetonitrile
A volume of 225 ml acetonitrile was placed in a 250 ml volumetric flask. Distilled water was
added up to the mark. The contents were mixed by inverting the flask.
c) Preparation of buffer solutions
Preparation of Glycine-NaOH buffer (pH 8.53 – 12.9)
A mass of 7.5075 g (0.1 mol) of glycine (aminoethanoic acid) and 5.8443 g (0.1 mol) of sodium
chloride were mixed and placed in 1 L volumetric flask. Distilled water was added up to the
mark and the flask was inverted several times to mix the contents.
A mass of 4.1020 g (0.1 M) of NaOH was placed in a 1 L volumetric flask and distilled water
was added up to the mark. The flask was inverted several times to mix the contents until they
dissolve.
To make up 100 ml of buffer solution, mixture of glycine and sodium chloride and 0.1 M NaOH
were mixed in the following portions shown in Table B1 to make the buffer solutions of pH
9.31 to 12.04.
Table B1: Volumes used to make Glycine-NaOH buffer solutions from pH 9.31 to 12.04.
pH Volume of Glycine (ml) Volume of NaOH (ml)
9.31 80 20
10.09 60 40
58
11.01 51 49
12.04 45 55
Preparation of Na2HPO4 – citric acid buffer (pH 2.2 – 8.0)
A mass of 28.3937 g (0.2 M) of Na2HPO4 was placed in a 1 L volumetric flask and filled up to
the mark with distilled water. The flask was inverted several time to mix and dissolve di-
sodium hydrogen orthophosphate anhydrous.
A mass of 21.0098 g (0.1 M) of citric acid was placed in a 1 L volumetric flask and filled up
the mark with distilled water. The contents were mixed by inverting several times.
To make 100 ml of the buffer 0.2 M Na2HPO4 was added to 0.1 M citric acid in the proportions
shown in Table B2 below.
Table B2: Volumes used to make Na2HPO4- citric acid buffer of pH 2.2 to 8.0.
pH Volume of Na2HPO4 (ml) Volume of citric acid (ml)
2.2 2 98
3.0 20.55 79.45
4.0 38.55 61.45
5.0 51.50 48.50
6.0 63.15 36.85
7.0 82.35 17.65
8.0 97.25 2.75
59
d) Preparation of phytochemical test solutions
Preparation of 1 M and 2 M sodium hydroxide (NaOH)
A mass of 40. 0019 g (0.1 mol) of NaOH was placed in a 1 L volumetric flask and distilled
water was added up to the mark. The flask was inverted several times to mix and dissolve
NaOH.
A mass of 8.0037 g (2 mol) of NaOH was placed in a 100 ml volumetric flask and distilled
water was added up to the mark. The flask was inverted several times to mix and dissolve
NaOH.
Preparation of 1 M hydrochloric acid (HCl)
A volume of 98 ml of hydrochloric acid was added to a 1 L volumetric flask with approximately
500 ml of distilled water. Distilled water was then added up to the mark. The flask was inverted
several times to mix HCl and distilled water.
Preparation of 1 M lead acetate [(CH3COO) 2 Pb. 3H2O]
A mass of 18.9725 g (1 mol) of lead acetate was placed in a 50 ml volumetric flask and filled
up to the mark with distilled water up to the mark. The flask was inverted several times to mix
the contents.
e) Preparation of titration solutions
Preparation of 1 M hydrochloric acid (HCl)
A volume of 98 ml of hydrochloric acid was added to a 1 L volumetric flask with approximately
500 ml distilled water. Distilled water was added up to the mark. The flask was inverted several
times.
Preparation of 1 M sodium hydroxide (NaOH)
A mass of 40.0008 g (1 M) of NaOH was placed in a 1 L volumetric flask and distilled water
was added up to the mark. The flask was inverted several times.

60
Preparation of 1 M acetic acid (CH3COOH)
A volume of 57.5 ml of glacial acetic acid was added in a 1 L volumetric flask with
approximately 500 ml distilled water. Distilled water was added up to the mark. The flask was
inverted several times.
Preparation of 1 M ammonium hydroxide (NH4OH)
A volume of 74.6 ml of ammonia was added to a 1 L volumetric flask with approximately 500
ml distilled water. Distilled water was added up to the mark. The flask was inverted several
times.
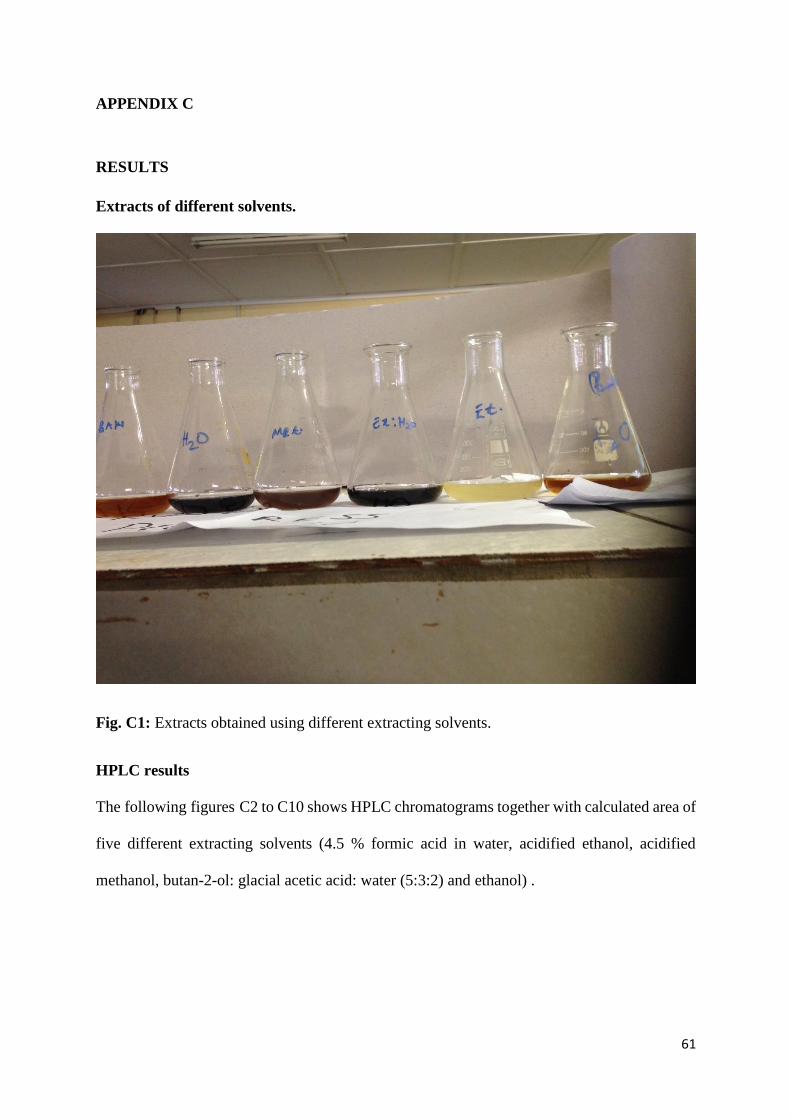
61
APPENDIX C
RESULTS
Extracts of different solvents.
Fig. C1: Extracts obtained using different extracting solvents.
HPLC results
The following figures C2 to C10 shows HPLC chromatograms together with calculated area of
five different extracting solvents (4.5 % formic acid in water, acidified ethanol, acidified
methanol, butan-2-ol: glacial acetic acid: water (5:3:2) and ethanol) .
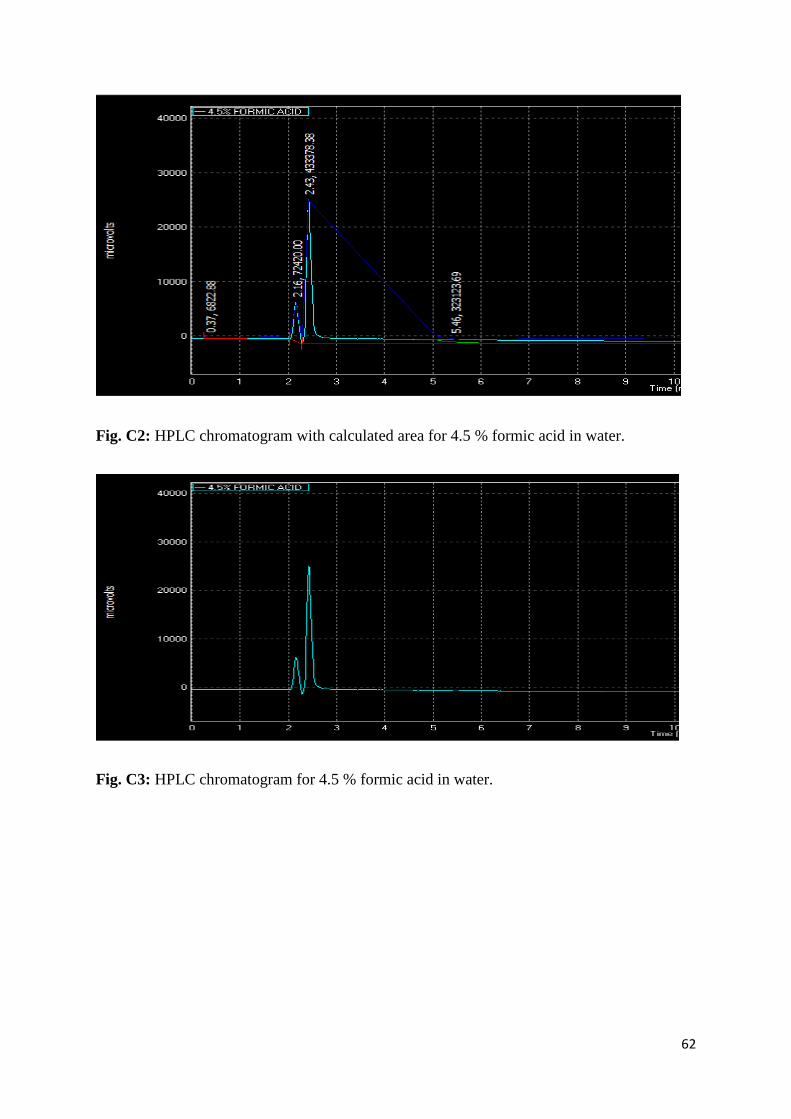
62
Fig. C2: HPLC chromatogram with calculated area for 4.5 % formic acid in water.
Fig. C3: HPLC chromatogram for 4.5 % formic acid in water.
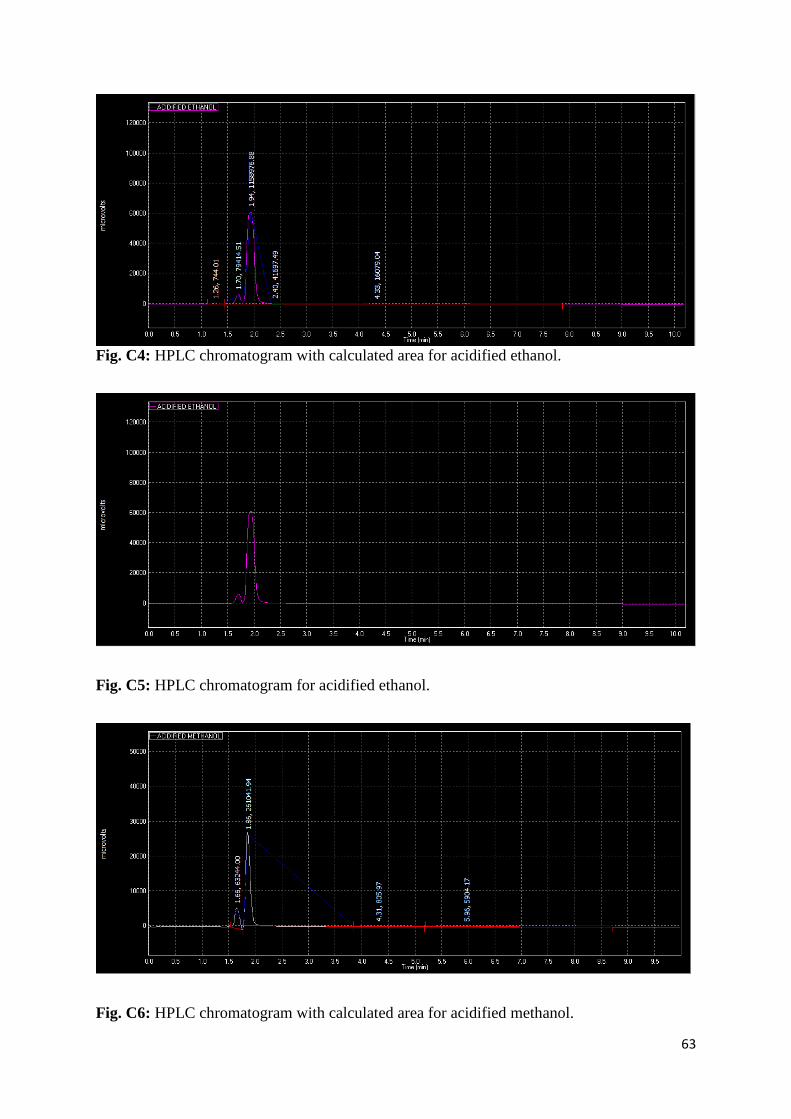
63
Fig. C4: HPLC chromatogram with calculated area for acidified ethanol.
Fig. C5: HPLC chromatogram for acidified ethanol.
Fig. C6: HPLC chromatogram with calculated area for acidified methanol.
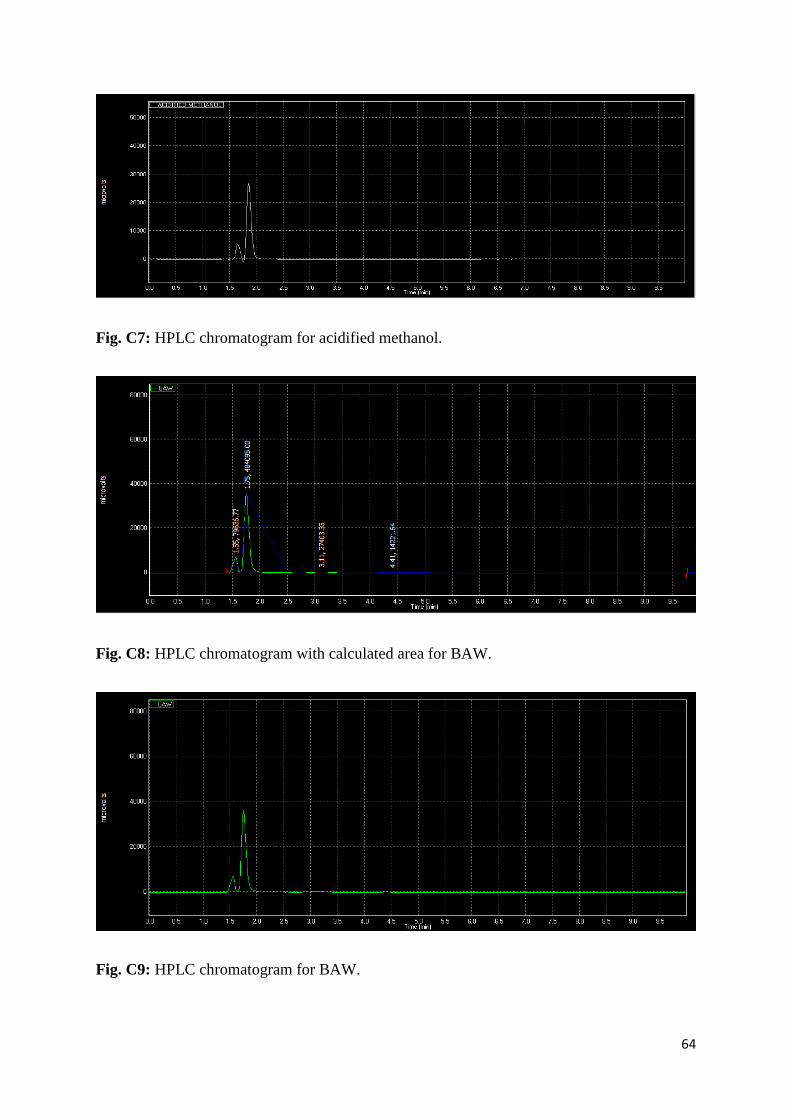
64
Fig. C7: HPLC chromatogram for acidified methanol.
Fig. C8: HPLC chromatogram with calculated area for BAW.
Fig. C9: HPLC chromatogram for BAW.
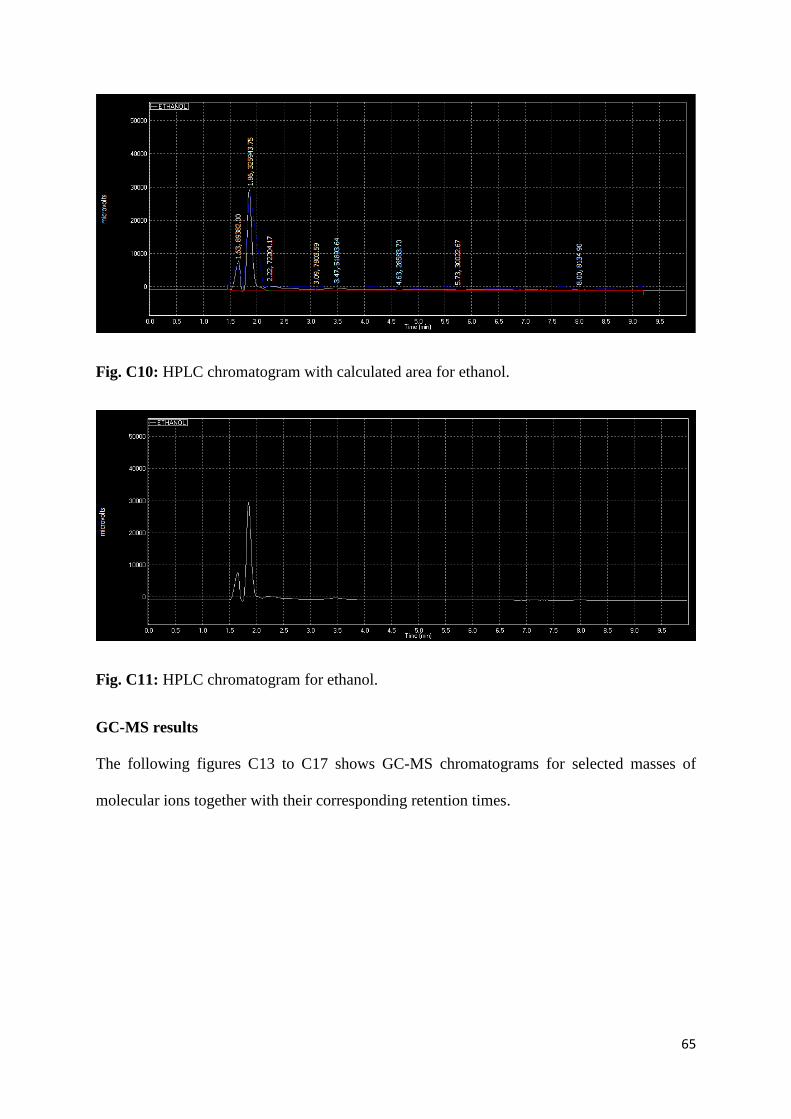
65
Fig. C10: HPLC chromatogram with calculated area for ethanol.
Fig. C11: HPLC chromatogram for ethanol.
GC-MS results
The following figures C13 to C17 shows GC-MS chromatograms for selected masses of
molecular ions together with their corresponding retention times.
66
Fig. C12: GC-MS chromatogram for acidified ethanol.
Fig. C13: GC-MS Chromatogram for ethanol
300
7:30.00
800
8:20.00
1300
9:10.00
1800
10:00.00
2300
10:50.00
2800
11:40.00
3300
12:30.00
3800
13:20.00
4300
14:10.00
4800
15:00.00
0
100
200
300
400
500
600
Time (min:sec)
Spectrum #
287 449 579 537
300
7:30.00
800
8:20.00
1300
9:10.00
1800
10:00.00
2300
10:50.00
2800
11:40.00
3300
12:30.00
3800
13:20.00
4300
14:10.00
0
100
200
300
400
500
Time (min:sec)
Spectrum #
287 449 579 537
67
Fig. C14: GC-MS chromatogram for acidified methanol.
Fig. C15: GC-MS chromatogram for 4.5 % formic acid in water.
300
7:30.00
800
8:20.00
1300
9:10.00
1800
10:00.00
2300
10:50.00
2800
11:40.00
3300
12:30.00
3800
13:20.00
4300
14:10.00
0
20
40
60
80
100
Time (min:sec)
Spectrum #
287 449 579 537
300
7:30.00
800
8:20.00
1300
9:10.00
1800
10:00.00
2300
10:50.00
2800
11:40.00
3300
12:30.00
3800
13:20.00
4300
14:10.00
0
20
40
60
80
100
120
140
Time (min:sec)
Spectrum #
287 449 579 537
68
Fig. C16: GC-MS chromatogram for BAW.
Fourier transform infrared spectrometry (FTIR) results
Figure C17 shows vibrational frequencies obtained from E. crassipes roots extract.
300
7:30.00
800
8:20.00
1300
9:10.00
1800
10:00.00
2300
10:50.00
2800
11:40.00
3300
12:30.00
3800
13:20.00
4300
14:10.00
0
20
40
60
80
100
120
140
160
180
Time (min:sec)
Spectrum #
287 449 579 537
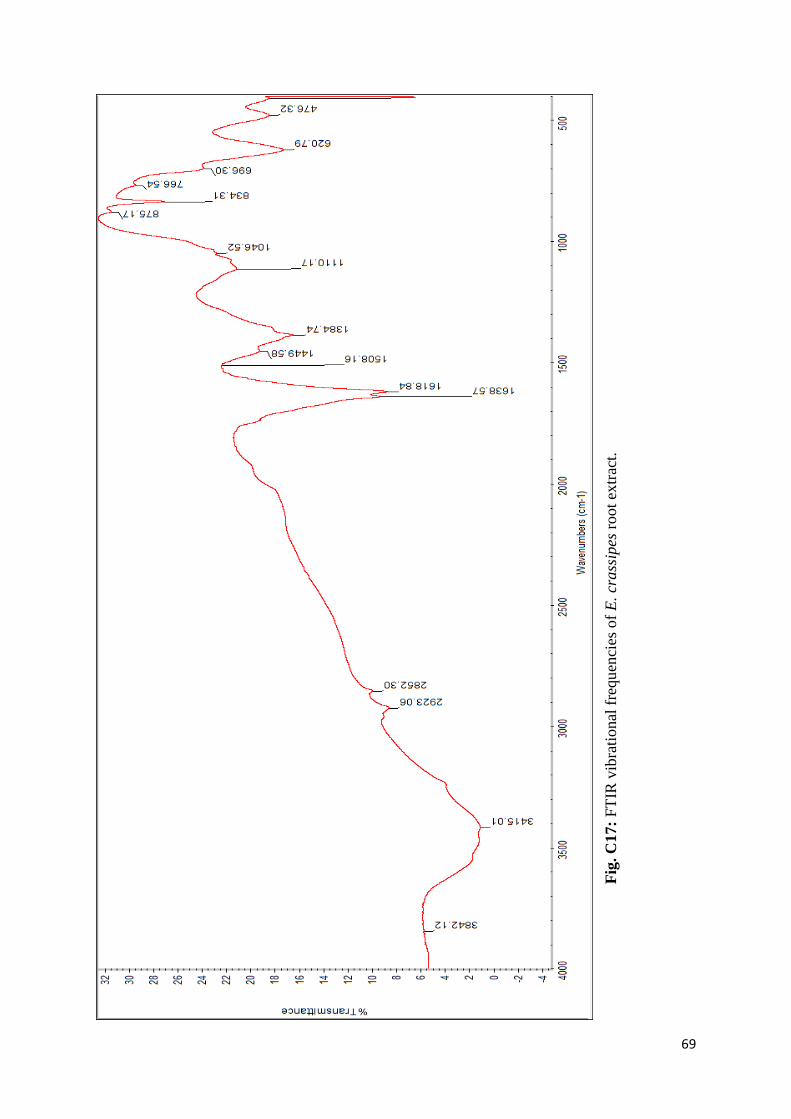
69
Fig
. C
17:
FT
IR v
ibra
tional
fre
qu
enci
es o
f E
. cr
ass
ipes
root
extr
act.
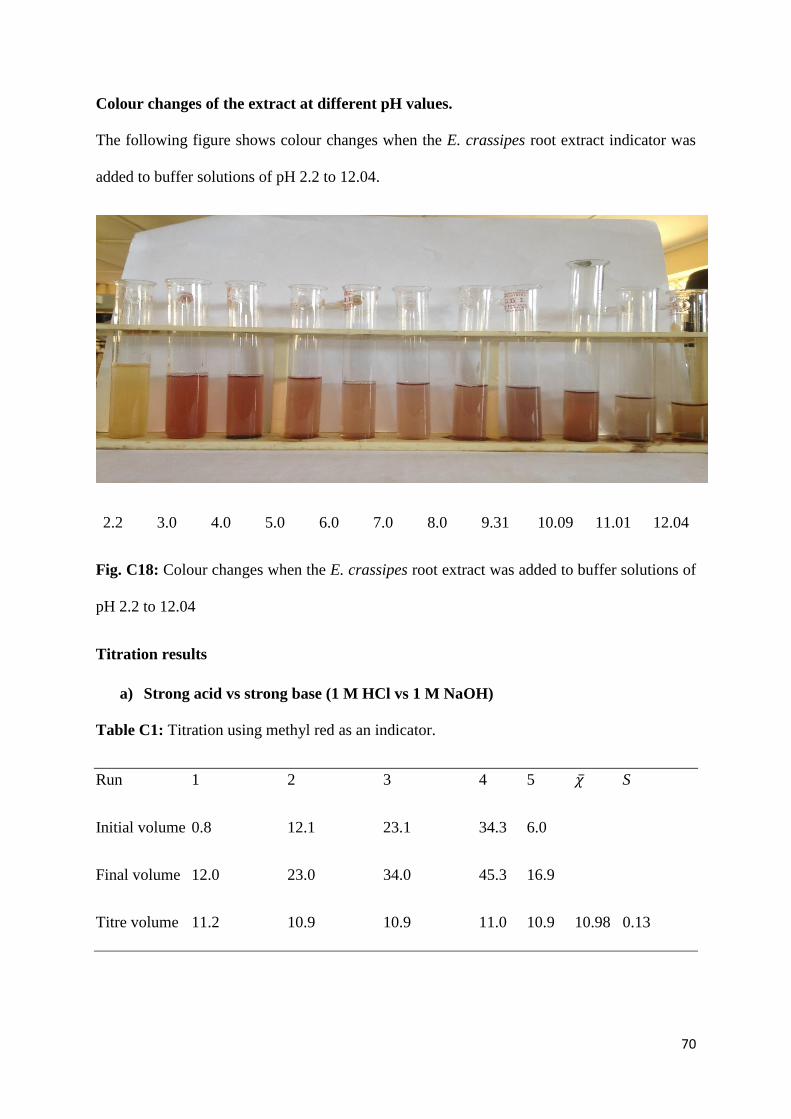
70
Colour changes of the extract at different pH values.
The following figure shows colour changes when the E. crassipes root extract indicator was
added to buffer solutions of pH 2.2 to 12.04.
2.2 3.0 4.0 5.0 6.0 7.0 8.0 9.31 10.09 11.01 12.04
Fig. C18: Colour changes when the E. crassipes root extract was added to buffer solutions of
pH 2.2 to 12.04
Titration results
a) Strong acid vs strong base (1 M HCl vs 1 M NaOH)
Table C1: Titration using methyl red as an indicator.
Run 1 2 3 4 5 �̅� S
Initial volume 0.8 12.1 23.1 34.3 6.0
Final volume 12.0 23.0 34.0 45.3 16.9
Titre volume 11.2 10.9 10.9 11.0 10.9 10.98 0.13
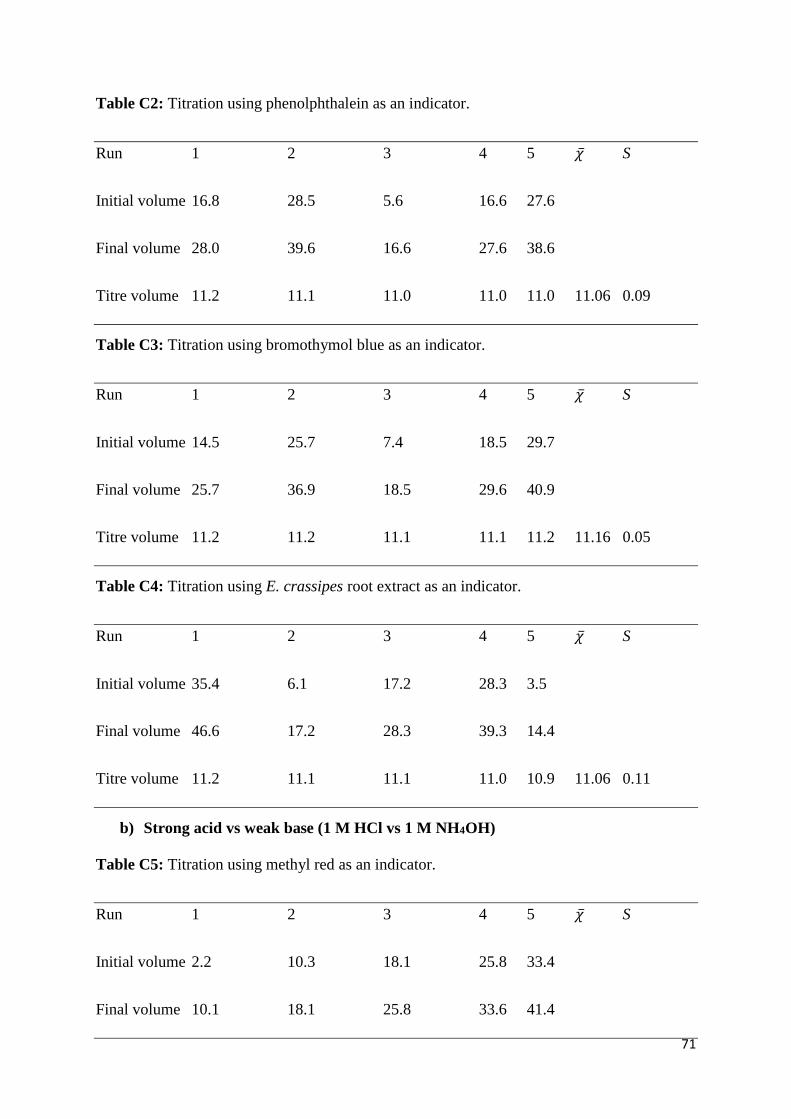
71
Table C2: Titration using phenolphthalein as an indicator.
Run 1 2 3 4 5 �̅� S
Initial volume 16.8 28.5 5.6 16.6 27.6
Final volume 28.0 39.6 16.6 27.6 38.6
Titre volume 11.2 11.1 11.0 11.0 11.0 11.06 0.09
Table C3: Titration using bromothymol blue as an indicator.
Run 1 2 3 4 5 �̅� S
Initial volume 14.5 25.7 7.4 18.5 29.7
Final volume 25.7 36.9 18.5 29.6 40.9
Titre volume 11.2 11.2 11.1 11.1 11.2 11.16 0.05
Table C4: Titration using E. crassipes root extract as an indicator.
Run 1 2 3 4 5 �̅� S
Initial volume 35.4 6.1 17.2 28.3 3.5
Final volume 46.6 17.2 28.3 39.3 14.4
Titre volume 11.2 11.1 11.1 11.0 10.9 11.06 0.11
b) Strong acid vs weak base (1 M HCl vs 1 M NH4OH)
Table C5: Titration using methyl red as an indicator.
Run 1 2 3 4 5 �̅� S
Initial volume 2.2 10.3 18.1 25.8 33.4
Final volume 10.1 18.1 25.8 33.6 41.4
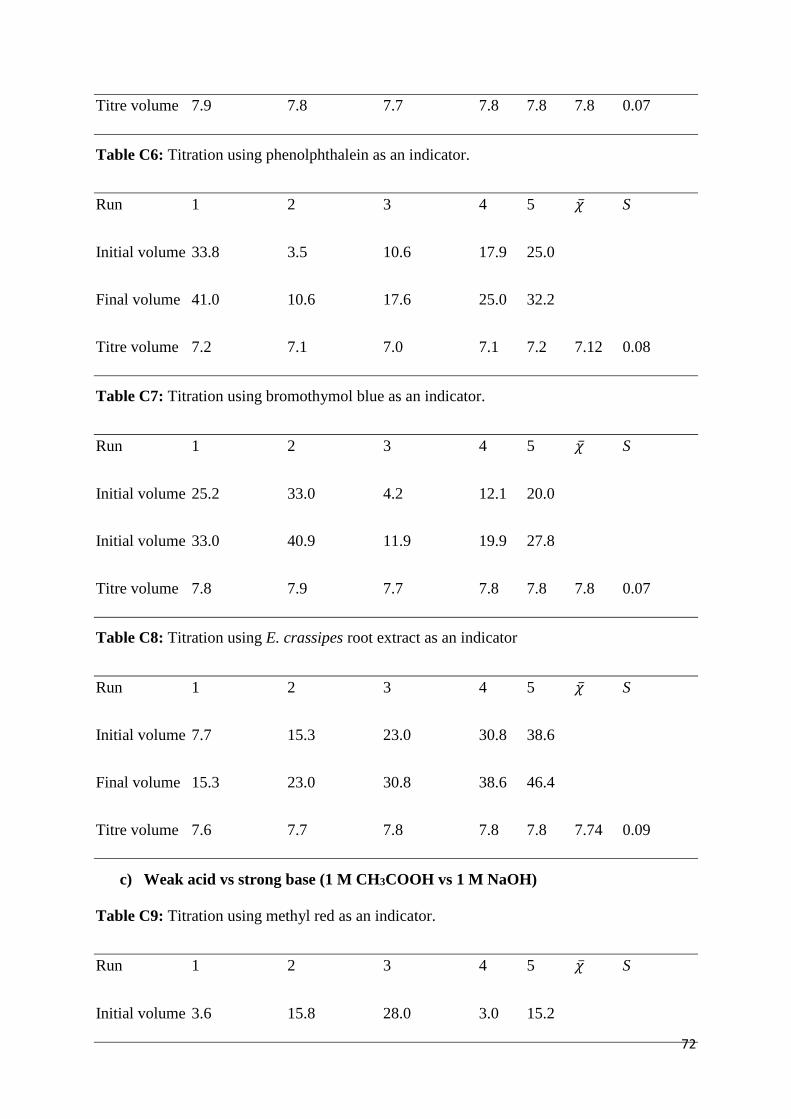
72
Titre volume 7.9 7.8 7.7 7.8 7.8 7.8 0.07
Table C6: Titration using phenolphthalein as an indicator.
Run 1 2 3 4 5 �̅� S
Initial volume 33.8 3.5 10.6 17.9 25.0
Final volume 41.0 10.6 17.6 25.0 32.2
Titre volume 7.2 7.1 7.0 7.1 7.2 7.12 0.08
Table C7: Titration using bromothymol blue as an indicator.
Run 1 2 3 4 5 �̅� S
Initial volume 25.2 33.0 4.2 12.1 20.0
Initial volume 33.0 40.9 11.9 19.9 27.8
Titre volume 7.8 7.9 7.7 7.8 7.8 7.8 0.07
Table C8: Titration using E. crassipes root extract as an indicator
Run 1 2 3 4 5 �̅� S
Initial volume 7.7 15.3 23.0 30.8 38.6
Final volume 15.3 23.0 30.8 38.6 46.4
Titre volume 7.6 7.7 7.8 7.8 7.8 7.74 0.09
c) Weak acid vs strong base (1 M CH3COOH vs 1 M NaOH)
Table C9: Titration using methyl red as an indicator.
Run 1 2 3 4 5 �̅� S
Initial volume 3.6 15.8 28.0 3.0 15.2
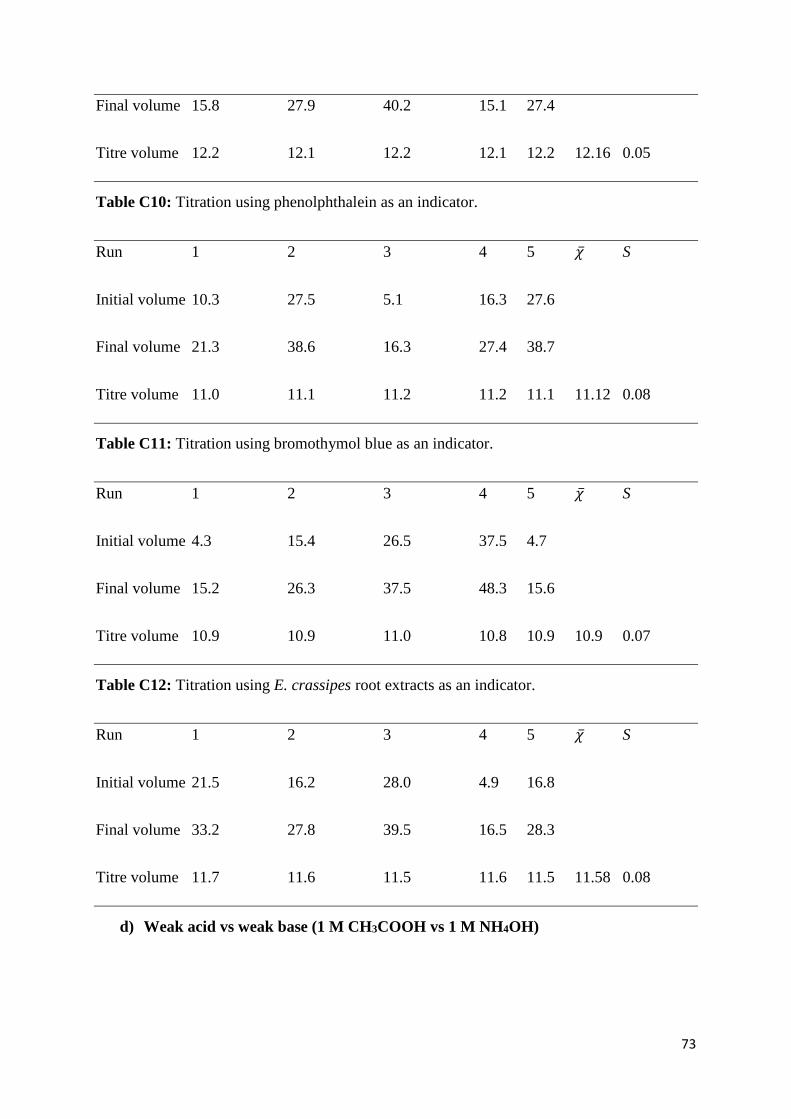
73
Final volume 15.8 27.9 40.2 15.1 27.4
Titre volume 12.2 12.1 12.2 12.1 12.2 12.16 0.05
Table C10: Titration using phenolphthalein as an indicator.
Run 1 2 3 4 5 �̅� S
Initial volume 10.3 27.5 5.1 16.3 27.6
Final volume 21.3 38.6 16.3 27.4 38.7
Titre volume 11.0 11.1 11.2 11.2 11.1 11.12 0.08
Table C11: Titration using bromothymol blue as an indicator.
Run 1 2 3 4 5 �̅� S
Initial volume 4.3 15.4 26.5 37.5 4.7
Final volume 15.2 26.3 37.5 48.3 15.6
Titre volume 10.9 10.9 11.0 10.8 10.9 10.9 0.07
Table C12: Titration using E. crassipes root extracts as an indicator.
Run 1 2 3 4 5 �̅� S
Initial volume 21.5 16.2 28.0 4.9 16.8
Final volume 33.2 27.8 39.5 16.5 28.3
Titre volume 11.7 11.6 11.5 11.6 11.5 11.58 0.08
d) Weak acid vs weak base (1 M CH3COOH vs 1 M NH4OH)
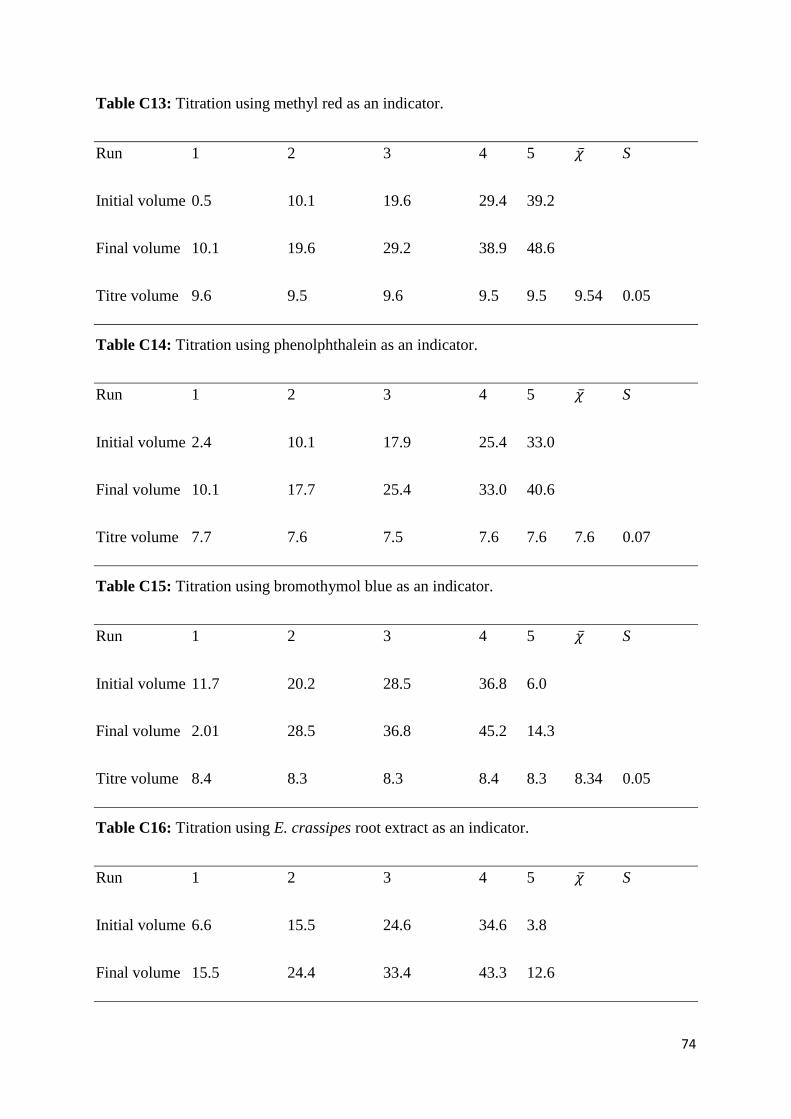
74
Table C13: Titration using methyl red as an indicator.
Run 1 2 3 4 5 �̅� S
Initial volume 0.5 10.1 19.6 29.4 39.2
Final volume 10.1 19.6 29.2 38.9 48.6
Titre volume 9.6 9.5 9.6 9.5 9.5 9.54 0.05
Table C14: Titration using phenolphthalein as an indicator.
Run 1 2 3 4 5 �̅� S
Initial volume 2.4 10.1 17.9 25.4 33.0
Final volume 10.1 17.7 25.4 33.0 40.6
Titre volume 7.7 7.6 7.5 7.6 7.6 7.6 0.07
Table C15: Titration using bromothymol blue as an indicator.
Run 1 2 3 4 5 �̅� S
Initial volume 11.7 20.2 28.5 36.8 6.0
Final volume 2.01 28.5 36.8 45.2 14.3
Titre volume 8.4 8.3 8.3 8.4 8.3 8.34 0.05
Table C16: Titration using E. crassipes root extract as an indicator.
Run 1 2 3 4 5 �̅� S
Initial volume 6.6 15.5 24.6 34.6 3.8
Final volume 15.5 24.4 33.4 43.3 12.6
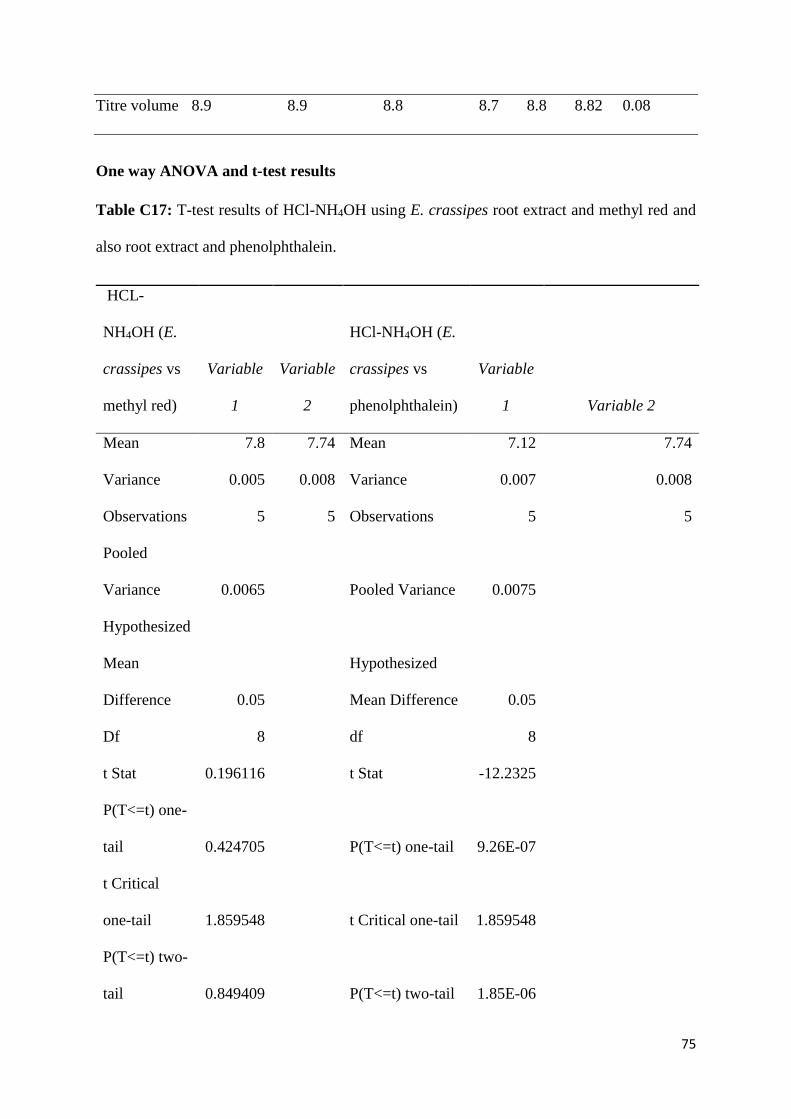
75
Titre volume 8.9 8.9 8.8 8.7 8.8 8.82 0.08
One way ANOVA and t-test results
Table C17: T-test results of HCl-NH4OH using E. crassipes root extract and methyl red and
also root extract and phenolphthalein.
HCL-
NH4OH (E.
crassipes vs
methyl red)
Variable
1
Variable
2
HCl-NH4OH (E.
crassipes vs
phenolphthalein)
Variable
1 Variable 2
Mean 7.8 7.74 Mean 7.12 7.74
Variance 0.005 0.008 Variance 0.007 0.008
Observations 5 5 Observations 5 5
Pooled
Variance 0.0065 Pooled Variance 0.0075
Hypothesized
Mean
Difference 0.05
Hypothesized
Mean Difference 0.05
Df 8 df 8
t Stat 0.196116 t Stat -12.2325
P(T<=t) one-
tail 0.424705 P(T<=t) one-tail 9.26E-07
t Critical
one-tail 1.859548 t Critical one-tail 1.859548
P(T<=t) two-
tail 0.849409 P(T<=t) two-tail 1.85E-06
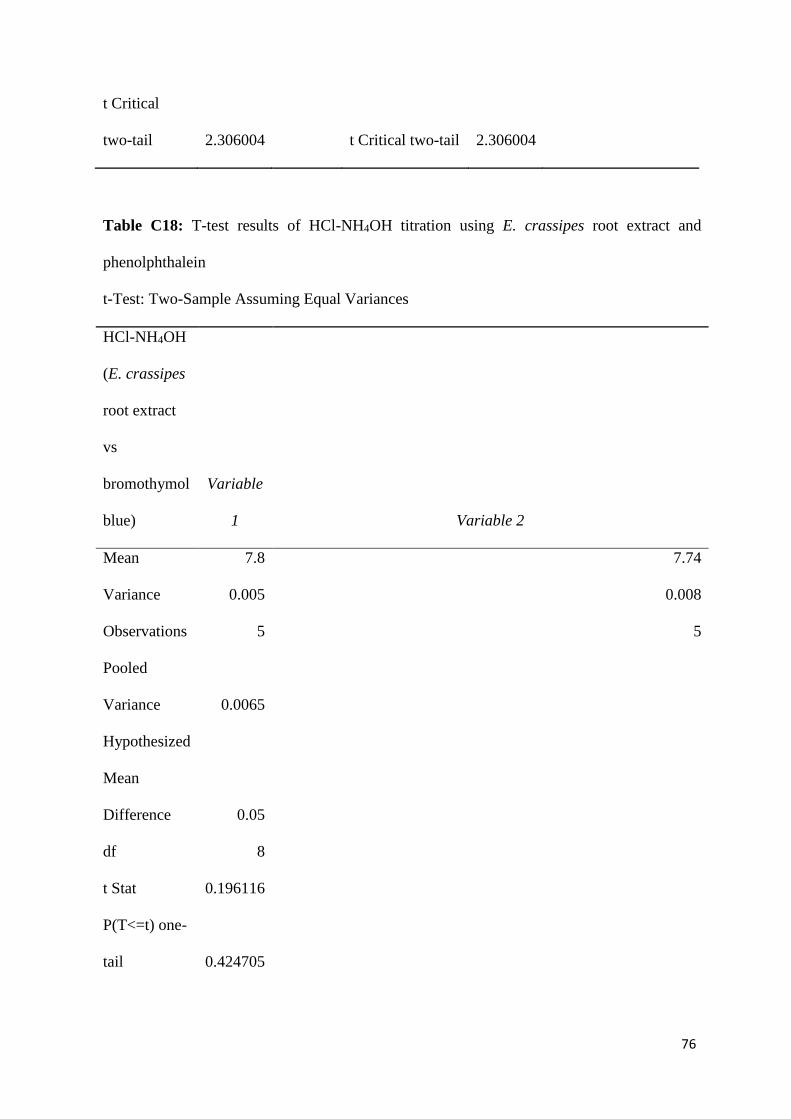
76
t Critical
two-tail 2.306004 t Critical two-tail 2.306004
Table C18: T-test results of HCl-NH4OH titration using E. crassipes root extract and
phenolphthalein
t-Test: Two-Sample Assuming Equal Variances
HCl-NH4OH
(E. crassipes
root extract
vs
bromothymol
blue)
Variable
1 Variable 2
Mean 7.8 7.74
Variance 0.005 0.008
Observations 5 5
Pooled
Variance 0.0065
Hypothesized
Mean
Difference 0.05
df 8
t Stat 0.196116
P(T<=t) one-
tail 0.424705
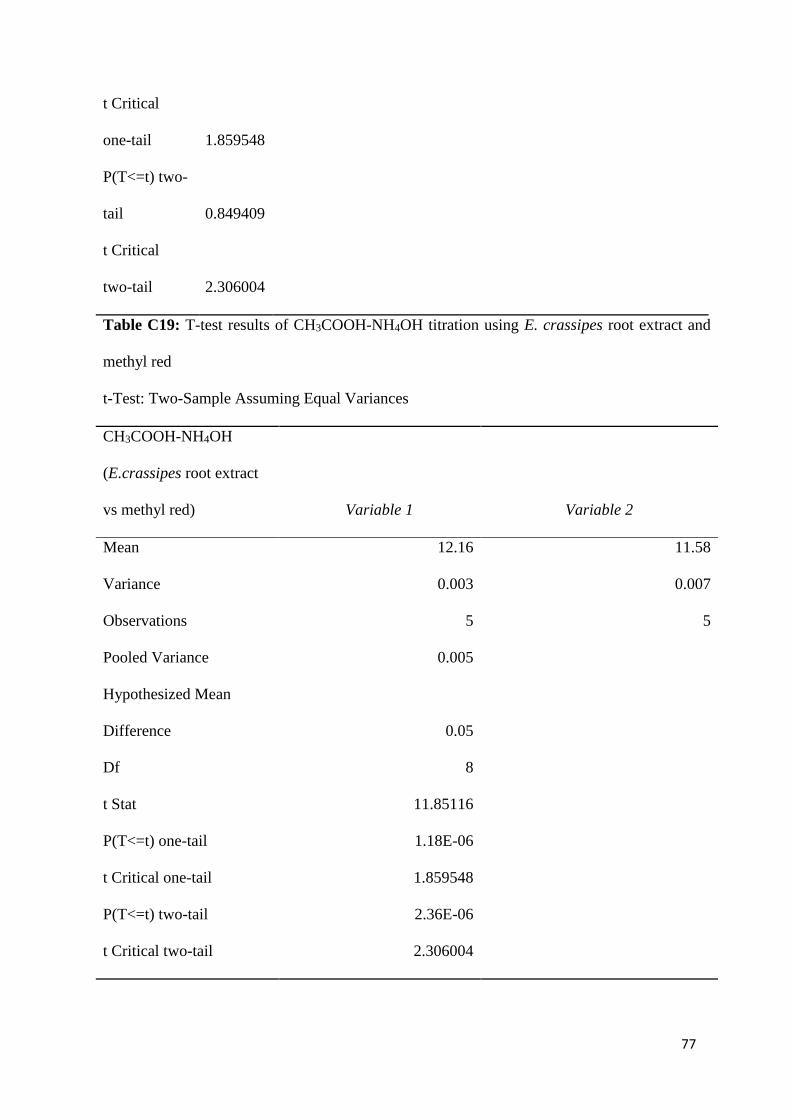
77
t Critical
one-tail 1.859548
P(T<=t) two-
tail 0.849409
t Critical
two-tail 2.306004
Table C19: T-test results of CH3COOH-NH4OH titration using E. crassipes root extract and
methyl red
t-Test: Two-Sample Assuming Equal Variances
CH3COOH-NH4OH
(E.crassipes root extract
vs methyl red) Variable 1 Variable 2
Mean 12.16 11.58
Variance 0.003 0.007
Observations 5 5
Pooled Variance 0.005
Hypothesized Mean
Difference 0.05
Df 8
t Stat 11.85116
P(T<=t) one-tail 1.18E-06
t Critical one-tail 1.859548
P(T<=t) two-tail 2.36E-06
t Critical two-tail 2.306004
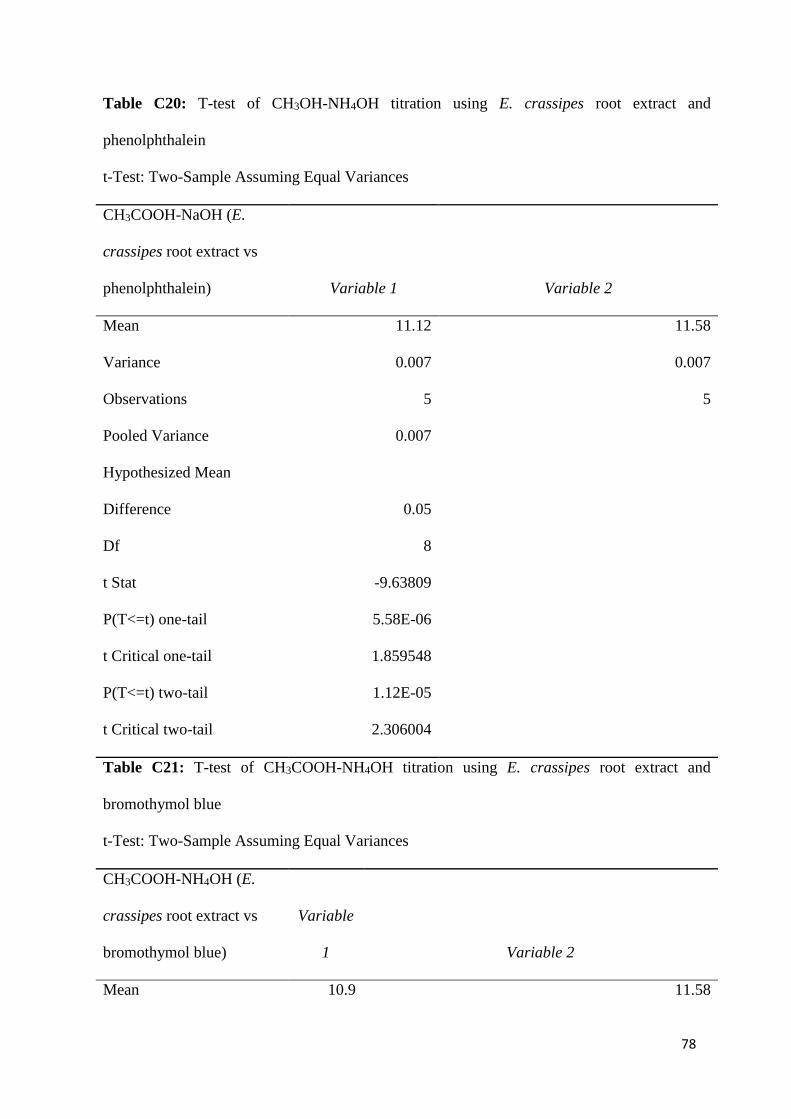
78
Table C20: T-test of CH3OH-NH4OH titration using E. crassipes root extract and
phenolphthalein
t-Test: Two-Sample Assuming Equal Variances
CH3COOH-NaOH (E.
crassipes root extract vs
phenolphthalein) Variable 1 Variable 2
Mean 11.12 11.58
Variance 0.007 0.007
Observations 5 5
Pooled Variance 0.007
Hypothesized Mean
Difference 0.05
Df 8
t Stat -9.63809
P(T<=t) one-tail 5.58E-06
t Critical one-tail 1.859548
P(T<=t) two-tail 1.12E-05
t Critical two-tail 2.306004
Table C21: T-test of CH3COOH-NH4OH titration using E. crassipes root extract and
bromothymol blue
t-Test: Two-Sample Assuming Equal Variances
CH3COOH-NH4OH (E.
crassipes root extract vs
bromothymol blue)
Variable
1 Variable 2
Mean 10.9 11.58
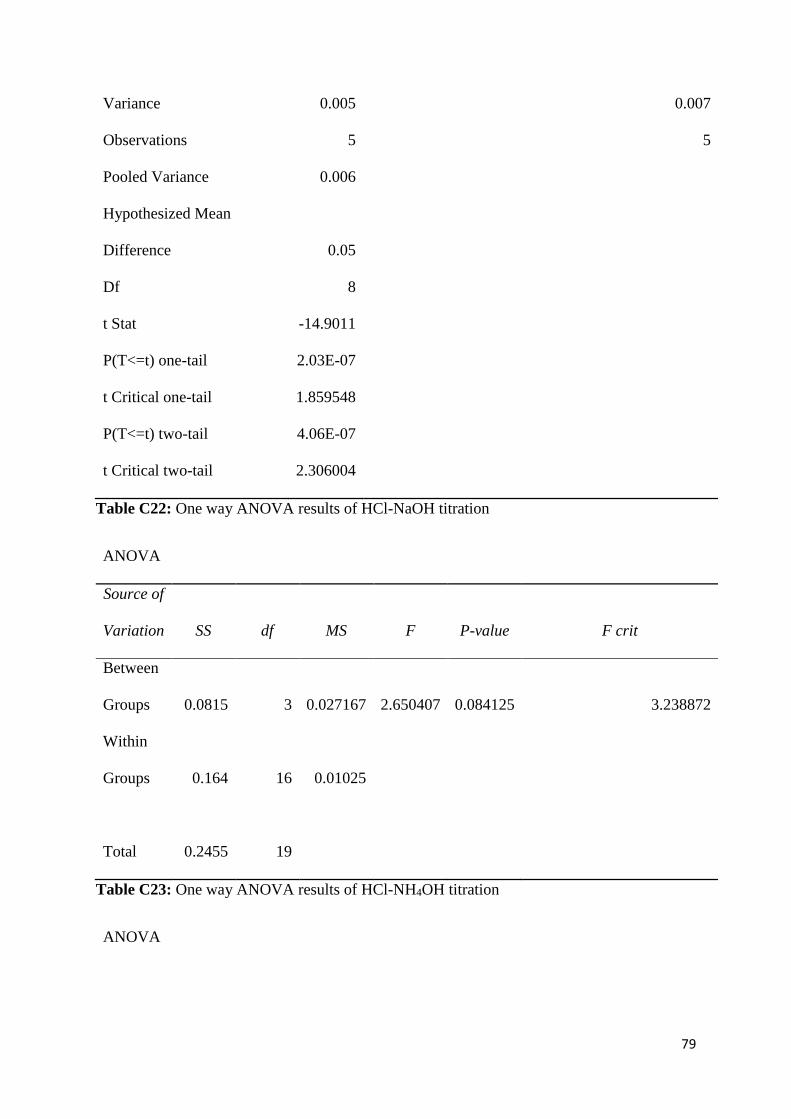
79
Variance 0.005 0.007
Observations 5 5
Pooled Variance 0.006
Hypothesized Mean
Difference 0.05
Df 8
t Stat -14.9011
P(T<=t) one-tail 2.03E-07
t Critical one-tail 1.859548
P(T<=t) two-tail 4.06E-07
t Critical two-tail 2.306004
Table C22: One way ANOVA results of HCl-NaOH titration
ANOVA
Source of
Variation SS df MS F P-value F crit
Between
Groups 0.0815 3 0.027167 2.650407 0.084125 3.238872
Within
Groups 0.164 16 0.01025
Total 0.2455 19
Table C23: One way ANOVA results of HCl-NH4OH titration
ANOVA
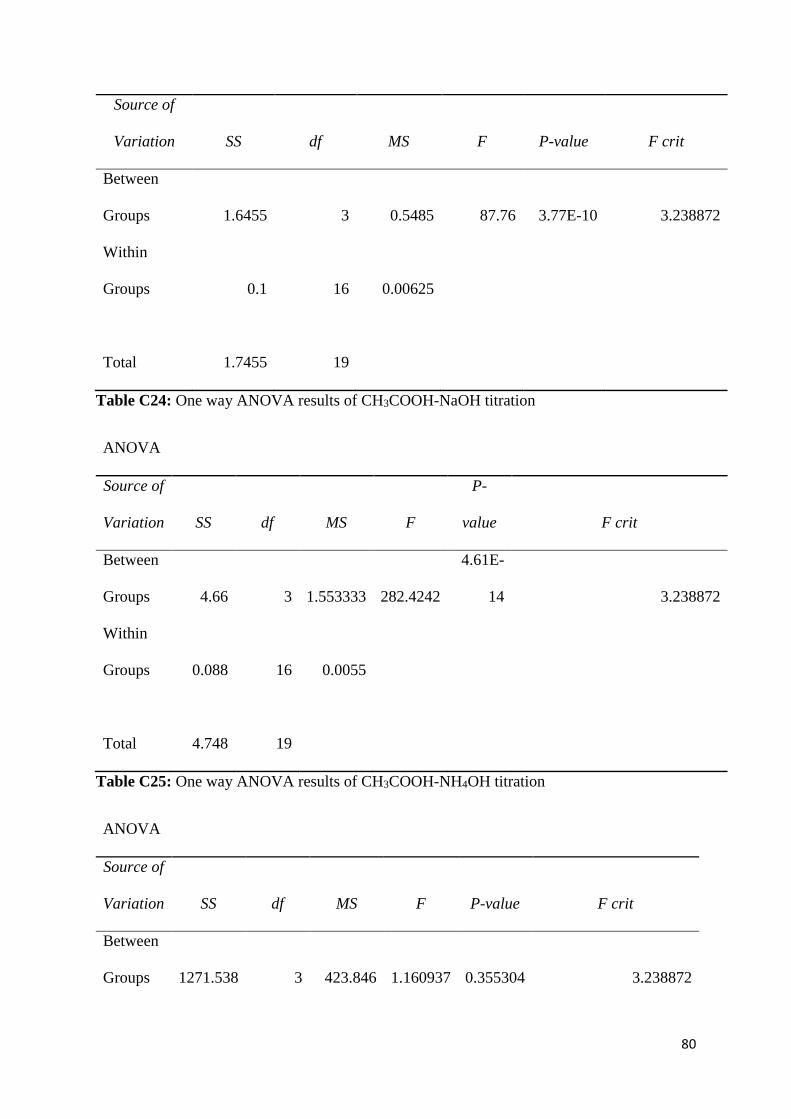
80
Source of
Variation SS df MS F P-value F crit
Between
Groups 1.6455 3 0.5485 87.76 3.77E-10 3.238872
Within
Groups 0.1 16 0.00625
Total 1.7455 19
Table C24: One way ANOVA results of CH3COOH-NaOH titration
ANOVA
Source of
Variation SS df MS F
P-
value F crit
Between
Groups 4.66 3 1.553333 282.4242
4.61E-
14 3.238872
Within
Groups 0.088 16 0.0055
Total 4.748 19
Table C25: One way ANOVA results of CH3COOH-NH4OH titration
ANOVA
Source of
Variation SS df MS F P-value F crit
Between
Groups 1271.538 3 423.846 1.160937 0.355304 3.238872

81
Within
Groups 5841.432 16 365.0895
Total 7112.97 19

82
APPENDIX D
Equations
D1 - Mean
�̅� =√𝜒
𝑛 Where �̅� is the mean value, 𝜒 are the experimental values and n is the number
of measurements.
D2- Standard deviation
𝑆 =√(𝜒−𝜒 ̅)
𝑛−1 Where 𝑆 is the standard deviation, 𝜒 are experimental values, �̅� is the mean and
n is the number of measurements.
D3- t-Test
where �̅� is the population mean, µ is the sample mean, S is the
standard deviation and n is the number of values.
D4-One way ANOVA
𝑆𝑆𝐵 = Σ𝑛(�̅� − 𝑋)̅̅ ̅ 2 where �̅� is the group mean and �̅� is the grand mean
𝑆𝑆𝑊 = Σ(𝓍 − �̅�) 2 where 𝓍 is group values and �̅� is the group mean
𝐹 =𝑆𝑆𝐵
𝑆𝑆𝑊 where SSB is the sum of squares between groups and SSW is the
sum of squares within groups
Related Documents