BABY BOOMERS AND GENERATION X IN AUSTRALIA. HEALTH DIFFERENCES AND THE INFLUENCE OF WORK AND WORKPLACE, WITH A FOCUS ON OBESITY. A Thesis Submitted for Consideration for the Award of DOCTOR OF PHILOSOPHY By Rhiannon Megan Pilkington BPsyc(Hons), G.DipPubHlth School of Medicine, Discipline of Medicine University of Adelaide SEPTEMBER 2014

Welcome message from author
This document is posted to help you gain knowledge. Please leave a comment to let me know what you think about it! Share it to your friends and learn new things together.
Transcript

BABY BOOMERS AND GENERATION X IN AUSTRALIA.
HEALTH DIFFERENCES AND THE INFLUENCE OF WORK AND
WORKPLACE, WITH A FOCUS ON OBESITY.
A Thesis Submitted for Consideration for the Award of
DOCTOR OF PHILOSOPHY
By
Rhiannon Megan Pilkington
BPsyc(Hons), G.DipPubHlth
School of Medicine, Discipline of Medicine
University of Adelaide
SEPTEMBER 2014

ii
Declaration
I certify that this work contains no material which has been accepted for the award of any
other degree or diploma in my name, in any university or other tertiary institution and, to
the best of my knowledge and belief, contains no material previously published or
written by another person, except where due reference has been made in the text. In
addition, I certify that no part of this work will, in the future, be used in a submission in
my name, for any other degree or diploma in any university or other tertiary institution
without the prior approval of the University of Adelaide and where applicable, any
partner institution responsible for the joint-award of this degree.
I give consent to this copy of my thesis when deposited in the University Library, being
made available for loan and photocopying, subject to the provisions of the Copyright Act
1968.
The author acknowledges that copyright of published works contained within this thesis
resides with the copyright holder(s) of those works.
I also give permission for the digital version of my thesis to be made available on the web,
via the University’s digital research repository, the Library Search and also through web
search engines, unless permission has been granted by the University to restrict access
for a period of time.
Rhiannon Pilkington
Date

iii
Acknowledgements
I have been lucky enough to have undertaken my PhD with the supervision and guidance
of Anne Taylor, Gary Wittert and Graeme Hugo. To Anne, thank you for setting my feet
on this path, for your trust, your endless wisdom and for helping me to realise my goals.
To Gary, thank you for all of your invaluable advice, for the time and effort you have
dedicated to helping me improve my work and for encouraging me to set my sights high.
To Graeme, thank you for your feedback, your continuing support and for the
opportunities you have granted and entrusted me with for the NOBLE project.
I would also like to acknowledge and thank the NWAHS and FAMAS participants– without
you the work we do would not be possible.
To my colleagues at Population Research and Outcome Studies, you have been my
second family throughout this process and for all your advice, support and friendship I
will be forever grateful. I would particularly like to acknowledge Eleonora Dal Grande and
Constance Kourbelis for your help and encouragement over the past few years. To the
many other people I have called on more than once who have kindly given their time,
help and advice, I owe you a debt of gratitude. Thank you.
A big thank you to all my family and friends who have provided support in many ways
you are most likely unaware of. Mum and Dad, I will always treasure and be thankful for
how you encourage and support me in all of my choices. Kylie Ellis, a big thank you for
being so generous with the advice and encouragement of one who has already travelled
this road.
Lastly- to Michael, I will always appreciate your never-ending support during this time.
Thanks for being patient when I hadn’t the energy to be and for the countless things you
have done.

iv
Abbreviations
ABS Australian Bureau of Statistics
ANZSCO Australia and New Zealand Standard Classification of Occupations
ARC Australian Research Council
BMI Body Mass Index
CATI Computer Assisted Telephone Interview
CES-D Centre for Epidemiological Studies Depression Scale
CHD Coronary Heart Disease
COAG Council of Australian Governments
CVD Cardiovascular Disease
FAMAS Florey Adelaide Male Ageing Study
GDP Gross Domestic Product
HREC Human Research Ethics Committee
K10 Kessler Psychological Distress Scale
NHS National Health Survey
NILF Not in the labour force
NOBLE The Nutrition Obesity Biomedical Lifestyle and Environment Project
NWAHS North West Adelaide Health Study
OECD Organisation for Economic Co-operation and Development
OR Odds Ratio
SES Socioeconomic Status
WC Waist Circumference
WHO The World Health Organisation
WHR Waist-Hip-Ratio
WWII World War II

v
Table of Contents
Declaration ........................................................................................................................ ii
Acknowledgements .......................................................................................................... iii
Abbreviations .................................................................................................................... iv
Table of Contents .............................................................................................................. v
List of Figures ..................................................................................................................... x
List of Tables ...................................................................................................................... x
Abstract ........................................................................................................................... xiii
SECTION I BACKGROUND & STUDY DESIGN ...................................................................... 1
Chapter 1 INTRODUCTION ................................................................................................ 2
1.0 Introduction............................................................................................................. 3
Chapter 2 AUSTRALIA’S BABY BOOMERS AND GENERATION X .......................................... 5
2.0 Australia’s Baby Boomers and Generation X .......................................................... 6
2.1 A Generational perspective ..................................................................................... 6
2.2 The History of Generations ..................................................................................... 7
2.2.1 A Demographic context ....................................................................................... 7
2.2.2 A Social and Political view ................................................................................... 9
2.3 Socio-demographic characteristics ....................................................................... 12
2.4 Health of the Generations ..................................................................................... 15

vi
Chapter 3 OBESITY .......................................................................................................... 19
3.0 What is Obesity? ................................................................................................... 20
3.1 Measuring Obesity ................................................................................................ 20
3.1.1 Body Mass Index ................................................................................................ 20
3.1.2 Waist Circumference and Waist-Hip-Ratio........................................................ 21
3.2 Obesity and mortality ............................................................................................ 23
3.3 What causes obesity? ............................................................................................ 25
3.3.1 Energy intake ..................................................................................................... 26
3.3.2 Energy expenditure ........................................................................................... 27
3.3.3 Genetics ............................................................................................................. 28
3.3.4 An evolutionary perspective.............................................................................. 28
3.3.5 Additional explanations ..................................................................................... 29
3.4 Prevalence and costs ............................................................................................. 30
Chapter 4 WORK AND THE WORKPLACE ......................................................................... 35
4.0 Work and the Workplace ...................................................................................... 36
4.1 An environment for intervention .......................................................................... 36
4.2 Work related stress ............................................................................................... 38
4.3 Absenteeism and Presenteeism ............................................................................ 42
Chapter 5 STUDY DESIGN AND OBJECTIVES ..................................................................... 45
5.0 Study Design and Objectives ................................................................................. 46

vii
5.1 The National Health Survey ................................................................................... 47
5.2 The Nutrition Obesity Biomedical Lifestyle and Environment Project ................. 49
5.3 The North West Adelaide Health Study (NWAHS) ................................................ 52
5.4 The Florey Adelaide Male Ageing Study (FAMAS) ................................................ 53
5.5 Research Objectives .............................................................................................. 55
SECTION II RESEARCH RESULTS ...................................................................................... 56
Chapter 6 ARE BABY BOOMERS HEALTHIER THAN GENERATION X? ................................. 57
6.0 Statement of Authorship ....................................................................................... 58
6.1 Chapter 6 Contextual Statement .......................................................................... 60
6.2 Abstract ................................................................................................................. 62
6.3 Introduction........................................................................................................... 64
6.4 Methods ................................................................................................................ 65
6.5 Results ................................................................................................................... 70
6.6 Discussion .............................................................................................................. 72
6.7 Conclusion ............................................................................................................. 76
Chapter 7 JOB STRAIN, OCCUPATION, PSYCHOLOGICAL DISTRESS AND RISK OF HIGH
WAIST CIRCUMFERENCE ................................................................................................. 79
7.0 Statement of Authorship ....................................................................................... 80
7.1 Chapter 7 Contextual Statement .......................................................................... 82
7.2 Abstract ................................................................................................................. 84

viii
7.3 Introduction........................................................................................................... 86
7.4 Methodology ......................................................................................................... 87
7.5 Results ................................................................................................................... 92
7.6 Discussion .............................................................................................................. 95
7.7 Conclusion ............................................................................................................. 99
Chapter 8 EMPLOYMENT TRANSITIONS AND CHRONIC CONDITIONS IN BABY BOOMERS
AND GENERATION X ..................................................................................................... 107
8.0 Statement of Authorship ..................................................................................... 108
8.1 Chapter 8 Contextual Statement ........................................................................ 110
8.2 Abstract ............................................................................................................... 112
8.3 Introduction......................................................................................................... 114
8.4 Methods .............................................................................................................. 115
8.5 Results ................................................................................................................. 119
8.6 Discussion ............................................................................................................ 122
8.7 Conclusion ........................................................................................................... 127
SECTION III DISCUSSION ............................................................................................... 133
Chapter 9 DISCUSSION, FUTURE DIRECTIONS AND CONCLUSIONS ................................. 134
9.0 Discussion ............................................................................................................ 135
9.1 Healthy ageing? ................................................................................................... 135
9.2 Widening the ‘gap’ - Obesity related social inequalities .................................... 138

ix
9.3 Workforce participation and supply ................................................................... 141
9.4 Limitations ........................................................................................................... 146
9.5 Future directions ................................................................................................. 147
9.6 Conclusion ........................................................................................................... 149

x
List of Figures
Figure 2.1: Total Fertility Rate in Australia 1921-2000……………………………………………………. 8
Figure 3.1 Prevalence of obesity in Australia for 25 to 64 years olds, using measured
height and weight, obesity defined as BMI≥30……………………………………………………………. 31
Figure 5.1 Framework exploring the inter-relationships between work and health related
factors…………………………………………………………………………………………………………………………..46
Figure 7.1 A flow chart of the NWAHS and FAMAS cohort studies illustrating the
composition of the NOBLE study and analysis sample………………………………………………...106
List of Tables
Table 2.1: Selected socio-demographic characteristics of Generation X, Baby Boomers and
the total Australian population using 2006 Census data from the Australian Bureau of
Statistics…………………………………………….……………………………………………………………………….. 14
Table 3.1: BMI Classification for Europid adults 18 years and over……………………………....20
Table 3.2: WC classifications………………………………………………………………………………….………21
Table 5.1: Breakdown of response rates by study for the NOBLE II project……………………51
Table 6.1: A health profile of Generation X (aged 25-44 years) and Baby Boomers (aged
25-44 years) at the same age using 2007/08 NHS data and 1989/90 NHS data from the
Australian Bureau of Statistics………………………………………………………………………………………77
Table 6.2: Logistic regression analysis of the association between overweight and obesity
(BMI≥25.00) and generation membership of Generation X (aged 25-44 years 2007/08

xi
NHS data) and Baby Boomers (aged 25-44 years 1989/90 NHS data) using data from the
Australian Bureau of Statistics …………………………………………………………………………….………..78
Table 6.3: Logistic regression analysis of the association between diabetes and generation
membership of Generation X (aged 25-44 years 2007/08 NHS data) and Baby Boomers
(aged 25-44 years 1989/90 NHS data) using data from the Australian Bureau of Statistics
………………………………………………………………………………………………………………………………..…....78
Table 7.1: Characteristics of participants, by generation ……………………………………...….… 101
Table 7.2: Associations between generation membership, work related characteristics,
psychological distress and a high waist circumference: logistic regression analysis…..…103
Table 7.3: Associations between Job strain, occupation, psychological distress and a high
waist circumference: logistic regression analysis of GENERATION X workers….………..….104
Table 7.4: Associations between Job strain, occupation and a high waist circumference:
logistic regression analysis of BABY BOOMER workers…………………………………………..…….105
Table 8.1: Characteristics of participants by generation group ……………………………..….…128
Table 8.2: Multivariable associations of sex, generation and employment transition with
unadjusted and adjusted analysis of the prevalence of diabetes and depression at T3..130
Table 8.3: Multivariable associations of sex, generation and employment transition with
unadjusted and adjusted analysis of the prevalence of arthritis at T3…………………….……131
Table 8.4: Multivariable associations of sex, generation and employment transition with
unadjusted and adjusted analysis of the prevalence of obesity and obesity excluding cases
with comorbid diabetes, depression or arthritis at T3………………………………….………………132

xii

xiii
Abstract
The increase in obesity prevalence seen in Australia since the 1970s and the rise in
comorbid chronic conditions –particularly diabetes, pose a significant problem for society
and government in terms of consequences for government spending on health,
workforce participation, economic growth and quality of life.
Baby Boomers, born from 1946 to 1965 and Generation Xers born from 1966 to 1980
together form over half of Australia’s total population and nearly 75% of the working
population. Their continued health into older age is essential if the nation is to cope with
the quadrupling of the 85 plus population by 20501.
This research explores generational differences in health status and the influence of work
and workplace on health, irrespective of age. The aim of this is to highlight risk factors for
the development of obesity and comorbid conditions, as well as specific groups that can
be targeted by programs and policies to improve the health of Australia’s population.
Using National Australian data, in Chapter 6 we explore the sociodemographic and health
profile of Baby Boomers in 1989/90 and Generation X in 2007/08, in order to determine
differences when the generations were of the same age of 25 to 44 years. This study
illustrates that while Generation X are higher educated and have lower levels of smoking,
they are also developing obesity and a higher prevalence of diabetes at an earlier age
than their predecessors, and this may be reflected in their self-reported health status.

xiv
Chapter 7 explores generational differences in the association between job strain,
occupation, psychological distress and the risk of overweight and obesity as defined by
high waist circumference. Using data from two community based Adelaide cohort studies,
this study provides evidence that for Generation Xers, work-related stress, occupation
and psychological distress have significant relationships with unhealthy weight. The
reasons for these generational differences require further exploration although it may
reflect differing values, perceptions or lifecourse effects.
Chapter 8 examines the relationship between changes in employment status over time
and the prevalence of Type 2 diabetes, depression, arthritis and obesity (BMI ≥ 30) with
and without comorbidities at follow up. Generation X is compared to early (born 1946 to
1955) and late (born 1966 to 1980) Baby Boomers using data from a biomedical cohort
study based in the North West suburbs of Adelaide, South Australia. Remaining
unemployed and becoming unemployed is associated with the presence of chronic
conditions. No generational differences were demonstrated in adjusted analyses.
These studies have identified that the younger generation is developing obesity and
diabetes earlier in the lifecourse, highlighted generational differences in the relationship
between work related factors and obesity and demonstrated that workforce exit and
unemployment is related to the presence of obesity and common comorbidities. These
findings have significant implications for healthy ageing, workforce participation,
healthcare utilisation and costs into the future.

xv

1
SECTION I
BACKGROUND & STUDY DESIGN

2
Chapter 1 INTRODUCTION

3
1.0 Introduction
Arguably one of the biggest challenges facing governments in Australia at this time is
the ageing population and as a consequence, the higher rates of chronic disease and
greater burden on the health system1. In 2012, the Baby Boomer cohort born from
1946 to 1965, made up 25.7% of the population and Generation X born from 1966 to
1980 formed 23.7% of the population2. Together, these generations form the
working population of Australia1 and their continued health into older age is
essential if the nation is to cope with the doubling of the over 65 population by
20361, 3 and the quadrupling of the 85 plus population by 20501.
The pressures from the ageing population are not limited to increasing the burden on
the health system. A projected reduction in working age Australians will slow
economic growth1 and affect the tax base needed to support the transformation of
the aged care system necessary to accommodate the ageing Baby Boomer
generation4. The contribution of chronic disease prevalence to these issues is
becoming all too evident. Prevalence of obesity has nearly doubled since the 1980s5
and as of 2012, 63.4% of the Australian population is overweight or obese6. The most
common comorbidities of obesity include cardiovascular disease (CVD), which is the
leading cause of death in Australia5 and diabetes, predicted to become the leading
cause of disease burden as well as the most costly by 20237. Together, these chronic
conditions severely impact on quality of life, workforce participation and overall, the
ability to age healthily. The projected costs associated with the growing prevalence

4
of these chronic conditions and the consequences for workforce participation and
workforce replacement as the Baby Boomers move into retirement are unsustainable.
These challenges have led to the present research that aims to explore the
differences in health status and the influence of work and workplace on health in
Baby Boomers and Generation X, as Australia’s working generations. Following this,
Chapters 2 to 4 discuss the background literature relevant to the current work and
Chapter 5 reports on the overall study design and research questions. In Section II of
this thesis these research questions are addressed. The initial study (Chapter 6) seeks
to answer the question ‘Are Baby Boomers healthier than Generation X, irrespective
of age?’ The second study (Chapter 7) focusses on Job Strain and occupation to
explore if the work and workplace, affects the health of the generations differently.
The final study (Chapter 8) examines employment status over time and chronic
conditions, to explore the relationship between economic inactivity and ill health in
Baby Boomers and Generation X. The findings will highlight generational differences
and factors that should be targeted in policy and program initiatives designed to
reduce the burden of chronic disease, particularly obesity, on Australia’s population.
5
Chapter 2 AUSTRALIA’S BABY BOOMERS AND
GENERATION X
6
2.0 Australia’s Baby Boomers and Generation X
2.1 A Generational perspective
Whilst some authors8 have argued that the correct term to describe groups such as
the Baby Boomers should be ‘cohort’, given that ‘generation’ is a term also used to
allude to kinship relationships, this dissertation will adopt the term generation in the
manner defined by Karl Mannheim in 1928: a particular age group that have shared
common experiences within a given period9.
An important question to be addressed before leaping into discussion presumptive of
differing social identities, values and personal orientations is, what is it that makes a
generation a generation, and why is this significant?
The late 1920s saw sociologist Karl Mannheim introduce the concept of ‘generation’9.
Mannheim defined a generation as a group of similar age that shared common
experiences in their formative years10. The generation is imprinted with the primary
social and political events that occurred during their youth and this shapes behaviours,
perceptions, values, orientations and thoughts over the life course. These early life
experiences form an individual’s core view of the world and all subsequent
experiences derive their meaning from this core9-13. Throughout their discussion of the
‘theory of generations’ Eyerman and Turner examine the model of ‘generations’ as a
tool by which social stratification can be studied. They propose that Bourdieu’s
sociology of culture and theories of habitus and hexis provide a premise that accounts

7
for the collective dispositions and practices seen in a generation, and suggested
generations are socially constructed by the conflict over limited resources within a
given sphere9. A generation is defined as
“a cohort of persons passing through time who come to share a
common habitus, hexis and culture, a function of which is to provide
them with a collective memory that serves to integrate the cohort over
a finite period of time” p939.
2.2 The History of Generations
2.2.1 A Demographic context
In Australia as elsewhere, there is little agreement regarding the definitive years of
generations, other than that of the Baby Boomers14. The Baby Boomer generation,
born from 1946 to 1965 were granted their moniker due to the post WWII rise in
fertility rates or, aptly, the ‘Baby Boom’15. During those years Australia saw a peak in
population growth due to an increase in both births and migration15.
The Australian population grew on average by 2.2% or 211,200 people per year
between 1946 and 1965 compared to population growth of only 0.9% in the decades
preceding the war16. The total fertility rate peaked at 3.5 in 196117 or in other words
women during that period would on average, give birth to 3.5 babies in their lifetime if
they conformed to the fertility rate of that year. The high rates of marriage and
fertility were a natural follow-up to the disruption of relationships and child-bearing

8
experienced during the War18, 19. Figure 2.1 demonstrates the Total Fertility Rate in
Australia from 1921 to the year 2000 with the Baby Boom highlighted.
Source: Australian social trends ABS 2002 Page 12
Figure 2.1: Total Fertility Rate in Australia 1921-200020
This increase in migration was the result of Australia’s immigration policy following
WWII, based on the belief that the population was not large enough to ensure
national security or economic growth17. This was commonly known as the ‘populate or
perish’ policy. Record levels of net migration were reached in 1949 and 195015.
The majority of migrants arrived from war-torn Europe as the White Australia Policy
was still in place restricting the entrance of non-English speaking immigrants, while
encouraging immigration from the United Kingdom and Ireland16, 21. However,
following the war this policy was relaxed to allow the entry of other Europeans22. This
resulted in increasing cultural diversity with immigrants born in Italy, Greece,
Yugoslavia, Malta and Germany making up 34% of immigrants into Australia from 1961

9
to 196522. The proportion of births in which one or both parents were born overseas
increased from 14% in 1947 to 31% in 196517.
The initial split between the Baby Boomers and Generation X has been defined by the
Australian Bureau of Statistics (ABS) by taking into account fertility rates and
significant social and political events that have resulted in shared experiences19. The
most significant change in birth rates can be seen in 1965 when fertility rates dropped
again dropped below 3.0 for the first time since the beginning of the Baby Boom (see
Figure 2.1). Due to this drop in fertility rates Generation X was also briefly referred to
as the “Baby Bust” although an ‘echo’ of the fertility boom can be seen from 1970 to
1973, in which fertility rates rose to just under 3 before quickly declining once more17.
Although this ‘echo’ resulted in the highest number of births in one year (276,400),
this discrete rise pales in comparison to the previous Baby Boom. Both of these
increases in fertility coincided with periods of strong economic growth and it is
thought the continued prosperity seen throughout the 1950s was a significant cause of
the continued high fertility rate16. By 1975 the youngest Generation Xers were being
born when fertility rates had dropped below replacement level.
2.2.2 A Social and Political view
As Pilcher11 notes, any investigation involving social generations needs to recognise
and consider the social and historical factors that helped create the historical
consciousness the generation carries with it8. In view of this, a discussion of these
factors in relation to Baby Boomers and Generation X, follows.

10
The formative conditions that are said to have shaped the older generation arose
largely out of the affluence of the post war boom12. This broadly included a rise in
living standards involving improved nutrition, health, education, public health
measures to develop sanitation and medical technology advances. Women in Australia
experienced some of the most significant changes. During the mid 1960s effective
contraception and access to abortion were introduced, women were allowed to
continue working in the public sector once married and in 1969, women were granted
‘equal pay for equal work’15, 23. These significant social changes are said to account for
the decrease in fertility rate as this led to higher employment rates for women, in
some instances delayed child-bearing and the changing pattern of the family structure.
Mothers began to balance family and work24 and the double income family was
created15. The Family Law Act was passed in 1975 and this led divorce rates to rise
significantly up until 1979. Economically, early Baby Boomers experienced high rates
of employment while late Baby Boomers experienced lower employment due to the
economic downturn of the late 80s and early 90s19.
The majority of the literature on Generation X examines work-related characteristics
and can be found in what could be termed ‘pop’ literature and as mentioned
previously, there is little agreement on this generational definition. However, for this
study we have defined Generation X as being born during the years 1966 to 1980
based on the previous discussion of birth rates as well as the shared social and political
policies and events of their youth.

11
Generation X grew up with higher rates of divorce and separation following the
introduction of the Family Law Act in 197519. Subsequently, the family structure for
Generation X was vastly different to that of the Baby Boomers19. Despite being the
first generation forced to pay for higher education, they are still more educated than
their predecessors, although the high unemployment during the early 1990s reflects
the reduced work opportunities available when many were entering the workforce19.
The workforce landscape also altered. Having observed their parents loyalty and
dedication to organisations resulting in significant lay-offs during harsher economic
times, Generation X is said to have developed a ‘work to live’ as opposed to a ‘live to
work’ attitude25, 26. It has also been suggested that they view employment as
necessary but precarious and expect to have multiple occupations in their working
life27. Broad themes from workforce and management studies suggest that
Generation X are more individualistic than Baby Boomers, valuing flexibility and
independence while displaying more loyalty to individuals rather than organisations26,
28.
In relation to this particular study, generational membership provides a unique way to
predict and explain health status, health behaviours and health beliefs. Additionally,
although broad generational themes can be identified, within a single generation it is
possible there are multiple ‘generational units’ as a result of different experiences and
responses to the same historical event11 and diversity is likely to exist within, as well as
between generations.
12
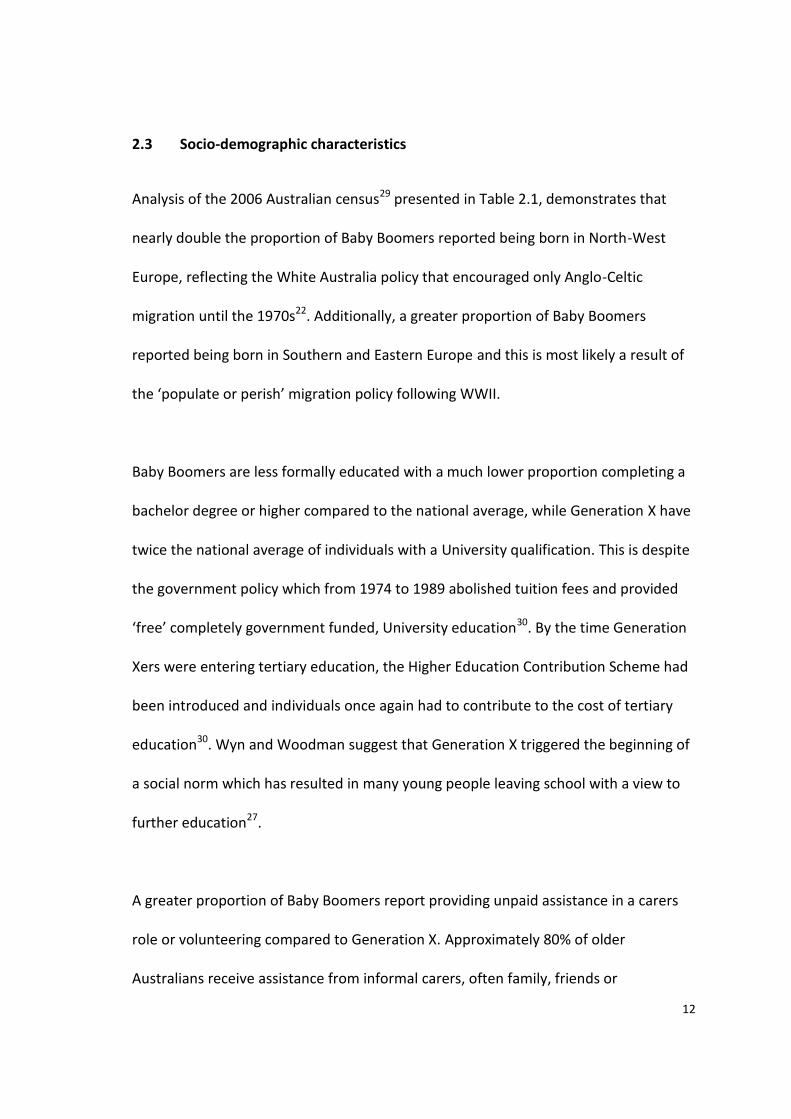
2.3 Socio-demographic characteristics
Analysis of the 2006 Australian census29 presented in Table 2.1, demonstrates that
nearly double the proportion of Baby Boomers reported being born in North-West
Europe, reflecting the White Australia policy that encouraged only Anglo-Celtic
migration until the 1970s22. Additionally, a greater proportion of Baby Boomers
reported being born in Southern and Eastern Europe and this is most likely a result of
the ‘populate or perish’ migration policy following WWII.
Baby Boomers are less formally educated with a much lower proportion completing a
bachelor degree or higher compared to the national average, while Generation X have
twice the national average of individuals with a University qualification. This is despite
the government policy which from 1974 to 1989 abolished tuition fees and provided
‘free’ completely government funded, University education30. By the time Generation
Xers were entering tertiary education, the Higher Education Contribution Scheme had
been introduced and individuals once again had to contribute to the cost of tertiary
education30. Wyn and Woodman suggest that Generation X triggered the beginning of
a social norm which has resulted in many young people leaving school with a view to
further education27.
A greater proportion of Baby Boomers report providing unpaid assistance in a carers
role or volunteering compared to Generation X. Approximately 80% of older
Australians receive assistance from informal carers, often family, friends or

13
neighbours4. In 2006 Baby Boomers were aged 41 to 60 and that nearly 15% of them
are reporting taking on a caring role is concerning given the negative effect unpaid
care has on participation in paid employment31, and the projected increase in caring
needs due to the ageing population3.
Examining the socioeconomic characteristics, it is apparent that there is a higher
proportion of Baby Boomers who are managers and a lower proportion who are
professionals or technicians and trades workers, compared to the younger generation.
The differences in employment levels are fairly minor, although a higher proportion of
Generation Xers reported looking for work compared to Baby Boomers who had a
higher proportion classified as ‘not in the labour force’. Related to employment level,
distribution across income categories is largely even, other than a higher proportion of
Baby Boomers earning $1-$399 weekly and a lower proportion of earning $1000-
$1599 compared to the younger generation.
These socio-demographic differences highlight the greater ethnic diversity of Baby
Boomers, the differences in formal education and in life stage, particularly in regards
to caring responsibilities and participation in the labour force.

14
Table 2.1: Selected socio-demographic characteristics of Generation X, Baby Boomers and the total Australian population using 2006 Census data from the Australian Bureau of Statistics
% Generation X (n= 4,163,834)
% Baby Boomers (n=5,397,474)
% Aus Population (n=19,855,287)
Sex
Male 49.1 49.4 49.3
Female 50.9 50.6 50.6
Country of Birth (selected)
North-West Europe 5.3 10.3 6.8
Southern and Eastern Europe 1.8 4.9 3.3
Oceania and Antarctica 72.8 66.3 73.4
Highest non-school qualification
Certificate / Diploma 28.8 7.5 19.1
Bachelor degree or higher 24.4 4.8 12.5
Marital status
Married (registered) 46.9 61.2 36.0
Married (de facto) 14.0 6.7 6.3
Not married 29.2 23.2 29.1
Carer status
Provide unpaid assistance 8.4 14.2 8.1
Volunteer status
Volunteer for organisation/group 16.3 21.2 14.4
Occupation
Managers 9.6 11.4 6.1
Professionals 17.3 14.9 9.1
Technicians & Trades workers 11.1 9.1 6.6
Community & personal services 6.0 5.7 4.0
Clerical & administrative 11.2 11.4 6.9
Sales 5.4 4.9 4.5
Machinery operators & drivers 4.8 5.4 3.0
Labourers 6.4 7.1 4.8
Employment
Employed full time 50.6 47.8 29.3
Employed part time 17.8 19.2 13.5
Employed away from work 4.7 4.2 3.0
Unemployed looking for work 3.6 0.8 2.5
Not in the labour force 17.2 20.7 26.5
Individual income (weekly)
Negative income 0.4 0.5 0.4
$0 4.3 4.7 5.3
$1-$399 21.8 24.6 27.1
$400-$999 39.0 36.6 25.8
$1000-$1599 18.3 16.9 9.6
$1600+ 8.1 9.4 4.8
Not stated 8.1 7.2 7.1

15
2.4 Health of the Generations
Baby Boomers are the first generation to grow up with advantages unseen in previous
generations, such as modern medicine and increased access to education and health
services, resulting in a significant increase in the standard of living32. Despite this,
there are differing views as to whether they will progress to old age in a better or
worse state than previous generations33-35. Research from the United States has
presented conflicting results. A study by Weir found Baby Boomers have worse self-
reported health than pre-Baby Boomers but objective measures showed their health
to be the same36. In contrast to this, a report by the Institute of Medicine concluded
disability rates are likely to increase as the Baby Boomers enter later life and the
demographic distribution of America gets older37. Further, Martin et al. concluded that
although mortality has dropped considerably, the rate of CVD, obesity, diabetes and
lung disease had increased, suggesting the public health advances have not caused an
increase in later life health, as could be expected33. Perhaps the most dire prediction
coming out of the US, is of a decline in life expectancy due to the rise in obesity
prevalence at a younger age38, the complications that arise as a consequence and its
life-shortening effects38-41. This is one of the most pressing health problems in the US
and due to the higher prevalence of obesity in younger groups, serious consequences
are expected in terms of morbidity and mortality42, 43. In the United Kingdom, Rice et
al. reported a higher proportion of Baby Boomers had an illness or disability, multiple
chronic conditions, diagnosed diabetes, diagnosed hypertension and a higher Body
Mass Index (BMI) compared to the wartime cohort. They concluded that in spite of
experiencing a higher quality of life compared to the former war-time generation,

16
Baby Boomers are ageing with overall worse health than expected and there are
significant health issues to be addressed32. On a more positive note, research from the
English Longitudinal Study of Ageing suggests retirement is an optimal time for
interventions targeting risky health behaviours44. Specifically, it was found individuals
were more likely to quit smoking whilst transitioning into retirement than before or
after this time point44. This raises the possibility of dedicating interventions to a
specific time point to increase success rates45. McMurdo argues ageing does not
necessarily mean dependency or ill health46 although the growing health problems
associated with obesity and the associated cost would suggest otherwise47.
In Australia the picture of Baby Boomer health is similar to that painted
internationally, with significant concerns surrounding the ageing of this large cohort
and the potential burden to the health system this presents48. Although life
expectancy of the Baby Boomer generation has improved by four years for women
and five for men since the early 1980s, this does not appear to have equated to
improved quality of health over the same time period35. Research focussing on the
Baby Boomer cohort in Australia posits that lifestyle changes seen over the past few
decades may well outweigh the improvements seen in public health, medicine and
overall quality of life, to cause an increase in morbidity largely attributed to the
growing obesity prevalence34. South Australian research has demonstrated a rise in
obesity among Baby Boomers between 2002 and 2007, with 65% of the cohort
classified as overweight or obese using BMI49. The study highlights the importance of
education, income, self-reported health status, physical activity and co-morbid

17
conditions such as diabetes, as precursors and potential consequences to developing
obesity49. The research on the increasing prevalence of obesity in the Baby Boomer
cohort34, 49-52 suggests that if nothing is done to halt this then Australia will see rising
rates of diabetes, sleep apnoea, knee replacements, bariatric band surgery50, CVD,
cancer and kidney disease53.
Health research examining Generation X is much less common as the current spotlight
centres on more immediate concerns surrounding the older generations. The latest
report on Australia’s Health from the Australian Institute of Health and Welfare
illustrates that Baby Boomers and Generation X share the same risk factors of
smoking, risky alcohol consumption and insufficient physical activity although the
conditions contributing most to burden of disease differ7. Anxiety, depression, suicide,
self-harm, substance abuse and traffic accidents feature prominently for the younger
generation whereas older Baby Boomers are dealing with a greater burden from
chronic diseases and cancer7. Unless the environment significantly changes then the
greatest burden of disease for Generation X will alter over time to mirror that of the
Baby Boomers. Research has also examined attitudes to work, generational
differences in work ethic and the experience of the work environment54-59. Emerging
themes from this research suggest ineffective communication in the workplace
between generations, more negative workplace experiences and greater value placed
on leisure time for Generation X55, 57, 59.

18
The health differences demonstrated via inferences from current national research
demonstrate a general consistent pattern with health issues associated with younger
and older groups. However, it is also important to understand if there are differences
between the generations in health status, irrespective of age or lifecourse stage. In
other words, are there birth cohort differences, caused by factors other than age?

19
Chapter 3 OBESITY
20
3.0 What is Obesity?
Obesity is characterised by excess or abnormal fat that increases the risk of illness60-62.
The development of obesity is a significant risk factor for multiple health problems
including CVD, musculoskeletal conditions63, type 2 diabetes64, some cancers65,
disability66, poor self-rated health67-69, obstructive sleep apnoea70, mental wellbeing71,
72 and significantly affects overall health-related quality of life73.
3.1 Measuring Obesity
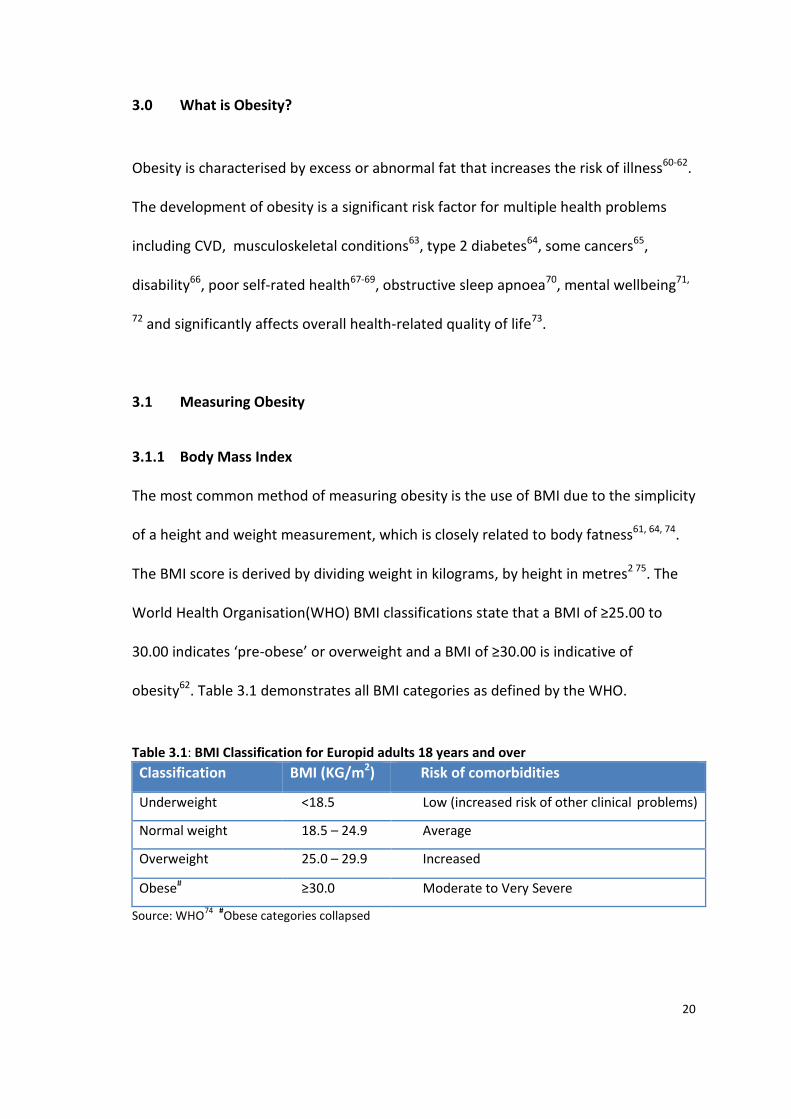
3.1.1 Body Mass Index
The most common method of measuring obesity is the use of BMI due to the simplicity
of a height and weight measurement, which is closely related to body fatness61, 64, 74.
The BMI score is derived by dividing weight in kilograms, by height in metres2 75. The
World Health Organisation(WHO) BMI classifications state that a BMI of ≥25.00 to
30.00 indicates ‘pre-obese’ or overweight and a BMI of ≥30.00 is indicative of
obesity62. Table 3.1 demonstrates all BMI categories as defined by the WHO.
Table 3.1: BMI Classification for Europid adults 18 years and over
Classification BMI (KG/m2) Risk of comorbidities
Underweight <18.5 Low (increased risk of other clinical problems)
Normal weight 18.5 – 24.9 Average
Overweight 25.0 – 29.9 Increased
Obese# ≥30.0 Moderate to Very Severe
Source: WHO74
#Obese categories collapsed

21
However, BMI fails to take into account fat distribution76 and includes estimation of
both fat mass and fat free mass in its calculation despite the opposing effects these
have on health77. There are also issues in using BMI to define obesity in older
populations as fat free mass decreases with age78.
3.1.2 Waist Circumference and Waist-Hip-Ratio
In 1947 a French physician Jean Vague first noted that abdominal fat most commonly
seen in men, was more likely to be associated with CVD and diabetes related
complications79, 80. The two most common measurements of abdominal fat are the
Waist-Hip-Ratio (WHR) and Waist Circumference (WC), both which are posited to
more accurately predict diabetes and CVD risk compared to BMI81-85.
WC is measured by placing a measuring tape at the point between the lowest rib and
the top of the iliac crest at the end of normal respiration86. In 2008, an expert
consultation was held by the WHO to explore the evidence base regarding WC cut-
off’s appropriate to the need for intervention86. The WC cut-off points most often
used to define increased risk of metabolic complications are displayed in Table 3.2.
Table 3.2: WC classifications
WHO Cut-off points Risk of metabolic complications
>94cm Males
>80cm Females Increased
>102cm Males
>88cm Females Substantially increased
Source: WHO, 2008 86

22
WHR is waist circumference divided by the hip circumference which is measured by
circling a measuring tape around the widest point of the buttocks86 and provides
additional information about muscle mass62. While both WHR and WC provide
measures of abdominal fat, WC is the more widely used given the comparative ease of
measurement compared to WHR86 and is the only measure of central obesity used in
the present research.
It is proposed that excess abdominal fat is related to decreased glucose tolerance,
reduced insulin sensitivity and unfavorable lipid profiles86, key indicators of CVD risk.
Accurate prediction of CVD risk and cardiometabolic risk factors is indispensable given
that CVD is the number one cause of death in Australia5 and globally87. However,
individuals with excess abdominal fat may be demonstrating the accumulation of
subcutaneous or visceral fat. Visceral fat has been shown to be associated with key
metabolic abnormalities independent of the amount of subcutaneous fat61, 88, 89 and is
widely accepted as at the minimum, a marker and at the most a cause, of greatly
increased risk of CVD and Type 2 diabetes61. Whilst WC is highly related to the
accumulation of visceral fat using computed tomography in comparison to WHR and
BMI90 and associated metabolic markers of CVD or type 2 diabetes91, it cannot by
itself, distinguish visceral from subcutaneous adiposity61. Despite this, WC is superior
to BMI in that it is unrelated to height79, 85, it accounts for fat distribution, which has
been shown to vary within a minor BMI range76 and it predicts CVD84, 85 and mortality92
independent of BMI.

23
Both BMI and WC have been accepted as predictors of obesity related health risk,
although both have limitations. The WHO suggests that BMI is appropriate for use as a
predictor of disease risk or that WC or WHR could be used in conjunction with BMI86.
3.2 Obesity and mortality
In attempting to discern the best population measure to identify those at highest risk
of obesity comorbid conditions, it is important to consider the relationship between
excess weight and mortality, as the ultimate consequence of unhealthy weight. A
phenomenon termed the ‘obesity paradox’ has been proposed suggesting that in older
age groups, overweight and moderate obesity confers a ‘survival advantage’93, 94.
Several large-scale projects have examined this seemingly counter-intuitive
relationship. A recent review of the association between BMI and mortality by Flegal
and colleagues showed that overweight was associated with lower mortality while
grade 1 or ‘mild’ obesity (BMI 30.00-35.00) was not associated with excess mortality95.
The authors therefore concluded that the driver of the relationship between obesity
and excess mortality was higher levels of BMI of 35.00 or greater95. Pishcon and
colleagues using the EPIC cohort data found that both general and abdominal
adiposity, measured by BMI, WC or WHR, were all independently related to mortality
risk96. However, they concluded that measuring both general fatness (BMI) and central
adiposity (WC or WHR) provided the best prediction of mortality96. Criticisms of the
Flegal meta-analysis make the point that their comparison group included smokers
24
and people with preexisting disease and therefore the risk of mortality in the
comparison groups are underestimated97.
A strong argument has been made that previous findings of an inverse association
between weight and mortality are due to confounding by smoking status and
preexisting disease as both factors influence premature mortality and weight.
Leitzmann et al. found that abdominal fat mass measured by WC consistently related
to death from multiple causes independent of BMI, while BMI demonstrated
inconsistent associations92. From this they suggested that general fatness is not a
consistent predictor of premature death92. This finding may be related to the potential
confounding factor of smoking status, as other work has found that WC is associated
with mortality risk independent of BMI, which may relate to the adverse fat storage
profile often seen in smokers96. Examining a cohort aged 50 to 71 years old, Adams et
al. found that when smokers and participants with preexisting disease were included
in analysis then the obesity paradox persisted and overweight was not associated with
risk of death in women and only weakly associated with death in men78. However,
after restricting analysis to those who had never smoked and using mid-life BMI values
to account for preexisting disease bias, they found that even modest increases in BMI
increases the risk of death98.
Acknowledging the potential bias, Berrington de Gonzalez and team aimed to estimate
the mortality risk of overweight, obesity and morbid obesity without confounding
from smoking or preexisting disease99. Using data from 19 prospective studies with a

25
median follow-up of ten years and restricting analysis to non-smokers and those who
did not have diagnosed cancer or heart disease, they found that overweight, obesity
and possible underweight was associated with an increase in all-cause mortality and
that a BMI range of 20.00 to 24.90 illustrated the lowest mortality risk99. Masters,
Powers and Link100 further discussed the possibility that the obesity paradox has
previously been found due to inadequate adjustment for birth cohort and age at
interview, given that reductions in mortality are highly related to birth cohort. In a
cross-sectional analysis of 19 waves of a US National survey they found that after
adjustment for cohort and the interaction between obesity and age at survey, the
association between BMI defined obesity and mortality grew stronger with severity of
obesity and age100.
The mass of evidence seems to suggest that in large population studies, BMI as a
measure of general fatness and WC as a measure of abdominal obesity both predict
health related risk and mortality with caveats. Use of WC confers advantage in terms
of its relationship with visceral fat, although this is still not the perfect measure as it
cannot discriminate between visceral and subcutaneous fat deposits.
3.3 What causes obesity?
While the causal pathway is generally accepted as an interaction between poor diet,
low physical activity and an increase in sedentary time101, 102 the sizeable increase in
obesity prevalence that has occurred in almost all countries, has also been driven by

26
evolutionary changes and the complex interactions between genetic, biological,
environmental and social factors.
In many countries, a small but chronic energy gap between intake and expenditure has
been responsible for gradual weight gain that has propelled the increase in obesity103.
Globally, food systems have altered over the past 50 years to the point where an
abundance of energy-dense, cheap and palatable food is consistently available for
consumption in a way that has never previously been experienced104, 105. Additionally,
technological advances linked to reduced physical activity in relation to work, home
and travel has resulted in reduced physical activity in developed countries106.
3.3.1 Energy intake
The production and marketing of foods high in sugar, fat, salt and with flavour
enhancers has been postulated as the primary driver of weight gain in developed
countries107, 108. For the first time, food has been engineered to trigger a reward
response exceeding that of traditional non-processed foods109. Volkow proposes food
reward plays a critical role in the development of overweight and obesity and that
highly palatable food trigger a response akin to drug addiction affecting self-control,
promoting over-eating and reward response conditioning110, 111. There is overlap in the
regions of the brain that respond to food and to drug intake110, 112 and evidence from
rat studies has shown intense sweetness consumed from sugars surpasses the reward
induced by cocaine – a highly addictive drug, suggesting that highly sweetened
beverages and foods may lead to a sugar addiction113. In the context of the

27
widespread availability of sweetened beverages, cheap, high fat and high sugar foods,
the probability that conditioning of reward circuitry in the brain and subsequent
behaviours akin to addiction are contributing to the obesity epidemic is of significant
concern. Lustig, Schmidt and Brindis recently called for government regulation of
sugar, arguing the addictive properties, the harm it confers on society and its
widespread availability warrants intervention114. There is support for the theory of
sugar and/or food addiction, although it has not yet been proven112, 115. However,
others caution the link between food addiction and obesity, suggesting animal studies
are not sufficient to prove this theory and endorsement may discriminate further
against a group within society already in receipt of significant discrimination116.
3.3.2 Energy expenditure
In terms of the reduction in energy expenditure, one contributor has been the
reduction in work related physical activity117-119. Studies undertaken using national US
data have shown that the prevalence of people working in occupations associated
with high levels of physical activity has reduced by at least half since 1950119. Further,
since the 1960s, daily occupation related energy expenditure in the US is estimated to
have dropped by more than 100 calories (418 kilojoules)117. The reduction in
occupational physical activity is of concern given that working in physically active
occupations reduces the likelihood of developing obesity120. However, the obesity
epidemic cannot purely be related to occupational related physical activity given the
rise in prevalence has also been seen in children and other non-working
populations107. An Australian study recently demonstrated that non-occupational

28
sedentary time has increased from 1997 to 2006 and 90% of leisure time is taken up
with sedentary activity121. Related to this, sitting time has been highlighted as
increasing the risk for many obesity related comorbidities118, 122-124. Prolonged sitting
time has been shown to increase the risk of all-cause122 and CVD related mortality125,
and is associated with diabetes and overall chronic disease status 124 independent of
physical activity levels.
3.3.3 Genetics
Although both of these factors pertain to this core issue of chronic energy imbalance,
genetic and evolutionary perspectives provide a further viewpoint on the causes of the
obesity epidemic. While not within the scope of the present research, it is important
to acknowledge the key role genes play in individual responses to the environment. It
is estimated that up to 70% of differences in fat development within the same
environment can be attributed to genetic variance126, 127. This should not be taken as
an absolute but rather an acknowledgment some individuals will be in receipt of
inherited genes that despite their best efforts, will result in the development of
metabolic disease127. O’Rahilly speculates that eventually obesity will be considered as
a neuro-behavioural disorder, as much of the identified genetic variance affects the
regulation of food intake (satiation and appetite) and energy expenditure128.
3.3.4 An evolutionary perspective
Pertinent observations have recently been made regarding the fact obesity is not a
new condition and it is likely the most common comorbidities also existed in the
29
Neolithic era, as overeating was once a necessary defense against times of famine129.
This is linked to the original evolutionary theory regarding the development of obesity.
The thrifty gene hypothesis was proposed by Neel in the early 1960s and posited a
genetically determined excessive insulin response to food ingestion promoted fat
storage to provide for times of food scarcity130. Essentially, this theory proposes the
earliest humans were predisposed to fat storage and overconsumption as a survival
tool and this tendency to fat storage now confers significant risk of developing obesity.
However, this theory does not explain how a significant proportion of individuals
maintain normal weight131. Speakman suggests there would not have been sufficient
levels of famine related mortality to encourage propagation of the thrifty gene and
obesity would have been selected out due to natural predators131. Instead, he
proposed that following the development of strategies to ward off predators, a
genetic predisposition to obesity developed in the absence of selection and this
mutation has spread as a result of random drift131. The random drift hypothesis
explains why so many people maintain normal weight in the same environment where
many do not.
3.3.5 Additional explanations
Other possible explanations for the rapid increase in obesity prevalence include
exposure to synthetic chemicals with endocrine disrupting abilities often found in
chemically contaminated food or food packaging, which have been linked to weight
gain132. Decrease in sleep time and the increase in sleep disorders133 have also been
shown to increase the risk of hypertension, diabetes, stroke and obesity134, 135.

30
Technological advances in heating technology and clothing have also reduced the time
humans spend in temperatures that require energy expenditure to maintain a stable
internal body temperature136, 137. A significant amount of research has also been
conducted into exposure to inadequate or inappropriate nutrition and other
detrimental environmental exposures during critical early development periods and
how this impacts on the development of early disease. Extensive evidence points to
intra-uterine or early life exposures playing a central role in the risk of developing
chronic disease through alteration in gene expression138.
Within the community, obesity is often portrayed as individual (knowledge and
behaviour) or environmental (external influences and resource availability), with
responsibility in the first instance purely personal, whereas responsibility for the latter
lies with the government, businesses and the wider community139. This research
perceives obesity as being shaped by the factors previously discussed, that have
altered the environment to one which requires minimum energy expenditure and
high-fat, energy-dense foods are more available and affordable than the healthier
alternative139, 140. In effect, human physiology and attitude to food has not changed in
step with the environment. This has resulted in what has been termed the obesity
pandemic104.
3.4 Prevalence and costs
Compared to other OECD (Organisation for Economic Co-operation and Development)
countries, Australia has one of the highest rates of obesity, with one in four Australian

31
adults obese in 2007/085. Using measured data, 28.3% of the Australian adult
population were obese in 2011-12 and 35.0% were overweight6. Similar figures are
seen internationally. In the US 32.3% of adults over 20 years old were obese in 200440
and in England approximately 28% of adults were obese in 2007-2008141. Projections
of obesity prevalence range from 33.9% for Australia in 2025142 and for global adult
obesity prevalence to reach 57.8% by 2030143. Furthermore, given that in 2007/08
40.0% to 47.0% of Generation X and Baby Boomer males and 26.5% to 34.7% of
females were overweight, there is a considerable possibility that by 2025 obesity
prevalence will be higher than currently projected7. Figure 3.1 illustrates the rise of
obesity prevalence in Australia since 1980 and shows in recent times, men have
overtaken women in terms of obesity prevalence5.
Source: Australian Institute of Health and Welfare, Australia’s Health 2012 5
Figure 3.1: Prevalence of obesity in Australia for 25 to 64 years olds, using measured
height and weight, obesity defined as BMI≥30.

32
Access Economics released a report in 2008, asserting obesity cost Australia $8.3
billion in 2008 but if the net cost of wellbeing loss is added to this, it brings the total
cost of obesity to $58.2 billion for 2008144. The latest intergenerational report from the
Federal Treasurer predicts overall spending on health will increase from 4.0% of Gross
Domestic Product (GDP) in 2010 to 7.1% of GDP in 20491. By 2023, Type 2 diabetes,
one of the most significant consequences of overweight and obesity39, is predicted to
become the leading cause of disease burden7 and the cost of diabetes is projected to
increase by 436% from $1.6 billion to $8.6 billion by 20331. Increases are ordinarily
expected over time but such a drastic rise poses a particular challenge to government
as the number of working age people is projected to fall in line with the ageing
population, from five in 2010, to less than three in 20501.
At the core of policy discourse surrounding the ageing generation is the idea it is not
only demographic ageing that will influence labour force participation but also health1,
145. According to the 2008-2009 ABS Retirement survey, 29% of men and 19% of
women reported the main reason they had ceased work was ‘own sickness, injury or
disability’146. The average age at which these people retire from the workforce is 54
years146, a considerable time before qualification for the age pension of 65 years147.
Taking all of these factors into account, it is obvious the benefits to reducing the
incidence and prevalence of overweight and obesity would not just lie in the economic
realm of reducing future health spending. There is also potential to increase and
maintain labour force participation into the future145, which in turn would affect
economic growth and reduce the impact of the ageing population1.

33
It is clear there is potential to moderate the effect of the ageing population through
health improvement, with a particular focus on obesity. However, evidence based
interventions at a population level are uncommon148 and how to tackle this worldwide
epidemic71, 149 at a public health level is a divisive topic50.
Two obvious pathways present themselves as opportunities to tackle the increase in
obesity. The first path involves treating the clinical symptoms and individual causes of
obesity and the second involves reversing the environmental changes seen over the
past centuries139, 150, 151 or in the least, the way in which individuals react to it. The
situation thus far has only been addressed with reactionary measures. However, both
research and policy agree the economic and health cost of this, should it continue,
may become unsustainable1, 152, 153 and interventions need to be instituted at a broad
environmental level to have population effect. In recognition of this, the Federal
Government formed a Standing Committee on ‘Health and Ageing: an inquiry into
obesity’ in 2008154 as well as the National Preventative Health Taskforce focussing on
obesity, tobacco and alcohol152. Submissions to the standing committee argued for
interventions ranging from behaviour modification, public education, weight loss and
surgical interventions to tackling the availability of open space, access to public
transport and suburb design155. However, there was a lack of discussion of the role
social inequalities play in the development and maintenance of obesity, nor
consideration of the idea interventions may only be taken up by the more advantaged
- as has largely been the case with smoking156.

34
Other research has proposed interventions at varying levels of government, including
a greater emphasis on health when it comes to land use management, zoning and
building design standards, as well as increasing walking opportunities and cycling lanes
and paths157. Bond and colleagues have also suggested applying a tax to ‘junk’ food for
similar reasons taxes have been raised on tobacco products and alcohol158. A US study
estimated a 10% increase in soft drink price could reduce consumption by 8-10% and
conversely, a 10% reduction in fruit and vegetable pricing could increase consumption
by 7% and 5.8% respectively159. However, there are no suggestions as yet the
Australian Government is receptive to this idea.
The prevalence of obesity has increased to an unsustainable level and the
consequences for multiple aspects of the economy, society and individuals are vast.
The central role of environmental changes in this epidemic raises the possibility
younger birth cohorts, who have spent more time in this ‘obeseogenic’ environment,
may reach a greater prevalence of obesity as they age than is currently being seen.
Policy that addresses aspects of the environment encouraging reduced physical
activity and increased food intake (i.e. bike paths, tax on sugar) coupled with programs
to motivate attitude and behavioral change are imperative.

35
Chapter 4 WORK AND THE WORKPLACE
36
4.0 Work and the Workplace
4.1 An environment for intervention
A question of significant interest in this research is what environments exist that can
be affected to alter the current pathway from environment, to obesity, to chronic
disease. Consideration of the workplace as an intervention medium to reach the
majority of the adult Australian population is reasonable, when it is evident that for
many people, this is where they spend upwards of 50% of their time101, 160.
In recent years there has been a respectable amount of funding invested in exploring
the work environment as a pathway to health, be it good or poor health. A workshop
into “preventing chronic disease in the workplace” convened by the National Institute
of Health and the Centres for Disease Control and Prevention in the US161 suggested
several aspects of the workplace that may adversely affect health for the individual
and potentially for the family. These included culture, policies, practices, hazardous
exposures, psychological demands, job control, work schedule control, rewards,
organisational justice, norms, social support and union status161. As of 2011, the
Federal government announced $21.2 million in funding for South Australia under the
new Healthy Workers Initiative to undertake workplace programs that encourage a
healthier lifestyle with a view to prevent chronic disease and obesity162. This highlights
that environment is comprised of more than just home and the workplace is a
significant area that needs to be considered for research and interventions. There is a
stark need to create an environment that encourages healthy eating and exercise

37
behaviours in a way that will eventually be accepted and supported by the community
to see sustainable change in behaviour, attitudes, and level of overweight and obesity
at the population level139, 151. The sticking point to all of this is the questions
remaining about how best to change unhealthy decision making and attitudes in a way
that is acceptable to the public and what it is exactly that should be targeted in policy.
Individual workplace interventions targeting diet or physical activity have been shown
to have limited effectiveness after a systematic review by Le Maes and colleagues163.
However, a recent workplace based intervention targeted at weight loss in male shift
workers by Morgan et al. achieved clinically significant weight loss in the intervention
group160, which is of potential importance given shift work has emerged as one of the
most significant factors that can negatively influence health when compared to normal
daytime workers160, 164. Moreover, a meta-analysis conducted by Hutchinson and
Wilson including 29 studies that conducted a workplace intervention with health as a
main outcome measure, found most support for workplace interventions that used
‘motivation enhancement’ as the method for change, and that interventions that
focussed only on a single behaviour (i.e. diet) had larger effect sizes than those that
focussed on multiple behaviours or outcomes. However, lack of follow up meant
change sustainability was not measured165. If we step out of the traditional view of
individual behaviour and look to other contributing factors that may be creating an
unhealthy workplace, it is apparent there are numerous pathways that may lead from
the work environment to poor health outcomes. These include job control, sedentary
time, subordination stress, peer or supervisory support or built environment and it is

38
extremely valuable to explore these additional avenues through which obesity and the
development of chronic disease can be tackled.
4.2 Work related stress
In addition to intervention programs there has also been significant research linking
psychosocial stress in the workplace to obesity and comorbid chronic conditions. This
is in part due to the association between obesity and metabolic syndrome, CVD, Type
2 diabetes and the link between psychosocial stress and these same conditions52, 166-
169.
Perhaps one of the most prominent utilised theories of stress in the workplace is the
Karasek demand-control model170. The theory hypothesises an individual working in a
job which has high psychological demands and low control over those demands will
experience job strain, which in turn leads to increased risk of ill-health 168, 171, 172. A
series of studies from the Whitehall II British civil servants cohort examined the link
between the Karasek control-demand model across a number of different contexts.
With three phases of data collection from 1985 to 1993 and 7,327 respondents
participating in all three stages173, these studies provide one of the most
comprehensive assessments of the effect job control can have on health. Marmot and
colleagues found support for the hypothesis that psychosocial work stress, in
particular work control, is an important factor in the creation of the social inequalities
seen in Coronary Heart Disease (CHD) incidence. They found having low control in the
workplace contributed to the unequal distribution of CHD in both men and women173.

39
Similarly, Kuper and Marmot investigated the full job strain model of demand and
control and reported that job strain (high demands, low control), low decision latitude
and high job demands were all associated with an increase in risk for CHD in the
Whitehall II cohort174. A further investigation was undertaken into work stress and the
metabolic syndrome, where chronic work stress was defined as three of more
exposures to job strain over the period of the study. A dose-response relationship
between work stress and metabolic syndrome was found for both males and females,
although the number of females was very small. There was also a relationship
between metabolic syndrome and unhealthy behaviours and both were more
common in the lower employment grades raising more questions about health
inequalities perpetuated through occupation class166.
More recent examination of the Whitehall cohort with the aim of exploring the role of
chronic stress in obesity by Brunner, Chandola and Marmot found that job strain over
19 years had a dose-response relationship with obesity defined by BMI (30 kg/m2) or
waist circumference (>102cm in men >88cm in women) and this relationship persisted
after controlling for alcohol, smoking, diet and physical activity169. Lallukka and
colleagues hypothesised that workers attempt to compensate for high job strain and
working overtime, with adverse health behaviours and analysed data from the London
Whitehall II cohort and similar cohorts in Japan and Helsinki. In contrast to the
previous findings that supported the link between working conditions and health, a
relationship between obesity and working overtime was seen only in women in the
London cohort while men in London with passive jobs (low control, low demand) were

40
more likely to have low physical activity. Job strain had a relationship with low physical
activity in London men and Helsinki women. However, there was no strong evidence
supporting the hypothesis the relationship between job strain and health might be
mediated by obesity or health behaviours. Heraclides and colleagues reported that
psychosocial work stress proved to be an independent predictor of type II diabetes in
women after a 15 year follow up, irrespective of unhealthy behaviours, weight change
and the resultant alteration of blood pressure, blood lipids and inflammation168.
Findings from the Finnish Public Sector Study also provide support that job strain
increases the likelihood of risky health behaviours175 and that low job control and high
strain are associated with a higher BMI176 although the cohort was primarily women
over 40.
Turning to Australian literature, a cross-sectional study among 1101 workers in
Victoria concluded high psychological demand in men was associated with a higher
BMI and after controlling for job stress measures in men, longer working hours were
also associated with a higher BMI171. Psychosocial or other working conditions were
not associated with BMI in women171. LaMontagne and colleagues using the same
data from the Victorian Job Stress Survey, focussed on population attributable risk for
depression and variation in job strain exposure177. They reported women were
significantly more likely to experience job strain than men, and that job strain
prevalence increased approximately 20% with each ‘unit’ of lowered skill level and
conclude that job strain is a significant factor contributing to mental health
inequality177. Using data from a cross sectional study of 40-44 year olds in Canberra

41
and Queenbeyan, D’Souza and colleagues examined the associations between job
status, job strain, job insecurity and mental health178. Job strain was seen in around
23% of both low and high status worker while mid-status workers had the lowest
proportion of workers experiencing job strain. Both job strain and job insecurity were
significantly associated with mental health, irrespective of job status and high job
strain was associated with depression and anxiety178. This is in contrast to the
previously described studies, as high status workers were just as likely as low status
workers to have poorer health outcomes, in part due to job strain.
The mass of evidence suggests conflicting support for the relationship between job
strain, psychological work demands, job control, obesity and overall health. There is
general theoretical agreement that stress at work caused by any of these factors may
adversely affect health behaviours, thereby increasing the risk of chronic disease and
further, it is plausible that increased levels of cortisol and adrenaline caused by chronic
stress may impact on the development of obesity166, 168, 169. However, there is a lack of
attention in data analysis that stress may cause weight gain or, weight loss179, perhaps
weight change should be considered as an unhealthy reaction to psychosocial stress at
work.
The Australian studies highlight the important role mental health may be playing in
mediating the relationship between work stress and overall health177, 178, while the
balance of evidence suggests that across a significant period of time, psychosocial
work stress can have a significant impact on overall health. However, there is little

42
consideration in this work of generational differences in workplace experience and
differences in work related influences on health. The majority of studies adjust for age,
without acknowledging the likely heterogeneity in how different birth cohorts may be
affected by factors such as work related stress.
4.3 Absenteeism and Presenteeism
Whilst much has been made of the potential decline in labour force participation in an
absolute sense, there has been little political discourse in regards to absenteeism or
presenteeism as significant factors that reduce work performance and labour force
productivity, increasing the economic burden of chronic disease172. It is clear from this
previous research that a further consequence of job strain may well be increased
absence from work or, indeed, unproductive presence at work due to the effect it has
on overall health. Absenteeism can also be conceptualised as an indicator of an
individual’s overall health, although the growing knowledge around presenteeism may
challenge this perception. As job strain has a relationship with risky health
behaviours175, obesity169, 176 and other chronic conditions such as CHD and metabolic
syndrome, not to mention mental health problems, it stands to reason it may affect
rates of both absenteeism and presenteeism.
In a Danish study, Hansen and Andersen consider what factors might influence the
‘decision to turn up ill at work’ and divide them into work-related factors, personal
factors and attitudes180. They conclude that overall the most important factor involved
in turning up at work ill was ‘time pressure’ theorising high workload may play a role in
43
presenteeism180. Studies conducted in Australia have demonstrated high job strain and
active jobs (high demand, high control), psychological distress, as well as longer
commuting time, are significantly associated with longer absenteeism over three
years172, 181. There was also a negative relationship between long working hours and
sick leave172. If long working hours exist due to a high or excessive workload, this raises
the possibility the ‘time pressure’ discussed previously180, may be the reason the ill
individual does not take a whole day off work, despite the fact their health may be
greatly reducing productivity at work. It is a distinct possibility that excessive
workloads resulting in long work hours may be reducing overall workplace output or
efficiency. Evidence in regards to work sector demonstrates those in the
administration or retail sector were more likely to take long sick leave172 although
government employees have been demonstrated to be more likely to take short term
sick leave182. Job insecurity has also been raised as a workplace factor that may
influence sick leave or presenteeism. D’Souza et al. show respondents reporting high
job insecurity or high workloads were significantly more likely to have long-term
absences compared to those with low job insecurity182. However, when depression
and anxiety were included in the model, they reduced the association between work
demands and long-term absenteeism to non-significance suggesting mental health
may explain the association between work conditions and long-term absence182.
Holden and colleagues explored the number of health conditions associated with
absenteeism or presenteeism183. They reported a greater number of conditions were
associated with absenteeism although psychological distress, drug and alcohol
problems, fatigue, work related injury and obesity demonstrated stronger positive

44
relationships with presenteeism than those conditions associated with staying at
home, and propose mental health has a greater impact on both sick leave and
presenteeism183.
The effect of the ageing of Australia’s population on the health system, the economy
and society can be mitigated through improvements in health. This research will seek
to identify behaviours, attitudes and environments that should come to the attention
of health practitioners, health promoters and policy makers alike in the quest to
reduce obesity and increase working life and health. The focus on both the Baby
Boomers and Generation X allows this research to identify any differences between
the groups that should be noted in terms of current and future interventions and
preventative health strategies.

45
Chapter 5 STUDY DESIGN AND OBJECTIVES

46
5.0 Study Design and Objectives
Figure 5.1 presents the framework this research is based on. It encapsulates the
proposal that work type or occupation, workplace and job specific characteristics such
as work stress, may affect the likelihood of participation in risky health behaviours.
This in turn has a relationship with the development of obesity and/or common
comorbidities such as diabetes, depression, musculoskeletal conditions and
cardiovascular disease, which affect overall health and may precipitate premature
workforce exit and/or increased absences from work or a decrease in job performance.
Figure 5.1: Framework exploring the inter-relationships between work and health
related factors.
Soci
o-d
emo
grap
hic
fac
tors
Work Type
Gen
erat
ion
me
mb
ersh
ip
Workplace
Job characteristics
Risky health behaviours
Obesity Comorbidities
Overall health
Reasons for workforce exit Absenteeism / Presenteeism

47
To investigate the generational differences in these relationships, multiple data
sources have been utilised. The first study analyses the Australian National Health
Survey (NHS), the second uses data from the Nutrition, Obesity Biomedical Lifestyle
and Environment (NOBLE) II project and the third data from the North West Adelaide
Health Study (NWAHS). The methodology of each study undertaken is explored within
each study respectively so the following will describe additional information.
5.1 The National Health Survey
With the aim of obtaining nationally representative information on a range of health
related indicators, the NHS has been conducted by the Australian Bureau of Statistics
(ABS) seven times since the first survey in 1977/78.
The analysis undertaken for this study includes a comparison of the 1989/90 NHS with
the 2007/08 NHS in order to compare Baby Boomers and Generation X when both
generations were of the same age of 24 to 45 years.
The 1989/90 NHS was conducted under the Census and Statistics Act 1905, although
willing participation of all respondents was sought. A multi-stage area sampling
strategy was used to ensure equal probability of selection, although hospitals, nursing
homes, boarding schools and military facilities were excluded from selection for the
survey. To encourage respondent cooperation, public awareness media campaigns
were undertaken prior to the survey commencing. A letter was initially sent to
selected dwellings to inform them of their selection. Face to face interviews were

48
conducted to collect information on long-term medical conditions, medications, risky
lifestyle behaviours as well as a specific set of questions assessing women’s health and
a range of socio-demographic information. A response rate of 96% was attained184.
Data are weighted according to age, sex and area ‘benchmarks’ to ensure the
population distribution in the sample matched that of the distribution within the
respective areas. Expansion factors are also applied to the data to enable prevalence
estimates for the total Australian population.
In 2007/08 15,792 houses were selected to participate, although this did not include
very remote areas of Australia. (Non-private dwellings including hotel, boarding
schools, hospitals, nursing homes and prisons were also not included in the survey.) A
stratified multi-stage area sampling technique was employed to ensure all sections of
the population considered with the scope of the survey were represented in the
sample.
A letter was initially sent to selected households to inform them of their selection in
the survey. Trained interviewers were used to collect information about one adult
(18+) and one child in each household and parents or a guardian were asked to answer
questions about children aged less than 15 years old. Five ‘call-backs’ were made to a
dwelling before it was classified as ‘non-contact’. All interviews were conducted face-
to-face. Across Australia, 20,788 people participated and answered questions relating

49
to their (or their child’s) health status and health-related behaviours. After sample loss
a response rate of 90.6% was achieved.
Data are weighted to account for probability of selection and calibrated to
“independent estimates of the population of interest” to ensure the sample estimates
conform to population distribution.
The data are accessed from the ABS under its Universities Australia Agreement and is
confidentialised. It is not possible to access all collected data at the desired level of
detail due to concerns about potential re-identification of survey respondents. Of the
data available from the 1989/90 and 2007/08 surveys we were able to match
education attainment, employment, smoking status, BMI, physical activity levels, self-
rated health and diabetes. All data were self-report. Further details on these variables
can be found in Chapter 6 pp66-68.
5.2 The Nutrition Obesity Biomedical Lifestyle and Environment Project
Baby Boomers and Generation X members from two existing cohort studies were
asked to partake in a telephone survey of work related issues as a part of the NOBLE II
project in October 2011. For the purpose of this study, a Baby Boomer was defined as
those born between 1 January 1946 and 31 December 1965 and Generation X was
defined as those born between 1 January 1966 and 31 December 1980.

50
Participants were sourced from the NWAHS185 and the Florey Adelaide Male Ageing
Study (FAMAS)186, both of which are population based biomedical studies of people
living in the north-west suburbs of Adelaide, South Australia at the time of selection.
An initial sample of 2350 Baby Boomers and Generation Xers was identified from the
two cohort studies. Respondents were considered ineligible for the study if they had
not worked in the past three years, as the majority of questions regarded work related
factors.
A letter and an information sheet were sent to all selected participants introducing
this study and informing them that they would receive a phone call within the time
frame specified. The CATI (Computer Assisted Telephone Interview) system was used
to conduct the interviews. This system allows immediate entry of data from the
interviewer’s questionnaire screen to the computer database.
A range of information was collected including respondents employment status,
health related work influences such as job strain, work-life balance, supervisor and
colleague support, occupation related physical activity, workplace policies, social
networks and general health related questions as well as demographics not previously
collected from the cohort studies or that needed to be updated.
A total of 1642 interviews were completed, resulting in an overall response rate of
87.5%. A breakdown of response rates by study can be found in Table 5.1.

51
Table 5.1: Breakdown of response rates by study for the NOBLE II project NWAHS FAMAS OVERALL
n % n % n %
Initial eligible sample 1715 635 2350
Not eligible to continue (not worked in last 3 years)
302 17.6 100 15.7 402 17.1
Unable to contact (modem, disconnected phone, respond not in area)
47 2.7 24 3.8 71 3.0
Eligible sample 1366 79.7 511 80.5 1877 79.8
Refusals 68 5.0 20 3.9 88 4.7
Non-contact after 15 attempts
91 6.7 18 3.5 109 5.8
Respondent unable to speak English
- - 1 0.2 1 0.1
Incapacitated/ unable to be interviewed (ie too ill, hearing impaired)
1 0.1 3 0.6 4 0.2
Terminated interview 1 0.1 - - 1 0.1
Respondent unavailable 20 1.5 11 2.2 31 1.7
Complete interviews 1185 86.7 458 89.6 1642 87.5
A flow chart depicting the cohort surveyed as a part of this study can be viewed on
page 106 as a part of Section II, Chapter 7.
Data are weighted to the respondent’s original probability of selection in the
household and to age group and sex, as per the ABS 2009 Estimated Residential
Population. Weighting was used to correct for the disproportionality of the sample
with respect to the population of interest. The weights reflect unequal sample
inclusion probabilities and compensate for differential non-response. The data were
weighted using the ABS data so the health estimates calculated would be
representative of the adult populations of the North West area of Adelaide.

52
Ethics approval for the survey of the existing NWAHS cohort was obtained from the
Queen Elizabeth Hospital Human Research Ethics Committee (HREC) and ethics
approval for the survey of the FAMAS cohort was granted by the Royal Adelaide
Hospital HREC.
5.3 The North West Adelaide Health Study (NWAHS)
The NWAHS Study commenced in 1999 and is a representative longitudinal study of
4060 randomly selected adults aged 18 years and over at the time of recruitment from
the north-west region of Adelaide, South Australia. At recruitment, 1,689 Baby
Boomers and 818 respondents from Generation-X were part of the study.
Households in the north and western regions of Adelaide were eligible for selection if
they had a telephone number listed in the Electronic White Pages. Businesses,
institutions and residential care facility phone numbers were removed from the
sample. Additional exclusions included those who could not communicate sufficiently
with the telephone interviewer to answer initial recruitment questions, despite efforts
to obtain family members who could translate185.
Major stages of the study have been held approximately every four years and
incorporated a telephone interview, self-completed questionnaire and biomedical
examination at a clinic. As of 2011, there have been three stages of data collection. Of
the initial sample of 10,096 selected in 1999, 18.6% were ineligible due to
disconnected phone number, non-residential phone number, fax or modem
53
connections. From the eligible sample (n=8213), 215 (2.6%) people could not be
contacted and 2148 (26.2%) refused to be interviewed. Of those interviewed (n=5850),
4056 attended the clinic for a biomedical examination resulting in a response rate of
69.3% for the clinic and 3622 respondents participated in the telephone follow up
resulting in a 89.3% response rate for the interview. Stage 2 of the study was
conducted from 2004 to 2006 and of the eligible sample, 79.0% of participants
attended the clinic, 86.3% completed the CATI and 80.3% completed the self-report
questionnaire. This resulted in an overall participation rate of 79.7%185. Stage 3
collected data from 2008 to 2010 using the same methods with 73.0% of eligible
respondents responding to the CATI, 71.1% completing the self-report questionnaire
and 67.0% attending the clinic185.
Ethics approval for all stages of the NWAHS has been granted by the Queen Elizabeth
Hospital HREC.
NWAHS data has been utilised in this research as part of a linked dataset with the
NOBLE II data collection as well as for the third study (Page 107) as a stand-alone
cohort.
5.4 The Florey Adelaide Male Ageing Study (FAMAS)
FAMAS commenced in 2002 as a longitudinal study assessing the “biomedical, socio-
demographic, behavioural, physical and psychological interactions that contribute to
the health and health-related behaviours of men”186. Overall, 1195 men aged 35 to 80

54
years were recruited from the north and west regions of Adelaide. All major stages of
the study have included a self-completed questionnaire and a clinic examination. At
the time of recruitment FAMAS contained 500 male Baby Boomers and 61 Generation
Xers.
With a similar methodological design to the NWAHS, each phase of data collection has
involved clinic assessment of a range of biomedical factors, with a CATI interview and
annual self-completed questionnaires, as well as additional voluntary participation in
various sub-studies undertaken with collaborators187. The study participants were
recruited at random, based on Electronic White Pages listings with the prefix for the
north or west suburbs of Adelaide. Selected households were sent an introductory
letter accompanied by a brochure on the study. Following this a telephone call was
made to the house and the last male aged between 35 to 80 years to have last had a
birthday was invited to participate using CATI technology.
Major stages of the study have been undertaken in a phased fashion to accommodate
funding availability. Of respondents who were eligible to participate, 71.7% agreed to
be interviewed and 45.1% attended a clinic for Stage 1. Phase 1 (n=568) was
undertaken from August 2002 until July 2003 and Phase 2 (n=627) from June 2004 to
May 2005. Therefore stage 1 of data collection occurred from 2002-2005. Stage 2 was
undertaken in a similar fashion from 2007 to 2010 and in total n=950 participants
were interviewed or attended the clinic resulting in a follow-up participation rate of
76.6%186, 187.
55
Ethics approval for all stages of the study was granted by the Royal Adelaide HREC.
Further information on the study methodology and data collection is available
elsewhere186, 187.
FAMAS data has been utilised in this research as participants formed part of the
NOBLE II cohort and data collected as a part of this study has been linked to the NOBLE
II study. This is further explored in the methodology of Chapter 8.
5.5 Research Objectives
The aim of this research is to investigate the differences in health status and the
influence of work and workplace on health in Baby Boomers and Generation X, as
Australia’s working generations. All analyses compare Baby Boomers and Generation
X in order to untangle the relationship between generation membership, health status,
health related behaviours and the influence of work.
The ensuing studies have been designed to answer the following questions;
1. Are Baby Boomers healthier than Generation X, irrespective of age?
2. Does work and the workplace affect the health of the generations
differently?
3. Does ill health have a relationship with workforce exit in Baby Boomers and
Generation X and are there generational differences?

56
SECTION II
RESEARCH RESULTS
57
Chapter 6 ARE BABY BOOMERS HEALTHIER
THAN GENERATION X?

58
6.0 Statement of Authorship
Title of Paper: “Are Baby Boomers healthier than Generation X? A profile of Australia’s
working generations using National Health Survey data.”
Publication Status: Published
Publication Details: Pilkington, R., Taylor, A., Hugo, G. & Wittert, G. 2014. Are Baby
Boomers healthier than Generation X? A profile of Australia’s working generations
using National Health Survey data. PLOS One, 9(3): e93087.
doi:10.1371/journal.pone.0093087.
Rhiannon Pilkington (Candidate)
Contribution: Conception and design, acquisition of data, data analysis, interpretation
of results, drafting the article, critically revising and performing revisions.
I hereby certify that the statement of contribution is accurate and grant permission for
the publication to be included in the candidate’s thesis.
Signed Date 13/05/2014
Anne Taylor (Co-Author)
Contribution: Conception and design, interpretation of results and critical manuscript
evaluation and editing.
I hereby certify that the statement of contribution is accurate and grant permission for
the publication to be included in the candidate’s thesis.
Signed Date 13/05/2014

59
Graeme Hugo (Co-Author)
Contribution: Conception and design, interpretation of results and critical manuscript
evaluation and editing.
I hereby certify that the statement of contribution is accurate and grant permission for
the publication to be included in the candidate’s thesis.
Signed Date 13/05/2014
Gary Wittert (Co-Author)
Contribution: Conception and design, interpretation of results, critical manuscript
evaluation and editing.
I hereby certify that the statement of contribution is accurate and grant permission for
the publication to be included in the candidate’s thesis.
Signed Date 13/05/2014

60
6.1 Chapter 6 Contextual Statement
In considering the concept that generational differences are shaped by distinctive
formative experiences and that this may affect health related behaviours and the
health status of the generations, it is essential to first consider the question; are there
differences in the health of Australia’s Baby Boomers and Generation Xers that are not
attributable to age?
Although the majority of this research is undertaken on South Australian data, a
national view of this question is warranted, given the potential implications of
generational health differences not caused by age. The aim of this study was to isolate
socio-demographic and health related differences associated with factors other than
age. It is possible that results of the same-age comparison may be attributable to
cohort or period effects, although the isolation of the difference in age-related health
is viewed as most important.
The following chapter presents the results of an exploration of socio-demographic and
health related differences of Baby Boomers and Generation Xers. This manuscript has
been published by PLOS One as of the 27th of March, 2014 and has been re-formatted
to meet the requirements of this thesis.

61
Are Baby Boomers healthier than Generation X? A profile of Australia’s working
generations using National Health Survey data.
Rhiannon Pilkington1*, Anne W Taylor1, Graeme Hugo2 & Gary Wittert3,4.
1 Population Research and Outcome Studies, Discipline of Medicine, The University of
Adelaide, Adelaide, South Australia, Australia
2 Australian Population and Migration Research Centre, The University of Adelaide,
Adelaide, South Australia, Australia
3 Discipline of Medicine, The University of Adelaide, Adelaide, South Australia,
Australia
4 Freemasons Foundation Centre for Men’s Health, University of Adelaide, Adelaide,
South Australia, Australia
*Corresponding author. Population Research and Outcome Studies, L3, 122 Frome
Street, Adelaide, South Australia, Australia, 5000. E-mail:

62
6.2 Abstract
Objective: To determine differences in sociodemographic and health related
characteristics of Australian Baby Boomers and Generation X at the same relative age.
Methods: The 1989/90 National Health Survey (NHS) for Boomers (1946-1965) and
the 2007/08 NHS for Generation Xers (1966-1980) was used to compare the cohorts at
the same age of 25-44 years. Generational differences for males and females in
education, employment, smoking, physical activity, Body Mass Index (BMI), self-rated
health and diabetes were determined using Z tests. Prevalence estimates and p-values
are reported. Logistic regression models examining overweight/obesity (BMI≥25) and
diabetes prevalence as the dependent variables, with generation as the independent
variable were adjusted for sex, age, education, physical activity, smoking and BMI
(diabetes model only). Adjusted odds ratios (OR) and 95% confidence intervals are
reported.
Results: At the same age, tertiary educational attainment was higher among
Generation X males (27.6% vs. 15.2% p<0.001) and females (30.0% vs. 10.6% p<0.001).
Boomer females had a higher rate of unemployment (5.6% vs. 2.5% p<0.001). Boomer
males and females had a higher prevalence of ‘excellent’ self-reported health (35.9%
vs. 21.8% p<0.001; 36.3% vs. 25.1% p<0.001) and smoking (36.3% vs. 30.4% p<0.001;
28.3% vs. 22.3% p<0.001). Generation X males (18.3% vs. 9.4% p<0.001) and females
(12.7% vs. 10.4% p=0.015) demonstrated a higher prevalence of obesity (BMI>30).

63
There were no differences in physical activity. Modelling indicated that Generation X
were more likely than Boomers to be overweight/obese (OR:2.09, 1.77-2.46) and have
diabetes (OR:1.79, 1.47-2.18).
Conclusion: Self-rated health has deteriorated while obesity and diabetes prevalence
has increased. This may impact on workforce participation and health care utilization
in the future.
64
6.3 Introduction
Change in population size and composition, lower workforce participation,
demographic ageing, an increase in life expectancy and a rise in chronic conditions are
some of the key challenges facing developed countries into the next decades1, 5, 142, 188-
190. The rise in chronic conditions is predicted to impact on workforce participation and
health expenditure thereby reducing the tax-base, threatening economic growth and
reducing the quality of life of those affected35. Baby Boomers comprise 25.3% and
Generation X 21.1% of Australia’s population respectively2. Given the size of these
generations, their continued health into older age is essential to ensure the stability of
Australia’s workforce and economy1. Baby Boomers, so named following the post-
World War II (WWII) rise in fertility were born from 1946 to 1965 (inclusive)15. They
were aged from 47 to 66 years in 2012 and beginning to enter the retirement phase of
life. Those in Generation X were born from 1966 to 1980 (inclusive) and were aged 32
to 46 years in 2012.
For Baby Boomers, the increase in life expectancy since the 1980s has not been
matched by improved quality of life, possibly because of the concomitant increase in
obesity35 and associated chronic disease34, 53, 103, 104. In general, Baby Boomers have
higher rates of many conditions such as arthritis, osteoporosis, circulatory conditions,
overweight, obesity and high blood pressure while Generation X have a higher
prevalence of smoking and anxiety, similar levels of psychological distress and better
self-rated health7, 191. In Australia, as elsewhere, obesity is increasing in younger

65
generations192 and therefore they may age with a greater burden of chronic disease
and poorer quality of life than the generation before them.
The present study examines the health status of Baby Boomers and Generation X at
the same age, using 1989/90 and 2007/08 National Health Survey data in order to
examine generational differences, irrespective of age.
6.4 Methods
The National Health Survey (NHS) is a population survey designed and conducted in
1989/90, 1995, 2001, 2004/05 and 2007/08 by the Australian Bureau of Statistics
(ABS), with the aim of obtaining information on a range of health related indicators.
For this study, a comparison of the 1989/90 and the 2007/08 NHS is undertaken.
The NHS was in the field from August 2007 until July 2008. To account for seasonal
variation in responses, interviewing times were randomly allocated to four periods. A
total of 19,979 households were selected to participate. Following sample loss 17,426
households formed the active sample with a response rate of 90.6% or 15,792
households responding to the survey184. A letter and an information brochure,
informing the dwelling of the upcoming survey and outlining their right to
confidentiality were mailed to all dwellings with complete postal addresses available.
Trained interviewers used Computer Assisted Interview technology to collect
information about one adult (18 years+) and one child selected randomly from the
household184. Missing data was not an issue for this analysis.

66
The 1989/90 NHS was conducted by the ABS from October 1989 to September 1990. A
total of 22,200 households were selected at random across Australia. A letter and
information brochure was posted to households informing them of their selection for
the survey and that an interviewer would be in contact. Trained ABS interviewers
interviewed persons aged 18 or older or from 15 to 17 years old with the consent of a
parent or guardian, in the selected households. A response rate of 96% was
attained193.
Variables
Education attainment, employment and smoking status, BMI, physical activity levels,
self-rated health and diabetes were able to be matched from the 2007/08 to the
1989/90 NHS, allowing a comparison between the generations. All data are self-report.
Education, BMI, smoking and self-rated health were subject to minor recoding to
ensure matching categories. Physical activity levels have been calculated by the
authors and diabetes was established using differently coded variables. The
employment variables did not need to be altered to match.
Education attainment was assessed by asking respondents to provide their current
study or highest non-school qualification, if respondents had not completed high
school or any qualifications post-high school, they were included in the category ‘no
non-school qualification’184. Respondents were classified as employed if they had a job
in the week prior to the survey, unemployed if they were actively seeking work and

67
not in the labour force if they met neither of those conditions184. Smoking status
(tobacco) was categorised into current smokers, ex-smokers if they had smoked at
least 100 cigarettes or other at least 20 times and non-smokers if they did not meet
this minimum criteria184.
Physical activity was assessed by asking respondents how much time they had spent
walking or doing moderate or vigorous exercise, in the two weeks prior to the survey.
The 2007/08 NHS specifically excludes “household chores, gardening or yard work” in
their questions on moderate on vigorous activity as types of exercise that could be
considered which the 1989/90 survey does not do. However, this was not viewed as a
significant barrier to matching the information although it is a potential limitation on
comparison. Physical activity levels were defined using the 2008 ABS guidelines184 and
were calculated using the following formula: number of times activity undertaken (in
last two weeks) x average time per session (minutes) x intensity. Intensity was defined
as 3.5 for walking, 5.0 for moderate exercise and 7.5 for vigorous exercise.
Respondents were grouped into four levels according to their score to correspond to
sedentary (<100), low (100 to <1600), moderate (1600 to 3200 or >3200 but <2 hours
of vigorous activity) and high (>3200 and >2 hours of vigorous activity) levels of
physical activity184.
Self-rated health status was determined by asking respondents if their health is
excellent, very good, good, fair or poor184. Height and weight were self-report at the
time of interview and BMI was defined using Quetelet’s body mass index calculated as

68
weight in kg divided by height (m2)75. Diabetes status was determined by asking
respondents if they had ever been told by a doctor or a nurse that they have diabetes
or high sugar levels in their blood or urine184. The variable available for the 2007/08
NHS is “Age first told had diabetes or high sugar levels” whilst the variable available
from the 1989/90 NHS is “Whether suffers from diabetes or hyperglycaemia”. All
respondents who reported an age or indicated they suffered from diabetes or
hyperglycemia were classified as having diabetes.
Analysis
The NHS uses a stratified, multi-staged, area sampling frame of private dwellings and
in order to produce unbiased estimates, this sampling technique needs to be taken
into account194. The sampling unit and stratification information is not included in the
datasets released by the ABS, rather a class of techniques called ‘replication methods’
are used to estimate variances for the complex sample design and weighting
procedure184, 195. The replicate weights are a series of variables that are calculated to
account for the design features and their values are based on the sampling and
stratification information196.
Analysis of the NHS data was undertaken using the 2007/08 and 1989/90
Confidentialised Unit Record File184, 193. The 2007/08 file contains replicate weights;
however the 1989/90 NHS is not released with the replicate weights. In order to
ensure these files were comparable the Jackknife (JK-1) method was used to calculate
replicate weights for the 1989/90 NHS using STATA IC 11196. JK-1 was the method

69
chosen as this is the method the ABS used for the 2007/08 calculation of replicate
weights184. The ABS also supplies a person weight, which is adjusted to enable
estimation of results for the total Australian population. For example, 20,788 persons
were interviewed for the 2007/08 NHS although the data provides weighted
population estimates with a total count of 20,643,100.
Applying both the person and replicate weights to the data, cross-tabulations were
undertaken to estimate standard errors and proportions. The Z test was used in
Microsoft Excel to produce p values adjusted for multiple comparisons using the Sidak
method, to compare the variables between the generations for males and females
(Table 6.1).
In 1989/90 Baby Boomers (1989/90 NHS n=5.3million) were aged 24/25 to 43/44 and
in 2007/08 Generation Xers (2007/08 NHS n=5.9million) were 27/28 to 41/42 years of
age. However, due to age only being available in pre-defined groupings, the
generations are compared when they were both aged 25 to 44 years.
Logistic regression models were then conducted to adjust for sex, age (5 year
groupings), education, smoking status, physical activity and BMI (diabetes model only)
when examining the relationship between generation membership, diabetes and
overweight/obesity in separate models, from 1989/90 and 2007/08. Table 6.2
presents results examining overweight/obesity using BMI as the dependant variable

70
and Table 6.3 presents results examining diabetes as the dependent variable, with
generation as the independent variable for both analyses.
6.5 Results
Comparisons between generations of the same relative age using the 1989/90 and
2007/08 National Health Surveys
Education, employment, smoking, BMI, physical activity, self-rated health and diabetes
prevalence were examined, by sex, when the generations are at the same relative age
of 25-44 years (Table 6.1), using 1989/90 NHS data for Baby Boomers and 2007/08
NHS data for Generation X.
Males
Significantly higher proportions of Generation X males reported attaining a Bachelor
degree or higher (27.6% vs 15.2% p<0.001), were classified as obese (18.3% vs 9.4%
p<0.001), had a low level of physical activity (36.6% vs 31.6% p=0.002) and reported
having diabetes (2.8% vs 1.0% p=0.001) as compared to Boomer males. As compared
to Generation X males, a greater proportion of Baby Boomer males reported being
employed (92.0% vs 89.7% p=0.024), a current smoker (36.3% vs 30.4% p<0.001) and
having ‘excellent’ self-rated health (35.9% vs 21.8% p<0.001).
Females
Generation X females were significantly more likely to have achieved an education
level of a Bachelor degree or higher (30.0% vs 10.6% p<0.001), report being employed

71
(75.2% vs 65.7% p<0.001), be classified as overweight (21.8% vs 17.6% p<0.001) or
obese (12.7% vs 10.4% p=0.015) and report having diabetes (7.6% vs 2.9% p<0.001)
compared to Boomer females. A higher proportion of Baby Boomer females reported
not being in the labour force (28.7% vs 22.3% p<0.001), being a current smoker (28.3%
vs 22.3% p<0.001) and having ‘excellent’ self-rated health (36.3% vs 25.1% p<0.001)
compared to Generation X females. No differences were demonstrated in physical
activity levels.
Multivariable analysis
Presented in Table 6.2, adjusted for sex, education, age, smoking status and physical
activity level, Generation Xers had greater odds of being overweight or obese (OR:
2.09, CI95% 1.77-2.46) and presented in Table 6.3, adjusted for sex, education, age,
smoking status, physical activity level and BMI, Generation X had greater odds of
diabetes (OR: 1.79, CI95% 1.47-2.18) compared to Baby Boomers, when both
generations were aged 25 to 44 years.
When the models were stratified by sex (not shown) the generational difference in
diabetes persisted for both males and females in the unadjusted but not in the
adjusted analysis. When age and education were included in the model, Generation X
females no longer demonstrated greater odds of diabetes (OR: 2.25, CI95% 0.87-5.82)
although the difference between Generation X and Boomers males remained
significant (OR:1.74, CI95% 1.11-2.74). The generational difference in overweight and

72
obesity remained significant for males and females in unadjusted and adjusted
stratified analysis.
6.6 Discussion
Compared at the same relative age of 25 to 44 years Generation X had a higher
prevalence of obesity and diabetes compared to Boomers. This was independent of
sex, age within that distribution, education, smoking status, physical activity and BMI
(diabetes model only). Boomers also demonstrated better self-rated health at the
same relative age, although this was unadjusted for demographic factors. This
suggests that Generation X may be developing the lifestyle related conditions of
obesity and diabetes sooner when compared to Baby Boomers.
When the sexes were examined separately, the prevalence of obesity was higher in
males as compared to females although the prevalence of diabetes was lower. The
difference in obesity prevalence is supported by figures from the Australian Institute
of Health and Welfare which demonstrates that males in Australia have a higher
prevalence of overweight and obesity compared to females5. Despite this, diabetes
prevalence was lower in men compared to women, although Australian prevalence
data from the ABS illustrates that diabetes prevalence is greater in men197. Population
studies from England and the USA have demonstrated that prevalence of undiagnosed
diabetes is higher in men than in women198, 199 and a higher prevalence of
undiagnosed diabetes among men in this sample may help explain this result although
this cannot be confirmed.

73
When the regression model examining diabetes was stratified by sex and adjusted for
age and education, Generation X females no longer had significantly greater odds of
diabetes compared to Boomers of the same age. However, despite the non-
significance of the result, the odds ratio increased and the confidence intervals
widened, suggesting the reduction in sample size and the design effects from the
complex sampling strategy the ABS employs, may have been responsible for altering
this result for females.
This study adds to the growing evidence suggesting that successive cohorts are
developing obesity and related chronic conditions earlier in the life course38, 43, 51, 200,
201. At the same relative age Baby Boomers in the USA200 and the United Kingdom32
have been shown to have a greater prevalence of obesity than the older generation
(born 1926-1945), associated with more disability and chronic conditions, including
diabetes and hypertension. Lee et al. conducted an age, period and birth cohort
analysis of individuals in the USA from 1971-2006 and demonstrated that in younger
cohorts, obesity is occurring earlier in the life course accompanied by the premature
development of conditions such as type II diabetes and arthritis, usually considered to
be diseases of ageing43. Furthermore, an Australian study examining age, period and
cohort contributions to the prevalence of overweight and obesity concluded that more
recently born cohorts are at greater risk of overweight51.

74
That the younger generation were more likely to report worse self-rated health at the
same age as Baby Boomers, may be linked to the significant increase in obesity.
Previous studies have demonstrated that obesity, sedentary behaviour and stress are
all related to poor self-rated health67-69. It could be theorised that this is due to
comorbid conditions as opposed to weight, although research has demonstrated the
association between obesity and self-rated health persists irrespective of chronic
condition status68, 69.
The physical activity and food environment has changed drastically over the past
decades to one in which transport options encourage sedentary behaviour and food
high in fat and sugar is often more readily available than a healthier alternative114, 139,
140. This may account for why the younger generation are developing an unhealthy
weight at an earlier age. Alternative explanations for the cohort differences in obesity
include the idea that psychosocial and socioeconomic stressors in early life may play a
role in obesity development. The Boomer experience of post WWII prosperity may
mean they experienced less psychosocial and socioeconomic stress compared to other
generations201, 202. Keith et al. also explore the prospect that an increase in sleep debt,
endocrine disruptors and maternal age at birthing are plausible contributors to the
obesity epidemic136.
Together, these generations form 76.7% of Australia’s labour force29 and there is
potential for obesity related health-problems to propel an early workforce exit49.
Should successive cohorts continue to develop what were once considered age related

75
conditions earlier, the consequences for healthcare costs will only increase further, at
a younger age203, 204.
Limitations
Due to the restrictions in the data granted from the ABS, we were not able to match
the generational cohorts by exact birth years for the NHS analysis. Therefore, the ages
the cohorts were compared at do not perfectly reflect the true birth years. Although
the effect of this on observed generational differences is difficult to estimate, the
balance of the age group is made up of the generations in question. We believe that
this enables us to make inferences about generational differences although it would
have been ideal to examine exact birth cohorts. Additionally, income and alcohol
consumption could not be examined for the same age analysis due to significant
alterations in the manner the survey assessed the variable. Self-report data was used
to calculate BMI and this may have resulted in an underestimation of overweight and
obesity, as individuals are prone to underestimate their weight and overestimate their
height205. All other variables were also derived from self-reported information and this
has inherent limitations in terms of potential for social desirability bias and issues with
inaccurate recall. Physical activity in particular may be vulnerable to inaccuracies
created by individual perception of what constitutes moderate or vigorous exercise184.
Furthermore, the difference in the physical activity question specification for the
1989/90 and 2007/08 surveys may have affected responses to the questions and
therefore this comparison should be interpreted with caution. Despite this, the
generational perspective provides important insights into the development of health

76
in the cohorts across the time span and matches a large range of variables across the
NHS surveys.
6.7 Conclusion
Generation X are becoming obese and developing a higher prevalence of diabetes at
an earlier age than their predecessors and this may be reflected in their self-reported
health status. The current study adds to previous research38, 43, 51, 201, demonstrating
successive generations are developing chronic conditions earlier. If this is to continue
there will be significant implications for workforce capacity, health care utilisation and
therefore health costs. There is a clear need for continued investment in preventative
strategies targeting lifestyle chronic conditions, particularly programs and policies to
tackle the increase in unhealthy weight at a population level.
Acknowledgements: The authors gratefully acknowledge and thank Graeme Tucker
and Eleonora Dal Grande for providing statistical advice.

77
Table 6.1: A health profile of Generation X (aged 25-44 years) and Baby Boomers (aged 25-44 years) at the same age using 2007/08 NHS data and 1989/90 NHS data from the Australian Bureau of Statistics
Males Females
Generation X in
2007/08 (n=2,949,678)
Baby Boomers in 1989/90
(n=2,702,515)
Generation X in 2007/08
(n=2,972,344)
Baby Boomers in 1989/90
(n=2,658,560)
% S.E. % S.E. % S.E. % S.E.
Education#
Bachelor degree or higher 27.6 0.009 15.2 0.013
***
30.0 0.009 10.6 0.009
**
Certificate/diploma/trade cert. 37.9 0.010 44.2 0.010
***
30.5 0.010 35.3 0.010
***
Other/certificate not defined 1.4 0.002 0.8 0.001
1.7 0.002 1.4 0.001
No non-school qualification 33.1 0.010 39.7 0.009
***
37.9 0.011 52.6 0.015
***
Employment
Employed 89.7 0.007 92.0 0.005 * 75.2 0.011 65.7 0.010 ***
Unemployed 3.0 0.004 4.1 0.003 * 2.5 0.003 5.6 0.003 ***
Not in labour force 7.3 0.006 3.8 0.003 *** 22.3 0.012 28.7 0.009 ***
Smoking
Current smoker 30.4 0.009 36.3 0.007 *** 22.3 0.008 28.3 0.006 ***
Ex-Smoker 26.0 0.010 23.1 0.005 * 25.2 0.009 18.9 0.005 ***
Never smoked 43.5 0.010 40.6 0.007 52.5 0.009 52.8 0.008
BMI#
Underweight (<18.50) 1.2 0.003 2.0 0.002 2.7 0.003 7.1 0.003 ***
Normal weight (18.50 to <25.00) 33.2 0.010 52.8 0.008
***
45.1 0.011 64.9 0.009
***
Overweight (25.00 to <30.00) 37.3 0.010 35.8 0.007
21.8 0.009 17.6 0.006
***
Obese (>30.00) 18.3 0.008 9.4 0.005 *** 12.7 0.006 10.4 0.005 ***
Physical activity#
Sedentary 32.1 0.010 34.9 0.011 33.2 0.010 35.6 0.011
Low 36.6 0.013 31.6 0.007 ** 43.0 0.010 39.0 0.008 *
Moderate 21.4 0.011 22.6 0.006 19.1 0.009 20.8 0.007
High 9.9 0.008 10.9 0.005 4.7 0.004 4.6 0.003
Self-rated health (SF36)
Excellent 21.8 0.010 35.9 0.009 *** 25.1 0.010 36.3 0.011 ***
Very good/good 68.8 0.012 52.4 0.007 *** 65.8 0.011 51.0 0.009 ***
Fair 7.6 0.007 10.2 0.004 ** 7.1 0.007 10.8 0.004 ***
Poor 1.8 0.003 1.5 0.002 2.0 0.003 1.9 0.002
Diabetes
Yes 2.8 0.003 1.0 0.001 ** 7.6 0.005 2.9 0.002 ***
No 97.2 0.003 99.0 0.001 ** 92.4 0.005 97.1 0.002 ***
#NA or ‘level not determined’ categories not included *p<0.05 ** p<0.01 ***p<0.001

78
Table 6.2: Logistic regression analysis of the association between overweight and obesity (BMI≥25.00) and generation membership of Generation X (aged 25-44 years 2007/08 NHS data) and Baby Boomers (aged 25-44 years 1989/90 NHS data) using data from the Australian Bureau of Statistics
Model 1 Model 2 (adj. age, sex,
education)
Model 3 (adj. age, sex,
education, smoking, physical
activity)
Generation OR (95% CI) p value OR (95% CI) p value OR (95% CI) p value
Baby Boomers 1.00 (ref) 1.00 (ref) 1.00 (ref)
Generation X 1.89 (1.72-2.09) <0.001 2.10 (1.82-2.44) <0.001 2.09 (1.77-2.46) <0.001
Table 6.3: Logistic regression analysis of the association between diabetes and generation membership of Generation X (aged 25-44 years 2007/08 NHS data) and Baby Boomers (aged 25-44 years 1989/90 NHS data) using data from the Australian Bureau of Statistics
Model 1 Model 2 (adj. age, sex,
education)
Model 3 (adj. age, sex,
education, smoking, physical
activity & BMI)
OR (95% CI) p value OR (95% CI) p value OR (95% CI) p value
Generation
Baby Boomers 1.00 (ref) 1.00 (ref) 1.00 (ref)
Generation X 1.92 (1.60-2.29) <0.001 2.05 (1.13-3.71) 0.019 1.79 (1.47-2.18) <0.001

79
Chapter 7 JOB STRAIN, OCCUPATION,
PSYCHOLOGICAL DISTRESS AND RISK OF HIGH
WAIST CIRCUMFERENCE

80
7.0 Statement of Authorship
Title of Paper: “Job strain, occupation, psychological distress and risk of high waist
circumference in Baby Boomers and Generation X.”
Publication status: Submitted to the American Journal of Public Health 26/3/14
Author Contributions
Rhiannon Pilkington (Candidate)
Contribution: Conception and design, acquisition of data, data analysis, interpretation
of results, drafting the article, critically revising and performing revisions.
I hereby certify that the statement of contribution is accurate and grant permission for
the publication to be included in the candidate’s thesis.
Signed Date 13/05/2014
Anne Taylor (Co-Author)
Contribution: Acquisition of data, interpretation of results and critical manuscript
evaluation and editing.
I hereby certify that the statement of contribution is accurate and grant permission for
the publication to be included in the candidate’s thesis.
Signed Date 13/05/2014

81
Graeme Hugo (Co-Author)
Contribution: Acquisition of data, interpretation of results and critical manuscript
evaluation and editing.
I hereby certify that the statement of contribution is accurate and grant permission for
the publication to be included in the candidate’s thesis.
Signed Date 13/05/2014
Gary Wittert (Co-Author)
Contribution: Conception and design, acquisition of data, interpretation of results,
critical manuscript evaluation and editing.
I hereby certify that the statement of contribution is accurate and grant permission for
the publication to be included in the candidate’s thesis.
Signed Date 13/05/2014

82
7.1 Chapter 7 Contextual Statement
Having established that there are generational differences in health irrespective of age,
the question regarding work related influences on health needed to be addressed.
The decision was made to examine the relationships between work related stress,
psychological distress, occupation and obesity as defined by Waist Circumference for
Baby Boomers and Generation X. This was based on the fact work related stress is the
second greatest cause of workers compensation in Australia206 and occupation
provides an overview of specific job characteristics that may impact negatively on
weight.
We utilised data from the NOBLE study to examine generational differences in work
related influences on obesity and highlight specific groups that should be targeted in
health promotion and obesity prevention policies and programs.
The following chapter has been submitted for publication with the American Journal of
Preventive Medicine although it has not been accepted as of the 7th of May, 2014.

83
Job strain, occupation, psychological distress and risk of high waist circumference in
Baby Boomers and Generation X.
Rhiannon Pilkington, 1* Anne W Taylor, 1 Graeme Hugo2 & Gary Wittert3,4.
1 Population Research and Outcome Studies, Discipline of Medicine, The University of
Adelaide, Adelaide, South Australia, Australia
2 Australian Population and Migration Research Centre, The University of Adelaide,
Adelaide, South Australia, Australia
3 Discipline of Medicine, The University of Adelaide, Adelaide, South Australia,
Australia
4 Freemasons Foundation Centre for Men’s Health, University of Adelaide, Adelaide,
South Australia, Australia
*Corresponding author. Population Research and Outcome Studies, L3, 122 Frome
Street, Adelaide, South Australia, Australia, 5000. E-mail:
84
A Pilkington, R., Taylor, A.W., Hugo, G. & Wittert, G. (2014) Job strain, occupation, psychological distress and risk of high waist circumference in Baby Boomers and Generation X. American Journal of Public Health, (In publication)
NOTE:
This publication is included on pages 84-106 in the print copy of the thesis held in the University of Adelaide Library.

107
Chapter 8 EMPLOYMENT TRANSITIONS AND
CHRONIC CONDITIONS IN BABY BOOMERS
AND GENERATION X

108
8.0 Statement of Authorship
Title of Paper: “Employment transitions and chronic conditions in Baby Boomers and
Generation X: A South Australian cohort study.”
Publication status: Not yet submitted
Author Contributions
Rhiannon Pilkington (Candidate)
Contribution: Conception and design, acquisition of data, data analysis, interpretation
of results, drafting the article, critically revising and performing revisions.
I hereby certify that the statement of contribution is accurate and grant permission for
the publication to be included in the candidate’s thesis.
Signed Date 13/05/2014
Anne Taylor (Co-Author)
Contribution: Conception and design, acquisition of data and critical manuscript
evaluation and editing.
I hereby certify that the statement of contribution is accurate and grant permission for
the publication to be included in the candidate’s thesis.
Signed Date 13/05/2014

109
Graeme Hugo (Co-Author)
Contribution: Acquisition of data, interpretation of results and critical manuscript
evaluation and editing.
I hereby certify that the statement of contribution is accurate and grant permission for
the publication to be included in the candidate’s thesis.
Signed Date 13/05/2014
Gary Wittert (Co-Author)
Contribution: Conception and design, acquisition of data, interpretation of results,
critical manuscript evaluation and editing.
I hereby certify that the statement of contribution is accurate and grant permission for
the publication to be included in the candidate’s thesis.
Signed Date 13/05/2014

110
8.1 Chapter 8 Contextual Statement
The previous findings that Generation X are developing a greater prevalence of obesity
and diabetes earlier in the life-course than Baby Boomers, coupled with the
differential affects that work stress has on the generations, has led to consideration of
the policy relevant consequences of these differences, in terms of workforce
participation.
Part of the overarching framework for this research illustrated the relationships
between work, obesity and comorbidities and the work related outcomes of
absenteeism and presenteeism. These outcomes were conceptualised as policy
relevant economic and productivity consequences of ill-health for businesses and for
government. Although there were insufficient data on work absences to explore the
relationship between health and absenteeism directly, the possibility of investigating
the relationship between employment transitions and health presented itself as an
alternative avenue to investigate policy and productivity relevant costs associated with
chronic conditions.
The following chapter therefore focuses on the exploration of the relationships
between generation membership and employment transitions with obesity and
commonly associated comorbidities including diabetes, depression and arthritis.

111
Employment transitions and chronic conditions in Baby Boomers and Generation X:
A South Australian cohort study
Rhiannon Pilkington1*, Anne W Taylor 1, Graeme Hugo2 & Gary Wittert3,4.
1 Population Research and Outcome Studies, Discipline of Medicine, The University of
Adelaide, Adelaide, South Australia, Australia
2 Australian Population and Migration Research Centre, The University of Adelaide,
Adelaide, South Australia, Australia
3 Discipline of Medicine, The University of Adelaide, Adelaide, South Australia,
Australia
4 Freemasons Foundation Centre for Men’s Health, University of Adelaide, Adelaide,
South Australia, Australia
*Corresponding author. Population Research and Outcome Studies, L3, 122 Frome
Street, Adelaide, South Australia, Australia, 5000. E-mail:
112
8.2 Abstract
Objective: To investigate differences in the relationship between change in work
status over time, and obesity and common comorbidities in Baby Boomers and
Generation X.
Methods: This study uses data from n=312 Generation Xers (born 1966-1980), n=508
late Baby Boomers (born 1956-1965) and n=611 early Baby Boomers (born 1946-1955)
who participated in stage 2 and 3 of the North West Adelaide Health Study in 2004 to
2006 and 2008 to 2010. Logistic regression was used to explore the relationships
between sex, generation, employment transitions, Type 2 diabetes mellitus (T2DM),
depression, arthritis and obesity (BMI ≥ 30) with and without comorbidities in
separate models. Adjustment was made for a range of socio-demographic variables
and physical activity.
Results: No relationships between generation and the chronic conditions were
demonstrated in adjusted analyses. Not working at time 1 and 2 was associated with
higher odds of T2DM (3.43, 1.88-6.27), depression (3.13, 2.05-4.79), arthritis (2.94,
1.98-4.38) and obesity with comorbidities (1.86, 1.30-2.65). Increased odds of T2DM
(2.74, 1.37-5.47) and depression (2.99, 1.82-4.92) were illustrated in those who moved
out of the labour force. Maintaining part-time work (1.79, 1.12-2.86) and moving from
full to part-time work (2.26, 1.25-4.10) showed higher odds of depression, while
moving from being out of the labour force into full-time work (3.36, 1.49-7.56) showed
higher odds of arthritis.

113
Conclusion: Exiting or remaining out of the labour force is associated with the
presence of T2DM, depression, arthritis and obesity without selected comorbidities.
As this may have substantial consequences for workforce participation direction of
causality requires further exploration.

114
8.3 Introduction
In Australia, there is a focus on increasing national productivity and workforce
participation to foster economic growth over the coming decades1, 188. In order to
achieve this, both increased and sustained workforce participation is required and it
has been proposed that female and older worker participation in the workforce needs
to increase drastically188 and transitioning into retirement must be encouraged to
increase part-time workforce participation247.
The extent to which the increasing prevalence of obesity and associated comorbidities
are barriers to ongoing workforce participation is unknown. However, there is
evidence that poor health in general is associated with workforce exit. An Australia
wide survey conducted in 2012-2013 demonstrated that of Australians who retired
before 65 years of age (over 75% of all Australians), 53.4% of males and 32.7% of
females reported ‘sickness, injury or disability’ as the reason they terminated their last
job248. A recent prospective study showed that poor health increases the likelihood of
labour force exit before reaching retirement age230. Additionally, previous research
has also shown that exiting the labour force is associated with poor mental health249,
250 and poor self-reported health231, 251.
This study examines only Baby Boomers (born 1946 to 1965) and Generation X (born
1966 to 1980) as they form 77% of Australia’s labour force29 and the prevalence of
overweight and obesity for these generations is 75% and 66% respectively7. We
investigate the relationship between change in work status from time 1 and time 2

115
and obesity and common comorbidities (T2DM, depression, arthritis). Analysis utilises
a South Australian cohort study limited to Baby Boomers and Generation Xers in order
to explore generational differences within Australia’s working population.
8.4 Methods
Data Source
The North West Adelaide Health Study (NWAHS) is a longitudinal cohort of 4056
randomly selected adults aged 18 years and over, who, at the time of recruitment
lived in the northern or western regions of Adelaide185. These areas include
approximately half of Adelaide’s population and reflect the demographic profile of
South Australia223. Households were selected using the electronic white pages and the
last person aged 18 or over to have had a birthday was interviewed and invited to
attend a hospital based clinic for a biomedical examination223. Telephone interviews
are undertaken by professional interviewers, accredited under the International
Standard for Market Opinion and Social Research.
As of 2014, there have been three stages of data collection all involving a clinic
assessment, telephone interview and a self-report questionnaire. From the eligible
sample selected in 1999 (n=8213), 5850 were initially interviewed and 4056 attended
the clinic for a biomedical examination resulting in a response rate of 69.4% for the
clinic. Further, 3622 respondents participated in the telephone follow up resulting in a
91.7% response rate for the interview. Stage 2 of the study was conducted from 2004
to 2006. Of the eligible sample, 79.0% of participants attended the clinic, 86.3%

116
completed the CATI and 80.3% completed the self-report questionnaire. This resulted
in an overall participation rate of 79.7%185. Stage 3 collected data from 2008 to 2010
using the same methods with 73.0% of eligible respondents responding to the CATI,
71.1% completing the self-report questionnaire and 67.0% attending the clinic. A total
of 2871 participants were interviewed or attended the clinic. Every effort is made to
ensure the participants are contacted in the same order as previous stages to maintain
the four year follow up period223.
Sample
The present analysis uses clinic and self-reported data from stage 2 and 3 of the
cohort study including only Baby Boomers (born 1946-1965) and Generation Xers
(born 1966-1980) who had data available for both stage 2 and stage 3 of the cohort
study (n=1431). The older generation has been split into early (1946 to 1955) and late
(1956 to 1965) Baby Boomers in recognition of within generational differences, given
the size and age range of the cohort. Stage 2 is also referred to as Time 1 and Stage 3
as Time 2.
Ethics approval for each stage of data collection was obtained from the Queen
Elizabeth Hospital Human Research Ethics Committee. Further details of the study can
be found in previously published work185, 223.
Variables

117
The prevalence of diabetes at stage 3 was defined as clinic-measured fasting plasma
glucose level of at least 7.0mmol/L, or those who self-reported being told by a doctor
they had diabetes.
Depression was defined as a score of 16 or higher on the Centre for Epidemiological
Studies Depression Scale (CES-D)252. Respondents answered 20 questions in relation to
symptoms associated with depression at stage 3 of the study.
The prevalence of arthritis at stage 3 was obtained from self-report response to a
telephone interview. Respondents were asked if they had osteoarthritis, rheumatoid
arthritis, another form of arthritis or if they did not know what type they had. A ‘yes’
to any of these questions was classified as ‘arthritis’.
Obesity was defined using the Body Mass Index (BMI) score derived from height and
weight measurements taken in the clinic at Stage 3223. A BMI of ≥30.00 (weight
kg/(height m2)) was classified as obese as per the World Health Organisation’s
recommendations62.
Changes in work status were derived from self-reported work status at stage 2 and 3.
Respondents were categorised into one of eight categories:
1) Stable full time work;
2) Stable part time work;
3) Stable not in the labour force;

118
4) Not in the labour force to part time;
5) Not in the labour force to full time;
6) From part to full time;
7) From full to part time; and
8) Employment to not in the labour force.
Not in the labour force (NILF) includes respondents who reported work status as home
duties, retired, unemployed, student, unable to work or volunteer.
Weight gain was derived by using clinic-measured body weight in kilograms, to
calculate percentage weight gain from stage 2 to 3. Percentage weight change was
dichotomised into weight increase of ≥5% of body weight.
Physical activity levels of sedentary, low, moderate and high at Stage 2 were
determined from a self-report questionnaire which asked about the amount and time
spent walking, or undertaking moderate or vigorous activity within the last two weeks.
Physical activity levels were defined using the formula “e * t * i” where e was number
of times spent walking or undertaking moderate of vigorous activity, t was the average
amount of time spent on each session and i was the weighted intensity score for type
of exercise (3.5 for walking, 5.0 for moderate exercise and 7.5 for vigorous exercise). A
sedentary level of activity equated to a score of less than 100, including a score of 0,
low activity a score of 100 to less than 1600, moderate activity a score of 1600 to 3200
or more than 3200 but with less than two hours of vigorous exercise and a high level
of activity was classified as a score of at least 3200 with two or more hours of vigorous

119
activity223. These questions were also used in the 2001 and 2004 Australian National
Health Survey and coding followed the same methodology253.
Sex was self-reported at Stage 1 of the study and marital status, education level and
household income are included from self-report data at Stage 2. The Generation
groups were categorised according to self-reported date of birth.
Statistical analysis
Binary logistic regression was conducted to analyse the relationships between sex,
generation membership, employment transitions (stage 2 to 3) and weight gain (stage
2 to 3) with the prevalence of T2DM, depression, arthritis and obesity with and
without comorbidities at stage 3, in respective models. IBM SPSS Version 19.0 was
used for all analyses.
8.5 Results
Table 8.1 demonstrates the characteristics of the sample by generation and shows
that overall the study population consisted of 53.5% females, 42.7% early Baby
Boomers and 45.2% of all respondents remained in stable full time work over the four
years between stages. Late Baby Boomers were most likely to have remained in stable
full time work (41.4%) while early Baby Boomers were most likely to have stayed out
of the labour force (70.3%) over the duration of the study compared to the other
generational groups. The highest proportion of those with T2DM, depression, arthritis
and obesity were early Baby Boomers (62.0%; 44.7%; 65.7%; 45.8%), while the highest

120
proportion of respondents with obesity and no comorbid diabetes, depression or
arthritis were late Baby Boomers (41.9%).
Unadjusted and adjusted multivariable analysis of the relationships between sex,
generation membership, employment transitions, weight gain and T2DM, depression
and arthritis prevalence at stage 3, are displayed in Table 8.2 and 8.3. Table 8.4
presents associations with obesity and obesity excluding comorbid cases with T2DM,
depression or arthritis.
Type 2 Diabetes Mellitus
Adjusted results illustrated females had a lower likelihood of having T2DM (OR 0.54
CI95% 0.34-0.85). Respondents who were stable NILF (OR 3.43 CI95% 1.88-6.27) or
moved from being employed to NILF (OR 2.74 CI95% 1.37-5.47) were more likely to
have T2DM. In the unadjusted model, both early (OR 3.79 CI95% 1.68-8.55) and late
(OR 3.06 CI95% 1.32-7.09) Baby Boomers had a greater likelihood of having T2DM
although this result attenuated once socio-demographics and year of birth were
included in the model. There was no relationship between weight gain and T2DM.
Depression
Stable part-time work (OR 1.79 CI95% 1.12-2.86), stable NILF (OR 3.13 CI95% 2.05-
4.79), moving from full to part-time work (OR2.26 CI 95% 1.25-4.10) or from
employment to NILF (OR 2.99 CI95% 1.82-4.92) had greater odds of depressive

121
symptoms. Weight gain of at least 5% also demonstrated greater likelihood of
depressive symptoms (OR 1.40 CI95% 1.05-1.88).
There was no significant relationship between sex and depressive symptoms. Early
Baby Boomers (OR 2.77 CI95% 1.02-7.55) had greater odds of depressive symptoms.
Arthritis
Respondents who were stable NILF (OR 2.94 CI95% 1.98-4.38) or moving from NILF
into full-time work (OR 3.36 CI95% 1.49-7.56) were more likely to have arthritis. The
unadjusted model showed that early (OR 5.00 CI95% 3.25-7.70) and late Baby
Boomers (OR 2.04 CI95% 1.29-3.23) as well as those who moved from employment to
NILF (OR 1.89 CI95% 1.17-3.05) showed an increased likelihood of having arthritis
although these results did not persist in the adjusted model.
Obesity
Separate models were undertaken to explore the relationships between sex,
generation, employment transitions and weight gain with obesity with comorbidities
and obesity without selected comorbidities. Both analyses are presented in Table 8.4.
Respondents who were stable NILF (OR 1.86 CI95% 1.30-2.65) and those who had
gained ≥5% of their body weight (OR 2.11 CI95% 1.66-2.68) had greater odds of BMI
defined obesity. In unadjusted analyses early (OR 1.44 CI95% 1.06-1.97) and late Baby
Boomers (OR 1.42 CI95% 1.04-1.93) were more likely to be obese.
122
After exclusion of those classified as obese with comorbid T2DM, arthritis or
depression (n=289) weight gain was significantly associated with obesity (OR 1.72
CI95% 1.28-2.32) in adjusted analyses. There were no relationships between sex,
generation membership or employment transition with the prevalence of obesity
without comorbidities.
8.6 Discussion
The main finding of this study of Baby Boomers and Generation Xers in South Australia,
demonstrates that not participating in the labour force is positively associated with
the presence of T2DM, depression, arthritis and obesity. Additionally, moving from
employment to out of the labour force is associated with T2DM and depression.
Generational differences were shown in the unadjusted analyses of relationships with
T2DM, arthritis and obesity. These findings suggest workforce exit or not being in the
labour force may be related to the presence of chronic conditions.
This provides support for the theory that the increasing prevalence of obesity142 and
associated comorbidities may constitute a substantial barrier to working life. While the
majority of previous research has focused on the relationship between health and
work status at a single point in time, of those studies examining change in work status,
there is support for our main finding that not working or moving out of the labour
force is related to ill health231, 249. Ki et al. show that transitions from employment into
unemployment and inactivity (defined as withdrawal from the workforce) over a one-

123
year period, were affected by self-reported general health, using data from the British
Household Panel Survey 1991 to 2007231. Another study using the same survey data
from 1991 to 1998 found that becoming unemployed was associated with an increase
in psychological distress249.
Research demonstrating negative changes in employment status are associated with
risky health behaviours such as decreased sleep and physical activity, as well as
increased alcohol consumption, are suggestive of a pathway from unemployment to
chronic conditions caused by unhealthy behaviours254. Alternatively, work or the
workplace may impact negatively on health in a way that promotes the development
of obesity and comorbid conditions. Au and colleagues have recently demonstrated in
a longitudinal cohort of Australian women, that stable full-time work255 and longer
work hours256 have a positive relationship with weight gain. This highlights a further
possibility that chronic conditions operate as health selection factors out of the
workforce.
Research into the relationships between work and chronic conditions suggest possible
explanations for the relationships seen in the current study 230, 251, 257, 258 . Analysis of
2003 national self-report data from the Australian Bureau of Statistics has shown
45.6% of workforce exit before age 65 was due to a chronic health condition251 and ill
health has been shown to increase the risk of labour force exit in a prospective study
on Dutch workers with a ten-year follow-up period230. T2DM prevalence and related
factors such as side effects from diabetic medications have been shown to increase

124
levels of absenteeism and work impairment, reducing productivity and affecting the
probability of employment257, 258. Studies by Robroek and colleagues have also
demonstrated obesity is associated with the duration and likelihood of taking sick
leave259, of exiting the workforce with a disability pension260 and that poor health
plays a role in labour force exit261. A relationship between economic inactivity and
depression has also been demonstrated, although direction of causation remains
unclear, as there is evidence for depression preceding unemployment and vice
versa262. Weight gain was also associated with increased odds of depression in the
present study, which is possibly a result of the bi-directional relationship between
obesity and depression244.
The associations between employment transitions and arthritis may seem
contradictory as both stable NILF and moving from NILF to full-time work
demonstrated around three times greater odds of having arthritis. It may be that the
association of workforce re-entry with arthritis is the result of temporary work loss
associated with disease characteristics263, although this cannot be confirmed in the
current study. Further, the number of cases in this category is quite small so this result
should be interpreted with caution. Australian estimates suggest the risk of being out
of the labour force is three times higher for those with arthritis251 and labour force
participation rates are significantly lower in people with rheumatoid arthritis
compared to the general population264. However, in this study we cannot confirm type
of arthritis.

125
Weight gain and stable NILF were both factors that had increased odds of obesity.
Once respondents with obesity and the comorbidities of T2DM, depression or arthritis
were excluded from analysis, this relationship did not persist and only weight gain was
significantly associated with obesity. This highlights the possibility that obesity related
chronic conditions may have a mediating role in the relationship between obesity and
workforce participation, although obesity may be the initial causal factor.
Differences by generation membership were demonstrated with unadjusted analysis
showing that both early and late Baby Boomers were more likely to be obese and have
arthritis and diabetes. That these differences did not persist after the addition of a
range of covariates to the model suggests these factors may mediate the relationship
between generation membership and chronic condition prevalence. The descriptive
statistics demonstrate late Baby Boomers are more likely to be obese without
comorbidities compared to the early Baby Boomers, suggesting that the length of time
at an unhealthy weight may relate to the development of comorbidities.
Investigations into the effect unemployment has on health have shown
unemployment or being economically inactive is related to an increased risk of all-
cause mortality265, 266 and poor psychological and physical health191, 250. However,
there is no examination of pre-existing health conditions operating as a selection
factor into unemployment. It is possible mortality risk increases with unemployment
because poor-health has forced workforce exit. As Ki notes, health is a necessary
precondition for economic activity231.

126
The exact timing of these transitions within the four year period is unknown and
therefore the precise temporal association between the employment transitions and
chronic conditions is unable to be established. We also would have liked to include
cardiovascular disease in this study. However, the low prevalence of CVD meant this
was not possible. It also cannot be ignored a significant proportion of the sample
(39.5%) had to be excluded due to missing data. Loss to follow-up in cohort studies is a
widespread issue, although it is encouraging previous work has demonstrated that
only minimal bias results from participant loss267, 268 and does not necessarily affect
analysis of causal associations269. The relatively small sample size also places
limitations on potential generalisability. It would be ideal for the longitudinal
relationship between chronic condition diagnosis and employment transitions to be
examined in a larger cohort of Australian workers. Additionally, investigation of
change in work status and incidence of chronic conditions will enable temporal order
to established. The present study did not have a large enough sample to examine
incidence. However, the in-clinic measured height and weight and diabetes diagnosis
are all significant strengths of the study.
Although we cannot ascribe causation, possible implications of these findings include
the potential for the rise in chronic conditions to affect future workforce participation
as ill-health may force early workforce exit.

127
8.7 Conclusion
This study raises to possibility that the increase in obesity prevalence and comorbid
conditions may affect workforce participation. Premature workforce exit affects both
individual savings for retirement and national productivity levels and comes at a
significant personal cost to the individual270-272. With the recent increase in the
pension qualification in Australia from age 65 to 67133, the need to create
preconditions for healthy ageing are more relevant than ever. The institution of
workplace policies that accommodates increased flexibility to enable longer working
life despite ill-health would benefit the economy and the individual. Additionally,
policy and program efforts to halt and reduce the continuing rise in chronic conditions,
particularly obesity, need to be ramped up if they are to improve the health and
working life of the ageing Baby Boomer generation.

128
Table 8.1: Characteristics of participants by generation group
Generation X 1966-1980
N=312
Late Baby Boomers 1956-1965
N=508
Early Baby Boomers 1946-1965
N=611
n % (95% CI) n % (95% CI) n % (95% CI) Total n %
Sex
Male 160 24.1 (21.0 - 27.5) 229 34.4 (30.9 - 38.1) 276 41.5 (37.8 - 45.3) 665 100.0
Female 152 19.8 (17.2 - 22.8) 279 36.4 (33.1 - 39.9) 335 43.7 (40.3 - 47.3) 766 100.0
Employment transition (T2 to T3)^
Stable full time work 161 24.9 (21.7 - 28.4) 268 41.4 (37.7 - 45.3) 218 33.7 (30.2 - 37.4) 647 100.0
Stable part time work 37 20.8 (15.5 - 27.3) 72 40.4 (33.5 - 47.8) 69 38.8 (31.9 - 46.1) 178 100.0
Stable NILF 26 12.4 (8.6 - 17.6) 36 17.2 (12.7 - 22.9) 147 70.3 (63.8 - 76.1) 209 100.0
NILF to part time 11 26.8 (15.7 - 41.9) 18 43.9 (29.9 - 59.0) 12 29.3 (17.6 - 44.5) 41 100.0
NILF to full time 12 34.3 (20.8 - 50.8) 15 42.9 (28.0 - 59.1) 8 22.9 (12.1 - 39.0) 35 100.0
From full to part time 20 20.0 (13.3 - 28.9) 47 47.0 (37.5 - 56.7) 33 33.0 (24.6 - 42.7) 100 100.0
From part to full time 17 22.1 (14.3 - 32.5) 19 24.7 (16.4 - 35.4) 41 53.2 (42.2 - 64.0) 77 100.0
Employment to NILF 15 13.4 (8.3 - 20.9) 25 22.3 (15.6 - 30.9) 72 64.3 (55.1 - 72.6) 112 100.0
Weight gain (T2 to T3)^
Have not gained 5% 210 20.8 (18.4 - 23.4) 348 34.5 (31.6 - 37.5) 451 44.7 (41.7 - 47.8) 1009 100.0
Gained ≥5% weight 102 24.2 (20.3 - 28.5) 160 37.9 (33.4 - 42.6) 160 37.9 (33.4 - 42.6) 422 100.0
Diabetes^
No 305 22.9 (20.7 - 25.2) 477 35.8 (33.3 - 38.5) 549 41.2 (38.6 - 43.9) 1331 100.0
Yes 7 7.0 (3.4 - 13.7) 31 31.0 (22.8 - 40.6) 62 62.0 (52.2 - 70.9) 100 100.0
Depression^
No 250 21.9 (19.6 - 24.4) 410 35.9 (33.2 - 38.8) 481 42.2 (39.3 - 45.0) 1141 100.0
Yes 56 21.1 (16.6 - 26.3) 91 34.2 (28.8 - 40.1) 119 44.7 (38.9 - 50.7) 266 100.0
NILF: Not in the labour force; GX: Generation X; BB: Baby Boomer ^ Missing not displayed

129
Table 8.1: Characteristics of participants by generation group continued
Generation X 1966-1980 Late Baby Boomers 1956-1965 Early Baby Boomers 1946-1965
n % (95% CI) n % (95% CI) n % (95% CI) Total n %
Arthritis
No 268 26.4 (23.8 - 29.2) 398 39.3 (36.3 - 42.3) 348 34.3 (31.5 - 37.3) 1014 100.0
Yes 29 8.7 (6.2 - 12.3) 85 25.6 (21.2 - 30.6) 218 65.7 (60.4 - 70.6) 332 100.0
Obesity
No 221 24.0 (21.3 - 26.8) 323 35.0 (32.0 - 38.2) 378 41.0 (37.9 - 44.2) 922 100.0
Yes BMI ≥30.00 91 17.9 (14.8 - 21.4) 185 36.3 (32.3 - 40.6) 233 45.8 (41.5 - 50.1) 509 100.0
Obesity no diabetes, depression, arthritis
No 252 21.3 (19.0 - 23.7) 405 34.2 (31.5 - 36.9) 528 44.6 (41.7 - 47.4) 1185 100.0
Yes 60 24.4 (19.4 - 30.1) 103 41.9 (35.9 - 48.1) 83 33.7 (28.1 - 39.9) 246 100.0

130
Table 8.2: Multivariable associations of sex, generation, employment transition and weight gain with unadjusted and adjusted analysis of the prevalence of diabetes and depression at T3
Diabetes Diabetes adjusted^ Depression Depression adjusted^
OR (95% CI) P OR (95% CI) P OR (95% CI) P OR (95% CI) P
Sex
Male 1.00 1.00 1.00 1.00
Female 0.57 (0.36-0.89) 0.014 0.54 (0.34-0.85) 0.008 1.03 (0.76-1.41) 0.831 1.02 (0.75-1.39) 0.881
Generation
GX 1966-1980 1.00 1.00 1.00 1.00
BB 1956-1965 3.06 (1.32-7.09) 0.009 1.49 (0.47-4.77) 0.500 1.01 (0.69-1.47) 0.967 1.86 (0.99-3.48) 0.053
BB 1946-1955 3.79 (1.68-8.55) 0.001 1.02 (0.18-5.83) 0.983 0.90 (0.62-1.3) 0.575 2.77 (1.02-7.55) 0.046
Employment transition (T2 to T3)
Stable full time work 1.00 1.00 1.00 1.00
Stable part time work 0.61 (0.20-1.82) 0.375 0.60 (0.20-1.80) 0.360 1.82 (1.14-2.90) 0.012 1.79 (1.12-2.86) 0.015
Stable NILF 3.98 (2.22-7.14) <0.001 3.43 (1.88-6.27) <0.001 2.88 (1.89-4.37) <0.001 3.13 (2.05-4.79) <0.001
NILF to part time 2.04 (0.58-7.18) 0.268 1.91 (0.54-6.80) 0.315 1.53 (0.67-3.50) 0.310 1.59 (0.70-3.65) 0.270
NILF to full time 0.76 (0.10-5.82) 0.793 0.73 (0.10-5.66) 0.767 1.10 (0.41-2.94) 0.844 1.10 (0.41-2.96) 0.852
From full to part time 2.01 (0.88-4.59) 0.098 1.99 (0.87-4.56) 0.105 1.55 (0.88-2.71) 0.128 1.55 (0.89-2.73) 0.125
From part to full time 0.57 (0.13-2.45) 0.448 0.57 (0.13-2.47) 0.454 2.20 (1.22-3.98) 0.009 2.26 (1.25-4.10) 0.007
Employment to NILF 3.00 (1.52-5.93) 0.002 2.74 (1.37-5.47) 0.004 2.74 (1.68-4.47) <0.001 2.99 (1.82-4.92) <0.001
Weight gain (T2 to T3)
Have not gained 5% 1.00 1.00 1.00 1.00
Gained ≥5% weight 1.01 (0.63-1.62) 0.961 1.02 (0.63-1.64) 0.944 1.43 (1.07-1.91) 0.014 1.40 (1.05-1.88) 0.023
^Baseline household income, education, physical activity level, marital status and year of birth included in the model NILF: Not in the labour force; GX: Generation X; BB: Baby Boomer

131
Table 8.3: Multivariable associations of sex, generation, employment transition and weight gain with unadjusted and adjusted analysis of the prevalence of arthritis at T3
Arthritis Arthritis adjusted^
OR (95% CI) P OR (95% CI) P
Sex
Male 1.00 1.00
Female 1.29 (0.96-1.74) 0.089 1.26 (0.93-1.71) 0.129
Generation
GX 1966-1980 1.00 1.00
BB 1956-1965 2.04 (1.29-3.23) 0.002 0.57 (0.29-1.12) 0.103
BB 1946-1955 5.00 (3.25-7.7) <0.001 0.47 (0.17-1.31) 0.149
Employment transition (T2 to T3)
Stable full time work 1.00 1.00
Stable part time work 1.20 (0.75-1.90) 0.448 1.25 (0.79-2) 0.343
Stable NILF 3.43 (2.34-5.04) <0.001 2.94 (1.98-4.38) <0.001
NILF to part time 1.40 (0.63-3.12) 0.414 1.33 (0.59-3.01) 0.494
NILF to full time 3.11 (1.41-6.87) 0.005 3.36 (1.49-7.56) 0.003
From full to part time 1.21 (0.69-2.11) 0.500 1.21 (0.69-2.11) 0.507
From part to full time 1.16 (0.62-2.16) 0.646 1.17 (0.62-2.18) 0.633
Employment to NILF 1.89 (1.17-3.05) 0.009 1.61 (0.98-2.62) 0.058
Weight gain (T2 to T3)
Have not gained 5% 1.00 1.00
Gained ≥5% body weight 1.00 (0.74-1.34) 0.993 1.06 (0.79-1.44) 0.690
^Baseline household income, education, physical activity level, marital status and year of birth included in the model NILF: Not in the labour force; GX: Generation X; BB: Baby Boomer

Table 8.4: Multivariable associations of sex, generation, employment transition and weight gain with unadjusted and adjusted analysis of the prevalence of obesity and obesity excluding cases with comorbid diabetes, depression or arthritis at T3
Obesity Obesity adjusted^ Obesity no comorbidities Obesity no comorbidities
adjusted^
OR (95% CI) P OR (95% CI) P OR (95% CI) P OR (95% CI) P
Sex
Male 1.00 1.00 1.00 1.00
Female 0.82 (0.64-1.06) 0.128 0.82 (0.64-1.06) 0.124 0.78 (0.57-1.07) 0.125 0.79 (0.58-1.09) 0.150
Generation
GX 1966-1980 1.00 1.00 1.00 1.00
BB 1956-1965 1.44 (1.06-1.97) 0.021 1.24 (0.75-2.06) 0.406 1.09 (0.76-1.56) 0.650 0.99 (0.54-1.82) 0.971
BB 1946-1955 1.42 (1.04-1.93) 0.026 1.06 (0.47-2.38) 0.895 0.74 (0.51-1.07) 0.112 0.62 (0.23-1.69) 0.351
Employment transition (T2
to T3)
Stable full time work 1.00 1.00 1.00 1.00
Stable part time work 1.07 (0.73-1.58) 0.727 1.07 (0.73-1.58) 0.727 0.77 (0.47-1.26) 0.305 0.66 (0.40-1.08) 0.099
Stable NILF 1.93 (1.36-2.74) <0.001 1.88 (1.32-2.69) <0.001 0.70 (0.43-1.14) 0.153 0.85 (0.38-1.94) 0.702
NILF to part time 1.35 (0.69-2.63) 0.377 1.35 (0.69-2.62) 0.384 0.90 (0.40-2.04) 0.801 0.60 (0.22-1.66) 0.329
NILF to full time 0.89 (0.41-1.91) 0.764 0.85 (0.39-1.85) 0.691 0.66 (0.25-1.74) 0.399 0.75 (0.42-1.35) 0.344
From full to part time 1.08 (0.68-1.71) 0.744 1.07 (0.67-1.69) 0.780 0.77 (0.43-1.37) 0.375 0.53 (0.25-1.15) 0.107
From part to full time 0.94 (0.55-1.60) 0.822 0.96 (0.56-1.63) 0.868 0.52 (0.24-1.12) 0.096 0.74 (0.42-1.33) 0.320
Employment to NILF 1.51 (0.98-2.31) 0.059 1.48 (0.97-2.28) 0.072 0.77 (0.43-1.37) 0.367 0.66 (0.40-1.08) 0.099
Weight gain (T2 to T3)
Have not gained 5% 1.00 1.00 1.00 1.00
Gained ≥5% weight 2.08 (1.64-2.64) <0.001 2.10 (1.65-2.67) <0.001 1.71 (1.28-2.30) <0.001 1.71 (1.27-2.29) <0.001
^Baseline household income, education, physical activity level, marital status and year of birth included in the model NILF: Not in the labour force; GX: Generation X; BB: Baby Boomer

SECTION III
DISCUSSION
Chapter 9 DISCUSSION, FUTURE DIRECTIONS
AND CONCLUSIONS

135
9.0 Discussion
In this thesis I have explored and demonstrated generational differences in health
status, the effect work related factors have on obesity and the relationship between
economic inactivity and workforce exit with health. In sum, Generation X have reached
a higher prevalence of obesity and diabetes with lower self-rated health and
demonstrate a greater likelihood of WC defined obesity if working in the community
and personal services sector or in a low strain, passive or high strain job compared to
Baby Boomers. Furthermore, staying out of, or exiting the labour force is strongly
related to the prevalence of diabetes, depression, arthritis and obesity.
The implications for these findings revolve around four specific themes; capacity for
healthy ageing, social inequalities of health as well as workforce participation and
supply.
9.1 Healthy ageing?
As life expectancy in Australia has increased, so too has the number of years spent in
retirement. Life expectancy in Australia (excluding Aboriginal and Torres Strait
Islanders) is among the highest in the world273. It is estimated that as of 2009, the
oldest Baby Boomers (born 1946-48) had gained approximately 17 years in additional
life expectancy273, while late Baby Boomers (born 1965) are estimated to have gained
approximately 45 years of additional life expectancy15 from when they were born.

136
The increase in life expectancy can be partly attributed to improved living standards
and medical advances23. Higher levels of education and the halving of smoking rates
from 30% in 1985 to 15% in 20105 are also important contributors. The decline in lung
cancer incidence in males, circulatory disease deaths and stroke mortality seen over
the past decades has been largely attributed to this decrease in smoking5. The first
study in this thesis demonstrates that at the same age, 15.2% and 10.6% of male and
female Baby Boomers had attained a Bachelor degree or higher education, while
27.6% and 30.0% of Generation X males and females respectively had achieved the
same. Prevalence of current smoking in the generations dropped from 36.3% to 30.4%
in Baby Boomer and Generation X males while in females it dropped from 28.3% to
22.3%. However, despite these results illustrating the drop in smoking prevalence and
the increase in education attainment, there is every probability the rise in overweight
and obesity is offsetting these successes.
Over the same period that smoking has decreased, obesity and overweight has more
than doubled in the adult population. The 1980 Australian NHS showed the prevalence
of overweight and obesity among adults was 26.7%274, while the most recent National
survey from 2011 has demonstrated a prevalence of 63.4%6. Subsequently, there is
also evidence the greatest contributors to burden of disease in Australia are changing.
In 2003, the greatest contributor to disease burden in Australia was tobacco smoking,
followed by high blood pressure and overweight/obesity275. As of 2006 high BMI was
the leading independent contributor to burden of disease in Western Australia276 and
by 2010 high BMI was demonstrated to be the leading risk factor for Australasia277.

137
Although Australian-specific burden of disease has not been estimated recently, we
would infer from these trends overweight and obesity is now the largest, preventable
contributor to the burden of disease in Australia.
Related to this, healthy life expectancy has not increased at the same rate as absolute
life expectancy. Recent estimates from the 2010 Global Burden of Disease Study278
show healthy life expectancy in Australia is 68.4 and 71.8 years for males and females
respectively, while absolute life expectancy is 79.2 and 83.8 years278. Given that
overweight and obesity may be the largest contributor to burden of disease in
Australia, it is reasonable to suggest this may be the most significant barrier to healthy
ageing, given the potential effect on quality of life73. Obesity can affect quality of life
through the previously mentioned avenues involving the development of comorbid
conditions such as diabetes279, depression72, musculoskeletal conditions and CVD280
and also increases the risk of falls in the elderly281. Additionally, the lifespan of
someone who is severely obese is around eight to 10 years shorter than someone of
normal BMI, which is similar to the years of life lost by smokers282. Estimates suggest
57.9% of Australian’s aged 60 years and over are living with two or more chronic
conditions283. The prevalence of obesity in Generation X in 2008 of 18.3% for males
and 12.7% for females as demonstrated in study one, does not bode well for future
development of comorbid conditions. A recent study supports this, demonstrating
younger Australians are also at significant risk of compromised quality of life as 32.1%
of those aged 40 to 59, are also living with multi-morbidity283.

138
The consequences of overweight and obesity in terms of disease burden, which in turn
compromises capacity for healthy ageing, may have overshadowed the benefits that
have arisen as a result of decreased smoking and increased levels of education.
Absolute life expectancy is lengthening but healthy life expectancy is not. The first
study has demonstrated the increase in obesity is not solely the result of an ageing
demographic but that the environment and cohort specific characteristics have also
played a role. If these results extrapolate to future generations, serious structural
changes to the environment will need to be considered.
9.2 Widening the ‘gap’ - Obesity related social inequalities
Socioeconomic and demographic factors have been included in all studies in this thesis,
however, the relationship between obesity and social inequality has not been explored.
A serious concern is that the increase in overweight and obesity is being seen
disproportionately in the most disadvantaged sectors of society. Theoretically, there is
potential for this to widen the gap between the least and most disadvantaged.
Although the high prevalence of overweight and obesity means that different social
groups are all affected to varying extents, existing evidence has demonstrated the
highest BMI’s are more likely to exist within the lowest educated and poorest sections
of society284-286. A recent review of the relationship between education attainment
and obesity found that an inverse association between education and obesity is more
likely in high income countries, although effect size differs by sex287. The same can be
said for the relationship between socioeconomic status (SES) and obesity, though the

139
inverse relationship is much stronger among women288. Australian data has shown
obesity is much more prevalent among people living in the most disadvantaged areas
and that fall within the lowest SES quintile5. While these associations are consistent
and strong, they do not address the question of causality. Prospective studies have
found that low education and SES predict weight gain over time289, 290. However, there
is also evidence overweight and obesity affect education achievement and likelihood
of marriage, as well as household income from a study following a group of 16 to 24
year olds over nine years from 1981291.
Stigma can be conceptualised as the development and propagation of stereotypes,
status degradation and discrimination292. Obesity and overweight are both highly
stigmatised conditions293, a social consequence of excess weight that can lead to poor
health outcomes292. Blaming obesity on individual characteristics is a major source of
stigma and discrimination294. There is evidence stigma can cause social isolation,
participation in risky health behaviours such as smoking and alcohol consumption295,
negative self-perception296, 297 and stress292. Studies examining American attitudes to
obesity have shown obesity was most often attributed to lack of willpower298, 299 and
insufficient exercise299. The consequences of weight-related stigma are at least
partially responsible for the disadvantage gradient seen in the occurrence of
overweight and obesity and a strong contributor to the perpetuation of inequality300.
The media also plays an important role in shaping perception of social issues, with
research demonstrating most television media covering obesity portrays it as the
result of individual action centered mostly on diet301. Further, there is evidence that
140
TV shows such as The Biggest Loser reinforce concepts of individual control and blame,
perpetuating ‘anti-fat’ attitudes302, 303. Despite the negative effect stigma has on
individuals, there has been little consideration of this as a causal factor that should be
treated with similar importance as nutrition and physical activity.
Further potential for widening inequality can be seen in the financial consequences of
obesity related discrimination. A German study has demonstrated wage and job
attainment discrimination negatively impacts upon obese females304. A longitudinal
American study also showed obese individuals experience a persistent wage
disadvantage of up to 6.3%, independent of health limitations305. This is also
supported by analysis of the European SHARE data, which illustrated obesity is
associated with higher unemployment and 10% less salary, although the earning result
was only seen in females306. The effect of BMI on occupational attainment has also
been demonstrated to be significant in females only307. As these relationships have
been shown to be stronger or exist only in females suggests that females are more
vulnerable to weight related financial disadvantage and discrimination. Obesity may
also act as a health selector out of the workforce230, 261, which could impact on further
weight gain, given the relationship between unemployment, financial resources,
depression and weight308, 309.
Environmental characteristics have also been demonstrated to influence health with a
social disadvantage gradient as the effect of the built environment on obesity risk is
more likely to be seen in disadvantaged areas310. Disadvantaged neighbourhoods are

141
more likely to have reduced access to supermarkets, open green spaces and safe
places to exercise311. They are often characterised by fewer opportunities to
participate in physical activity due to lack of facilities312, lower levels of physical
activity313 and reduced access to healthy food outlets314. Possibly reflecting this,
groups of higher socioeconomic disadvantage have also been shown to consume less
fruit and vegetables315.
Stigma, the associated discrimination and unhealthy surroundings are all factors that
combine to perpetuate a cycle of disadvantage related to obesity. Built environment
influences on health including land-mix, healthy food supply and availability of
facilities that promote physical activity can be altered through local and state
government regulation and intervention316. The vulnerability to discrimination in the
workforce seen particularly in obese women, needs to be addressed through
education and policy in the first instance with the potential for legislation. The culture
of individual blame for obesity and resultant stigma particularly, needs to be
addressed.
9.3 Workforce participation and supply
A core policy question for all levels of Australian government is ‘How can we improve
workforce participation, keep Baby Boomers in the workforce longer and prevent
health related workforce exit in the younger generations?’

142
From the research presented in this thesis, there is support for the hypothesis that
work and the workplace is affecting the health of the generations differently. Evidence
presented that the workplace is affecting the likelihood of overweight and obese
through job strain, occupation and psychological distress in the younger generation
suggests avenues of prevention within the workplace still need to be pursued. That
Generation X is reaching a higher prevalence of obesity and diabetes earlier in life, and
chronic conditions are strongly associated with workforce exit, also calls for
prevention strategies to be married with management strategies, to promote longer
working life in the high proportion of individuals already managing chronic conditions.
Possible consequences for these findings exist in terms of workforce participation and
supply. In the short to medium-term there is the possibility the younger generation
will exit the workforce for health related reasons, earlier than their predecessors.
Following this, a worse-case scenario could manifest into significant workforce supply
shortages, propelled by the increase in what are largely preventable chronic
conditions.
As of 2013, there is considerable evidence demonstrating workforce exit can be
propelled by health related factors. A comprehensive overview of the retirement
intentions and status of the Australian population is provided by an ABS survey
conducted from July 2012 to June 2013 with 8,300 Australian residents aged 15 or
over248. Of Baby Boomers aged 55 to 64 in 2012/13, the average age of intended
retirement was 65.6 for males and 64.8 for females. This compares to an actual
143
average retirement age for those aged 45 years and over of 58.5 years for men and 50
years of age for women. Of those who retired before 65 years of age (over 75% of all
retirees), 53.4% of males and 32.7% of females reported their ‘own sickness, injury or
disability’ as the reason for terminating their last job248. However, a more recent
picture of those who had retired since 2007/08 illustrated the average age of actual
retirement for men was 63.3 years and 59.6 years for women, demonstrating later
retirement ages in more recent cohorts. In 2011, only 61.1% of 55 to 64 year olds were
employed in Australia317. Although this is the highest proportion of workforce
participation seen in this age cohort, there is substantial capacity for improvement.
Moreover, comparable countries such as New Zealand demonstrate significantly
higher participation rates among 60 to 64 year olds (78.9%) and Australia is lagging
behind other OECD countries with female participation rates of over 55 year olds318.
This, coupled with the high proportion of health propelled workforce exit, points to
the significant capacity to increase working life by improving health and workforce
ability to retain workers who are managing their health conditions.
As previously discussed, premature retirement affects personal financial resources and
national productivity levels270-272. Prior to workforce exit, the effect of chronic disease
on productivity is also significant. The 2004/05 National Health Survey assessed days
away from work as a result of illness319. During the fortnight prior to the survey, males
and females with one chronic disease averaged 0.55 and 0.41 days away respectively.
Of those with three or more chronic conditions, males had two days off work while
females had less than one day off work within the previous fortnight319. This translates

144
to approximately 500,000 days lost per fortnight. Access Economics estimates
productivity costs related to obesity incorporating the flow-on affects due to comorbid
diabetes, CVD, osteoarthritis and cancer at $3.6 billion in 2008271. Although no sex
differences exist in the present research to support this, the sex differences in the
absenteeism rates suggest females respond differently and perhaps manage multi-
morbidity better than males. This is particularly interesting given the stronger
relationships between weight and discrimination seen in women as discussed
earlier304, 306, 307.
Multiple policy driven changes have been instituted to promote and encourage an
increased working life317. In 2009 a ‘work bonus’ was introduced to allow pensioners
to continue receiving a proportion of their pension if they returned to part-time work.
Related to this, retirees can also now receive all of their superannuation and work full-
time if they wish247. The eligibility criterion for the disability pension has also been
tightened to align with a substantial reduction in working capacity. Importantly, in
2011 an Age Discrimination Commissioner was appointed to identify barriers to
mature worker employment and how to remove them320. Incentives have also been
introduced to encourage employers to hire and retain older workers317. Further to this,
increasing the pension eligibility age to 67 years by 2023 and raising the age at which
superannuation can be accessed without severe tax penalties to 60 by 2025 will
influence financial-based retirement decisions. To increase self-funding of retirement
the compulsory superannuation contribution will gradually be raised from 9 to 12% by
2019247. All of these changes have been designed to increase capacity for self-funded

145
retirement and encourage greater participation in the workforce for older Australians
in a relatively short time frame.
Work has been conducted proposing why mature age workforce participation will
continue to rise and common themes include the move away from manual work, the
increase in levels of education which is highly correlated with workforce participation,
and the increasing health of successive cohorts will positively impact on participation
rates247, 318. Health is acknowledged to be the most important contributor to
workforce participation in older age groups247, 318. Heady and colleagues propose that
if population health is improved based on estimates of increased life expectancy, then
participation rates will increase for all older (55+) age groups by at least 2%247.
However, whilst the increasing level of education is supported by the current research,
the supposition that successive cohorts will be healthier than previous cohorts is not.
In terms of increasing population health, the National Partnership Agreement on
Preventive Health has been created by the Council of Australian Government (COAG)
to coordinate targeted interventions designed to address the rising prevalence of
chronic conditions321. In terms of preventing early workforce exit due to ill-health
$216.8 million in funding has been allocated to the state and territory governments to
fund the implementation of health promotion in workplaces321. The focus of these
interventions are to address overweight and obesity, physical activity, smoking,
nutrition and alcohol abuse. The South Australian initiative is focusing on
implementing programs through a top-down approach with industry, associations or

146
unions leading the implementation of policies and programs designed to create a
health promoting culture322. Progress, reach and effect of this program have yet to be
evaluated so unfortunately, there is little information about the success of the
initiative thus far, although as the aims are for long-term sustainable change it may be
some years until this can be detected. However, in relation to the current research it
is apparent there are generational differences in how work affects health. Although
we can only theorise as to the causal mechanisms involved in the differences seen in
the relationships between job strain, occupation and obesity seen in the second study,
it highlights the need to consider these differences in workplace promotion and
programs aimed at improving health. Also, given that all forms of job strain bar active
jobs (high demands, high control) demonstrated greater odds of obesity, that this
initiative is not targeting mental health including work stress, is concerning. In addition,
the third study of this thesis demonstrates the strong relationship between workforce
exit or economic activity with chronic conditions and this highlights that for many Baby
Boomers who are already out of the workforce, this initiative will have no effect.
9.4 Limitations
There are a number of factors that were not within the scope of the present research,
which could be examined to further elaborate on the relationships between work and
health. Health behaviours were only included in analyses as potential confounders, not
as potential outcomes of work-related factors that may lead to obesity. However,
previous exploration of the effect of work on health related behaviours has shown
only partial and inconsistent support for the association between psychosocial work

147
factors and risky health behaviours such as smoking, low physical activity and poor
nutrition175, 208, 212, 323. Additionally, there are a multitude of work-related factors that
may influence health, including the location and size of the workplace, workplace
policies, management and co-worker support, hours worked, commuting time and job
security, that were unable to be examined. Many of these factors will constitute the
basis of future exploration into the influences of work on health. Despite this, a
strength of this research is the multi-faceted view of obesity in Baby Boomers and
Generation X. Use of multiple data sources has allowed investigation into the health
related generational differences at a national level, followed by a closer examination
of work related influences on obesity and the associations between employment
transitions and health. This has provided an overview of generational differences and
illustrated groups that should be targeted in work-related health promotion and
programs, as well as highlighted the potential productivity and workforce participation
costs of chronic conditions.
9.5 Future directions
Future directions for research focusing on the health of Baby Boomers and Generation
X and work related factors include extending the work of the first study to compare
Baby Boomers and Generation X with Generation Y, to determine if the successive
cohort or environment effect of a higher prevalence of chronic conditions earlier, is
continuing.
148
There is also a need to elucidate the causal pathways that resulted in the differential
effects of work and workplace on the health of the generations. We theorised that the
effect of occupation and job strain categories on WC defined obesity may reflect
differences in perceptions of the workplace, or lifecourse differences in the potential
effect of work and workplace on weight. Examination of this relationship in a larger
longitudinal sample with additional information to understand why work and the
workplace might affect the respective generation’s health differently would enable
tailoring of workplace health promotion campaigns and programs.
An exploration of the reasons behind employment transitions across the generations
would allow differentiation of voluntary and involuntary transitions, which may be
related to carer responsibilities, ill-health or labour market forces. This would help
target policies towards specific causes of workforce exit.
Additionally, whilst not within the scope of the current work, the ageing of the Baby
Boomers is going to force structural changes to the aged care system due to the size of
the generation. Expectations of aged care are also expected to differ given the
uniqueness of the Baby Boomer generation and their desire for independence4.
Research exploring future expectations and perceptions of needs will allow proactive
changes to be made as aged care services grow.
Future research could also examine the uptake of workplace health programs and
interventions and how this differs by generation to allow better targeting of programs.
149
Related to this, an investigation into the sex differences demonstrated in absenteeism
rates for people with multimorbidity may highlight avenues to reduce the impact
chronic conditions have on productivity.
9.6 Conclusion
The causal factors involved in the increasing prevalence of obesity as discussed, are
extremely complex. This thesis has demonstrated cohort, environment and work
related influences. Overall it appears if obesity continues to rise in prevalence earlier
in the lifecourse the consequences for health, workforce participation and economic
growth will become untenable. Importantly, there are opportunities to affect change.
Workplace focused interventions provide a key opportunity to improve adult health
and thereby workforce participation, although generational differences in the work
experience should be taken into account. Moreover, a focus on management of
workers with chronic conditions and increased flexibility may prevent workforce exit
due to ill-health. There is a clear need for management to accompany prevention
efforts, as it is unlikely current efforts will reduce the high prevalence of chronic
conditions to such an extent that it no longer affects productivity. Furthermore, efforts
must be made to reduce the stigma associated with excess weight and to address the
potential for widening inequalities caused by this epidemic.

References 1. Commonwealth of Australia. Australia to 2050: future challenges. Barton, ACT: 2010. 2. Australian Bureau of Statistics. Population - age in Australia. Canberra: ABS, 2012. 3. Australian Institute of Health and Welfare. Older Australia at a Glance 4th edition. Canberra: AIHW, 2007. 4. Productivity Commission. Caring for older Australians Final Inquiry Report. Canberra: 2011 53. 5. Australian Institute of Health and Welfare. Australia's health 2012. Canberra: AIHW, 2012 13. Cat. no. AUS 156. 6. Australian Bureau of Statistics. Australian Health Survey: First Results 2011-2012. ABS, 2013 Contract No.: 4364.0.55.001. 7. Australian Institute of Health and Welfare. Australia's health 2010. Canberra: AIHW, 2010. 8. Bengtson B, Furlong M, Laufer R. Time, Aging and the continuity of social structure: Themes and issues in generational analysis. Journal of Social Issues. 1974;30(2):1-30. 9. Eyerman RT, B. S. Outline of a Theory of Generations. European Journal of Social Theory. 1998;1(1):91-106. 10. Schuman H, Scott J. Generations and Collective Memories. Am Sociol Rev. 1989;54(June):359-81. 11. Pilcher J. Mannheim's sociology of generations: an undervalued legacy. The British Journal of Sociology. 1994;45(3):481-95. 12. Phillips TW, M. Social change and social identity : postmodernity, reflexive modernisation and the transformation of social identities in Australia. In: Devine F, editor. Rethinking class : culture, identities and lifestyles. New York: Palgrave Macmillan; 2005. p. 163 - 85. 13. Mannheim K. Essays on the sociology of knowledge. London: Routledge and Kegan Paul Ltd; 1952. 327 p. 14. Benson JB, M. Generations at work: are there differences and do they matter? The International Journal of Human Resource Management. 2011;22(9):1843-65. 15. Australian Bureau of Statistics. South Australia's Baby Boomers: A Profile. Canberra: ABS, 2003 4149.4.55.001. 16. Australian Bureau of Statistics. Reflecting a Nation: Stories from the 2011 Census. 2012 2071.0. 17. Australian Bureau of Statistics. Australian Social Trends 2004. 2004. 18. Commonwealth of Australia. Australian Social Policy 2002-2003. 2004. 19. Australian Bureau of Statistics. A picture of the Nation: the Statistician's report on the 2006 Census, 2006. Canberra: ABS, 2006 2070.1. 20. Australian Bureau of Statistics. Australian Social Trends 2002. Canberra: Commonwealth of Australia; 2002. 21. McCallum AJ. What will we do with the Baby Boomers? . Australian Population Association, Population and Globalisation: Australia in the 21st Century; 28th November to 1st December; Melbourne, Australia: RMIT University; 2000. 22. Australian Bureau of Statistics. Australian Social Trends 1994. Canberra: ABS, 1994 4102.0.

151
23. Pool I. Australian Population Association Borrie Lecture 2006. The Baby Boom in New Zealand and Other Western Developed Countries Journal of Population Research. 2007;24(2):141-61. 24. Brown K. Key Experiences of Baby Boom Cohorts. Australian Social Policy 2002 - 2003, 2004. 25. Wallace JE. Work commitment in the legal profession: a study of Baby Boomers and Generation Xers. International Journal of the Legal Profession. 2006;13(2):137-51. 26. Sirias D, Karp HB, Brotherton T. Comparing the levels of individualism/collectivism between Baby Boomers and Generation X. Management Research News. 2007;30(10):749-61. 27. Wyn J, Woodman D. Generation, Youth and Social Change in Australia. J Youth Stud. 2006;9(5):495-514. 28. Jorgensen B. Baby Boomers, Generation X and Generation Y? Policy implications for defence forces in the modern era. Foresight. 2003;5(4):41-9. 29. 2006 Census of Population and Housing Labour Force Status by AGE and Sex [database on the Internet]. Australian Bureau of Statistics 2006 [cited 24/09/2012]. Available from: http://www.censusdata.abs.gov.au/ABSNavigation/prenav/ViewData?action=404&documentproductno=0&documenttype=Details&order=1&tabname=Details&areacode=0&issue=2006&producttype=Census 30. Australian Bureau of Statistics. Australian Social Trends April 2013. ABS, 2013 4102.0. 31. Bittman M, Hill T, Thomson C. The Impact of Caring on Informal Carers' Employment, Income and Earnings: a Longitudinal Approach. Aust J Soc Issues. 2007;42(255-272):255-72. 32. Rice NE, Lang IA, Henley W, Melzer D. Baby boomers nearing retirement: the healthiest generation? Rejuvenation Res. 2010;13(1):105-14. 33. Martin LG, Freedman VA, Schoeni RF, Andreski PM. Health and Functioning Among Baby Boomers Approaching 60. Journals of Gerontology Series B-Psychological Sciences and Social Sciences. 2009;64(3):369-77. 34. Buckley J. Baby boomers, obesity and social change. Obesity Research and Clinical Practice. 2008;2:73-82. 35. Humpel N, O'Loughlin K, Wells Y, Kendig H. The health of Australian baby boomers. Australasian Journal on Ageing. 2010;29(1):8-13. 36. Weir D. Are Baby Boomers living well longer? In: Madrian B, Mitchell OS, Soldo BJ, editors. Redefining retirement: How will Boomers fare? New York: Oxford University Press; 2007. p. 99-111. 37. IOM. The future of disability in America. Washington, D.C.: Institute of Medicine, 2007. 38. Leveille SG, Wee CC, Iezzoni LI. Trends in obesity and arthritis among baby boomers and their predecessors, 1971-2002. Am J Public Health. 2005;95(9):1607-13. 39. Gregg EW, Cheng YJ, Narayan KM, Thompson TJ, Williamson DF. The relative contributions of different levels of overweight and obesity to the increased prevalence of diabetes in the United States: 1976-2004. Prev Med. 2007;45(5):348-52.

152
40. Ogden CL, Carroll MD, Curtin LR, McDowell MA, Tabak CJ, Flegal KM. Prevalence of overweight and obesity in the United States, 1999-2004. JAMA. 2006;295(13):1549-55. 41. Singh GK, Kogan MD, van Dyck PC. Changes in state-specific childhood obesity and overweight prevalence in the United States from 2003 to 2007. Arch Pediatr Adolesc Med. 2010;164(7):598-607. 42. Ryan DH, Kushner R. The state of obesity and obesity research. JAMA - Journal of the American Medical Association. 2010;304(16):1835-6. 43. Lee JM, Pilli S, Gebremariam A, Keirns CC, Davis MM, Vijan S, et al. Getting heavier, younger: Trajectories of obesity over the life course. Int J Obesity. 2010;34(4):614-23. 44. Lang IA, Rice NE, Wallace RB, Guralnik JM, Melzer D. Smoking cessation and transition into retirement: analyses from the English Longitudinal Study of Ageing. Age Ageing. 2007;36(6):638-43. 45. Wilson DM, Palha P. A systematic review of published research articles on health promotion at retirement. J Nurs Scholarship. 2007;39(4):330-7. 46. McMurdo ME. A healthy old age: realistic or futile goal? BMJ. 2000;321(7269):1149-51. 47. National Obesity Obeservatory. About Obesity. 2010 [cited 2011 21/03/2011]; Available from: http://www.noo.org.uk/NOO_about_obesity/. 48. Quine S, Carter S. Australian baby boomers' expectations and plans for their old age. Australasian Journal on Ageing. 2006;25(1):3-8. 49. Hugo G, Taylor A, DalGrande E. Are baby boomers booming too much? An epidemiological description of overweight and obese baby boomers. Obes Res Clin Pract 2008;2:203-14. 50. Adams RJ, Tucker G, Hugo G, Hill CL, Wilson DH. Projected future trends of hospital service use for selected obesity-related conditions. Obes Res Clin Pract. 2008;2(2):133-41. 51. Allman-Farinelli MA, Chey T, Bauman AE, Gill T, James WP. Age, period and birth cohort effects on prevalence of overweight and obesity in Australian adults from 1990 to 2000. Eur J Clin Nutr. 2008;62(7):898-907. 52. Atlantis E, Lange K, Wittert GA. Chronic disease trends due to excess body weight in Australia. Obesity Reviews. 2009;10(5):543-53. 53. Stewart S, Tikelles G, Carrington C, Walker K, O'Dea K. Australia's future 'Fat Bomb': A report on the long term consequences of Australia's expanding waistline on cardiovascular disease. Baker Heart Research Institute,, 2008. 54. Tung KY, Huang IC, Chen SL, Shih CT. Mining the Generation Xers' job attitudes by artificial neural network and decision tree - empirical evidence in Taiwan. Expert Syst Appl. 2005;29(4):783-94. 55. O'Bannon G. Managing our future: The generation X factor. Public Pers Manage. 2001;30(1):95-109. 56. Meriac JP, Woehr DJ, Banister C. Generational differences in work ethic: An examination of measurement equivalence across three cohorts. Journal of Business and Psychology. 2010;25(2):315-24.

153
57. Twenge JM, Campbell SM, Hoffman BJ, Lance CE. Generational differences in work values: Leisure and extrinsic values increasing, social and intrinsic values decreasing. Journal of Management. 2010;36(5):1117-42. 58. Leiter MP, Jackson NJ, Shaughnessy K. Contrasting burnout, turnover intention, control, value congruence and knowledge sharing between Baby Boomers and Generation X. J Nurs Manag. 2009;17(1):100-9. 59. Leiter MP, Price SL, Spence Laschinger HK. Generational differences in distress, attitudes and incivility among nurses. J Nurs Manag. 2010;18(8):970-80. 60. Chaput JP, Doucet E, Tremblay A. Obesity: a disease or a biological adaptation? An update. Obes Rev. 2012;13(8):681-91. 61. Despres JP. Body fat distribution and risk of cardiovascular disease: an update. Circulation. 2012;126(10):1301-13. 62. World Health Organisation. Obesity: Preventing and managing the global epidemic. Geneva: 1998. 63. Anandacoomarasamy A, Caterson I, Sambrook P, Fransen M, March L. The impact of obesity on the musculoskeletal system. Int J Obes (Lond). 2008;32(2):211-22. 64. Vazquez G, Duval S, Jacobs DR, Silventoinen K. Comparison of body mass index, waist circumference, and waist/hip ratio in predicting incident diabetes: A meta-analysis. Epidemiol Rev. 2007;29:115-28. 65. Ferguson RD, Gallagher EJ, Scheinman EJ, Damouni R, Leroith D. The epidemiology and molecular mechanisms linking obesity, diabetes, and cancer. Vitamins and hormones. 2013;93:51-98. 66. Sturm R, Ringel JS, Andreyeva T. Increasing obesity rates and disability trends. Health Aff (Millwood). 2004;23(2):199-205. 67. Svedberg P, Bardage C, Sandin S, Pedersen NL. A prospective study of health, life-style and psychosocial predictors of self-rated health. Eur J Epidemiol. 2006;21(10):767-76. 68. Prosper MH, Moczulski VL, Qureshi A. Obesity as a predictor of self-rated health. Am J Health Behav. 2009;33(3):319-29. 69. Okosun IS, Choi S, Matamoros T, Dever GE. Obesity is associated with reduced self-rated general health status: evidence from a representative sample of white, black, and Hispanic Americans. Prev Med. 2001;32(5):429-36. 70. Young T, Palta M, Dempsey J, Skatrud J, Weber S, Badr S. The occurrence of sleep-disordered breathing among middle-aged adults. N Engl J Med. 1993;328(17):1230-5. 71. Morris J, Koehn S, Happell B, Dwyer T, Moxham L. Implications of excess weight on mental wellbeing. Aust Health Rev. 2010;34(3):368-74. 72. Luppino FS, de Wit LM, Bouvy PF, Stijnen T, Cuijpers P, Penninx BW, et al. Overweight, obesity, and depression: a systematic review and meta-analysis of longitudinal studies. Arch Gen Psychiatry. 2010;67(3):220-9. 73. Renzaho A, Wooden M, Houng B. Associations between body mass index and health-related quality of life among Australian adults. Qual Life Res. 2010;19(4):515-20. 74. World Health Organisation. Redefining Obesity and its treatment. 2000. 75. Quetelet A. A Treatise on Man and the Development of his Faculties. New York: Burt Franklin; Originally published in 1842. Reprinted in 1986.

154
76. Kissebah AH, Vydelingum N, Murray R, Evans DJ, Hartz AJ, Kalkhoff RK, et al. Relation of body fat distribution to metabolic complications of obesity. J Clin Endocrinol Metab. 1982;54(2):254-60. 77. Oppert JM, Charles MA, Thibult N, Guy-Grand B, Eschwege E, Ducimetiere P. Anthropometric estimates of muscle and fat mass in relation to cardiac and cancer mortality in men: the Paris Prospective Study. Am J Clin Nutr. 2002;75(6):1107-13. 78. Gallagher D, Visser M, Sepulveda D, Pierson RN, Harris T, Heymsfield SB. How useful is body mass index for comparison of body fatness across age, sex, and ethnic groups? Am J Epidemiol. 1996;143(3):228-39. 79. Vague J. The degree of masculine differentiation of obesities: a factor determining predisposition to diabetes, atherosclerosis, gout, and uric calculous disease. Am J Clin Nutr. 1956;4(1):20-34. 80. Arsenault BJ, Beaumont EP, Despres JP, Larose E. Mapping body fat distribution: a key step towards the identification of the vulnerable patient? Ann Med. 2012;44(8):758-72. 81. Czernichow S, Kengne AP, Stamatakis E, Hamer M, Batty GD. Body mass index, waist circumference and waist-hip ratio: which is the better discriminator of cardiovascular disease mortality risk?: evidence from an individual-participant meta-analysis of 82 864 participants from nine cohort studies. Obes Rev. 2011;12(9):680-7. 82. Dalton M, Cameron AJ, Zimmet PZ, Shaw JE, Jolley D, Dunstan DW, et al. Waist circumference, waist-hip ratio and body mass index and their correlation with cardiovascular disease risk factors in Australian adults. J Intern Med. 2003;254(6):555-63. 83. Huxley R, Mendis S, Zheleznyakov E, Reddy S, Chan J. Body mass index, waist circumference and waist:hip ratio as predictors of cardiovascular risk--a review of the literature. Eur J Clin Nutr. 2010;64(1):16-22. 84. Janssen I, Katzmarzyk PT, Ross R. Waist circumference and not body mass index explains obesity-related health risk. Am J Clin Nutr. 2004;79(3):379-84. 85. Zhu S, Wang Z, Heshka S, Heo M, Faith MS, Heymsfield SB. Waist circumference and obesity-associated risk factors among whites in the third National Health and Nutrition Examination Survey: clinical action thresholds. Am J Clin Nutr. 2002;76(4):743-9. 86. World Health Organisation. Waist circumference and Waist-hip ratio: Report of a WHO expert consultation. Geneva: 2008. 87. World Health Organisation. Global status report on noncommunicable diseases. Italy: 2010. 88. Fox CS, Massaro JM, Hoffmann U, Pou KM, Maurovich-Horvat P, Liu CY, et al. Abdominal visceral and subcutaneous adipose tissue compartments: association with metabolic risk factors in the Framingham Heart Study. Circulation. 2007;116(1):39-48. 89. Despres JP, Lemieux I, Bergeron J, Pibarot P, Mathieu P, Larose E, et al. Abdominal obesity and the metabolic syndrome: contribution to global cardiometabolic risk. Arterioscler Thromb Vasc Biol. 2008;28(6):1039-49. 90. Parr CL, Batty GD, Lam TH, Barzi F, Fang X, Ho SC, et al. Body-mass index and cancer mortality in the Asia-Pacific Cohort Studies Collaboration: pooled analyses of 424,519 participants. Lancet Oncol. 2010;11(8):741-52.

155
91. Pouliot MC, Despres JP, Lemieux S, Moorjani S, Bouchard C, Tremblay A, et al. Waist circumference and abdominal sagittal diameter: best simple anthropometric indexes of abdominal visceral adipose tissue accumulation and related cardiovascular risk in men and women. The American journal of cardiology. 1994;73(7):460-8. 92. Leitzmann MF, Moore SC, Koster A, Harris TB, Park Y, Hollenbeck A, et al. Waist circumference as compared with body-mass index in predicting mortality from specific causes. PLoS One. 2011;6(4):e18582. 93. Emerging Risk Factors C, Wormser D, Kaptoge S, Di Angelantonio E, Wood AM, Pennells L, et al. Separate and combined associations of body-mass index and abdominal adiposity with cardiovascular disease: collaborative analysis of 58 prospective studies. Lancet. 2011;377(9771):1085-95. 94. Janssen I, Mark AE. Elevated body mass index and mortality risk in the elderly. Obes Rev. 2007;8(1):41-59. 95. Flegal KM, Kit BK, Orpana H, Graubard BI. Association of all-cause mortality with overweight and obesity using standard body mass index categories: a systematic review and meta-analysis. JAMA. 2013;309(1):71-82. 96. Pischon T. General and Abdominal Adiposity and Risk of Death in Europe (vol 359, pg 2105, 2008). New Engl J Med. 2010;362(25):2433-. 97. Willett WC, Hu FB, Thun M. Overweight, obesity, and all-cause mortality. JAMA. 2013;309(16):1681. 98. Adams KF, Schatzkin A, Harris TB, Kipnis V, Mouw T, Ballard-Barbash R, et al. Overweight, obesity, and mortality in a large prospective cohort of persons 50 to 71 years old. N Engl J Med. 2006;355(8):763-78. 99. Berrington de Gonzalez A, Hartge P, Cerhan JR, Flint AJ, Hannan L, MacInnis RJ, et al. Body-mass index and mortality among 1.46 million white adults. N Engl J Med. 2010;363(23):2211-9. 100. Masters RK, Reither EN, Powers DA, Yang YC, Burger AE, Link BG. The impact of obesity on US mortality levels: the importance of age and cohort factors in population estimates. Am J Public Health. 2013;103(10):1895-901. 101. Allman-Farinelli MA, Chey T, Merom D, Bauman AE. Occupational risk of overweight and obesity: an analysis of the Australian Health Survey. J Occup Med Toxicol. 2010;5:14. 102. Allender S, Gleeson E, Crammond B, Sacks G, Lawrence M, Peeters A, et al. Moving beyond 'rates, roads and rubbish': How do local governments make choices about healthy public policy to prevent obesity? Aust New Zealand Health Policy. 2009;6:20. 103. Gortmaker SL, Swinburn BA, Levy D, Carter R, Mabry PL, Finegood DT, et al. Changing the future of obesity: science, policy, and action. Lancet. 2011;378(9793):838-47. 104. Swinburn BA, Sacks G, Hall KD, McPherson K, Finegood DT, Moodie ML, et al. The global obesity pandemic: shaped by global drivers and local environments. Lancet. 2011;378(9793):804-14. 105. Heitmann BL, Westerterp KR, Loos RJ, Sorensen TI, O'Dea K, McLean P, et al. Obesity: lessons from evolution and the environment. Obes Rev. 2012;13(10):910-22. 106. Ng SW, Popkin BM. Time use and physical activity: a shift away from movement across the globe. Obes Rev. 2012;13(8):659-80.

156
107. Bleich S, Cutler D, Murray C, Adams A. Why is the developed world obese? Annu Rev Public Health. 2008;29:273-95. 108. Swinburn B, Sacks G, Ravussin E. Increased food energy supply is more than sufficient to explain the US epidemic of obesity. Am J Clin Nutr. 2009;90(6):1453-6. 109. Gearhardt AN, Grilo CM, DiLeone RJ, Brownell KD, Potenza MN. Can food be addictive? Public health and policy implications. Addiction. 2011;106(7):1208-12. 110. Volkow ND, Wang GJ, Tomasi D, Baler RD. The addictive dimensionality of obesity. Biol Psychiatry. 2013;73(9):811-8. 111. Volkow ND, Wang GJ, Fowler JS, Tomasi D, Telang F, Baler R. Addiction: decreased reward sensitivity and increased expectation sensitivity conspire to overwhelm the brain's control circuit. BioEssays : news and reviews in molecular, cellular and developmental biology. 2010;32(9):748-55. 112. Avena NM, Rada P, Hoebel BG. Evidence for sugar addiction: behavioral and neurochemical effects of intermittent, excessive sugar intake. Neuroscience and biobehavioral reviews. 2008;32(1):20-39. 113. Lenoir M, Serre F, Cantin L, Ahmed SH. Intense sweetness surpasses cocaine reward. PLoS One. 2007;2(8):e698. 114. Lustig RH, Schmidt LA, Brindis CD. Public health: The toxic truth about sugar. Nature. 2012;482(7383):27-9. 115. Garber AK, Lustig RH. Is fast food addictive? Current drug abuse reviews. 2011;4(3):146-62. 116. Peters A. Does sugar addiction really cause obesity? Frontiers in neuroenergetics. 2011;3:11. 117. Church TS, Thomas DM, Tudor-Locke C, Katzmarzyk PT, Earnest CP, Rodarte RQ, et al. Trends over 5 decades in U.S. occupation-related physical activity and their associations with obesity. PLoS One. 2011;6(5):e19657. 118. Chau JY, van der Ploeg HP, Merom D, Chey T, Bauman AE. Cross-sectional associations between occupational and leisure-time sitting, physical activity and obesity in working adults. Prev Med. 2012;54(3-4):195-200. 119. Brownson RC, Boehmer TK, Luke DA. Declining rates of physical activity in the United States: what are the contributors? Annu Rev Public Health. 2005;26:421-43. 120. King GA, Fitzhugh EC, Bassett DR, Jr., McLaughlin JE, Strath SJ, Swartz AM, et al. Relationship of leisure-time physical activity and occupational activity to the prevalence of obesity. Int J Obes Relat Metab Disord. 2001;25(5):606-12. 121. Chau JY, Merom D, Grunseit A, Rissel C, Bauman AE, van der Ploeg HP. Temporal trends in non-occupational sedentary behaviours from Australian Time Use Surveys 1992, 1997 and 2006. The international journal of behavioral nutrition and physical activity. 2012;9:76. 122. van der Ploeg HP, Chey T, Korda RJ, Banks E, Bauman A. Sitting time and all-cause mortality risk in 222 497 Australian adults. Arch Intern Med. 2012;172(6):494-500. 123. Mummery WK, Schofield GM, Steele R, Eakin EG, Brown WJ. Occupational sitting time and overweight and obesity in Australian workers. American journal of preventive medicine. 2005;29(2):91-7.

157
124. George ES, Rosenkranz RR, Kolt GS. Chronic disease and sitting time in middle-aged Australian males: findings from the 45 and Up Study. The international journal of behavioral nutrition and physical activity. 2013;10:20. 125. Dunstan DW, Barr EL, Healy GN, Salmon J, Shaw JE, Balkau B, et al. Television viewing time and mortality: the Australian Diabetes, Obesity and Lifestyle Study (AusDiab). Circulation. 2010;121(3):384-91. 126. Maes HH, Neale MC, Eaves LJ. Genetic and environmental factors in relative body weight and human adiposity. Behav Genet. 1997;27(4):325-51. 127. O'Rahilly S. Human genetics illuminates the paths to metabolic disease. Nature. 2009;462(7271):307-14. 128. O'Rahilly S, Farooqi IS. Human obesity: a heritable neurobehavioral disorder that is highly sensitive to environmental conditions. Diabetes. 2008;57(11):2905-10. 129. Haslam D, Rigby N. A long look at obesity. Lancet. 2010;376(9735):85-6. 130. Neel JV. Diabetes mellitus: a "thrifty" genotype rendered detrimental by "progress"? American journal of human genetics. 1962;14:353-62. 131. Speakman JR. A nonadaptive scenario explaining the genetic predisposition to obesity: the "predation release" hypothesis. Cell metabolism. 2007;6(1):5-12. 132. Tang-Peronard JL, Andersen HR, Jensen TK, Heitmann BL. Endocrine-disrupting chemicals and obesity development in humans: a review. Obes Rev. 2011;12(8):622-36. 133. Advisory Panel on the Economic Potential of Senior Australians. Realising the economic potential of senior Australians: turning grey into gold. ACT: 2011. 134. Cappuccio FP, Taggart FM, Kandala NB, Currie A, Peile E, Stranges S, et al. Meta-analysis of short sleep duration and obesity in children and adults. Sleep. 2008;31(5):619-26. 135. Magee CA, Kritharides L, Attia J, McElduff P, Banks E. Short and long sleep duration are associated with prevalent cardiovascular disease in Australian adults. Journal of sleep research. 2012;21(4):441-7. 136. Keith SW, Redden DT, Katzmarzyk PT, Boggiano MM, Hanlon EC, Benca RM, et al. Putative contributors to the secular increase in obesity: exploring the roads less traveled. Int J Obesity. 2006;30(11):1585-94. 137. Pijl H. Obesity: evolution of a symptom of affluence. The Netherlands journal of medicine. 2011;69(4):159-66. 138. Jackson AA, Burdge GC, Lillycrop KA. Diet, nutrition and modulation of genomic expression in fetal origins of adult disease. World review of nutrition and dietetics. 2010;101:56-72. 139. Peters JC, Wyatt HR, Donahoo WT, Hill JO. From instinct to intellect: the challenge of maintaining healthy weight in the modern world. Obes Rev. 2002;3(2):69-74. 140. French SA, Story M, Jeffery RW. Environmental influences on eating and physical activity. Annu Rev Public Health. 2001;22:309-35. 141. IASO. Obesity Prevalence Worldwide. International Association for the study of obesity; 2011 [17 March 2011]; Available from: http://www.iaso.org/. 142. Walls HL, Magliano DJ, Stevenson CE, Backholer K, Mannan HR, Shaw JE, et al. Projected Progression of the Prevalence of Obesity in Australia. Obesity (Silver Spring). 2011.

158
143. Kelly T, Yang W, Chen CS, Reynolds K, He J. Global burden of obesity in 2005 and projections to 2030. Int J Obes (Lond). 2008;32(9):1431-7. 144. Russell GV, Pierce CW, Nunley L. Financial implications of obesity. Orthopedic Clinics of North America. 2011;42(1):123-7. 145. Schofield DJ, Passey ME, Earnest A, Gloor IC, Shrestha R. Are we getting healthier as we grow older? Implications for babyboomer labor force participation. Ann Ny Acad Sci. 2007;1114:230-40. 146. Australian Bureau of Statistics. 6238.0 Retirement and Retirment Intentions, Australia, Jul 2008 to Jun 2009. Canberra: ABS, 2009. 147. Australian Government. Budget 2009-2010 Secure and Sustainable Pensions. Canberra: 2009. 148. Thomas SL, Lewis S, Hyde J, Castle D, Komesaroff P. "The solution needs to be complex." Obese adults' attitudes about the effectiveness of individual and population based interventions for obesity. BMC Public Health. 2010;10:420. 149. Jacobsen BK, Njolstad I, Thune I, Wilsgaard T, Lochen ML, Schirmer H. Increase in weight in all birth cohorts in a general population - The Tromso study, 1974-1994. Arch Intern Med. 2001;161(3):466-72. 150. Hanlon P, Carlisle S, Hannah M, Reilly D, Lyon A. Making the case for a 'fifth wave' in public Health. Public Health. 2011;125(1):30-6. 151. Swinburn B, Egger G, Raza F. Dissecting obesogenic environments: The development and application of a framework for identifying and prioritizing environmental interventions for obesity. Prev Med. 1999;29(6):563-70. 152. Commonwealth of Australia. Taking Preventative Action - A Response to Australia: The Healthiest Country by 2020 - The Report of the National Preventative Health Taskforce. Barton, ACT: Commonwealth of Australia, 2010. 153. Colagiuri S, Lee CM, Colagiuri R, Magliano D, Shaw JE, Zimmet PZ, et al. The cost of overweight and obesity in Australia. Med J Aust. 2010;192(5):260-4. 154. Parliament of the Commonwealth of Australia. Weighing it up: Obesity in Australia. House of Representatives Standing Committee on Health and Ageing. Canberra: Commonwealth of Australia, 2009. 155. Olsen A, Dixon J, Banwell C, Baker P. Weighing it up: the missing social inequalities dimension in Australian obesity policy discourse. Health Promot J Austr. 2009;20(3):167-71. 156. Lawlor DA, Frankel S, Shaw M, Ebrahim S, Smith GD. Smoking and ill health: does lay epidemiology explain the failure of smoking cessation programs among deprived populations? Am J Public Health. 2003;93(2):266-70. 157. Sacks G, Swinburn BA, Lawrence MA. A systematic policy approach to changing the food system and physical activity environments to prevent obesity. Aust New Zealand Health Policy. 2008;5:13. 158. Bond ME, Williams MJ, Crammond B, Loff B. Taxing junk food: applying the logic of the Henry tax review to food. Med J Aust. 2010;193(8):472-3. 159. Andreyeva T, Long MW, Brownell KD. The impact of food prices on consumption: a systematic review of research on the price elasticity of demand for food. Am J Public Health. 2010;100(2):216-22. 160. Morgan PJ, Collins CE, Plotnikoff RC, Cook AT, Berthon B, Mitchell S, et al. Efficacy of a workplace-based weight loss program for overweight male shift workers:

159
the Workplace POWER (Preventing Obesity Without Eating like a Rabbit) randomized controlled trial. Prev Med. 2011;52(5):317-25. 161. Sorensen G, Landsbergis P, Hammer L, Amick BC, 3rd, Linnan L, Yancey A, et al. Preventing chronic disease in the workplace: a workshop report and recommendations. Am J Public Health. 2011;101 Suppl 1:S196-207. 162. Roxon N. Boost for Healthy Kids and Healthy Workers in South Australia. In: Ageing Ha, editor. Canberra: Commonwealth of Australia; 2011. 163. Maes L, Van Cauwenberghe E, Van Lippevelde W, Spittaels H, De Pauw E, Oppert JM, et al. Effectiveness of workplace interventions in Europe promoting healthy eating: a systematic review. Eur J Public Health. 2011. 164. Atkinson G, Fullick S, Grindey C, Maclaren D. Exercise, energy balance and the shift worker. Sports Med. 2008;38(8):671-85. 165. Hutchinson AD, Wilson C. Improving nutrition and physical activity in the workplace: a meta-analysis of intervention studies. Health Promot Int. 2011. 166. Chandola T, Brunner E, Marmot M. Chronic stress at work and the metabolic syndrome: prospective study. BMJ. 2006;332(7540):521-5. 167. Harvey SB, Glozier N, Carlton O, Mykletun A, Henderson M, Hotopf M, et al. Obesity and sickness absence: results from the CHAP study. Occup Med (Lond). 2010;60(5):362-8. 168. Heraclides A, Chandola T, Witte DR, Brunner EJ. Psychosocial stress at work doubles the risk of type 2 diabetes in middle-aged women: evidence from the Whitehall II study. Diabetes Care. 2009;32(12):2230-5. 169. Brunner EJ, Chandola T, Marmot MG. Prospective effect of job strain on general and central obesity in the Whitehall II Study. Am J Epidemiol. 2007;165(7):828-37. 170. Karasek R, Brisson C, Kawakami N, Houtman I, Bongers P, Amick B. The Job Content Questionnaire (JCQ): an instrument for internationally comparative assessments of psychosocial job characteristics. J Occup Health Psychol. 1998;3(4):322-55. 171. Ostry AS, Radi S, Louie AM, LaMontagne AD. Psychosocial and other working conditions in relation to body mass index in a representative sample of Australian workers. BMC Public Health. 2006;6:53. 172. Magee C, Stefanic N, Caputi P, Iverson D. Occupational factors and sick leave in Australian employees. J Occup Environ Med. 2011;53(6):627-32. 173. Marmot MG, Bosma H, Hemingway H, Brunner E, Stansfeld S. Contribution of job control and other risk factors to social variations in coronary heart disease incidence. Lancet. 1997;350(9073):235-9. 174. Kuper H, Marmot M. Job strain, job demands, decision latitude, and risk of coronary heart disease within the Whitehall II study. J Epidemiol Community Health. 2003;57(2):147-53. 175. Kouvonen A, Kivimaki M, Vaananen A, Heponiemi T, Elovainio M, Ala-Mursula L, et al. Job strain and adverse health behaviors: the Finnish Public Sector Study. J Occup Environ Med. 2007;49(1):68-74. 176. Kouvonen A, Kivimaki M, Cox SJ, Cox T, Vahtera J. Relationship between work stress and body mass index among 45,810 female and male employees. Psychosom Med. 2005;67(4):577-83.
160
177. LaMontagne AD, Keegel T, Vallance D, Ostry A, Wolfe R. Job strain - attributable depression in a sample of working Australians: assessing the contribution to health inequalities. BMC Public Health. 2008;8:181. 178. D'Souza RM, Strazdins L, Clements MS, Broom DH, Parslow R, Rodgers B. The health effects of jobs: status, working conditions, or both? Aust N Z J Public Health. 2005;29(3):222-8. 179. Siegrist J, Rodel A. Work stress and health risk behavior. Scand J Work Environ Health. 2006;32(6):473-81. 180. Hansen CD, Andersen JH. Going ill to work--what personal circumstances, attitudes and work-related factors are associated with sickness presenteeism? Soc Sci Med. 2008;67(6):956-64. 181. Holden L, Scuffham PA, Hilton MF, Ware RS, Vecchio N, Whiteford HA. Health-related productivity losses increase when the health condition is co-morbid with psychological distress: findings from a large cross-sectional sample of working Australians. BMC Public Health. 2011;11:417. 182. D'Souza RM, Strazdins L, Broom DH, Rodgers B, Berry HL. Work demands, job insecurity and sickness absence from work. how productive is the new, flexible labour force? Aust N Z J Public Health. 2006;30(3):205-12. 183. Holden L, Scuffham PA, Hilton MF, Ware RS, Vecchio N, Whiteford HA. Which health conditions impact on productivity in working Australians? J Occup Environ Med. 2011;53(3):253-7. 184. Australian Bureau of Statistics. National Health Survey: Users Guide. Canberra: ABS, 2007-2008 Contract No.: 4363.0.55.001. 185. Grant JF, Taylor AW, Ruffin RE, Wilson DH, Phillips PJ, Adams RJ, et al. Cohort Profile: The North West Adelaide Health Study (NWAHS). Int J Epidemiol. 2008;38(6):1479-86. 186. Martin S, Haren M, Taylor A, Middleton S, Wittert G. Cohort profile: the Florey Adelaide Male Ageing Study (FAMAS). Int J Epidemiol. 2007;36(2):302-6. 187. Martin SA, Haren MT, Middleton SM, Wittert GA. The Florey Adelaide Male Ageing Study (FAMAS): design, procedures & participants. BMC Public Health. 2007;7:126. 188. Daley J, McGannon C, Ginnivan L. Game-changers: Economic reform priorities for Australia. Melbourne: Grattan Institute, 2012. 189. United Nations. Report by the Secretary General on the prevention and control of non-communicable diseases. New York: United Nations General Assembly, 2011 A/66/83. 190. National Institute on Aging and National Institutes of Health. Global Health and Aging. 2011 11-7737. 191. McKee-Ryan F, Song Z, Wanberg CR, Kinicki AJ. Psychological and physical well-being during unemployment: a meta-analytic study. The Journal of applied psychology. 2005;90(1):53-76. 192. Dal Grande E, Gill T, Taylor AW, Chittleborough C, Carter P. Obesity in South Australian adults--prevalence, projections and generational assessment over 13 years. Aust N Z J Public Health. 2005;29(4):343-8. 193. Australian Bureau of Statistics. 1989-90 National Health Survey Users Guide. Canberra: ABS, 1991 Contract No.: Cat. No. 4363.

161
194. Donath SM. How to calculate standard errors for population estimates based on Australian National Health Survey data. Aust N Z J Public Health. 2005;29(6):565-71. 195. Kreuter F, Valliant R. A survey on survey statistics: What is done and can be done in Stata. The Stata Journal. 2007;7(1):1-21. 196. Institute for digital research and education UCLA. Stata library replicate weights. UCLA; 2013 [updated 2013; cited 2013 9 January]; Available from: http://www.ats.ucla.edu/stat/stata/library/replicate_weights.htm. 197. Australian Bureau of Statistics. Diabetes in Australia: A snapshot, 2007-08. Canberra 2011. 198. Zhang Y, Dall TM, Mann SE, Chen Y, Martin J, Moore V, et al. The economic costs of undiagnosed diabetes. Population health management. 2009;12(2):95-101. 199. Pierce MB, Zaninotto P, Steel N, Mindell J. Undiagnosed diabetes-data from the English longitudinal study of ageing. Diabetic medicine : a journal of the British Diabetic Association. 2009;26(7):679-85. 200. King DE, Matheson E, Chirina S, Shankar A, Broman-Fulks J. The status of baby boomers' health in the United States: the healthiest generation? JAMA Intern Med. 2013;173(5):385-6. 201. Robinson WR, Keyes KM, Utz RL, Martin CL, Yang Y. Birth cohort effects among US-born adults born in the 1980s: foreshadowing future trends in US obesity prevalence. Int J Obesity. 2012. 202. Bjorntorp P. Do stress reactions cause abdominal obesity and comorbidities? Obesity reviews : an official journal of the International Association for the Study of Obesity. 2001;2(2):73-86. 203. Productivity Commission. Economic Implications of an Ageing Australia. Canberra: Australian Government, 2005. 204. Aitken RJ, Allman-Farinelli MA, King LA, Bauman AE. Current and future costs of cancer, heart disease and stroke attributable to obesity in Australia - a comparison of two birth cohorts. Asia Pacific journal of clinical nutrition. 2009;18(1):63-70. 205. Taylor AW, Dal Grande E, Gill TK, Chittleborough CR, Wilson DH, Adams RJ, et al. How valid are self-reported height and weight? A comparison between CATI self-report and clinic measurements using a large cohort study. Aust N Z J Public Health. 2006;30(3):238-46. 206. Work Safe Victoria. Stresswise- preventing work-related stress. Melbourne: State Government, Victoria, 2007. 207. Azagba S, Sharaf MF. The relationship between job stress and body mass index using longitudinal data from Canada. Int J Public Health. 2012;57(5):807-15. 208. Lallukka T, Lahelma E, Rahkonen O, Roos E, Laaksonen E, Martikainen P, et al. Associations of job strain and working overtime with adverse health behaviors and obesity: evidence from the Whitehall II Study, Helsinki Health Study, and the Japanese Civil Servants Study. Soc Sci Med. 2008;66(8):1681-98. 209. Ishizaki M, Nakagawa H, Morikawa Y, Honda R, Yamada Y, Kawakami N. Influence of job strain on changes in body mass index and waist circumference--6-year longitudinal study. Scand J Work Environ Health. 2008;34(4):288-96. 210. Kivimaki M, Head J, Ferrie JE, Shipley MJ, Brunner E, Vahtera J, et al. Work stress, weight gain and weight loss: evidence for bidirectional effects of job strain on body mass index in the Whitehall II study. Int J Obes (Lond). 2006;30(6):982-7.

162
211. Slopen N, Glynn RJ, Buring JE, Lewis TT, Williams DR, Albert MA. Job strain, job insecurity, and incident cardiovascular disease in the Women's Health Study: results from a 10-year prospective study. PLoS One. 2012;7(7):e40512. 212. Hellerstedt WL, Jeffery RW. The association of job strain and health behaviours in men and women. Int J Epidemiol. 1997;26(3):575-83. 213. Niedhammer I, Sultan-Taieb H, Chastang JF, Vermeylen G, Parent-Thirion A. Fractions of cardiovascular diseases and mental disorders attributable to psychosocial work factors in 31 countries in Europe. Int Arch Occup Environ Health. 2013. 214. Heraclides AM, Chandola T, Witte DR, Brunner EJ. Work stress, obesity and the risk of type 2 diabetes: gender-specific bidirectional effect in the Whitehall II study. Obesity. 2012;20(2):428-33. 215. Steeves JA, Bassett DR, Jr., Thompson DL, Fitzhugh EC. Relationships of occupational and non-occupational physical activity to abdominal obesity. Int J Obes (Lond). 2012;36(1):100-6. 216. Di Lorenzo L, De Pergola G, Zocchetti C, L'Abbate N, Basso A, Pannacciulli N, et al. Effect of shift work on body mass index: results of a study performed in 319 glucose-tolerant men working in a Southern Italian industry. Int J Obes Relat Metab Disord. 2003;27(11):1353-8. 217. Ishizaki M, Morikawa Y, Nakagawa H, Honda R, Kawakami N, Haratani T, et al. The influence of work characteristics on body mass index and waist to hip ratio in Japanese employees. Ind Health. 2004;42(1):41-9. 218. van Drongelen A, Boot CR, Merkus SL, Smid T, van der Beek AJ. The effects of shift work on body weight change - a systematic review of longitudinal studies. Scand J Work Environ Health. 2011;37(4):263-75. 219. Solovieva S, Lallukka T, Virtanen M, Viikari-Juntura E. Psychosocial factors at work, long work hours, and obesity: a systematic review. Scand J Work Environ Health. 2013. 220. Proper KI, Hildebrandt VH. Overweight and obesity among Dutch workers: differences between occupational groups and sectors. Int Arch Occup Environ Health. 2010;83(1):61-8. 221. Faith MS, Butryn M, Wadden TA, Fabricatore A, Nguyen AM, Heymsfield SB. Evidence for prospective associations among depression and obesity in population-based studies. Obes Rev. 2011;12(5):e438-53. 222. Pilkington R, Taylor AW, Hugo G, Wittert G. Are Baby Boomers Healthier than Generation X? A Profile of Australia's Working Generations Using National Health Survey Data. PLoS One. 2014;9(3):e93087. 223. Grant JF, Chittleborough CR, Taylor AW, Dal Grande E, Wilson DH, Phillips PJ, et al. The North West Adelaide Health Study: detailed methods and baseline segmentation of a cohort for selected chronic diseases. Epidemiol Perspect Innov. 2006;3:4. 224. Australian Bureau of Statistics and Statistics New Zealand. Australian and New Zealand Standard Classification of Occupations. Canberra: 2006 Contract No.: ABS cat. no. 1220.0. 225. Australian Bureau of Statistics. National Survey of Mental Health and Wellbeing: Summary of results. Canberra: ABS, 2007 4326.0.

163
226. Andrews G, Slade T. Interpreting scores on the Kessler Psychological Distress Scale (K10). Aust N Z J Public Health. 2001;25(6):494-7. 227. Health Information Centre. 2000 Collaborative Health and Wellbeing Survey. Health West, 2001. 228. Australian Institute of Health and Welfare. The Active Australia Survey: a guide and manual for implementation, analysis and reporting. Canberra: AIHW, 2003. 229. Nyberg ST, Heikkila K, Fransson EI, Alfredsson L, De Bacquer D, Bjorner JB, et al. Job strain in relation to body mass index: pooled analysis of 160 000 adults from 13 cohort studies. J Intern Med. 2011. 230. Schuring M, Robroek SJ, Otten FW, Arts CH, Burdorf A. The effect of ill health and socioeconomic status on labor force exit and re-employment: a prospective study with ten years follow-up in the Netherlands. Scand J Work Environ Health. 2013;39(2):134-43. 231. Ki M, Kelly Y, Sacker A, Nazroo J. Poor health, employment transitions and gender: evidence from the British Household Panel Survey. Int J Public Health. 2012. 232. Oliver G, Wardle J, Gibson EL. Stress and food choice: a laboratory study. Psychosom Med. 2000;62(6):853-65. 233. Wardle J, Steptoe A, Oliver G, Lipsey Z. Stress, dietary restraint and food intake. J Psychosom Res. 2000;48(2):195-202. 234. Dallman MF, Pecoraro N, Akana SF, La Fleur SE, Gomez F, Houshyar H, et al. Chronic stress and obesity: a new view of "comfort food". Proceedings of the National Academy of Sciences of the United States of America. 2003;100(20):11696-701. 235. Lallukka T, Sarlio-Lahteenkorva S, Roos E, Laaksonen M, Rahkonen O, Lahelma E. Working conditions and health behaviours among employed women and men: the Helsinki Health Study. Prev Med. 2004;38(1):48-56. 236. Cameron AJ, Welborn TA, Zimmet PZ, Dunstan DW, Owen N, Salmon J, et al. Overweight and obesity in Australia: the 1999-2000 Australian Diabetes, Obesity and Lifestyle Study (AusDiab). Med J Aust. 2003;178(9):427-32. 237. Dollard MF, LaMontagne AD, Caulfield N, Blewett V, Shaw A. Job Stress in the Australian and International Health and Community Services Sector: A Review of the Literature. Int J Stress Manag. 2007;14(4):417-45. 238. Borritz M, Rugulies R, Bjorner JB, Villadsen E, Mikkelsen OA, Kristensen TS. Burnout among employees in human service work: design and baseline findings of the PUMA study. Scandinavian journal of public health. 2006;34(1):49-58. 239. Hartley TA, Burchfiel CM, Fekedulegn D, Andrew ME, Violanti JM. Health disparities in police officers: Comparisons to the U.S. general population. Int J Emerg Ment Health. 2011;13(4):211-20. 240. Zimmerman FH. Cardiovascular disease and risk factors in law enforcement personnel: a comprehensive review. Cardiol Rev. 2012;20(4):159-66. 241. Munir F, Clemes S, Houdmont J, Randall R. Overweight and obesity in UK firefighters. Occup Med 2012;62(5):362-5. 242. Hu FB, Li TY, Colditz GA, Willett WC, Manson JE. Television watching and other sedentary behaviors in relation to risk of obesity and type 2 diabetes mellitus in women. JAMA. 2003;289(14):1785-91.

164
243. Choi B, Schnall PL, Yang H, Dobson M, Landsbergis P, Israel L, et al. Sedentary work, low physical job demand, and obesity in US workers. Am J Ind Med. 2010;53(11):1088-101. 244. Atlantis E, Goldney RD, Wittert GA. Obesity and depression or anxiety. BMJ 2009;339(7726):871. 245. Heo M, Pietrobelli A, Fontaine KR, Sirey JA, Faith MS. Depressive mood and obesity in US adults: Comparison and moderation by sex, age, and race. Int J Obesity. 2006;30(3):513-9. 246. Australian Bureau of Statistics. 6238.0 Retirement and Retirement Intentions. Canberra: ABS, 2013. 247. Heady B, Freebairn J, Warren D. Dynamics of Mature Age Workforce Participation: Policy Effects and Continuing Trends. Melbourne, Victora: Melbourne Institute of Applied Economic and Social Research, 2010. 248. Australian Bureau of Statistics. Retirement and Retirement Intentions. ABS, 2013 6238.0. 249. Thomas C, Benzeval M, Stansfeld SA. Employment transitions and mental health: an analysis from the British household panel survey. J Epidemiol Community Health. 2005;59(3):243-9. 250. Backhans MC, Hemmingsson T. Unemployment and mental health -Who is (not) affected? European Journal of Public Health. 2012;22(3):429-33. 251. Schofield DJ, Shrestha RN, Passey ME, Earnest A, Fletcher SL. Chronic disease and labour force participation among older Australians. Med J Aust. 2008;189(8):447-50. 252. Radloff L. The CES-D Scale: a self report depression scale for research in the general population. Applied Psychological Measurement. 1977;1(3):385-401. 253. Australian Bureau of Statistics. National Health Survey: Users' Guide 2001. ABS, 2001 4363.0.55.001. 254. Virtanen P, Vahtera J, Broms U, Sillanmäki L, Kivimäki M, Koskenvuo M. Employment trajectory as determinant of change in health-related lifestyle: The prospective HeSSup study. European Journal of Public Health. 2008;18(5):504-8. 255. Au N, Hollingsworth B. Employment patterns and changes in body weight among young women. Prev Med. 2011;52(5):310-6. 256. Au N, Hauck K, Hollingsworth B. Employment, work hours and weight gain among middle-aged women. Int J Obes. 2013;37(5):718-24. 257. DiBonaventura M, Link C, Pollack MF, Wagner JS, Williams SA. The relationship between patient-reported tolerability issues with oral antidiabetic agents and work productivity among patients having type 2 diabetes. J Occup Environ Med. 2011;53(2):204-10. 258. Tunceli K, Bradley CJ, Nerenz D, Williams LK, Pladevall M, Elston Lafata J. The impact of diabetes on employment and work productivity. Diabetes Care. 2005;28(11):2662-7. 259. Robroek SJ, van den Berg TI, Plat JF, Burdorf A. The role of obesity and lifestyle behaviours in a productive workforce. Occup Environ Med. 2011;68(2):134-9. 260. Robroek SJ, Reeuwijk KG, Hillier FC, Bambra CL, van Rijn RM, Burdorf A. The contribution of overweight, obesity, and lack of physical activity to exit from paid employment: a meta-analysis. Scand J Work Environ Health. 2013;39(3):233-40.

165
261. Robroek SJ, Schuring M, Croezen S, Stattin M, Burdorf A. Poor health, unhealthy behaviors, and unfavorable work characteristics influence pathways of exit from paid employment among older workers in Europe: a four year follow-up study. Scand J Work Environ Health. 2013;39(2):125-33. 262. Jefferis BJ, Nazareth I, Marston L, Moreno-Kustner B, Bellon JA, Svab I, et al. Associations between unemployment and major depressive disorder: evidence from an international, prospective study (the predict cohort). Soc Sci Med. 2011;73(11):1627-34. 263. Mau W, Listing J, Huscher D, Zeidler H, Zink A. Employment across chronic inflammatory rheumatic diseases and comparison with the general population. The Journal of rheumatology. 2005;32(4):721-8. 264. Burton W, Morrison A, Maclean R, Ruderman E. Systematic review of studies of productivity loss due to rheumatoid arthritis. Occup Med (Lond). 2006;56(1):18-27. 265. Ahs AM, Westerling R. Mortality in relation to employment status during different levels of unemployment. Scandinavian journal of public health. 2006;34(2):159-67. 266. Bender KA, Economou A, Theodossiou I. The temporary and permanent effects of unemployment on mortality in Europe. International Labour Review. 2013;152(2):275-86. 267. Nohr EA, Frydenberg M, Henriksen TB, Olsen J. Does low participation in cohort studies induce bias? Epidemiology. 2006;17(4):413-8. 268. Carter KN, Imlach-Gunasekara F, McKenzie SK, Blakely T. Differential loss of participants does not necessarily cause selection bias. Aust N Z J Public Health. 2012;36(3):218-22. 269. Cohen DA. Obesity and the built environment: changes in environmental cues cause energy imbalances. Int J Obes (Lond). 2008;32 Suppl 7:S137-42. 270. Schofield DJ, Shrestha RN, Percival R, Passey ME, Callander EJ, Kelly SJ. The personal and national costs of lost labour force participation due to arthritis: an economic study. BMC Public Health. 2013;13:188. 271. Access Economics. The growing cost of obesity in 2008: three years on. Diabetes Australia; 2008. 272. Vijan S, Hayward RA, Langa KM. The impact of diabetes on workforce participation: results from a national household sample. Health services research. 2004;39(6 Pt 1):1653-69. 273. Australian Bureau of Statistics. Australian Social Trends March 2011. Canberra: ABS, 2011 4102.0. 274. Australian Institute of Health and Welfare. Australia's Health 1996. Canberra: AIHW 1996. 275. Begg SJ, Vos T, Barker B, Stanley L, Lopez AD. Burden of disease and injury in Australia in the new millennium: measuring health loss from diseases, injuries and risk factors. Med J Aust. 2008;188(1):36-40. 276. Hoad V, Somerford P, Katzenellenbogen J. High body mass index overtakes tobacco as the leading independent risk factor contributing to disease burden in Western Australia. Aust N Z J Public Health. 2010;34(2):214-5. 277. Lim SS, Vos T, Flaxman AD, Danaei G, Shibuya K, Adair-Rohani H, et al. A comparative risk assessment of burden of disease and injury attributable to 67 risk

166
factors and risk factor clusters in 21 regions, 1990-2010: a systematic analysis for the Global Burden of Disease Study 2010. Lancet. 2012;380(9859):2224-60. 278. Salomon JA, Wang H, Freeman MK, Vos T, Flaxman AD, Lopez AD, et al. Healthy life expectancy for 187 countries, 1990-2010: a systematic analysis for the Global Burden Disease Study 2010. Lancet. 2012;380(9859):2144-62. 279. Abdullah A, Stoelwinder J, Shortreed S, Wolfe R, Stevenson C, Walls H, et al. The duration of obesity and the risk of type 2 diabetes. Public Health Nutr. 2011;14(1):119-26. 280. Kannel WB, D'Agostino RB, Cobb JL. Effect of weight on cardiovascular disease. Am J Clin Nutr. 1996;63(3 Suppl):419S-22S. 281. Mitchell RJ, Lord SR, Harvey LA, Close JC. Associations between obesity and overweight and fall risk, health status and quality of life in older people. Aust N Z J Public Health. 2014;38(1):13-8. 282. Organisation for Economic Co-operation and Development. Obesity and the Economics of Prevention. In: OECD, editor. 2010. 283. Taylor AW, Price K, Gill TK, Adams R, Pilkington R, Carrangis N, et al. Multimorbidity - not just an older person's issue. Results from an Australian biomedical study. BMC Public Health. 2010;10:-. 284. Molarius A, Seidell JC, Sans S, Tuomilehto J, Kuulasmaa K. Educational level, relative body weight, and changes in their association over 10 years: an international perspective from the WHO MONICA Project. Am J Public Health. 2000;90(8):1260-8. 285. Devaux M, Sassi F. Social inequalities in obesity and overweight in 11 OECD countries. European Journal of Public Health. 2013;23(3):464-9. 286. McLaren L. Socioeconomic status and obesity. Epidemiol Rev. 2007;29:29-48. 287. Cohen AK, Rai M, Rehkopf DH, Abrams B. Educational attainment and obesity: a systematic review. Obes Rev. 2013. 288. Stunkard AJ, Sorensen TI. Obesity and socioeconomic status--a complex relation. N Engl J Med. 1993;329(14):1036-7. 289. Lahmann PH, Lissner L, Gullberg B, Berglund G. Sociodemographic factors associated with long-term weight gain, current body fatness and central adiposity in Swedish women. Int J Obes Relat Metab Disord. 2000;24(6):685-94. 290. Braddon FE, Rodgers B, Wadsworth ME, Davies JM. Onset of obesity in a 36 year birth cohort study. Br Med J (Clin Res Ed). 1986;293(6542):299-303. 291. Gortmaker SL, Must A, Perrin JM, Sobol AM, Dietz WH. Social and economic consequences of overweight in adolescence and young adulthood. N Engl J Med. 1993;329(14):1008-12. 292. Hatzenbuehler ML, Phelan JC, Link BG. Stigma as a fundamental cause of population health inequalities. Am J Public Health. 2013;103(5):813-21. 293. ten Have M, de Beaufort ID, Teixeira PJ, Mackenbach JP, van der Heide A. Ethics and prevention of overweight and obesity: an inventory. Obes Rev. 2011;12(9):669-79. 294. Sikorski C, Luppa M, Kaiser M, Glaesmer H, Schomerus G, Konig HH, et al. The stigma of obesity in the general public and its implications for public health - a systematic review. BMC Public Health. 2011;11:661. 295. Paradies Y. A systematic review of empirical research on self-reported racism and health. Int J Epidemiol. 2006;35(4):888-901.

167
296. Hinshaw SP, Stier A. Stigma as related to mental disorders. Annual review of clinical psychology. 2008;4:367-93. 297. Wang SS, Brownell KD, Wadden TA. The influence of the stigma of obesity on overweight individuals. Int J Obes Relat Metab Disord. 2004;28(10):1333-7. 298. Oliver JE, Lee T. Public opinion and the politics of obesity in America. Journal of health politics, policy and law. 2005;30(5):923-54. 299. Taylor P, Funk C, Craighill P. Americans See Weight Problems Everywhere But In the Mirror. Pew Research Centre, 2006. 300. Puhl RM, Heuer CA. Obesity stigma: important considerations for public health. Am J Public Health. 2010;100(6):1019-28. 301. Bonfiglioli CM, Smith BJ, King LA, Chapman SF, Holding SJ. Choice and voice: obesity debates in television news. Med J Aust. 2007;187(8):442-5. 302. Domoff SE, Hinman NG, Koball AM, Storfer-Isser A, Carhart VL, Baik KD, et al. The effects of reality television on weight bias: an examination of The Biggest Loser. Obesity (Silver Spring). 2012;20(5):993-8. 303. Yoo JH. No clear winner: effects of The Biggest Loser on the stigmatization of obese persons. Health communication. 2013;28(3):294-303. 304. Caliendo M, Lee WS. Fat chance! Obesity and the transition from unemployment to employment. Econ Hum Biol. 2013;11(2):121-33. 305. Baum CL, 2nd, Ford WF. The wage effects of obesity: a longitudinal study. Health Econ. 2004;13(9):885-99. 306. Lundborg P, Bolin K, Höjgård S, Lindgren B. Obesity and Occupational Attainment among the 50+ of Europe. Adv Health Econ Health Serv Res. 2006;17:219-51. 307. Morris S. Body mass index and occupational attainment. J Health Econ. 2006;25(2):347-64. 308. Thomas C, Benzeval M, Stansfeld S. Psychological distress after employment transitions: the role of subjective financial position as a mediator. J Epidemiol Community Health. 2007;61(1):48-52. 309. Appelhans BM, Segawa E, Janssen I, Kazlauskaite R, Thurston RC, Lewis TT, et al. Employment status, depressive symptoms, and waist circumference change in midlife women: the Study of Women's Health Across the Nation (SWAN). Ann Epidemiol. 2014;24(3):187-92. 310. Ludwig J, Sanbonmatsu L, Gennetian L, Adam E, Duncan GJ, Katz LF, et al. Neighborhoods, obesity, and diabetes--a randomized social experiment. N Engl J Med. 2011;365(16):1509-19. 311. Lovasi GS, Hutson MA, Guerra M, Neckerman KM. Built environments and obesity in disadvantaged populations. Epidemiol Rev. 2009;31:7-20. 312. Gordon-Larsen P, Nelson MC, Page P, Popkin BM. Inequality in the built environment underlies key health disparities in physical activity and obesity. Pediatrics. 2006;117(2):417-24. 313. Turrell G, Haynes M, Burton NW, Giles-Corti B, Oldenburg B, Wilson LA, et al. Neighborhood Disadvantage and Physical Activity: Baseline Results from the HABITAT Multilevel Longitudinal Study. Ann Epidemiol. 2010;20(3):171-81.

168
314. Morland K, Wing S, Diez Roux A, Poole C. Neighborhood characteristics associated with the location of food stores and food service places. American journal of preventive medicine. 2002;22(1):23-9. 315. Giskes K, Avendano M, Brug J, Kunst AE. A systematic review of studies on socioeconomic inequalities in dietary intakes associated with weight gain and overweight/obesity conducted among European adults. Obes Rev. 2010;11(6):413-29. 316. Allender S, Gleeson E, Crammond B, Sacks G, Lawrence M, Peeters A, et al. Policy change to create supportive environments for physical activity and healthy eating: which options are the most realistic for local government? Health promotion international. 2012;27(2):261-74. 317. Organisation for Economic Co-operation and Development. OECD Thematic Follow-Up Review of Policies to Improve Labour Market Prospects for Older Workers. Australia (situation mid-2010). 2012; Available from: http://www.oecd.org/employment/emp/ageingandemploymentpolicies.htm. 318. Temple J, Adair T, Hosseini-Chavosi M. Ageing and the Barriers to Mature Age Labour Force Participation in Australia. Commonwealth of Australia; 2011. 319. Australian Institute of Health and Welfare. Chronic disease and participation in work. Canberra: AIHW, 2009 PHE 109. 320. Australian Human Rights Commission. Working past our 60s. Reforming laws and policies for the older worker. Australian Human Rights Commussion, 2012. 321. Commonwealth of Australia. National Partnership Agreement on Preventive Health. 2012 [updated 02 December 2013; cited 2014 21 March]; Available from: http://www.health.gov.au/internet/main/publishing.nsf/Content/phd-prevention-np. 322. South Australia Healthy Workers Initiative. Implementation plan for the Healthy Workers Initiative. 2012. 323. Brisson C, Larocque B, Moisan J, Vezina M, Dagenais GR. Psychosocial factors at work, smoking, sedentary behavior, and body mass index: a prevalence study among 6995 white collar workers. J Occup Environ Med. 2000;42(1):40-6.
Related Documents