Babcock International Group PLC half year results for the six months ended 30 September 2021 Babcock International Group PLC half year results for the six months ended 30 September 2021 1 7 December 2021 Delivering on our strategy, turnaround on track, results in line Statutory results 30 September 2021 30 September 2020 Restated Revenue £2,223m £2,054m Operating profit/(loss) £75.4m £(785.3)m Basic earnings/(loss) per share 10.3p (164.8)p Cash generated from operations £(10.5)m £163.5m Underlying results 30 September 2021 30 September 2020 Restated Contract backlog (note ii) £10.9bn £9.4bn Revenue £2,223m £2,054m Underlying operating profit (note iii) £115.3m £84.5m of which ‘one-off’ contract profitability and balance sheet (‘CPBS’) adjustments (note iv) - £(21.4)m Underlying operating profit excluding one-off CPBS adjustments - £105.9m Underlying basic earnings per share (note v) 15.3p 5.8p Underlying free cash flow (note vi) £(160.6)m £(4.4)m Net debt £1,347m £1,609m Net debt excluding operating leases (note vii) £938m £990m Net debt/EBITDA (covenant basis) (note viii) 2.8x 2.5x The results for HY21 have been restated, see note (i). See notes on page 3 and a reconciliation between statutory and underlying results on page 12. Financial results in line with expectations Contract backlog up to £10.9 billion following signing of Future Maritime Support Maritime Programme (FMSP) Revenue up 8% (up 10% excluding foreign exchange and disposals) – see page 13 for a revenue bridge o c.6 percentage points of revenue growth driven by growth in Marine (Type 31 ramp up) and Nuclear (infrastructure ramp up) o c.4 percentage points of revenue growth from less COVID-19 interruption than the prior period Statutory operating profit of £75.4 million compared to a £785.3 million loss in the prior year, which includes charges from the CPBS (see below) and a restatement of HY21 goodwill of £760.5 million Underlying operating profit of £115.3 million helped by lower COVID-19 business interruption than the prior period (estimated £25 million YoY benefit) – see page 14 for an underlying operating profit bridge Underlying EPS of 15.3p includes benefit of £6.2 million of other income related to the sale of our oil and gas aviation business Cash generated from operations was £(10.5) million and includes a £110.7 million decrease in payables Underlying free cash flow of £(160.6) million includes material cash outflows previously communicated, including pension deficit contributions (£89 million) and a large working capital outflow (£140m), partly as the period end deferral of creditors is reduced Net debt to EBITDA (covenant basis) 2.8 x at 30 September 2021, with liquidity headroom of £1.4 billion Net proceeds from sale of Frazer-Nash of £290 million received after 30 September 2021 Pro forma net debt to EBITDA 2.1 x after disposal of Frazer-Nash As outlined on 30 July 2021, our full year results for the 2021 financial year included a series of presentational changes to our reporting and the results of our Contract Profitability and Balance Sheet review (‘CPBS’). Results for the half year ended 30 September 2020 (HY21) have been restated for these presentational changes and to include the results of the CPBS. See pages 6 - 11 for further details. Progress on our strategy Three disposals announced in the first half with c.£400 million of proceeds expected to pay down debt: o Oil and Gas aviation business completed in August 2021 for £10 million (£8 million net proceeds) o Frazer-Nash Consultancy completed in October 2021 for £290 million cash consideration o Sale of stake in AirTanker Holdings for £95 million (net of shareholder loans) expected to complete in the second half Portfolio alignment programme to continue o Proceeds generated will either be used to strengthen the balance sheet further or will be invested in future growth New operating model being implemented across the Group o Continue to expect c.£40 million annualised cost savings (c.£20 million benefit this financial year) o Changes include streamlined processes, strengthened controls, centre-led functions and more standardisation People strategy being rolled out o New Group Principles launched and agile working being rolled out across the Group Developing our ESG strategy o Continue to progress our plans to be net zero (scope 1 and 2) by 2040 o Integrating climate-related risk and opportunity into our risk management and strategic processes

Welcome message from author
This document is posted to help you gain knowledge. Please leave a comment to let me know what you think about it! Share it to your friends and learn new things together.
Transcript

Babcock International Group PLC half year results for the six months ended 30 September 2021
Babcock International Group PLC half year results for the six months ended 30 September 2021 1
7 December 2021
Delivering on our strategy, turnaround on track, results in line
Statutory results
30 September 2021
30 September 2020
Restated
Revenue £2,223m £2,054m
Operating profit/(loss) £75.4m £(785.3)m
Basic earnings/(loss) per share 10.3p (164.8)p
Cash generated from operations £(10.5)m £163.5m
Underlying results
30 September 2021
30 September 2020
Restated
Contract backlog (note ii) £10.9bn £9.4bn
Revenue £2,223m £2,054m
Underlying operating profit (note iii) £115.3m £84.5m
of which ‘one-off’ contract profitability and balance sheet (‘CPBS’) adjustments (note iv) - £(21.4)m
Underlying operating profit excluding one-off CPBS adjustments - £105.9m
Underlying basic earnings per share (note v) 15.3p 5.8p
Underlying free cash flow (note vi) £(160.6)m £(4.4)m
Net debt £1,347m £1,609m
Net debt excluding operating leases (note vii) £938m £990m
Net debt/EBITDA (covenant basis) (note viii) 2.8x 2.5x The results for HY21 have been restated, see note (i). See notes on page 3 and a reconciliation between statutory and underlying results on page 12.
Financial results in line with expectations Contract backlog up to £10.9 billion following signing of Future Maritime Support Maritime Programme (FMSP) Revenue up 8% (up 10% excluding foreign exchange and disposals) – see page 13 for a revenue bridge
o c.6 percentage points of revenue growth driven by growth in Marine (Type 31 ramp up) and Nuclear (infrastructure ramp up) o c.4 percentage points of revenue growth from less COVID-19 interruption than the prior period
Statutory operating profit of £75.4 million compared to a £785.3 million loss in the prior year, which includes charges from the CPBS (see below) and a restatement of HY21 goodwill of £760.5 million
Underlying operating profit of £115.3 million helped by lower COVID-19 business interruption than the prior period (estimated £25 million YoY benefit) – see page 14 for an underlying operating profit bridge
Underlying EPS of 15.3p includes benefit of £6.2 million of other income related to the sale of our oil and gas aviation business Cash generated from operations was £(10.5) million and includes a £110.7 million decrease in payables Underlying free cash flow of £(160.6) million includes material cash outflows previously communicated, including pension deficit
contributions (£89 million) and a large working capital outflow (£140m), partly as the period end deferral of creditors is reduced Net debt to EBITDA (covenant basis) 2.8 x at 30 September 2021, with liquidity headroom of £1.4 billion Net proceeds from sale of Frazer-Nash of £290 million received after 30 September 2021 Pro forma net debt to EBITDA 2.1 x after disposal of Frazer-Nash
As outlined on 30 July 2021, our full year results for the 2021 financial year included a series of presentational changes to our reporting and the results of our Contract Profitability and Balance Sheet review (‘CPBS’). Results for the half year ended 30 September 2020 (HY21) have been restated for these presentational changes and to include the results of the CPBS. See pages 6 - 11 for further details.
Progress on our strategy
Three disposals announced in the first half with c.£400 million of proceeds expected to pay down debt: o Oil and Gas aviation business completed in August 2021 for £10 million (£8 million net proceeds) o Frazer-Nash Consultancy completed in October 2021 for £290 million cash consideration o Sale of stake in AirTanker Holdings for £95 million (net of shareholder loans) expected to complete in the second half
Portfolio alignment programme to continue o Proceeds generated will either be used to strengthen the balance sheet further or will be invested in future growth
New operating model being implemented across the Group o Continue to expect c.£40 million annualised cost savings (c.£20 million benefit this financial year) o Changes include streamlined processes, strengthened controls, centre-led functions and more standardisation
People strategy being rolled out o New Group Principles launched and agile working being rolled out across the Group
Developing our ESG strategy o Continue to progress our plans to be net zero (scope 1 and 2) by 2040 o Integrating climate-related risk and opportunity into our risk management and strategic processes

2 Babcock International Group PLC half year results for the six months ended 30 September 2021
Developing international opportunities including winning our first export order for Arrowhead 140 (licence agreement with Indonesia) and signing a Memorandum of Implementation with Ukraine to be the prime contractor on a programme of naval defence projects
Recent business development Contract backlog at 30 September 2021 was £10.9 billion. This includes the Future Maritime Support Programme (FMSP), a
c.£3.5 billion contract signed in September that runs to March 2026. It replaces the previous MSDF contract and continues our support work for the UK Royal Navy across ships, submarines and naval bases
Other significant new contract wins in the period included: o c.€500 million contract for defence aviation training activities in France o c.£150 million logistic support contract, part of the UK’s next generation tactical communications & information systems o c.£110 million contract to deliver the new Defence Strategic Radio Service for critical UK military operations
In October, we won a c.£100 million contract for the design, manufacture, delivery, commissioning and in-service support to the Maritime Electronic Warfare Systems Integrated Capability (MEWSIC)
In December, we were selected by the Australian Government as the preferred tenderer to upgrade and sustain the Defence High Frequency Communication System (DHFCS) to support the Australian armed forces over the next 10 years, with a further four extension options, each of two years
Outlook
Full year outlook unchanged: o Our new operating model is on track to deliver savings of approximately £20 million in this financial year o While we have seen a recovery of activity from the heavily COVID-19 impacted prior period, and we have largely been able
to recover extra costs, we are cautious about our ability to maintain activity levels and recover all costs in the remainder of this financial year given the uncertainty from new COVID-19 variants and varied government responses
o We are investing in our business, including business development and strengthening our control environment o Some external uncertainty remains for the second half of the year as we manage inflation and supply chain pressures
The disposals of Frazer-Nash and oil and gas aviation will impact the reported results for this year As stated before, FY22 free cash flow is expected to be significantly negative. This reflects material cash outflows including additional
pension contributions, restructuring costs, investments in facilities and IT upgrades and the unwinding over time of the historical management of working capital around period ends
We remain confident in our future prospects. We believe that our new strategic focus and operating model will significantly improve the Group’s profitability, and most importantly its cash generation, over the medium term
David Lockwood, Chief Executive Officer, said: “We are on-track with our turnaround strategy with around £400 million of disposals to bolster our balance sheet announced to date. “We will continue to align our portfolio to best support the Group’s capital allocation priorities and future growth. The ongoing implementation of our new operating model means Babcock will be a simplified, more focused Group. “We are pursuing a number of important growth opportunities, with significant contract wins in military communications, our first order for an export licence for our Arrowhead 140 frigate as part of the Type 31 programme, and an agreement for potentially significant work in Ukraine, supported by both the UK and the Ukrainian governments. “While our half year results show some recovery from the financial impact of COVID-19, we remain cautious as we are early on in our transformation and as we manage inflationary and supply chain pressures across the business and potential interruptions from COVID-19. However, the Board believes the actions we are taking will enable the Group to take advantage of the many opportunities ahead of us, leading to improved cash generation and profitability in the medium term.”
Results presentation: A meeting for investors and analysts will be held at the London Stock Exchange (10 Paternoster Square, London) at 9:00 am (UK time). The presentation will be webcast live at www.babcockinternational.com/investors and subsequently will be made available on demand at www.babcockinternational.com/investors/results-and-presentations. A transcript will also be made available on our website.
For further information: Simon McGough, Director of Investor Relations +44 (0)7850 978 741 Kate Hill, Group Director of Communications +44 (0)20 7355 5312 Tulchan Communications: Olivia Peters/Harry Cameron +44 (0)20 7353 4200

Babcock International Group PLC half year results for the six months ended 30 September 2021 3
Adjustments between statutory and underlying information The Group uses various alternative performance measures, including underlying operating profit, to enable users to better understand the performance and earnings trends of the Group. The Directors believe the alternative performance measures provide a consistent measure of business performance year to year and they are used by management to measure operating performance and as a basis for forecasting and decision-making. The Group believes they are also used by investors in analysing business performance. These alternative performance measures are not defined by IFRS and therefore there is a level of judgement involved in identifying the adjustments required to calculate the underlying results. As the alternative performance measures used are not defined under IFRS, they may not be comparable to similar measures used by other companies. They are not intended to be a substitute for, or superior to, measures defined under IFRS.
Notes to statutory and underlying results on page 1 Note (i): Results for HY21 have been restated to correct for prior year errors and to reflect changes in accounting policies. See page 6 for details. Note (ii): The contract backlog represents amounts of future revenue under contract. This measure does not include £3.0 billion of work expected to be done by Babcock as part of framework agreements (September 2020: £5.8 billion). The decrease in amounts in framework agreements mainly reflects the movement of FMSP from framework into backlog after the signing of the contract in September 2021. Note (iii): Underlying operating profit is defined as IFRS statutory operating profit adjusted for Specific Adjusting Items. See page 12 for a reconciliation. The Specific Adjusting Items are:
Amortisation of acquired intangibles Business acquisition, merger and divestment related items (being acquisitions and gains or losses on disposal of assets or businesses) Gains, losses and costs directly arising from the Group’s withdrawal from a specific market or geography, including closure costs,
severance costs, the sale of assets and termination of leases The costs of large restructuring programmes which significantly exceed the minor restructuring which occurs every year as part of the
normal day to day business. Where restructuring costs are incurred as a result of the ongoing execution of day to day business, they are included in operating costs and are not excluded from underlying operating profit
Profit or loss from amendment, curtailment, settlement or equalisation of Group pension schemes Exceptional items that are significant, non-recurring and outside of the normal operating practice. These items are described as
exceptional in order to appropriately represent the Group’s underlying business performance Note (iv): The Group’s contract profitability and balance sheet review (‘CPBS’) resulted in various adjustments, including in-year estimate changes, reversing prior year errors and a change in accounting policy – see page 9 for details. Reference is made throughout this document to the CPBS and its impact. Commentary in this document often discusses performance before the ‘one-off’ CPBS adjustments to better reflect the year-on-year differences in performance across the Group. Note (v): Underlying basic earnings per share (‘EPS’) is based on the Group’s underlying operating profit (see note iii). It includes the Group’s post-tax share of results of joint ventures and associates. This measure also includes the amortisation of acquired intangibles within joint ventures. Note (vi): Underlying free cash flow includes cash flows from exceptional items and the capital element of lease payment cash flows (rather than net new lease commitments which are reflected as a debt movement). Underlying cash flows are reconciled to statutory cash flows on page 15. Note (vii): This measure excludes operating leases as defined by IAS 17. This accounting standard has since been superseded by IFRS 16 but was the relevant standard at the inception of the banking facility. This net debt figure also includes finance leases (as defined by IAS 17) receivables and payables and continues to include loans from the Group to joint ventures. Supply chain financing balances are included in debt in both periods (September 2021: £11 million, September 2020: £77 million). See page 187 of our 2021 Annual Report and Financial Statements for full details of our definition of net debt. Note (viii): Net debt / EBITDA as measured in our banking covenants, which make a series of adjustments to both Group net debt and Group EBITDA. See page 18 for a reconciliation.

4 Babcock International Group PLC half year results for the six months ended 30 September 2021
CEO STATEMENT Progress on our strategy We are an international aerospace, defence and security company with a leading naval business, and we provide value-add services across the UK, France, Canada, Australasia and South Africa. We are focused on five strategic actions:
1. Aligning our portfolio 2. Implementing our new operating model 3. Rolling out our new people strategy 4. Developing our new ESG strategy 5. Exploring growth opportunities
We have made good progress across all of these areas in the first half of this year and we are now six months into a turnaround of the Group that we expect to take two to three years.
1) Aligning our portfolio Our strategy review defined the markets we wish to serve and therefore the best portfolio to hold. We are aligning the Group’s portfolio by divesting certain businesses. We are on track to deliver our targeted proceeds from disposals with the agreed sales of three businesses which, once completed, will generate around £400 million:
In August 2021, we completed the sale of the Oil and Gas aviation business for a cash consideration of £10 million In October 2021, we completed the sale of Frazer-Nash Consultancy for a cash consideration of £290 million We have also announced the sale of our shareholding in AirTanker Holdings Limited for a cash consideration of £126 million (£95 million
net of the repayment of shareholder loans). This transaction is expected to complete in the second half of this financial year and is subject to regulatory approvals
Our strategic work on portfolio alignment continues and we expect a small number of further disposals in the second half of the year. Proceeds generated will either be used to strengthen the balance sheet further or will be invested in the business for future growth.
2) Implementing our new operating model Our new operating model is creating a more efficient and effective business through a flatter structure. This will shorten communication lines and improve transparency and lead to an increase in the pace and clarity of business decisions. The numbers of management layers are being reduced across the Group and certain functions are being established in a centre-led model, increasing standardisation and removing duplication. As previously reported, approximately 1,000 employees will leave the Group this year as a result. The estimated restructuring cost of up to £40 million will be incurred in this financial year. The expected realisable annualised savings continue to be approximately £40 million, with roughly half this benefit in FY22. The exercise has commenced and £11 million of restructuring costs were incurred in the period. The Finance, Human Resources, Procurement and Supply Chain and IT functions have been reorganised to be centre-led. We are also looking at our property footprint, primarily in the UK, and planning to move to a regional hub model to reduce property costs. Alongside this operating model, we are making a series of changes to how we do business. We now have a new Group-wide approach to project management and project reviews and have changed how we manage the commercial bidding process. We have improved group-wide coordination on business growth, improved oversight on new bids and strengthened our focus on the large-scale, complex bid opportunities.
3) Rolling out our new people strategy Alongside the new operating model, we are developing an organisation that shares capability, talent, innovation and best practice across the Group and removes complexity. In the first half, we continued work on transforming our culture and launched our Purpose, “to create a safe and secure world, together”, across the Group. We have also launched the Group’s new Principles:
Be curious: we question everything, listen well and test the best ideas with pragmatic optimism Be kind: we consider the intent and impact of our actions at every turn Be courageous: we show up, speak out and dare to win. We are tenacious, but never reckless Think: outcomes: we focus our efforts on what our customers, communities, and colleagues really value. We never compromise on
safety or ethics Collaborate: we pull together in service of our purpose, as one global team, in partnership with our customers Own and deliver: We know our role and take personal accountability for delivering it
These Principles seek to unify the way we do things and guide how we work and will be embedded across the organisation as the year progresses. We have also introduced Agile working across the business, to provide an improved working environment and culture by offering our staff more autonomy and choice. In addition to providing detailed guidance to managers and resourcing leads, we have introduced systems for each member of Babcock to record their agile working status, whether they are location fixed or location flexible workers.

Babcock International Group PLC half year results for the six months ended 30 September 2021 5
4) Developing our new ESG strategy Our 2021 Annual Report set out the details of our ESG strategy, including our roadmap to achieve net zero carbon emissions for our estate, assets and operations (scope 1 and 2) by 2040. During the first half we took important steps in our ESG journey, including
Executive Committee completed the Chapter Zero Board Readiness assessment Incorporating the Task Force for Climate-related Financial Disclosures (TCFD) risk management and scenario planning into our strategic
planning cycle this year as we progress towards full TCFD disclosure requirements Set out high level scenario planning for three climate scenarios (1.5°C, 2.0°C and 3.0°C+) Progressed inclusion and diversity initiatives, including our target of 30% of senior managers to be female by 2025 (currently 21%)
5) Exploring growth opportunities The markets we address offer favourable medium-term growth. Business development highlights included:
Memorandum of Implementation with the UK and Ukraine to be the prime contractor on a programme of naval defence projects Memorandum of Understanding with Hyundai Heavy Industries in Korea for the CVX Aircraft Carrier Programme opportunity c.€500 million contract for defence aviation training activities in France c.£150 million logistic support contract, part of the UK’s next generation tactical communications & information systems c.£110 million contract to deliver the new Defence Strategic Radio Service (DSRS) to critical UK military operations c.£100 million contract for the design, manufacture, delivery, commissioning and in-service support to the Maritime Electronic Warfare
Systems Integrated Capability (MEWSIC) Increment 1 Secured the first export contract for our Arrowhead 140 frigate through a design licence agreement with PT PAL Indonesia
In September, we signed the Future Maritime Support Programme (FMSP) with the UK MOD to continue our support spanning UK naval base operations at HMNB Clyde and HMNB Devonport, alongside UK submarine and surface ship fleet support. This contract runs over five years to March 2026 and is worth around £3.5 billion. The Group’s contract backlog at 30 September 2021 was £10.9 billion (31 March 2021: £8.7 billion), with the increase mainly relating to the signing of FMSP.
Looking ahead We are making good progress on our turnaround and strategic development. While this year is a year of transition, we remain confident in our future prospects. We believe that our new strategic focus and operating model will significantly improve the Group’s profitability, and most importantly its cash generation, over the medium term. David Lockwood OBE Chief Executive Officer

6 Babcock International Group PLC half year results for the six months ended 30 September 2021
FINANCIAL REVIEW
Introduction At the end of the last financial year, the Group performed a Contract Profitability and Balance Sheet review (‘CPBS’) and also changed the presentation of its financial reporting to improve transparency. These changes have been applied to HY21 in these results. This Financial review covers:
How the changes made to the presentation of underlying reporting in our FY21 results have been applied to restating HY21 results Summary of how the Contract Profitability and Balance Sheet review, which was completed with our FY21 results, has been applied to HY21 Our financial performance in HY22, both statutory and underlying, including a reconciliation between the two
Changes to the presentation of underlying reporting The Group provides alternative performance measures, including underlying measures, to enable users to better understand the performance and earnings trends of the Group. These measures are considered to provide a consistent measure of business performance from year to year. They are used by management to assess operating performance and as a basis for forecasting and decision making and the Group believes are helpful for investors to analyse business performance. For the results of the financial year ended 31 March 2021 we made a series of changes to our underlying measures to improve transparency and provide a simpler set of accounts and financial commentary for the future. Results for the previous financial year (FY20) were restated. For these set of results, we use the same approach and restate the results for the half year ended 30 September 2020. There are four main changes to the presentation of our underlying results as outlined below.
1) Joint ventures and associates Previously the Group incorporated its share of the results of joint ventures and associates into each of the main captions of the income statement. Babcock’s share of joint ventures and associates profit after tax is now included as one line in the income statement. The Group used to include a share of joint ventures and associates revenue within its revenue line – which was then defined as underlying revenue. This definition is therefore no longer needed. This aligns revenue with the statutory IFRS measure and reduces the number of reconciling items between statutory and underlying income statement captions.
2) IFRIC12 Investment Income The group previously included IFRIC 12 investment income within underlying operating profit. This is now included within investment income to align with IFRS. The restated underlying income statement compared to that presented in the prior year Interim Statement is shown below. Note that the correction of prior year errors (within the ‘Prior year restatement’ column below) is covered on page 11.
Restatement of HY21 underlying income statement
30 September 2020
previously reported
Change to JV and Associates
presentation
Change to IFRIC 12
presentation
Prior year restatements
30 September
2020
restated
£m £m £m £m £m
Underlying revenue 2,243.7 (134.1) - (56.1) 2,053.5
Underlying operating profit 143.1 (31.2) (0.5) (26.9) 84.5
Share of results from joint ventures and associates - 11.6 - (5.3) 6.3
Net finance costs (44.2) 11.2 0.5 (0.1) (32.6)
Underlying profit before tax 98.9 (8.4) - (32.3) 58.2
Tax (19.8) 3.9 - (12.9) (28.8)
Underlying profit after tax 79.1 (4.5) - (45.2) 29.4
Underlying basic EPS 15.7p 5.8p
3) A clearer definition of underlying operating profit and Specific Adjusting Items
Underlying operating profit is now defined as IFRS statutory operating profit adjusted for Specific Adjusting Items. Items such as these may occur regularly, may be lumpy and may be profits or losses. As such they distort the reporting of underlying business performance measures if not adjusted for. The Specific Adjusting Items are: Amortisation of acquired intangibles Business acquisition, merger and divestment related items (being acquisitions and gains or losses on disposal of assets or businesses) Gains, losses and costs directly arising from the Group’s withdrawal from a specific market or geography, including closure costs,
severance costs, the sale of assets and termination of leases The costs of large restructuring programmes which significantly exceed the minor restructuring which occurs every year as part of
the normal day to day business. Where restructuring costs are incurred as a result of the on-going execution of day to day business, they are included in operating costs and are not excluded from underlying operating profit
Profit or loss from amendment, curtailment, settlement or equalisation of Group pension schemes Exceptional items that are significant, non-recurring and outside of the normal operating practice. These items are described as
exceptional in order to appropriately represent the Group’s underlying business performance

Babcock International Group PLC half year results for the six months ended 30 September 2021 7
The income statement can now be shown in a ‘three column’ format with Underlying results, Specific Adjusting Items and Statutory results in separate columns as shown below:
30 September 2021 30 September 2020 (restated)
Underlying £m
Specific Adjusting
Items £m
Statutory £m
Underlying £m
Specific Adjusting
items £m
Statutory £m
Revenue 2,223.0 – 2,223.0 2,053.5 – 2,053.5
Operating profit / (loss) 115.3 (39.9) 75.4 84.5 (869.8) (785.3)
Other income 6.2 – 6.2 – – –
Share of results of joint ventures and associates 9.6 – 9.6 6.3 – 6.3
Finance costs (32.4) – (32.4) (32.6) – (32.6)
Profit / (loss) before tax 98.7 (39.9) 58.8 58.2 (869.8) (811.6)
Income tax benefit/(expense) (19.6) 15.0 (4.6) (28.8) 8.1 (20.7)
Profit / (loss) after tax for the year 79.1 (24.9) 54.2 29.4 (861.7) (832.3)
Basic EPS 15.3p (5.0)p 10.3p 5.8p (170.6)p (164.8)p
Diluted EPS 15.1p (4.9)p 10.2p 5.8p (170.6)p (164.8)p
Note: the performance review on page 13 considers these results in more detail, they are shown here for presentational purposes.
4) Presentational changes to the underlying cash flow statement The Group has historically presented an underlying cash flow statement with free cash flow as an important measure. Previously cash flows relating to exceptional items were excluded from free cash flow. This has now been changed to more clearly present the cash generated from the Group’s operations. Also, following the introduction of IFRS16 (Leases), the Group previously deducted new lease commitments in entirety from operating cash flow. We have now amended this to show the capital element of leases as an operating cash flow (akin to capital expenditure) and the interest element of leases within the interest line. The lease commitment is now shown as a change in net debt when signed, not an operating cash flow. The restated HY21 underlying cash flow is shown below.

8 Babcock International Group PLC half year results for the six months ended 30 September 2021
Restatement of HY21 underlying cash flow
Underlying HY21
previously
reported
Prior year restatements
Changes to cash flow
presentation
Underlying
HY21
restated
£m £m £m £m
Underlying operating profit 111.4 (26.9) - 84.5
One-off CPBS adjustments - 21.4 - 21.4
Underlying operating profit excl. one-off CPBS adjustments 111.4 (5.5) - 105.9
Depreciation & amortisation 55.5 3.2 - 58.7
ROU asset depreciation 69.0 (3.6) - 65.4
Non-cash items 2.9 4.5 (0.5) 6.9
Working capital (14.7) 6.0 - (8.7)
Provisions 1.5 - - 1.5
Net capital expenditure (47.6) - - (47.6)
New lease commitments (34.4) 8.1 26.3 -
Capital element of lease payments - - (70.7) (70.7)
Underlying operating cash flow 143.6 12.7 (44.9) 111.4
Cash conversion % 129% 105%
Pension contributions in excess of income statement (42.2) - - (42.2)
Interest paid (28.0) (0.2) 0.5 (27.7)
Tax paid (30.0) - - (30.0)
Dividends from joint ventures 15.0 - - 15.0
Cash flows from exceptional items - - (30.9) (30.9)
Underlying free cash flow 58.4 12.5 (75.3) (4.4)
Acquisitions and disposals net of cash acquired 84.6 - - 84.6
Exceptional cash flow (30.9) - 30.9 -
Capital element of lease payments - - 70.7 70.7
New lease commitments - (8.1) (26.3) (34.4)
Investments in joint ventures - - - -
Own shares (2.2) - - (2.2)
Dividends paid (0.3) - - (0.3)
Net cash inflow 109.6 4.4 - 114.0
Opening net debt (previously reported) (1,594.9) - - (1,594.9)
Supply chain financing - opening adjustment - (93.3) - (93.3)
Lease liability – opening adjustment - (16.6) - (16.6)
Opening net debt (restated) (1,594.9) (109.9) - (1,704.8)
Exchange movements (33.7) 15.7 - (18.0)
Movement in net debt 109.6 4.4 - 114.0
Closing net debt (1,519.0) (89.8) - (1,608.8)
Note: the two main items in the correction of prior year errors impacting net debt are the movement of supply chain finance balances from trade creditors to debt (£93.3 million at 1 April 2020, £77.0 million at 30 September 2020 ) and the inclusion of certain lease liabilities (1 April 2020: £16.6 million).

Babcock International Group PLC half year results for the six months ended 30 September 2021 9
Contract profitability and balance sheet review (‘CPBS’) As outlined in the annual report and financial statements for the year ended 31 March 2021, the Group performed a review of the profitability of its contract portfolio and the carrying values of assets and liabilities on the balance sheet. This review resulted in around 140 adjustments totalling around £2 billion and related to a mixture of changes in estimates, the correction of prior year errors and a change in accounting policy. The results of this review have now been applied to the results for the six months ended 30 September 2020, with prior year errors corrected for and the change in accounting policy retrospectively applied. The changes in estimates, which were the largest adjusting items in FY21, were made at March 2021 (i.e. at the year-end) so have not been retrospectively applied to the half year financials, unless the fact pattern proved a ‘trigger point’ existing within HY21 and therefore requiring correction by restatement. In summary, the restatements for the results for the six months period ended 30 September 2020 are:
Cumulative restatement at 1 April 2019 of £308.1 million, being £45.3 million relating to a change in accounting policy and correction of prior year errors of £262.8 million. This is the same as the restatement in our FY21 results.
Cumulative restatement at 31 March 2020 of £230.7 million (being £59.8 million relating to a change in accounting policy and correction of prior year errors of £170.9 million). This is the same as the restatement in our FY21 results.
Changes recorded within the six months ended 30 September 2020 of £885.2 million, being £6.3 million relating to a change in accounting policy and £878.9 million relating to correction of errors. The correction of errors includes a restatement of HY21 goodwill of £760.5 million.
Summarised cumulative adjustments to retained earnings are as set out below:
£m
Restatement as at 1 April 2019 (308.1)
Adjustments recognised in the year ended 31 March 2020 77.4
Total restatement at 31 March 2020 (230.7)
Adjustments recognised in the six months ended 30 September 2020 (885.2)
Total restatement at 30 September 2020 (1,115.9)
Adjustments recognised in the six months ended 31 March 2021 (928.5)
Total adjustments recognised at 31 March 2021 (2,044.4)
The impact of items identified through the contract profitability and balance sheet on the income statement for the six months ended 30 September 2020 are summarised as follows:
Six months ended 30 September 2020
£m
Underlying £m
Specific Adjusting Items £m
Statutory £m
Revenue impacts (56.1) – (56.1)
Operating profit/(loss) impacts
Impairment/disposal of goodwill and acquired intangible assets
0.4 (821.1) (820.7)
Impairment of non-current assets (4.4) (4.9) (9.3)
Impairment of property, plant and equipment and right of use assets
(1.5) (1.4) (2.9)
Impairment/write down of current assets (3.7) – (3.7)
Introduction of/increase to liabilities (17.6) (7.5) (25.1)
Operating loss (26.8) (834.9) (861.7)
Share of income from JVs and associates (5.3) – (5.3)
Loss before tax impacts (32.1) (834.9) (867.0)
Tax adjustments (28.8) 8.1 (20.7)
Tax effect 2.5 – 2.5
Loss after tax for the period impacts (58.4) (826.8) (885.2)
Revenue: These adjustments have two components within them. Firstly is a correction of an error where revenue had been recognised on a contract the terms of which had been varied in February 2020. The effect of the contract change is that the Group is deemed an agent of the customer, not a principal and therefore the revenue should not be recognised. As a result of identifying this error, £36.5 million of revenue initially recognised in the six months ended 30 September 2020 was reversed. The second component of revenue adjustments reflect reassessment of constraint of variable revenue and reassessment of the recoverability of contract assets. Impairment of goodwill and acquired intangible assets: Management have reviewed the goodwill balance at 30 September 2020 for indicators of impairment and identified that the approved Q2 forecast presented to the Board in October 2020 and the strategy plan showed a decline in profitability from the forecast used to carry out the goodwill impairment test at 31 March 2020. This presents impairment indicators in the Aviation and Land operating segments at 30 September

10 Babcock International Group PLC half year results for the six months ended 30 September 2021
2020. Management performed an impairment test at 30 September 2020 for Aviation and Land and determined that a goodwill impairment of £592.3 million in Aviation and £168.2 million in Land should have been recorded. An adjustment at 30 September 2020 of £68.4 million was also recorded to allocate the goodwill that should have been allocated to the Holdfast disposal (June 2020). Partially offsetting this is the reversal of amortisation of £15.0 million in relation to the oil and gas business acquired intangible reflecting management’s judgement to dispose of this intangible at 1 April 2019 as a result of a reassessment of its useful economic life. Impairment of other non-current assets: The adjustment of £4.4 million within underlying operating profit in the six months ended 30 September 2020 relates to the write off of a loan to one of our joint ventures which is no longer deemed recoverable. The £4.9 million in the six months ended 30 September 2020 Specific Adjusting Items is due to the impairment of internally generated intangibles, mainly computer software. Impairment of property, plant and equipment and right of use assets: The £1.4 million in the six months ended 30 September 2020 Specific Adjusting Items is largely due to a fair value adjustment to land in the Land operating segment. Impairments of £1.5 million included in underlying operating profit largely relate to a lease incentive which was incorrectly accounted for at 30 September 2020, which is offset by lease additions which were missed at 30 September 2020. Impairment/write down of current assets: The impairment to current assets of £3.7 million relates to the reassessment of recoverability of trade and other receivables, including contract assets. Introduction of/increase to liabilities: The adjustments within underlying operating profit relate to reassessment of constraint of variable revenue, aircraft maintenance accruals, and other provisions. The £7.5 million in the six months ended 30 September 2020 Specific Adjusting Items relates primarily to an increase in the provision for the loss on disposal of Conbras, which was disposed of in October 2020. Share of income from joint ventures and associates: Historically the Group adjusted the results of the joint ventures and associates before equity accounting the relevant share in the income statement. Contract settlements remain outstanding in relation to works carried out some years ago by the Land sector’s ABC joint venture and an adjustment of £3.1 million for the six months ended 30 September 2020 has been recorded. The Group has also identified an instance where profit was incorrectly recorded in the ALC (Superholdco) Limited joint venture for the six months ended 30 September 2020. Correction of this error reduces Babcock’s share of results for this joint venture by £2.2 million. Tax adjustments: The underlying impact of £28.8 million in the six months ended 30 September 2020 primarily relates to the write off of deferred tax assets in Spain of £18.2 million now considered not recoverable within the Group’s forecasting horizon, as well as an adjustment to current tax receivable. Change in accounting policy: During the year, management amended the Group’s accounting policy regarding Power By the Hour agreements. For the six months ended 30 September 2020 this change in policy increases cost of revenue by £5.8 million and administration and distribution costs by £0.5 million. Further information is detailed at note 4.

Babcock International Group PLC half year results for the six months ended 30 September 2021 11
Impact on underlying results Revenue for HY21 has been restated by £56.1 million and underlying operating profit by £26.8 million. The split across sectors is shown below.
Revenue
£m
Underlying operating profit
£m
Marine (14.2) (14.2)
Nuclear (3.0) (1.8)
Land (38.0) (5.8)
Aviation (0.9) (5.0)
Total (56.1) (26.8)
In order to assist the users of the financial statements to better understand the effect of the transactions resulting from the CPBS on HY21 underlying operating profit performance, we have analysed them into ‘one-off CPBS adjustments’ and ‘recurring CPBS adjustments’. It is accepted that these terms are not defined in IFRS and are simplistic. For this purpose, we consider ‘one-off CPBS adjustments’ to be those that adjust the level of profit recognised either as a result of a one-off event or in previous periods, while ‘recurring CPBS adjustments’ are those that impact the amount of current period (and potentially future) profit before completion of the CPBS review. A single adjustment arising from the CPBS review might have both ‘one-off’ and ‘recurring’ elements. By way of illustration, the write-off of a long overdue debtor can be thought of as a ‘one off CPBS adjustment’ as – with today’s facts and circumstances – it would be a single transaction that would not otherwise impact the current or future year’s profitability. However, a long term contract that has had its profit margin reduced creates an adjustment that has the effect of reducing the cumulative profit recognised over the life of the contract from the old profit margin estimate to the new. An element of this adjustment can be seen to in effect reverse the profit on these contracts that had been recognised in HY21 (before completion of CPBS review). This element is included within ‘recurring CPBS adjustments’ whereas the remainder of the adjustment, simplistically relating to the profit previously recognised before HY21, is included within ‘one-off CPBS adjustments’. The restatement of revenue for HY21 (as shown in the table above) can be split into:
1. One-off CPBS adjustments of £14.3 million 2. Recurring CPBS adjustments of £41.8 million
The restatement of underlying operating profit for HY21 (as shown in the table above) can be split into:
1. One-off CPBS adjustments of £21.4 million 2. Recurring CPBS adjustments of £5.4 million
In addition to this, and as stated above, FY21 year-end changes in estimates do not cause retrospective restatement of the HY21 financials (e.g. reassessments of project profit margins). However these are a material variance in comparing the restated HY21 financials to the current year performance. The revenue and underlying operating profit impact of such changes in estimate total £51.5 million and £7.4 million respectively for the half year. We refer to these in our financial review where we bridge performance from HY21 to HY22.

12 Babcock International Group PLC half year results for the six months ended 30 September 2021
HY22 performance In order to simplify the presentation of underlying and statutory financial performance, the Group uses a three-column approach to the income statement. The first column below shows the underlying results with the second column showing the Specific Adjusting Items. The third column shows the statutory results. Details of the Specific Adjusting Items are included in note 2 of the financial statements.
30 September 2021 30 September 2020
Underlying £m
Specific Adjusting
Items £m
Statutory £m
Underlying £m
Specific Adjusting
items £m
Statutory £m
Revenue 2,223.0 – 2,223.0 2,053.5 – 2,053.5
Operating profit / (loss) 115.3 (39.9) 75.4 84.5 (869.8) (785.3)
Other income 6.2 – 6.2 – – –
Share of results of joint ventures and associates 9.6 – 9.6 6.3 – 6.3
Investment income 0.4 – 0.4 0.5 – 0.5
Net finance costs (32.8) – (32.8) (33.1) – (33.1)
Profit / (loss) before tax 98.7 (39.9) 58.8 58.2 (869.8) (811.6)
Income tax (expense) / benefit (19.6) 15.0 (4.6) (28.8) 8.1 (20.7)
Profit / (loss) after tax for the year 79.1 (24.9) 54.2 29.4 (861.7) (832.3)
Basic EPS 15.3p (5.0)p 10.3p 5.8p (170.6)p (164.8)p
Diluted EPS 15.1p (4.9)p 10.2p 5.8p (170.6)p (164.8)p
Statutory performance Revenue of £2,223 million was 8% higher than last year with business growth largely in Marine and Nuclear, and less COVID-19 business interruption than the prior period, more than offset the impact of disposals and foreign exchange. The statutory operating profit was £75.4 million compared to £785.3 million loss in the prior period, which includes charges from the CPBS and a restatement of HY21 goodwill of £760.5 million. The share of results from joint ventures and associates was higher than last year, which included a loss on one joint venture no longer in the Group. Other income of £6.2 million in the period (HY21: £nil) related to additional fees received in relation to the sale of our oil and gas aviation business. Our statutory profit after tax was £54.2 million compared to a large loss last year, again mainly reflecting CPBS charges. Basic earnings per share, as defined by IAS 33, was 10.3 pence per share (HY21: (164.8) pence).

Babcock International Group PLC half year results for the six months ended 30 September 2021 13
Underlying results
30 September
2021
30 September
2020
restated
Revenue £2,223m £2,054m
Underlying operating profit £115.3m £84.5m
of which one-off CPBS adjustments £(21.4)m
Underlying operating profit excluding one-off CPBS adjustments £105.9m
Other income £6.2m -
Share of results of joint ventures and associates £9.6m £6.3m
Investment income £0.4m £0.5m
Net finance costs £(32.8)m £(33.1)m
Underlying profit before tax £98.7m £58.2m
Tax £(19.6)m £(28.8)m
Underlying profit after tax £79.1m £29.4m
Non-controlling interests £(2.0)m -
Underlying profit attributable to shareholders £77.1m £29.4m
Underlying basic EPS 15.3p 5.8p
Revenue bridge
30 September 2020
Restated
£m
Add back one-off CPBS
adjustments
£m
30 September 2020
excl. one-off CPBS
£m
FX
impact
£m
Disposals of businesses
£m
CPBS estimates changes
£m
COVID-19
Recovery
£m
Other
trading
£m
30 September
2021
£m
Marine 592.6 10.2 602.8 (0.3) - (4.3) (20.7) 49.9 627.4
Nuclear 455.8 1.7 457.5 - (1.3) (7.9) 10.6 57.4 516.3
Land 564.0 1.4 565.4 7.9 (17.9) (30.4) 72.1 9.9 607.0
Aviation 441.1 1.0 442.1 (9.4) (12.3) (8.9) 23.0 37.8 472.3
Total 2,053.5 14.3 2,067.8 (1.8) (31.5) (51.5) 85.0 155.0 2,223.0
Revenue was £2,223 million, up 8% compared to last year. The table above shows the main comparison variances of revenue performance against last year. The ‘one-off CPBS adjustments’ that impacted HY21 totalling £14.3 million are covered on page 9. The other main variances year-on-year are:
FX impact – this relates to FX translation on the results, most notably South Africa in Land and Southern Europe in Aviation. Disposals of businesses – this reflects the absence of Conbras in our Land sector (sold in October 2020) and the civil nuclear
manufacturing business (sold in September 2020) in the period, as well as the sale of our oil and gas aviation business in August 2021. CPBS estimate changes – this is the impact of CPBS estimate changes made at March 2021 (i.e. at the year-end) that have not been
retrospectively applied to the HY21 results. As such they are a variance in the reported financials HY21 to HY22. The most significant item here is less revenue recognised on our DSG contract in the Land sector.
COVID-19 recovery – this reflects the relatively smaller impact from COVID-19 on operations this year compared to last year. The pandemic had a very significant impact on revenue in the first few months of last year, including stopping or heavily disrupting activity especially in our South Africa, airports and civil training businesses in the Land sector. Lower flying hours in the early stages of the pandemic also impacted the Aviation sector. Conversely, COVID-19 led to slightly more revenue in Marine as activity levels were increased, for example for the design and manufacture of ventilators. The COVID-19 impact in both periods has been estimated across our sectors and based on an analysis of direct and indirect impacts, which include a significant degree of judgement.
Other trading – this relates to revenue movements excluding all the items above. On this basis, revenue grew across all four sectors. Marine saw growth from a further ramp up of work on the Type 31 frigate programme while Nuclear saw growth from a ramp up in infrastructure work and increased submarine support activity. The small growth in Aviation reflects new contract wins, particularly in France. Land’s revenue was slightly higher despite the loss of the Heathrow baggage handling contract last year. Included within the current period financial results is £81.8 million (six months to 30 September 2020: £88.1 million) of revenue and cost of sales relating to the procurement of materials for the customer under the DSG contract within the land sector. No profit margin is attached this revenue.

14 Babcock International Group PLC half year results for the six months ended 30 September 2021
Underlying operating profit bridge
30 September 2020
Restated
£m
Add back one-off CPBS
adjustments
£m
30 September 2020
excl. one-off CPBS
£m
FX
impact
£m
Disposals of businesses
£m
CPBS estimates changes
£m
COVID-19
recovery
£m
Pension movements
£m
Other trading
£m
30 September
2021 £m
Marine 32.1 10.2 42.3 0.3 - (0.6) 4.0 1.0 (8.1) 38.9
Nuclear 34.2 1.8 36.0 - (0.1) (0.1) 2.1 (3.9) 2.2 36.2
Land 16.5 5.8 22.3 0.6 (0.6) (4.9) 13.0 (0.4) (0.2) 29.8
Aviation 1.7 3.6 5.3 (0.2) 0.2 (1.8) 5.5 - 1.4 10.4
Total 84.5 21.4 105.9 0.7 (0.5) (7.4) 24.6 (3.3) (4.7) 115.3
The ‘one-off CPBS adjustments’ that impacted HY21 totalling £21.4 million are covered on page 9. The main other variances year-on-year are:
FX impact – this relates to FX translation on the results. Disposals of businesses – this is the lower profit contribution from Conbras (sold in October 2020) and the civil nuclear manufacturing
business (sold in September 2020) partly offset by the sale of the oil and gas aviation business in August 2021, which made a loss last year.
CPBS estimate changes – this is the impact of CPBS estimate changes made at March 2021 (i.e. at the year-end) that have not been retrospectively applied to the HY21 results. As such they are a variance in the reported financials HY21 to HY22. The most significant item here is a lower margin recognised on our DSG contract in the Land sector.
COVID-19 recovery – as covered in the revenue section above, the first few months of the prior period were significantly impacted by the early stages of the pandemic, stopping or heavily disrupting activity especially in our South Africa, airports and civil training businesses in the Land sector, and lower flying hours in the Aviation sector. The partial recovery of these operations, albeit with higher operating costs or inefficiencies, caused the estimated £25 million profit variance. In certain cases, the additional costs of maintaining operations (e.g. antigen testing) continued to be recoverable from some customers in the first few months of the current period. The COVID-19 impact in both periods has been estimated across our sectors and based on an analysis of direct and indirect impacts, which include a significant degree of judgement. The estimate of differences in other ‘consequential’ expenses, e.g. business travel, have also been estimated in this analysis.
Pension movements – this reflects the higher pension costs this year split across our sectors. Other trading – other trading in Marine reflects the loss of the UK Royal Navy training contract last year, as well as increased business
development costs and a share of higher corporate costs. The Group is also investing significant resource in improving the control environment. The Nuclear sector’s results also reflects lower margin recognised in the first year of the FMSP contract.
Other income Other income of £6.2 million in the period (HY21: £nil) related to additional fees received in relation to the sale of our oil and gas aviation business. Share of results of joint ventures and associates The share of joint ventures and associates of £9.6 million was higher than last year (HY21: £6.3 million) as last year included a loss on the Dounreay joint venture which has since ended. Finance costs Finance costs of £32.8 million were flat on last year. This represented lower year-on-year interest (due to lower average net debt and the impact of the USPP, which had a higher interest rate, being paid down in March 2021) offset by a non-cash charge to the income statement on hedging our €550 million Eurobond. Tax charge The underlying tax charge of £19.6 million represents an underlying effective tax rate of 23%, being the underlying tax charge divided by underlying profit before tax, excluding the share of results from JVs and associates (already a post-tax number) and excluding other income. We continue to expect the Group’s full year underlying effective tax rate to be around 23% for this financial year. Exchange rates The translation impact of foreign currency movements resulted in a decrease in revenue of £1.8 million and a £0.7 million increase in underlying operating profit. The main currencies that have impacted our results are the South African Rand and the Euro. The currencies with the greatest potential to impact our results are the Euro, the South African Rand and the Canadian Dollar:
A 10% movement in the Euro against Sterling would affect underlying revenue by around £23.0 million and underlying operating profit by around £1.3 million per annum
A 10% movement in the South African Rand against Sterling would affect underlying revenue by around £14.0 million and underlying operating profit by around £1.5 million per annum
A 10% movement in the Canadian Dollar against Sterling would affect underlying revenue by around £7.7 million and underlying operating profit by around £0.8 million per annum
Earnings per share Underlying earnings per share for the half year was 15.3 pence (HY21: 5.8 pence), reflecting the higher underlying operating profit, other income and lower tax costs.

Babcock International Group PLC half year results for the six months ended 30 September 2021 15
Cash flow and net debt Our underlying cash flows are used by management to measure operating performance as they provide a more consistent measure of business performance year to year.
30 September
2021
30 September
2020
Underlying £m
Underlying
restated*
£m
Underlying operating profit 115.3 84.5
One-off CPBS 21.4
Underlying operating profit excl. one-off CPBS adjustments 115.3 105.9
Other income 6.2 -
Depreciation & amortisation 39.9 58.7
Right of use asset depreciation 59.7 65.4
Non-cash items 3.0 6.9
Working capital (140.1) (8.7)
Provisions (1.2) 1.5
Net capital expenditure (72.1) (47.6)
Capital element of lease payments (69.6) (70.7)
Underlying operating cash flow (58.9) 111.4
Cash conversion % (51)% 105%
Pension contributions in excess of income statement (88.5) (42.2)
Interest paid (18.4) (27.7)
Tax paid (10.3) (30.0)
Dividends from joint ventures and associates 24.7 15.0
Cash flows related to exceptional items (9.2) (30.9)
Underlying free cash flow (160.6) (4.4)
Net acquisitions and disposals 8.0 84.6
Cash outflow from settlement of derivative (5.4) -
Dividends paid (including non-controlling interests) - (0.3)
Purchase of own shares - (2.2)
Capital element of lease payments 69.6 70.7
Net new lease arrangements (19.6) (34.4)
Leases terminated on disposal of business 129.7 -
Exchange movements (15.0) (18.0)
Movement in net debt 6.7 96.0
Opening net debt (1,353.6) (1,704.8)
Closing net debt (1,346.9) (1,608.8)
Operating leases 408.6 618.5
Closing net debt excluding operating leases (938.3) (990.3)
The table below provides the reconciliation between the statutory cash flow and underlying cash flow table above.
30 September 2021 30 September 2020
Underlying
£m
Specific adjusting
items £m
Statutory £m
Underlying £m
Specific adjusting
items £m
Statutory £m
Cash generated from operations (1.3) (9.2) (10.5) 187.0 (23.5) 163.5
Proceeds on disposal of property, plant and equipment 10.3 - 10.3 2.3 6.2 8.6
Purchases of property, plant and equipment (77.7) - (77.7) (38.2) (13.6) (51.8)
Purchases of intangible assets (4.7) - (4.7) (11.8) - (11.8)
Vehicle leasing repayments (4.4) - (4.4) 0.6 - 0.5
Capital element of lease payments (69.6) - (69.6) (70.7) - (70.7)
Impairment of JV loans - - - - (4.4) (4.4)
Retirement benefit contributions in excess of income statement 88.5 - 88.5 42.2 (7.5) 34.7
Operating cash flow (58.9) (9.2) (68.1) 111.4 (42.8) 68.6

16 Babcock International Group PLC half year results for the six months ended 30 September 2021
Cash performance Underlying operating cash flow Underlying operating cash in the period after capital expenditure was an outflow of £58.9 million compared to an inflow of £111.4 million last year. This outflow was mostly driven by a large working capital outflow in the period. Movements in working capital The movement in working capital for the period was a £140.1 million outflow compared to a £8.7 million outflow last year. As previously disclosed, we intend to move away from the period end management of working capital, particularly creditors. The outflow in the period includes part of the unwind in VAT deferrals last year (c.£25 million of the total £56 million deferral) and some reversal of deferred creditors (c.£50 million impact), as well as an increase in amounts recoverable under contract in Aviation. Capital expenditure Net capital expenditure of £72.1 million in the period was higher than last year (HY21: £47.6 million) largely due to investment in the Rosyth Type 31 infrastructure in Marine, and investment in facilities in Nuclear. It is expected that net capital expenditure will continue to be high in FY22 as we continue the Type 31 investment and increase investment in other areas of the business, including upgrading facilities and IT equipment. Capital element of lease payments Capital element of lease payments of £69.6 million in the period represents the cash paid on lease obligations. This is reversed out below underlying free cash flow as the payment reduces our lease liability obligations. The oil & gas business represented £10 million of capital element of lease payments in the period. Cash interest paid Net Group cash interest paid, excluding that paid by joint ventures and associates, was £18.4 million (HY21: £27.7 million), lower year-on-year due to lower average net debt and the impact of the USPP (which had a higher interest rate) being paid down in March 2021. Taxation Underlying cash tax payments of £10.3 million (HY21: £30.0 million) represent payments on account for the expected full year tax payable. Pensions Pension cash outflow in excess of the income statement charge (excluding exceptional charges for curtailment losses) was £88.5 million (HY21: £42.2 million). This includes the previously disclosed £50 million additional payment into the Rosyth scheme made in April 2021. For FY22, the cash outflow in excess of the income statement charge is expected to be around £130 million. An additional £50 million payment into the Rosyth scheme, and a further £10 million contribution to the BIG scheme have been agreed to be made in April 2022. Dividends from joint ventures and associates
During the period the Group received £24.7 million in dividends from its joint ventures and associates (HY21: £15.0 million) which includes ALC exit dividends. We currently expect dividends from joint ventures to be around £30 million this financial year. Exceptional cash flows Cash outflows in the period classified as exceptional items were £9.2 million, all of which are restructuring costs. For the full year, we anticipate exceptional cash outflows of up to £40 million, being the restructuring costs relating to the new operating model implementation. This restructuring cost may be lower if an element of the reductions can be achieved through natural attrition. If the Italy fine is resolved and paid, this would be a further exceptional cash item. Underlying free cash flow Underlying free cash flow of £(160.6) million was significantly larger than last year’s outflow of £(4.4) million which reflects the large working capital outflow and higher pension payments. Acquisitions and disposals The net cash inflow from acquisitions and disposals of £8.0 million was the net proceeds from the sale of the Oil and Gas aviation business. New lease arrangements In addition to net capital expenditure, and not included in free cash flow, £19.6 million (HY21: £34.4 million) of additional leases were entered into in the period. These represent new lease obligations and so are included in our main net debt figure but do not involve any cash outflows at inception. Lease obligations terminated on disposal of business During the period there was £129.7 million of leases transferred on disposal of the Oil and Gas aviation business.

Babcock International Group PLC half year results for the six months ended 30 September 2021 17
Net debt The Group’s net debt at 30 September 2021 was £1,346.9 million, or £938.3 million excluding operating leases. Our average net debt in period was around £200 million higher than at the period end of 30 September 2021, partly reflecting the phasing of creditor payments around period end. This gap is smaller than in the prior year as we reduce the level of period end working capital management. Our net debt includes balances related to the use of supply chain financing in the Group with extended credit terms. At 30 September 2021 the amount included was £11 million (30 September 2020: £77 million). Funding and liquidity At 30 September 2021, the Group’s net cash balance (gross cash less overdrafts) was £367 million. This combined with the undrawn element of our RCFs gave us liquidity headroom of over £1.4 billion. As of 30 September 2021, the Group had access to a total of £2.4 billion of borrowings and facilities of mostly long-term maturities. These comprised:
€550 million bond maturing 6 October 2022 (in April 2021 this was hedged at £482 million) New £300 million 3-year RCF maturing 20 May 2024 (signed on 20th May 2021) £775 million revolving credit facility (RCF) maturing 28 August 2025 £300 million bond maturing 5 October 2026 €550 million bond, hedged at £493 million, maturing 13 September 2027 Committed overdraft facility of £50 million
Capital structure An important part of the transformation of Babcock is the strengthening of the balance sheet. Whilst there are several facets to balance sheet strength, the primary measurement relevant to Babcock is net debt / EBITDA (covenant basis) within our debt covenants, which was 2.8x at 30 September 2021. As mentioned earlier, the disposal of Frazer-Nash completed after the period end, for a net consideration of £290 million. If this had been received before 30 September 2021, the gearing ratio for the period would have reduced to 2.1x. The covenant level is 3.5 times, temporarily increased to 4.5 times until March 2022. Our near-term priority is to reduce the gearing ratio to below 2x and progress on our disposal programme is helping us reach this goal. There are, however, some short-term headwinds that remain. Free cash flow is expected to be negative in FY22 and HY23 as certain material cash outflows – particularly additional pension contributions and restructuring - have already been committed. Additionally, we intend to gradually unwind the gap between period end and average net debt. Despite the clear priority to delever the balance sheet, the Group will continue to invest organically in the business as this will be key to driving value in the medium term. As we announced in April 2021, we aim to return to strength without the need for an equity issue. In the coming months, once the disposal programme is complete, we will reassess the appropriate capital structure for the future of the Group. Pensions management An estimate of the technical provisions actuarial deficits as at 30 September 2021 for the principal schemes was around £400 million, predominantly reflecting discount rates based on UK gilts – which differs from the corporate bond approach of IAS 19. This technical provisions estimate is based on the assumptions used within the latest agreed valuation prior to 30 September 2021 for each of the three main schemes and includes the additional funding gap from longevity swaps. Note: restatement of pensions accounting position The longevity swaps related to the three main group pension schemes were previously valued in line with the collateral posted by each scheme with their intermediary. This was deemed a proxy for fair value in line with IAS 19. Having considered valuations of a notional replacement swap, or exit, we now believe the previous approach did not accurately reflect fair value and so we have changed our valuation approach accordingly. The prior year has been restated for the change in approach, reducing the net retirement benefit balances by £39.8 million as at 31 March 2021, with no impact on the Group Income Statement. This change does not affect the technical provisions assessed for those schemes during triennial valuations, their funding requirements, or the deficit recovery cash contributions agreed with each scheme.

18 Babcock International Group PLC half year results for the six months ended 30 September 2021
Net debt to EBITDA (covenant basis) This is the measure used in the covenant in our revolving credit facilities (RCF) and makes a number of adjustments from reported net debt and EBITDA. The covenant level is 3.5 times - amended to 4.5 times until 31 March 2022.
30 September 2021
£m
Last twelve months
30 September 2020
£m
Last twelve months
Underlying operating profit excl. one-off CPBS adjustments* 231.6 317.3
Depreciation and amortisation 99.0 107.6
Covenant adjustments** (15.2) (19.5)
EBITDA 315.4 405.4
JV and associate dividends 46.5 29.7
EBITDA + JV and associate dividends (covenant basis) 361.9 435.1
Net debt (938.3) (990.3)
Covenant adjustments*** (77.9) (80.1)
Net debt (covenant basis) (1,016.2) (1,070.4)
Net debt / EBITDA (covenant basis) 2.8x 2.5x
* excludes one-off CPBS adjustments as described on pages 9-11
** various adjustments made to EBITDA to reflect accounting standards at the time of inception of the original RCF agreement. The main adjustments
are to the treatment of leases within operating profit and pension costs
*** removing loans to JVs, finance lease receivables and adjusting for an average FX rate for the previous 12 months
Interest cover (covenant basis) This measure is also used in the covenant in our revolving credit facility (RCF), with a covenant level of 4.0 times.
30 September 2021
£m
Last twelve months
30 September 2020
£m
Last twelve months
EBITDA + JV and associate dividends (covenant basis) 361.9 435.1
Finance costs (52.4) (60.4)
Finance income 11.4 12.4
Covenant adjustments - 0.2
Net Group finance costs (41.0) (47.8)
Interest cover 8.8x 9.1x
Return on invested capital, pre-tax (ROIC) This measure is one of the Group’s key performance indicators (KPIs).
30 September 2021
£m
Last twelve months
30 September 2020
£m
Last twelve months
Underlying operating profit excluding one-off CPBS adjustments 231.6 317.3 Share of JV PAT excluding one-off CPBS adjustments 21.7 45.3
Underlying operating profit plus share of JV PAT 253.3 362.6
Net debt excluding operating leases 938.3 990.3
Operating leases 408.6 618.5
Shareholder funds 388.6 1,251.2
Retirement deficit / (surplus) 79.0 134.3
Invested capital 1,814.5 2,994.3
ROIC (pre-tax) 14.0% 12.1%

Babcock International Group PLC half year results for the six months ended 30 September 2021 19
OPERATIONAL REVIEWS
Marine
30 September 2021
31 September 2020
Restated
Contract backlog £2.6bn £2.6bn
Revenue £627.4m £592.6m
Underlying operating profit £38.9m £32.1m
Underlying margin 6.2% 5.4%
Revenue and underlying operating profit bridge:
30 September
2020
Restated
£m
Add back one-off CPBS adjustments
£m
30 September
2020
Restated
excl. one off CPBS
£m
FX
impact
£m
Disposals of businesses
£m
CPBS estimate changes
£m
COVID-19 recovery
£m
Pensions movements
£m
Other
trading
£m
30 September
2021 £m
Revenue 592.6 10.2 602.8 (0.3) - (4.3) (20.7) - 49.9 627.4
Underlying operating profit 32.1 10.2 42.3 0.3 - (0.6) 4.0 1.0 (8.1) 38.9
Financial review Revenue excluding FX and disposals grew by 6% led by a ramp up of work on the Type 31 frigate and warship support programmes, and growth in the LGE business. This growth more than offset the impact of the loss of our UK Royal Navy training contract last year and the year-on-year impact of COVID-19, with orders for the ventilators project in the UK contributing last year. Underlying operating profit of £38.9 million includes a £4.0 million year-on-year recovery in COVID-19 related costs compared to HY21, which was particularly impacted by site closures and lower activity levels. The recovery in activity was primarily in Frazer-Nash (higher margin consultancy) and Oman, where the site had been largely closed throughout the prior period. Other trading was worse and reflects the loss of the UK Royal Navy training contract last year, increased bidding and campaign costs across the sector and a share of higher corporate costs. The sector’s contract backlog of £2.6 billion is broadly in line with last year and the position at March 2021 (31 March 2021: £2.5 billion) as new contract wins replaced contracted work completed.
Operational review UK defence The Type 31 frigate programme is on schedule following the first cut of steel for HMS Venturer at our advanced manufacturing facility in Rosyth. The new infrastructure allows for parallel build and assembly activity free from weather disruption and is nearing completion ahead of first block assembly. The investment across our Rosyth site aims to ensure shipbuilding capability and capacity to support additional future opportunities. Warship support activity at Devonport was higher year-on-year with work on the Type 23 frigate programme ahead of last year, which included COVID-19 disruption. Our fleet time support programme continues with a large package for HMS Albion in the UK and HMS Richmond in Japan, to support the Carrier Strike Group. We’ve also continued to support the Type 23 and Sandown classes in the Gulf and UK before its exit from the UK fleet. We continue to support the development of the next generation of UK submarines. We have extended our contracts for Dreadnought launch weapons and signal ejector systems to include further scope on boats two to four, and converted all remaining scope on boat one to a firm basis. In September, we secured a c. £110 million contract to deliver the new Defence Strategic Radio Service to critical military operations and in November, we were awarded a c.£100 million 13-year contract by the UK MOD for the design, manufacture, delivery and in-service support to the Maritime Electronic Warfare Systems Integrated Capability (MEWSIC). Babcock will deliver the programme together as prime contractor with its collaboration partners, Elbit Systems UK and QinetiQ. During the period, we achieved full operational capacity in our new Morpheus Logistic Support Contract (LSC) with UK MOD which forms part of the Land Environment Tactical Communications and Information Systems (LE TacCIS) programme of opportunities to deliver the next generation tactical communications and information systems. International defence We support international defence markets from our UK operations and from our businesses in Canada, Australia, New Zealand, Oman and Korea. In Australia, following the AUKUS announcement to acquire nuclear-powered submarine technology without nuclear armaments, Australia will no longer proceed with the Attack class conventional submarine contract with Naval Group. As a result, our participation in the Attack class programme will also end. The AUKUS agreement may open further opportunities for Babcock.

20 Babcock International Group PLC half year results for the six months ended 30 September 2021
In December, we were selected by the Australian Government as the preferred tenderer to upgrade and sustain the Defence High Frequency Communication System (DHFCS) to support the Australian armed forces over the next 10 years, with a further four extension options, each of two years. In Canada, the extended Victoria Class In-Service Support Contract (VISSC) is continuing with work on two submarines underway. In Korea, we signed a Memorandum of Understanding with Hyundai Heavy Industries for the CVX Aircraft Carrier Programme opportunity. Babcock has established in-country business benefitting from investment in an assembly, maintenance, repair and overhaul facility in Busan, where Babcock currently assembles equipment for the Janbogo-III submarine programme. In Ukraine, we signed a tripartite Memorandum of Implementation with the Ministry of Defence of Ukraine and the UK Government. The two nations intend to push forward a major programme of Ukrainian naval projects, with Babcock as their designated prime industrial partner. The programme includes the enhancement of capabilities on existing naval platforms, the delivery of new platforms and training. The programme also serves to regenerate Ukrainian shipyards. In September, we won our first export contract for Arrowhead 140 frigate (which Type 31 is based on) through a design licence agreement with PT PAL Indonesia. The design licence will enable PAL to build two frigates in Indonesia with bespoke design modifications for the Indonesian Navy. Also in the period, it was confirmed that Babcock’s AH140 design is one of the shortlisted designs for Poland’s frigate programme. Energy and Marine Our Energy and Marine business continues to see strong demand for liquefied gas handling and re-liquefaction system across the LPG and LNG markets. Babcock LGE was awarded 47 projects, comprising 30 LPG Cargo Handling Systems and 17 ecoSMRT LNG Reliquefaction systems from major Korean shipyards in the Hyundai Group, all under the recently signed Frame Agreements for LGE market-leading Innovative Technology. In addition, LGE has also successfully completed trial for 19 LPG and LNG systems in the same period in Korea and China. In the period we signed a one-year framework agreement with Hyundai Heavy Industries, confirming Babcock LGE for the design and supply of ecoSMRT® LNG reliquefaction systems for LNG gas carriers.

Babcock International Group PLC half year results for the six months ended 30 September 2021 21
Nuclear
30 September 2021
31 September 2020
Restated
Contract backlog £3.0bn £0.4bn
Revenue £516.3m £455.8m
Underlying operating profit £36.2m £34.2m
Underlying margin 7.0% 7.5%
Revenue and underlying operating profit bridge:
30 September
2020
Restated
£m
Add back one-off CPBS adjustments
£m
30 September
2020
Restated
excl. one off CPBS
£m
FX
impact
£m
Disposals of businesses
£m
CPBS estimate changes
£m
COVID-19 recovery
£m
Pensions charge
£m
Other
trading
£m
30 September
2021 £m
Revenue 455.8 1.7 457.5 - (1.3) (7.9) 10.6 - 57.4 516.3
Underlying operating profit 34.2 1.8 36.0 - (0.1) (0.1) 2.1 (3.9) 2.2 36.2
Financial review Revenue excluding FX and disposals was 14% higher with increased submarine work and a further ramp up in our submarine infrastructure work. There was a small positive revenue impact from COVID-19 as ongoing operating costs, such as PPE and onsite antigen testing, were covered by the customer and thus booked as revenue, though at zero margin. Underlying operating profit of £36.2 million is broadly flat year-on-year with a small trading improvement and COVID-19 cost recovery improvement offset by the higher pension charge. The flat profit performance despite strong revenue growth partly reflects the lower margin in the initial period of the FMSP contract and a low margin recognised on infrastructure work. The sector’s contract backlog of £3.0 billion is up significantly since March (31 March 2021: £0.4 billion) due to the signing of the FMSP contract.
Operational review Defence In Devonport, work has commenced on the long term infrastructure programme to support future submarine classes and the submarine decommissioning and disposal programme. Work on 10 Dock is being accelerated to be ready in line with planning for the first deep maintenance period of the Astute Class at Devonport in the next few years. We continue to work on the Revalidation Assisted Maintenance Period (RAMP) programme for the Trafalgar Class and the life extension of the Vanguard Class. The UK’s future submarine programme work has also continued and our Dreadnought design phase contract was extended in the period for a further two years. The programme continues to plan and growth opportunities are being monitored and assessed. In September, the Future Maritime Support Programme (FMSP) was signed. This five-year c.£3.5 billion contract replaces the previous Maritime Support Delivery Framework (MSDF) and continues our support spanning UK naval base operations at HMNB Clyde and HMNB Devonport, alongside UK submarine and surface ship fleet support. The new contract is identified as being a ‘Qualifying Defence Contracts (QDC)’ and falls under Single Source Contract Regulations (SSCR). Civil In the period we secured a five-year extension to the multi-year Design Services Alliance (DSA) engineering framework, worth around £200 million, and a two-year extension to the Pile Fuel Cladding Silo (PFCS) project, both at Sellafield. We continue to support EDF and the project volumes are in line with expectations. In new build, Hinkley Point C continues to run behind schedule with delays in civil construction delaying the ramp up of MEH Alliance scope further.
During the period we signed a memorandum of understanding with Rolls-Royce for collaboration on the Small Modular Reactor (SMR) programme to help develop roles across manufacturing, licensing, design and delivery. Babcock, in collaboration with U-Battery, has developed a full-size mock-up of the main vessels of an advanced modular reactor at our Whetstone manufacturing facility. The mock-up intends to demonstrate the potential simplicity in construction and transport of an SMR, making a valuable contribution to the UK’s net zero efforts.

22 Babcock International Group PLC half year results for the six months ended 30 September 2021
Land
30 September 2021
31 September 2020
Restated
Contract backlog £2.9bn £3.4bn
Revenue £607.0m £564.0m
Underlying operating profit £29.8m £16.5m
Underlying margin 4.9% 2.9%
Revenue and underlying operating profit bridge:
30 September
2020
Restated
£m
Add back one-off CPBS adjustments
£m
30 September
2020
Restated
excl. one off CPBS
£m
FX
impact
£m
Disposals of businesses
£m
CPBS estimate changes
£m
COVID-19 recovery
£m
Pensions charge
£m
Other
trading
£m
30 September
2021 £m
Revenue 564.0 1.4 565.4 7.9 (17.9) (30.4) 72.1 - 9.9 607.0
Underlying operating profit 16.5 5.8 22.3 0.6 (0.6) (4.9) 13.0 (0.4) (0.2) 29.8
Financial review The disposal of Conbras in October 2020 caused the revenue variance of £17.9 million and profit variance of £0.6 million versus the prior period. Revenue excluding FX and disposals was 9% higher with an increase in activity levels across the sector compared to last year which was severely impacted by COVID-19 restrictions. As previously disclosed, the pandemic had a very significant impact on revenue in the first few months of last year, including stopping or heavily disrupting activity especially in our South Africa, airports and civil training businesses. There was a small increase in other trading as business growth more than offset the impact of the loss of the Heathrow baggage handling contract last year. Included within the current period financial results is £81.8 million (six months to 30 September 2020: £88.1 million) of revenue and cost of sales relating to the procurement of materials for the customer under the DSG contract. No profit margin is attached this revenue. Underlying operating profit benefited from the partial recovery of activity levels from the COVID-19 impact in the prior period. The other trading movement reflects better performances in our Rail and training businesses offset by the loss of the Heathrow baggage handling contract last year. The CPBS estimate changes mainly relate to a lower margin in our DSG business, consistent with the reassessment at the March 2021 year end. The sector’s contract backlog of £2.9 billion is slightly lower than at March 2021 (31 March 2021: £3.0 billion), reflecting the utilisation of multi-year backlog on long term contracts, mostly DSG.
Operational review Defence The DSG transformation programme has been implemented in response to the customer’s evolving requirements following the UK’s Integrated Review. This review stated that the Warrior platform will now be taken out of service, and a number of other changes will take place to the Army fleet. We have been working closely with the customer to support their requirements with the reduction phasing over the upcoming years. Defence training saw a recovery in activity levels compared to last year. After a competitive process, we were selected to participate in the British Army’s 2021 Army Warfighting Experiment to demonstrate the integration of a range of innovative collective training capabilities. In the period we were awarded a three year extension for the Defence College of Technical Training for EMTC 2, the provision of training design and delivery. Emergency services Activity was higher in the period with a ramp up of the Met Police training contract. The Police Education and Qualification Framework (PEQF) programme originally launched through a COVID-secure delivery model in January 2021 and in September 2021 we were able to return the programme to anticipated operational delivery. Our work with the London Fire Brigade performed well in the period. South Africa Our business in South Africa had a good half year as Eskom resumed outages to enable routine maintenance schedules. The equipment business saw a modest recovery and experienced some disruption from global shipping constraints. Other civil markets The Rail business saw a modest increase in volumes on track renewals and signalling framework while our civil training and power businesses saw higher activity compared to last year.

Babcock International Group PLC half year results for the six months ended 30 September 2021 23
Aviation
30 September 2021
31 September 2020
Restated
Contract backlog £2.4bn £3.0bn
Revenue £472.3m £441.1m
Underlying operating profit £10.4m £1.7m
Underlying margin 2.2% 0.4%
Revenue and underlying operating profit bridge:
30 September
2020
Restated
£m
Add back one-off CPBS adjustments
£m
30 September
2020
Restated
excl. one off CPBS
£m
FX
impact
£m
Disposals of businesses
£m
CPBS estimate changes
£m
COVID-19 recovery
£m
Pensions movements
£m
Other
trading
£m
30 September
2021 £m
Revenue 441.1 1.0 442.1 (9.4) (12.3) (8.9) 23.0 - 37.8 472.3
Underlying operating profit 1.7 3.6 5.3 (0.2) 0.2 (1.8) 5.5 - 1.4 10.4
Financial review Revenue excluding FX and disposals was up 12% with business growth and higher activity compared to last year, which was particularly hit by lower flying hours amid COVID-19 restrictions in the early months of the pandemic. Reported revenue was impacted by the sale of our Oil and Gas aviation business in August 2021. Growth, particularly in the French defence business, also improved revenue in the period. Underlying operating profit of £10.4 million was significantly improved on last year. This improvement mainly reflects the return to more normal conditions compared to the COVID-19 pressures last year, which included lower activity, personal protective equipment and refit costs. The CPBS estimate changes reflect estimate changes made at 31 March 2021 and not restated for. These estimate changes were mostly the adjustment of some project margins and asset impairments. The sector’s contract backlog of £2.4 billion is lower than last year and the position at March 2021 (31 March 2021: £2.9 billion) as the backlog for the Oil and Gas aviation business, sold in August 2021, was removed.
Operational review Defence Defence revenues increased as the H160 contract, which delivers search and rescue aircraft for the French Navy, ramped up. In June 2021, we were awarded a contract by the French MOD for an expansion of our existing defence aviation training activities. This five-year contract is worth around €500 million and started in June 2021. Activity across UK defence including RAF station support, Hawk and LAFT contracts was broadly flat. In Canada, we have signed a teaming agreement with Leonardo to bid together for the Future Aircrew Training programme (FACT). Aerial emergency services Revenue across the majority of our aerial emergency services businesses was slightly higher due to new contracts and compared to last year where COVID-19 had a large impact on activity levels. Performance in aerial emergency medical services was the most severely hit by COVID-19 last year and has seen some good recovery this year. Scandinavia saw higher flying hours over the summer with new services in Sweden and Norway. Southern European bases have all remained open and experienced varying increases in activity. Our firefighting operations across Europe and Canada saw higher activity levels compared to last year, particularly in Italy. During the period we have utilised five Super Puma helicopters in Spain that have been converted from oil and gas operations. These aircraft deliver much greater water capacity than existing helicopters and are able to deliver a significantly larger number of firefighters to wildfires than was previously possible. Oil and gas Revenue was higher year-on-year reflecting previous business wins. The sale of the Oil and Gas business completed in August 2021.

24 Babcock International Group PLC half year results for the six months ended 30 September 2021
Risks and uncertainties The Group’s risks and uncertainties are reviewed throughout the year. The principal risk and uncertainties are shown below. These, together with their potential impacts and mitigating actions we take in respect of them, are explained in more detail in the 2021 Annual Report, a copy of which is available at www.babcockinternational.com. There are no new principal risk and uncertainties. Since the publication of our 2021 Annual Report, the macro risk of cost inflation and supply chain disruptions has increased and the Group has taken mitigating actions where possible. The risk around financial resilience (see below) has reduced given the progress we have made on our disposal programme. Existing markets: we rely heavily on winning and retaining large contracts with a relatively limited number of major clients, whether in the UK, particularly the Ministry of Defence, or overseas, many of whom are (directly or indirectly) owned or controlled by government (national or local) and/or are (wholly or partly) publicly funded. Contract performance: we operate large contracts, which often requires us to price for the long term and for risk transfer. Our contracts can include fixed price and may in some cases assume inflation risk. We also contract with suppliers for the delivery of components of our large contracts. New markets: We seek new markets and contracts for our services both with existing and new customers, whether in territories where we are already established or in territories where we are not. Financial resilience: The Group is exposed to a number of financial risks, some of which are of a macroeconomic nature (for example, foreign currency, interest rates) and some of which are more specific to the Group (for example, liquidity and credit risks). The Group’s debt facilities include financial covenant tests every six months. Business interruption: Failure to withstand the impact of an event or a combination of events may significantly disrupt all or a substantial part of the Group’s business. Operational resilience: We are undertaking multiple change programmes with the introduction of a new strategy, a new operating model to restructure the shape of the Group, and a new people strategy, as well as undertaking the rationalisation of both the business portfolio and our property portfolio. Health, safety and environmental: Our operations entail the potential risk of significant harm to people, property or the environment, wherever we operate across the world. Regulatory and compliance burden: Our businesses are subject to the laws, regulations and restrictions of the many jurisdictions in which they operate People: We operate in many specialised engineering and technical domains, which require appropriate skills and experience. Pensions: The Group has significant defined benefit pension schemes in the UK, which provide for a specified level of pension funds to scheme members. IT and security: Our ability to deliver secure IT and other information assurance systems to maintain the confidentiality of sensitive information is a key factor for our customers. Acquisitions and disposals: We have built our core strengths organically and through acquisition. Decisions to acquire companies, as well as the process of their acquisition and integration, are complex, time-consuming and expensive. If we believe that a business is not “core” we may decide to sell that business.
Forward-looking statements Certain statements in this announcement are forward-looking statements. Such statements may relate to Babcock’s business, strategy and plans. Statements that are not historical facts, including statements about Babcock’s or its management’s beliefs and expectations, are forward-looking statements. Words such as ‘believe’, ‘anticipate’, ‘estimates’, ‘expects’, ‘intends’, ‘aims’, ‘potential’, ‘will’, ‘would’, ‘could’, ‘considered’, ‘likely’, and variations of these words and similar future or conditional expressions are intended to identify forward-looking statements but are not the exclusive means of doing so. By their nature, forward-looking statements involve a number of risks, uncertainties or assumptions, some known and some unknown, many of which are beyond Babcock’s control that could cause actual results or events to differ materially from those expressed or implied by the forward-looking statements. These risks, uncertainties or assumptions could adversely affect the outcome and financial effects of the plans and events described herein. Forward-looking statements contained in this announcement regarding past trends or activities should not be taken as a representation that such trends or activities will continue in the future. Nor are they indicative of future performance and Babcock’s actual results of operations and financial condition and the development of the industry and markets in which Babcock operates may differ materially from those made in or suggested by the forward-looking statements. You should not place undue reliance on forward-looking statements because such statements relate to events and depend on circumstances that may or may not occur in the future. Except as required by law, Babcock is under no obligation to update (and will not) or keep current the forward-looking statements contained herein or to correct any inaccuracies which may become apparent in such forward-looking statements. Forward-looking statements reflect Babcock’s judgement at the time of preparation of this announcement and are not intended to give any assurance as to future result.

Condensed consolidated income statement (unaudited)
Babcock International Group PLC half year results for the six months ended 30 September 2021 25
Note
Six months ended 30 September 2021
Six months ended 30 September 2020
(restated *)
Total
£m Total
£m
Revenue 2,5 2,223.0 2,053.5
Cost of revenue (1,986.1) (1,842.7)
Gross profit 236.9 210.8
Administration and distribution expenses (145.2) (185.9)
Goodwill impairment 2, 3 – (760.5)
Loss on divestments 18 (16.3) (49.7)
Operating profit/(loss) 2,5 75.4 (785.3)
Other income 6 6.2 –
Share of results of joint ventures and associates 2, 5 9.6 6.3
Finance income 7 5.6 8.1
Finance costs 7 (38.0) (40.7)
Profit/(loss) before tax 58.8 (811.6)
Income tax (expense) 8 (4.6) (20.7)
Profit/(loss) for the period 54.2 (832.3)
Attributable to:
Owners of the parent 52.2 (832.3)
Non-controlling interest 2.0 –
54.2 (832.3)
Earnings/(loss) per share 2
Basic 10.3p (164.8)p
Diluted 10.2p (164.8)p
*In the year ended 31 March 2021, the Group performed a contract profitability and balance sheet review which identified accounting errors and a change to one accounting policy. These also impact the six months ended 30 September 2020. Details of the restatements are contained in note 4.

Condensed consolidated statement of comprehensive income (unaudited)
26 Babcock International Group PLC half year results for the six months ended 30 September 2021
Note
Six months ended 30 September
2021 £m
Six months ended
30 September 2020 (restated *)
£m
Profit/(loss) for the year 54.2 (832.3)
Other comprehensive income/(loss)
Items that may be subsequently reclassified to income statement
Currency translation differences (6.9) 17.0
Reclassification of cumulative currency translation reserve on disposal (7.3) –
Fair value adjustment of interest rate and foreign exchange hedges (7.8) 13.6
Tax, including rate change impact, on fair value adjustment of interest rate and foreign exchange hedges 3.8 (0.9)
Hedging (losses)/gains reclassified to profit and loss (3.1) 1.4
Share of other comprehensive income/(losses) of joint ventures and associates 2.7 (5.2)
Tax, including rate change impact, on share of other comprehensive income of joint ventures and associates – 0.1
Items that will not be subsequently reclassified to income statement
Remeasurement of retirement benefit obligations 168.0 (269.3)
Tax, including rate change impact, on remeasurement of retirement benefit obligations (27.1) 51.1
Other comprehensive income/(loss), net of tax 122.3 (192.2)
Total comprehensive income/(loss) 176.5 (1,024.5)
Total comprehensive income/(loss) attributable to:
Owners of the parent 174.5 (1,024.8)
Non-controlling interest 2.0 0.3
Total comprehensive income/(loss) 176.5 (1,024.5)

Condensed consolidated statement of changes in equity (unaudited)
Babcock International Group PLC half year results for the six months ended 30 September 2021 27
Share capital
£m
Share premium
£m
Other reserve
£m
Capital redemption
£m
Retained earnings
£m
Hedging reserve
£m
Translation reserve
£m
Owners of the parent
£m
Non-controlling
interest £m
Total equity
£m
At 1 April 2020 as previously stated * 303.4 873.0 768.8 30.6 480.1 (97.3) (59.5) 2,299.1 15.7 2,314.8
Prior year adjustment (note 4) – – – – (39.9) – – (39.9) – (39.9)
At 1 April 2020 restated 303.4 873.0 768.8 30.6 440.2 (97.3) (59.5) 2,259.2 15.7 2,274.9
Loss for the period – – – – (832.3) – – (832.3) – (832.3)
Other comprehensive income/(loss)
–
–
–
–
(218.2)
9.0
16.7
(192.5)
0.3
(192.2)
Total comprehensive loss – – – – (1,050.5) 9.0 16.7 (1,024.8) 0.3 (1,024.5)
Dividends – – – – – – – – (0.3) (0.3)
Share-based payments – – – – 1.8 – – 1.8 – 1.8
Tax on shared-based payments – – – – 1.5 – – 1.5 – 1.5
Own shares – – – – (2.2) – – (2.2) – (2.2)
Net movement in equity – – – – (1,049.4) 9.0 16.7 (1,023.7) – (1,023.7)
At 30 September 2020 restated 303.4 873.0 768.8 30.6 (609.2) (88.3) (42.8) 1,235.5 15.7 1,251.2
At 1 April 2021 as previously stated 303.4 873.0 768.8 30.6 (1,629.1) (71.1) (48.2) 227.4 16.0 243.4
Prior year adjustment (note 4) – – – – (34.2) – – (34.2) – (34.2)
At 1 April 2021 restated 303.4 873.0 768.8 30.6 (1,663.3) (71.1) (48.2) 193.2 16.0 209.2
Profit for the period – – – – 52.2 – – 52.2 2.0 54.2
Other comprehensive income/(loss)
–
–
–
–
140.9
(4.4)
(14.2)
122.3
–
122.3
Total comprehensive income – – – – 193.1 (4.4) (14.2) 174.5 2.0 176.5
Share-based payments – – – – 2.0 – – 2.0 – 2.0
Tax on shared-based payments – – – – 0.9 – – 0.9 – 0.9
Net movement in equity – – – – 196.0 (4.4) (14.2) 177.4 2.0 179.4
At 30 September 2021 303.4 873.0 768.8 30.6 (1,467.3) (75.5) (62.4) 370.6 18.0 388.6
*Amount included in this line relates to amounts previously stated in the annual report for the year ended 31 March 2021.
The other reserve relates to the rights issue of new ordinary shares on 7 May 2014 and the capital redemption reserve relates to the issue and redemption of redeemable “B” preference shares in 2001.

Condensed consolidated statement of financial position (unaudited)
28 Babcock International Group PLC half year results for the six months ended 30 September 2021
Note
As at 30 September
2021 £m
As at 31 March
2021 (restated *) £m
Assets
Non-current assets
Goodwill 9 955.6 956.3
Other intangible assets 186.1 200.0
Property, plant and equipment 749.5 731.5
Right of use assets 353.6 521.2
Investment in joint ventures and associates 60.8 73.5
Loans to joint ventures and associates 42.6 42.1
Retirement benefit surpluses 17 115.5 14.6
Financial assets 10.8 11.2
Lease receivables 16.5 12.9
Derivatives 3.2 4.3
Deferred tax asset 120.1 148.9
2,614.3 2,716.5
Current assets
Inventories 168.7 162.4
Trade and other receivables 11 367.9 430.1
Contract assets 11 344.6 310.9
Income tax recoverable 47.9 48.4
Lease receivables 18.8 26.7
Derivatives 3.4 8.2
Cash and cash equivalents 16 784.1 904.8
1,735.4 1,891.5
Total assets 4,349.7 4,608.0
Equity and liabilities
Equity attributable to owners of the parent
Share capital 303.4 303.4
Share premium 873.0 873.0
Capital redemption and other reserves 661.5 680.1
Retained losses (1,467.3) (1,663.3)
Total equity attributable to owners of the parent 370.6 193.2
Non-controlling interest 18.0 16.0
Total equity 388.6 209.2
Non-current liabilities
Bank and other borrowings 1,319.2 1,318.8
Lease liabilities 328.4 486.2
Trade and other payables 12 1.8 1.9
Deferred tax liabilities 8.2 7.7
Other financial liabilities 59.0 51.1
Retirement benefit deficits 17 194.5 347.5
Provisions for other liabilities 14 63.8 73.7
1,974.9 2,286.9
Current liabilities
Bank and other borrowings 425.2 383.7
Lease liabilities 106.2 126.1
Trade and other payables 12 977.8 1,110.2
Contract liabilities 12 382.4 396.5
Income tax payable 8.3 9.7
Other financial liabilities 8.8 13.9
Provisions for other liabilities 14 77.5 71.8
1,986.2 2,111.9
Total liabilities 3,961.1 4,398.8
Total equity and liabilities 4,349.7 4,608.0
*The Group has restated the statement of financial position at 31 March 2021. Details of the restatements are contained in note 4.

Condensed consolidated cash flow statement (unaudited)
Babcock International Group PLC half year results for the six months ended 30 September 2021 29
Note
Six months ended
30 September 2021
£m
Six months ended
30 September 2020 (restated *)
£m
Cash flows from operating activities
Profit/(loss) for the period 54.2 (832.3)
Share of results of joint ventures and associates (9.6) (6.3)
Income tax expense 8 4.6 20.7
Finance income 7 (5.6) (8.1)
Finance costs 7 38.0 40.7
Depreciation and impairment of property, plant and equipment 31.4 51.4
Depreciation and impairment of right of use assets 62.4 65.9
Amortisation and impairment of intangible assets 18.3 32.8
Goodwill impairment – 760.5
Equity share based payments 2.0 1.8
Impairment of joint venture loans – 4.4
Net derivative fair value movement through profit or loss 0.1 1.8
Loss on disposal of subsidiaries, businesses and joint ventures and associates 18 16.3 49.7
Loss on disposal of property, plant and equipment 0.4 5.9
Loss on disposal of intangible assets 0.5 –
Cash generated from operations before movement in working capital and retirement benefit payments 213.0 188.9
(Increase)/decrease in inventories (8.9) 3.6
Increase in receivables (11.7) (25.4)
(Decrease)/increase in payables (110.7) 42.7
Decrease in provisions (3.7) (11.6)
Retirement benefit payments in excess of income statement (88.5) (34.7)
Cash generated from operations (10.5) 163.5
Income tax paid (10.3) (30.0)
Interest paid (23.9) (34.3)
Interest received 4.4 5.5
Net cash flows from operating activities (40.3) 104.7
Cash flows from investing activities
Disposal of subsidiaries and joint ventures and associates, net of cash disposed 18 8.0 84.6
Dividends received from joint ventures and associates 24.7 15.0
Proceeds on disposal of property, plant and equipment 10.3 8.6
Purchases of property, plant and equipment (77.7) (51.8)
Purchases of intangible assets (4.7) (11.8)
Loans repaid by joint ventures and associates 0.6 4.6
Net cash flows from investing activities (38.8) 49.2
Cash flows from financing activities
Lease principal payments (69.6) (70.7)
Cash outflow from non-hedging derivatives (5.4) –
Bank loans repaid (15.3) (732.0)
Loans raised and facilities drawn down 3.8 –
Dividends paid to non-controlling interest – (0.3)
Purchase of own shares – (2.2)
Net cash flows from financing activities (86.5) (805.2)
Net decrease in cash, cash equivalents and bank overdrafts 16 (165.6) (651.3)
Cash, cash equivalents and bank overdrafts at beginning of period 530.9 1,348.7
Effects of exchange rate fluctuations 1.2 1.9
Cash, cash equivalents and bank overdrafts at end of period 16 366.5 699.3
* In the year ended 31 March 2021, the Group performed a contract profitability and balance sheet review which identified accounting errors and a change to one accounting policy. These also impact the six months ended 30 September 2020. Details of the restatements are contained in note 4.

Notes to the consolidated financial statements continued (unaudited)
30 Babcock International Group PLC half year results for the six months ended 30 September 2021
1. Basis of preparation and significant accounting policies These condensed consolidated half year financial statements have been prepared in accordance with IAS 34, Interim Financial Reporting and the Disclosures and Transparency Rules of the Financial Services Authority, the Listing Rules and UK-endorsed International Financial Reporting Standards (IFRS). They should be read in conjunction with the Annual Report and financial statements for the year ended 31 March 2021, which were prepared in accordance with EU endorsed IFRS and the applicable legal requirements of the Companies Act 2006. These condensed consolidated half-yearly financial statements do not comprise statutory accounts within the meaning of Section 435 of the Companies Act 2006. The annual report and financial statements for the year ended 31 March 2021 were reported upon by the Group’s auditor and delivered to the registrar of companies. The report of the auditor on the annual report and financial statements for the year ended 31 March 2021 was unqualified, did not include a reference to any matters to which the auditor drew attention by way of emphasis without qualifying their report and did not contain statements under Section 498 (2) or (3) of the Companies Act 2006. The accounting policies used and presentation of these condensed consolidated half year financial statements are consistent with the accounting policies applied by the Group in its consolidated annual report and financial statements as at, and for the year ended, 31 March 2021, except as noted below, and comply with amendments to IFRS.
The half year report for the six months ended 30 September 2021 was approved by the Directors on 7 December 2021.
Significant accounting policies
New and amended standards adopted by the Group
There are no new standards, amendments or interpretations that are not yet effective that are expected to have a material impact on the Group’s operations.
The Group has amended one accounting policy in response to an IFRIC agenda decision released in April 2021 regarding software-as-a-service arrangements. Further detail is included in note 4.
Basis of preparation
The Directors consider it appropriate to adopt the going concern basis of accounting in preparing the interim financial information.
In assessing the appropriateness of the going concern basis of accounting, the Directors have considered whether the Group has adequate resources to continue in operational existence for at least 12 months from the date of signing. The Directors reviewed the resources available to the Group in the form of cash and committed facilities. As of 30 September 2021, the Group’s committed facilities and bonds totalling £2.4 billion were the £300 million revolving credit facility (RCF), the £775 million five year multi-currency RCF, and the three tranches of notes (€550 million 1.75% notes, £300m million 1.875% notes and €550 million 1.375% notes) issued under the Group’s Eurobond programme.
The RCFs are the only facilities with covenants attached. The key covenant ratios are (i) net debt to EBITDA (gearing ratio) (ii) and EBITDA to net interest (interest cover). These are measured twice per year, on 30 September and 31 March. The lending banks have agreed to raise the covenant limit for the gearing ratio from 3.5x to 4.5x for the measurement periods ending 30 September 2021 and 31 March 2022. For all subsequent periods, the gearing ratio covenant returns to 3.5x. To assess the level of headroom within the available facilities, a reverse stress test was performed to see what level of performance deterioration against the base case budget (in both EBITDA and net debt) was required to challenge covenant levels. Of the remaining measurement points within the three year period approved by the Board, the lowest required reduction in forecast EBITDA to hit the covenant level was 58% and the lowest net debt increase was 68%. Given the mitigating actions that are available and within management’s control, such movements are not considered plausible. There have been no breaches of debt covenants during the reporting period.
The Directors have also considered the Group’s forecasts when assessing going concern, having considered the 18 month period from the date of signing the Group’s condensed consolidated financial statements for the six months ended 30 September 2021. These are prepared using a bottom up approach, aggregating the budgets for the individual business units into Sector budgets. The Sector budgets and the consolidated Group budget is then reviewed by the Board and used to monitor business performance. The impacts of the prior year contract profitability and balance sheet review (‘CPBS’) and the restructuring now underway as a result of the change in operating model have been incorporated into the forecasts, as has the future expected impact of COVID-19 on the Group.
The Directors have performed sensitivity analyses on the latest Group forecast for the duration of the assessment period. These sensitivities include a reduction in bid pipeline closure (business winning), a reduction in the assumed restructuring savings, a deterioration in large programme performance across the Group, a deterioration in profitability arising from cost base inflation, a deterioration in the Group’s working capital position and a regulator imposed cessation in flying two of the largest aircraft fleets in the Group. These sensitivities did not present any material uncertainties in relation to the Group’s ability to continue as a going concern.
As outlined in the annual report and financial statements for the year ended 31 March 2021, we are aligning the Group’s portfolio by divesting certain businesses and this is expected to generate at least £400 million. In the first half of this year we exchanged contracts on three divestments, two of which are still subject to completion at the reporting date, which, once completed, will generate around £400 million. Our strategic work on portfolio alignment continues and we expect a small number of further disposals in the second half of the year. Proceeds generated will either be used to strengthen the balance sheet further or will be invested in the business for future growth. This divestment programme has been included in the going concern assessment.
Having considered these matters, the Directors do not believe there are any material uncertainties to disclose in relation to the Group’s ability to continue as a going concern.

Babcock International Group PLC half year results for the six months ended 30 September 2021 31
1. Basis of preparation and significant accounting policies (continued) Key sources of estimation uncertainty
The application of the Group’s accounting policies requires the use of estimates. The key sources of estimation uncertainty at the end of the reporting period that may have a significant risk of causing a material adjustment to the carrying amount of assets and liabilities within the next financial year are set out below:
Revenue and profit recognition: The Group’s revenue recognition policies are set out in note 1 of the annual report for the year ended 31 March 2021. Revenue is recognised over time based on costs incurred for the majority of the Group’s contracts with customers. These policies require management to make an estimate of the cost to complete for long term contracts. Estimates of cost to complete include assessment of contract contingencies arising out of technical, commercial, operational and other risks. The assessments of all significant contract outturns are subject to review and challenge, and judgements and estimates are reviewed regularly throughout the contract life based on latest available information and adjustments are made where necessary. As contracts near completion, often less judgement is required to determine the expected outturn. As at 30 September 2021, the Group’s contract assets and contract liabilities amounted to £344.6 million and £382.4 million, respectively. The Group has considered the nature of the estimates involved in deriving these balances and concluded that it is possible that outcomes within the next financial year may be different from the Group’s assumptions applied as at 30 September 2021 and could require a material adjustment to the carrying amounts of these assets and liabilities in the next financial year. In the annual report and financial statements for the year ended 31 March 2021, note 1 provided a sensitivity indicator regarding the impact of the costs to complete estimate on revenue and profit recognition.
Defined benefit pension schemes obligation: The Group’s defined benefit pension schemes are assessed annually in accordance with IAS 19 and the valuation of the defined benefit pension obligations is sensitive to the inflation and discount rate actuarial assumptions used. There is a range of possible values for the assumptions and small changes to the assumptions may have a significant impact on the valuation of the defined benefit pension obligation. In addition to the inflation and discount rate estimates, a key estimation relates to the expected availability of future accounting surpluses under IFRIC 14. In the annual report and financial statements for the year ended 31 March 2021, note 29 provided a sensitivity analysis of the Group’s defined benefit pension schemes.
Deferred tax assets: The Group has carried forward tax losses in a number of jurisdictions, and therefore has to assess the extent to which a deferred tax asset should be recognised in respect of these. The recognition of deferred tax assets can be subjective, and the Group is required to assesses the future availability of carried forward losses and other tax attributes by reference to the jurisdiction-specific rules around the carry forward and utilisation, and whether it is probable that future taxable profits will be available against which the attribute can be utilised. In the annual report and financial statements for the year ended 31 March 2021, note 1 provided a sensitivity indicator regarding the deferred tax asset balance. There have been no changes to the Group’s key assumptions in the six months ended 30 September 2021.
The carrying value of goodwill: Goodwill is tested annually for impairment based on assumptions in relation to the cash flows expected to be generated by cash generating units, together with appropriate discounting of the cash flows. The assessment of the carrying value of goodwill is included as a critical accounting estimate given the significance of the remaining carrying value of goodwill and the inherent level of estimation uncertainty required to undertake impairment testing. In the annual report and financial statements for the year ended 31 March 2021, note 13 provided a sensitivity indicator regarding the impairment of goodwill.
Italy fine: As outlined in the annual report for the year ended 31 March 2021, in the year ended 31 March 2020 the Group was issued a fine of €51 million by the Italian Competition Authority for certain anti-trust violations. In In July 2021, the Court to the Italian Council of State annulled the fine, though allowing the Authority leave to re-calculate it, which is expected in the next few months. Taking into account the guidance given by the Council to the Authority on the recalculation, we further expect the Authority to reduce the fine. At 30 September 2021 the Group has recorded a provision of £20 million, being management’s best estimate of the Group’s obligation based on an interpretation of the Council’s guidance. We have not received any indication from the Authority as to how it will choose to interpret the Council’s guidance.
Critical accounting judgements
Critical accounting judgements, apart from those involving estimations, that are applied in the preparation of the consolidated financial statements are discussed below:
Revenue and profit recognition: The Group’s contracts are often amended for changes in customers’ requirements. The Group’s preferred approach is to approve contract variations following scope and pricing agreement by contract amendment. However the approval of contract modifications is often required to be at pace and other mechanisms can be used to achieve effective approval of contract modifications, informed by established customer relationships and local working arrangements. The Group is required to make a judgement regarding the point in time at which a contract modification is approved and should be accounted for, which impacts on the point at which revenue and profit can be recognised.
Impact of COVID-19: During the six months ended 30 September 2021 the Group benefitted from some COVID-19 recovery. Management considered the potential impact of COVID-19 on the Group’s future performance as part of the budgeting and business planning process and concluded that COVID-19 is not expected to materially impact the Group in the medium or long term. The Group’s budget for FY22 includes contingency to address remaining uncertainty.
Determining the Group’s operating segments: Management exercises judgement in determining the Group’s operating segments. This determination is generally straightforward and factual, however in some cases judgement is required. There have been no changes to the operating segments in the current period.

Notes to the consolidated financial statements continued (unaudited)
32 Babcock International Group PLC half year results for the six months ended 30 September 2021
1. Basis of preparation and significant accounting policies (continued) Identification of prior period errors
As outlined in the annual report and financial statements for the year ended 31 March 2021, the Group performed a contract profitability and balance sheet review which resulted in the identification of a number of prior period errors. The results of the Group have been restated, where practicable, by retrospectively restating the Group’s prior period results for the affected periods. Where an item identified through the contract profitability and balance sheet review has been found to impact the results for the six months ended 30 September 2020 we have restated the comparative financial information. An additional restatement has been made relating to the valuation of the Group’s longevity swaps. See note 4 for further details.
Changes in accounting policies
Management have implemented one change in accounting policy during the six months ended 30 September 2021 in response to an IFRS Interpretation Committee agenda decision in April 2021. See note 4 for further details.
2. Adjustments between statutory and underlying information Definition of underlying measures and exceptional items
The Group provides alternative performance measures, including underlying operating profit, to enable users to better understand the performance and earnings trends of the Group. These measures are considered to provide a consistent measure of business performance from year to year. They are used by management to assess operating performance and as a basis for forecasting and decision-making, as well as the planning and allocation of capital resources. They are also understood to be used by investors in analysing business performance.
The Group’s alternative performance measures are not defined by IFRS and are therefore considered to be non-GAAP measures. The measures may not be comparable to similar measures used by other companies and they are not intended to be a substitute for, or superior to, measures defined under IFRS. The Group’s alternative performance measures are consistent with the year ended 31 March 2021.
Underlying operating profit
Underlying operating profit excludes certain Specific Adjusting Items that distort the reporting of underlying business performance measures if they are not adjusted for. Underlying operating profit eliminates potential differences in performance caused by purchase price allocations on business combinations in prior periods (amortisation of acquired intangibles), business acquisition, merger and divestment related items and large, infrequent restructuring programmes. Transactions such as these may happen regularly and could be lumpy and may be profits or losses. Specific Adjusting Items include: • Amortisation of acquired intangibles; • Business acquisition, merger and divestment related items (being acquisitions and gains or losses on disposal of assets or businesses); • Gains, losses and costs directly arising from the Group’s withdrawal from a specific market or geography, including closure costs, severance
costs, the disposal of assets and termination of leases; • The costs of large restructuring programmes that significantly exceed the minor restructuring which occurs in most years as part of normal operations. Restructuring costs incurred as a result of normal operations are included in operating costs and are not excluded from underlying operating profit; • Profit or loss from amendment, curtailment, settlement or equalisation of Group pension schemes; and • Exceptional items that are significant, non-recurring and outside of the normal operating practice. These items are described as exceptional in order to appropriately represent the Group’s underlying business performance. Exceptional items are set out in the Exceptional items section below.
Income statement including underlying results
Six months ended 30 September 2021 Six months ended 30 September 2020 (restated)
Underlying
£m
Specific Adjusting
Items £m
Statutory £m
Underlying £m
Specific Adjusting
Items £m
Statutory £m
Revenue 2,223.0 – 2,223.0 2,053.5 – 2,053.5
Operating profit/(loss) 115.3 (39.9) 75.4 84.5 (869.8) (785.3)
Other income 6.2 – 6.2 – – –
Share of results of joint ventures and associates 9.6 – 9.6 6.3 – 6.3
Investment income 0.4 – 0.4 0.5 – 0.5
Net finance costs (32.8) – (32.8) (33.1) – (33.1)
Profit/(loss) before tax 98.7 (39.9) 58.8 58.2 (869.8) (811.6)
Income tax (expense)/benefit (19.6) 15.0 (4.6) (28.8) 8.1 (20.7)
Profit/(loss) after tax for the year 79.1 (24.9) 54.2 29.4 (861.7) (832.3)

Babcock International Group PLC half year results for the six months ended 30 September 2021 33
2. Adjustments between statutory and underlying information (continued) Earnings per share including underlying measures
Six months ended 30 September 2021 Six months ended 30 September 2020 (restated)
Underlying
£m
Adjusting items
£m
Statutory £m
Underlying £m
Adjusting items
£m Statutory
£m
Profit/(loss) after tax for the year 79.1 (24.9) 54.2 29.4 (861.7) (832.3)
Amount attributable to owners of the parent 77.1 (24.9) 52.2 29.4 (861.7) (832.3)
Amount attributable to non-controlling interests
2.0 – 2.0 – – –
Weighted average number of shares (m) 505.0 505.0 505.1 505.1
Effect of dilutive securities (m) 6.3 6.3 1.1 1.1
Diluted weighted average number of shares (m) 511.3 511.3 506.2 506.2
Basic EPS 15.3p (5.0)p 10.3p 5.8p (170.6)p (164.8)p
Diluted EPS 15.1p (4.9)p 10.2p 5.8p (170.6)p (164.8)p
Details of Specific Adjusting Items
The impact of Specific Adjusting Items is set out below:
Six months ended 30
September 2021
£m
Six months ended 30
September 2020
(restated) £m
Amortisation of acquired intangibles (10.6) (20.3)
Business acquisition, merger and divestment related items (21.1) (49.7)
Gains, losses and costs directly arising from withdrawal from a specific market or geography – (7.1)
Profit or loss from amendment, curtailment, settlement or equalisation of Group pension schemes – (7.5)
Restructuring (9.4) (11.0)
Exceptional items 1.2 (774.2)
(39.9) (869.8)
Income tax benefit
Amortisation of acquired intangibles 2.6 4.1
Gains, losses and costs directly arising from withdrawal from a specific market or geography – 1.0
Profit or loss from amendment, curtailment, settlement or equalisation of group pension schemes – 1.4
Restructuring 1.7 0.5
Tax on exceptional items (0.5) 1.1
Exceptional tax items – change in UK tax rate 11.2 –
15.0 8.1
Explanation of Specific Adjusting Items
Amortisation of acquired intangibles
Underlying operating profit excludes the amortisation of acquired intangibles. This item is excluded from underlying results as it arises as a result of purchase price allocations on business combinations, and is a non-cash item which does not change each year dependent on the performance of the business. It is therefore not considered to represent the underlying activity of the Group. Intangible assets arising as a result of the purchase price allocation on business combinations include customer lists, technology-based assets, order book and trade names. Amortisation of internally generated intangible assets is included within underlying operating profit.
Amortisation of acquired intangibles for the six months ended 30 September 2020 has been restated following identification of prior period errors through the CPBS, resulting in a reduction to amortisation charged through cost of revenue of £7.7 million. Further detail is included in note 4.
Business acquisition, merger and divestment related items
The total net loss relating to business acquisition, merger and divestment related items was £21.1 million. Of this, £16.3 million relates to the disposal of the Group’s Oil and Gas business. Further detail is included in note 18. The remaining £4.8 million relates to professional fees and other related costs incurred in relation to the Group’s divestment programme for transactions which were not completed at 30 September 2021. Further details on the Group’s divestment programme are included in note 1.

Notes to the consolidated financial statements continued (unaudited)
34 Babcock International Group PLC half year results for the six months ended 30 September 2021
2. Adjustments between statutory and underlying information (continued) Business acquisition, merger and divestment related items (continued)
The prior period included a net loss of £49.7 million, consisting of a £38.2 million loss on disposal of the Group’s share in the Holdfast joint venture and losses arising on disposal of subsidiary undertakings of £0.6 million for Cavendish Nuclear Manufacturing Limited. In addition a provision of £10.9 million was made in relation of the disposal of Conbras Serrvicos Tecnicos Supporte Ltda which completed in October 2020. Included in the prior period is a restatement of £68.4 million in relation to allocation of goodwill to the disposal of Holdfast and £6.9 million in relation to an increased provision for the loss on disposal of Conbras Serrvicos Tecnicos Supporte Ltda. Further detail is included in note 4.
Gains, losses and costs directly arising from the Group’s withdrawal from a specific market or geography
In the prior period the Group exited its Airport baggage handling business, incurring costs of £3.1 million. Further costs were incurred in relation to exits in the previous financial year from the oil and gas business in Congo (£2.0 million), the overseas Powerlines business (£0.7 million) and certain Rail related contracts (£1.3 million).
Restructuring
The Group incurred £10.8 million of charges in relation to the new operating model programme. Further detail is included in the CEO Statement on page 4. This was offset by the release of restructuring provision totalling £1.4 million.
In the prior period, the Group incurred a restructuring charge of £11.0 million.
Profit or loss from amendment, curtailment, settlement or equalisation of Group pension schemes.
In the prior period, the Group incurred a curtailment charge of £7.5 million in relation to the closure of the Rosyth defined benefit pension scheme to future accrual.
Exceptional items
In the prior period, business acquisition and divestment related items and restructuring charges were included as exceptional items (previously referred to as ‘Exits and disposals’). These remain as Specific Adjusting Items but are no longer included as exceptional items in order to provide greater clarity and consistency to the users of the financial statements.
Exceptional items are those items which are significant, non-recurring and outside the normal operating practice of the Group.
Six months ended 30
September 2021
£m
Six months ended 30
September 2020
(restated) £m
Operating costs
Impairment of goodwill – (760.5)
Impairment of internally generated intangible assets – (4.9)
Impairment of property, plant and equipment and aircraft fleet rationalisation – (8.8)
Onerous contracts 0.6 –
Other 0.6 –
Exceptional items – Group 1.2 (774.2)
Tax on exceptional items (0.5) 1.1
Exceptional items – net of tax 0.7 (773.1)
Explanation of exceptional items
Impairment of goodwill
The Group reviewed the goodwill balance at 30 September 2020 for indicators of impairment and identified that the Q2 forecast and strategy plan presented to the Board showed a decline in profitability from the forecast used to carry out the goodwill impairment test at 31 March 2020. This did not present an impairment indicator in the Marine and Nuclear operating segments due to the headroom at 31 March 2020.
However, there was no headroom in the Aviation or Land operating segment at 31 March 2020, and therefore the decline in profitability for both operating segments present impairment indicators. Management performed an impairment test as at 30 September 2020 for Aviation and Land and determined that a goodwill impairment should have been recorded. Correction of this error results in an impairment in Aviation and Land of £592.3 million and £168.2 million, respectively. Further detail is included in note 4.
Impairment of internally generated intangible assets
The prior period has been restated as a result of the impairment of the Clarity software intangible asset. This was developed for use on the Phoenix contract and another contract that was in the bidding phase. The Group was advised that this bid was unsuccessful and therefore the asset should have been impaired, resulting in a charge of £4.9 million for the six months ended 30 September 2020. Further detail is included in note 4.
Impairment of property, plant and equipment and aircraft fleet rationalisation
In the prior period, the fleet rationalisation programme in Aviation resulted in an income statement charge of £7.4 million within cost of revenue. Included in the prior period is a restatement of £1.4 million relating to further impairments of property, plant and equipment. Further detail is included in note 4.

Babcock International Group PLC half year results for the six months ended 30 September 2021 35
3. Contract and balance sheet review As outlined in the annual report and financial statements for the year ended 31 March 2021, the Group performed a review of the profitability of its contract portfolio and the carrying values of assets and liabilities on the balance sheet.
The contract profitability and balance sheet review has impacted on the results for the six months ended 30 September 2020, consisting of: • Cumulative restatement at 1 April 2019 of £308.1 million (being £45.3 million relating to a change in accounting policy and correction of prior year errors of £262.8 million). • Cumulative restatement at 31 March 2020 of £230.7 million (being £59.8 million relating to a change in accounting policy and correction of prior year errors of £170.9 million). • Changes recorded within the six months ended 30 September 2020 of £885.2 million, being £6.3 million relating to a change in accounting policy and £878.9 million relating to correction of errors.
Of the adjustments recorded in the income statement for the six months ended 30 September 2020 (see table below), £26.8 million were charged within underlying operating profit.
Prior year restatements
The Group restated the results for the six months ended 30 September 2020 for changes in accounting policy and errors. Accounting errors included both the rollforward of those identified as at 31 March 2020 and also those which were identified in the previously published results for the six months ended 30 September 2020. Further details are set out in note 4.
Summarised cumulative adjustments to retained earnings are as set out below:
£m
Restatement as at 1 April 2019 (308.1)
Adjustments recognised in the year ended 31 March 2020 77.4
Total restatement at 31 March 2020 (230.7)
Adjustments recognised in the six months ended 30 September 2020 (885.2)
Total restatement at 30 September 2020 (1,115.9)
Adjustments recognised in the six months ended 31 March 2021 (928.5)
Total adjustments recognised at 31 March 2021 (2,044.4)
Impact of the contract profitability and balance sheet review on the six months ended 30 September 2020
The impact of items identified through the contract profitability and balance sheet on the income statement for the six months ended 30 September 2020 are summarised as follows:
Six months ended 30 September 2020
£m
Underlying £m
Specific Adjusting Items £m
Statutory £m
Revenue impacts (56.1) – (56.1)
Operating profit/(loss) impacts
Impairment/disposal of goodwill and acquired intangible assets
0.4 (821.1) (820.7)
Impairment of non-current assets (4.4) (4.9) (9.3)
Impairment of property, plant and equipment and right of use assets
(1.5) (1.4) (2.9)
Impairment/write down of current assets (3.7) – (3.7)
Introduction of/increase to liabilities (17.6) (7.5) (25.1)
Operating loss (26.8) (834.9) (861.7)
Share of income from JVs and associates (5.3) – (5.3)
Loss before tax impacts (32.1) (834.9) (867.0)
Tax adjustments (28.8) 8.1 (20.7)
Tax effect 2.5 – 2.5
Loss after tax for the period impacts (58.4) (826.8) (885.2)
The summary of the adjustments in the table above is set out in note 4.
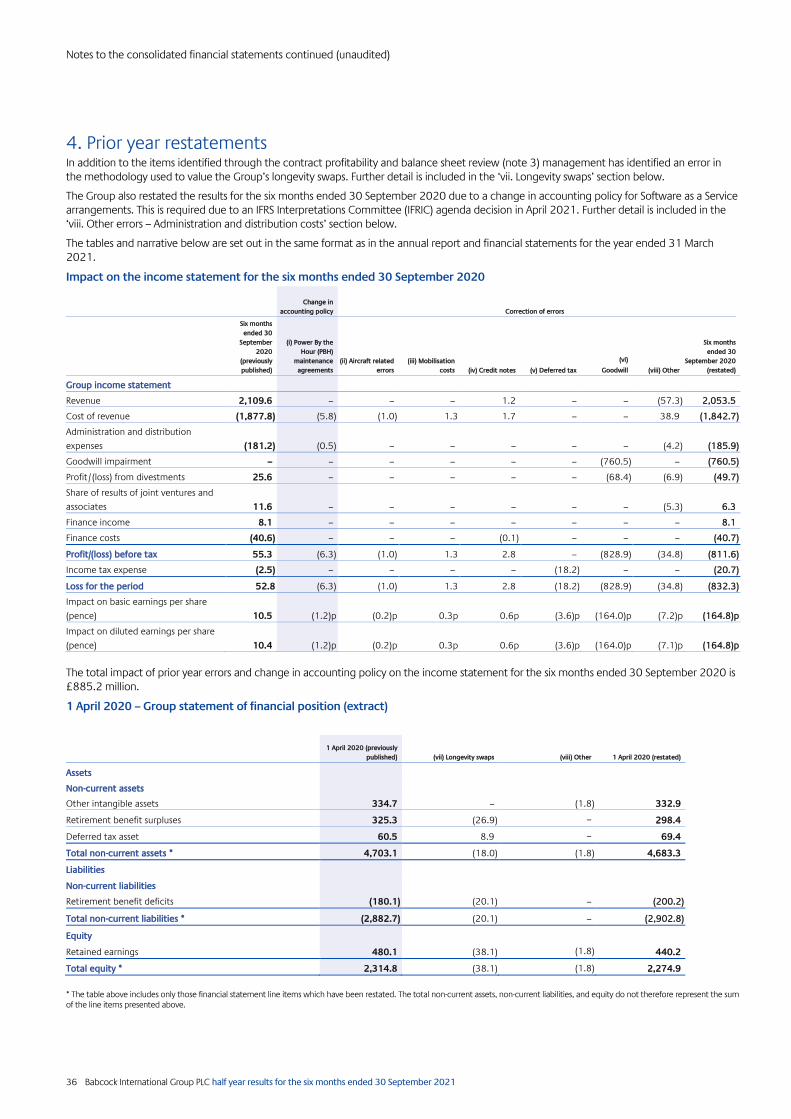
Notes to the consolidated financial statements continued (unaudited)
36 Babcock International Group PLC half year results for the six months ended 30 September 2021
4. Prior year restatements In addition to the items identified through the contract profitability and balance sheet review (note 3) management has identified an error in the methodology used to value the Group’s longevity swaps. Further detail is included in the ‘vii. Longevity swaps’ section below.
The Group also restated the results for the six months ended 30 September 2020 due to a change in accounting policy for Software as a Service arrangements. This is required due to an IFRS Interpretations Committee (IFRIC) agenda decision in April 2021. Further detail is included in the ‘viii. Other errors – Administration and distribution costs’ section below.
The tables and narrative below are set out in the same format as in the annual report and financial statements for the year ended 31 March 2021.
Impact on the income statement for the six months ended 30 September 2020
Change in
accounting policy Correction of errors
Six months
ended 30
September
2020
(previously
published)
(i) Power By the
Hour (PBH)
maintenance
agreements
(ii) Aircraft related
errors
(iii) Mobilisation
costs (iv) Credit notes (v) Deferred tax
(vi)
Goodwill (viii) Other
Six months
ended 30
September 2020
(restated)
Group income statement
Revenue 2,109.6 – – – 1.2 – – (57.3) 2,053.5
Cost of revenue (1,877.8) (5.8) (1.0) 1.3 1.7 – – 38.9 (1,842.7)
Administration and distribution
expenses (181.2) (0.5) – – – – – (4.2) (185.9)
Goodwill impairment – – – – – – (760.5) – (760.5)
Profit/(loss) from divestments 25.6 – – – – – (68.4) (6.9) (49.7)
Share of results of joint ventures and
associates 11.6 – – – – – – (5.3) 6.3
Finance income 8.1 – – – – – – – 8.1
Finance costs (40.6) – – – (0.1) – – – (40.7)
Profit/(loss) before tax 55.3 (6.3) (1.0) 1.3 2.8 – (828.9) (34.8) (811.6)
Income tax expense (2.5) – – – – (18.2) – – (20.7)
Loss for the period 52.8 (6.3) (1.0) 1.3 2.8 (18.2) (828.9) (34.8) (832.3)
Impact on basic earnings per share
(pence) 10.5 (1.2)p (0.2)p 0.3p 0.6p (3.6)p (164.0)p (7.2)p (164.8)p
Impact on diluted earnings per share
(pence) 10.4 (1.2)p (0.2)p 0.3p 0.6p (3.6)p (164.0)p (7.1)p (164.8)p
The total impact of prior year errors and change in accounting policy on the income statement for the six months ended 30 September 2020 is £885.2 million.
1 April 2020 – Group statement of financial position (extract)
1 April 2020 (previously
published) (vii) Longevity swaps (viii) Other 1 April 2020 (restated)
Assets
Non-current assets
Other intangible assets 334.7 – (1.8) 332.9
Retirement benefit surpluses 325.3 (26.9) – 298.4
Deferred tax asset 60.5 8.9 – 69.4
Total non-current assets * 4,703.1 (18.0) (1.8) 4,683.3
Liabilities
Non-current liabilities
Retirement benefit deficits (180.1) (20.1) – (200.2)
Total non-current liabilities * (2,882.7) (20.1) – (2,902.8)
Equity
Retained earnings 480.1 (38.1) (1.8) 440.2
Total equity * 2,314.8 (38.1) (1.8) 2,274.9
* The table above includes only those financial statement line items which have been restated. The total non-current assets, non-current liabilities, and equity do not therefore represent the sum of the line items presented above.

Babcock International Group PLC half year results for the six months ended 30 September 2021 37
4. Prior year restatements (continued) 31 March 2021 – Group statement of financial position (extract)
31 March 2021
(previously published) (vii) Longevity swaps (viii) Other 1 April 2020 (restated)
Assets
Non-current assets
Other intangible assets 202.0 – (2.0) 200.0
Retirement benefit surpluses 40.8 (26.2) – 14.6
Deferred tax asset 141.3 7.6 – 148.9
Total non-current assets * 2,737.1 (18.6) (2.0) 2,716.5
Liabilities
Non-current liabilities
Retirement benefit deficits (333.9) (13.6) – (347.5)
Total non-current liabilities * (2,273.3) (13.6) – (2,286.9)
Equity
Retained earnings (1,629.1) (32.2) (2.0) (1,663.3)
Total equity * 243.4 (32.2) (2.0) 209.2
* The table above includes only those financial statement line items which have been restated. The total non-current assets, non-current liabilities, and equity do not therefore represent the sum of the line items presented above.
Six months ended 30 September 2020 – Group statement of other comprehensive income (extract)
The table below shows the impact of the adjustment to the Group’s longevity swaps on the statement of other comprehensive income. Further detail is included in the ‘vii. Longevity swaps’ section below.
Six months ended 30
September 2020 (vii) Longevity swaps (viii) Other
Six months ended 30
September 2020 (restated)
Other comprehensive income/(loss)
Remeasurement of retirement benefit obligations (286.3) 17.0 – (269.3)
Tax, including rate change impact, on remeasurement of
retirement benefit obligations 54.3 (3.2) – 51.1
Change in presentation
In the year ended 31 March 2021 the Group changed the presentation of the Group income statement to present its share of results of joint ventures and associates below operating profit. This change was made to better reflect the way in which management reviews the core underlying performance of the business. The total share of results of joint ventures and associates is £9.6 million profit for the six months ended 30 September 2021 (30 September 2020 (restated): £6.3 million).
Definitions
Aircraft are considered in two key components for accounting purposes. ‘Rotables’ are major life-limited parts, such as engines, gearboxes and rotor blades, where value is consumed on a flying hour basis. The ‘airframe’ represents the remainder of the aircraft, and includes the body and other structural, mechanical and electrical installations necessary for flight. These definitions exclude ‘equipment’ which is separable from the aircraft and mission specific, such as medical and firefighting installations.
Change in accounting policy
i. Power By the Hour (PBH) agreements
The Group is party to a number of ‘Power By the Hour’ (‘PBH’) maintenance arrangements, under which the provider supplies rotable and airframe parts as required in exchange for a fixed price per flying hour. The provider therefore assumes the risk associated with the failure rate of parts.
Certain of these payments have previously been capitalised within property, plant and equipment, while the rotable parts which are subject to the arrangement have been depreciated as a separate component of the aircraft. Depreciation of the PBH payments has commenced as rotable and airframe parts are provided under the arrangement.

Notes to the consolidated financial statements continued (unaudited)
38 Babcock International Group PLC half year results for the six months ended 30 September 2021
4. Prior year restatements (continued) Correction of errors
i. Power By the Hour (PBH) agreements (continued)
Following a review of the terms of these arrangements, a comparison to policies of peer companies (where publicly available) and considering the requirements and application of IAS 16 ‘Property, Plant and Equipment’ (‘IAS 16’), it was determined that a more reliable and relevant accounting policy would be to recognise PBH payments in the income statement as incurred, but not to separately depreciate the rotable parts covered by the arrangement. This is more relevant as it reflects the substance of the arrangements, which is to maintain the parts covered at their full potential. It is more reliable in recording an expense in the income statement as there is no depreciation charge, which requires the use of an accounting estimate. The policy is also more prudent as (a) the cost of rotable parts does not change over time with inflation and (b) the elements of the PBH cost which reimburse the risk assumed by the PBH provider and which cover ancillary benefits such as access to the supply chain of the provider are directly expensed rather than initially capitalised.
This change in policy is consistent with those disclosed in the annual report and financial statements for the year ended 31 March 2021 and increases cost of revenue by £5.8 million and administration and distribution costs by £0.5 million for the six months ended 30 September 2020.
ii. Aircraft related errors
Maintenance of leased aircraft
Leased aircraft typically require to be returned to lessors with rotables in a similar condition to that which existed at the commencement of the lease. Betterment and detriment clauses set out the balancing payments required if these conditions are not met.
The cost of repair and replacement parts which extends the life of rotables has typically been capitalised as a leasehold improvement and depreciated over the term of the lease, resulting in an increasing cost of depreciation towards the end of the lease.
Following a review of lease return conditions and considering the requirements and application of IAS 16, it was determined that the Group should record a leasehold improvement asset or dilapidation provision which represents the difference between the condition of the rotables at any given point in time and the return condition. This reflects the amount of leasehold improvement which will generate future benefits and the value of the liability to restore parts to the return condition, and results in a more consistent profile of cost recognition over the duration of the lease.
The correction of this error increases cost of revenue by £0.1 million for the six months ended 30 September 2020.
Rotables – maintenance of owned aircraft
Rotables are depreciated as a separate component of the aircraft on the basis of flying hours, as this most appropriately reflects the consumption of economic benefits.
Following a review of balances capitalised as rotables, it was identified that in certain cases the carrying value of parts replaced prior to completion of the expected number of flying hours had not been written off, depreciation rates had not been regularly updated to reflect the latest actual cost of replacement parts and the remaining number of flying hours used for accounting purposes had not been regularly checked for accuracy against contemporaneous technical records. It was also identified that certain parts capitalised related to the airframe rather than rotables and should have been expensed as these represented a replacement rather than enhancement to the aircraft. Detailed exercises were undertaken to assess the remaining life of rotables against technical records, determine the actual cost of parts capitalised and review balances for airframe parts which should not have been capitalised under IAS 16.
The correction of these errors increases cost of revenue by £0.8 million for the six months ended 30 September 2020.
Rotables – maintenance of customer aircraft
The Group operates a number of aircraft which are provided by customers. The cost of repair and replacement parts which extends the life of rotables was capitalised within property, plant and equipment and depreciated over the contract term in a manner similar to that applied for leased aircraft.
Following a review of the terms of these customer contracts, it has been determined that these costs should not have been capitalised as they represent the enhancement of a customer asset rather than an asset of the Group and therefore do not meet the recognition requirements of IAS 16.
The correction of this error increases cost of revenue by £0.1 million for the six months ended 30 September 2020.
iii. Mobilisation costs
The Group incurs various costs in mobilising contracts and certain of these costs have been capitalised as contract fulfilment assets. Following a review of all such assets, it was identified that certain costs did not meet the requirements of IFRS 15 to be capitalised as contract fulfilment assets as there was insufficient evidence that the costs generated or enhanced resources which the Group would use in performing the contract. The key areas related to lease costs, maintenance costs and personnel costs incurred prior to contract commencement or the achievement of full operating capability. A significant proportion of these costs was incurred in mobilising the Group’s Air Ambulance contract in Norway, which commenced in July 2019.
The correction of these errors decreases cost of revenue by £1.3 million for the six months ended 30 September 2020.

Babcock International Group PLC half year results for the six months ended 30 September 2021 39
4. Prior year restatements (continued) Correction of errors (continued)
iv. Credit notes
The Group receives certain credit notes from aircraft manufacturers at the point of placing orders for aircraft, exercisable against the purchase of future parts and services. These credit notes have previously been recognised in the income statement on receipt of the credit notes and recorded within trade and other receivables until used to purchase parts or services, which is typically within a short period.
Following a review of the substance of these credit notes, it was determined that these represent a discount on the purchase price of the aircraft. In the case of aircraft which are owned by the Group, credit notes should therefore be recognised as a reduction in the cost of aircraft acquired. The majority of aircraft ordered by the Group in recent years have been sold and leased back prior to delivery, typically at the gross purchase price excluding the credit note, resulting in a gain on disposal of the aircraft being recognised in the income statement. The accounting for these sale and leasebacks has been corrected, reversing the gain recognised on disposal and recalculating reduced right of use assets arising from the leasebacks. The reduced right of use assets represent the discounted purchase price of the aircraft due to utilisation of the credit notes.
In the case of aircraft acquired for customers under an aircraft supply contract, the credit notes should be recognised as a reduction in operating costs.
The correction of these errors increases revenue by £1.2 million, decreases cost of revenue costs by £1.7 million and increases finance costs by £0.1 million for the six months ended 30 September 2020.
v. Deferred tax
At 31 March 2020 a net deferred tax asset of £71.7 million was recognised in the Aviation operating segment in relation to the Group’s Spanish entities. The recognition of this asset was supported by forecasts which showed the Spanish tax group becoming profitable in FY23 with significant further growth beyond this date. However, this analysis did not appropriately take into account restrictions on the utilisation of various tax attributes within Spanish tax law which, when corrected, extend the duration over which the deferred tax asset is expected to be fully utilised to over 20 years. Although the relevant tax attributes can be carried forward indefinitely, it was determined that appropriately risk-weighted profit forecasts (see note 1 “Critical accounting estimates”) supported only a portion of the deferred tax asset, reducing the deferred tax asset by £25.5 million at 1 April 2019, £37.9 million at 31 March 2020 and £56.1 million at 30 September 2020. This is partially offset by the tax benefit of other CPBS adjustments which are recognised to the extent it is appropriate to do so in the relevant jurisdiction.
The correction of this error (after the partial offset by the tax benefit of other adjustments) results in a reduction in deferred tax assets of £8.8 million at 1 April 2019, £16.3 million at 31 March 2020 and £34.5 million at 30 September 2020. This increased the tax charge for the six months ended 30 September 2020 by £18.2 million.
vi. Goodwill allocation
Goodwill impairment
Following the goodwill impairment identified through the contract profitability and balance sheet review, the Group reviewed the goodwill balance at 30 September 2020 for indicators of impairment and identified that the approved Q2 forecast and strategy plan presented to the Board showed a decline in profitability from the forecast used to carry out the goodwill impairment test at 31 March 2020.
In the Marine and Nuclear operating segments this did not present an impairment indicator, given the significant headroom in each sector at 31 March 2020. However, following the restatement identified through the contract and balance sheet review, there was no headroom in Aviation and Land operating segments at 31 March 2020, and therefore the decline in profitability for both operating segments presented impairment indicators.
Management therefore performed an impairment test for the Aviation and Land operating segments at 30 September 2020 and determined that a goodwill impairment of £592.3 million and £168.2 million, respectively, should be charged to the income statement for the six months ended 30 September 2020.
Goodwill allocation
In June 2020 the Group completed the sale of its 74% shareholding in Holdfast Training Services Limited for a cash consideration of £85.0 million, which resulted in a loss on disposal of £38.2 million. This loss arose following goodwill allocation of £68.4 million to Holdfast Training Services Limited upon disposal, which was allocated using the relative value method. As the sale occurred in June 2020, the allocated goodwill should have been included in the loss on disposal in the six months ended 30 September 2020. Correction of this error increases the loss on disposal by £68.4 million.
vii. Longevity swaps
The longevity swaps related to the three main group pension schemes were previously valued in line with the collateral posted by each scheme with their intermediary. This was deemed a proxy for fair value in line with IAS 19. Having considered valuations of a notional replacement swap, or exit, we now believe the previous approach did not accurately reflect fair value and so we have changed our valuation approach accordingly. The prior year has been restated for the change in approach, reducing retirement benefit surpluses by £26.9 million, increasing deferred tax asset by £8.9 million and increasing retirement benefit deficits by £20.1 million as at 1 April 2020. In the year ended 31 March 2021 there was a £5.9 million gain through the statement of other comprehensive income resulting in a cumulative reduction to retirement benefit surpluses of £26.2 million, an increase to deferred tax asset of £7.6 million and an increase to retirement benefit deficits by £13.6 million as at 31 March 2021. There is no impact on the Group Income Statement. This change does not affect the technical provisions assessed for those schemes during triennial valuations, their funding requirements, or the deficit recovery cash contributions agreed with each scheme.

Notes to the consolidated financial statements continued (unaudited)
40 Babcock International Group PLC half year results for the six months ended 30 September 2021
4. Prior year restatements (continued) Correction of errors (continued)
viii. Other errors
A number of other errors have been identified, as set out below.
Revenue
The contract profitability and balance sheet review identified that variable revenue recognised in relation to a contract modification did not meet the ‘highly probable not to significantly reverse’ test set out in IFRS 15 and should therefore be reversed. This resulted in a reduction to revenue of £9.4 million for the six months ended 30 September 2020.
An error was identified relating to a pain/gain share agreement, in which a reduction in revenue was incorrectly recorded as an expense. The correction of this error results in a reduction to revenue of £1.3 million and a reduction in cost of revenue of £1.3 million for the six months ended 30 September 2020.
Following the sale of the Group’s investment in Holdfast in June 2020, the Group reassessed the performance obligations of associated contracts. This identified a contract modification that impacted on the allocation of the transaction price as well as the timing of revenue recognition. The effective date of the change is 5 June 2020 and therefore revenue requires restatement. Correction of this error reduces revenue by £1.2 million for the six months ended 30 September 2020.
Due to early stage of completion of one of the Groups’ contracts, and the complex nature of the contract, management made a decision during the contract profitability and balance sheet review to recognise revenue in line with costs incurred in accordance with IFRS 15 paragraph 45. Application of this approach to the six months ended 30 September 2020 reduced revenue by £3.8 million.
It was identified that an incorrect margin had been applied to the costs incurred by the Group for a particular contract. The correction of this error decreases revenue by £0.2 million for the six months ended 30 September 2020.
An overstatement of revenue and cost of revenue was identified in relation to pass-through revenue on the Phoenix contract. The Group had previously concluded that it acted as principal in the arrangement. It was determined that a contract amendment in February 2020 represented a contract modification under IFRS 15, following which the Group has been acting as an agent. The correction of this error results in a decrease in revenue and cost of revenue of £36.5 million for the six months ended 30 September 2020. There was no impact to reported profit as a result of this adjustment.
Management has also identified an error in the accrued income balance. Correction of this error results in a decrease in revenue of £1.1 million for the six months ended 30 September 2020.
It was identified that certain receivables were not recoverable at 30 September 2020. The correction of this error results in a decrease to revenue of £2.8 million for the six months ended 30 September 2020.
Additionally, it was identified that at 30 September 2020 the Group was not entitled to a performance incentive on a particular contract. Correction of this error results in a decrease to revenue of £1.0 million for the six months ended 30 September 2020.
Cost of revenue
Additionally, as noted in the Revenue section, an error was identified in relation to a painshare arrangement which resulted in a decrease to cost of revenue of £1.3 million. A further error was identified relating to a principal versus agency assessment on the Phoenix contract which resulted in a decrease to cost of revenue of £36.5 million.
Through the goodwill impairment analysis for the oil and gas operating segment it was identified that the carrying value of the operating segment was less than the recoverable value. Management reviewed the acquired intangible asset included in this operating segment and determined that the customer relationships included in the intangible asset were no longer part of the customer base, and were not part of the customer base at 1 April 2019. The useful expected life of the acquired intangible asset has therefore been revised and the intangible asset was disposed at 1 April 2019. The amortisation of the intangible asset for the six months ended 30 September 2020 has been reversed, resulting in a reduction in cost of revenue of £7.7 million.
The Group developed the Clarity software intangible asset for use on the Phoenix contract and another proposed contract that was currently in the bidding stage. The Group was advised that the bid for this proposed contract was unsuccessful on 3 April 2020. The recoverable value of the intangible asset was therefore less than the book value, and the asset should have been impaired at 30 September 2020. Correction of this error results in an increase to cost of revenue of £4.9 million for the six months ended 30 September 2020.
Capitalised maintenance costs were identified in relation to aircraft which had been sold or returned to lessors, or where the underlying customer contract had been completed. The correction of this error decreases cost of revenue by £0.5 million for the six months ended 30 September 2020.
A number of errors were identified where an inappropriate useful life was assigned to aircraft and capitalised maintenance, due to incorrect application of the Group’s depreciation policy. The correction of this error increases cost of revenue by £0.8 million for the six months ended 30 September 2020.
Additionally, it has been identified that certain elements capitalised under the PBH arrangements were not suitable for capitalisation under the previous accounting policy or the updated accounting policy. The correction of this error reduces cost of revenue by £0.6 million for the six months ended 30 September 2020.

Babcock International Group PLC half year results for the six months ended 30 September 2021 41
4. Prior year restatements (continued) Correction of errors (continued)
viii. Other errors (continued)
Cost of revenue (continued)
On acquisition of Lex Transfleet Limited in 2007, a £2.0 million fair value adjustment was made to the land value of the Camberwell and Park Royal sites, with the fair value adjustment split notionally between the two sites. The Camberwell site was subsequently sold in the year ended 31 March 2019 and therefore £1.0 million of the adjustment should have been considered as part of the disposal. A £1.0 million write down was recorded in the year ended 31 March 21. Correction of this error increases cost of revenue for the six months ended 30 September 2020 by £1.0 million.
Two instances were identified where reductions in lease costs in future periods were recognised in the income statement when agreed, with an asset recognised within trade and other receivables and subsequently amortised, rather than in the future periods to which the reductions related. The correction of these errors decreases cost of revenue by £0.1 million and administration and distribution costs by £1.4 million for the six months ended 30 September 2020.
Additionally, management identified capitalised bid costs that do not meet the criteria for capitalisation under IFRS 15. Correction of this error results in an increase in cost of revenue of £0.1 million for the six months ended 30 September 2020.
Management have also identified historic adjustments that incorrectly reduced creditor balances. Correction of this error results in an increase in cost of revenue of £1.0 million for the six months ended 30 September 2020.
Administration and distribution costs
Balances were identified relating to IT assets capitalised under IAS 38 – Intangible Assets which are no longer used by the business, and should therefore have been written off in previous years. The correction of this error reduces administration and distribution costs by £0.4 million for the six months ended 30 September 2020.
Following a review of the Group’s foreign currency hedging arrangements in relation to aircraft leases in Norway, it was identified that insufficient contemporaneous documentation was recorded in order to designate part of the arrangement as a hedge for accounting purposes. The correction of this error results in an increase in administration and distribution costs of £1.5 million for the six months ended 30 September 2020, and an increase in other comprehensive income of £8.4 million for the six months ended 30 September 2020.
The Group has an equity accounted investment in ABC Electrification Limited. It was identified that certain loan balances with this joint venture are not recoverable. Correction of this error increases administration and distribution costs by £4.6 million.
As noted in the cost of revenue section, two instances were identified where reductions in lease costs in future periods were recognised in the income statement when agreed. The correction of these errors decreases administration and distribution costs by £1.4 million for the six months ended 30 September 2020.
The IFRS Interpretations Committee (IFRIC) published an agenda decision in April 2021 which clarified how a customer should account for the costs of configuring or customising the supplier’s application software in a Software-as-a-service arrangement. As a result of this decision the Group has revised its accounting policy and will not capitalise costs associated with Software-as-a-service arrangements where it does not control the underlying software. Application of this new policy accounting has reduced the software intangible asset by £1.8 million. As this policy is retrospectively applied we are required to reverse amortisation previously charged on the software intangible asset. Reversal of this amortisation reduces administration and distribution costs by £0.1 million. We note that this did not arise through the CPBS, but through the IFRIC agenda decision in April 2021.
Loss on divestments
In October 2020 the Group completed the sale of Conbras for a consideration of £9.7 million, which resulted in a loss on disposal of £10.9 million. At 30 September 2020 the Group had provided for a loss on disposal of £4.0 million. Correction of this error results in an increased provision for loss on disposal of £6.9 million.
Share of results of joint ventures and associates
The Group has an equity accounted investment in AirTanker Holdings Limited. It was identified that this investment balance became a deficit during the year ended 31 March 2019 as a result of movements in the valuation of derivatives held by the company, and that the Group’s investment in joint ventures and associates balance at 1 April 2019, 31 March 2020 and 30 September 2020 included this negative balance. However, as the Group has not taken on any commitment to fund AirTanker Holdings Limited’s liabilities, in accordance with IAS 28 ‘Investments in Associates and Joint Ventures’ the Group should have ceased decreasing the related investment balance once it became negative. The correction of this error results in a decrease in other comprehensive income of £4.8 million for the six months ended 30 September 2020.
The Group has an equity accounted investment in ABC Electrification Limited. It was identified that the investment in the joint venture was not supportable at 30 September 2020 based on future expected cash inflows. Correction of this error reduces Babcock’s share of results for this joint venture by £3.1 million.
The Group also identified an instance where profit was incorrectly recorded in the ALC (Superholdco) Limited joint venture for the six months ended 30 September 2020. Correction of this error reduces Babcock’s share of results for this joint venture by £2.2 million.
Taxation
The cumulative tax benefit of these other errors decreases the tax charge for the six months ended 30 September 2020 by £2.5 million. However this is offset by the movement on income tax recoverable to result in a net impact on the tax charge of £nil.
There is an increase in the tax charge for the six months ended 30 September 2020 due to movement on deferred tax assets, see vii “deferred tax”.

Notes to the consolidated financial statements continued (unaudited)
42 Babcock International Group PLC half year results for the six months ended 30 September 2021
4. Prior year restatements (continued) Impact of prior period restatements on the cash flow statement
The prior year restatements described above have had the following impact on the cash flow statement for the six months ended 30 September 2020:
30 September
2020 (previously published)
£m
Impact of prior year
errors £m
30 September
2020 (restated)
£m
Cash flows from operating activities
Profit/(loss) for the year 52.8 (885.1) (832.3)
Share of results of joint ventures and associates (11.6) 5.3 (6.3)
Income tax (credit)/expense 2.5 18.2 20.7
Finance costs 40.6 0.1 40.7
Depreciation and impairment of right of use assets 69.0 (3.1) 65.9
Amortisation and impairment of intangible assets 35.9 (3.1) 32.8
Goodwill impairment – 760.5 760.5
Investment income 0.5 (0.5) –
(Profit)/loss on disposal of subsidiaries, joint ventures and associates (25.6) 75.3 49.7
Impairment of joint venture loans – 4.4 4.4
Loss on disposal of property, plant and equipment 6.2 (0.3) 5.9
Net derivative fair value movement through profit or loss – 1.8 1.8
Cash generated from operations before movement in working capital and retirement benefit payments*
215.4
(26.5)
188.9
Increase in receivables (11.5) (13.9) (25.4)
Decrease in payables (9.2) 51.9 42.7
Increase in provisions (14.3) 2.7 (11.6)
Interest paid (33.6) (0.7) (34.3)
Interest received 5.6 (0.1) 5.5
Net cash flows from operating activities* 91.3 13.4 104.7
Cash flows from investing activities
Purchases of property, plant and equipment (39.7) (12.1) (51.8)
Purchases of intangible assets (10.3) (1.5) (11.8)
Loan movements in joint ventures and associates 4.0 0.6 4.6
Net cash flows from investing activities* 62.2 (13.0) 49.2
Cash flows from financing activities
Lease principal repayments (70.3) (0.4) (70.7)
Lease assets advanced and repaid (0.6) 0.6 –
Bank loans repaid (731.4) (0.6) (732.0)
Net cash flows from financing activities* (804.8) (0.4) (805.2)
* The table above includes only those financial statement line items which have been restated. The total cash generated from operations, investing activities and financing activities do not therefore represent the sum of the line items presented above.

Babcock International Group PLC half year results for the six months ended 30 September 2021 43
5. Segmental information The Group has four reporting segments, determined by reference to the goods and services they provide and the markets they serve.
Marine – through life support of naval ships and infrastructure and communications in the UK and internationally.
Nuclear – through life support of submarines and complex engineering services in support of major decommissioning programmes and projects, training and operation support, new build programme management and design and installation in the UK.
Land – large scale critical vehicle fleet management, equipment support and training for military and civil customers worldwide.
Aviation – critical engineering services to defence and civil customers worldwide, including pilot training, equipment support, airbase management and operation of aviation fleets delivering emergency and offshore services.
Six months ended 30 September 2021
Marine £m
Nuclear £m
Land £m
Aviation £m
Unallocated £m
Total £m
Revenue 627.4 516.3 607.0 472.3 – 2,223.0
Underlying operating profit 38.9 36.2 29.8 10.4 – 115.3
Specific Adjusting Items
Amortisation of acquired intangibles (0.1) – (0.6) (9.9) – (10.6)
Business acquisition, merger and divestment related items – – – (16.3) (4.8) (21.1)
Restructuring costs (1.7) 1.5 (4.7) (1.4) (3.1) (9.4)
Exceptional items – 0.6 0.3 0.3 – 1.2
Operating profit/(loss) 37.1 38.3 24.8 (16.9) (7.9) 75.4
Other income – – – – 6.2 6.2
Share of results of joint ventures and associates 2.0 – 2.1 5.5 – 9.6
Net finance costs – – 0.4 – (32.8) (32.4)
Profit/(loss) before tax 39.1 38.3 27.3 (11.4) (34.5) 58.8
Six months ended 30 September 2020 (restated *)
Marine £m
Nuclear £m
Land £m
Aviation £m
Unallocated £m
Total £m
Revenue 592.6 455.8 564.0 441.1 – 2,053.5
Underlying operating profit 32.1 34.2 16.5 1.7 – 84.5
Specific Adjusting Items
Acquired intangible amortisation (0.4) – (8.2) (11.7) – (20.3)
Business acquisition, merger and divestment related items – – (49.7) – – (49.7)
Gains, losses and costs directly arising from the group’s withdrawal from a specific market or geography – (4.5) (2.0) (0.6) – (7.1)
Profit or loss from amendment, curtailment, settlement or equalisation of group pension schemes (7.5) – – – – (7.5)
Restructuring costs (1.0) – (1.1) (8.9) – (11.0)
Exceptional items – – (174.1) (600.1) – (774.2)
Operating profit/(loss) 23.2 29.7 (218.6) (619.6) – (785.3)
Share of results of joint ventures and associates 1.6 (4.0) (0.9) 9.6 – 6.3
Investment income – – 0.5 – – 0.5
Net finance costs – – – – (33.1) (33.1)
Profit/(loss) before tax 24.8 25.7 (219.0) (610.0) (33.1) (811.6)
* In the year ended 31 March 2021, the Group performed a contract profitability and balance sheet review which identified errors and a change to accounting policy. These also impact the 6 months ended 30 September 2020. Details of the restatements are contained in note 4.

Notes to the consolidated financial statements continued (unaudited)
44 Babcock International Group PLC half year results for the six months ended 30 September 2021
6. Other income In the six months ended 30 September 2021 the Group earned £6.2 million (2020: £nil) related to additional fees received in relation to the sale of its oil and gas aviation business, which is presented as other income as this does not relate to the Group’s operational activity.
7. Net finance costs
Six months ended
30 September 2021
£m
Six months ended
30 September 2020
(restated) £m
Finance costs
Loans, overdrafts and associated interest rate hedges 23.0 25.8
Lease interest 10.1 12.3
Amortisation of issue costs of bank loan 0.3 0.2
Retirement benefit interest 2.6 –
Other 2.0 2.4
Total finance costs 38.0 40.7
Finance income
Bank deposits, loans and leases 5.2 5.5
IFRIC 12 investment income 0.4 0.5
Retirement benefit interest – 2.1
Total finance income 5.6 8.1
Net finance costs 32.4 32.6
8. Income tax expense
Six months ended
30 September 2021
£m
Six months ended
30 September 2020
(restated) £m
Taxation expense (4.6) (20.7)
Calculation of effective tax rate
Profit before tax 58.8 (811.6)
Deduct: Equity accounted investments (9.6) (6.3)
(Deduct)/add back: taxable non-recurring items 12.5 51.8
(Deduct)/add back: non-taxable non-recurring items 21.2 818.0
Adjusted profit before tax 82.9 51.9
Tax charge 4.6 20.7
Exclude one-off tax benefits 11.2 –
Exclude tax adjustments in respect of non-recurring items 3.2 (10.1)
Adjusted tax charge 19.0 10.6
Effective tax rate 23% 20%
The tax charge has been calculated by applying the effective rate of tax which the Group expects to incur for the year to 31 March 2022. As the Group operates in multiple jurisdictions, the effective rate is calculated by applying a weighted average of the rates that are expected to apply across the jurisdictions as a reasonable approximation of the effect of using more specific rates.
The recognition of deferred tax assets can be a subjective process and the Group’s approach is therefore set out in more detail in Note 1 – Basis of preparation and significant accounting policies – Key sources of estimation uncertainty.
As at 30 September 2021, an increase in the UK rate of corporation tax has been substantively enacted, from 19% to 25%, with effect from 1 April 2023. An adjustment has been made to reflect the fact that a portion of UK deferred tax balances are expected to unwind at 25%. This adjustment has been recorded as a non-recurring gain of £11.2 million in the group income statement with Specific Adjusting Items together with a non-recurring gain of £6.5 million in the group Statement Of Comprehensive Income.

Babcock International Group PLC half year results for the six months ended 30 September 2021 45
9. Goodwill
30 September 2021
£m
31 March
2021 £m
Cost
At 1 April 2,487.3 2,571.1
On disposal of subsidiaries (note 18) (0.7) (72.6)
Exchange adjustments – (11.2)
At 30 September/ 31 March 2,486.6 2,487.3
Accumulated impairment
At 1 April 1,531.0 283.2
On disposal of subsidiaries (note 18) – –
Impairment – 1,243.2
Exchange adjustments – 4.6
At 30 September/ 31 March 1,531.0 1,531.0
Net book value at 30 September / 31 March 955.6 956.3
Goodwill is allocated to the operating segments as set out in the table below:
2021
£m
2020
(restated) £m
Marine 339.2 339.2
Nuclear 233.1 233.1
Land 262.7 262.7
Aviation 118.6 119.3
Africa 2.0 2.0
955.6 956.3
Goodwill is stated at cost less any provision for impairment and is compared against the recoverable amount at least annually. The recoverable value of each cash generating unit was assessed at 31 March 2021 by reference to value-in-use calculations. The value-in-use calculations were derived from risk-adjusted cash flows from the Group’s three-year budget and nominal growth rates between 2.0% and 3.0% were used to establish cash flows for two further years. Terminal value assessments were included based on year five and an estimated long-term nominal growth rate of 2.0% (2021: 2.0%). There have been no changes to the Group’s key assumptions in the six months ended 30 September 2021 since the published annual report and financial statements for the year ending 31 March 2021. The key assumptions can be found in note 13 of that report. The process by which the Group’s budget is prepared, reviewed and approved benefits from historical experience, visibility of long–term work programmes in relation to work undertaken for the UK Government, available government spending information (both UK and overseas), the Group’s contract backlog, bid pipeline and the Group’s tracking pipeline which monitors opportunities prior to release of tenders. The budget process includes consideration of risks and opportunities at contract and business level and considered matters such as COVID-19 and climate change.
Goodwill is required to be tested for impairment at least once every financial year, irrespective of whether there is any indication of impairment. The Group’s annual impairment review typically occurs at year end. However, if indicators of impairment are present, an earlier review is also required. The Group has assessed the goodwill balance for both internal and external impairment indicators and no impairment indicators were identified. Management will prepare a full goodwill impairment assessment in the final quarter of the year.
10. Property, plant and equipment
In the six months ended 30th September 2021 the Group made the following significant additions to property, plant and equipment: • £23.7 million investment into site improvements at Rosyth to support the Type-31 build programme; • £6.9 million on a new fixed wing jet and hangar in Norway; and • £14.7 million investment into site improvements at Devonport Royal Dockyard.

46 Babcock International Group PLC half year results for the six months ended 30 September 2021
11. Trade and other receivables and contract assets
30 September
2021 £m
31 March 2021
£m
Current assets
Trade receivables 213.7 267.1
Contract assets 344.6 310.9
Other debtors 154.2 163.0
712.5 741.0
Trade and other receivables are stated at amortised cost less expected credit loss.
12. Trade and other payables and contract liabilities
30 September 2021
£m
31 March 2021
£m
Current liabilities
Trade creditors 326.5 410.6
Contract liabilities 382.4 396.5
Other creditors 651.3 699.6
Total current trade and other payables 1,360.2 1,506.7
Non-current liabilities
Other creditors 1.8 1.9
Included in creditors is £12.3 million (31 March 2021: £19.1 million) relating to capital expenditure which has therefore not been included in working capital movements within the cash flow.

Babcock International Group PLC half year results for the six months ended 30 September 2021 47
13. Financial instruments The Group’s financial assets and financial liabilities are classified as follows:
30 September 2021 (£m) At amortised
cost
Fair value through
profit or loss Fair value
hedges Cash flow
hedges
Total carrying amount Fair value
Financial assets
Trade and other receivables * 618.2 – – – 618.2 618.2
Loans to joint ventures and associates 42.6 – – – 42.6 42.6
Cash and cash equivalents 784.1 – – – 784.1 784.1
IFRIC 12 financial assets 10.8 – – – 10.8 10.8
Financial liabilities
Bank and other borrowings (1,744.4) – – – (1,744.4) (1,802.7)
Trade payables (326.5) – – – (326.5) (326.5)
Accruals and other payables ** (348.4) – – – (348.4) (348.4)
Derivative contracts
Hedged contracts – – (29.9) (31.4) (61.3) (61.3)
Non-hedged contracts – – – – – –
Net assets / (liabilities) (963.6) – (29.9) (31.4) (1,024.9)
31 March 2021 (£m) At amortised
cost
Fair value through
profit or loss Fair value
hedges Cash flow
hedges Total carrying
amount Fair value
Financial assets
Trade and other receivables * 723.2 – – – 723.2 723.2
Loans to joint ventures and associates 48.6 – – – 48.6 48.6
Cash and cash equivalents 1,845.9 – – – 1,845.9 1,845.9
IFRIC 12 financial assets 12.8 – – – 12.8 12.8
Financial liabilities
Bank and other borrowings (3,710.8) – – – (3,710.8) (3,710.8)
Trade payables (435.5) – – – (435.5) (435.5)
Accruals and other payables ** (521.1) – – – (521.1) (521.1)
Derivative contracts
Hedged contracts – – 89.4 (15.9) 73.5 73.5
Non-hedged contracts – 2.9 – – 2.9 2.9
Net assets / (liabilities) (2,036.9) 2.9 89.4 (15.9) (1,960.5)
* Trade and other receivables excludes prepayments (2021: £74.8m; 2020: £107.5m) and capitalised contract costs (2021: £19.5m; 2020: £39.4m) as these are not classed as financial instruments.
** Accruals and other payables excludes other taxes and social security (2021: (£99.8m); 2020: (£136.9m)) and contract cost accruals (2021: (£204.9m); 2020: (£215.4m)) as these are not classed as financial instruments.
The fair value measurement hierarchy is as follows: • Quoted prices (unadjusted) in active markets for identical assets or liabilities (Level 1); • Inputs other than quoted prices included within Level 1 that are observable for the asset or liability, either directly (that is, as prices) or indirectly (that is, derived from prices) (Level 2); and • Inputs for the asset or liability that are not based on observable market data (that is, unobservable inputs) (Level 3).
All of the financial assets and liabilities measured at fair value are classified as level 2 using the fair value hierarchy. There were no transfers between levels during the period.

48 Babcock International Group PLC half year results for the six months ended 30 September 2021
14. Provisions for other liabilities
Insurance provisions
(a) £m
Contract/ warranty
(b) £m
Employee benefits and
business reorganisation
costs (c)
Italian anti-trust fine
£m
Property and other
(d) £m
Total provisions
£m
At 1 April 2021 0.7 67.1 35.8 20.0 21.9 145.5
On disposal of subsidiaries – – (1.3) – – (1.3)
Net charge to income statement – 0.2 6.4 – 3.4 10.0
Utilised in year – (5.7) (4.9) – (3.1) (13.7)
Foreign exchange – 0.4 – 0.2 0.2 0.8
At 30 September 2021 0.7 62.0 36.0 20.2 22.4 141.3
Included within net charge to income statement is £5.7 million relating to exceptional items, all relating to employee benefits and business reorganisation.
Provisions are analysed between current and non-current as follows:
30 September 2021
£m
31 March 2021
£m
Current 77.5 71.8
Non-current 63.8 73.7
141.3 145.5
(a) The insurance provisions arise in the Group’s captive insurance company, Chepstow Insurance Limited. They relate to specific claims assessed in accordance with the advice of independent actuaries.
(b) The contract/warranty provisions relate to onerous contracts and warranty obligations on completed contracts and disposals.
(c) The employee benefits and reorganisation costs arise mainly in relation to restructuring (see note 2), acquired businesses, personnel related costs and payroll taxes.
(d) Property and other in the main relate to provisions for dilapidation costs and contractual obligations in respect of infrastructure.
Included within provisions is £8 million expected to be utilised over approximately ten years. Other than these provisions the Group’s non-current provisions are expected to be utilised within two to five years.
15. Movement in net debt
Six months ended
30 September 2021
£m
Six months ended
30 September 2020
(restated) £m
(Decrease)/increase in cash in the year (165.6) (651.3)
Cash flow from the decrease/(increase) in debt 76.1 798.4
Change in net funds resulting from cash flows (89.5) 147.1
Net additional lease obligations (19.6) (29.3)
Disposal of subsidiaries 129.7 –
Other non-cash movements 1.1 (3.8)
Foreign currency translation differences (15.0) (18.0)
Movement in net debt in the year 6.7 96.0
Net debt at the beginning of the year (1,353.6) (1,704.8)
Net debt at the end of the period (1,346.9) (1,608.8)

Babcock International Group PLC half year results for the six months ended 30 September 2021 49
16. Changes in net debt
31 March 2021
£m Cash flow
£m
Disposal of subsidiaries
£m
Additional leases
£m
Other non-cash
movements £m
Exchange movement
£m
30 September 2021
£m
Cash and bank balances 904.8 (121.9) – – – 1.2 784.1
Bank overdrafts (373.9) (43.7) – – – – (417.6)
Cash, cash equivalents and bank overdrafts 530.9 (165.6) – – – 1.2 366.5
Debt (1,328.6) 11.5 – – – (9.7) (1,326.8)
Leases liabilities (612.3) 69.6 129.7 (21.7) 2.1 (2.0) (434.6)
Derivatives designated as hedges of company debt
(25.2) – – – – (4.7) (29.9)
Changes in liabilities from financing arrangements
(1,966.1) 81.1 129.7 (21.7) 2.1 (16.4) (1,791.3)
Leases – granted 39.5 (4.4) – – – 0.2 35.3
Net debt before loans to joint ventures and associates
(1,395.7)
(88.9)
129.7
(21.7)
2.1
(15.0)
(1,389.5)
Joint ventures and associates loans 42.1 (0.6) – – 1.1 – 42.6
Net debt (1,353.6) (89.5) 129.7 (21.7) 3.2 (15.0) (1,346.9)
17. Retirement benefits and liabilities Analysis of movement in the Group statement of financial position.
30 September 2021
£m
31 March 2021 (restated)
£m
Fair value of plan assets (including reimbursement rights)
At 1 April 4,745.1 4,364.3
Interest on assets 45.0 100.4
Actuarial gain on assets 247.1 431.8
Employer contributions 108.0 108.8
Employee contributions 0.1 0.2
Benefits paid (134.7) (260.4)
As at period end 5,010.6 4,745.1
Present value of benefit obligations
At 1 April 5,078.0 4,266.1
Service cost 15.8 28.1
Incurred expenses 3.7 7.3
Interest cost 47.6 96.4
Employee contributions 0.1 0.2
Experience (gains)/losses (34.4) 32.7
Actuarial loss – demographics – 7.6
Actuarial loss – financial 113.5 891.1
Benefits paid (including transfers) (134.7) (260.4)
Curtailments – 7.5
Past service cost – 1.4
As at period end 5,089.6 5,078.0
Net deficit at period end (79.0) (332.9)
The Group has restated the value of its longevity swaps at 31 March 2021. Further detail is included in note 4.

50 Babcock International Group PLC half year results for the six months ended 30 September 2021
17. Retirement benefits and liabilities (continued)
The amounts recognised in the Group income statement are as follows:
30 September 2021
£m
30 September 2020
£m
Current service cost 15.8 14.4
Incurred expenses 3.7 1.8
Curtailment – 7.5
Total included within operating profit 19.5 23.7
Net interest cost/(credit) 2.6 (2.1)
Total included within income statement 22.1 21.6
As at 30 September 2021 the key assumptions used in valuing pension liabilities were:
Discount rate 2.0% (31 March 2021: 2.0%)
Inflation rate (RPI) 3.4% (30 March 2021: 3.2%)
18. Disposals of subsidiaries, businesses and joint ventures and associates On 11 March 2021, the Group announced that it had entered into a sale and purchase agreement to dispose of the Oil and Gas business, which provides offshore Oil and Gas crew transportation services in the UK, Denmark and Australia. The disposal was made as part of the Group’s targeted disposals programme. The disposal completed on 1 September 2021, on which date control of the Oil and Gas business passed to CHC Group LLC. The Group received consideration of £10 million.
Six months ended 30
September 2021
Six months ended 30 September 2020
(restated *)
Oil & Gas
£m
Holdfast Training Services
Limited
Cavendish Nuclear
Manufacturing Limited
£m Total
£m
Goodwill 0.7 68.4 – 68.4
Property, plant and equipment 15.1 – – –
Right-of-use assets 125.8 – – –
Investments in joint ventures and associates – 53.2 – 53.2
Deferred tax asset 23.2 – – –
Inventory 3.6 – 0.5 0.5
Current assets 48.3 – 0.7 0.7
Cash, cash equivalents and bank overdrafts – – 0.4 0.4
Lease liabilities (129.7) – – –
Deferred tax liabilities (13.4) – – –
Current liabilities (40.7) – (1.0) (1.0)
Provisions for other liabilities and charges (1.3) – – –
Net assets disposed 31.6 121.6 0.6 122.2
Disposal costs 2.0 1.6 – 1.6
Cumulative currency translation gain (7.3)
Loss on disposal (16.3) (38.2) (0.6) (38.8)
Sale proceeds 10.0 85.0 – 85.0
Sale proceeds less cash disposed of 10.0 85.0 (0.4) 84.6
Less costs paid in the year (2.0) – – –
Net cash inflow/(outflow) 8.0 85.0 (0.4) 84.6
* In October 2020 the Group disposed of Conbras Serrvicos Tecnicos Supporte Ltda for net consideration of £6.6m, resulting in a loss on disposal of £10.9m. Through the contract profitability and balance sheet review it was identified that this loss should have been provided for in full at 30 September 2020. Further detail is included in note 4.

Babcock International Group PLC half year results for the six months ended 30 September 2021 51
19. Related party transactions Related party transactions for the six months ended 30 September 2021 are: sales to joint ventures and associates of £18.8 million (six months ended 30 September 2020: £31.2 million) and purchases from joint ventures and associates of £0.1 million (six months ended 30 September 2020: £nil million).
For annualised key management compensation, please refer to note 9 and the Remuneration Report in the annual report and financial statements for the year ended 31 March 2021.
For transactions with Group defined benefit pension schemes, please refer to note 18 above and note 29 in the annual report and financial statements for the year ended 31 March 2021.
30 September 2021 Revenue to
(£m) Purchases from (£m)
Period end receivables
balance (£m)
Period end payables balance
(£m)
Alert Communications Limited 2.8 – 0.9 –
Babcock Mission Critical Services Limited – (0.1) – –
AirTanker Services Limited 6.0 – – –
Advanced Jet Training Limited 0.7 – 0.2 –
Rear Crew Training Limited 1.2 – – –
Ascent Flight Training (Management) Limited 1.0 – – –
Fixed Wing Training Limited 1.4 – – –
Rotary Wing Training Limited 2.0 – – –
First Swietelsky Operation and Maintenance 3.7 – 1.5 (1.1)
18.8 (0.1) 2.6 (1.1)
30 September 2020 Revenue to
(£m) Purchases from (£m)
Period end receivables
balance (£m)
Period end payables balance
(£m)
AirTanker Services Limited 5.0 – 0.2 –
Advanced Jet Training Limited 1.9 – – –
Rear Crew Training Limited 1.8 – – –
Ascent Flight Training (Management) Limited 0.9 – 0.3 –
Fixed Wing Training Limited 2.0 – – –
Rotary Wing Training Limited 1.6 – – –
Holdfast Training Services Limited 10.8 – – –
ABC Electrification Limited – – 6.8 –
First Swietelsky Operation and Maintenance 4.2 – 1.0 –
Cavendish Dounreay Partnership Limited 3.0 – 0.9 –
31.2 – 9.2 –

52 Babcock International Group PLC half year results for the six months ended 30 September 2021
20. Contingent liabilities A provision is recognised when the Group has a present obligation as a result of a past event, it is probable that an outflow of economic benefits will occur and the amount can be reliably estimated. A contingent liability is a possible obligation arising from past events whose existence will be confirmed only on the occurrence or non-occurrence of uncertain future events outside the Group’s control, a present obligation that is not recognised because it is not probable that an outflow of economic benefits will occur or the value of such outflow cannot be measured reliably. The Group does not recognise contingent liabilities. There are a number of contingent liabilities that arise in the normal course of business, including: a) The Group has given certain indemnities and warranties in the course of disposing of businesses and companies and in completing
contracts. The Group believes that any liability in respect of these is unlikely to have a material effect on the Group’s financial position. b) The nature of the Group’s long term contracts means that there are reasonably frequent contractual issues, variations and renegotiations
that arise in the ordinary course of business, including liabilities that arise on completion of contracts and on conclusion of relationships with joint ventures and associates. The Group takes account of the advice of experts, both internal and external, in making judgements on contractual issues and whether the outcome of negotiations will result in an obligation to the Group. The Directors do not believe that the outcome of these matters will result in any material adverse change in the Group’s financial position.
c) As a large contracting organisation, the Group has a significant number of contracts with customers to deliver services and products, as well as with its supply chain, where the Group cannot deliver all those services and products itself. The Group is involved in disputes and litigation, which have arisen in the course of its normal trading in connection with these contracts. Whilst the Directors do not believe that the outcome of these matters will result in any material adverse change in the Group’s financial position, it is possible that, if any of these disputes come to court, the court may take a different view to the Group.
d) The Group is subject to corporate and other tax rules in the jurisdictions in which it operates. Changes in tax rates, tax reliefs and tax laws, or interpretation of the law, by the relevant tax authorities may result in financial and reputational damage to the Group. This may affect the Group’s financial condition and performance.
21. Events after the reporting period On 13 August 2021, the Group announced that it had entered into a sale and purchase agreement to dispose of Frazer Nash Consultancy, which provides engineering and technology solutions across a broad range of critical national infrastructure. The disposal was made as part of the Group’s targeted disposals programme. The disposal completed on 20 October 2021, on which date control of Frazer Nash Consultancy passed to KBR Inc. The Group received consideration of £290 million. The disposal group was not classified as held for sale at 30 September 2021, as completion of the disposal was contingent on approval from the Australian Foreign Investment Review Board.

Babcock International Group PLC half year results for the six months ended 30 September 2021 53
Interim financial information As part of the tender process for a new statutory auditor it was initially planned that Deloitte would give an Interim Review opinion on the interim financial information in addition to auditing the full year results. This was a new approach for Babcock which had not previously had interim reviews performed by the auditor.
The interim financial information review timetable was delayed by the timing of the handover from the previous auditor and the transition work being more extensive than would usually be the case given the many adjustments published in the 31 March 2021 year end and the Group’s ongoing transformation of the accounting and control environment. As a result, there was insufficient time to enable Deloitte to complete their review procedures, pursuant to the Financial Reporting Council guidance on Review of Interim Financial Information.
Although no review of the interim financial information has been completed by Deloitte, the directors have discussed and agreed with Deloitte the material adjustments to date which the directors have made within the unaudited results in this statement.
Statement of Directors’ responsibilities This half year report is the responsibility of the Directors who each confirms that, to the best of their knowledge:
this condensed set of financial statements has been prepared in accordance with United Kingdom adopted IAS 34 (Interim Financial Reporting); and
the interim management report herein includes a fair review of the information required by:
Rule 4.2.7 of the Disclosure & Transparency Rules (indication of the important events during the first six months, and their impact on the condensed set of financial statements, and a description of principal risks and uncertainties for the remaining six months of the year); and
Rule 4.2.8. of the Disclosure & Transparency Rules (disclosure of related parties’ transactions that have taken place in the first six months of the current financial year and that have materially affected the financial position or the performance of the entity during that period; and any changes in the related parties transactions described in the last annual report that could have a material effect on the financial position or performance of the enterprise in the first six months of the current financial year).
Approved by the Board and signed on behalf of the Directors by:
David Lockwood Chief Executive Officer
David Mellors Chief Financial Officer
7 December 2021
Related Documents