Chapter 3 PROPERTIES OF PURE SUBSTANCES Copyright © The McGraw-Hill Companies, Inc. Permission required for reproduction or display. Thermodynamics: An Engineering Approach Seventh Edition in SI Units Yunus A. Cengel, Michael A. Boles McGraw-Hill, 2011

Bab 3 Thermodynamic of Engineering Approach
Jul 16, 2015
Welcome message from author
This document is posted to help you gain knowledge. Please leave a comment to let me know what you think about it! Share it to your friends and learn new things together.
Transcript
Chapter 3
PROPERTIES OF PURE
SUBSTANCES
Copyright © The McGraw-Hill Companies, Inc. Permission required for reproduction or display.
Thermodynamics: An Engineering Approach Seventh Edition in SI Units
Yunus A. Cengel, Michael A. Boles
McGraw-Hill, 2011
2
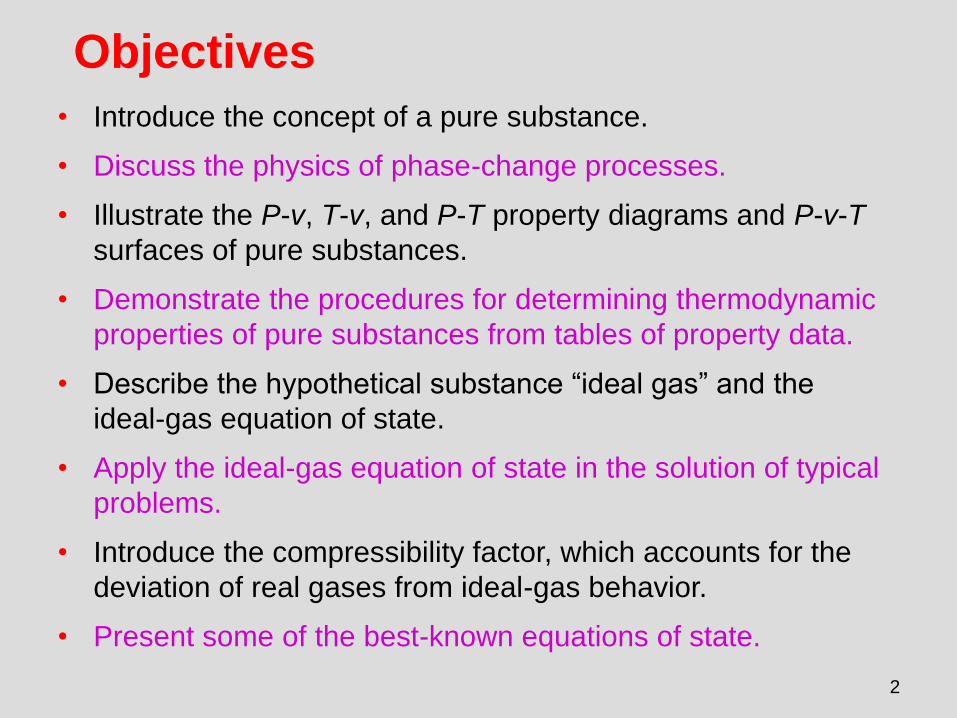
Objectives
• Introduce the concept of a pure substance.
• Discuss the physics of phase-change processes.
• Illustrate the P-v, T-v, and P-T property diagrams and P-v-T
surfaces of pure substances.
• Demonstrate the procedures for determining thermodynamic
properties of pure substances from tables of property data.
• Describe the hypothetical substance “ideal gas” and the
ideal-gas equation of state.
• Apply the ideal-gas equation of state in the solution of typical
problems.
• Introduce the compressibility factor, which accounts for the
deviation of real gases from ideal-gas behavior.
• Present some of the best-known equations of state.
3
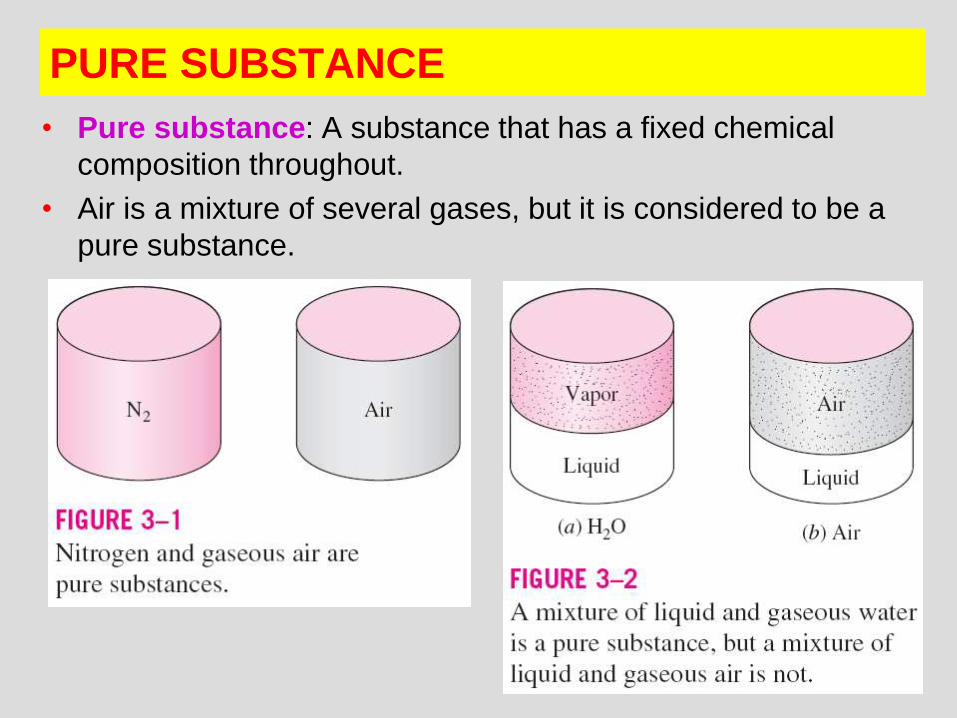
PURE SUBSTANCE
• Pure substance: A substance that has a fixed chemical
composition throughout.
• Air is a mixture of several gases, but it is considered to be a
pure substance.
4
PHASES OF A PURE SUBSTANCE
The molecules
in a solid are
kept at their
positions by the
large springlike
inter-molecular
forces.
In a solid, the
attractive and
repulsive forces
between the
molecules tend
to maintain them
at relatively
constant
distances from
each other.
5
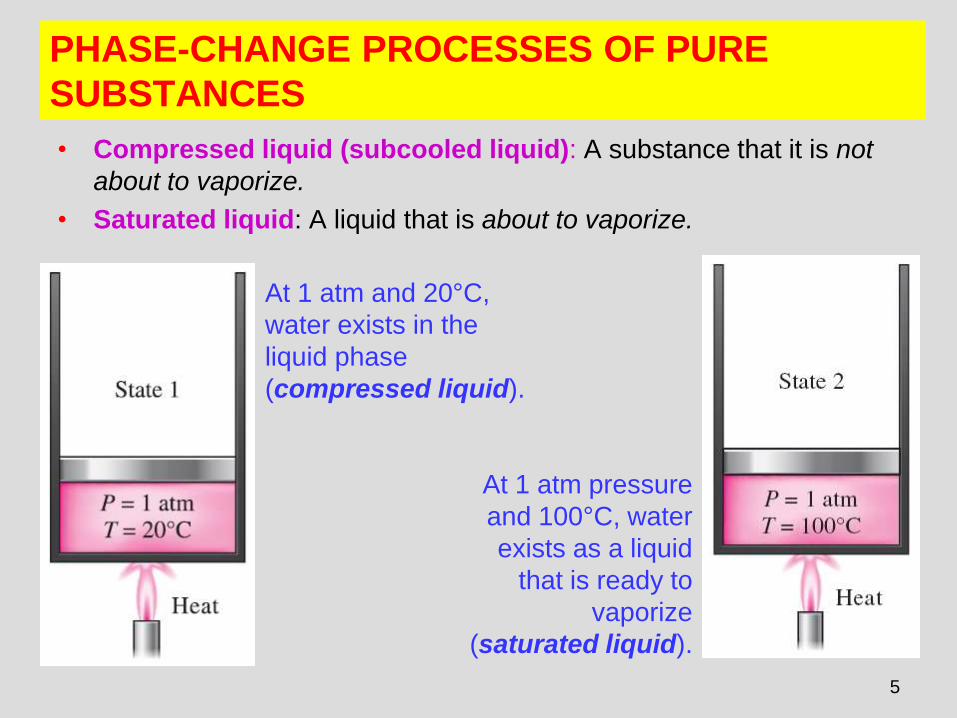
PHASE-CHANGE PROCESSES OF PURE
SUBSTANCES
• Compressed liquid (subcooled liquid): A substance that it is not
about to vaporize.
• Saturated liquid: A liquid that is about to vaporize.
At 1 atm and 20°C,
water exists in the
liquid phase
(compressed liquid).
At 1 atm pressure
and 100°C, water
exists as a liquid
that is ready to
vaporize
(saturated liquid).
6
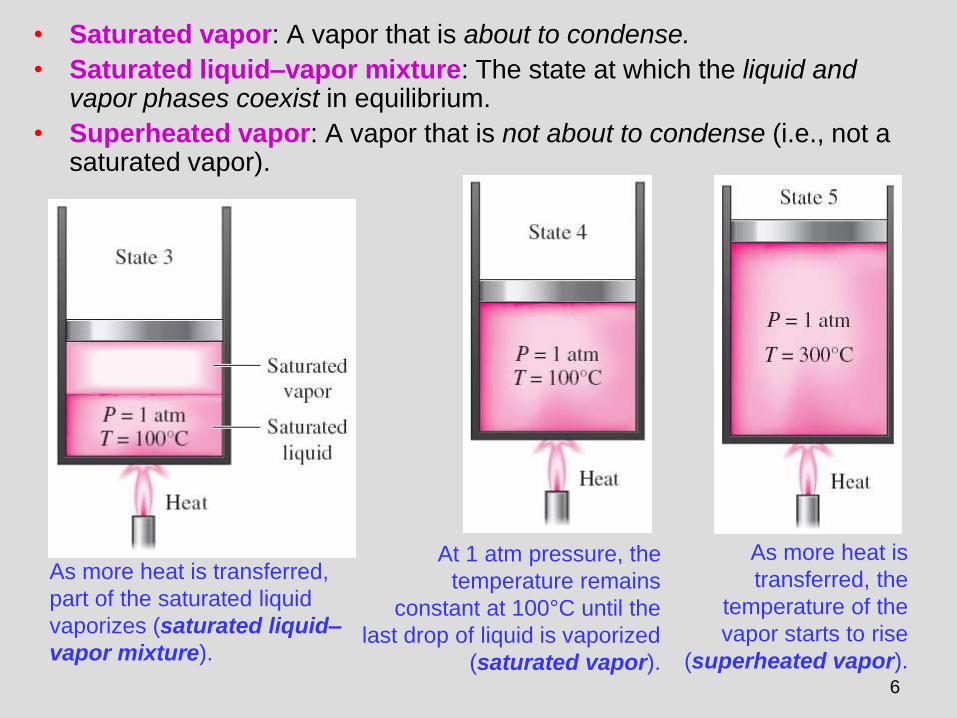
• Saturated vapor: A vapor that is about to condense.
• Saturated liquid–vapor mixture: The state at which the liquid and vapor phases coexist in equilibrium.
• Superheated vapor: A vapor that is not about to condense (i.e., not a saturated vapor).
As more heat is transferred,
part of the saturated liquid
vaporizes (saturated liquid–
vapor mixture).
At 1 atm pressure, the
temperature remains
constant at 100°C until the
last drop of liquid is vaporized
(saturated vapor).
As more heat is
transferred, the
temperature of the
vapor starts to rise
(superheated vapor).

7
T-v diagram for the
heating process of
water at constant
pressure.
If the entire process between state 1 and 5 described in the figure is reversed by cooling the water while maintaining the pressure at the same value, the water will go back to state 1, retracing the same path, and in so doing, the amount of heat released will exactly match the amount of heat added during the heating process.
8
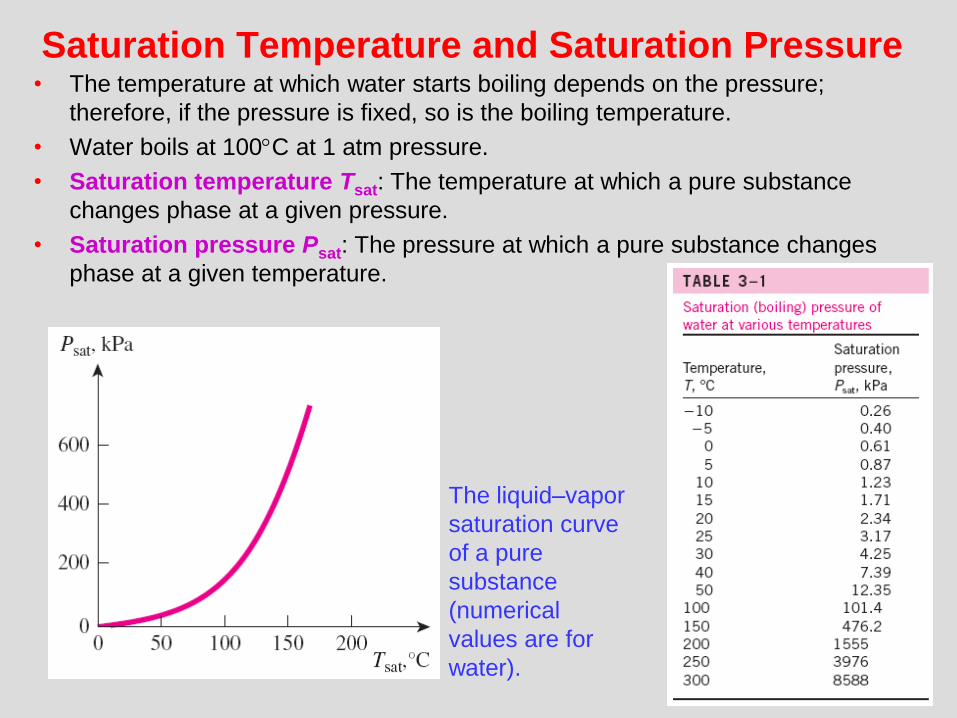
Saturation Temperature and Saturation Pressure• The temperature at which water starts boiling depends on the pressure;
therefore, if the pressure is fixed, so is the boiling temperature.
• Water boils at 100C at 1 atm pressure.
• Saturation temperature Tsat: The temperature at which a pure substance
changes phase at a given pressure.
• Saturation pressure Psat: The pressure at which a pure substance changes
phase at a given temperature.
The liquid–vapor
saturation curve
of a pure
substance
(numerical
values are for
water).
9
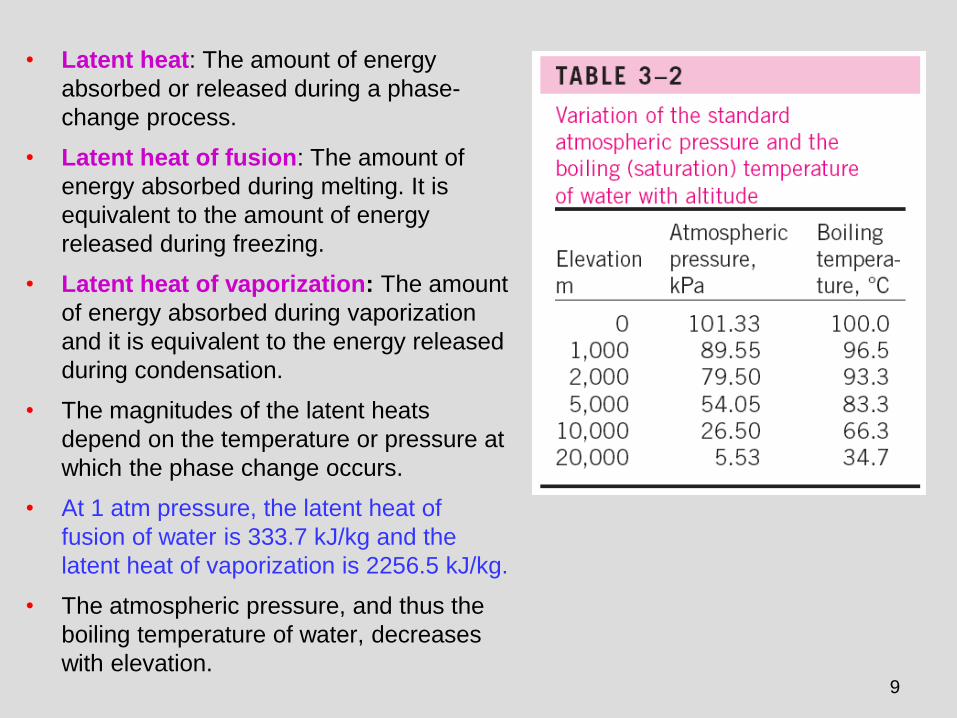
• Latent heat: The amount of energy
absorbed or released during a phase-
change process.
• Latent heat of fusion: The amount of
energy absorbed during melting. It is
equivalent to the amount of energy
released during freezing.
• Latent heat of vaporization: The amount
of energy absorbed during vaporization
and it is equivalent to the energy released
during condensation.
• The magnitudes of the latent heats
depend on the temperature or pressure at
which the phase change occurs.
• At 1 atm pressure, the latent heat of
fusion of water is 333.7 kJ/kg and the
latent heat of vaporization is 2256.5 kJ/kg.
• The atmospheric pressure, and thus the
boiling temperature of water, decreases
with elevation.
10
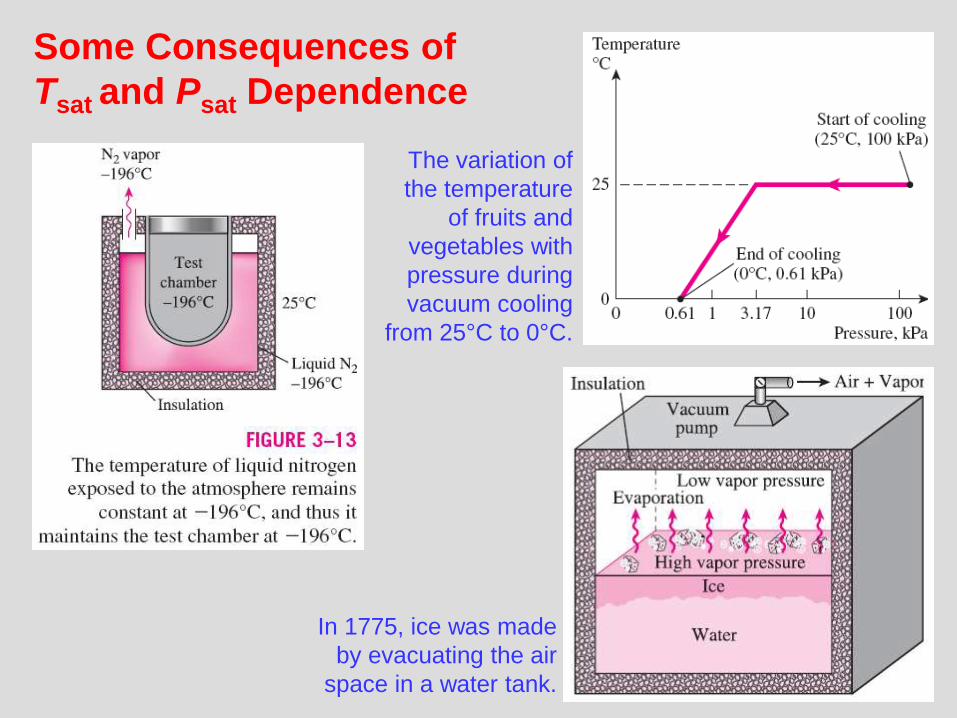
Some Consequences of
Tsat and Psat Dependence
The variation of
the temperature
of fruits and
vegetables with
pressure during
vacuum cooling
from 25°C to 0°C.
In 1775, ice was made
by evacuating the air
space in a water tank.

11
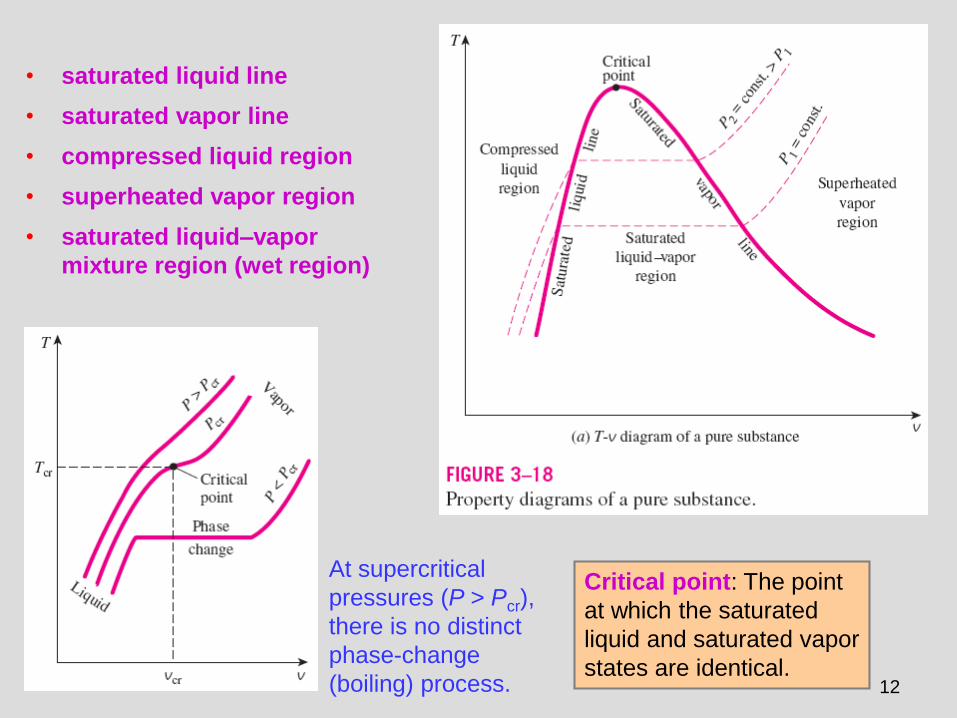
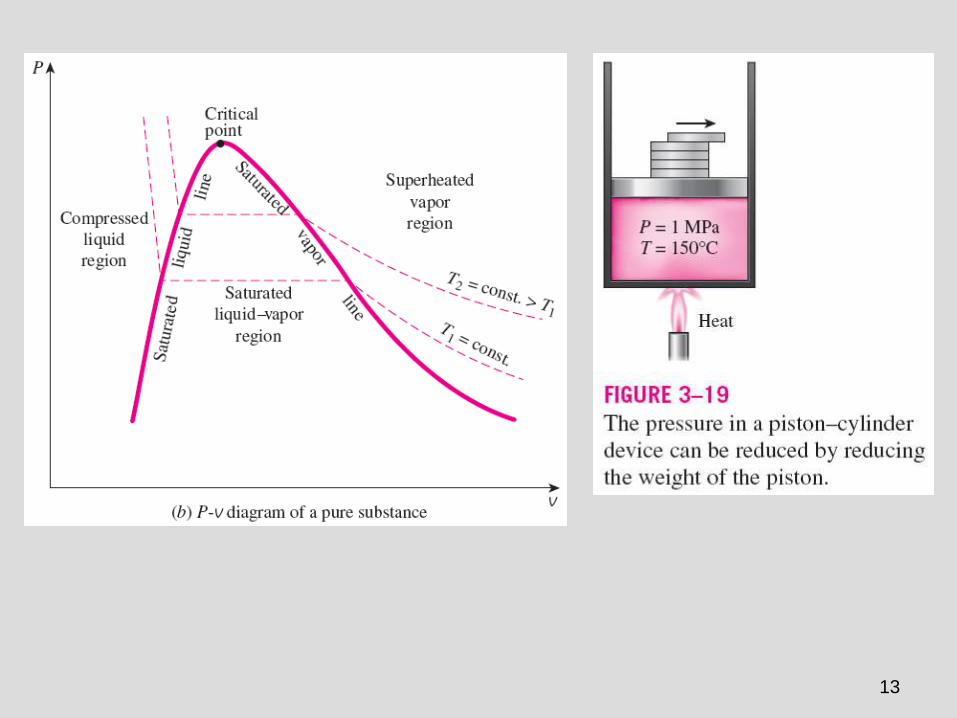
PROPERTY DIAGRAMS FOR PHASE-CHANGE
PROCESSESThe variations of properties during phase-change processes are best studied and understood with the help of property diagrams such as the T-v, P-v, and P-T diagrams for pure substances.
T-v diagram of
constant-pressure
phase-change
processes of a pure
substance at various
pressures
(numerical values
are for water).
12
• saturated liquid line
• saturated vapor line
• compressed liquid region
• superheated vapor region
• saturated liquid–vapor
mixture region (wet region)
At supercritical
pressures (P > Pcr),
there is no distinct
phase-change
(boiling) process.
Critical point: The point
at which the saturated
liquid and saturated vapor
states are identical.
13

14
Extending the
Diagrams to Include
the Solid Phase
At triple-point pressure
and temperature, a
substance exists in three
phases in equilibrium.
For water,
Ttp = 0.01°C
Ptp = 0.6117 kPa
15
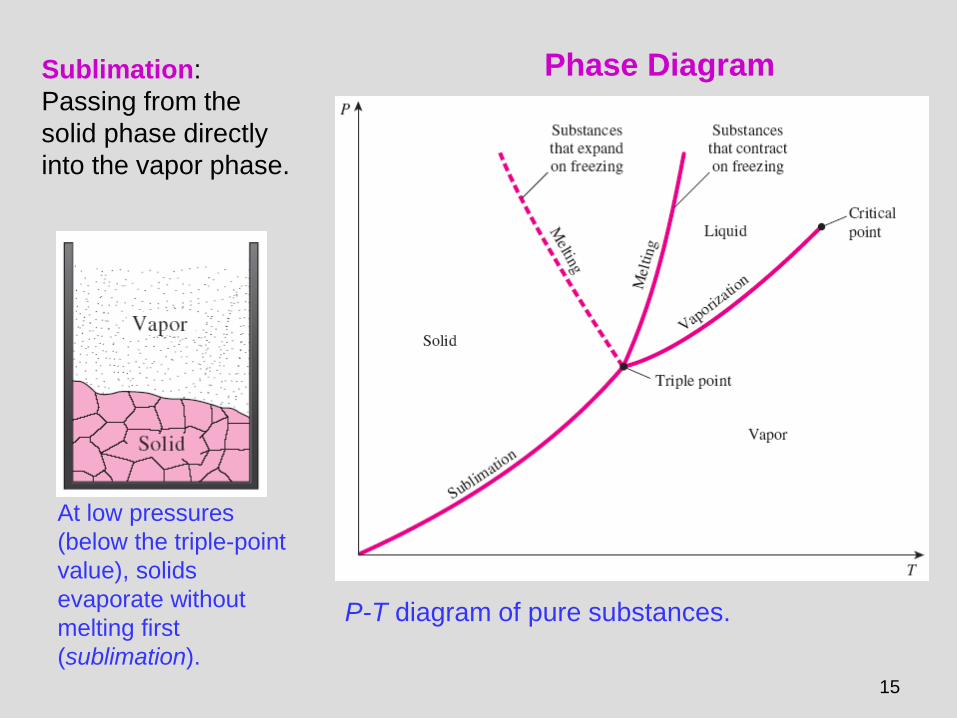
Sublimation:
Passing from the
solid phase directly
into the vapor phase.
At low pressures
(below the triple-point
value), solids
evaporate without
melting first
(sublimation).
P-T diagram of pure substances.
Phase Diagram
16
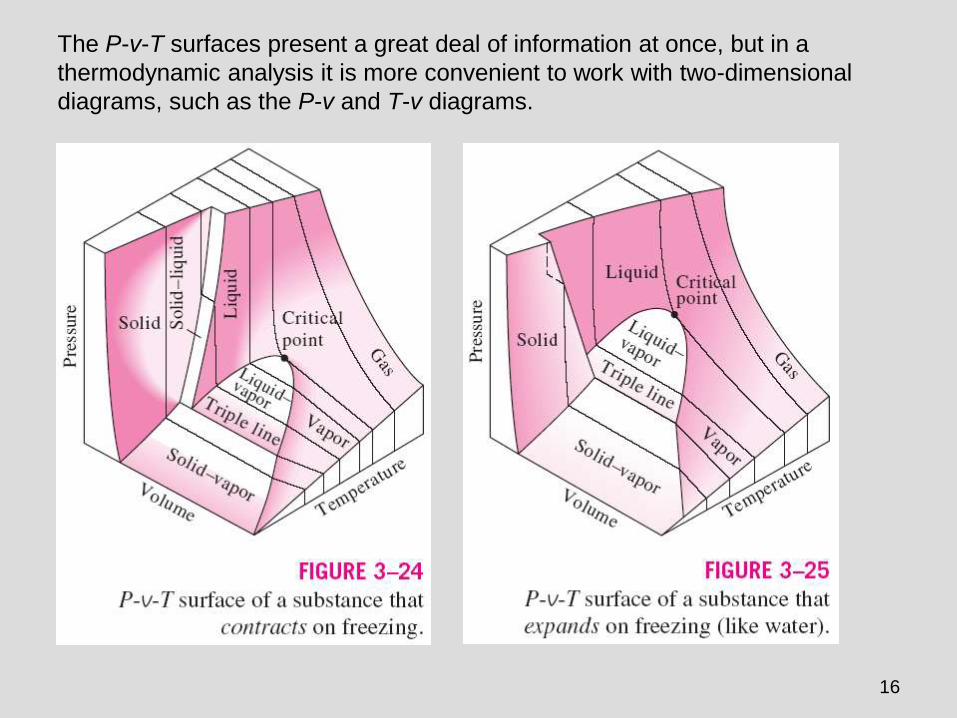
The P-v-T surfaces present a great deal of information at once, but in a
thermodynamic analysis it is more convenient to work with two-dimensional
diagrams, such as the P-v and T-v diagrams.

17
PROPERTY TABLES
• For most substances, the relationships among thermodynamic properties are too
complex to be expressed by simple equations.
• Therefore, properties are frequently presented in the form of tables.
• Some thermodynamic properties can be measured easily, but others cannot and
are calculated by using the relations between them and measurable properties.
• The results of these measurements and calculations are presented in tables in a
convenient format.
Enthalpy—A Combination Property
The
combination
u + Pv is
frequently
encountered
in the analysis
of control
volumes.
The product pressure
volume has energy units.

18
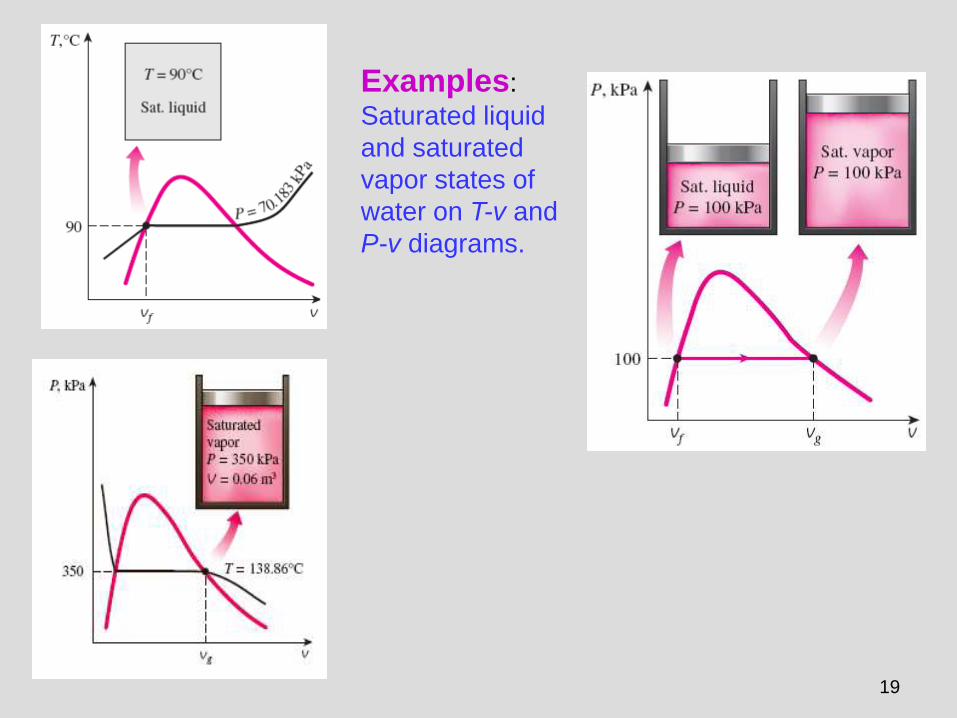
Saturated Liquid and Saturated Vapor States
• Table A–4: Saturation properties of water under temperature.
• Table A–5: Saturation properties of water under pressure.
A partial list of Table A–4.
Enthalpy of vaporization, hfg (Latent
heat of vaporization): The amount of
energy needed to vaporize a unit mass
of saturated liquid at a given
temperature or pressure.
19
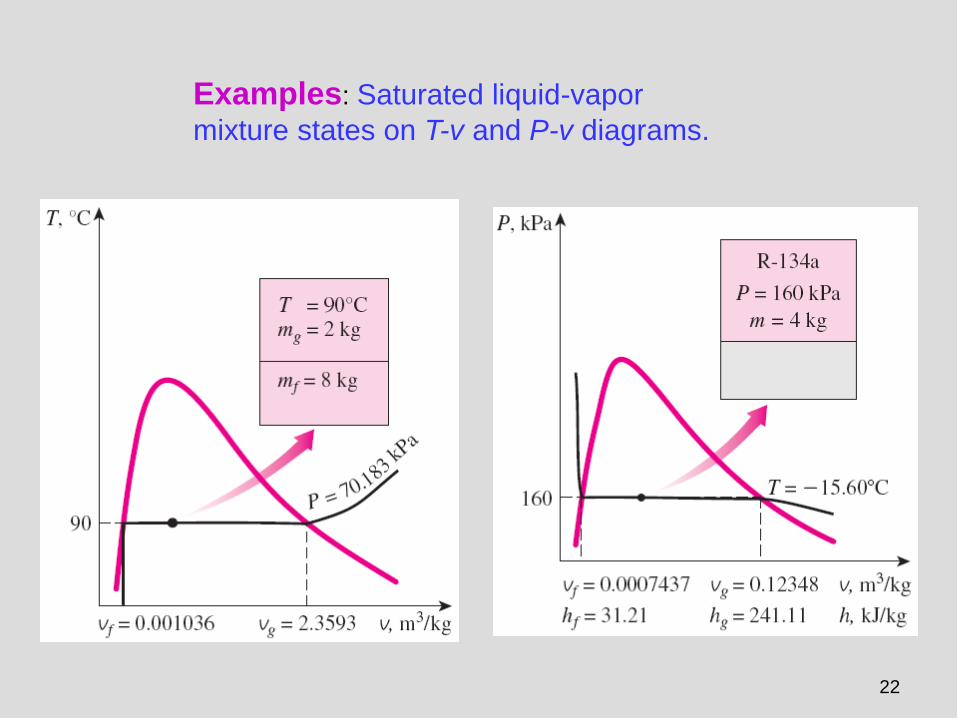
Examples:
Saturated liquid
and saturated
vapor states of
water on T-v and
P-v diagrams.
20
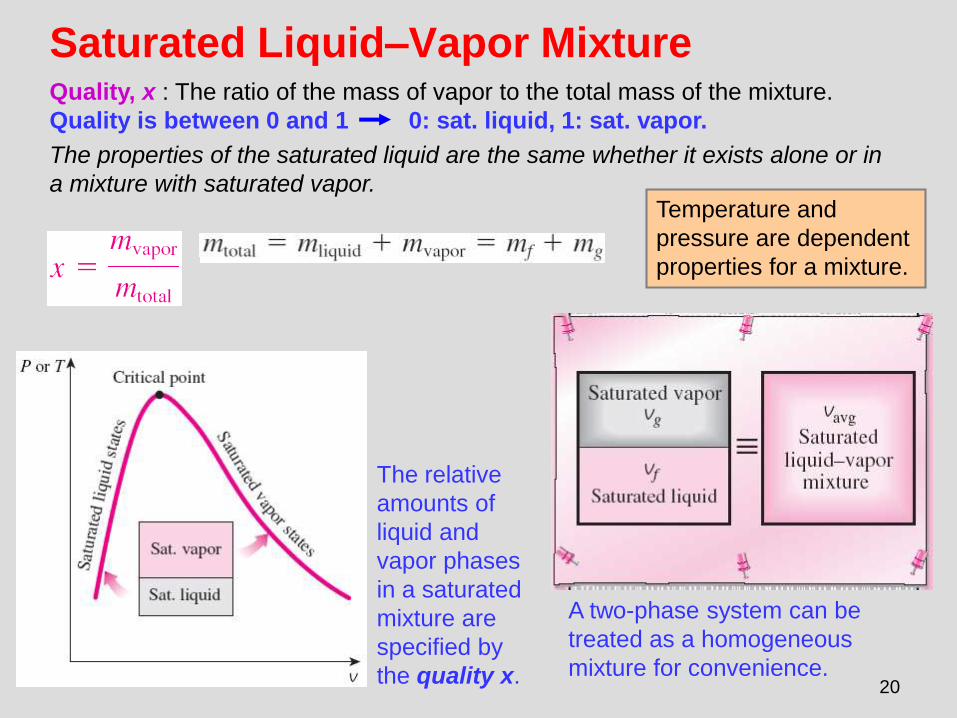
Saturated Liquid–Vapor MixtureQuality, x : The ratio of the mass of vapor to the total mass of the mixture.
Quality is between 0 and 1 0: sat. liquid, 1: sat. vapor.
The properties of the saturated liquid are the same whether it exists alone or in
a mixture with saturated vapor.
The relative
amounts of
liquid and
vapor phases
in a saturated
mixture are
specified by
the quality x.
A two-phase system can be
treated as a homogeneous
mixture for convenience.
Temperature and
pressure are dependent
properties for a mixture.

21
y v, u, or h.
22
Examples: Saturated liquid-vapor
mixture states on T-v and P-v diagrams.
23
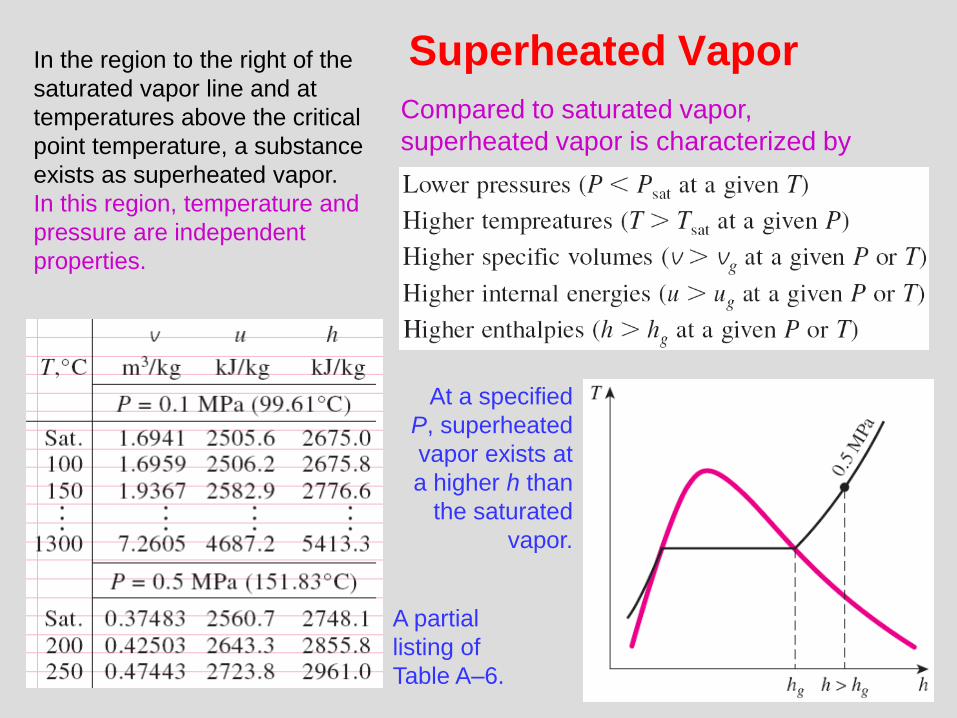
Superheated VaporIn the region to the right of the
saturated vapor line and at
temperatures above the critical
point temperature, a substance
exists as superheated vapor.
In this region, temperature and
pressure are independent
properties.
A partial
listing of
Table A–6.
At a specified
P, superheated
vapor exists at
a higher h than
the saturated
vapor.
Compared to saturated vapor,
superheated vapor is characterized by

24
Compressed LiquidCompressed liquid is characterized by
y v, u, or h
A more accurate relation for h
A compressed liquid
may be approximated
as a saturated liquid at
the given temperature.
The compressed liquid properties
depend on temperature much more
strongly than they do on pressure.

25
Reference State and Reference Values• The values of u, h, and s cannot be measured directly, and they are calculated from
measurable properties using the relations between properties.
• However, those relations give the changes in properties, not the values of properties at specified states.
• Therefore, we need to choose a convenient reference state and assign a value of zero for a convenient property or properties at that state.
• The reference state for water is 0.01°C and for R-134a is -40°C in tables.
• Some properties may have negative values as a result of the reference state chosen.
• Sometimes different tables list different values for some properties at the same state as a result of using a different reference state.
• However, In thermodynamics we are concerned with the changes in properties, and the reference state chosen is of no consequence in calculations.
26
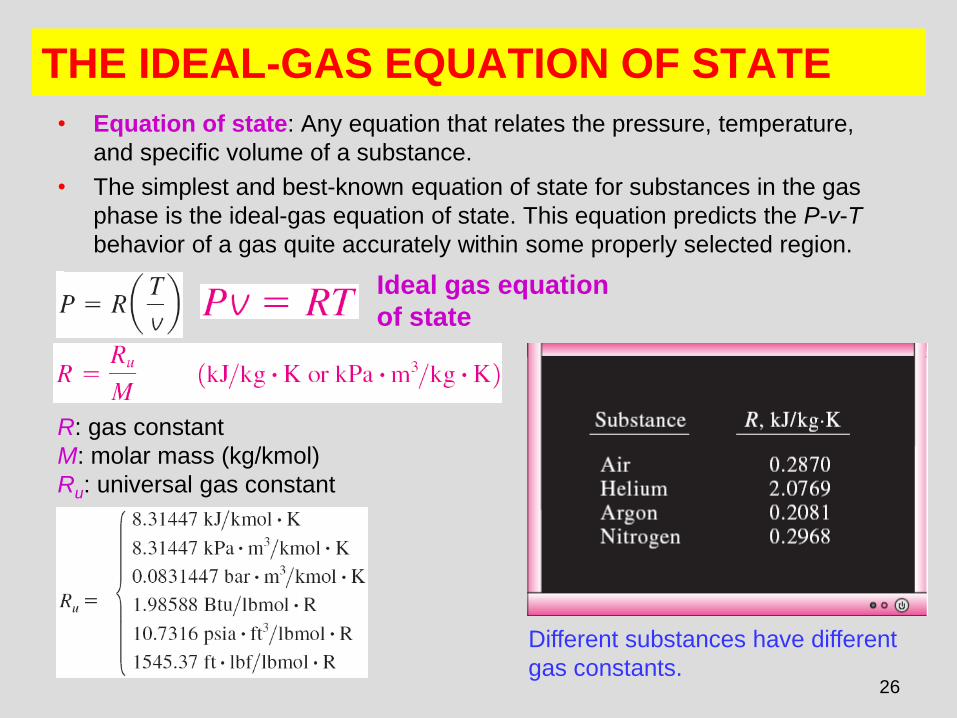
THE IDEAL-GAS EQUATION OF STATE
• Equation of state: Any equation that relates the pressure, temperature,
and specific volume of a substance.
• The simplest and best-known equation of state for substances in the gas
phase is the ideal-gas equation of state. This equation predicts the P-v-T
behavior of a gas quite accurately within some properly selected region.
R: gas constant
M: molar mass (kg/kmol)
Ru: universal gas constant
Ideal gas equation
of state
Different substances have different
gas constants.

27
Properties per unit mole are
denoted with a bar on the top.
Mass = Molar mass Mole number
Various expressions
of ideal gas equation
Ideal gas equation at two
states for a fixed mass
Real gases behave as an ideal gas at low
densities (i.e., low pressure, high temperature).
28
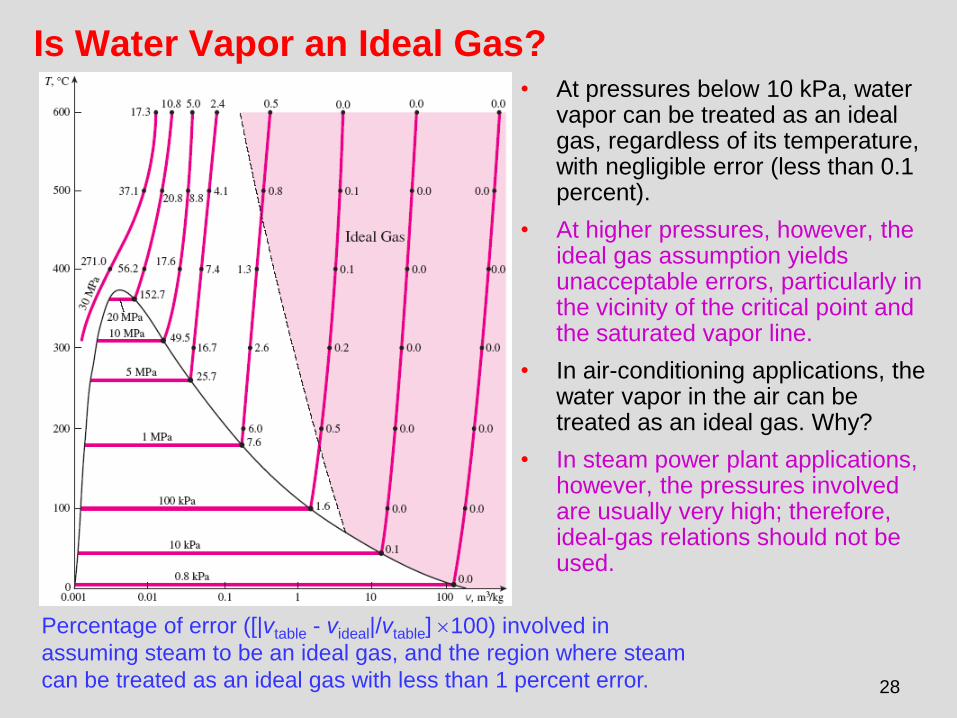
Is Water Vapor an Ideal Gas?• At pressures below 10 kPa, water
vapor can be treated as an ideal gas, regardless of its temperature, with negligible error (less than 0.1 percent).
• At higher pressures, however, the ideal gas assumption yields unacceptable errors, particularly in the vicinity of the critical point and the saturated vapor line.
• In air-conditioning applications, the water vapor in the air can be treated as an ideal gas. Why?
• In steam power plant applications, however, the pressures involved are usually very high; therefore, ideal-gas relations should not be used.
Percentage of error ([|vtable - videal|/vtable] 100) involved in
assuming steam to be an ideal gas, and the region where steam
can be treated as an ideal gas with less than 1 percent error.

29
COMPRESSIBILITY FACTOR—A MEASURE
OF DEVIATION FROM IDEAL-GAS BEHAVIORCompressibility factor Z
A factor that accounts for
the deviation of real gases
from ideal-gas behavior at
a given temperature and
pressure.
The farther away Z is from unity, the more the
gas deviates from ideal-gas behavior.
Gases behave as an ideal gas at low densities
(i.e., low pressure, high temperature).
Question: What is the criteria for low pressure
and high temperature?
Answer: The pressure or temperature of a gas
is high or low relative to its critical temperature
or pressure.

30Comparison of Z factors for various gases.
Reduced
temperature
Reduced
pressure
Pseudo-reduced
specific volume
Z can also be determined from
a knowledge of PR and vR.
31
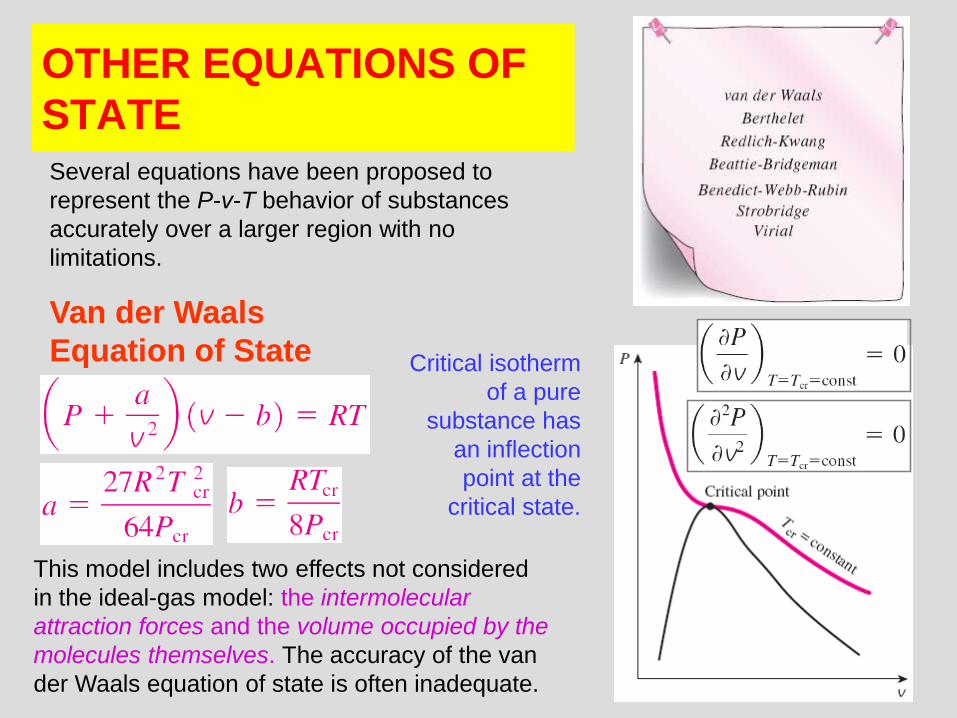
OTHER EQUATIONS OF
STATE
Several equations have been proposed to
represent the P-v-T behavior of substances
accurately over a larger region with no
limitations.
Van der Waals
Equation of State Critical isotherm
of a pure
substance has
an inflection
point at the
critical state.
This model includes two effects not considered
in the ideal-gas model: the intermolecular
attraction forces and the volume occupied by the
molecules themselves. The accuracy of the van
der Waals equation of state is often inadequate.
32
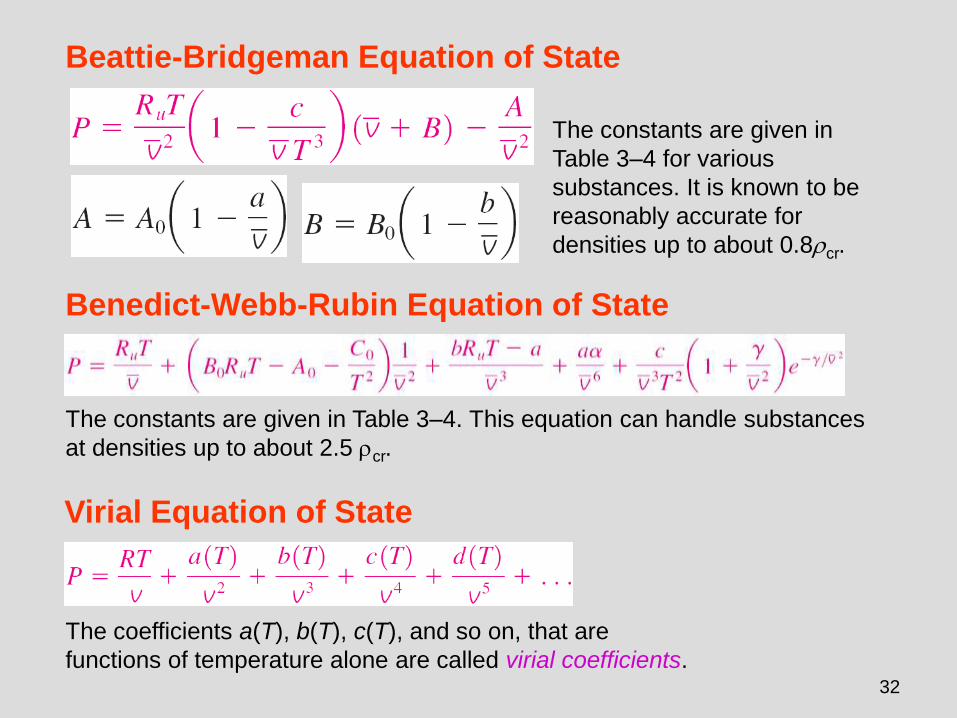
Beattie-Bridgeman Equation of State
The constants are given in
Table 3–4 for various
substances. It is known to be
reasonably accurate for
densities up to about 0.8cr.
Benedict-Webb-Rubin Equation of State
The constants are given in Table 3–4. This equation can handle substances
at densities up to about 2.5 cr.
Virial Equation of State
The coefficients a(T), b(T), c(T), and so on, that are
functions of temperature alone are called virial coefficients.

33
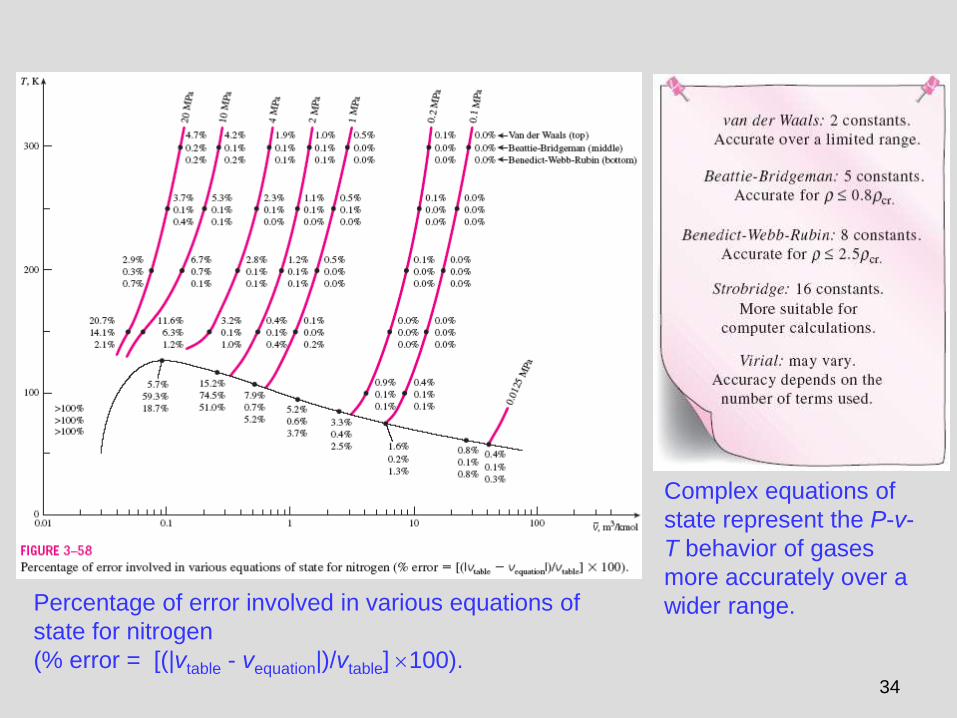
34
Complex equations of
state represent the P-v-
T behavior of gases
more accurately over a
wider range.Percentage of error involved in various equations of
state for nitrogen
(% error = [(|vtable - vequation|)/vtable] 100).

35
Summary• Pure substance
• Phases of a pure substance
• Phase-change processes of pure substances
Compressed liquid, Saturated liquid, Saturated vapor, Superheated vapor
Saturation temperature and Saturation pressure
• Property diagrams for phase change processes
The T-v diagram, The P-v diagram, The P-T diagram, The P-v-T surface
• Property tables
Enthalpy
Saturated liquid, saturated vapor, Saturated liquid vapor mixture, Superheated vapor, compressed liquid
Reference state and reference values
• The ideal gas equation of state
Is water vapor an ideal gas?
• Compressibility factor
• Other equations of state
van der Waals Equation of State, Beattie-Bridgeman Equation of State
Benedict-Webb-Rubin Equation of State, Virial Equation of State
Related Documents