B. Derrick Taff B. Derrick Taff April, 2009 Generalizing the Generalizing the Norm/Crowding Relationship: Norm/Crowding Relationship: An Application of PCI An Application of PCI

B. Derrick Taff April, 2009 Generalizing the Norm/Crowding Relationship: An Application of PCI.
Dec 14, 2015
Welcome message from author
This document is posted to help you gain knowledge. Please leave a comment to let me know what you think about it! Share it to your friends and learn new things together.
Transcript
B. Derrick TaffB. Derrick Taff
April, 2009
Generalizing the Norm/Crowding Generalizing the Norm/Crowding Relationship: An Application of PCIRelationship: An Application of PCI

1978 – Transit shuttle and park 1978 – Transit shuttle and park and and ride ride system established.system established.
2000 -- Shuttle system between 2000 -- Shuttle system between the the
Park & Ride lot and Bear Park & Ride lot and Bear Lake operates on 10-Lake operates on 10-
minute minute headways during peak headways during peak periods.periods.
2002 -- Expansion of the Park & 2002 -- Expansion of the Park & Ride lot to 338 spaces.Ride lot to 338 spaces.
2006 – Provision of Hiker shuttle 2006 – Provision of Hiker shuttle service from Estes Park to service from Estes Park to the Park & Ridethe Park & Ride
Goal: Conserve natural, historical and cultural
resources/reduce congestion and pollution/ultimately
enhance visitor experiences

Introducing high frequency shuttles to the Introducing high frequency shuttles to the Bear Lake Road corridor has increased Bear Lake Road corridor has increased access to the trails within the corridor and access to the trails within the corridor and has caused impacts:has caused impacts:
Integrity of the ParkIntegrity of the Park
Resource Degradation Resource Degradation
Managerial ConcernsManagerial Concerns

“Develop approaches to explicitly integrate
transportation and user capacity planning in parks
and public lands”

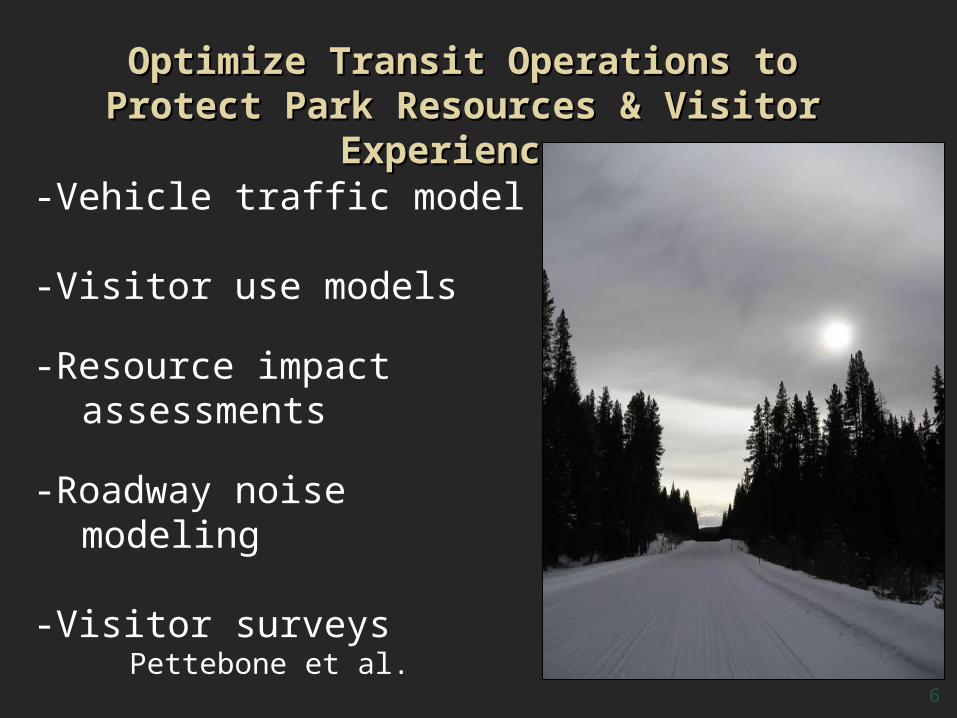
Research GoalResearch Goal: Optimize : Optimize Transit Operations to Transit Operations to
Protect Park Resources & Protect Park Resources & Visitor ExperiencesVisitor Experiences
Vehicle Traffic
Cadna-A SoundGrid
NoiseImpacts
Perceived Impacts
GIS Model
Site Perceived Crowding
Paramics Site Visitatio
n Resource
Impacts
Perceived
Impacts
Pedestrian
Model
Experiential &
EcosystemEffects
6
Optimize Transit Operations to Optimize Transit Operations to Protect Park Resources & Visitor Protect Park Resources & Visitor
ExperiencesExperiences-Vehicle traffic model
-Visitor use models
-Resource impact assessments
-Roadway noise modeling
-Visitor surveysPettebone et al.
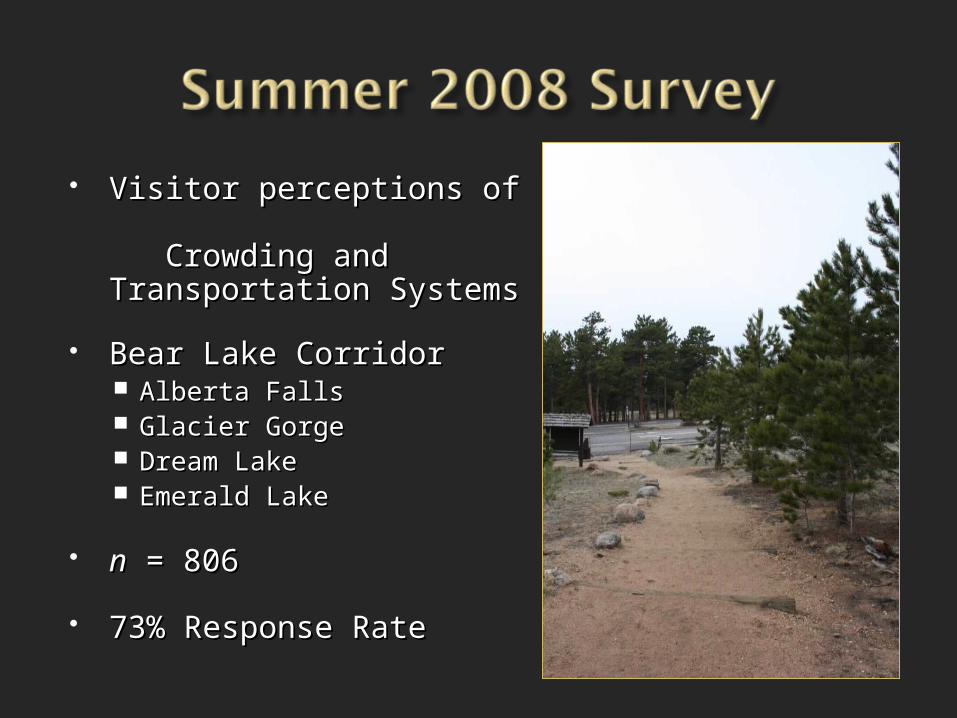
Visitor perceptions of Visitor perceptions of Crowding Crowding and Transportation and Transportation SystemsSystems
Bear Lake Corridor Bear Lake Corridor Alberta Falls Alberta Falls Glacier GorgeGlacier Gorge Dream LakeDream Lake Emerald LakeEmerald Lake
nn = 806 = 806
73% Response Rate73% Response Rate

Structural Approaches to Norms Provide a framework for evaluating behaviors or conditions
stemming from those behaviors Great for determining standards for acceptable recreation impacts
-Personal Norms Individual expectations, learned from shared expectations
-Social Norms Standards shared by members of a group
-Subjective Norms What you think others would want you to do → leading to behavior
-Encounter NormsExpectations in terms of the number of encounters with other people an individual would tolerate before their experience would be altered.

PCIPCI
Norm/Crowding Norm/Crowding ResearchResearch
Research
Research
DirectionDirection
Generalizing the Encounter-Norm-Crowding RelationshipVaske & Donnelly, 2002
- “Theory predicts that when encounters exceed a visitor’s norm for seeing others, crowding will occur.”
- Analyzed data from 13 different studies to support the hypotheses
- Crowding was measured using the 9-pt scale
- Continuing this research with a splash of Potential for Conflict Index
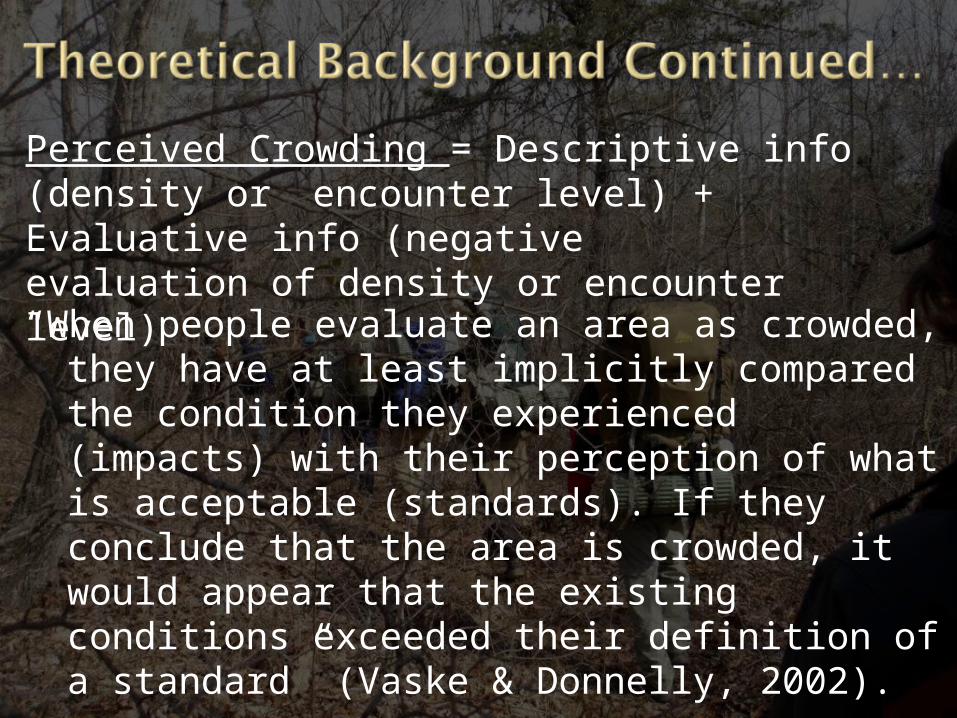
“When people evaluate an area as crowded, they have at least implicitly compared the condition they experienced (impacts) with their perception of what is acceptable (standards). If they conclude that the area is crowded, it would appear that the existing conditions exceeded their definition of a standard” (Vaske & Donnelly, 2002).
Perceived Crowding = Descriptive info (density or encounter level) + Evaluative info (negative evaluation of density or encounter level)
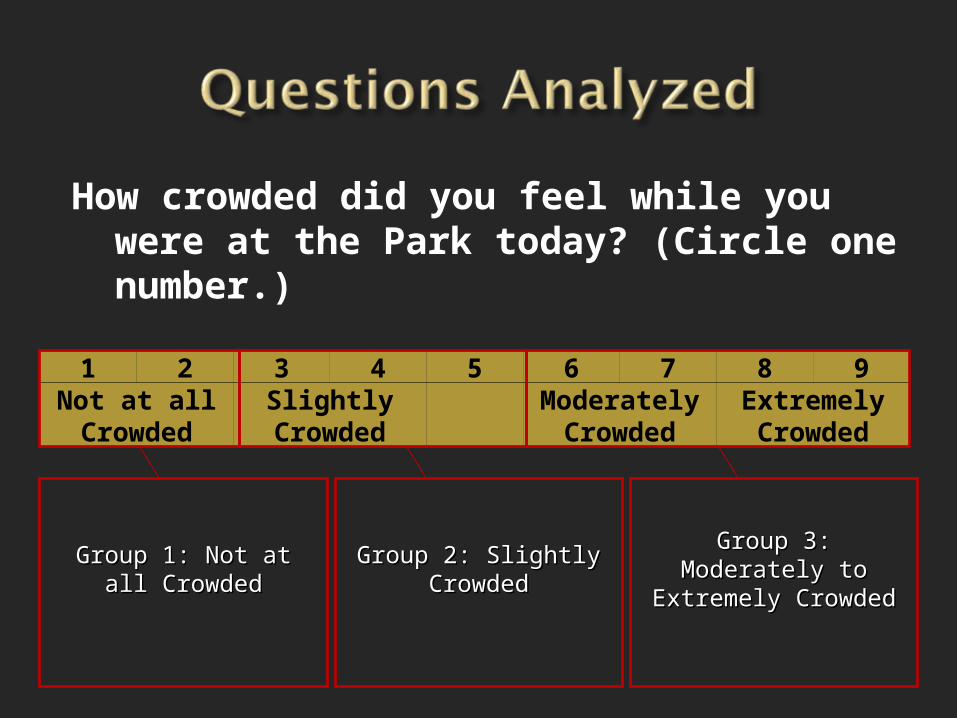
How crowded did you feel while you were at the Park today? (Circle one number.)
1 2 3 4 5 6 7 8 9Not at allCrowded
SlightlyCrowded
Moderately Crowded
Extremely Crowded
Group 1: Not at all Group 1: Not at all CrowdedCrowded
Group 2: Slightly Group 2: Slightly CrowdedCrowded
Group 3: Moderately Group 3: Moderately to Extremely Crowdedto Extremely Crowded

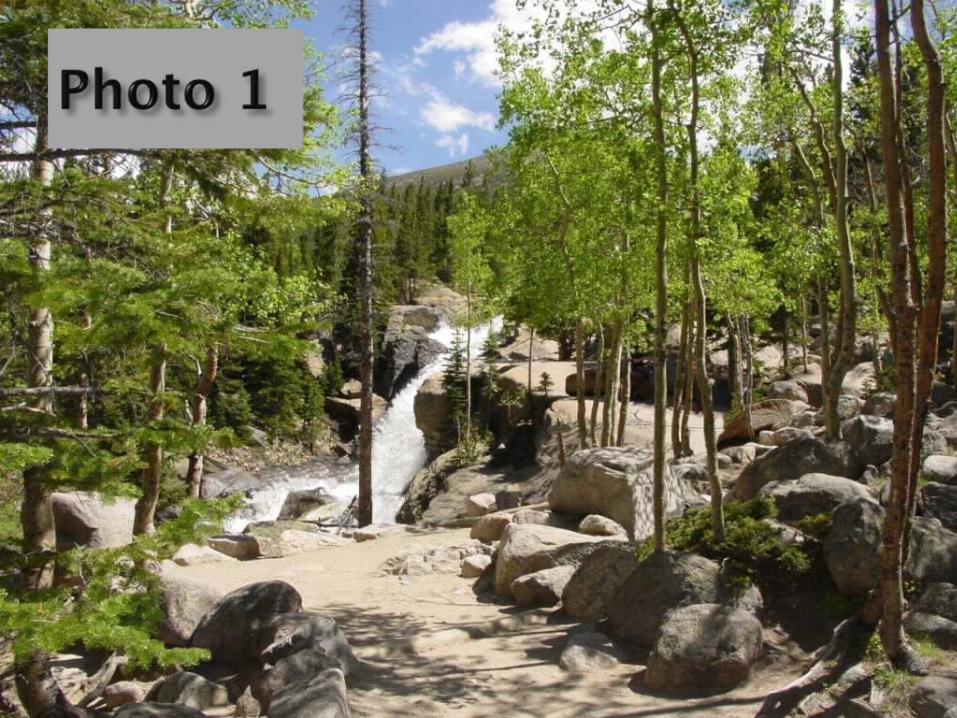
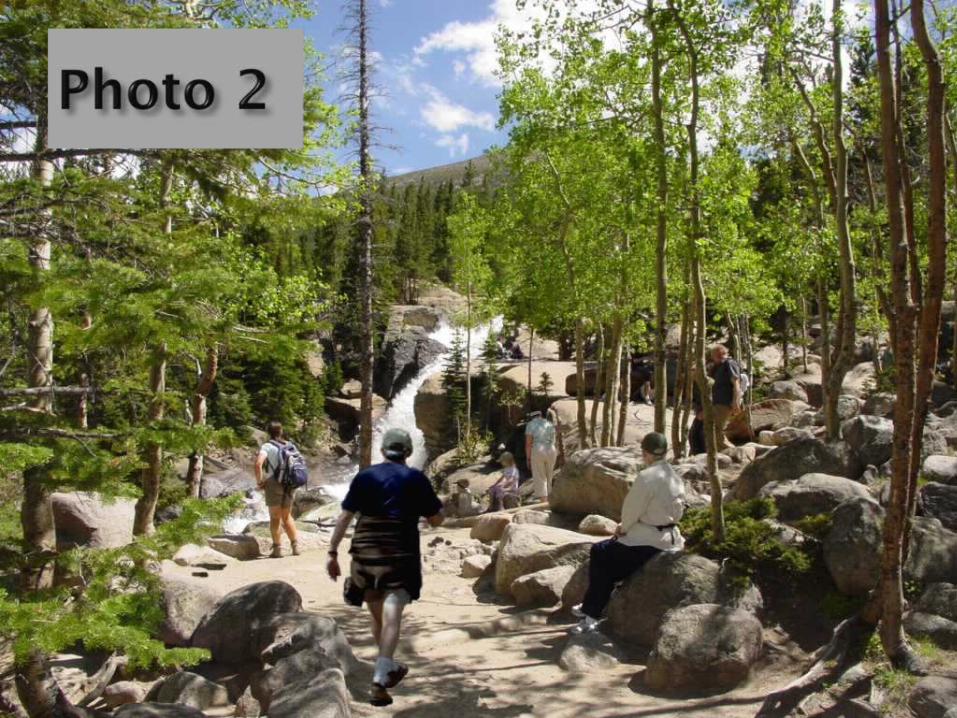
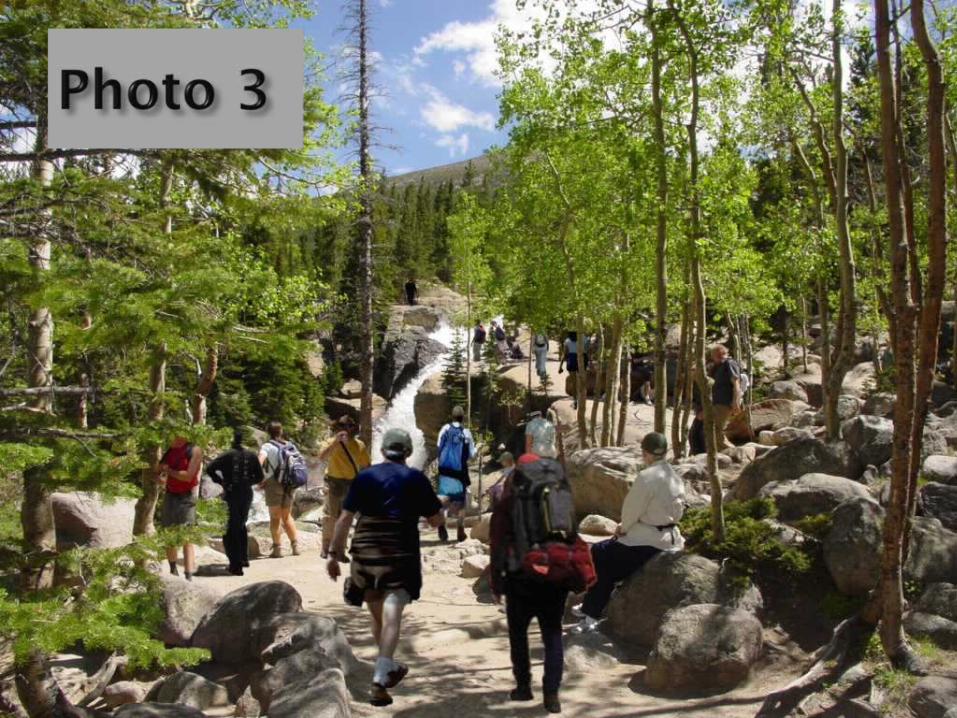
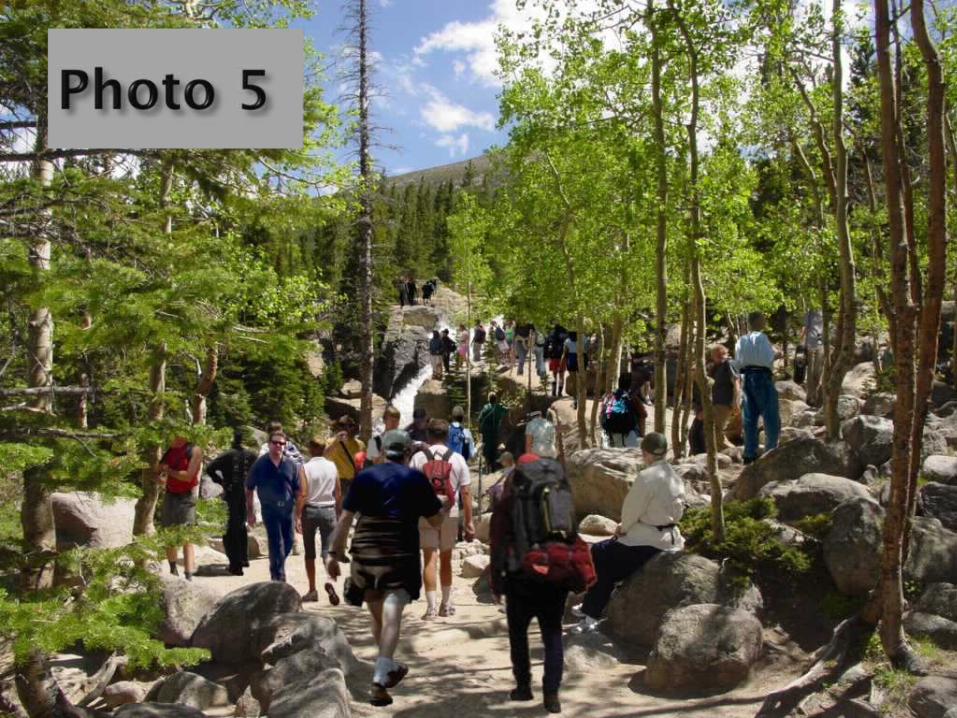
We would like to know how many other people you think you could encounter We would like to know how many other people you think you could encounter at the Park without feeling too crowded. To help judge this, please rate at the Park without feeling too crowded. To help judge this, please rate each of the photographs by indicating how acceptable you find it based on each of the photographs by indicating how acceptable you find it based on the number of people in the photo. (Circle the number of people in the photo. (Circle oneone number for number for each photoeach photo))
Very Unacceptable
Very Acceptable
Photo 1 -4 -3 -2 -1 0 1 2 3 4
Photo 2 -4 -3 -2 -1 0 1 2 3 4
Photo 3 -4 -3 -2 -1 0 1 2 3 4
Photo 4 -4 -3 -2 -1 0 1 2 3 4
Photo 5 -4 -3 -2 -1 0 1 2 3 4


H1: When actual density exceeds encounter norms, visitor acceptability of crowding will decrease.
H2: The most consensus regarding acceptability of crowding will occur at the least crowded and most crowded scenarios.
H3: As level of perceived crowding increases, acceptability of crowding will vary among groups.
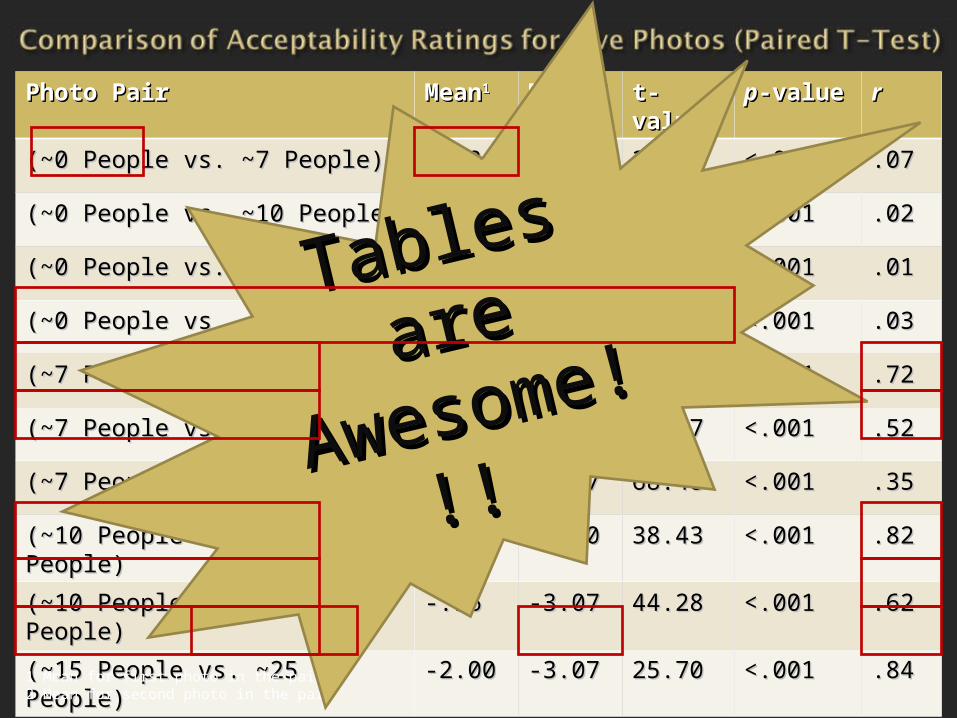
Photo PairPhoto Pair MeanMean11 Mean Mean 22
t-t-valuevalue
pp-value-value rr
(~0 People vs. ~7 People)(~0 People vs. ~7 People) 3.733.73 2.102.10 21.0821.08 <.001<.001 .07.07
(~0 People vs. ~10 People)(~0 People vs. ~10 People) 3.733.73 -.16-.16 43.8343.83 <.001<.001 .02.02
(~0 People vs. ~15 People)(~0 People vs. ~15 People) 3.733.73 -2.00-2.00 68.3368.33 <.001<.001 .01.01
(~0 People vs. ~25 People)(~0 People vs. ~25 People) 3.733.73 -3.07-3.07 92.3192.31 <.001<.001 .03.03
(~7 People vs. ~10 People)(~7 People vs. ~10 People) 2.102.10 -.16-.16 39.7339.73 <.001<.001 .72.72
(~7 People vs. ~15 People)(~7 People vs. ~15 People) 2.102.10 -2.00-2.00 57.2757.27 <.001<.001 .52.52
(~7 People vs. ~25 People)(~7 People vs. ~25 People) 2.102.10 -3.07-3.07 68.4868.48 <.001<.001 .35.35
(~10 People vs. ~15 People)(~10 People vs. ~15 People) -.16-.16 -2.00-2.00 38.4338.43 <.001<.001 .82.82
(~10 People vs. ~25 People)(~10 People vs. ~25 People) -.16-.16 -3.07-3.07 44.2844.28 <.001<.001 .62.62
(~15 People vs. ~25 People)(~15 People vs. ~25 People) -2.00-2.00 -3.07-3.07 25.7025.70 <.001<.001 .84.84
1 Mean for first photo in the pair2 Mean for second photo in the pair
Tables Tables
are are
AwesomeAwesome
!!! !!!

Visitor Acceptability of Photos Very
Acceptable
Neutral
Very Unacceptable
Acc
ep
tab
ility
Acceptability of Crowding at the Bear Lake Corridor of RMNP
Visitor Norm: ~10 People
~ 0 ~ 0 PeoplePeople
~ 7 People~ 7 People ~10 People~10 People ~ 15 People~ 15 People ~ 25 People~ 25 People

Attitude Toward Crowding LevelAttitude Toward Crowding Level11
PhotoPhoto Not at Not at AllAll
SlighSlightt
Moderate – Moderate – ExtremeExtreme
FF pp--valuevalue
EtaEta
#1#1 3.443.44aa 3.763.76bb 3.823.82bb 6.806.80 .001*.001* .13.13
#2#2 2.922.92aa 2.112.11bb 1.431.43cc 30.530.511
<.001*<.001***
.27.27
#3#3 .87.87aa -.17-.17bb -.93-.93cc 33.733.700
<.001*<.001***
.28.28
#4#4 -1.19-1.19aa -2.11-2.11bb -2.41-2.41bb 18.118.144
<.001*<.001***
.21.21
#5#5 -2.51-2.51aa -3.17-3.17bb -3.33-3.33bb 12.712.700
<.001*<.001***
.18.18
1 Means with different subscripts are significant at the p<.05 level, accounting for multiple tests using the Scheffe’s S Method*p<.05; **p<.001
~ 0 ~ 0 PeoplePeople
~ 7 ~ 7 PeoplePeople
~ 10 ~ 10 PeoplePeople
~ 15 ~ 15 PeoplePeople
~25 ~25 PeoplePeople

Group Perceptions of Crowding Across 5 PhotosVery
Acceptable
Unsure
Very Unacceptabl
e
Acc
ep
tab
ility
Not At All CrowdedNot At All Crowded
Slightly CrowdedSlightly CrowdedModerately to Extremely CrowdedModerately to Extremely Crowded
Photo 1 Photo 2
Photo 3
Photo 4
Photo 5
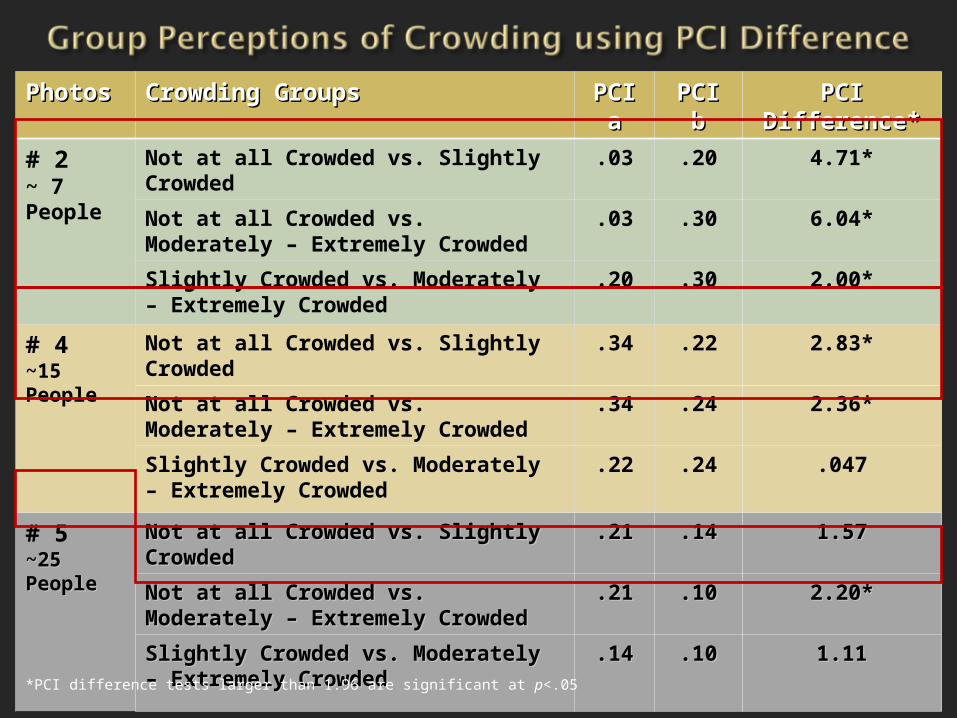
PhotosPhotos Crowding GroupsCrowding Groups PCI PCI aa
PCI PCI bb
PCI PCI Difference*Difference*
# 2 ~ 7 People
Not at all Crowded vs. Slightly Crowded
.03 .20 4.71*
Not at all Crowded vs. Moderately – Extremely Crowded
.03 .30 6.04*
Slightly Crowded vs. Moderately – Extremely Crowded
.20 .30 2.00*
# 4~15 People
Not at all Crowded vs. Slightly Crowded
.34 .22 2.83*
Not at all Crowded vs. Moderately – Extremely Crowded
.34 .24 2.36*
Slightly Crowded vs. Moderately – Extremely Crowded
.22 .24 .047
# 5~25 ~25 PeoplePeople
Not at all Crowded vs. Slightly Not at all Crowded vs. Slightly CrowdedCrowded
.21.21 .14.14 1.571.57
Not at all Crowded vs. Moderately Not at all Crowded vs. Moderately – Extremely Crowded– Extremely Crowded
.21.21 .10.10 2.20*2.20*
Slightly Crowded vs. Moderately – Slightly Crowded vs. Moderately – Extremely Crowded Extremely Crowded
.14.14 .10.10 1.111.11
*PCI difference tests larger than 1.96 are significant at p<.05
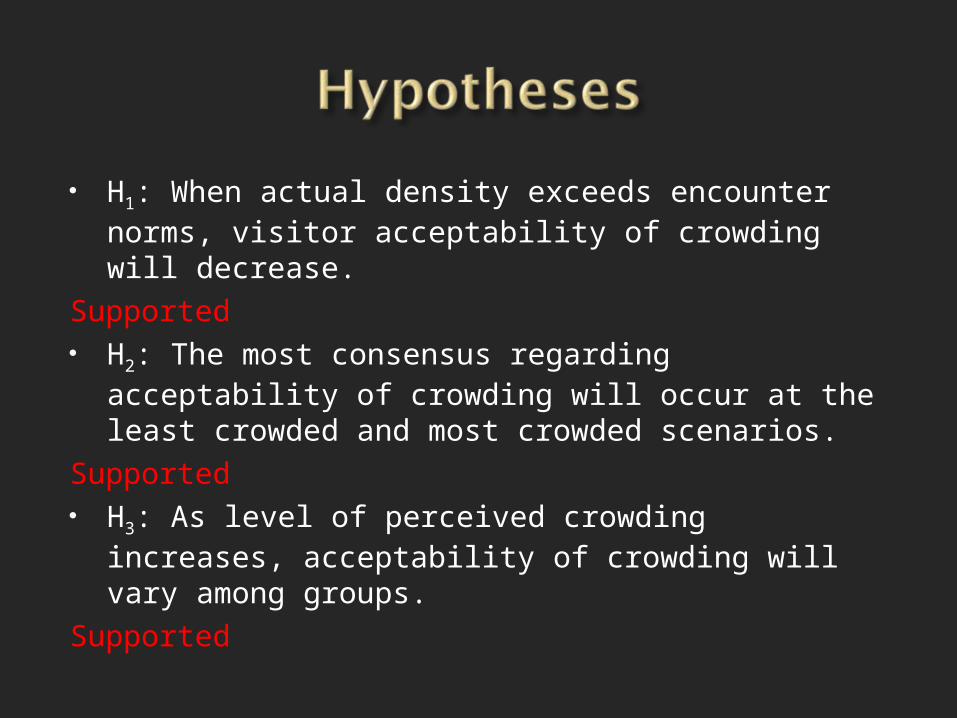
H1: When actual density exceeds encounter norms, visitor acceptability of crowding will decrease.
Supported H2: The most consensus regarding acceptability
of crowding will occur at the least crowded and most crowded scenarios.
Supported H3: As level of perceived crowding increases,
acceptability of crowding will vary among groups. Supported
Focus upon the three different groups and the norms/standards established through this analysis
Management should focus upon those individuals that exhibit norms/standards at the extreme ends (Moderate – Extremely Crowded Group)
Recreation Opportunity Spectrum Adapt management plans to better inform and educate
visitors Zone for different user groups based upon interpretive
information

-Test Different Methodologies Randomize Photos
-Stay Consistent with Proven Scales (9-pt Scale)-Apply PCI to reports to enhance Management Implications-Establish Baselines

QuestionQuestions?s?
Related Documents