»} ll b D HABITAT USE AND ENERGETICS OF AMERICAN BLACK DUCKS WINTERING AT CHINCOTEAGUE, VIRGINIA bv John M. Morton Thesis submitted to the Faculty of the Virginia Polytechnic Institute and State University in partial fultillment of the requirements for the degree of MASTER OF SCIENCE in Flsheries and Wildlife Sciences . APPRO)/ED: - I [I Il I/{ Nv 1, - „ ~«/ r. R y L? rkpatl Tk, Chairman 1 Q - / ·’ . l . ‘ ‘) / F 4 Dr. Michael R. Vaughan Q) . Öqr. Dean F. Stäfér I 12 May 1987 Blacksburg, Virginia

Welcome message from author
This document is posted to help you gain knowledge. Please leave a comment to let me know what you think about it! Share it to your friends and learn new things together.
Transcript

»} llb D
HABITAT USE AND ENERGETICS OF AMERICAN BLACK DUCKS WINTERING
AT CHINCOTEAGUE, VIRGINIA
bv
John M. Morton
Thesis submitted to the Faculty of the
Virginia Polytechnic Institute and State University
in partial fultillment of the requirements for the degree of
MASTER OF SCIENCE
in
Flsheries and Wildlife Sciences
. APPRO)/ED:
- I [I Il I/{Nv
1,-
„ ~«/
r. R y L? rkpatl Tk, Chairman1 Q
- /·’
.l .
‘
‘)/ F 4
Dr. Michael R. Vaughan Q).
Öqr. Dean F. StäférI
12 May 1987
Blacksburg, Virginia

35T
HABITAT USE AND ENERGETICS OF AMERICAN BLACK DUCKS WINTERING
{ AT CHINCOTEAGUE, VIRGINIAJ by
John M. Morton
Dr. Roy L. Kirkpatrick, Chairman
Fisheries and Wildlife Sciences
(ABSTRACT)
The habitat use and energetlcs of American black ducks (Anas rubripes) wintering at
Chincoteague National Wildlife Refuge, Virginia, were investigated. Twenty-two female black
ducks were systematically radiotracked on the 25,600 ha study area between 15 December
1985 and 28 February 1986. Diurnal time and energy budgets were constructed by distributing
1,471 scans (collected in 1985-86 and 1986-87) over a time-tide matrix within refuge, saltmarsh,
and tidal water habitats. Sixty-four ducks were collected during early, mid, and late winter in
1985-86 to determine changes in carcass composition. The Habitat Suitability index (HSI)
model for wintering black ducks was evaluated. Age affected range and core areas but did
not affect habitat selection. Tide, ice, and time of day affected habitat use. Refuge pools were
used during the day and saltmarsh was used at night. Subtidal water was used during periods
of icing. Black ducks fed least and rested most when in refuge pools but fed most and rested
least when in tidal waters. Black ducks curtailed feeding and increased time spent in alert
and locomotion behaviors in response to disturbance. Whole carcass analysis indicated that
black ducks were at least as fat and heavy in the spring as they were in the fall. Comparisons
with similar work in Maine suggested that black ducks wintering in Maine and Virginia expend
the same energy at a given temperature. However, because of lower temperatures, black
ducks collected at Chincoteague were in relatively better condition than ducks wintering in
Maine.

Acknowledgements
I wish to thank my advisor, Dr. Roy L. Kirkpatrick, for creating a sincere and stimulating
working environment, as well as his support and friendship during my graduate studies. I also
wish to e><tend my gratitude to my other committee members, Drs. Michael R. Vaughan and
Dean F. Stauffer, for their constructive comments throughout this study.
Acknowledgemonts Iii

Acknowledgements lv
Table of Contents
INTRODUCTION ......................................................... 1
Literature cited ......................................................... 3
CHAPTER 1 ............................................................ 5
Habitat Use and Movements ................................................ 6
introduction ............................................................ 7
Study area ............................................................. 8
Habitat description ................................................... 9
Methods ............................................................. 12
Trapping .......................................................... 12
Telemetry system .............................,..................... 13
Data processing .................................................... 14
Aerial survey ...................................................... 15
Results .............................................................. 16
Movement.......................................................,. 17
Habitat use vs availability ........,.................................... 18
Table ol Contents v

Determinants of habitat use ........................................... 19
Discussion ............................................................ 21
Comparison of aerial survey and telemetry techniques ....................... 21
Sample population ................-.................................. 22
Habitat use considerations ............................................ 24
Management recommendations ........................................ 28
Literature cited ........................................................ 31
CHAPTER 2 ........................................................... 55
Time and Energy Budgets ................................................ 56
Introduction ........................................................... 57
Study area ............................................................ 58
Methods ............................................................. 59
Analysis .......................................................... 60
Results .............................................................. 61
Independence ....................................................,. 61
influence of weather ................................................. 62
Influence of habitat, time and tide ....................................... 62
Time budget estimation .............................................. 63
Energy budget estimation ............................................. 64
Disturbance ....................................................... 66
Agonistic encounters .................................,.............. 67
Discussion ............................................................ 67
Behavioral and energetic considerations ................................. 69
Management recommendations ........................................ 71
Literature Cited ........................................................ 72
Table of Contents vi

CHAPTER 3 .„...„..................................................... 87
Carcass Composition .................................................... 88
Introduction ........................................................... 89
Study area ..................................,......................... 92
Methods ............................................................. 93
Field techniques .................................................... 93
Laboratory techniques ............................................... 93
Statistical analysis .................................................. 95
Results .............................................................. 97
Carcass composition ................................................ 97
Effect of sex and age ................................................ 98
Changes over winter................................................. 99
Condition index ..................................................... 99
Heavy metals ..................................................... 101
Diet............................................................. 101
Sarcosporidiosis ................................................... 102
Discussion ........................................................... 102
Wintering grounds ................................................. 102
Comparison of Virginia and Maine data ..............................,.. 104
Condition index .................................................... 105
Management recommendations ....................................... 107
Literature cited ..........................,...,,....................... 108
CHAPTER 4 .......................................................... 126
Habltat Suitability Index Model ............................................ 127
introduction ........................................................., 128
Table er Contents vii

Methods ............................................................ 129
Results ..........................................................,.. 131
Discussion ........................................................... 133
Measurement of variables ........................................... 133
Model output ..................................................... 134
Literature Cited ...................................................,... 136
SUMMARY ........................................................... 140
APPENDIX ........................................................... 143
Appendix A. National Wetland Inventory types. .............................., 143
Appendix B. Contingency table for log-linear model of habitat use. ............... 144
Appendix C. Least squares means of fat, protein, water, and ash during early, mid, and
late winter. .......................................................... 145
Appendix D. Least squares means of body components during early, mid, and late winter. 146
VITA ............................................................... 147
Table of Contents vii!

List of lllustrations
Figure 1. Map of study area and aerial survey route. .......................... 47
Figure 2. Ground and aerial counts of black ducks in the Chincoteague NWR. ....... 48
Figure 3. Distribution of diurnal radio locations on the study area. ................ 49 _
Figure 4. Distribution of nocturnal radio locations on the study area. .............. 50
Figure 5. Histogram of radio locations within habitat by age class. ................ 51
Figure 6. Histogram of radio locations within habitat by day and night. ............. 52
Figure 7. Histogram of radio locations within habitat when ice is present or absent. . . . 53
Figure 8. Histogram of radio locations within habitat by tidal stage. ............... 54
Figure 9. Proportion of black ducks feeding in saltmarsh. ....................... 84
Figure 10. Proportion of black ducks feeding in tidal water. ...................... 85
Figure 11. Proportion of black ducks feeding in refuge pools. ..................... 86
List 61 iiiusmmans ix

List 0f Tables
Table 1. Available macro-habitat types on the study area. ...................... 35
Table 2. Status of 23 radioed birds known to have used the study area. ............ 36
Table 3. Results of aerial surveys. ........................................ 37
Table 4. Movement estimates for 20 radioed black ducks. ....................... 38
Table 5. Comparison of range area, core area, and movement estimates by age class. 39
Table 6. Convex polygon and harmonic mean estimates of range and core areas. .... 40
Table 7. Neu's chi-square statistic. ........................................ 41
Table 8. Johnson’s Preference Assessment Program. .......................... 42
Table 9. Effect of ice cover on use of three habitats. ........................... 43
Table 10. Effect of ice cover on use of saltmarsh. .............................. 44
Table 11. Comparison of telemetry and aerial survey techniques. ................. 45
Table 12. Diurnal and nocturnal use of refuge and nonrefuge habitats. .............. 46
Table 13. Correlations of behaviors with weather and other variables. .............. 75
Table 14. Effects of habitat, time, and tide on behaviors. ......................... 76
Table 15. Diurnal time budgets. ........................................... 77
Table 16. Diurnal energy expenditure. ...................................... 78
Table 17. Proportional use of three habitats during day and night. ................. 79
Table 18. Nocturnal time budget. .......................................... 80
Table 19. Behavioral responses to human and natural dislurbance. ................ 81
Table 20. lnterspecitic and intraspecitic agonistic encounters. .................... 82
Table 21. Diurnal time budgets of black ducks wintering in Maine and Virginia. ....... 83
List 61 Tables x

Table 22. Pearson correlation matrix of carcass components. ................... 114
Table 23. Effects of age, time, and time on carcass composition. ................. 115
Table 24. Means of body components during early, mid, and late winter. ........... 116
Table 25. Means of fat, protein, water, and ash during early, mid, and late winter. .... 117
Table 26. Correlations of external measurements with selected carcass components. . 118
Table 27. Partial correlations of body weight and structure regressed on fat and the lipidindex. ...................................................... 119
Table 28. Models of weight, water, and weight·structure ratios regressed on lipid index. 120
Table 29. Means of carcass components by sex and age. ....................... 121
Table 30. Food habits analysis. ........................................... 122
Table 31. Body weights and wing Iengths of ducks collected by gunning and trapping. . 123
Table 32. Structural components of ducks collected in Maine and Virginia. .......... 124
Table 33. Carcass composition of ducks collected in Maine and Virginia. ........... 125
Table 34. Habitat Suitability Index model for wintering black ducks. ............... 138
Table 35. Snail counts in four height classes of saltmarsh cordgrass. .............. 139
Llst of Tablss xi

Introduction
American black duck (Anas rubripes) populations wintering along the Atlantic Flyway, as de-
termined by annual Mid-Winter Waterfowl Inventories, have declined almost 50% since 1954
(Steiner 1984). This represents an annual rate of decline of almost 2% for the past three
decades. The black duck, which has historically ranked first in the Atlantic Flyway harvest, is
now third behind the mallard (Anas platyrhynchos) and the wood duck (Aix sponsa; Blandln
1982). Excessive harvest (Geis et al. 1971, Grandy 1983), habitat loss (Spencer 1981), changes
in food availability (Perry and Obrecht 1983), pesticides (Heath l969, Longcore and Samson
1976), acid precipitation (Hansen 1987), and hybridization with mallards (Johnsgard and
DiSilvestro 1976) have been implicated as factors contributing to this decline.
Recently, attention has been directed towards the dynamics of waterfowl populations on their
wintering grounds (see, for instance, the 1982 Workshop on the Ecology of Wintering Waterfowl
and the 1984 Symposium on Wintering Waterfowl). Fretwell (1972) argued that environmental
factors outside the breeding season were cruclal in regulating populations of migratory
waterfowl species, and recent studies lndicate that the condition of waterfowl leaving the
wintering grounds strongly influences reproductive success during the subsequent spring
(Ankney and Maclnnes 1978, Krapu 1981). Yet, of 1,748 waterfowl studies reviewed by
Reinecke (1981), only 8% pertained to wintering waterfowl. Clearly, additional research is
Introduction 1

needed to determine the role of winter in waterfowl survival and reproduction. Blandin (1982)
concluded that the relationship of habitat conditions to winter survival, of winter mortality to
annual survival, of winter stress and food availability to reproductive capability of northern
migrants, and of behavioral adaptations to stressful conditions on the wintering grounds are
specific areas of black duck research that require attention.
ln October 1985, my Advisory Committee approved a proposal to study the ecology of black
ducks wintering at the Chincoteague National Wildlife Refuge, Virginia. This study was to be
accomplished in cooperation with the Patuxent Wildlife Research Center, U.S. Fish and Wildlife
Service, whose personnel were completing the third year of a three-year telemetry study of
female black ducks wintering in coastal New Jersey and Virginia. Objectives of that study
were to estimate time- and source-specific mortality factors, collect general movement and
distribution data, and delineate possible competitive interactions with snow geese (Conroy
and Perry 1984).
Our study proposed to intensively monitor Patuxent’s radio-harnessed birds during the winter
of 1985-86 to assess habitat use by black ducks; three other objectives were outlined that
complemented the telemetry effort and could be extended into the winter of 1986-87. A 25,600
ha study area was defined that included the Chincoteague NWR and adjacent tidal habitats.
Objectives of this study were the following:
1) To determine the habitats used by female black ducks on the study area.
2) To quantify the daily time and energy budget of black ducks wintering on the study
area.
3) To quantify changes in body weight and endogenous energy reserves of black ducks
collected on the study area during the winter.
Introduction 2

4) To evaluate the Habitat Suitability Index model (Lewis and Garrison 1984) for black
ducks wintering on the study area.
This study was funded by the Patuxent Wildlife Research Center (U.S. Fish and Wildlife Ser-
vice), Laurel, MD, and Virginia Polytechnic Institute & State University, Blacksburg, VA.
Literature cited
Anderson, M.G. and B.D. Batt. 1983. Workshop on the ecology of wintering waterfowl. Wildl.
Soc. Bull. 11:22-24.
Ankney, C.D. and C.D. Maclnnes. 1978. Nutrient reserves and reproduction of female lesser
snow geese. Auk 95:459-471.
Blandin, W.W. 1982. Population characteristics and simulation modelling of black ducks. PhD
dissertation, Clark University. 366pp.
Conroy, M.J. and M.C. Perry. 1984. Impact ofsnow goose feeding in New Jersey salt marshes
on wintering black ducks. Preliminary report, dated 2 July 1984. Patuxent Wildlife Re-
search Center, U.S. Fish and Wildlife Service, Laurel, MD. 22pp.
Fretwell, S.D. 1972. Populations in a seasonal environment. Monogr. Popul. Biol. 5. 217pp.
Princeton University Press, NJ.
Geis, A.D., R.l. Smith, and J.P. Rogers. 1971. Black duck distribution, harvest characteristics,
and survival. U.S. Fish and Wildlife Service, Special Scientific Report-Wildlife No. 139.
241 pp.
Introduction 3

Grandy, J.W. 1983. The North American black duck (Anas rubripes): a case study of 28 years
of failure in American wildlife management. Int. J. Study of Animal Problems
4(4):suppIement. 35pp.
Hansen, P.H. 1987. Acid rain and waterfowl: the case for concern in North America. lzaak
Walton League of America, Arlington, VA. 39pp.
Heath, R.G. 1969. Nationwide residues of organochlorine pesticides in wings of mallards and
black ducks. Pestic. Monit. J. 3(2):115-123. 4
Johnsgard, D.H. and R. DiSilvestro. 1976. Seventy-live years of changes in malIard·black duck
ratios in eastern North America. Birds 30(5):905-908.
Krapu, G.L. 1981. The role of nutrient reserves in mallard reproduction. Auk 98:29-38. Cor-
ner, Massachusetts. 300pp.
Lewis, J.C. and R.L. Garrison. 1984. Habitat suitability index models: American black duck
(wintering). National Coastal Ecosystems Team, Div. Biological Services, Research and
Development, U.S. Fish and Wildlife Service. FWS/OBS-82/10.68. 16pp.
Longcore, J.R. and F.B. Samson. 1973. Eggshell breakage by incubating black ducks fed DDE.
J. Wildl. Manage. 37(3):390-394.
Perry, M.C. and H.H. Obrecht. 1983. Food habits and distribution of wintering black ducks in
the Atlantic Flyway (abstract only). Trans. Northeast Sect. Wildl. Soc. 40:130.
Reinecke, K.J. 1981. Winter waterfowl needs and efforts in the Mississippi delta. Int. Waterfwl
Symp. Trans. 4:231-236. °
Spencer, H.E. (ed.). 1981. Black duck management plan for North America, 1980-2000. Vol
1. Black Duck Committee, Technical Section, Atlantic Flyway Council. 42pp.
Steiner, A.J. 1984. Mid-Winter Waterfowl Inventory, Atlantic Flyway, 1954-1984 trend analysis.
U.S. Fish and Wildlife Service, Newton Corner, Massachusetts. 300pp.
lmmducrten 4

CHAPTER 1

Habitat Use and Movements
ABSTRACT: Habitat use and movement patterns of American black ducks (Anas rubripes)
wintering at Chincoteague National Wildlife Refuge, Virginia, were determined with radio
telemetry and aerial survey techniques. Twenty-two female black ducks were systematically
radiotracked on the 25,600 ha study area between 15 December 1985 and 28 February 1986.
Juvenile females used range and core areas 2-3 times larger than adults. Adults used one
core area while juveniles tended to use more than one. Monitored ducks used refuge pools
during the day and saltmarsh habitats at night. Subtidal water was used during periods of
icing. Habitat use was affected primarily by the day-night cycle and secondarily by a tide-ice
interaction.
Habitat use and Movement; 6

Introduction
American black duck (Anas rubripes) populations wintering along the Atlantic Flyway, as de-
termined by annual Mid·Winter Waterfowl Inventories, have decllned almost 50% since 1954
(Steiner 1984). This represents an annual rate of decline of almost 2% for the past three
decades. The black duck, which has historically ranked first in the Atlantic Flyway harvest, is
now third behind the mallard (Anas platyrhynchos) and the wood duck (Aix sponsa; Blandin
1982). Excessive harvest (Geis et al. 1971, Grandy 1983), habitat loss (Spencer 1981), changes
in food availability (Perry and Obrecht 1983), pesticides (Heath l969, Longcore and Samson
1976), acid precipitation (Hansen 1987), and hybridization with mallards (Johnsgard and
DiSilvestro 1976) have been implicated as factors contributing to this decline.
Recently, attention has been directed towards the dynamics of black duck populations on their
wintering grounds. Weather, tide, availability of ice-free foraging habitat, and food availability
have been shown to influence the behavioral response of black ducks to low temperatures in
Maine (Albright et al. 1983, Jorde 1986) and Canada (Hickey and Titman 1983, Brodsky and
Weatherhead 1984, 1985). These studies investigated the environmental constraints placed
on black ducks wintering at high latitudes but failed to identify how these factors may be af-
fecting population declines; there is no evidence that habitat conditions on the wintering
grounds of black ducks have been negatively impacted in recent years. lt is not even known
if existing habitat in the winter range of black ducks is fully utilized (Lewis et al. 1984).
To address this need, we initiated a one—year telemetry study (1985-86) of wintering black
ducks at the Chincoteague National Wildlife Refuge, Virginia. This research was accom-
plished in cooperation with the Patuxent Wildlife Research Center, U.S. Fish and Wildlife Ser-
vice, whose personnel were completing the third year of a three·year telemetry study of
female black ducks wintering in coastal New Jersey and the Eastern Shore of Virginia. Ob-
Habitat use and Mavemam 7

jectives of that study were to estimate time- and source-specific mortality factors, collect
general movement and distribution data, and delineate possible competitive interactions with
snow geese (Chen caerulescens; Conroy and Perry 1984).
We intensively monitored Patuxent’s radio-harnessed birds to assess habitat use by wintering
black ducks. The objectives of our study were to determine habitat use relative to availability,
identify movement patterns over the winter, and compare habitat use by black ducks wintering
at Chincoteague to that of black ducks wintering at higher latitudes. Secondarily, we proposed
to quantify the area minimally required by black ducks to successfully winter in tidal Virginia.
Study area
The study area was located on Virginia’s Eastern Shore of the Delmarva peninsula. In 1986,
36,700 black ducks wintered in Virginia. This represented 16% of the Atlantic Flyway popu-
Iation or 11% of the total U.S. population during that year (Serie 1986). Based on aerial sur-
veys flown during our study, at least 7-8% of the Virginia black duck population wintered on
the study area.
The study area was defined as the area bounded on the east by the Assateague National
Seashore (Maryland-Virginia border to the southern tip of Assateague Island) and on the west
by County Highway 679, from Swans Gut Creek to the Wallops Island bridge (Figure 1). This
area includes all of the Chincoteague National Wildlife Refuge (3600 ha), the south end of the
Assateague National Seashore, the north end of Wallops Island, the south end of
Chincoteague Bay, and encompassed about 25,600 hectares. Telemetry data from the 1984-85
field season suggested that some female black ducks spend the entire winter within the con-
fines of the study area.
Habana: uaa and Mavamanna s

Habitat description
Habitat classification was initially based on the National Wetland Inventory (NWI) scheme de-
veloped by Cowardin et al. (1979) for the U.S. Fish and Wildlife Service. Early in the study,
however, it became apparent that NWI maps have several inherent limitations:
•NWI classifications, at the subsystem level, are based on vegetative structure rather than
taxonomical considerations. Consequently, habitats with very different wildlife values
may be grouped together. For instance, on the Chincoteague study area, E2EMP gener-
ally constitutes a saltmarsh complex dominated by Sparfina a/temifolia, an important
habitat for black ducks on their wintering grounds. However, in impounded waters,
E2EMP can also be predominantly Phragmites, a habitat of little or no value to wintering
black ducks.
•The NWI system disregards important political boundaries, such as refuge designations.
•NWI maps have not been fully ground-truthed. Classification ofA Pool and the Pony Trails
pond in the Chincoteague NWR as estuarine tidal flats were two of the more obvious er-
rors. ln general, however, the NWI maps have proved to be accurate.
When overlayed on USGS topographic maps, NWI maps are useful for delineating certain
habitat types. Shrub wetlands (E2SS1P) within the saltmarsh complex (E2EMP) can be sepa-
rated with the aid of NWI maps. Large oyster beds (E2RF/FLN) can be distinguished from tidal
tiats (E2FLN). Palustrine habitats are much easier to identify with NWI maps.
Glven the limitatlons of the NWI system, habitats were reclassified into a more functional
macrohabitat scheme involving ten types: upland, open water, subtidal water, saltmarsh, tidal
flat, impoundment, natural pool, shrub wetland, stream, and other (Table 1). Appendix A
shows the NWI types associated with each macrohabitat.
Habitat Usa and Movamants 9

Upland habitat in the Chincoteague vicinlty was characterized by fragmented mesic forests
of Ioblolly pine (Pinus taeda), Virginia pine (Pinus virginiana), and oak (Quercus spp.). On the
Delmarva peninsula, much of the upland is cultivated, primarily for soybeans and truck crops
(e.g., tomatoes, potatoes). On the barrier islands, interdune regions were characterlzed by a
dense zone of xeric shrub, dominated by wax myrtle and bayberry (Myrica spp.). Higgins et
al. (1971) provided a thorough discussion of terrestrial tlora on Assateague Island. All areas
designated as upland habitat (including urban areas) on the NWI maps are included in this
type. Upland habitat represented 26% of the total study area.
Open water was estuarine water with a depth greater than 1m at mean low tide; subtidal water
was estuarine water with a depth less than 1m at mean low tide. This is a distinction that
Lewis and Garrison (1984) made in the Habitat Suitability Index model for wintering black
ducks. As the study area Is located on the Atlantic seaboard, estuarine water is highly saline;
salinity varies from 24% in March and April to 38% in August and September. Salinity of
estuarine water may be higher than that of the ocean’s in autumn due to evaporation (Sieling
1960). Vegetation in Chincoteague Bay was dominated by eel grass (Zostera marina) and, to
a lesser extent, by widgeon grass (Ruppia maritima). Open water and subtidal water consti-
tuted 22% and 21%, respectively, of the study area.
The saltmarsh was dominated by saltmarsh cordgrass (Spartina alternifolia) Interspersed with
sea lavender (Limonium carolinianum) and glasswort (Salicornia spp.). The marsh hay—
seashore saltgrass (Spartina patens-Distich/is spicata) complex occurred on drier sites. Beds
of widgeon grass (Ruppia maritima) were sometimes found In small pools or channels within
the saltmarsh. Saltmarsh composed 19% of the study area.
Tidal ilats and commercial oyster beds made up 6% of the study area. By delinition, a tidal
tlat is exposed at low tide and submerged at high tide (l.e., intertidal), although not all tlats
are completely exposed all of the time. Less frequently exposed sites near the Chincoteague
Bay inlet often were covered with beds of sea Iettuce (Ulva lactuca). Smaller estuaries closer
Habitat Usa and Movement: 10

to the mainland, such as Powells Bay or Bogues Bay, have tlats that were predominantly mud
and have been either naturally or artilicially seeded with oysters.
Diked bodies of water on the Chincoteague NWR were classed as impoundments. These were
relatlvely large bodies of fresh to brackish water, which were originally created for wintering
waterfowl. Although they constituted only 4% of the study area, impoundments represented
70% of the available fresh to brackish standing water. The plant community in these
impoundments varies with water level and salinity; both are highly dependent on precipitation.
Refuge personnel have conducted vegetatlon transects in the fall within these impoundments
for the past 10 years. In November 1985, at the start of our radio monitoring, spikerush
(Eleocharis spp.) dominated most of the impoundments.
INatural pools included palustrine habitat under the NWI system; these were small (<8ha)
nontidal pools and wetlands where salinity due to ocean-derived salts is less than 0.5%.
However, a few larger pools of varying degrees of salinity were also included; most notably,
Backpool and the large brackish pools (E1OWL) on the Hook were included in this type. This
was done to distinguish naturally-occurring pools from the diked impoundments in the
Chincoteague NWR. This type represented 2% of the study area.
Shrub wetlands included both palustrine and estuarine shrub categories under the NWI sys-
tem. This habitat, particularly in the estuarine environment, was characterized by marsh elder
(lva frutescens). Shrub wetland composed 1% of the study area.
Streams on the study area were essentially tidal. Spartina marsh can be found in the lower
reaches of most of the small streams tlowing off the Delmarva peninsula. Streams are rela-
tively diverse vegetative zones and may include several NWI types in close proximity to one
another. Half of the area designated as stream was comprised of estuarine emergent vege-
tation (E2EMP), indicating the expansive corridor of Spartina along the stream channel.
Streams represented 1% of the study area.
Habim use and Movements 11

Other habitat constituted less than 1% of the study area. This type included all areas desig-
nated as dunes (E2BBP) on the NWI maps.
Approximately 54% of the total area may be considered potential habitat for wintering black
ducks according to guidelines established for the HSI model (Lewis and Garrison 1984). The
HSI model excludes deep open water and upland habitats. Although there is no evidence that
black ducks from the Chlncoteague population use either habitat extensively, the entire study
area was assumed to be available habitat for wintering black ducks.
Methods
Trapping
Twenty female (8 adults, 12 juveniles) black ducks were captured, banded, and radio-
harnessed in cooperation with Patuxent Wildlife Research Center personnel during 10-18 De-_
cember 1985. Clover-leaf walk-in traps, approximately2’
high and floorless, were used to trap
ducks on the Chincoteague NWR. Traps generally were prebaited with cracked com at least
two weeks prior to trap closure.
_Captured ducks were transported to the field station in wood or plastic holding pens lined with
straw. Ducks were held overnight to allow crops to empty and plumage to dry. Ducks were
aged and sexed by plumage and cloacal examination. Weight (nearest 10 g) and wing length
(nearest 1 mm) were recorded. Crops were palpated and indexed on a scale from O-4 to
correct body weight for crop contents (Albright 1981).
Habftat Us• and Movements 12

Telemetry system
The transmitter package was made by Advanced Telemetry Systems in Bethel, MN. The ra-
dios were 164-165 megahertz pulsating transmitters, weighed approximately 30 g, and had a
designed ground range of 1% miles and a life expectancy of three months. Radios were
mounted on the back of each duck with adjustable harnesses (Dwyer 1972).
A modified null-peak antenna array (Telonics Telemetry and Electronics Consultants, Mesa,
AZ), which extended through the vehicle roof, and a compass rose assembly welded at the
Agricultural Research Station in Beltsville, MD, were used to monitor radioed ducks. To test
the accuracy of this system, ten radios were placed within different habitats, 478-7403 meters
from the road, and were independently located by both field personnel from 32 stations. A
paired t-test (t=1.249, df=31) indicated no observer bias and, furthermore, suggested an ac-
curacy of 0-3 degrees (x=2.2, 2SE=0.5). Locations estimated by telemetry were within 150m
of actual locations ($'<=107.9, 2SE=45.5). The Iimiting factor in system accuracy appeared to
be the scale of the map.
Radio locations were plotted in the field on reduced (by 20%) 1:24000 National Wetland ln-
ventory maps. Date, time, location, and NWl habitat type were recorded. Ducks were sys-
tematically radio-tracked at 6-hour intervals, four times per day, three consecutlve days per
week, from 15 December 1985 to 28 February 1986; two diurnal and two nocturnal locations
were generally obtalned per bird for each day of tracking. This monitoring effort resulted in
approximately 1500 radio locations.
ln addition, ducks were monitored once daily by Patuxent personnel both on and off the study
area during this period. Radio locations, collected by Patuxent personnel the day before and
the day after our 3-day sampling interval, were pooled with our data. Pooled data were used
Habltat use ana Movement; 13

in estimating home range and distances moved. However, due to differences in telemetry
system accuracy, Patuxent’s data were not included in habitat use analyses.
Radio-monitoring continued after 28 February because several black ducks unexpectedly re-
mained on the study area long after the peak migration period. During 3-4 May, the last reli-
able period of tracking, eight radioed ducks remained on the study area. Birds were tracked
later in May, but these data were considered unreliable because transmitter batteries were
failing. Winter was defined as 15 December-28 February; radio locations taken alter this pe-
riod were not used in these analyses.
Twenty-three radioed birds were known to have used the study area (Table 2). However, only
13 of the 23 birds remained on the study area by the end of winter. This count included three
ducks (4151, 5536, 5670) that were captured and radio-harnessed at Brigantine NWR in New
Jersey. Of the original 20 Chincoteague birds, two were killed by hunters, another was a
post-hunting cripple (poached), and one died from natural causes. Three ducks were of un-
known status (5155, 5767, 5919) and three others were Iikely alive but had left the study area
by the end of winter.
Data processing4
Radio locations were digitized with a Tel<tronics electronic digitizer and the UTM coordinates
were transferred to the mainframe computer at Virginia Polytechnic Institute. Distances be-
tween locations were determined with a Proc MATRIX program on SAS (1985). Habitat use,
relative to habitat availability, was statistically compared using Neu's chi-square statistic (Neu
et al. 1974) and Johnson’s (1980) Preference Assessment program.
The effects of age, time of day, ice, and tide on habitat use were evaluated with two-way
contingency tables and log-linear models (Fienberg 1978). Age was categorlzed as adult or
Habitat Use and Movements 14

juvenile. Time of day was categorized as day or night. lce cover on a given day was indirectly
determined by averaging the minimum and maximum temperatures for that day; ice was
considered present when the mean temperature was less than 0°C. Temperature data were
obtained from the National Oceanic and Atmospheric Administration (NOAA) station on
Wallops Island. Tide periodicity was determined from NOAA tide tables (1985, 1986) for Sandy
Hook, NJ, using Chincoteague Channel as the reference. High and low tides were each de-
fined as 3 hour stages (:l:1V; hrs of maximum or minimum tide). Ebb and tlood stages ac-
counted for the remainer of the time between high and low stages; consequently, they
approximated 3 hours each. Tide height generally varied 0.6m between high and low water.
The harmonic means procedure in Program Home Range (Samuel et al. 1983) was used to
estimate area that was actually used by a black duck on the study area; the convex polygon
procedure was used to provide a measure of the area over which a duck ranged. The har-
monic means procedure is significantly influenced by outliers. Program Home Range identi-
fies statistical outliers by comparing a relative measure of location density with progressively
less e><treme locations in the data. The 50% and 95% contours, and a statistically-derived
core area were estimated with the outliers excluded; a 500m' grid cell was used in this pro-
cedure. The Wilcoxon two-sample test was used to compare mean distance moved, mean
range area, and mean core area by age class. Significance for all statistical inferences was
p=0.05, unless otherwise indicated.
Aerial survey
A weekly aerial survey of black duck distribution on the study area (Figure 1) was designed
to complement radio-tracking efforts. This survey was to serve as a standard with which to
compare telemetry data, but proved useful for monitoring the local black duck population and
for identifying shifts in habitat use that were not discernable from radio-tracking. ln particular,
habitat use changes within the saltmarsh were noted during periods of icing.
Habitat Use and Movement: 15

The survey design was based on three assumptlons: random distribution of birds within each
habitat type, equal detectability of birds over all habitat types, and minimal tidal influence.
Surveys were flown in a Cessna 172 at 150’ AGL at approximately 100 km/hr during periods
of good visibility and light winds. Two observers used micro-cassette recorders to record
count data by habitat. The same observers and pilot participated in all flights. Transect width
was 200 meters on either side of the aircraft. Total transect length was approximately 90 km,
representing 38% saltmarsh, 17% brackish refuge impoundment, 8% tidal flat, 25% subtidal
water, 6% open water, 2% tidal streams, and 4% other habitats (primarily upland). Twelve
surveys were flown between 30 October and 18 March.
Results
Since at least 1977, Chincoteague NWR personnel have conducted weekly ground counts of
waterfowl in refuge impoundments. Refuge counts of black ducks from the 1985-86 winter
were contrasted with mean refuge counts for the previous nine years (Figure 2). The winter
of 1985-86 was typical with respect to total number of wintering black ducks but atypical with
respect to timing of peak fall migration; excluding an apparent migration pulse in early No-
vember, it appeared that black ducks arrived at Chincoteague later in the fall of 1985-86 than
was usual. Aerial surveys (Table 3; Figure 2) failed to identify the early November peak,
suggesting that ground observers in the refuge recorded a large movement of black ducks.
Mean monthly temperatures, monitored at the Wallops Island NOAA station, were 3.5°F and
8.0°F above normal for October and November, but were normal during the three months de-
fined as winter.
Habitat use ana Movements 16

Movement
Telemetered black ducks were monitored at 6hr intervals for three consecutive days per week.
This sampling design provided within·day (D), within·night (N), and crepuscular (AM, PM) es-
timates of movement over equal time intervals for 20 female black ducks (Table 4). Three
birds were excluded from these analyses because of inadequate data; 5112 was shot shortly
after its release, and 5662 and 5919 moved further south shortly after their release. Diurnal
and nocturnal radio locations of all birds were plotted in Figures 3 and 4.
There were no differences between mean movements of adult and juvenile black ducks on the
study area (Wiicoxon *2-sample test, p>0.38, Table 5). Black ducks tlew a mean distance of
2792m (n=40, SE=253) between night and day locations. Black ducks moved, on average,
at least 816m (n=20, SE=152) during the day and 595m (n=20, SE=83) at night.
Range and core areas were estimated for 20 female ducks by the harmonic means procedure
(Dixon and Chapman 1980) in Program Home Range (Tables 5, 6). Program Home Range
calculates a statistical core area by comparing the ordered cumulative distribution of the ob-
served points to an expected uniform distribution of the data within the estimated home range;
the Kolmogorov test is used after correcting for sample size. For 5514 the observed distrib-
ution was not signilicantly different from the assumed uniform distribution (Table 6), suggest-
ing it did not use a core area; data for this duck was not included in calculation of the mean
core area in Table 4. Spearman rank correlations suggested no relationship between number
of radio locations and estimations of the 50% contour (r=·0.002, n =20, p=0.99), 95% contour
(r=-0.060, n=20, p=0.80), and core area (r=-0.144, n=20, p=0.55).
Juvenile female black ducks used larger areas than adults at both 50% (z=-2.91, p<0.01) and _
95% contour (z=-2.38, p<0.02) levels (Table 5). ln general, 50% of the radio locations were
within 20% of the estimated 95% contour, suggesting that black ducks tend to utilize core
l-labitat Use and Movement: 17

areas. Mean core area differed between adults and juveniles (z=-2.08, p=0.04); the core
area used by juveniles was 260% larger than that of adults. Juveniles tended to use more
core areas as well, although the difference was not signiücant (z=-1.44, p=0.15); mean
number of core areas for all birds was 1.45 (n=20, SE=0.266). On average, a dlscrete core
accounted for 30.8% (n=19, SE=1.5) of the area used and 58.5% (n=19, SE=1.7) ofthe radio
locations.
Habitat use vs availability
Neu’s chi·square statistic was used to compare female black duck habitat use with habitat
availability (Table 7). Proportional use of saltmarsh, impoundment, and natural pool habitats
was significantly greater than proportional availability, whereas that of subtidal water, upland,
and open water habitats was signiticantly less. Tidal flat, stream, shrub wetland, and other
habitats were used proportional to availability. lf the criteria for selecting the most important
habitat for wintering black ducks is percent use, then saltmarsh is the preferred habitat.
Johnson’s Preference Assessment Program is a nonparametric procedure that weights pro-
portional habitat use of each bird equally regardless of sample size. When this program was
used to assess habitat use relative to availability (Table 8), the impoundments were ranked
as the most important habitat for 18 black ducks wintering on the study area. An F-test
(F=509, df=9,9, p<0.01) rejected the null hypothesis that all components were equally pre-
ferred. The Waller-Duncan means separation procedure indicated that use of upland and
open water habitats was different than use of all other habitats; the variance among habitat
use by individual ducks was apparently high enough to prevent further discrimination of pre-
ferred habitats.
Neither Neu’s chi-square nor Johnson’s rank assessment of habitat use indicated that tidal
waters were important habitats for black ducks wintering on the Chincoteague study area.
Habitat Use and Movement: 18

This observation is misleading, however. Aerial survey data indicated that ice cover affected
habitat use (Table 9). Black ducks used refuge impoundments less and tidal habitats more
when ice limited availability of the former habitats. Even when ducks continued to use the
saltmarsh, albeit in much reduced numbers, they shifted their use from pools within the
saltmarsh (which quickly freeze over) to small channels within the saltmarsh (Table 10). Al-
though tidal water was not an important habitat type for black ducks during most ofthe winter
at Chincoteague, it was critical habitat during extended periods of freezing temperatures.
Determinants of habitat use
Habitats were regrouped into three categories for contingency analysis and log-linear model-
ing. Locations within open water, subtidal water, streams, and tidal flats were categorized
as tidal habitat. impoundments, natural pools, shrub wetland, other, and upland were cate-
gorized as nontidal habitat. Saltmarsh remained as a distinct category. Figures 5, 6, 7, and
8 are the histograms of the proportion of telemetered locations, by age, time of day, ice, and
tide (respectively), falling within each habitat.
Juvenile and adult female black ducks had a similar distribution of habitat use (Figure 5). AI-
though there was a slight tendency for adults to use nontidal areas more and saltmarsh less
than juvenile black ducks, the null hypothesis that habitat use was independent of age failed
to be rejected (X’=4.265, df=2, p=.119).
Female black ducks had a very different habitat use pattern during the night than during the
day (Fig. 6). Telemetered ducks used nontidal habitats (primarily refuge impoundments) and,
to a lesser extent, saltmarsh during the day. At night, these ducks shifted their use of habitats
from nontidal to saltmarsh and tidal habitats. Habitat use was dependent on time of day
(x'=300.30, df=2, p<.001).
Mabuse usa and Movaments 19
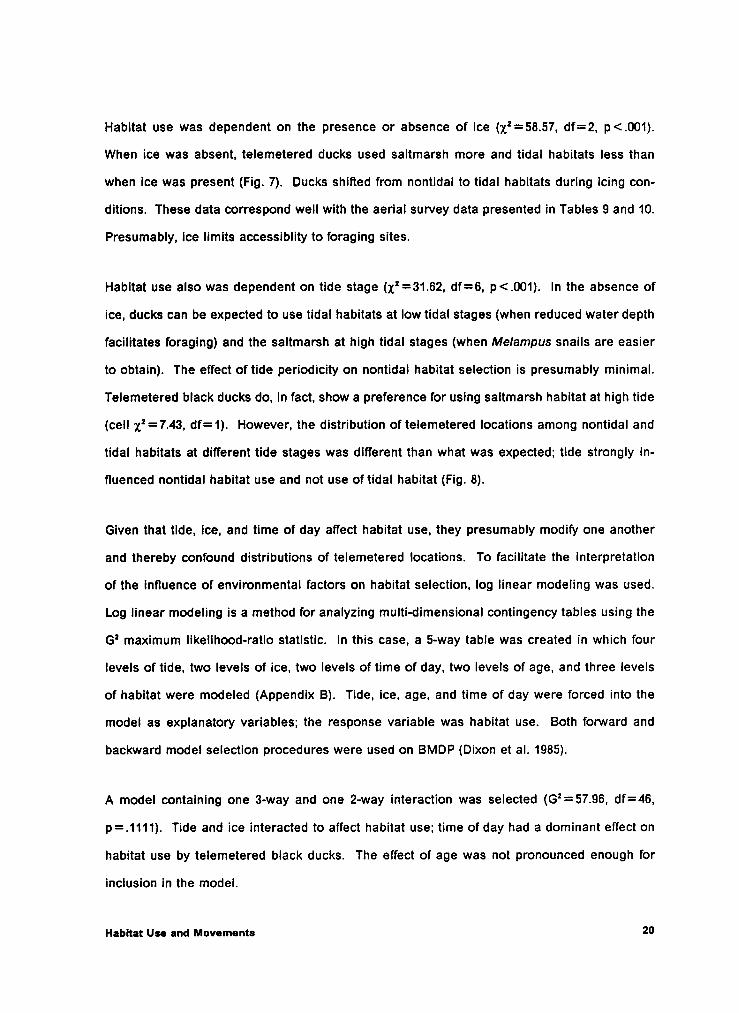
Habitat use was dependent on the presence or absence of ice (X’=58.57, df=2, p<.001).
When ice was absent, telemetered ducks used saltmarsh more and tidal habitats less than
when ice was present (Fig. 7). Ducks shilted from nontidal to tidal habitats during icing con-
ditions. These data correspond well with the aerial survey data presented in Tables 9 and 10.
Presumably, ice limits accessiblity to foraging sites.
Habitat use also was dependent on tide stage (X’=31.62, df=6, p<.001). In the absence of
ice, ducks can be expected to use tidal habitats at low tidal stages (when reduced water depth
facilitates foraging) and the saltmarsh at high tidal stages (when Melampus snails are easier
to obtain). The effect of tide periodicity on nontidal habitat selection is presumably minimal.
Telemetered black ducks do, in fact, show a preference for using saltmarsh habitat at high tide
(cell x'=7.43, df=1). However, the distribution of telemetered locations among nontidal and
tidal habitats at different tide stages was different than what was expected; tide strongly in-
fluenced nontidal habitat use and not use of tidal habitat (Fig. 8).
Given that tide, ice, and time of day affect habitat use, they presumably modify one another
and thereby confound distributions of telemetered locations. To facilitate the interpretation
of the influence of environmental factors on habitat selection, log linear modeling was used.
Log linear modeling is a method for analyzing multi-dimensional contingency tables using the
G' maximum Iikelihood·ratio statistic. In this case, a 5-way table was created in which four
levels of tide, two levels of ice, two levels of time of day, two levels of age, and three levels
of habitat were modeled (Appendix B). Tide, ice, age, and time of day were forced into the
model as explanatory variables; the response variable was habitat use. Both forward and
backward model selection procedures were used on BMDP (Dixon et al. 1985).
A model containing one 3-way and one 2~way interaction was selected (G'=57.96, df=46,
p=.1111). Tide and ice interacted to affect habitat use; time of day had a dominant effect on
habitat use by telemetered black ducks. The effect of age was not pronounced enough for
inclusion in the model.
Habitat Use and Movements 20

Discussion
Comparison of aerial survey and telemetry techniques
Aerial survey and diurnal telemetry data were compared after adjusting survey data for
habitat availability within the flight transect (Table 11). Neu’s goodness-of-fit statistic
(X“=289, df=6, p<.01) suggested that the telemetry and aerial survey techniques provided
different estimates of habitat use distributions. Use of refuge impoundments was similarly
estimated by both techniques; however, outside the refuge, aerial counts suggested less use
of saltmarsh and more use oftidal habitats (subtidal water, tidal flats, streams) than was es-
timated by radio·telemetry. lt is conceivable that ducks in Spartina were being undercounted;
however, both observers thought aerial counts were accurate.
It was originally proposed that aerial surveys would accurately retlect diurnal habitat use by
the local black duck population. Aerial survey counts were to be used as a standard with
which to compare telemetry data. One assumption of the aerial survey design was minimal
tidal influence; for Iogistical reasons, it was convenient to schedule surveys at midday without
regard for tidal stage. Results from this study, however, suggested that black ducks in tidal
habitats were influenced by tide and ice.
Telemetry data were equitably distributed over tidal stages and were collected during 33 days
over 2% months. Aerial surveys, on the other hand, represented point samples of diurnal
habitat use on 12 days and were not well distributed over tide and ice conditions (Table 3). I
suggest both techniques accurately assessed habitat use by black ducks during the sampling
periods, but that aerial survey data have a biased distribution when extrapolated over the
entire winter.
Habitat Use and Movements 21

Sample population
In any telemetry study, the results of the monitoring effort are highly dependent on (1) the in-
itial representativeness of the sample population and (2) the potential blas associated with the
effect of the radio package on behavior or physiological condition. In this study, 20 female
black ducks (8 adults, 12 juveniles) were captured and radio-harnessed on the Chincoteague
NWR. ln addition, three (2 adults, 1 juvenile) female black ducks, originally captured and
radio-harnessed at Brigantine NWR, used the study area for at least part of the winter.
Despite the fact that the monitored sample was of one sex, results are Iikely applicable to the
Chincoteague population of black ducks at large. Adult black ducks begin pairing in August
shortly after the postnuptial molt and remain paired over the winter; immature females begin
pairing late in November (Stotts 1958). In mallards, females were observed to lead pairs in
85% of take·offs, 83% of intlight observations, and 62% of Iandings (Derrickson 1986). As
palr·formation mechanisms are virtually identical in mallards and black ducks (Johnsgard
1960), it seems reasonable to assume that the sample population of female black ducks was
representative of the paired population in general. One radioed bird (5128) was observed to
be paired (on 5 January and, again, on 15 January).
Telemetered ducks remained on the study area long after the peak period of vernal migration.
Thirteen ducks were present on 15 March and eight ducks were present on 4 May. Counts
of black ducks in refuge impoundments since 1977 (Figure 2) indicate that northern migration
typically occurs in the latter part of February to early March. Similarly, Meanley (1972) re-
ported that black ducks normally migrate through the Chesapeake Bay area during 15
February-30 April, with peak migration occurring during 25 February-30 March. In 1986, aerial
survey data indicated that the majority of movement was over by the end of February.
Hanna: use and Movements 22

The possibility exists that some of the telemetered ducks were from the resident population.
Outside of the main breeding range in the Canadian boreal forest, the coastal marshes adja·
cent to the eastern shore of Chesapeake Bay maintain the highest breeding densities of black
ducks (BeIIrose 1976). 5128, as discussed earlier, was observed paired on 5 and 15 January,
and yet was flushed as a single bird on 19 March from a wooded stream. Coincidentally,
Stotts and Davis (1958) reported that first egg laying by black ducks in the Chesapeake Bay
occurs about 19 March. lt is possible that this bird was investigating nest sites.
Alternatively, the radio packages may have negatively affected the physiological condition of
the sample black ducks. Radio packages, which weighed 30 g, represented only 3% of the
typical body weight for female black ducks. Nevertheless, Greenwood and Sargeant (1973)
reported a significantly greater rate of weight loss in captive mallards harnessed with trans-
mitters (weighing 36 g) than in those without radios during a 12-week study.
Limited work by Wooley and Owen (1977, 1978) suggest how radio packages may be affecting
body weight. They compared activity budgets of three noninstrumented black ducks with three
black ducks equipped with breast implants to monitor heart rate. Telemetered birds had a
19% higher resting metabolism but spent considerably less time feeding and more time
preening than control ducks. Application of their energetic coefficients to activity budgets
suggested that energy expenditure increased only 3% with the use of the radio package;
however, due to the reduced time allocated for feeding, instrumented black ducks would have
to increase feeding rates 4-fold to maintain body weight.
lt seems reasonable to expect some weight loss in telemetered ducks released in the wild.
Grandy (1972) suggested that black ducks remained on wintering areas in Massachusetts after
ice break-up and subsequent group disintegration to strengthen pair bonds and regain body
condition before spring migration. Perhaps telemetered birds extended their stay on the
Chincoteague wintering grounds in response to unusual weight loss.
Habltat use and Movemants 23

The radio package did not significantly lmpair flight behavior, however. Three of the teleme-
tered ducks on the study area were originally captured at Brigantine NWR, 150 miles north of
Chincoteague NWR. Telemetered ducks captured at Chincoteague were known to have dis-
persed as far south as North Carolina (5662) and as far north as Snowhill, MD (5464). On the
study area, telemetered birds fiew daily foraging fiights of 2.8km (Table 4).
Whether birds were from a resident population or radio packages affected physiological con-
dition, the assumption is made that telemetry data reflected habitat use by black ducks on the
study area. This seems to be a valid assumption given their apparent unhindered flight be-
havior and the general similarity of telemetry and aerial survey data.
Habitat use considerations
Home range and habitat use by wintering black ducks are difficult concepts to meaningfully
quantify. Black ducks are obvlously highly mobile animals and may range over large, ge-
ographically varied areas during the winter. Patuxent WRC originally extended their research
to Chincoteague because one telemetered black duck relocated from Brigantine NWR to
Chincoteague NWR during the first winter of their study. During the winter of 1985-86, three
New Jersey ducks spent the majority of the winter on the study area, while other New Jersey
birds were known to have used coastal marshes elsewhere on the Delmarva peninsula (M.J.
Conroy, per. comm,).
Some Chincoteague black ducks also were highly mobile. 5662 continued south to North
Carolina shortly after its release. 5419 had an apparent winter range that extended from the
Maryland-Virginia border on Assateague Island to an area of extensive saltmarsh around
Metomkin Inlet, VA, a linear distance of 60km. 5419 left the study area in mid-winter and re-
located in Delaware (E. Derleth, per. comm,).
Habltat Use and Movement; 24

Some telemetered ducks, on the other hand, conlined their movements to very small areas.
4999, 5088, 5128, 5143, 5183, 5205, 5231, 5324, 5336, and 5983 apparently never left the study
area during the winter. It may be that there are two black duck phenotypes; one that is far-
ranging and one which is not. Lack (1968) suggested that migrants may have poiytypic pop-
ulations in which individuals possess different thresholds of migration that may vary with
winter conditions and with age or sex.
Given the mobility of black ducks on their wintering grounds, lt is not only difficult to deüne a
home range, but similarly difficult to quantify habitat usage. Johnson (1980) stated that con-
clusions reached from use-availability studies clearly depend on the investigators notion of
what components are available to an animal. ln our investigation, a study area was defined
and all habitat within that space was considered available for use by black ducks. Although
the definition of habitat availability by Lewis and Garrison (1984) would restrict available
habitat to 54% of the study area, such apriori distinctions are neither biologically sound nor
of management value. Johnson (1980) noted that the very fact that the animal has its home
range where it does, or that it occurs within the study area, is itself indlcative that the animal
has already made a selection.
The purpose of this study was not to define an average home range size but, rather, to define
the mean minimum area required by black ducks wintering on the study area. In this respect,
activity centers are considered indlcative of the minimum area required by wintering black
ducks. Harmonic contours serve as comparative measures of dispersion; mean distance
moved between foraging and roosting sites (AM, PM) is a more biologically valid datum for
describing minimum home range size.
Range sizes of black ducks within the study area were related to age. Juvenile black ducks
used larger core areas and dispersed over larger areas within the study area; on average,
juveniles used areas 2·3 times larger than adults. Adults used one core area whereas juve-
niles tended to use more than one. It is not immediately obvious when juveniles were making
Habitat Use and Movements 25

extended movements; none of the four comparisons of movement in Table 4 was signiticantly
different. Presumably, juveniles were not consistently returning to the same foraging and/or
roosting site. Perhaps more experienced adults chose areas with higher food densities and/or
are able to distinguish areas that do not readily ice·over. Adults also may forcibly dlsplace
juveniles at preferred foraging sites. Many juveniles are not paired during their first winter
and pairs dominate unpaired individuals in intraspecitic encounters regardless of sex (Hepp
and Hair 1984).
Habitat use was signiticantly affected by time of day, icing conditions, and tide, but not by age.
Black ducks were apparently responding to a day-night cycle mediated by tide and ice. Tide
and ice clearly function together in determining the accessibility of food items and, conse-
quently, habitat selection. The saltmarsh and refuge impoundments rapidly freeze over when
temperatures drop below 0°C. ln subtidal water, the response to freezing temperatures is not
so immediate, particularly when winds are high and water mixing inhibits ice formation. Tidal
ebbing and tlooding will break up large bodies of ice. During extended cold periods on the
Chincoteague study area, broken ice often was observed from the air packed against the
windward shore of exposed bays and estuaries. During the day (when visual observations
were possible), black ducks tended to tlock in open water when icing occured; presumably, a
similar response occured at night.
A problem with habitat use analyses is that preference is reflected in selection, which can
occur only when the resource component is relatively scarce (Johnson 1980); use of a com-
mon resource (however important the resource) may not suggest preference. Tidal water,
although not a scarce habitat component in the Chincoteague area, apparently was a critical
habitat for black duck survival during extended periods of freezing weather.
Habitat use considerations by the black duck in the southern portion of its winter range appear
to be different from those in the North. Lewis and Garrison (1984) used Cape Cod as the de-
marcation line for application of two different HSl models to wintering black duck populations;
Habitat use ana Mavamems 26

northward of Cape Cod increasing amounts of animal material (primarily bivalves and
amphipods) are found in the diet of black ducks. As Jorde and Krohn (1986) point out, extreme
tides in northern areas (often >10ft) keep some foraging areas ice-free, allowlng black ducks
to winter as far north as Maine and eastern Canada. A relationship between tide and foraging
behavior has been found in maritime Canada (Hickey and Titman 1983) and coastal Maine
(Hartman 1963, Albright et al. 1983, Jorde 1986). In Massachusetts, Grandy (1972) reported a
disproportionate number of bivalves in the stomachs of black ducks collected at low tide and,
conversely, a disproportionate number of saltmarsh snails (Melampus bidentatus) in ducks
collected at high tide.
However, as tide heights decrease and Spartina saltmarsh extends southward, the tidal influ·
ence on habitat selection becomes less pronounced. ln tidal Virginia, tide and ice still interact
to modify available foraging sites but not to the degree evident at higher latitudes. Tide
heights in the Chincoteague area tluctuate only about 0.6m and small bivalves exist at very
low densities on the study area (Chapter 4). Black ducks do not use tidal tlats in the
Chincoteague area as they do further north. Ninety·four percent of the ducks observed on
designated tidal tlats during aerial surveys were in the water, not on exposed tlats. Ducks
were tipping up for Ulva rather than for molluscs. ln short, tidal tlats are not distinguishable
from shallow subtidal water with respect to use by black ducks wintering on the Chincoteague
study area.
Habitats other than tidal water and saltmarsh are important to black ducks wintering in tidal
Virginia, where the influence of tide and ice is less pervasive than it is north of Cape Cod.
The impoundments in the Chincoteague NWR have been identitied as extremely important
habitats for black ducks on the study area. Although black ducks do feed on aquatic plants
and seed heads in these impoundments, black ducks spent proportlonately more time resting
and less time feeding (see Chapter 2) while in the impoundments during the day. Foraging
apparently occurs primarily at night in saltmarsh and tidal waters outside the refuge.
l-labitat Use and Movement: 27

The refuge impoundments serve more importantly as a true refugia during the fall and winter
when hunter pressure is high and disturbance by commercial oystermen is frequent. The
importance of the Chincoteague National Wildlife Refuge for wintering black ducks is assessed
in Table 12. Black duck use of the refuge is shown to be dependent on whether it was night
or day (X’=320.9, df=1, p=.0001). Black ducks used the refuge more and the non-refuge
habitats less during the day and, importantly, used non-refuge (mostly saltmarsh) habitats at
night. This habitat use pattern is clearly contrasted in Figures 3 and 4.
Black ducks were Iikely roosting in the refuge impoundments more in response to human
disturbance outside the refuge than to a natural preference for brackish pools. Agonistic en-
counters with other waterfowl species were frequent in the pools (Chapter 2) and, presumably,
competition for foraging items among congeners was intense; it makes little sense for black
ducks to remain within the impoundments when they are so well adapted to feeding in tidal
zones. Many black ducks returned to the refuge even when freezing temperatures lced over
impoundments but left tidal waters open; mixed tlocks of waterfowl continued to use the
impoundments during the day but solely for the purpose of roosting on ice. This habitat use
pattern appears to be energetically expensive unless the cost of human disturbance outside
the refuge is considered.
Management recommendations
At the flyway level, protection of saltmarsh habitat and creation of refuges should be priorities.
The North American Waterfowl Management Plan (U.S. Fish and Wildlife Service 19866) pro-
vides a framework for cooperative management of waterfowl populations by the U.S. Depart-
ment of the Interior and the Canadian Ministry of the Environment. It specilically recommends
creation of an additional 50,000 acres of migration and wintering habitat along the east coast
of the U.S. and effecting a 25% increase in carrying capacity on 382,000 acres of existing
wildlife refuges just to maintain current population levels.
Habltat Use and Movements 28

In the Concept Plan for Preservation of Black Duck Winterlng Habitat (U.S. Fish and Wildlife
Service 1986b) key wintering areas are identified, based on the Mid-Winter Waterfowl Inven-
tory, in the coastal zones of 13 eastern states. These areas are ranked, by state, using area
size, habitat diversity, black duck population density, total duck population density, other
wildlife uses, and benefits to existing refuges as crlteria. The assigned rank is intended to
aid state and federal agencies in prioritizing areas to be set aside for acquisition or, alterna-
tively, for easement. The area between Assateague Island and Wallops Island, coinciding with
the study area, was ranked first In the state of Virginia. This area was described as "possibly
threatened' and 2950 acres (of 6600 acres) were identified within private holding. Certainly,
consideration should be given to acquiring these Iands.
As the same document points out, however, the relationship between habitat loss and de-
clining black duck populations is not clear. Data summarized from coastal habitat inventories
and the Mid-Winter Waterfowl Inventory suggest that, relative to the diminished wintering
population, the amount of habitat available to black ducks has nearly doubled in the past 30
years in the Atlantic Flyway. This implies that deterioration of habitat may be more
critical to the welfare of the black duck than is the loss of habitat (U.S. Fish and Wildlife Service
1986b).
There are no data from this study to indicate whether the black duck population on the
Chincoteague study area was near carrying capacity. However, day-night use patterns of
telemetered ducks provides circumstantial evidence that the quality of the saltmarsh was not
tolerable to black ducks during the day. Some ducks remained in the marsh but most returned
to the refuge (or occasionally to streams) during the day. Loss of habitat quality, due to high
human disturbance levels, may apparently be mitigated by maintaining the Integrity of the
Chincoteague NWR as a refugia. Disturbance levels in adjacent saltmarsh outside the refuge
will Iikely increase in the future; therefore, maintaining water levels in the impoundments and
minimizing disturbance should be mandated priorities.
Habitat Use and Movemants 29

ln recent years, management emphasis at the Chincoteague NWR has been placed on in-
creasing user access, expanding public education programs, and maintaining hunter pro-
grams; much less effort has been directed towards regulating vegetation and water levels in
the impoundments. Water level gauges are no longer monitored (in fact, are not even oper-
ational) and vegetation composition in the impoundments is not a result of management as
much as precipitation-dependent. Water control structures already exist at three of the largest
impoundments in the refuge (Old Fields, Wash Flats, and F Pool), They access highly saline
estuarine water, and should only be used as a last resort. Nonetheless, maintenance of
impoundment water levels during the waterfowl hunting season would alleviate much of the
pressure on black ducks winterlng in the area.
Hunter programs on the refuge also should be curtalled. The gun season for deer should be
scheduled to fall between the early and late waterfowl seasons. The length of the archery
season should be reduced; hunters are allowed virtually unlimited access to the north end of
the refuge during the extended two month season. Vehicle and foot traffic can be disturbing
to waterfowl, particularly black ducks and snow geese. lf deer reduction is an essential part
of management on the refuge, then it would be more expedient to extend the gun season for
a day or two and restrict the archery season by several weeks; the eflicacy of bow hunting
on deer herd size (relative to gun hunting) is minimal. The waterfowl hunting program on
Wildcat Marsh, a large expanse of refuge-owned saltmarsh on the north end of Chincoteague
Island, also should be conservatively reviewed. Currently, public demand for the blinds on the
marsh is minimal; use of the blinds is largely by private guides and their clients. This program
should be curtailed or abandoned.
Despite potential improvement of habitat quality on the refuge, winterlng black duck popu-
lations still will be dependent on the carrying capacity of adjacent saltmarsh, which they use
for nocturnal foraging. The relationship of abiotic factors to Melampus bidentatus populations
and the relationship of saltmarsh snail densities to black duck foraging patterns need to be
quantitied.
Habitat Use and Movements 30

Literature cited
Albright, J.J. 1981. Behavioral and physiological responses of coastal-wintering black ducks
(Anas rubripes) to changing weather in Maine. MS thesis. U. of Maine, Orono, ME.
72pp.
Albright, J.J., R.B. Owen, Jr., and P.O. Corr. 1983. The effects of winter weather on the be-
havior and energy reserves of black ducks in Maine. Trans. Northeast Sect., The Wildl.
Soc. 40:118-128.
Bellrose, F.C. 1976. Ducks, geese, and swans of North America. Stackpole Books,
Harrisburg, PA. 543pp
Brodsky, L.M. and P.J. Weatherhead. 1984. Behavioral thermoregulation in wintering black
ducks. Can. J. Zoo!. 62:1223-1226.
Brodsky, L.M. and P.J. Weatherhead. 1985. Variability in behavioral response of wintering
black ducks to increased energy demands. Can. J. Zoo!. 63:1657-1662.
Conroy, M.J. and M.C. Perry. 1984. Impact of snow goose feeding in New Jersey salt marshes
on wintering black ducks. Preliminary report, dated 2 July 1984. Patuxent Wildlife Re-
search Center, U.S. Fish and Wildlife Service, Laurel, MD. 22pp.
Cowardin, L.M., V. Carter, F.C. Golet, and E.T. LaRoe. 1979. Classification of wetlands and
deepwater habitats of the United States. U.S. Fish and Wildlife Service, USDI,
Washington D.C. FWS/OBS—79/31. 103pp
Derrickson, K.C. 1986. Which sex leads in paired mallards? Wilson Bull. 98(4):608—609.
Dixon, K.R. and J.A. Chapman. 1980. Harmonic mean measure of animal activity areas.
Ecology 61:1040·1044.
Dixon, W.J., M.B. Brown, L. Engelman, J.W. Frane, M.A. Hill, R.I. Jennrich, and J.D. Toporek
(eds.). 1985. BMDP Statistical Software. University of California Press, Berkeley, CA.
734pp.
Dwyer, T.J. 1972. An adjustable radio-package for ducks. Bird Banding 43:282-284.
Habitat Use and Movements 31

J:
Fienberg, S.E. 1978. The analysis of cross-classified categorical data. Massachussetts Insti-
tute of Technology, Cambridge, MA. 151pp.
Geis, A.D., R.l. Smith, and J.P. Rogers. 1971. Black duck distribution, harvest characteristics,
and survival. U.S. Fish and Wildlife Service, Special Scientific Report-Wildlife No. 139.
241 pp.
Grandy, J.W. 1972. Winter ecology of maritime black ducks (A. rubripes) in Massachusetts,
with special reference to Nauset Marsh, Orleans, and Eastham. PhD dissertation, U. of
Massachusetts. 111pp.
Grandy, J.W. 1983. The North American black duck (Anas rubripes): a case study of 28 years
of failure in American wildlife management. Int. J. Study of Animal Problems
4(4):supplement. 35pp.
Greenwood, R.J. and A.B. Sargeant. 1973. influence of radio packs on captive mallards and
blue-winged teal. J. Wildl. Manage. 37:3-9.
Hansen, P.H. 1987. Acid rain and waterfowl: the case for concern in North America. Izaak
Walton League of America, Arlington, VA. 39pp.
Hartman, F.E. 1963. Estuarine wintering habitat for black ducks. J. Wildl. Manage. 27:339-347.
Heath, R.G. 1969. Nationwide residues of organochlorine pesticides in wings of mallards and
black ducks. Pestic. Monit. J. 3(2):115—123.
Hepp, G.R. and J.D. Hair. 1984. Dominance in wintering waterfowl (Anatini): Effects on dis-
tribution of sexes. Condor 86:251-257.
Hickey, T.E. and R.D. Titman. 1983. Diurnal activity budgets of black ducks during their annual
cycle in Prince Edward Island. Can. J. Zool. 61(4):743-749.
Higgins, E.A.T., R.D. Rappleye, and R.G. Brown. 1971. The flora and ecology of Assateague
Island. Bull. A-172. Agricultural Experiment Station, U. of Maryland, College Park, MD.
70pp.
Johnsgard, P.A. 1960. A quantitative study of sexual behavior of mallards and black ducks.
Wilson Bull. 72:133-155.
Habitat Use and Movements 32

Johnsgard, D.H. and R. DiSilvestro. 1976. Seventy-tive years of changes in mallard—bIack duck
ratlos in eastem North America. Birds 30(5):905-908.
Johnson, D.H. 1980. Comparison of usage and availability measurements for evaluating re-
source preference. Ecology 61:65-71.
Jorde, D.G. 1986. Nutritional and thermodynamic aspects of the ecology of black ducks win-
tering in Maine. PhD dissertation. U. of Maine, Orono. 114pp.
Jorde, D.G. and W.B. Krohn. 1986. Microhabitats of black ducks wintering in Maine. Research
Information Bull. No. 86-94. U.S. Fish and Wildlife Service, Laurel, MD. 2pp.
Lack, D. 1968. Bird migration and natural selection. Oikos 19:1-9.
Lewis, J.C. and R.L. Garrison. 1984. Habitat suitability index models: American black duck
(wintering). National Coastal Ecosystems Team, Div. Biological Services, Research and
Development, U.S. Fish and Wildlife Service. FWS/OBS-82/10.68. 16pp.
Lewis, J.C., M. Nelson, and J.D. Clark. 1984. A test of variables and equations potentially
useful in an HSI model for black duck coastal (wintering) habitat. U.S. Fish and Wildlife
Service. Unpubl. rep. 50pp.
Longcore, J.R. and F.B. Samson. 1973. Eggshell breakage by incubating black ducks fed DDE.
J. Wildl. Manage. 37(3):390-394.
Meanley, B. 1982. Waterfowl of the Chesapeake Bay country. Tidewater Publishers,
Centreville, MD. 221pp.
National Oceanic and Atmospheric Administration. 1985. Tide tables 1985. High and low
water predictions. East coast of North and South America, including Greenland. NOAA,
U.S. Dept. of Commerce. 285pp.
National Oceanic and Atmospheric Administration. 1986. Tide tables 1986. High and low
water predictions. East coast of North and South America, including Greenland. NOAA,
U.S. Dept. of Commerce. 285pp.
Neu, C.W., C.R. Byers, and J.M. Peek. 1974. A technique for the analysis of utilization-
availability data. J. Wildl. Manage. 38(3):541-545.
Mabuse use and Mwemems 33

Perry, M.C. and H.H. Obrecht. 1983. Food habits and distribution of wintering black ducks in
the Atlantic Flyway (abstract only). Trans. Northeast Sect. Wildl. Soc. 40:130.
SAS Institute, Inc. 1985. SAS User's Guide: Statistics, version 5 edition. Gary, NC. 956pp.
Samuel, M.D., D.J.Pierce, E.O. Garton, L.J. Nelson, and K.R. Dixon. 1983. Users manuel for
Program Home Range. Contribution #259, Forest Wildlife and Range Experiment Station,
U. of Idaho, Moscow, ID. 64pp
Serie, J.R. 1986. Results of the 1986 Midwinter Waterfowl Survey in the Atlantic Flyway states.
U.S. Fish and Wildlife Service, Office of Migratory Bird Management, Laurel, MD. 6pp.
Sieling, F.W. 1960. Resources of Worchester County coastal waters. Maryland Dept. Res. and
Education. Ref. No. 60-10. Solomons, M.D. 17pp.
Spencer, H.E. (ed.). 1981. Black duck management plan for North America, 1980-2000. Vol
1. Black Duck Committee, Technical Section, Atlantic Flyway Council. 42pp.
Steiner, A.J. 1984. Mid-Winter Waterfowl Inventory, Atlantic Flyway, 1954-1984 trend analysis.
U.S. Fish and Wildlife Service, Newton Corner, Massachusetts. 300pp.
Stotts, V.D. 1958. The time of pair formation in black ducks. Trans. N. Am. Wildl. Nat. Re-
source Conf. 23:192-197.
Stotts, V.D. and D.E. Davis. 1960. The black duck in the Chesapeake Bay of Maryland:
breeding behavior and biology. Chesapeake Sci. 1:127-154.
U.S. Fish and Wildlife Service. 1986a. North American waterfowl management plan. A strat-
egy for cooperation. 33pp.
U.S. Fish and Wildlife Service. 1986b. Concept plan for preservation of black duck wintering
habitat. Atlantic coast. U.S. FWS, U.S. Dept. Interior, Newton Corner, MA.
34pp+appendices.
Wooley, J.B., Jr. and R.B. Owen, Jr. 1977. Metabolic rates and heart rate-metabolism re-
Iationships in the black duck (Anas rubripes). Comp. Biochem. Physiol. 57A:363·367.
Wooley, J.B., Jr. and R.B. Owen, Jr. 1978. Energy costs of activity and daily energy expendi-
ture in the black duck. J. Wildl. Manage. 42:739-745.
Habltat use and Movement: 34

Table 1. Available macre-habltat types on the Chlnceteague study area.
HABITAT HECTARES PERCENT
UpIand‘ 6562.0‘ 25.6
Open water' 5518.3 21.5
Subtidal water 5385.5l
21.0
Saltmarsh 4743.1 18.5
Tidal flat 1400.2 5.5
Impoundment 910.0 3.6
Natural pool 423.4 1.7 _
Shrub wetland 324.2 1.2
Stream 304.4 1.2
olneé 42.6 0.2
Total 25614.9 100.0
"Upland includes developed areas and all other areas designated as up-Iand under the National Wetland Inventory classification.
*Open water is 21m deep at mean low tide; subtidal water ls <1m deep '
at mean low tide. Data from 1:24000 USGS topographic maps.
’Other includes those areas designated as dunes under the NationalWetland Inventory classification.
ss

Table 2. Status (as of 4 May 1986) of the 23' radloed female black ducks known to have usedthe Chincoteague study area.
4151 AHY* last located 2/28/86 on study area
4999 AHY alive on study area
5067 AHY dead; post·hunting cripple 1/28/86
5088 HY alive on study area
5112 HY dead; hunter kill 12/18/85
5128 HY alive on study area
5143 HY dead; natural mortality 1/14/86
. 5155 _ AHY last located 1/23/86 on study area
5183 HY alive on study area‘ 5205 HY alive on study area
5231 AHY last located 4/19/86 on study area
5324 HY alive on study area
5336 AHY alive on study area .
5419 AHY last located 1/29/86 on study area; 2/16/86 at Cedar island, VA
5464l
AHY last located 1/23/86 on study area; 2/15/86 at Snowhill, MD
5514 AHY dead; hunter kill 12/30/85
5536 HY last located 4/20/86 on study area
5662 HY never located on study area after release; 2/17/86 at Back Bay NWR, NC
5670 AHY last located 4/6/86 on study area
5767 HY last located 1/8/86 on study area ·
5886 HY alive on study area .
5919 HY last located 12/30/86 on study area; 1/16/86 at Bow Beach, DE
5983 HY last located 4/20/86 on study area
‘lncludes 20 black ducks radio-harnessed at Chincoteague NWR and 3 black ducks (4151, 5536,5670) radio·hamessed at Brigantine NWR, NJ; all were captured and released during De-cember 1985. Radio locations off study area provided by E. Derleth (U.S. Fish and WildlifeService).
'AHY=after hatching year (juvenile); HY=hatching year (adult).
36

ed3Z24;
U!Ö
°°
o
S
NQ
Q
...
E
coQ
QN
R
E
ab
S¤¤N
Y
2
"2
S-
222
§
cu0
O;
Qo
.,.,
3
Q
o
Ö
Q)
O
OQ
q;
•
ÖQ
:
2-
°<¤
22
,,
•:
cg
oO
2"
··6
4„,
Q
=_
1*Ö
lX
ä2
3
·••L
•
äg
go
Q
Z
5cn
;Q
Q<·¤
zu
2
·=
1-
QN
N
U‘
mQ
Qc
QE
•-
Q¤¤
><
uS
•'Q
J
¤.
••€
Q.
éN
Ng
QN
m
N
oaQ
<¤Q
c¤Q
zu
I
cnIn
QY
NQ
_'
>
NQ
Nca
00m
-¤
“’*.9
S2
2
vi¤>
.
ancam
Q
gQ
?'°
gco
„
Ü!
'¤xa
coQ
MQ
Q-
ae
¤—Q
co"
Q
‘°
2
*"-
¤¤3
gS
';
.¤
N
cn
§·
-E3
Z
2
3•-
.¤3
gg
a.:
0
EÖ
,_E
D_:
U
1:-¤
Q;-Q
.:
3
·=0
0--
9Q
;·.:
"'
~6
"=
·=
zO
2.2
—1:
ua
ä2
=
:—
°o
·
¤c
¢:°
O"’
0en
Q
¤>,
c4;
Ücn
Qan
v
>4U
Ü
D
=o
EGJ
g
coo$2
cQ
-
"‘
_;..
Ö..
1-
YQ
Ö
.:
QY
cnÖ
..Q
YO
Q
3:
1-
1-
'·1
-¤
•gu-
„_en
Ö..
OQ
B
Q
1*
Y.
..N
NIn
<Q
W"
—·S
Qes
§§
.
.ac
ao‘·°
un
‘”~·
OW
eaca
ceQ
eoQ
an
:2
2
§‘§
"*'·*23
§3
2·¤
.¤„„
22
·g2
o5
«.»5
".-
93Q
gQ
Q¤>2
"Q
ZQ
°¤>
cs:
"Q
S
Oeq
InO
ON
QG
,Ql¤
*_m
q
F)
1*
"7N
Q
}
cu3
ca¤
4;¢¤
1-O
cz
_,
LL
Ülc
l-LE
Q
Q1
-F
V
E
1-
vQ
:¤
cu„.
m
37

Table 4. Mean movement estlmates for luvenile and adult female blackwlntering at Chlncoteague, Vlrglnia, December 1985-February
MOVEMENT' (m)
FREQ AM PM D(
N
Juvenile -
5088 (116)' 982.1 1150.8 346.8 151.1
5128 (118) 1451.2 1525.8 351.4 222.4
5143 (43) 1031.6 1151.0 431.5 289.7
5183 (119) 2239.5 1903.2 828.1 719.7
5205 (121) 4826.2 5722.0 574.6 709.7
5324 (118) 1656.8 1378.7 725.9 858.4
5536 (76) 1847.2 1946.2 556.0 547.9
5767 (35) 5217.3 5103.0 2802.2 1226.3
5886 (115) 1492.0 1867.3 844.2 669.6
5983 (104) 3181.3 3612.8 859.6 600.9
Aßsä ·4151 (86) 585.3 879.2 386.7 555.3
4999 (135) 4642.7 4700.3 356.0 352.3 ·
5067 (28) 1836.8 1667.9 826.7 802.1
5155 (55) 3563.3 3457.7 2197.2 1191.7
5231 (112) 3584.5 3236.6 1400.5 638.9
5336 (119) 2466.5 2713.4 298.3 252.3
5419 (36) 5019.6 4591.5 1464.6 1410.1
5464 (20) 3694.4 4753.6 106.0 296.6
5514 (17) 4934.8 4852.7 597.3 345.8
5670 (65) 582.6 623.4 364.5 50.0
'Movement data averaged over approximately S-hour intervals:AM=crepuscular night-to-day movement, PM =crepuscular day-to-night movement, D=dlurnal movement, N =nocturnal move-ment.
'Number of radio locations used in movement estimates.
38

Table 5. Wllcoxon two·sample comparlson of mean range area, mean corearea, and mean movement estlmates by age class for female black duckswinterlng at Chlncoteague, Virginia, December 1985-February 1986.
Juvenile Adult
7 SE Y SE
Movement‘ (m)
Crepuscular (A.M.) 2392.5 482.2 3091.0 525.9
Crepuscular (P.M.) 2536.1 530.1 3147.6 516.2
Day 832.0 227.6 799.8 213.1
Night 599.6 101.8 589.5 137.1
Range area' (ha)l
50% contour 322.7 68.9 81.8 28.0 "
95% contour 1721.1 458.3 418.6 102.1 '
Core area'‘
core area (ha) 483.2 113.9 183.0 71.5 "
number of cores 1.9 0.5 1.0 0.1 _
‘Movement data for 10 juveniles and 10 adults averaged over approximately6-hour lntervals.
. 'Harmonic mean contours estlmated from 10 juveniles and 10 adults.
’Mean core area based on 10 juveniles and 9 adults; mean number of coresbased on 10 juveniles and 10 adults.
°Asterisk indlcates signlflcant difference between age classes (p S .05).l
39

Table 8. Convex polygon and harmonic mean estlmates of range and core area sizes (ha) forluvenlle and adult lemale black ducks wintering at Chincoteague, Virginia, December1985·February 1988.
RANGE AREA‘ CORE AREA
Harmonic means Convex ·
FREQ 50% 95% polygon Area No. %area/%data'
Juvenile _
5088 (116)‘ 71.0 137.2 1197.6 0.7 1 20.0/39.8
5128 (118) 134.7 670.2 1193.6 214.3 1 38.1/66.7
5143 (43) 231.0 627.8 688.7 238.5 1 29.6/52.6
5183 (119) 632.1 2686.1 4602.8 · 829.1 1 26.8/56.3
5205 (121) 63.5 578.7 1495.3 172.7 3 38.5/68.1
5324 (118) 224.6 862.7 2104.4 306.0 1 31.7/59.3
5536 (76) 439.6 2667.8 5556.8 787.4 1 25.2/62.3
5767 (35) 320.7 1660.2 5392.8 455.4 4 30.4/59.2
5886 (115) 440.6 2496.8 3977.7 701.8 1 26.2/61.8
5983 (104) 668.8 4823.2 7210.6 1126.4 5 20.6/60.4
4151 (86) 5.3 96.0 1367.8 5.3 1 33.3/68.8
4999 (135) 30.7 171.9 1695.0 28.4 2 40.0/59.0
5067 (28) 42.1 248.6 2268.1 685.3 1 36.4/60.5
5155 (55) 57.0 698.6 2481.0 169.7 1 25.0/62.8
5231 (112) 9.9 158.6 791.1 173.5 1 37.5/65.4
5336 (119) 119.5 372.6 3402.7 114.5 1 38.9/71.7
5419 (36) 310.1 1098.0 8483.4 344.1 1 33.3/60.6
5464 (20) 81.3 585.7 406.1 81.4 1 20.0/53.3
5514 (17) 107.0 605.6 1208.9 °' °° °°
5670 (65) 55.4 150.2 165.6 44.8 1 33.3/52.7
’Approx. 500m* cells used in harmonic means procedure to estimate 50% and 95% contours.Harmonic means estimatlon excludes outliers; convex polygon estimatlon includesoutliers.
_ *Statistica| measure of importance of core area; estlmate of the area (expressed as percent
of total range area) that contains the clustered radio locations (expressed as percent oftotal number of locations). Core area estimation excludes outliers. "Asterisk indicates
no statlstical core area ldentitied.
’Number of radio locations used ln range estimation.
40

Table 7. Comparison ol habltat availability to habitat use (uslng Neu’s chi-square statistlc) by female black ducks wlnterlng at Chlncoteague, Virginia,December 1985·February 1986.
Saltmarsh 18.5 49.1 '
Impoundment 3.6·
22.5 '
Subtidal water 21.0 11.5 '
Natural pool 1.7 7.4 '
Tidal flat 5.5 5.9
Shrub 1.2 1.5
Upland 25.6 1.0 ' yStream 1.2 0.8
Open water 21.5 0.3 '
Other 0.2 0.0
‘AlI habitats within 25615 ha study area assumed available.
'Based on 1442 radio locations of 22 birds.
'Asterisk indicates use signiticantly different than availability (p$.05). Overailx'=3145, df=9, p<.001.
I 41

‘Table 8. Comparlson of habltat availability to habltat use' (uslng Johnson’sPreference Assessment Program) by female black ducks wlnterlng atChincoteague, Virglnla, December 1985·February 1986.
HABITAT T BAR' RANK
lmpoundment -3.19a‘ 1
Saltmarsh -2.69al
2
Natural pool -2.11a 3
Shrub -1.81a 4
Stream -1.28a 5
Other -0.94a 6
Tidal tlat -0.17a 7
Subtidal water 0.97a ' 8
Open water 5.14b 9
Upland 6.08b 10
‘Based on individual use of 10 habitats by 18 ducks. Ducks with less than 25radio locations were not used in this analysis.
’Average differences between ranks of use and availability; negative numbersuggests avoidance and positive number suggests preference. °
’Types with same letter are not signllicantly different (p2.0.05) according toWaller-Duncan ranks separation procedure. Overall F=509.5 (df=9,9,p<.01) for H„: all components are equally preferred.
42

6
·‘
¤M
.
¤
N.-
E2
3
Lucu
5.::
Q•«
CO6
.Q
.O§
gC
U
E2
::2%
UQ
ME
.-
‘䤤
E‘°
EE
IXQ
P3.¤
Q0
._
NE
x.
~c
2¤
c:Ö
Q
•—
Qe
-•
I6
·->‘°
ÜI-
3
E:
0-
ELU
In‘°
'·°ä-S
anCO
M:
äD
·¤
5I-
BN
Uä
gg
*6o
•·=."!
'¤0
.ID
mcu
.:
Fw
3cn
-Q
tl
c
äs-
2¤*
•-·
22
„S"'
.¤¤
lx~·
E‘·°
wg
°3
E°*
ET*6***
Q...
cO
-;-7
6
•¤§
°.
C"
"r-
ES
sth
og
;
¤¤c
SQ
{
c"
gg
·
°«
:
Le
g
LU
N;
0*-
··
>¤
gc
S?
6*;
o2
°o
22
·3-:
SL
:2
•-SE
"
gc
:;
2222
••
L°’,!
¤_•=
Üg
g
E6L!
°2
S==
-0
.:-¤
g°E
°-
:E
I->‘°
*-:
mm
2
Iä
zuE
0*
CD·.
;
43

Ol
GuaEI-2
,E
LU';
N
s2
w=>
52
§
evÖ
·c
22
°6
E
S
—
,„
luQ
Ixtg
It':Q
V!
x
3
QE
c,
=’
8
°ci
'~15
°
E
Ö=¤
Eä
C¤¤
„,§
:2E
"’6
-2
Z
E
_guJ
22
6
w3
•=D
.
1-
E
v
_:
wö
LUnn
ca
gg
__,cn
o¤>
E
2*
6Ö
68
2
‘
*6·~
Ö2
hn
},
lo
¤t¤
rn
mz
E
q;Ix
r—cn
$,,59
Q3
ES
g
=2
°6
2’2
cw-
“
‘
Öä
C•$
-9
”<·=
„E9
26
2‘=
uu
m
..2
°—ä
2.
=ä
..2
2.,
·
ÖE
€Q
ZS.?
gg
2%
vg
ING
aa
.
S
5,,,
.°*
"’¤
og
_:
sv
__
S2
.¤_§N
cu
{E.:
:
<¤
-ä
U.¤
E—
E,.
2E
°ä°92
·
<%§_2
26
U
zumP
44

TABLE 11. Comparison ot telemetry and aerial survey techniques (using Neu's chi-square statlstlc) tor assessing dlumal habitat use of black ducks wintering atChlncoteague, Virginia, Octeber 1985-March 1986.
HABITAT TELEMETRY DATA AERIAL SURVEY DATA
Habitat’ Survey Habitat' Birds/ha Habitat'
Use (%) Count Area (ha)”
Use (%)
Saltmarsh 30.5 ' 6723 1365.3 4.92 13.3
lmpoundments 60.4 14038 617.3 22.74 61.6
Subtidal water 5.2 " 2448 900.5 2.72 7.4
Tidal flat 1.7 ' 768 297.8 2.58 7.0
Open water 0.1 10 207.0 0.05 0.1
Streams 1.5 ' 343 87.2 3.93 10.6
Other 0.7 0 156.1 0.00 0.0
Total 100.1 24330 3631.2 36.94 100.0
'Based on 752 diurnal radio locations of 22 birds. Asterisk indicates frequency derivedfrom telemetry data is signilicantly different (ps.05) than frequency derived fromaerial survey data. x'=289.1, df=6, p<.01.
_
’Area of habitat within survey transect.
°Percent habitat use=((birds/ha)/36.94) x 100; this procedure weights the observedsurvey count by proportional habitat tlown over.
45

·89¤V89E
.
·¤2":
E
,an
q6.
~—o
>>
.¤
O
3J
ä
5
5
-¤Wg""
c>
E
-¤c•O
co
0
ex-·
}-¤
¤.
°z·
;
na
V
ga
1-'D
ÖQ
G
cu.
'_
¤
Tg
I
••°
cg
)
CD
G¤
gn
.sg
¢¤c><I',_,$c>
U
4
·;E
äo
vi
c,J
HQ
vu-Q
C
gu
“°ä
es
0
3%>-
'¤
.:2
<a
m
0
gg
NQ
DQ
C,6
vw
¤_
1.:
vu
nm
md
mv
x
3>
vw
ed
<¤J
ßä
"
§
•¤
O
gß
I.|..I
0
Nu
(B
•¤
„°
D
0
.
No
g_
EE
gg
S
2
uJ
rn·
¤—‘!ä
<°
S"
anZ
3
46
;,
*5
.¤9
-
2;
*5
,_¤
.
-¤"’
n-5
;
NE
·¤
Ü";
gg
°·¤E-
.
mg
»-wb
}-¤
I|
EN
:8
?
46

°Ü‘
*=‘··E
*“*
~'
Um
G
·;_E:
äs
\~zu
EJ
"'Q
J'ya
.,
gw
-ä
g•\
’g·
äBä
/E
U9
‘'
¢
"Ü,
1 1·
ä„
‘1
¤„
_°
1(\
1
-e
sQ
’§\/§
(\•,._
ä
äc
s,\*
§mz
ärg
"‘E
‘
IL
47

Aum-es x cnounu sunvsv ——-
;_1965·66 GROUND SURVEY
1965-66 ÄERIAL SURVEY ·-·•··•·•·A
<¤ E 2 2 2Q ° 2 2 =
1500gä§
E E Egg F E 2w E l' . 2m E E EE : j =· :=
1000 E'_,• •
EZ 5 5 ,.,E { Ä ··
•,·~•• .
=·· E 2
s30SEP 14 NOV 29 DEC 12 FEB 29 MAR
· DATE'
Flgure 2. Ground and aerlal counts of black duck: ln the Chlncoteague NatlonalWildlife Refuge.
A48

·
E
.V
°z
W=
.,E
5E.
5
¢S
uQ
E
ääh
Sug
0
•-•Q
U
40
\_
Q•-•
4:1
„\q
.
•·
sc·¤
‘z
rn
E
8
7**U
-l
.10
W
\¤
1-
E4
Q:
a:
.¤
.
0
ß”¢*"·
4,
ä
•·•—
\x_
°'
Ü‘°
°'?‘‘
§
4
,_
VA
’4
'B
1•
1_
_4
g
V
"‘•.Ü'
N
3rf
GI
S
>·z
°°',‘
SF:
S<·-
SQ-
2;E
·‘
ab
ul{
gg
Ö
P"
_
gg
,
°1
0¤
E‘
¤°
...4Q
4Q
2**-
Q5
¤__‘„>
15
¤ä
11
.1'
{Äl
LO
SS
.·6
4„
-·—*¤.
E··
—
:Ü
Ö"¤.¤
d
Ö‘§
S
7
E
Ü
bg
gü
,
H0
0
·=
ka„¤
1
hw
5ä¤
|•
¢
”
·
§5
111ZI
•-•g
4z
‘w
SE
49
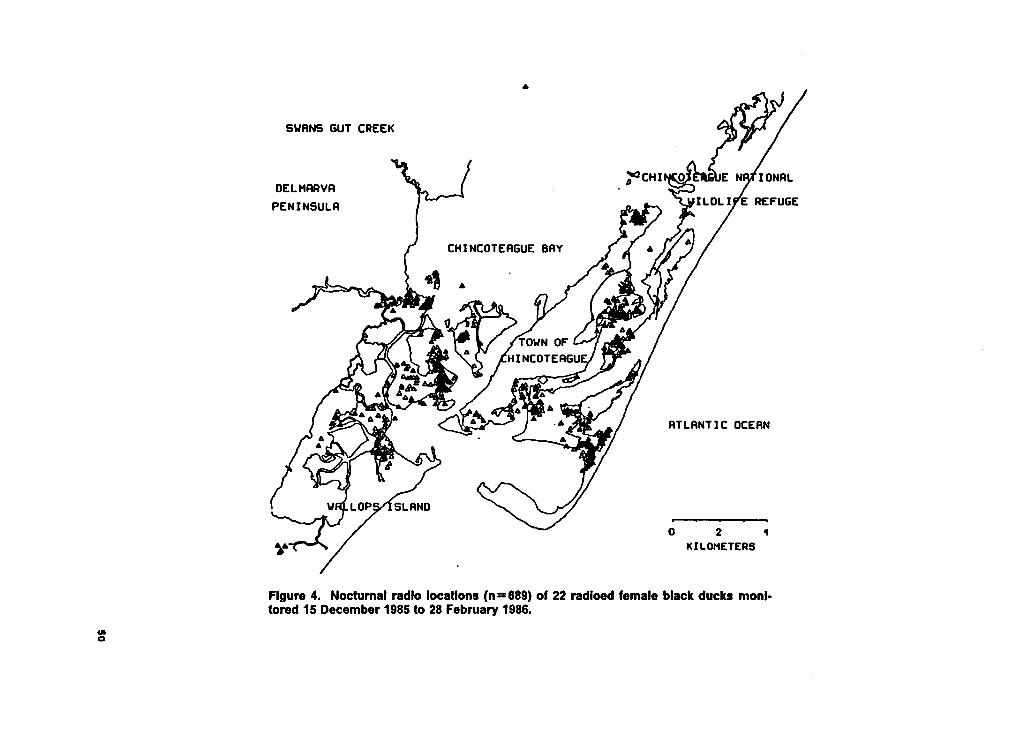
I
•·€
2E
E
_,S
zu•-
an
c3
U
w0
zIL
¤n
ää
2E
2
:,'an
‘.
u1
E
"8
„~'\Z
co
E
‘_;··
u..•
;'
2
\.
3
a:
E
8U
I*X
.,
8
o~
·¤
4*
iv4..
8
•£4
‘
Rg;
.»
„
G
Ul
~
"I
44
r
·c
‘!In
a:
¤*
on1
‘
gg
1-
1-
>-Z
o-s ‘
II
2ä
'~···ä
2
sä
NU"
P4"
·;'
QE
:I
¥·
5-g
g‘
4*·
·‘€¤-
•'·*·'
4° )9**
S°
°°‘U
-.
g°
E•
.l’*
,;I2
Qa
x
·z
¤__.__
~a·
4I
ag
U
M-!•—
#•·.
_
_|
q-
‘°‘
¤-
¢‘T
4<
_
E0
,_„.>
4*ÜQ
_
-¤
.;
'_
·'
”V
OG8
.
·
N"
'
JZQ
Ä
4b
i„
r
Q
ÄI
3
qi
un
5SIi"
":1ca
u4QS
I-¢
4*
u-°"
3II
.1us
>:
anE
lg8
ZI
•-•E
"E
ang
m
50

EE
WIA2
2¤
2S
äfE
EE
Y?S
’_,
E3
7<
>§
2Ҥ
•-ää
.gg
•-°°
E<
E%
<C
Q?
Em
ag
euIE
-21ä'9'M
OS
_.—
0
aEE
Yh
l/
•-o
o/
ä2%
z¤22EE“‘;
22
22
2E32
—EE?
SNO
|.l.VOO
'|:|O
.|.N3O
H3d
51

7
2
$2
5L12
S
=;•z
3
·gS_
5
EZ5
_ll-:Ih
ä!"'
5·35°·‘8
2'2
E2
E
P0
E
ä'E
Ea
°°IE
E2 ät
252
Q
‘ä°·¤
2
;5*6
2S
22%
.
S
äé
2
ge!
SN
C.
2
ag
NE
OU
EC
52

W AIgJW
‘䤤
r
E5
II
E§?.a
..
5°g
E
:v—
_Ü
r-
ig?
2§§
tlg
s;'—
gas
•-<
gg
g”
Eéäi
6
gg
N
an
Igg;
a
ääl
.•
Uzv
,
<
EB
S
"
E
aßä
ég
g
1
__
2._
Na
·
Eä
Gag
5*2*
6
äga"u.
5:

VÜ
IIIIIÄ
ä2
;.
"E
6IIIIIIIII
.Ia
m
*
_
662
rD-
**0
/3*aggain;§gä
2Z
222
""8
2IIIIIIII
=2=~·
'JE
62—
VEag
i8
+
3%§-E
9*6%
|||||||l||||""
zn
ä•‘SE32
22
22
22
’SNO
|.LvO0‘I
A01.N3O
H3d
54

CHAPTER 2

Time and Energy Budgets
ABSTRACT: Scan sampling techniques were used to quantify behaviors of American black
ducks (Anas rubripes) wintering at Chincoteague National Wildlife Refuge, Virginia, during the
winters of 1985-86 and 1986-87. Diurnal time budgets were constructed by distributing scans
over a time-tide matrix within refuge pool, saltmarsh, and tidal water habitats. Black ducksl
fed least and rested most when in refuge pools during the day. Black ducks fed most and
rested least when in tidal waters during the day. Black ducks curtailed feeding and increased
time spent in alert and locomotion behaviors in response to disturbance. Time budgets were
converted to energy budgets. Diurnal energy expenditure (DEE) was derived by weighting
expenditure within habitat by the proponion of time spent in all three habitats. Comparison
with literature values suggested that black ducks wintering in Maine and Virginia have similar
DEE at a given temperature.
Time and Energy Budgets 56

Introduction
Declining populations of American black ducks (Anas rubripes) over the past three decades
(Steiner 1984) have prompted behavioral research of black ducks on their wintering grounds.
Albright et al. (1983) invesiigated the behavioral responses of wintering black ducks in Maine
to temperature, wind chill, and the availability of ice—free foraging habitat. Black ducks rested
more and fed less with decreasing temperature and increasing ice, even as total daily energy
expenditure increased due to the demands of thermoregulation. These authors suggested
that black ducks in northern wintering areas experience times of extreme food shortage and
that there was evidence of a physiological set-point below which it is more advantageous to
rely on energy reserves than to expend energy searching for food.
Hickey and Titman (1983) employed scan sampling to study black ducks wintering on Prince
Edward Island. Similar to the tindings of Albright et al. (1983), ducks fed less and rested more
with increased wind chill and tide level. These authors suggested that there is a need to de-
termine the amount of time black ducks spend in various habitats and to measure nocturnal
activity.
Brodsky and Weatherhead (1985a, 1985b) demonstrated that local food availability can deter-
mine black duck behavioral responses to low temperatures in Canada. Brodsky and
Weatherhead (1984) also studied the posturing of black ducks while resting and roosting as a
mechanism for reducing thermoregulatory costs. That study suggested that the management
of energy expenditure is as much a consideration as management of energy intake by black
ducks.
In this study, the time budget approach was used to quantify behavior and energy expenditure
of black ducks wintering on, and in the vicinity of, the Chincoteague National Wildlife Refuge,
Virginia. Objectives were to estimate time and energy expenditure within different habitats,
Time and Energy Budgets 57

identify environmental factors that influence behavioral response, and contrast black duck al-
location of time and energy resources in tidal Virginia with results of studies conducted at
higher Iatitudes.
Study area
The study area was located on Virginia's Eastern Shore of the Delmarva peninsula. lt was
bounded on the east by the Assateague National Seashore (Maryland-Virginia border to the
southern tip of Assateague Island) and on the west by County Highway 679, from Swan Gut
Creek to the Wallops island bridge. This area included all of the Chincoteague National
Wildlife Refuge (3600 ha), the south end of the Assateague National Seashore, the north end
of Wallops Island, the south end of Chincoteague Bay, and encompassed about 25,600
hectares. At least 3000 black ducks wintered on the study area.
The study area was composed of 25% upland, 21% open tidal (21m deep at mean low tide)
water, 21% subtidal (<1m deep at mean low tide) water, 18% saltmarsh, 5% tidal flat, 4%
brackish impoundment, 2% natural pool, 1% shrub wetland, 1% freshwater stream, and < 1%
other habitats. Telemetry and aerial survey data from the winter of 1985-86 indicated that use
of the saltmarsh and refuge impoundments by black ducks was significantly more than pro-
portional availability (Chapter 1). Tidal waters (i.e., subtidal water and tidal flats) were im-
portant during periods of freezing temperatures, when other habitats were not available for
foraging.
Time end Energy Budgets 58

Methods
Scan sampling techniques (Altmann 1974) were used to quantify behaviors of black duck flocks
wintering on the Chincoteague study area. During the 1985-86 winter, 138 flocks were ob-
served between 5 November and 27 February. During 1986-87, 41 flocks were observed be-
tween 10 November and 1 February. An efforl was made to distribute weekly observations
over habitat and time of day. Flock size ranged from 10-880; mean and median flock size was
70 and 43 birds, respectively. The term "flocks" is used Ioosely in this context; observed
'fIocks' were not necessarily discrete biological units. ln most cases, a group of easily visible
ducks (within a flock) was selected for observation. During active periods, ilock composition
often varied among scans as birds moved in and out of the observation 'window".
The sampling procedure began with the duck farthest to the left or right (side was randomly
chosen), and proceeded to the next individual until the entire group had been scanned. Sub-
sequent scans within a flock started on the same side that was initially chosen. Regardless
of flock size, a minimum of one full minute was allowed to Iapse between the end of one scan
and the beginning of the next to minimize dependence of scan data. A flock generally was
observed for an hour or until 20 scans were obtained (whichever came lirst). This procedure
was followed to minimize llock bias in the time budget estimate.
Each duck was observed through a 15 - 60x scope for tive seconds or less, and behaviors were
categorized as feed, rest, stand, walk, swim, fly, comfort, alert, courtship, or agonistic (Albright
et al. 1983). Feeding included dabbling, tipping-up, and foraging behaviors often observed in
Held-feedlng ducks (i.e., walking with head down). Resting included sleeping and loating.
Comfort behaviors included preening, wing tlapping, stretching, and scratching. Courtship
included all pre- and post-copulatory behaviors. Agonistic behaviors included both intraspe-
Time and Energy Budgets 59

citic and interspecific encounters. A 10-key mechanical laboratory counter was used in the
field to tally behaviors.
Date, time, wind speed and direction, temperature, cloud cover, precipitation, ice cover,
habitat type, and location were recorded for each scan. Cloud cover was recorded in 10%
increments. Precipitation was recorded as absent or present. Ice cover was categorized as
none, light/intermittent, or heavy (i.e., thick enough to support ducks). Habitats were cate-
gorized as saltmarsh, refuge pool, or tidal water. Tidal water included tidal tlats, streams, and
subtidal open water. Refuge pool included both artiticial impoundments and natural pools.
When fiocks were disturbed by a recognizable source, the source was categorized as natural
(e.g., racoon or raptor) or man-made (e.g., pedestrian or automobile). Scan sampling contin-
ued while the disturbance was present (or until the flock flew away) to obtain a random sam-
ple of the behavioral response of black duck flocks to disturbance. Nocturnal observations
of black duck flocks were obtained with the aid of a Smith and Wesson night-vision scope, lit-
ted with a 400 mm lens. lt was difficult to distinguish black ducks from other dabblers; ob-
servations could only be made on nights with a full moon and some ice or snow to enhance
light reflection.
Analysis
Tidal stage was categorized as ebb, flood, high, or low. Low and high tides were exactly three
hours, centered on the corrected (for Chincoteague Channel) low and high tide times pub-
lished by the National Oceanic and Atmospheric Administration (1985, 1986, 1987) for Sandy
Hook, New Jersey. Ebb and flood stages made up the remaining time, each approximating
three hours. Tide height varied 0.6m between high and low water. The time of scan was
converted to minutes from sunrise and minutes before sunset for correlation analysis (NOAA,
Time and Energy Budgets 60

38°N). For analysis of variance (ANOVA), time was categorized as <3Vz hours after sunrise,
<3% hours before sunset, and midday (i.e., the time in the remaining interval).
Spearman rank correlation procedures were used to assess behavioral responses to weather.
The overall effect of habitat, time, and tide on black duck behavioral response was assessed
with multivariate analysis of variance (MANOVA), in which all behaviors were modeled as
mutually-inclusive dependent variables. Three-way ANOVA procedures were used to assess
the inliuence of habitat, time, and tide on energy expenditure and each behavior. Proportions
were arcsine-square root transformed for both MANOVA and ANOVA procedures (Zar 1984).
Time budgets were calculated from least squares means of behavioral proportions. Energy
budgets were estimated from energy coeflicients used by Albright et al. (1983). Signiücance
for all statistical inferences was pS0.05, unless otherwise indicated.
Results
Independence
The independence of scans within llocks was investigated. Plots of behavioral proportions
and energy expenditures against time of day suggested that some behaviors were related to
time. Therefore, proportion feeding and energy expenditure (for each scan) were regressed
against time to remove serial correlation due to time, and the residuals of the model were
analyzed for statistical autocorrelation using an autoregressive integrated moving-average
model (PROC ARIMA, SAS-ETS 1984). The proportion feeding was selected for analysis be-
cause it was the most dynamic behavior.
Time and Energy Budgets 61

Only 12 flocks had >25 scans, the minimum number of observations recommended for esti-
mation of autocorrelation by PROC ARIMA. For energy expenditure, only 1 of the 12 flocks
showed significant first·order autocorrelation between scans. For proportion feeding, three
of the 12 flocks showed signiticant first-order autocorrelation and one showed significant
second-order autocorrelation. This procedure suggested that a lag of tive minutes between
scans sufficiently reduced problems of statistical dependence. Consequently, scans less than
five minutes apart were discarded from the data set; 1471 diurnal scans from 179 flocks and
47 nocturnal scans from 7 flocks were used in the following analyses.
Influence cf weather
The influences of cloud cover, wind, and temperature on behavior and energy expenditure
were assessed with Spearman rank correlation coefficients (Table 13). Swim, comfort, and
courtship behaviors were positively correlated with cloud cover; rest was negatively corre-
lated. Feeding was positively correlated with wind speed; stand, walk, comfort, courtship,
alert, and agonistic behaviors were negatively correlated. Rest, stand, and comfort behaviors
were positively correlated with temperature; feeding, swimming, flying, and energy expendi-
ture were negatively correlated with temperature. All correlations, except for that of energy
expenditure with temperature, were low (r<0.25).
influence of habitat, time and tide
Habitat, time, tide, and their interactions influenced the behavior of black ducks wintering at
Chincoteague (MANOVA, p=0.0001). However, individual behaviors within the MANOVA ma-
trix did not always respond in a similar manner (Table 14). For example, feed, rest, stand,
swim, maintenance, and alert behaviors were dependent on habitat whereas walking, flying,
courtship, and agonism were not.
Time and Energy Budgets 62

lnterpretation of behavioral responses to tide is confounded by habitat use considerations.
A positive relationship between low tide and foraging behavior has been found in tidal habitats
in maritime Canada (Hickey and Titman 1983) and coastal Maine (Hartman 1963, Albright et
al. 1981, Jorde 1986). In Massachusetts saltmarshes, however, Grandy (1972) found evidence
of a positive relationship between high tide and foraging behavior. Consequently, the effect
of tide stage on black duck behavior must be investigated by habitat type.
Black ducks clearly changed their diurnal feeding frequency in response to habitat and tide,
and less so to time of day. When in the saltmarsh (Figure 9), black ducks spent the most time
foraging during high and low tides. ln tidal waters (Figure 10), black ducks spent significantly
less time feeding at high tide; however, during other tide stages black ducks spent signif-
icantly more time feeding in tldal waters than in either refuge pools (Figure 11) or saltmarsh.
As expected, tide stage did not significantly affect foraging behavior in refuge pools (water
levels are not tidal).
Time budget estimation
MANOVA and ANOVA procedures suggested that time, tide, and habitat are important factors
to consider when constructing a time budget for black ducks wintering on the Chincoteague
study area. Albright et al. (1983) were able to equitably distribute observations of black ducks
on Maine tidal flats by sampling at fixed times during the day. However, at Chincoteague,
black ducks have several available habitats and move among the habitats (Chapter 1) to
accomodate foraging strategies; behaviors must be sampled as liocks are encountered.
Consequently, scan data were distributed ex post facto over time and tide, by habitat. Two-
way tables for time°tide (3x4) interactions, by habitat, were calculated for each behavior.
Least square estimators were used to calculate the overall mean and standard error for each
behavioral proportion. This procedure accounted for the unbalanced cell sample sizes and
the covariances among cells when calculating the standard error associated with the mean.
Time and Energy Budgets 63

The least squares estimates of mean and standard error for each behavior were used to
construct a diurnal time budget within each of the three habitats (Table 15).
Black ducks fed least and rested most when in refuge pools; conversely, they fed most and
rested least when in tidal waters. Black ducks were particularly active in tidal waters, ap-
parently curtailing rest to feed and swim more. Black ducks used tidal waters primarily when
ice limited the availability of saltmarsh and pool habitats (Chapter 1); their behavioral re-
sponse in this habitat was likely due to lower temperatures rather than some habitat charac-
teristic.
The time spent in flight was underestimated by scan sampling. Flights between roosting and
foraging sites were not accounted for because ducks quickly moved out of view. Telemetry
data, however, suggested that black ducks on the study area generally flew 2.8km between
foraging and roosting sites (Chapter 1); a conservative estimate of time required to fly this
distance, allowing time for milling, would be 10 minutes.
Energy budget estimation
Time budgets can be converted to energy budgets by weighting each behavioral category by
an appropriate multiple of basal metabolic rate (BMR). Additionally, the cost of
thermoregulation at 5 - 10°C, 0 - 4°C, and -10 - 0°C can be factored in as, respectively, 1.4, 2.0,
and 3.4 times the BMR. Temperatures 210°C were assumed to be in the thermoneutral zone
(Wooley 1976). Basal metabolic rate was assumed to be 3.204 kcal/bird/hr. All BMR multiples
used in this analysis were obtained from Albright et al. (1983).
The energy expenditure (kcal/bird/hour) of black ducks at 5°C was calculated for each habitat
(Table 16). Hourly energy expenditure=[(muItipIe)(BMR) + cost of thermoregulationl x pro-
portion of time spent in a given behavior. Total hourly energy expenditure was the summed
Time and Energy Budgets 64

energy cost of all behaviors within a habitat. Total hourly energy expenditure was then
weighted by the proportion of time that black ducks spent in each habitat (Table 17). This
weighted value (6.80 Kcal) represented the hourly rate of energy expenditure at 5°C by an
average black duck wintering on the Chincoteague area during the day.
This same approach was used to estimate energy expenditure for each scan and its corre-
sponding temperature. Not surprisingly, estimates of energy expenditure for scans were sig-
niticantly correlated with temperature (Table 13). Scan energy expenditures also were
correlated with time; as the day progressed, energy expenditure decreased.
Estimates of diurnal energy expenditure also may be extrapolated to 24 hours. Nocturnal
feeding has been reported in dabbling ducks in the summer (Swanson and Sargeant 1972) and
in the winter (Mendall 1949, Tamasier 1976, Albright et al. 1983, Jorde et al. 1984). Although
nocturnal data collected during this study were not adequate for the least squares means
procedure, the arithmetic means (Table 18) suggested that black ducks were indeed foraging
and swimming actively at night. Twenty·two of 62 carcasses collected on the study area dur-
ing the day had empty digestive tracts and aggregate dry weight of ingested food in the other
carcasses suggested that black ducks were not actively feeding during the day (Chapter 3).
Circumstantial evidence from radio telemetry (Chapter 1) also strongly indicated that black
ducks were active outside the Chincoteague NWR at night.
Day-night habitat use patterns of black ducks on the Chincoteague study area were very dif-
ferent (Table 17). lf nocturnal and diurnal behaviors within habitat are assumed to be similar,
as these data suggested (Tables 15, 18), the energy budget can be extrapolated over a 24hr
period by weighting the estimate of energy expenditure by proportional use of habitats at
night. At night, black ducks spent 5.2hrs foraging and expended 7.07 kcal/bird/hr at 5°C.
Tlme and Energy Budgets 65

Disturbance
Of the 179 flocks sampled during this study, 38 were disturbed at least once during the ob-
servation period (approx. 1hr). Of the 38 disturbances, 66% (25) were of human-origin and
24% (13) were natural. Human disturbances included pedestrians (5), automobiles (10), boats
(2), hunters and oystermen (4), and aircraft (4). Natural disturbances included flocks of snow
geese (2;Chen carulescens), Canada geese (1; Branta canadensis), and brants (2; Branta
bernicla), northern harrlers (2; Circus cyaneus), an immature bald eagle (1; Haliaeetus
leucocephalus), a black-backed gull (1; Larus marinus), a raccoon (1; Procyon lotor), a Sika
deer (1; Cervus nippon); and two unknown sources. A 2x2 contingency table suggested that
the incidence of disturbance was dependent on habitat (X‘=3.26, df=1, p=.08). Fifty-eight
percent (22) and 42% (16) of the flock disturbances occurred on and off the refuge, respec-
tlvely; however, 73% (103) of the undisturbed flocks were observed on the refuge whereas
only 27% (38) of the undisturbed flocks occurred off-refuge.
Quantifying the behavioral response of black ducks to disturbance proved difficult in the field;
disturbed birds often were too active to monitor through the scope. Additionally, the birds
often flew or swam out of view before the start of the next scan. Consequently, only 56 dis-
turbance scans were obtained from 35 flocks, although 38 flocks were disturbed. In response
to disturbance, black ducks reduced foraging efforts and increased the frequency of alert and
Iocomotion behaviors. However, the response to human and natural disturbances was not the
same (Table 19); black ducks more severely curtailed feeding while swimming away from the
human disturbance (Wllcoxon two-sample test, pS.05). Sixty percent (15) of the flocks dis-
turbed by humans flushed; only 23% (3) of the flocks disturbed by natural sources took flight.
Tlme and Energy Budgets 66

Agonistic encounters
Time budgets were used to assess agonistic interactions (Table 20). The proportional fre-
quencies of occurrence were 0.16%, 0.15%, and 0.10% for refuge pool, tidal water, and
saltmarsh habitats, repectively, suggesting that black ducks were encountering the least an-
tagonism in the saltmarsh. The increased encounter rate in refuge impoundments was due
to interactlons with other species of waterfowl, particularly mallards. Mallards were present
in 109 of 179 (61%) black duck llocks observed. However, on the Chlncoteague study area,
aerial surveys indicated that no dabblers other than black ducks used areas outside the refuge
in any signiticant numbers.
Discussion
The time budget approach to quantifying behavior has been used on several species of win-
tering waterfowlz black ducks (Albrlght et al. 1983, Hickey and Titman 1983, Brodsky and
Weatherhead 1985a, 1985b), pintails (Miller 1985), green·winged teals (Tamasier 1976),
mallards (Jorde et al. 1984), and diving ducks (Goudier and Ankney 1986). This technique,
however, has not been well documented. Discussions at the Workshop on the Ecology of
Wintering Waterfowl (Anderson and Batt 1983) indlcated that both standardization of termi·
nology and sampling design, as well as rigorous statistical evaluation of time-energy budget
data, are needed. Extension of time budgets to energy estlmation further confounds inherent
problems, especially when energy coefticients are derived from literature values rather than
empirically (Weathers et al. 1984).
The approach used in this study is unique in two ways; dependence among scans has been
statistically evaluated and variances associated with each behavioral proportion have been
Time end Energy Budgets 67

calculated using a least squares estimator. Furthermore, an overall value for energy ex-
penditure (that accounts for patterns of habitat use) was estimated by weighting energy ex-
penditure within each habitat by proportional habitat use. Previous investigators have not had
the opportunity to combine telemetry and time budget data.
lt was essential that the scan be considered the sample unit (rather than as a subsample of
flock). Although weather and habitat type were constant among scans for a given tlock, time
and tide categories often changed during the observation period; consequently, scans of one
flock could be distributed over as many as four cells (two time, two tide) in the construction
of the time budget. Therefore, the data were edited to remove signiticantly autocorrelated
scans and the potential flock bias was ignored. This analysis would not necessarily be ap-
propriate for tlocks with a discrete composition such that scans were uniformally sampling the
same individuals. However, in this study, flock composition often varied among scans as birds
moved in and out of the observation ”window"; in extreme cases, total black ducks varied by
100 between scans.
Perhaps the most signiticant problem with this approach is the slight but signiticant depend-
ence of behavior on flock size (Table 13). Black ducks tended to rest more and feed less with
increasing flock size. However, black ducks tended to congregate in larger tlocks in certain
habitats. Mean scan totals were 79.5 (SE=2.6), 57.0 (SE=2.8), and 32.9 (SE=1.6) for refuge
pool, saltmarsh, and tidal water habitats, respectively. Black ducks fed least and rested most
when in refuge pools, and fed most and rested least when in tidal habitats (Table 15). These
similar relationships indicate that behaviors were not related to tlock size as much as they
were related to habitat use patterns. l suggest that the relationship between behavior and
flock size is not sampling bias but, rather, an accurate reflection of behavioral response to
habitat characteristics.
Time and Energy Budgets 68

Behavioral and energetic considerations
American black ducks have one of the largest wintering ranges of any North American
waterfowl species, e><tending from maritime Canada to the Gulf Coast; much of their wintering
and breeding ranges overlap (BelIrose 1976). It seems Iikely that varying levels of fitness must
be conveyed upon ducks wintering at different Iatitudes. The Habitat Suitability Index model
for wintering black ducks, in fact, assumes that habitat quality improves with decreasing lati-
tude (Lewis and Garrison 1984). Presumably, birds wintering further south have a selective
advantage in severe winters whereas birds wintering further north have a selective advantage
in mild winters (Lack 1968).
This study was designed to provide results comparable to work done by Albright et al. (1983)
in Maine. Weather appeared to similarly affect behavior of black ducks wintering in Maine
and Virginia, except that a positive correlation between temperature and feedlng was found
by those investigators; temperatures in the Maine study were often below -10°C, the threshold
at which ducks in that study apparently found it more advantageous to conserve energy (i.e.,
rest) than to expend energy foraging. The lowest diurnal temperature recorded during the two
winters at Chincoteague was -5°C. The similarities in behavioral response to weather at lati-
tude extremes suggest that wind speed, temperature, and cloud cover are slight but pervasive
infiuences on black duck behaviors in the winter.
The same behavioral categories and energy coefficients were used in both studies (Table 21).
At 5°C, Albright et al. (1983) estimated an energy expenditure of 81.95 kcal/bird during a 12.4hr
day with 4.5 hours allocated to energy intake (i.e., feedlng); data from this study suggested
an energy expenditure of 84.3 kcal/bird with 4.5 hours (weighted over three habitats) allocated
to energy intake. Assuming equal foraging rates, energy expenditure and intake were similar
for black ducks wintering on the east coasts of Maine and Virginia at 5°C. However, due to
the much milder climate in Virginia, black ducks were presumably leaving these wintering
Tlme and Energy Budgets 69

grounds with larger fat reserves. Laboratory analyses of black ducks collected on the study
area provide support for this assertion (Chapter 3),
The behavioral responses of black ducks to conditions on the wintering grounds appear to be
flexible. Black ducks wintering in Canada and Maine apparently cannot adjust foraging
strategies by shifting habitats; rather, foraging time is constrained by food density (Brodsky
and Weatherhead 1985b) or the tide cycle (Albright et al. 1983, Jorde 1986). Foraging response
also may be affected by the day·night cycle; Brodsky and Weatherhead (1985a) reported that
black ducks spent 100% of their time resting at night, whereas Albright et al. (1983) suggested
that nocturnal feeding was important for black ducks in coastal Maine (based on vocalizations
and radio telemetry signals).
At Chincoteague, black ducks were clearly responding to a foraging cycle dominated by dif-
ferent patterns of habitat use during the day and night. Black ducks were the only species
(besides snow geese) observed making crepuscular llights to and from the refuge. Observa-
tions with the night-vision scope indicated that black ducks in tldal water and saltmarsh were
actively feeding and, furthermore, that few black ducks remalned in the refuge at night. During
the day, black ducks observed in the refuge impoundments often were conspicuously lnactive
relative to the activity of other waterfowl species, particularly at low temperatures. The pat-
tern suggests that black ducks rest in the refuge between bouts of nocturnal foraging; Herbers
(1981) suggested that, in an adaptive sense, "laziness" (i.e., inactlvity) curtails energy ex-
penditures and elongates the interval between feeding periods.
Food availability and tldal stage were apparently second-order considerations for black ducks.
lnfluences of tldal periodicity on activity was evident for black ducks in all habitat types.
Telemetry and aerial survey data (Chapter 1) suggested that habitat use was mediated by tide
and ice; both affect food availability.
Time and Energy Budgets 70

Black ducks may have returned to the refuge during the day because of microclimate con-
siderations (Brodsl<y and Weatherhead 1984, Jorde 1986); certainly, the trees surrounding the
impoundments serve as windbreaks. However, aerial survey and telemetry data indicated
that many black ducks continued to use the refuge during the day even when ice cover in the
impoundments made open tidal water outside the refuge a more favorable habitat. l suggest
that disturbance levels outside the refuge are high enough during the day to force black ducks
into this pattern of nocturnal feeding and diurnal resting; black ducks observed in the
saltmarsh during the day spent at least twice as much time on alert (p<.05, Table 15) as black
ducks in other habitats and only 27% of undisturbed flocks occurred outside the refuge.
Mendall (1949) similarly found evidence that black ducks in Maine changed their diurnal
foraging cycle to one dominated by nocturnal feeding in response to fall hunting pressure.
The impact of disturbance on black ducks was both in energy expended and in energy intake.
The mean hourly rate of energy expenditure (HEE) for disturbed flocks (6.78 kcal/bird/hr,
SE=0.44, $<' temperature=5.6°C) approximated the HEE for undisturbed flocks; however, 47%
of disturbed flocks flushed, a behavior that expends 5-6 times more calories per unit time than
any other behavior. Korschgen et al. (1985) estimated that staging canvasbacks flew at least
4.43 min/incidenf when disturbed by boats on the upper Mississippi River. Additionally,
feeding was severely curtailed by other behaviors such as alert and modes of locomotion,
presumably resulting in a net loss in energy intake. If disturbance occurred frequently
enough, the physiological condition of black ducks wintering in the Chincoteague area could
be impaired. Owen and Reinecke (1977) similarly suggested that human disturbance could
negatively affect waterfowl on their breeding grounds.
Management recommendations
Evidence suggests that black ducks undergo their morning flights from the saltmarsh to the
Chincoteague National Wildlife Refuge to avoid disturbance from commercial oystermen and
Tlme and Energy Budgets 71

tishermen, recreational hunters, and automobile and boat traffic. Day-night patterns of habitat
use (from telemetry data) provide circumstantial evidence that black ducks were avoiding the
saltmarsh during the day. These results suggest that disturbance levels in the refuge are
currently low enough to compensate for the cost of increased interspecitic agonism exhibited
in refuge pools. However, at some point, increased levels of disturbance within the refuge
may force more black ducks into the saltmarsh during the day where hunting pressure is high.
The proposed master plan for the Chincoteague National Wildlife Refuge includes an option
to make remote sites in the refuge (where black ducks tend to congregate) more accessible
to the public. ln addition, fall and winter visitors will likely increase in number in the future.
Some waterfowl species (mallards, for instance) can habituate to fairly high levels of disturb-
ance, but black ducks tend to respond with flight and a potentially critical loss of feeding time.
At least part of the refuge should be kept free of disturbance; I suggest that Old Fields, Wash
Flats, and the Hook be left relatively inaccessible to visitor traffic. Future investigators of
disturbance should attempt to further characterize (i.e., quantify) sources of disturbance and
document the frequency of those disturbances.
Literature Cited
Albright, J.J., R.B. Owen, Jr., and P.O. Corr. 1983. The effects of winter weather on the be-
havior and energy reserves of black ducks in Maine. Trans. Northeast Sect., The Wildl.
Soc. 40:118-128.
Altmann, J. 1974. Observational study of behavior: sampling methods. Behaviour 49:227-267.
Anderson, M.G. and B.D. Batt. 1983. Workshop on the ecology of wintering waterfowl. Wildl.
Soc. Bull. 11:22-24.
Time and Energy Budgets 72

Bellrose, F.C. 1976. Ducks, geese, and swans of North America. Stackpole Books,
Harrisburg, PA. 544pp.
Brodsky, L.M. and P.J. Weatherhead. 1984. Behavioral thermoregulation in wintering black
ducks: roosting and resting. Can. J. Zool. 62:1223-1226.
Brodsky, L.M. and P.J. Weatherhead. 1985a. Time and energy constraints on courtship in
wintering American black ducks. Condor 87:33-36.
Brodsky, L.M. and P.J. Weatherhead. 1985b. Variability in behavioral response of wintering
black ducks to increased energy demands. Can. J. Zool. 63:1657-1662.
Goudie, R.l. and C.D. Ankney. 1986. Body size, activity budgets, and diets of sea ducks win-
tering in Newfoundland. Ecology 67(6):1475-1482.
Grandy, J.W. 1972. Winter ecology of maritime black ducks (A. rubripes) in Massachusetts,
with special reference to Nauset Marsh, Orleans, and Eastham. PhD dissertation, U. of
Massachusetts. 111pp.
Hartman, F.E. 1963. Estuarine wintering habitat for black ducks. J. Wildl. Manage. 27:339-347.
Condor 86:251-257.
Herbers, J.M. 1981. Time resources and laziness in animals. Oecologia (Berl) 49:252-262.
Hickey, T.E. and R.D. Titman. 1983. Diurnal activity budgets of black ducks during their annual
cycle in Prince Edward Island. Can. J. Zool. 61(4):743-749.
Jorde, D.G. 1986. Nutritional and thermodynamic aspects of the ecology of black ducks win-
tering in Maine. PhD dissertation. U. of Maine, Orono, ME. 114pp.
Korschgen, C.E., L.S. George, and W.L. Green. 1985. Disturbance of diving ducks by boaters
on a migrational staging area. Wildl. Soc. Bull. 13:290-296.
Lack, D. 1968. Bird migration and natural selection. Oikos 19:1-9.
Lewis, J.C. and R.L. Garrison. 1984. Habitat suitability index models: American black duck
(wintering). National Coastal Ecosystems Team, Div. Biological Services, Research and
Development, U.S. Fish and Wildlife Service. FWS/OBS-82/10.68. 16pp.
Mendall, H.L. 1949. Food habits in relation to black duck management in Maine. J. Wildl.
Manage. 13(1):64-101.
'I’ime and Energy Budgets 73

Miller, M.R. 1985. Time budgets of northern pintails wintering in the Sacramento Valley,
California. Wildfowl 36:53-64.
National Oceanic and Atmospheric Administration. 1985. Tide tables 1985. High and low
water predictions. East coast of North and South America, including Greenland. NOAA,
U.S. Dept. of Commerce. 285pp.
National Oceanic and Atmospheric Administration. 1986. Tide tables 1986. High and low
water predictions. East coast of North and South America, including Greenland. NOAA,
U.S. Dept. of Commerce. 285pp.
National Oceanic and Atmospheric Administration. 1987. Tide tables 1987. High and low
water predictions. East coast of North and South America, including Greenland. NOAA,
U.S. Dept. of Commerce. 285pp.
Owen, R.B., Jr. and K.J. Reinecke. 1979. Bioenergetics of breeding dabbling ducks. Pp.
103-118 IN T.A. Bookhout (ed.). Waterfowl and wetlands - an integrated review. La
Crosse Printing Co., Inc., La Crosse, WI. 152pp.
SAS Institute, inc. 1984. SAS/ETS User’s Guide, version 5 edition. Gary, NC. 738pp.
Steiner, A.J. 1984. Mid-Winter Waterfowl Inventory, Atlantic Flyway, 1954-1984 trend analysis.
U.S. Fish and Wildlife Service, Newton Corner, Massachusetts. 300pp.
Swanson, G.A. and A.B. Sargeant. 1972. Observation of nighttime feeding behavior ol ducks.
J. Wildl. Manage. 36(3):959-961.
Tamasier, A. 1976. Diurnal activities of green-winged teal and pintail wintering in Louisiana.
Wildfowl 27:19-32.
Weathers, W.W., W.A. Buttemer, A.M. Hayworth, and K.A. Nagy. 1984. An evaluation of
time-budget estimates of daily energy expenditure in birds. Auk 101:459-472.
Wooley, J.B., Jr. 1976. Energy expenditure of the black duck under controlled and free-living
conditions. MS thesis, U. of Maine, Orono, ME. 106pp.
Time and Energy Budgets 74

6·¤E*6>.
EU!
=
6
5-C
gLU
ä
¤
8
E
=
2
‘”
2
2
‘°
Eca<
E
E
·~
E
gg
Q
3
2-c
EÜ7
U
•·2
S
‘
x:
t
'
¤
2
ca
83
<
8
¢-
Va
:
vr
°
au
-
°·8
B
o
Y
E
o
Nt
O
‘8
1**
••-
Zg
tb
F
.
°
lg
O
g
••g
g¤·
‘__
D
2
·2
E
uni
>_
N
„,
:
ää
E
°2
·
Q'E
°
°°
6:
'
26
E
2
—92
EZ
§
.
°
cu
"‘
';
co
°
·
=
.,.
Ei
‘“¤
E
5;
o
8
m
"'¤•
—
cn
•-
:
$.2
£
Q
ao
t~
v;
cu
.ö>
.-
rg
··:
g
3
$2*
„
·‘2
S
r:
GG
‘¤
g
Q
E
,*1
Sg
ä
Q
•
ln
·
{
•C
c
äo
6
2
$3
"
"
o
°
c
·
o
·¤
gs
··
·‘2
§
.1:
{B
N
·-
6
o
-
ea
cu
6·-
2
·2
==
Ä
·=·
"•T•'
cg
S
nv-
'”
é
".°é
r~
°°
U
E
;
g*
~¤
(D
V
0
Q
E
1-
N
S
3
¤..
**7
ca
°
o
¤¤
'
E
"*
„ä
·—
‘
·»
E8
2
E„
2
E2
N4!
r~
°·<r
M
E
¢*
85
°'3
‘*
·
„.
N
Mg
·
2
0
:
1:
·
>
¤
‘
,5:
"
o
E
„-o
·‘2*
¤
¤-
an
•¤
S
,%*6
·
=
T6
¤>
.
2
*77
P?8
··
EE
E
Z
¤.
8
„g
=
E
26
T6
‘°
v'
>
n.
'U
Q
E
A-
88
,_-3
__
3
‘;
26
22
28
2
2
I-
•¤O
ua
¢
an
cu
g
U
D
.¤
ö
0*)
'D
g
:s
c:Q
E
E
g
‘°E
g
9
E8
Ö
"’
„_
0
°
2
I-
0
N
cd
:
6
‘
'··¤
¤>
s=°°
***8
°ö
6
2,
2
:3
*°·"
o6"’
¤
ug
«»
EZ
m
¤><¤2
!'>-· ä9
76

232
2
SE
ä
2.
*6
<
§¢
¤
S12
dä
I
3
V"
S
Q
-§
3
U
E
ÖG
°6
5:
¢‘§
..
1:
3
·
N
•2
5;
eg
<
Ih
Ü
gg
<
'd6
dg
>
2
ß.
N
«-v-
2
§6
‘ö—
-dä
‘8;
6
u
3
ci
6_
„
E
'-
G
Q
G1
-
Ög
df}E
5
·ä.,d
§
°’§d
ä
‘
§„d
¤
·§..d
ä
-3
i
°'.
gq
eg
ß
q.8
6>
Ia
ä
1%
·6
..d§
·2
„d
¤
°’§
8
6·~
3
dd
“"”"
Q
ep
„
F
.8
Ö
E
°**
"§
gä
ää
°§
dg
°
2
a
2
«¤
6”
•¤
2.-
s
g
2
·2..d
"~‘F
·;..d
§
-3
2
-
3
dä
dä
dg
3
2
¤.-
:
Su
lg
w
$„,°8
«¤
S.
gg
g
.w
dg
.3
dä
9
2
W
V
°""
r~=
·>
"
m
¤.
-6...
-—
dd
6
63
6
6
ss
38
ö’d
°“°
*‘
=·=
'dä
2
-*6J;
¤•
6
ä
6<~·
dd
Q
:;“
2dg
ä'ä
§
ä·=
·”§
·=¤
.g•¤
;§··
Bw
'
3
„-'8
--
2:
ae
6
§
.3
6,,
.3
dä·
E2
35
-·§
dä
"'3
dä
Ԥ
2
~,=
Ev
12
.;
.=
Q.,
¢D
1-
*,9
E"
6
.«
6•¤
‘°ä
6
216
äv
un
"°"
*8
r~
·°
§
äz
.6
·2
-d
§.,·
2.,,d
-ä
6g
E5
dg
.;¤6
g,
C;
-¤.¤
=‘
==
Q
Oc
6.
··
-¤
~
6
*°=¤ci
°
••"'
cw
d
-v
6N
do
8
an
nn
,.
v~
6.,,
l|
gz
ga
.2
dg
dt!
6
2.-2
og
”"’
a
¢•·
0**
,..
E
g
ég
.w
d
B:
e:
*6
In
S
E
*3
5;
s-
Q
·
cE
¤-_¤
u
cu
«-Sg
5
gu
ga
ää
-2
ä
§
·ä
.„d
§,
2ä
E:
*2
21T
2
‘"
dä
·2
Ԥԡ6
Ep,
-¤-ng
;
"‘··
Eä
ä
ag
**3
;;
d§
03
2
-5
Bs:
||-·•--3
;
JL
r—
Ö
g<
gn
ug
g-E
d
.-In
E
N
mzä
z
.26
3
*;*22
.
3
g<
3<
2d.=,—
·l22
2-::
*6.6-E
gw
we
gg
-
·<
gS
!;"
·¤
$Q
°**~
«2
-E
•=
1?
,·5;6
22
;
Eiä
äg
lj
.·=‘¤
>'°‘•=
·—
3ä
E=
2
Ü
U.!
•'¤
<°°¤
**u
.n
¤>
·¤o
<¤
¤
Id.:-—
22
d2=
2
igä
eva
22,622
we
e;
éegeg
-IZ
<"
22
22
IÜS
E
äg
äg
ä
"’
ä=
·¤.S
'j
22
22
;
2:,2
;.dg
F22
E3
nl- B
.
V
76

uf
C•••°_
c
gä
§ä
„-§
><
'•
Q-
5
'·
88
Eo
5
,,,-
¤1:
c
N=
•-
s6
ä2
Q—
EQQ
2‘
·S
Q§§
Ei
E
°‘
aa
G-
"¤
bl
<8
3„-
Q
2·
·Q
8§
§E
E
'·
Y
6Ü
Q
.E_
2
„,
sE
8Q
•.3
2
Q3
Q8
2g
F3·~
¤
g
°·
QE
Q2
-¤h
oz~
•··
2Q
S2
äg
·~„
Q
g¤
o
Q-8
J·E
'”¤=
§Ä
2ä
E$2
„-,.
$$2
n°
Q"Z
GQ
NE
"
4:
‘·
Q0*5
Ex
E"'
„Q
Ss
Eg
Qw
s
2·
·~
Qä
EE
=
um
2E
gs
Ö
E‘“
§¤~
2Q
Q.
8Q
ä-
25
E
”‘
.U
m
E
3**
:17;
S';
gä
so
o
·Q
ng
„-$2
goU
gn,
Ea:
*5Q‘=
SS
Ev-
Q,5
c
bm
¤.2
za·-
22Q
.8Q
Üä
·°*Q
S3
gH
g
•¤'°'
‘$°3
Q3
SC
cm
uu-·-
o=
Sg
:IY
*·_O
m‘”
—¤·E‘
0Y
—·¤
mu
¤.O
1:·
U_C
,.,2Q
¤.0
::0
UI-¤
¤'ll.!
EQ.
NN
"
V)'·‘·'
Eaa
Qi!
Gm
ggth
_|l}-
am
¢\.
-2
äs
Ihn
-
"Eul
$.35
22Q
2=
93
ac
|·l-O
l"U
)-|I-Z
LuO
—|
(Z<
Ec
°‘°-
Ü:§
¤<
3F
77

Q¤S0
EE
E-96
§·-
.6
,,,*-2.2,;
caN
.6
5N
SS
lgM
?23
¤¤"
Ö6
-8
é'2
gi3
3
338%
..
N.
Qc_
_
%E
"N
·§„.;fg
::
6g
g!
~N
gg
gq
Ü
N@
Q-
g
,,,2
·6
8E
N-2
;%ӊ
0
IN
Q"
.·=
E
tg
G
NE
.:g
d
QW
Q-
Q
•-•}
.
za;-
cmQ
S
s.
88
Q°'
N
00
-·
9
'Ö
8Q
§8
sx
Oc;
°Ö
C1
-
UE
-Ö
02
_9¤‘>
8Ö
U)
•-•O
L
6·
<=S6
S..,
38
56
Y-°
'Ö
§Q
‘°9
0
Q,9
.Ö
cf
QE
EE
'-Ö
ai
QN
N
EX
.:"
6-
ÖQ
RQ
¤_g
5·
·6
w'Nv
66=¤
E
In
8 56<—·
N.'
°2
Q:
E9
Ö
‘·‘·~·8
N-eo
Ö
GJ><
:9.
‘Ö
8cu
N
"’
•'*;;
¤„g
.ca
0Ö
Sr-·
¢¤
*'—
a
_§2
‘Q
8g
Nsf;
6;
(AN
FQ
gn‘_
=
:J‘_
•-•,_
C
•gn
gp
-G
ig
'1-
,.va
1-
O5
.;:g
w-
2.6
.·
Nm
.¤,_
\n
g
F
N
1
=S=‘-.:.2
N,
°’S
882
25
>~;?·‘
83
s.·NN
E6”‘
28
E:
‘Ö
ÖQ
hlÖ
EE
V.1:;:
°“
-6
‘Ö
3Q
0N
.-"·'·¤
gw6
·6
=¤<>u
Q:
ÜN
Q]
(D
¤¤•,,
NN
—°’
••°
u-
mo
"'-
•-8
QN
1-
gg
¤L
n
ug
‘Ö
Ö
oS
mB
0)
32
•-·'
Öä
Ög
+'ö
"3‘
N-vr
.·
,9E
EII
'V
"
3M
Q-
g'
~N-
vew
g5
66"*
.8
_¤.
F:
¤E
I0
;
NE
Uv-
NÖ
¤-
•'
0¤
.•-•··
Ö"
_N
'¤
***2
NÖ
cneo
0—
Ecc;
0
.Ö
hl
Ö0
¤„_
5:1
Ä
“°’Q
“E
0¤."ö
B"
2
'"°
°';:,.:
xn.
8*3§
_ä
.82
2*6$2
S6
2·¤
8
¤‘
gé
vz.
¤>°
:¤.
U"Q
u.:O
_;·¤
0"?
:-9
¤•
Iu.:
°·
5:0
5*
°·‘.::
N
QE
LUÜ
Q—
•-•
uß
Izu
·¤ca
0
6
6.‘°
:
0
:"‘
°',-2
zää
„,
°·’·;8.‘3
lg:
NN
:
D_
'
8•.\0
N
Po
U-
I
5‘¤
__
,•-·0
Wo
50
_,M
26
::6.93
ex°
<°‘
<m
*6W
Q.?
·¤<¤
°-<
•->
„—-
0*-
U}E
Q
Q-¢
¤.g
..„
N-
(ä
ng
.,n
g
*"E
6g
x<
6w
u.1I
"*5
2,
•·.
78

Table 17. Pr¤portionaI’ day and night use of three habltats byblack ducks wlntering at Chlncoteague, Virginia, -15 December 1985 - 28 February 1986. ~
HABITAT DAY (n = 753) NIGHT (n =689)
Refuge pool .519 .110
Saltmarsh .396 .595l
Tidal water .085 .295
’Based on 1442 radio locations for 21 female black ducks.
79

Table 18. Noctumal tlme budgets for black ducks win-tering at Chincoteague, Virginia, November-March 1985and 1986.
Feed .442 _ .052
Rest .267 .048
Stand .002 .002
Walk .023 .009’
Swim .236 .040
Fly .002 .002‘
Comfort .022 .006
Alert .005 .003
Courtship .000 .000
Agonistic .000 .000
‘Arithmetic means based on 47 scans from 5 ilocks intidal water, 1 tlock in saltmarsh, and 1 tlock in ref-uge poolhabitats.so

0.9
B:
Q.
_
I·
E
-O
§§
§N
cn
2Q
--
.8
6.2
<’
„
E°
·
S¤
ä..
äé
‘°*'
1-2
S0
.3
88
E2
sa2
8
,._
G}-=
"3
S*1
8*5
82.
61:
‘¤
0O
-·
Q•—
cl
N
2E
68
22
2{
8·
-.
.2
2'U
2:
E_z~
3$
··¤¤
‘°
E¤·
·<Q
'EB
2.
·äE
CE
g
1:.-
·g
sE
E3E5
v8
cn1*
c.
--
28
2N
C
88
Qx
anJ;
EQ
§C>
r~E
•··E
Q.2
'•-
S*8
"8
.6C,
E
§6
8_
¤
"E
¤•·E2
OE
Qln
C)
Q...
E¤<
*<8
83
28
88
vi•
'D•
0gg2
g2
22
8C
Pu
‘·
QN
O2
g_·¤°
E
··ä8
EC
gL';
IhQ
·—.
··¤¤·—
.9=
EQ
!C
tzCh
o"
oO
5
‘äQ
¤·W
EU)
*6
Q?
:
•.d
l
dg
-¤‘°
•'Ez
<-=
.
gg
,<
,,¤¤
.9:
ggE
<¤E
2SS
·_zD
II<
IIG
"I
gZ
.
81

Table 20. Dlstrlbutlon‘ of lntraspeclllc and lnterspeciflc agonlstlc encounterswlth black duck: wlnterlng In three habltats at Chlncoteague, Vlrglnla,November-March 1985 and 1986.
SPECIES REFUGE POOL TIDAL WAT€R SALTMARSH
Black duck 114 9 13
Mallard 11 1 0
Canada goose 1 0 0
Gadwall 1 0 0
Hooded merganser 0 0 1
man _ E iö TZ
‘Based on 80,988, 6,710, and 14,135 observations of black ducks in refuge pool,tidal water, and saltmarsh habitats, respectlvely.
82

Table 21. Comparlson of dlumal tlme budgets (lnhours) for black ducks wlnterlng In Maine and Virglnla.
Feed 4.54’ 4.49
Rest 3.80 ' 4.54
Stand 1.07 0.08
Walk 0.03 0.13
_ Swim 2.66 1.83
Fly 0.01 0.07
Comfort 0.27 1.07
Alert 0.01 0.15l
Courtship 0.00 0.02
Agonlstlc 0.00 0.02
Total‘Data
from Albright et al. (1983) at 5°C.
'Behavioral data from Table 14; behaviors areweighted by dlurnal habitat use data from Table 17.
'Proportlons converted to hours spent ln each behav-lor out of a 12.4hr day.
83

II
•
Ij
I3
¤
:
3 §:
IL=
III
;5
J1
..
//
:§
.
-¤
„•°°
°
\
äuv:
f:
*1:
:
.
Q
°‘•··
/
¤
gs
/
_•'
-
IL-g
g
//
’G
gg
.=
S
1
·
‘é'ES
·‘
\
I:··E
-·
5..
•
ßa
\
•-G
2
;
äa
S
z
„é‘
2_
2;
SN
IQB
6QV
fg
3:}NO
6E
gg
Ua
°
:5
O
¤·-
dOg
EF
dN
••
Vgw
84

IEE
„,.2
I!I
.2
*2E
II
EI
\"
E
u.$
‘°
I\
Eß
O
2.
g22
\s
—§§
:"G
\ää
‘22
uaE
5
·E
3°
33
33
33
33
E)N
ICI33:I
NO
|.I.I:IOdO
Hd
NVBW
I
85

2E2‘
G.¢
II
Eun
S
1iI
12
22
2\
21
32°
>-"ö
„
I.
E==
2%„
\‘
_/=
Eäg8
6
\E
äg
\;.2%
AE?SI2;
/5
\Q
ga°
<Ü
%2E2I
22
2.2
AE)NIG33:I
NO|.LHOdOHdnvaw
86

CHAPTER 3

Carcass Composition
ABSTRACT: Sixty-four American black ducks (Anas rubripes) were collected during early,
mid, and late winter at Chincoteague, Virginia, in 1985-86. Whole carcass analysis indicated
that black ducks were at least as fat and heavy in the spring as they were in the fall. Com-
parisons with similar work in Maine suggested that black ducks experience a negative energy
balance after mid·winter, the extent of which may be determined by the severity ofthe winter.
Regression models were derived from body weight and external measurements to predict
physiological condition of live black ducks (R’=0.63).
Carcass Composition 88

Introduction
American black duck (Anas rubripes) populations wintering along the Atlantic Flyway, as de-
termined by annual Mid-Winter Waterfowl lnventories, have declined almost 50% since 1954
(Steiner 1984). This represents an annual rate of decline of almost 2% for the past three
decades. The black duck, which has historically ranked first in the Atlantic Flyway harvest, is
now third behind the mallard (Anas platyrhynchos) and the wood duck (Aix sponsa; Blandin
1982).
Excessive harvest (Geis et al. 1971, Grandy 1983), habitat loss (Spencer 1981), changes in food
availability (Perry and Obrecht 1983), pesticides (Heath l969, Longcore and Samson 1976), acid
precipitation (Hansen 1987), and hybridization with mallards (Johnsgard and DiSilvestro 1976)
have all been implicated as factors contributing to this decline. Recently, attention has been
directed towards the dynamics of waterfowl populations on their wintering grounds (see, for
instance, the 1982 Workshop on the Ecology of Wintering Waterfowl and the 1984 Symposium
on Wintering Waterfowl). Fretwell (1972) argued that environmental factors outside the
breeding season were crucial in regulating populations of migratory waterfowl species, and
recent studies have indicated that the condition of waterfowl leaving the wintering grounds
strongly influences reproductive success during the subsequent spring (Ankney and Maclnnes
1978, Krapu 1981).
Physiological condition of homeotherms is considered to be a direct function of total body fat
relative to body size. Body fat represents efficiently stored energy. It has twice the caloric
density of protein (Ricklefs 1974) and only 0.2-0.3 grams of fat per gram of nonfat tissue is
needed to maintain functional homeostasis in birds (Odum et al. 1964). Fat levels in birds can
vary from as little as 2% of the body weight of starving cockerels to more than 40% of the
body weight in premigratory passerines (Griminger 1976). In black ducks, mean fat levels vary
Carcass Composition 89

from 4% to 16% of wet body weights of postlaying females and premigratory females, re-
spectively (Reinecke et al. 1982).
Fat levels in waterfowl are generally assessed by ether extraction of plucked, dried,
homogenized, whole carcasses. Results are expressed as percent fat or as grams of fat per
bird. Although whole carcass analysis has been conducted in several waterfowl species,
black duck carcass composition has been investigated only once, in Maine (Reinecke et al.
1982). Clearly, more studies of endogenous energy reserves in black ducks are needed. The
Workshop on the Ecology of Wintering Waterfowl (1982) specitically addressed Iatitudinal var-
iation in fat reserves and maintenance of fat reserves over winter as important research
needs.
Several researchers have investigated indices for assessing the physiological condition of
waterfowl in the tield. Total body weight is generally expressed in some allometric relation-
ship with external physical measurements (to account for individual differences in body size)
and correlated with either total body fat or a fat index. Alternatively, weights of various fat
depots (e.g., subcutaneous, omental, visceral) can be correlated to body fat. Harris (1970)
used keel and culmen Iengths when correcting for body size variation in blue—winged teal
(Anas discors). Owen and Cook (1977) used the body weight to wing length ratio as a condition
index for mallards. Woodall (1978) used omental fat as an indicator of condition in red—billed
teal. Bailey (1979) evaluated the relationships of body weight, skin weight, several fat depots,
and bill, culmen, keel, and total Iengths to total body fat in the redhead duck (Aythya
americana). Chappel and Titman (1983) used body weight, whole skin, plucked skin, various
fat depots, and body length as condition indices for the greater (Aythya aftinis) and lesser
scaups (Aythya marila). Various condition indices also were used by Whyte and Bolen (1984)
and Ringelman and Szymczak (1985) to assess total body fat in mallards.
Other researchers have used blood characteristics as indicators of physiological stress.
Harris (1970) found that plasma free fatty acids, glucose, and nonprotein nitrogen were related
Carcass Composition 90

to weight loss in incubating blue-winged teal. Korschgen (1977) showed that hematocrit per-
centages and levels of total plasma protein and free fatty acids were indicative of degenera-
tive changes in breeding common eiders (Somateria mollissima). Blood glucose, uric acid,
and urea in green-winged teal (Anas crecca) were found by Bennet and Bolen (1978) to be
correlated to certain weather variables in winter. However, blood characteristics were not
correlated with total body fat or body protein.
In waterfowl, labile protein in the gizzard and flight muscles may constitute a source of
endogenous energy. Gizzards lose weight in waterfowl during nesting (Keith 1981, Korschgen
1977, Reinecke et al. 1982), and flight muscles lose weight during wing molt (Korschgen 1977,
Ankney 1979, Bailey 1985, Raveling 1979, Reinecke et al. 1982) and during the winter.
Korschgen (1977) attributed these weight Iosses to active protein mobilization but Ankney
(1977) believed atrophy due to disuse to be responsible. Work by Jones and Ward (1978) on
the red-billed quelea (Quelea quelea) and by Bailey (1985) on redhead ducks indicated that
at least some of the gizzard and pectoral muscle weight Iosses are due to active mobilization
of endogenous protein.
The purpose of this study was to investigate the body composition of black ducks wintering in
tidal Virginia. Objectives were to estimate changes in body fat and protein over the winter,
and to compare body composition of black ducks wintering in Virginia with that of black ducks
wintering in Maine. Indices for assessing the physiological condition of black ducks also were
investigated; these were based on weight, external structural measurements, and blood
characteristics.
Carcass Composition 91

Study area
In addition to investigations of body composition, habitat use and behavior of wintering black
ducks were concurrently studied on 25,600 ha on Virginia’s Eastern Shore of the Delmarva
peninsula. At least 3000 black ducks wintered on the study area. This area included the
Chincoteague National Wildlife Refuge and was composed of 25% upland, 21% open tidal
(21m deep at mean low tide) water, 21% subtidal (< 1m deep at mean low tide) water, 18%
saltmarsh, 5% tidal flat, 4% brackish impoundment, 2% natural pool, 1% shrub wetland, 1%
freshwater stream, and < 1% other habitats.
Since at least 1977, Chincoteague NWR personnel have conducted weekly ground counts of
waterfowl in refuge impoundments. Refuge counts of black ducks from the 1985-86 winter
were compared with mean refuge counts for the previous nine years. The winter of 1985-86
was typical with respect to total number of wintering black ducks but atypical with respect to
timing of peak fall migration; excluding an apparent migration pulse in early November, it
appeared that black ducks arrived at Chincoteague later in the fall of 1985-86 than was usual.
Mean monthly temperatures, monitored at the Wallops island NOAA station, were 3.5° F and
8.0° F above normal for October and November, respectively, but were normal during
December-February.
Carcass Compositlon 92

Methods
Field techniques
Sixty-four black ducks were collected during early (12 October-11 November), mid (16-30 De-
cember), and late (31 January-13 February) winter in 1985-86; at least one month separated
each sampling period. Black duck carcasses were collected from all major habltat types
during all hours of the day; 2 ducks were collected at night. Body weight and wing length data
also were obtained for black ducks trapped by Patuxent Wildlife Research Center (WRC) and
Chincoteague National Wildlife Refuge (NWR) personnel at Chincoteague. These two trapping
efforts coincided with the mid and late carcass sampling periods, respectively.
Ducks were sexed, aged, weighed to the nearest 10 g, tagged, and double-bagged in plastic.
Blood samples were obtained from 44 of these ducks. Ducks were decapitated in the field and
the blood was drained through heparinized funnels into heparinized tubes. Packed cell vol-
ume and total plasma nitrogen were determined at the Chincoteague field station.
Laboratory techniques
Efforts were made to make carcass analysis procedures comparable with the work done by
Reinecke et al. (1982) in Maine. ln the laboratory, each bird was reweighed to the nearest 0.5
g and partially thawed at room temperature for 4-6 hours. The cloaca was reexamined to
verify sex and age. The following morphological features were measured with a micrometer
(keel and wing to 1.0 mm; all others to 0.1 mm):
Carcass Composition 93

1) Culmen length. This is the length of the upper mandible along the dorsal median line
from the tip of the nail to the "V" of the feathers on the forehead (Harris 1970, Chappel
and Titman 1983).
2) Bill length. This is the length of the upper mandible from the gape to the tip of the
nail (Ringelman and Szymczak 1985).
3) Keel length. This is the dorsal length of the keel from the anterior to posterior end
(Albright 1981).
4) Wing length. This is the length of the straightened and flattened wing from the
proximal end of the carpo-metacarpus to the tip of the Iongest primary (Ringelman and
Szymczak 1985).
5) Tarsus length. This is the length of the tarsometatarsus from the proximal to the
distal end (Albright 1981).
6) Bill width. This is the width of the bill at its widest point (generally, this was at the
point where the bill forms a ”spatula").
7) Head width. This is the width of the head at the squamosals.
The carcass was then plucked, and bill, tarsi, liver (for heavy metal analysis), and the entire
gastrointestinal tract were removed; mesentary fat was stripped from the viscera and returned
to the carcass. The breast was incised and the flight muscles (i.e., pectoralis,
supracoracoideus, and coracobrachialis) on the left side of the sternum were removed (Owen
and Cook 1977). Wet weights of the flight muscles, emptied gizzard, and liver were obtained
after returning external fat to the carcass. The remaining carcass, gizzard, and flight muscles
were combined and weighed to the nearest gram to obtain wet carcass weight.
Carcass Composition 94

Carcass components were sectioned and frozen prior to freeze-drying; dry weights ofthe flight
muscles, gizzard, and liver were obtained after freeze·drying for at least 48 h. Carcass com-
ponents (excluding the liver) were then pooled, ground with a commercial Waring blender, and
the homogenate refreeze-dried for 24 h. The homogenate was weighed to the nearest grnm
to obtain dry carcass weight.
Prior to fat extraction, the homogenate was ground again and freeze-dried for another 12 h to
remove moisture absorbed during the second grinding. Fat in two 7-10 g samples/bird were
extracted for at least 12 h using ethyl ether in a Soxhlet apparatus after oven—drying the rep-
Iicates at 55° C for 12 h. A 2 g sample from the carcass homogenate was analyzed for percent
protein using the Kjeldahl nitrogen process at the Forage Testing Laboratory at Virginia
Polytechnic Institute and State University. A 1-2 g sample of the homogenate was combusted
in a muffle furnace at 450° C for 12 h to obtain percent ash.
Hepatic concentrations of lead, cadmium, zinc, and copper were determined with an Instru-
mentation Laboratories Model 351 atomic absorption spectrophotometer following the proce-
dures outlined by Di Guilio (1982); however, 5% HNO, was used for dissolution of the ash.
X-ray radiographs of gizzard contents were examined for ingested lead pellets (Montalbano
and Hines 197_). Esophagi and proventriculi contents were freeze-dried and sorted into
identiliable groups; aggregate dry weight and aggregate percent were tabulated for each
group (Swanson et al. 1974). Martin and Uhler (1951), Montgomery (1977), Gosner (1978), and
Lee et al. (1980), were used for identification of food items.
Statistical analysis
Fat, protein, and ash levels were reported as both percent ofdried homogenate and as grams
(based on the dry weight of the homogenate). The nonfat dry carcass weight (NFDW) was the
Carcass Composition 95

dry carcass weight minus the weight of the fat. Percent water was calculated from the wet
carcass weight:
([wet wt - dry wt] / wet wt) x 100.
A Lipid Index (LI) was used to assess the physiological condition of carcasses (Johnson et al.
1985, Servello and Kirkpatrick 1987):
Lipid Index = g fat / g nonfat dry wt.
The Lipid Index accounts for individual differences in body size among black ducks. Changes
in LI are proportional to incremental changes in grams fat for a given NFDW; however, percent
fat changes at a decreasing rate as grams fat increases incrementally for a given NFDW. For
regresslon analysis, structural measurements were log-transformed because ofthe allometric
nature of these variables and Ll was converted to In[1 + LI] because this tends to Iinearize
ratlos (Johnson et al. 1985).
A paired t·test indicated a signiücant difference of 5.5 g (SE=1.5) between the field weight and
Iaboratory weight of whole carcasses (T=3.68, P<0.001). This may be due to rounding error
(field weight was measured to nearest 10 g) or dessication; Clark (1979) reported that birds
that have been frozen and sealed in plastic bags typically weigh 2% less than Ilve weight.
For analysis, the wet weight of the esophageal and proventriculus contents (if any) was sub-
tracted from the Iaboratory weight to standardize whole carcass weight.
Paired t-tests suggested no differences between fat replicates (t=·0.09, P=0.931), paired wing
lengths (t=·0.35, P=0.725), or paired tarsi lengths (t=-0,95, P=0.348); therefore, mean values
for all three measurements were used in these analyses. Three-way analysis of variance
(ANOVA) was used to assess the effects of sex, age, and time (i.e., early, mid, and late winter)
Carcass Composltlon 96

on carcass composition; standard errors associated with least square means were used for
model interpretation (Appendices C, D). Pearson correlation procedures were used to
measure the relationships between carcass components. Multiple and simple regression
techniques were used to investigate indices for assessing physiological condition. Signif-
icance was p $0.05 for all statistical inference unless otherwise indicated.
Results
Carcass composition
Pearson correlation procedures were used to correlate carcass components with one another
(Table 22). Whole carcass weight was positlvely correlated with weights of fat, protein, ash,
and water and with percent fat, but not with percent protein, ash, or water, This suggests that
increasing body weight was due to a disproportionate increase in fat over other body com-
ponents.
Grams water was poorly correlated with grams fat but highly related to grams protein, similar
to results reported by Reinecke et al. (1982) for black ducks collected in Maine. Percent water
was highly correlated (r=0.892) with percent protein, grams fat (r=-0.939), percent fat
(r=-0.940), and the Lipid Index (r=-0.928). Percent water has been correlated with both body
fat and body protein in other avian species (Bailey 1979, Child and Marshall 1970, Wishart
1979, Cambell and Leatherland 1980, Chappel and Tltman 1983, and Johnson et al. 1985).
Wet and dry weights of the gizzard, liver, and flight muscle complex were inconsistently cor-
related with other carcass components (Table 22). lt is clear, however, that wet weights of
muscles and organs can change over time without a proportional change in corresponding
Carcass Composition 97

dry weights (Table 23). The mean wet weights of flight muscles and gizzard increased and
decreased, respectively, over the winter but the dry weights remained relatively constant.
Reinecke et al. (1982) found that weights of black duck gizzards and flight muscles varied with
season, but these results could be misleading as wet weights were used. The Iiver ('>E=69.6%,
SE=0.2) and flight muscle complex (x=68.2%, SE=0.6) consisted of proportionately more
water than the whole carcass (x=62.3%, SE=0.5) and gizzard (S<'=63.7%, SE=1.3).
Hematocrit and total plasma nitrogen (TPN) levels did not correlate well with other carcass
components (Table 22).
Effect of sex and age
Soft tlssue body components tended to differ by sex and age. Weights of whole carcass,
nonfat dry carcass, protein, water, wet and dry flight muscles, and wet gizzard were signif-
icantly affected by both sex and age (Table 23). Lipid index, percent protein, percent fat, and
percent water (p=0.06) were different between age classes but not between sexes. Ash lev-
els were not significantly affected by sex and age.
Structural measurements of black ducks were signiticantly different between sexes but gen-
erally not different between ages (Table 23); presumably black ducks have reached skeletal
maturity by autumn, as ash levels would suggest. Wing length, however, signilicantly differed
by age. The shorter wing of juveniles was likely due to excessive wear of the primaries.
Sex and age interacted to affect wet and dry Iiver weights, percent protein, percent fat
(p=0.06), and wing, culmen, and tarsus lengths (Table 23). ln these instances, measurements
ofjuvenile males were not different than those of adult males, whereas measurements ofju-
venile females were signilicantly less than those of adult females.
Carcass Compositlon 98

Changes over winter
Weights of body components and structural size generally did not change over winter (Table
23). Weights of whole carcass, nonfat dry carcass, dry flight muscles, dry gizzard, protein, fat,
water, and ash remained relatively constant. However, wet weights of flight muscles and liver
increased as wet gizzard weight decreased (Tables 23, 24). Percent body fat increased in mid
winter as percent body protein decreased (Tables 23, 25). Cell means (Table 25) suggested
that fat weight and percent changed similarly over the winter; however, standard errors as-
sociated with fat weight were large.
The body composition of males apparently responded differently to conditions on the wintering
grounds than that of females; the Iipid index and percent protein, fat, and water were signif-
icantly affected by the sex‘time interaction (Table 23). Lipid indices for male black ducks did
not differ between age classes or over the winter; mean Ll for males was 0.55 (SE=0.06).
Lipid indices for female ducks, however, differed between ages and over winter (Table 25).
Juvenile females ($<'=0.36, SE=0.05) had signiflcantly lower Ll values than adult females
($<'=0.63, SE=0.05). Both female age classes exhibited a similar response to winter condi-
tions; lipid indices for juvenile and adult females were low in early winter, peaked by mid
winter, and did not diminish by late winter.
Condition index
Linear measurements of bill, culmen, tarsus, wing, and keel lengths, and bill and head width,
were positively correlated with weights of soft tissue components but not with the Lipid Index
(Table 26). All structural components correlated better with nonfat dry carcass weight than
with whole carcass weight, suggesting that use of structural measurements to correct for
morphological variation in black ducks may be justified.
Carcass Composltion 99

Whole carcass weight and linear measurements of tarsus, culmen, wing, keel, head, and bill
were regressed on the Lipid Index and percent fat. For the full data set (n=62; two meas-
urements of head width were missing), body weight accounted for 55% and 49% of the vari-
ation in LI and percent fat, respectively. Wing length explained less than 2% of the variatlon
in either condition index, whereas keel explained 9-10% of the variatlon (Table 27).
Multicollinearity between variables was excesslve (i.e., condition number > 30), suggesting
that predictive equations based on multiple regression techniques would be lnconsistent.
Therefore, weight was divided by each structural measurement to account for morphological
variatlon, and the natural logarithm (ln) of the ratlos were individually regressed on LI using
simple linear regression techniques. Weight alone explained more of the variatlon in percent
fat (R'=0.437) than any ofthe transformed weight-structure ratlos ln the full model. However,
weight/keel accounted for more of the variatlon in Ll (R' =0.545) than weight alone (R' =0.437).
Separate models by sex and age were investigated; neither improved lit appreciably over the
full model. The best models were developed by separatlng adult males from the other three
sex-age classes (i.e., juvenile male, and both female age classes; Table 28). The physiological
condition of adult males (n=23) was best expressed by the regression of weight/bill width
against LI:
Ll = 1.506(ln[wt/bill width]) - 5.600
The physiological condition of all other sex-age classes (n=41) was best expressed by the
regression of weight/keel length against Ll:
LI = 1.357(In[wt/keel length]) - 2.812
Percent water was investigated as a possible indicator of black duck physiological condition
during winter because of its high correlations with Ll and percent fat. Percent water regressed
on LI explained more ofthe variatlon in lipid indices of both adult males and the other sex-age
Carcass Composltion 100

classes than either weight or weight·structure ratios (Table 28). Unlike full models of weight
and weight-structure ratios, the full model (n=64) of percent water appreciably accounted for
much of the variation in LI (R' = 0.8771). This model yielded the following equation:
LI = 3.2708 - 5.907(ln[1 + percent water])
Heavy metals
Mean concentrations of lead and zinc in the Iiver (Table 29) were lower than levels in black
ducks wintering in Chesapeake Bay; Di Giulio (1982) reported mean concentrations (u/ug) of
5.8 and 136.0 for lead and zinc, respectively, in livers of 128 black ducks. Concentrations of
cadmium and copper were consistent with those found in Chesapeake Bay ducks (1.16 and
34.9 ug/g, respectively) except that mean hepatic levels of copper were high in Chincoteague
male juveniles; two carcasses had cupric concentrations of 122.65 and 456.10 ug/g. Di Guilio
(1982) suggested that relatively high dietary levels of copper may be beneticial to waterfowl
inhabiting systems contaminated, to some degree, with toxic metals such as cadmium and
lead.
Two gizzards (3% of sample) contained one lead shot each. In contrast, 18% of 128 black
ducks collected in Chesapeake Bay contained ingested shot (Di Giulio 1982).
Diet
ingested food was found in 40 of 64 black duck carcasses. Animal matter represented 43.4%
of the aggregate dry weight and was found in 37.5% (15) of the digestive tracts. Plant matter
comprised 56.6% of the aggregate weight but was found in 90% (36) of the carcasses. Ag-
gregate weights of both animal and plant matter were highly biased by a few ducks with full
Carcass Compositlon 101

crops of the saltmarsh snail (Melampus bidentatus) and glasswort (Salicornia spp.), respec-
tively (Table 30). ln general, black ducks at Chincoteague appear to have fed on a diversity
of items during the day. However, 34% of the digestive tracts were empty and aggregate dry
weight was only 44.2 g, of which almost 17 g was accounted for by the snail shells. These data
suggest that black ducks were not feeding heavily during the day; presumably, black ducks
at Chincoteague were foraging nocturnally. Two birds collected at night in subtidal water had
been feeding on sea Iettuce (Ulva sp,).
Sarcospuridiosis
One juvenile male, six adult females, and six adult males showed signs of sarcosporidiosis
(19.4%). There was no evidence to suggest that the protozoan affected flight muscle weights
or levels of body fat and protein.
Discussion
Wintering grounds
Owen and Reinecke (1979) proposed that temperate and arctic nesting waterfowl have evolved
four strategies for using endogenous and exogenous sources to meet energy requirements
during reproduction. These strategies are (1) reliance on exogenous energy supplemented
by a small endogenous energy reserve accumulated away from the breeding area, (2) reliance
on exogenous energy supplemented by a small endogenous energy reserve accumulated on
the breeding grounds, (3) reliance on endogenous energy accumulated away from the breed-
ing grounds, and (4) reliance on endogenous energy accumulated on the breeding grounds.
Carcass Composition 102

These authors suggested that black ducks have evolved the first strategy. Reinecke (1982)
found that peak fat levels in the spring occurred in prelaying females, indicating that black
ducks accumulate energy reserves while wintering or migrating.
Data from this study strongly suggest that black ducks were leaving the Chincoteague win-
tering grounds in the spring in as good, if not better, condition as when they arrived there in
the fall; there is no reason to suspect that the winter of 1985-86 was atypical. Female black
ducks were in relatively poor condition in October—November, presumably because juvenile
and postbrooding adult females had insufticient time to accumulate extensive fat stores. Lipid
reserves peaked by late December for both female age classes and were maintained into late
winter. However, juveniles had consistently lower fat levels than adult females throughout the
winter, suggesting that second year (SY) females may be disadvantaged during egg laying.
Owen and Reinecke (1979) pointed out that the deposition of lipids prior to egg laying will not
affect the net energy requirement during egg production, but may be critical in reducing the
exogenous energy requirement to a level within foraglng capabilities.
Data suggested that both juvenile and adult males maintained high levels of fat throughout the
winter. It seems plausible that adult males would begin the winter with high lipid levels after
spending the latter half of the summer primarily foraging. However, there is no reason to
expect the physiological condition of male and female juveniles to differ qualitatively. These
data were more Iikely due to an anomalous sample of juvenile males (n=5) than to the bi-
ological norm. Comparison of this sample with a larger sample of black ducks trapped by
Patuxent WRC and Chincoteague NWR personnel (Table 31) suggested that the wing lengths
of juvenile males used in these analyses were unusually long; other body components may
have been similarly atypical. Juvenile males Iikely would have shown a response similar to
juvenile females had the sample been more representative.
Carcass Compositlon 103

Comparison of Virginia and Maine data
Carcass analysis procedures used in this study were similar to those used by Reinecke et al.
(1982) to lnvestigate carcass composition of female black ducks in Maine. Contrary to their
analysis, however, the Iiver, viscera, tarsi, and bill were excluded from the homogenate in this
study. Reinecke et al. were able to account for 93% of the body weight in their analysis by
summing the slopes of fat, protein, water, and fat regressed on body weight. Using the same
approach, l accounted for only 83% of the body weight in this analysis. Consequently, com-
parisons of absolute values for nonfat dry weight, protein, fat, water, and ash are invalid;
nevertheless, qualitative comparisons can be made.
Although wings of adult females and juvenile males collected in Virginia were signilicantly
longer than those ofducks in Maine (Table 32), black ducks wintering in Virginia generally did
not differ structurally from ducks wintering in Maine. However, female black ducks were ar-
riving on wintering grounds at Chincoteague lighter and with proportionately less fat than
ducks in Maine (Table 33); presumably the caloric cost of migration further depleted energy
reserves.
Black ducks collected at Chincoteague during late January and early February were at least
as heavy and as fat as birds collected in the fall, whereas black ducks collected during the
same period in Maine were in poor condition relative to the fall sample. Carcass condition
peaked by early December in Maine and by late December in Virginia; Reinecke et al. (1982)
reported individuals with as much as 250 g of fat in late fall and several birds at Chincoteague
carried as much as 266 g of fat in late December. It seems likely that black ducks wintering
at both latitudes experienced a negative energy balance after December, the extent of which
was determined by the severity of the winter. Estimates of daily energy expenditure in Maine
(Albright et al. 1983) and in Virginia (Chapter 2) were shown to be similar at a given temper-
ature; however, average winter temperatures are obviously much lower in Maine than in
Carcass Compositlon 104

Virginia. Apparently, the energetic cost of migrating further south is mitigated by the energy
accrued in a milder climate.
There is no evidence to suggest, however, that black ducks wintering further south are able
to maintain these energy reserves during the northward migration. Perhaps the advantage
of migrating is in increased winter survivorship rather than in increased energy reserves
carried to the breeding grounds (i.e., increased reproductive success). Lack (1968) postulated
that migration at high northern Iatitudes evolved when the average mortality among individ-
uals wintering on the breeding grounds is greater than among those wintering in a milder
climate further south. (In 1986, 9,000 and 36,700 black ducks were recorded in Maine and
Virginia, respectively, during the Midwinter Waterfowl Inventory; Serie 1986). Additionally,
hunter harvest may be biased by physiological condition; Greenwood et al. (1986) showed that
mallards in poor condition, as assessed by body weight, were more Iikely to be shot by hunt-
ers than ducks in good condition.
Condition index
A condition index for black ducks has not been investigated previously. However, the U.S.
Fish and Wildlife Service recently completed a study of mortality in wintering black ducks and
assumed that the physiological condition of black ducks could be assessed by the body weight
to wing length ratio (Conroy and Perry 1984). However, Whyte and Bolen (1984) concluded
from an analysis of 634 carcasses that body weight explained only 49% ofthe variation in total
body fat of wintering mallards in Texas; adjusting body weight by wing length yielded only 4%
more predictability of total body fat than did body weight alone. Ringelman and Szymczak
(1985) similarly found that body weight accounted for only 45.7% of the variation in total body
fat of wintering mallards in Colorado. However, using a multiple regression approach, an
additional 18-20% of the variation in total carcass fat was attributable to differences in struc-
tural size as indexed by wing length. At best then, employing body weight and wing length in
Carcass Composition 105

some sort of allometric relationship has only accounted for 53-66% of the variatlon in mallard
carcass fat.
Simple linear regression models (based on weight-structure ratlos) proposed in this study
account for 63% of the variatlon in lipid index (Table 28); the best models were developed by
separating male adults from other sex-age classes. The inclusion of bill width and keel length
as denomlnators accounted for 10 - 17% additional variance in LI over that explained by
weight alone. The regression of the body weight/wing length ratio on lipid index explained
only 44% (adult males) and 59% (other classes) of the variatlon (Table 28). Perhaps wing
length was such a poor indicator of physiological condition in wintering black ducks because
it was the only structural component to differ between ages.
Percent water correlated with LI better than either weight or weight-structure ratlos. However,
the feasibility of assessing the water content of live ducks in the field is uncertain. Johnson
et al. (1985) reviewed three methods for estimating the water content of avian species; the
Child·MarshalI and Campbell-Leatherland methods are based on theoretical considerations
and the percent water method (i.e., the method used in this study) requires sacrificing the bird.
The isotope dilution technique (Schmidt-Nielsen 1979:315) may be used in situations in which
birds can be held overnight. Deuterium or tritium is injected into the animal and allowed to
distribute throughout the body water. The water volume is determined from the isotope con-
centration in the blood water. Assumptions and practical considerations of isotope analysis
were dlscussed by Mullen (1973). The applicability of this technique for field studies of
waterfowl physiology should be investigated.
Carcass Composltion 106

Management recommendations
In the Concept Plan for Preservation of Black Duck Wintering Habitat (U.S. Fish and Wildlife
Service 1986) key wintering areas are identiüed, based on the Mid-Winter Waterfowl Inventory,
in the coastal zones of 13 eastern states. These areas are ranked, by state, using area size,
habitat diversity, black duck population density, total duck population density, other wildlife
uses, and benefits to existing refuges as criteria. The assigned rank is intended to aid state
and federal agencies in prioritizing areas to be set aside for acquisition or, alternatively, for
easement. The area between Assateague Island and Wallops Island, coinciding with the study
area, was ranked first in the state of Virginia. This area was described as "possibIy threat-
ened” and 2950 acres (of 6600 acres) were identified within private holding. Consideration
should be given to acquiring these lands; hepatic concentrations of heavy metals suggest that
black ducks wintering in this area are less contaminated than ducks wintering in Chesapeake
Bay.
Seasonal energy balance of black ducks needs to be given more consideration in
mangagement proposals. Black ducks have been declining at a constant rate for three dec-
ades, suggesting a persistant cause(s) that may be more pervasive than is immediately obvi-
ous; wintering populations of other dabblers have been declining over the same time period
on the Atlantic Flyway (Steiner 1984). Albright (1983) noted that declining regional temper-
atures in the winter correspond well with the decline of wintering black duck populations.
Davis (1986) discussed circumstantial evidence that the cooling trend in the northern hemi-
sphere has affected distributions of some avian species. Given that Jorde and Krohn (1986)
estimated that a 1.0° C change in microclimate temperature can increase daily energy ex-
penditure in black ducks by 15 KJ/bird/day, the equivalent of 429 ingested Gammarus
oceanicus, it seems probable that climatic changes in winter temperature may have an accu-
mulating effect on the condition of waterfowl on their wintering grounds.
Carcass Composition 107
A

Similarly, Albright et al. (1983) suggested that human-induced energy demands such as dis-
turbance need to be considered in management plans. Behavioral data collected at
Chincoteague (Chapter 2) strongly indicate that a disturbance event reduces foraging time
while increasing energy expenditure. As with declining regional temperatures, increasing
rates of human disturbance may be negatively affecting the seasonal energy balance of black
ducks.
Literature cited
Albright, J.J. 1981. Behavioral and physiological responses of coastal-wintering black ducks
(Anas rubripes) to changing weather in Maine.! MS thesis. University of Maine, Orono,
ME. 72pp.
Albright, J.J., R.B. Owen, Jr., and P.O. Corr. 1983. The effects of winter weather on the be-
havior and energy reserves of black ducks in Maine. Trans. Northeast Sect., The Wildl.
Soc. 40:118-128.
Anderson, M.G. and B.D. Batt. 1983. Workshop on the ecology of wintering waterfowl. Wildl.
Soc. Bull. 11:22-24.
Ankney, C.D. 1977. Feeding and digestive organ size in breeding Iesser snow geese. Auk
94:275-282.
Ankney, C.D. 1979. Does the wing molt cause nutritional stress in Iesser snow geese? Auk
96:68-72.‘
Ankney, C.D. and C.D. Macinnes. 1978. Nutrient reserves and reproduction of female Iesser
snow geese. Auk 95:459-471. _
Bailey, R.O. 1979. Methods of estimating total Iipid content in the redhead duck (Aythya
americana) and an evaluation of condition indices. Can. J. Zool. 57:1830-1833.
Carcass Composltion 108

Bailey, R.O. 1985. Protein reserve dynamics in postbreeding adult male redheads. Condor
87:23-32.
Bennet, J.W. and E.G. Bolen. 1978. Stress response in wintering green-winged teal. J. Wildl.
Manage. 42(1):81-86.
Blandin, W.W. 1982. Population characteristics and simulation modelling of black ducks. PhD
dissertation, Clark University. 366pp.
Cambell, R.R. and J.F. Leatherhead. 1980. Estimating body protein and fat from water content
in Iesser snow geese. J. Wildl. Manage. 44:438-446.
Chappel, W.A. and R.D. Titman. 1983. Estimating reserve Iipids in greater scaup (Aythya
marila) and Iesser scaup (A. afünis). Can. J. Zool. 61(1):35-38.
Child, G.l. and S.G. Marshall. 1970. A method of estimating carcass and fat-free weights in
migrant birds from water content of specimens. Condor 72:116-119.
Conroy, M.J. and M.C. Perry. 1984. impact of snow goose feeding in New Jersey salt marshes
on wintering black ducks. Preliminary report, dated 2 July 1984. Patuxent Wildlife Re-
search Center, U.S. Fish and Wildlife Service, Laurel, MD. 22pp.
Davis, M.B. 1986. Climatic instability, time lags, and community disequilibrium. Pages
257-268 IN J. Diamond and T.J. Case (eds.), Community ecology. Harper & Row, Pub-
lishers, Inc., New York, NY. 665pp.
Di Giulio, R.T. 1982. The occurrence and toxicology of heavy metals in Chesapeake Bay
waterfowl. PhD dissertation. Dept. Fisheries and Wildlife Sciences, Virginia Polytechnic
Institute and State University, Blacksburg, VA. 245pp.
Fretwell, S.D. 1972. Populations in a seasonal environment. Monogr. Popul. Biol. 5. 217pp.
Princeton University Press, NJ.
Geis, A.D., R.l. Smith, and J.P. Rogers. 1971. Black duck distribution, harvest characteristics,
and survival. U.S. Fish and Wildlife Service, Special Scientific Report-Wildlife No. 139.
241 pp.
Carcass Composition 109

Gosner, K.L. 1978. A Field Guide to the Atlantic Seashore. lnvertebrates and seaweeds of
the Atlantic coast from the Bay of Fundy to Cape Hatteras. Peterson Field Guide Series,
vol. 24. Houghton Miftlin Co., Boston, MA. 329pp.
Grandy, J.W. 1983. The North American black duck (Anas rubripes): a case study of 28 years
of failure in American wildlife management. lnt. J. Study of Animal Problems
4(4):supplement. 35pp.
Greenwood, H., R.G. Clark, and P.J. Weatherhead. 1986. Condition bias of hunter-shot
mallards (Anas rubripes). Can. J. Zool. 64:599-601.
Griminger, P. 1976. Lipid metabolism. Pages 252-262 IN P.D. Slurkle (ed.), Avian Physiology.
Springer·Verlag, NY, NY. 400pp.
Hansen, P.H. 1987. Acid rain and waterfowl: the case for concern in North America. lzaak
- Walton League of America, Arlington, VA. 39pp.
Harris, H.J., Jr. 1970. Evidence of stress response in breeding blue-winged teal. J. Wlldl.
Manage. 34(4):747·755.
Heath, R.G. 1969. Nationwide resldues of organochlorlne pesticides in wings of mallards and
black ducks. Pestic. Monit. J. 3(2):115-123.
Johnsgard, D.H. and R. DiSilvestro. 1976. Seventy-tive years of changes in mallard-black duck
ratlos ln eastern North America. Birds 30(5):905-908.
Johnson, D.H., G.L. Krapu, K.J. Reinecke, and D.G. Jorde. 1985. An evaluation of condition
lndlces for birds. J. Wildl. Manage. 49(3):569-575.
Jones, P.J. and P. Ward. 1976. The level of reserve protein as the proximate factor controlling
the timing of breeding and clutch-size in the red-bllled quelea, Quelea quelea.
Jorde, D.G. and W.B. Krohn. 1986. Microhabitats of black ducks wintering ln Maine. Research
information bulletin no. 86-94. U.S. Fish and Wildlife Service. 2pp.
Keith, L.B. 1961. A study of waterfowl ecology on small impoundments in southeastern
Alberta. Wildl. Monogr. No. 6.
Krapu, G.L. 1981. The role of nutrient reserves in mallard reproduction. Auk 98:29-38. Cor-
ner, Massachusetts. 300pp.
Carcass Composltlon 110

Korschgen, C.E. 1977. Breeding stress of female eiders in Maine. J. Wildl. Manage.
41:360·373.
Lack, D. 1968. Bird migration and natural selection. Oikos 19:1-9.
Lee, D.S., C.R. Gilbert, C.H. Hocutt, R.E. Jenkins, D.E. McAIlister, and J.R. Stauffer, Jr. 1980.
Atlas of North American freshwater tishes. Publication #1980-12. North Carolina Bi-
ological Survey, North Carolina State Museum of Natural History, Raleigh, NC. 854pp.
Longcore, J.R. and F.B. Samson. 1973. Eggshell breakage by incubating black ducks fed DDE.
J. Wildl. Manage. 37(3):390-394.
Martin, A.C. and F.M. Uhler. 1951. Food of game ducks in the United States and Canada.
Research Report 30. U.S. Fish and Wildlife Service. Wash., D.C. 308pp.
Montalbano, F. and T.C. Hines. 197_. An improved x·ray technique for waterfowl lead
ingestion investigation. Florida Game and Fresh Water Fish Commission. 12pp.
Montgomery, F.H. 1977. Seeds and fruits of plants of eastern Canada and northeastern United
States. University of Toronto Press, Toronto, Canada. 232pp.
Mullen, R.K. 1973. The D,O method of measuring the energy metabolism of free-living ani-
mals. Pp. 32-43 IN J.A. Gessaman (ed.). Ecological energetics of homeotherms. A view
compatible with ecological modeling. Monograph Series vol. 20. Utah State University
Press, Logan, Utah. 155pp.
Odum, E.P., D.T. Rogers, and D.L. Hicks. 1964. Homeostasis of the nonfat components of
migrating birds. Science 143:1037-1039.
Owen, M. and W.A. Cook. 1977. Variations in body weight, wing length and condition of
mallard Anas platyrhynchos platyrhynchos and their relationship to environmental
changes. J. Zool., Lond. 183:377-395.
Owen, R.B., Jr. and K.J. Reinecke. 1979. Bioenergetics of breeding dabbling ducks. Pages
71-94 IN T.A. Bookhout (ed.), Waterfowl and wetlands · an integrated review. Proc.
symposium. 151pp.
Perry, M.C. and H.H. Obrecht. 1983. Food habits and distribution of wintering black ducks in
the Atlantic Flyway (abstract only). Trans. Northeast Sect. Wildl. Soc. 40:130.
Carcass Composition 111

Raveling, D.G. 1979. The annual cycle of body composition of Canada geese with special
reference to control of reproduction. Auk 96:234-252.
Reinecke, K.J., T.L. Stone, and R.B. Owen, Jr. 1982. Seasonal carcass composition and en-
ergy balance of female black ducks in Maine. Condor 84:420-426.
Ricklefs, R.E. 1974. Energetics of reproduction in birds. Pages 152-297 IN R.A. Paynter, Jr.
(ed.). Avian Energetics. Publication No. 15. Nuttall Ornithological Club, Cambridge, MA.
334pp.
Ringelman, J.K. and M.R. Szymczak. 1985. A physiological condition index for wintering
mallards. J. Wildl. Manage. 49(3):564-568.
Schmidt-Nielsen, K. 1979. Animal physiology. Second edition. Cambridge University Press,
Cambridge, UK. 560pp.
Serie, J.R. 1986. Results of the 1986 Midwinter Waterfowl Survey in the Atlantic Flyway states.
Office of Migratory Bird Management, U.S. Fish and Wildlife Service, Laurel, MD. 5pp.
Servello, F.A. and R.L. Kirkpatrick. In press. Fat indices for ruffed grouse. J. Wildl. Manage.
Spencer, H.E. (ed.). 1981. Black duck management plan for North America, 1980-2000. Vol
1. Black Duck Committee, Technical Section, Atlantic Flyway Council. 42pp.
Steiner, A.J. 1984. Mid-Winter Waterfowl Inventory, Atlantic Flyway, 1954-1984 trend analysis.
U.S. Fish and Wildlife Service, Newton Corner, Massachusetts. 300pp.
Swanson, G.A., G.L. Krapu, J.C. Bartonek, J.R. Serie, and D.H. Johnson. 1974. Advantages
in mathematically weighting waterfowl food habits data. J. Wildl. Manage. 38(2):302-307.
U.S. Fish and Wildlife Service. 1985. Concept plan for preservation of black duck wintering
habitat. Atlantic Coast. Priority Category 5. U.S. Dept. Interior, U.S. Fish and Wildlife
Service, Newton Corner, MA.
Wishart, R.A. 1979. Indices of structural size and condition of American wigeon (Anas
americana). Can. J. Zool. 57:2369-2374.
Whyte, R.J. and E.G. Bolen. 1984. Variation in winter fat depots and condition indices of
mallards. J. Wildl. Manage. 48(4):1370-1373.
Carcass Composition 112

Woodall, P.F. 1978. Omental fat: a condition index for red-billed teal. J. Wild!. Manage.
42:188-190.
Carcass Composition 113

In
§ÜO {'—c
Z
(b
g
•~
0.
·|~
g
I-
Nm
g
US
°B
,„
2
nn
°‘°
'S
8
Z
.9
1-rt':
5
'«S
‘5..°
*S
‘
.:
-l
~·g
„·_e
g
cn
.-
0T6°=
Q
••
g,
rcvv
¤¢
v
8
B
'«¤
„
'a";
"¤
···=
··„·-=
—
1-
'c
•¤
GV
G
Ee䤕'S—
·q
1;
"‘^E
u
Vvm
:·n
-··1
-
Qc.
:5%
nn.
U-
eu
$"···<
¤
-¢
Q.;
··
¤.
‘“°
=°¤
•·
2..$2
E
'an
ä
~—
';
EV
U
8
„,·¤
„-S
'
2;°
¤.
vg
¤¤
~=
QN
n:
m-
HgU
p
U-
·£
gg
¤„
Z,„.§
*‘
¤.2
5
3
·<"<·
«s§E
·§"
sags.,
°‘.¤
cr-
¤nE
$$5
-¤,;,
.;
og
g
Ffm
ah
a
1-
‘
HN Nm
E5}:
{ad
E
E3·¤m
¤
ca
ll!
LL
gg
g
0.Q
*·*
0
8*:;.
1
gw
.2*
P5
V:
ni
•-g
k
S
gyn
II(O
gv!
¤<¤
Eä䢤>
E
,5:-
.*
u.
¤,lI___;
Q
—*¤n¤
LL
0;*
n-
:„,~
§
:
B"25
I¤u114
n

Table 23. The effect of age, sex, time, and their lnteractions (ANOVA) on carcass composltion
of black ducks collected at Chincoteague, Virginia, October 1985·February 1986.
Whole carcass (9) .0001’ .0001 .3387 .1503 .4666 .8801 .9487
Nonfat dry carC3S$ (Q) .0001 .0001 .2902 .3916 .8603 .9172 .7358
Dry flight muscles (g) .0578 .0006 .1026 .5077 .6682 .0759 .3267
Wet flight muscles (9) .0001 .0001 .0110 .3625 .5287 .4802 .5491
Dry gizzard (Q) .3097 .0045 .3787 .5253 .5896 .1517 .9990
Wet gizzard (9) .0169 .0303 .0059 .5521 .8670 .9549 .5776
Dry live? (Q) .8377 .0046 .0001 .0010 .0001 .0004 .0008
Wet live? (Q) .8532 .0327 .0001 .0028 .0001 .0027 .0113
Lipid index (fat/NFDW) .0173 .4480 .1985 .1189 .5777 .0531 .8027
Fat (Q) .0054 .0959 .2571 .1812 .5522 .1136 .8166
Fat (%) .0097 .2556 .0507 .0639 .5601 .0350 .6619
Protein (Q) .0081 .0001 .8300 .5105 .6881 .7563 .5856
Protein (%) .0074 .2774 .0403 .0189 .7883 .0491 .4773
Wate? (Q) .0001 .0001 .9773 .4168 .5797 .3137 .7840
Water (%) .0617 .0609 .1046 .1321 .5630 .0514 .6618
Ash (Q) .2876 .2735 .7298 .6354 .3436 .7908 .7742
Ash (%) .8607 .7175 .5192 .4445 .3553 .9320_
.7988
Wing length (mm) .0024 .0001 .6686 .0095 .7037 .8164. .7209
Keel length (mm) .1720 .0001 .7945 .3739 .9350 .4351 .5938
Tarsus length (mm) .2171 .0001 .4096 .0039 .9698 .3978 .8960
Head width (mm) .0908 .0001 .2451 .8362 .3627 .4614 .5386
Bill length (mm) .9175 .0001 .7117 .1111 .6190 .2815 .8857
Bill width (mm) .3743 .®01 .5413 .4395 .8314 .9930 .8589
Culmen length (mm) .8061 .0001 .1502 .0430 .7356 .8259 .6697
'Sample size=64 for all variables except for head width (n=62).
*Carcasses collected during three periods; 12 October·11 November, 16-30 December, and 31
_ January-13 February.
'Probability that F(criticaI) > F(caIculated).
115

Table 24. Arithmetlc means and standard errors of body components (g) of black ducks col-
Iected during early, mid, and late winter at Chincoteague, Virginia.
WINTER' COMPONENT FEMALEAdultJuvenile ~ Adult Juvenile
EARLY n 4 6 8 2
Whole carcass 1182$41' 949$19 1303$48 1171 $69
Nonfat dry carcass 226 $4 196 $3 250 $ 5 235 $4
Dry flight muscle 32$1 28$2 43 $4 44$9
Wet flight muscle 114$2 98 $3 127 $4 120$5
Dry gizzard 12.3$1.7 11.5$1.6 19.5$3.2 20.4 $4.6l
Wet gizzard 43.9 $4.7 38.2 $ 2.4 47.7 $4.1 43.5 $2.7
Dry liver 9.8 $0.2 6.2 $0.6 8.7$1.1 6.3 $0.5
Wet liver 33.1 $0.7 21.4 $2.2 26.9 $2.7 21.9 $ 2.0
MID _n 8 7 4 2
_ Whole carcass 1219 $27 992$31 1322 $48 1180$51
Nonfat dry carcass 225$2 197$6 256$6 236$5
Dry flight muscle 35$1 32$2 40$2 32$1
Wet flight muscle 115$2 101$3 127$2 110$3
Dry gizzard 13.0$0.6 11.3 $0.8 15.2$2.6 15.3 $0.9
Wet gizzard 43.9$1.6 36.6$1.6· 45.3$2.7 45.5$5.3
Dry llver 7.8 $0.4 6.9 $0.7 8.1 $0.6 7.2 $0.2
Wet llver 25.6$1.1 22.5$1.8 27.3$2.0 23.7$1.3
LATE n 6 5 11 1
Whole carcass 1200 $46 1066$14 1311 $23 1234$.
A Nonfat dry carcass 226 $6 209 $3 262 $ 6 243 $.
Dry flight muscle 42$2 32$1 44$2 44$.
Wet flight muscle 121 $4 109$2 133 $4 130$.
Dry gizzard 15.9$1.5 11.4$1.8 16.4 $0.8 13.8$.
Wet gizzard 35.7$1.3 30.0$1.5 41.0$2.2 32.9$.
Dry llver 9.8 $0.8 8.5 $0.5 9.7$0.7 19.5$.
(Wet llver 31.5 $2.3l
29.6 $2.3 31.2$1.9 54.6$.
‘Carcasses (n = 64) collected during three periods in winter 1985-86; 12 October-11 November
(early), 16-30 December(mid), and 31 January·13 February (late).
'Plus or minus one standard error.
116

Table 25. Arlthmetlc means and standard errors ot lat, protein, water, and ash levels ol black
ducks collected during early, mld, and late winter at Chlncoteague, Vlrginla.
WINTER' COMPONENT FEMALEL/|§_
Adult Juvenile · Adult Juvenile
EARLY n 4 848
2
Llpid lndex 0.45$,10' 0.161:.02 0.59$.11 0.58$.31
Fat (Q) 101 $22 32$3 148$29 134$69
Fat (%) 29.9 $4.5 13.8:1:1.1 35.2$3.7 34.1 $12.7
Protein (9) 176$8 161$3 199$4 181 $8
Protein (%) 54.3$3.1 70.6$1.1 51.7$3.0 51.1 $11.1
· Water (9) 595$15 505$9 829$13 560$15
Water (%) 64.7$1.4 68.9 $0.5 61.6$1.6 60.6 $3.6
Ash lg) 491:10 31 1.3 66132 arms
Ash (%) 14.9 $0.8 13.7$1.4 21.6 $7.8 11.3$7.1
MID n 8 7 4 2
Llpid index 0.76 $ .07 0.45 $.06 0.65 $ .13 0.43 $.03
Fat (Q) 170$16 91$14 166$3S 102$5
Fat (%) 42.4$2.5 30.4$3.3 38.2 $4.4 30.2$ 1.4
Protein (Q) 176$4 155$5 198$8 183$4
Protein (%) 45.0$2.2 55.0$2.8 47.9$3.8 54.0$1.0
Water (Q) 575 $8 496$11 634$ 14 592$39
Water (%) 59.4$1.0 63.5$1.2 60.3$1.8 63.6$1.5
Ash (9) 39$2 40$4 47$2 ' 41 $4
Ash (%) 10.1 $0.9 13.8$0.9 11.3 $0.7 12.3$1.1
iLATE n 6 5 11 1
Llpid index 0.70$.10 0.48$.08 0.51 $.05 0.55$.
Fat (9) 159$24 99$16 132$14 134$.
Fat (%) 39.9 $4.1 31.3 $4.4 32.8$2.1 35.6$.
Protein (9) 164$15 168 $3 207$S 189$.
Protein (%) 43.7$5.3 55.1 $3.8 S3.0$ 1.7 50.1 $.
Water (g) 581 $18 532 $15 621 $15 569 $ .
Water (%) 60.4$1.5 63.3$1.6 61.2$1.2 60.2$.
Ash (el 46:*.:3 44$2 52$5 sri._ Ash (%) 12.1 $0.8 14.5$0.7 13.4$1.2 15.1 $.
‘Carcasses (n =64) collected during three periods in winter 1985·86; 12 October~11 November
(early), 16~30 December(mid), and 31 January-13 February (late).
*P|us or minus one standard error.
117

Table 26. Pearson correlation coefficlents of extemal measurements (mm) with selectedcarcass components‘ from black ducks wlnterlng at Chincoteague, Vlrglnia, October1985·February 1986. -
LBILL WBILL CULMEN HEAD TARSUS WING KEEL
Whole carcass (Q) 0.516*' 0.558** 0.470** 0.677** 0.567** 0.737** 0.716**
Nonfat dry carcass (g) 0.609** 0.669** 0.573** 0.708** 0.650** 0.821** 0.817**
Lipid index (fat/NFDW) 0.149 0.093 0.062 0.248 0.069 0.230 0.143
Fat (Q) 0.254* 0.207 0.169 0.376** 0.187 0.369** 0.304*
Protein (g) 0.493** 0.533** 0.464** 0.600** 0.533** 0.737** 0.757**
Water (g) 0.572** 0.559** 0.557** 0.630** 0.626** 0.732** 0.699**
Ash (9) 0.238 0.353** 0.274* 0.359** 0.224 0.196 0.262*
‘lncludes length of bill (LBILL), culmen, tarsus, wing, and keel, and width of bill (WBILL)and head.
*Signilicantly different than zero (p <0.05).
"Signiticantly different than zero (p <0.01).
118

Table 27. Partlal correlation coefllclents ol body weight and structural components re·gressed on physlologlcal condition ol black duck carcasses‘ collected at Chincoteague,Virginia, October 1985-February 1986. _
WEIGHT LBILL WBILL CULMEN HEAD TARSUS WING KEEL
Lipld Index 0.548 0.029 0.053 0.007 0.007 0.049 0.013 0.100
Percent Fat 0.488 0.017 0.009 0.003 0.012 0.039 0.001 0.087
‘Sample size=62; 2 measurements of head width missing.
l
119

Table 28. Selected models of weight, water, and welghtzstructure ratlos regressedagainst the Ilpld Index (g fatlg nonlat dry carcass) ol black duck carcasses collectedat Chlncoteague, Vlrglnla, October 1985-February 1986.
VARIABLE‘ Y—lNTERCEPT SLOPE · R*
ADULT MALES (n=23)
Weight -8.535 12.131* 1.250 10.297 0.4575
Weight/wing length ' -1.413 10.456 122510.302 0.4389
Weight/bill width -5.600 11.014 1.506 10.253 0.6277
Percent water 2.751 10.281 -4.85710.587 0.7650
ADULT FEMALE AND JUVENILE In =41)
Weight -7.2451 1.151 1.091 10.164 0.5308 '
Weight/wing length -1.59710.267 1.42410.19O 0.5905
Weight/keel length -2.812 10.396 1.35710167 0.6291
Percent water 3.648 10.117 -6.658 10.240 0.9519
‘Variables are natural log-transformed; LI = ln(1 + LI).
*Plus or minus one standard error.
120

Table 29. Means and standard errors of carcass components from black ducks collected at
Chincoteague, Virginia, October 1985-February 1986.
_Adult Juvenile‘
Adult Juvenile
Whole carCa$$ (Q) 1204220 (18)' 998 217 (18) 1310221 (23) 1187230 (5)
Nonfat dry carcass (Q) 22622 (18) 20023 (18) 4 25724 (23) 23723 (5)
Dry fllght musclé (Q) 3721 (18) 3121 (18) 4322 (23) 3924 (5)
Wet flight musclß (Q) 11722 (18) 10222 (18) 13022 (23) 11824 (5)
ÜVY QlZZ8Vd (Q) 1421 (18) 1121 (18) 1721 (23) 1722 (5)
Wél QlZZ3l’d (Q) 4122 (18) 3521 (18) 4422 (23) 4223 (5)
Dry llV€l‘ (Q) 8.92.4 (18) 7.12.4 (18) 9.02.5 (23) 9.322.6 (5)
Wét llV€r (Q) 29 21 (18) 24 21 (18) 29 21 (23) 29 2 6 (5)
Llpid index (fat/NFDW) 0.672.06 (18) 0.362.05 (18) 0.562.05 (23) 0.522.10 (5)
Fat (9) 151213 (18) 73210 (18) 144213 (23) 121223 (5)
Fat (%) 3922 (18) 25 23 (18) 3522 (23) 33 24 (5)
Protein (Q) 17225 (18) 16122 (18) 20323 (23) 18323 (5)
Protein (%) 472 2 (18) 6022 (18) 52 2 2 (23) 52 24 (5)
Water (9) 58128 (18) 509 27 (18) 62629 (23) 575215 (5)
Water (%) 6121 (18) 6521 (18) 6121 (23) 6222 (5)
Ash (Q) 4422 (18) 3822 (18) 63211 (23) 4327 (5)
Ash (%) 1221 (18) 1421 (18) 1623 (23) _ 1322 (5)
Wing length (mm) 278 21 (18) 263 22 (18) 290 21 (23) 2872 2 (5)
Keel length (mm) 10421 (18) 10221 (18) 11121 (23) _11021 (5)
Tarsus length (mm) 45.22.3 (18) 43.62.3 (18) 46.3 2.2 (23) 46.82.3 (5)
Head width (mm) 29.72.1 (18) 29.22.2 (17) 30.62.2 (22) 30.32.4 (5)
Bill length (mm) 58.62.4 (18) 57.42.4 (18) 61.62.5 (23) 82.62.5 (5)
Bill width (mm) 22.8 2 .2 (18) 22.3 2 .2 (18) 23.8 2 .2 (23) 23.72 .1 (5)
Culmen length (mm) 52.32.4 (18) 51.02.5 (18) 54.82.5 (23) 56.02.8 (5)
Plasma nitrogen (g/100 ml) 4.52 .1 (15) 4.3 2 .2 (9) 4.5 2 .1 (17) 4.9 2 .8 (3)
Hematocrit (% RBC) 39.121.2 (14) 38.6 22.3 (8) 41.7 21.6 (12) 40.7 2 3.8 (3)
Hepatlc Pb (ug/g) 1.512 .27 (13) 1.412 .17 (14) 1.72 2 .35 (20) 2.312.46 (5)‘
Hepatlc Cd (ug/g) 1.76 2 .24 (13) 1.66 2 .32 (14) 1.79 2.18 (20) 1.26 2 .42 (5)
Hepatlc Cu (ug/g) 34.624.4 (13) 30.823.9 (14) 27.724.9 (20) 131.0283.8 (5)
Hepatlc Zn (ug/g) 117.826.2 (13) 119.225.9 (14) 112.223.1 (20) 115.1218.2 (5)
‘Plus or minus one standard error. Number in parenthesis is sample size.
121

Table 30. Diet' ol black ducks collected at Chincoteague, Virginia, during winter ol 1985-86.
DRY WEIGHT A FREQUENCYA Q °Äs NO. °/o
INVERTEBRATES 16.794 38.0 15 37.5
Saltmarsh snail (Melampus bidentatus) 15.687 35.5 3 7.5
Fiddler crab (Uca sp.) 0.375 0.8 6 15.0
Caridean shrimp 0.142 0.7 3 7.5
Amphipod 0.097 0.2 1 2.5
Water boatman (Hemiptera:Corixidae) 0.067 0.2 1 2.5
Unknown cmstacean 0.062 0.1 4 10.0
Sea pill bugs (Sphaeroma quadridentatum) 0.027 0.1 1 2.5
Ribbed mussel (Geukensia demissa) 0.014 0.0 1 2.5
Insect Iarvae 0.010 0.0 1 2.5
Marsh periwinkle (Littorina irrorata) 0.003 0.0 1‘
2.5
lsopod (Chiridotea sp.) 0.002 0.0 1 2.5
Shell fragments 0.265 0.6 6 15.0
Miscellaneous 0.043 0.1 6 15.0
VERTEBRATE5 2.393 5.4 3 7.5
Mummichog (Fundulus heteroclitus) 1.734 3.9 1 2.5
Spottin killilish (Fundulus Iuciae) 0.344 0.8 1 2.5
Unknown lish 0.315 0.7 2 5.0
SEEDS 20.303 45.9 17 42.5
Glasswort (Sallcomia sp.) 16.649 37.7 2 5.0
Bayberry (Myrica pensylvanica) 1.472 3.3 4 10.0
Barnyard grass (Echinochloa) 0.686 1.6 6 15.0
Sedge (Juncus sp.) 0.418 0.9 5 12.5
Sedge (Scirpus sp.) 0.289 0.7 10 25.0
Panic grass (Panicum sp.) 0.308 0.7 4 10.0
Unknown seeds 0.286 0.6 6 15.0
Spikerush (Eleocharis sp.) 0.195 0.4 3 7.5
VEGETATIVE 4.724 10.7 31 77.5
Sea Iettuce (Ulva lactuca) 2.359 5.3 5 12.5
Unknown aquatic vascular plants 0.020 0.5 2 5.0
Saltmarsh cordgrass (Spartina alternifolia) 0.058 0.1 2 5.0
Miscellaneous 2.287 5.2 26 60.0
TOTAL 44.214 99.8
‘Food habits based on proventriculus and esophageal contents (n=40).
122
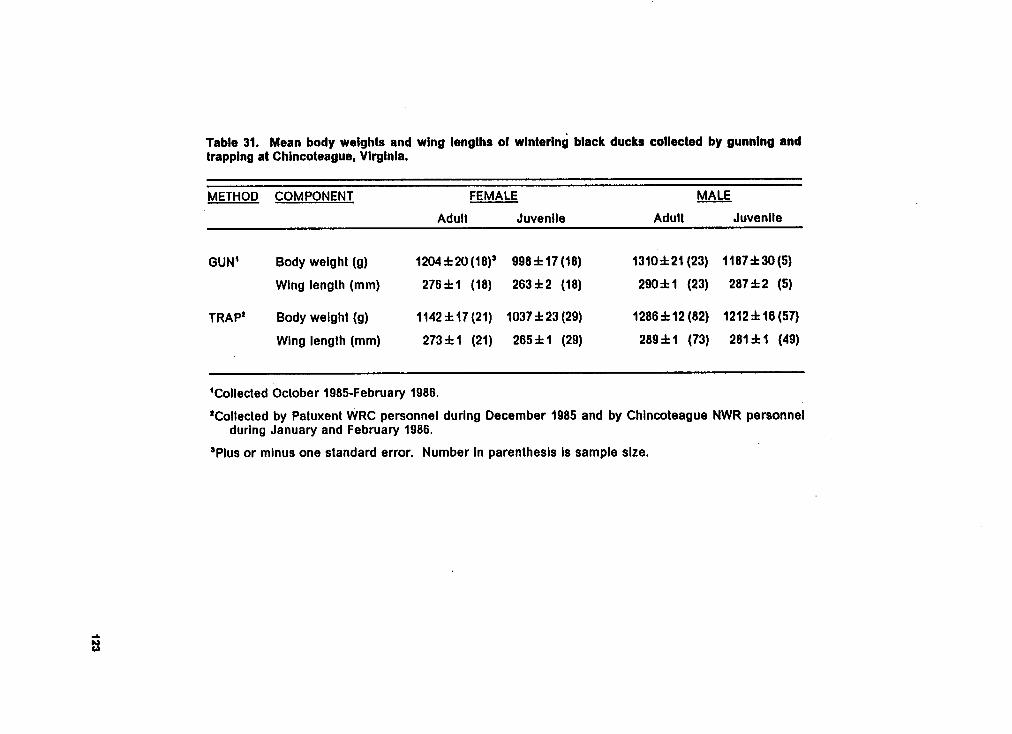
·¤1:¤E1::o
ä
2-2
-
4
>.
Q
og
.-
.¤
:
cn
NA
u-I-¤
mm
7
.1
+‘°
"’v
Ü
§
'°r~
°
‘-
2
:Q
'H*'
gg
¤-
°‘¢
\I·H
C
8
,..
E-
‘
·
„
=-5
2;*ä
E
Ü
‘¤
Zw
,.
°
=
<
Nvg
k
¤.,
'U
,H
‘._
,R
ß
1:
.<a+¤2
~
§
2
„¢2
S+
|~··
w
.3
N3
-H
=
2
2%
2*
’
__
1-N
N
1:
2
-
*2
8
';
26
E
..
=
:2
5
2
2‘*
‘*
Q
w"
2
2
w
E
1.1-
NN
-H
an
Q
n
FS
U,
Q
N
=
»-
G5
Ü
1-
m
‘;
ä
.,2
g"
E
<
ä~
·§,_
_
-3
¤!
***2
;§
§.ä
ää:-15
gf:
%’$
"·*‘2+*
ä
S-
,.¤
2
¤.
o
,.Z
-c
>•’
E
'“
Q?
5
«s¤
S
.¤SLU
gg
gi
-¤
=°
Z
~.«
Q-g
.E
mo
Q
-•E
:2
:
1,511
=~
··~^
a¤
¤:z
E':
E
PE
EE
***9*
Eo
gg
zä
Eg
aä
1„=··8
-22.6
%„s=
‘
,2O
Q-.
>_
2
cc
gn
I
g¤
"':·¤
3
I-
¢
1.0
c
LU
m°'
q;>
<:I¤
2-
E
-g.=1°°'·5
.
Z
•-Eb
d}
2
..
äg
(D
CL
E:
(
‘D
qm
nc
2·¤
‘¤=
*
I"
n
U_
g¤
;-E2
o,E
E9
6€
¤
QW
°'2 2-
1g3

OE.¤¤
g
-
NQ
.
2 gg
•«
gzä
gg
ä
g„„
“’·*·
2+
52
2,
8'·
F
IDN
3.
+5
6
g
vö
o
_H
Eg
=S
;'E2„
-N
’zu:
§‘*:..
‘°ä
°¤ ZC
-
,_•,«
|-|.
'
gl
==;::äIa‘ä
Ä
·
-H
o
“ 2..
Z·
g
*··=·g·2
:‘*2=
.„
ä
6
N
·¤
E
'é‘
··<=
¥'ä
‘ä3
Eä
"g·=
.2
g
s5
‘°~8
E.
va
-
2E
Sc
3;
.g
m_
m
SB
cä
aa
g
wa
'
es
•·-cw
-
9-¤
;
,2‘S
„.
¤¤§S
°$
S
U!
c
„_;
“Q]
':,
css;
:52
DE
¤¤
·
z°·‘g
..
3
„,,2¤
>
Z
:9
0
LU
_¤
2C
.>
EE
C
2
vg
ää
s:«
»5
W2
85
Gs.
98
2··E
U
12
4

Table 33. Adult and juvenile carcass components (g) of female black duck: wlntering in Maine and
Virginia.
Fall Winter‘
Fall Winter
ADULT Whole carcass 1166 2 51 (7)* 989 228 (11) 1206 222 (12) 1200 246 (6)
Nonfat dry carcass 281213(5) 25924 (11) 22522 (12) 22626 (6)
Protein 20628 (5) 18924 (11) 17623 (12) 164215 (6)
Water 619223 (5) 519213(11) 58228 (12) 581218(6)
Fat 187227 (5) 128218 (11) 147216 (12) 159224(6)
Ash 4923 (5) 4222 (11) 4323 (12) 4623 (6)
Gizzard 4023 (7) 3422 (11) 4422 (12) 3621 (6)
Flight muscle 22729 (7) 19125 (11) 22923 (12) 24227 (6)
JUVENILE Whole carcass 1112222 (25) 890222 (20) 972219 (13) 1066 214 (5)
Nonfat dry carcass 26926 (14) 24325 (20) 19723 (13) 20923 (5)
Protein 20224 (14) 17723 (20) 158 23 (13) 16823 (5)
Water 633215(14) 505211 (20) 50027 (13) 532215(5)
Fat 133221 (14) 69211 (20) 64211 (13) 99216(5)
Ash 4621 (14) 4121 (20) 3623 (13) 4422 (5)
Gizzard 3622 (25) 3122 (20) 3721 (13)‘ 3022 (5)
Flight muscle 22624 (25) 17926 (20) 20025 (13) - 21824 (5)
’Data from Reinecke et al. (1982). Fall carcasses collected in October, November, and early Decem-
ber. Winter carcass collected in late January and early February.
’Direct comparisons with Maine data cannot be made for nonfat dry weight, protein, fat, water, and
ash; Virginia analysis excluded Iiver, dlgestive tract, tarsi, and bill from homogenate. Weight of
flight muscles multipled by 2 (only left side weighed). Fall carcasses collected 12 October-11 No-
vember and 16-30 December. Winter carcasses collected 31 January-13 February.
*Plus or minus one standard error. Number in parenthesis is sample size.
125

CHAPTER 4
cuAP‘rER 4 126

Habitat Suitability Index Model
ABSTRACT: The Habitat Suitability Index model (Lewis and Garrison 1984) for wintering black
ducks (Anas rubripes) was evaluated at Chincoteague, Virginia, during 1985 and 1986. Com-
parison of overall model outputs (0.56-0.66) with food habits and carcass data suggested that
the HSI model was underestimating habitat quality at Chincoteague. Modilication of one var-
iable (V,) and inclusion of a new variable (V,) were proposed to correct model output.
Habitat Suitability Index Model 127

Introduction
A Habitat Suitability lndex (HSI) model for wintering black ducks was proposed by the U.S. Fish
and Wildlife Service (Lewis and Garrison 1984). This model is intended for use in impact as-
sessment and management of winter habitat along the Atlantic coast. ln general, HSl models
are used for comparing the suitability of two or more different areas or for comparing one area
at different points in time. °
The HSI model for wintering black ducks requires that seven variables be assessed; three
physical variables can be determined from maps and four biological variables must be
measured in the field before the onset of winter. The physical variables are the percentage
of subtidal open water S 1 m deep (V,), the percentage of open water area exposed af low
tide (V,), and the percentage of emergent and forested wetland area covered by streams,
ponds, and impoundments (V,). The four biological variables are the percentage of subtidal
shallows that are occupied by rooted vascular plants (V,), the percentage of sample plots on
intertidal mudtlats that contain 2 300 clams/m* (V,), the percentage of bottom substrate of
freshwater impoundments and ponds represented by Ruppia and Potamogeton (V,), and the
percentage of nonforested, emergent marsh that supports 2 750 snails/m* (V,). Based on
theoretical and, less frequently, empirical considerations of habitat use by wintering black
ducks, Suitability Index (Sl) values are assigned to estimates of these variables.
For sites south of Cape Cod, Massachusetts, the HSI model specifies the following equation
for marine and estuarine open water:
1/3
HSI[ow] = ((Sl, + Sl,) / 2)* x ((Sl, + Sl,) / 2)] .
The following equation is used for sites (south of Cape Cod) with estuarine vegetaled
wetlands:
Habitat Suitability Index Model 128

HS|[vw] = ((2 x SI,) + SI, + Sl,) /4.
An overall HSI value can be calculated by weighting each of the previous values by the rela-
tive areas involved (A[ow] = proportion of site that is subtidal open water; A[vw] = proportion
of site that is vegetated wetlands; A[ow] + A[vw] = 1):
HSI = (A[ow] x HSl[ow]) + (A[vw] x HSI[vw]).
A partial application of this model to 23 study sites along the Atlantic coast from Virginia to
Maine indicated that physical habitat characteristics alone may account for 22-29% of the
variation in the distribution of wintering black ducks (Lewis et al. 1984). The biological vari-
ables for this model were not measured; consequently, the model has been neither verilied
nor validated. In this study, we applied the model to a 25,614 ha study area on the Eastern
Shore of Virginia’s Delmarva peninsula. The area included the Chincoteague National Wildlife
Refuge, part of the Assateague National Seashore, and adjacent tidal habitats. Objectives
were to evaluate field measurement of the model variables and the overall model output for
the winters of 1985-86 and 1986-87.
Methods
Cartographic data were measured with a Tektronix 4051 electronic planimeter. The area of
subtidal water (V,) was estimated from bathymetric contours on 1:24000 USGS topographic
maps. Areas of tidal flats (V,) and streams, ponds, and impoundments (V,) were determined
from 1:24000 National Wetland Inventory (NWI) maps.
Cover of rooted vascular plants (V,) was assessed from approximately 100 aerial photographs,
representing 27 different locations, taken on 10 December 1985 from 1100-1200' AGL. These
Habltat Sultabillty Index Model 129

locatlons also were photographed in December 1986 but print quality was too poor to be
considered reliable; consequently, V, was assumed to be the same for both years. Photo lo-
cations were nonrandomly distributed over the study area. Locations were selected that could
be identified easily on USGS topographic maps. A 50 mm lens and Kodak Ektachrome (200
ASA) film were used; however, the slides were developed as 8x10 high-contrast black & white
prints. Cover was estimated with a dot grid (64 dots/in’).
Clam densities (V,) were estimated from ten 100 m transects perpendicular to the water’s
edge on selected tidal fiats at low tide. Transect starting points were randomly chosen for
each flat. Each transect was divided into five 20 m sections and two 0.1m‘ sample plots were
randomly allocated to each section within 10 m of the transect line; therefore, 100 0.1m’ plots
were tabulated each year. Sand and silt, to a depth of4 inches, were sifted through by hand.
Clams were tallied by species. Transects were completed during 19-26 November in 1985 and
28 November-14 December in 1986.
To assess the frequency of Ruppia and Pofamcgeton (V,) in impoundments, we completed the
fall vegetation survey which was normally conducted by Chincoteague NWR personnel. Ref-
uge impoundments constituted only 4% of the study area but represented 70% ofthe available
fresh to brackish standing water. The refuge survey had been conducted annually during the
past decade, but was not scheduled during 1985 and 1986 due to lack of funds. Seven
transects, in seven impoundments (A, B, C, WFN, WFS, Old Fields, F) were completed. Addi-
tionally, three more transects were completed within these pools (WFN, WFS, Old Fields) to
improve distribution and size of the sampling effort in 1985. ln 1986, however, only one addi-
tional transect was completed (Old Fields). A five-point sampler was placed at 10 m intervals
along the transect and vegetation at each point was recorded. Totals of 714 stations (3,570
points) and 497 stations (2,485 points) were sampled in 1985 and 1986, respectively. Pool
totals were weighted by the relative area of the pool. Transects were completed during 23
October-15 November in 1985. and 13-22 November in 1986.
Habitat sultabllity Index Model 130

Snail densities (V,) were estimated from twenty-six 100m transects nonrandomly distributed
over the study area. The sampling design was similar to that used for estimating clam den-
sities. Each transect was perpendicular to the water’s edge, divided into five 20 m sections,
and two 0.1 m' sample plots were randomly allocated to each section within 10 m of the
transect line; therefore, 260 0.1 m' plots were tabulated each year. All snails on the ground
(within the frame) or on vegetation that was rooted within the frame were counted. Snail
species, plant species, and average height of Spartina alternifolia within the plot were re-
corded. Transects were completed during 22 October-28 November in 1985 and 14
November·11 December in 1986.
Results
The study area was composed of 6562 ha upland, 5518 ha deep subtidal water (>1 m), 5386
ha shailow subtidal water (S1 m), 4743 ha saltmarsh, 1400 ha tidal fiat, 910 ha impoundment,
423 ha natural pool, 324 ha shrub wetland, 304 ha stream, and 44 ha other habitat. Other
habitat included areas designated as dunes under the NWI classification and were pooled with
upland for this analysis. variables and corresponding Sl values are estimated for both years
in Table 34.
Shallow subtidal water (V,) covered 49.4% of the open water area at mean low tide; 11.4%
ofthe total open water was exposed at mean low tide (V,). Ponds, creeks, and impoundments
(V,) represented 24.4% of vegetated wetlands. These physical variables were assumed to be
the same during both winters.
Approximately 17.4% of shailow subtidal water supported rooted vascular aquatic plants in
1985. On the Chincoteague study area, widgeon grass (Ruppia marilima) and eel grass
Habltat suizabimy index Model 131l

(Zostera marina) were dominant vascular plants in estuarine waters. In our opinion, there was
no change in aquatic plant cover between 1985 and 1986.
In 1985, impoundment water levels were high and averaged approximately 0.3-0.6 m in depth.
Ruppia and Pofamogeton occurred on 13.7% of transect points; after weighting this sampling
by the relative areas of the pools, a value of 20.7% was estimated for V,. ln 1986, however,
refuge impoundments did not üll with rainwater until mid-December; Ruppia and Potamogeton
were negligible at the time of sampling, representing only 0.2% of transect points. During
both years, Eleocharis parvula was the dominant waterfowl food in refuge impoundments.
Vegetation survey data are on tile with the Chincoteague NWR.
In both 1985 and 1986, no plots sampled on tidal flats contained 2 300 clams/m'. We had
planned to use sieves if clam counts were high; however, the highest plot count during two
years was four. ln 1986, in fact, a total of four clams were counted in 100 sample plots.
Mercenaria mercenaria was the common clam; Tellina sp. and Tagelus sp. were infrequently
found on transects.
Fifty-four plots (20.8%) contained 2 750 snails/m' in 1985; only 18 plots (6.9%) contained 2
750 snails/mz in 1986 (V,). A Wilcoxon two-sample comparison suggested that Melampus snail
densities varied significantly between years (Z = -5.414, p < 0.0001). Mean snail densities
were 37.8/0.1 m' (n=260, SE=3.27) and 16.0/0.1m’
(n=260, SE=2.28) in 1985 and 1986, re-
spectively. Snail counts were different between four height classes of Spartina alternifolia
(Kruskall-Wallis X’=155.9, df=3, p < 0.0001; Table 35). Pairwise comparisons, using the
Wilcoxon two-sample test to separate means, suggested that snail densities in 21-40 cm, 41-60
cm, and <21 or >60 cm cordgrass were different (pS0.05). Snail densities in >60 cm
cordgrass tended to be lower than those in <21 cm cordgrass (p=0.082).
Spartina height differed between years (X'=25.4, df=3, p<0.001). Plots in 1985 contained
significantly more cordgrass in the 41-60 cm height class than expected (cell ;g“=6.40, df=1)
Habltat suitebamy Index Model 132

and significantly less cordgrass in the 0-20 cm class than expected (cell X'=4.32, df=1); the
opposite was true in 1986. This difference in cordgrass height may explain the difference in
snail counts between years. Marsh periwinkles (Littorina irrorata) and ribbed mussels
(Geukensia demissa) also were common gastropods in the saltmarsh; the mud dog whelk
(Nassarius obsoletus) was commonly found on flats and channel banks of high sill composi-
tion.
Discussion
Measurement of variables
Cartographic variables (V,, V2, V,) were measured as Lewis and Garrison (1984) suggested.
NWI maps proved to be easier to use than USGS maps because wetland habitat types were
designated with discrete boundaries; consequently, measurements could be replicated. We
have no suggestions for improvement.
The method used in this study for estimating submerged vegetative cover in subtidal waters
(V2) was practical; shallow subtidal waters covered almost 5400 ha and obtaining a represen-
tative sample from more conventional methods would be prohibitively time-consuming.
However, we suggest use of infrared film, extensive ground—truthlng, and randomization of
photo locations.
Lewis and Garrison (1984) suggested using an Ekman dredge to sample for clams. We found
that an Ekman dredge did not penetrate compacted sand and silt, nor did it consistently hold
a uniform sample. The 0.1 m' plot used in this study was adequate, although time-consuming.
As mentioned earlier, it would have been necessary to screen samples had clam counts ap-
Habltat Suitablllty Index Model 133
proached 300 clams/m'. Each transect (i.e., 10 plots) required 1-1 V; h to complete; as clam
counting is constrained by low tide, we were able to complete 2-3 transects per day (two
persons).
The 0.1 m' plot was a good method for estimating V,. lt is time consuming (1-1 V2 h/transect)
but we believe that the method provides an accurate estimate of snail densities. Snail
counting in the saltmarsh also is constrained by low tide but not to the degree that transects
on tidal tlats are; consequently, 3-4 transects were completed per day (two persons).
The five-point sampler proved to be a good method for sampling vegetative frequencies in
shallow impoundments; it was simple and efficient, although random stations may be more
appropriate than transects. Lewis and Garrison (1984) suggested using a plant dredge, which
would be appropriate for deeper water (>1 m); however, there is little value in sampling
deeper than a tive—point sampler can reach. Although black ducks have been known to dive
(Kutz 1940), diving is not a common foraging strategy.
Model output
Habitat Sultability Index models index habitat quality with a value that ranges from 0 - 1.0.
Members of the Habitat Evaluation Procedures Group and the Coastal Habitat Evaluation
Procedures Project (U.S. Fish and Wildlife Service 1984) stated that HSI models do not directly
measure carrying capacity; rather, the degree to which a model correlates with some meas-
ure of carrying capacity is directly related to the degree to which factors limiting that measure
have been identified and integrated into the habitat model. Consequently, validation tests
should use an independent measure that substantiates and quantifies the relationship be-
tween an animal and its habitat. Those authors suggested using habitat use data, abundance
data, or measures of "well being" (i.e., physiological condition) as independent measures.
Habitat Sultability Index Model 134

Variables for this HSI model were measured in 1985 and 1986 concurrently with a more com-
prehensive study of the wintering ecoiogy black ducks at Chincoteague. Consequently, we
have access to habitat use data, time budget data, and carcass condition information, which
serve as independent measures of the accuracy of model output.
In 1985, the overall HSI value was estimated to be 0.66; values for HSl[ow] and HSI[vw] were
0.56 and 0.76, respectlvely. ln 1986, the overall HSI value was estimated to be 0.56; values for
HSl[ow] and HSI[vw] were 0.56 and 0.56, respectlvely. A[ow] and A[vw] were 0.50 and 0.50,
respectively, for both years. Although we believe that model variables were well chosen by
Lewis and Garrison (1984), we suggest that the model is underestimating habitat quality on the
Chincoteague study area.
Analyses of carcasses collected on the study area indicated that black ducks were leaving
these wintering grounds in the spring of 1986 at least as fat and heavy as they entered them
in the fall (Chapter 3), suggesting that wintering conditions at Chincoteague were relatively
benign. Furthermore, based partially on Mid-Winter Waterfowl lnventories, the area between
Assateague Island and Wallops Island (coinciding with the study area) was ranked ürst in the
state of Virginia for acquisition in the Concept Plan for Preservation of Black Duck Wintering
Habitat (U.S. Fish and Wildife Service 1986). Clearly, the model is not accurately assessing
the quality of Chincoteague habitats.
On the Chincoteague study area, Ruppia and Potamogeton were not common forage items for
wintering black ducks. Esophageal and proventriculi contents data from 40 black ducks col-
lected on the study area during 1985-86 showed little evidence of Potamogeton and Ruppia
ingestion (Chapter 3). Seeds accounted for 45.9% of total dry weight and were found in 42.5%
of the digestive tracts. Vegetative material represented only 10.7% of total dry weight al-
though fragmented vegetation was found in 60% of the carcasses. We suggest that V, be
generalized to reflect the abundance of common waterfowl forages in local ponds and
Habitat Suitabllity Index Model 135

impoundments; restricting this variable to Ruppia and Potamogeton tends to underestimate
the value of this habitat type.
This model estimates both area and food value for subtidal water (V., V,). intertidal zones
(V,. V.), and creeks, ponds, and impoundments (V,. V.); however, it falls to specitically esti-
mate estuarine emergent vegetatlon although snail numbers are evaluated (V,). We suggest
including a new variable, V,. which would be an estlmate of the percentage of vegetated
wetlands that is represented by Spartina saltmarsh. This variable would be included in the
suitability equation for estuarine vegetated wetlands (Lewis and Garrison 1984) and all vari—
ables would be equally weighted (i.e., unweight V,):
(Sl, + Sl, + Sl, + Sl,) /4.
ln general, the model variables appear to be good indicators of habitat quality. With the two
changes suggested here, the model may have more applicability to wintering areas south of
Cape Cod. However, the ultimate decision as to the utility and effectiveness of this model
must be made on the basis of assessment in planning situations (U.S. Fish and Wildlife Service
1984).
Literature Cited
Kutz. H.L. 1940. The diving ability of the black duck. J. Wlldl. Manage. 4(1):19-20.
Lewis, J.C. and R.L. Garrison. 1984. Habltat suitability index models: American black duck
(wintering). National Coastal Ecosystems Team. Div. Biological Services, Research and
Development, U.S. Fish and Wildlife Service. FWS/OBS-82/10.68. 16pp.
Habltat Suitabillty Index Mudel 136

Lewis, J.C., M. Nelson, and J.D. Clark. 1984. A test of variables and equations potentially
useful in an HSI model for black duck coastal (wintering) habitat. U.S. Fish and Wildlife
Service. Unpubl. rep. 50pp.
U.S. Fish and Wildlife Service. 1984. Habitat Suitability Index model validatlons. Habitat
Evaluation Procedures Group, Ft. Collins, CO, and Coastal Habitat Evaluation Procedures
Project, Slidell, LA. 22pp.
Habitat Sultabillty Index Model 137

R)
28
S¤~
36
°
6S;
g¤
G3
—
'Y<:>
N6
ä—
Q
cY
C•
"r~
m
YÖ
ga
Y
"'sa
Y•~
"
'¤•
V
¤’
•.
co
6;{I
"
P
ES
gY
g
...-
„,
0
..O
s.
S
22
2
.
:~
"
zuao
'"'
U
°·:
Yvz
ci°
·¤=
‘é··
·¤¤
·¤ci
·=
-é
LQ
QY
oN
g
3‘°
coW
Y'
YN
g
,¤>
Qca
N
°
=*'
°?Y
6ZI
..4
nß
uID
c,
Q,
~¢
“G
°°°
v
an
•-•
cn\
gu
-„.
¤
c
Ex;
"ä
'
ram
„E
¤>
N"
••E
II)°
E3
0,,
0E
c:
.:1.
EE
1,m
E
°"2
¤·cu
Gg
Ö
E
gg
~¤"
Ssn
ID
··*—
6°
o0
:~
°0
8E
°N
9
M;
s.n
··E
*—
=•'
¤-_:
A1*6
2·¤
.
MQ
U
...•_
QE
G
.¤•-
3
...z
.¤E
3
Q3
.6E3
E$
äg
·¤
-
•·*¢¤
.-
gg
E;°
E5
0:
§
'*%.Z
Y,-
28
45&
‘öE
Wr-
Q
—
Ucn
C3
E*
5;
+-
g_
g-*5
g¤:
,>;·
-669.-
5¤
6E
E
_,cz
.¤E
ua
.¤
gn
gä
*'.
E
ig
LU
•
(3
E°
Q
Y$
>
··
—g
••>
_S
)
“'f¤
E}>
<·°ä<
°°••E
ag
>{fu
138

Table 35. Mean saltmarsh snafl counts ln four heightclasses ol saltmarsh cordgrass at Chlncoteague,Vlrglnla, ln the fall ol 1985 and 1986. A
HEIGHT (cm) n SE SE
0-20 125 5.06 a' 2.24
21-40 261 44.30 b 3.38
41·60 85 16.21 c 3.47
> 60 39 0.87 a 0.49
‘NIeans with same Ietter are not signiticanfly different(p20.05) according to Wilcoxon two·sample test.Overall Kruskall-Wallis x_'= 155.9, df=3, p<0.0001.
139
SUMMARY
Wintering populations of black ducks (Anas rubripes) on the Atlantic Flyway have decllned
50% since 1954. To better understand their wintering ecology, we conducted a study at
Chincoteague, Virginia, during the winters of 1985-86 and 1986-87. Some recent research has
been conducted in Maine and Canada where wintering black ducks are restricted to open
rivers and coastal tidal zones; however, at Chincoteague, black ducks are not usually con-
strained by ice and have access to several habitat types. Objectives of this study were to
determine habitat use, quantify time and energy expenditure, and quantify changes in
endogenous energy reserves over winter.
Twenty-three female black ducks were radio·tracked between 15 December 1985-1 March 1986
on a 25,600 ha study area that included the Chincoteague NWR and adjacent tidal habitats
(Chapter 1). Juvenile black ducks used range and core areas 2-3 times larger than adults.
Adults used one core area while juveniles tended to use more than one. Refuge
impoundments were used during the day and the saltmarsh was used at night. Subtidal wa-
ters were used during perlods of icing. Log-linear modeling suggested that habitat use was
determined primarily by the day-night cycle and secondarily by the tide—ice interaction.
SUMMARY 140

Scan sampling techniques were used to quantify behaviors of flocks within refuge pools,
saltmarsh, and subtidal water habitats during both years (Chapter 2). Black ducks fed least
and rested most when in refuge pools during the day; conversely, they fed most and rested
least when in subtidal waters during the day. Nocturnal observations (with a night-vision
scope) indicated that black ducks were at least as active at night as they were during the day.
l suggested that black ducks were primarily feeding at night in tidal habitats and roosting
during the day in refuge pools.
Diurnal energy expenditure (DEE) within habitat was estimated by the conventional use of
energy coeflicents; DEE for the average duck at Chincoteague was derlved by weighting ex-
penditure within habitat by the proportion of time spent in all three habitats. Comparisons
with DEE estimates of black ducks wintering in Maine suggested that black ducks have similar
DEE at a given temperature whether in Maine or Virginia.
When flocks were disturbed, scan sampling continued (until birds moved out of sight or
llushed) to obtain a random sample of the response to disturbance. Disturbed tlocks spent
more time on alert and in modes of Iocomotion, and severely curtailed feeding. The mean rate
of energy expenditure for disturbed flocks approximated that of undisturbed llocks; however,
47% of disturbed flocks llushed, a behavior that expends 5-6 times more energy than other
behaviors.
Sixty-four black ducks were collected during early, mid, and late winter at Chincoteague in
1985-86 (Chapter 3). Whole carcass analysis indicated that black ducks were at least as fat
and heavy in the spring as they were in the fall. Comparisons with similar work in Maine
suggest that black ducks experience a negative energy balance after mid-winter, the extent
of which is determined by the severity of the winter. Regression models were derlved from
body weight and external measurements to predict physiological condition of live black ducks
(R’=0.63).
SUMMARY 141

The Habitat Suitability lndex (HSI) model for winterlng black ducks was evaluated during both
years (Chapter 4). Comparison of overall model output with food habits and carcass data
suggested that the model underestimated habitat quality at Chincoteague. l proposed that
V, be modified to include local waterfowl foods (rather than Ruppia and Potamogeton) and a
new variable, V,, be created that estimates the percentage of wetlands represented by
Spartina saltmarsh.
SUMMARY 142

Appendlx A. Summary of avallable macro-habltat categorles and assocl-
ated Natlonal Wetland Inventory types on the Chincoteague study area.
HABITAT NWI TYPE HECTARES
Upland u _6562.03
Open water‘ E1OWL’ 5518.33
Subtldal water E1OWL 5385.50
Saltmarsh E2EMP · 4726.16E2EM/FLP, PEMR 16.89
Tldal flat E2FL 1393.07EZRF 7.16
lmpoundment E1OW 270.161 E2EM 152.49
EZFL 37.06E2SS 31.37L2FL 343.46PEM, PFO 10.08
POW 16.80PSS 48.54
Natural pool E1OW. E2OW 62.62
EZFO 27.48E2EM
1 32.89E2FL 15.33FEM _ 62.32PFO 183.83POW, PAB 38.89
Shrub wetland E2EM/u 69.55EZFO, PFO 19.49E2SS 173.62PSS 61.50
Stream E1OW 37.28E2EM 156.03E2FL 34.54EZSS, PSS 20.70POW, FAB 2.57PFO — 53.24
Other EZBBP1 38.01
E2FL/OWL 5.78
Total 25614.90
‘Open water ls 21m deep at mean low tlde; subtidal water ls <1m
deep at mean low tide. Data from 1:24000 USGS topographlc maps.
143

Appendlx B. Radlo locatlons for juvenile and adult female black ducks distributed over
habitat, tlde, tlme ol day, age, and Ice condition during December 1985~February 1986.
· ICE AGE PERIOD TIDE _ HABITAT TOTAL
Nontidal Subtldal ·SaltmarshYes
HY Diurnal Flood 15 4 12 31
High 16 V 5 12 33
Ebb 24 8 29 61
Low 6 3 4 13
Noctumal Flood 6 17 25 48
High 1 9 7 17
- Ebb 0 17 22 39
Low 2 8 5 15
AHY Diurnal Flood 12 5 7 24
High 6 6 9 21
Ebb 15 7 19 41
Low 5 2 1 8
Nocturnal Flood 1 11 8 20High 1 11 8 20
Ebb 2‘
13 5 20
Low 1 3 5 9
No HY Diurnal Flood 54 2 29 85
High 25 6 43 74
Ebb 53 7 42 ° 102 _
Low 20 4 20 44
Nocturnal Flood 13 13 36 ‘ 62
High 4 9 68 V 81Ebb 15 23 55 93
· Low 8 17 28 53
AHY Diurnal Flood 43 1 16 60
High 29 4 22 55
Ebb 46 0 18 64
Low „ 22 0 15 37
Nocturnal Flood 7 6 25 38
High 3 12 44 59
Ebb 9 23 40 72
Low 3 11 29 43
TOTAL 467 ' 267 708 1442
'See text for explanation of variables.
144

Appendlx C. Least square' means and standard errors of fat, protein, water, and ash levels
ol black ducks collected durlng early, mid, and late winter at Chlncoteague, Virginia.
WINTER' COMPONENT FEMALEAdultJuvenile Adult Juvenile
EARLY Lipid index 0.45 + .11’ 0.16 + .09 0.59 + .08 0.58 + .15
Fat (Q) 101 +26 32+21 148+18 134+37
Fat (%) 29.9+4.3 13.8+3.5 35.2+3.0 34.1 +6.0
Protein (Q) 176+8 161+7 199+6 181+11
Protein (%) 54.3+3.9 70.6+3.1 51.7+2.7 51.2+5.5
_ Wate|' (Q) 595 +18 505 +15 629 +13 560 + 26Water (%) 64.7+1.8 68.9+1.4 61.6+1.2 60.6+2.5
Ash (9) 49+17 31+14 86+12 37+24
Ash (%) 14.9+4.3 13.7+3.5 21.6+3.0 11.3+6.0 V
MID Lipid index 0.76 +.08 0.45 + .08 0.65 + .11 0.43 +.1.5
Fat (9) 170+18 91+20 166+26 102+37
Fat (%) 42.4+3.0 30.4+3.2 38.2+4.3 30.2+6.0i
Protein (Q) 176+6 155+6 198+8 183+11
Protein (%) 45.0+2.7 55.0+2.9 47.9+3.9 54.0+5.5i
Water (Q) 575+13 496+14 634+18 592+26
Water (%) 59.4+1.2 63.5+1.3 60.3+1.8 63.6+2.5
Ash (9) 39+12 40+13 47+17 41 +24
Ash (%) 10.1 +3.0 13.8+3.2 11.3+4.3 12.3+6.0
LATE Lipid index 0.70 +.09 0.48 +.10 0.51 +.06 0.55 +.21
Fat (g) 159+21 99+23 132+16 134+52
Fat (%) 39.9+3.5 31.3+3.8 32.8+2.6 35.6+8.6
Protein (Q) 164+7 168+7 207+5 189+16
Protein (%) 43.8 +3.1 55.1 +3.4 53.0+2.3 50.1 +7.7
Water (g) 581 +15 532 +16 621 +11 569 + 37
Water (%) 60.4+1.4 63.3+1.6 61.2+1.1 60.2+3.5
Ash (Q) 46+14 44+15 52+10 57+34
Ash (%) 12.1 +3.5 14.5+3.8 13.4+2.6 15.1 +8.6
'Least squares estlmates from 3-way ANOVA of age, sex, and time.
'Carcasses (n=64) collected during three periods in winter 1985-86; 12 October·11 November
(early), 16-30 December(mid), and 31 January-13 February (late).
’PIus or minus one standard error.
145

Appendix D. Least square' means and standard errors of body components (g) of black ducks
collected during early, mid, and late winter at Chlncoteague, Virginia.
WINTER' COMPONENTFEMALE-
Adult Juvenile‘
Adult Juvenile
EARLY Whole carcass 1182244' 949 2 36 1303 2 31 11712 63
Nonfat dry carcass 226 26 196 2 5‘
250 2S 235 29
Dry flight muscle 3223 2823 4322 4425
Wet flight muscle 11424 98 23 12723 12026
Dry gizzard 12.322.3 11.521.8 19.521.6 20.423.2
Wet gizzard 43.923.4 38.222.8 47.722.4 43.524.8
Dry liver 9.820.9 6.220.8 8.720.7 6.321.3
Wet liver 33.122.7 21.422.2 26.9 21.9 21.923.8
MID Whole carcass 1219231 992233 1322244 1180263
Nonfat dry carcass 225 2 5 19725 256 2 7 236 2 9
. Dry flight muscle 3522 3223 4023 3225
Wet flight muscle 11523 10123 12724 11026
Dry gizzard 13.021.6 11.321.7 15.222.3 15.3 23.2
Wet gizzard 43.922.4 35.622.6 45.323.4 45.524.8
Dry liver 7.8 20.7 6.9 20.7 8.120.9 7.2 21.3
Wet llver 25.621.9 22.522.0 27.322.7 23.723.8
LATE Whole carcass 1200236 1066 240 1311227 1234289
Nonfat dry carcass 226 2 5 209 26 262 24 243 213
Dry flight muscle 4223 3223 4422 4427
Wet flight muscle 12123 109 24 13323 13029
Dry gizzard 15.921.8 11.422.0 16.421.4 13.824.5
Wet gizzard 35.722.8 30.023.1 41.022.1 32.926.8
Dry llver 9.820.8 8.520.8 9.720.6 19.521.9
Wet liver 31.522.2 29.622.4 31.221.6 54.625.3
‘Least squares estimates from 3-way ANOVA of age, sex, and time.
'Carcasses (n =64) collected during three periods in winter 1985-86; 12 October-11 November
(early), 16-30 December(mid), and 31 January-13 February (late).
’Plus or minus one standard error.
146

Related Documents