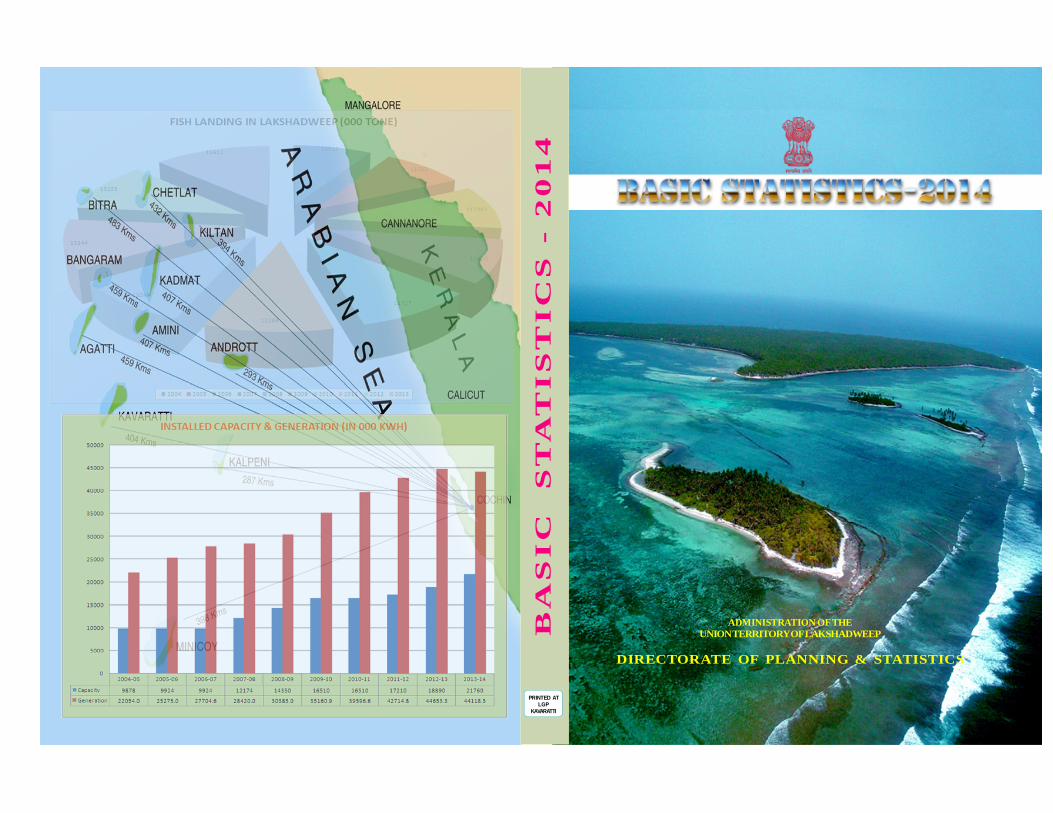
ADMINISTRATION OF THE UNION TERRITORYOFLAKSHADWEEP DIRECTORATE OF PLANNING & STATISTICS BASIC STATISTICS - 2014 PRINTED AT LGP KAVARATTI

Welcome message from author
This document is posted to help you gain knowledge. Please leave a comment to let me know what you think about it! Share it to your friends and learn new things together.
Transcript
ADMINISTRATION OF THEUNION TERRITORY OF LAKSHADWEEP
DIRECTORATE OF PLANNING & STATISTICS
BA
SIC
S
TA
TIS
TIC
S -
20
14
PRINTED ATLGP
KAVARATTI
UNION TERRITORY OFLAKSHADWEEP
BASIC
STATISTICS
2014
BY
DIRECTORATE OF PLANNING & STATISTICS,
SECRETARIAT, LAKSHADWEEP,
KAVARATTI
Phone No. 04896-262683, 263068 (Per & Fax), 263299
Email: [email protected]
Kavaratti
11-04-2015
Kavaratti
11-04-2015
Kavaratti
16-04-2015
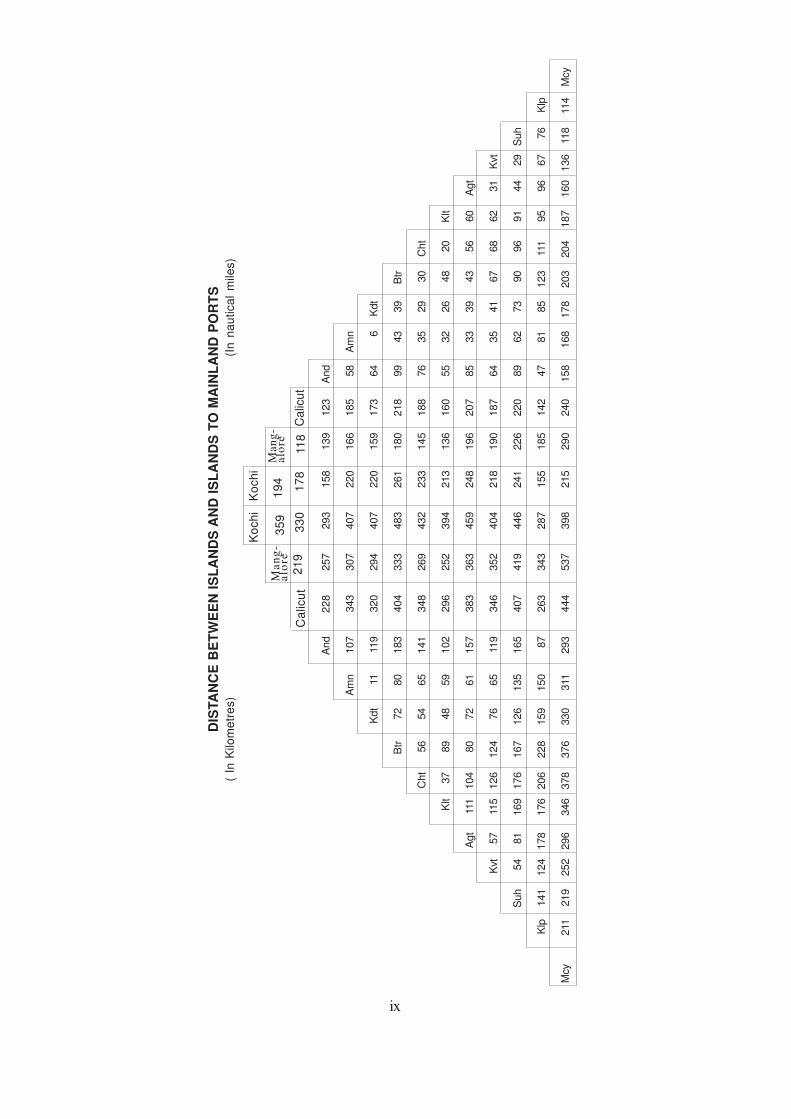
ix
Ko
ch
iK
och
i
And
22
8257
293
158
139
123
And
Am
n107
343
307
407
220
166
185
58
Am
n
Kdt
1111
9320
294
407
220
159
173
64
6K
dt
Btr
72
80
183
404
333
483
261
180
218
99
43
39
Btr
Cht
56
54
65
141
348
269
432
233
145
188
76
35
29
30
Cht
Klt
37
89
48
59
102
296
252
394
213
136
160
55
32
26
48
20
Klt
Agt
111
104
80
72
61
157
383
363
459
248
196
207
85
33
39
43
56
60
Agt
Kvt
57
115
126
124
76
65
119
346
352
404
218
190
187
64
35
41
67
68
62
31
Kvt
Suh
54
81
169
176
167
126
135
165
407
419
446
241
226
220
89
62
73
90
96
91
44
29
Suh
Klp
141
124
178
176
206
228
159
150
87
263
343
287
155
185
142
47
81
85
123
111
95
96
67
76
Klp
Mcy
211
219
252
296
346
378
376
330
311
293
444
537
398
215
290
240
158
168
178
203
204
187
160
136
118
114
Mcy
DIS
TA
NC
E B
ET
WE
EN
IS
LA
ND
S A
ND
IS
LA
ND
S T
O M
AIN
LA
ND
PO
RT
S
( In
Kilo
me
tre
s)
(In
na
utica
l m
iles)
35
9M
an
g-
alo
reM
an
g-
alo
re1
94
Ca
licu
t2
19
33
01
78
11
8C
alic
ut
xi
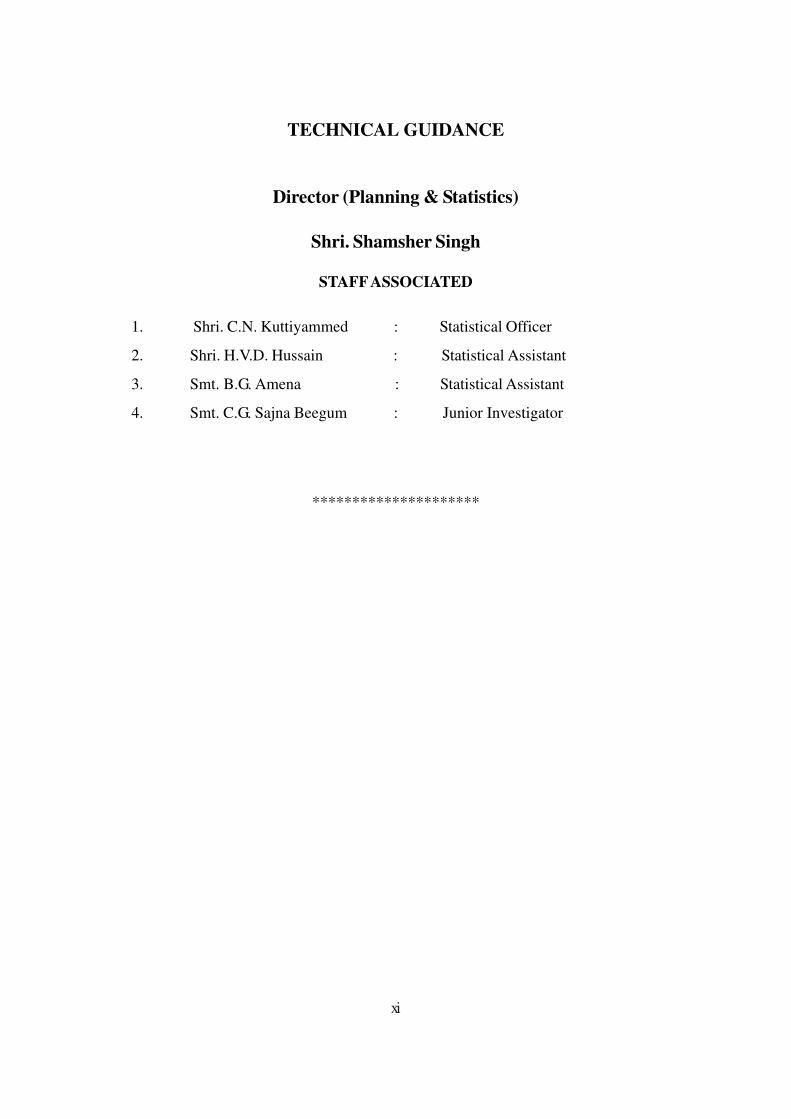
TECHNICAL GUIDANCE
Director (Planning & Statistics)
Shri. Shamsher Singh
STAFF ASSOCIATED
1. Shri. C.N. Kuttiyammed : Statistical Officer
2. Shri. H.V.D. Hussain : Statistical Assistant
3. Smt. B.G. Amena : Statistical Assistant
4. Smt. C.G. Sajna Beegum : Junior Investigator
*********************
xiii
Title
CONTENTS
Table Page
No. No.
GENERAL
1 Major Indicator 2013—2014 1-6
CLIMATE
1 Normal and actual rainfall in Lakshadweep 7
2 Temperature in Lakshadweep 7-9
3 Rainfall recorded at various centres 9
AREA AND POPULATION
1 Island-wise area and population (2011 Census) 10
2 Name and area of uninhabited islands. 11
3 Population in Lakshadweep since 1901 11
4 Island-wise Scheduled Tribe Population (2001 & 2011 Census) 13
5 Decennial growth rate 2001-2011 13
6 Sex ratio (1901-2011 Census) 13
7 Island-wise houses and house-holds 14
8 Density of population 14-15
AGRICULTURE
1 Land utilisation statistics of Lakshadweep. 16
2 Distribution of seeds 16
3 Island-wise labour strength 17
4 Coconut harvested 17
AGRICULTURAL CENSUS
1 Agricultural operational holdings 18-19
2 Operational Holdings (Nos) in Percentages - Lakshadweep 19
3 Operational holdings and area operated 20
4 Estimated area by size of Class and Land use 20-22
5 Operational holdings by tenure 22-23
ANIMAL HUSBANDRY
1 Livestock census and poultry 24
2 Veterinary facilities 24
3 Milk production in Govt.dairy units/farm 25
4 Milk production in Private 25
5 Egg production in Govt.poultry units/farm 26
6 Egg production under private sector 26
7 Cattle in Govt.demonstration units/farm 27
8 Poultry in Govt.demonstration units/farm 27
9 Labourers strength in Animal Husbandry 27
10 Chicks Production in Govt. Hatcheries 27
11 Details of Treatment 28
12 Island wise Broiler Meat Production 28
FISHERIES
1 Fisheries in Lakshadweep 29
2 Quantity and value of fish landing in Lakshadweep 29
3 Island-wise fish landing and its value 30
4 Major species of Fish landing in Lakshadweep 31
5 Fish products exported 32
xiv
6 Island wise Tuna Landing 32
7 Island-wise labour engaged 33
8 Island wise cold storages availablilty & Tunnel Freezers 33
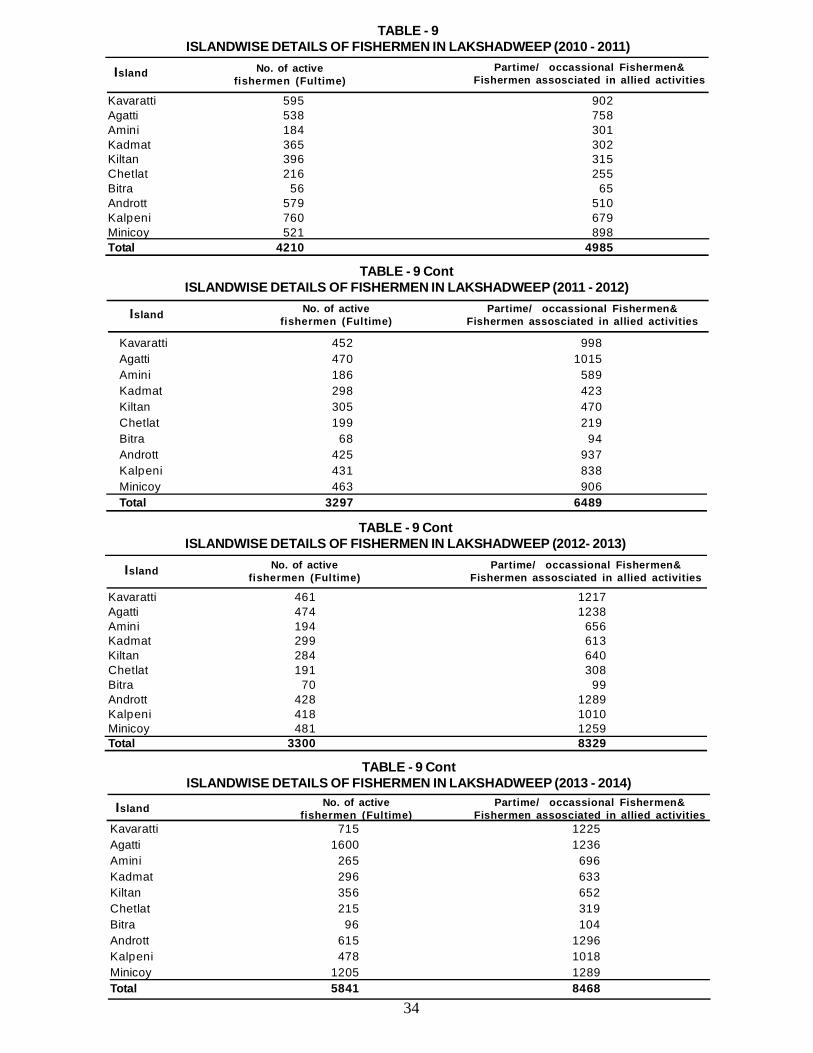
9 Island wise details of Fishermen in Lakshadweep 34
EDUCATION
1 Literacy in Lakshadweep 35
2 Island wise & Sex wise literates (2011 Census) 35
3 Island-wise literacy as a percentage of total population 35
4 Educational institutions in Lakshadweep 36
5 Educational institutions, Enrolment and Teachers 36
6 Institution-wise scholars 37
7 Year wise Result (SSLC) 38
8 Institution-wise Result (SSLC) 39-40
9 Institution-wise Result (X CBSE) 41
10 Year wise Result of PDC/Plus Two level of Education. 41-42
11 Year wise Result of XII CBSE 43
12 Year wise Result of KVK & Navodaya 43
13 Year wise CBSE XII Result of Navodaya 43
14 Year wise Result of B.ed course 43
15 Gender wise enrollement of Scholars Calicut University Centre, Kadmat 43-44
16 Year wise Result of Calicut University Centres, Kadmat 44
17 Gender wise enrollement of Scholars P.M. Sayed Calicut University Centre, Androt 44-45
18 Year wise Result of P.M. Sayed Calicut University Centres, Androt 45
19 Dr. B.R. Ambedkar Govt. Industrial Training Institute, Kavaratti 45
SPORTS & YOUTH AFFAIRS
1 Island wise availablity of Sports Infrastructure 46
2 Activities undertaken for promotion of sports and games 46
3 Activities undertaken for youths and Govt. employees 47
4 Performance of varios competition 47
JAWAHAR NAVODAYA VIDYALAYA
1 Year wise & Sex wise student strength 48
2 Year wise Result in AISSE & AISSCE 48
3 Teacher strength 48
KENDRIYA VIDYALAYA
1 Enrollment and Staff 49
INDUSTRIAL TRAINING INSTITUTE
1 Stenography 50
2 Cutting & Tailoring 50
3 Carpentry 50
4 Diesel Mechanic 50
MEDICAL AND PUBLIC HEALTH
1 Medical facilities in Lakshadweep 51
2 Tehsil-wise/block-wise hospital and dispensaries 51
3 Bed strength of hospitals/primary health centres/CHC’s 52
4 Year wise Out-patient and In patient 52
5 Island wise Out-patient and in patient 52
6 Assistance under National Illness Fund 54
7 Patients evacuated from other Island to Kavaratti, RGSH Agatti & to 54
mainland for specialised treatment.
8 Pulse polio 55
9 Pulse polio Immunization 55
Table
No.Title
Page
No.
xv
FAMILY WELFARE
1 Sterilisation operations performed 56
2 Island-wise family welfare activities 56-59
3 Demography of Lakshadweep 59
4 Year wise and sex wise Birth and Death ratio 59
5 Prevalent communicable diseases in Lakshadweep 60-61
6 Pregnant women registered 61
7 Immunization Status 61
8 Status of HIV+ve cases 62
9 Number of TB Patient 62
LEAGAL METROLOGY AND CONSUMER AFFAIRS
1 Legal Metrology & Consumer Affairs 63
SHIPPING AND TRANSPORT
1 Ships/ferry vessel plying between mainland and island 64
2 Island-wise passenger traffic by Ship/Ferry vessel 65-75
3 Island-wise and year-wise passenger traffic by Ship/Ferry vessel 76-77
4 Year-wise passenger traffic by Ship/Ferry vessel 78-79
5 Passenger summary- All routes 79-81
6 Total number of passengers travelled in all ship 82
7 Cargo transported by ship/Charted Vessel 83-86
8 Passenger fares for mainland and inter island helicopter services 86-87
9 Concessional Helicopter fare for Medical Evacuation 87-88
10 Revised Tourist fare in Helicopter 88
11 Passenger traffic by Helicopter 88
12 Ship fare and Revised ship fare of passenger ships 89-98
13 IIF/HSV fare 99-100
14 Passenger Traffic by Ships / Ferry Vessel 100-101
15 Passenger summary- All routes 101-102
16 Passenger summary- Inter Island 102-103
17 Total number of passengers travelled in all ship 104
REGIONAL TRANSPORT
1 No. of Registered Vehicles 105-109
2 Revenue Earned 110
PUBLIC WORKS DEPARTMENT
1 Road length in Lakshadweep 111
2 Island-wise road constructed 111
3 Govt. quarters constructed by P.W.D 111
4 Island-wise workcharged employees and labour strength 112-113
5 Island-wise shore protected in meters 113
6 Details of Wells, Ponds, Hand Pumps etc. 113-114
7 Construction of Rain water Tank 114
8 Cumulative data as on 31-03-2014 115
DEPARTMENT OF TELECOMMUNICATION
1 Telecommunication facilities in Lakshadweep 116
2 Telphone facilities 116-117
3 Details of exchanges 118-119
4 Global system for mobile communication 119
5 Postal facilities in Lakshadweep 120
6 Other premium services 120
Table
No.Title
Page
No.
xvi
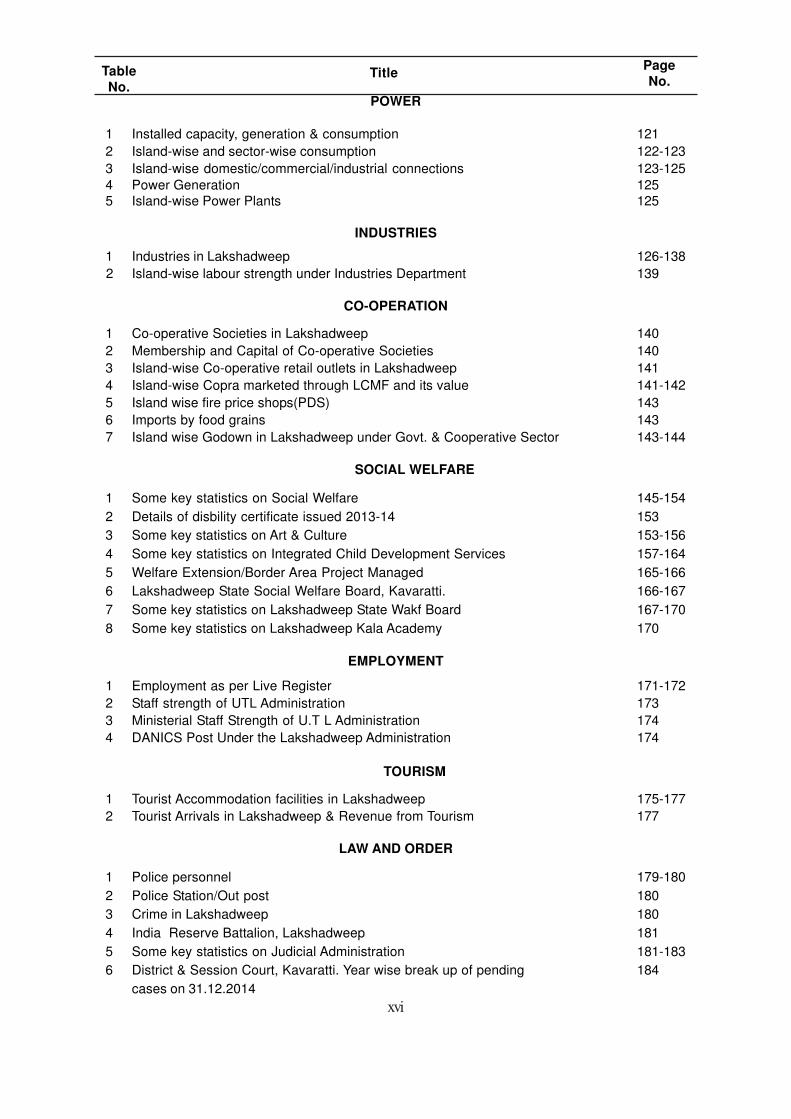
POWER
1 Installed capacity, generation & consumption 121
2 Island-wise and sector-wise consumption 122-123
3 Island-wise domestic/commercial/industrial connections 123-125
4 Power Generation 125
5 Island-wise Power Plants 125
INDUSTRIES
1 Industries in Lakshadweep 126-138
2 Island-wise labour strength under Industries Department 139
CO-OPERATION
1 Co-operative Societies in Lakshadweep 140
2 Membership and Capital of Co-operative Societies 140
3 Island-wise Co-operative retail outlets in Lakshadweep 141
4 Island-wise Copra marketed through LCMF and its value 141-142
5 Island wise fire price shops(PDS) 143
6 Imports by food grains 143
7 Island wise Godown in Lakshadweep under Govt. & Cooperative Sector 143-144
SOCIAL WELFARE
1 Some key statistics on Social Welfare 145-154
2 Details of disbility certificate issued 2013-14 153
3 Some key statistics on Art & Culture 153-156
4 Some key statistics on Integrated Child Development Services 157-164
5 Welfare Extension/Border Area Project Managed 165-166
6 Lakshadweep State Social Welfare Board, Kavaratti. 166-167
7 Some key statistics on Lakshadweep State Wakf Board 167-170
8 Some key statistics on Lakshadweep Kala Academy 170
EMPLOYMENT
1 Employment as per Live Register 171-172
2 Staff strength of UTL Administration 173
3 Ministerial Staff Strength of U.T L Administration 174
4 DANICS Post Under the Lakshadweep Administration 174
TOURISM
1 Tourist Accommodation facilities in Lakshadweep 175-177
2 Tourist Arrivals in Lakshadweep & Revenue from Tourism 177
LAW AND ORDER
1 Police personnel 179-180
2 Police Station/Out post 180
3 Crime in Lakshadweep 180
4 India Reserve Battalion, Lakshadweep 181
5 Some key statistics on Judicial Administration 181-183
6 District & Session Court, Kavaratti. Year wise break up of pending 184
cases on 31.12.2014
Table
No.Title
Page
No.
xvii
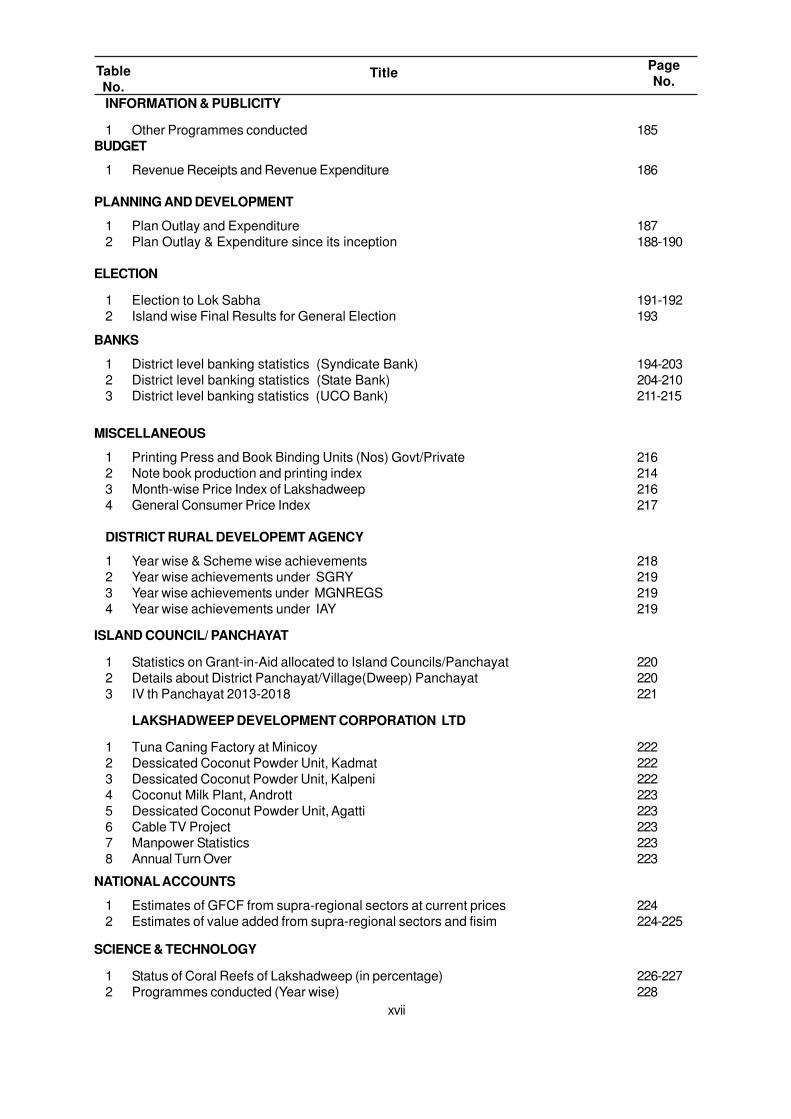
INFORMATION & PUBLICITY
1 Other Programmes conducted 185
BUDGET
1 Revenue Receipts and Revenue Expenditure 186
PLANNING AND DEVELOPMENT
1 Plan Outlay and Expenditure 187
2 Plan Outlay & Expenditure since its inception 188-190
ELECTION
1 Election to Lok Sabha 191-192
2 Island wise Final Results for General Election 193
BANKS
1 District level banking statistics (Syndicate Bank) 194-203
2 District level banking statistics (State Bank) 204-210
3 District level banking statistics (UCO Bank) 211-215
MISCELLANEOUS
1 Printing Press and Book Binding Units (Nos) Govt/Private 216
2 Note book production and printing index 214
3 Month-wise Price Index of Lakshadweep 216
4 General Consumer Price Index 217
DISTRICT RURAL DEVELOPEMT AGENCY
1 Year wise & Scheme wise achievements 218
2 Year wise achievements under SGRY 219
3 Year wise achievements under MGNREGS 219
4 Year wise achievements under IAY 219
ISLAND COUNCIL/ PANCHAYAT
1 Statistics on Grant-in-Aid allocated to Island Councils/Panchayat 220
2 Details about District Panchayat/Village(Dweep) Panchayat 220
3 IV th Panchayat 2013-2018 221
LAKSHADWEEP DEVELOPMENT CORPORATION LTD
1 Tuna Caning Factory at Minicoy 222
2 Dessicated Coconut Powder Unit, Kadmat 222
3 Dessicated Coconut Powder Unit, Kalpeni 222
4 Coconut Milk Plant, Andrott 223
5 Dessicated Coconut Powder Unit, Agatti 223
6 Cable TV Project 223
7 Manpower Statistics 223
8 Annual Turn Over 223
NATIONAL ACCOUNTS
1 Estimates of GFCF from supra-regional sectors at current prices 224
2 Estimates of value added from supra-regional sectors and fisim 224-225
SCIENCE & TECHNOLOGY
1 Status of Coral Reefs of Lakshadweep (in percentage) 226-227
2 Programmes conducted (Year wise) 228
Table
No.Title
Page
No.
xviii
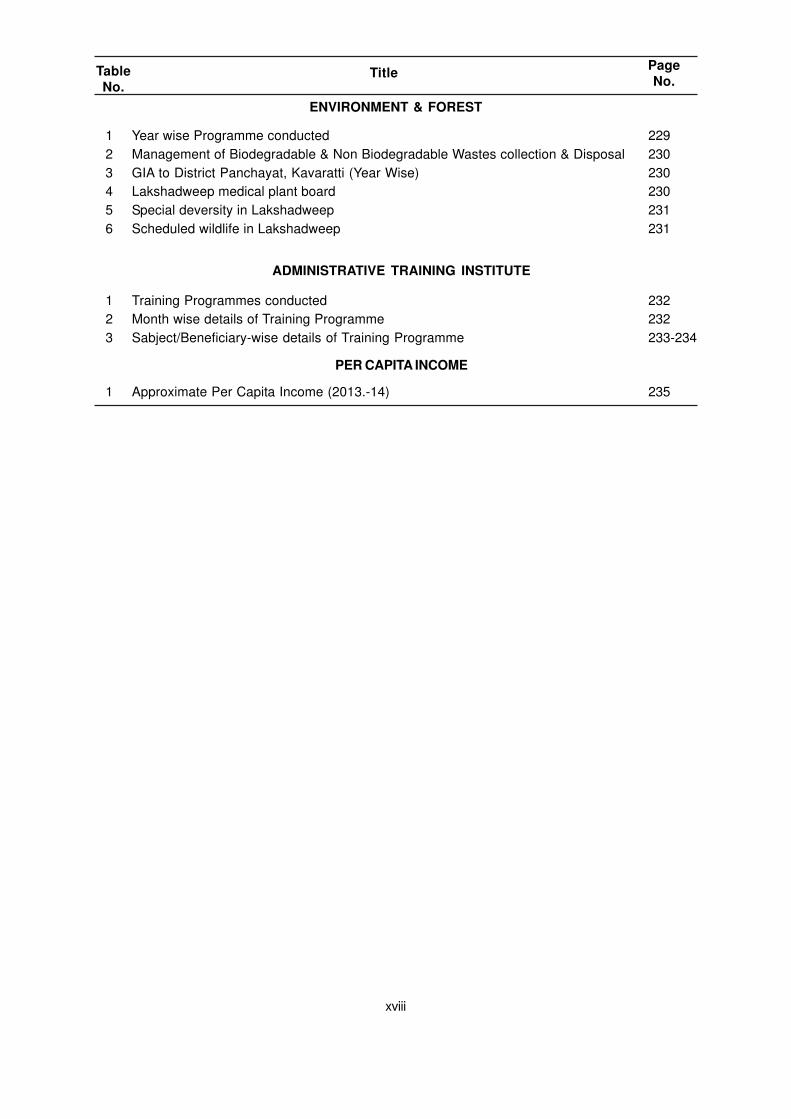
ENVIRONMENT & FOREST
1 Year wise Programme conducted 229
2 Management of Biodegradable & Non Biodegradable Wastes collection & Disposal 230
3 GIA to District Panchayat, Kavaratti (Year Wise) 230
4 Lakshadweep medical plant board 230
5 Special deversity in Lakshadweep 231
6 Scheduled wildlife in Lakshadweep 231
ADMINISTRATIVE TRAINING INSTITUTE
1 Training Programmes conducted 232
2 Month wise details of Training Programme 232
3 Sabject/Beneficiary-wise details of Training Programme 233-234
PER CAPITA INCOME
1 Approximate Per Capita Income (2013.-14) 235
Table
No.Title
Page
No.
1
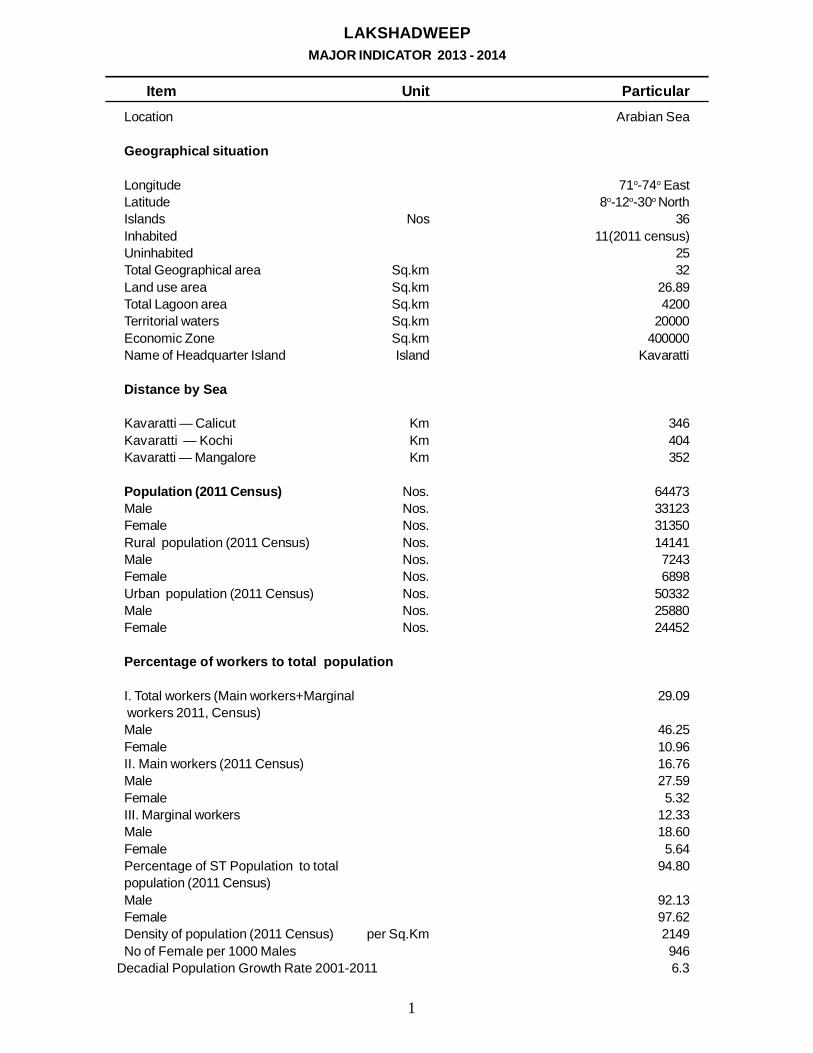
LAKSHADWEEPMAJOR INDICATOR 2013 - 2014
Item Unit ParticularLocation Arabian Sea
Geographical situation
Longitude 71o-74o EastLatitude 8o-12o-30o NorthIslands Nos 36Inhabited 11(2011 census)Uninhabited 25Total Geographical area Sq.km 32Land use area Sq.km 26.89Total Lagoon area Sq.km 4200Territorial waters Sq.km 20000Economic Zone Sq.km 400000Name of Headquarter Island Island Kavaratti
Distance by Sea
Kavaratti — Calicut Km 346Kavaratti — Kochi Km 404Kavaratti — Mangalore Km 352
Population (2011 Census) Nos. 64473Male Nos. 33123Female Nos. 31350Rural population (2011 Census) Nos. 14141Male Nos. 7243Female Nos. 6898Urban population (2011 Census) Nos. 50332Male Nos. 25880Female Nos. 24452
Percentage of workers to total population
I. Total workers (Main workers+Marginal 29.09 workers 2011, Census)Male 46.25Female 10.96II. Main workers (2011 Census) 16.76Male 27.59Female 5.32III. Marginal workers 12.33Male 18.60Female 5.64Percentage of ST Population to total 94.80population (2011 Census)Male 92.13Female 97.62Density of population (2011 Census) per Sq.Km 2149No of Female per 1000 Males 946
Decadial Population Growth Rate 2001-2011 6.3
2
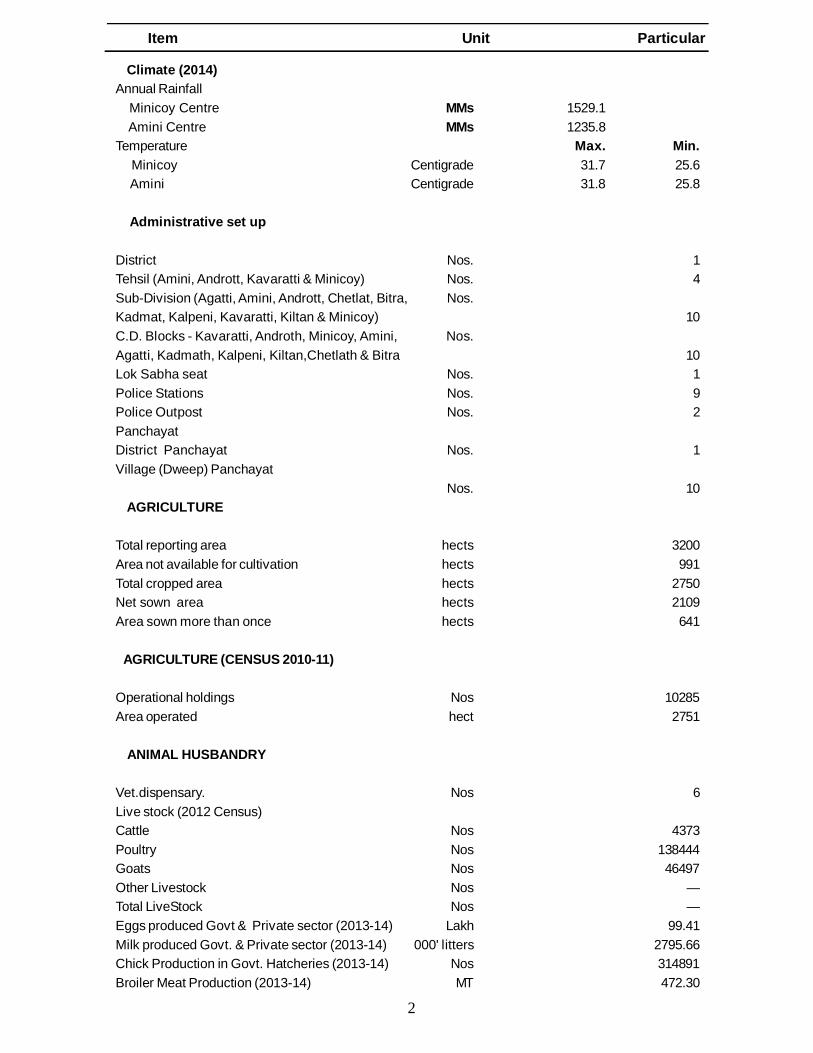
Climate (2014)Annual Rainfall Minicoy Centre MMs 1529.1 Amini Centre MMs 1235.8Temperature Max. Min. Minicoy Centigrade 31.7 25.6 Amini Centigrade 31.8 25.8
Administrative set up
District Nos. 1Tehsil (Amini, Andrott, Kavaratti & Minicoy) Nos. 4Sub-Division (Agatti, Amini, Andrott, Chetlat, Bitra, Nos.Kadmat, Kalpeni, Kavaratti, Kiltan & Minicoy) 10C.D. Blocks - Kavaratti, Androth, Minicoy, Amini, Nos.Agatti, Kadmath, Kalpeni, Kiltan,Chetlath & Bitra 10Lok Sabha seat Nos. 1Police Stations Nos. 9Police Outpost Nos. 2PanchayatDistrict Panchayat Nos. 1Village (Dweep) Panchayat
Nos. 10 AGRICULTURE
Total reporting area hects 3200Area not available for cultivation hects 991Total cropped area hects 2750Net sown area hects 2109Area sown more than once hects 641
AGRICULTURE (CENSUS 2010-11)
Operational holdings Nos 10285Area operated hect 2751
ANIMAL HUSBANDRY
Vet.dispensary. Nos 6Live stock (2012 Census)Cattle Nos 4373Poultry Nos 138444Goats Nos 46497Other Livestock Nos —Total LiveStock Nos —Eggs produced Govt & Private sector (2013-14) Lakh 99.41Milk produced Govt. & Private sector (2013-14) 000' litters 2795.66Chick Production in Govt. Hatcheries (2013-14) Nos 314891Broiler Meat Production (2013-14) MT 472.30
Item Unit Particular
3
Item Unit Particular
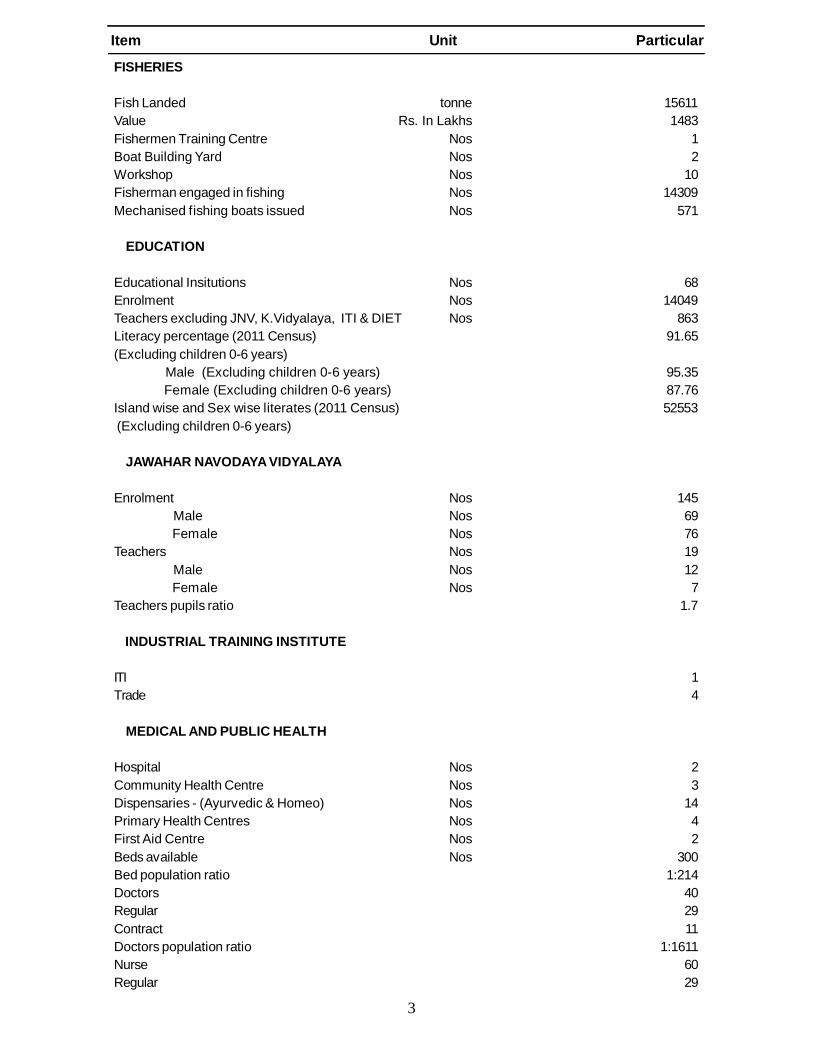
FISHERIES
Fish Landed tonne 15611Value Rs. In Lakhs 1483Fishermen Training Centre Nos 1Boat Building Yard Nos 2Workshop Nos 10Fisherman engaged in fishing Nos 14309Mechanised fishing boats issued Nos 571
EDUCATION
Educational Insitutions Nos 68Enrolment Nos 14049Teachers excluding JNV, K.Vidyalaya, ITI & DIET Nos 863Literacy percentage (2011 Census) 91.65(Excluding children 0-6 years) Male (Excluding children 0-6 years) 95.35 Female (Excluding children 0-6 years) 87.76Island wise and Sex wise literates (2011 Census) 52553 (Excluding children 0-6 years)
JAWAHAR NAVODAYA VIDYALAYA
Enrolment Nos 145 Male Nos 69 Female Nos 76Teachers Nos 19 Male Nos 12 Female Nos 7Teachers pupils ratio 1.7
INDUSTRIAL TRAINING INSTITUTE
ITI 1Trade 4
MEDICAL AND PUBLIC HEALTH
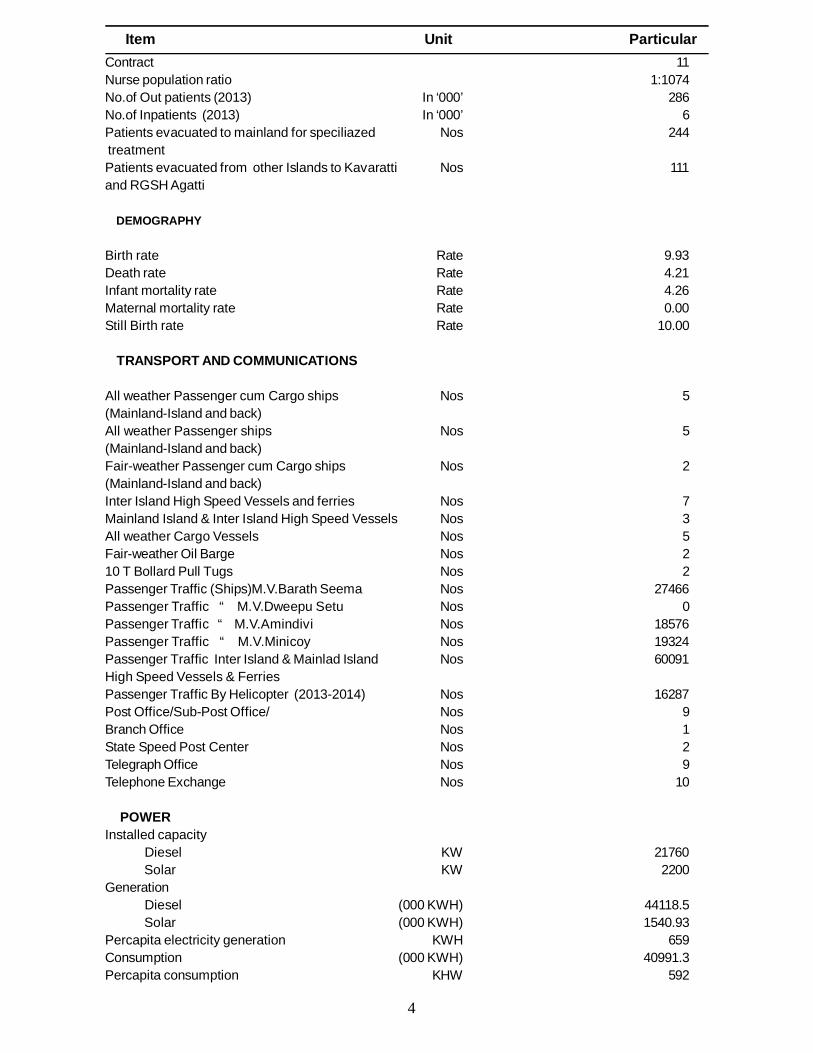
Hospital Nos 2Community Health Centre Nos 3Dispensaries - (Ayurvedic & Homeo) Nos 14Primary Health Centres Nos 4First Aid Centre Nos 2Beds available Nos 300Bed population ratio 1:214Doctors 40Regular 29Contract 11Doctors population ratio 1:1611Nurse 60Regular 29
4
Item Unit ParticularContract 11Nurse population ratio 1:1074No.of Out patients (2013) In ‘000’ 286No.of Inpatients (2013) In ‘000’ 6Patients evacuated to mainland for speciliazed Nos 244 treatmentPatients evacuated from other Islands to Kavaratti Nos 111and RGSH Agatti
DEMOGRAPHY
Birth rate Rate 9.93Death rate Rate 4.21Infant mortality rate Rate 4.26Maternal mortality rate Rate 0.00Still Birth rate Rate 10.00
TRANSPORT AND COMMUNICATIONS
All weather Passenger cum Cargo ships Nos 5(Mainland-Island and back)All weather Passenger ships Nos 5(Mainland-Island and back)Fair-weather Passenger cum Cargo ships Nos 2(Mainland-Island and back)Inter Island High Speed Vessels and ferries Nos 7Mainland Island & Inter Island High Speed Vessels Nos 3All weather Cargo Vessels Nos 5Fair-weather Oil Barge Nos 210 T Bollard Pull Tugs Nos 2Passenger Traffic (Ships)M.V.Barath Seema Nos 27466Passenger Traffic “ M.V.Dweepu Setu Nos 0Passenger Traffic “ M.V.Amindivi Nos 18576Passenger Traffic “ M.V.Minicoy Nos 19324Passenger Traffic Inter Island & Mainlad Island Nos 60091High Speed Vessels & FerriesPassenger Traffic By Helicopter (2013-2014) Nos 16287Post Office/Sub-Post Office/ Nos 9Branch Office Nos 1State Speed Post Center Nos 2Telegraph Office Nos 9Telephone Exchange Nos 10
POWERInstalled capacity Diesel KW 21760 Solar KW 2200Generation Diesel (000 KWH) 44118.5 Solar (000 KWH) 1540.93Percapita electricity generation KWH 659Consumption (000 KWH) 40991.3Percapita consumption KHW 592
5
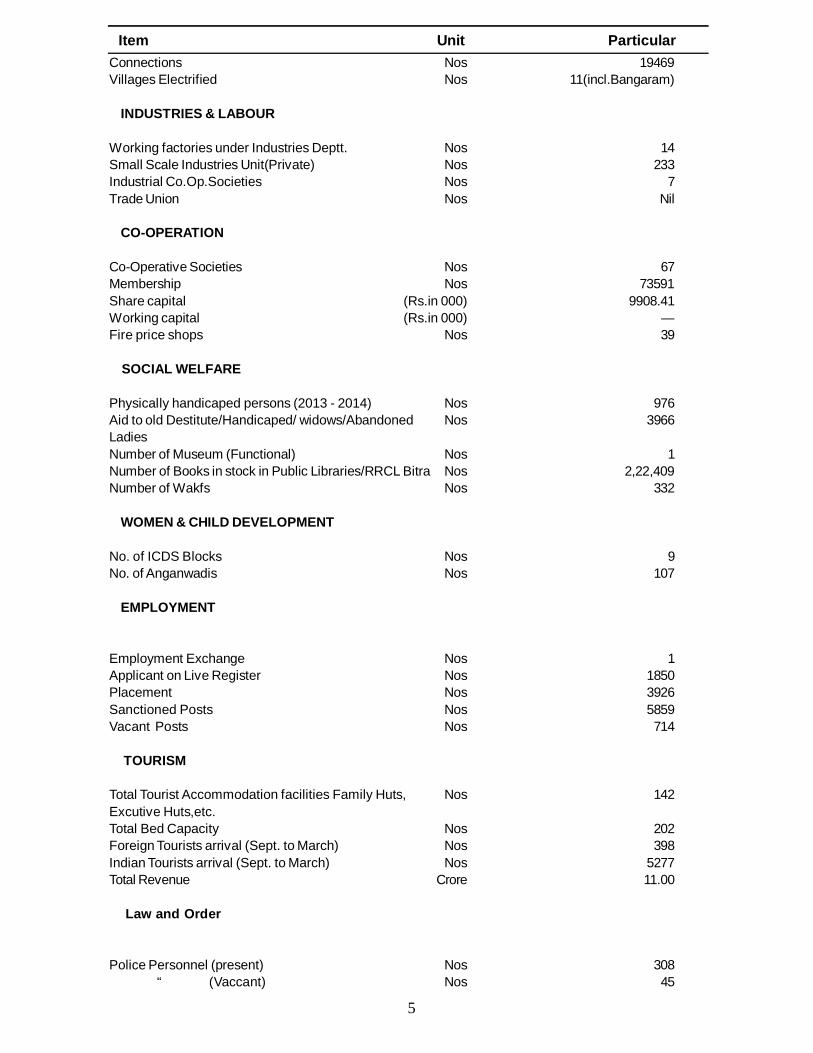
Item Unit ParticularConnections Nos 19469Villages Electrified Nos 11(incl.Bangaram)
INDUSTRIES & LABOUR
Working factories under Industries Deptt. Nos 14Small Scale Industries Unit(Private) Nos 233Industrial Co.Op.Societies Nos 7Trade Union Nos Nil
CO-OPERATION
Co-Operative Societies Nos 67Membership Nos 73591Share capital (Rs.in 000) 9908.41Working capital (Rs.in 000) —Fire price shops Nos 39
SOCIAL WELFARE
Physically handicaped persons (2013 - 2014) Nos 976Aid to old Destitute/Handicaped/ widows/Abandoned Nos 3966LadiesNumber of Museum (Functional) Nos 1Number of Books in stock in Public Libraries/RRCL Bitra Nos 2,22,409Number of Wakfs Nos 332
WOMEN & CHILD DEVELOPMENT
No. of ICDS Blocks Nos 9No. of Anganwadis Nos 107
EMPLOYMENT
Employment Exchange Nos 1Applicant on Live Register Nos 1850Placement Nos 3926Sanctioned Posts Nos 5859Vacant Posts Nos 714
TOURISM
Total Tourist Accommodation facilities Family Huts, Nos 142Excutive Huts,etc.Total Bed Capacity Nos 202Foreign Tourists arrival (Sept. to March) Nos 398Indian Tourists arrival (Sept. to March) Nos 5277Total Revenue Crore 11.00
Law and Order
Police Personnel (present) Nos 308 “ (Vaccant) Nos 45
6
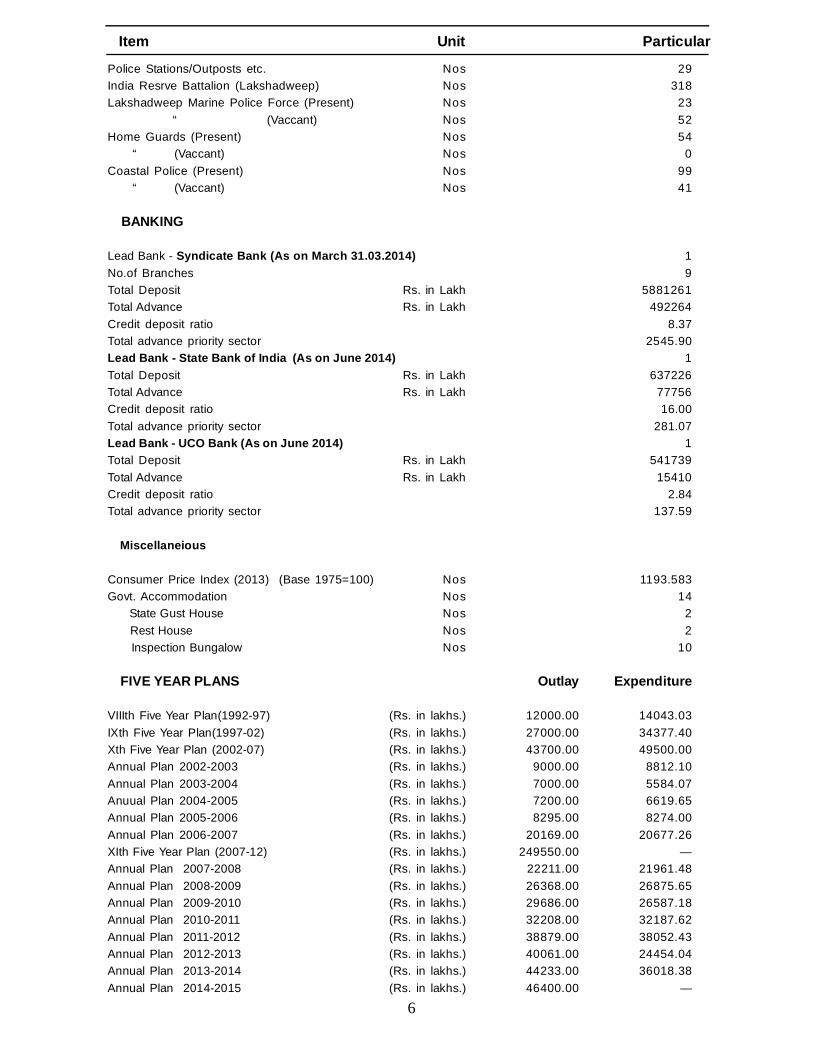
Item Unit Particular
Police Stations/Outposts etc. Nos 29India Resrve Battalion (Lakshadweep) Nos 318Lakshadweep Marine Police Force (Present) Nos 23 “ (Vaccant) Nos 52Home Guards (Present) Nos 54 “ (Vaccant) Nos 0Coastal Police (Present) Nos 99 “ (Vaccant) Nos 41
BANKING
Lead Bank - Syndicate Bank (As on March 31.03.2014) 1No.of Branches 9Total Deposit Rs. in Lakh 5881261Total Advance Rs. in Lakh 492264Credit deposit ratio 8.37Total advance priority sector 2545.90Lead Bank - State Bank of India (As on June 2014) 1Total Deposit Rs. in Lakh 637226Total Advance Rs. in Lakh 77756Credit deposit ratio 16.00Total advance priority sector 281.07Lead Bank - UCO Bank (As on June 2014) 1Total Deposit Rs. in Lakh 541739Total Advance Rs. in Lakh 15410Credit deposit ratio 2.84Total advance priority sector 137.59
Miscellaneious
Consumer Price Index (2013) (Base 1975=100) Nos 1193.583Govt. Accommodation Nos 14 State Gust House Nos 2 Rest House Nos 2 Inspection Bungalow Nos 10
FIVE YEAR PLANS Outlay Expenditure
VIIIth Five Year Plan(1992-97) (Rs. in lakhs.) 12000.00 14043.03IXth Five Year Plan(1997-02) (Rs. in lakhs.) 27000.00 34377.40Xth Five Year Plan (2002-07) (Rs. in lakhs.) 43700.00 49500.00Annual Plan 2002-2003 (Rs. in lakhs.) 9000.00 8812.10Annual Plan 2003-2004 (Rs. in lakhs.) 7000.00 5584.07Anuual Plan 2004-2005 (Rs. in lakhs.) 7200.00 6619.65Annual Plan 2005-2006 (Rs. in lakhs.) 8295.00 8274.00Annual Plan 2006-2007 (Rs. in lakhs.) 20169.00 20677.26XIth Five Year Plan (2007-12) (Rs. in lakhs.) 249550.00 —Annual Plan 2007-2008 (Rs. in lakhs.) 22211.00 21961.48Annual Plan 2008-2009 (Rs. in lakhs.) 26368.00 26875.65Annual Plan 2009-2010 (Rs. in lakhs.) 29686.00 26587.18Annual Plan 2010-2011 (Rs. in lakhs.) 32208.00 32187.62Annual Plan 2011-2012 (Rs. in lakhs.) 38879.00 38052.43Annual Plan 2012-2013 (Rs. in lakhs.) 40061.00 24454.04Annual Plan 2013-2014 (Rs. in lakhs.) 44233.00 36018.38Annual Plan 2014-2015 (Rs. in lakhs.) 46400.00 —
7
2005 1400.2 1388.2 1644.6 1504.82006 1803.7 1645.0 1644.6 1504.82007 1473.9 2211.2 1645.6 1504.92008 1928.0 1839.1 1645.6 1504.92009 1422.4 1798.3 1644.6 1504.92010 1891.5 1945.1 1644.6 1504.92011 1531.0 1335.1 1673.7 1521.72012 1424.4 1463.4 1673.7 1521.72013 1620.7 1292.7 1673.7 1521.72014 1529.1 1235.8 1673.7 1521.7
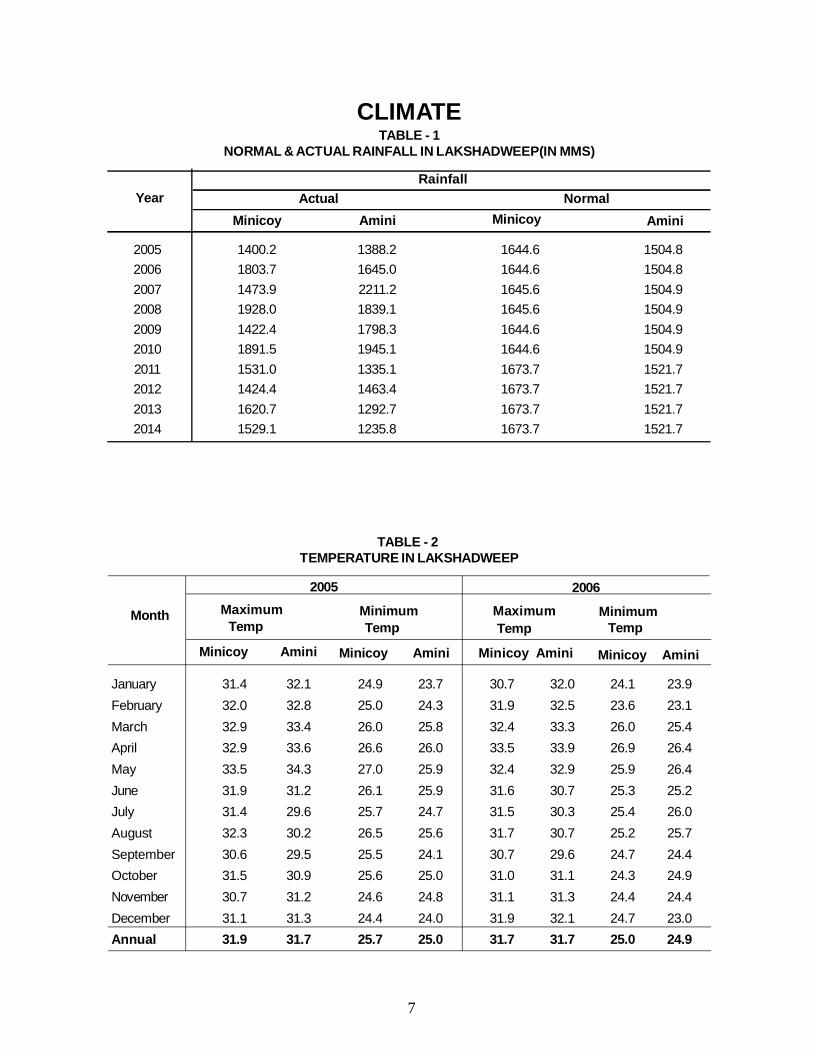
CLIMATETABLE - 1
NORMAL & ACTUAL RAINFALL IN LAKSHADWEEP(IN MMS)
Rainfall Year Actual Normal
Minicoy Amini Minicoy Amini
January 31.4 32.1 24.9 23.7 30.7 32.0 24.1 23.9February 32.0 32.8 25.0 24.3 31.9 32.5 23.6 23.1March 32.9 33.4 26.0 25.8 32.4 33.3 26.0 25.4April 32.9 33.6 26.6 26.0 33.5 33.9 26.9 26.4May 33.5 34.3 27.0 25.9 32.4 32.9 25.9 26.4June 31.9 31.2 26.1 25.9 31.6 30.7 25.3 25.2July 31.4 29.6 25.7 24.7 31.5 30.3 25.4 26.0August 32.3 30.2 26.5 25.6 31.7 30.7 25.2 25.7September 30.6 29.5 25.5 24.1 30.7 29.6 24.7 24.4October 31.5 30.9 25.6 25.0 31.0 31.1 24.3 24.9November 30.7 31.2 24.6 24.8 31.1 31.3 24.4 24.4December 31.1 31.3 24.4 24.0 31.9 32.1 24.7 23.0Annual 31.9 31.7 25.7 25.0 31.7 31.7 25.0 24.9
TABLE - 2 TEMPERATURE IN LAKSHADWEEP
2005 2006Maximum Minimum Maximum MinimumMonth
Temp Temp Temp Temp
Minicoy Amini Minicoy Amini Minicoy Amini Minicoy Amini
8
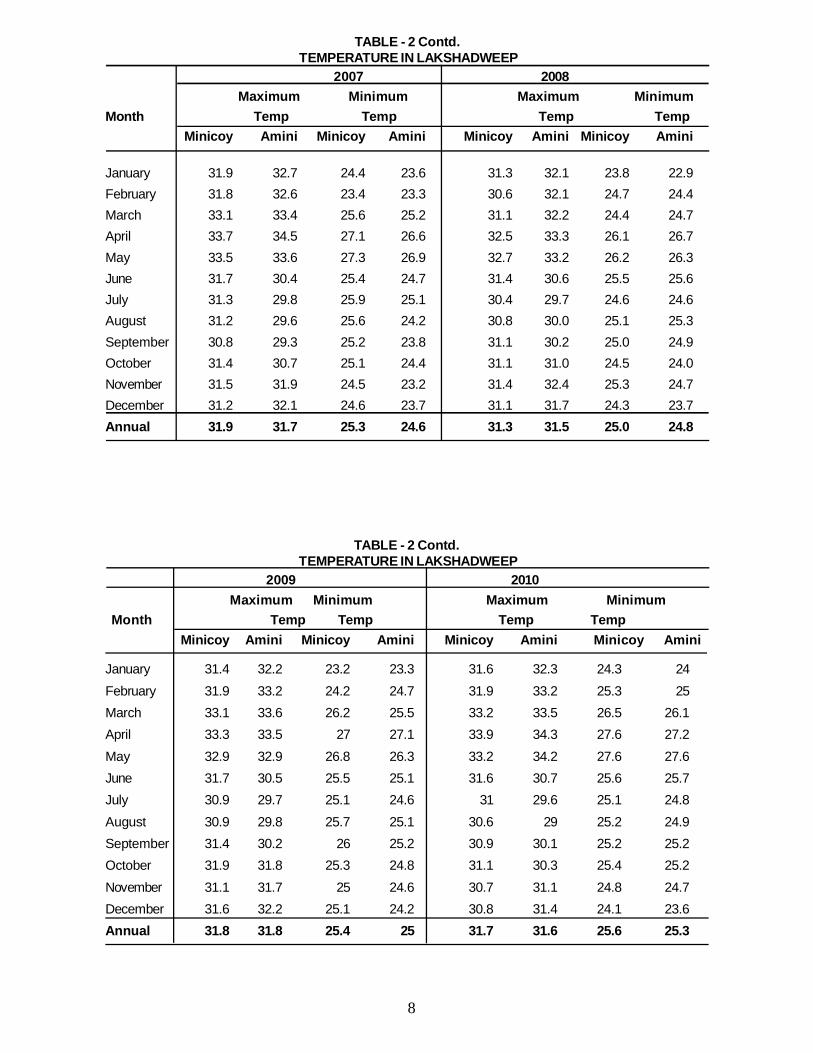
TABLE - 2 Contd. TEMPERATURE IN LAKSHADWEEP
2007 2008 Maximum Minimum Maximum Minimum
Month Temp Temp Temp TempMinicoy Amini Minicoy Amini Minicoy Amini Minicoy Amini
January 31.9 32.7 24.4 23.6 31.3 32.1 23.8 22.9February 31.8 32.6 23.4 23.3 30.6 32.1 24.7 24.4March 33.1 33.4 25.6 25.2 31.1 32.2 24.4 24.7April 33.7 34.5 27.1 26.6 32.5 33.3 26.1 26.7May 33.5 33.6 27.3 26.9 32.7 33.2 26.2 26.3June 31.7 30.4 25.4 24.7 31.4 30.6 25.5 25.6July 31.3 29.8 25.9 25.1 30.4 29.7 24.6 24.6August 31.2 29.6 25.6 24.2 30.8 30.0 25.1 25.3September 30.8 29.3 25.2 23.8 31.1 30.2 25.0 24.9October 31.4 30.7 25.1 24.4 31.1 31.0 24.5 24.0November 31.5 31.9 24.5 23.2 31.4 32.4 25.3 24.7December 31.2 32.1 24.6 23.7 31.1 31.7 24.3 23.7Annual 31.9 31.7 25.3 24.6 31.3 31.5 25.0 24.8
TABLE - 2 Contd. TEMPERATURE IN LAKSHADWEEP
2009 2010Maximum Minimum Maximum Minimum
Month Temp Temp Temp TempMinicoy Amini Minicoy Amini Minicoy Amini Minicoy Amini
January 31.4 32.2 23.2 23.3 31.6 32.3 24.3 24February 31.9 33.2 24.2 24.7 31.9 33.2 25.3 25March 33.1 33.6 26.2 25.5 33.2 33.5 26.5 26.1April 33.3 33.5 27 27.1 33.9 34.3 27.6 27.2May 32.9 32.9 26.8 26.3 33.2 34.2 27.6 27.6June 31.7 30.5 25.5 25.1 31.6 30.7 25.6 25.7July 30.9 29.7 25.1 24.6 31 29.6 25.1 24.8August 30.9 29.8 25.7 25.1 30.6 29 25.2 24.9September 31.4 30.2 26 25.2 30.9 30.1 25.2 25.2October 31.9 31.8 25.3 24.8 31.1 30.3 25.4 25.2November 31.1 31.7 25 24.6 30.7 31.1 24.8 24.7December 31.6 32.2 25.1 24.2 30.8 31.4 24.1 23.6Annual 31.8 31.8 25.4 25 31.7 31.6 25.6 25.3
9
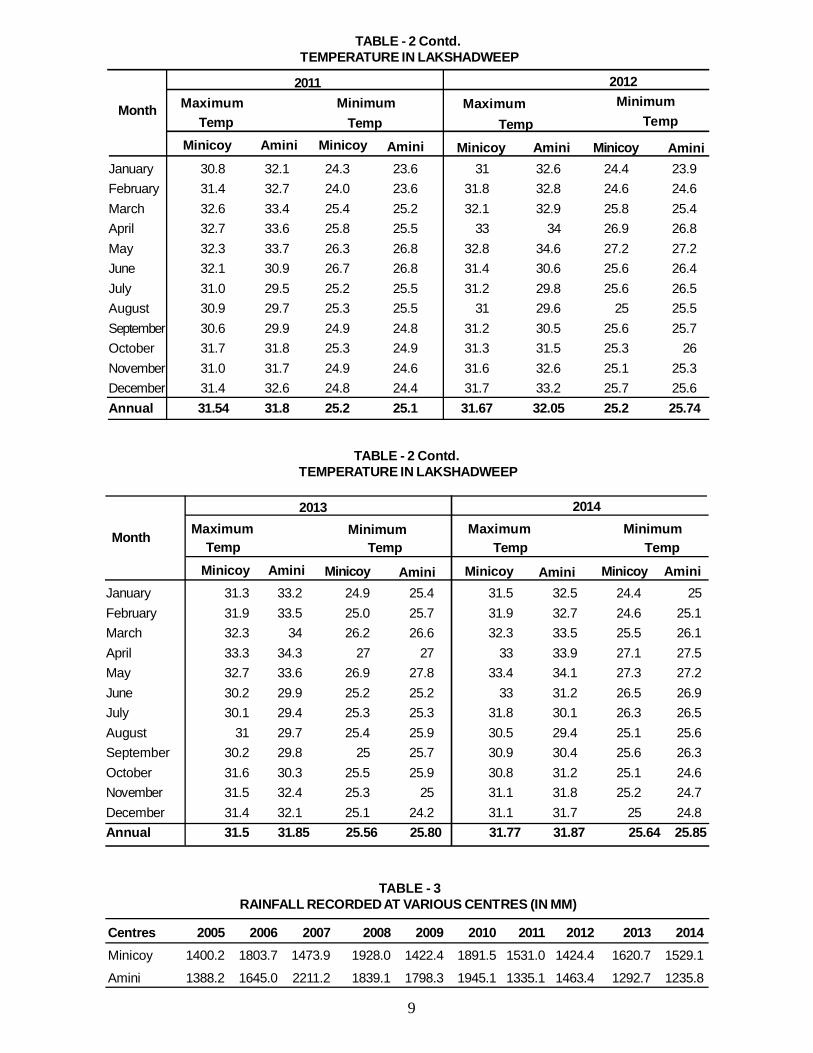
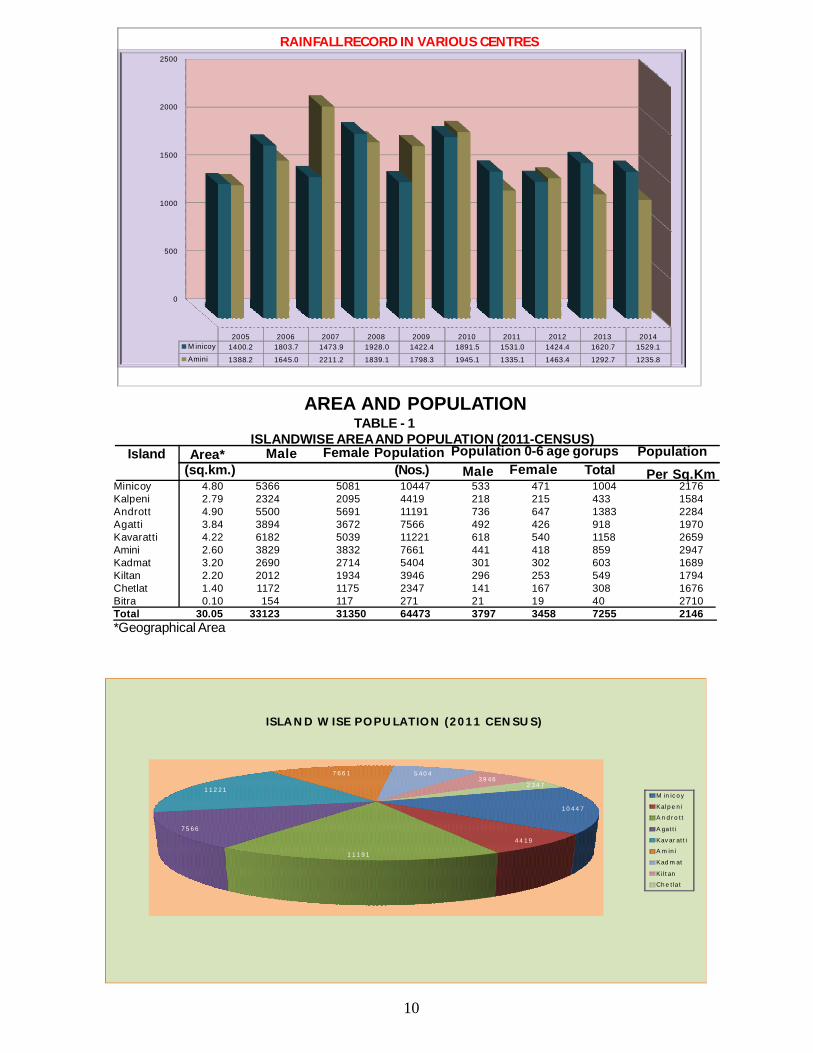
TABLE - 3RAINFALL RECORDED AT VARIOUS CENTRES (IN MM)
Centres 2005 2006 2007 2008 2009 2010 2011 2012 2013 2014Minicoy 1400.2 1803.7 1473.9 1928.0 1422.4 1891.5 1531.0 1424.4 1620.7 1529.1
Amini 1388.2 1645.0 2211.2 1839.1 1798.3 1945.1 1335.1 1463.4 1292.7 1235.8
January 30.8 32.1 24.3 23.6 31 32.6 24.4 23.9February 31.4 32.7 24.0 23.6 31.8 32.8 24.6 24.6March 32.6 33.4 25.4 25.2 32.1 32.9 25.8 25.4April 32.7 33.6 25.8 25.5 33 34 26.9 26.8May 32.3 33.7 26.3 26.8 32.8 34.6 27.2 27.2June 32.1 30.9 26.7 26.8 31.4 30.6 25.6 26.4July 31.0 29.5 25.2 25.5 31.2 29.8 25.6 26.5August 30.9 29.7 25.3 25.5 31 29.6 25 25.5September 30.6 29.9 24.9 24.8 31.2 30.5 25.6 25.7October 31.7 31.8 25.3 24.9 31.3 31.5 25.3 26November 31.0 31.7 24.9 24.6 31.6 32.6 25.1 25.3December 31.4 32.6 24.8 24.4 31.7 33.2 25.7 25.6Annual 31.54 31.8 25.2 25.1 31.67 32.05 25.2 25.74
TABLE - 2 Contd. TEMPERATURE IN LAKSHADWEEP
2011 2012Maximum Minimum Maximum MinimumMonth
Temp Temp Temp Temp
Minicoy Amini Minicoy Amini Minicoy Amini Minicoy Amini
January 31.3 33.2 24.9 25.4 31.5 32.5 24.4 25February 31.9 33.5 25.0 25.7 31.9 32.7 24.6 25.1March 32.3 34 26.2 26.6 32.3 33.5 25.5 26.1April 33.3 34.3 27 27 33 33.9 27.1 27.5May 32.7 33.6 26.9 27.8 33.4 34.1 27.3 27.2June 30.2 29.9 25.2 25.2 33 31.2 26.5 26.9July 30.1 29.4 25.3 25.3 31.8 30.1 26.3 26.5August 31 29.7 25.4 25.9 30.5 29.4 25.1 25.6September 30.2 29.8 25 25.7 30.9 30.4 25.6 26.3October 31.6 30.3 25.5 25.9 30.8 31.2 25.1 24.6November 31.5 32.4 25.3 25 31.1 31.8 25.2 24.7December 31.4 32.1 25.1 24.2 31.1 31.7 25 24.8Annual 31.5 31.85 25.56 25.80 31.77 31.87 25.64 25.85
TABLE - 2 Contd. TEMPERATURE IN LAKSHADWEEP
2013 2014Maximum Minimum Maximum MinimumMonth
Temp Temp Temp TempMinicoy Amini Minicoy Amini Minicoy Amini Minicoy Amini
10
1 0 4 4 7
4 4 1 9
1 1 1 9 1
7 5 6 6
1 1 2 2 1
7 6 6 1 5 4 0 43 9 4 6
2 3 4 7
IS L A N D W IS E P O P U L A T IO N ( 2 0 1 1 C E N S U S )
M in ic o y
K a l p e n i
A n d r o tt
A g a tti
K a v a r a tt i
A m in i
K a d m a t
K ilt a n
C h e tla t
AREA AND POPULATIONTABLE - 1
ISLANDWISE AREA AND POPULATION (2011-CENSUS)
Minicoy 4.80 5366 5081 10447 533 471 1004 2176Kalpeni 2.79 2324 2095 4419 218 215 433 1584Andrott 4.90 5500 5691 11191 736 647 1383 2284Agatti 3.84 3894 3672 7566 492 426 918 1970Kavaratti 4.22 6182 5039 11221 618 540 1158 2659Amini 2.60 3829 3832 7661 441 418 859 2947Kadmat 3.20 2690 2714 5404 301 302 603 1689Kiltan 2.20 2012 1934 3946 296 253 549 1794Chetlat 1.40 1172 1175 2347 141 167 308 1676Bitra 0.10 154 117 271 21 19 40 2710Total 30.05 33123 31350 64473 3797 3458 7255 2146*Geographical Area
Island Area* Male Female Population Population 0-6 age gorups Population (sq.km.) (Nos.) Male Female Total Per Sq.Km
0
500
1000
1500
2000
2500
20 05 20 06 2007 2008 2009 2010 2011 2012 2013 2014M inicoy 14 00.2 180 3.7 1473 .9 1928.0 1422.4 1891.5 1531.0 1424.4 1620.7 1529.1
A mini 13 88.2 164 5.0 2211 .2 1839.1 1798.3 1945.1 1335.1 1463.4 1292.7 1235.8
R AINFALL RECOR D IN VA RIOUS CENTRES
11
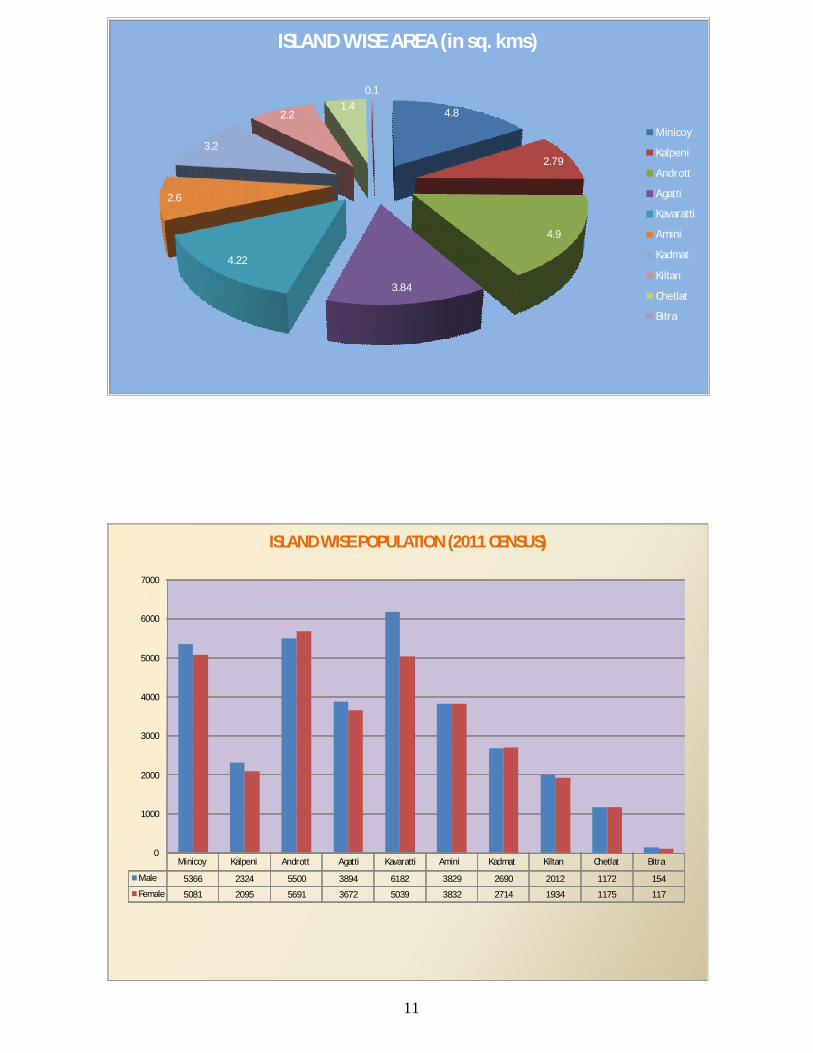
Minicoy Kalpeni Andrott Agatti Kavaratti Amini Kadmat Kiltan Chetlat Bitra
Male 5366 2324 5500 3894 6182 3829 2690 2012 1172 154
Female 5081 2095 5691 3672 5039 3832 2714 1934 1175 117
0
1000
2000
3000
4000
5000
6000
7000
ISLAND WISE POPULATION (2011 CENSUS)
4.8
2.79
4.9
3.84
4.22
2.6
3.2
2.21.4
0.1
ISLAND WISE AREA (in sq. kms)
Minicoy
Kalpeni
Andrott
Agatti
Kavaratti
Amini
Kadmat
Kiltan
Chetlat
Bitra
12
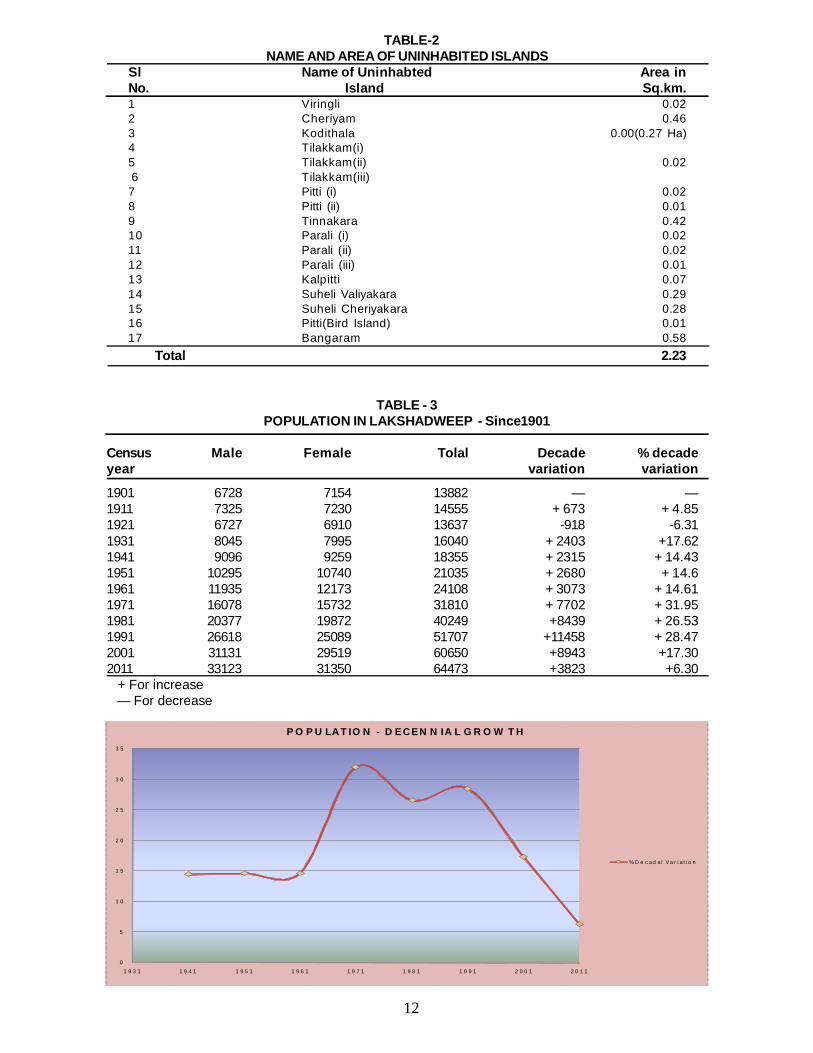
TABLE-2NAME AND AREA OF UNINHABITED ISLANDS
Sl Name of Uninhabted Area inNo. Island Sq.km.1 Viringli 0.022 Cheriyam 0.463 Kodithala 0.00(0.27 Ha)4 Tilakkam(i)5 Tilakkam(ii) 0.02 6 Tilakkam(iii)7 Pitti (i) 0.028 Pitti (ii) 0.019 Tinnakara 0.4210 Parali (i) 0.0211 Parali (ii) 0.0212 Parali (iii) 0.0113 Kalpitti 0.0714 Suheli Valiyakara 0.2915 Suheli Cheriyakara 0.2816 Pitti(Bird Island) 0.0117 Bangaram 0.58
Total 2.23
TABLE - 3POPULATION IN LAKSHADWEEP - Since1901
Census Male Female Tolal Decade % decadeyear variation variation
1901 6728 7154 13882 — —1911 7325 7230 14555 + 673 + 4.851921 6727 6910 13637 -918 -6.311931 8045 7995 16040 + 2403 +17.621941 9096 9259 18355 + 2315 + 14.431951 10295 10740 21035 + 2680 + 14.61961 11935 12173 24108 + 3073 + 14.611971 16078 15732 31810 + 7702 + 31.951981 20377 19872 40249 +8439 + 26.531991 26618 25089 51707 +11458 + 28.472001 31131 29519 60650 +8943 +17.302011 33123 31350 64473 +3823 +6.30 + For increase — For decrease
0
5
1 0
1 5
2 0
2 5
3 0
3 5
1 9 3 1 1 9 4 1 1 9 5 1 1 9 6 1 1 9 7 1 1 9 8 1 1 9 9 1 2 0 0 1 2 0 1 1
P O P U L A T I O N - D E C E N N I A L G R O W T H
% D e c a d a l V a r i a t i o n
13
TABLE - 6SEX RATIO 1901 - 2011 CENSUS
Census Year No.of Femalesper 1000Males
1901 10631911 9871921 10271931 9941941 10181951 10431961 10201971 9781981 9751991 9432001 9482011 940
Minicoy 9495 8833 7762 10447 9987 8768Kalpeni 4321 3916 3175 4419 4051 3778Andrott 10727 10307 7557 11191 10948 8887Agatti 7009 6737 5003 7566 7167 6142Kavaratti. 10119 9058 7842 11221 9955 9218Amini 7353 7221 5133 7661 7541 6062Kadmat 5334 5165 3905 5404 5178 4563Kiltan 3669 3544 2455 3946 3827 3036Chetlat 2291 2234 1614 2347 2195 1875Bitra 267 257 178 271 271 224
TOTAL 60585 57272 44624 64473 61120 52553
TABLE - 4ISLANDWISE SCHEDULED TRIBE POPULATION 2001& 2011 CENSUS
2001 2011
TotalPopulation
Scheduledtribe
Population Literates Total
Population
Scheduledtribe
Population Literates
Island
Minicoy 9495 10447 10.03Kalpeni 4321 4419 2.27Andrott 10727 11191 4.33Agatti 7074 7566 6.96Kavaratti. 10119 11221 10.89Amini 7353 7661 4.19Kadmat 5334 5404 1.31Kiltan 3669 3946 7.55Chetlat 2291 2347 2.44Bitra 267 271 1.50Total 60650 64473 6.30
TABLE - 5DECENNIAL GROWTH RATE 2001- 2011
IslandPopulationcensus Percentage decennal
2001 2011 growth rate
14
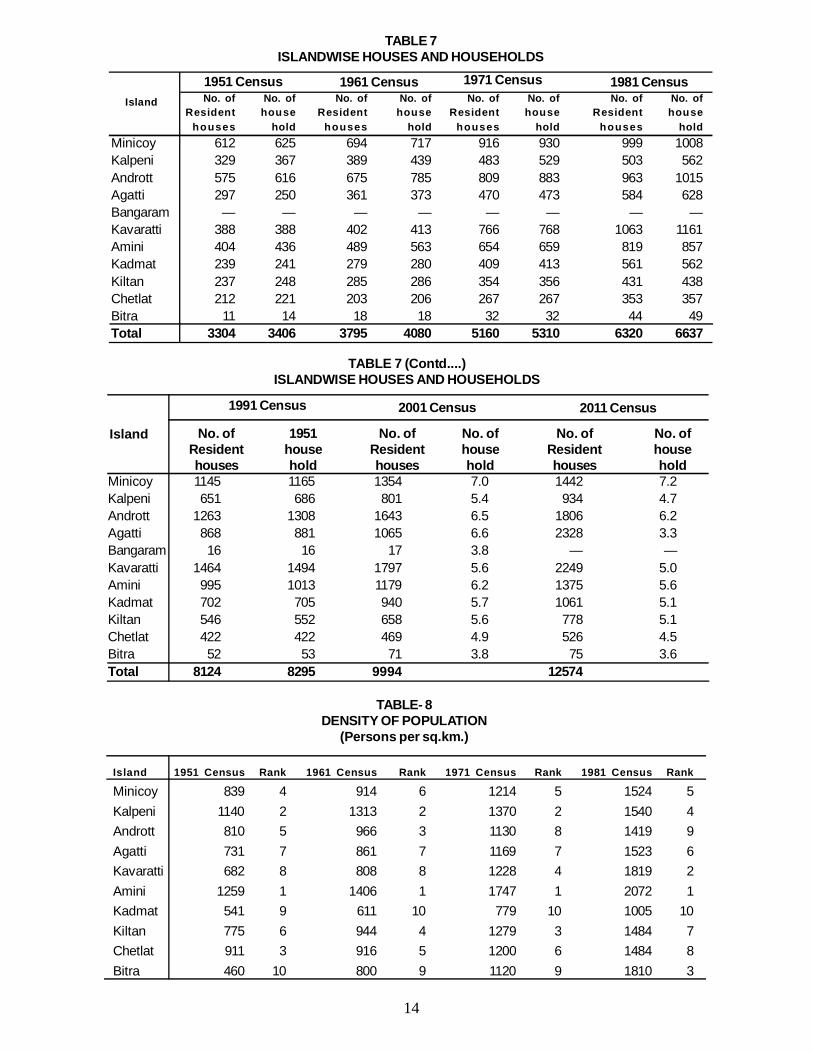
No. of No. of No. of No. of No. of No. of No. of No. ofResident house Resident house Resident house Resident house
houses hold houses hold houses hold houses holdMinicoy 612 625 694 717 916 930 999 1008Kalpeni 329 367 389 439 483 529 503 562Andrott 575 616 675 785 809 883 963 1015Agatti 297 250 361 373 470 473 584 628Bangaram — — — — — — — —Kavaratti 388 388 402 413 766 768 1063 1161Amini 404 436 489 563 654 659 819 857Kadmat 239 241 279 280 409 413 561 562Kiltan 237 248 285 286 354 356 431 438Chetlat 212 221 203 206 267 267 353 357Bitra 11 14 18 18 32 32 44 49Total 3304 3406 3795 4080 5160 5310 6320 6637
TABLE 7ISLANDWISE HOUSES AND HOUSEHOLDS
Island
1951 Census 1961 Census 1971 Census 1981 Census
TABLE- 8DENSITY OF POPULATION
(Persons per sq.km.)
Island 1951 Census Rank 1961 Census Rank 1971 Census Rank 1981 Census Rank
Minicoy 839 4 914 6 1214 5 1524 5Kalpeni 1140 2 1313 2 1370 2 1540 4Andrott 810 5 966 3 1130 8 1419 9Agatti 731 7 861 7 1169 7 1523 6Kavaratti 682 8 808 8 1228 4 1819 2Amini 1259 1 1406 1 1747 1 2072 1Kadmat 541 9 611 10 779 10 1005 10Kiltan 775 6 944 4 1279 3 1484 7Chetlat 911 3 916 5 1200 6 1484 8Bitra 460 10 800 9 1120 9 1810 3
TABLE 7 (Contd....)ISLANDWISE HOUSES AND HOUSEHOLDS
No. of 1951 No. of No. of No. of No. ofResident house Resident house Resident househouses hold houses hold houses hold
Island
1991 Census 2001 Census 2011 Census
Minicoy 1145 1165 1354 7.0 1442 7.2Kalpeni 651 686 801 5.4 934 4.7Andrott 1263 1308 1643 6.5 1806 6.2Agatti 868 881 1065 6.6 2328 3.3Bangaram 16 16 17 3.8 — —Kavaratti 1464 1494 1797 5.6 2249 5.0Amini 995 1013 1179 6.2 1375 5.6Kadmat 702 705 940 5.7 1061 5.1Kiltan 546 552 658 5.6 778 5.1Chetlat 422 422 469 4.9 526 4.5Bitra 52 53 71 3.8 75 3.6Total 8124 8295 9994 12574
15
Minicoy 1902 7 2173 8 2176 5Kalpeni 1773 10 1895 9 1584 10Andrott 1900 8 2216 6 2284 6Agatti 2091 4 2586 4 1970 8Kavaratti 2387 2 2788 2 2659Amini 2488 1 2839 1 2947 1Kadmat 1285 9 1710 10 1689 9Kiltan 1922 6 2251 5 1794 4Chetlat 2050 5 2203 7 1676 7Bitra 2250 3 2670 3 2710 2
Island 1991 Census Rank 2001 Census Rank 2011 Census Rank
TABLE- 8 (Contd....)DENSITY OF POPULATION
(Persons per sq.km.)
16
A G R I C U L T U R ETABLE-1
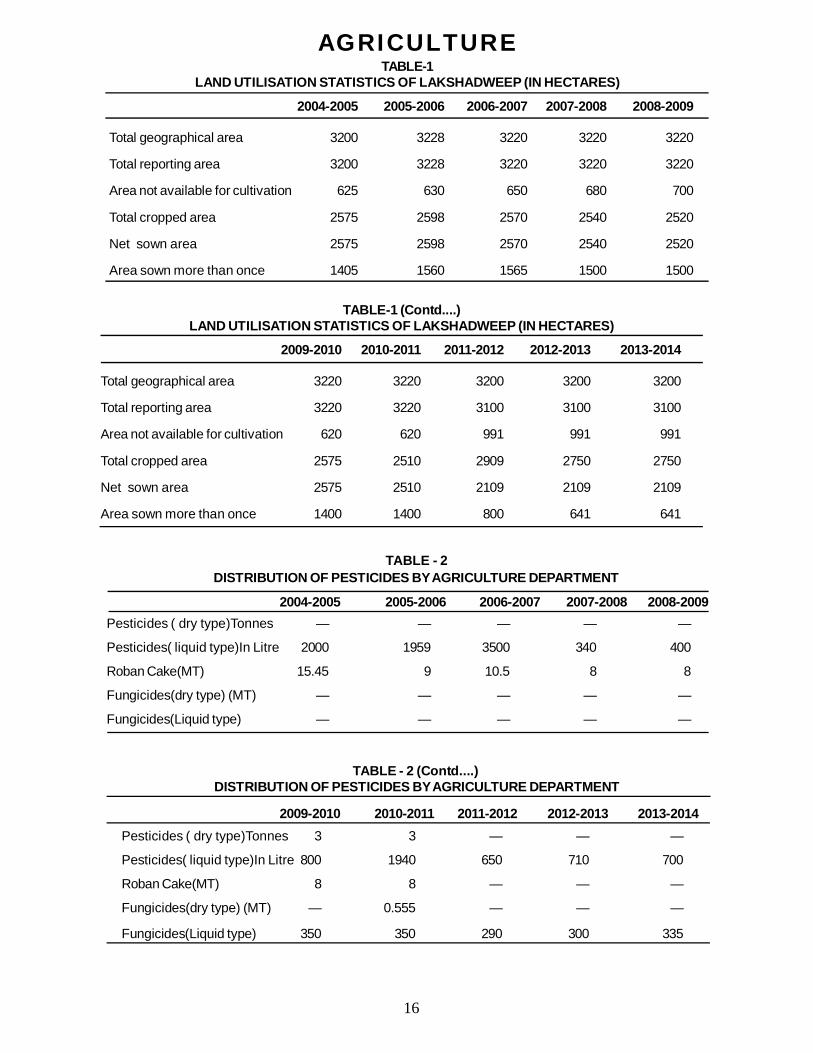
LAND UTILISATION STATISTICS OF LAKSHADWEEP (IN HECTARES)
2004-2005 2005-2006 2006-2007 2007-2008 2008-2009
Total geographical area 3200 3228 3220 3220 3220
Total reporting area 3200 3228 3220 3220 3220
Area not available for cultivation 625 630 650 680 700
Total cropped area 2575 2598 2570 2540 2520
Net sown area 2575 2598 2570 2540 2520
Area sown more than once 1405 1560 1565 1500 1500
TABLE-1 (Contd....)LAND UTILISATION STATISTICS OF LAKSHADWEEP (IN HECTARES)
2009-2010 2010-2011 2011-2012 2012-2013 2013-2014
Total geographical area 3220 3220 3200 3200 3200
Total reporting area 3220 3220 3100 3100 3100
Area not available for cultivation 620 620 991 991 991
Total cropped area 2575 2510 2909 2750 2750
Net sown area 2575 2510 2109 2109 2109
Area sown more than once 1400 1400 800 641 641
TABLE - 2 DISTRIBUTION OF PESTICIDES BY AGRICULTURE DEPARTMENT
2004-2005 2005-2006 2006-2007 2007-2008 2008-2009Pesticides ( dry type)Tonnes — — — — —
Pesticides( liquid type)In Litre 2000 1959 3500 340 400
Roban Cake(MT) 15.45 9 10.5 8 8
Fungicides(dry type) (MT) — — — — —
Fungicides(Liquid type) — — — — —
TABLE - 2 (Contd....) DISTRIBUTION OF PESTICIDES BY AGRICULTURE DEPARTMENT
2009-2010 2010-2011 2011-2012 2012-2013 2013-2014Pesticides ( dry type)Tonnes 3 3 — — —
Pesticides( liquid type)In Litre 800 1940 650 710 700
Roban Cake(MT) 8 8 — — —
Fungicides(dry type) (MT) — 0.555 — — —
Fungicides(Liquid type) 350 350 290 300 335
17
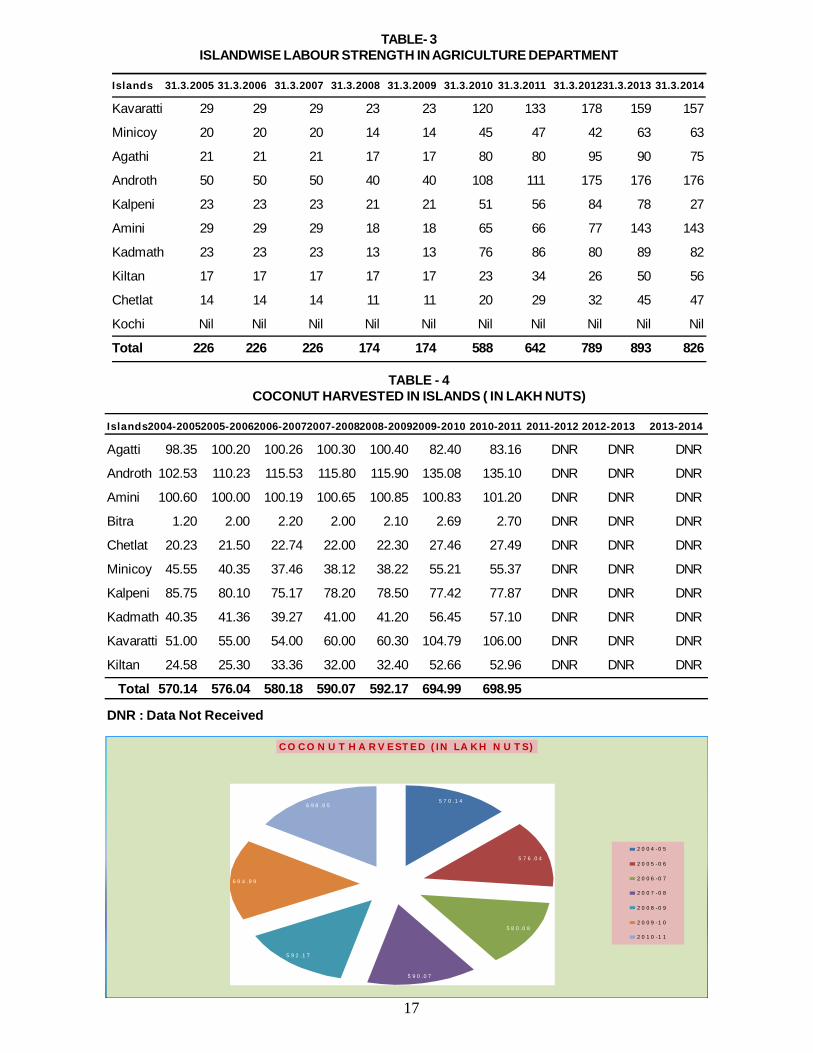
TABLE- 3ISLANDWISE LABOUR STRENGTH IN AGRICULTURE DEPARTMENT
Islands 31.3.2005 31.3.2006 31.3.2007 31.3.2008 31.3.2009 31.3.2010 31.3.2011 31.3.201231.3.2013 31.3.2014
Kavaratti 29 29 29 23 23 120 133 178 159 157
Minicoy 20 20 20 14 14 45 47 42 63 63
Agathi 21 21 21 17 17 80 80 95 90 75
Androth 50 50 50 40 40 108 111 175 176 176
Kalpeni 23 23 23 21 21 51 56 84 78 27
Amini 29 29 29 18 18 65 66 77 143 143
Kadmath 23 23 23 13 13 76 86 80 89 82
Kiltan 17 17 17 17 17 23 34 26 50 56
Chetlat 14 14 14 11 11 20 29 32 45 47
Kochi Nil Nil Nil Nil Nil Nil Nil Nil Nil Nil
Total 226 226 226 174 174 588 642 789 893 826
TABLE - 4COCONUT HARVESTED IN ISLANDS ( IN LAKH NUTS)
Islands2004-20052005-20062006-20072007-20082008-20092009-2010 2010-2011 2011-2012 2012-2013 2013-2014
Agatti 98.35 100.20 100.26 100.30 100.40 82.40 83.16 DNR DNR DNR
Androth 102.53 110.23 115.53 115.80 115.90 135.08 135.10 DNR DNR DNR
Amini 100.60 100.00 100.19 100.65 100.85 100.83 101.20 DNR DNR DNR
Bitra 1.20 2.00 2.20 2.00 2.10 2.69 2.70 DNR DNR DNR
Chetlat 20.23 21.50 22.74 22.00 22.30 27.46 27.49 DNR DNR DNR
Minicoy 45.55 40.35 37.46 38.12 38.22 55.21 55.37 DNR DNR DNR
Kalpeni 85.75 80.10 75.17 78.20 78.50 77.42 77.87 DNR DNR DNR
Kadmath 40.35 41.36 39.27 41.00 41.20 56.45 57.10 DNR DNR DNR
Kavaratti 51.00 55.00 54.00 60.00 60.30 104.79 106.00 DNR DNR DNR
Kiltan 24.58 25.30 33.36 32.00 32.40 52.66 52.96 DNR DNR DNR
Total 570.14 576.04 580.18 590.07 592.17 694.99 698.95
DNR : Data Not Received
5 7 0 . 1 4
5 7 6 .0 4
5 8 0 .0 8
5 9 0 .0 7
5 9 2 .1 7
6 9 4 . 9 9
6 9 8 .9 5
C O C O N U T H A R V E S T E D ( I N L A K H N U T S )
2 0 0 4 - 0 5
2 0 0 5 - 0 6
2 0 0 6 - 0 7
2 0 0 7 - 0 8
2 0 0 8 - 0 9
2 0 0 9 - 1 0
2 0 1 0 - 1 1
18
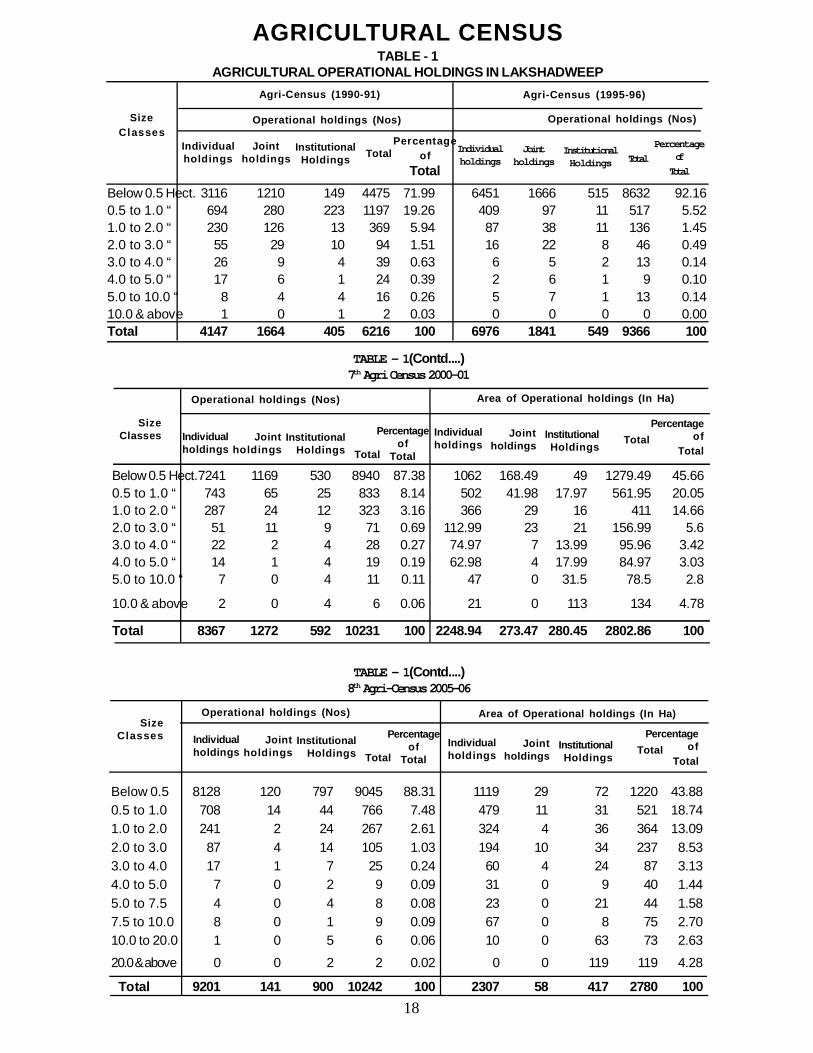
AGRICULTURAL CENSUSTABLE - 1
AGRICULTURAL OPERATIONAL HOLDINGS IN LAKSHADWEEP
Below 0.5 Hect. 3116 1210 149 4475 71.99 6451 1666 515 8632 92.160.5 to 1.0 “ 694 280 223 1197 19.26 409 97 11 517 5.521.0 to 2.0 “ 230 126 13 369 5.94 87 38 11 136 1.452.0 to 3.0 “ 55 29 10 94 1.51 16 22 8 46 0.493.0 to 4.0 “ 26 9 4 39 0.63 6 5 2 13 0.144.0 to 5.0 “ 17 6 1 24 0.39 2 6 1 9 0.105.0 to 10.0 “ 8 4 4 16 0.26 5 7 1 13 0.1410.0 & above 1 0 1 2 0.03 0 0 0 0 0.00Total 4147 1664 405 6216 100 6976 1841 549 9366 100
SizeClasses
Agri-Census (1990-91) Agri-Census (1995-96)
Operational holdings (Nos) Operational holdings (Nos)
Individualholdings
Jointholdings
InstitutionalHoldings Total
Percentageof
TotalIndividualholdings
Jointholdings
InstitutionalHoldings Total
PercentageofTotal
SizeClasses
Below 0.5 8128 120 797 9045 88.31 1119 29 72 1220 43.880.5 to 1.0 708 14 44 766 7.48 479 11 31 521 18.741.0 to 2.0 241 2 24 267 2.61 324 4 36 364 13.092.0 to 3.0 87 4 14 105 1.03 194 10 34 237 8.533.0 to 4.0 17 1 7 25 0.24 60 4 24 87 3.134.0 to 5.0 7 0 2 9 0.09 31 0 9 40 1.445.0 to 7.5 4 0 4 8 0.08 23 0 21 44 1.587.5 to 10.0 8 0 1 9 0.09 67 0 8 75 2.7010.0 to 20.0 1 0 5 6 0.06 10 0 63 73 2.63
20.0 & above 0 0 2 2 0.02 0 0 119 119 4.28
Total 9201 141 900 10242 100 2307 58 417 2780 100
Operational holdings (Nos)
TABLE - 1(Contd....)8th Agri-Census 2005-06
Area of Operational holdings (In Ha)
SizeClasses
Below 0.5 Hect.7241 1169 530 8940 87.38 1062 168.49 49 1279.49 45.660.5 to 1.0 “ 743 65 25 833 8.14 502 41.98 17.97 561.95 20.051.0 to 2.0 “ 287 24 12 323 3.16 366 29 16 411 14.662.0 to 3.0 “ 51 11 9 71 0.69 112.99 23 21 156.99 5.63.0 to 4.0 “ 22 2 4 28 0.27 74.97 7 13.99 95.96 3.424.0 to 5.0 “ 14 1 4 19 0.19 62.98 4 17.99 84.97 3.035.0 to 10.0 “ 7 0 4 11 0.11 47 0 31.5 78.5 2.8
10.0 & above 2 0 4 6 0.06 21 0 113 134 4.78
Total 8367 1272 592 10231 100 2248.94 273.47 280.45 2802.86 100
Operational holdings (Nos)
TABLE - 1(Contd....)7th Agri Census 2000-01
Area of Operational holdings (In Ha)
Individualholdings
Jointholdings
InstitutionalHoldings Total
Percentageof
Total
Individualholdings
Jointholdings
InstitutionalHoldings
TotalPercentage
ofTotal
Individualholdings
Jointholdings
InstitutionalHoldings Total
Percentageof
Total
Individualholdings
Jointholdings
InstitutionalHoldings Total
Percentageof
Total
19
SizeClasses
Agri-Census 1990-91 Agri-Census 1995-96 Agri-Census 2000-01
Below 0.5 Hrs 4475 71.99 71.99 8632 92.16 92.16 8940 87.38 87.380.5 to 1.0 1197 19.26 91.25 517 5.52 97.68 833 8.14 95.521.0 to 2.0 369 5.94 97.18 136 1.45 99.13 323 3.16 98.682.0 to 3.0 94 1.5 98.7 46 0.49 99.62 71 0.69 99.373.0 to 4.0 39 0.63 99.32 13 0.14 99.76 28 0.27 99.64
4.0 to 5.0 24 0.39 99.71 9 0.10 99.86 19 0.19 99.835.0 to 10.0 16 0.26 99.97 13 0.14 100 11 0.11 99.94
10.0 & above 2 0.03 100 0 0.00 0 6 0.06 100
Total 6216 100 9366 100 10231 100
TABLE 2OPERATIONAL HOLDINGS (Nos) IN PERCENTAGES - LAKSHADWEEP
SizeClasses
Operational holdings (Nos) Area Operational holdings (in ha)
Individualholdings Joint
holdingsInstitutional
HoldingsIndividualholdings
Jointholdings
InstitutionalHoldings Total
Percentageof
Total
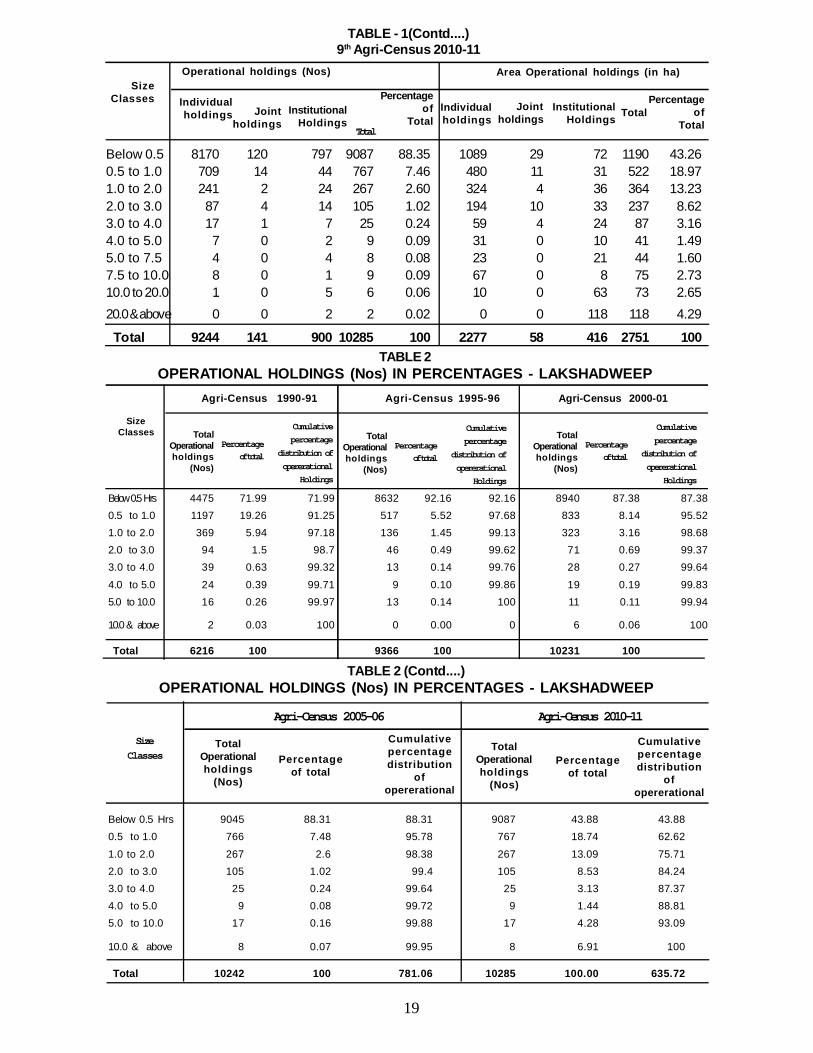
TABLE - 1(Contd....)9th Agri-Census 2010-11
Below 0.5 8170 120 797 9087 88.35 1089 29 72 1190 43.260.5 to 1.0 709 14 44 767 7.46 480 11 31 522 18.971.0 to 2.0 241 2 24 267 2.60 324 4 36 364 13.232.0 to 3.0 87 4 14 105 1.02 194 10 33 237 8.623.0 to 4.0 17 1 7 25 0.24 59 4 24 87 3.164.0 to 5.0 7 0 2 9 0.09 31 0 10 41 1.495.0 to 7.5 4 0 4 8 0.08 23 0 21 44 1.607.5 to 10.0 8 0 1 9 0.09 67 0 8 75 2.7310.0 to 20.0 1 0 5 6 0.06 10 0 63 73 2.6520.0 & above 0 0 2 2 0.02 0 0 118 118 4.29
Total 9244 141 900 10285 100 2277 58 416 2751 100
Percentageof
Total
SizeClasses
Agri-Census 2005-06 Agri-Census 2010-11
Below 0.5 Hrs 9045 88.31 88.31 9087 43.88 43.880.5 to 1.0 766 7.48 95.78 767 18.74 62.62
1.0 to 2.0 267 2.6 98.38 267 13.09 75.712.0 to 3.0 105 1.02 99.4 105 8.53 84.243.0 to 4.0 25 0.24 99.64 25 3.13 87.374.0 to 5.0 9 0.08 99.72 9 1.44 88.815.0 to 10.0 17 0.16 99.88 17 4.28 93.09
10.0 & above 8 0.07 99.95 8 6.91 100
Total 10242 100 781.06 10285 100.00 635.72
TABLE 2 (Contd....)OPERATIONAL HOLDINGS (Nos) IN PERCENTAGES - LAKSHADWEEP
Total
TotalOperationalholdings
(Nos)
Cumulativepercentage
distribution ofopererational
Holdings
Percentageof total
TotalOperationalholdings
(Nos)
Cumulativepercentage
distribution ofopererational
Holdings
Percentageof total
TotalOperationalholdings
(Nos)
Cumulativepercentage
distribution ofopererational
Holdings
Percentageof total
TotalOperationalholdings
(Nos)
Percentageof total
Cumulativepercentagedistribution
ofopererational
TotalOperationalholdings
(Nos)
Percentageof total
Cumulativepercentagedistribution
ofopererational
20
SizeClasses
Opera-tional
holdings(Nos)
Areaoperated
(Hect)
Opera-tional
holdings(Nos)
Areaoperated
hect
Opera-tional
holdings(Nos)
Areaoperated
(Hect)
Opera-tional
holdings(Nos)
Below 0.5Hects 4475 800 8632 1777 8940 1279.49 9045 1220 9087 1190.0.5to 1.0 ,, 1197 773 517 345 833 561.95 766 521 767 521.531.0 to 2.0 ,, 369 489 136 172 323 411 267 364 267 364.052.0 to 3.0 ,, 94 216 46 108 71 156.99 105 237 105 237.43.0 to 4.0 ,, 39 128 13 43 28 95.96 25 87 25 86.954.0 to 5.0 ,, 24 101 9 37 19 84.97 9 40 9 40.335.0 to 10.0 ,, 18 143 13 97 11 78.5 17 119 17 118.56
10.0 & above 6216 2650 0 0 6 134 8 192 8 192.02
All size class 12432 5300 9366 2579 10231 2802.86 10242 2780 10285 2750.92
Areaoperated
(Hect)
Opera-tional
holdings(Nos)
Areaoperated
(Hect)
TABLE - 3OPERATIONAL HOLDINGS AND AREA OPERATED
1990-91 1995-96 2000-01 2005-06 2010-11
TABLE 5ESTIMATED AREA BY SIZE OF CLASS AND LAND USE 1995-96 CENSUS
Class
Below 0.5 Hrs 8632 1777 1777.0 00.5 to 1.0 517 345 345.0 01.0 to 2.0 136 172 172.0 02.0 to 3.0 46 108 108.0 03.0 to 4.0 13 43 43.0 04.0 to 5.0 9 37 37.0 05.0 to 10.0 13 97 97.0 010.0 & above 0 0 0.0 0 Total 9366 2579 2579 0
Total holdings(Nos)
Total area(Hrs)
Net areasown(Hrs)
Area undercurrentFallow
Below 0.5 Hrs 810.1 809.4 809.4 0.8 800 785 785 150.5 to 1.0 646.6 642.4 642.4 4.2 773 753 753 201.0 to 2.0 602.4 599.0 599.0 3.5 489 479 479 102.0 to 3.0 201.2 199.6 199.6 1.6 216 213 213 33.0 to 4.0 122.8 120.3 120.3 2 128 127 127 14.0 to 5.0 61.5 60.0 60.0 1.5 101 100 100 15.0 to 10.0 102.8 102.8 102.8 0 98 97 97 110.0 & above 145.2 145.2 145.2 0 45 45 45 0 Total 2692.6 2678.56 2678.56 13.54 2650 2599 2599 51
TABLE 4ESTIMATED AREA BY SIZE OF CLASS AND LAND USE 1985-86 CENSUS
ClassTotalarea(Hrs)
Net areas own( Hrs)
Netcultivatedarea (Hrs)
Total unculti-vatable
land (Hrs)
Totalarea(Hrs)
Net areas own(Hrs)
Netcultivatedarea (Hrs)
Land notavailable
21
Class
TABLE 5 (Contd)ESTIMATED AREA BY SIZE OF CLASS AND LAND USE 1995-96 CENSUS
Below 0.5 Hrs 1777.0 0.0 0.0 0.0 0.0 0.00.5 to 1.0 345.0 0.0 0.0 0.0 0.0 0.01.0 to 2.0 172.0 0.0 0.0 0.0 0.0 0.02.0 to 3.0 108.0 0.0 0.0 0.0 0.0 0.03.0 to 4.0 43.0 0.0 0.0 0.0 0.0 0.04.0 to 5.0 37.0 0.0 0.0 0.0 0.0 0.05.0 to 10.0 97.0 0.0 0.0 0.0 0.0 0.010.0 & above 0.0 0.0 0.0 0.0 0.0 0.0 Total 2579 0 0 0 0 0
Netcultivated
area(Hrs)
OtherUnculti-
vable landexcluding
fallow land
Fallow landOther than
currentfallow
CulturableWasteland
Total unculti-vable land
(Hrs)
Land not available
forcultivation
Below 0.5 Hect. 8940 1279.49 1204.54 00.5 to 1.0 833 561.95 548.54 01.0 to 2.0 323 411 402.39 02.0 to 3.0 71 156.99 147.12 03.0 to 4.0 28 95.96 95.25 04.0 to 5.0 19 84.97 79.58 05.0 to 10.0 11 78.5 78.11 010.0 & above 6 134 109.37 0Total 10231.00 2802.86 2664.90 0.00
TABLE 6Estimated Area by Size of Class and Land use 2000-01 Census
SizeClass
Total area(Nos)
Total area (Hrs)
Net Areasown(hrs)
Area underCurrentFallow
Below 0.5 Hect. 1204.54 0 0 0 0 74.950.5 to 1.0 548.54 0 0 0 0 13.411.0 to 2.0 402.39 0 0 0 0 8.612.0 to 3.0 147.12 0 0 0 0 9.873.0 to 4.0 95.25 0 0 0 0 0.714.0 to 5.0 79.58 0 0 0 0 5.395.0 to 10.0 78.11 0 0 0 0 0.3910.0 & above 109.37 0 0 0 0 24.63Total 2664.90 0.00 0.00 0.00 0.00 137.96
TABLE 6 (Contd)Estimated Area by Size of Class and Land use 2000-01Census
SizeClass
Net Culti-vated area
OtherUnculti-
vable landexcluding
fallow land
Fallow landOther
than currentfallow
Culturablewasteland
Totalununculti-
vableland (Hrs)
Land notavailable
forcultivation
22
Below 0.5 H 4475 800 — — — —0.5 to 1.0 ,, 1197 773 — — — —1.0 to 2.0 ,, 369 489 — — — —2.0 to 3.0 ,, 94 216 — — — —3.0 to 4.0 ,, 39 128 — — — —4.0 to 5.0 ,, 24 101 — — — —5.0 to 10.0 ,, 16 98 — — — —10.0 & above 2 45 — — — —All size class 6216 2650 — — — —
TABLE 8OPERATIONAL HOLDINGS BY TENURE ( AREA IN HECT.)
1990-91 Census
Size classes
Wholly owned & Selfoperated
Wholly owned &Partly rented
Wholly rented fromothers
No Area No Area No Area
No Area No Area No AreaBelow 0.5 H 8632 1777 — — — —0.5 to 1.0 ,, 517 345 — — — —1.0 to 2.0 ,, 136 172 — — — —2.0 to 3.0 ,, 46 108 — — — —3.0 to 4.0 ,, 13 43 — — — —4.0 to 5.0 ,, 9 37 — — — —5.0 to 10.0 ,, 13 97 — — — —10.0 & above 0 0 — — — —All size class 9366 2579 — — — —
TABLE 8 (Contd)OPERATIONAL HOLDINGS BY TENURE ( AREA IN HECT.)
1995-96 Census
Size classes Wholly owned & Selfoperated
Wholly owned &Partly rented
Wholly rented fromothers
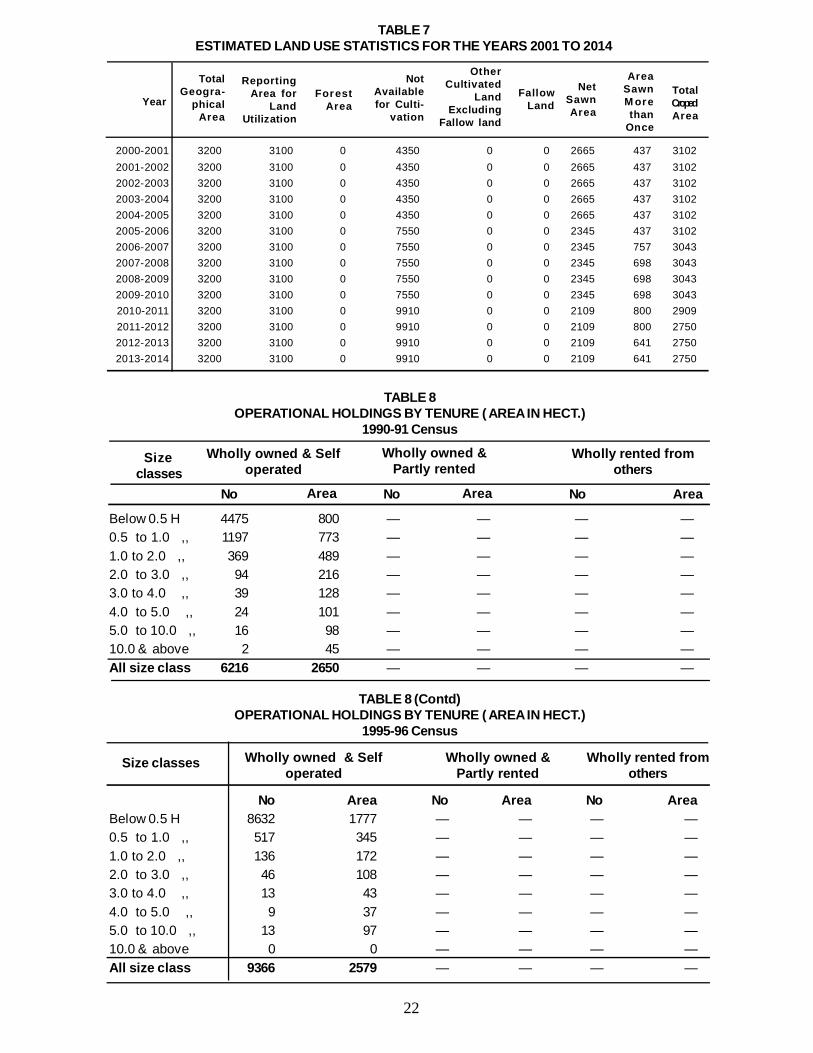
2000-2001 3200 3100 0 4350 0 0 2665 437 31022001-2002 3200 3100 0 4350 0 0 2665 437 31022002-2003 3200 3100 0 4350 0 0 2665 437 31022003-2004 3200 3100 0 4350 0 0 2665 437 31022004-2005 3200 3100 0 4350 0 0 2665 437 31022005-2006 3200 3100 0 7550 0 0 2345 437 31022006-2007 3200 3100 0 7550 0 0 2345 757 30432007-2008 3200 3100 0 7550 0 0 2345 698 30432008-2009 3200 3100 0 7550 0 0 2345 698 30432009-2010 3200 3100 0 7550 0 0 2345 698 30432010-2011 3200 3100 0 9910 0 0 2109 800 29092011-2012 3200 3100 0 9910 0 0 2109 800 27502012-2013 3200 3100 0 9910 0 0 2109 641 27502013-2014 3200 3100 0 9910 0 0 2109 641 2750
TABLE 7ESTIMATED LAND USE STATISTICS FOR THE YEARS 2001 TO 2014
Year
TotalGeogra-
phicalArea
ReportingArea for
LandUtilization
ForestArea
NotAvailablefor Culti-
vation
OtherCultivated
LandExcluding
Fallow land
FallowLand
NetSawnArea
AreaSawnM orethan
Once
TotalCropedArea
23
Below 0.5 Hect. 9087 1190 0 0 0 00.5 to 1.0 767 522 0 0 0 01.0 to 2.0 267 364 0 0 0 02.0 to 3.0 105 237 0 0 0 03.0 to 4.0 25 87 0 0 0 04.0 to 5.0 9 41 0 0 0 05.0 to 7.5 8 44 0 0 0 07.5 to 10.0 9 75 0 0 0 010.0 to 20.0 6 73 0 0 0 020.0 & above 2 118 0 0 0 0Total 10285 2751 0 0 0 0
TABLE 8 (Contd)OPERATIONAL HOLDINGS BY TENURE ( AREA IN HECT.)
2010-11 Census
Size ClassWholly owned &
Self operatedWholly owned &
Partly rentedWholly rented
from othersNo Area No Area No Area
Below 0.5 Hect. 8940 1279.49 0 0 0 00.5 to 1.0 833 561.95 0 0 0 01.0 to 2.0 323 411 0 0 0 02.0 to 3.0 71 156.99 0 0 0 03.0 to 4.0 28 95.96 0 0 0 04.0 to 5.0 19 84.97 0 0 0 05.0 to 10.0 11 78.5 0 0 0 010.0 & above 6 134 0 0 0 0All size classes 10231 2802.86 0 0 0 0
TABLE 8 (Contd)OPERATIONAL HOLDINGS BY TENURE ( AREA IN HECT.)
2000-01 Census
Size Class
Whollyowned & Self
operated
Wholly owned& Partly rented
Wholly rented fromothers
No Area No Area No Area
No Area No Area No AreaBelow 0.5 Hect. 9045 1220 0 0 0 00.5 to 1.0 766 521 0 0 0 01.0 to 2.0 267 364 0 0 0 02.0 to 3.0 105 237 0 0 0 03.0 to 4.0 25 87 0 0 0 04.0 to 5.0 9 40 0 0 0 05.0 to 7.5 8 44 0 0 0 07.5 to 10.0 9 75 0 0 0 010.0 to 20.0 6 73 0 0 0 020.0 & above 2 119 0 0 0 0Total 10242 2780 0 0 0 0
TABLE 8 (Contd)OPERATIONAL HOLDINGS BY TENURE ( AREA IN HECT.)
2005-06 Census
Size ClassWholly owned & Self
operatedWholly owned &
Partly rentedWholly rented from
others
24
1. Central 1 1 1 1 1 1 1 1 1 1Hatchery
2. Regional 3 3 3 3 3 3 3 3 3 3Hatchery
3. Hatchery 4 5 5 5 5 6 6 6 6 6Units
4. Central 1 1 1 1 1 1 1 1 1 1PoultryFarm
5. Govt.Poultry 5 5 5 5 5 5 5 5 5 5Farm
6. Poultry 3 3 3 3 3 3 3 3 3 3Demonstra-tion Unit
7. Parent 5 5 5 — — 4 4 4 4 4StockRearing Unit
9. Quilery Unit 1 1 1 — — N.I N.I — — —10. Vetrinary 3 3 3 3 3 3 3 4 4 4
Hospital11. Veterinary 7 7 7 7 7 7 7 7 7 7
Sub Centre12. Artificial 7 7 7 7 7 7 7 7 7 7
inseminationService Unit
13. Veterinary 6 6 6 6 6 6 6 6 6 6Dispensaries
14. Dairy 2 2 2 2 2 2 2 2 2 2Demonstra-tion Unit
15. Slaugter 1 1 1 1 1 1 1 1 1 1House
16. Veterinary 1 1 1 1 1 1 1 1 1 1First AidCentre
17. Boyer 1 1 1 1 1 1 1 1 1 1goat Farm
18 Fodder Unit 3 3 3 3 3 4 4 4 4 419. Bull/Buck 9 9 9 9 9 9 9 9 9 9
Unit20. ICE Cream 1 1 1 1 1 1 1 0 0 0
Plant21. Minor Vet. — — — — — N.I N.I — — —
dispensaries(Vet.clinics)
* N.I :- The items not included in their list for the year 2009-10 & 2010-11
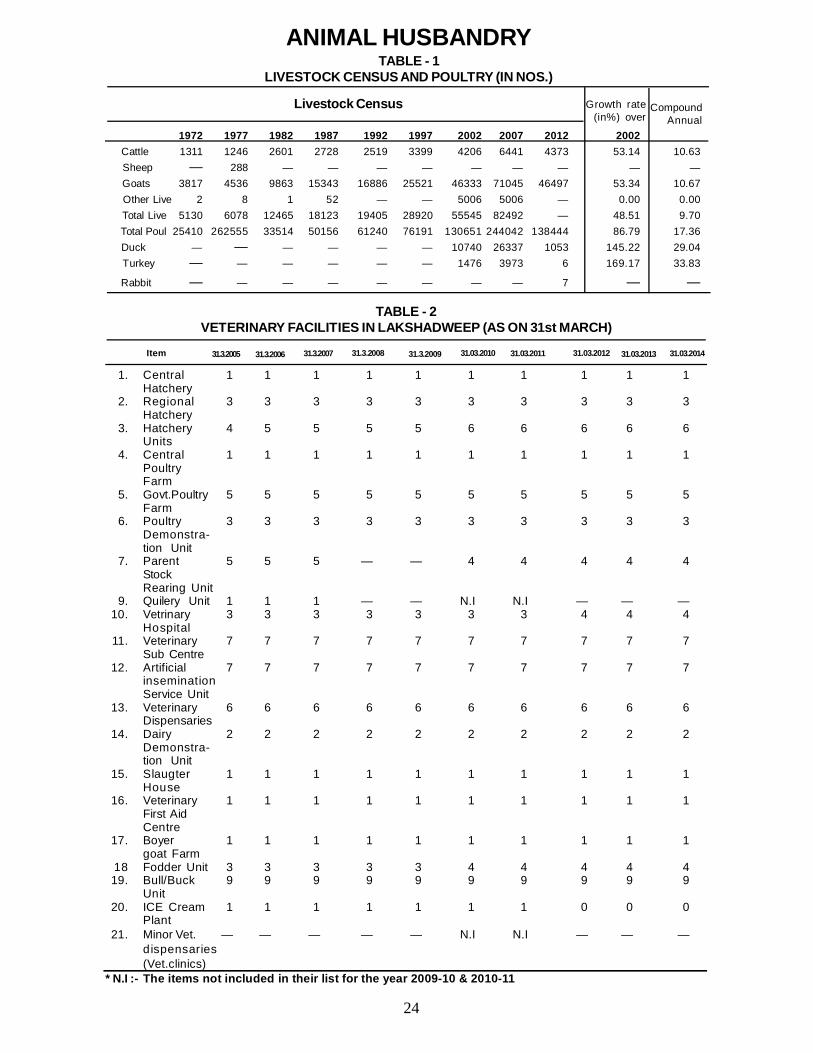
TABLE - 2VETERINARY FACILITIES IN LAKSHADWEEP (AS ON 31st MARCH)
Item 31.3.2005 31.3.2006 31.3.2007 31.3.2008 31.3.2009 31.03.2010 31.03.2011 31.03.2012 31.03.2013 31.03.2014
ANIMAL HUSBANDRYTABLE - 1
LIVESTOCK CENSUS AND POULTRY (IN NOS.)
1972 1977 1982 1987 1992 1997 2002 2007 2012 2002 Cattle 1311 1246 2601 2728 2519 3399 4206 6441 4373 53.14 10.63 Sheep — 288 — — — — — — — — — Goats 3817 4536 9863 15343 16886 25521 46333 71045 46497 53.34 10.67 Other Live 2 8 1 52 — — 5006 5006 — 0.00 0.00 Total Live 5130 6078 12465 18123 19405 28920 55545 82492 — 48.51 9.70 Total Poul 25410 262555 33514 50156 61240 76191 130651 244042 138444 86.79 17.36 Duck — — — — — — 10740 26337 1053 145.22 29.04 Turkey — — — — — — 1476 3973 6 169.17 33.83
Rabbit — — — — — — — — 7 — —
Livestock Census Growth rate(in%) over
CompoundAnnual
25
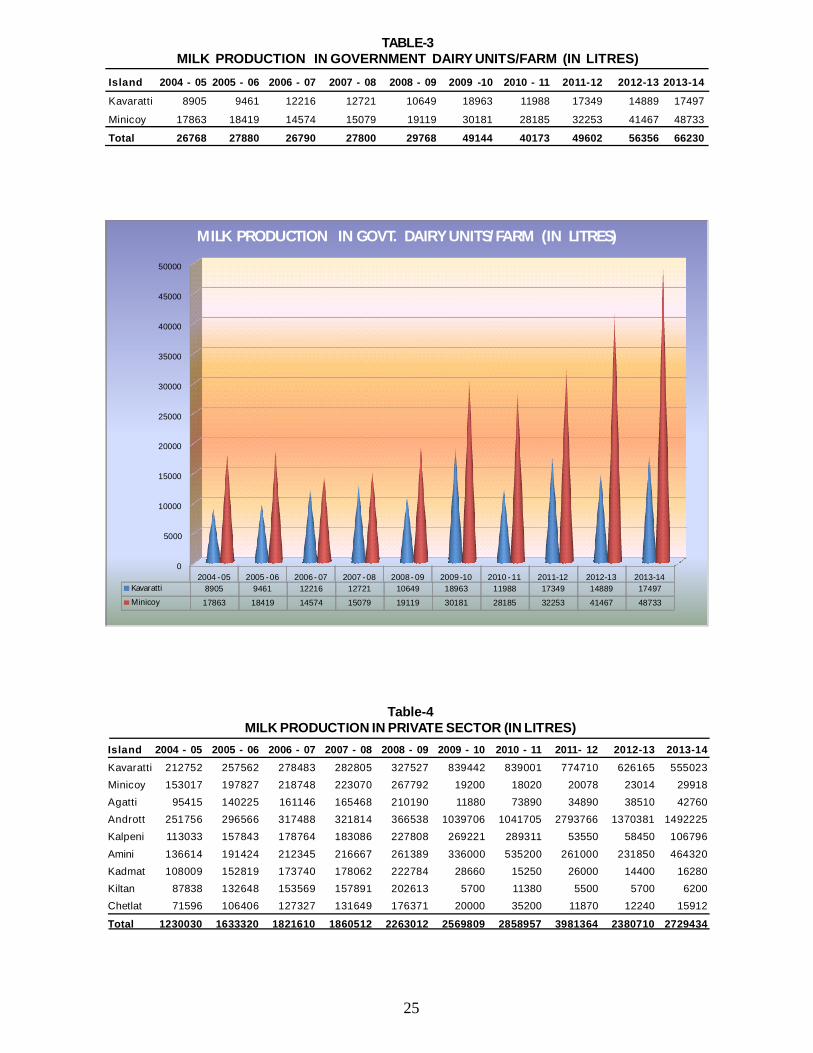
Island 2004 - 05 2005 - 06 2006 - 07 2007 - 08 2008 - 09 2009 -10 2010 - 11 2011-12 2012-13 2013-14
Kavaratti 8905 9461 12216 12721 10649 18963 11988 17349 14889 17497
Minicoy 17863 18419 14574 15079 19119 30181 28185 32253 41467 48733
Total 26768 27880 26790 27800 29768 49144 40173 49602 56356 66230
TABLE-3MILK PRODUCTION IN GOVERNMENT DAIRY UNITS/FARM (IN LITRES)
Island 2004 - 05 2005 - 06 2006 - 07 2007 - 08 2008 - 09 2009 - 10 2010 - 11 2011- 12 2012-13 2013-14Kavaratti 212752 257562 278483 282805 327527 839442 839001 774710 626165 555023Minicoy 153017 197827 218748 223070 267792 19200 18020 20078 23014 29918Agatti 95415 140225 161146 165468 210190 11880 73890 34890 38510 42760Andrott 251756 296566 317488 321814 366538 1039706 1041705 2793766 1370381 1492225Kalpeni 113033 157843 178764 183086 227808 269221 289311 53550 58450 106796
Amini 136614 191424 212345 216667 261389 336000 535200 261000 231850 464320Kadmat 108009 152819 173740 178062 222784 28660 15250 26000 14400 16280Kiltan 87838 132648 153569 157891 202613 5700 11380 5500 5700 6200Chetlat 71596 106406 127327 131649 176371 20000 35200 11870 12240 15912
Total 1230030 1633320 1821610 1860512 2263012 2569809 2858957 3981364 2380710 2729434
Table-4MILK PRODUCTION IN PRIVATE SECTOR (IN LITRES)
0
5000
10000
15000
20000
25000
30000
35000
40000
45000
50000
2004 - 05 2005 - 06 2006 - 07 2007 - 08 2008 - 09 2009 -10 2010 - 11 2011-12 2012-13 2013-14Kavaratti 8905 9461 12216 12721 10649 18963 11988 17349 14889 17497
Minicoy 17863 18419 14574 15079 19119 30181 28185 32253 41467 48733
MILK PRODUCTION IN GOVT. DAIRY UNITS/FARM (IN LITRES)
26
Island 2004 - 05 2005 - 06 2006 - 07 2007 - 08 2008 - 09 2009 - 10 2010 - 11 2011 - 12 2012-13 2013-14
Kavaratti 145466 160466 113354 116806 86417 68335 128937 67280 66405 107473
Minicoy 10787 18787 11172 14626 4136 16717 25136 24642 53320 58652
Agatti 21584 26084 28916 32365 5496 16619 3961 34564 45763 86272
Andrott 17066 19626 57065 60517 38699 17441 143331 28438 12704 32427
Kalpeni 9656 23196 9568 13017 34205 75820 31359 19410 33111 71783
Amini 86613 90993 39563 43017 89499 43562 19312 93482 71732 105665
Kadmat 2080 7223 25181 28635 2388 24275 2342 19703 39824 27725
Kiltan 5422 6241 2819 6270 — 0 3966 2521 0 11495
Chetlat 14383 2859 5296 8747 21157 1269 585 1373 4078 5301
Total 313057 355475 292934 324000 281997 264038 358929 291413 326937 506793
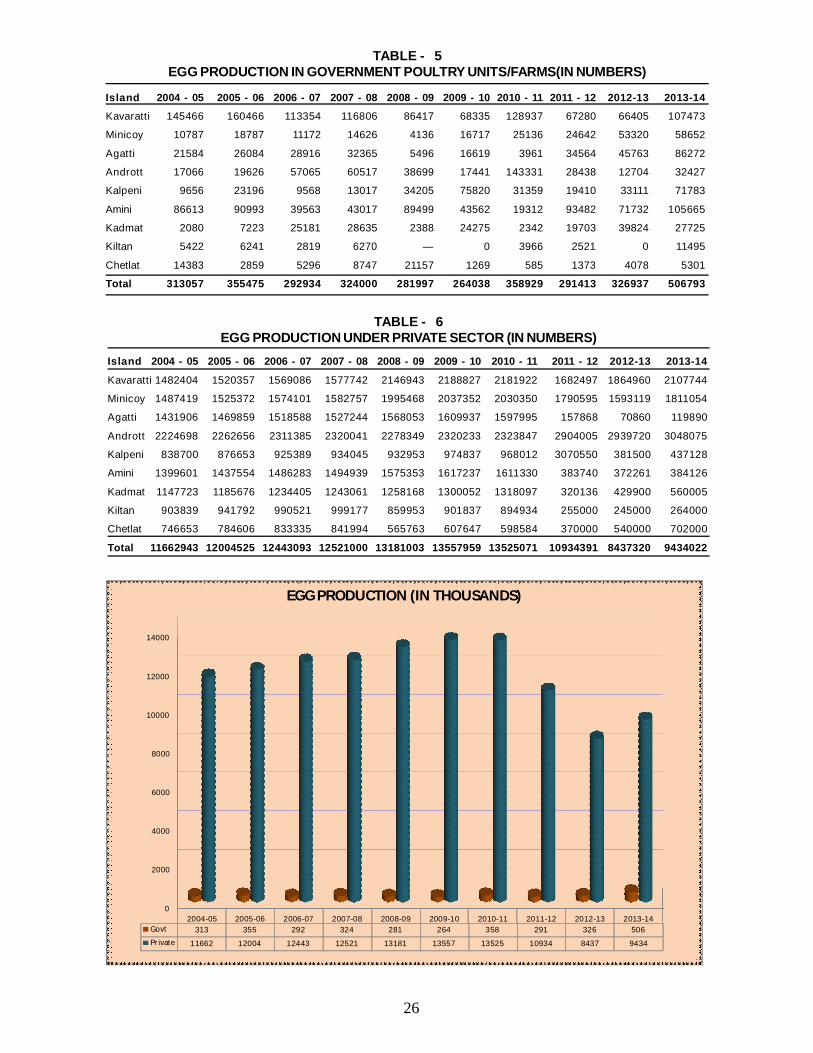
TABLE - 5EGG PRODUCTION IN GOVERNMENT POULTRY UNITS/FARMS(IN NUMBERS)
Island 2004 - 05 2005 - 06 2006 - 07 2007 - 08 2008 - 09 2009 - 10 2010 - 11 2011 - 12 2012-13 2013-14
Kavaratti 1482404 1520357 1569086 1577742 2146943 2188827 2181922 1682497 1864960 2107744
Minicoy 1487419 1525372 1574101 1582757 1995468 2037352 2030350 1790595 1593119 1811054
Agatti 1431906 1469859 1518588 1527244 1568053 1609937 1597995 157868 70860 119890
Andrott 2224698 2262656 2311385 2320041 2278349 2320233 2323847 2904005 2939720 3048075
Kalpeni 838700 876653 925389 934045 932953 974837 968012 3070550 381500 437128
Amini 1399601 1437554 1486283 1494939 1575353 1617237 1611330 383740 372261 384126
Kadmat 1147723 1185676 1234405 1243061 1258168 1300052 1318097 320136 429900 560005
Kiltan 903839 941792 990521 999177 859953 901837 894934 255000 245000 264000
Chetlat 746653 784606 833335 841994 565763 607647 598584 370000 540000 702000
Total 11662943 12004525 12443093 12521000 13181003 13557959 13525071 10934391 8437320 9434022
TABLE - 6EGG PRODUCTION UNDER PRIVATE SECTOR (IN NUMBERS)
0
2000
4000
6000
8000
10000
12000
14000
2004-05 2005-06 2006-07 2007-08 2008-09 2009-10 2010-11 2011-12 2012-13 2013-14Govt 313 355 292 324 281 264 358 291 326 506
Private 11662 12004 12443 12521 13181 13557 13525 10934 8437 9434
EGG PRODUCTION (IN THOUSANDS)
27
Island 31.3.2003 31.3.2004 31.3.2005 31.3.2006 31.3.2007 31.3.2008 31.3.2009 31.03.2010 31.03.2011 31.03.2012
Kavaratti 4 10 9 10 6 18 26 26 39 29Minicoy 6 10 9 10 5 20 29 38 45 45Total 10 20 18 20 11 38 55 64 84 74
TABLE - 7CATTLE IN GOVERNMENT DEMONSTRATION UNITS/FARMS (In Nos)
Island 31.3.2003 31.3.2004 31.3.2005 31.3.2006 31.3.2007 31.3.2008 31.3.2009 31.03.2010 31.03.2011 31.03.2012
Kavaratti 3278 8341 5812 3227 3345 3542 4322 2423 2277 770
Minicoy 4321 5971 1383 2320 2452 2543 2502 2819 1729 18603
Agatti 1820 3911 1348 1120 1423 1542 1815 2181 506 2978
Andrott 2333 3260 2412 2093 2541 3241 189 988 896 318
Kalpeni 1200 2177 1800 2088 2143 2245 3037 1093 1253 375
Amini 1462 1785 3214 2974 2845 2985 2008 643 1292 7174
Kadmat 1420 518 464 1646 1732 1830 4690 169 162 1104
Kiltan 346 1514 450 987 1012 1125 1281 3761 1019 59
Chetlat 1758 501 285 452 648 896 5238 2065 — —
Bitra - - — — — — — — — —
Total 17938 27978 17168 16907 18141 19949 25082 16142 9134 31381
TABLE - 8POULTRY IN GOVERNMENT DEMONSTRATION UNITS/FARM (In Nos)
Island 31.3.2005 31.3.2006 31.3.2007 31.3.2008 31.3.2009 31.3.2010 31.3.2011 31.03.2012 31.03.2013 31.03.2014
Kavaratti 21 21 21 21 21 27 27 23 21 28Minicoy 9 9 9 9 9 14 14 13 14 14Agatti 3 3 3 3 3 11 11 12 13 16Andrott 10 10 10 10 10 12 12 13 13 16Kalpeni 6 6 6 6 6 13 13 16 16 10Amini 14 14 14 14 14 12 12 14 12 9Kadmat 4 4 4 4 4 6 6 5 3 6Kiltan 2 2 2 2 2 7 7 7 7 7Chetlat 1 1 1 1 1 3 3 3 3 3Bitra 0 0 0 0 0 1 1 1 1 1Kochi 2 2 2 2 2 4 4 4 4 4Total 72 72 72 72 72 110 110 111 107 114Note: Bitra is included now.
TABLE - 9ISLAND WISE LABOUR STRENGTH IN ANIMAL HUSBANDRY (IN NUMBERS)
Island 2004 - 05 2005 - 06 2006 - 07 2007 - 08 2008 - 09 2009 - 10 2010 - 11 2011 - 12 2012-13 2013-14
Kavaratti 64949 68646 49414 43538 57106 49512 59615 57703 59265 48650
Minicoy 21452 25395 23075 30427 39258 36455 35541 53038 52704 34690
Agatti 28292 20921 22678 23279 33838 14840 16325 40284 56134 38430
Androth 25455 32480 29721 26010 19510 23317 22554 30722 48154 36690
Kalpeni 16604 16218 11568 18826 20050 20218 18890 19339 18299 29129
Amini 14198 10617 8838 15295 19418 23425 25394 35235 31146 34650
Kadmat - 9745 12368 17333 19613 14942 21726 22145 28476 51922
Kiltan - 16006 18256 20182 20294 25365 20429 25408 26544 21890
Chetlat - - 4645 6392 2891 11878 7025 9132 10122 17265
Bitra 0 0 0 0 0 0 0 0 855 1575
Total 170950 200028 180563 201282 231978 219952 227499 293006 331699 314891
Note: Bitra is included now.
TABLE-10CHICKS PRODUCTION IN GOVERNMENT HATCHERIES (IN NUMBERS)
28
I tem 2004 - 05 2005 - 06 2006 - 07 2007 - 08 2008 - 09 2009 - 10 2010 - 11 2011 - 12 2012-13 2013-14Artificial 575 625 650 675 0 0 0 0 0 0InseminationTreatmentCattle/ 23844 44534 21474 22430 14618 11961 10930 39423 52640 74706GoatBirds 129309 149384 183669 165340 205542 223220 270749 283191 377843 483094
TABLE-11DETAILS OF TREATMENT (IN NUMBERS)
TABLE - 12ISLAND-WISE BROILER MEAT PRODUCTION (IN MT)
2004-2005 2005-2006 2006-2007 2007-2008 2008-2009 2009-2010 2010-2011 2011-2012 2012-13 2013-14
Kavaratti 93 99 70 65 86 58.57 78.00 86.55 88.9 72.98
Minicoy 36 46 43 46 59 47.56 53.42 69.00 79.06 52.00
Agatti 24 23 16 36 51 32.23 20.40 60.23 84.2 57.65
Androth 30 36 33 39 29 20.00 18.44 46.08 72.23 55.00
Kalpeni 20 15 13 28 30 22.50 21.00 29.00 31.52 43.69
Amini 25 30 32 23 29 35.13 38.24 52.85 46.72 52.00
Kadamath 10 14 18 26 29 16.42 26.63 33.21 42.71 77.88
Kiltan 5 18 26 30 30 28.95 19.80 38.11 39.82 32.85
Chethlath 2 5 7 10 4 14.01 12.09 13.70 15.18 25.9
Bitra 0 0 0 0 0 0 0 0 1.28 2.35
Total 245 286 258 303 347 275.37 288.02 428.73 501.62 472.3
Name of Island
29
FISHERIESTABLE - 1
FISHERIES IN LAKSHADWEEP Item 2004-05 2005-06 2006-07 2007-08 2008-09 2009-10 2010-11 2011-12 2012-13 2013-14
1. Fishermen engaged in 6710 7020 8140 9860 9995 11400 9195 9786 11629 14309
fishing (Nos)
2. Boat engaged in fishing -
Total crafts available (Nos) 944 920 2275 2266 2035 2005 2017 2093 2140 2238
a) Mechanised Boats 508 494 586 566 555 550 567 567 571 571
b) OBM fitted Crafts 246 246 371 410 385 405 400 428 435 445
c) Country Crafts 190 180 1318* 1290 1095 1050 1050 1098 1134 1222
3. Nets used (Nos)
a) Gill Net — — — — — — 150 163 188 215
b) Shore seen net 365 345 310 290 275 280 282 284 283 289
c) Ancornent/ Drag net 230 212 190 185 165 180 170 191 193 198
d) Cast net 1250 1180 1165 1095 1120 1070 1200 1215 1213 1230
4. Pablo Boats issued by the 505 505 505 505 505 505 505 505 505 505
Dept.upto the year (Incl.
Fisheries dept. Boats (Nos.)
5. Fisheries Department boats 5 5 5 5 5 5 5 5 5 5
6.Fisheries requisites — — — — — — — — — —
distributed worth (Rs.in lakhs)
* Source from National Marine Fisheries Census for Andaman & Lakshadweep
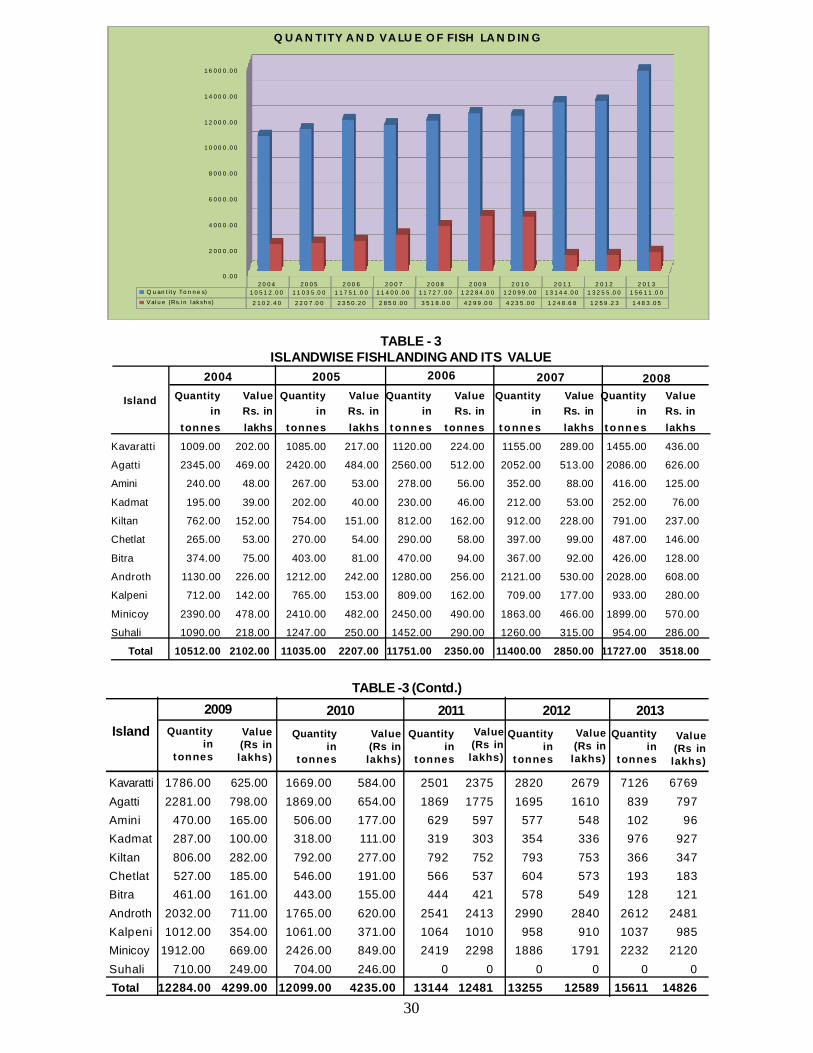
TABLE - 2QUANTITY AND VALUE OF FISH LANDING IN LAKSHADWEEP
Quantity (Tonnes) Value (Rs.in lakshs)2004 10512.00 2102.402005 11035.00 2207.002006 11751.00 2350.202007 11400.00 2850.002008 11727.00 3518.002009 12284.00 4299.002010 12099.00 4235.002011 13144.00 1248.682012 13255.00 1259.232013 15611.00 1483.05
30
Quantity Value Quantity Value Quantity Value Quantity Value Quantity Valuein Rs. in in Rs. in in Rs. in in Rs. in in Rs. in
tonnes lakhs tonnes lakhs t o nn e s tonnes t o nn e s lakhs t o nn e s lakhs
Kavaratti 1009.00 202.00 1085.00 217.00 1120.00 224.00 1155.00 289.00 1455.00 436.00
Agatti 2345.00 469.00 2420.00 484.00 2560.00 512.00 2052.00 513.00 2086.00 626.00
Amini 240.00 48.00 267.00 53.00 278.00 56.00 352.00 88.00 416.00 125.00
Kadmat 195.00 39.00 202.00 40.00 230.00 46.00 212.00 53.00 252.00 76.00
Kiltan 762.00 152.00 754.00 151.00 812.00 162.00 912.00 228.00 791.00 237.00
Chetlat 265.00 53.00 270.00 54.00 290.00 58.00 397.00 99.00 487.00 146.00
Bitra 374.00 75.00 403.00 81.00 470.00 94.00 367.00 92.00 426.00 128.00
Androth 1130.00 226.00 1212.00 242.00 1280.00 256.00 2121.00 530.00 2028.00 608.00
Kalpeni 712.00 142.00 765.00 153.00 809.00 162.00 709.00 177.00 933.00 280.00
Minicoy 2390.00 478.00 2410.00 482.00 2450.00 490.00 1863.00 466.00 1899.00 570.00
Suhali 1090.00 218.00 1247.00 250.00 1452.00 290.00 1260.00 315.00 954.00 286.00
Total 10512.00 2102.00 11035.00 2207.00 11751.00 2350.00 11400.00 2850.00 11727.00 3518.00
TABLE - 3ISLANDWISE FISHLANDING AND ITS VALUE
2004
Island
2005 2006 2007 2008
Kavaratti 1786.00 625.00 1669.00 584.00 2501 2375 2820 2679 7126 6769Agatti 2281.00 798.00 1869.00 654.00 1869 1775 1695 1610 839 797Amini 470.00 165.00 506.00 177.00 629 597 577 548 102 96Kadmat 287.00 100.00 318.00 111.00 319 303 354 336 976 927Kiltan 806.00 282.00 792.00 277.00 792 752 793 753 366 347Chetlat 527.00 185.00 546.00 191.00 566 537 604 573 193 183Bitra 461.00 161.00 443.00 155.00 444 421 578 549 128 121Androth 2032.00 711.00 1765.00 620.00 2541 2413 2990 2840 2612 2481Kalpeni 1012.00 354.00 1061.00 371.00 1064 1010 958 910 1037 985Minicoy 1912.00 669.00 2426.00 849.00 2419 2298 1886 1791 2232 2120Suhali 710.00 249.00 704.00 246.00 0 0 0 0 0 0 Total 12284.00 4299.00 12099.00 4235.00 13144 12481 13255 12589 15611 14826
TABLE -3 (Contd.)
Island Quantityin
tonnes
Value(Rs inlakhs)
Quantityin
tonnes
Quantityin
tonnes
Quantityin
tonnes
Quantityin
tonnes
Value(Rs inlakhs)
Value(Rs inlakhs)
Value(Rs in
lakhs)
Value(Rs inlakhs)
2009 2010 2011 2012 2013
0 . 0 0
2 0 0 0 . 0 0
4 0 0 0 . 0 0
6 0 0 0 . 0 0
8 0 0 0 . 0 0
1 0 0 0 0 . 0 0
1 2 0 0 0 . 0 0
1 4 0 0 0 . 0 0
1 6 0 0 0 . 0 0
2 0 0 4 2 0 0 5 2 0 0 6 2 0 0 7 2 0 0 8 2 0 0 9 2 0 1 0 2 0 1 1 2 0 1 2 2 0 1 3Q u a n tity T o n n e s ) 1 0 5 1 2 . 0 0 1 1 0 3 5 .0 0 1 1 7 5 1 .0 0 1 1 4 0 0 .0 0 1 1 7 2 7 . 0 0 1 2 2 8 4 .0 0 1 2 0 9 9 .0 0 1 3 1 4 4 . 0 0 1 3 2 5 5 .0 0 1 5 6 1 1 .0 0
V a l u e ( R s .i n l a k s h s ) 2 1 0 2 . 4 0 2 2 0 7 .0 0 2 3 5 0 .2 0 2 8 5 0 . 0 0 3 5 1 8 .0 0 4 2 9 9 .0 0 4 2 3 5 . 0 0 1 2 4 8 .6 8 1 2 5 9 .2 3 1 4 8 3 .0 5
Q U A N T IT Y A N D V A L U E O F F IS H L A N D IN G
31
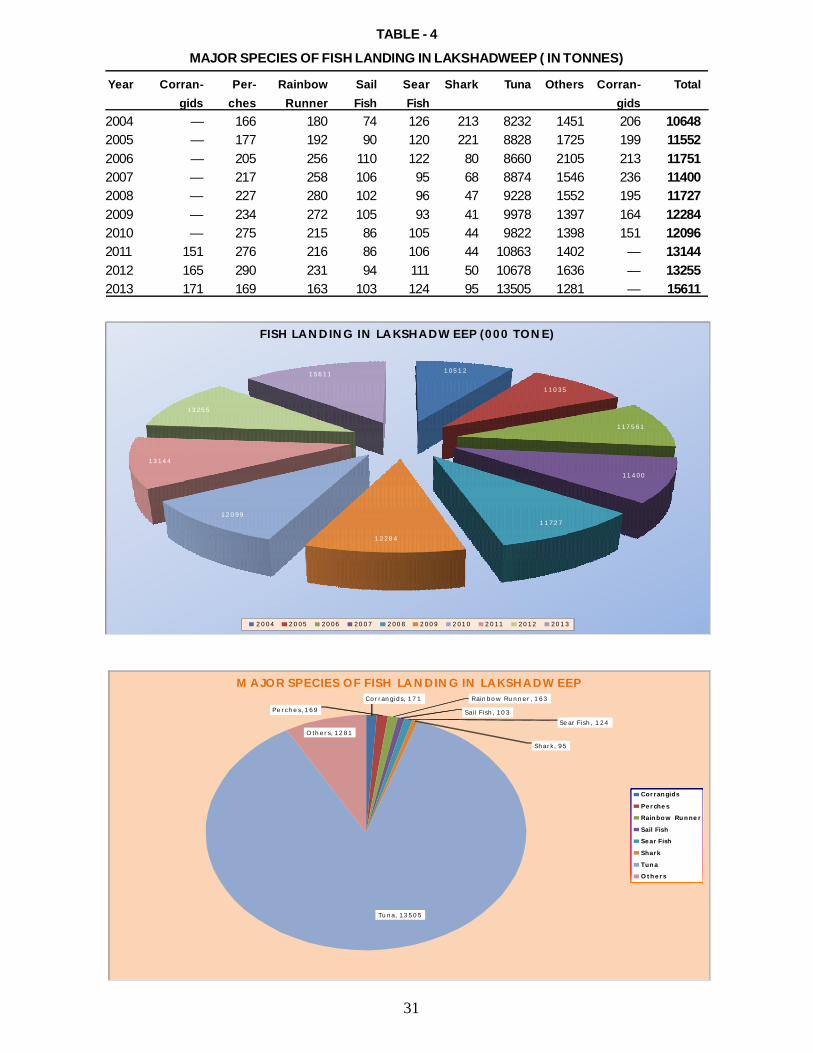
TABLE - 4
MAJOR SPECIES OF FISH LANDING IN LAKSHADWEEP ( IN TONNES)
Year Corran- Per- Rainbow Sail Sear Shark Tuna Others Corran- Totalgids ches Runner Fish Fish gids
2004 — 166 180 74 126 213 8232 1451 206 106482005 — 177 192 90 120 221 8828 1725 199 115522006 — 205 256 110 122 80 8660 2105 213 117512007 — 217 258 106 95 68 8874 1546 236 114002008 — 227 280 102 96 47 9228 1552 195 117272009 — 234 272 105 93 41 9978 1397 164 122842010 — 275 215 86 105 44 9822 1398 151 120962011 151 276 216 86 106 44 10863 1402 — 131442012 165 290 231 94 111 50 10678 1636 — 132552013 171 169 163 103 124 95 13505 1281 — 15611
1 0 5 1 2
1 1 0 3 5
1 1 7 5 6 1
1 1 4 0 0
1 1 7 2 7
1 2 2 8 4
1 2 0 9 9
1 3 1 4 4
1 3 2 5 5
1 5 6 1 1
F IS H L A N D IN G IN L A K S H A D W E E P ( 0 0 0 T O N E )
2 0 0 4 2 0 0 5 2 0 0 6 2 0 0 7 2 0 0 8 2 0 0 9 2 0 1 0 2 0 1 1 2 0 1 2 2 0 1 3
C o r r a n g i d s , 1 7 1
P e r c h e s , 1 6 9
R a in b o w R u n n e r , 1 6 3
S a il F i s h , 1 0 3
S e a r F i s h , 1 2 4
S h a r k , 9 5
T u n a , 1 3 5 0 5
O th e r s , 1 2 8 1
M A J O R S P E C IE S O F F IS H L A N D IN G IN L A K S H A D W E E P
C o r r an g id s
P e r ch e s
R a in b o w R u n n e r
S a il F is h
S e a r F ish
S h a r k
T u n a
O t h e r s
32
2004 1317 322005 1345 282006 1280 242007 1350 212008 1410 262009 1395 252010 1276 232011 175 02012 83.84 02013 207.68 19
Year
TABLE - 5FISH PRODUCTS EXPORTED (MT)
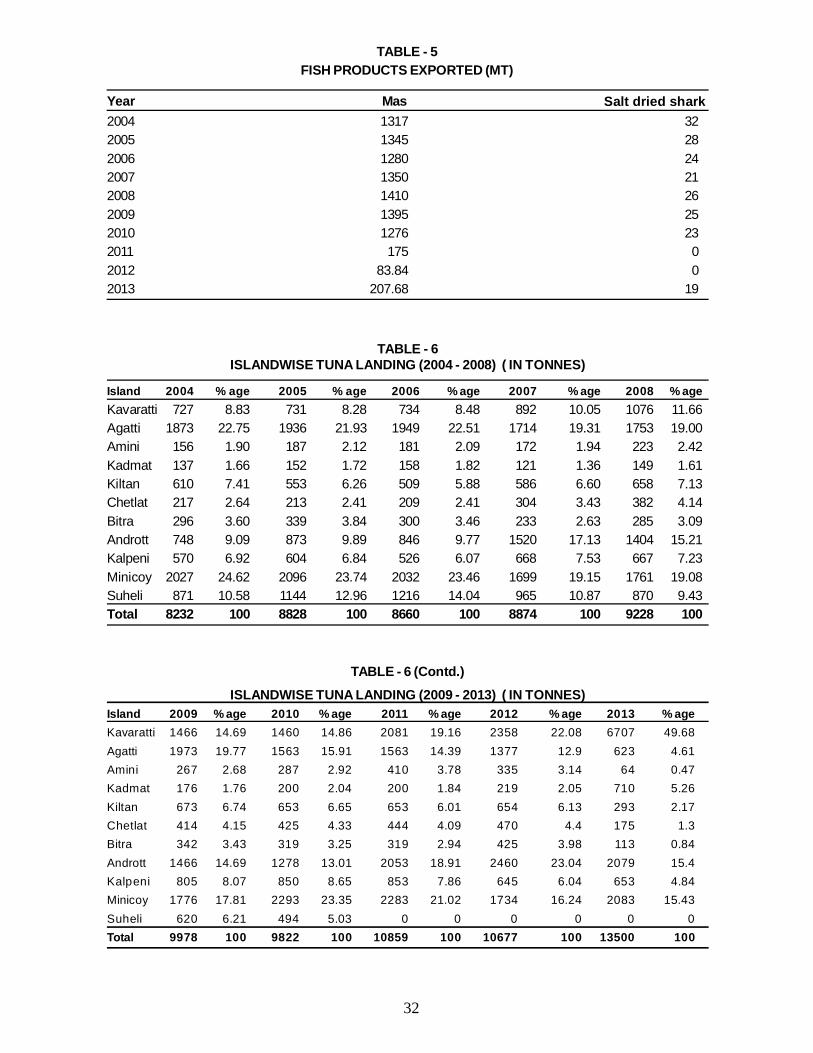
Mas Salt dried shark
TABLE - 6ISLANDWISE TUNA LANDING (2004 - 2008) ( IN TONNES)
Island 2004 % age 2005 % age 2006 % age 2007 % age 2008 % ageKavaratti 727 8.83 731 8.28 734 8.48 892 10.05 1076 11.66Agatti 1873 22.75 1936 21.93 1949 22.51 1714 19.31 1753 19.00Amini 156 1.90 187 2.12 181 2.09 172 1.94 223 2.42Kadmat 137 1.66 152 1.72 158 1.82 121 1.36 149 1.61Kiltan 610 7.41 553 6.26 509 5.88 586 6.60 658 7.13Chetlat 217 2.64 213 2.41 209 2.41 304 3.43 382 4.14Bitra 296 3.60 339 3.84 300 3.46 233 2.63 285 3.09Andrott 748 9.09 873 9.89 846 9.77 1520 17.13 1404 15.21Kalpeni 570 6.92 604 6.84 526 6.07 668 7.53 667 7.23Minicoy 2027 24.62 2096 23.74 2032 23.46 1699 19.15 1761 19.08Suheli 871 10.58 1144 12.96 1216 14.04 965 10.87 870 9.43Total 8232 100 8828 100 8660 100 8874 100 9228 100
TABLE - 6 (Contd.)ISLANDWISE TUNA LANDING (2009 - 2013) ( IN TONNES)
Island 2009 % age 2010 % age 2011 % age 2012 % age 2013 % ageKavaratti 1466 14.69 1460 14.86 2081 19.16 2358 22.08 6707 49.68Agatti 1973 19.77 1563 15.91 1563 14.39 1377 12.9 623 4.61Amini 267 2.68 287 2.92 410 3.78 335 3.14 64 0.47Kadmat 176 1.76 200 2.04 200 1.84 219 2.05 710 5.26Kiltan 673 6.74 653 6.65 653 6.01 654 6.13 293 2.17Chetlat 414 4.15 425 4.33 444 4.09 470 4.4 175 1.3Bitra 342 3.43 319 3.25 319 2.94 425 3.98 113 0.84Andrott 1466 14.69 1278 13.01 2053 18.91 2460 23.04 2079 15.4Kalpeni 805 8.07 850 8.65 853 7.86 645 6.04 653 4.84Minicoy 1776 17.81 2293 23.35 2283 21.02 1734 16.24 2083 15.43Suheli 620 6.21 494 5.03 0 0 0 0 0 0Total 9978 100 9822 100 10859 100 10677 100 13500 100
33
TABLE - 7ISLANDWISE LABOUR ENGAGED
( average per day in the fisheries department)
Island 30.3.1997 30.3.1998 30.3.1999 30.3.2000 30.3.2001 31.3.2002 31.3.2003 31.3.2004 31.3.2005 31.3.2006
Kavaratti 8 6 6 6 6 6 6 6 6 6Agatti 0 0 0 0 0 0 0 0 0 0Amini 1 1 1 1 1 1 1 1 1 1Kadmat 1 0 0 0 0 0 0 0 0 0Kiltan 1 1 1 1 1 1 1 1 1 1Chetlat 2 2 2 2 2 2 2 2 2 2Bitra 1 1 1 1 1 1 1 1 1 1Androth 1 1 1 1 1 1 1 1 1 1Kalpeni 1 1 1 1 1 1 1 1 1 1Minicoy 0 0 0 0 0 0 0 0 0 0Total 16 13 13 13 13 13 13 13 13 13
Kavaratti 1 1Agatti 1 1Chetlat 2 1Andrott 1 1Kalpeni 1Total 5 1 4
TABLE - 8ISLAND WISE COLD STORAGES AVAILABLABILITY & TUNNEL FREEZERS
(IN NOS)
Island No. of coldStorage/Freezer
TunnelNo. of
No. of IcePlants
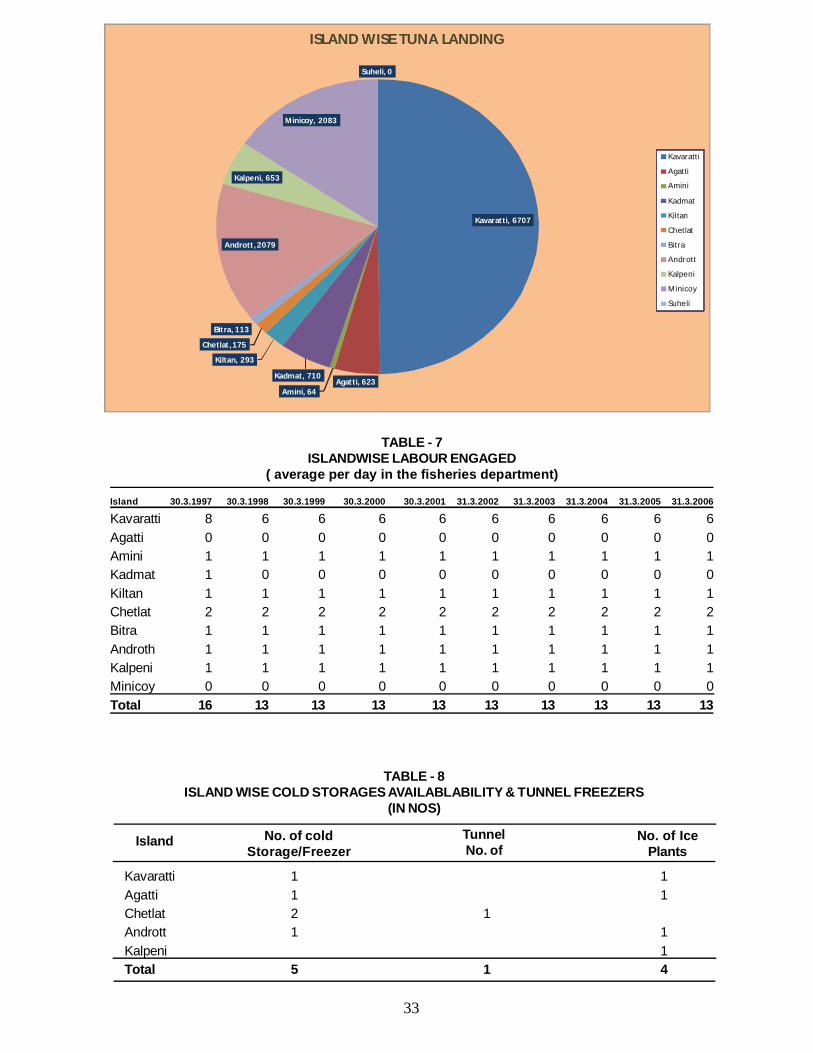
Kavaratti, 6707
Agatti, 623Am ini, 64
Kadm at, 710
Kiltan, 293
Chetlat , 175
Bitra, 113
Andrott , 2079
Kalpeni, 653
Minicoy, 2083
Suheli, 0
ISLAND WISE TUNA LANDING
Kavaratti
Agatti
Amini
Kadmat
Kiltan
Chetlat
Bitra
Andrott
Kalpeni
Minicoy
Suheli
34
Kavaratti 452 998Agatti 470 1015Amini 186 589Kadmat 298 423Kiltan 305 470Chetlat 199 219Bitra 68 94Andrott 425 937Kalpeni 431 838Minicoy 463 906Total 3297 6489
TABLE - 9 ContISLANDWISE DETAILS OF FISHERMEN IN LAKSHADWEEP (2011 - 2012)
Island No. of activefishermen (Fultime)
Partime/ occassional Fishermen&Fishermen assosciated in allied activities
Kavaratti 715 1225Agatti 1600 1236Amini 265 696Kadmat 296 633Kiltan 356 652Chetlat 215 319Bitra 96 104Andrott 615 1296Kalpeni 478 1018Minicoy 1205 1289Total 5841 8468
TABLE - 9 ContISLANDWISE DETAILS OF FISHERMEN IN LAKSHADWEEP (2013 - 2014)
Island No. of activefishermen (Fultime)
Partime/ occassional Fishermen&Fishermen assosciated in allied activities
Kavaratti 595 902Agatti 538 758Amini 184 301Kadmat 365 302Kiltan 396 315Chetlat 216 255Bitra 56 65Andrott 579 510Kalpeni 760 679Minicoy 521 898Total 4210 4985
TABLE - 9ISLANDWISE DETAILS OF FISHERMEN IN LAKSHADWEEP (2010 - 2011)
Island No. of activefishermen (Fultime)
Partime/ occassional Fishermen&Fishermen assosciated in allied activities
Kavaratti 461 1217Agatti 474 1238Amini 194 656Kadmat 299 613Kiltan 284 640Chetlat 191 308Bitra 70 99Andrott 428 1289Kalpeni 418 1010Minicoy 481 1259Total 3300 8329
TABLE - 9 ContISLANDWISE DETAILS OF FISHERMEN IN LAKSHADWEEP (2012- 2013)
Island No. of activefishermen (Fultime)
Partime/ occassional Fishermen&Fishermen assosciated in allied activities
35
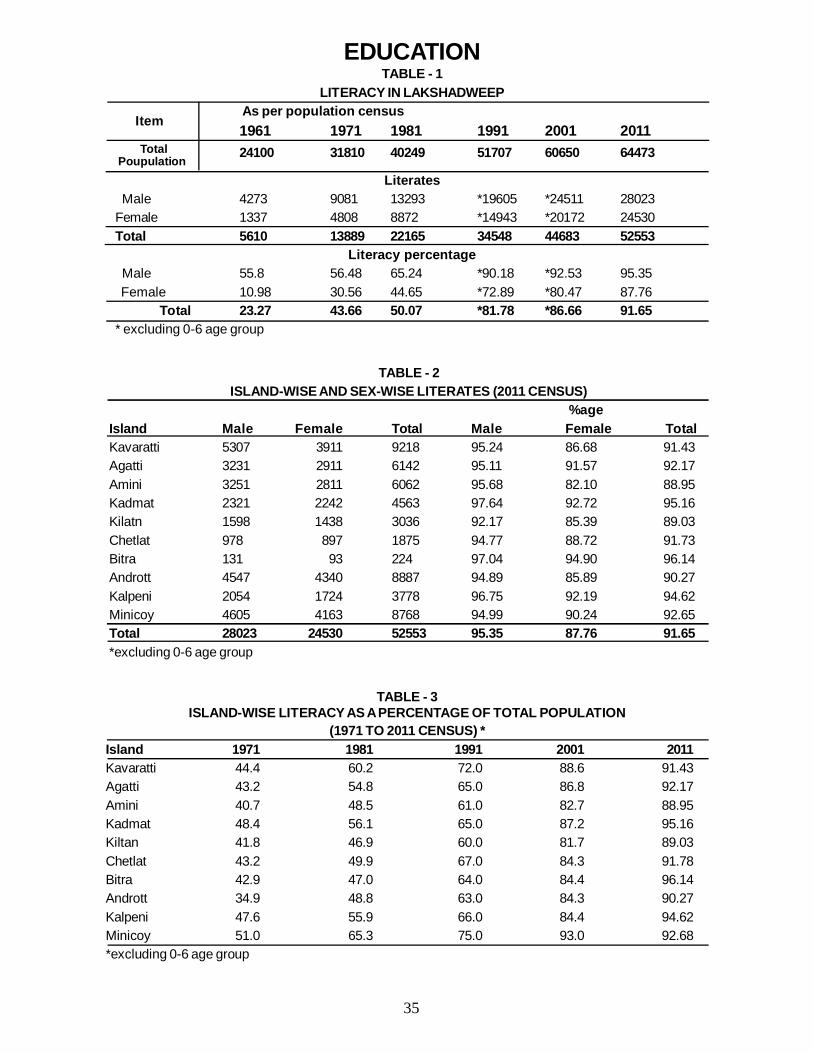
EDUCATIONTABLE - 1
LITERACY IN LAKSHADWEEP As per population census1961 1971 1981 1991 2001 201124100 31810 40249 51707 60650 64473
Literates Male 4273 9081 13293 *19605 *24511 28023Female 1337 4808 8872 *14943 *20172 24530Total 5610 13889 22165 34548 44683 52553
Literacy percentage Male 55.8 56.48 65.24 *90.18 *92.53 95.35 Female 10.98 30.56 44.65 *72.89 *80.47 87.76 Total 23.27 43.66 50.07 *81.78 *86.66 91.65* excluding 0-6 age group
Item
TotalPoupulation
TABLE - 3ISLAND-WISE LITERACY AS A PERCENTAGE OF TOTAL POPULATION
(1971 TO 2011 CENSUS) *Island 1971 1981 1991 2001 2011Kavaratti 44.4 60.2 72.0 88.6 91.43Agatti 43.2 54.8 65.0 86.8 92.17Amini 40.7 48.5 61.0 82.7 88.95Kadmat 48.4 56.1 65.0 87.2 95.16Kiltan 41.8 46.9 60.0 81.7 89.03Chetlat 43.2 49.9 67.0 84.3 91.78Bitra 42.9 47.0 64.0 84.4 96.14Andrott 34.9 48.8 63.0 84.3 90.27Kalpeni 47.6 55.9 66.0 84.4 94.62Minicoy 51.0 65.3 75.0 93.0 92.68*excluding 0-6 age group
TABLE - 2ISLAND-WISE AND SEX-WISE LITERATES (2011 CENSUS)
%ageIsland Male Female Total Male Female TotalKavaratti 5307 3911 9218 95.24 86.68 91.43Agatti 3231 2911 6142 95.11 91.57 92.17Amini 3251 2811 6062 95.68 82.10 88.95Kadmat 2321 2242 4563 97.64 92.72 95.16Kilatn 1598 1438 3036 92.17 85.39 89.03Chetlat 978 897 1875 94.77 88.72 91.73Bitra 131 93 224 97.04 94.90 96.14Andrott 4547 4340 8887 94.89 85.89 90.27Kalpeni 2054 1724 3778 96.75 92.19 94.62Minicoy 4605 4163 8768 94.99 90.24 92.65Total 28023 24530 52553 95.35 87.76 91.65*excluding 0-6 age group
36
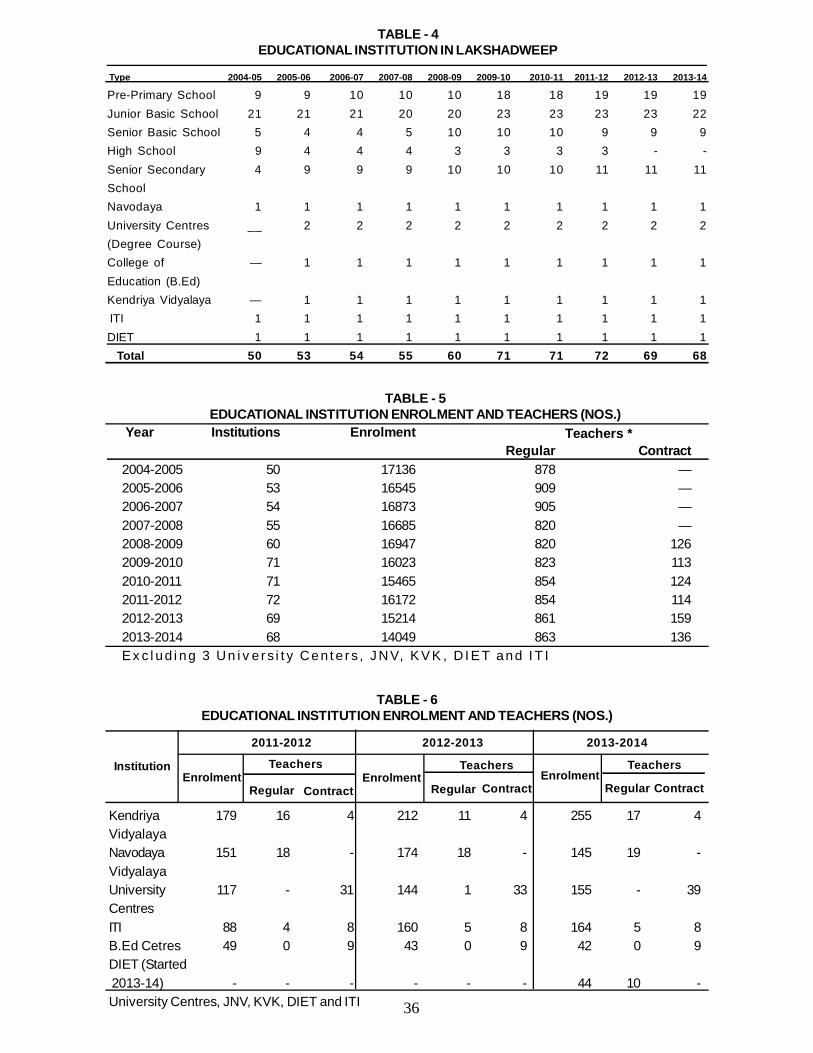
TABLE - 4EDUCATIONAL INSTITUTION IN LAKSHADWEEP
Type 2004-05 2005-06 2006-07 2007-08 2008-09 2009-10 2010-11 2011-12 2012-13 2013-14
Pre-Primary School 9 9 10 10 10 18 18 19 19 19Junior Basic School 21 21 21 20 20 23 23 23 23 22Senior Basic School 5 4 4 5 10 10 10 9 9 9High School 9 4 4 4 3 3 3 3 - -Senior Secondary 4 9 9 9 10 10 10 11 11 11SchoolNavodaya 1 1 1 1 1 1 1 1 1 1University Centres __ 2 2 2 2 2 2 2 2 2(Degree Course)College of — 1 1 1 1 1 1 1 1 1Education (B.Ed)Kendriya Vidyalaya — 1 1 1 1 1 1 1 1 1 ITI 1 1 1 1 1 1 1 1 1 1DIET 1 1 1 1 1 1 1 1 1 1 Total 50 53 54 55 60 71 71 72 69 68
Kendriya 179 16 4 212 11 4 255 17 4VidyalayaNavodaya 151 18 - 174 18 - 145 19 -VidyalayaUniversity 117 - 31 144 1 33 155 - 39CentresITI 88 4 8 160 5 8 164 5 8B.Ed Cetres 49 0 9 43 0 9 42 0 9DIET (Started 2013-14) - - - - - - 44 10 -University Centres, JNV, KVK, DIET and ITI
Institution
TABLE - 6EDUCATIONAL INSTITUTION ENROLMENT AND TEACHERS (NOS.)
2011-2012 2012-2013 2013-2014
EnrolmentTeachers
EnrolmentTeachers
EnrolmentTeachers
Regular Contract Regular Contract ContractRegular
TABLE - 5EDUCATIONAL INSTITUTION ENROLMENT AND TEACHERS (NOS.)
Year Institutions EnrolmentRegular Contract
2004-2005 50 17136 878 —2005-2006 53 16545 909 —2006-2007 54 16873 905 —2007-2008 55 16685 820 —2008-2009 60 16947 820 1262009-2010 71 16023 823 1132010-2011 71 15465 854 1242011-2012 72 16172 854 1142012-2013 69 15214 861 1592013-2014 68 14049 863 136E x c l ud i ng 3 Un i v e r s i t y Cen t e r s , J NV, K V K , D I E T and I T I
Teachers *
37
1 0 0 3
4 6 5 9
3 4 7 9
2 9 3 7
1 9 7 1
1 4 5 3
4 21 4 5 2 5 5
2 2 23 4
IN S T IT U T IO N W IS E S C H O L A R S 2 0 1 3 - 1 4
P r e -P r im a r y
J r . B a s ic S c h o o l ( I t o I V )
S r . B a s ic S c h o o l ( V to V II)
H ig h S c h o o l ( V II I to X )
S r . S e c o n d a r y S c h o o l ( X I to X II )
H ig h e r E d u c a t io n ( D e g r e e ) *
C o lle g e o f E d u c a tio n ( B .E d .)
N a v o d a y a
K e n d r iy a V id y a la y a
IT I
D IE T ( S ta r te d 2 0 1 3 -1 4 )
TABLE - 7 (Contd.)GIRLS
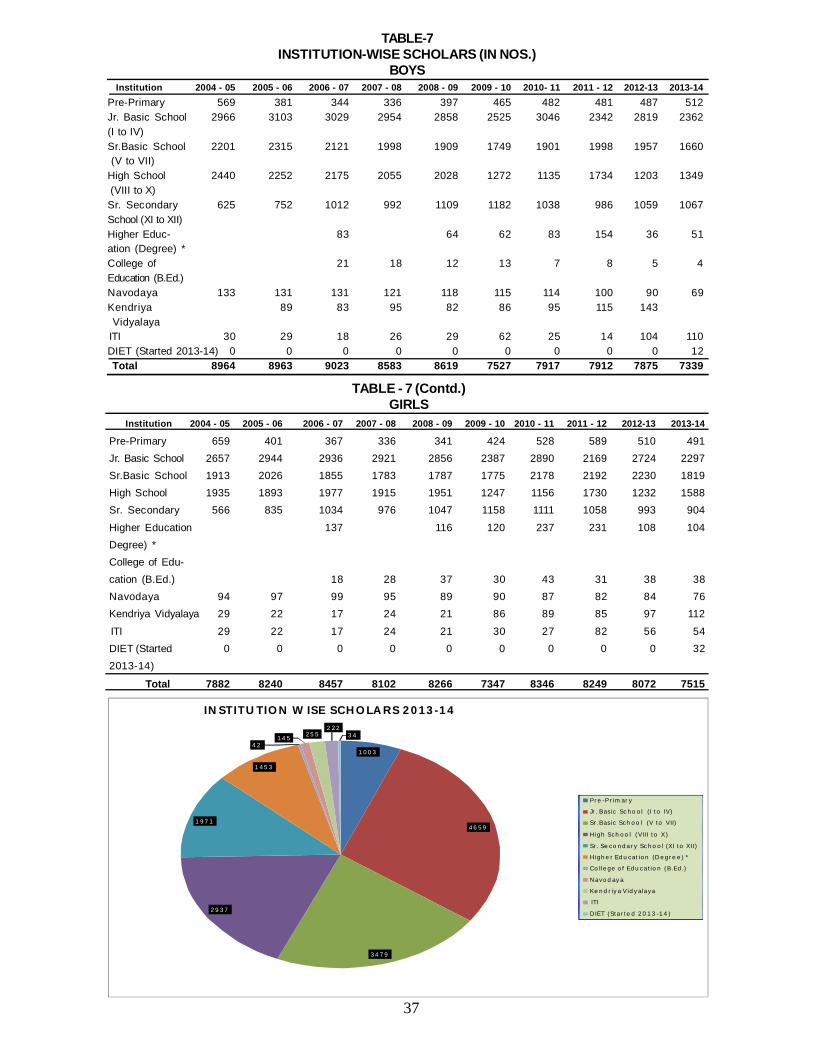
Institution 2004 - 05 2005 - 06 2006 - 07 2007 - 08 2008 - 09 2009 - 10 2010 - 11 2011 - 12 2012-13 2013-14
Pre-Primary 659 401 367 336 341 424 528 589 510 491Jr. Basic School 2657 2944 2936 2921 2856 2387 2890 2169 2724 2297Sr.Basic School 1913 2026 1855 1783 1787 1775 2178 2192 2230 1819High School 1935 1893 1977 1915 1951 1247 1156 1730 1232 1588Sr. Secondary 566 835 1034 976 1047 1158 1111 1058 993 904
Higher Education 137 116 120 237 231 108 104Degree) *College of Edu-cation (B.Ed.) 18 28 37 30 43 31 38 38Navodaya 94 97 99 95 89 90 87 82 84 76Kendriya Vidyalaya 29 22 17 24 21 86 89 85 97 112
ITI 29 22 17 24 21 30 27 82 56 54DIET (Started 0 0 0 0 0 0 0 0 0 322013-14)
Total 7882 8240 8457 8102 8266 7347 8346 8249 8072 7515
TABLE-7INSTITUTION-WISE SCHOLARS (IN NOS.)
BOYS Institution 2004 - 05 2005 - 06 2006 - 07 2007 - 08 2008 - 09 2009 - 10 2010- 11 2011 - 12 2012-13 2013-14Pre-Primary 569 381 344 336 397 465 482 481 487 512Jr. Basic School 2966 3103 3029 2954 2858 2525 3046 2342 2819 2362(I to IV)Sr.Basic School 2201 2315 2121 1998 1909 1749 1901 1998 1957 1660 (V to VII)High School 2440 2252 2175 2055 2028 1272 1135 1734 1203 1349 (VIII to X)Sr. Secondary 625 752 1012 992 1109 1182 1038 986 1059 1067School (XI to XII)Higher Educ- 83 64 62 83 154 36 51ation (Degree) *College of 21 18 12 13 7 8 5 4Education (B.Ed.)Navodaya 133 131 131 121 118 115 114 100 90 69Kendriya 89 83 95 82 86 95 115 143 Vidyalaya ITI 30 29 18 26 29 62 25 14 104 110DIET (Started 2013-14) 0 0 0 0 0 0 0 0 0 12 Total 8964 8963 9023 8583 8619 7527 7917 7912 7875 7339
38
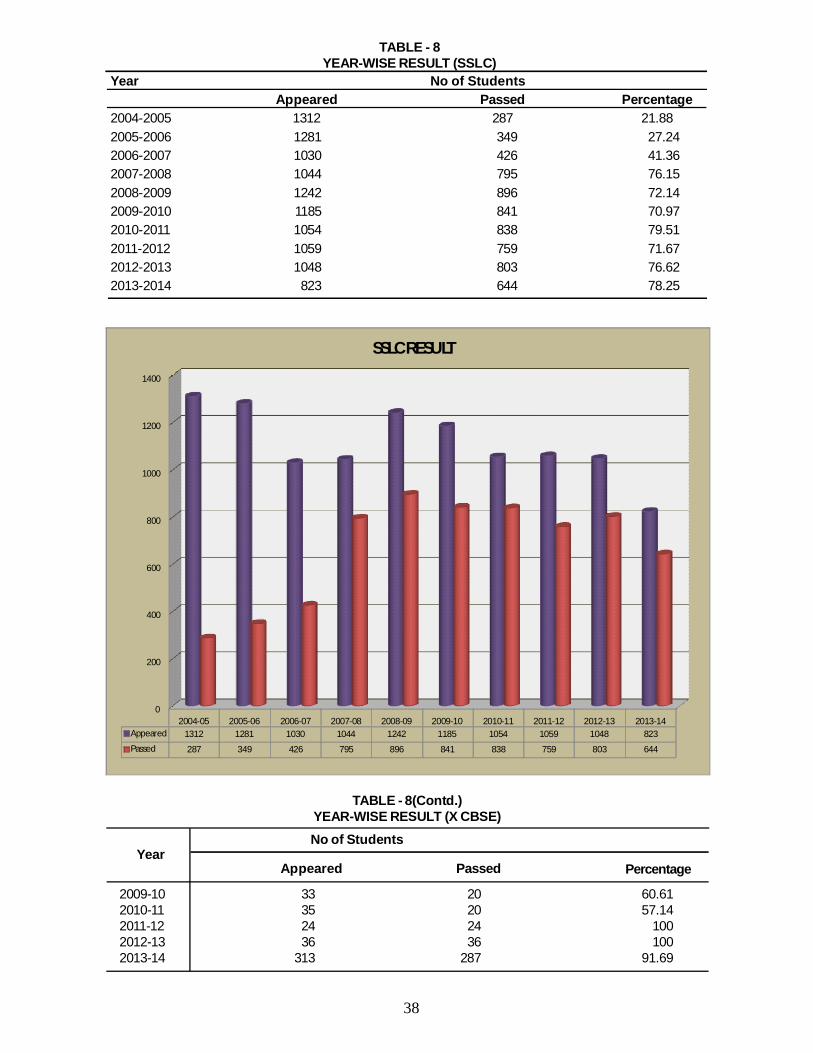
TABLE - 8YEAR-WISE RESULT (SSLC)
Year No of StudentsAppeared Passed Percentage
2004-2005 1312 287 21.882005-2006 1281 349 27.242006-2007 1030 426 41.362007-2008 1044 795 76.152008-2009 1242 896 72.142009-2010 1185 841 70.972010-2011 1054 838 79.512011-2012 1059 759 71.672012-2013 1048 803 76.622013-2014 823 644 78.25
2009-10 33 20 60.612010-11 35 20 57.142011-12 24 24 1002012-13 36 36 1002013-14 313 287 91.69
Year
TABLE - 8(Contd.)YEAR-WISE RESULT (X CBSE)No of Students
Appeared Passed Percentage
0
200
400
600
800
1000
1200
1400
2004-05 2005-06 2006-07 2007-08 2008-09 2009-10 2010-11 2011-12 2012-13 2013-14Appeared 1312 1281 1030 1044 1242 1185 1054 1059 1048 823
Passed 287 349 426 795 896 841 838 759 803 644
SSLC RESULT
39
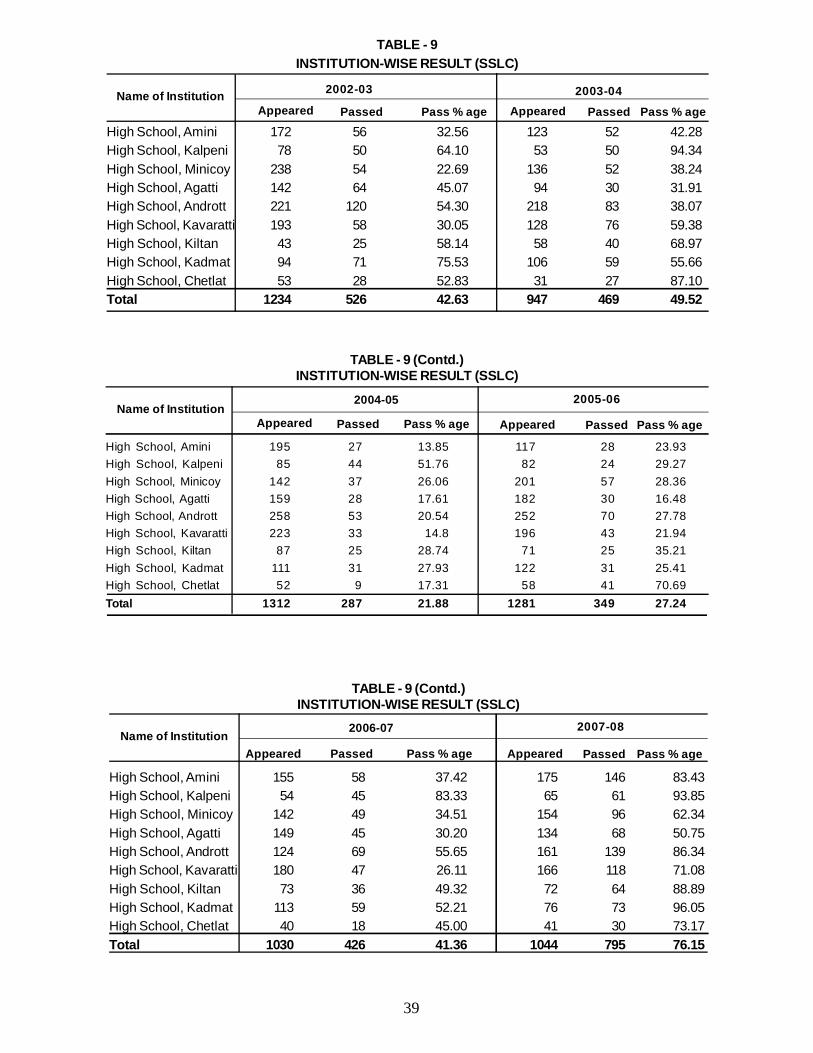
High School, Amini 155 58 37.42 175 146 83.43High School, Kalpeni 54 45 83.33 65 61 93.85High School, Minicoy 142 49 34.51 154 96 62.34High School, Agatti 149 45 30.20 134 68 50.75High School, Andrott 124 69 55.65 161 139 86.34High School, Kavaratti 180 47 26.11 166 118 71.08High School, Kiltan 73 36 49.32 72 64 88.89High School, Kadmat 113 59 52.21 76 73 96.05High School, Chetlat 40 18 45.00 41 30 73.17Total 1030 426 41.36 1044 795 76.15
TABLE - 9 (Contd.)INSTITUTION-WISE RESULT (SSLC)
Name of Institution 2006-07 2007-08
Appeared Passed Pass % age Appeared Passed Pass % age
TABLE - 9INSTITUTION-WISE RESULT (SSLC)
High School, Amini 172 56 32.56 123 52 42.28High School, Kalpeni 78 50 64.10 53 50 94.34High School, Minicoy 238 54 22.69 136 52 38.24High School, Agatti 142 64 45.07 94 30 31.91High School, Andrott 221 120 54.30 218 83 38.07High School, Kavaratti 193 58 30.05 128 76 59.38High School, Kiltan 43 25 58.14 58 40 68.97High School, Kadmat 94 71 75.53 106 59 55.66High School, Chetlat 53 28 52.83 31 27 87.10Total 1234 526 42.63 947 469 49.52
Name of Institution 2002-03 2003-04Appeared Passed Pass % age Appeared Passed Pass % age
High School, Amini 195 27 13.85 117 28 23.93High School, Kalpeni 85 44 51.76 82 24 29.27High School, Minicoy 142 37 26.06 201 57 28.36High School, Agatti 159 28 17.61 182 30 16.48High School, Andrott 258 53 20.54 252 70 27.78High School, Kavaratti 223 33 14.8 196 43 21.94High School, Kiltan 87 25 28.74 71 25 35.21High School, Kadmat 111 31 27.93 122 31 25.41High School, Chetlat 52 9 17.31 58 41 70.69Total 1312 287 21.88 1281 349 27.24
TABLE - 9 (Contd.)INSTITUTION-WISE RESULT (SSLC)
Name of Institution 2004-05 2005-06
Appeared Passed Pass % age Appeared Passed Pass % age
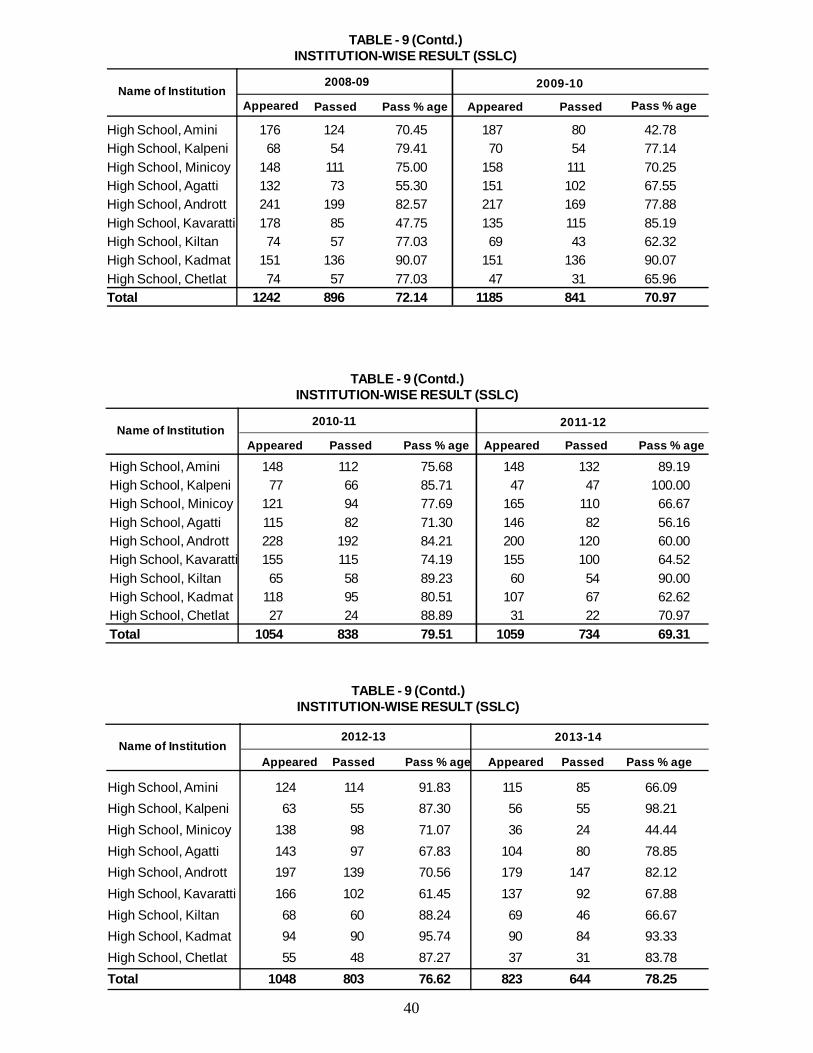
40
TABLE - 9 (Contd.)INSTITUTION-WISE RESULT (SSLC)
High School, Amini 176 124 70.45 187 80 42.78High School, Kalpeni 68 54 79.41 70 54 77.14High School, Minicoy 148 111 75.00 158 111 70.25High School, Agatti 132 73 55.30 151 102 67.55High School, Andrott 241 199 82.57 217 169 77.88High School, Kavaratti 178 85 47.75 135 115 85.19High School, Kiltan 74 57 77.03 69 43 62.32High School, Kadmat 151 136 90.07 151 136 90.07High School, Chetlat 74 57 77.03 47 31 65.96Total 1242 896 72.14 1185 841 70.97
Name of Institution 2008-09 2009-10
Appeared Passed Pass % age Appeared Passed Pass % age
High School, Amini 148 112 75.68 148 132 89.19High School, Kalpeni 77 66 85.71 47 47 100.00High School, Minicoy 121 94 77.69 165 110 66.67High School, Agatti 115 82 71.30 146 82 56.16High School, Andrott 228 192 84.21 200 120 60.00High School, Kavaratti 155 115 74.19 155 100 64.52High School, Kiltan 65 58 89.23 60 54 90.00High School, Kadmat 118 95 80.51 107 67 62.62High School, Chetlat 27 24 88.89 31 22 70.97Total 1054 838 79.51 1059 734 69.31
TABLE - 9 (Contd.)INSTITUTION-WISE RESULT (SSLC)
Name of Institution 2010-11 2011-12
Appeared Passed Pass % age Appeared Passed Pass % age
High School, Amini 124 114 91.83 115 85 66.09High School, Kalpeni 63 55 87.30 56 55 98.21High School, Minicoy 138 98 71.07 36 24 44.44High School, Agatti 143 97 67.83 104 80 78.85High School, Andrott 197 139 70.56 179 147 82.12High School, Kavaratti 166 102 61.45 137 92 67.88High School, Kiltan 68 60 88.24 69 46 66.67High School, Kadmat 94 90 95.74 90 84 93.33High School, Chetlat 55 48 87.27 37 31 83.78Total 1048 803 76.62 823 644 78.25
Name of Institution 2012-13 2013-14
Appeared Passed Pass % age Appeared Passed Pass % age
TABLE - 9 (Contd.)INSTITUTION-WISE RESULT (SSLC)
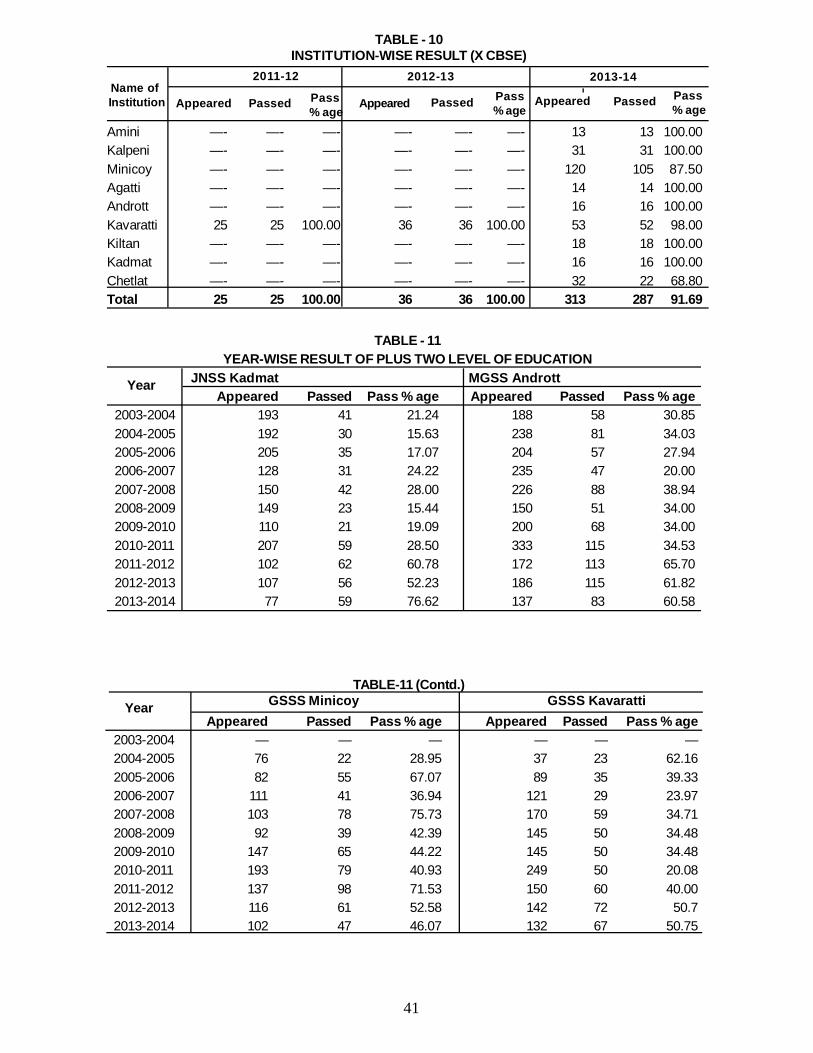
41
TABLE - 11YEAR-WISE RESULT OF PLUS TWO LEVEL OF EDUCATION
JNSS Kadmat MGSS AndrottAppeared Passed Pass % age Appeared Passed Pass % age
2003-2004 193 41 21.24 188 58 30.852004-2005 192 30 15.63 238 81 34.032005-2006 205 35 17.07 204 57 27.942006-2007 128 31 24.22 235 47 20.002007-2008 150 42 28.00 226 88 38.942008-2009 149 23 15.44 150 51 34.002009-2010 110 21 19.09 200 68 34.002010-2011 207 59 28.50 333 115 34.532011-2012 102 62 60.78 172 113 65.702012-2013 107 56 52.23 186 115 61.822013-2014 77 59 76.62 137 83 60.58
Year
TABLE-11 (Contd.)GSSS Minicoy GSSS Kavaratti
Appeared Passed Pass % age Appeared Passed Pass % age2003-2004 — — — — — —2004-2005 76 22 28.95 37 23 62.162005-2006 82 55 67.07 89 35 39.332006-2007 111 41 36.94 121 29 23.972007-2008 103 78 75.73 170 59 34.712008-2009 92 39 42.39 145 50 34.482009-2010 147 65 44.22 145 50 34.482010-2011 193 79 40.93 249 50 20.082011-2012 137 98 71.53 150 60 40.002012-2013 116 61 52.58 142 72 50.72013-2014 102 47 46.07 132 67 50.75
Year
Amini —- —- —- —- —- —- 13 13 100.00Kalpeni —- —- —- —- —- —- 31 31 100.00Minicoy —- —- —- —- —- —- 120 105 87.50Agatti —- —- —- —- —- —- 14 14 100.00Andrott —- —- —- —- —- —- 16 16 100.00Kavaratti 25 25 100.00 36 36 100.00 53 52 98.00Kiltan —- —- —- —- —- —- 18 18 100.00Kadmat —- —- —- —- —- —- 16 16 100.00Chetlat —- —- —- —- —- —- 32 22 68.80Total 25 25 100.00 36 36 100.00 313 287 91.69
Name of Institution
TABLE - 10INSTITUTION-WISE RESULT (X CBSE)
2011-12 2012-13 2013-14
Appeared Passed Pass % age
Appeared Passed Pass% age
Appeared Passed Pass % age
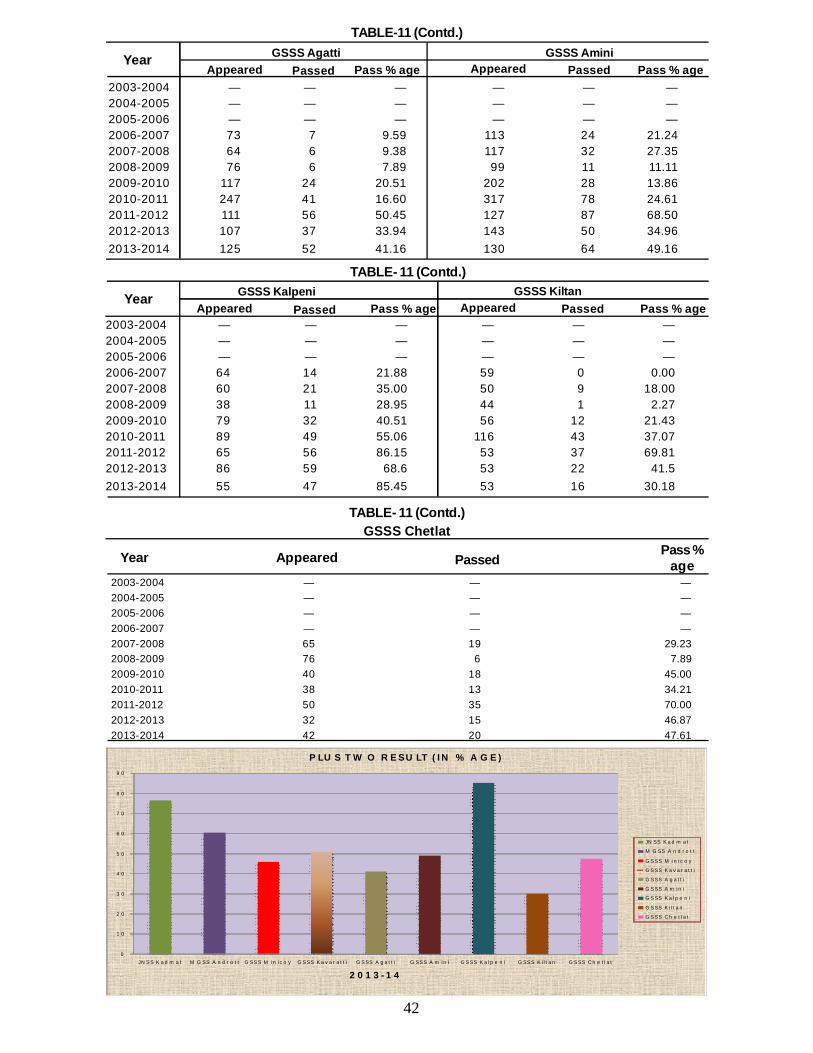
42
2003-2004 — — — — — —2004-2005 — — — — — —2005-2006 — — — — — —2006-2007 73 7 9.59 113 24 21.242007-2008 64 6 9.38 117 32 27.352008-2009 76 6 7.89 99 11 11.112009-2010 117 24 20.51 202 28 13.862010-2011 247 41 16.60 317 78 24.612011-2012 111 56 50.45 127 87 68.502012-2013 107 37 33.94 143 50 34.962013-2014 125 52 41.16 130 64 49.16
TABLE-11 (Contd.)
Year GSSS Agatti GSSS Amini Appeared Passed Pass % age Appeared Passed Pass % age
Year GSSS Kalpeni GSSS Kiltan Appeared Passed Pass % age Appeared Passed Pass % age
2003-2004 — — — — — —2004-2005 — — — — — —2005-2006 — — — — — —2006-2007 64 14 21.88 59 0 0.002007-2008 60 21 35.00 50 9 18.002008-2009 38 11 28.95 44 1 2.272009-2010 79 32 40.51 56 12 21.432010-2011 89 49 55.06 116 43 37.072011-2012 65 56 86.15 53 37 69.812012-2013 86 59 68.6 53 22 41.52013-2014 55 47 85.45 53 16 30.18
TABLE- 11 (Contd.)
2003-2004 — — —2004-2005 — — —2005-2006 — — —2006-2007 — — —2007-2008 65 19 29.232008-2009 76 6 7.892009-2010 40 18 45.002010-2011 38 13 34.212011-2012 50 35 70.002012-2013 32 15 46.872013-2014 42 20 47.61
TABLE- 11 (Contd.)GSSS Chetlat
Year Appeared PassedPass %
age
0
1 0
2 0
3 0
4 0
5 0
6 0
7 0
8 0
9 0
J N S S K a d m a t M G S S A n d r o t t G S S S M i n i c o y G S S S K a v a r a t t i G S S S A g a t t i G S S S A m i n i G S S S K a l p e n i G S S S K i l t a n G S S S C h e t l a t
2 0 1 3 - 1 4
P L U S T W O R E S U L T ( I N % A G E )
J N S S K a d m a t
M G S S A n d r o t t
G S S S M i n i c o y
G S S S K a v a r a t t i
G S S S A g a t t i
G S S S A m i n i
G S S S K a l p e n i
G S S S K i l t a n
G S S S C h e t l a t
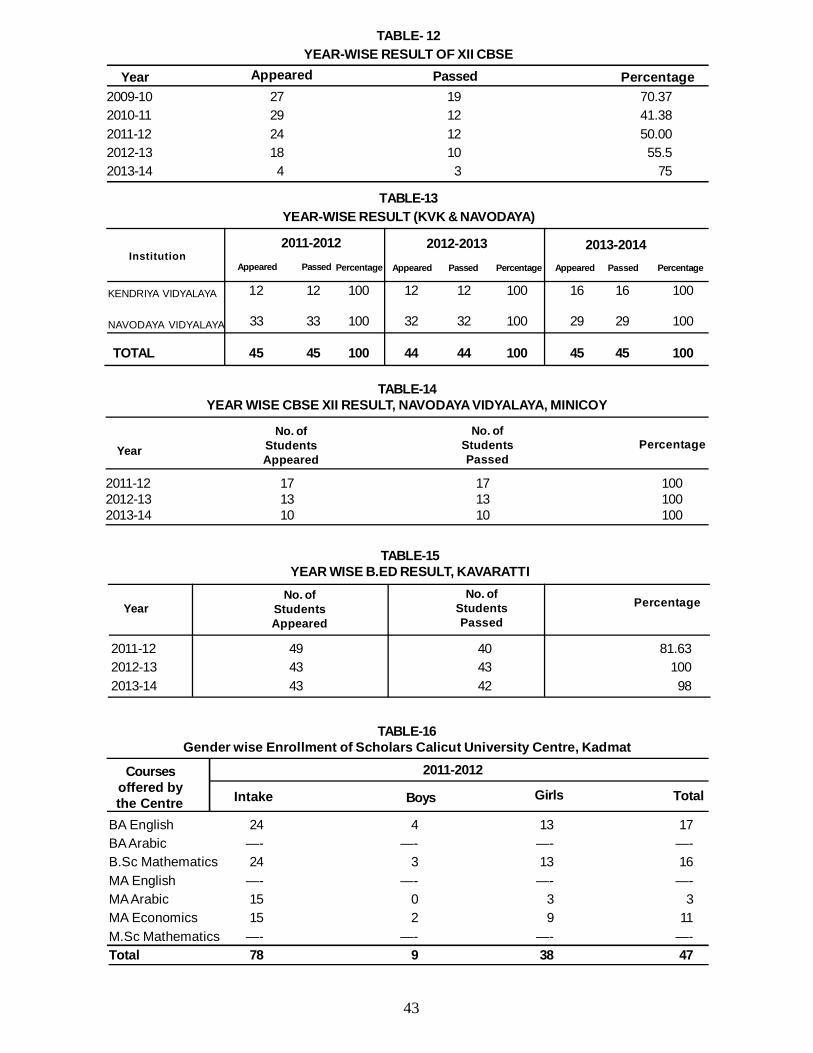
43
2009-10 27 19 70.372010-11 29 12 41.382011-12 24 12 50.002012-13 18 10 55.52013-14 4 3 75
TABLE- 12YEAR-WISE RESULT OF XII CBSE
Year Appeared Passed Percentage
12 12 100 12 12 100 16 16 100
33 33 100 32 32 100 29 29 100
TOTAL 45 45 100 44 44 100 45 45 100
TABLE-13YEAR-WISE RESULT (KVK & NAVODAYA)
Institution2011-2012 2012-2013 2013-2014
PercentageAppeared Passed PercentageAppeared Passed PercentageAppeared Passed
KENDRIYA VIDYALAYA
NAVODAYA VIDYALAYA
2011-12 17 17 1002012-13 13 13 1002013-14 10 10 100
TABLE-14YEAR WISE CBSE XII RESULT, NAVODAYA VIDYALAYA, MINICOY
YearNo. of
StudentsAppeared
No. ofStudentsPassed
Percentage
2011-12 49 40 81.632012-13 43 43 1002013-14 43 42 98
YearNo. of
StudentsAppeared
No. ofStudentsPassed
TABLE-15YEAR WISE B.ED RESULT, KAVARATTI
Percentage
BA English 24 4 13 17BA Arabic —- —- —- —-B.Sc Mathematics 24 3 13 16MA English —- —- —- —-MA Arabic 15 0 3 3MA Economics 15 2 9 11M.Sc Mathematics —- —- —- —-Total 78 9 38 47
Coursesoffered bythe Centre
TABLE-16Gender wise Enrollment of Scholars Calicut University Centre, Kadmat
2011-2012
Intake Boys Girls Total
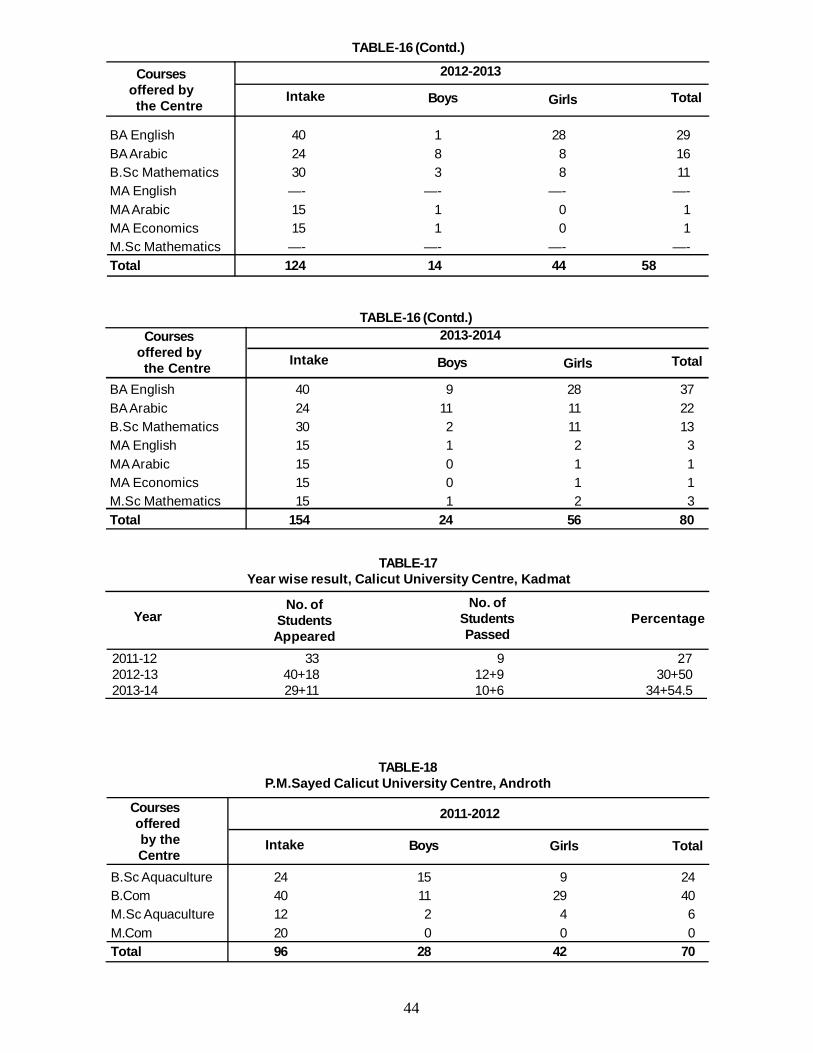
44
BA English 40 9 28 37BA Arabic 24 11 11 22B.Sc Mathematics 30 2 11 13MA English 15 1 2 3MA Arabic 15 0 1 1MA Economics 15 0 1 1M.Sc Mathematics 15 1 2 3Total 154 24 56 80
TABLE-16 (Contd.)Courses
offered by the Centre
2013-2014
Intake Boys Girls Total
2011-12 33 9 272012-13 40+18 12+9 30+502013-14 29+11 10+6 34+54.5
YearNo. of
StudentsAppeared
No. ofStudentsPassed
TABLE-17Year wise result, Calicut University Centre, Kadmat
Percentage
BA English 40 1 28 29BA Arabic 24 8 8 16B.Sc Mathematics 30 3 8 11MA English —- —- —- —-MA Arabic 15 1 0 1MA Economics 15 1 0 1M.Sc Mathematics —- —- —- —-Total 124 14 44 58
TABLE-16 (Contd.)
Coursesoffered by
the Centre
2012-2013
Intake Boys Girls Total
B.Sc Aquaculture 24 15 9 24B.Com 40 11 29 40M.Sc Aquaculture 12 2 4 6M.Com 20 0 0 0Total 96 28 42 70
TABLE-18P.M.Sayed Calicut University Centre, Androth
Coursesoffered by theCentre
2011-2012
Intake Boys Girls Total
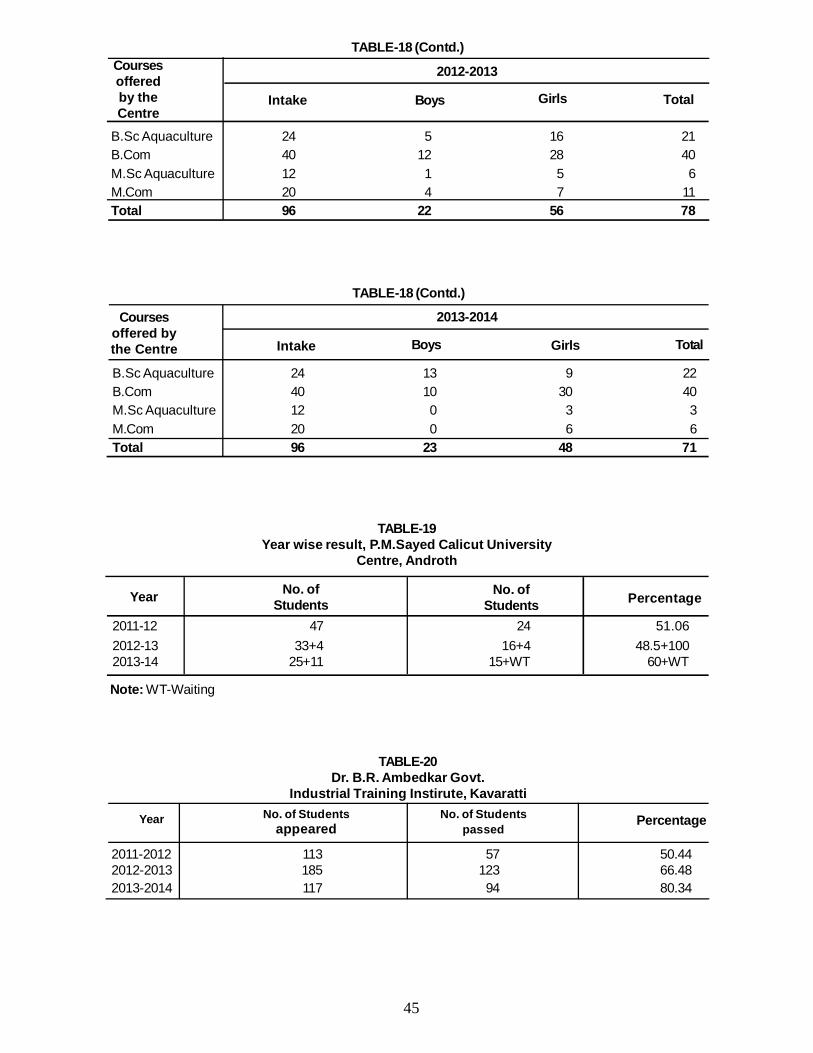
45
B.Sc Aquaculture 24 13 9 22B.Com 40 10 30 40M.Sc Aquaculture 12 0 3 3M.Com 20 0 6 6Total 96 23 48 71
TABLE-18 (Contd.)
Coursesoffered bythe Centre
2013-2014
Intake Boys Girls Total
2011-12 47 24 51.062012-13 33+4 16+4 48.5+1002013-14 25+11 15+WT 60+WT
Year
TABLE-19Year wise result, P.M.Sayed Calicut University
Centre, Androth
No. ofStudents
No. ofStudents Percentage
Note: WT-Waiting
Year
TABLE-20Dr. B.R. Ambedkar Govt.
Industrial Training Instirute, KavarattiNo. of Students
appearedNo. of Students
passedPercentage
2011-2012 113 57 50.442012-2013 185 123 66.482013-2014 117 94 80.34
B.Sc Aquaculture 24 5 16 21B.Com 40 12 28 40M.Sc Aquaculture 12 1 5 6M.Com 20 4 7 11Total 96 22 56 78
TABLE-18 (Contd.)Coursesofferedby theCentre
2012-2013
Intake Boys Girls Total
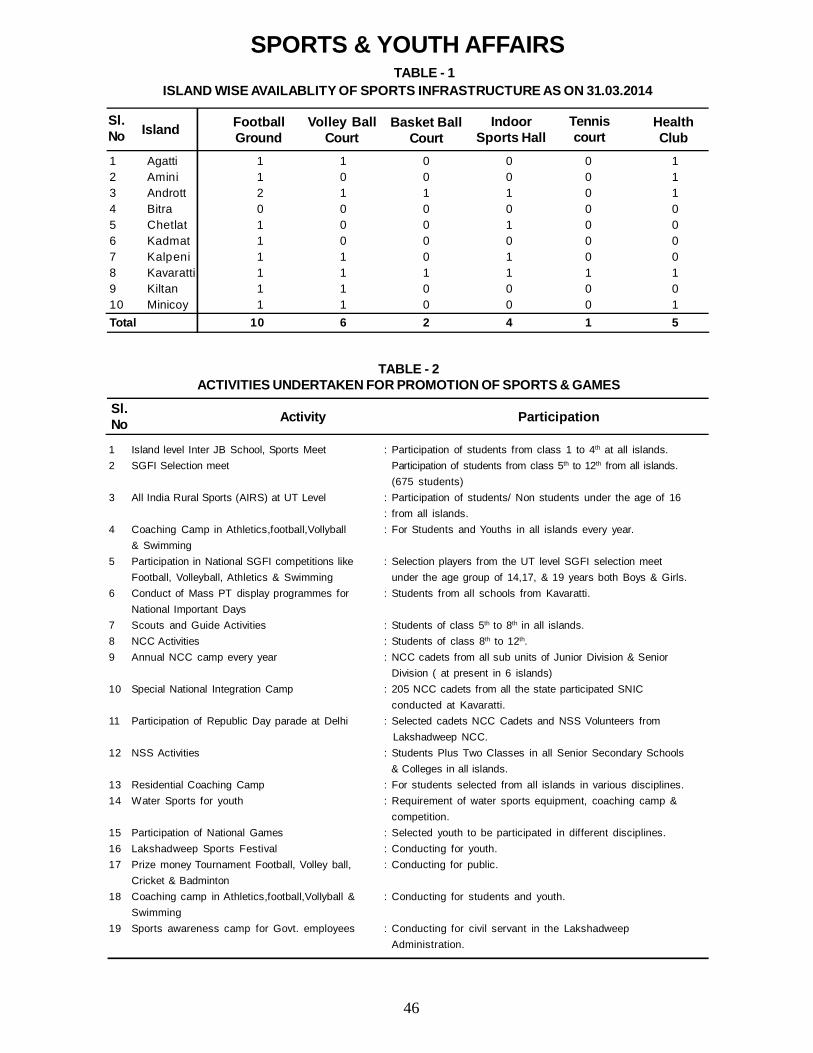
46
1 Agatti 1 1 0 0 0 12 Amini 1 0 0 0 0 13 Andrott 2 1 1 1 0 14 Bitra 0 0 0 0 0 05 Chetlat 1 0 0 1 0 06 Kadmat 1 0 0 0 0 07 Kalpeni 1 1 0 1 0 08 Kavaratti 1 1 1 1 1 19 Kiltan 1 1 0 0 0 010 Minicoy 1 1 0 0 0 1Total 10 6 2 4 1 5
Sl.No
SPORTS & YOUTH AFFAIRSTABLE - 1
ISLAND WISE AVAILABLITY OF SPORTS INFRASTRUCTURE AS ON 31.03.2014
Island FootballGround
Volley BallCourt
Basket BallCourt
IndoorSports Hall
Tenniscourt
HealthClub
TABLE - 2ACTIVITIES UNDERTAKEN FOR PROMOTION OF SPORTS & GAMES
Activity Participation
1 Island level Inter JB School, Sports Meet : Participation of students from class 1 to 4th at all islands.2 SGFI Selection meet Participation of students from class 5th to 12th from all islands.
(675 students)3 All India Rural Sports (AIRS) at UT Level : Participation of students/ Non students under the age of 16
: from all islands.4 Coaching Camp in Athletics,football,Vollyball : For Students and Youths in all islands every year.
& Swimming5 Participation in National SGFI competitions like : Selection players from the UT level SGFI selection meet
Football, Volleyball, Athletics & Swimming under the age group of 14,17, & 19 years both Boys & Girls.6 Conduct of Mass PT display programmes for : Students from all schools from Kavaratti.
National Important Days7 Scouts and Guide Activities : Students of class 5th to 8th in all islands.8 NCC Activities : Students of class 8th to 12th.9 Annual NCC camp every year : NCC cadets from all sub units of Junior Division & Senior
Division ( at present in 6 islands)10 Special National Integration Camp : 205 NCC cadets from all the state participated SNIC
conducted at Kavaratti.11 Participation of Republic Day parade at Delhi : Selected cadets NCC Cadets and NSS Volunteers from
Lakshadweep NCC.12 NSS Activities : Students Plus Two Classes in all Senior Secondary Schools
& Colleges in all islands.13 Residential Coaching Camp : For students selected from all islands in various disciplines.14 Water Sports for youth : Requirement of water sports equipment, coaching camp &
competition.15 Participation of National Games : Selected youth to be participated in different disciplines.16 Lakshadweep Sports Festival : Conducting for youth.17 Prize money Tournament Football, Volley ball, : Conducting for public.
Cricket & Badminton18 Coaching camp in Athletics,football,Vollyball & : Conducting for students and youth.
Swimming19 Sports awareness camp for Govt. employees : Conducting for civil servant in the Lakshadweep
Administration.
Sl.No
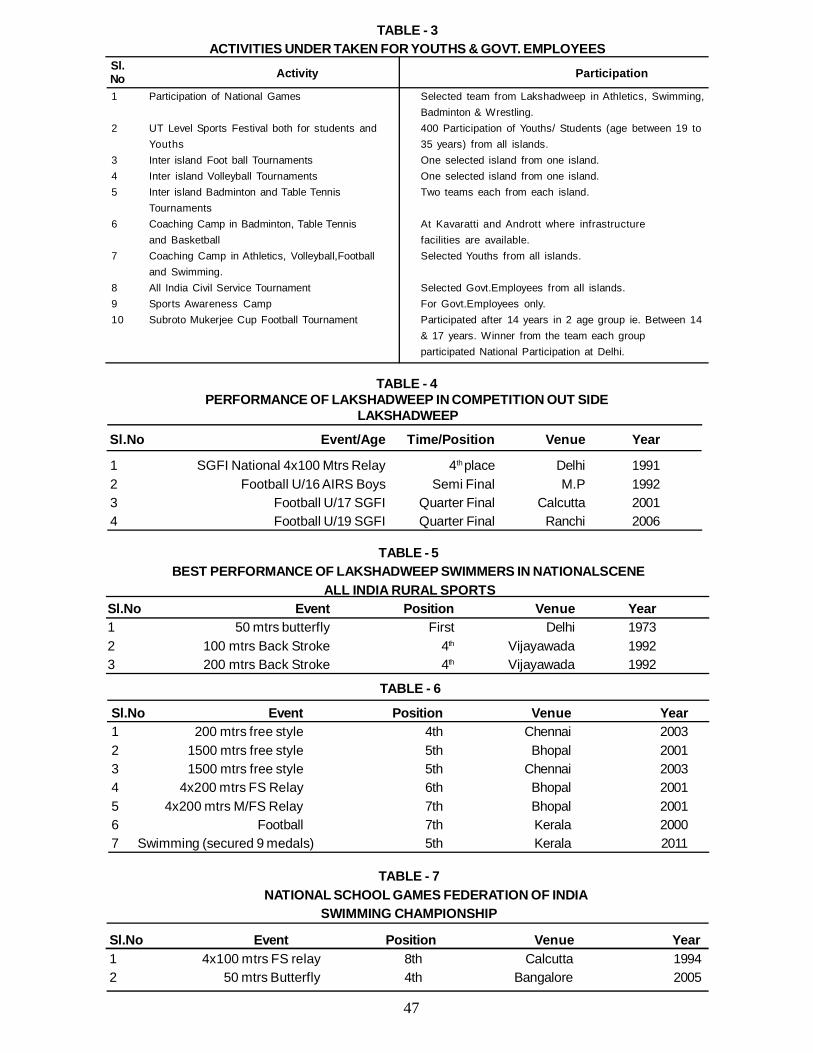
47
TABLE - 4PERFORMANCE OF LAKSHADWEEP IN COMPETITION OUT SIDE
LAKSHADWEEP
Sl.No Event/Age Time/Position Venue Year
1 SGFI National 4x100 Mtrs Relay 4th place Delhi 1991 2 Football U/16 AIRS Boys Semi Final M.P 1992 3 Football U/17 SGFI Quarter Final Calcutta 2001 4 Football U/19 SGFI Quarter Final Ranchi 2006
TABLE - 5BEST PERFORMANCE OF LAKSHADWEEP SWIMMERS IN NATIONALSCENE
ALL INDIA RURAL SPORTSSl.No Event Position Venue Year1 50 mtrs butterfly First Delhi 19732 100 mtrs Back Stroke 4th Vijayawada 19923 200 mtrs Back Stroke 4th Vijayawada 1992
TABLE - 6
Sl.No Event Position Venue Year1 200 mtrs free style 4th Chennai 20032 1500 mtrs free style 5th Bhopal 20013 1500 mtrs free style 5th Chennai 20034 4x200 mtrs FS Relay 6th Bhopal 20015 4x200 mtrs M/FS Relay 7th Bhopal 20016 Football 7th Kerala 20007 Swimming (secured 9 medals) 5th Kerala 2011
TABLE - 7NATIONAL SCHOOL GAMES FEDERATION OF INDIA
SWIMMING CHAMPIONSHIP
Sl.No Event Position Venue Year1 4x100 mtrs FS relay 8th Calcutta 19942 50 mtrs Butterfly 4th Bangalore 2005
TABLE - 3ACTIVITIES UNDER TAKEN FOR YOUTHS & GOVT. EMPLOYEES
Activity ParticipationSl.No1 Participation of National Games Selected team from Lakshadweep in Athletics, Swimming,
Badminton & Wrestling.2 UT Level Sports Festival both for students and 400 Participation of Youths/ Students (age between 19 to
Youths 35 years) from all islands.3 Inter island Foot ball Tournaments One selected island from one island.4 Inter island Volleyball Tournaments One selected island from one island.5 Inter island Badminton and Table Tennis Two teams each from each island.
Tournaments6 Coaching Camp in Badminton, Table Tennis At Kavaratti and Andrott where infrastructure
and Basketball facilities are available.7 Coaching Camp in Athletics, Volleyball,Football Selected Youths from all islands.
and Swimming.8 All India Civil Service Tournament Selected Govt.Employees from all islands.9 Sports Awareness Camp For Govt.Employees only.10 Subroto Mukerjee Cup Football Tournament Participated after 14 years in 2 age group ie. Between 14
& 17 years. Winner from the team each groupparticipated National Participation at Delhi.

48
JAWAHAR NAVODAYA VIDYALAYATABLE - 1
YEAR-WISE & SEX-WISE STUDENTS STRENGTH (JNV)Item 2004-2005 2005-2006 2006-2007 2007-2008 2008-2009 2009-2010 2010-2011 2011-2012 2012-2013 2013-2014
Boys 133 131 131 121 118 126 115 88 90 69
Girs 94 97 99 95 89 97 90 63 84 76
Total 227 228 230 216 207 223 205 151 174 145
2004-2005 41 19 7 8 34 82.93 13 7 5 — 12 92.31
2005-2006 35 15 9 6 30 85.71 7 3 1 — 4 57.14
2006-2007 38 22 12 4 38 100.00 20 16 4 — 20 100.00
2007-2008 47 35 12 0 47 100.00 9 8 1 0 9 100.00
2008-2009 35 28 5 2 35 100.00 24 22 2 0 24 100.00
2009-2010 35 28 5 2 35 100 24 22 2 0 24 100
2010-2011 34 21 8 4 33 97.06 29 26 0 0 26 89.66
2011-2012 33 6 14 13 33 100.00 17 11 6 0 17 100.00
2012-2013 32 4 16 12 32 100.00 13 2 11 0 13 100.00
2013-2014 29 2 16 11 29 100.00 10 1 6 3 10 100.00
Note:Division means Grade
Year
TABLE - 2YEAR-WISE RESULT IN AISSE & AISSCE (JNV)
TotalStudents I Div. II Div. III Div. Total
PassPass
%Total
StudentsITotalPass
Pass %
AISSCE (Class XII)AISSE (Class X)
I Div. II Div. III Div.
I tem 2004-05 2005-06 2006-07 2007-08 2008-09 2009-10 2010-11 2011-12 2012-13 2013-14
Male 15 14 9 8 11 10 10 10 10 12Female 5 6 7 7 6 5 4 8 8 7Total 20 20 16 15 17 15 14 18 18 19
TABLE - 3TEACHER STRENGTH (JNV)
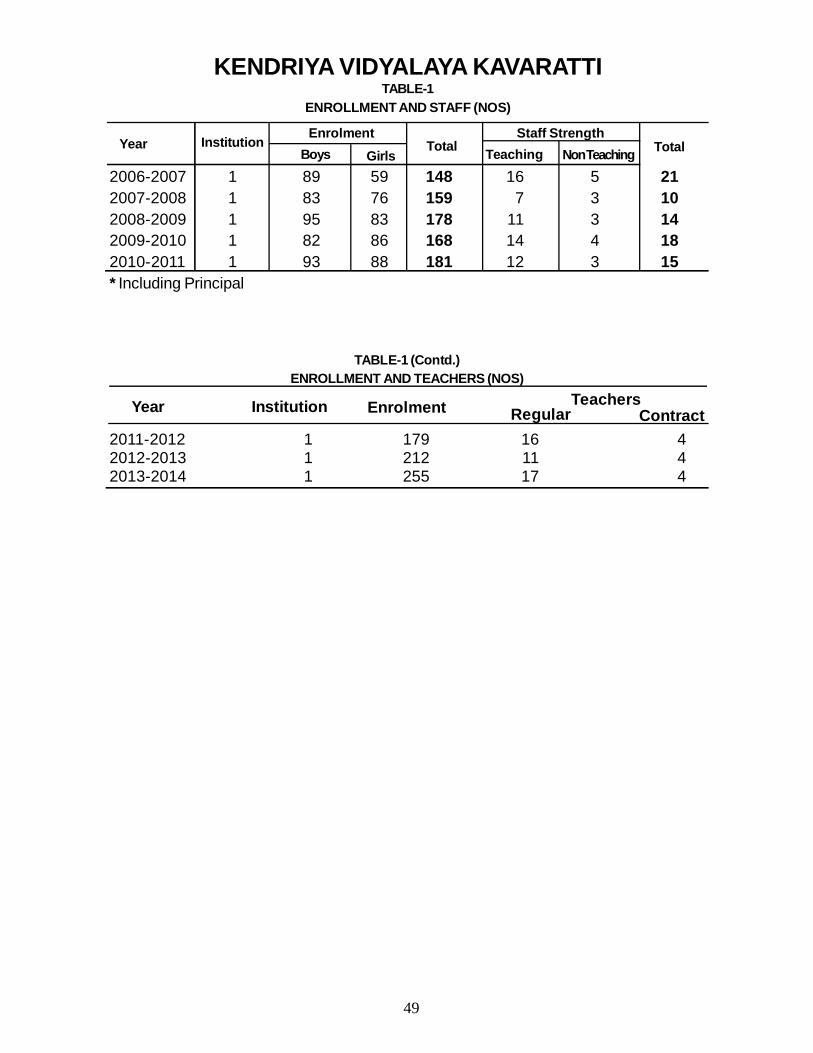
49
2006-2007 1 89 59 148 16 5 212007-2008 1 83 76 159 7 3 102008-2009 1 95 83 178 11 3 142009-2010 1 82 86 168 14 4 182010-2011 1 93 88 181 12 3 15* Including Principal
KENDRIYA VIDYALAYA KAVARATTITABLE-1
ENROLLMENT AND STAFF (NOS)
Year Institution EnrolmentTotal
Staff StrengthTotalBoys Girls Teaching Non Teaching
TABLE-1 (Contd.)ENROLLMENT AND TEACHERS (NOS)
Year
2011-2012 1 179 16 42012-2013 1 212 11 42013-2014 1 255 17 4
Institution Enrolment TeachersRegular Contract
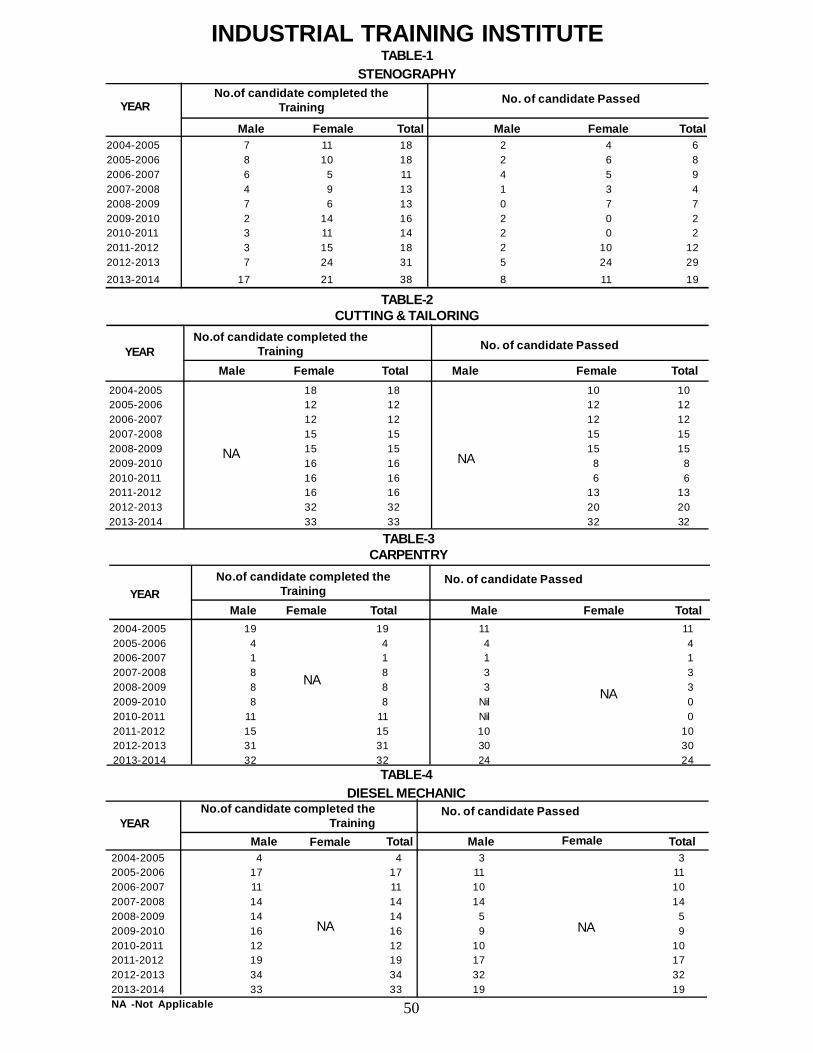
50
2004-2005 7 11 18 2 4 62005-2006 8 10 18 2 6 82006-2007 6 5 11 4 5 92007-2008 4 9 13 1 3 42008-2009 7 6 13 0 7 72009-2010 2 14 16 2 0 22010-2011 3 11 14 2 0 22011-2012 3 15 18 2 10 122012-2013 7 24 31 5 24 292013-2014 17 21 38 8 11 19
INDUSTRIAL TRAINING INSTITUTETABLE-1
STENOGRAPHY
YEARNo.of candidate completed the
TrainingNo. of candidate Passed
Male Female Total Male Female Total
2004-2005 18 18 10 102005-2006 12 12 12 122006-2007 12 12 12 122007-2008 15 15 15 152008-2009 15 15 15 152009-2010 16 16 8 82010-2011 16 16 6 62011-2012 16 16 13 132012-2013 32 32 20 202013-2014 33 33 32 32
TABLE-2CUTTING & TAILORING
YEARNo.of candidate completed the
Training No. of candidate Passed
Male Female Total Male Female Total
NA NA
2004-2005 19 19 11 112005-2006 4 4 4 42006-2007 1 1 1 12007-2008 8 8 3 32008-2009 8 8 3 32009-2010 8 8 Nil 02010-2011 11 11 Nil 02011-2012 15 15 10 102012-2013 31 31 30 302013-2014 32 32 24 24
TABLE-3CARPENTRY
NANA
YEARNo.of candidate completed the
TrainingNo. of candidate Passed
Male Female Total Male Female Total
2004-2005 4 4 3 32005-2006 17 17 11 112006-2007 11 11 10 102007-2008 14 14 14 142008-2009 14 14 5 52009-2010 16 16 9 92010-2011 12 12 10 102011-2012 19 19 17 172012-2013 34 34 32 322013-2014 33 33 19 19NA -Not Applicable
TABLE-4DIESEL MECHANIC
YEARNo.of candidate completed the
TrainingNo. of candidate Passed
Male Female Total Male Female Total
NA NA
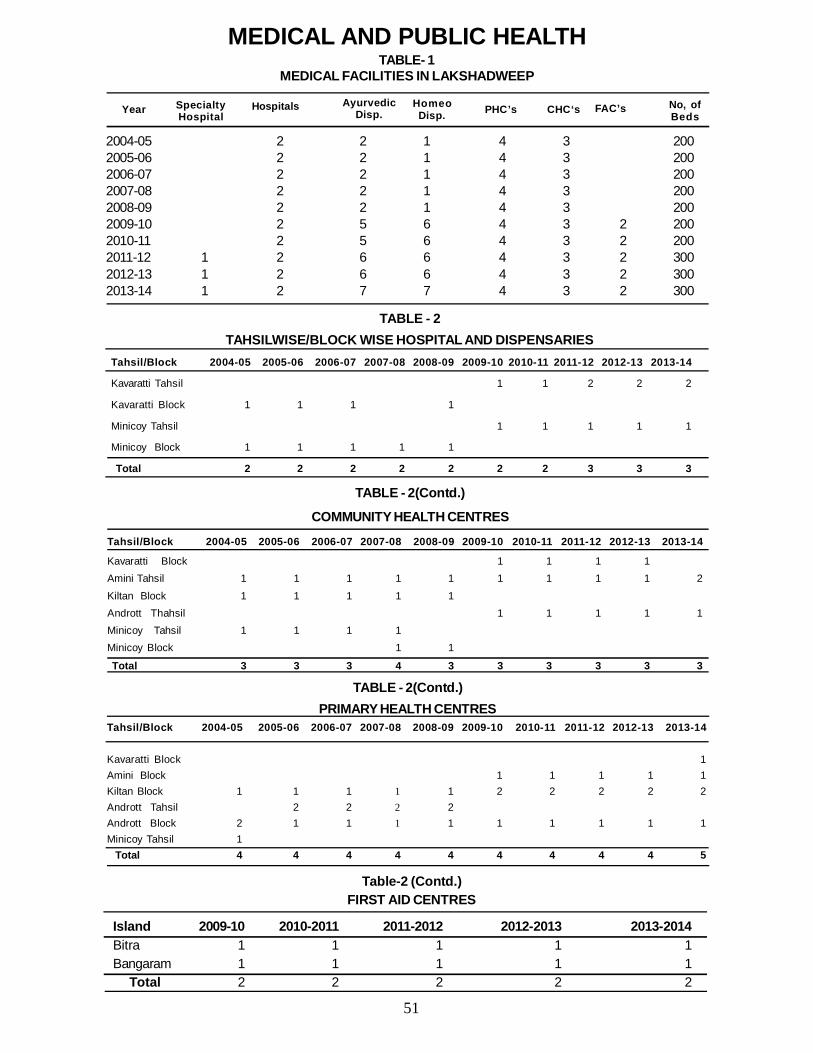
51
TABLE - 2(Contd.)PRIMARY HEALTH CENTRES
Tahsil/Block 2004-05 2005-06 2006-07 2007-08 2008-09 2009-10 2010-11 2011-12 2012-13 2013-14
Kavaratti Block 1Amini Block 1 1 1 1 1Kiltan Block 1 1 1 1 1 2 2 2 2 2Andrott Tahsil 2 2 2 2Andrott Block 2 1 1 1 1 1 1 1 1 1Minicoy Tahsil 1 Total 4 4 4 4 4 4 4 4 4 5
TABLE - 2TAHSILWISE/BLOCK WISE HOSPITAL AND DISPENSARIES
Tahsil/Block 2004-05 2005-06 2006-07 2007-08 2008-09 2009-10 2010-11 2011-12 2012-13 2013-14
Kavaratti Tahsil 1 1 2 2 2
Kavaratti Block 1 1 1 1
Minicoy Tahsil 1 1 1 1 1
Minicoy Block 1 1 1 1 1
Total 2 2 2 2 2 2 2 3 3 3
Table-2 (Contd.)FIRST AID CENTRES
Island 2009-10 2010-2011 2011-2012 2012-2013 2013-2014Bitra 1 1 1 1 1Bangaram 1 1 1 1 1 Total 2 2 2 2 2
TABLE - 2(Contd.)
COMMUNITY HEALTH CENTRES
Tahsil/Block 2004-05 2005-06 2006-07 2007-08 2008-09 2009-10 2010-11 2011-12 2012-13 2013-14
Kavaratti Block 1 1 1 1Amini Tahsil 1 1 1 1 1 1 1 1 1 2
Kiltan Block 1 1 1 1 1Andrott Thahsil 1 1 1 1 1Minicoy Tahsil 1 1 1 1Minicoy Block 1 1
Total 3 3 3 4 3 3 3 3 3 3
2004-05 2 2 1 4 3 2002005-06 2 2 1 4 3 2002006-07 2 2 1 4 3 2002007-08 2 2 1 4 3 2002008-09 2 2 1 4 3 2002009-10 2 5 6 4 3 2 2002010-11 2 5 6 4 3 2 2002011-12 1 2 6 6 4 3 2 3002012-13 1 2 6 6 4 3 2 3002013-14 1 2 7 7 4 3 2 300
MEDICAL AND PUBLIC HEALTHTABLE- 1
MEDICAL FACILITIES IN LAKSHADWEEP
Year Hospitals AyurvedicDisp.
HomeoDisp. PHC’s CHC‘s FAC’s No, of
BedsSpecialtyHospital
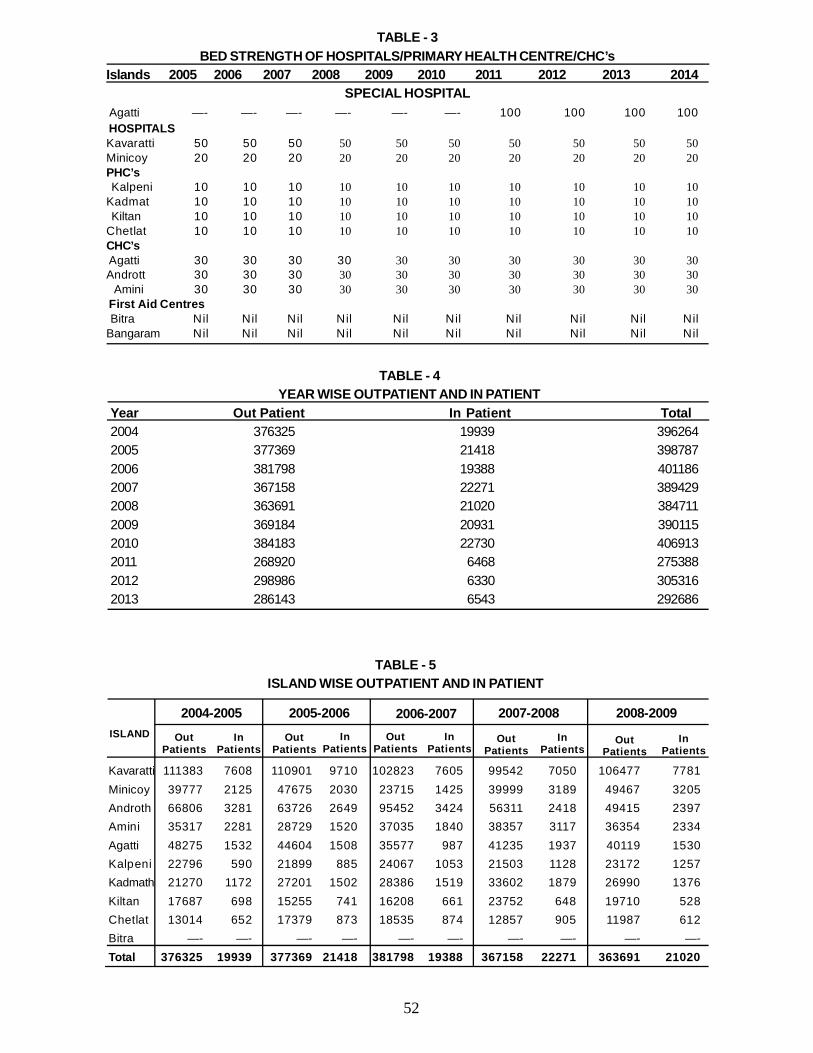
52
TABLE - 3BED STRENGTH OF HOSPITALS/PRIMARY HEALTH CENTRE/CHC’s
Islands 2005 2006 2007 2008 2009 2010 2011 2012 2013 2014SPECIAL HOSPITAL
Agatti —- —- —- —- —- —- 100 100 100 100 HOSPITALSKavaratti 50 50 50 50 50 50 50 50 50 50Minicoy 20 20 20 20 20 20 20 20 20 20PHC’s Kalpeni 10 10 10 10 10 10 10 10 10 10Kadmat 10 10 10 10 10 10 10 10 10 10 Kiltan 10 10 10 10 10 10 10 10 10 10Chetlat 10 10 10 10 10 10 10 10 10 10CHC’s Agatti 30 30 30 30 30 30 30 30 30 30Andrott 30 30 30 30 30 30 30 30 30 30 Amini 30 30 30 30 30 30 30 30 30 30 First Aid Centres Bitra Nil Nil Nil Nil Nil Nil Nil Nil Nil NilBangaram Nil Nil Nil Nil Nil Nil Nil Nil Nil Nil
TABLE - 4YEAR WISE OUTPATIENT AND IN PATIENT
Year Out Patient In Patient Total2004 376325 19939 3962642005 377369 21418 3987872006 381798 19388 4011862007 367158 22271 3894292008 363691 21020 3847112009 369184 20931 3901152010 384183 22730 4069132011 268920 6468 2753882012 298986 6330 3053162013 286143 6543 292686
Kavaratti 111383 7608 110901 9710 102823 7605 99542 7050 106477 7781Minicoy 39777 2125 47675 2030 23715 1425 39999 3189 49467 3205Androth 66806 3281 63726 2649 95452 3424 56311 2418 49415 2397Amini 35317 2281 28729 1520 37035 1840 38357 3117 36354 2334Agatti 48275 1532 44604 1508 35577 987 41235 1937 40119 1530Kalpeni 22796 590 21899 885 24067 1053 21503 1128 23172 1257Kadmath 21270 1172 27201 1502 28386 1519 33602 1879 26990 1376Kiltan 17687 698 15255 741 16208 661 23752 648 19710 528Chetlat 13014 652 17379 873 18535 874 12857 905 11987 612Bitra —- —- —- —- —- —- —- —- —- —-Total 376325 19939 377369 21418 381798 19388 367158 22271 363691 21020
TABLE - 5ISLAND WISE OUTPATIENT AND IN PATIENT
2004-2005 2005-2006 2006-2007 2007-2008 2008-2009Out
PatientsIn
PatientsOut
PatientsIn
PatientsOut
PatientsIn
PatientsOut
PatientsIn
PatientsOut
PatientsIn
PatientsISLAND
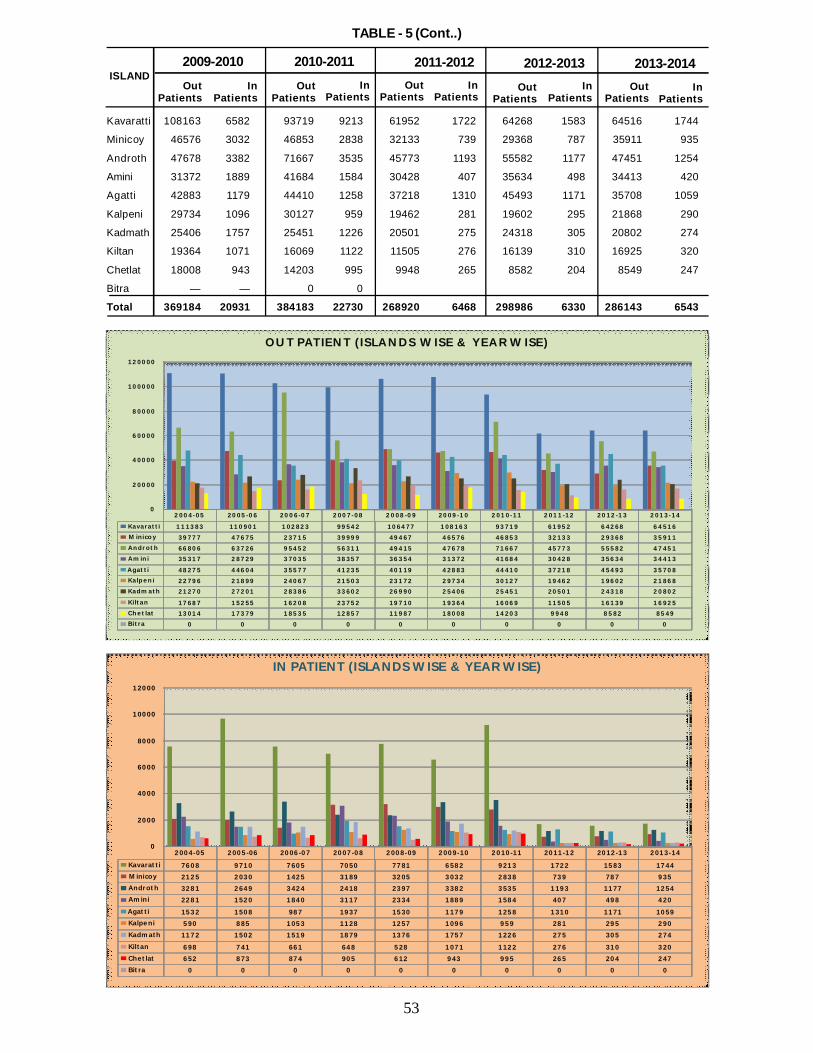
53
Kavaratti 108163 6582 93719 9213 61952 1722 64268 1583 64516 1744
Minicoy 46576 3032 46853 2838 32133 739 29368 787 35911 935
Androth 47678 3382 71667 3535 45773 1193 55582 1177 47451 1254
Amini 31372 1889 41684 1584 30428 407 35634 498 34413 420
Agatti 42883 1179 44410 1258 37218 1310 45493 1171 35708 1059
Kalpeni 29734 1096 30127 959 19462 281 19602 295 21868 290
Kadmath 25406 1757 25451 1226 20501 275 24318 305 20802 274
Kiltan 19364 1071 16069 1122 11505 276 16139 310 16925 320
Chetlat 18008 943 14203 995 9948 265 8582 204 8549 247
Bitra — — 0 0
Total 369184 20931 384183 22730 268920 6468 298986 6330 286143 6543
2009-2010 2010-2011 2011-2012 2012-2013 2013-2014Out
PatientsIn
PatientsOut
PatientsIn
PatientsOut
PatientsIn
PatientsOut
PatientsIn
PatientsOut
PatientsIn
Patients
ISLAND
TABLE - 5 (Cont..)
2 0 0 4 - 0 5 2 0 0 5 -0 6 2 0 0 6 -0 7 2 0 0 7 -0 8 2 0 0 8 - 0 9 2 0 0 9 - 1 0 2 0 1 0 -1 1 2 0 1 1 -1 2 2 0 1 2 -1 3 2 0 1 3 - 1 4
Ka va rat t i 7 6 0 8 9 7 1 0 7 6 0 5 7 0 5 0 7 7 8 1 6 5 8 2 9 2 1 3 1 7 2 2 1 5 8 3 1 7 4 4
M in ico y 2 1 2 5 2 0 3 0 1 4 2 5 3 1 8 9 3 2 0 5 3 0 3 2 2 8 3 8 7 3 9 7 8 7 9 3 5
A n d r o t h 3 2 8 1 2 6 4 9 3 4 2 4 2 4 1 8 2 3 9 7 3 3 8 2 3 5 3 5 1 1 9 3 1 1 7 7 1 2 5 4
A m in i 2 2 8 1 1 5 2 0 1 8 4 0 3 1 1 7 2 3 3 4 1 8 8 9 1 5 8 4 4 0 7 4 9 8 4 2 0
A g at t i 1 5 3 2 1 5 0 8 9 8 7 1 9 3 7 1 5 3 0 1 1 7 9 1 2 5 8 1 3 1 0 1 1 7 1 1 0 5 9
Ka lp e n i 5 9 0 8 8 5 1 0 5 3 1 1 2 8 1 2 5 7 1 0 9 6 9 5 9 2 8 1 2 9 5 2 9 0
Ka d m a t h 1 1 7 2 1 5 0 2 1 5 1 9 1 8 7 9 1 3 7 6 1 7 5 7 1 2 2 6 2 7 5 3 0 5 2 7 4
Kilt a n 6 9 8 7 4 1 6 6 1 6 4 8 5 2 8 1 0 7 1 1 1 2 2 2 7 6 3 1 0 3 2 0
C h e t lat 6 5 2 8 7 3 8 7 4 9 0 5 6 1 2 9 4 3 9 9 5 2 6 5 2 0 4 2 4 7
Bit ra 0 0 0 0 0 0 0 0 0 0
0
2 0 0 0
4 0 0 0
6 0 0 0
8 0 0 0
1 0 0 0 0
1 2 0 0 0
IN PAT IE N T ( ISLA N D S W ISE & Y E A R W ISE )
2 0 0 4 - 0 5 2 0 0 5 -0 6 2 0 0 6 -0 7 2 0 0 7 - 0 8 2 0 0 8 -0 9 2 0 0 9 -1 0 2 0 1 0 - 1 1 2 0 1 1 -1 2 2 0 1 2 -1 3 2 0 1 3 - 1 4
K a v a r a t t i 1 1 1 3 8 3 1 1 0 9 0 1 1 0 2 8 2 3 9 9 5 4 2 1 0 6 4 7 7 1 0 8 1 6 3 9 3 7 1 9 6 1 9 5 2 6 4 2 6 8 6 4 5 1 6
M in ico y 3 9 7 7 7 4 7 6 7 5 2 3 7 1 5 3 9 9 9 9 4 9 4 6 7 4 6 5 7 6 4 6 8 5 3 3 2 1 3 3 2 9 3 6 8 3 5 9 1 1
A n d r o t h 6 6 8 0 6 6 3 7 2 6 9 5 4 5 2 5 6 3 1 1 4 9 4 1 5 4 7 6 7 8 7 1 6 6 7 4 5 7 7 3 5 5 5 8 2 4 7 4 5 1
A m in i 3 5 3 1 7 2 8 7 2 9 3 7 0 3 5 3 8 3 5 7 3 6 3 5 4 3 1 3 7 2 4 1 6 8 4 3 0 4 2 8 3 5 6 3 4 3 4 4 1 3
A g at t i 4 8 2 7 5 4 4 6 0 4 3 5 5 7 7 4 1 2 3 5 4 0 1 1 9 4 2 8 8 3 4 4 4 1 0 3 7 2 1 8 4 5 4 9 3 3 5 7 0 8
K a lp e n i 2 2 7 9 6 2 1 8 9 9 2 4 0 6 7 2 1 5 0 3 2 3 1 7 2 2 9 7 3 4 3 0 1 2 7 1 9 4 6 2 1 9 6 0 2 2 1 8 6 8
K a d m a t h 2 1 2 7 0 2 7 2 0 1 2 8 3 8 6 3 3 6 0 2 2 6 9 9 0 2 5 4 0 6 2 5 4 5 1 2 0 5 0 1 2 4 3 1 8 2 0 8 0 2
K i lt a n 1 7 6 8 7 1 5 2 5 5 1 6 2 0 8 2 3 7 5 2 1 9 7 1 0 1 9 3 6 4 1 6 0 6 9 1 1 5 0 5 1 6 1 3 9 1 6 9 2 5
C h e t lat 1 3 0 1 4 1 7 3 7 9 1 8 5 3 5 1 2 8 5 7 1 1 9 8 7 1 8 0 0 8 1 4 2 0 3 9 9 4 8 8 5 8 2 8 5 4 9
B it r a 0 0 0 0 0 0 0 0 0 0
0
2 0 0 0 0
4 0 0 0 0
6 0 0 0 0
8 0 0 0 0
1 0 0 0 0 0
1 2 0 0 0 0
O U T PA T IE N T ( IS L A N D S W IS E & Y E A R W IS E )
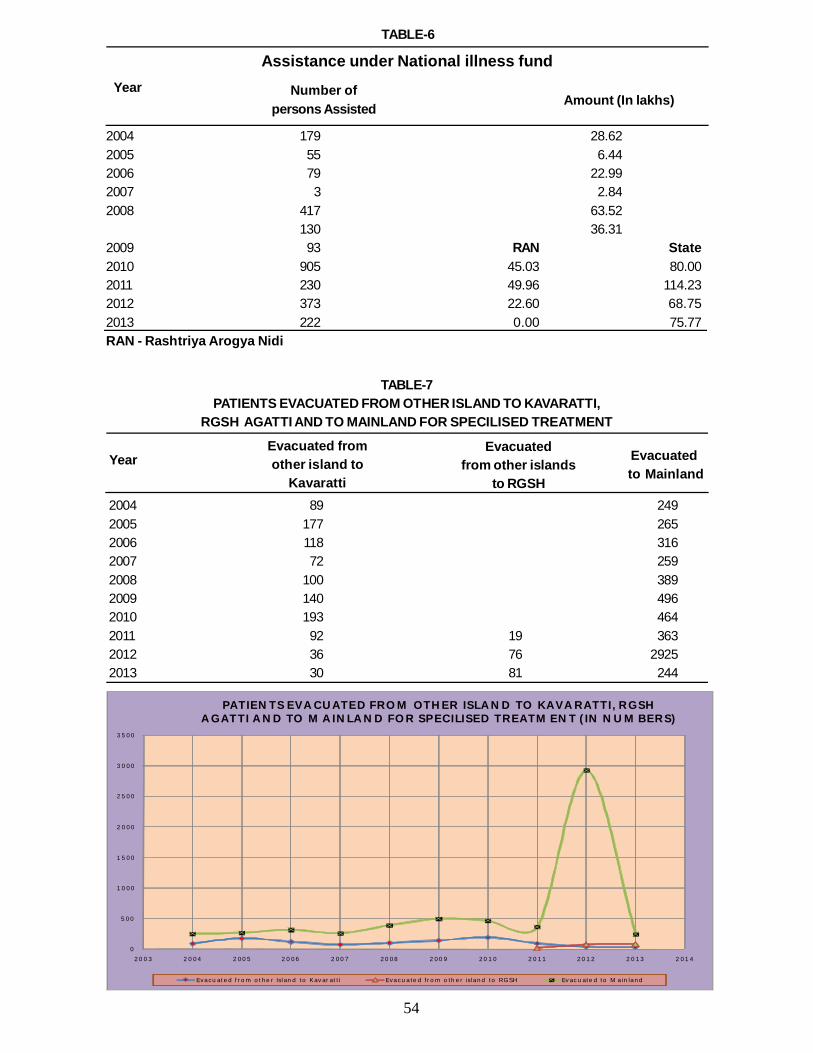
54
0
5 0 0
1 0 0 0
1 5 0 0
2 0 0 0
2 5 0 0
3 0 0 0
3 5 0 0
2 0 0 3 2 0 0 4 2 0 0 5 2 0 0 6 2 0 0 7 2 0 0 8 2 0 0 9 2 0 1 0 2 0 1 1 2 0 1 2 2 0 1 3 2 0 1 4
P A T IE N T S E V A C U A T E D F R O M O T H E R IS L A N D T O K A V A R A T T I , R G S H A G A T T I A N D T O M A IN L A N D F O R S P E C IL IS E D T R E A T M E N T ( IN N U M B E R S )
E v a c u a t e d f r o m o t h e r Is l a n d to K a v a r a t ti E v a c u a te d f r o m o th e r is la n d to R G S H E v a c u a te d to M a in la n d
2004 179 28.622005 55 6.442006 79 22.992007 3 2.842008 417 63.52
130 36.312009 93 RAN State2010 905 45.03 80.002011 230 49.96 114.232012 373 22.60 68.752013 222 0.00 75.77RAN - Rashtriya Arogya Nidi
Year
TABLE-6
Assistance under National illness fund
Number ofpersons Assisted Amount (In lakhs)
2004 89 2492005 177 2652006 118 3162007 72 2592008 100 3892009 140 4962010 193 4642011 92 19 3632012 36 76 29252013 30 81 244
Year
TABLE-7PATIENTS EVACUATED FROM OTHER ISLAND TO KAVARATTI,
RGSH AGATTI AND TO MAINLAND FOR SPECILISED TREATMENT
Evacuated fromother island to
Kavaratti
Evacuatedfrom other islands
to RGSH
Evacuated to Mainland
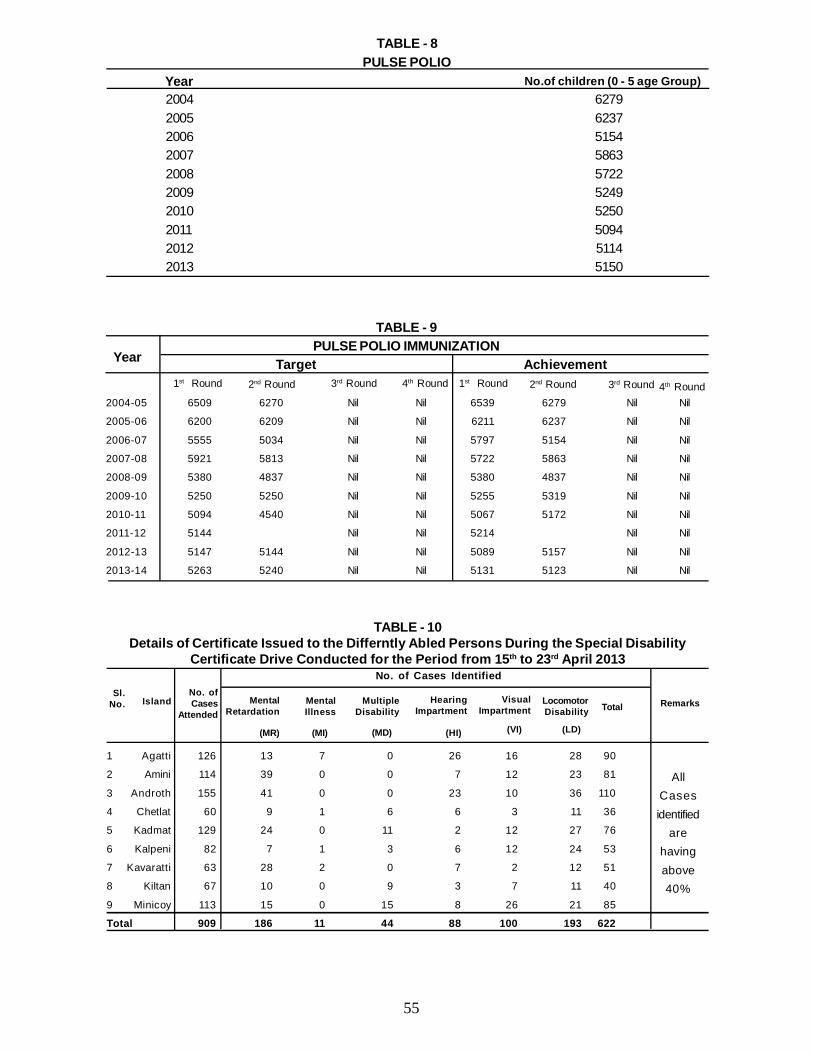
55
1 Agatti 126 13 7 0 26 16 28 90
2 Amini 114 39 0 0 7 12 23 81
3 Androth 155 41 0 0 23 10 36 110
4 Chetlat 60 9 1 6 6 3 11 36
5 Kadmat 129 24 0 11 2 12 27 76
6 Kalpeni 82 7 1 3 6 12 24 53
7 Kavaratti 63 28 2 0 7 2 12 51
8 Kiltan 67 10 0 9 3 7 11 40
9 Minicoy 113 15 0 15 8 26 21 85
Total 909 186 11 44 88 100 193 622
Sl.No.
TABLE - 10Details of Certificate Issued to the Differntly Abled Persons During the Special Disability
Certificate Drive Conducted for the Period from 15th to 23rd April 2013
IslandNo. ofCases
AttendedMental
RetardationMentalIllness
MultipleDisability
HearingImpartment
VisualImpartment
LocomotorDisability
No. of Cases Identified
Total Remarks
(MR) (MI) (MD) (HI)
AllCasesidentified
arehavingabove40%
TABLE - 8PULSE POLIO
2004 62792005 62372006 51542007 58632008 57222009 52492010 52502011 50942012 51142013 5150
Year No.of children (0 - 5 age Group)
(VI) (LD)
TABLE - 9PULSE POLIO IMMUNIZATION
Target Achievement
2004-05 6509 6270 Nil Nil 6539 6279 Nil Nil
2005-06 6200 6209 Nil Nil 6211 6237 Nil Nil
2006-07 5555 5034 Nil Nil 5797 5154 Nil Nil
2007-08 5921 5813 Nil Nil 5722 5863 Nil Nil
2008-09 5380 4837 Nil Nil 5380 4837 Nil Nil
2009-10 5250 5250 Nil Nil 5255 5319 Nil Nil
2010-11 5094 4540 Nil Nil 5067 5172 Nil Nil
2011-12 5144 Nil Nil 5214 Nil Nil
2012-13 5147 5144 Nil Nil 5089 5157 Nil Nil
2013-14 5263 5240 Nil Nil 5131 5123 Nil Nil
Year
1st Round 2nd Round 3rd Round 4th Round 1st Round 2nd Round 3rd Round 4th Round
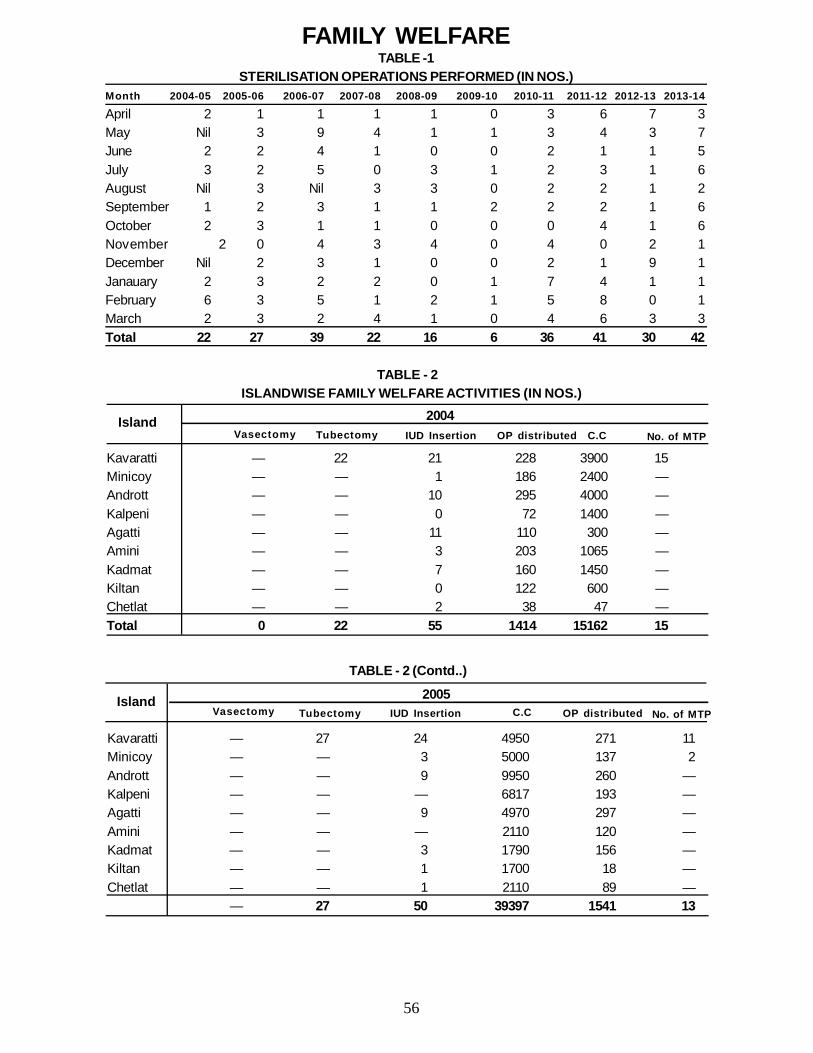
56
FAMILY WELFARETABLE -1
STERILISATION OPERATIONS PERFORMED (IN NOS.)Month 2004-05 2005-06 2006-07 2007-08 2008-09 2009-10 2010-11 2011-12 2012-13 2013-14
April 2 1 1 1 1 0 3 6 7 3May Nil 3 9 4 1 1 3 4 3 7June 2 2 4 1 0 0 2 1 1 5July 3 2 5 0 3 1 2 3 1 6August Nil 3 Nil 3 3 0 2 2 1 2September 1 2 3 1 1 2 2 2 1 6October 2 3 1 1 0 0 0 4 1 6November 2 0 4 3 4 0 4 0 2 1December Nil 2 3 1 0 0 2 1 9 1Janauary 2 3 2 2 0 1 7 4 1 1February 6 3 5 1 2 1 5 8 0 1March 2 3 2 4 1 0 4 6 3 3Total 22 27 39 22 16 6 36 41 30 42
Kavaratti — 22 21 228 3900 15Minicoy — — 1 186 2400 —Andrott — — 10 295 4000 —Kalpeni — — 0 72 1400 —Agatti — — 11 110 300 —Amini — — 3 203 1065 —Kadmat — — 7 160 1450 —Kiltan — — 0 122 600 —Chetlat — — 2 38 47 —Total 0 22 55 1414 15162 15
TABLE - 2 ISLANDWISE FAMILY WELFARE ACTIVITIES (IN NOS.)
Island 2004Vasectomy Tubectomy IUD Insertion OP distributed C.C No. of MTP
Kavaratti — 27 24 4950 271 11Minicoy — — 3 5000 137 2Andrott — — 9 9950 260 —Kalpeni — — — 6817 193 —Agatti — — 9 4970 297 —Amini — — — 2110 120 —Kadmat — — 3 1790 156 —Kiltan — — 1 1700 18 —Chetlat — — 1 2110 89 —
— 27 50 39397 1541 13
TABLE - 2 (Contd..)
Island 2005Vasectomy Tubectomy IUD Insertion OP distributedC.C No. of MTP
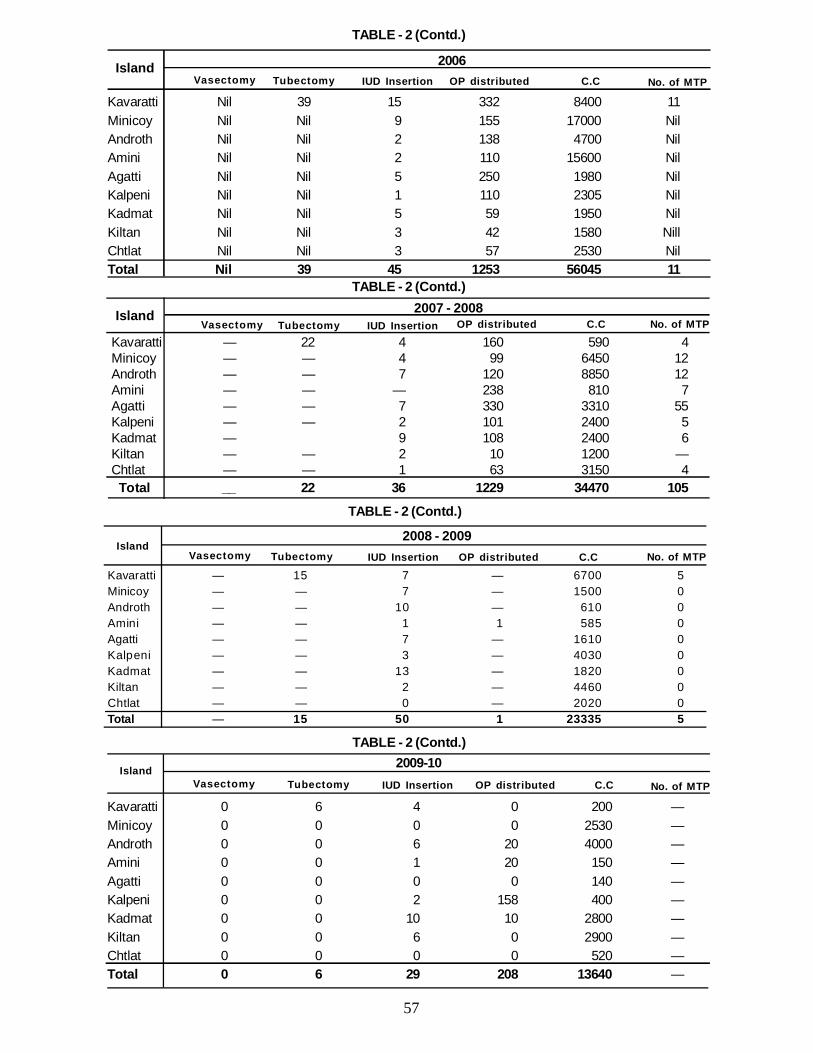
57
Kavaratti Nil 39 15 332 8400 11Minicoy Nil Nil 9 155 17000 NilAndroth Nil Nil 2 138 4700 NilAmini Nil Nil 2 110 15600 NilAgatti Nil Nil 5 250 1980 NilKalpeni Nil Nil 1 110 2305 NilKadmat Nil Nil 5 59 1950 NilKiltan Nil Nil 3 42 1580 NillChtlat Nil Nil 3 57 2530 NilTotal Nil 39 45 1253 56045 11
TABLE - 2 (Contd.)
IslandVasectomy Tubectomy IUD Insertion OP distributed C.C No. of MTP
2006
Kavaratti — 15 7 — 6700 5Minicoy — — 7 — 1500 0Androth — — 10 — 610 0Amini — — 1 1 585 0Agatti — — 7 — 1610 0Kalpeni — — 3 — 4030 0Kadmat — — 13 — 1820 0Kiltan — — 2 — 4460 0Chtlat — — 0 — 2020 0Total — 15 50 1 23335 5
IslandVasectomy Tubectomy IUD Insertion OP distributed C.C No. of MTP
TABLE - 2 (Contd.)
2008 - 2009
Kavaratti 0 6 4 0 200 —Minicoy 0 0 0 0 2530 —Androth 0 0 6 20 4000 —Amini 0 0 1 20 150 —Agatti 0 0 0 0 140 —Kalpeni 0 0 2 158 400 —Kadmat 0 0 10 10 2800 —Kiltan 0 0 6 0 2900 —Chtlat 0 0 0 0 520 —Total 0 6 29 208 13640 —
Island 2009-10Vasectomy Tubectomy IUD Insertion OP distributed C.C No. of MTP
TABLE - 2 (Contd.)
Kavaratti — 22 4 160 590 4Minicoy — — 4 99 6450 12Androth — — 7 120 8850 12Amini — — — 238 810 7Agatti — — 7 330 3310 55Kalpeni — — 2 101 2400 5Kadmat — 9 108 2400 6Kiltan — — 2 10 1200 —Chtlat — — 1 63 3150 4 Total __ 22 36 1229 34470 105
Island 2007 - 2008Vasectomy Tubectomy IUD Insertion OP distributed C.C No. of MTP
TABLE - 2 (Contd.)
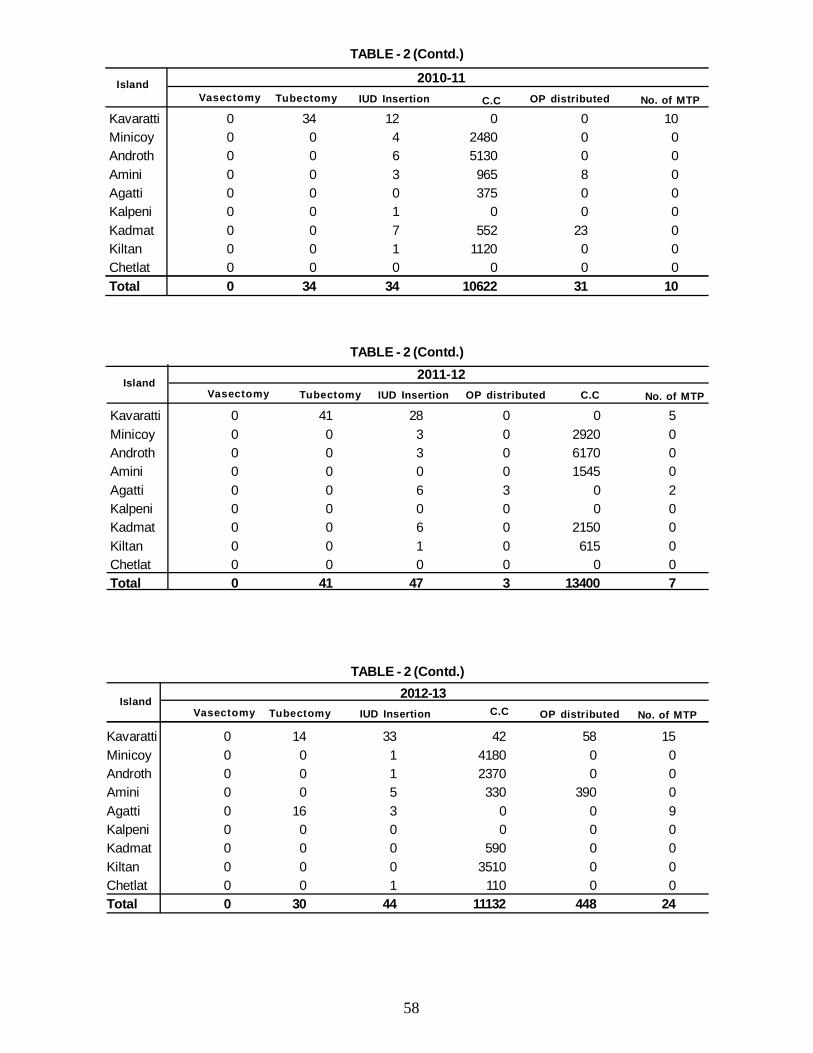
58
Kavaratti 0 41 28 0 0 5Minicoy 0 0 3 0 2920 0Androth 0 0 3 0 6170 0Amini 0 0 0 0 1545 0Agatti 0 0 6 3 0 2Kalpeni 0 0 0 0 0 0Kadmat 0 0 6 0 2150 0Kiltan 0 0 1 0 615 0Chetlat 0 0 0 0 0 0Total 0 41 47 3 13400 7
TABLE - 2 (Contd.)
Island 2011-12
Vasectomy Tubectomy IUD Insertion OP distributed C.C No. of MTP
Kavaratti 0 34 12 0 0 10Minicoy 0 0 4 2480 0 0Androth 0 0 6 5130 0 0Amini 0 0 3 965 8 0Agatti 0 0 0 375 0 0Kalpeni 0 0 1 0 0 0Kadmat 0 0 7 552 23 0Kiltan 0 0 1 1120 0 0Chetlat 0 0 0 0 0 0Total 0 34 34 10622 31 10
TABLE - 2 (Contd.)
Island 2010-11Vasectomy Tubectomy IUD Insertion OP distributedC.C No. of MTP
Kavaratti 0 14 33 42 58 15Minicoy 0 0 1 4180 0 0Androth 0 0 1 2370 0 0Amini 0 0 5 330 390 0Agatti 0 16 3 0 0 9Kalpeni 0 0 0 0 0 0Kadmat 0 0 0 590 0 0Kiltan 0 0 0 3510 0 0Chetlat 0 0 1 110 0 0Total 0 30 44 11132 448 24
Island 2012-13Vasectomy Tubectomy IUD Insertion OP distributedC.C No. of MTP
TABLE - 2 (Contd.)
59
2004 14.73 3.50 20.29 0.19 25.302005 16.17 4.87 19.78 Nil 34.062006 15.79 4.16 16.71 Nil 23.592007 12.51 4.92 19.51 1.21 2.312008 11.61 4.97 14.08 2.56 11.522009 13.50 1.21 14.90 3.73 26.982010 10.94 4.64 18.41 Nil 7.082011 11.36 4.52 12.26 0 8.002012 11.29 4.30 10.88 1.36 6.002013 9.93 4.21 4.26 0 10.00
TABLE -3DEMOGRAPHY OF LAKSHADWEEP
Year Birthrate
Deathrate
InfantMortality
rate
MaternalMortality
rate
StillBirthRate
2 0 0 4 2 0 0 5 2 0 0 6 2 0 0 7 2 0 0 8 2 0 0 9 2 0 1 0 2 0 1 1 2 0 1 2 2 0 1 3
B ir t h r a t e 1 4 . 7 3 1 6 . 1 7 1 5 . 7 9 1 2 . 5 1 1 1 . 6 1 1 3 . 5 0 1 0 . 9 4 1 1 . 3 6 1 1 . 2 9 9 . 9 3
D e a t h r a t e 3 . 5 0 4 . 8 7 4 . 1 6 4 . 9 2 4 . 9 7 1 . 2 1 4 . 6 4 4 . 5 2 4 . 3 0 4 . 2 1
I n f a n t M o r t a lit y r a t e 2 0 . 2 9 1 9 . 7 8 1 6 . 7 1 1 9 . 5 1 1 4 . 0 8 1 4 . 9 0 1 8 . 4 1 1 2 . 2 6 1 0 . 8 8 4 . 2 6
M a t e r n a l M o r t a li t y r a t e 0 . 1 9 0 0 1 . 2 1 2 . 5 6 3 . 7 3 0 0 1 . 3 6 0
S t il l B ir t h R a t e 2 5 . 3 0 3 4 . 0 6 2 3 . 5 9 2 . 3 1 1 1 . 5 2 2 6 . 9 8 7 . 0 8 8 . 0 0 6 . 0 0 1 0 . 0 0
0 . 0 0
5 . 0 0
1 0 . 0 0
1 5 . 0 0
2 0 . 0 0
2 5 . 0 0
3 0 . 0 0
3 5 . 0 0
4 0 . 0 0
D E M O G R A P H Y O F L A K S H A D W E E P
Kavaratti 0 16 15 183 145 6Minicoy 0 0 1 10 1490 0Androth 0 0 2 100 0 0Amini 0 0 12 15 1471 0Agatti 0 26 0 0 0 28Kalpeni 0 0 1 40 2000 0Kadmat 0 0 0 46 265 0Kiltan 0 0 10 31 120 3Chetlat 0 0 0 0 275 0Total 0 42 41 425 5766 37
Island2013-14
Vasectomy Tubectomy IUD Insertion OP distributed C.C No. of MTP
TABLE - 2 (Contd.)
TABLE - 4YEAR-WISE & SEX-WISE BIRTH AND DEATH RATE OF
LAKSHADWEEP
2005-06 532 483 153 1112006-07 494 462 168 1312007-08 419 401 179 1432008-09 431 385 182 1522009-10 346 329 152 1312010-11 363 343 168 1392011-12 399 370 168 1202012-13 399 370 132 1332013-14 335 338 156 128
No. of Birth No. of DeathYearMale Female Male Female
60
1. Acute Diarrhoea 3386 207 — 4368 177 0 4908 381 —2. Acute respiratory 15233 194 — 19625 300 0 15463 234 — Infection3. Viral Hepatitis 177 18 — 19 13 0 4 Nil —4. Measles — — — 0 0 0 Nil Nil —5. T.B 4 3 — 10 5 2 172 Nil —6. Tetanus — — — 0 0 0 Nil Nil —7. Entric fever 1 3 — 0 0 9 Nil 13 —8. Pneumonia 18 17 — 53 43 0 52 23 —9. Whooping cough — — — 0 0 0 Nil Nil —
Diseases2008 2009 2010
TABLE - 5 (Contd.)
OPD IPDIPD
OPD IPDIPD
OPD IPD IPDDeath Death Death
1. Acute Diarrhoea 3739 158 — 4396 227 — 5894 297 —2. Acute respiratory 13077 224 — 19350 301 — 18089 310 — Infection3.Viral Hepatitis 8 7 — 14 12 — 8 3 —4.Measles — — — — — — — — —5.T.B 951 — — 1130 1 1 1205 — —6.Tetanus — — — — — — — — —7.Entric fever 4 4 — 3 3 — 3 3 —8.Pneumonia 34 29 — 30 28 — — — —9.Whooping cough — — — — — — — — —
Diseases2011 2012 2013
TABLE - 5 (Contd.)
OPD IPD IPD OPD IPD IPD OPD IPDIPD
Death Death Death
1. Acute Diarrhoea 7373 200 — 5126 151 — 6003 326 — diseases2. Acute respiratory — — Infection 31944 602 — 15139 252 — 18561 293 —3. Viral Hepatitis 34 2 — 130 6 — 91 23 —4. Measles — — — 9 3 — — — —5. T.B 29 2 6 6 — 1 10 5 —6. Tetanus — — — — — — — — —7. Entric fever 5 3 — 11 — — 1 3 —8. Pneumonia 49 16 4 41 29 — 26 15 —9. Whooping cough — — — — — — — —
Diseases
TABLE - 5PREVELENT COMMUNICABLE DISEASES IN LAKSHADWEEP
2005 2006 2007
OPD IPD IPDOPD IPD
IPDOPD IPD
IPDDeathDeath Death
61
1. Acute Diarrhoea 4762 205 —
2. Acute respiratory 23390 374 —
Infection
3. Viral Hepatitis 22 10 —
4. Measles 5 — —
5. T.B 784 — —
6. Tetanus — — —
7. Entric fever 14 14 —
8. Pneumonia 66 27 —
9. Whooping cough — — —
Diseases OPD
TABLE - 5 (Contd.)
IPD IPD Death2014
TABLE - 6PREGNANT WOMEN REGISTERED
Total No.of Registered Pregnant Women2004-05 12052005-06 12122006-07 11002007-08 9712008-09 11292009-10 10222010-11 10912011-12 11142012-13 11632013-14 1175
Year
TABLE - 7 IMMUNIZATION STATUS
Year DPT OPV BCG Measles TT(P.W)*2004-05 1119 1119 909 1020 10422005-06 1068 1068 1005 1039 18902006-07 1035 1035 972 994 9222007-08 883 883 619 830 14272008-09 974 974 864 910 13062009-10 966 965 702 1045 15372010-11 913 867 758 885 10062011-12 977 977 771 1078 18832012-13 921 921 687 1052 19832013-14 1030 1030 679 1055 1837(*) Pregnant Women
62
TABLE - 8STATUS OF HIV +VE CASES
Year HIV +ve Expired Alive1993 2 0 21994 4 1 51995 0 1 41996 0 1 31997 1 2 21998 1 0 31999 5 0 82000 1 0 92001 0 1 82002 2 2 82003 2 0 102004 2 0 122005 31 `2 132006 3 4 122007 1 0 132008 0 3 102009 0 0 102010 1 4 72011 0 1 62012 0 0 62013 1 1 62014 1 0 7
2005-06 202006-07 152007-08 152008-09 152009-10 132010-11 172011-12 202012-13 242013-14 28
Year
TABLE - 9TOTAL NUMBER OF TB PATIENTS
Total numer ofTB patients
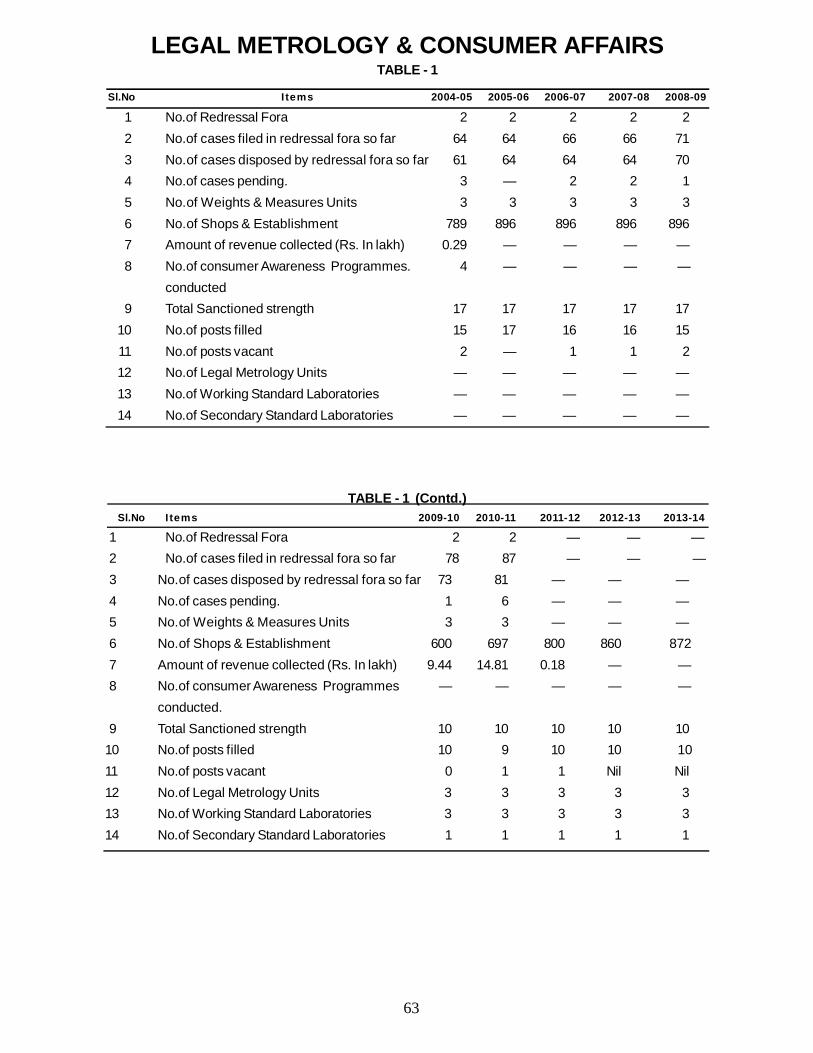
63
TABLE - 1 (Contd.) Sl.No I tems 2009-10 2010-11 2011-12 2012-13 2013-14
1 No.of Redressal Fora 2 2 — — —2 No.of cases filed in redressal fora so far 78 87 — — —3 No.of cases disposed by redressal fora so far 73 81 — — —4 No.of cases pending. 1 6 — — —5 No.of Weights & Measures Units 3 3 — — —6 No.of Shops & Establishment 600 697 800 860 8727 Amount of revenue collected (Rs. In lakh) 9.44 14.81 0.18 — —8 No.of consumer Awareness Programmes — — — — —
conducted.9 Total Sanctioned strength 10 10 10 10 10
10 No.of posts filled 10 9 10 10 1011 No.of posts vacant 0 1 1 Nil Nil12 No.of Legal Metrology Units 3 3 3 3 313 No.of Working Standard Laboratories 3 3 3 3 314 No.of Secondary Standard Laboratories 1 1 1 1 1
Sl.No I tems 2004-05 2005-06 2006-07 2007-08 2008-09
1 No.of Redressal Fora 2 2 2 2 22 No.of cases filed in redressal fora so far 64 64 66 66 713 No.of cases disposed by redressal fora so far 61 64 64 64 704 No.of cases pending. 3 — 2 2 15 No.of Weights & Measures Units 3 3 3 3 36 No.of Shops & Establishment 789 896 896 896 8967 Amount of revenue collected (Rs. In lakh) 0.29 — — — —8 No.of consumer Awareness Programmes. 4 — — — —
conducted9 Total Sanctioned strength 17 17 17 17 17
10 No.of posts filled 15 17 16 16 1511 No.of posts vacant 2 — 1 1 212 No.of Legal Metrology Units — — — — —13 No.of Working Standard Laboratories — — — — —14 No.of Secondary Standard Laboratories — — — — —
LEGAL METROLOGY & CONSUMER AFFAIRSTABLE - 1
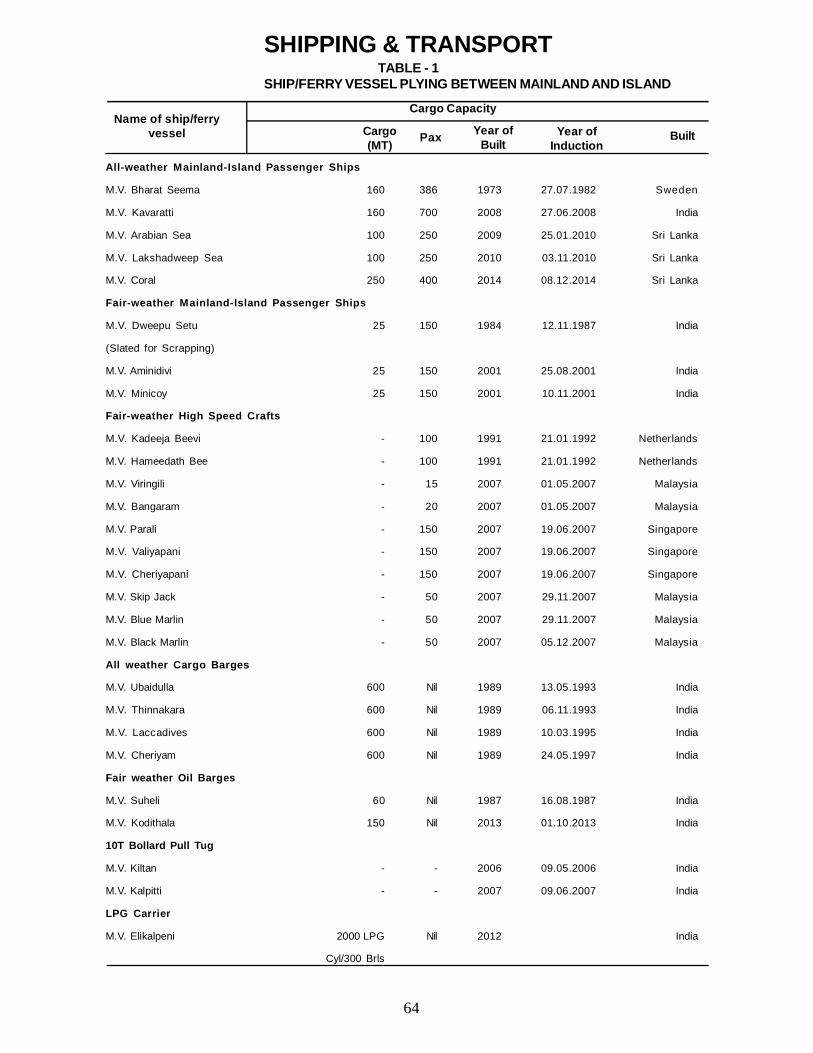
64
All-weather Mainland-Island Passenger Ships
M.V. Bharat Seema 160 386 1973 27.07.1982 Sweden
M.V. Kavaratti 160 700 2008 27.06.2008 India
M.V. Arabian Sea 100 250 2009 25.01.2010 Sri Lanka
M.V. Lakshadweep Sea 100 250 2010 03.11.2010 Sri Lanka
M.V. Coral 250 400 2014 08.12.2014 Sri Lanka
Fair-weather Mainland-Island Passenger Ships
M.V. Dweepu Setu 25 150 1984 12.11.1987 India
(Slated for Scrapping)
M.V. Aminidivi 25 150 2001 25.08.2001 India
M.V. Minicoy 25 150 2001 10.11.2001 India
Fair-weather High Speed Crafts
M.V. Kadeeja Beevi - 100 1991 21.01.1992 Netherlands
M.V. Hameedath Bee - 100 1991 21.01.1992 Netherlands
M.V. Viringili - 15 2007 01.05.2007 Malaysia
M.V. Bangaram - 20 2007 01.05.2007 Malaysia
M.V. Parali - 150 2007 19.06.2007 Singapore
M.V. Valiyapani - 150 2007 19.06.2007 Singapore
M.V. Cheriyapani - 150 2007 19.06.2007 Singapore
M.V. Skip Jack - 50 2007 29.11.2007 Malaysia
M.V. Blue Marlin - 50 2007 29.11.2007 Malaysia
M.V. Black Marlin - 50 2007 05.12.2007 Malaysia
All weather Cargo Barges
M.V. Ubaidulla 600 Nil 1989 13.05.1993 India
M.V. Thinnakara 600 Nil 1989 06.11.1993 India
M.V. Laccadives 600 Nil 1989 10.03.1995 India
M.V. Cheriyam 600 Nil 1989 24.05.1997 India
Fair weather Oil Barges
M.V. Suheli 60 Nil 1987 16.08.1987 India
M.V. Kodithala 150 Nil 2013 01.10.2013 India
10T Bollard Pull Tug
M.V. Kiltan - - 2006 09.05.2006 India
M.V. Kalpitti - - 2007 09.06.2007 India
LPG Carrier
M.V. Elikalpeni 2000 LPG Nil 2012 India
Cyl/300 Brls
SHIPPING & TRANSPORTTABLE - 1
SHIP/FERRY VESSEL PLYING BETWEEN MAINLAND AND ISLAND
Name of ship/ferryvessel
Cargo Capacity
Year ofBuilt
Year ofInduction
BuiltCargo(MT) Pax
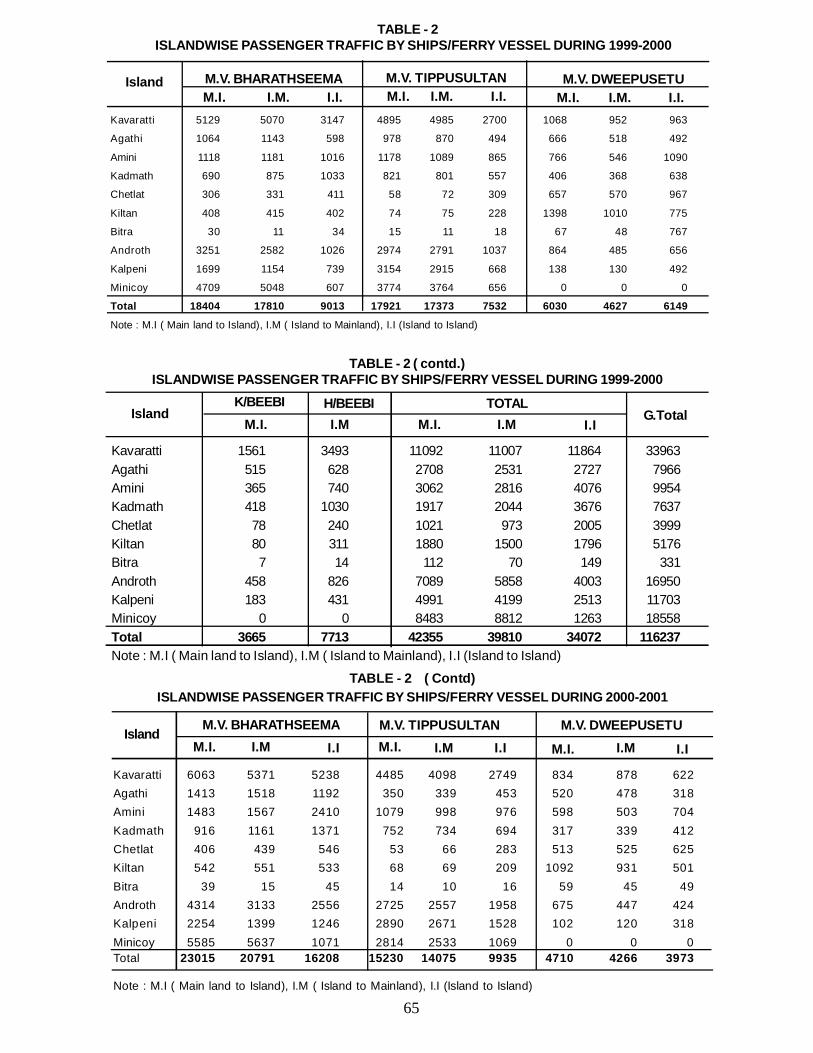
65
Kavaratti 5129 5070 3147 4895 4985 2700 1068 952 963
Agathi 1064 1143 598 978 870 494 666 518 492
Amini 1118 1181 1016 1178 1089 865 766 546 1090
Kadmath 690 875 1033 821 801 557 406 368 638
Chetlat 306 331 411 58 72 309 657 570 967
Kiltan 408 415 402 74 75 228 1398 1010 775
Bitra 30 11 34 15 11 18 67 48 767
Androth 3251 2582 1026 2974 2791 1037 864 485 656
Kalpeni 1699 1154 739 3154 2915 668 138 130 492
Minicoy 4709 5048 607 3774 3764 656 0 0 0
Total 18404 17810 9013 17921 17373 7532 6030 4627 6149
Note : M.I ( Main land to Island), I.M ( Island to Mainland), I.I (Island to Island)
TABLE - 2 ISLANDWISE PASSENGER TRAFFIC BY SHIPS/FERRY VESSEL DURING 1999-2000
Island M.V. BHARATHSEEMAM.I. I.M. I.I.
M.V. TIPPUSULTANM.I. I.M. I.I.
M.V. DWEEPUSETU M.I. I.M. I.I.
Kavaratti 1561 3493 11092 11007 11864 33963Agathi 515 628 2708 2531 2727 7966Amini 365 740 3062 2816 4076 9954Kadmath 418 1030 1917 2044 3676 7637Chetlat 78 240 1021 973 2005 3999Kiltan 80 311 1880 1500 1796 5176Bitra 7 14 112 70 149 331Androth 458 826 7089 5858 4003 16950Kalpeni 183 431 4991 4199 2513 11703Minicoy 0 0 8483 8812 1263 18558Total 3665 7713 42355 39810 34072 116237Note : M.I ( Main land to Island), I.M ( Island to Mainland), I.I (Island to Island)
TABLE - 2 ( contd.)ISLANDWISE PASSENGER TRAFFIC BY SHIPS/FERRY VESSEL DURING 1999-2000
IslandK/BEEBI H/BEEBI TOTAL
G.Total M.I. I.M M.I. I.M I.I
Kavaratti 6063 5371 5238 4485 4098 2749 834 878 622Agathi 1413 1518 1192 350 339 453 520 478 318Amini 1483 1567 2410 1079 998 976 598 503 704Kadmath 916 1161 1371 752 734 694 317 339 412Chetlat 406 439 546 53 66 283 513 525 625Kiltan 542 551 533 68 69 209 1092 931 501Bitra 39 15 45 14 10 16 59 45 49Androth 4314 3133 2556 2725 2557 1958 675 447 424Kalpeni 2254 1399 1246 2890 2671 1528 102 120 318Minicoy 5585 5637 1071 2814 2533 1069 0 0 0Total 23015 20791 16208 15230 14075 9935 4710 4266 3973
Note : M.I ( Main land to Island), I.M ( Island to Mainland), I.I (Island to Island)
TABLE - 2 ( Contd)ISLANDWISE PASSENGER TRAFFIC BY SHIPS/FERRY VESSEL DURING 2000-2001
Island M.V. BHARATHSEEMA M.V. TIPPUSULTAN M.V. DWEEPUSETUM.I. I.M I.I M.I. I.M I.I I.IM.I. I.M
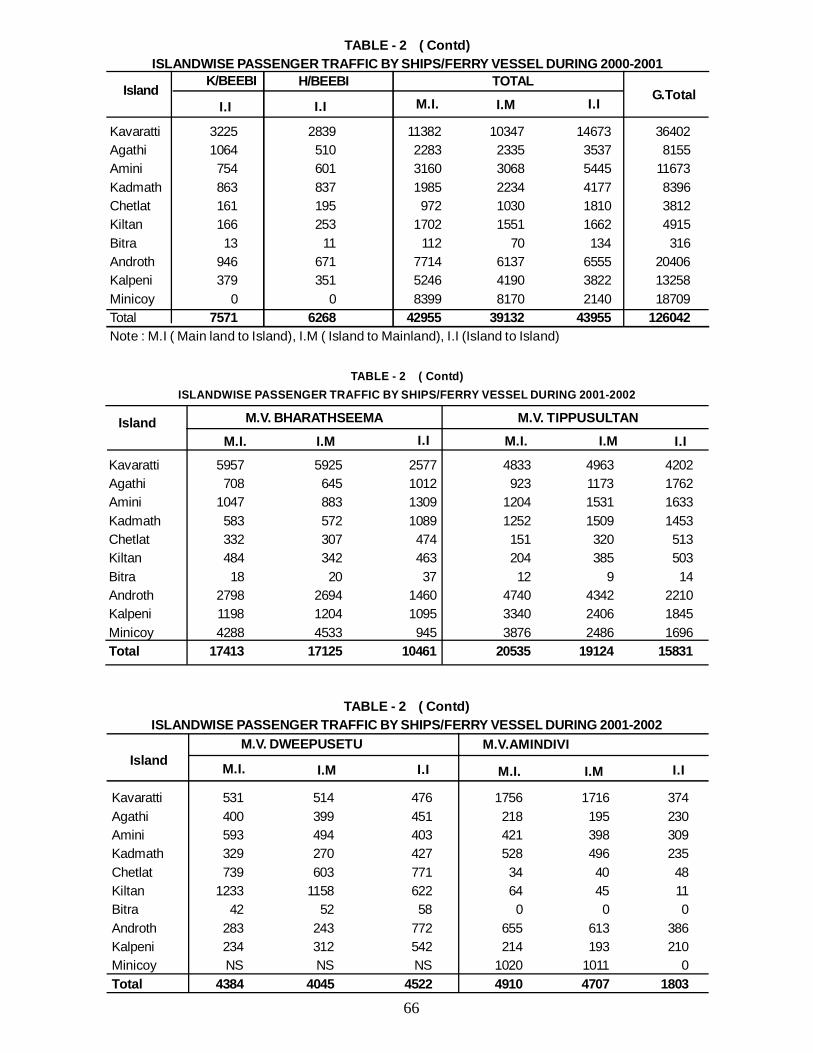
66
Kavaratti 3225 2839 11382 10347 14673 36402Agathi 1064 510 2283 2335 3537 8155Amini 754 601 3160 3068 5445 11673Kadmath 863 837 1985 2234 4177 8396Chetlat 161 195 972 1030 1810 3812Kiltan 166 253 1702 1551 1662 4915Bitra 13 11 112 70 134 316Androth 946 671 7714 6137 6555 20406Kalpeni 379 351 5246 4190 3822 13258Minicoy 0 0 8399 8170 2140 18709Total 7571 6268 42955 39132 43955 126042Note : M.I ( Main land to Island), I.M ( Island to Mainland), I.I (Island to Island)
TABLE - 2 ( Contd)ISLANDWISE PASSENGER TRAFFIC BY SHIPS/FERRY VESSEL DURING 2000-2001
K/BEEBIIsland H/BEEBI TOTAL
G.TotalI.I I.I M.I. I.M I.I
Island
Kavaratti 5957 5925 2577 4833 4963 4202Agathi 708 645 1012 923 1173 1762Amini 1047 883 1309 1204 1531 1633Kadmath 583 572 1089 1252 1509 1453Chetlat 332 307 474 151 320 513Kiltan 484 342 463 204 385 503Bitra 18 20 37 12 9 14Androth 2798 2694 1460 4740 4342 2210Kalpeni 1198 1204 1095 3340 2406 1845Minicoy 4288 4533 945 3876 2486 1696Total 17413 17125 10461 20535 19124 15831
TABLE - 2 ( Contd)ISLANDWISE PASSENGER TRAFFIC BY SHIPS/FERRY VESSEL DURING 2001-2002
M.V. BHARATHSEEMA M.V. TIPPUSULTAN
M.I. I.M I.I M.I. I.M I.I
Kavaratti 531 514 476 1756 1716 374Agathi 400 399 451 218 195 230Amini 593 494 403 421 398 309Kadmath 329 270 427 528 496 235Chetlat 739 603 771 34 40 48Kiltan 1233 1158 622 64 45 11Bitra 42 52 58 0 0 0Androth 283 243 772 655 613 386Kalpeni 234 312 542 214 193 210Minicoy NS NS NS 1020 1011 0Total 4384 4045 4522 4910 4707 1803
TABLE - 2 ( Contd)ISLANDWISE PASSENGER TRAFFIC BY SHIPS/FERRY VESSEL DURING 2001-2002
M.V. DWEEPUSETU M.V.AMINDIVI
M.I. I.M I.I M.I. I.M I.IIsland
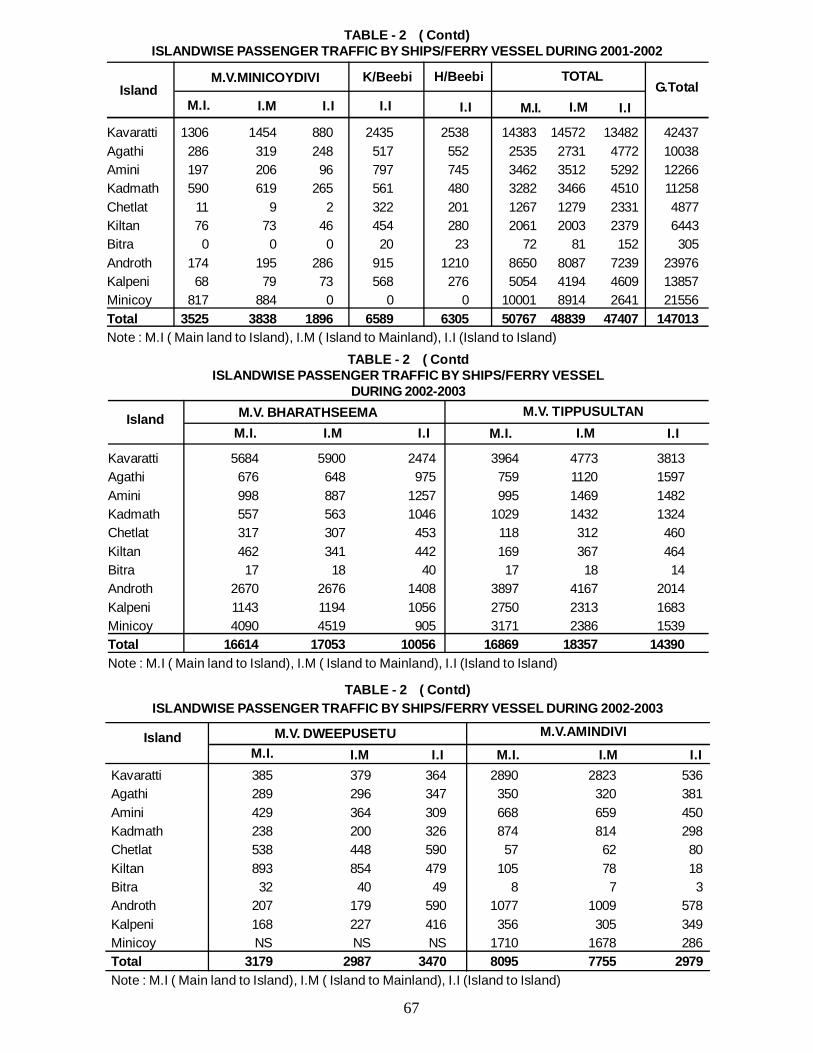
67
Kavaratti 1306 1454 880 2435 2538 14383 14572 13482 42437Agathi 286 319 248 517 552 2535 2731 4772 10038Amini 197 206 96 797 745 3462 3512 5292 12266Kadmath 590 619 265 561 480 3282 3466 4510 11258Chetlat 11 9 2 322 201 1267 1279 2331 4877Kiltan 76 73 46 454 280 2061 2003 2379 6443Bitra 0 0 0 20 23 72 81 152 305Androth 174 195 286 915 1210 8650 8087 7239 23976Kalpeni 68 79 73 568 276 5054 4194 4609 13857Minicoy 817 884 0 0 0 10001 8914 2641 21556Total 3525 3838 1896 6589 6305 50767 48839 47407 147013Note : M.I ( Main land to Island), I.M ( Island to Mainland), I.I (Island to Island)
TABLE - 2 ( Contd)ISLANDWISE PASSENGER TRAFFIC BY SHIPS/FERRY VESSEL DURING 2001-2002
IslandM.V.MINICOYDIVI K/Beebi H/Beebi TOTAL
G.Total M.I. I.M I.I I.I I.I M.I. I.M I.I
Kavaratti 5684 5900 2474 3964 4773 3813Agathi 676 648 975 759 1120 1597Amini 998 887 1257 995 1469 1482Kadmath 557 563 1046 1029 1432 1324Chetlat 317 307 453 118 312 460Kiltan 462 341 442 169 367 464Bitra 17 18 40 17 18 14Androth 2670 2676 1408 3897 4167 2014Kalpeni 1143 1194 1056 2750 2313 1683Minicoy 4090 4519 905 3171 2386 1539Total 16614 17053 10056 16869 18357 14390Note : M.I ( Main land to Island), I.M ( Island to Mainland), I.I (Island to Island)
TABLE - 2 ( ContdISLANDWISE PASSENGER TRAFFIC BY SHIPS/FERRY VESSEL
DURING 2002-2003
Island M.V. BHARATHSEEMA M.V. TIPPUSULTAN M.I. I.M I.I M.I. I.M I.I
Kavaratti 385 379 364 2890 2823 536Agathi 289 296 347 350 320 381Amini 429 364 309 668 659 450Kadmath 238 200 326 874 814 298Chetlat 538 448 590 57 62 80Kiltan 893 854 479 105 78 18Bitra 32 40 49 8 7 3Androth 207 179 590 1077 1009 578Kalpeni 168 227 416 356 305 349Minicoy NS NS NS 1710 1678 286Total 3179 2987 3470 8095 7755 2979Note : M.I ( Main land to Island), I.M ( Island to Mainland), I.I (Island to Island)
Island
TABLE - 2 ( Contd)ISLANDWISE PASSENGER TRAFFIC BY SHIPS/FERRY VESSEL DURING 2002-2003
M.V. DWEEPUSETU M.V.AMINDIVIM.I. I.M I.I M.I. I.M I.I
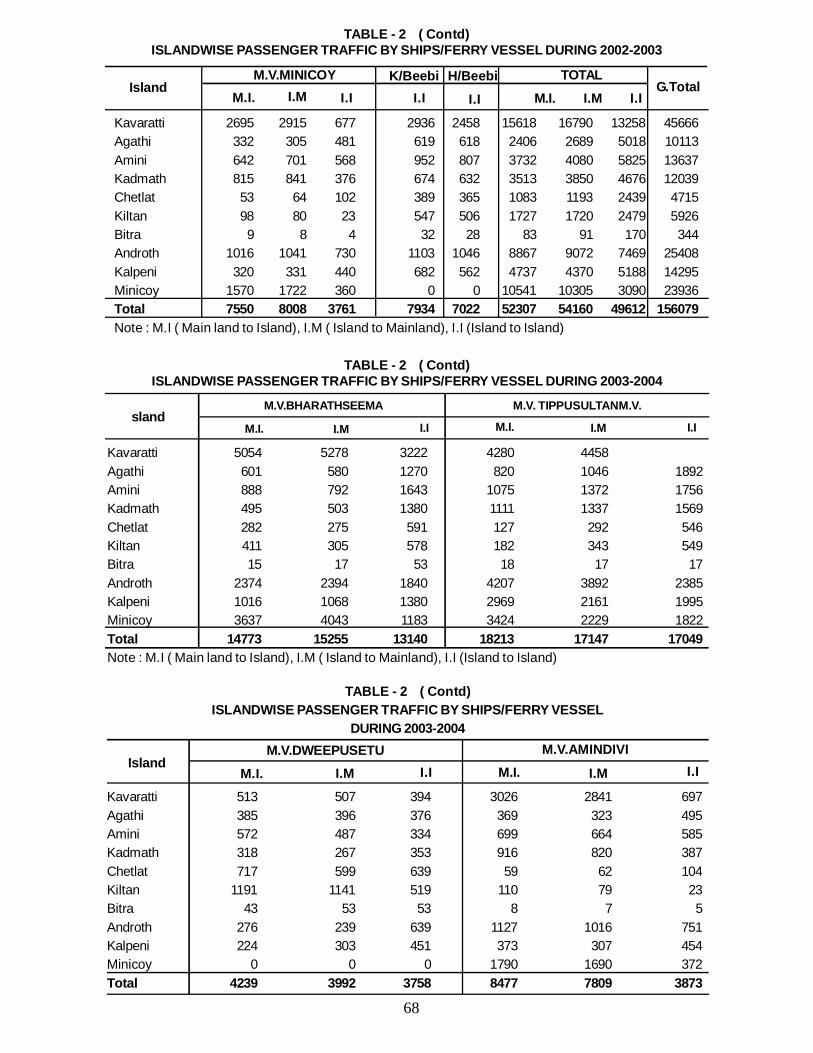
68
Kavaratti 5054 5278 3222 4280 4458Agathi 601 580 1270 820 1046 1892Amini 888 792 1643 1075 1372 1756Kadmath 495 503 1380 1111 1337 1569Chetlat 282 275 591 127 292 546Kiltan 411 305 578 182 343 549Bitra 15 17 53 18 17 17Androth 2374 2394 1840 4207 3892 2385Kalpeni 1016 1068 1380 2969 2161 1995Minicoy 3637 4043 1183 3424 2229 1822Total 14773 15255 13140 18213 17147 17049Note : M.I ( Main land to Island), I.M ( Island to Mainland), I.I (Island to Island)
TABLE - 2 ( Contd)ISLANDWISE PASSENGER TRAFFIC BY SHIPS/FERRY VESSEL DURING 2003-2004
slandM.I.
M.V.BHARATHSEEMA M.V. TIPPUSULTANM.V.
I.M I.I M.I. I.M I.I
Kavaratti 513 507 394 3026 2841 697Agathi 385 396 376 369 323 495Amini 572 487 334 699 664 585Kadmath 318 267 353 916 820 387Chetlat 717 599 639 59 62 104Kiltan 1191 1141 519 110 79 23Bitra 43 53 53 8 7 5Androth 276 239 639 1127 1016 751Kalpeni 224 303 451 373 307 454Minicoy 0 0 0 1790 1690 372Total 4239 3992 3758 8477 7809 3873
TABLE - 2 ( Contd)ISLANDWISE PASSENGER TRAFFIC BY SHIPS/FERRY VESSEL
DURING 2003-2004
IslandM.V.DWEEPUSETU M.V.AMINDIVI
M.I. I.M I.I M.I. I.M I.I
Kavaratti 2695 2915 677 2936 2458 15618 16790 13258 45666Agathi 332 305 481 619 618 2406 2689 5018 10113Amini 642 701 568 952 807 3732 4080 5825 13637Kadmath 815 841 376 674 632 3513 3850 4676 12039Chetlat 53 64 102 389 365 1083 1193 2439 4715Kiltan 98 80 23 547 506 1727 1720 2479 5926Bitra 9 8 4 32 28 83 91 170 344Androth 1016 1041 730 1103 1046 8867 9072 7469 25408Kalpeni 320 331 440 682 562 4737 4370 5188 14295Minicoy 1570 1722 360 0 0 10541 10305 3090 23936Total 7550 8008 3761 7934 7022 52307 54160 49612 156079Note : M.I ( Main land to Island), I.M ( Island to Mainland), I.I (Island to Island)
TABLE - 2 ( Contd)ISLANDWISE PASSENGER TRAFFIC BY SHIPS/FERRY VESSEL DURING 2002-2003
IslandM.V.MINICOY K/Beebi H/Beebi TOTAL
G.TotalM.I. I.M I.I I.I I.I M.I. I.M I.I
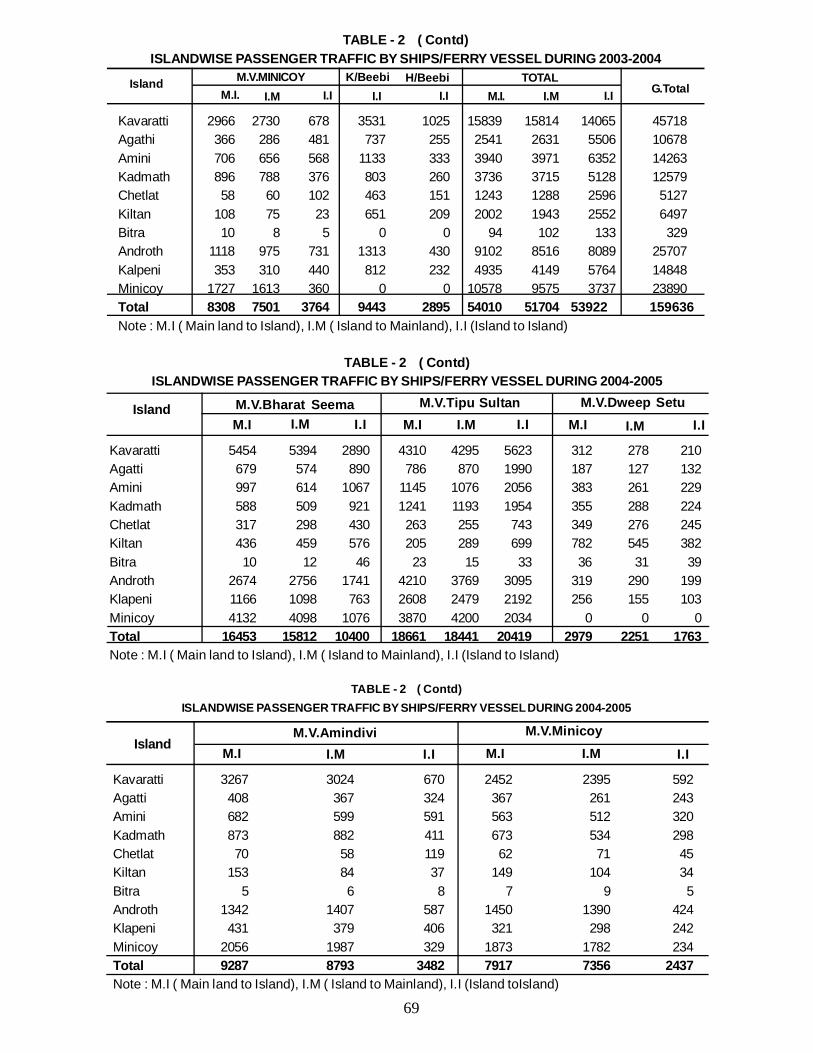
69
Kavaratti 2966 2730 678 3531 1025 15839 15814 14065 45718Agathi 366 286 481 737 255 2541 2631 5506 10678Amini 706 656 568 1133 333 3940 3971 6352 14263Kadmath 896 788 376 803 260 3736 3715 5128 12579Chetlat 58 60 102 463 151 1243 1288 2596 5127Kiltan 108 75 23 651 209 2002 1943 2552 6497Bitra 10 8 5 0 0 94 102 133 329Androth 1118 975 731 1313 430 9102 8516 8089 25707Kalpeni 353 310 440 812 232 4935 4149 5764 14848Minicoy 1727 1613 360 0 0 10578 9575 3737 23890Total 8308 7501 3764 9443 2895 54010 51704 53922 159636Note : M.I ( Main land to Island), I.M ( Island to Mainland), I.I (Island to Island)
Island M.V.MINICOY K/Beebi TOTALG.TotalM.I. I.M I.I I.I I.I M.I. I.M
TABLE - 2 ( Contd)ISLANDWISE PASSENGER TRAFFIC BY SHIPS/FERRY VESSEL DURING 2003-2004
I.IH/Beebi
Kavaratti 5454 5394 2890 4310 4295 5623 312 278 210Agatti 679 574 890 786 870 1990 187 127 132Amini 997 614 1067 1145 1076 2056 383 261 229Kadmath 588 509 921 1241 1193 1954 355 288 224Chetlat 317 298 430 263 255 743 349 276 245Kiltan 436 459 576 205 289 699 782 545 382Bitra 10 12 46 23 15 33 36 31 39Androth 2674 2756 1741 4210 3769 3095 319 290 199Klapeni 1166 1098 763 2608 2479 2192 256 155 103Minicoy 4132 4098 1076 3870 4200 2034 0 0 0Total 16453 15812 10400 18661 18441 20419 2979 2251 1763Note : M.I ( Main land to Island), I.M ( Island to Mainland), I.I (Island to Island)
TABLE - 2 ( Contd)ISLANDWISE PASSENGER TRAFFIC BY SHIPS/FERRY VESSEL DURING 2004-2005
Island M.V.Bharat Seema M.V.Tipu Sultan M.V.Dweep SetuM.I I.M I.I M.I I.M I.I M.I I.M I.I
Kavaratti 3267 3024 670 2452 2395 592Agatti 408 367 324 367 261 243Amini 682 599 591 563 512 320Kadmath 873 882 411 673 534 298Chetlat 70 58 119 62 71 45Kiltan 153 84 37 149 104 34Bitra 5 6 8 7 9 5Androth 1342 1407 587 1450 1390 424Klapeni 431 379 406 321 298 242Minicoy 2056 1987 329 1873 1782 234Total 9287 8793 3482 7917 7356 2437Note : M.I ( Main land to Island), I.M ( Island to Mainland), I.I (Island toIsland)
TABLE - 2 ( Contd)ISLANDWISE PASSENGER TRAFFIC BY SHIPS/FERRY VESSEL DURING 2004-2005
IslandM.V.Amindivi M.V.Minicoy
M.I I.M I.I M.I I.M I.I
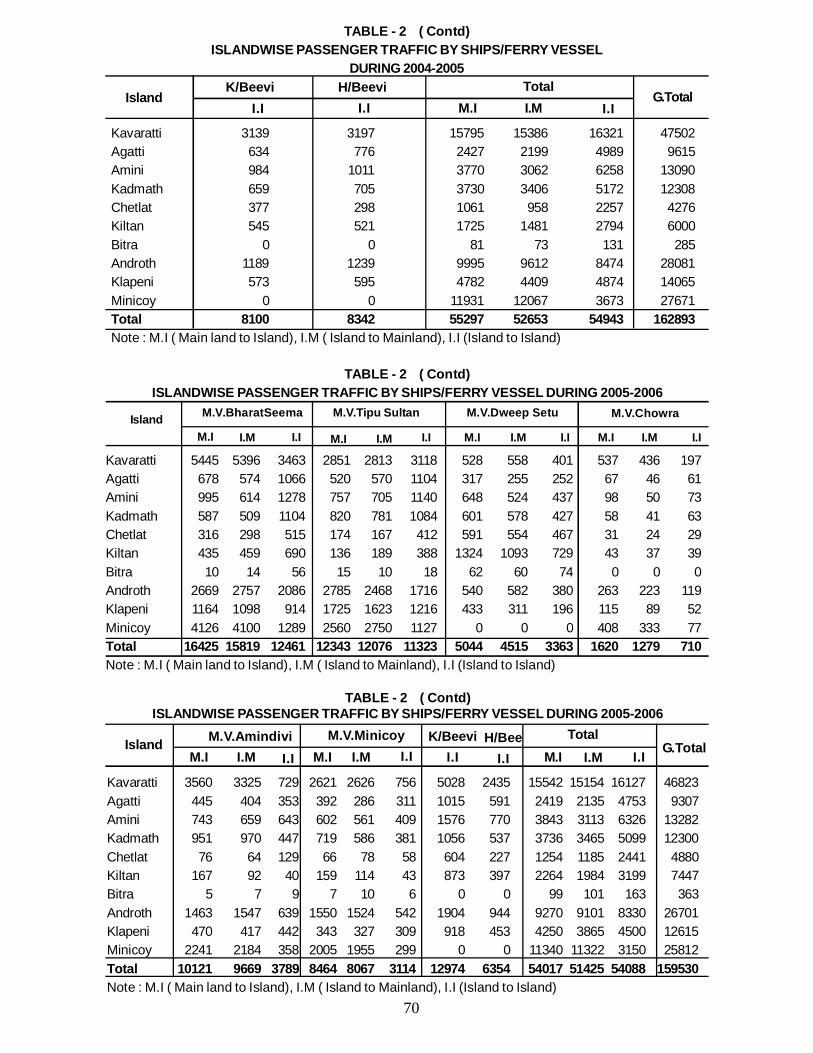
70
Kavaratti 3139 3197 15795 15386 16321 47502Agatti 634 776 2427 2199 4989 9615Amini 984 1011 3770 3062 6258 13090Kadmath 659 705 3730 3406 5172 12308Chetlat 377 298 1061 958 2257 4276Kiltan 545 521 1725 1481 2794 6000Bitra 0 0 81 73 131 285Androth 1189 1239 9995 9612 8474 28081Klapeni 573 595 4782 4409 4874 14065Minicoy 0 0 11931 12067 3673 27671Total 8100 8342 55297 52653 54943 162893Note : M.I ( Main land to Island), I.M ( Island to Mainland), I.I (Island to Island)
TABLE - 2 ( Contd)ISLANDWISE PASSENGER TRAFFIC BY SHIPS/FERRY VESSEL
DURING 2004-2005
IslandK/Beevi H/Beevi Total
G.TotalI.I I.I M.I I.M I.I
Kavaratti 5445 5396 3463 2851 2813 3118 528 558 401 537 436 197Agatti 678 574 1066 520 570 1104 317 255 252 67 46 61Amini 995 614 1278 757 705 1140 648 524 437 98 50 73Kadmath 587 509 1104 820 781 1084 601 578 427 58 41 63Chetlat 316 298 515 174 167 412 591 554 467 31 24 29Kiltan 435 459 690 136 189 388 1324 1093 729 43 37 39Bitra 10 14 56 15 10 18 62 60 74 0 0 0Androth 2669 2757 2086 2785 2468 1716 540 582 380 263 223 119Klapeni 1164 1098 914 1725 1623 1216 433 311 196 115 89 52Minicoy 4126 4100 1289 2560 2750 1127 0 0 0 408 333 77Total 16425 15819 12461 12343 12076 11323 5044 4515 3363 1620 1279 710Note : M.I ( Main land to Island), I.M ( Island to Mainland), I.I (Island to Island)
TABLE - 2 ( Contd)ISLANDWISE PASSENGER TRAFFIC BY SHIPS/FERRY VESSEL DURING 2005-2006
Island M.V.BharatSeema M.V.Tipu Sultan M.V.Dweep Setu M.V.Chowra
M.I I.M I.I M.I I.M I.I M.I I.M I.I M.I I.M I.I
Kavaratti 3560 3325 729 2621 2626 756 5028 2435 15542 15154 16127 46823Agatti 445 404 353 392 286 311 1015 591 2419 2135 4753 9307Amini 743 659 643 602 561 409 1576 770 3843 3113 6326 13282Kadmath 951 970 447 719 586 381 1056 537 3736 3465 5099 12300Chetlat 76 64 129 66 78 58 604 227 1254 1185 2441 4880Kiltan 167 92 40 159 114 43 873 397 2264 1984 3199 7447Bitra 5 7 9 7 10 6 0 0 99 101 163 363Androth 1463 1547 639 1550 1524 542 1904 944 9270 9101 8330 26701Klapeni 470 417 442 343 327 309 918 453 4250 3865 4500 12615Minicoy 2241 2184 358 2005 1955 299 0 0 11340 11322 3150 25812Total 10121 9669 3789 8464 8067 3114 12974 6354 54017 51425 54088 159530Note : M.I ( Main land to Island), I.M ( Island to Mainland), I.I (Island to Island)
TABLE - 2 ( Contd)ISLANDWISE PASSENGER TRAFFIC BY SHIPS/FERRY VESSEL DURING 2005-2006
Island M.V.Amindivi M.V.Minicoy K/Beevi H/Bee TotalG.TotalM.I I.M I.I M.I I.M I.I I.I I.I M.I I.M I.I
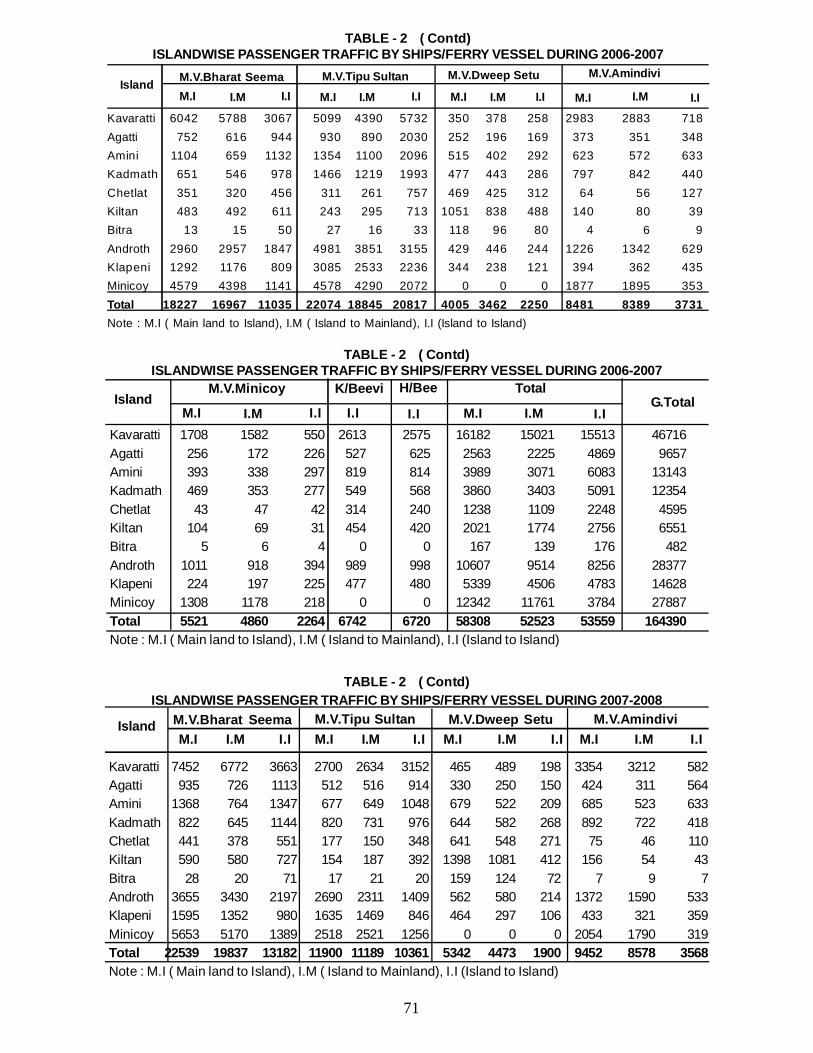
71
Kavaratti 6042 5788 3067 5099 4390 5732 350 378 258 2983 2883 718Agatti 752 616 944 930 890 2030 252 196 169 373 351 348Amini 1104 659 1132 1354 1100 2096 515 402 292 623 572 633Kadmath 651 546 978 1466 1219 1993 477 443 286 797 842 440Chetlat 351 320 456 311 261 757 469 425 312 64 56 127Kiltan 483 492 611 243 295 713 1051 838 488 140 80 39Bitra 13 15 50 27 16 33 118 96 80 4 6 9Androth 2960 2957 1847 4981 3851 3155 429 446 244 1226 1342 629Klapeni 1292 1176 809 3085 2533 2236 344 238 121 394 362 435Minicoy 4579 4398 1141 4578 4290 2072 0 0 0 1877 1895 353Total 18227 16967 11035 22074 18845 20817 4005 3462 2250 8481 8389 3731Note : M.I ( Main land to Island), I.M ( Island to Mainland), I.I (Island to Island)
TABLE - 2 ( Contd)ISLANDWISE PASSENGER TRAFFIC BY SHIPS/FERRY VESSEL DURING 2006-2007
IslandM.I I.M I.I M.I I.M I.I M.I I.M I.I M.I I.M I.I
M.V.Bharat Seema M.V.Tipu Sultan M.V.Dweep Setu M.V.Amindivi
Kavaratti 1708 1582 550 2613 2575 16182 15021 15513 46716Agatti 256 172 226 527 625 2563 2225 4869 9657Amini 393 338 297 819 814 3989 3071 6083 13143Kadmath 469 353 277 549 568 3860 3403 5091 12354Chetlat 43 47 42 314 240 1238 1109 2248 4595Kiltan 104 69 31 454 420 2021 1774 2756 6551Bitra 5 6 4 0 0 167 139 176 482Androth 1011 918 394 989 998 10607 9514 8256 28377Klapeni 224 197 225 477 480 5339 4506 4783 14628Minicoy 1308 1178 218 0 0 12342 11761 3784 27887Total 5521 4860 2264 6742 6720 58308 52523 53559 164390Note : M.I ( Main land to Island), I.M ( Island to Mainland), I.I (Island to Island)
TABLE - 2 ( Contd)ISLANDWISE PASSENGER TRAFFIC BY SHIPS/FERRY VESSEL DURING 2006-2007
IslandM.V.Minicoy K/Beevi H/Bee Total
G.TotalM.I I.M I.I I.I I.I M.I I.M I.I
Kavaratti 7452 6772 3663 2700 2634 3152 465 489 198 3354 3212 582Agatti 935 726 1113 512 516 914 330 250 150 424 311 564Amini 1368 764 1347 677 649 1048 679 522 209 685 523 633Kadmath 822 645 1144 820 731 976 644 582 268 892 722 418Chetlat 441 378 551 177 150 348 641 548 271 75 46 110Kiltan 590 580 727 154 187 392 1398 1081 412 156 54 43Bitra 28 20 71 17 21 20 159 124 72 7 9 7Androth 3655 3430 2197 2690 2311 1409 562 580 214 1372 1590 533Klapeni 1595 1352 980 1635 1469 846 464 297 106 433 321 359Minicoy 5653 5170 1389 2518 2521 1256 0 0 0 2054 1790 319Total 22539 19837 13182 11900 11189 10361 5342 4473 1900 9452 8578 3568Note : M.I ( Main land to Island), I.M ( Island to Mainland), I.I (Island to Island)
TABLE - 2 ( Contd)ISLANDWISE PASSENGER TRAFFIC BY SHIPS/FERRY VESSEL DURING 2007-2008
Island M.V.Bharat Seema M.V.Tipu Sultan M.V.Dweep Setu M.V.AmindiviM.I I.M I.I M.I I.M I.I M.I I.M I.I M.I I.M I.I
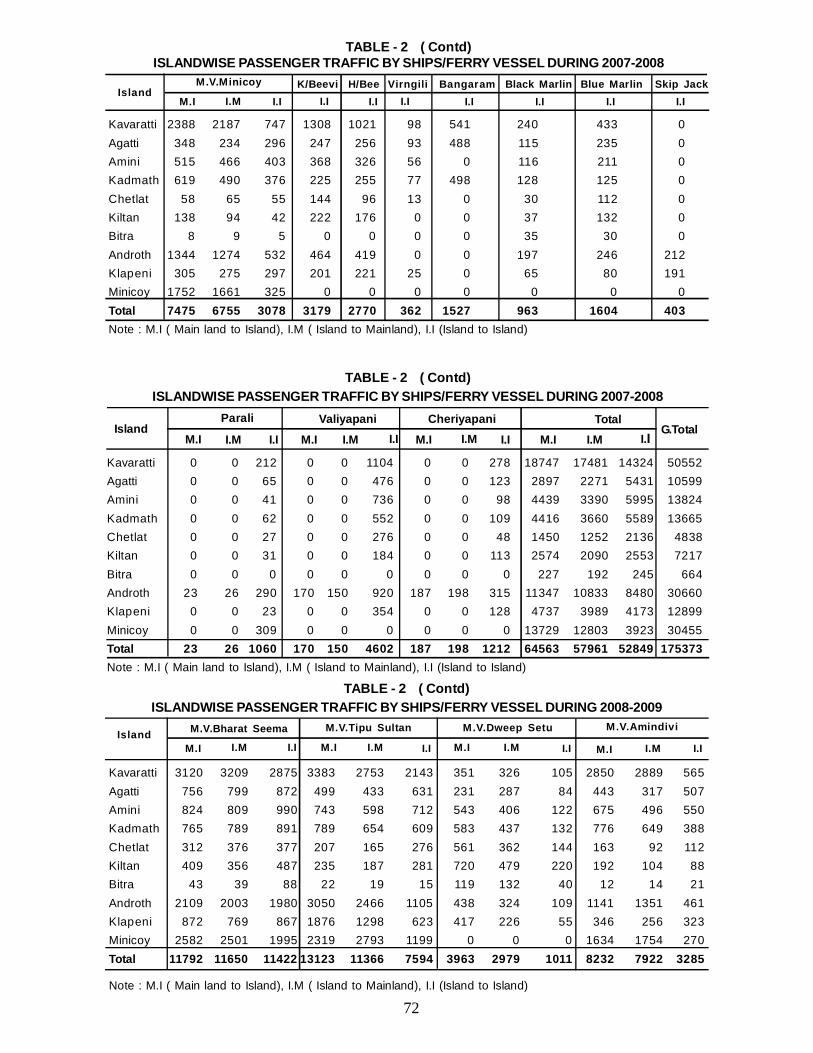
72
Kavaratti 2388 2187 747 1308 1021 98 541 240 433 0Agatti 348 234 296 247 256 93 488 115 235 0Amini 515 466 403 368 326 56 0 116 211 0Kadmath 619 490 376 225 255 77 498 128 125 0Chetlat 58 65 55 144 96 13 0 30 112 0Kiltan 138 94 42 222 176 0 0 37 132 0Bitra 8 9 5 0 0 0 0 35 30 0Androth 1344 1274 532 464 419 0 0 197 246 212Klapeni 305 275 297 201 221 25 0 65 80 191Minicoy 1752 1661 325 0 0 0 0 0 0 0Total 7475 6755 3078 3179 2770 362 1527 963 1604 403Note : M.I ( Main land to Island), I.M ( Island to Mainland), I.I (Island to Island)
TABLE - 2 ( Contd)ISLANDWISE PASSENGER TRAFFIC BY SHIPS/FERRY VESSEL DURING 2007-2008
IslandM.V.Minicoy K/Beevi H/Bee Virngili Bangaram Black Marlin Blue Marlin Skip Jack
M.I I.M I.I I.I I.I I.I I.I I.I I.I I.I
Kavaratti 0 0 212 0 0 1104 0 0 278 18747 17481 14324 50552Agatti 0 0 65 0 0 476 0 0 123 2897 2271 5431 10599Amini 0 0 41 0 0 736 0 0 98 4439 3390 5995 13824Kadmath 0 0 62 0 0 552 0 0 109 4416 3660 5589 13665Chetlat 0 0 27 0 0 276 0 0 48 1450 1252 2136 4838Kiltan 0 0 31 0 0 184 0 0 113 2574 2090 2553 7217Bitra 0 0 0 0 0 0 0 0 0 227 192 245 664Androth 23 26 290 170 150 920 187 198 315 11347 10833 8480 30660Klapeni 0 0 23 0 0 354 0 0 128 4737 3989 4173 12899Minicoy 0 0 309 0 0 0 0 0 0 13729 12803 3923 30455Total 23 26 1060 170 150 4602 187 198 1212 64563 57961 52849 175373Note : M.I ( Main land to Island), I.M ( Island to Mainland), I.I (Island to Island)
TABLE - 2 ( Contd)ISLANDWISE PASSENGER TRAFFIC BY SHIPS/FERRY VESSEL DURING 2007-2008
IslandParali Valiyapani Cheriyapani Total
G.TotalM.I I.M I.I M.I I.M I.I M.I I.M I.I M.I I.M I.I
Kavaratti 3120 3209 2875 3383 2753 2143 351 326 105 2850 2889 565Agatti 756 799 872 499 433 631 231 287 84 443 317 507Amini 824 809 990 743 598 712 543 406 122 675 496 550Kadmath 765 789 891 789 654 609 583 437 132 776 649 388Chetlat 312 376 377 207 165 276 561 362 144 163 92 112Kiltan 409 356 487 235 187 281 720 479 220 192 104 88Bitra 43 39 88 22 19 15 119 132 40 12 14 21Androth 2109 2003 1980 3050 2466 1105 438 324 109 1141 1351 461Klapeni 872 769 867 1876 1298 623 417 226 55 346 256 323Minicoy 2582 2501 1995 2319 2793 1199 0 0 0 1634 1754 270Total 11792 11650 11422 13123 11366 7594 3963 2979 1011 8232 7922 3285
Note : M.I ( Main land to Island), I.M ( Island to Mainland), I.I (Island to Island)
TABLE - 2 ( Contd)ISLANDWISE PASSENGER TRAFFIC BY SHIPS/FERRY VESSEL DURING 2008-2009
Island M.V.Bharat Seema M.V.Tipu Sultan M.V.Dweep Setu M.V.Amindivi
M.I I.M I.I M.I I.M I.I M.I I.M I.I M.I I.M I.I
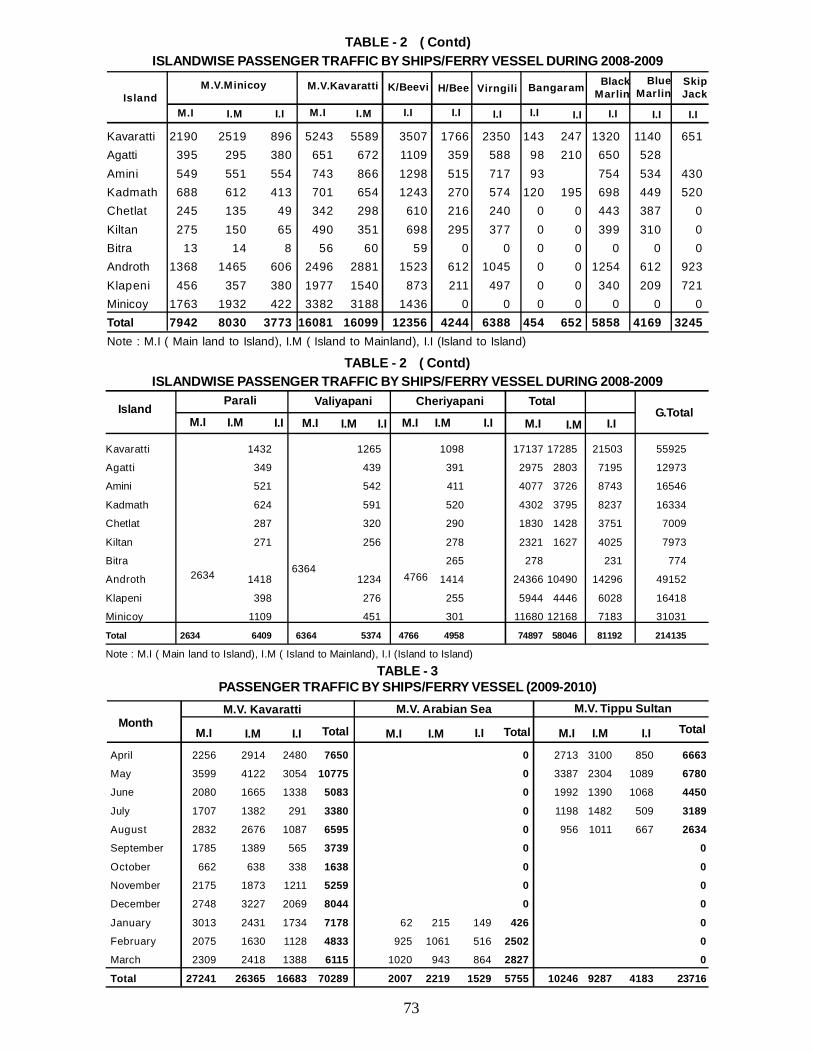
73
Kavaratti 2190 2519 896 5243 5589 3507 1766 2350 143 247 1320 1140 651Agatti 395 295 380 651 672 1109 359 588 98 210 650 528Amini 549 551 554 743 866 1298 515 717 93 754 534 430Kadmath 688 612 413 701 654 1243 270 574 120 195 698 449 520Chetlat 245 135 49 342 298 610 216 240 0 0 443 387 0Kiltan 275 150 65 490 351 698 295 377 0 0 399 310 0Bitra 13 14 8 56 60 59 0 0 0 0 0 0 0Androth 1368 1465 606 2496 2881 1523 612 1045 0 0 1254 612 923Klapeni 456 357 380 1977 1540 873 211 497 0 0 340 209 721Minicoy 1763 1932 422 3382 3188 1436 0 0 0 0 0 0 0Total 7942 8030 3773 16081 16099 12356 4244 6388 454 652 5858 4169 3245Note : M.I ( Main land to Island), I.M ( Island to Mainland), I.I (Island to Island)
TABLE - 2 ( Contd)ISLANDWISE PASSENGER TRAFFIC BY SHIPS/FERRY VESSEL DURING 2008-2009
IslandM.V.Minicoy M.V.Kavaratti K/Beevi H/Bee Virngili Bangaram Black
Marlin
M.I
BlueMarlin
SkipJack
I.M I.I M.I I.M I.I I.I I.I I.I I.I I.I I.I I.I
Kavaratti 1432 1265 1098 17137 17285 21503 55925
Agatti 349 439 391 2975 2803 7195 12973
Amini 521 542 411 4077 3726 8743 16546
Kadmath 624 591 520 4302 3795 8237 16334
Chetlat 287 320 290 1830 1428 3751 7009
Kiltan 271 256 278 2321 1627 4025 7973
Bitra 265 278 231 774
Androth 1418 1234 1414 24366 10490 14296 49152
Klapeni 398 276 255 5944 4446 6028 16418
Minicoy 1109 451 301 11680 12168 7183 31031
Total 2634 6409 6364 5374 4766 4958 74897 58046 81192 214135
Note : M.I ( Main land to Island), I.M ( Island to Mainland), I.I (Island to Island)
TABLE - 2 ( Contd)ISLANDWISE PASSENGER TRAFFIC BY SHIPS/FERRY VESSEL DURING 2008-2009
IslandParali Valiyapani Cheriyapani Total
G.TotalM.I I.M I.I M.I I.M I.I M.I I.M I.I M.I I.M I.I
2634 63644766
April 2256 2914 2480 7650 0 2713 3100 850 6663
May 3599 4122 3054 10775 0 3387 2304 1089 6780
June 2080 1665 1338 5083 0 1992 1390 1068 4450
July 1707 1382 291 3380 0 1198 1482 509 3189
August 2832 2676 1087 6595 0 956 1011 667 2634
September 1785 1389 565 3739 0 0
October 662 638 338 1638 0 0
November 2175 1873 1211 5259 0 0
December 2748 3227 2069 8044 0 0
January 3013 2431 1734 7178 62 215 149 426 0
February 2075 1630 1128 4833 925 1061 516 2502 0
March 2309 2418 1388 6115 1020 943 864 2827 0
Total 27241 26365 16683 70289 2007 2219 1529 5755 10246 9287 4183 23716
TABLE - 3PASSENGER TRAFFIC BY SHIPS/FERRY VESSEL (2009-2010)
Month M.V. Kavaratti M.V. Arabian Sea M.V. Tippu Sultan
M.I I.M I.I TotalM.I I.M I.I Total M.I I.M I.ITotal
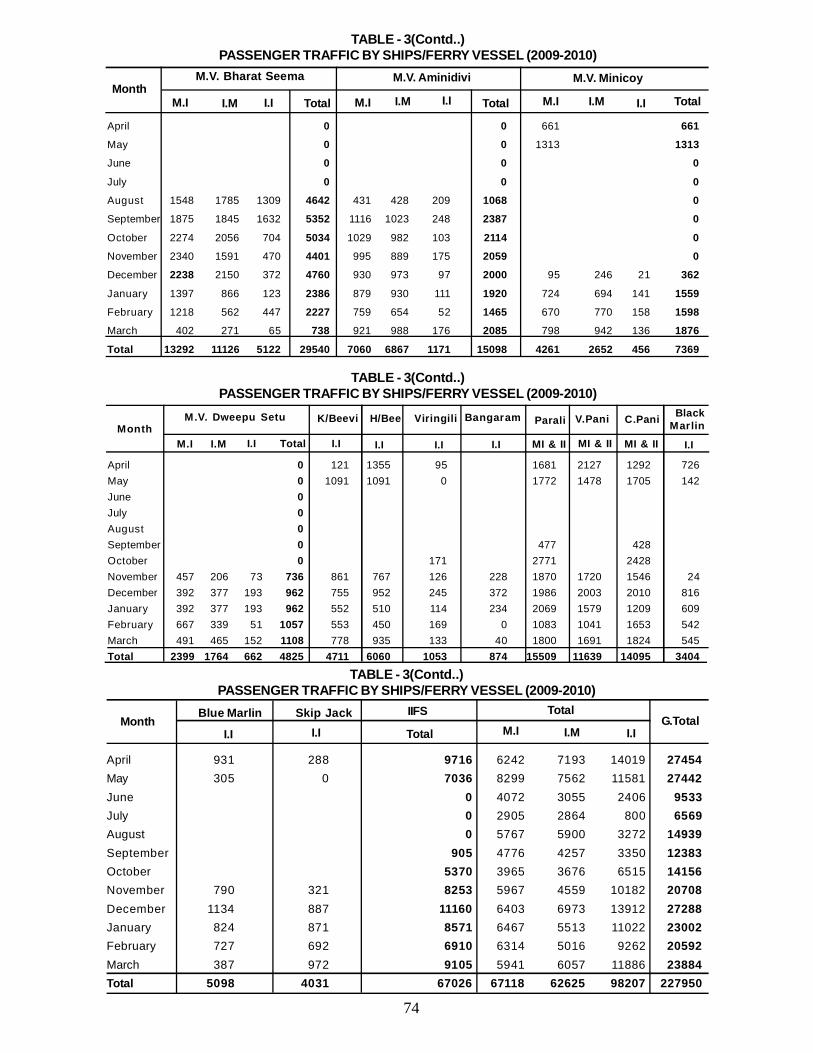
74
April 0 0 661 661
May 0 0 1313 1313
June 0 0 0
July 0 0 0
August 1548 1785 1309 4642 431 428 209 1068 0
September 1875 1845 1632 5352 1116 1023 248 2387 0
October 2274 2056 704 5034 1029 982 103 2114 0
November 2340 1591 470 4401 995 889 175 2059 0
December 2238 2150 372 4760 930 973 97 2000 95 246 21 362
January 1397 866 123 2386 879 930 111 1920 724 694 141 1559
February 1218 562 447 2227 759 654 52 1465 670 770 158 1598
March 402 271 65 738 921 988 176 2085 798 942 136 1876
Total 13292 11126 5122 29540 7060 6867 1171 15098 4261 2652 456 7369
TABLE - 3(Contd..)PASSENGER TRAFFIC BY SHIPS/FERRY VESSEL (2009-2010)
MonthM.V. Bharat Seema M.V. Aminidivi M.V. Minicoy
M.I I.M I.I M.I TotalI.M I.ITotal M.I I.M I.ITotal
TABLE - 3(Contd..)PASSENGER TRAFFIC BY SHIPS/FERRY VESSEL (2009-2010)
MonthM.V. Dweepu Setu K/Beevi H/Bee Viringili Bangaram Parali V.Pani C.Pani Black
MarlinM.I I.M I.I Total I.I I.I I.I I.I MI & II MI & II MI & II I.I
April 0 121 1355 95 1681 2127 1292 726May 0 1091 1091 0 1772 1478 1705 142June 0July 0August 0September 0 477 428October 0 171 2771 2428November 457 206 73 736 861 767 126 228 1870 1720 1546 24December 392 377 193 962 755 952 245 372 1986 2003 2010 816January 392 377 193 962 552 510 114 234 2069 1579 1209 609February 667 339 51 1057 553 450 169 0 1083 1041 1653 542March 491 465 152 1108 778 935 133 40 1800 1691 1824 545Total 2399 1764 662 4825 4711 6060 1053 874 15509 11639 14095 3404
April 931 288 9716 6242 7193 14019 27454May 305 0 7036 8299 7562 11581 27442June 0 4072 3055 2406 9533July 0 2905 2864 800 6569August 0 5767 5900 3272 14939September 905 4776 4257 3350 12383October 5370 3965 3676 6515 14156November 790 321 8253 5967 4559 10182 20708December 1134 887 11160 6403 6973 13912 27288January 824 871 8571 6467 5513 11022 23002February 727 692 6910 6314 5016 9262 20592March 387 972 9105 5941 6057 11886 23884Total 5098 4031 67026 67118 62625 98207 227950
TABLE - 3(Contd..)PASSENGER TRAFFIC BY SHIPS/FERRY VESSEL (2009-2010)
MonthBlue Marlin Skip Jack IIFS Total
G.TotalI.I I.I Total M.I I.M I.I
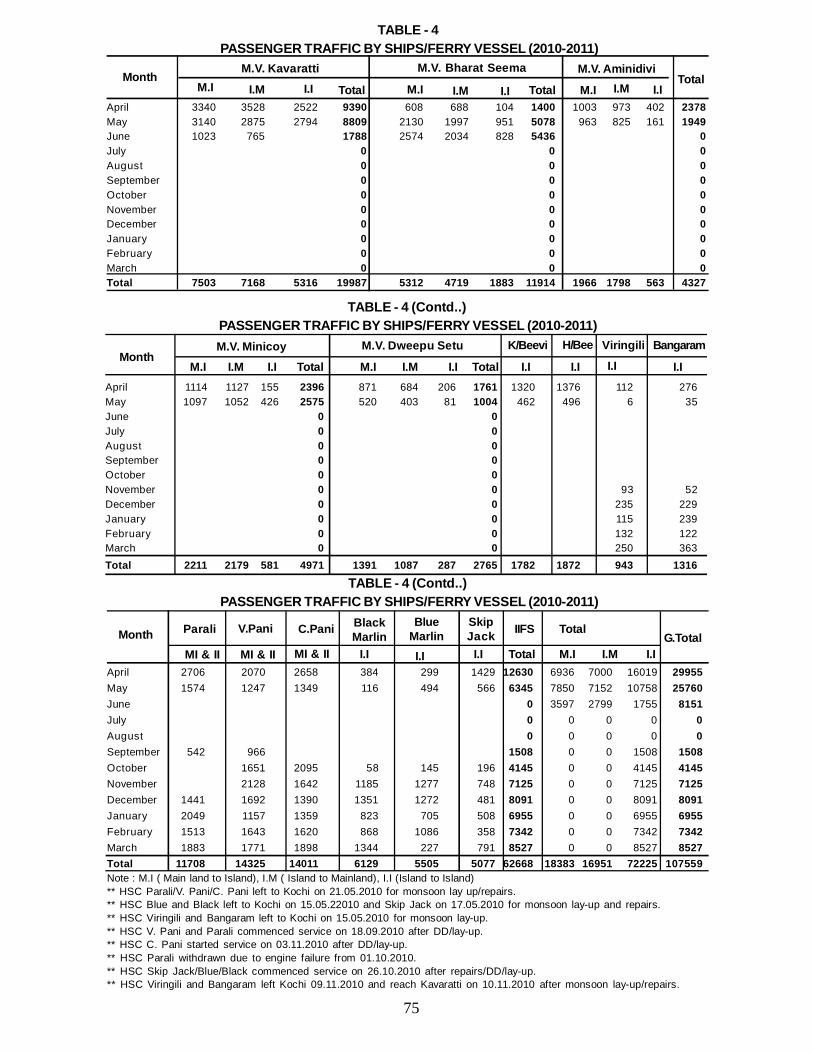
75
April 1114 1127 155 2396 871 684 206 1761 1320 1376 112 276May 1097 1052 426 2575 520 403 81 1004 462 496 6 35June 0 0July 0 0August 0 0September 0 0October 0 0November 0 0 93 52December 0 0 235 229January 0 0 115 239February 0 0 132 122March 0 0 250 363Total 2211 2179 581 4971 1391 1087 287 2765 1782 1872 943 1316
TABLE - 4 (Contd..) PASSENGER TRAFFIC BY SHIPS/FERRY VESSEL (2010-2011)
MonthM.V. Minicoy M.V. Dweepu Setu K/Beevi H/Bee Viringili Bangaram
M.I I.M I.I Total M.I I.M I.I Total I.I I.I I.I I.I
April 3340 3528 2522 9390 608 688 104 1400 1003 973 402 2378May 3140 2875 2794 8809 2130 1997 951 5078 963 825 161 1949June 1023 765 1788 2574 2034 828 5436 0July 0 0 0August 0 0 0September 0 0 0October 0 0 0November 0 0 0December 0 0 0January 0 0 0February 0 0 0March 0 0 0Total 7503 7168 5316 19987 5312 4719 1883 11914 1966 1798 563 4327
TABLE - 4 PASSENGER TRAFFIC BY SHIPS/FERRY VESSEL (2010-2011)
MonthM.V. Kavaratti M.V. Bharat Seema M.V. Aminidivi
M.I I.M I.I Total M.I I.M I.I Total M.I I.M I.ITotal
April 2706 2070 2658 384 299 1429 12630 6936 7000 16019 29955May 1574 1247 1349 116 494 566 6345 7850 7152 10758 25760June 0 3597 2799 1755 8151July 0 0 0 0 0August 0 0 0 0 0September 542 966 1508 0 0 1508 1508October 1651 2095 58 145 196 4145 0 0 4145 4145November 2128 1642 1185 1277 748 7125 0 0 7125 7125December 1441 1692 1390 1351 1272 481 8091 0 0 8091 8091January 2049 1157 1359 823 705 508 6955 0 0 6955 6955February 1513 1643 1620 868 1086 358 7342 0 0 7342 7342March 1883 1771 1898 1344 227 791 8527 0 0 8527 8527Total 11708 14325 14011 6129 5505 5077 62668 18383 16951 72225 107559Note : M.I ( Main land to Island), I.M ( Island to Mainland), I.I (Island to Island)** HSC Parali/V. Pani/C. Pani left to Kochi on 21.05.2010 for monsoon lay up/repairs.** HSC Blue and Black left to Kochi on 15.05.22010 and Skip Jack on 17.05.2010 for monsoon lay-up and repairs.** HSC Viringili and Bangaram left to Kochi on 15.05.2010 for monsoon lay-up.** HSC V. Pani and Parali commenced service on 18.09.2010 after DD/lay-up.** HSC C. Pani started service on 03.11.2010 after DD/lay-up.** HSC Parali withdrawn due to engine failure from 01.10.2010.** HSC Skip Jack/Blue/Black commenced service on 26.10.2010 after repairs/DD/lay-up.** HSC Viringili and Bangaram left Kochi 09.11.2010 and reach Kavaratti on 10.11.2010 after monsoon lay-up/repairs.
TABLE - 4 (Contd..) PASSENGER TRAFFIC BY SHIPS/FERRY VESSEL (2010-2011)
Month Parali V.Pani C.Pani BlackMarlin
BlueMarlin
SkipJack IIFS Total
G.TotalMI & II MI & II MI & II I.I I.I I.I Total M.I I.M I.I
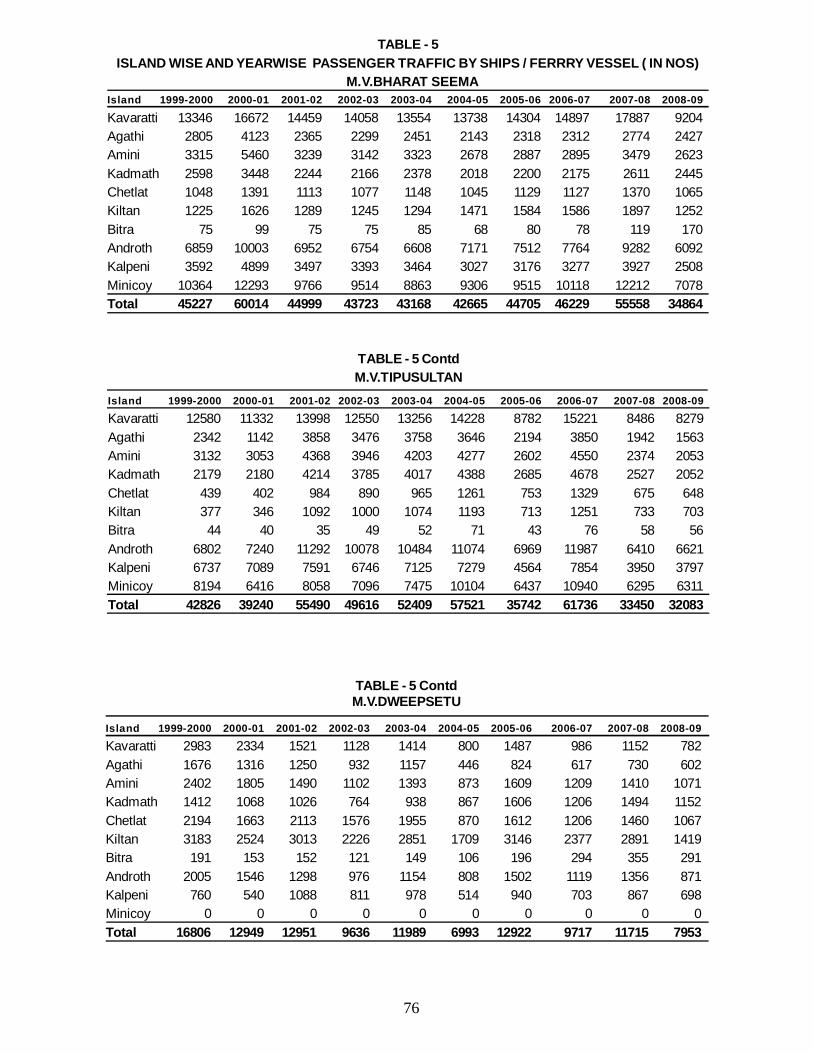
76
Island 1999-2000 2000-01 2001-02 2002-03 2003-04 2004-05 2005-06 2006-07 2007-08 2008-09
Kavaratti 13346 16672 14459 14058 13554 13738 14304 14897 17887 9204Agathi 2805 4123 2365 2299 2451 2143 2318 2312 2774 2427Amini 3315 5460 3239 3142 3323 2678 2887 2895 3479 2623Kadmath 2598 3448 2244 2166 2378 2018 2200 2175 2611 2445Chetlat 1048 1391 1113 1077 1148 1045 1129 1127 1370 1065Kiltan 1225 1626 1289 1245 1294 1471 1584 1586 1897 1252Bitra 75 99 75 75 85 68 80 78 119 170Androth 6859 10003 6952 6754 6608 7171 7512 7764 9282 6092Kalpeni 3592 4899 3497 3393 3464 3027 3176 3277 3927 2508Minicoy 10364 12293 9766 9514 8863 9306 9515 10118 12212 7078Total 45227 60014 44999 43723 43168 42665 44705 46229 55558 34864
TABLE - 5ISLAND WISE AND YEARWISE PASSENGER TRAFFIC BY SHIPS / FERRRY VESSEL ( IN NOS)
M.V.BHARAT SEEMA
TABLE - 5 ContdM.V.TIPUSULTAN
Island 1999-2000 2000-01 2001-02 2002-03 2003-04 2004-05 2005-06 2006-07 2007-08 2008-09
Kavaratti 12580 11332 13998 12550 13256 14228 8782 15221 8486 8279Agathi 2342 1142 3858 3476 3758 3646 2194 3850 1942 1563Amini 3132 3053 4368 3946 4203 4277 2602 4550 2374 2053Kadmath 2179 2180 4214 3785 4017 4388 2685 4678 2527 2052Chetlat 439 402 984 890 965 1261 753 1329 675 648Kiltan 377 346 1092 1000 1074 1193 713 1251 733 703Bitra 44 40 35 49 52 71 43 76 58 56Androth 6802 7240 11292 10078 10484 11074 6969 11987 6410 6621Kalpeni 6737 7089 7591 6746 7125 7279 4564 7854 3950 3797Minicoy 8194 6416 8058 7096 7475 10104 6437 10940 6295 6311Total 42826 39240 55490 49616 52409 57521 35742 61736 33450 32083
TABLE - 5 ContdM.V.DWEEPSETU
Island 1999-2000 2000-01 2001-02 2002-03 2003-04 2004-05 2005-06 2006-07 2007-08 2008-09
Kavaratti 2983 2334 1521 1128 1414 800 1487 986 1152 782Agathi 1676 1316 1250 932 1157 446 824 617 730 602Amini 2402 1805 1490 1102 1393 873 1609 1209 1410 1071Kadmath 1412 1068 1026 764 938 867 1606 1206 1494 1152Chetlat 2194 1663 2113 1576 1955 870 1612 1206 1460 1067Kiltan 3183 2524 3013 2226 2851 1709 3146 2377 2891 1419Bitra 191 153 152 121 149 106 196 294 355 291Androth 2005 1546 1298 976 1154 808 1502 1119 1356 871Kalpeni 760 540 1088 811 978 514 940 703 867 698Minicoy 0 0 0 0 0 0 0 0 0 0Total 16806 12949 12951 9636 11989 6993 12922 9717 11715 7953
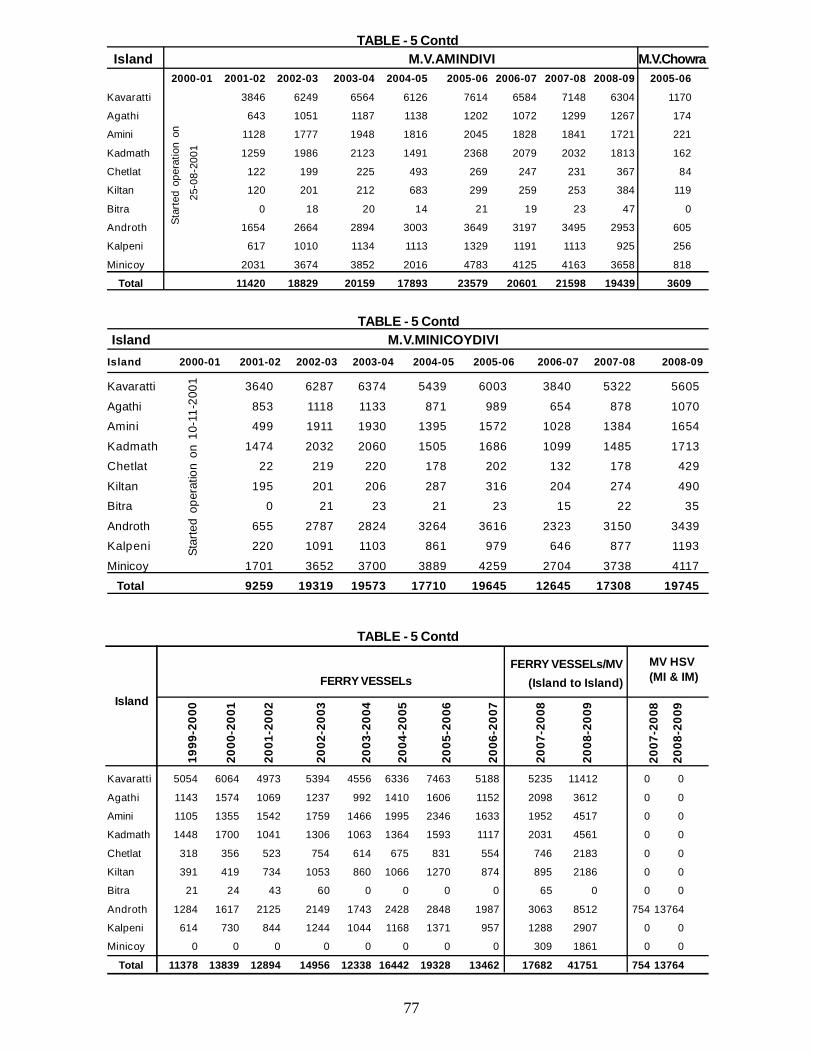
77
Island 2000-01 2001-02 2002-03 2003-04 2004-05 2005-06 2006-07 2007-08 2008-09
TABLE - 5 Contd Island M.V.AMINDIVI M.V.Chowra
2000-01 2001-02 2002-03 2003-04 2004-05 2005-06 2006-07 2007-08 2008-09 2005-06
Kavaratti 3846 6249 6564 6126 7614 6584 7148 6304 1170
Agathi 643 1051 1187 1138 1202 1072 1299 1267 174
Amini 1128 1777 1948 1816 2045 1828 1841 1721 221
Kadmath 1259 1986 2123 1491 2368 2079 2032 1813 162
Chetlat 122 199 225 493 269 247 231 367 84
Kiltan 120 201 212 683 299 259 253 384 119
Bitra 0 18 20 14 21 19 23 47 0
Androth 1654 2664 2894 3003 3649 3197 3495 2953 605
Kalpeni 617 1010 1134 1113 1329 1191 1113 925 256
Minicoy 2031 3674 3852 2016 4783 4125 4163 3658 818
Total 11420 18829 20159 17893 23579 20601 21598 19439 3609
Star
ted
oper
atio
n on
25-
08-2
001
Kavaratti 3640 6287 6374 5439 6003 3840 5322 5605
Agathi 853 1118 1133 871 989 654 878 1070
Amini 499 1911 1930 1395 1572 1028 1384 1654
Kadmath 1474 2032 2060 1505 1686 1099 1485 1713
Chetlat 22 219 220 178 202 132 178 429
Kiltan 195 201 206 287 316 204 274 490
Bitra 0 21 23 21 23 15 22 35
Androth 655 2787 2824 3264 3616 2323 3150 3439
Kalpeni 220 1091 1103 861 979 646 877 1193
Minicoy 1701 3652 3700 3889 4259 2704 3738 4117
Total 9259 19319 19573 17710 19645 12645 17308 19745
TABLE - 5 Contd Island M.V.MINICOYDIVI
Star
ted
oper
atio
n on
10-
11-2
001
Kavaratti 5054 6064 4973 5394 4556 6336 7463 5188 5235 11412 0 0
Agathi 1143 1574 1069 1237 992 1410 1606 1152 2098 3612 0 0
Amini 1105 1355 1542 1759 1466 1995 2346 1633 1952 4517 0 0
Kadmath 1448 1700 1041 1306 1063 1364 1593 1117 2031 4561 0 0
Chetlat 318 356 523 754 614 675 831 554 746 2183 0 0
Kiltan 391 419 734 1053 860 1066 1270 874 895 2186 0 0
Bitra 21 24 43 60 0 0 0 0 65 0 0 0
Androth 1284 1617 2125 2149 1743 2428 2848 1987 3063 8512 754 13764
Kalpeni 614 730 844 1244 1044 1168 1371 957 1288 2907 0 0
Minicoy 0 0 0 0 0 0 0 0 309 1861 0 0
Total 11378 13839 12894 14956 12338 16442 19328 13462 17682 41751 754 13764
TABLE - 5 Contd
Island
1999
-200
0
2000
-200
1
2001
-200
2
2002
-200
3
2003
-200
4
2004
-200
5
2005
-200
6
2006
-200
7
2007
-200
8
2008
-200
9
2007
-200
8
2008
-200
9FERRY VESSELs
FERRY VESSELs/MV (Island to Island)
MV HSV (MI & IM)
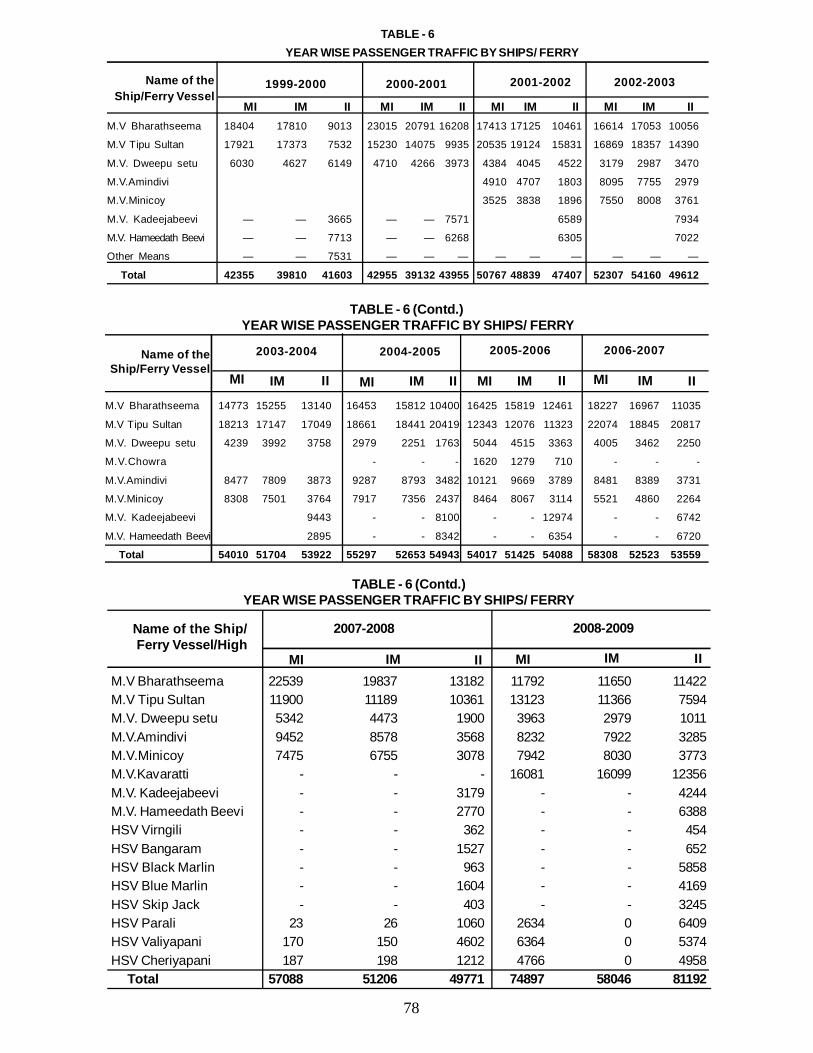
78
M.V Bharathseema 18404 17810 9013 23015 20791 16208 17413 17125 10461 16614 17053 10056
M.V Tipu Sultan 17921 17373 7532 15230 14075 9935 20535 19124 15831 16869 18357 14390
M.V. Dweepu setu 6030 4627 6149 4710 4266 3973 4384 4045 4522 3179 2987 3470
M.V.Amindivi 4910 4707 1803 8095 7755 2979
M.V.Minicoy 3525 3838 1896 7550 8008 3761
M.V. Kadeejabeevi — — 3665 — — 7571 6589 7934
M.V. Hameedath Beevi — — 7713 — — 6268 6305 7022
Other Means — — 7531 — — — — — — — — —
Total 42355 39810 41603 42955 39132 43955 50767 48839 47407 52307 54160 49612
Name of theShip/Ferry Vessel
1999-2000
MI
TABLE - 6 YEAR WISE PASSENGER TRAFFIC BY SHIPS/ FERRY
2000-2001 2001-2002 2002-2003
IM II MI IM II MI IM II MI IM II
M.V Bharathseema 14773 15255 13140 16453 15812 10400 16425 15819 12461 18227 16967 11035
M.V Tipu Sultan 18213 17147 17049 18661 18441 20419 12343 12076 11323 22074 18845 20817
M.V. Dweepu setu 4239 3992 3758 2979 2251 1763 5044 4515 3363 4005 3462 2250
M.V.Chowra - - - 1620 1279 710 - - -
M.V.Amindivi 8477 7809 3873 9287 8793 3482 10121 9669 3789 8481 8389 3731
M.V.Minicoy 8308 7501 3764 7917 7356 2437 8464 8067 3114 5521 4860 2264
M.V. Kadeejabeevi 9443 - - 8100 - - 12974 - - 6742
M.V. Hameedath Beevi 2895 - - 8342 - - 6354 - - 6720
Total 54010 51704 53922 55297 52653 54943 54017 51425 54088 58308 52523 53559
TABLE - 6 (Contd.) YEAR WISE PASSENGER TRAFFIC BY SHIPS/ FERRY
Name of theShip/Ferry Vessel
2003-2004 2004-2005 2005-2006 2006-2007
MI IM II MI IM II MI IM II MI IM II
M.V Bharathseema 22539 19837 13182 11792 11650 11422M.V Tipu Sultan 11900 11189 10361 13123 11366 7594M.V. Dweepu setu 5342 4473 1900 3963 2979 1011M.V.Amindivi 9452 8578 3568 8232 7922 3285M.V.Minicoy 7475 6755 3078 7942 8030 3773M.V.Kavaratti - - - 16081 16099 12356M.V. Kadeejabeevi - - 3179 - - 4244M.V. Hameedath Beevi - - 2770 - - 6388HSV Virngili - - 362 - - 454HSV Bangaram - - 1527 - - 652HSV Black Marlin - - 963 - - 5858HSV Blue Marlin - - 1604 - - 4169HSV Skip Jack - - 403 - - 3245HSV Parali 23 26 1060 2634 0 6409HSV Valiyapani 170 150 4602 6364 0 5374HSV Cheriyapani 187 198 1212 4766 0 4958 Total 57088 51206 49771 74897 58046 81192
TABLE - 6 (Contd.)YEAR WISE PASSENGER TRAFFIC BY SHIPS/ FERRY
Name of the Ship/Ferry Vessel/High
2007-2008 2008-2009
MI IM II MI IM II
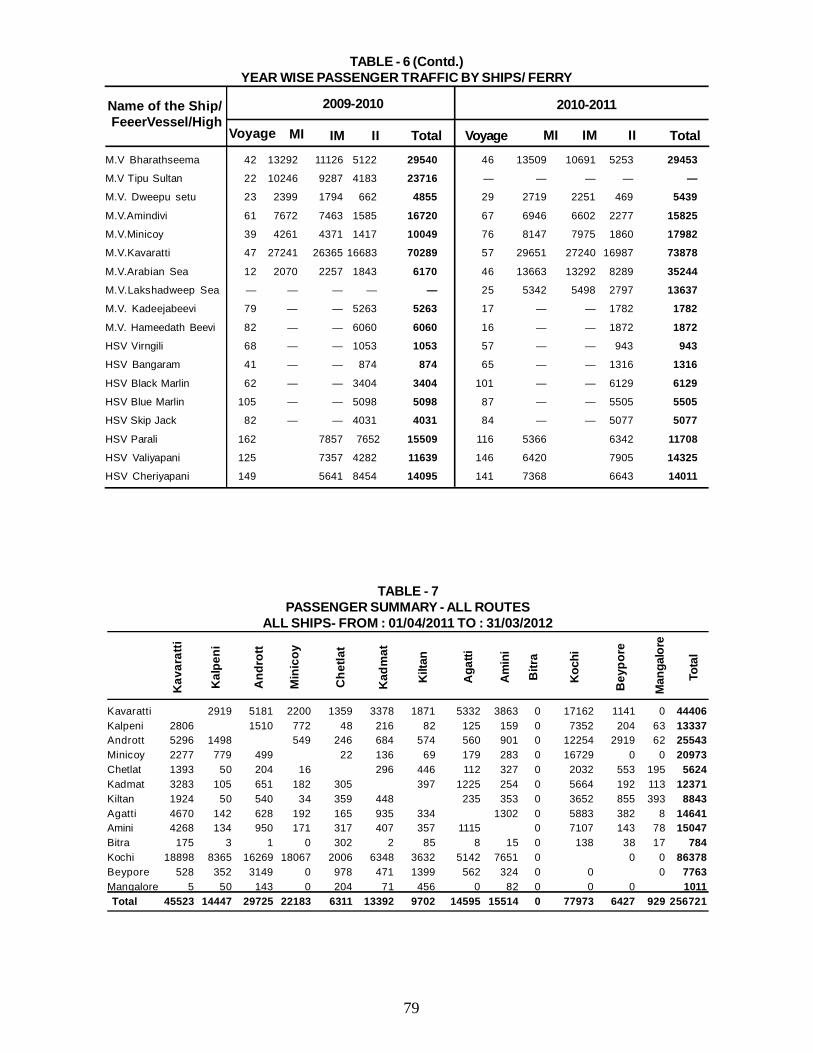
79
M.V Bharathseema 42 13292 11126 5122 29540 46 13509 10691 5253 29453
M.V Tipu Sultan 22 10246 9287 4183 23716 — — — — —
M.V. Dweepu setu 23 2399 1794 662 4855 29 2719 2251 469 5439
M.V.Amindivi 61 7672 7463 1585 16720 67 6946 6602 2277 15825
M.V.Minicoy 39 4261 4371 1417 10049 76 8147 7975 1860 17982
M.V.Kavaratti 47 27241 26365 16683 70289 57 29651 27240 16987 73878
M.V.Arabian Sea 12 2070 2257 1843 6170 46 13663 13292 8289 35244
M.V.Lakshadweep Sea — — — — — 25 5342 5498 2797 13637
M.V. Kadeejabeevi 79 — — 5263 5263 17 — — 1782 1782
M.V. Hameedath Beevi 82 — — 6060 6060 16 — — 1872 1872
HSV Virngili 68 — — 1053 1053 57 — — 943 943
HSV Bangaram 41 — — 874 874 65 — — 1316 1316
HSV Black Marlin 62 — — 3404 3404 101 — — 6129 6129
HSV Blue Marlin 105 — — 5098 5098 87 — — 5505 5505
HSV Skip Jack 82 — — 4031 4031 84 — — 5077 5077
HSV Parali 162 7857 7652 15509 116 5366 6342 11708
HSV Valiyapani 125 7357 4282 11639 146 6420 7905 14325
HSV Cheriyapani 149 5641 8454 14095 141 7368 6643 14011
TABLE - 6 (Contd.)YEAR WISE PASSENGER TRAFFIC BY SHIPS/ FERRY
Name of the Ship/FeeerVessel/High
2009-2010 2010-2011
Voyage MI IM II Total Voyage MI IM II Total
Kavaratti 2919 5181 2200 1359 3378 1871 5332 3863 0 17162 1141 0 44406Kalpeni 2806 1510 772 48 216 82 125 159 0 7352 204 63 13337Andrott 5296 1498 549 246 684 574 560 901 0 12254 2919 62 25543Minicoy 2277 779 499 22 136 69 179 283 0 16729 0 0 20973Chetlat 1393 50 204 16 296 446 112 327 0 2032 553 195 5624Kadmat 3283 105 651 182 305 397 1225 254 0 5664 192 113 12371Kiltan 1924 50 540 34 359 448 235 353 0 3652 855 393 8843Agatti 4670 142 628 192 165 935 334 1302 0 5883 382 8 14641Amini 4268 134 950 171 317 407 357 1115 0 7107 143 78 15047Bitra 175 3 1 0 302 2 85 8 15 0 138 38 17 784Kochi 18898 8365 16269 18067 2006 6348 3632 5142 7651 0 0 0 86378Beypore 528 352 3149 0 978 471 1399 562 324 0 0 0 7763Mangalore 5 50 143 0 204 71 456 0 82 0 0 0 1011 Total 45523 14447 29725 22183 6311 13392 9702 14595 15514 0 77973 6427 929 256721
TABLE - 7PASSENGER SUMMARY - ALL ROUTES
ALL SHIPS- FROM : 01/04/2011 TO : 31/03/2012
Kav
arat
ti
Kal
peni
And
rott
Min
icoy
Che
tlat
Kad
mat
Kilt
an
Aga
tti
Am
ini
Bitr
a
Koc
hi
Bey
pore
Man
galo
re
Tota
l
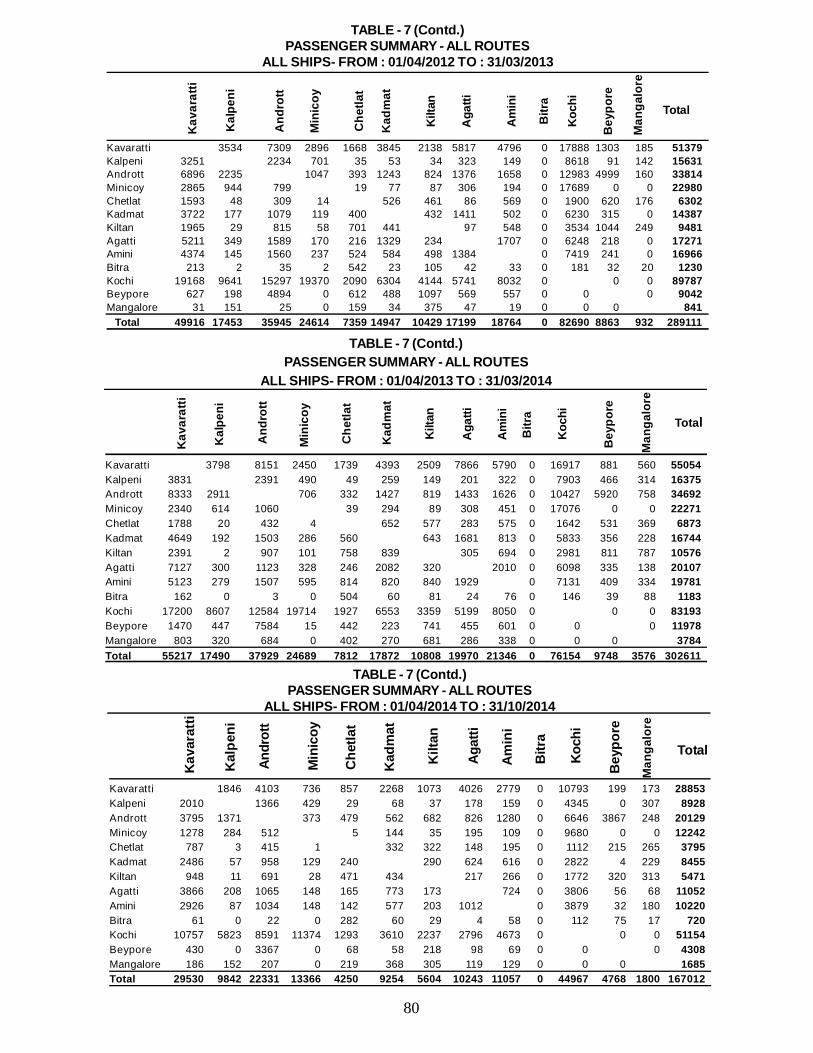
80
Kavaratti 3798 8151 2450 1739 4393 2509 7866 5790 0 16917 881 560 55054Kalpeni 3831 2391 490 49 259 149 201 322 0 7903 466 314 16375Andrott 8333 2911 706 332 1427 819 1433 1626 0 10427 5920 758 34692Minicoy 2340 614 1060 39 294 89 308 451 0 17076 0 0 22271Chetlat 1788 20 432 4 652 577 283 575 0 1642 531 369 6873Kadmat 4649 192 1503 286 560 643 1681 813 0 5833 356 228 16744Kiltan 2391 2 907 101 758 839 305 694 0 2981 811 787 10576Agatti 7127 300 1123 328 246 2082 320 2010 0 6098 335 138 20107Amini 5123 279 1507 595 814 820 840 1929 0 7131 409 334 19781Bitra 162 0 3 0 504 60 81 24 76 0 146 39 88 1183Kochi 17200 8607 12584 19714 1927 6553 3359 5199 8050 0 0 0 83193Beypore 1470 447 7584 15 442 223 741 455 601 0 0 0 11978Mangalore 803 320 684 0 402 270 681 286 338 0 0 0 3784Total 55217 17490 37929 24689 7812 17872 10808 19970 21346 0 76154 9748 3576 302611
TABLE - 7 (Contd.)PASSENGER SUMMARY - ALL ROUTES
ALL SHIPS- FROM : 01/04/2013 TO : 31/03/2014
Kav
arat
ti
Kal
peni
And
rott
Min
icoy
Che
tlat
Kad
mat
Kilt
an
Aga
tti
Am
ini
Koc
hi
Bey
pore
Bitr
a
Man
galo
re
Total
Kavaratti 3534 7309 2896 1668 3845 2138 5817 4796 0 17888 1303 185 51379Kalpeni 3251 2234 701 35 53 34 323 149 0 8618 91 142 15631Andrott 6896 2235 1047 393 1243 824 1376 1658 0 12983 4999 160 33814Minicoy 2865 944 799 19 77 87 306 194 0 17689 0 0 22980Chetlat 1593 48 309 14 526 461 86 569 0 1900 620 176 6302Kadmat 3722 177 1079 119 400 432 1411 502 0 6230 315 0 14387Kiltan 1965 29 815 58 701 441 97 548 0 3534 1044 249 9481Agatti 5211 349 1589 170 216 1329 234 1707 0 6248 218 0 17271Amini 4374 145 1560 237 524 584 498 1384 0 7419 241 0 16966Bitra 213 2 35 2 542 23 105 42 33 0 181 32 20 1230Kochi 19168 9641 15297 19370 2090 6304 4144 5741 8032 0 0 0 89787Beypore 627 198 4894 0 612 488 1097 569 557 0 0 0 9042Mangalore 31 151 25 0 159 34 375 47 19 0 0 0 841 Total 49916 17453 35945 24614 7359 14947 10429 17199 18764 0 82690 8863 932 289111
TABLE - 7 (Contd.)PASSENGER SUMMARY - ALL ROUTES
ALL SHIPS- FROM : 01/04/2012 TO : 31/03/2013
Kav
arat
ti
Kal
peni
And
rott
Min
icoy
Che
tlat
Kad
mat
Kilt
an
Aga
tti
Am
ini
Bitr
a
Koc
hi
Bey
pore
Man
galo
re
Total
Kavaratti 1846 4103 736 857 2268 1073 4026 2779 0 10793 199 173 28853Kalpeni 2010 1366 429 29 68 37 178 159 0 4345 0 307 8928Andrott 3795 1371 373 479 562 682 826 1280 0 6646 3867 248 20129Minicoy 1278 284 512 5 144 35 195 109 0 9680 0 0 12242Chetlat 787 3 415 1 332 322 148 195 0 1112 215 265 3795Kadmat 2486 57 958 129 240 290 624 616 0 2822 4 229 8455Kiltan 948 11 691 28 471 434 217 266 0 1772 320 313 5471Agatti 3866 208 1065 148 165 773 173 724 0 3806 56 68 11052Amini 2926 87 1034 148 142 577 203 1012 0 3879 32 180 10220Bitra 61 0 22 0 282 60 29 4 58 0 112 75 17 720Kochi 10757 5823 8591 11374 1293 3610 2237 2796 4673 0 0 0 51154Beypore 430 0 3367 0 68 58 218 98 69 0 0 0 4308Mangalore 186 152 207 0 219 368 305 119 129 0 0 0 1685Total 29530 9842 22331 13366 4250 9254 5604 10243 11057 0 44967 4768 1800 167012
TABLE - 7 (Contd.)PASSENGER SUMMARY - ALL ROUTES
ALL SHIPS- FROM : 01/04/2014 TO : 31/10/2014
Kav
arat
ti
Kal
peni
Andr
ott
Min
icoy
Che
tlat
Kad
mat
Kilt
an
Agat
ti
Amin
i
Bitr
a
Koch
i
Bey
pore
Man
galo
re
Total
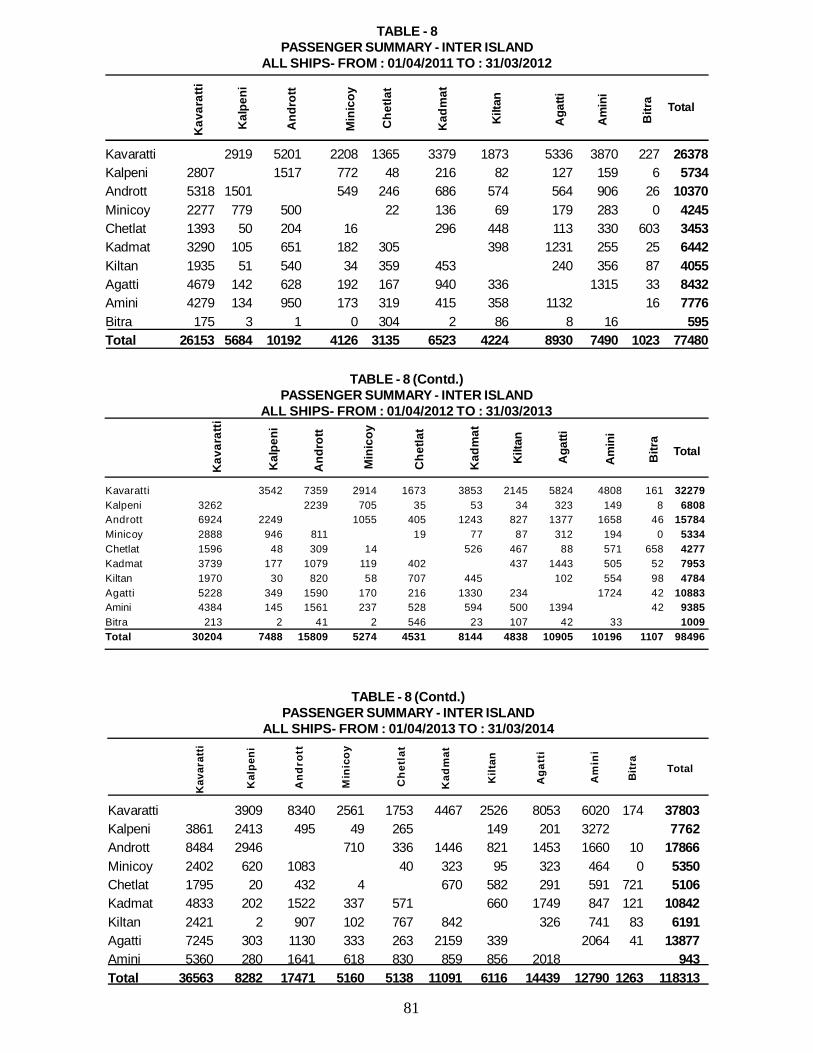
81
Kavaratti 2919 5201 2208 1365 3379 1873 5336 3870 227 26378Kalpeni 2807 1517 772 48 216 82 127 159 6 5734Andrott 5318 1501 549 246 686 574 564 906 26 10370Minicoy 2277 779 500 22 136 69 179 283 0 4245Chetlat 1393 50 204 16 296 448 113 330 603 3453Kadmat 3290 105 651 182 305 398 1231 255 25 6442Kiltan 1935 51 540 34 359 453 240 356 87 4055Agatti 4679 142 628 192 167 940 336 1315 33 8432Amini 4279 134 950 173 319 415 358 1132 16 7776Bitra 175 3 1 0 304 2 86 8 16 595Total 26153 5684 10192 4126 3135 6523 4224 8930 7490 1023 77480
TABLE - 8PASSENGER SUMMARY - INTER ISLAND
ALL SHIPS- FROM : 01/04/2011 TO : 31/03/2012
Kav
arat
ti
Kal
peni
And
rott
Min
icoy
Che
tlat
Kad
mat
Kilt
an
Aga
tti
Am
ini
Bitr
a Total
Kavaratti 3542 7359 2914 1673 3853 2145 5824 4808 161 32279Kalpeni 3262 2239 705 35 53 34 323 149 8 6808Andrott 6924 2249 1055 405 1243 827 1377 1658 46 15784Minicoy 2888 946 811 19 77 87 312 194 0 5334Chetlat 1596 48 309 14 526 467 88 571 658 4277Kadmat 3739 177 1079 119 402 437 1443 505 52 7953Kiltan 1970 30 820 58 707 445 102 554 98 4784Agatti 5228 349 1590 170 216 1330 234 1724 42 10883Amini 4384 145 1561 237 528 594 500 1394 42 9385Bitra 213 2 41 2 546 23 107 42 33 1009Total 30204 7488 15809 5274 4531 8144 4838 10905 10196 1107 98496
TABLE - 8 (Contd.)PASSENGER SUMMARY - INTER ISLAND
ALL SHIPS- FROM : 01/04/2012 TO : 31/03/2013
Kav
arat
ti
Kal
peni
And
rott
Min
icoy
Che
tlat
Kad
mat
Kilt
an
Aga
tti
Am
ini
Bitr
a
Total
Kavaratti 3909 8340 2561 1753 4467 2526 8053 6020 174 37803Kalpeni 3861 2413 495 49 265 149 201 3272 7762Andrott 8484 2946 710 336 1446 821 1453 1660 10 17866Minicoy 2402 620 1083 40 323 95 323 464 0 5350Chetlat 1795 20 432 4 670 582 291 591 721 5106Kadmat 4833 202 1522 337 571 660 1749 847 121 10842Kiltan 2421 2 907 102 767 842 326 741 83 6191Agatti 7245 303 1130 333 263 2159 339 2064 41 13877Amini 5360 280 1641 618 830 859 856 2018 943Total 36563 8282 17471 5160 5138 11091 6116 14439 12790 1263 118313
TABLE - 8 (Contd.)PASSENGER SUMMARY - INTER ISLAND
ALL SHIPS- FROM : 01/04/2013 TO : 31/03/2014
Kav
arat
ti
Kal
peni
And
rott
Min
icoy
Che
tlat
Kad
mat
Kilt
an
Aga
tti
Am
ini
Bitr
a
Total
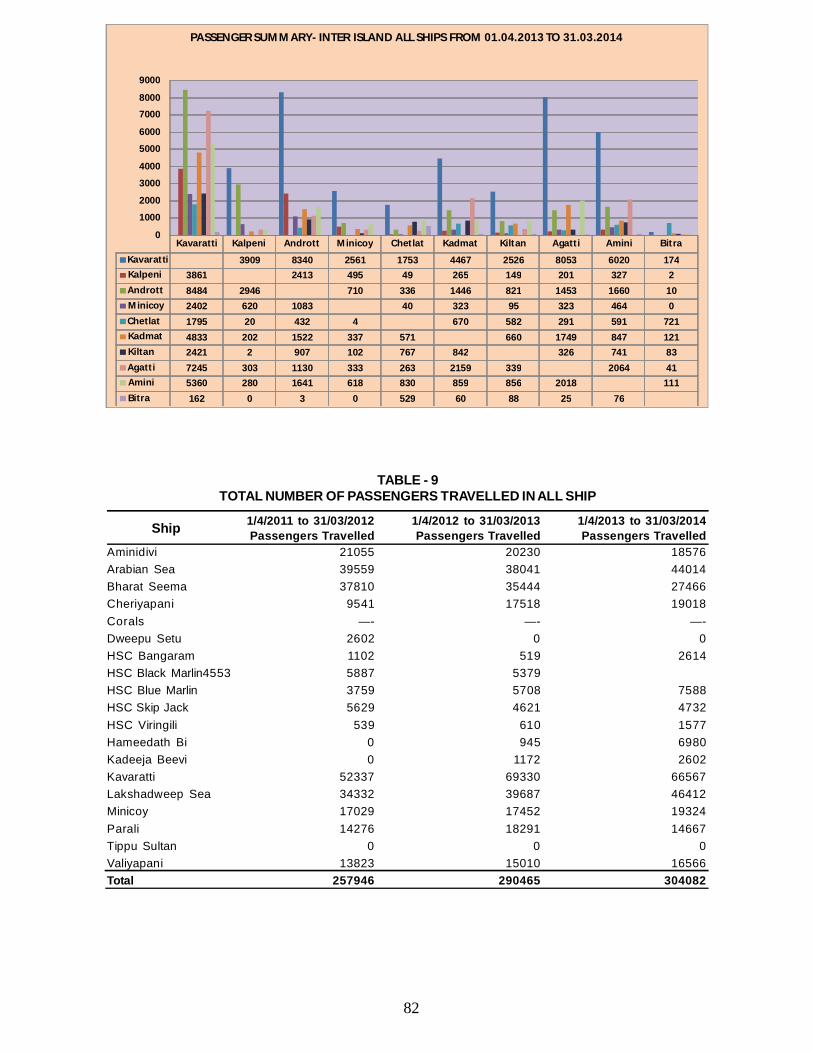
82
1/4/2011 to 31/03/2012 1/4/2012 to 31/03/2013 1/4/2013 to 31/03/2014Passengers Travelled Passengers Travelled Passengers Travelled
Aminidivi 21055 20230 18576Arabian Sea 39559 38041 44014Bharat Seema 37810 35444 27466Cheriyapani 9541 17518 19018Corals —- —- —-Dweepu Setu 2602 0 0HSC Bangaram 1102 519 2614HSC Black Marlin4553 5887 5379HSC Blue Marlin 3759 5708 7588HSC Skip Jack 5629 4621 4732HSC Viringili 539 610 1577Hameedath Bi 0 945 6980Kadeeja Beevi 0 1172 2602Kavaratti 52337 69330 66567Lakshadweep Sea 34332 39687 46412Minicoy 17029 17452 19324Parali 14276 18291 14667Tippu Sultan 0 0 0Valiyapani 13823 15010 16566Total 257946 290465 304082
TABLE - 9TOTAL NUMBER OF PASSENGERS TRAVELLED IN ALL SHIP
Ship
Kavaratti Kalpeni Andrott Minicoy Chetlat Kadmat Kiltan Agatti Amini Bitra
Kavaratti 3909 8340 2561 1753 4467 2526 8053 6020 174Kalpeni 3861 2413 495 49 265 149 201 327 2Andrott 8484 2946 710 336 1446 821 1453 1660 10Minicoy 2402 620 1083 40 323 95 323 464 0Chetlat 1795 20 432 4 670 582 291 591 721Kadmat 4833 202 1522 337 571 660 1749 847 121Kiltan 2421 2 907 102 767 842 326 741 83Agatti 7245 303 1130 333 263 2159 339 2064 41Amini 5360 280 1641 618 830 859 856 2018 111Bitra 162 0 3 0 529 60 88 25 76
0
1000
2000
3000
4000
5000
6000
7000
8000
9000
PASSENGER SUMM ARY- INTER ISLAND ALL SHIPS FROM 01.04.2013 TO 31.03.2014
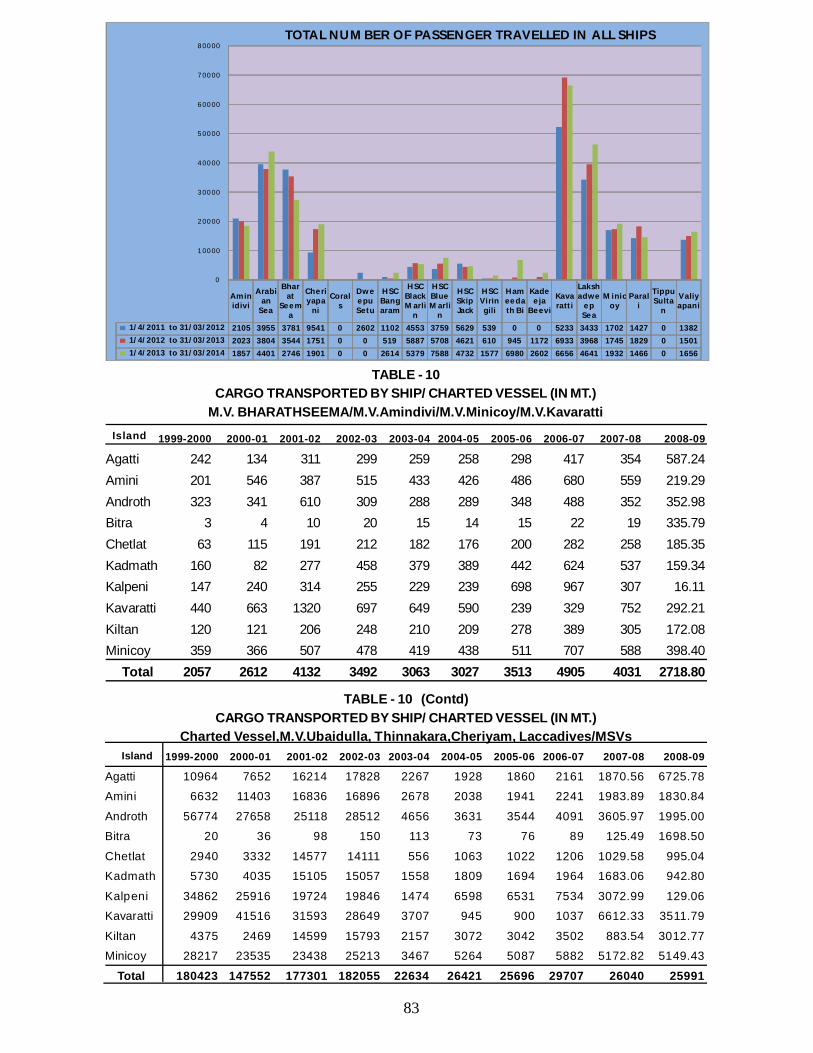
83
1999-2000 2000-01 2001-02 2002-03 2003-04 2004-05 2005-06 2006-07 2007-08 2008-09
Agatti 242 134 311 299 259 258 298 417 354 587.24Amini 201 546 387 515 433 426 486 680 559 219.29Androth 323 341 610 309 288 289 348 488 352 352.98Bitra 3 4 10 20 15 14 15 22 19 335.79Chetlat 63 115 191 212 182 176 200 282 258 185.35Kadmath 160 82 277 458 379 389 442 624 537 159.34Kalpeni 147 240 314 255 229 239 698 967 307 16.11Kavaratti 440 663 1320 697 649 590 239 329 752 292.21Kiltan 120 121 206 248 210 209 278 389 305 172.08Minicoy 359 366 507 478 419 438 511 707 588 398.40 Total 2057 2612 4132 3492 3063 3027 3513 4905 4031 2718.80
TABLE - 10CARGO TRANSPORTED BY SHIP/ CHARTED VESSEL (IN MT.)
M.V. BHARATHSEEMA/M.V.Amindivi/M.V.Minicoy/M.V.KavarattiIsland
TABLE - 10 (Contd)CARGO TRANSPORTED BY SHIP/ CHARTED VESSEL (IN MT.)
Charted Vessel,M.V.Ubaidulla, Thinnakara,Cheriyam, Laccadives/MSVs1999-2000 2000-01 2001-02 2002-03 2003-04 2004-05 2005-06 2006-07 2007-08 2008-09
Agatti 10964 7652 16214 17828 2267 1928 1860 2161 1870.56 6725.78
Amini 6632 11403 16836 16896 2678 2038 1941 2241 1983.89 1830.84
Androth 56774 27658 25118 28512 4656 3631 3544 4091 3605.97 1995.00
Bitra 20 36 98 150 113 73 76 89 125.49 1698.50
Chetlat 2940 3332 14577 14111 556 1063 1022 1206 1029.58 995.04
Kadmath 5730 4035 15105 15057 1558 1809 1694 1964 1683.06 942.80
Kalpeni 34862 25916 19724 19846 1474 6598 6531 7534 3072.99 129.06
Kavaratti 29909 41516 31593 28649 3707 945 900 1037 6612.33 3511.79
Kiltan 4375 2469 14599 15793 2157 3072 3042 3502 883.54 3012.77
Minicoy 28217 23535 23438 25213 3467 5264 5087 5882 5172.82 5149.43
Total 180423 147552 177301 182055 22634 26421 25696 29707 26040 25991
Island
A m inid iv i
A rabian
S e a
B harat
Se e ma
Ch e riy ap a
ni
Co ra ls
D w ee pu S e tu
H SC Ban garam
H SC Bl ack M arli
n
H SC Bl ue M arli
n
H SC Sk ip Jack
H SC V i rin
g ili
H ame e d ath B i
Kadee ja
B e e v i
Kavaratti
Lak shad w e
e p Se a
M i ni co y
P ara li
T ip pu S u lta
n
V aliyapan i
1/4/2011 to 31/03/2012 2105 3955 3781 9541 0 2602 1102 4553 3759 5629 539 0 0 5233 3433 1702 1427 0 13821/4/2012 to 31/03/2013 2023 3804 3544 1751 0 0 519 5887 5708 4621 610 945 1172 6933 3968 1745 1829 0 15011/4/2013 to 31/03/2014 1857 4401 2746 1901 0 0 2614 5379 7588 4732 1577 6980 2602 6656 4641 1932 1466 0 1656
0
1 0 0 0 0
2 0 0 0 0
3 0 0 0 0
4 0 0 0 0
5 0 0 0 0
6 0 0 0 0
7 0 0 0 0
8 0 0 0 0TO TA L N U M B E R O F PA SSE N G E R TR A V E LLE D IN A LL SH IP S
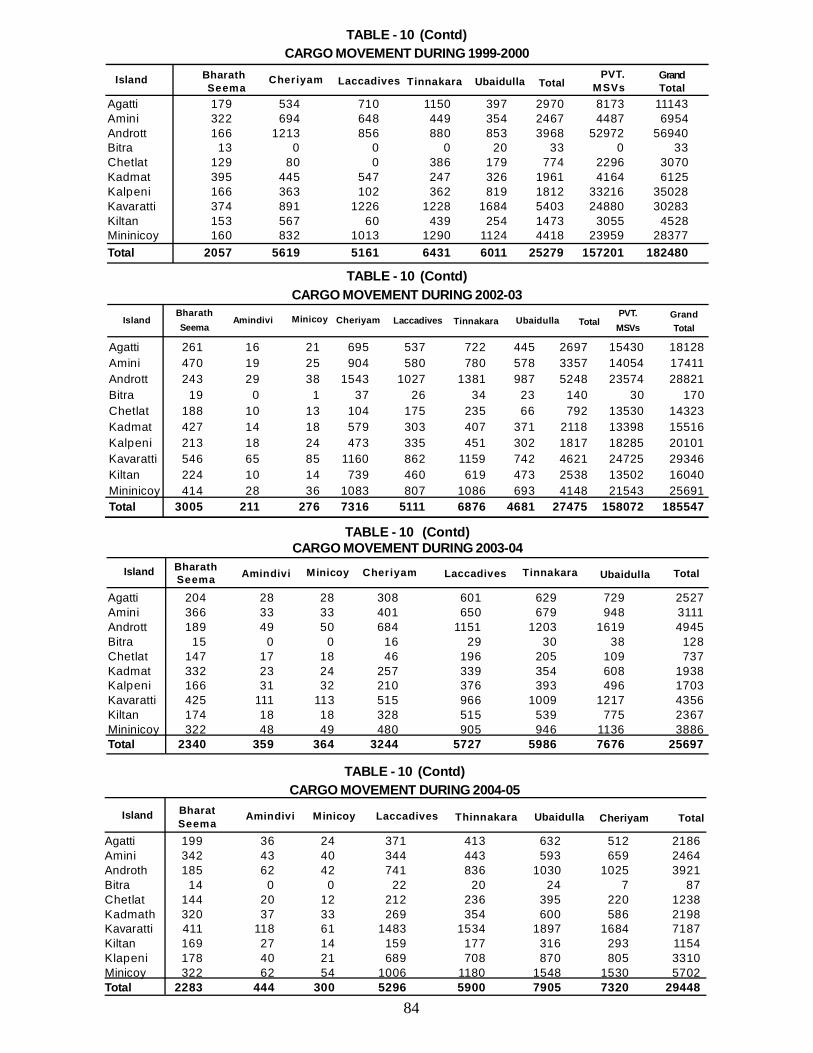
84
Agatti 179 534 710 1150 397 2970 8173 11143Amini 322 694 648 449 354 2467 4487 6954Andrott 166 1213 856 880 853 3968 52972 56940Bitra 13 0 0 0 20 33 0 33Chetlat 129 80 0 386 179 774 2296 3070Kadmat 395 445 547 247 326 1961 4164 6125Kalpeni 166 363 102 362 819 1812 33216 35028Kavaratti 374 891 1226 1228 1684 5403 24880 30283Kiltan 153 567 60 439 254 1473 3055 4528Mininicoy 160 832 1013 1290 1124 4418 23959 28377Total 2057 5619 5161 6431 6011 25279 157201 182480
TABLE - 10 (Contd)CARGO MOVEMENT DURING 1999-2000
Island BharathSeema
Cheriyam Laccadives Tinnakara Ubaidulla TotalPVT.
MSVs Grand
Total
Agatti 261 16 21 695 537 722 445 2697 15430 18128Amini 470 19 25 904 580 780 578 3357 14054 17411Andrott 243 29 38 1543 1027 1381 987 5248 23574 28821Bitra 19 0 1 37 26 34 23 140 30 170Chetlat 188 10 13 104 175 235 66 792 13530 14323Kadmat 427 14 18 579 303 407 371 2118 13398 15516Kalpeni 213 18 24 473 335 451 302 1817 18285 20101Kavaratti 546 65 85 1160 862 1159 742 4621 24725 29346Kiltan 224 10 14 739 460 619 473 2538 13502 16040Mininicoy 414 28 36 1083 807 1086 693 4148 21543 25691Total 3005 211 276 7316 5111 6876 4681 27475 158072 185547
Island
TABLE - 10 (Contd)CARGO MOVEMENT DURING 2002-03
BharathSeema
Amindivi Minicoy Cheriyam Laccadives Tinnakara Ubaidulla TotalPVT.MSVs
GrandTotal
TABLE - 10 (Contd)CARGO MOVEMENT DURING 2003-04
Island
Agatti 204 28 28 308 601 629 729 2527Amini 366 33 33 401 650 679 948 3111Andrott 189 49 50 684 1151 1203 1619 4945Bitra 15 0 0 16 29 30 38 128Chetlat 147 17 18 46 196 205 109 737Kadmat 332 23 24 257 339 354 608 1938Kalpeni 166 31 32 210 376 393 496 1703Kavaratti 425 111 113 515 966 1009 1217 4356Kiltan 174 18 18 328 515 539 775 2367Mininicoy 322 48 49 480 905 946 1136 3886Total 2340 359 364 3244 5727 5986 7676 25697
BharathSeema Amindivi Minicoy Cheriyam Laccadives Tinnakara Ubaidulla Total
TABLE - 10 (Contd)CARGO MOVEMENT DURING 2004-05
Island
Agatti 199 36 24 371 413 632 512 2186Amini 342 43 40 344 443 593 659 2464Androth 185 62 42 741 836 1030 1025 3921Bitra 14 0 0 22 20 24 7 87Chetlat 144 20 12 212 236 395 220 1238Kadmath 320 37 33 269 354 600 586 2198Kavaratti 411 118 61 1483 1534 1897 1684 7187Kiltan 169 27 14 159 177 316 293 1154Klapeni 178 40 21 689 708 870 805 3310Minicoy 322 62 54 1006 1180 1548 1530 5702Total 2283 444 300 5296 5900 7905 7320 29448
BharatSeema
Amindivi Minicoy Laccadives Thinnakara Ubaidulla Cheriyam Total
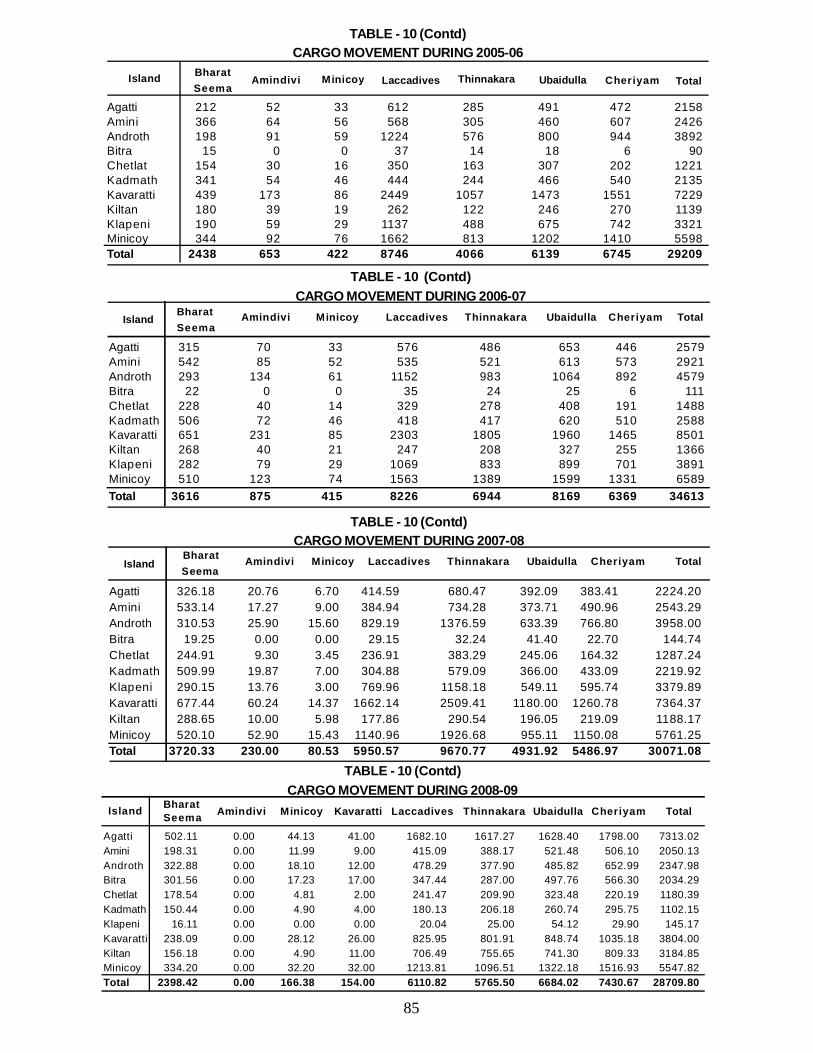
85
TABLE - 10 (Contd)CARGO MOVEMENT DURING 2007-08
Amindivi Minicoy Laccadives Thinnakara Ubaidulla Cheriyam Total Island
Agatti 326.18 20.76 6.70 414.59 680.47 392.09 383.41 2224.20Amini 533.14 17.27 9.00 384.94 734.28 373.71 490.96 2543.29Androth 310.53 25.90 15.60 829.19 1376.59 633.39 766.80 3958.00Bitra 19.25 0.00 0.00 29.15 32.24 41.40 22.70 144.74Chetlat 244.91 9.30 3.45 236.91 383.29 245.06 164.32 1287.24Kadmath 509.99 19.87 7.00 304.88 579.09 366.00 433.09 2219.92Klapeni 290.15 13.76 3.00 769.96 1158.18 549.11 595.74 3379.89Kavaratti 677.44 60.24 14.37 1662.14 2509.41 1180.00 1260.78 7364.37Kiltan 288.65 10.00 5.98 177.86 290.54 196.05 219.09 1188.17Minicoy 520.10 52.90 15.43 1140.96 1926.68 955.11 1150.08 5761.25Total 3720.33 230.00 80.53 5950.57 9670.77 4931.92 5486.97 30071.08
Bharat Seema
TABLE - 10 (Contd)CARGO MOVEMENT DURING 2008-09
Amindivi Minicoy Kavaratti Laccadives Thinnakara Ubaidulla Cheriyam TotalIsland BharatSeema
Agatti 502.11 0.00 44.13 41.00 1682.10 1617.27 1628.40 1798.00 7313.02Amini 198.31 0.00 11.99 9.00 415.09 388.17 521.48 506.10 2050.13Androth 322.88 0.00 18.10 12.00 478.29 377.90 485.82 652.99 2347.98Bitra 301.56 0.00 17.23 17.00 347.44 287.00 497.76 566.30 2034.29Chetlat 178.54 0.00 4.81 2.00 241.47 209.90 323.48 220.19 1180.39Kadmath 150.44 0.00 4.90 4.00 180.13 206.18 260.74 295.75 1102.15Klapeni 16.11 0.00 0.00 0.00 20.04 25.00 54.12 29.90 145.17Kavaratti 238.09 0.00 28.12 26.00 825.95 801.91 848.74 1035.18 3804.00Kiltan 156.18 0.00 4.90 11.00 706.49 755.65 741.30 809.33 3184.85Minicoy 334.20 0.00 32.20 32.00 1213.81 1096.51 1322.18 1516.93 5547.82Total 2398.42 0.00 166.38 154.00 6110.82 5765.50 6684.02 7430.67 28709.80
TABLE - 10 (Contd)CARGO MOVEMENT DURING 2005-06
Island
Agatti 212 52 33 612 285 491 472 2158Amini 366 64 56 568 305 460 607 2426Androth 198 91 59 1224 576 800 944 3892Bitra 15 0 0 37 14 18 6 90Chetlat 154 30 16 350 163 307 202 1221Kadmath 341 54 46 444 244 466 540 2135Kavaratti 439 173 86 2449 1057 1473 1551 7229Kiltan 180 39 19 262 122 246 270 1139Klapeni 190 59 29 1137 488 675 742 3321Minicoy 344 92 76 1662 813 1202 1410 5598Total 2438 653 422 8746 4066 6139 6745 29209
BharatSeema
Amindivi Minicoy Laccadives Thinnakara Ubaidulla Cheriyam Total
TABLE - 10 (Contd)CARGO MOVEMENT DURING 2006-07
Amindivi Minicoy Laccadives Thinnakara Ubaidulla Cheriyam Total IslandBharatSeema
Agatti 315 70 33 576 486 653 446 2579Amini 542 85 52 535 521 613 573 2921Androth 293 134 61 1152 983 1064 892 4579Bitra 22 0 0 35 24 25 6 111Chetlat 228 40 14 329 278 408 191 1488Kadmath 506 72 46 418 417 620 510 2588Kavaratti 651 231 85 2303 1805 1960 1465 8501Kiltan 268 40 21 247 208 327 255 1366Klapeni 282 79 29 1069 833 899 701 3891Minicoy 510 123 74 1563 1389 1599 1331 6589Total 3616 875 415 8226 6944 8169 6369 34613
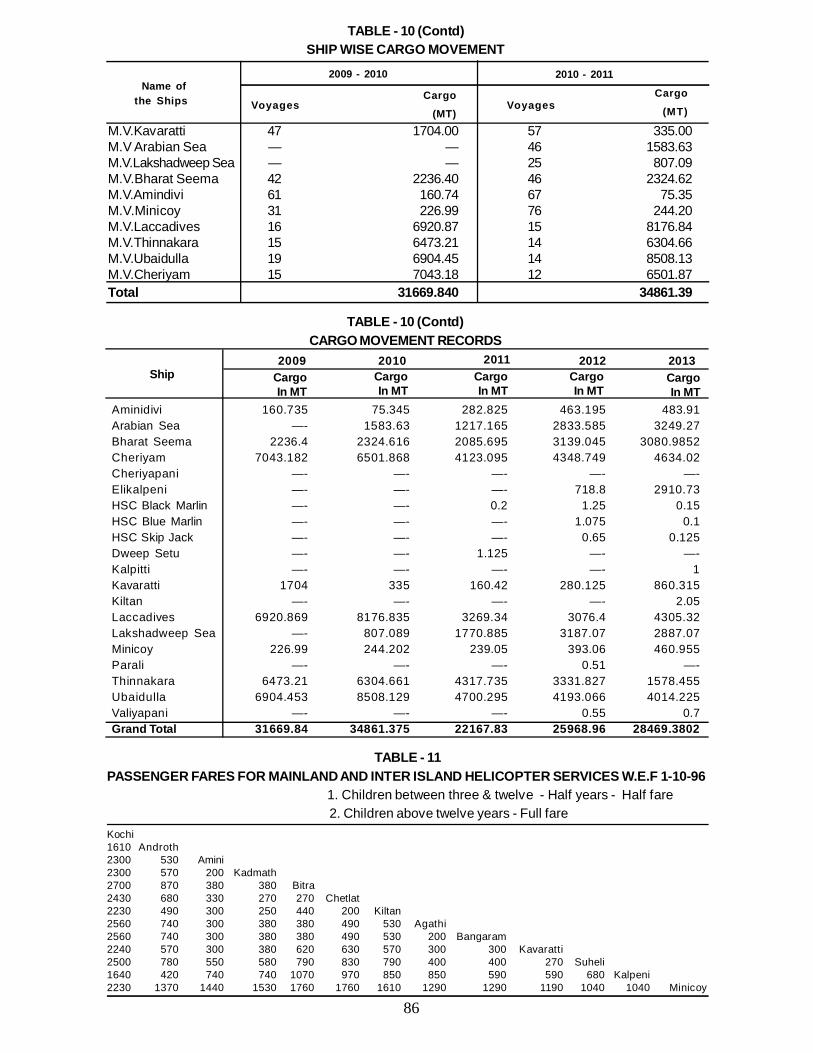
86
Aminidivi 160.735 75.345 282.825 463.195 483.91Arabian Sea —- 1583.63 1217.165 2833.585 3249.27Bharat Seema 2236.4 2324.616 2085.695 3139.045 3080.9852Cheriyam 7043.182 6501.868 4123.095 4348.749 4634.02Cheriyapani —- —- —- —- —-Elikalpeni —- —- —- 718.8 2910.73HSC Black Marlin —- —- 0.2 1.25 0.15HSC Blue Marlin —- —- —- 1.075 0.1HSC Skip Jack —- —- —- 0.65 0.125Dweep Setu —- —- 1.125 —- —-Kalpitti —- —- —- —- 1Kavaratti 1704 335 160.42 280.125 860.315Kiltan —- —- —- —- 2.05Laccadives 6920.869 8176.835 3269.34 3076.4 4305.32Lakshadweep Sea —- 807.089 1770.885 3187.07 2887.07Minicoy 226.99 244.202 239.05 393.06 460.955Parali —- —- —- 0.51 —-Thinnakara 6473.21 6304.661 4317.735 3331.827 1578.455Ubaidulla 6904.453 8508.129 4700.295 4193.066 4014.225Valiyapani —- —- —- 0.55 0.7Grand Total 31669.84 34861.375 22167.83 25968.96 28469.3802
TABLE - 10 (Contd)CARGO MOVEMENT RECORDS
Ship2009 2010 2011 2012 2013
CargoIn MT
CargoIn MT
CargoIn MT
CargoIn MT
CargoIn MT
TABLE - 11PASSENGER FARES FOR MAINLAND AND INTER ISLAND HELICOPTER SERVICES W.E.F 1-10-96
1. Children between three & twelve - Half years - Half fare 2. Children above twelve years - Full fare
Kochi1610 Androth2300 530 Amini2300 570 200 Kadmath2700 870 380 380 Bitra2430 680 330 270 270 Chetlat2230 490 300 250 440 200 Kiltan2560 740 300 380 380 490 530 Agathi2560 740 300 380 380 490 530 200 Bangaram2240 570 300 380 620 630 570 300 300 Kavaratti2500 780 550 580 790 830 790 400 400 270 Suheli1640 420 740 740 1070 970 850 850 590 590 680 Kalpeni2230 1370 1440 1530 1760 1760 1610 1290 1290 1190 1040 1040 Minicoy
M.V.Kavaratti 47 1704.00 57 335.00M.V Arabian Sea — — 46 1583.63M.V.Lakshadweep Sea — — 25 807.09M.V.Bharat Seema 42 2236.40 46 2324.62M.V.Amindivi 61 160.74 67 75.35M.V.Minicoy 31 226.99 76 244.20M.V.Laccadives 16 6920.87 15 8176.84M.V.Thinnakara 15 6473.21 14 6304.66M.V.Ubaidulla 19 6904.45 14 8508.13M.V.Cheriyam 15 7043.18 12 6501.87Total 31669.840 34861.39
TABLE - 10 (Contd)SHIP WISE CARGO MOVEMENT
Name of2009 - 2010 2010 - 2011
the Ships VoyagesCargo
(MT)Voyages
Cargo
(MT)
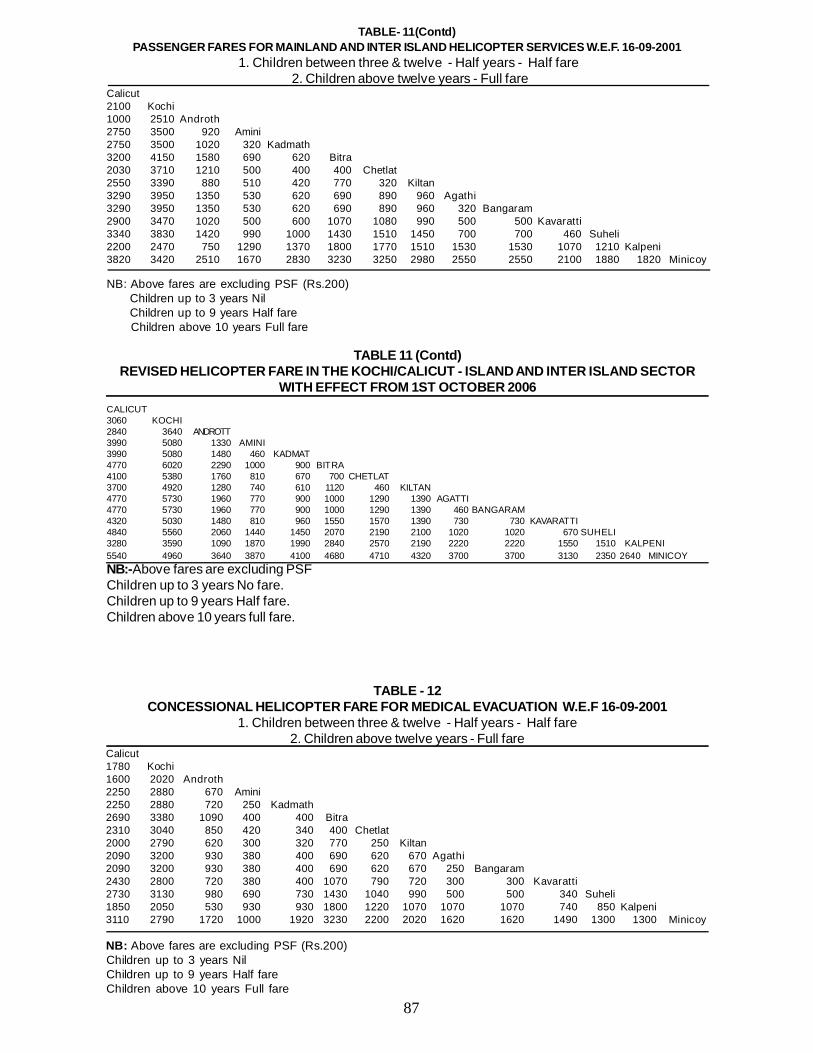
87
NB: Above fares are excluding PSF (Rs.200) Children up to 3 years Nil Children up to 9 years Half fare Children above 10 years Full fare
TABLE- 11(Contd)PASSENGER FARES FOR MAINLAND AND INTER ISLAND HELICOPTER SERVICES W.E.F. 16-09-2001
1. Children between three & twelve - Half years - Half fare 2. Children above twelve years - Full fare
Calicut2100 Kochi1000 2510 Androth2750 3500 920 Amini2750 3500 1020 320 Kadmath3200 4150 1580 690 620 Bitra2030 3710 1210 500 400 400 Chetlat2550 3390 880 510 420 770 320 Kiltan3290 3950 1350 530 620 690 890 960 Agathi3290 3950 1350 530 620 690 890 960 320 Bangaram2900 3470 1020 500 600 1070 1080 990 500 500 Kavaratti3340 3830 1420 990 1000 1430 1510 1450 700 700 460 Suheli2200 2470 750 1290 1370 1800 1770 1510 1530 1530 1070 1210 Kalpeni3820 3420 2510 1670 2830 3230 3250 2980 2550 2550 2100 1880 1820 Minicoy
TABLE - 12CONCESSIONAL HELICOPTER FARE FOR MEDICAL EVACUATION W.E.F 16-09-2001
1. Children between three & twelve - Half years - Half fare2. Children above twelve years - Full fare
Calicut1780 Kochi1600 2020 Androth2250 2880 670 Amini2250 2880 720 250 Kadmath2690 3380 1090 400 400 Bitra2310 3040 850 420 340 400 Chetlat2000 2790 620 300 320 770 250 Kiltan2090 3200 930 380 400 690 620 670 Agathi2090 3200 930 380 400 690 620 670 250 Bangaram2430 2800 720 380 400 1070 790 720 300 300 Kavaratti2730 3130 980 690 730 1430 1040 990 500 500 340 Suheli1850 2050 530 930 930 1800 1220 1070 1070 1070 740 850 Kalpeni3110 2790 1720 1000 1920 3230 2200 2020 1620 1620 1490 1300 1300 Minicoy
NB: Above fares are excluding PSF (Rs.200)Children up to 3 years NilChildren up to 9 years Half fareChildren above 10 years Full fare
TABLE 11 (Contd)REVISED HELICOPTER FARE IN THE KOCHI/CALICUT - ISLAND AND INTER ISLAND SECTOR
WITH EFFECT FROM 1ST OCTOBER 2006CALICUT3060 KOCHI2840 3640 ANDROTT3990 5080 1330 AMINI3990 5080 1480 460 KADMAT4770 6020 2290 1000 900 BITRA4100 5380 1760 810 670 700 CHETLAT3700 4920 1280 740 610 1120 460 KILTAN4770 5730 1960 770 900 1000 1290 1390 AGATTI4770 5730 1960 770 900 1000 1290 1390 460 BANGARAM4320 5030 1480 810 960 1550 1570 1390 730 730 KAVARATTI4840 5560 2060 1440 1450 2070 2190 2100 1020 1020 670 SUHELI3280 3590 1090 1870 1990 2840 2570 2190 2220 2220 1550 1510 KALPENI5540 4960 3640 3870 4100 4680 4710 4320 3700 3700 3130 2350 2640 MINICOYNB:-Above fares are excluding PSFChildren up to 3 years No fare.Children up to 9 years Half fare.Children above 10 years full fare.
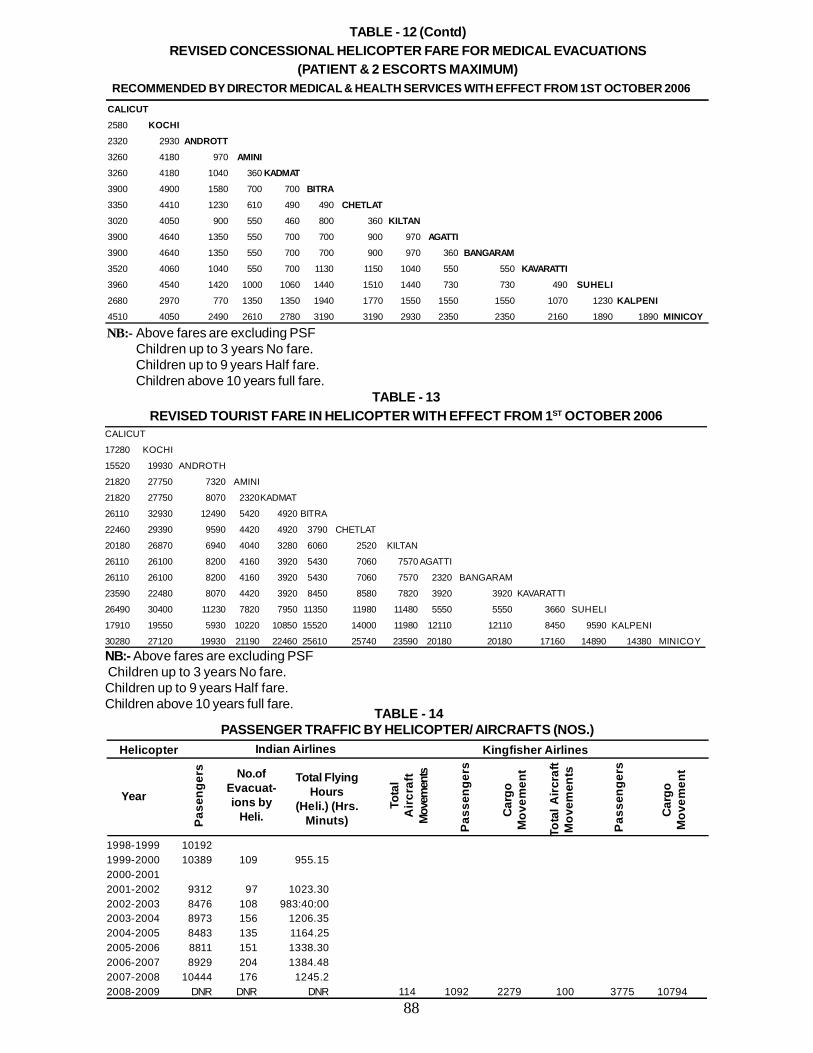
88
TABLE - 12 (Contd)REVISED CONCESSIONAL HELICOPTER FARE FOR MEDICAL EVACUATIONS
(PATIENT & 2 ESCORTS MAXIMUM) RECOMMENDED BY DIRECTOR MEDICAL & HEALTH SERVICES WITH EFFECT FROM 1ST OCTOBER 2006CALICUT2580 KOCHI2320 2930 ANDROTT3260 4180 970 AMINI3260 4180 1040 360 KADMAT3900 4900 1580 700 700 BITRA3350 4410 1230 610 490 490 CHETLAT3020 4050 900 550 460 800 360 KILTAN3900 4640 1350 550 700 700 900 970 AGATTI3900 4640 1350 550 700 700 900 970 360 BANGARAM3520 4060 1040 550 700 1130 1150 1040 550 550 KAVARATTI3960 4540 1420 1000 1060 1440 1510 1440 730 730 490 SUHELI2680 2970 770 1350 1350 1940 1770 1550 1550 1550 1070 1230 KALPENI4510 4050 2490 2610 2780 3190 3190 2930 2350 2350 2160 1890 1890 MINICOY
NB:- Above fares are excluding PSFChildren up to 3 years No fare.Children up to 9 years Half fare.Children above 10 years full fare.
TABLE - 13REVISED TOURIST FARE IN HELICOPTER WITH EFFECT FROM 1ST OCTOBER 2006
CALICUT
17280 KOCHI
15520 19930 ANDROTH
21820 27750 7320 AMINI
21820 27750 8070 2320KADMAT
26110 32930 12490 5420 4920 BITRA
22460 29390 9590 4420 4920 3790 CHETLAT
20180 26870 6940 4040 3280 6060 2520 KILTAN
26110 26100 8200 4160 3920 5430 7060 7570 AGATTI
26110 26100 8200 4160 3920 5430 7060 7570 2320 BANGARAM
23590 22480 8070 4420 3920 8450 8580 7820 3920 3920 KAVARATTI
26490 30400 11230 7820 7950 11350 11980 11480 5550 5550 3660 SUHELI
17910 19550 5930 10220 10850 15520 14000 11980 12110 12110 8450 9590 KALPENI
30280 27120 19930 21190 22460 25610 25740 23590 20180 20180 17160 14890 14380 MINICOY
NB:- Above fares are excluding PSF Children up to 3 years No fare.Children up to 9 years Half fare.Children above 10 years full fare.
1998-1999 101921999-2000 10389 109 955.152000-20012001-2002 9312 97 1023.302002-2003 8476 108 983:40:002003-2004 8973 156 1206.352004-2005 8483 135 1164.252005-2006 8811 151 1338.302006-2007 8929 204 1384.482007-2008 10444 176 1245.22008-2009 DNR DNR DNR 114 1092 2279 100 3775 10794
TABLE - 14PASSENGER TRAFFIC BY HELICOPTER/ AIRCRAFTS (NOS.)
Helicopter Indian Airlines Kingfisher Airlines
Year
Pas
enge
rs No.ofEvacuat-ions by
Heli.
Total FlyingHours
(Heli.) (Hrs.Minuts)
Tota
lA
ircr
aft
Mov
emen
ts
Pas
seng
ers
Car
goM
ovem
ent
Tota
l Airc
raft
Mov
emen
ts
Pas
seng
ers
Car
goM
ovem
ent
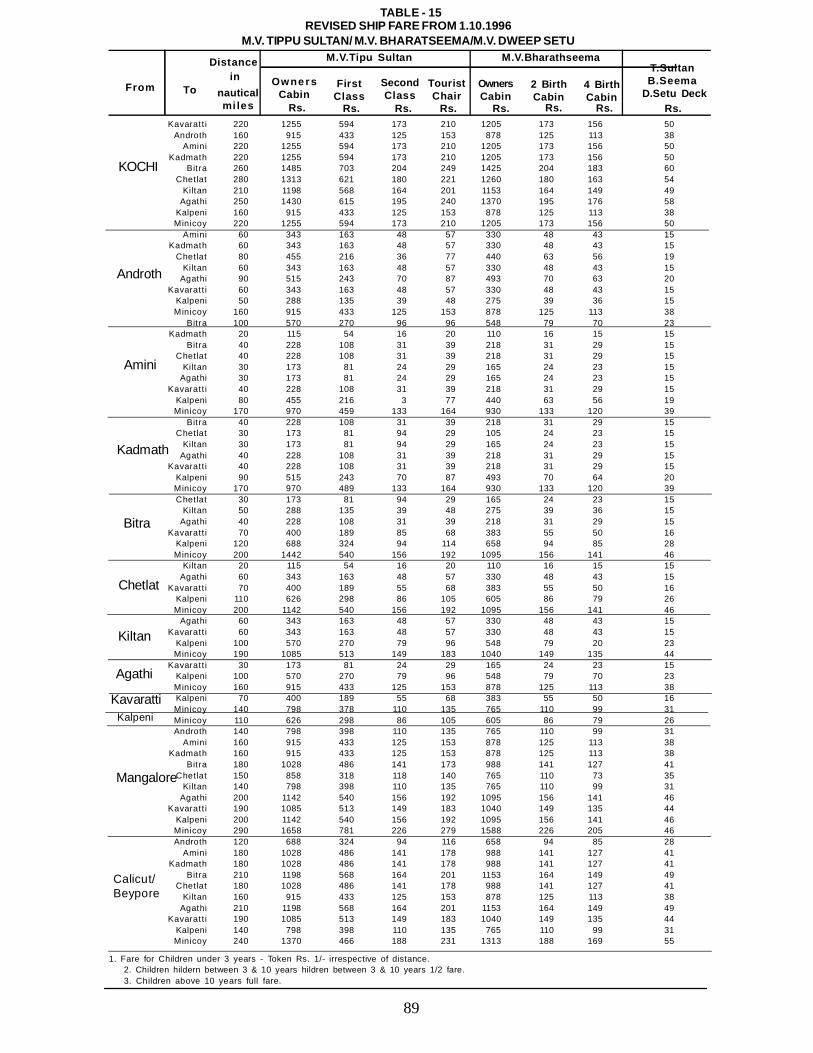
89
TABLE - 15REVISED SHIP FARE FROM 1.10.1996
M.V. TIPPU SULTAN/ M.V. BHARATSEEMA/M.V. DWEEP SETU
Kavaratt i 220 1255 594 173 210 1205 173 156 50Androth 160 915 433 125 153 878 125 113 38
Amini 220 1255 594 173 210 1205 173 156 50Kadmath 220 1255 594 173 210 1205 173 156 50
Bitra 260 1485 703 204 249 1425 204 183 60Chetlat 280 1313 621 180 221 1260 180 163 54
Kiltan 210 1198 568 164 201 1153 164 149 49Agathi 250 1430 615 195 240 1370 195 176 58
Kalpeni 160 915 433 125 153 878 125 113 38Minicoy 220 1255 594 173 210 1205 173 156 50
Amini 60 343 163 48 57 330 48 43 15Kadmath 60 343 163 48 57 330 48 43 15
Chetlat 80 455 216 36 77 440 63 56 19Kiltan 60 343 163 48 57 330 48 43 15
Agathi 90 515 243 70 87 493 70 63 20Kavaratt i 60 343 163 48 57 330 48 43 15
Kalpeni 50 288 135 39 48 275 39 36 15Minicoy 160 915 433 125 153 878 125 113 38
Bitra 100 570 270 96 96 548 79 70 23Kadmath 20 115 54 16 20 110 16 15 15
Bitra 40 228 108 31 39 218 31 29 15Chetlat 40 228 108 31 39 218 31 29 15
Kiltan 30 173 81 24 29 165 24 23 15Agathi 30 173 81 24 29 165 24 23 15
Kavaratt i 40 228 108 31 39 218 31 29 15Kalpeni 80 455 216 3 77 440 63 56 19Minicoy 170 970 459 133 164 930 133 120 39
Bitra 40 228 108 31 39 218 31 29 15Chetlat 30 173 81 94 29 105 24 23 15
Kiltan 30 173 81 94 29 165 24 23 15Agathi 40 228 108 31 39 218 31 29 15
Kavaratt i 40 228 108 31 39 218 31 29 15Kalpeni 90 515 243 70 87 493 70 64 20Minicoy 170 970 489 133 164 930 133 120 39Chetlat 30 173 81 94 29 165 24 23 15
Kiltan 50 288 135 39 48 275 39 36 15Agathi 40 228 108 31 39 218 31 29 15
Kavaratt i 70 400 189 85 68 383 55 50 16Kalpeni 120 688 324 94 114 658 94 85 28Minicoy 200 1442 540 156 192 1095 156 141 46
Kiltan 20 115 54 16 20 110 16 15 15Agathi 60 343 163 48 57 330 48 43 15
Kavaratt i 70 400 189 55 68 383 55 50 16Kalpeni 110 626 298 86 105 605 86 79 26Minicoy 200 1142 540 156 192 1095 156 141 46
Agathi 60 343 163 48 57 330 48 43 15Kavaratt i 60 343 163 48 57 330 48 43 15
Kalpeni 100 570 270 79 96 548 79 20 23Minicoy 190 1085 513 149 183 1040 149 135 44
Kavaratt i 30 173 81 24 29 165 24 23 15Kalpeni 100 570 270 79 96 548 79 70 23Minicoy 160 915 433 125 153 878 125 113 38Kalpeni 70 400 189 55 68 383 55 50 16Minicoy 140 798 378 110 135 765 110 99 31Minicoy 110 626 298 86 105 605 86 79 26Androth 140 798 398 110 135 765 110 99 31
Amini 160 915 433 125 153 878 125 113 38Kadmath 160 915 433 125 153 878 125 113 38
Bitra 180 1028 486 141 173 988 141 127 41Chetlat 150 858 318 118 140 765 110 73 35
Kiltan 140 798 398 110 135 765 110 99 31Agathi 200 1142 540 156 192 1095 156 141 46
Kavaratt i 190 1085 513 149 183 1040 149 135 44Kalpeni 200 1142 540 156 192 1095 156 141 46Minicoy 290 1658 781 226 279 1588 226 205 46Androth 120 688 324 94 116 658 94 85 28
Amini 180 1028 486 141 178 988 141 127 41Kadmath 180 1028 486 141 178 988 141 127 41
Bitra 210 1198 568 164 201 1153 164 149 49Chetlat 180 1028 486 141 178 988 141 127 41
Kiltan 160 915 433 125 153 878 125 113 38Agathi 210 1198 568 164 201 1153 164 149 49
Kavaratt i 190 1085 513 149 183 1040 149 135 44Kalpeni 140 798 398 110 135 765 110 99 31Minicoy 240 1370 466 188 231 1313 188 169 55
1. Fare for Children under 3 years - Token Rs. 1/- irrespective of distance.2. Children hildern between 3 & 10 years hildren between 3 & 10 years 1/2 fare.3. Children above 10 years full fare.
From To
M.V.Tipu Sultan M.V.Bharathseema
Owne rsCabin
FirstClass
SecondClass
TouristChair
OwnersCabin
2 BirthCabin
Rs. Rs.Rs. Rs. Rs. Rs.
KOCHI
Androth
Amini
Kadmath
4 BirthCabin
Rs.
T.SultanB.Seema
D.Setu Deck
Bitra
Chetlat
Kiltan
Agathi
KavarattiKalpeni
Rs.
Mangalore
Calicut/Beypore
Distancein
nauticalmi les
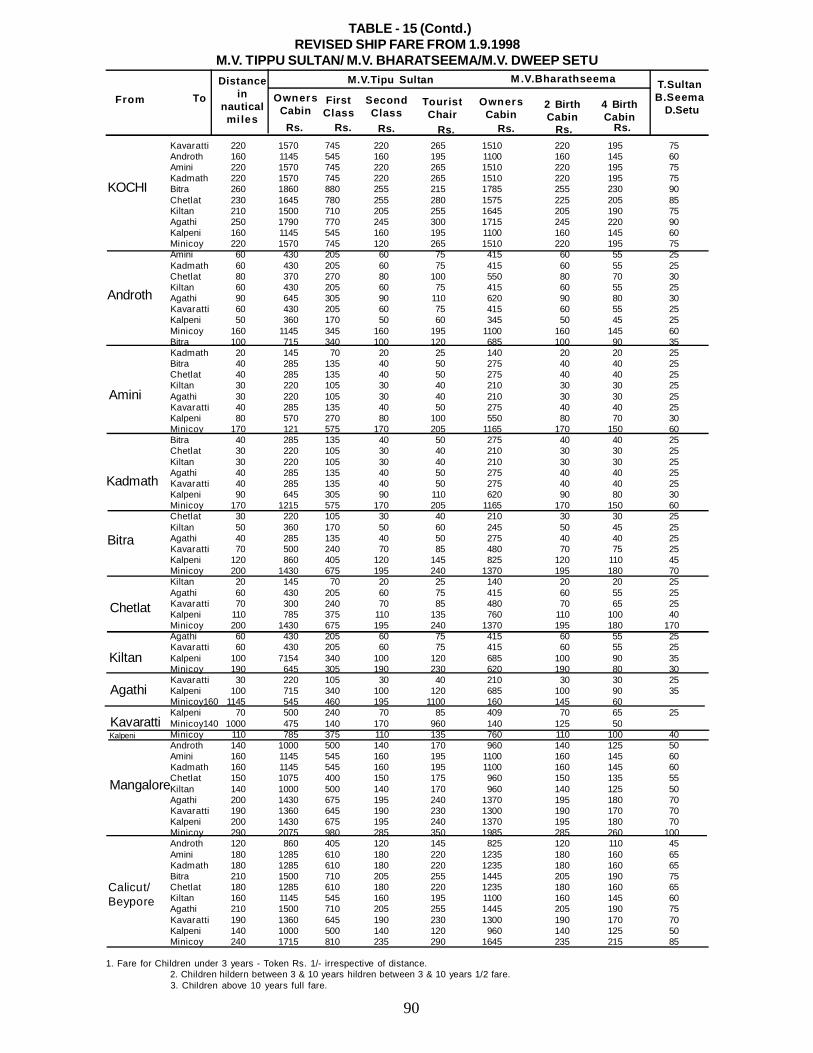
90
Kavaratti 220 1570 745 220 265 1510 220 195 75Androth 160 1145 545 160 195 1100 160 145 60Amini 220 1570 745 220 265 1510 220 195 75Kadmath 220 1570 745 220 265 1510 220 195 75Bitra 260 1860 880 255 215 1785 255 230 90Chetlat 230 1645 780 255 280 1575 225 205 85Kiltan 210 1500 710 205 255 1645 205 190 75Agathi 250 1790 770 245 300 1715 245 220 90Kalpeni 160 1145 545 160 195 1100 160 145 60Minicoy 220 1570 745 120 265 1510 220 195 75Amini 60 430 205 60 75 415 60 55 25Kadmath 60 430 205 60 75 415 60 55 25Chetlat 80 370 270 80 100 550 80 70 30Kiltan 60 430 205 60 75 415 60 55 25Agathi 90 645 305 90 110 620 90 80 30Kavaratti 60 430 205 60 75 415 60 55 25Kalpeni 50 360 170 50 60 345 50 45 25Minicoy 160 1145 345 160 195 1100 160 145 60Bitra 100 715 340 100 120 685 100 90 35Kadmath 20 145 70 20 25 140 20 20 25Bitra 40 285 135 40 50 275 40 40 25Chetlat 40 285 135 40 50 275 40 40 25Kiltan 30 220 105 30 40 210 30 30 25Agathi 30 220 105 30 40 210 30 30 25Kavaratti 40 285 135 40 50 275 40 40 25Kalpeni 80 570 270 80 100 550 80 70 30Minicoy 170 121 575 170 205 1165 170 150 60Bitra 40 285 135 40 50 275 40 40 25Chetlat 30 220 105 30 40 210 30 30 25Kiltan 30 220 105 30 40 210 30 30 25Agathi 40 285 135 40 50 275 40 40 25Kavaratti 40 285 135 40 50 275 40 40 25Kalpeni 90 645 305 90 110 620 90 80 30Minicoy 170 1215 575 170 205 1165 170 150 60Chetlat 30 220 105 30 40 210 30 30 25Kiltan 50 360 170 50 60 245 50 45 25Agathi 40 285 135 40 50 275 40 40 25Kavaratti 70 500 240 70 85 480 70 75 25Kalpeni 120 860 405 120 145 825 120 110 45Minicoy 200 1430 675 195 240 1370 195 180 70Kiltan 20 145 70 20 25 140 20 20 25Agathi 60 430 205 60 75 415 60 55 25Kavaratti 70 300 240 70 85 480 70 65 25Kalpeni 110 785 375 110 135 760 110 100 40Minicoy 200 1430 675 195 240 1370 195 180 170Agathi 60 430 205 60 75 415 60 55 25Kavaratti 60 430 205 60 75 415 60 55 25Kalpeni 100 7154 340 100 120 685 100 90 35Minicoy 190 645 305 190 230 620 190 80 30Kavaratti 30 220 105 30 40 210 30 30 25Kalpeni 100 715 340 100 120 685 100 90 35Minicoy160 1145 545 460 195 1100 160 145 60Kalpeni 70 500 240 70 85 409 70 65 25Minicoy140 1000 475 140 170 960 140 125 50Minicoy 110 785 375 110 135 760 110 100 40Androth 140 1000 500 140 170 960 140 125 50Amini 160 1145 545 160 195 1100 160 145 60Kadmath 160 1145 545 160 195 1100 160 145 60Chetlat 150 1075 400 150 175 960 150 135 55Kiltan 140 1000 500 140 170 960 140 125 50Agathi 200 1430 675 195 240 1370 195 180 70Kavaratti 190 1360 645 190 230 1300 190 170 70Kalpeni 200 1430 675 195 240 1370 195 180 70Minicoy 290 2075 980 285 350 1985 285 260 100Androth 120 860 405 120 145 825 120 110 45Amini 180 1285 610 180 220 1235 180 160 65Kadmath 180 1285 610 180 220 1235 180 160 65Bitra 210 1500 710 205 255 1445 205 190 75Chetlat 180 1285 610 180 220 1235 180 160 65Kiltan 160 1145 545 160 195 1100 160 145 60Agathi 210 1500 710 205 255 1445 205 190 75Kavaratti 190 1360 645 190 230 1300 190 170 70Kalpeni 140 1000 500 140 120 960 140 125 50Minicoy 240 1715 810 235 290 1645 235 215 85
1. Fare for Children under 3 years - Token Rs. 1/- irrespective of distance.2. Children hildern between 3 & 10 years hildren between 3 & 10 years 1/2 fare.3. Children above 10 years full fare.
TABLE - 15 (Contd.)REVISED SHIP FARE FROM 1.9.1998
M.V. TIPPU SULTAN/ M.V. BHARATSEEMA/M.V. DWEEP SETU
From To
M.V.Tipu Sultan M.V.Bharathseema
Rs. Rs.Rs. Rs. Rs. Rs.
Distancein
nauticalmi les
OwnersCabin
FirstClass
SecondClass
Rs.
TouristChair
OwnersCabin
2 BirthCabin
4 BirthCabin
T.SultanB.Seema D.Setu
KOCHI
Androth
Amini
Kadmath
Bitra
Kiltan
Agathi
Kavaratti
Mangalore
Chetlat
Kalpeni
Calicut/Beypore
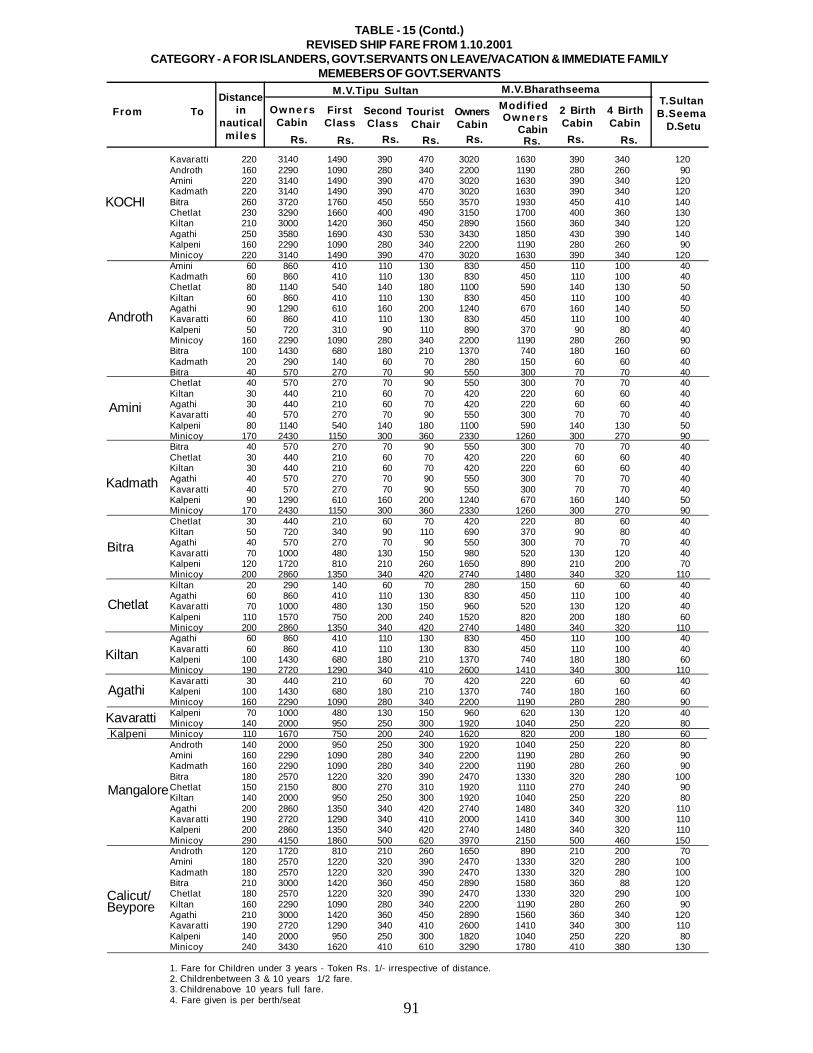
91
Kavaratti 220 3140 1490 390 470 3020 1630 390 340 120Androth 160 2290 1090 280 340 2200 1190 280 260 90Amini 220 3140 1490 390 470 3020 1630 390 340 120Kadmath 220 3140 1490 390 470 3020 1630 390 340 120Bitra 260 3720 1760 450 550 3570 1930 450 410 140Chetlat 230 3290 1660 400 490 3150 1700 400 360 130Kiltan 210 3000 1420 360 450 2890 1560 360 340 120Agathi 250 3580 1690 430 530 3430 1850 430 390 140Kalpeni 160 2290 1090 280 340 2200 1190 280 260 90Minicoy 220 3140 1490 390 470 3020 1630 390 340 120Amini 60 860 410 110 130 830 450 110 100 40Kadmath 60 860 410 110 130 830 450 110 100 40Chetlat 80 1140 540 140 180 1100 590 140 130 50Kiltan 60 860 410 110 130 830 450 110 100 40Agathi 90 1290 610 160 200 1240 670 160 140 50Kavaratti 60 860 410 110 130 830 450 110 100 40Kalpeni 50 720 310 90 110 890 370 90 80 40Minicoy 160 2290 1090 280 340 2200 1190 280 260 90Bitra 100 1430 680 180 210 1370 740 180 160 60Kadmath 20 290 140 60 70 280 150 60 60 40Bitra 40 570 270 70 90 550 300 70 70 40Chetlat 40 570 270 70 90 550 300 70 70 40Kiltan 30 440 210 60 70 420 220 60 60 40Agathi 30 440 210 60 70 420 220 60 60 40Kavaratti 40 570 270 70 90 550 300 70 70 40Kalpeni 80 1140 540 140 180 1100 590 140 130 50Minicoy 170 2430 1150 300 360 2330 1260 300 270 90Bitra 40 570 270 70 90 550 300 70 70 40Chetlat 30 440 210 60 70 420 220 60 60 40Kiltan 30 440 210 60 70 420 220 60 60 40Agathi 40 570 270 70 90 550 300 70 70 40Kavaratti 40 570 270 70 90 550 300 70 70 40Kalpeni 90 1290 610 160 200 1240 670 160 140 50Minicoy 170 2430 1150 300 360 2330 1260 300 270 90Chetlat 30 440 210 60 70 420 220 80 60 40Kiltan 50 720 340 90 110 690 370 90 80 40Agathi 40 570 270 70 90 550 300 70 70 40Kavaratti 70 1000 480 130 150 980 520 130 120 40Kalpeni 120 1720 810 210 260 1650 890 210 200 70Minicoy 200 2860 1350 340 420 2740 1480 340 320 110Kiltan 20 290 140 60 70 280 150 60 60 40Agathi 60 860 410 110 130 830 450 110 100 40Kavaratti 70 1000 480 130 150 960 520 130 120 40Kalpeni 110 1570 750 200 240 1520 820 200 180 60Minicoy 200 2860 1350 340 420 2740 1480 340 320 110Agathi 60 860 410 110 130 830 450 110 100 40Kavaratti 60 860 410 110 130 830 450 110 100 40Kalpeni 100 1430 680 180 210 1370 740 180 180 60Minicoy 190 2720 1290 340 410 2600 1410 340 300 110Kavaratti 30 440 210 60 70 420 220 60 60 40Kalpeni 100 1430 680 180 210 1370 740 180 160 60Minicoy 160 2290 1090 280 340 2200 1190 280 280 90Kalpeni 70 1000 480 130 150 960 620 130 120 40Minicoy 140 2000 950 250 300 1920 1040 250 220 80Minicoy 110 1670 750 200 240 1620 820 200 180 60Androth 140 2000 950 250 300 1920 1040 250 220 80Amini 160 2290 1090 280 340 2200 1190 280 260 90Kadmath 160 2290 1090 280 340 2200 1190 280 260 90Bitra 180 2570 1220 320 390 2470 1330 320 280 100Chetlat 150 2150 800 270 310 1920 1110 270 240 90Kiltan 140 2000 950 250 300 1920 1040 250 220 80Agathi 200 2860 1350 340 420 2740 1480 340 320 110Kavaratti 190 2720 1290 340 410 2000 1410 340 300 110Kalpeni 200 2860 1350 340 420 2740 1480 340 320 110Minicoy 290 4150 1860 500 620 3970 2150 500 460 150Androth 120 1720 810 210 260 1650 890 210 200 70Amini 180 2570 1220 320 390 2470 1330 320 280 100Kadmath 180 2570 1220 320 390 2470 1330 320 280 100Bitra 210 3000 1420 360 450 2890 1580 360 88 120Chetlat 180 2570 1220 320 390 2470 1330 320 290 100Kiltan 160 2290 1090 280 340 2200 1190 280 260 90Agathi 210 3000 1420 360 450 2890 1560 360 340 120Kavaratti 190 2720 1290 340 410 2600 1410 340 300 110Kalpeni 140 2000 950 250 300 1820 1040 250 220 80Minicoy 240 3430 1620 410 610 3290 1780 410 380 130
1. Fare for Children under 3 years - Token Rs. 1/- irrespective of distance.2. Childrenbetween 3 & 10 years 1/2 fare.3. Childrenabove 10 years full fare.4. Fare given is per berth/seat
TABLE - 15 (Contd.)REVISED SHIP FARE FROM 1.10.2001
CATEGORY - A FOR ISLANDERS, GOVT.SERVANTS ON LEAVE/VACATION & IMMEDIATE FAMILYMEMEBERS OF GOVT.SERVANTS
From To Owne rsCabin
FirstClass
SecondClass
TouristChair
OwnersCabin
2 BirthCabin
Rs. Rs.Rs. Rs. Rs. Rs.
ModifiedOwne rs
CabinRs.
M.V.BharathseemaM.V.Tipu SultanT.SultanB.Seema D.Setu
Distancein
nauticalmi les
4 BirthCabin
Rs.
KOCHI
Androth
Amini
Kadmath
Bitra
Chetlat
Kiltan
Agathi
KavarattiKalpeni
Mangalore
Calicut/Beypore
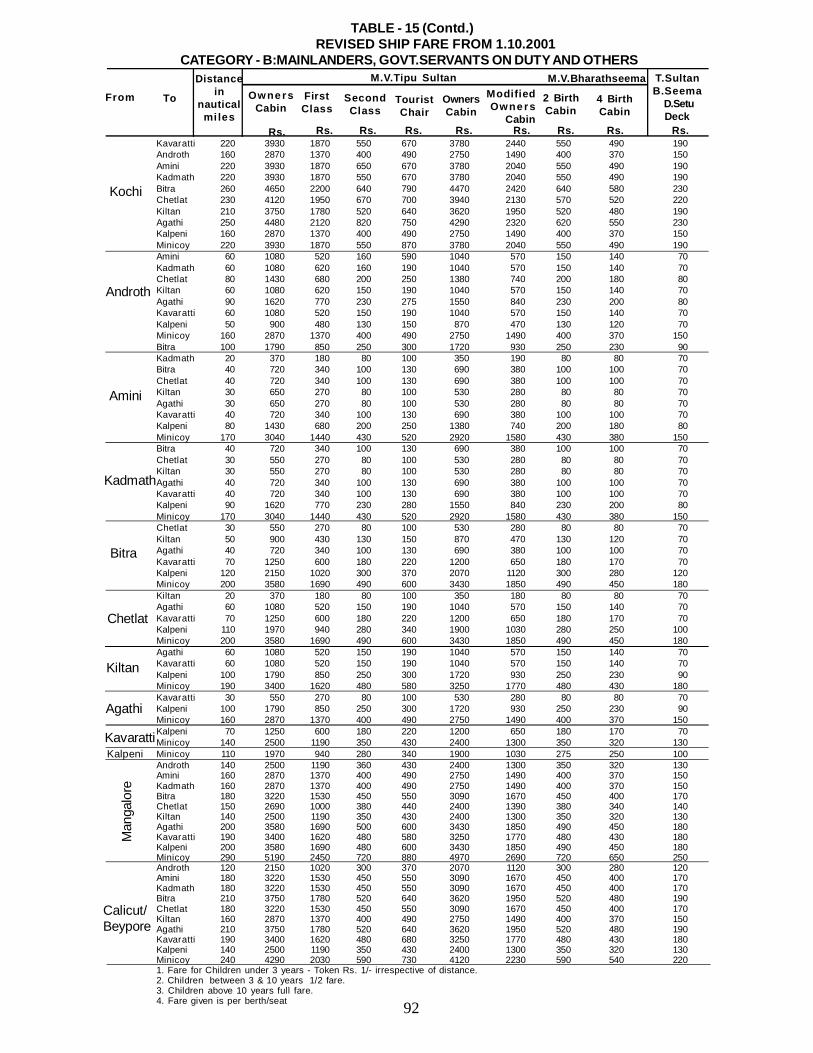
92
Kavaratti 220 3930 1870 550 670 3780 2440 550 490 190Androth 160 2870 1370 400 490 2750 1490 400 370 150Amini 220 3930 1870 650 670 3780 2040 550 490 190Kadmath 220 3930 1870 550 670 3780 2040 550 490 190Bitra 260 4650 2200 640 790 4470 2420 640 580 230Chetlat 230 4120 1950 670 700 3940 2130 570 520 220Kiltan 210 3750 1780 520 640 3620 1950 520 480 190Agathi 250 4480 2120 820 750 4290 2320 620 550 230Kalpeni 160 2870 1370 400 490 2750 1490 400 370 150Minicoy 220 3930 1870 550 870 3780 2040 550 490 190Amini 60 1080 520 160 590 1040 570 150 140 70Kadmath 60 1080 620 160 190 1040 570 150 140 70Chetlat 80 1430 680 200 250 1380 740 200 180 80Kiltan 60 1080 620 150 190 1040 570 150 140 70Agathi 90 1620 770 230 275 1550 840 230 200 80Kavaratti 60 1080 520 150 190 1040 570 150 140 70Kalpeni 50 900 480 130 150 870 470 130 120 70Minicoy 160 2870 1370 400 490 2750 1490 400 370 150Bitra 100 1790 850 250 300 1720 930 250 230 90Kadmath 20 370 180 80 100 350 190 80 80 70Bitra 40 720 340 100 130 690 380 100 100 70Chetlat 40 720 340 100 130 690 380 100 100 70Kiltan 30 650 270 80 100 530 280 80 80 70Agathi 30 650 270 80 100 530 280 80 80 70Kavaratti 40 720 340 100 130 690 380 100 100 70Kalpeni 80 1430 680 200 250 1380 740 200 180 80Minicoy 170 3040 1440 430 520 2920 1580 430 380 150Bitra 40 720 340 100 130 690 380 100 100 70Chetlat 30 550 270 80 100 530 280 80 80 70Kiltan 30 550 270 80 100 530 280 80 80 70Agathi 40 720 340 100 130 690 380 100 100 70Kavaratti 40 720 340 100 130 690 380 100 100 70Kalpeni 90 1620 770 230 280 1550 840 230 200 80Minicoy 170 3040 1440 430 520 2920 1580 430 380 150Chetlat 30 550 270 80 100 530 280 80 80 70Kiltan 50 900 430 130 150 870 470 130 120 70Agathi 40 720 340 100 130 690 380 100 100 70Kavaratti 70 1250 600 180 220 1200 650 180 170 70Kalpeni 120 2150 1020 300 370 2070 1120 300 280 120Minicoy 200 3580 1690 490 600 3430 1850 490 450 180Kiltan 20 370 180 80 100 350 180 80 80 70Agathi 60 1080 520 150 190 1040 570 150 140 70Kavaratti 70 1250 600 180 220 1200 650 180 170 70Kalpeni 110 1970 940 280 340 1900 1030 280 250 100Minicoy 200 3580 1690 490 600 3430 1850 490 450 180Agathi 60 1080 520 150 190 1040 570 150 140 70Kavaratti 60 1080 520 150 190 1040 570 150 140 70Kalpeni 100 1790 850 250 300 1720 930 250 230 90Minicoy 190 3400 1620 480 580 3250 1770 480 430 180Kavaratti 30 550 270 80 100 530 280 80 80 70Kalpeni 100 1790 850 250 300 1720 930 250 230 90Minicoy 160 2870 1370 400 490 2750 1490 400 370 150Kalpeni 70 1250 600 180 220 1200 650 180 170 70Minicoy 140 2500 1190 350 430 2400 1300 350 320 130Minicoy 110 1970 940 280 340 1900 1030 275 250 100Androth 140 2500 1190 360 430 2400 1300 350 320 130Amini 160 2870 1370 400 490 2750 1490 400 370 150Kadmath 160 2870 1370 400 490 2750 1490 400 370 150Bitra 180 3220 1530 450 550 3090 1670 450 400 170Chetlat 150 2690 1000 380 440 2400 1390 380 340 140Kiltan 140 2500 1190 350 430 2400 1300 350 320 130Agathi 200 3580 1690 500 600 3430 1850 490 450 180Kavaratti 190 3400 1620 480 580 3250 1770 480 430 180Kalpeni 200 3580 1690 480 600 3430 1850 490 450 180Minicoy 290 5190 2450 720 880 4970 2690 720 650 250Androth 120 2150 1020 300 370 2070 1120 300 280 120Amini 180 3220 1530 450 550 3090 1670 450 400 170Kadmath 180 3220 1530 450 550 3090 1670 450 400 170Bitra 210 3750 1780 520 640 3620 1950 520 480 190Chetlat 180 3220 1530 450 550 3090 1670 450 400 170Kiltan 160 2870 1370 400 490 2750 1490 400 370 150Agathi 210 3750 1780 520 640 3620 1950 520 480 190Kavaratti 190 3400 1620 480 680 3250 1770 480 430 180Kalpeni 140 2500 1190 350 430 2400 1300 350 320 130Minicoy 240 4290 2030 590 730 4120 2230 590 540 2201. Fare for Children under 3 years - Token Rs. 1/- irrespective of distance.2. Children between 3 & 10 years 1/2 fare.3. Children above 10 years full fare.4. Fare given is per berth/seat
TABLE - 15 (Contd.) REVISED SHIP FARE FROM 1.10.2001
CATEGORY - B:MAINLANDERS, GOVT.SERVANTS ON DUTY AND OTHERS
From To FirstClass
SecondClass
TouristChair
OwnersCabin
Rs. Rs.Rs. Rs. Rs. Rs.
Owne rsCabin
ModifiedOwne rs
CabinRs.
M.V.BharathseemaM.V.Tipu SultanDistancein
nauticalmi les
Rs.
2 BirthCabin
4 BirthCabin
T.SultanB.Seema
D.SetuDeck
Rs.
Kochi
Bitra
Chetlat
Kiltan
Agathi
Kavaratti
Man
galo
re
Calicut/Beypore
Androth
Kadmath
Amini
Kalpeni
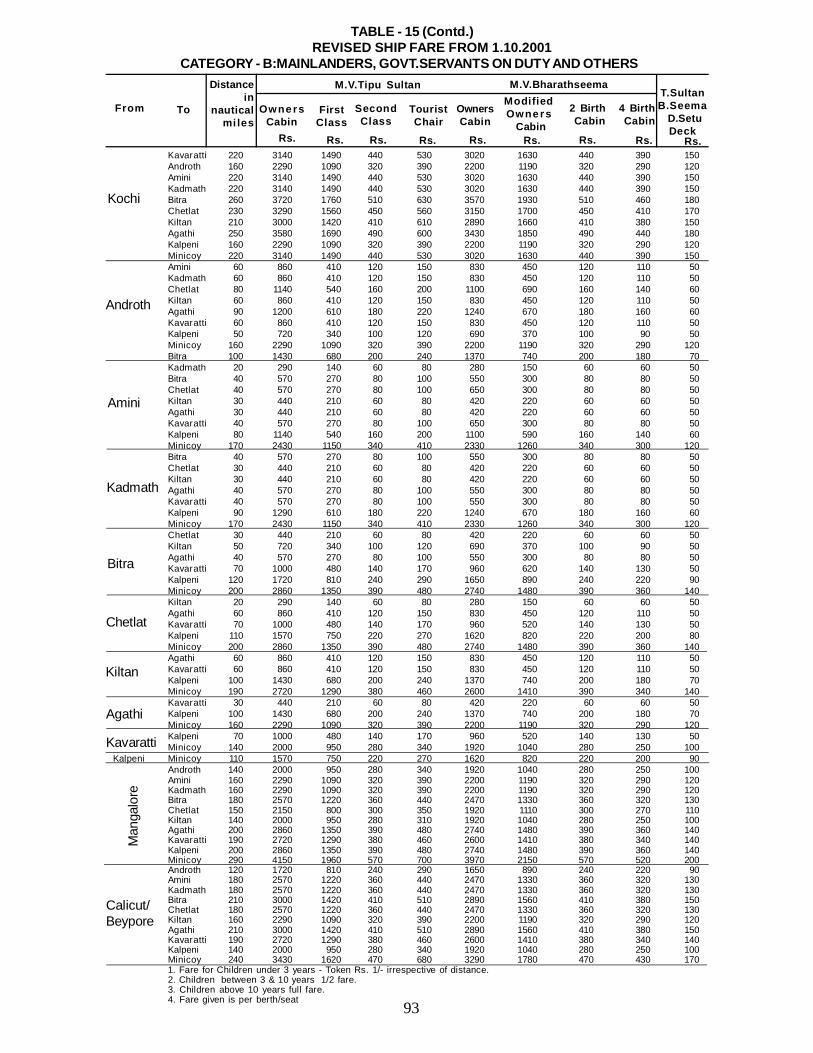
93
TABLE - 15 (Contd.) REVISED SHIP FARE FROM 1.10.2001
CATEGORY - B:MAINLANDERS, GOVT.SERVANTS ON DUTY AND OTHERS
From To FirstClass
SecondClass
TouristChair
OwnersCabin
Rs. Rs.Rs. Rs. Rs. Rs.
Owne rsCabin
ModifiedOwne rs Cabin
Rs.
M.V.BharathseemaM.V.Tipu SultanDistancein
nauticalmi les
Rs.
2 BirthCabin
4 BirthCabin
T.SultanB.Seema D.Setu
DeckRs.Kavaratti 220 3140 1490 440 530 3020 1630 440 390 150Androth 160 2290 1090 320 390 2200 1190 320 290 120Amini 220 3140 1490 440 530 3020 1630 440 390 150Kadmath 220 3140 1490 440 530 3020 1630 440 390 150Bitra 260 3720 1760 510 630 3570 1930 510 460 180Chetlat 230 3290 1560 450 560 3150 1700 450 410 170Kiltan 210 3000 1420 410 610 2890 1660 410 380 150Agathi 250 3580 1690 490 600 3430 1850 490 440 180Kalpeni 160 2290 1090 320 390 2200 1190 320 290 120Minicoy 220 3140 1490 440 530 3020 1630 440 390 150Amini 60 860 410 120 150 830 450 120 110 50Kadmath 60 860 410 120 150 830 450 120 110 50Chetlat 80 1140 540 160 200 1100 690 160 140 60Kiltan 60 860 410 120 150 830 450 120 110 50Agathi 90 1200 610 180 220 1240 670 180 160 60Kavaratti 60 860 410 120 150 830 450 120 110 50Kalpeni 50 720 340 100 120 690 370 100 90 50Minicoy 160 2290 1090 320 390 2200 1190 320 290 120Bitra 100 1430 680 200 240 1370 740 200 180 70Kadmath 20 290 140 60 80 280 150 60 60 50Bitra 40 570 270 80 100 550 300 80 80 50Chetlat 40 570 270 80 100 650 300 80 80 50Kiltan 30 440 210 60 80 420 220 60 60 50Agathi 30 440 210 60 80 420 220 60 60 50Kavaratti 40 570 270 80 100 650 300 80 80 50Kalpeni 80 1140 540 160 200 1100 590 160 140 60Minicoy 170 2430 1150 340 410 2330 1260 340 300 120Bitra 40 570 270 80 100 550 300 80 80 50Chetlat 30 440 210 60 80 420 220 60 60 50Kiltan 30 440 210 60 80 420 220 60 60 50Agathi 40 570 270 80 100 550 300 80 80 50Kavaratti 40 570 270 80 100 550 300 80 80 50Kalpeni 90 1290 610 180 220 1240 670 180 160 60Minicoy 170 2430 1150 340 410 2330 1260 340 300 120Chetlat 30 440 210 60 80 420 220 60 60 50Kiltan 50 720 340 100 120 690 370 100 90 50Agathi 40 570 270 80 100 550 300 80 80 50Kavaratti 70 1000 480 140 170 960 620 140 130 50Kalpeni 120 1720 810 240 290 1650 890 240 220 90Minicoy 200 2860 1350 390 480 2740 1480 390 360 140Kiltan 20 290 140 60 80 280 150 60 60 50Agathi 60 860 410 120 150 830 450 120 110 50Kavaratti 70 1000 480 140 170 960 520 140 130 50Kalpeni 110 1570 750 220 270 1620 820 220 200 80Minicoy 200 2860 1350 390 480 2740 1480 390 360 140Agathi 60 860 410 120 150 830 450 120 110 50Kavaratti 60 860 410 120 150 830 450 120 110 50Kalpeni 100 1430 680 200 240 1370 740 200 180 70Minicoy 190 2720 1290 380 460 2600 1410 390 340 140Kavaratti 30 440 210 60 80 420 220 60 60 50Kalpeni 100 1430 680 200 240 1370 740 200 180 70Minicoy 160 2290 1090 320 390 2200 1190 320 290 120Kalpeni 70 1000 480 140 170 960 520 140 130 50Minicoy 140 2000 950 280 340 1920 1040 280 250 100
Kalpeni Minicoy 110 1570 750 220 270 1620 820 220 200 90Androth 140 2000 950 280 340 1920 1040 280 250 100Amini 160 2290 1090 320 390 2200 1190 320 290 120Kadmath 160 2290 1090 320 390 2200 1190 320 290 120Bitra 180 2570 1220 360 440 2470 1330 360 320 130Chetlat 150 2150 800 300 350 1920 1110 300 270 110Kiltan 140 2000 950 280 310 1920 1040 280 250 100Agathi 200 2860 1350 390 480 2740 1480 390 360 140Kavaratti 190 2720 1290 380 460 2600 1410 380 340 140Kalpeni 200 2860 1350 390 480 2740 1480 390 360 140Minicoy 290 4150 1960 570 700 3970 2150 570 520 200Androth 120 1720 810 240 290 1650 890 240 220 90Amini 180 2570 1220 360 440 2470 1330 360 320 130Kadmath 180 2570 1220 360 440 2470 1330 360 320 130Bitra 210 3000 1420 410 510 2890 1560 410 380 150Chetlat 180 2570 1220 360 440 2470 1330 360 320 130Kiltan 160 2290 1090 320 390 2200 1190 320 290 120Agathi 210 3000 1420 410 510 2890 1560 410 380 150Kavaratti 190 2720 1290 380 460 2600 1410 380 340 140Kalpeni 140 2000 950 280 340 1920 1040 280 250 100Minicoy 240 3430 1620 470 680 3290 1780 470 430 1701. Fare for Children under 3 years - Token Rs. 1/- irrespective of distance.2. Children between 3 & 10 years 1/2 fare.3. Children above 10 years full fare.4. Fare given is per berth/seat
Kochi
Androth
Amini
Kadmath
Bitra
Kiltan
Chetlat
Agathi
Kavaratti
Man
galo
re
Calicut/Beypore
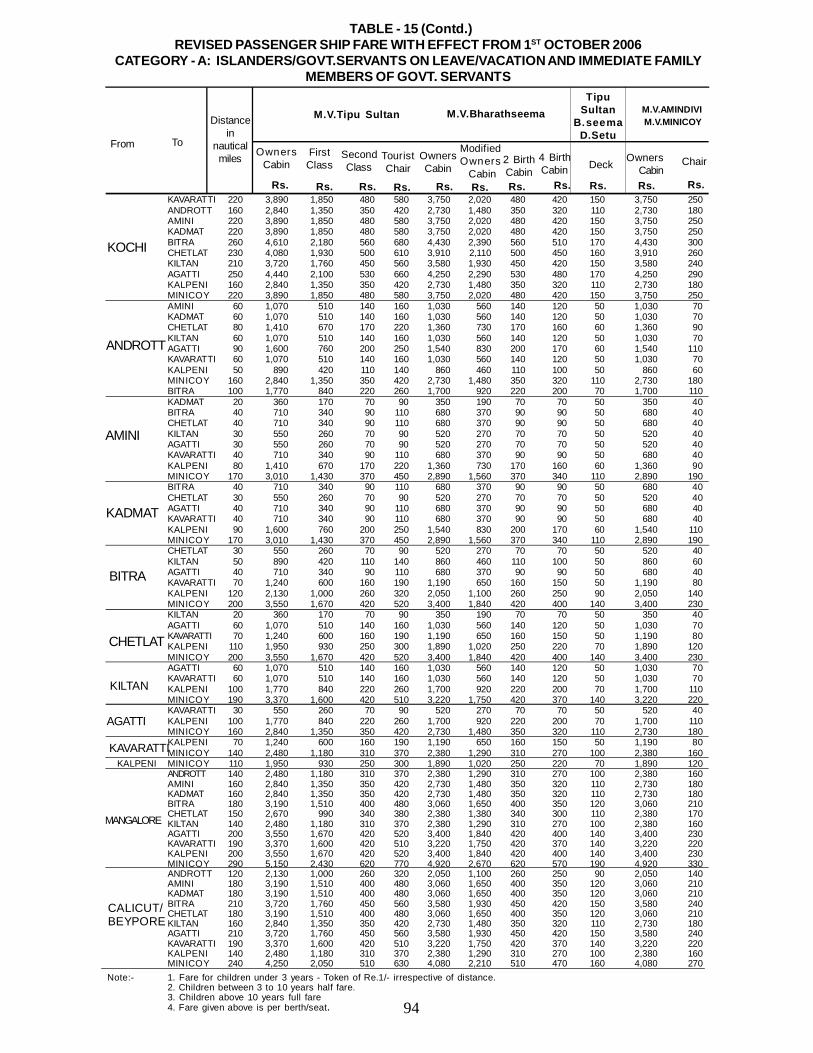
94
TABLE - 15 (Contd.)REVISED PASSENGER SHIP FARE WITH EFFECT FROM 1ST OCTOBER 2006
CATEGORY - A: ISLANDERS/GOVT.SERVANTS ON LEAVE/VACATION AND IMMEDIATE FAMILYMEMBERS OF GOVT. SERVANTS
KAVARATTI 220 3,890 1,850 480 580 3,750 2,020 480 420 150 3,750 250ANDROTT 160 2,840 1,350 350 420 2,730 1,480 350 320 110 2,730 180AMINI 220 3,890 1,850 480 580 3,750 2,020 480 420 150 3,750 250KADMAT 220 3,890 1,850 480 580 3,750 2,020 480 420 150 3,750 250BITRA 260 4,610 2,180 560 680 4,430 2,390 560 510 170 4,430 300CHETLAT 230 4,080 1,930 500 610 3,910 2,110 500 450 160 3,910 260KILTAN 210 3,720 1,760 450 560 3,580 1,930 450 420 150 3,580 240AGATTI 250 4,440 2,100 530 660 4,250 2,290 530 480 170 4,250 290KALPENI 160 2,840 1,350 350 420 2,730 1,480 350 320 110 2,730 180MINICOY 220 3,890 1,850 480 580 3,750 2,020 480 420 150 3,750 250AMINI 60 1,070 510 140 160 1,030 560 140 120 50 1,030 70KADMAT 60 1,070 510 140 160 1,030 560 140 120 50 1,030 70CHETLAT 80 1,410 670 170 220 1,360 730 170 160 60 1,360 90KILTAN 60 1,070 510 140 160 1,030 560 140 120 50 1,030 70AGATTI 90 1,600 760 200 250 1,540 830 200 170 60 1,540 110KAVARATTI 60 1,070 510 140 160 1,030 560 140 120 50 1,030 70KALPENI 50 890 420 110 140 860 460 110 100 50 860 60MINICOY 160 2,840 1,350 350 420 2,730 1,480 350 320 110 2,730 180BITRA 100 1,770 840 220 260 1,700 920 220 200 70 1,700 110KADMAT 20 360 170 70 90 350 190 70 70 50 350 40BITRA 40 710 340 90 110 680 370 90 90 50 680 40CHETLAT 40 710 340 90 110 680 370 90 90 50 680 40KILTAN 30 550 260 70 90 520 270 70 70 50 520 40AGATTI 30 550 260 70 90 520 270 70 70 50 520 40KAVARATTI 40 710 340 90 110 680 370 90 90 50 680 40KALPENI 80 1,410 670 170 220 1,360 730 170 160 60 1,360 90MINICOY 170 3,010 1,430 370 450 2,890 1,560 370 340 110 2,890 190BITRA 40 710 340 90 110 680 370 90 90 50 680 40CHETLAT 30 550 260 70 90 520 270 70 70 50 520 40AGATTI 40 710 340 90 110 680 370 90 90 50 680 40KAVARATTI 40 710 340 90 110 680 370 90 90 50 680 40KALPENI 90 1,600 760 200 250 1,540 830 200 170 60 1,540 110MINICOY 170 3,010 1,430 370 450 2,890 1,560 370 340 110 2,890 190CHETLAT 30 550 260 70 90 520 270 70 70 50 520 40KILTAN 50 890 420 110 140 860 460 110 100 50 860 60AGATTI 40 710 340 90 110 680 370 90 90 50 680 40KAVARATTI 70 1,240 600 160 190 1,190 650 160 150 50 1,190 80KALPENI 120 2,130 1,000 260 320 2,050 1,100 260 250 90 2,050 140MINICOY 200 3,550 1,670 420 520 3,400 1,840 420 400 140 3,400 230KILTAN 20 360 170 70 90 350 190 70 70 50 350 40AGATTI 60 1,070 510 140 160 1,030 560 140 120 50 1,030 70KAVARATTI 70 1,240 600 160 190 1,190 650 160 150 50 1,190 80KALPENI 110 1,950 930 250 300 1,890 1,020 250 220 70 1,890 120MINICOY 200 3,550 1,670 420 520 3,400 1,840 420 400 140 3,400 230AGATTI 60 1,070 510 140 160 1,030 560 140 120 50 1,030 70KAVARATTI 60 1,070 510 140 160 1,030 560 140 120 50 1,030 70KALPENI 100 1,770 840 220 260 1,700 920 220 200 70 1,700 110MINICOY 190 3,370 1,600 420 510 3,220 1,750 420 370 140 3,220 220KAVARATTI 30 550 260 70 90 520 270 70 70 50 520 40KALPENI 100 1,770 840 220 260 1,700 920 220 200 70 1,700 110MINICOY 160 2,840 1,350 350 420 2,730 1,480 350 320 110 2,730 180KALPENI 70 1,240 600 160 190 1,190 650 160 150 50 1,190 80MINICOY 140 2,480 1,180 310 370 2,380 1,290 310 270 100 2,380 160
KALPENI MINICOY 110 1,950 930 250 300 1,890 1,020 250 220 70 1,890 120ANDROTT 140 2,480 1,180 310 370 2,380 1,290 310 270 100 2,380 160AMINI 160 2,840 1,350 350 420 2,730 1,480 350 320 110 2,730 180KADMAT 160 2,840 1,350 350 420 2,730 1,480 350 320 110 2,730 180BITRA 180 3,190 1,510 400 480 3,060 1,650 400 350 120 3,060 210CHETLAT 150 2,670 990 340 380 2,380 1,380 340 300 110 2,380 170KILTAN 140 2,480 1,180 310 370 2,380 1,290 310 270 100 2,380 160AGATTI 200 3,550 1,670 420 520 3,400 1,840 420 400 140 3,400 230KAVARATTI 190 3,370 1,600 420 510 3,220 1,750 420 370 140 3,220 220KALPENI 200 3,550 1,670 420 520 3,400 1,840 420 400 140 3,400 230MINICOY 290 5,150 2,430 620 770 4,920 2,670 620 570 190 4,920 330ANDROTT 120 2,130 1,000 260 320 2,050 1,100 260 250 90 2,050 140AMINI 180 3,190 1,510 400 480 3,060 1,650 400 350 120 3,060 210KADMAT 180 3,190 1,510 400 480 3,060 1,650 400 350 120 3,060 210BITRA 210 3,720 1,760 450 560 3,580 1,930 450 420 150 3,580 240CHETLAT 180 3,190 1,510 400 480 3,060 1,650 400 350 120 3,060 210KILTAN 160 2,840 1,350 350 420 2,730 1,480 350 320 110 2,730 180AGATTI 210 3,720 1,760 450 560 3,580 1,930 450 420 150 3,580 240KAVARATTI 190 3,370 1,600 420 510 3,220 1,750 420 370 140 3,220 220KALPENI 140 2,480 1,180 310 370 2,380 1,290 310 270 100 2,380 160MINICOY 240 4,250 2,050 510 630 4,080 2,210 510 470 160 4,080 270
Note:- 1. Fare for children under 3 years - Token of Re.1/- irrespective of distance.2. Children between 3 to 10 years half fare.3. Children above 10 years full fare4. Fare given above is per berth/seat.
From ToFirstClass
SecondClass
TouristChair
OwnersCabin
Rs. Rs.Rs. Rs. Rs. Rs.
OwnersCabin
ModifiedOwners Cabin
Rs.
M.V.BharathseemaM.V.Tipu SultanDistancein
nauticalmiles
Rs.
2 BirthCabin
4 BirthCabin
Rs.
Deck
Rs.
M.V.AMINDIVIM.V.MINICOY
TipuSultan
B.seemaD.Setu
OwnersCabin
Chair
Rs.
KOCHI
ANDROTT
AMINI
KADMAT
BITRA
CHETLAT
KILTAN
AGATTI
KAVARATTI
MANGALORE
CALICUT/BEYPORE
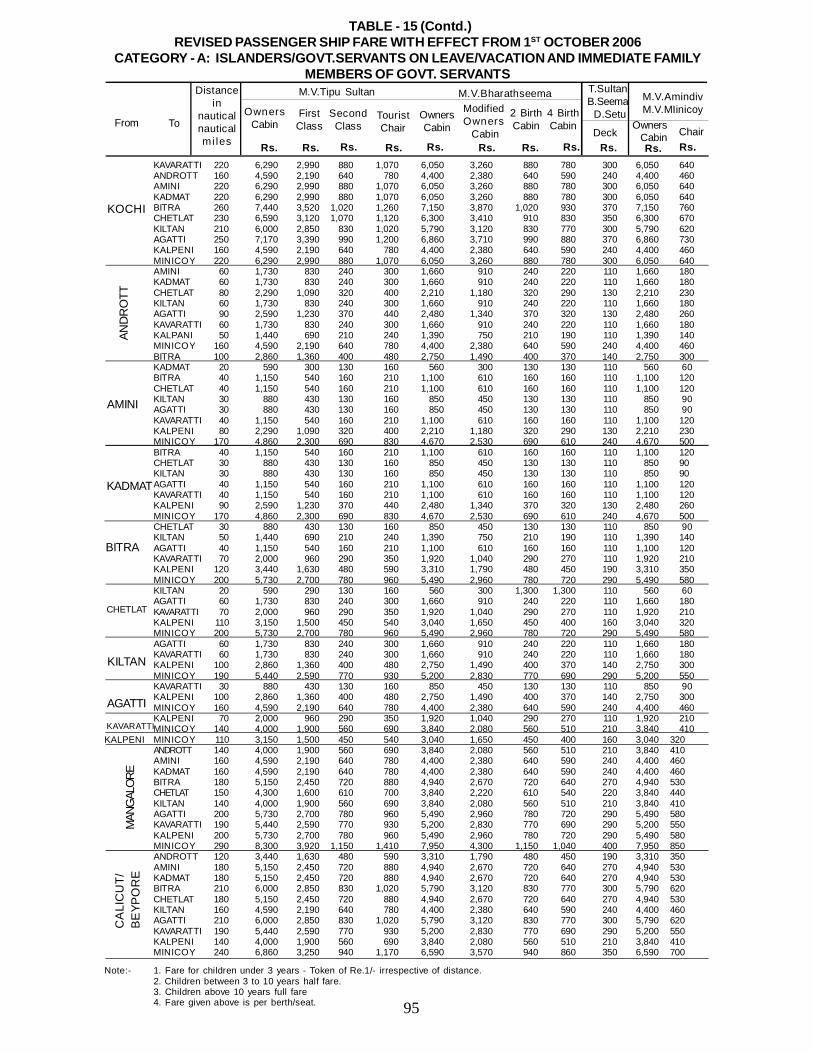
95
KAVARATTI 220 6,290 2,990 880 1,070 6,050 3,260 880 780 300 6,050 640ANDROTT 160 4,590 2,190 640 780 4,400 2,380 640 590 240 4,400 460AMINI 220 6,290 2,990 880 1,070 6,050 3,260 880 780 300 6,050 640KADMAT 220 6,290 2,990 880 1,070 6,050 3,260 880 780 300 6,050 640BITRA 260 7,440 3,520 1,020 1,260 7,150 3,870 1,020 930 370 7,150 760CHETLAT 230 6,590 3,120 1,070 1,120 6,300 3,410 910 830 350 6,300 670KILTAN 210 6,000 2,850 830 1,020 5,790 3,120 830 770 300 5,790 620AGATTI 250 7,170 3,390 990 1,200 6,860 3,710 990 880 370 6,860 730KALPENI 160 4,590 2,190 640 780 4,400 2,380 640 590 240 4,400 460MINICOY 220 6,290 2,990 880 1,070 6,050 3,260 880 780 300 6,050 640AMINI 60 1,730 830 240 300 1,660 910 240 220 110 1,660 180KADMAT 60 1,730 830 240 300 1,660 910 240 220 110 1,660 180CHETLAT 80 2,290 1,090 320 400 2,210 1,180 320 290 130 2,210 230KILTAN 60 1,730 830 240 300 1,660 910 240 220 110 1,660 180AGATTI 90 2,590 1,230 370 440 2,480 1,340 370 320 130 2,480 260KAVARATTI 60 1,730 830 240 300 1,660 910 240 220 110 1,660 180KALPANI 50 1,440 690 210 240 1,390 750 210 190 110 1,390 140MINICOY 160 4,590 2,190 640 780 4,400 2,380 640 590 240 4,400 460BITRA 100 2,860 1,360 400 480 2,750 1,490 400 370 140 2,750 300KADMAT 20 590 300 130 160 560 300 130 130 110 560 60BITRA 40 1,150 540 160 210 1,100 610 160 160 110 1,100 120CHETLAT 40 1,150 540 160 210 1,100 610 160 160 110 1,100 120KILTAN 30 880 430 130 160 850 450 130 130 110 850 90AGATTI 30 880 430 130 160 850 450 130 130 110 850 90KAVARATTI 40 1,150 540 160 210 1,100 610 160 160 110 1,100 120KALPENI 80 2,290 1,090 320 400 2,210 1,180 320 290 130 2,210 230MINICOY 170 4,860 2,300 690 830 4,670 2,530 690 610 240 4,670 500BITRA 40 1,150 540 160 210 1,100 610 160 160 110 1,100 120CHETLAT 30 880 430 130 160 850 450 130 130 110 850 90KILTAN 30 880 430 130 160 850 450 130 130 110 850 90AGATTI 40 1,150 540 160 210 1,100 610 160 160 110 1,100 120KAVARATTI 40 1,150 540 160 210 1,100 610 160 160 110 1,100 120KALPENI 90 2,590 1,230 370 440 2,480 1,340 370 320 130 2,480 260MINICOY 170 4,860 2,300 690 830 4,670 2,530 690 610 240 4,670 500CHETLAT 30 880 430 130 160 850 450 130 130 110 850 90KILTAN 50 1,440 690 210 240 1,390 750 210 190 110 1,390 140AGATTI 40 1,150 540 160 210 1,100 610 160 160 110 1,100 120KAVARATTI 70 2,000 960 290 350 1,920 1,040 290 270 110 1,920 210KALPENI 120 3,440 1,630 480 590 3,310 1,790 480 450 190 3,310 350MINICOY 200 5,730 2,700 780 960 5,490 2,960 780 720 290 5,490 580KILTAN 20 590 290 130 160 560 300 1,300 1,300 110 560 60AGATTI 60 1,730 830 240 300 1,660 910 240 220 110 1,660 180KAVARATTI 70 2,000 960 290 350 1,920 1,040 290 270 110 1,920 210KALPENI 110 3,150 1,500 450 540 3,040 1,650 450 400 160 3,040 320MINICOY 200 5,730 2,700 780 960 5,490 2,960 780 720 290 5,490 580AGATTI 60 1,730 830 240 300 1,660 910 240 220 110 1,660 180KAVARATTI 60 1,730 830 240 300 1,660 910 240 220 110 1,660 180KALPENI 100 2,860 1,360 400 480 2,750 1,490 400 370 140 2,750 300MINICOY 190 5,440 2,590 770 930 5,200 2,830 770 690 290 5,200 550KAVARATTI 30 880 430 130 160 850 450 130 130 110 850 90KALPENI 100 2,860 1,360 400 480 2,750 1,490 400 370 140 2,750 300MINICOY 160 4,590 2,190 640 780 4,400 2,380 640 590 240 4,400 460KALPENI 70 2,000 960 290 350 1,920 1,040 290 270 110 1,920 210MINICOY 140 4,000 1,900 560 690 3,840 2,080 560 510 210 3,840 410
KALPENI MINICOY 110 3,150 1,500 450 540 3,040 1,650 450 400 160 3,040 320ANDROTT 140 4,000 1,900 560 690 3,840 2,080 560 510 210 3,840 410AMINI 160 4,590 2,190 640 780 4,400 2,380 640 590 240 4,400 460KADMAT 160 4,590 2,190 640 780 4,400 2,380 640 590 240 4,400 460BITRA 180 5,150 2,450 720 880 4,940 2,670 720 640 270 4,940 530CHETLAT 150 4,300 1,600 610 700 3,840 2,220 610 540 220 3,840 440KILTAN 140 4,000 1,900 560 690 3,840 2,080 560 510 210 3,840 410AGATTI 200 5,730 2,700 780 960 5,490 2,960 780 720 290 5,490 580KAVARATTI 190 5,440 2,590 770 930 5,200 2,830 770 690 290 5,200 550KALPENI 200 5,730 2,700 780 960 5,490 2,960 780 720 290 5,490 580MINICOY 290 8,300 3,920 1,150 1,410 7,950 4,300 1,150 1,040 400 7,950 850ANDROTT 120 3,440 1,630 480 590 3,310 1,790 480 450 190 3,310 350AMINI 180 5,150 2,450 720 880 4,940 2,670 720 640 270 4,940 530KADMAT 180 5,150 2,450 720 880 4,940 2,670 720 640 270 4,940 530BITRA 210 6,000 2,850 830 1,020 5,790 3,120 830 770 300 5,790 620CHETLAT 180 5,150 2,450 720 880 4,940 2,670 720 640 270 4,940 530KILTAN 160 4,590 2,190 640 780 4,400 2,380 640 590 240 4,400 460AGATTI 210 6,000 2,850 830 1,020 5,790 3,120 830 770 300 5,790 620KAVARATTI 190 5,440 2,590 770 930 5,200 2,830 770 690 290 5,200 550KALPENI 140 4,000 1,900 560 690 3,840 2,080 560 510 210 3,840 410MINICOY 240 6,860 3,250 940 1,170 6,590 3,570 940 860 350 6,590 700
Note:- 1. Fare for children under 3 years - Token of Re.1/- irrespective of distance.2. Children between 3 to 10 years half fare.3. Children above 10 years full fare4. Fare given above is per berth/seat.
TABLE - 15 (Contd.)REVISED PASSENGER SHIP FARE WITH EFFECT FROM 1ST OCTOBER 2006
CATEGORY - A: ISLANDERS/GOVT.SERVANTS ON LEAVE/VACATION AND IMMEDIATE FAMILYMEMBERS OF GOVT. SERVANTS
From To
M.V.Tipu Sultan M.V.Bharathseema
OwnersCabin
FirstClass
SecondClass
TouristChair
OwnersCabin
2 BirthCabin
4 BirthCabin
Rs. Rs.Rs. Rs. Rs. Rs.
ModifiedOwners Cabin
Rs.
Distancein
nauticalnauticalmi les Rs.
T.SultanB.Seema D.Setu
DeckRs.
OwnersCabinRs.
Chair
M.V.AmindivM.V.MIinicoy
Rs.
KOCHI
AND
RO
TT
AMINI
KADMAT
BITRA
CHETLAT
KILTAN
AGATTI
KAVARATTI
MAN
GAL
ORE
CA
LIC
UT/
BE
YPO
RE
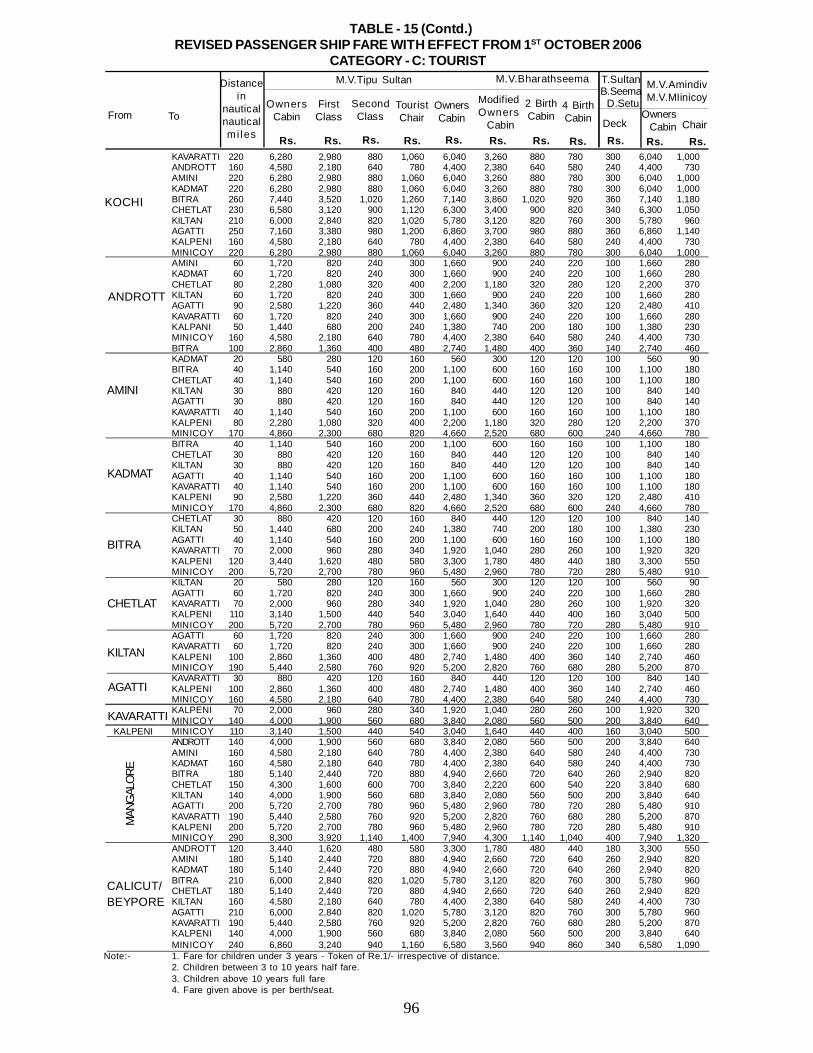
96
TABLE - 15 (Contd.)REVISED PASSENGER SHIP FARE WITH EFFECT FROM 1ST OCTOBER 2006
CATEGORY - C: TOURIST
KAVARATTI 220 6,280 2,980 880 1,060 6,040 3,260 880 780 300 6,040 1,000ANDROTT 160 4,580 2,180 640 780 4,400 2,380 640 580 240 4,400 730AMINI 220 6,280 2,980 880 1,060 6,040 3,260 880 780 300 6,040 1,000KADMAT 220 6,280 2,980 880 1,060 6,040 3,260 880 780 300 6,040 1,000BITRA 260 7,440 3,520 1,020 1,260 7,140 3,860 1,020 920 360 7,140 1,180CHETLAT 230 6,580 3,120 900 1,120 6,300 3,400 900 820 340 6,300 1,050KILTAN 210 6,000 2,840 820 1,020 5,780 3,120 820 760 300 5,780 960AGATTI 250 7,160 3,380 980 1,200 6,860 3,700 980 880 360 6,860 1,140KALPENI 160 4,580 2,180 640 780 4,400 2,380 640 580 240 4,400 730MINICOY 220 6,280 2,980 880 1,060 6,040 3,260 880 780 300 6,040 1,000AMINI 60 1,720 820 240 300 1,660 900 240 220 100 1,660 280KADMAT 60 1,720 820 240 300 1,660 900 240 220 100 1,660 280CHETLAT 80 2,280 1,080 320 400 2,200 1,180 320 280 120 2,200 370KILTAN 60 1,720 820 240 300 1,660 900 240 220 100 1,660 280AGATTI 90 2,580 1,220 360 440 2,480 1,340 360 320 120 2,480 410KAVARATTI 60 1,720 820 240 300 1,660 900 240 220 100 1,660 280KALPANI 50 1,440 680 200 240 1,380 740 200 180 100 1,380 230MINICOY 160 4,580 2,180 640 780 4,400 2,380 640 580 240 4,400 730BITRA 100 2,860 1,360 400 480 2,740 1,480 400 360 140 2,740 460KADMAT 20 580 280 120 160 560 300 120 120 100 560 90BITRA 40 1,140 540 160 200 1,100 600 160 160 100 1,100 180CHETLAT 40 1,140 540 160 200 1,100 600 160 160 100 1,100 180KILTAN 30 880 420 120 160 840 440 120 120 100 840 140AGATTI 30 880 420 120 160 840 440 120 120 100 840 140KAVARATTI 40 1,140 540 160 200 1,100 600 160 160 100 1,100 180KALPENI 80 2,280 1,080 320 400 2,200 1,180 320 280 120 2,200 370MINICOY 170 4,860 2,300 680 820 4,660 2,520 680 600 240 4,660 780BITRA 40 1,140 540 160 200 1,100 600 160 160 100 1,100 180CHETLAT 30 880 420 120 160 840 440 120 120 100 840 140KILTAN 30 880 420 120 160 840 440 120 120 100 840 140AGATTI 40 1,140 540 160 200 1,100 600 160 160 100 1,100 180KAVARATTI 40 1,140 540 160 200 1,100 600 160 160 100 1,100 180KALPENI 90 2,580 1,220 360 440 2,480 1,340 360 320 120 2,480 410MINICOY 170 4,860 2,300 680 820 4,660 2,520 680 600 240 4,660 780CHETLAT 30 880 420 120 160 840 440 120 120 100 840 140KILTAN 50 1,440 680 200 240 1,380 740 200 180 100 1,380 230AGATTI 40 1,140 540 160 200 1,100 600 160 160 100 1,100 180KAVARATTI 70 2,000 960 280 340 1,920 1,040 280 260 100 1,920 320KALPENI 120 3,440 1,620 480 580 3,300 1,780 480 440 180 3,300 550MINICOY 200 5,720 2,700 780 960 5,480 2,960 780 720 280 5,480 910KILTAN 20 580 280 120 160 560 300 120 120 100 560 90AGATTI 60 1,720 820 240 300 1,660 900 240 220 100 1,660 280KAVARATTI 70 2,000 960 280 340 1,920 1,040 280 260 100 1,920 320KALPENI 110 3,140 1,500 440 540 3,040 1,640 440 400 160 3,040 500MINICOY 200 5,720 2,700 780 960 5,480 2,960 780 720 280 5,480 910AGATTI 60 1,720 820 240 300 1,660 900 240 220 100 1,660 280KAVARATTI 60 1,720 820 240 300 1,660 900 240 220 100 1,660 280KALPENI 100 2,860 1,360 400 480 2,740 1,480 400 360 140 2,740 460MINICOY 190 5,440 2,580 760 920 5,200 2,820 760 680 280 5,200 870KAVARATTI 30 880 420 120 160 840 440 120 120 100 840 140KALPENI 100 2,860 1,360 400 480 2,740 1,480 400 360 140 2,740 460MINICOY 160 4,580 2,180 640 780 4,400 2,380 640 580 240 4,400 730KALPENI 70 2,000 960 280 340 1,920 1,040 280 260 100 1,920 320MINICOY 140 4,000 1,900 560 680 3,840 2,080 560 500 200 3,840 640
KALPENI MINICOY 110 3,140 1,500 440 540 3,040 1,640 440 400 160 3,040 500ANDROTT 140 4,000 1,900 560 680 3,840 2,080 560 500 200 3,840 640AMINI 160 4,580 2,180 640 780 4,400 2,380 640 580 240 4,400 730KADMAT 160 4,580 2,180 640 780 4,400 2,380 640 580 240 4,400 730BITRA 180 5,140 2,440 720 880 4,940 2,660 720 640 260 2,940 820CHETLAT 150 4,300 1,600 600 700 3,840 2,220 600 540 220 3,840 680KILTAN 140 4,000 1,900 560 680 3,840 2,080 560 500 200 3,840 640AGATTI 200 5,720 2,700 780 960 5,480 2,960 780 720 280 5,480 910KAVARATTI 190 5,440 2,580 760 920 5,200 2,820 760 680 280 5,200 870KALPENI 200 5,720 2,700 780 960 5,480 2,960 780 720 280 5,480 910MINICOY 290 8,300 3,920 1,140 1,400 7,940 4,300 1,140 1,040 400 7,940 1,320ANDROTT 120 3,440 1,620 480 580 3,300 1,780 480 440 180 3,300 550AMINI 180 5,140 2,440 720 880 4,940 2,660 720 640 260 2,940 820KADMAT 180 5,140 2,440 720 880 4,940 2,660 720 640 260 2,940 820BITRA 210 6,000 2,840 820 1,020 5,780 3,120 820 760 300 5,780 960CHETLAT 180 5,140 2,440 720 880 4,940 2,660 720 640 260 2,940 820KILTAN 160 4,580 2,180 640 780 4,400 2,380 640 580 240 4,400 730AGATTI 210 6,000 2,840 820 1,020 5,780 3,120 820 760 300 5,780 960KAVARATTI 190 5,440 2,580 760 920 5,200 2,820 760 680 280 5,200 870KALPENI 140 4,000 1,900 560 680 3,840 2,080 560 500 200 3,840 640MINICOY 240 6,860 3,240 940 1,160 6,580 3,560 940 860 340 6,580 1,090
Note:- 1. Fare for children under 3 years - Token of Re.1/- irrespective of distance.2. Children between 3 to 10 years half fare.3. Children above 10 years full fare4. Fare given above is per berth/seat.
From To
M.V.Tipu Sultan M.V.Bharathseema
OwnersCabin
FirstClass
SecondClass
TouristChair
OwnersCabin
2 BirthCabin
4 BirthCabin
Rs. Rs.Rs. Rs. Rs. Rs.
ModifiedOwners Cabin
Rs.
Distancein
nauticalnauticalmi les Rs.
T.SultanB.Seema D.Setu
DeckRs.
OwnersCabin
Rs.Chair
M.V.AmindivM.V.MIinicoy
Rs.
KOCHI
ANDROTT
AMINI
KADMAT
BITRA
CHETLAT
KILTAN
AGATTI
KAVARATTI
MAN
GAL
ORE
CALICUT/BEYPORE
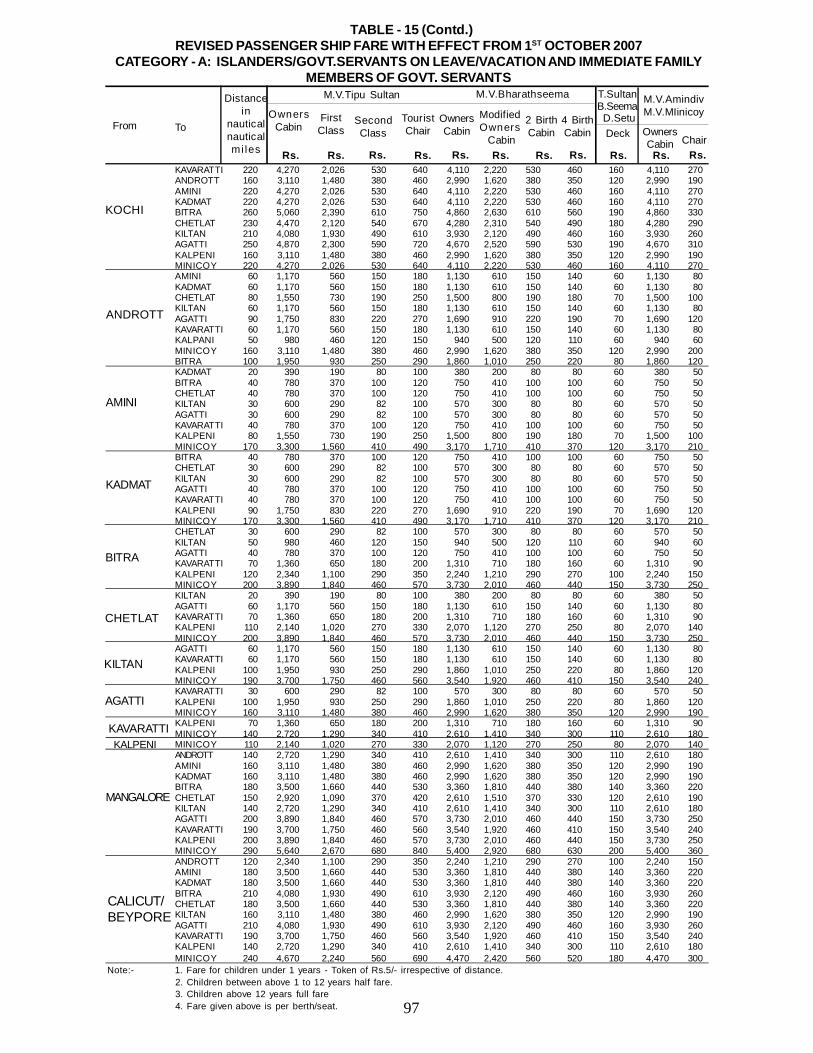
97
KAVARATTI 220 4,270 2,026 530 640 4,110 2,220 530 460 160 4,110 270ANDROTT 160 3,110 1,480 380 460 2,990 1,620 380 350 120 2,990 190AMINI 220 4,270 2,026 530 640 4,110 2,220 530 460 160 4,110 270KADMAT 220 4,270 2,026 530 640 4,110 2,220 530 460 160 4,110 270BITRA 260 5,060 2,390 610 750 4,860 2,630 610 560 190 4,860 330CHETLAT 230 4,470 2,120 540 670 4,280 2,310 540 490 180 4,280 290KILTAN 210 4,080 1,930 490 610 3,930 2,120 490 460 160 3,930 260AGATTI 250 4,870 2,300 590 720 4,670 2,520 590 530 190 4,670 310KALPENI 160 3,110 1,480 380 460 2,990 1,620 380 350 120 2,990 190MINICOY 220 4,270 2,026 530 640 4,110 2,220 530 460 160 4,110 270AMINI 60 1,170 560 150 180 1,130 610 150 140 60 1,130 80KADMAT 60 1,170 560 150 180 1,130 610 150 140 60 1,130 80CHETLAT 80 1,550 730 190 250 1,500 800 190 180 70 1,500 100KILTAN 60 1,170 560 150 180 1,130 610 150 140 60 1,130 80AGATTI 90 1,750 830 220 270 1,690 910 220 190 70 1,690 120KAVARATTI 60 1,170 560 150 180 1,130 610 150 140 60 1,130 80KALPANI 50 980 460 120 150 940 500 120 110 60 940 60MINICOY 160 3,110 1,480 380 460 2,990 1,620 380 350 120 2,990 200BITRA 100 1,950 930 250 290 1,860 1,010 250 220 80 1,860 120KADMAT 20 390 190 80 100 380 200 80 80 60 380 50BITRA 40 780 370 100 120 750 410 100 100 60 750 50CHETLAT 40 780 370 100 120 750 410 100 100 60 750 50KILTAN 30 600 290 82 100 570 300 80 80 60 570 50AGATTI 30 600 290 82 100 570 300 80 80 60 570 50KAVARATTI 40 780 370 100 120 750 410 100 100 60 750 50KALPENI 80 1,550 730 190 250 1,500 800 190 180 70 1,500 100MINICOY 170 3,300 1,560 410 490 3,170 1,710 410 370 120 3,170 210BITRA 40 780 370 100 120 750 410 100 100 60 750 50CHETLAT 30 600 290 82 100 570 300 80 80 60 570 50KILTAN 30 600 290 82 100 570 300 80 80 60 570 50AGATTI 40 780 370 100 120 750 410 100 100 60 750 50KAVARATTI 40 780 370 100 120 750 410 100 100 60 750 50KALPENI 90 1,750 830 220 270 1,690 910 220 190 70 1,690 120MINICOY 170 3,300 1,560 410 490 3,170 1,710 410 370 120 3,170 210CHETLAT 30 600 290 82 100 570 300 80 80 60 570 50KILTAN 50 980 460 120 150 940 500 120 110 60 940 60AGATTI 40 780 370 100 120 750 410 100 100 60 750 50KAVARATTI 70 1,360 650 180 200 1,310 710 180 160 60 1,310 90KALPENI 120 2,340 1,100 290 350 2,240 1,210 290 270 100 2,240 150MINICOY 200 3,890 1,840 460 570 3,730 2,010 460 440 150 3,730 250KILTAN 20 390 190 80 100 380 200 80 80 60 380 50AGATTI 60 1,170 560 150 180 1,130 610 150 140 60 1,130 80KAVARATTI 70 1,360 650 180 200 1,310 710 180 160 60 1,310 90KALPENI 110 2,140 1,020 270 330 2,070 1,120 270 250 80 2,070 140MINICOY 200 3,890 1,840 460 570 3,730 2,010 460 440 150 3,730 250AGATTI 60 1,170 560 150 180 1,130 610 150 140 60 1,130 80KAVARATTI 60 1,170 560 150 180 1,130 610 150 140 60 1,130 80KALPENI 100 1,950 930 250 290 1,860 1,010 250 220 80 1,860 120MINICOY 190 3,700 1,750 460 560 3,540 1,920 460 410 150 3,540 240KAVARATTI 30 600 290 82 100 570 300 80 80 60 570 50KALPENI 100 1,950 930 250 290 1,860 1,010 250 220 80 1,860 120MINICOY 160 3,110 1,480 380 460 2,990 1,620 380 350 120 2,990 190KALPENI 70 1,360 650 180 200 1,310 710 180 160 60 1,310 90MINICOY 140 2,720 1,290 340 410 2,610 1,410 340 300 110 2,610 180MINICOY 110 2,140 1,020 270 330 2,070 1,120 270 250 80 2,070 140ANDROTT 140 2,720 1,290 340 410 2,610 1,410 340 300 110 2,610 180AMINI 160 3,110 1,480 380 460 2,990 1,620 380 350 120 2,990 190KADMAT 160 3,110 1,480 380 460 2,990 1,620 380 350 120 2,990 190BITRA 180 3,500 1,660 440 530 3,360 1,810 440 380 140 3,360 220CHETLAT 150 2,920 1,090 370 420 2,610 1,510 370 330 120 2,610 190KILTAN 140 2,720 1,290 340 410 2,610 1,410 340 300 110 2,610 180AGATTI 200 3,890 1,840 460 570 3,730 2,010 460 440 150 3,730 250KAVARATTI 190 3,700 1,750 460 560 3,540 1,920 460 410 150 3,540 240KALPENI 200 3,890 1,840 460 570 3,730 2,010 460 440 150 3,730 250MINICOY 290 5,640 2,670 680 840 5,400 2,920 680 630 200 5,400 360ANDROTT 120 2,340 1,100 290 350 2,240 1,210 290 270 100 2,240 150AMINI 180 3,500 1,660 440 530 3,360 1,810 440 380 140 3,360 220KADMAT 180 3,500 1,660 440 530 3,360 1,810 440 380 140 3,360 220BITRA 210 4,080 1,930 490 610 3,930 2,120 490 460 160 3,930 260CHETLAT 180 3,500 1,660 440 530 3,360 1,810 440 380 140 3,360 220KILTAN 160 3,110 1,480 380 460 2,990 1,620 380 350 120 2,990 190AGATTI 210 4,080 1,930 490 610 3,930 2,120 490 460 160 3,930 260KAVARATTI 190 3,700 1,750 460 560 3,540 1,920 460 410 150 3,540 240KALPENI 140 2,720 1,290 340 410 2,610 1,410 340 300 110 2,610 180MINICOY 240 4,670 2,240 560 690 4,470 2,420 560 520 180 4,470 300
Note:- 1. Fare for children under 1 years - Token of Rs.5/- irrespective of distance.2. Children between above 1 to 12 years half fare.3. Children above 12 years full fare4. Fare given above is per berth/seat.
TABLE - 15 (Contd.)REVISED PASSENGER SHIP FARE WITH EFFECT FROM 1ST OCTOBER 2007
CATEGORY - A: ISLANDERS/GOVT.SERVANTS ON LEAVE/VACATION AND IMMEDIATE FAMILYMEMBERS OF GOVT. SERVANTS
From To
M.V.Tipu Sultan M.V.Bharathseema
OwnersCabin
FirstClass
SecondClass
TouristChair
OwnersCabin
2 BirthCabin
4 BirthCabin
Rs. Rs.Rs. Rs. Rs. Rs.
ModifiedOwners Cabin
Rs.
Distancein
nauticalnauticalmi les Rs.
T.SultanB.Seema D.Setu Deck
Rs.
OwnersCabin
Rs.Chair
M.V.AmindivM.V.MIinicoy
Rs.
KOCHI
ANDROTT
AMINI
KADMAT
BITRA
CHETLAT
KILTAN
AGATTI
KAVARATTI
MANGALORE
KALPENI
CALICUT/BEYPORE
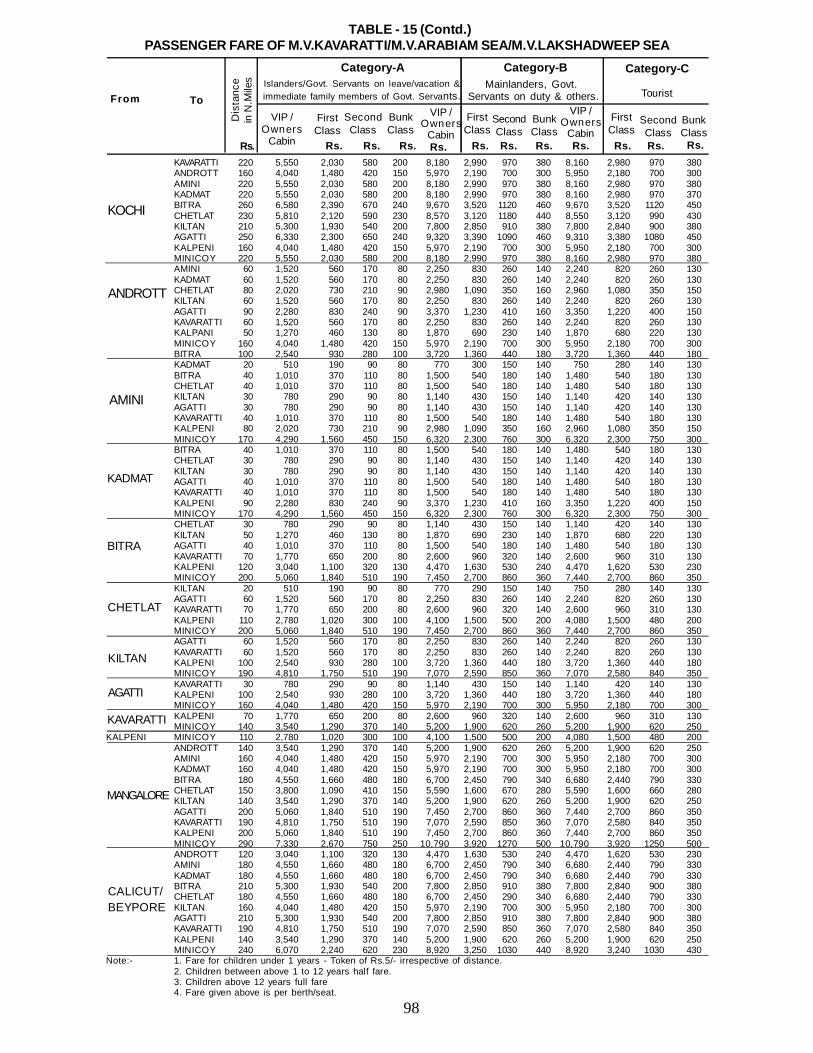
98
KAVARATTI 220 5,550 2,030 580 200 8,180 2,990 970 380 8,160 2,980 970 380ANDROTT 160 4,040 1,480 420 150 5,970 2,190 700 300 5,950 2,180 700 300AMINI 220 5,550 2,030 580 200 8,180 2,990 970 380 8,160 2,980 970 380KADMAT 220 5,550 2,030 580 200 8,180 2,990 970 380 8,160 2,980 970 370BITRA 260 6,580 2,390 670 240 9,670 3,520 1120 460 9,670 3,520 1120 450CHETLAT 230 5,810 2,120 590 230 8,570 3,120 1180 440 8,550 3,120 990 430KILTAN 210 5,300 1,930 540 200 7,800 2,850 910 380 7,800 2,840 900 380AGATTI 250 6,330 2,300 650 240 9,320 3,390 1090 460 9,310 3,380 1080 450KALPENI 160 4,040 1,480 420 150 5,970 2,190 700 300 5,950 2,180 700 300MINICOY 220 5,550 2,030 580 200 8,180 2,990 970 380 8,160 2,980 970 380AMINI 60 1,520 560 170 80 2,250 830 260 140 2,240 820 260 130KADMAT 60 1,520 560 170 80 2,250 830 260 140 2,240 820 260 130CHETLAT 80 2,020 730 210 90 2,980 1,090 350 160 2,960 1,080 350 150KILTAN 60 1,520 560 170 80 2,250 830 260 140 2,240 820 260 130AGATTI 90 2,280 830 240 90 3,370 1,230 410 160 3,350 1,220 400 150KAVARATTI 60 1,520 560 170 80 2,250 830 260 140 2,240 820 260 130KALPANI 50 1,270 460 130 80 1,870 690 230 140 1,870 680 220 130MINICOY 160 4,040 1,480 420 150 5,970 2,190 700 300 5,950 2,180 700 300BITRA 100 2,540 930 280 100 3,720 1,360 440 180 3,720 1,360 440 180KADMAT 20 510 190 90 80 770 300 150 140 750 280 140 130BITRA 40 1,010 370 110 80 1,500 540 180 140 1,480 540 180 130CHETLAT 40 1,010 370 110 80 1,500 540 180 140 1,480 540 180 130KILTAN 30 780 290 90 80 1,140 430 150 140 1,140 420 140 130AGATTI 30 780 290 90 80 1,140 430 150 140 1,140 420 140 130KAVARATTI 40 1,010 370 110 80 1,500 540 180 140 1,480 540 180 130KALPENI 80 2,020 730 210 90 2,980 1,090 350 160 2,960 1,080 350 150MINICOY 170 4,290 1,560 450 150 6,320 2,300 760 300 6,320 2,300 750 300BITRA 40 1,010 370 110 80 1,500 540 180 140 1,480 540 180 130CHETLAT 30 780 290 90 80 1,140 430 150 140 1,140 420 140 130KILTAN 30 780 290 90 80 1,140 430 150 140 1,140 420 140 130AGATTI 40 1,010 370 110 80 1,500 540 180 140 1,480 540 180 130KAVARATTI 40 1,010 370 110 80 1,500 540 180 140 1,480 540 180 130KALPENI 90 2,280 830 240 90 3,370 1,230 410 160 3,350 1,220 400 150MINICOY 170 4,290 1,560 450 150 6,320 2,300 760 300 6,320 2,300 750 300CHETLAT 30 780 290 90 80 1,140 430 150 140 1,140 420 140 130KILTAN 50 1,270 460 130 80 1,870 690 230 140 1,870 680 220 130AGATTI 40 1,010 370 110 80 1,500 540 180 140 1,480 540 180 130KAVARATTI 70 1,770 650 200 80 2,600 960 320 140 2,600 960 310 130KALPENI 120 3,040 1,100 320 130 4,470 1,630 530 240 4,470 1,620 530 230MINICOY 200 5,060 1,840 510 190 7,450 2,700 860 360 7,440 2,700 860 350KILTAN 20 510 190 90 80 770 290 150 140 750 280 140 130AGATTI 60 1,520 560 170 80 2,250 830 260 140 2,240 820 260 130KAVARATTI 70 1,770 650 200 80 2,600 960 320 140 2,600 960 310 130KALPENI 110 2,780 1,020 300 100 4,100 1,500 500 200 4,080 1,500 480 200MINICOY 200 5,060 1,840 510 190 7,450 2,700 860 360 7,440 2,700 860 350AGATTI 60 1,520 560 170 80 2,250 830 260 140 2,240 820 260 130KAVARATTI 60 1,520 560 170 80 2,250 830 260 140 2,240 820 260 130KALPENI 100 2,540 930 280 100 3,720 1,360 440 180 3,720 1,360 440 180MINICOY 190 4,810 1,750 510 190 7,070 2,590 850 360 7,070 2,580 840 350KAVARATTI 30 780 290 90 80 1,140 430 150 140 1,140 420 140 130KALPENI 100 2,540 930 280 100 3,720 1,360 440 180 3,720 1,360 440 180MINICOY 160 4,040 1,480 420 150 5,970 2,190 700 300 5,950 2,180 700 300KALPENI 70 1,770 650 200 80 2,600 960 320 140 2,600 960 310 130MINICOY 140 3,540 1,290 370 140 5,200 1,900 620 260 5,200 1,900 620 250
KALPENI MINICOY 110 2,780 1,020 300 100 4,100 1,500 500 200 4,080 1,500 480 200ANDROTT 140 3,540 1,290 370 140 5,200 1,900 620 260 5,200 1,900 620 250AMINI 160 4,040 1,480 420 150 5,970 2,190 700 300 5,950 2,180 700 300KADMAT 160 4,040 1,480 420 150 5,970 2,190 700 300 5,950 2,180 700 300BITRA 180 4,550 1,660 480 180 6,700 2,450 790 340 6,680 2,440 790 330CHETLAT 150 3,800 1,090 410 150 5,590 1,600 670 280 5,590 1,600 660 280KILTAN 140 3,540 1,290 370 140 5,200 1,900 620 260 5,200 1,900 620 250AGATTI 200 5,060 1,840 510 190 7,450 2,700 860 360 7,440 2,700 860 350KAVARATTI 190 4,810 1,750 510 190 7,070 2,590 850 360 7,070 2,580 840 350KALPENI 200 5,060 1,840 510 190 7,450 2,700 860 360 7,440 2,700 860 350MINICOY 290 7,330 2,670 750 250 10,790 3,920 1270 500 10,790 3,920 1250 500ANDROTT 120 3,040 1,100 320 130 4,470 1,630 530 240 4,470 1,620 530 230AMINI 180 4,550 1,660 480 180 6,700 2,450 790 340 6,680 2,440 790 330KADMAT 180 4,550 1,660 480 180 6,700 2,450 790 340 6,680 2,440 790 330BITRA 210 5,300 1,930 540 200 7,800 2,850 910 380 7,800 2,840 900 380CHETLAT 180 4,550 1,660 480 180 6,700 2,450 290 340 6,680 2,440 790 330KILTAN 160 4,040 1,480 420 150 5,970 2,190 700 300 5,950 2,180 700 300AGATTI 210 5,300 1,930 540 200 7,800 2,850 910 380 7,800 2,840 900 380KAVARATTI 190 4,810 1,750 510 190 7,070 2,590 850 360 7,070 2,580 840 350KALPENI 140 3,540 1,290 370 140 5,200 1,900 620 260 5,200 1,900 620 250MINICOY 240 6,070 2,240 620 230 8,920 3,250 1030 440 8,920 3,240 1030 430
Note:- 1. Fare for children under 1 years - Token of Rs.5/- irrespective of distance.2. Children between above 1 to 12 years half fare.3. Children above 12 years full fare4. Fare given above is per berth/seat.
TABLE - 15 (Contd.)PASSENGER FARE OF M.V.KAVARATTI/M.V.ARABIAM SEA/M.V.LAKSHADWEEP SEA
From To
Rs.Rs. Rs. Rs.Rs. Rs.Rs.
Category-A Category-B Category-C Islanders/Govt. Servants on leave/vacation & immediate family members of Govt. Servants.
Mainlanders, Govt. Servants on duty & others.
Rs.
Dis
tanc
ein
N.M
iles
FirstClass
SecondClass
BunkClass
FirstClass
SecondClass
BunkClass
Rs.
Tourist
VIP /Owners
Cabin
VIP /Owners
CabinRs. Rs. Rs.
FirstClass
SecondClass
BunkClass
VIP /Owners
Cabin
KOCHI
ANDROTT
AMINI
KADMAT
BITRA
CHETLAT
KILTAN
AGATTI
KAVARATTI
MANGALORE
CALICUT/BEYPORE
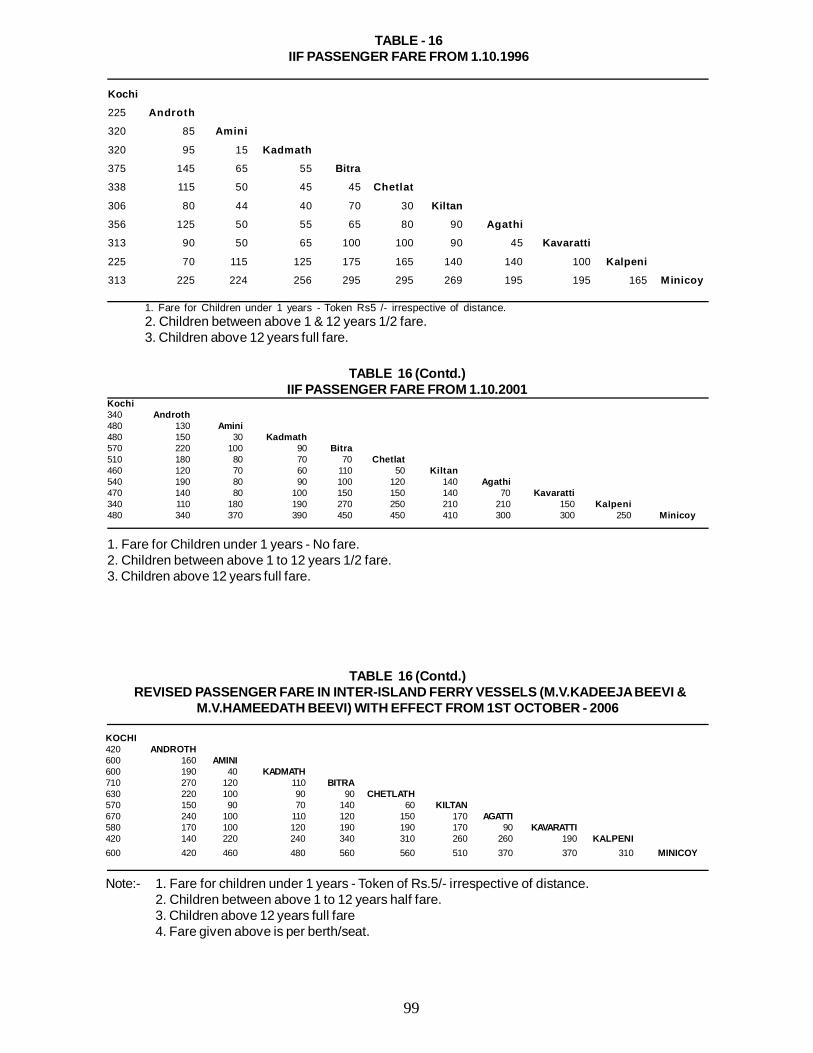
99
TABLE - 16IIF PASSENGER FARE FROM 1.10.1996
Kochi
225 Androth
320 85 Amini
320 95 15 Kadmath
375 145 65 55 Bitra
338 115 50 45 45 Chetlat
306 80 44 40 70 30 Kiltan
356 125 50 55 65 80 90 Agathi
313 90 50 65 100 100 90 45 Kavaratti
225 70 115 125 175 165 140 140 100 Kalpeni
313 225 224 256 295 295 269 195 195 165 Minicoy
1. Fare for Children under 1 years - Token Rs5 /- irrespective of distance.2. Children between above 1 & 12 years 1/2 fare.3. Children above 12 years full fare.
TABLE 16 (Contd.)IIF PASSENGER FARE FROM 1.10.2001
Kochi340 Androth480 130 Amini480 150 30 Kadmath570 220 100 90 Bitra510 180 80 70 70 Chetlat460 120 70 60 110 50 Kiltan540 190 80 90 100 120 140 Agathi470 140 80 100 150 150 140 70 Kavaratti340 110 180 190 270 250 210 210 150 Kalpeni480 340 370 390 450 450 410 300 300 250 Minicoy
1. Fare for Children under 1 years - No fare.2. Children between above 1 to 12 years 1/2 fare.3. Children above 12 years full fare.
TABLE 16 (Contd.) REVISED PASSENGER FARE IN INTER-ISLAND FERRY VESSELS (M.V.KADEEJA BEEVI &
M.V.HAMEEDATH BEEVI) WITH EFFECT FROM 1ST OCTOBER - 2006
KOCHI420 ANDROTH600 160 AMINI600 190 40 KADMATH710 270 120 110 BITRA630 220 100 90 90 CHETLATH570 150 90 70 140 60 KILTAN670 240 100 110 120 150 170 AGATTI580 170 100 120 190 190 170 90 KAVARATTI420 140 220 240 340 310 260 260 190 KALPENI600 420 460 480 560 560 510 370 370 310 MINICOY
Note:- 1. Fare for children under 1 years - Token of Rs.5/- irrespective of distance.2. Children between above 1 to 12 years half fare.3. Children above 12 years full fare4. Fare given above is per berth/seat.
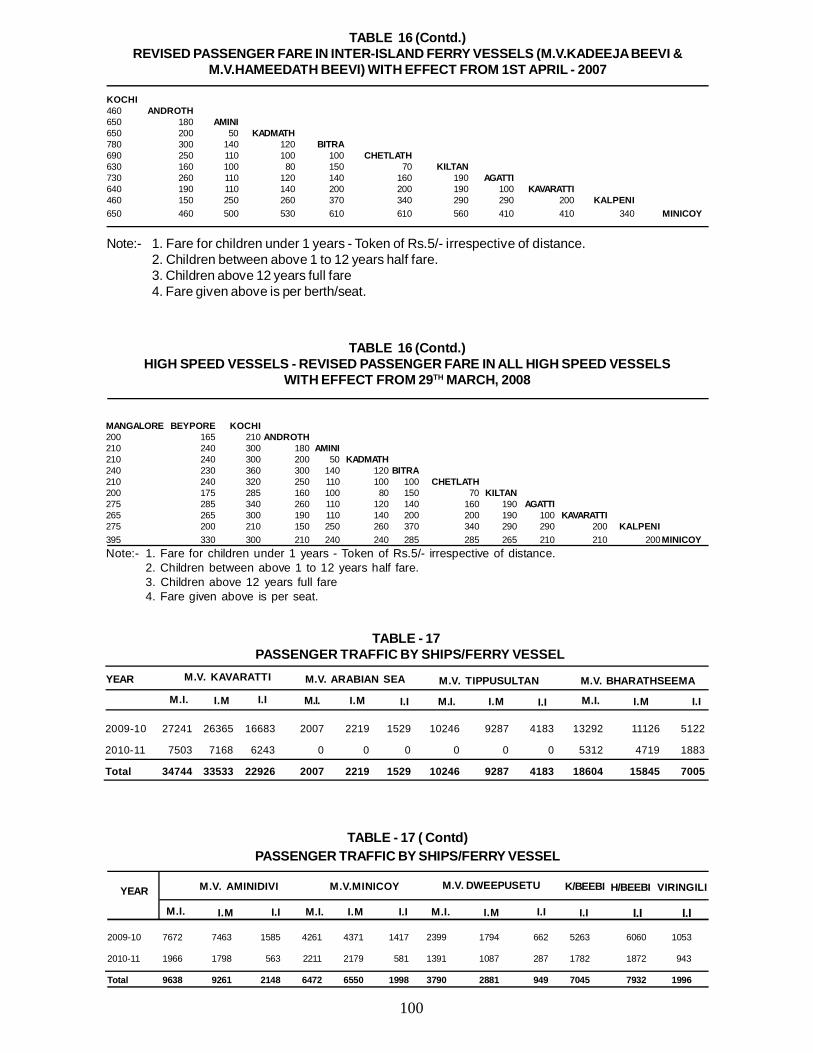
100
TABLE 16 (Contd.)REVISED PASSENGER FARE IN INTER-ISLAND FERRY VESSELS (M.V.KADEEJA BEEVI &
M.V.HAMEEDATH BEEVI) WITH EFFECT FROM 1ST APRIL - 2007
KOCHI460 ANDROTH650 180 AMINI650 200 50 KADMATH780 300 140 120 BITRA690 250 110 100 100 CHETLATH630 160 100 80 150 70 KILTAN730 260 110 120 140 160 190 AGATTI640 190 110 140 200 200 190 100 KAVARATTI460 150 250 260 370 340 290 290 200 KALPENI650 460 500 530 610 610 560 410 410 340 MINICOY
Note:- 1. Fare for children under 1 years - Token of Rs.5/- irrespective of distance.2. Children between above 1 to 12 years half fare.3. Children above 12 years full fare4. Fare given above is per berth/seat.
TABLE 16 (Contd.)HIGH SPEED VESSELS - REVISED PASSENGER FARE IN ALL HIGH SPEED VESSELS
WITH EFFECT FROM 29TH MARCH, 2008
MANGALORE BEYPORE KOCHI200 165 210 ANDROTH210 240 300 180 AMINI210 240 300 200 50 KADMATH240 230 360 300 140 120 BITRA210 240 320 250 110 100 100 CHETLATH200 175 285 160 100 80 150 70 KILTAN275 285 340 260 110 120 140 160 190 AGATTI265 265 300 190 110 140 200 200 190 100 KAVARATTI275 200 210 150 250 260 370 340 290 290 200 KALPENI395 330 300 210 240 240 285 285 265 210 210 200MINICOYNote:- 1. Fare for children under 1 years - Token of Rs.5/- irrespective of distance.
2. Children between above 1 to 12 years half fare.3. Children above 12 years full fare4. Fare given above is per seat.
2009-10 7672 7463 1585 4261 4371 1417 2399 1794 662 5263 6060 1053
2010-11 1966 1798 563 2211 2179 581 1391 1087 287 1782 1872 943
Total 9638 9261 2148 6472 6550 1998 3790 2881 949 7045 7932 1996
TABLE - 17 ( Contd)PASSENGER TRAFFIC BY SHIPS/FERRY VESSEL
YEAR M.V. AMINIDIVI M.V.MINICOY M.V. DWEEPUSETU K/BEEBI H/BEEBI VIRINGILI
M.I. I.M I.I M.I. I.M I.I M.I. I.M I.I I.I I.I I.I
2009-10 27241 26365 16683 2007 2219 1529 10246 9287 4183 13292 11126 5122
2010-11 7503 7168 6243 0 0 0 0 0 0 5312 4719 1883
Total 34744 33533 22926 2007 2219 1529 10246 9287 4183 18604 15845 7005
TABLE - 17 PASSENGER TRAFFIC BY SHIPS/FERRY VESSEL
M.I.
YEAR M.V. ARABIAN SEA M.V. TIPPUSULTAN M.V. BHARATHSEEMAM.V. KAVARATTI
I.M I.I M.I. I.M I.I M.I. I.M I.I M.I. I.M I.I
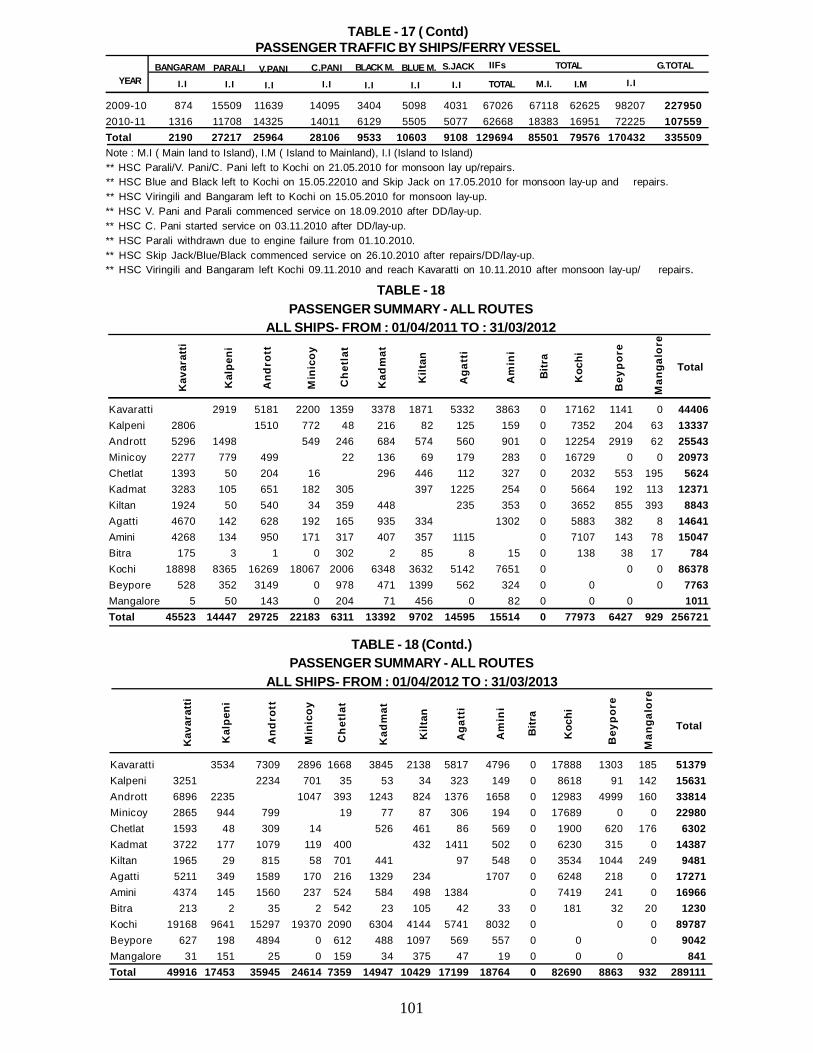
101
Kavaratti 2919 5181 2200 1359 3378 1871 5332 3863 0 17162 1141 0 44406Kalpeni 2806 1510 772 48 216 82 125 159 0 7352 204 63 13337Andrott 5296 1498 549 246 684 574 560 901 0 12254 2919 62 25543Minicoy 2277 779 499 22 136 69 179 283 0 16729 0 0 20973Chetlat 1393 50 204 16 296 446 112 327 0 2032 553 195 5624Kadmat 3283 105 651 182 305 397 1225 254 0 5664 192 113 12371Kiltan 1924 50 540 34 359 448 235 353 0 3652 855 393 8843Agatti 4670 142 628 192 165 935 334 1302 0 5883 382 8 14641Amini 4268 134 950 171 317 407 357 1115 0 7107 143 78 15047Bitra 175 3 1 0 302 2 85 8 15 0 138 38 17 784Kochi 18898 8365 16269 18067 2006 6348 3632 5142 7651 0 0 0 86378Beypore 528 352 3149 0 978 471 1399 562 324 0 0 0 7763Mangalore 5 50 143 0 204 71 456 0 82 0 0 0 1011Total 45523 14447 29725 22183 6311 13392 9702 14595 15514 0 77973 6427 929 256721
TABLE - 18PASSENGER SUMMARY - ALL ROUTES
ALL SHIPS- FROM : 01/04/2011 TO : 31/03/2012
Kav
arat
ti
Kal
peni
And
rott
Min
icoy
Che
tlat
Kad
mat
Kilt
an
Aga
tti
Am
ini
Bitr
a
Koc
hi
Bey
pore
Man
galo
re
Total
Kavaratti 3534 7309 2896 1668 3845 2138 5817 4796 0 17888 1303 185 51379Kalpeni 3251 2234 701 35 53 34 323 149 0 8618 91 142 15631Andrott 6896 2235 1047 393 1243 824 1376 1658 0 12983 4999 160 33814Minicoy 2865 944 799 19 77 87 306 194 0 17689 0 0 22980Chetlat 1593 48 309 14 526 461 86 569 0 1900 620 176 6302Kadmat 3722 177 1079 119 400 432 1411 502 0 6230 315 0 14387Kiltan 1965 29 815 58 701 441 97 548 0 3534 1044 249 9481Agatti 5211 349 1589 170 216 1329 234 1707 0 6248 218 0 17271Amini 4374 145 1560 237 524 584 498 1384 0 7419 241 0 16966Bitra 213 2 35 2 542 23 105 42 33 0 181 32 20 1230Kochi 19168 9641 15297 19370 2090 6304 4144 5741 8032 0 0 0 89787Beypore 627 198 4894 0 612 488 1097 569 557 0 0 0 9042Mangalore 31 151 25 0 159 34 375 47 19 0 0 0 841Total 49916 17453 35945 24614 7359 14947 10429 17199 18764 0 82690 8863 932 289111
TABLE - 18 (Contd.)PASSENGER SUMMARY - ALL ROUTES
ALL SHIPS- FROM : 01/04/2012 TO : 31/03/2013
Kav
arat
ti
Kal
peni
And
rott
Min
icoy
Che
tlat
Kad
mat
Kilt
an
Aga
tti
Am
ini
Bitr
a
Koc
hi
Bey
pore
Man
galo
re
Total
TABLE - 17 ( Contd)PASSENGER TRAFFIC BY SHIPS/FERRY VESSEL
2009-10 874 15509 11639 14095 3404 5098 4031 67026 67118 62625 98207 2279502010-11 1316 11708 14325 14011 6129 5505 5077 62668 18383 16951 72225 107559Total 2190 27217 25964 28106 9533 10603 9108 129694 85501 79576 170432 335509Note : M.I ( Main land to Island), I.M ( Island to Mainland), I.I (Island to Island)** HSC Parali/V. Pani/C. Pani left to Kochi on 21.05.2010 for monsoon lay up/repairs.** HSC Blue and Black left to Kochi on 15.05.22010 and Skip Jack on 17.05.2010 for monsoon lay-up and repairs.** HSC Viringili and Bangaram left to Kochi on 15.05.2010 for monsoon lay-up.** HSC V. Pani and Parali commenced service on 18.09.2010 after DD/lay-up.** HSC C. Pani started service on 03.11.2010 after DD/lay-up.** HSC Parali withdrawn due to engine failure from 01.10.2010.** HSC Skip Jack/Blue/Black commenced service on 26.10.2010 after repairs/DD/lay-up.** HSC Viringili and Bangaram left Kochi 09.11.2010 and reach Kavaratti on 10.11.2010 after monsoon lay-up/ repairs.
YEARBANGARAM PARALI V.PANI C.PANI BLACK M. BLUE M. S.JACK IIFs TOTAL G.TOTAL
I.I I.I I.I I.I I.I I.I I.I M.I. I.M I.ITOTAL
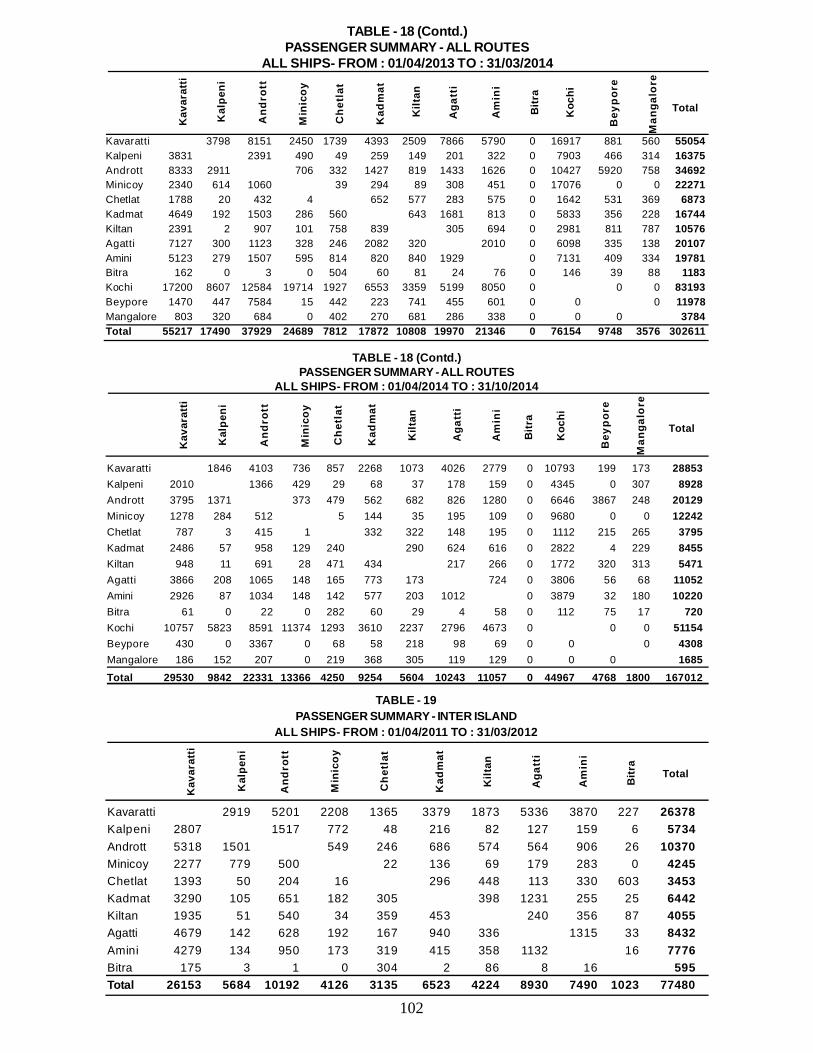
102
Kavaratti 3798 8151 2450 1739 4393 2509 7866 5790 0 16917 881 560 55054Kalpeni 3831 2391 490 49 259 149 201 322 0 7903 466 314 16375Andrott 8333 2911 706 332 1427 819 1433 1626 0 10427 5920 758 34692Minicoy 2340 614 1060 39 294 89 308 451 0 17076 0 0 22271Chetlat 1788 20 432 4 652 577 283 575 0 1642 531 369 6873Kadmat 4649 192 1503 286 560 643 1681 813 0 5833 356 228 16744Kiltan 2391 2 907 101 758 839 305 694 0 2981 811 787 10576Agatti 7127 300 1123 328 246 2082 320 2010 0 6098 335 138 20107Amini 5123 279 1507 595 814 820 840 1929 0 7131 409 334 19781Bitra 162 0 3 0 504 60 81 24 76 0 146 39 88 1183Kochi 17200 8607 12584 19714 1927 6553 3359 5199 8050 0 0 0 83193Beypore 1470 447 7584 15 442 223 741 455 601 0 0 0 11978Mangalore 803 320 684 0 402 270 681 286 338 0 0 0 3784Total 55217 17490 37929 24689 7812 17872 10808 19970 21346 0 76154 9748 3576 302611
TABLE - 18 (Contd.)PASSENGER SUMMARY - ALL ROUTES
ALL SHIPS- FROM : 01/04/2013 TO : 31/03/2014
Kav
arat
ti
Kal
peni
And
rott
Min
icoy
Che
tlat
Kad
mat
Kilt
an
Aga
tti
Am
ini
Bitr
a
Koc
hi
Bey
pore
Man
galo
re
Total
Kavaratti 1846 4103 736 857 2268 1073 4026 2779 0 10793 199 173 28853Kalpeni 2010 1366 429 29 68 37 178 159 0 4345 0 307 8928Andrott 3795 1371 373 479 562 682 826 1280 0 6646 3867 248 20129Minicoy 1278 284 512 5 144 35 195 109 0 9680 0 0 12242Chetlat 787 3 415 1 332 322 148 195 0 1112 215 265 3795Kadmat 2486 57 958 129 240 290 624 616 0 2822 4 229 8455Kiltan 948 11 691 28 471 434 217 266 0 1772 320 313 5471Agatti 3866 208 1065 148 165 773 173 724 0 3806 56 68 11052Amini 2926 87 1034 148 142 577 203 1012 0 3879 32 180 10220Bitra 61 0 22 0 282 60 29 4 58 0 112 75 17 720Kochi 10757 5823 8591 11374 1293 3610 2237 2796 4673 0 0 0 51154Beypore 430 0 3367 0 68 58 218 98 69 0 0 0 4308Mangalore 186 152 207 0 219 368 305 119 129 0 0 0 1685Total 29530 9842 22331 13366 4250 9254 5604 10243 11057 0 44967 4768 1800 167012
TABLE - 18 (Contd.)PASSENGER SUMMARY - ALL ROUTES
ALL SHIPS- FROM : 01/04/2014 TO : 31/10/2014
Kav
arat
ti
Kal
peni
And
rott
Min
icoy
Che
tlat
Kad
mat
Kilt
an
Aga
tti
Am
ini
Bitr
a
Koc
hi
Bey
pore
Man
galo
re
Total
Kavaratti 2919 5201 2208 1365 3379 1873 5336 3870 227 26378Kalpeni 2807 1517 772 48 216 82 127 159 6 5734Andrott 5318 1501 549 246 686 574 564 906 26 10370Minicoy 2277 779 500 22 136 69 179 283 0 4245Chetlat 1393 50 204 16 296 448 113 330 603 3453Kadmat 3290 105 651 182 305 398 1231 255 25 6442Kiltan 1935 51 540 34 359 453 240 356 87 4055Agatti 4679 142 628 192 167 940 336 1315 33 8432Amini 4279 134 950 173 319 415 358 1132 16 7776Bitra 175 3 1 0 304 2 86 8 16 595Total 26153 5684 10192 4126 3135 6523 4224 8930 7490 1023 77480
TABLE - 19PASSENGER SUMMARY - INTER ISLAND
ALL SHIPS- FROM : 01/04/2011 TO : 31/03/2012
Kav
arat
ti
Kal
peni
And
rott
Min
icoy
Che
tlat
Kad
mat
Kilt
an
Aga
tti
Am
ini
Bitr
a
Total
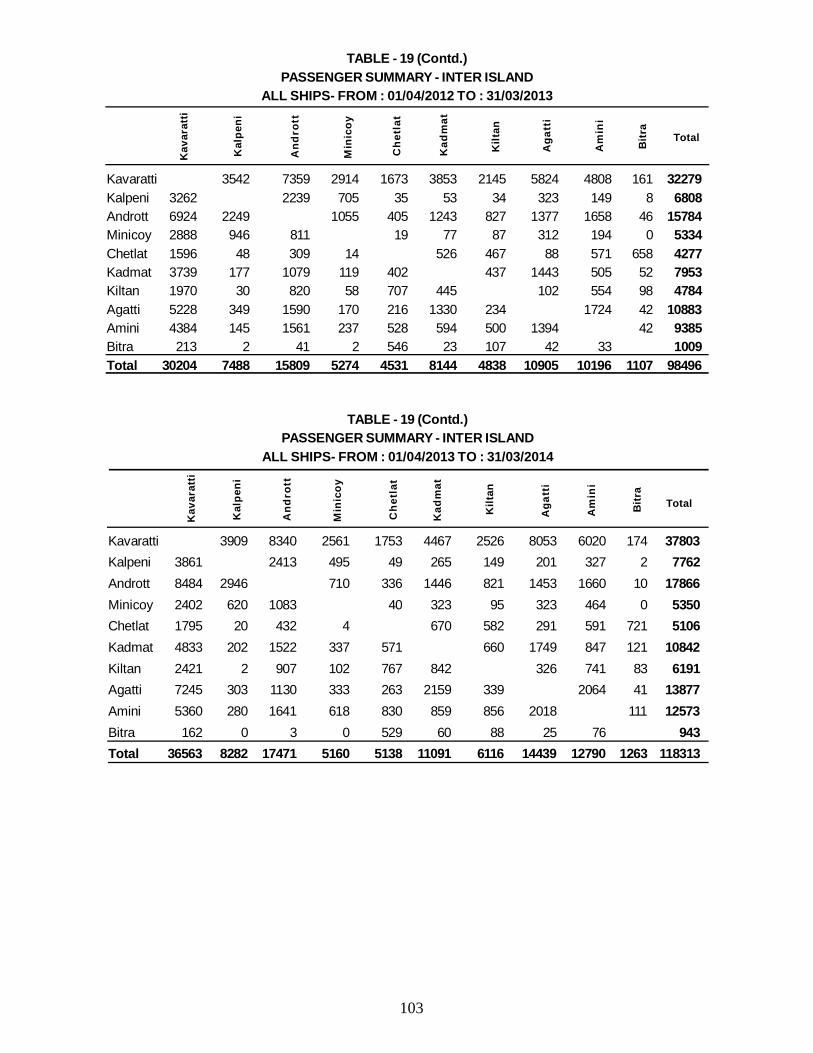
103
Kavaratti 3542 7359 2914 1673 3853 2145 5824 4808 161 32279Kalpeni 3262 2239 705 35 53 34 323 149 8 6808Andrott 6924 2249 1055 405 1243 827 1377 1658 46 15784Minicoy 2888 946 811 19 77 87 312 194 0 5334Chetlat 1596 48 309 14 526 467 88 571 658 4277Kadmat 3739 177 1079 119 402 437 1443 505 52 7953Kiltan 1970 30 820 58 707 445 102 554 98 4784Agatti 5228 349 1590 170 216 1330 234 1724 42 10883Amini 4384 145 1561 237 528 594 500 1394 42 9385Bitra 213 2 41 2 546 23 107 42 33 1009Total 30204 7488 15809 5274 4531 8144 4838 10905 10196 1107 98496
TABLE - 19 (Contd.)PASSENGER SUMMARY - INTER ISLAND
ALL SHIPS- FROM : 01/04/2012 TO : 31/03/2013
Kav
arat
ti
Kal
peni
And
rott
Min
icoy
Che
tlat
Kad
mat
Kilt
an
Aga
tti
Am
ini
Bitr
a
Total
Kavaratti 3909 8340 2561 1753 4467 2526 8053 6020 174 37803Kalpeni 3861 2413 495 49 265 149 201 327 2 7762Andrott 8484 2946 710 336 1446 821 1453 1660 10 17866Minicoy 2402 620 1083 40 323 95 323 464 0 5350Chetlat 1795 20 432 4 670 582 291 591 721 5106Kadmat 4833 202 1522 337 571 660 1749 847 121 10842Kiltan 2421 2 907 102 767 842 326 741 83 6191Agatti 7245 303 1130 333 263 2159 339 2064 41 13877Amini 5360 280 1641 618 830 859 856 2018 111 12573Bitra 162 0 3 0 529 60 88 25 76 943Total 36563 8282 17471 5160 5138 11091 6116 14439 12790 1263 118313
TABLE - 19 (Contd.)PASSENGER SUMMARY - INTER ISLAND
ALL SHIPS- FROM : 01/04/2013 TO : 31/03/2014
Kav
arat
ti
Kal
peni
And
rott
Min
icoy
Che
tlat
Kad
mat
Kilt
an
Aga
tti
Am
ini
Bitr
a
Total
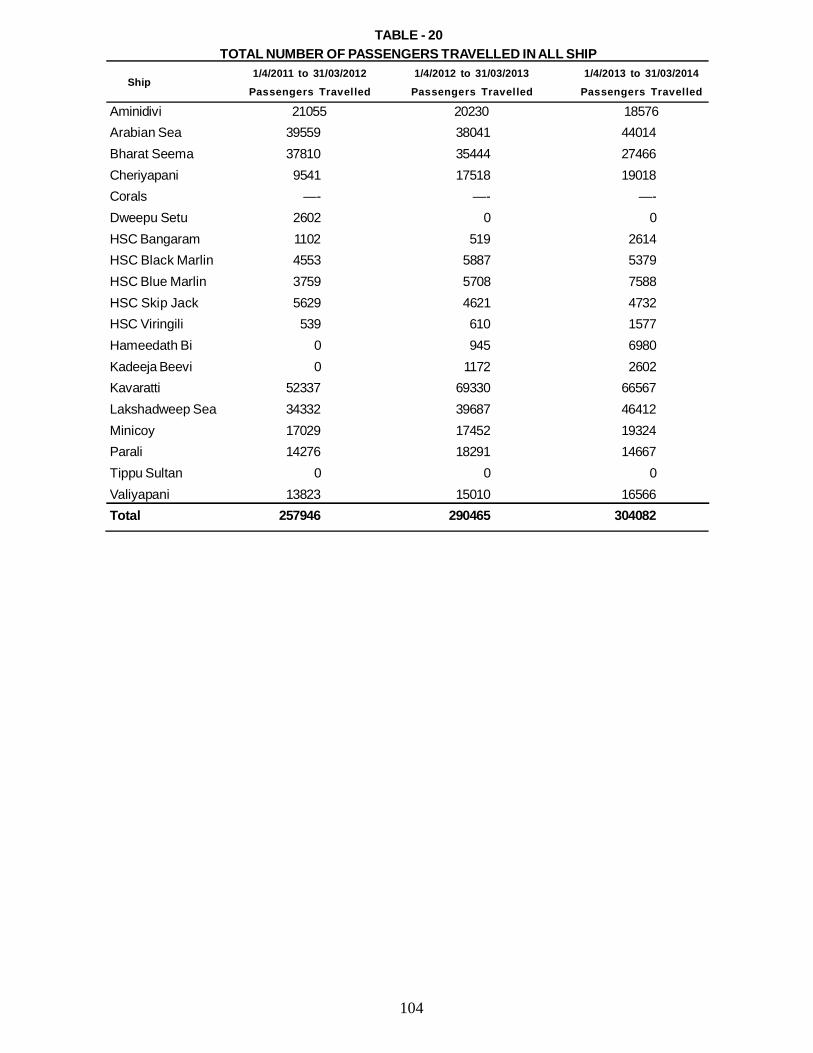
104
TABLE - 20TOTAL NUMBER OF PASSENGERS TRAVELLED IN ALL SHIP
1/4/2011 to 31/03/2012 1/4/2012 to 31/03/2013 1/4/2013 to 31/03/2014
Passengers Travelled Passengers Travelled Passengers Travelled
Aminidivi 21055 20230 18576Arabian Sea 39559 38041 44014Bharat Seema 37810 35444 27466Cheriyapani 9541 17518 19018Corals —- —- —-Dweepu Setu 2602 0 0HSC Bangaram 1102 519 2614HSC Black Marlin 4553 5887 5379HSC Blue Marlin 3759 5708 7588HSC Skip Jack 5629 4621 4732HSC Viringili 539 610 1577Hameedath Bi 0 945 6980Kadeeja Beevi 0 1172 2602Kavaratti 52337 69330 66567Lakshadweep Sea 34332 39687 46412Minicoy 17029 17452 19324Parali 14276 18291 14667Tippu Sultan 0 0 0Valiyapani 13823 15010 16566Total 257946 290465 304082
Ship
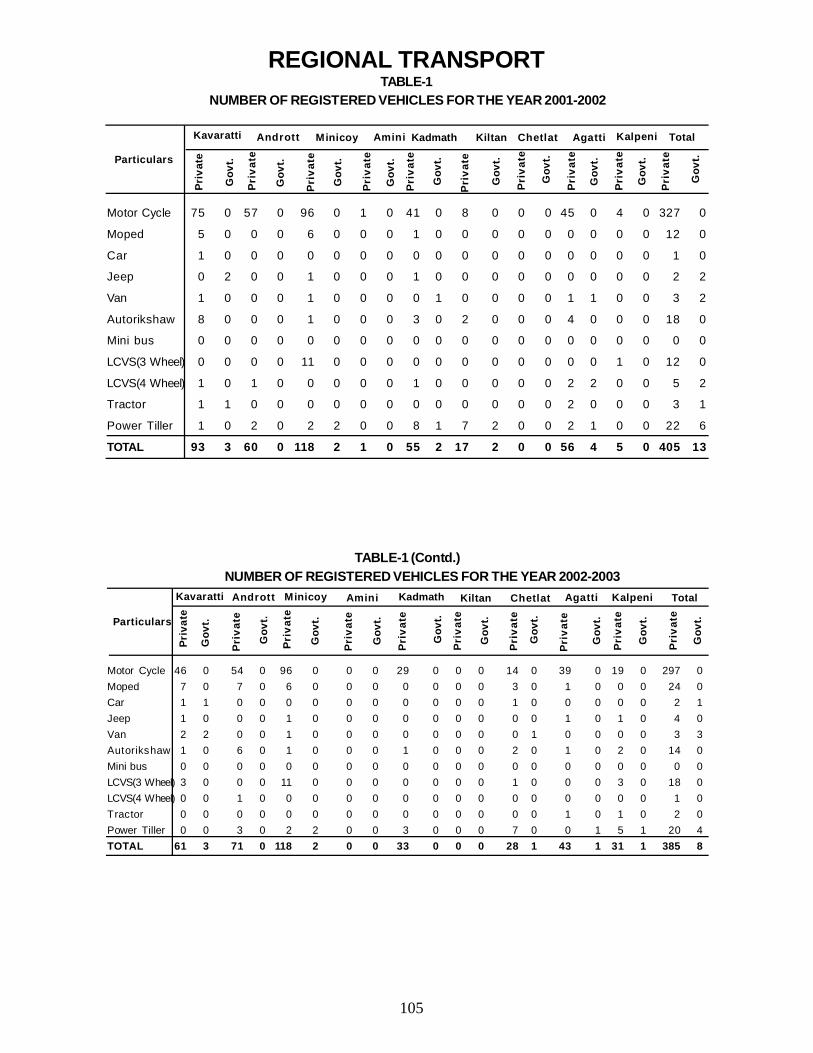
105
Motor Cycle 75 0 57 0 96 0 1 0 41 0 8 0 0 0 45 0 4 0 327 0
Moped 5 0 0 0 6 0 0 0 1 0 0 0 0 0 0 0 0 0 12 0
Car 1 0 0 0 0 0 0 0 0 0 0 0 0 0 0 0 0 0 1 0
Jeep 0 2 0 0 1 0 0 0 1 0 0 0 0 0 0 0 0 0 2 2
Van 1 0 0 0 1 0 0 0 0 1 0 0 0 0 1 1 0 0 3 2
Autorikshaw 8 0 0 0 1 0 0 0 3 0 2 0 0 0 4 0 0 0 18 0
Mini bus 0 0 0 0 0 0 0 0 0 0 0 0 0 0 0 0 0 0 0 0
LCVS(3 Wheel) 0 0 0 0 11 0 0 0 0 0 0 0 0 0 0 0 1 0 12 0
LCVS(4 Wheel) 1 0 1 0 0 0 0 0 1 0 0 0 0 0 2 2 0 0 5 2
Tractor 1 1 0 0 0 0 0 0 0 0 0 0 0 0 2 0 0 0 3 1
Power Tiller 1 0 2 0 2 2 0 0 8 1 7 2 0 0 2 1 0 0 22 6
TOTAL 93 3 60 0 118 2 1 0 55 2 17 2 0 0 56 4 5 0 405 13
REGIONAL TRANSPORTTABLE-1
NUMBER OF REGISTERED VEHICLES FOR THE YEAR 2001-2002
Particulars
Kavaratti Andrott Minicoy Amini Kadmath Kiltan Chetlat Agatti Kalpeni Total
Pri
vate
Gov
t.
Priv
ate
Gov
t.
Priv
ate
Gov
t.
Priv
ate
Gov
t.
Priv
ate
Gov
t.
Priv
ate
Gov
t.
Priv
ate
Gov
t.
Priv
ate
Gov
t.
Priv
ate
Gov
t.
Priv
ate
Gov
t.
Motor Cycle 46 0 54 0 96 0 0 0 29 0 0 0 14 0 39 0 19 0 297 0Moped 7 0 7 0 6 0 0 0 0 0 0 0 3 0 1 0 0 0 24 0Car 1 1 0 0 0 0 0 0 0 0 0 0 1 0 0 0 0 0 2 1Jeep 1 0 0 0 1 0 0 0 0 0 0 0 0 0 1 0 1 0 4 0Van 2 2 0 0 1 0 0 0 0 0 0 0 0 1 0 0 0 0 3 3Autorikshaw 1 0 6 0 1 0 0 0 1 0 0 0 2 0 1 0 2 0 14 0Mini bus 0 0 0 0 0 0 0 0 0 0 0 0 0 0 0 0 0 0 0 0LCVS(3 Wheel) 3 0 0 0 11 0 0 0 0 0 0 0 1 0 0 0 3 0 18 0LCVS(4 Wheel) 0 0 1 0 0 0 0 0 0 0 0 0 0 0 0 0 0 0 1 0Tractor 0 0 0 0 0 0 0 0 0 0 0 0 0 0 1 0 1 0 2 0Power Tiller 0 0 3 0 2 2 0 0 3 0 0 0 7 0 0 1 5 1 20 4TOTAL 61 3 71 0 118 2 0 0 33 0 0 0 28 1 43 1 31 1 385 8
TABLE-1 (Contd.)NUMBER OF REGISTERED VEHICLES FOR THE YEAR 2002-2003
Particulars
Kavaratti Andrott Minicoy Amini Kadmath Kiltan Chetlat Agatti Kalpeni Total
Pri
vate
Gov
t.
Priv
ate
Gov
t.
Priv
ate
Gov
t.
Priv
ate
Gov
t.
Priv
ate
Gov
t.
Priv
ate
Gov
t.
Priv
ate
Gov
t.
Priv
ate
Gov
t.
Priv
ate
Gov
t.
Priv
ate
Gov
t.
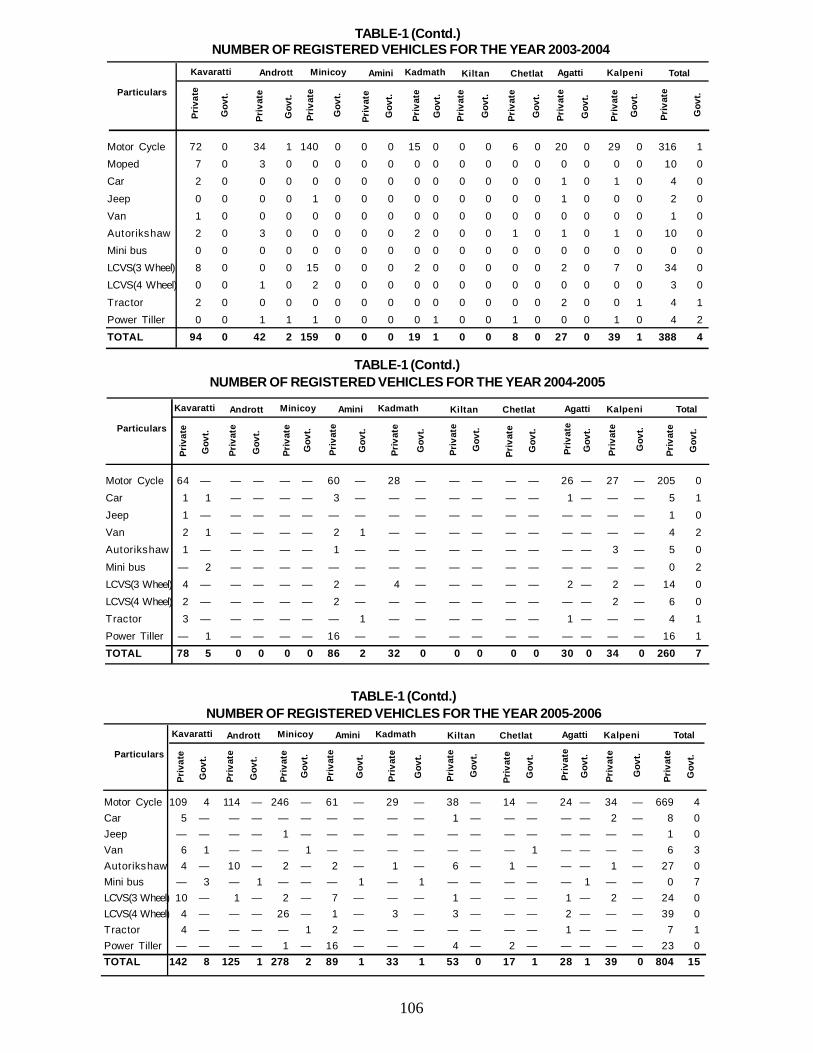
106
TABLE-1 (Contd.) NUMBER OF REGISTERED VEHICLES FOR THE YEAR 2003-2004
Motor Cycle 72 0 34 1 140 0 0 0 15 0 0 0 6 0 20 0 29 0 316 1Moped 7 0 3 0 0 0 0 0 0 0 0 0 0 0 0 0 0 0 10 0Car 2 0 0 0 0 0 0 0 0 0 0 0 0 0 1 0 1 0 4 0
Jeep 0 0 0 0 1 0 0 0 0 0 0 0 0 0 1 0 0 0 2 0Van 1 0 0 0 0 0 0 0 0 0 0 0 0 0 0 0 0 0 1 0Autorikshaw 2 0 3 0 0 0 0 0 2 0 0 0 1 0 1 0 1 0 10 0Mini bus 0 0 0 0 0 0 0 0 0 0 0 0 0 0 0 0 0 0 0 0LCVS(3 Wheel) 8 0 0 0 15 0 0 0 2 0 0 0 0 0 2 0 7 0 34 0LCVS(4 Wheel) 0 0 1 0 2 0 0 0 0 0 0 0 0 0 0 0 0 0 3 0
Tractor 2 0 0 0 0 0 0 0 0 0 0 0 0 0 2 0 0 1 4 1Power Tiller 0 0 1 1 1 0 0 0 0 1 0 0 1 0 0 0 1 0 4 2TOTAL 94 0 42 2 159 0 0 0 19 1 0 0 8 0 27 0 39 1 388 4
Particulars
Kavaratti Andrott Minicoy Amini Kadmath Kiltan Chetlat Agatti Kalpeni Total
Priv
ate
Gov
t.
Priv
ate
Gov
t.
Priv
ate
Gov
t.
Priv
ate
Gov
t.
Priv
ate
Gov
t.
Priv
ate
Gov
t.
Priv
ate
Gov
t.
Priv
ate
Gov
t.
Priv
ate
Gov
t.
Priv
ate
Gov
t.
Motor Cycle 64 — — — — — 60 — 28 — — — — — 26 — 27 — 205 0Car 1 1 — — — — 3 — — — — — — — 1 — — — 5 1Jeep 1 — — — — — — — — — — — — — — — — — 1 0Van 2 1 — — — — 2 1 — — — — — — — — — — 4 2Autorikshaw 1 — — — — — 1 — — — — — — — — — 3 — 5 0
Mini bus — 2 — — — — — — — — — — — — — — — — 0 2LCVS(3 Wheel) 4 — — — — — 2 — 4 — — — — — 2 — 2 — 14 0LCVS(4 Wheel) 2 — — — — — 2 — — — — — — — — — 2 — 6 0Tractor 3 — — — — — — 1 — — — — — — 1 — — — 4 1Power Tiller — 1 — — — — 16 — — — — — — — — — — — 16 1TOTAL 78 5 0 0 0 0 86 2 32 0 0 0 0 0 30 0 34 0 260 7
TABLE-1 (Contd.)NUMBER OF REGISTERED VEHICLES FOR THE YEAR 2004-2005
Particulars
Kavaratti Andrott Minicoy Amini Kadmath Kiltan Chetlat Agatti Kalpeni Total
Priv
ate
Gov
t.
Priv
ate
Gov
t.
Priv
ate
Gov
t.
Priv
ate
Gov
t.
Priv
ate
Gov
t.
Priv
ate
Gov
t.
Priv
ate
Gov
t.
Priv
ate
Gov
t.
Priv
ate
Gov
t.
Priv
ate
Gov
t.
Motor Cycle 109 4 114 — 246 — 61 — 29 — 38 — 14 — 24 — 34 — 669 4Car 5 — — — — — — — — — 1 — — — — — 2 — 8 0Jeep — — — — 1 — — — — — — — — — — — — — 1 0Van 6 1 — — — 1 — — — — — — — 1 — — — — 6 3Autorikshaw 4 — 10 — 2 — 2 — 1 — 6 — 1 — — — 1 — 27 0Mini bus — 3 — 1 — — — 1 — 1 — — — — — 1 — — 0 7LCVS(3 Wheel) 10 — 1 — 2 — 7 — — — 1 — — — 1 — 2 — 24 0LCVS(4 Wheel) 4 — — — 26 — 1 — 3 — 3 — — — 2 — — — 39 0Tractor 4 — — — — 1 2 — — — — — — — 1 — — — 7 1Power Tiller — — — — 1 — 16 — — — 4 — 2 — — — — — 23 0TOTAL 142 8 125 1 278 2 89 1 33 1 53 0 17 1 28 1 39 0 804 15
TABLE-1 (Contd.)NUMBER OF REGISTERED VEHICLES FOR THE YEAR 2005-2006
Particulars
Kavaratti Andrott Minicoy Amini Kadmath Kiltan Chetlat Agatti Kalpeni Total
Priv
ate
Gov
t.
Priv
ate
Gov
t.
Priv
ate
Gov
t.
Priv
ate
Gov
t.
Priv
ate
Gov
t.
Priv
ate
Gov
t.
Priv
ate
Gov
t.
Priv
ate
Gov
t.
Priv
ate
Gov
t.
Priv
ate
Gov
t.
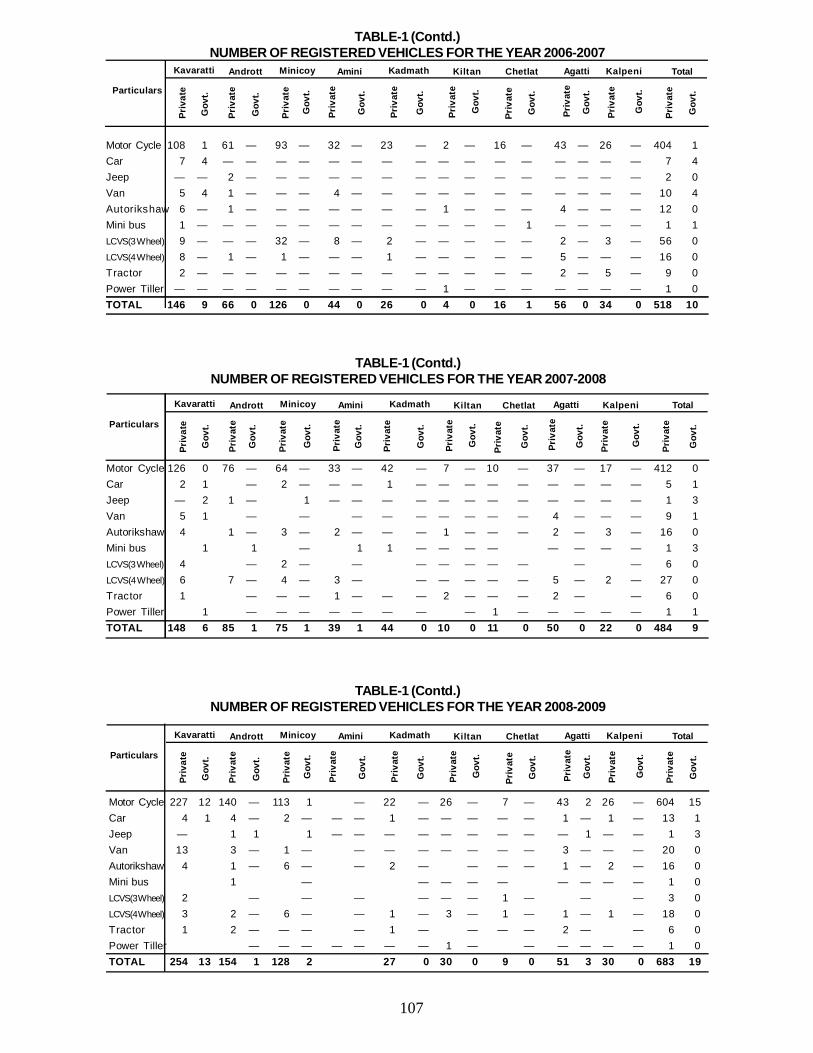
107
Motor Cycle 108 1 61 — 93 — 32 — 23 — 2 — 16 — 43 — 26 — 404 1Car 7 4 — — — — — — — — — — — — — — — — 7 4Jeep — — 2 — — — — — — — — — — — — — — — 2 0Van 5 4 1 — — — 4 — — — — — — — — — — — 10 4Autorikshaw 6 — 1 — — — — — — — 1 — — — 4 — — — 12 0Mini bus 1 — — — — — — — — — — — — 1 — — — — 1 1LCVS(3 Wheel) 9 — — — 32 — 8 — 2 — — — — — 2 — 3 — 56 0LCVS(4 Wheel) 8 — 1 — 1 — — — 1 — — — — — 5 — — — 16 0Tractor 2 — — — — — — — — — — — — — 2 — 5 — 9 0Power Tiller — — — — — — — — — — 1 — — — — — — — 1 0TOTAL 146 9 66 0 126 0 44 0 26 0 4 0 16 1 56 0 34 0 518 10
TABLE-1 (Contd.)NUMBER OF REGISTERED VEHICLES FOR THE YEAR 2006-2007
Particulars
Kavaratti Andrott Minicoy Amini Kadmath Kiltan Chetlat Agatti Kalpeni Total
Priv
ate
Gov
t.
Priv
ate
Gov
t.
Priv
ate
Gov
t.
Priv
ate
Gov
t.
Priv
ate
Gov
t.
Priv
ate
Gov
t.
Priv
ate
Gov
t.
Priv
ate
Gov
t.
Priv
ate
Gov
t.
Priv
ate
Gov
t.
TABLE-1 (Contd.)NUMBER OF REGISTERED VEHICLES FOR THE YEAR 2007-2008
Motor Cycle 126 0 76 — 64 — 33 — 42 — 7 — 10 — 37 — 17 — 412 0Car 2 1 — 2 — — — 1 — — — — — — — — — 5 1Jeep — 2 1 — 1 — — — — — — — — — — — — 1 3Van 5 1 — — — — — — — — — 4 — — — 9 1Autorikshaw 4 1 — 3 — 2 — — — 1 — — — 2 — 3 — 16 0Mini bus 1 1 — 1 1 — — — — — — — — 1 3LCVS(3 Wheel) 4 — 2 — — — — — — — — — 6 0LCVS(4 Wheel) 6 7 — 4 — 3 — — — — — — 5 — 2 — 27 0Tractor 1 — — — 1 — — — 2 — — — 2 — — 6 0Power Tiller 1 — — — — — — — — 1 — — — — — 1 1TOTAL 148 6 85 1 75 1 39 1 44 0 10 0 11 0 50 0 22 0 484 9
Particulars
Kavaratti Andrott Minicoy Amini Kadmath Kiltan Chetlat Agatti Kalpeni Total
Priv
ate
Gov
t.
Priv
ate
Gov
t.
Priv
ate
Gov
t.
Priv
ate
Gov
t.
Priv
ate
Gov
t.
Priv
ate
Gov
t.
Priv
ate
Gov
t.
Priv
ate
Gov
t.
Priv
ate
Gov
t.
Priv
ate
Gov
t.
Motor Cycle 227 12 140 — 113 1 — 22 — 26 — 7 — 43 2 26 — 604 15Car 4 1 4 — 2 — — — 1 — — — — — 1 — 1 — 13 1Jeep — 1 1 1 — — — — — — — — — 1 — — 1 3Van 13 3 — 1 — — — — — — — — 3 — — — 20 0Autorikshaw 4 1 — 6 — — 2 — — — — 1 — 2 — 16 0Mini bus 1 — — — — — — — — — 1 0LCVS(3 Wheel) 2 — — — — — — 1 — — — 3 0LCVS(4 Wheel) 3 2 — 6 — — 1 — 3 — 1 — 1 — 1 — 18 0Tractor 1 2 — — — — 1 — — — — 2 — — 6 0Power Tiller — — — — — — — 1 — — — — — — 1 0TOTAL 254 13 154 1 128 2 27 0 30 0 9 0 51 3 30 0 683 19
TABLE-1 (Contd.)NUMBER OF REGISTERED VEHICLES FOR THE YEAR 2008-2009
Particulars
Kavaratti Andrott Minicoy Amini Kadmath Kiltan Chetlat Agatti Kalpeni Total
Priv
ate
Gov
t.
Priv
ate
Gov
t.
Priv
ate
Gov
t.
Priv
ate
Gov
t.
Priv
ate
Gov
t.
Priv
ate
Gov
t.
Priv
ate
Gov
t.
Priv
ate
Gov
t.
Priv
ate
Gov
t.
Priv
ate
Gov
t.
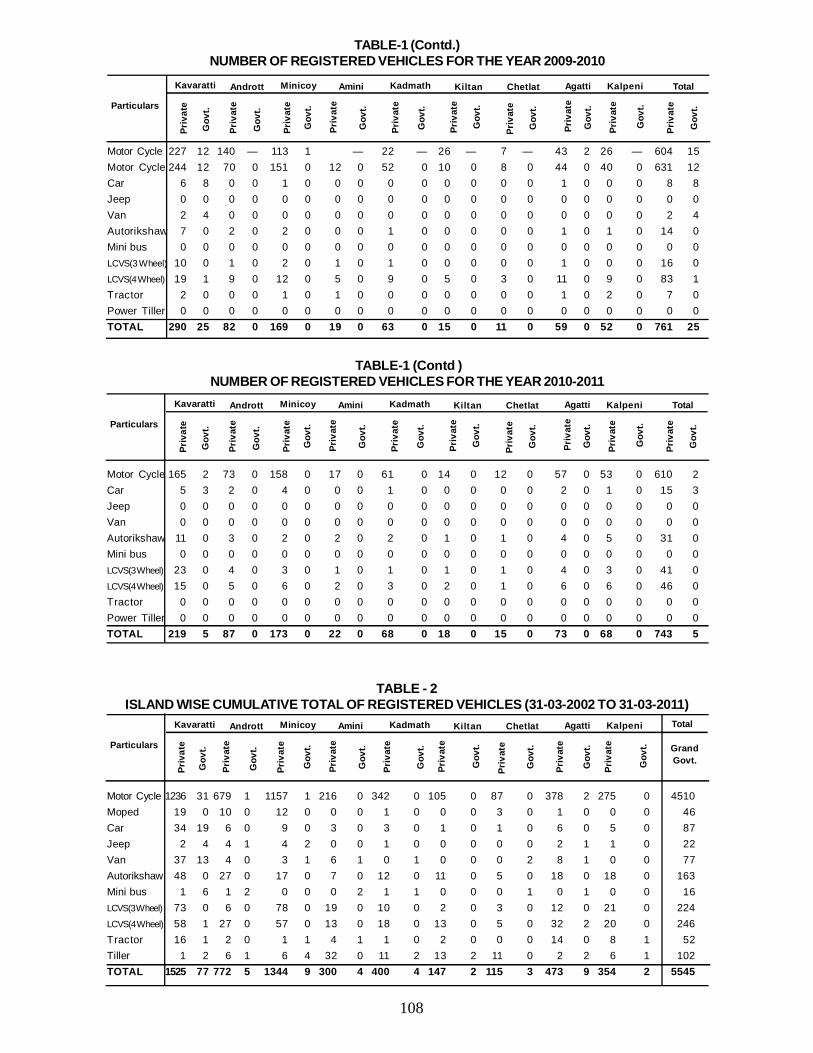
108
Motor Cycle 227 12 140 — 113 1 — 22 — 26 — 7 — 43 2 26 — 604 15Motor Cycle 244 12 70 0 151 0 12 0 52 0 10 0 8 0 44 0 40 0 631 12Car 6 8 0 0 1 0 0 0 0 0 0 0 0 0 1 0 0 0 8 8Jeep 0 0 0 0 0 0 0 0 0 0 0 0 0 0 0 0 0 0 0 0Van 2 4 0 0 0 0 0 0 0 0 0 0 0 0 0 0 0 0 2 4Autorikshaw 7 0 2 0 2 0 0 0 1 0 0 0 0 0 1 0 1 0 14 0Mini bus 0 0 0 0 0 0 0 0 0 0 0 0 0 0 0 0 0 0 0 0LCVS(3 Wheel) 10 0 1 0 2 0 1 0 1 0 0 0 0 0 1 0 0 0 16 0LCVS(4 Wheel) 19 1 9 0 12 0 5 0 9 0 5 0 3 0 11 0 9 0 83 1Tractor 2 0 0 0 1 0 1 0 0 0 0 0 0 0 1 0 2 0 7 0Power Tiller 0 0 0 0 0 0 0 0 0 0 0 0 0 0 0 0 0 0 0 0TOTAL 290 25 82 0 169 0 19 0 63 0 15 0 11 0 59 0 52 0 761 25
TABLE-1 (Contd.)NUMBER OF REGISTERED VEHICLES FOR THE YEAR 2009-2010
Particulars
Kavaratti Andrott Minicoy Amini Kadmath Kiltan Chetlat Agatti Kalpeni Total
Priv
ate
Gov
t.
Priv
ate
Gov
t.
Priv
ate
Gov
t.
Priv
ate
Gov
t.
Priv
ate
Gov
t.
Priv
ate
Gov
t.
Priv
ate
Gov
t.
Priv
ate
Gov
t.
Priv
ate
Gov
t.
Priv
ate
Gov
t.
Motor Cycle 165 2 73 0 158 0 17 0 61 0 14 0 12 0 57 0 53 0 610 2Car 5 3 2 0 4 0 0 0 1 0 0 0 0 0 2 0 1 0 15 3Jeep 0 0 0 0 0 0 0 0 0 0 0 0 0 0 0 0 0 0 0 0Van 0 0 0 0 0 0 0 0 0 0 0 0 0 0 0 0 0 0 0 0Autorikshaw 11 0 3 0 2 0 2 0 2 0 1 0 1 0 4 0 5 0 31 0Mini bus 0 0 0 0 0 0 0 0 0 0 0 0 0 0 0 0 0 0 0 0LCVS(3 Wheel) 23 0 4 0 3 0 1 0 1 0 1 0 1 0 4 0 3 0 41 0LCVS(4 Wheel) 15 0 5 0 6 0 2 0 3 0 2 0 1 0 6 0 6 0 46 0Tractor 0 0 0 0 0 0 0 0 0 0 0 0 0 0 0 0 0 0 0 0Power Tiller 0 0 0 0 0 0 0 0 0 0 0 0 0 0 0 0 0 0 0 0TOTAL 219 5 87 0 173 0 22 0 68 0 18 0 15 0 73 0 68 0 743 5
TABLE-1 (Contd )NUMBER OF REGISTERED VEHICLES FOR THE YEAR 2010-2011
Particulars
Kavaratti Andrott Minicoy Amini Kadmath Kiltan Chetlat Agatti Kalpeni Total
Priv
ate
Gov
t.
Priv
ate
Gov
t.
Priv
ate
Gov
t.
Priv
ate
Gov
t.
Priv
ate
Gov
t.
Priv
ate
Gov
t.
Priv
ate
Gov
t.
Priv
ate
Gov
t.
Priv
ate
Gov
t.
Priv
ate
Gov
t.
Motor Cycle 1236 31 679 1 1157 1 216 0 342 0 105 0 87 0 378 2 275 0 4510Moped 19 0 10 0 12 0 0 0 1 0 0 0 3 0 1 0 0 0 46Car 34 19 6 0 9 0 3 0 3 0 1 0 1 0 6 0 5 0 87Jeep 2 4 4 1 4 2 0 0 1 0 0 0 0 0 2 1 1 0 22Van 37 13 4 0 3 1 6 1 0 1 0 0 0 2 8 1 0 0 77Autorikshaw 48 0 27 0 17 0 7 0 12 0 11 0 5 0 18 0 18 0 163Mini bus 1 6 1 2 0 0 0 2 1 1 0 0 0 1 0 1 0 0 16LCVS(3 Wheel) 73 0 6 0 78 0 19 0 10 0 2 0 3 0 12 0 21 0 224LCVS(4 Wheel) 58 1 27 0 57 0 13 0 18 0 13 0 5 0 32 2 20 0 246Tractor 16 1 2 0 1 1 4 1 1 0 2 0 0 0 14 0 8 1 52Tiller 1 2 6 1 6 4 32 0 11 2 13 2 11 0 2 2 6 1 102TOTAL 1525 77 772 5 1344 9 300 4 400 4 147 2 115 3 473 9 354 2 5545
TABLE - 2ISLAND WISE CUMULATIVE TOTAL OF REGISTERED VEHICLES (31-03-2002 TO 31-03-2011)
Particulars
Kavaratti Andrott Minicoy Amini Kadmath Kiltan Chetlat Agatti Kalpeni Total
Priv
ate
Gov
t.
Priv
ate
Gov
t.
Priv
ate
Gov
t.
Priv
ate
Gov
t.
Priv
ate
Gov
t.
Priv
ate
Gov
t.
Priv
ate
Gov
t.
Priv
ate
Gov
t.
Priv
ate
Gov
t. GrandGovt.
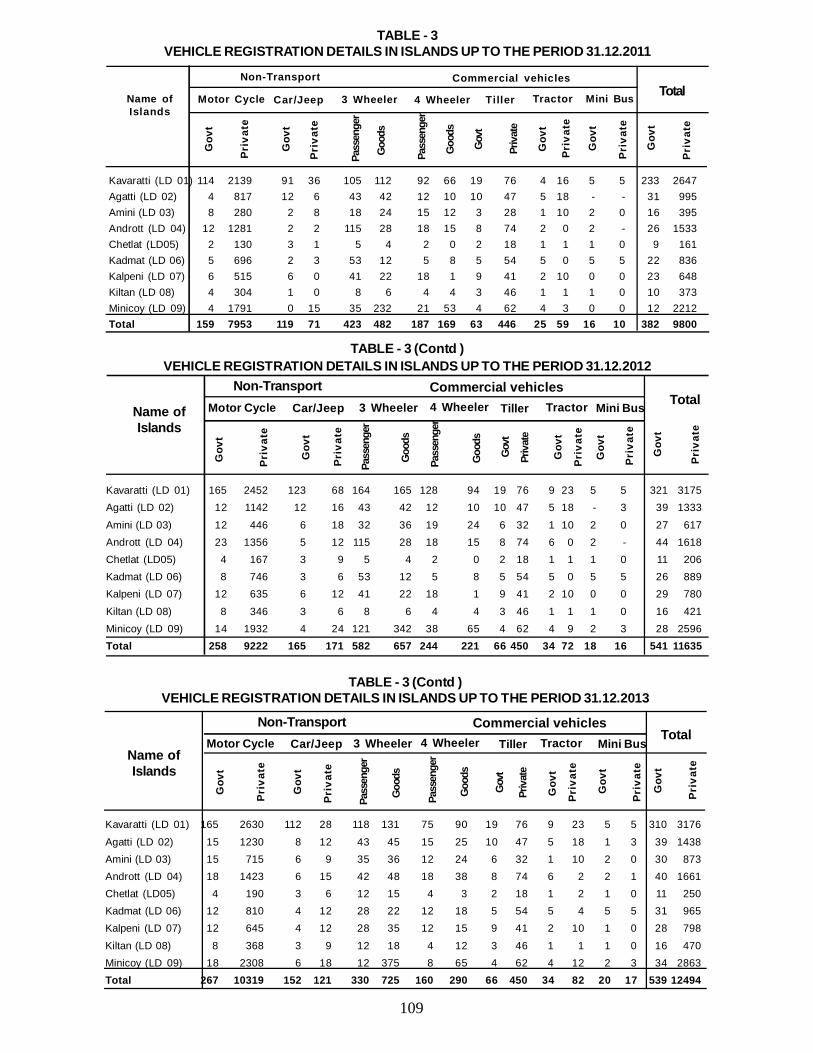
109
Kavaratti (LD 01) 114 2139 91 36 105 112 92 66 19 76 4 16 5 5 233 2647Agatti (LD 02) 4 817 12 6 43 42 12 10 10 47 5 18 - - 31 995Amini (LD 03) 8 280 2 8 18 24 15 12 3 28 1 10 2 0 16 395Andrott (LD 04) 12 1281 2 2 115 28 18 15 8 74 2 0 2 - 26 1533Chetlat (LD05) 2 130 3 1 5 4 2 0 2 18 1 1 1 0 9 161Kadmat (LD 06) 5 696 2 3 53 12 5 8 5 54 5 0 5 5 22 836Kalpeni (LD 07) 6 515 6 0 41 22 18 1 9 41 2 10 0 0 23 648Kiltan (LD 08) 4 304 1 0 8 6 4 4 3 46 1 1 1 0 10 373Minicoy (LD 09) 4 1791 0 15 35 232 21 53 4 62 4 3 0 0 12 2212Total 159 7953 119 71 423 482 187 169 63 446 25 59 16 10 382 9800
TABLE - 3VEHICLE REGISTRATION DETAILS IN ISLANDS UP TO THE PERIOD 31.12.2011
Name ofIslands
Non-Transport Commercial vehicles
Motor Cycle Car/Jeep 3 Wheeler 4 Wheeler Tiller Tractor Mini Bus
Gov
t
Total
Priv
ate
Gov
t
Priv
ate
Pass
enge
r
Goo
ds
Gov
t
Priv
ate
Gov
t
Gov
t
Pass
enge
r
Goo
ds
Priv
ate
Priv
ate
Gov
t
Priv
ate
Kavaratti (LD 01) 165 2452 123 68 164 165 128 94 19 76 9 23 5 5 321 3175Agatti (LD 02) 12 1142 12 16 43 42 12 10 10 47 5 18 - 3 39 1333
Amini (LD 03) 12 446 6 18 32 36 19 24 6 32 1 10 2 0 27 617Andrott (LD 04) 23 1356 5 12 115 28 18 15 8 74 6 0 2 - 44 1618Chetlat (LD05) 4 167 3 9 5 4 2 0 2 18 1 1 1 0 11 206Kadmat (LD 06) 8 746 3 6 53 12 5 8 5 54 5 0 5 5 26 889Kalpeni (LD 07) 12 635 6 12 41 22 18 1 9 41 2 10 0 0 29 780
Kiltan (LD 08) 8 346 3 6 8 6 4 4 3 46 1 1 1 0 16 421Minicoy (LD 09) 14 1932 4 24 121 342 38 65 4 62 4 9 2 3 28 2596Total 258 9222 165 171 582 657 244 221 66 450 34 72 18 16 541 11635
TABLE - 3 (Contd )VEHICLE REGISTRATION DETAILS IN ISLANDS UP TO THE PERIOD 31.12.2012
Name ofIslands
Non-Transport Commercial vehiclesMotor Cycle Car/Jeep 3 Wheeler 4 Wheeler Tiller Tractor Mini Bus
Gov
t
Total
Priv
ate
Gov
t
Priv
ate
Pass
enge
r
Goo
ds
Gov
t
Priv
ate
Gov
t
Gov
t
Pass
enge
r
Goo
ds
Priv
ate
Priv
ate
Gov
t
Priv
ate
Kavaratti (LD 01) 165 2630 112 28 118 131 75 90 19 76 9 23 5 5 310 3176
Agatti (LD 02) 15 1230 8 12 43 45 15 25 10 47 5 18 1 3 39 1438Amini (LD 03) 15 715 6 9 35 36 12 24 6 32 1 10 2 0 30 873Andrott (LD 04) 18 1423 6 15 42 48 18 38 8 74 6 2 2 1 40 1661Chetlat (LD05) 4 190 3 6 12 15 4 3 2 18 1 2 1 0 11 250Kadmat (LD 06) 12 810 4 12 28 22 12 18 5 54 5 4 5 5 31 965Kalpeni (LD 07) 12 645 4 12 28 35 12 15 9 41 2 10 1 0 28 798
Kiltan (LD 08) 8 368 3 9 12 18 4 12 3 46 1 1 1 0 16 470Minicoy (LD 09) 18 2308 6 18 12 375 8 65 4 62 4 12 2 3 34 2863Total 267 10319 152 121 330 725 160 290 66 450 34 82 20 17 539 12494
TABLE - 3 (Contd )VEHICLE REGISTRATION DETAILS IN ISLANDS UP TO THE PERIOD 31.12.2013
Name ofIslands
Non-Transport Commercial vehiclesMotor Cycle Car/Jeep 3 Wheeler 4 Wheeler Tiller Tractor Mini Bus
Gov
t
Total
Priv
ate
Gov
t
Priv
ate
Pass
enge
r
Goo
ds
Gov
t
Priv
ate
Gov
t
Gov
t
Pass
enge
r
Goo
ds
Priv
ate
Priv
ate
Gov
t
Priv
ate
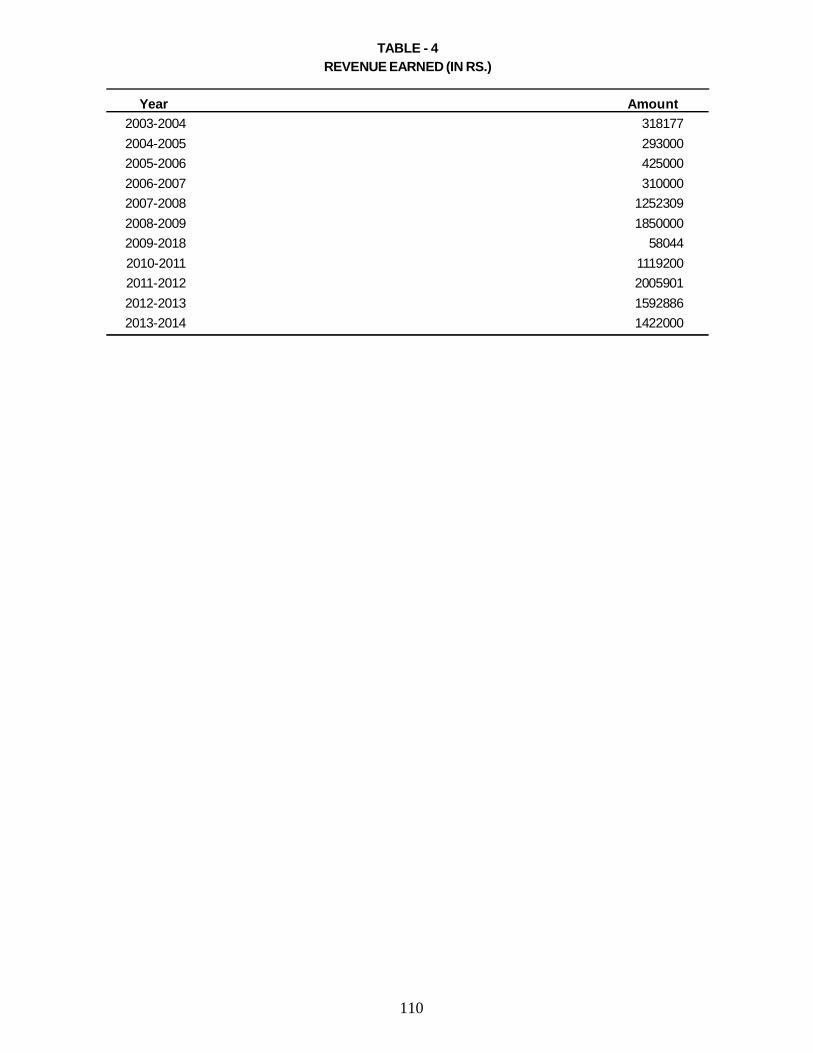
110
TABLE - 4REVENUE EARNED (IN RS.)
Year Amount2003-2004 3181772004-2005 2930002005-2006 4250002006-2007 3100002007-2008 12523092008-2009 18500002009-2018 580442010-2011 11192002011-2012 20059012012-2013 15928862013-2014 1422000
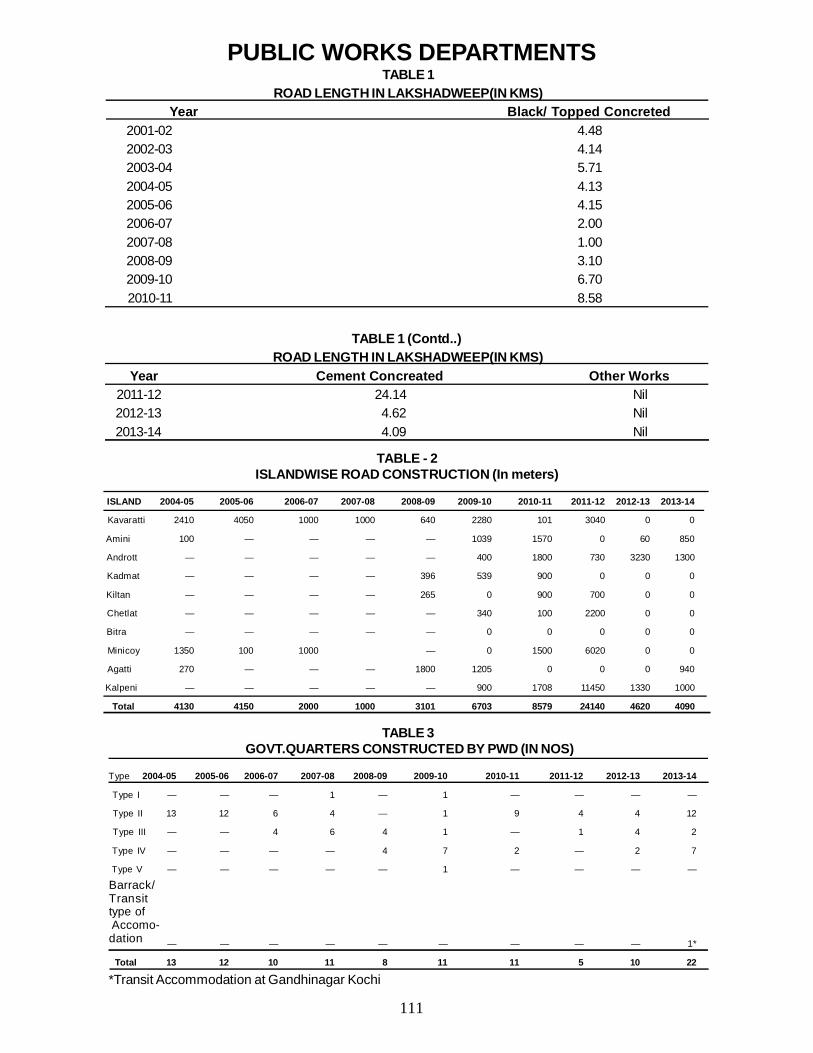
111
TABLE - 2ISLANDWISE ROAD CONSTRUCTION (In meters)
ISLAND 2004-05 2005-06 2006-07 2007-08 2008-09 2009-10 2010-11 2011-12 2012-13 2013-14
Kavaratti 2410 4050 1000 1000 640 2280 101 3040 0 0
Amini 100 — — — — 1039 1570 0 60 850
Andrott — — — — — 400 1800 730 3230 1300
Kadmat — — — — 396 539 900 0 0 0
Kiltan — — — — 265 0 900 700 0 0
Chetlat — — — — — 340 100 2200 0 0
Bitra — — — — — 0 0 0 0 0
Minicoy 1350 100 1000 — 0 1500 6020 0 0
Agatti 270 — — — 1800 1205 0 0 0 940
Kalpeni — — — — — 900 1708 11450 1330 1000
Total 4130 4150 2000 1000 3101 6703 8579 24140 4620 4090
TABLE 3 GOVT.QUARTERS CONSTRUCTED BY PWD (IN NOS)
Type 2004-05 2005-06 2006-07 2007-08 2008-09 2009-10 2010-11 2011-12 2012-13 2013-14
Type I — — — 1 — 1 — — — —
Type II 13 12 6 4 — 1 9 4 4 12
Type III — — 4 6 4 1 — 1 4 2
Type IV — — — — 4 7 2 — 2 7
Type V — — — — — 1 — — — —
— — — — — — — — — 1*
Total 13 12 10 11 8 11 11 5 10 22
*Transit Accommodation at Gandhinagar Kochi
Barrack/Transittype of Accomo-dation
TABLE 1 (Contd..) ROAD LENGTH IN LAKSHADWEEP(IN KMS)
Year Cement Concreated Other Works2011-12 24.14 Nil2012-13 4.62 Nil2013-14 4.09 Nil
PUBLIC WORKS DEPARTMENTSTABLE 1
ROAD LENGTH IN LAKSHADWEEP(IN KMS) Year Black/ Topped Concreted
2001-02 4.482002-03 4.142003-04 5.712004-05 4.132005-06 4.152006-07 2.002007-08 1.002008-09 3.102009-10 6.702010-11 8.58
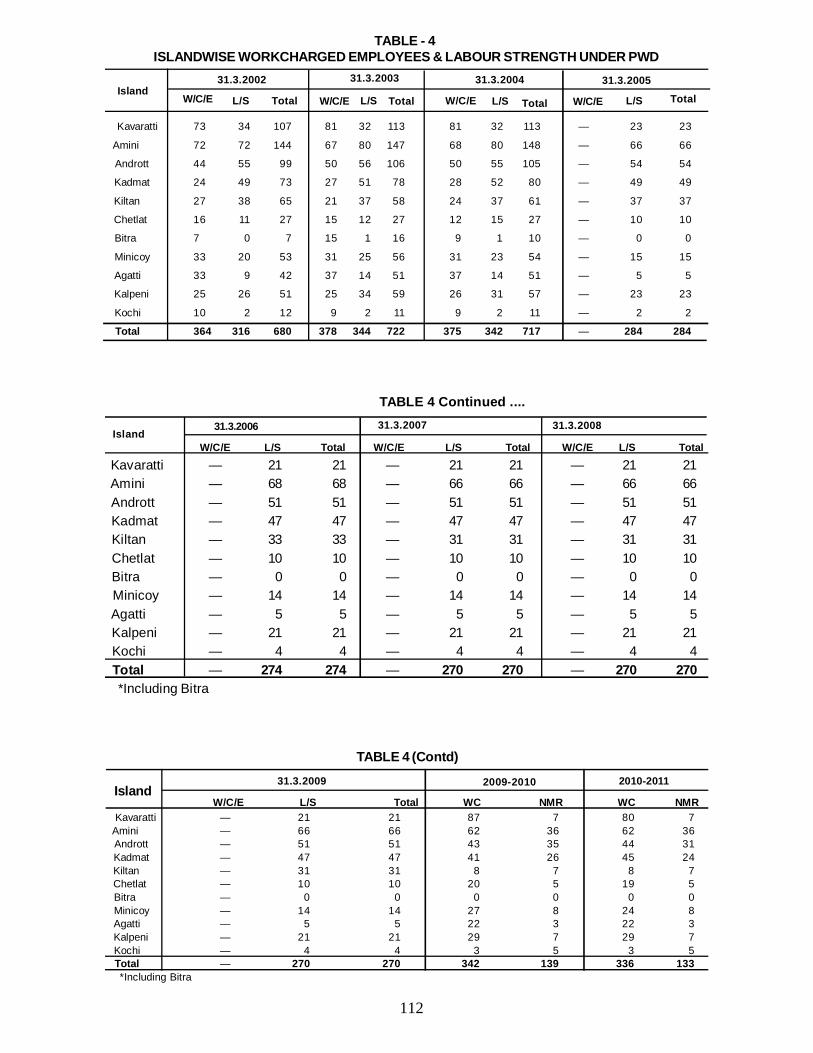
112
TABLE 4 Continued ....
W/C/E L/S Total W/C/E L/S Total W/C/E L/S Total
Kavaratti — 21 21 — 21 21 — 21 21 Amini — 68 68 — 66 66 — 66 66 Andrott — 51 51 — 51 51 — 51 51 Kadmat — 47 47 — 47 47 — 47 47 Kiltan — 33 33 — 31 31 — 31 31 Chetlat — 10 10 — 10 10 — 10 10 Bitra — 0 0 — 0 0 — 0 0 Minicoy — 14 14 — 14 14 — 14 14 Agatti — 5 5 — 5 5 — 5 5 Kalpeni — 21 21 — 21 21 — 21 21 Kochi — 4 4 — 4 4 — 4 4 Total — 274 274 — 270 270 — 270 270 *Including Bitra
Island31.3.2006 31.3.2007 31.3.2008
TABLE 4 (Contd)
W/C/E L/S Total WC NMR WC NMR Kavaratti — 21 21 87 7 80 7 Amini — 66 66 62 36 62 36 Andrott — 51 51 43 35 44 31 Kadmat — 47 47 41 26 45 24 Kiltan — 31 31 8 7 8 7 Chetlat — 10 10 20 5 19 5 Bitra — 0 0 0 0 0 0 Minicoy — 14 14 27 8 24 8 Agatti — 5 5 22 3 22 3 Kalpeni — 21 21 29 7 29 7 Kochi — 4 4 3 5 3 5 Total — 270 270 342 139 336 133 *Including Bitra
Island31.3.2009 2009-2010 2010-2011
Kavaratti 73 34 107 81 32 113 81 32 113 — 23 23
Amini 72 72 144 67 80 147 68 80 148 — 66 66
Andrott 44 55 99 50 56 106 50 55 105 — 54 54
Kadmat 24 49 73 27 51 78 28 52 80 — 49 49
Kiltan 27 38 65 21 37 58 24 37 61 — 37 37
Chetlat 16 11 27 15 12 27 12 15 27 — 10 10
Bitra 7 0 7 15 1 16 9 1 10 — 0 0
Minicoy 33 20 53 31 25 56 31 23 54 — 15 15
Agatti 33 9 42 37 14 51 37 14 51 — 5 5
Kalpeni 25 26 51 25 34 59 26 31 57 — 23 23
Kochi 10 2 12 9 2 11 9 2 11 — 2 2
Total 364 316 680 378 344 722 375 342 717 — 284 284
Island
TABLE - 4 ISLANDWISE WORKCHARGED EMPLOYEES & LABOUR STRENGTH UNDER PWD
31.3.2002 31.3.2003 31.3.2005
L/S Total L/S TotalW/C/E L/S Total W/C/E L/S Total
31.3.2004
W/C/EW/C/E
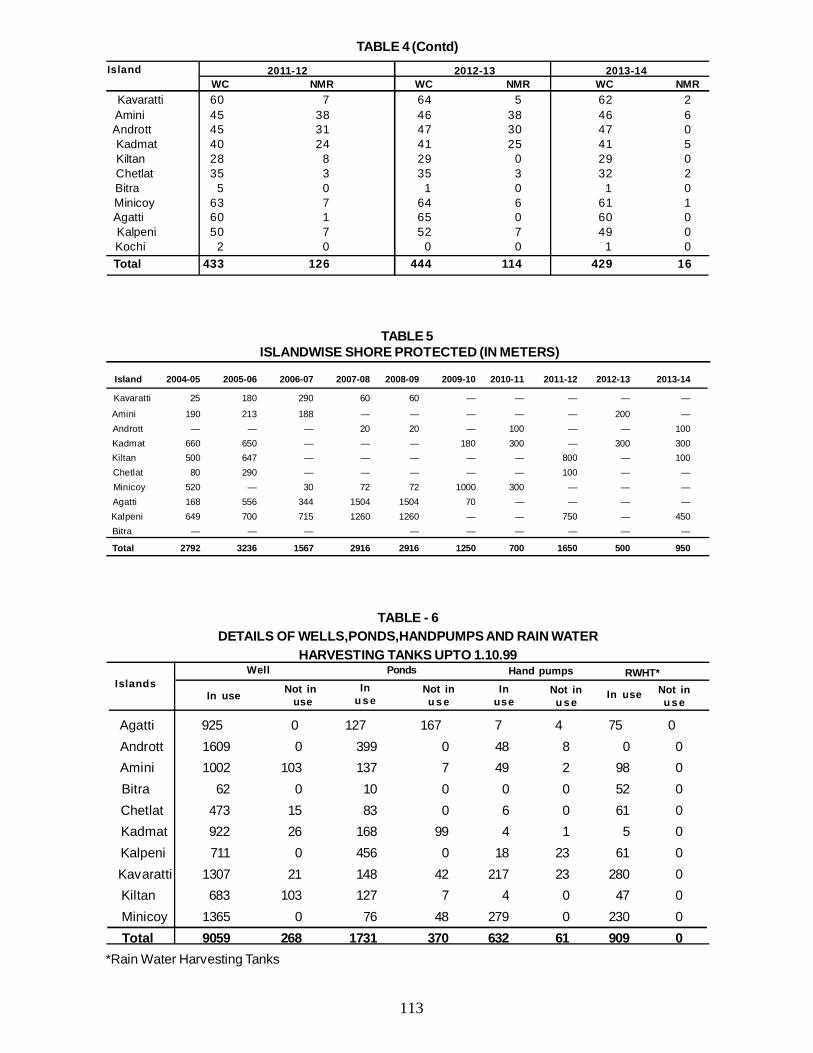
113
TABLE 4 (Contd)Island
WC NMR WC NMR WC NMR Kavaratti 60 7 64 5 62 2 Amini 45 38 46 38 46 6 Andrott 45 31 47 30 47 0 Kadmat 40 24 41 25 41 5 Kiltan 28 8 29 0 29 0 Chetlat 35 3 35 3 32 2 Bitra 5 0 1 0 1 0 Minicoy 63 7 64 6 61 1 Agatti 60 1 65 0 60 0 Kalpeni 50 7 52 7 49 0 Kochi 2 0 0 0 1 0 Total 433 126 444 114 429 16
2011-12 2012-13 2013-14
TABLE 5 ISLANDWISE SHORE PROTECTED (IN METERS)
Island 2004-05 2005-06 2006-07 2007-08 2008-09 2009-10 2010-11 2011-12 2012-13 2013-14
Kavaratti 25 180 290 60 60 — — — — —
Amini 190 213 188 — — — — — 200 — Andrott — — — 20 20 — 100 — — 100 Kadmat 660 650 — — — 180 300 — 300 300 Kiltan 500 647 — — — — — 800 — 100 Chetlat 80 290 — — — — — 100 — — Minicoy 520 — 30 72 72 1000 300 — — — Agatti 168 556 344 1504 1504 70 — — — — Kalpeni 649 700 715 1260 1260 — — 750 — 450 Bitra — — — — — — — — —
Total 2792 3236 1567 2916 2916 1250 700 1650 500 950
Agatti 925 0 127 167 7 4 75 0 Andrott 1609 0 399 0 48 8 0 0 Amini 1002 103 137 7 49 2 98 0 Bitra 62 0 10 0 0 0 52 0 Chetlat 473 15 83 0 6 0 61 0 Kadmat 922 26 168 99 4 1 5 0 Kalpeni 711 0 456 0 18 23 61 0 Kavaratti 1307 21 148 42 217 23 280 0 Kiltan 683 103 127 7 4 0 47 0 Minicoy 1365 0 76 48 279 0 230 0 Total 9059 268 1731 370 632 61 909 0*Rain Water Harvesting Tanks
TABLE - 6DETAILS OF WELLS,PONDS,HANDPUMPS AND RAIN WATER
HARVESTING TANKS UPTO 1.10.99
Not inu s e
Not inu s e
IslandsWell Ponds Hand pumps RWHT*
In use Not in use
Inu s e
Inuse In use Not in
u s e
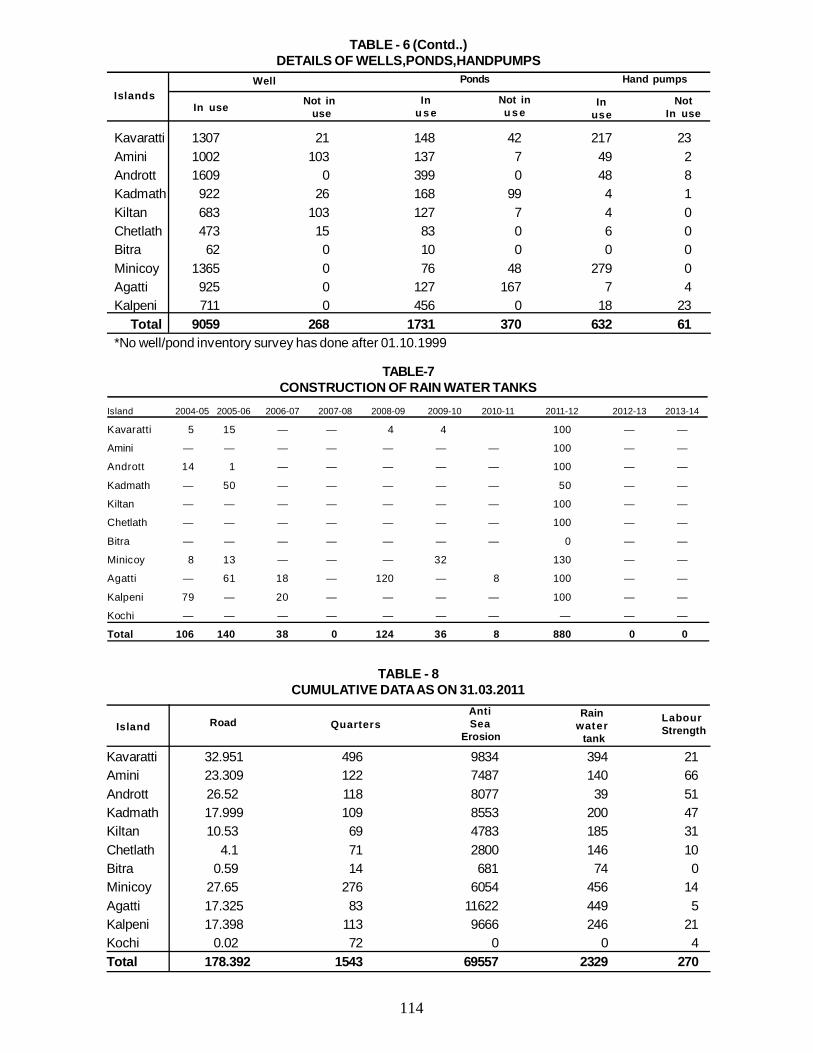
114
TABLE-7CONSTRUCTION OF RAIN WATER TANKS
Island 2004-05 2005-06 2006-07 2007-08 2008-09 2009-10 2010-11 2011-12 2012-13 2013-14
Kavaratti 5 15 — — 4 4 100 — —
Amini — — — — — — — 100 — —
Andrott 14 1 — — — — — 100 — —
Kadmath — 50 — — — — — 50 — —
Kiltan — — — — — — — 100 — —
Chetlath — — — — — — — 100 — —
Bitra — — — — — — — 0 — —
Minicoy 8 13 — — — 32 130 — —
Agatti — 61 18 — 120 — 8 100 — —
Kalpeni 79 — 20 — — — — 100 — —
Kochi — — — — — — — — — —
Total 106 140 38 0 124 36 8 880 0 0
Kavaratti 32.951 496 9834 394 21Amini 23.309 122 7487 140 66Andrott 26.52 118 8077 39 51Kadmath 17.999 109 8553 200 47Kiltan 10.53 69 4783 185 31Chetlath 4.1 71 2800 146 10Bitra 0.59 14 681 74 0Minicoy 27.65 276 6054 456 14Agatti 17.325 83 11622 449 5Kalpeni 17.398 113 9666 246 21Kochi 0.02 72 0 0 4Total 178.392 1543 69557 2329 270
TABLE - 8CUMULATIVE DATA AS ON 31.03.2011
Island Road QuartersAntiSea
Erosion
Rainwater tank
Labour Strength
Kavaratti 1307 21 148 42 217 23Amini 1002 103 137 7 49 2Andrott 1609 0 399 0 48 8Kadmath 922 26 168 99 4 1Kiltan 683 103 127 7 4 0Chetlath 473 15 83 0 6 0Bitra 62 0 10 0 0 0Minicoy 1365 0 76 48 279 0Agatti 925 0 127 167 7 4Kalpeni 711 0 456 0 18 23 Total 9059 268 1731 370 632 61*No well/pond inventory survey has done after 01.10.1999
TABLE - 6 (Contd..)DETAILS OF WELLS,PONDS,HANDPUMPS
IslandsWell Ponds Hand pumps
In use Not in use
Inu s e
Inuse
NotIn use
Not inu s e

115
Kavaratti 35.99 508 9834 494 64Minicoy 33.67 276 5154 586 62Androt 30.48 118 8077 139 47Amini 20.91 122 7687 240 52Agatti 17.16 87 11622 549 60Kalpeni 30.18 113 10416 346 49Kadmat 15.02 113 8853 250 46Kiltan 11.23 69 5583 285 29Chetlat 6.3 75 2900 246 34Bitra 0.58 14 681 74 1Kochi 0 72 0 0 1Total 201.52 1567 70807 3209 445
TABLE - 8 (Contd..)CUMULATIVE DATA AS ON 31.03.2014
Island Road(KM)
Quarters(Nos)
Anti SeaErosion
(M)
Rainwatertank
LabourStrength
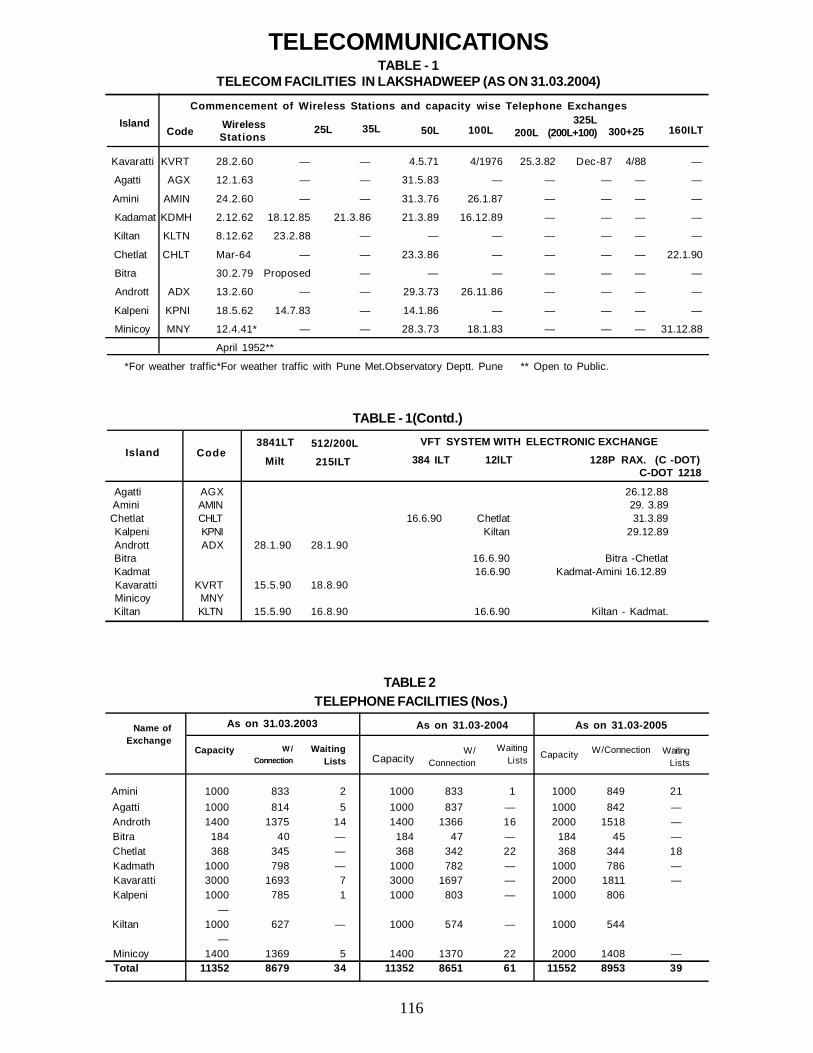
116
TELECOMMUNICATIONSTABLE - 1
TELECOM FACILITIES IN LAKSHADWEEP (AS ON 31.03.2004)
Kavaratti KVRT 28.2.60 — — 4.5.71 4/1976 25.3.82 Dec-87 4/88 —
Agatti AGX 12.1.63 — — 31.5.83 — — — — —
Amini AMIN 24.2.60 — — 31.3.76 26.1.87 — — — —
Kadamat KDMH 2.12.62 18.12.85 21.3.86 21.3.89 16.12.89 — — — —
Kiltan KLTN 8.12.62 23.2.88 — — — — — — —
Chetlat CHLT Mar-64 — — 23.3.86 — — — — 22.1.90
Bitra 30.2.79 Proposed — — — — — — —
Andrott ADX 13.2.60 — — 29.3.73 26.11.86 — — — —
Kalpeni KPNI 18.5.62 14.7.83 — 14.1.86 — — — — —
Minicoy MNY 12.4.41* — — 28.3.73 18.1.83 — — — 31.12.88
April 1952**
*For weather traffic*For weather traffic with Pune Met.Observatory Deptt. Pune ** Open to Public.
Commencement of Wireless Stations and capacity wise Telephone Exchanges Island
Code WirelessStations
25L 35L 50L 100L 200L 325L
(200L+100) 300+25 160ILT
Agatti AGX 26.12.88 Amini AMIN 29. 3.89Chetlat CHLT 16.6.90 Chetlat 31.3.89 Kalpeni KPNI Kiltan 29.12.89 Andrott ADX 28.1.90 28.1.90 Bitra 16.6.90 Bitra -Chetlat Kadmat 16.6.90 Kadmat-Amini 16.12.89 Kavaratti KVRT 15.5.90 18.8.90 Minicoy MNY Kiltan KLTN 15.5.90 16.8.90 16.6.90 Kiltan - Kadmat.
TABLE - 1(Contd.)
Island Code3841LT 512/200L VFT SYSTEM WITH ELECTRONIC EXCHANGE
128P RAX. (C -DOT) Milt 215ILT 384 ILT 12lLTC-DOT 1218
Amini 1000 833 2 1000 833 1 1000 849 21 Agatti 1000 814 5 1000 837 — 1000 842 — Androth 1400 1375 14 1400 1366 16 2000 1518 — Bitra 184 40 — 184 47 — 184 45 — Chetlat 368 345 — 368 342 22 368 344 18 Kadmath 1000 798 — 1000 782 — 1000 786 — Kavaratti 3000 1693 7 3000 1697 — 2000 1811 — Kalpeni 1000 785 1 1000 803 — 1000 806
— Kiltan 1000 627 — 1000 574 — 1000 544
— Minicoy 1400 1369 5 1400 1370 22 2000 1408 — Total 11352 8679 34 11352 8651 61 11552 8953 39
TABLE 2 TELEPHONE FACILITIES (Nos.)
Name ofExchange
As on 31.03.2003 As on 31.03-2004 As on 31.03-2005
Capacity W/Connection
WaitingLists Capacity
W/Connection
WaitingLists Capacity W/Connection Waiting
Lists
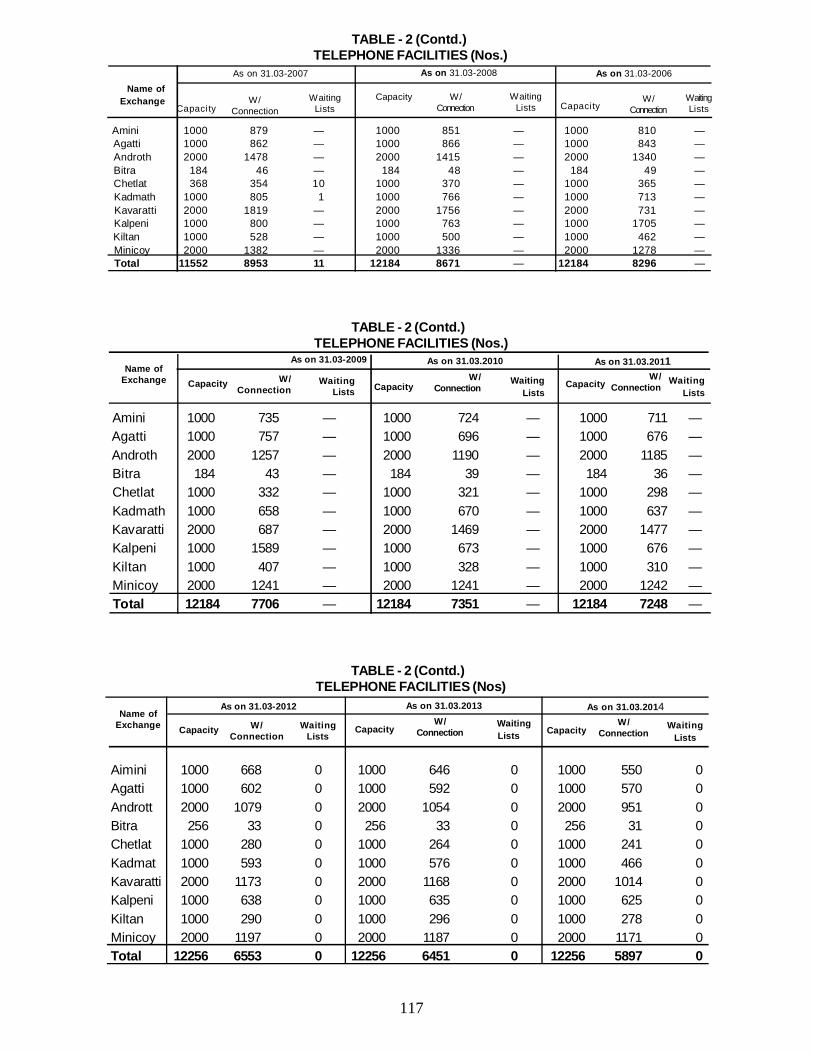
117
TABLE - 2 (Contd.) TELEPHONE FACILITIES (Nos.)
Amini 1000 735 — 1000 724 — 1000 711 — Agatti 1000 757 — 1000 696 — 1000 676 — Androth 2000 1257 — 2000 1190 — 2000 1185 — Bitra 184 43 — 184 39 — 184 36 — Chetlat 1000 332 — 1000 321 — 1000 298 — Kadmath 1000 658 — 1000 670 — 1000 637 — Kavaratti 2000 687 — 2000 1469 — 2000 1477 — Kalpeni 1000 1589 — 1000 673 — 1000 676 — Kiltan 1000 407 — 1000 328 — 1000 310 — Minicoy 2000 1241 — 2000 1241 — 2000 1242 — Total 12184 7706 — 12184 7351 — 12184 7248 —
TABLE - 2 (Contd.) TELEPHONE FACILITIES (Nos.)
Amini 1000 879 — 1000 851 — 1000 810 — Agatti 1000 862 — 1000 866 — 1000 843 — Androth 2000 1478 — 2000 1415 — 2000 1340 — Bitra 184 46 — 184 48 — 184 49 — Chetlat 368 354 10 1000 370 — 1000 365 — Kadmath 1000 805 1 1000 766 — 1000 713 — Kavaratti 2000 1819 — 2000 1756 — 2000 731 — Kalpeni 1000 800 — 1000 763 — 1000 1705 — Kiltan 1000 528 — 1000 500 — 1000 462 — Minicoy 2000 1382 — 2000 1336 — 2000 1278 — Total 11552 8953 11 12184 8671 — 12184 8296 —
Name ofExchange
As on 31.03-2006 As on 31.03-2007 As on 31.03-2008
CapacityW/
ConnectionWaiting
Lists Capacity W/
ConnectionWaiting
Lists CapacityW/
ConnectionWaitingLists
Name ofExchange
As on 31.03-2009 As on 31.03.2010 As on 31.03.2011
Capacity W/Connection
WaitingLists Capacity
W/Connection
WaitingLists
CapacityW/
ConnectionWaiting
Lists
Aimini 1000 668 0 1000 646 0 1000 550 0Agatti 1000 602 0 1000 592 0 1000 570 0Andrott 2000 1079 0 2000 1054 0 2000 951 0Bitra 256 33 0 256 33 0 256 31 0Chetlat 1000 280 0 1000 264 0 1000 241 0Kadmat 1000 593 0 1000 576 0 1000 466 0Kavaratti 2000 1173 0 2000 1168 0 2000 1014 0Kalpeni 1000 638 0 1000 635 0 1000 625 0Kiltan 1000 290 0 1000 296 0 1000 278 0Minicoy 2000 1197 0 2000 1187 0 2000 1171 0Total 12256 6553 0 12256 6451 0 12256 5897 0
TABLE - 2 (Contd.) TELEPHONE FACILITIES (Nos)
Name ofExchange
As on 31.03-2012 As on 31.03.2013 As on 31.03.2014
Capacity W/Connection
WaitingLists
CapacityW/
Connection Waiting
Lists CapacityW/
ConnectionWaiting
Lists
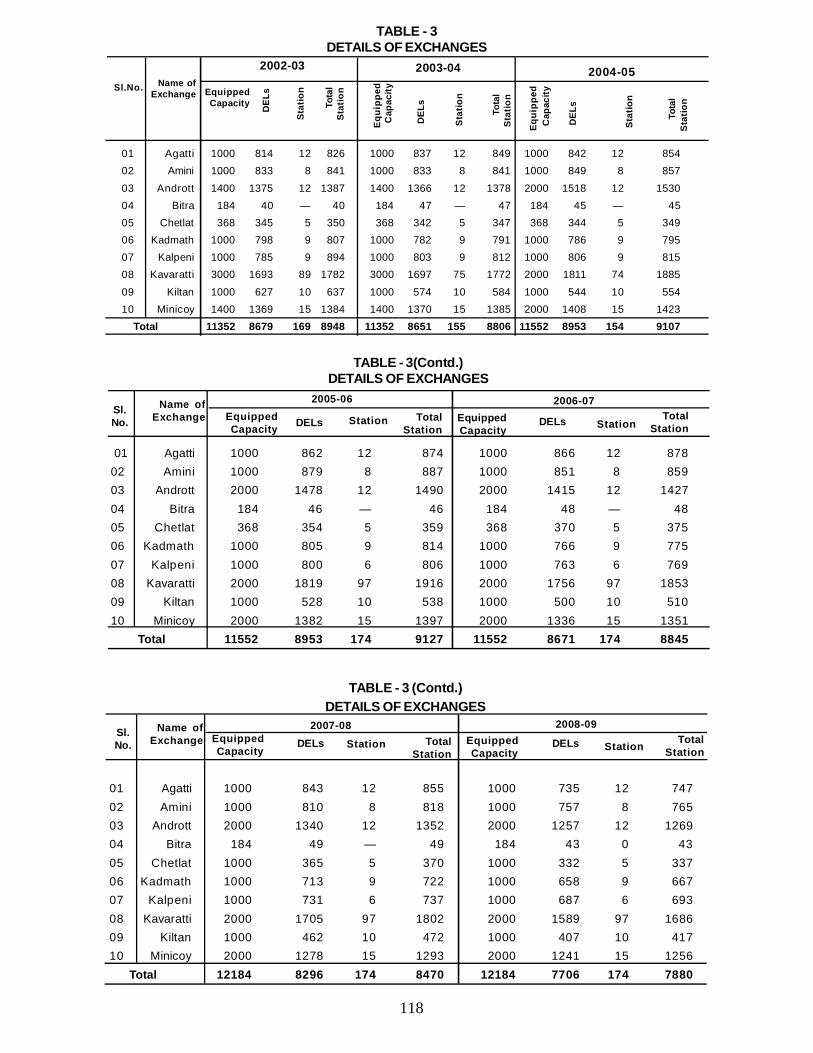
118
TABLE - 3DETAILS OF EXCHANGES
01 Agatti 1000 814 12 826 1000 837 12 849 1000 842 12 85402 Amini 1000 833 8 841 1000 833 8 841 1000 849 8 857
03 Andrott 1400 1375 12 1387 1400 1366 12 1378 2000 1518 12 153004 Bitra 184 40 — 40 184 47 — 47 184 45 — 4505 Chetlat 368 345 5 350 368 342 5 347 368 344 5 34906 Kadmath 1000 798 9 807 1000 782 9 791 1000 786 9 79507 Kalpeni 1000 785 9 894 1000 803 9 812 1000 806 9 81508 Kavaratti 3000 1693 89 1782 3000 1697 75 1772 2000 1811 74 1885
09 Kiltan 1000 627 10 637 1000 574 10 584 1000 544 10 55410 Minicoy 1400 1369 15 1384 1400 1370 15 1385 2000 1408 15 1423
Total 11352 8679 169 8948 11352 8651 155 8806 11552 8953 154 9107
Sl.No. Name ofExchange
2002-03 2003-04 2004-05EquippedCapacity D
ELs
Stat
ion
Tota
lSt
atio
n
Equi
pped
Cap
acity
DEL
s
Stat
ion
Tota
lSt
atio
n
Tota
lSt
atio
n
Equi
pped
Cap
acity
DEL
s
Stat
ion
01 Agatti 1000 862 12 874 1000 866 12 878 02 Amini 1000 879 8 887 1000 851 8 859 03 Andrott 2000 1478 12 1490 2000 1415 12 1427 04 Bitra 184 46 — 46 184 48 — 48 05 Chetlat 368 354 5 359 368 370 5 375 06 Kadmath 1000 805 9 814 1000 766 9 775 07 Kalpeni 1000 800 6 806 1000 763 6 769 08 Kavaratti 2000 1819 97 1916 2000 1756 97 1853 09 Kiltan 1000 528 10 538 1000 500 10 510 10 Minicoy 2000 1382 15 1397 2000 1336 15 1351 Total 11552 8953 174 9127 11552 8671 174 8845
TABLE - 3(Contd.)DETAILS OF EXCHANGES
EquippedCapacity
Sl.No.
Name ofExchange
2005-06EquippedCapacity
2006-07
DELs Station TotalStation
DELs StationTotal
Station
01 Agatti 1000 843 12 855 1000 735 12 74702 Amini 1000 810 8 818 1000 757 8 76503 Andrott 2000 1340 12 1352 2000 1257 12 126904 Bitra 184 49 — 49 184 43 0 4305 Chetlat 1000 365 5 370 1000 332 5 33706 Kadmath 1000 713 9 722 1000 658 9 66707 Kalpeni 1000 731 6 737 1000 687 6 69308 Kavaratti 2000 1705 97 1802 2000 1589 97 168609 Kiltan 1000 462 10 472 1000 407 10 41710 Minicoy 2000 1278 15 1293 2000 1241 15 1256
Total 12184 8296 174 8470 12184 7706 174 7880
TABLE - 3 (Contd.)DETAILS OF EXCHANGES
Sl.No.
Name ofExchange
2008-09
StationDELs StationEquippedCapacity
2007-08EquippedCapacity
TotalStation
TotalStation
DELs
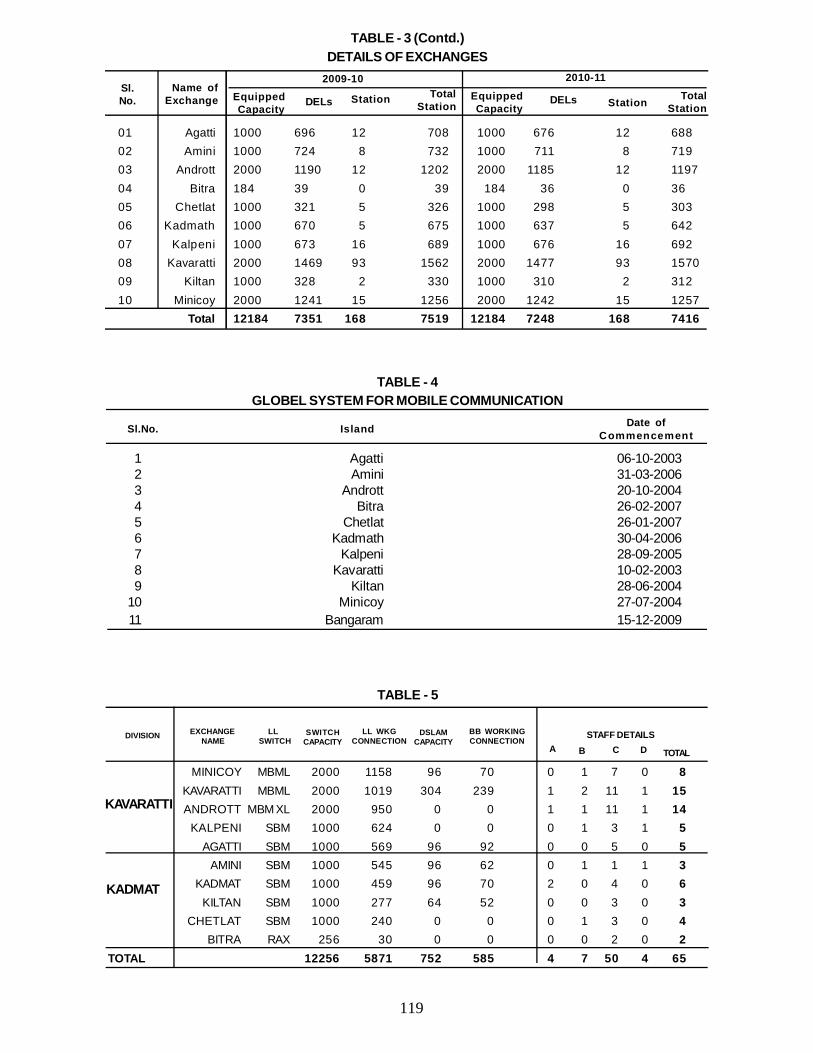
119
1 Agatti 06-10-20032 Amini 31-03-20063 Andrott 20-10-20044 Bitra 26-02-20075 Chetlat 26-01-20076 Kadmath 30-04-20067 Kalpeni 28-09-20058 Kavaratti 10-02-20039 Kiltan 28-06-2004
10 Minicoy 27-07-200411 Bangaram 15-12-2009
TABLE - 4GLOBEL SYSTEM FOR MOBILE COMMUNICATION
Sl.No. Island Date ofCommencement
TABLE - 5
MINICOY MBML 2000 1158 96 70 0 1 7 0 8KAVARATTI MBML 2000 1019 304 239 1 2 11 1 15ANDROTT MBM XL 2000 950 0 0 1 1 11 1 14
KALPENI SBM 1000 624 0 0 0 1 3 1 5AGATTI SBM 1000 569 96 92 0 0 5 0 5
AMINI SBM 1000 545 96 62 0 1 1 1 3KADMAT SBM 1000 459 96 70 2 0 4 0 6
KILTAN SBM 1000 277 64 52 0 0 3 0 3CHETLAT SBM 1000 240 0 0 0 1 3 0 4
BITRA RAX 256 30 0 0 0 0 2 0 2 TOTAL 12256 5871 752 585 4 7 50 4 65
DIVISION EXCHANGE NAME
LL SWITCH
SWITCHCAPACITY
LL WKGCONNECTION
DSLAMCAPACITY
BB WORKINGCONNECTION
STAFF DETAILSA B C
KAVARATTI
KADMAT
D TOTAL
TABLE - 3 (Contd.)DETAILS OF EXCHANGES
01 Agatti 1000 696 12 708 1000 676 12 68802 Amini 1000 724 8 732 1000 711 8 71903 Andrott 2000 1190 12 1202 2000 1185 12 119704 Bitra 184 39 0 39 184 36 0 3605 Chetlat 1000 321 5 326 1000 298 5 30306 Kadmath 1000 670 5 675 1000 637 5 64207 Kalpeni 1000 673 16 689 1000 676 16 69208 Kavaratti 2000 1469 93 1562 2000 1477 93 157009 Kiltan 1000 328 2 330 1000 310 2 31210 Minicoy 2000 1241 15 1256 2000 1242 15 1257
Total 12184 7351 168 7519 12184 7248 168 7416
Sl.No.
Name ofExchange
2010-11
StationDELs TotalStation
EquippedCapacity
2009-10EquippedCapacity Station
TotalStation DELs
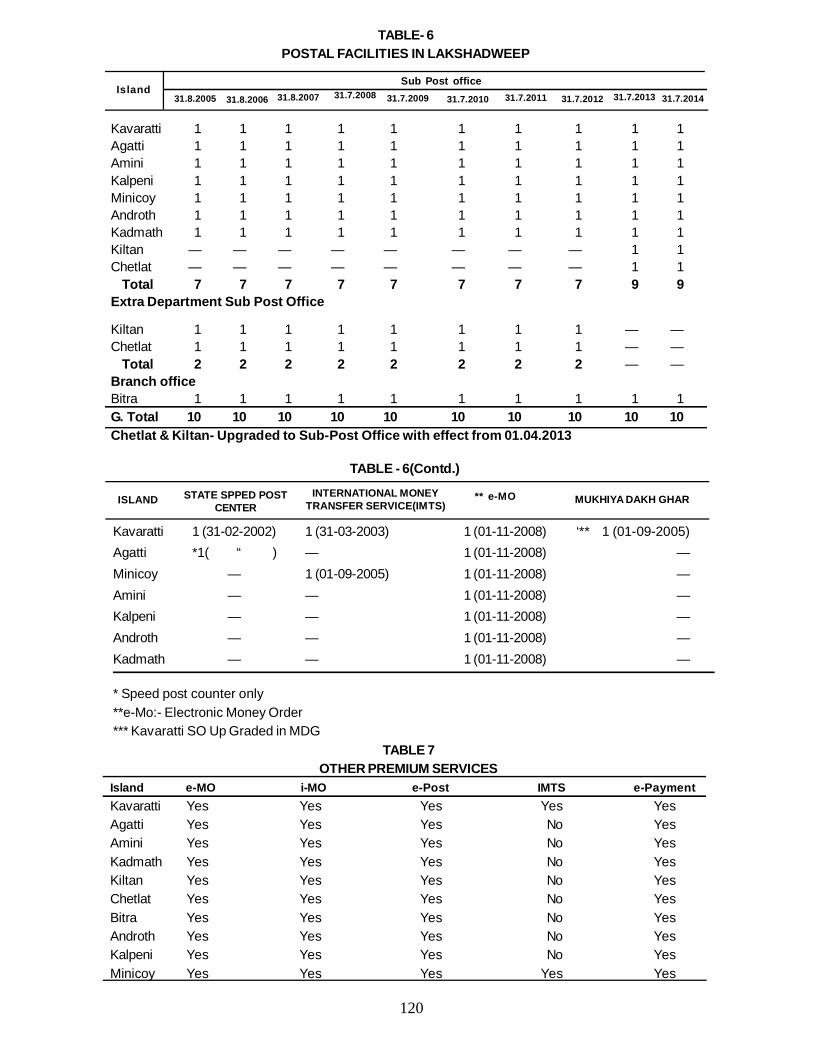
120
TABLE 7OTHER PREMIUM SERVICES
Island e-MO i-MO e-Post IMTS e-PaymentKavaratti Yes Yes Yes Yes YesAgatti Yes Yes Yes No YesAmini Yes Yes Yes No YesKadmath Yes Yes Yes No YesKiltan Yes Yes Yes No YesChetlat Yes Yes Yes No YesBitra Yes Yes Yes No YesAndroth Yes Yes Yes No YesKalpeni Yes Yes Yes No YesMinicoy Yes Yes Yes Yes Yes
TABLE - 6(Contd.)
Kavaratti 1 (31-02-2002) 1 (31-03-2003) 1 (01-11-2008) ‘** 1 (01-09-2005)Agatti *1( “ ) — 1 (01-11-2008) —Minicoy — 1 (01-09-2005) 1 (01-11-2008) —Amini — — 1 (01-11-2008) —Kalpeni — — 1 (01-11-2008) —Androth — — 1 (01-11-2008) —Kadmath — — 1 (01-11-2008) —
* Speed post counter only**e-Mo:- Electronic Money Order*** Kavaratti SO Up Graded in MDG
ISLAND STATE SPPED POSTCENTER
INTERNATIONAL MONEYTRANSFER SERVICE(IMTS)
** e-MO MUKHIYA DAKH GHAR
TABLE- 6POSTAL FACILITIES IN LAKSHADWEEP
Kavaratti 1 1 1 1 1 1 1 1 1 1Agatti 1 1 1 1 1 1 1 1 1 1Amini 1 1 1 1 1 1 1 1 1 1Kalpeni 1 1 1 1 1 1 1 1 1 1Minicoy 1 1 1 1 1 1 1 1 1 1Androth 1 1 1 1 1 1 1 1 1 1Kadmath 1 1 1 1 1 1 1 1 1 1Kiltan — — — — — — — — 1 1Chetlat — — — — — — — — 1 1 Total 7 7 7 7 7 7 7 7 9 9Extra Department Sub Post Office
Kiltan 1 1 1 1 1 1 1 1 — —Chetlat 1 1 1 1 1 1 1 1 — — Total 2 2 2 2 2 2 2 2 — —Branch officeBitra 1 1 1 1 1 1 1 1 1 1G. Total 10 10 10 10 10 10 10 10 10 10Chetlat & Kiltan- Upgraded to Sub-Post Office with effect from 01.04.2013
Island31.8.2005 31.8.2006 31.8.2007 31.7.2008 31.7.2009 31.7.2010 31.7.2011 31.7.2012 31.7.2013 31.7.2014
Sub Post office
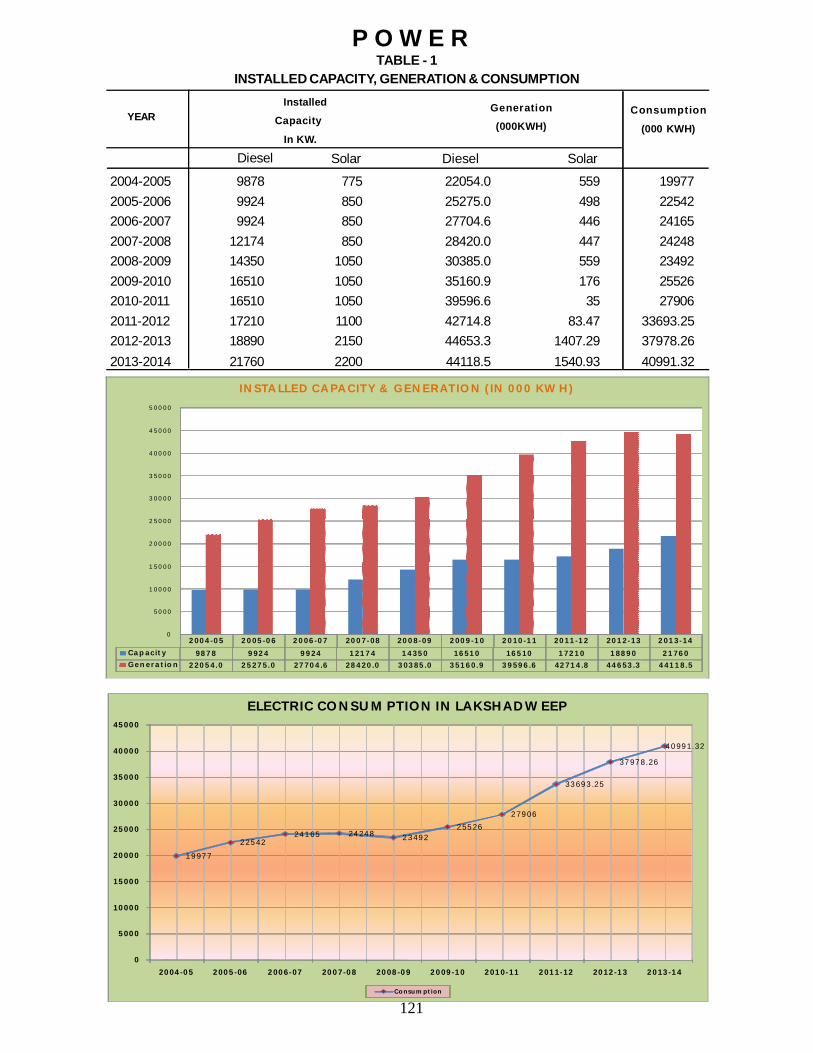
121
P O W E RTABLE - 1
INSTALLED CAPACITY, GENERATION & CONSUMPTION
YEAR Installed
Capacity
In KW.
Generation
(000KWH)Consumption
(000 KWH)
Diesel Solar Diesel Solar
2004-2005 9878 775 22054.0 559 199772005-2006 9924 850 25275.0 498 225422006-2007 9924 850 27704.6 446 241652007-2008 12174 850 28420.0 447 242482008-2009 14350 1050 30385.0 559 234922009-2010 16510 1050 35160.9 176 255262010-2011 16510 1050 39596.6 35 279062011-2012 17210 1100 42714.8 83.47 33693.252012-2013 18890 2150 44653.3 1407.29 37978.262013-2014 21760 2200 44118.5 1540.93 40991.32
1 9 9 7 7
2 2 5 4 22 4 1 6 5 2 4 2 4 8 2 3 4 9 2
2 5 5 2 6
2 7 9 0 6
3 3 6 9 3 .2 5
3 7 9 7 8 . 2 6
4 0 9 9 1 . 3 2
0
5 0 0 0
1 0 0 0 0
1 5 0 0 0
2 0 0 0 0
2 5 0 0 0
3 0 0 0 0
3 5 0 0 0
4 0 0 0 0
4 5 0 0 0
2 0 0 4 -0 5 2 0 0 5 -0 6 2 0 0 6 - 0 7 2 0 0 7 -0 8 2 0 0 8 -0 9 2 0 0 9 -1 0 2 0 1 0 - 1 1 2 0 1 1 - 1 2 2 0 1 2 -1 3 2 0 1 3 -1 4
E L E C T R IC C O N S U M P T IO N IN L A K S H A D W E E P
C o n su m p t io n
2 0 0 4 - 0 5 2 0 0 5 - 0 6 2 0 0 6 - 0 7 2 0 0 7 - 0 8 2 0 0 8 - 0 9 2 0 0 9 - 1 0 2 0 1 0 - 1 1 2 0 1 1 - 1 2 2 0 1 2 - 1 3 2 0 1 3 - 1 4
C a p a c it y 9 8 7 8 9 9 2 4 9 9 2 4 1 2 1 7 4 1 4 3 5 0 1 6 5 1 0 1 6 5 1 0 1 7 2 1 0 1 8 8 9 0 2 1 7 6 0G e n e r a t io n 2 2 0 5 4 .0 2 5 2 7 5 .0 2 7 7 0 4 .6 2 8 4 2 0 .0 3 0 3 8 5 .0 3 5 1 6 0 .9 3 9 5 9 6 .6 4 2 7 1 4 .8 4 4 6 5 3 .3 4 4 1 1 8 .5
0
5 0 0 0
1 0 0 0 0
1 5 0 0 0
2 0 0 0 0
2 5 0 0 0
3 0 0 0 0
3 5 0 0 0
4 0 0 0 0
4 5 0 0 0
5 0 0 0 0
IN S TA L L E D C A P A C IT Y & G E N E R A T IO N ( IN 0 0 0 K W H )
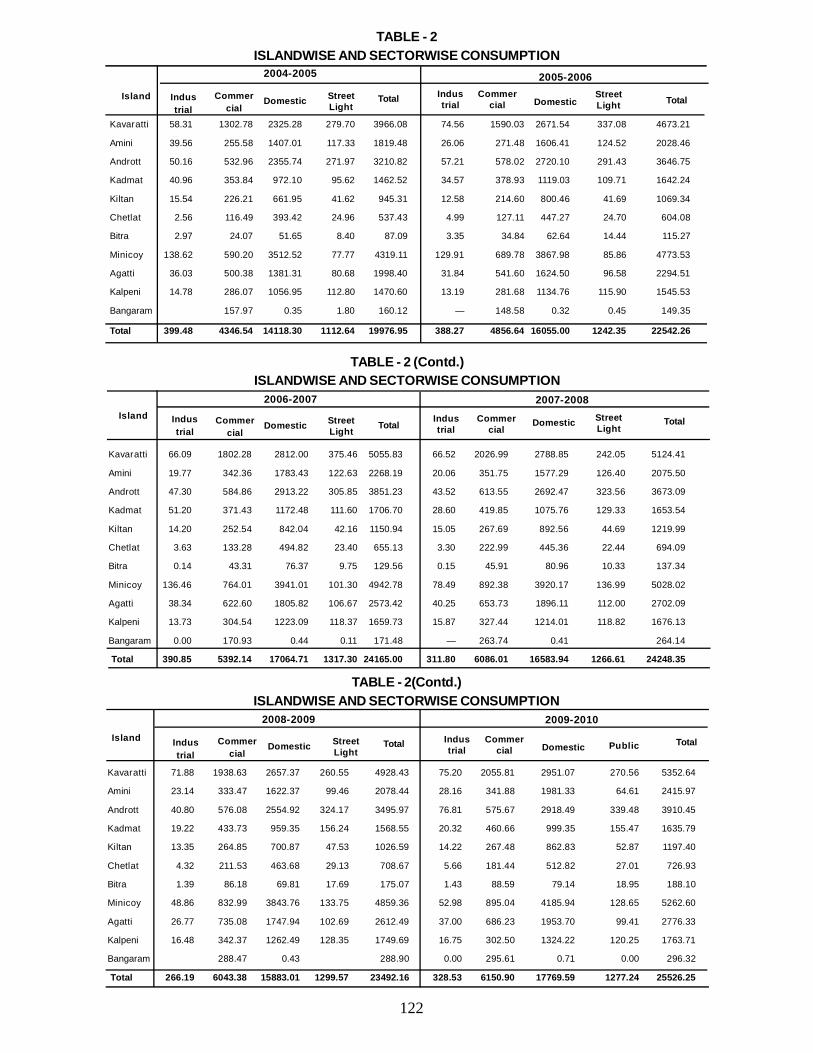
122
Kavaratti 58.31 1302.78 2325.28 279.70 3966.08 74.56 1590.03 2671.54 337.08 4673.21
Amini 39.56 255.58 1407.01 117.33 1819.48 26.06 271.48 1606.41 124.52 2028.46
Andrott 50.16 532.96 2355.74 271.97 3210.82 57.21 578.02 2720.10 291.43 3646.75
Kadmat 40.96 353.84 972.10 95.62 1462.52 34.57 378.93 1119.03 109.71 1642.24
Kiltan 15.54 226.21 661.95 41.62 945.31 12.58 214.60 800.46 41.69 1069.34
Chetlat 2.56 116.49 393.42 24.96 537.43 4.99 127.11 447.27 24.70 604.08
Bitra 2.97 24.07 51.65 8.40 87.09 3.35 34.84 62.64 14.44 115.27
Minicoy 138.62 590.20 3512.52 77.77 4319.11 129.91 689.78 3867.98 85.86 4773.53
Agatti 36.03 500.38 1381.31 80.68 1998.40 31.84 541.60 1624.50 96.58 2294.51
Kalpeni 14.78 286.07 1056.95 112.80 1470.60 13.19 281.68 1134.76 115.90 1545.53
Bangaram 157.97 0.35 1.80 160.12 — 148.58 0.32 0.45 149.35
Total 399.48 4346.54 14118.30 1112.64 19976.95 388.27 4856.64 16055.00 1242.35 22542.26
Island
2004-2005 2005-2006
Industrial
Commercial
Domestic StreetLight
Total Industrial
Commercial Domestic
StreetLight Total
TABLE - 2ISLANDWISE AND SECTORWISE CONSUMPTION
TABLE - 2 (Contd.)ISLANDWISE AND SECTORWISE CONSUMPTION
Kavaratti 66.09 1802.28 2812.00 375.46 5055.83 66.52 2026.99 2788.85 242.05 5124.41
Amini 19.77 342.36 1783.43 122.63 2268.19 20.06 351.75 1577.29 126.40 2075.50
Andrott 47.30 584.86 2913.22 305.85 3851.23 43.52 613.55 2692.47 323.56 3673.09
Kadmat 51.20 371.43 1172.48 111.60 1706.70 28.60 419.85 1075.76 129.33 1653.54
Kiltan 14.20 252.54 842.04 42.16 1150.94 15.05 267.69 892.56 44.69 1219.99
Chetlat 3.63 133.28 494.82 23.40 655.13 3.30 222.99 445.36 22.44 694.09
Bitra 0.14 43.31 76.37 9.75 129.56 0.15 45.91 80.96 10.33 137.34
Minicoy 136.46 764.01 3941.01 101.30 4942.78 78.49 892.38 3920.17 136.99 5028.02
Agatti 38.34 622.60 1805.82 106.67 2573.42 40.25 653.73 1896.11 112.00 2702.09
Kalpeni 13.73 304.54 1223.09 118.37 1659.73 15.87 327.44 1214.01 118.82 1676.13
Bangaram 0.00 170.93 0.44 0.11 171.48 — 263.74 0.41 264.14
Total 390.85 5392.14 17064.71 1317.30 24165.00 311.80 6086.01 16583.94 1266.61 24248.35
StreetLight
Island2006-2007 2007-2008
Industrial
Commercial
Domestic StreetLight Total
Industrial
Commercial
Domestic Total
Kavaratti 71.88 1938.63 2657.37 260.55 4928.43 75.20 2055.81 2951.07 270.56 5352.64
Amini 23.14 333.47 1622.37 99.46 2078.44 28.16 341.88 1981.33 64.61 2415.97
Andrott 40.80 576.08 2554.92 324.17 3495.97 76.81 575.67 2918.49 339.48 3910.45
Kadmat 19.22 433.73 959.35 156.24 1568.55 20.32 460.66 999.35 155.47 1635.79
Kiltan 13.35 264.85 700.87 47.53 1026.59 14.22 267.48 862.83 52.87 1197.40
Chetlat 4.32 211.53 463.68 29.13 708.67 5.66 181.44 512.82 27.01 726.93
Bitra 1.39 86.18 69.81 17.69 175.07 1.43 88.59 79.14 18.95 188.10
Minicoy 48.86 832.99 3843.76 133.75 4859.36 52.98 895.04 4185.94 128.65 5262.60
Agatti 26.77 735.08 1747.94 102.69 2612.49 37.00 686.23 1953.70 99.41 2776.33
Kalpeni 16.48 342.37 1262.49 128.35 1749.69 16.75 302.50 1324.22 120.25 1763.71
Bangaram 288.47 0.43 288.90 0.00 295.61 0.71 0.00 296.32
Total 266.19 6043.38 15883.01 1299.57 23492.16 328.53 6150.90 17769.59 1277.24 25526.25
Island
2008-2009 2009-2010
Industrial
Commercial
Domestic StreetLight
Total Industrial
Commercial Domestic TotalPublic
TABLE - 2(Contd.)ISLANDWISE AND SECTORWISE CONSUMPTION
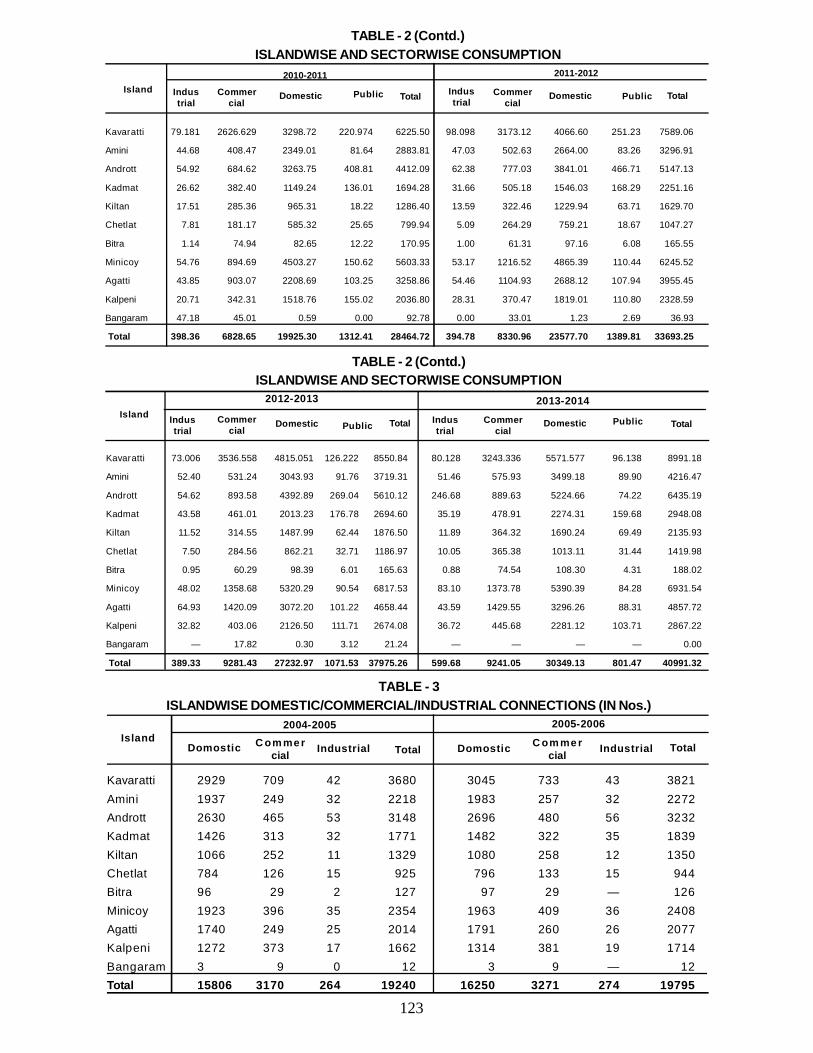
123
TABLE - 2 (Contd.)ISLANDWISE AND SECTORWISE CONSUMPTION
Kavaratti 79.181 2626.629 3298.72 220.974 6225.50 98.098 3173.12 4066.60 251.23 7589.06
Amini 44.68 408.47 2349.01 81.64 2883.81 47.03 502.63 2664.00 83.26 3296.91
Andrott 54.92 684.62 3263.75 408.81 4412.09 62.38 777.03 3841.01 466.71 5147.13
Kadmat 26.62 382.40 1149.24 136.01 1694.28 31.66 505.18 1546.03 168.29 2251.16
Kiltan 17.51 285.36 965.31 18.22 1286.40 13.59 322.46 1229.94 63.71 1629.70
Chetlat 7.81 181.17 585.32 25.65 799.94 5.09 264.29 759.21 18.67 1047.27
Bitra 1.14 74.94 82.65 12.22 170.95 1.00 61.31 97.16 6.08 165.55
Minicoy 54.76 894.69 4503.27 150.62 5603.33 53.17 1216.52 4865.39 110.44 6245.52
Agatti 43.85 903.07 2208.69 103.25 3258.86 54.46 1104.93 2688.12 107.94 3955.45
Kalpeni 20.71 342.31 1518.76 155.02 2036.80 28.31 370.47 1819.01 110.80 2328.59
Bangaram 47.18 45.01 0.59 0.00 92.78 0.00 33.01 1.23 2.69 36.93
Total 398.36 6828.65 19925.30 1312.41 28464.72 394.78 8330.96 23577.70 1389.81 33693.25
Island2010-2011 2011-2012
Industrial
Commercial
Domestic Industrial
Commercial
Domestic Public TotalTotal
TABLE - 3ISLANDWISE DOMESTIC/COMMERCIAL/INDUSTRIAL CONNECTIONS (IN Nos.)
Kavaratti 2929 709 42 3680 3045 733 43 3821Amini 1937 249 32 2218 1983 257 32 2272Andrott 2630 465 53 3148 2696 480 56 3232Kadmat 1426 313 32 1771 1482 322 35 1839Kiltan 1066 252 11 1329 1080 258 12 1350Chetlat 784 126 15 925 796 133 15 944Bitra 96 29 2 127 97 29 — 126Minicoy 1923 396 35 2354 1963 409 36 2408Agatti 1740 249 25 2014 1791 260 26 2077Kalpeni 1272 373 17 1662 1314 381 19 1714Bangaram 3 9 0 12 3 9 — 12Total 15806 3170 264 19240 16250 3271 274 19795
Island2004-2005 2005-2006
DomosticC om me rcial Industrial TotalDomostic C om me r
cial Industrial Total
Public
TABLE - 2 (Contd.)ISLANDWISE AND SECTORWISE CONSUMPTION
Kavaratti 73.006 3536.558 4815.051 126.222 8550.84 80.128 3243.336 5571.577 96.138 8991.18
Amini 52.40 531.24 3043.93 91.76 3719.31 51.46 575.93 3499.18 89.90 4216.47
Andrott 54.62 893.58 4392.89 269.04 5610.12 246.68 889.63 5224.66 74.22 6435.19
Kadmat 43.58 461.01 2013.23 176.78 2694.60 35.19 478.91 2274.31 159.68 2948.08
Kiltan 11.52 314.55 1487.99 62.44 1876.50 11.89 364.32 1690.24 69.49 2135.93
Chetlat 7.50 284.56 862.21 32.71 1186.97 10.05 365.38 1013.11 31.44 1419.98
Bitra 0.95 60.29 98.39 6.01 165.63 0.88 74.54 108.30 4.31 188.02
Minicoy 48.02 1358.68 5320.29 90.54 6817.53 83.10 1373.78 5390.39 84.28 6931.54
Agatti 64.93 1420.09 3072.20 101.22 4658.44 43.59 1429.55 3296.26 88.31 4857.72
Kalpeni 32.82 403.06 2126.50 111.71 2674.08 36.72 445.68 2281.12 103.71 2867.22
Bangaram — 17.82 0.30 3.12 21.24 — — — — 0.00
Total 389.33 9281.43 27232.97 1071.53 37975.26 599.68 9241.05 30349.13 801.47 40991.32
Island2012-2013 2013-2014
Industrial
Commercial
Domestic Total Industrial
Commercial
Domestic TotalPublic Public
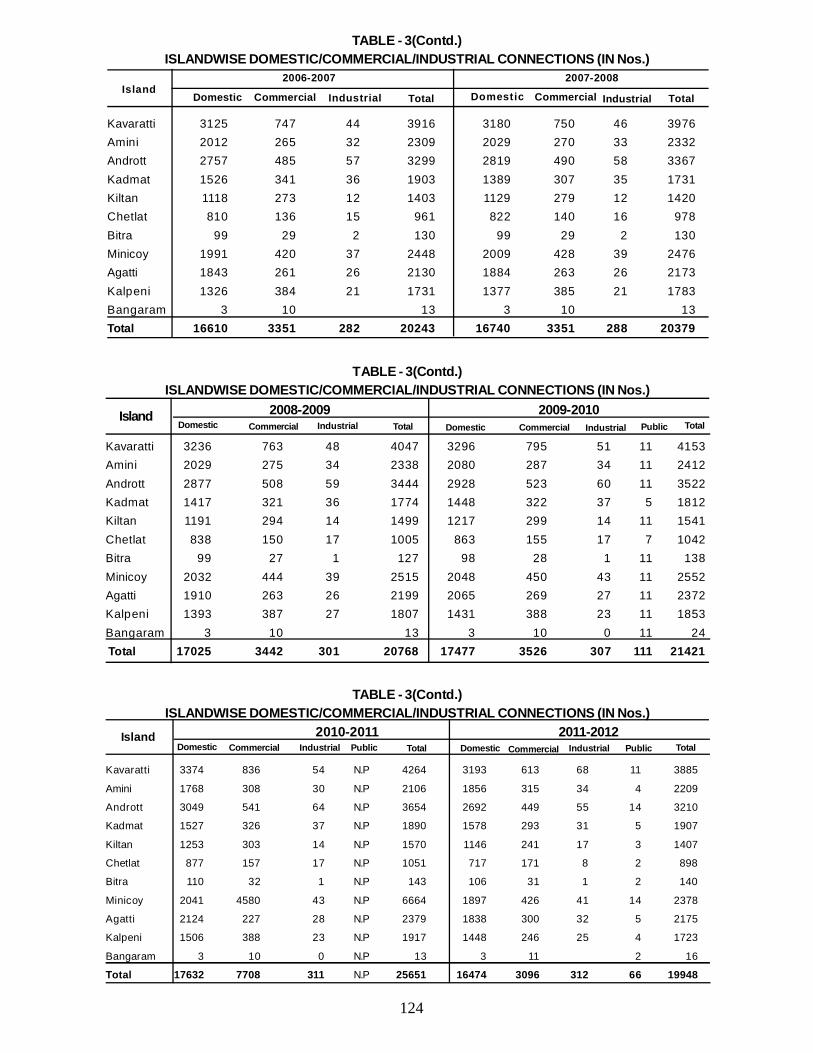
124
TABLE - 3(Contd.)ISLANDWISE DOMESTIC/COMMERCIAL/INDUSTRIAL CONNECTIONS (IN Nos.)
Kavaratti 3236 763 48 4047 3296 795 51 11 4153Amini 2029 275 34 2338 2080 287 34 11 2412Andrott 2877 508 59 3444 2928 523 60 11 3522Kadmat 1417 321 36 1774 1448 322 37 5 1812Kiltan 1191 294 14 1499 1217 299 14 11 1541Chetlat 838 150 17 1005 863 155 17 7 1042Bitra 99 27 1 127 98 28 1 11 138Minicoy 2032 444 39 2515 2048 450 43 11 2552Agatti 1910 263 26 2199 2065 269 27 11 2372Kalpeni 1393 387 27 1807 1431 388 23 11 1853Bangaram 3 10 13 3 10 0 11 24 Total 17025 3442 301 20768 17477 3526 307 111 21421
IslandDomestic Commercial Industrial Total Domestic Commercial Industrial Public Total
2008-2009 2009-2010
TABLE - 3(Contd.)ISLANDWISE DOMESTIC/COMMERCIAL/INDUSTRIAL CONNECTIONS (IN Nos.)
2010-2011 2011-2012
Kavaratti 3374 836 54 N.P 4264 3193 613 68 11 3885
Amini 1768 308 30 N.P 2106 1856 315 34 4 2209
Andrott 3049 541 64 N.P 3654 2692 449 55 14 3210
Kadmat 1527 326 37 N.P 1890 1578 293 31 5 1907
Kiltan 1253 303 14 N.P 1570 1146 241 17 3 1407
Chetlat 877 157 17 N.P 1051 717 171 8 2 898
Bitra 110 32 1 N.P 143 106 31 1 2 140
Minicoy 2041 4580 43 N.P 6664 1897 426 41 14 2378
Agatti 2124 227 28 N.P 2379 1838 300 32 5 2175
Kalpeni 1506 388 23 N.P 1917 1448 246 25 4 1723
Bangaram 3 10 0 N.P 13 3 11 2 16
Total 17632 7708 311 N.P 25651 16474 3096 312 66 19948
IslandDomestic Commercial Industrial Public Total Domestic Commercial Industrial Public Total
Kavaratti 3125 747 44 3916 3180 750 46 3976Amini 2012 265 32 2309 2029 270 33 2332Andrott 2757 485 57 3299 2819 490 58 3367Kadmat 1526 341 36 1903 1389 307 35 1731Kiltan 1118 273 12 1403 1129 279 12 1420Chetlat 810 136 15 961 822 140 16 978Bitra 99 29 2 130 99 29 2 130Minicoy 1991 420 37 2448 2009 428 39 2476Agatti 1843 261 26 2130 1884 263 26 2173Kalpeni 1326 384 21 1731 1377 385 21 1783Bangaram 3 10 13 3 10 13Total 16610 3351 282 20243 16740 3351 288 20379
TABLE - 3(Contd.)ISLANDWISE DOMESTIC/COMMERCIAL/INDUSTRIAL CONNECTIONS (IN Nos.)
Island2006-2007 2007-2008
Domestic Commercial Industrial Total Domestic Commercial Industrial Total
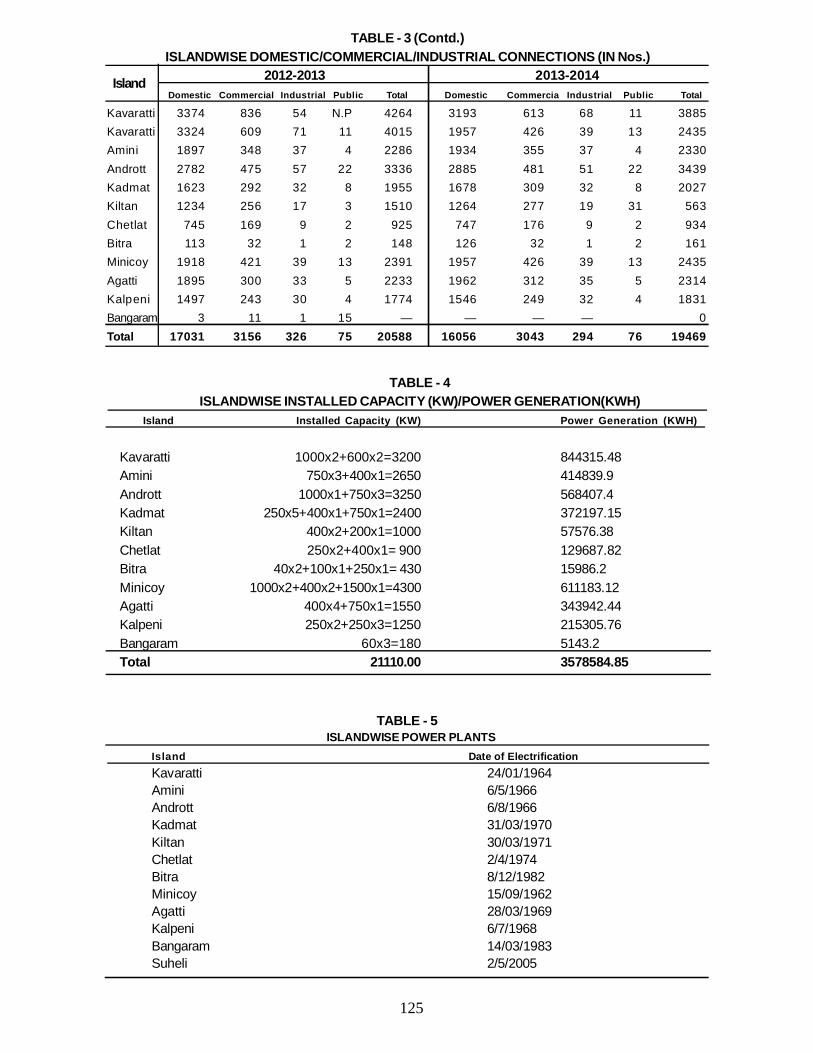
125
TABLE - 4ISLANDWISE INSTALLED CAPACITY (KW)/POWER GENERATION(KWH)
Island Installed Capacity (KW) Power Generation (KWH)
Kavaratti 1000x2+600x2=3200 844315.48Amini 750x3+400x1=2650 414839.9Andrott 1000x1+750x3=3250 568407.4Kadmat 250x5+400x1+750x1=2400 372197.15Kiltan 400x2+200x1=1000 57576.38Chetlat 250x2+400x1= 900 129687.82Bitra 40x2+100x1+250x1= 430 15986.2Minicoy 1000x2+400x2+1500x1=4300 611183.12Agatti 400x4+750x1=1550 343942.44Kalpeni 250x2+250x3=1250 215305.76Bangaram 60x3=180 5143.2Total 21110.00 3578584.85
TABLE - 3 (Contd.)ISLANDWISE DOMESTIC/COMMERCIAL/INDUSTRIAL CONNECTIONS (IN Nos.)
2012-2013 2013-2014Domestic Commercial Industrial Public Total Domestic Commercia Industrial Public Total
Kavaratti 3374 836 54 N.P 4264 3193 613 68 11 3885Kavaratti 3324 609 71 11 4015 1957 426 39 13 2435Amini 1897 348 37 4 2286 1934 355 37 4 2330Andrott 2782 475 57 22 3336 2885 481 51 22 3439Kadmat 1623 292 32 8 1955 1678 309 32 8 2027Kiltan 1234 256 17 3 1510 1264 277 19 31 563Chetlat 745 169 9 2 925 747 176 9 2 934Bitra 113 32 1 2 148 126 32 1 2 161Minicoy 1918 421 39 13 2391 1957 426 39 13 2435Agatti 1895 300 33 5 2233 1962 312 35 5 2314Kalpeni 1497 243 30 4 1774 1546 249 32 4 1831Bangaram 3 11 1 15 — — — — 0Total 17031 3156 326 75 20588 16056 3043 294 76 19469
Island
ISLANDWISE POWER PLANTSIsland Date of ElectrificationKavaratti 24/01/1964Amini 6/5/1966Andrott 6/8/1966Kadmat 31/03/1970Kiltan 30/03/1971Chetlat 2/4/1974Bitra 8/12/1982Minicoy 15/09/1962Agatti 28/03/1969Kalpeni 6/7/1968Bangaram 14/03/1983Suheli 2/5/2005
TABLE - 5
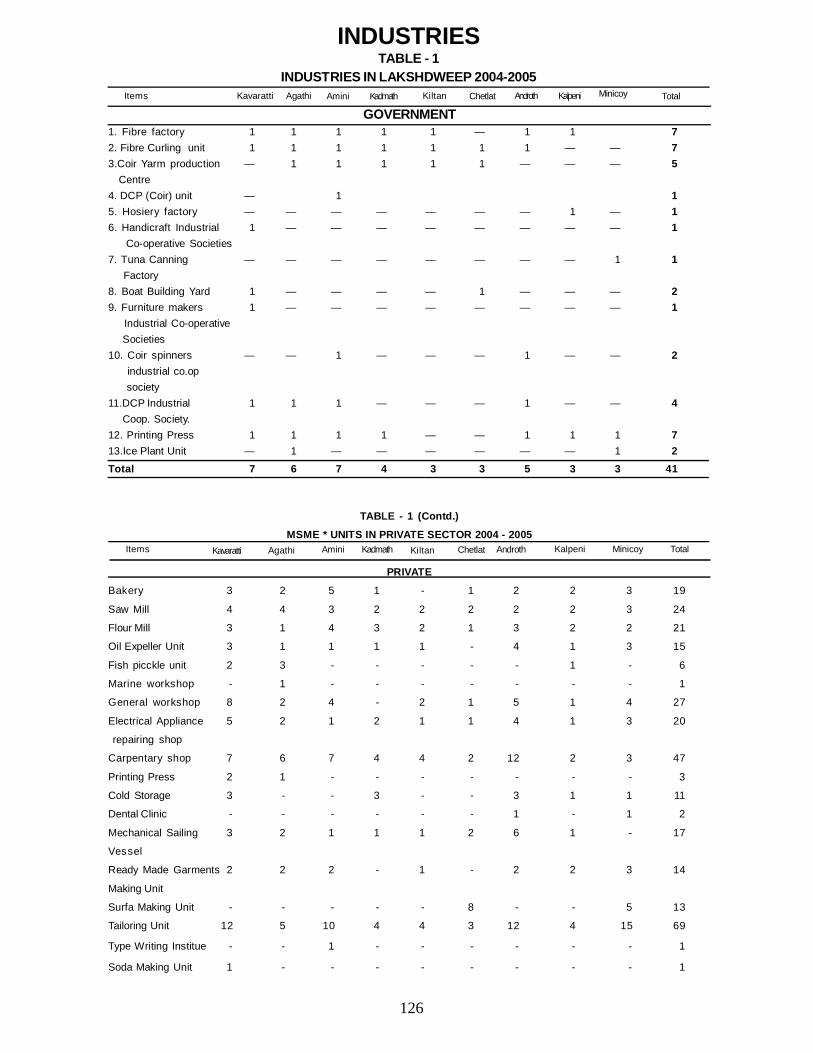
126
TABLE - 1 (Contd.)
MSME * UNITS IN PRIVATE SECTOR 2004 - 2005
PRIVATE
Bakery 3 2 5 1 - 1 2 2 3 19
Saw Mill 4 4 3 2 2 2 2 2 3 24
Flour Mill 3 1 4 3 2 1 3 2 2 21
Oil Expeller Unit 3 1 1 1 1 - 4 1 3 15
Fish picckle unit 2 3 - - - - - 1 - 6
Marine workshop - 1 - - - - - - - 1
General workshop 8 2 4 - 2 1 5 1 4 27
Electrical Appliance 5 2 1 2 1 1 4 1 3 20
repairing shop
Carpentary shop 7 6 7 4 4 2 12 2 3 47
Printing Press 2 1 - - - - - - - 3
Cold Storage 3 - - 3 - - 3 1 1 11
Dental Clinic - - - - - - 1 - 1 2
Mechanical Sailing 3 2 1 1 1 2 6 1 - 17
Vessel
Ready Made Garments 2 2 2 - 1 - 2 2 3 14
Making Unit
Surfa Making Unit - - - - - 8 - - 5 13
Tailoring Unit 12 5 10 4 4 3 12 4 15 69
Type Writing Institue - - 1 - - - - - - 1
Soda Making Unit 1 - - - - - - - - 1
Items Kavaratti Agathi Amini Kadmath Kiltan Chetlat Androth Kalpeni Minicoy Total
INDUSTRIESTABLE - 1
INDUSTRIES IN LAKSHDWEEP 2004-2005
GOVERNMENT1. Fibre factory 1 1 1 1 1 — 1 1 72. Fibre Curling unit 1 1 1 1 1 1 1 — — 73.Coir Yarm production — 1 1 1 1 1 — — — 5 Centre4. DCP (Coir) unit — 1 15. Hosiery factory — — — — — — — 1 — 16. Handicraft Industrial 1 — — — — — — — — 1 Co-operative Societies7. Tuna Canning — — — — — — — — 1 1 Factory8. Boat Building Yard 1 — — — — 1 — — — 29. Furniture makers 1 — — — — — — — — 1 Industrial Co-operative Societies10. Coir spinners — — 1 — — — 1 — — 2 industrial co.op society11.DCP Industrial 1 1 1 — — — 1 — — 4 Coop. Society.12. Printing Press 1 1 1 1 — — 1 1 1 713.Ice Plant Unit — 1 — — — — — — 1 2Total 7 6 7 4 3 3 5 3 3 41
Items Kavaratti Agathi Amini Kadmath Kiltan Chetlat Androth Kalpeni Minicoy Total
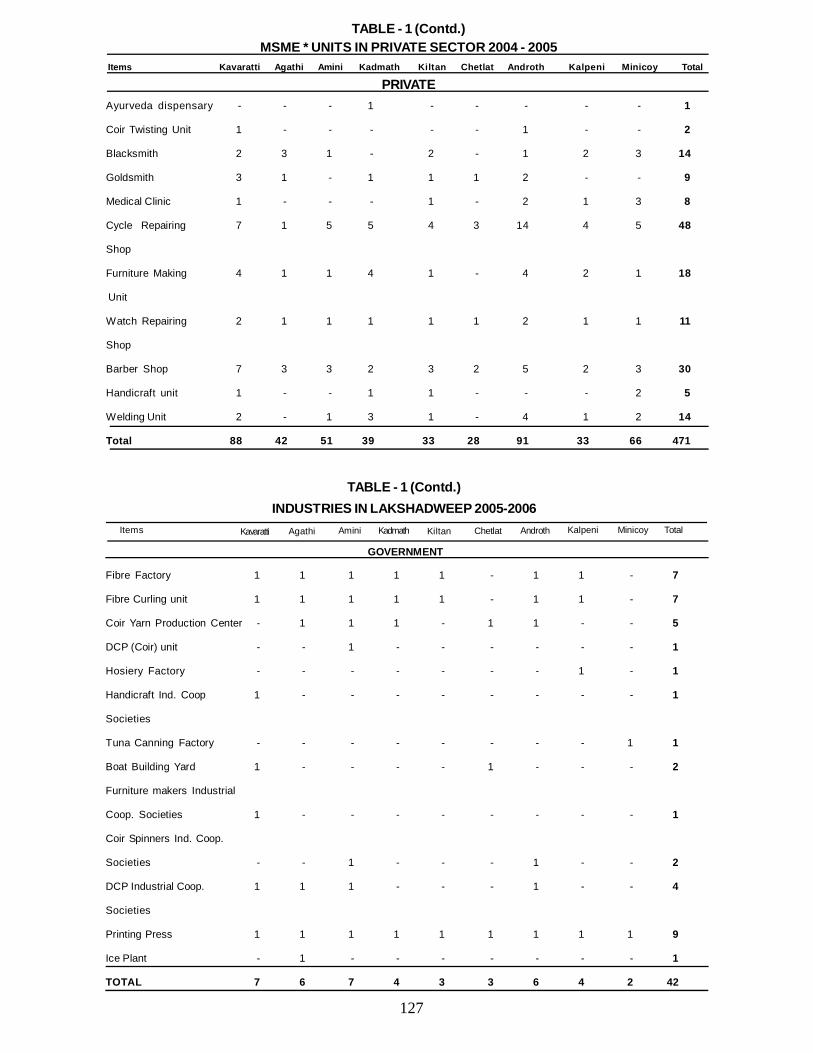
127
Ayurveda dispensary - - - 1 - - - - - 1
Coir Twisting Unit 1 - - - - - 1 - - 2
Blacksmith 2 3 1 - 2 - 1 2 3 14
Goldsmith 3 1 - 1 1 1 2 - - 9
Medical Clinic 1 - - - 1 - 2 1 3 8
Cycle Repairing 7 1 5 5 4 3 14 4 5 48
Shop
Furniture Making 4 1 1 4 1 - 4 2 1 18
Unit
Watch Repairing 2 1 1 1 1 1 2 1 1 11
Shop
Barber Shop 7 3 3 2 3 2 5 2 3 30
Handicraft unit 1 - - 1 1 - - - 2 5
Welding Unit 2 - 1 3 1 - 4 1 2 14
Total 88 42 51 39 33 28 91 33 66 471
TABLE - 1 (Contd.)MSME * UNITS IN PRIVATE SECTOR 2004 - 2005
Items Kavaratti Agathi Amini Kadmath Kiltan Chetlat Androth Kalpeni Minicoy Total
PRIVATE
Items Kavaratti Agathi Amini Kadmath Kiltan Chetlat Androth Kalpeni Minicoy Total
TABLE - 1 (Contd.)INDUSTRIES IN LAKSHADWEEP 2005-2006
GOVERNMENT
Fibre Factory 1 1 1 1 1 - 1 1 - 7
Fibre Curling unit 1 1 1 1 1 - 1 1 - 7
Coir Yarn Production Center - 1 1 1 - 1 1 - - 5
DCP (Coir) unit - - 1 - - - - - - 1
Hosiery Factory - - - - - - - 1 - 1
Handicraft Ind. Coop 1 - - - - - - - - 1
Societies
Tuna Canning Factory - - - - - - - - 1 1
Boat Building Yard 1 - - - - 1 - - - 2
Furniture makers Industrial
Coop. Societies 1 - - - - - - - - 1
Coir Spinners Ind. Coop.
Societies - - 1 - - - 1 - - 2
DCP Industrial Coop. 1 1 1 - - - 1 - - 4
Societies
Printing Press 1 1 1 1 1 1 1 1 1 9
Ice Plant - 1 - - - - - - - 1
TOTAL 7 6 7 4 3 3 6 4 2 42
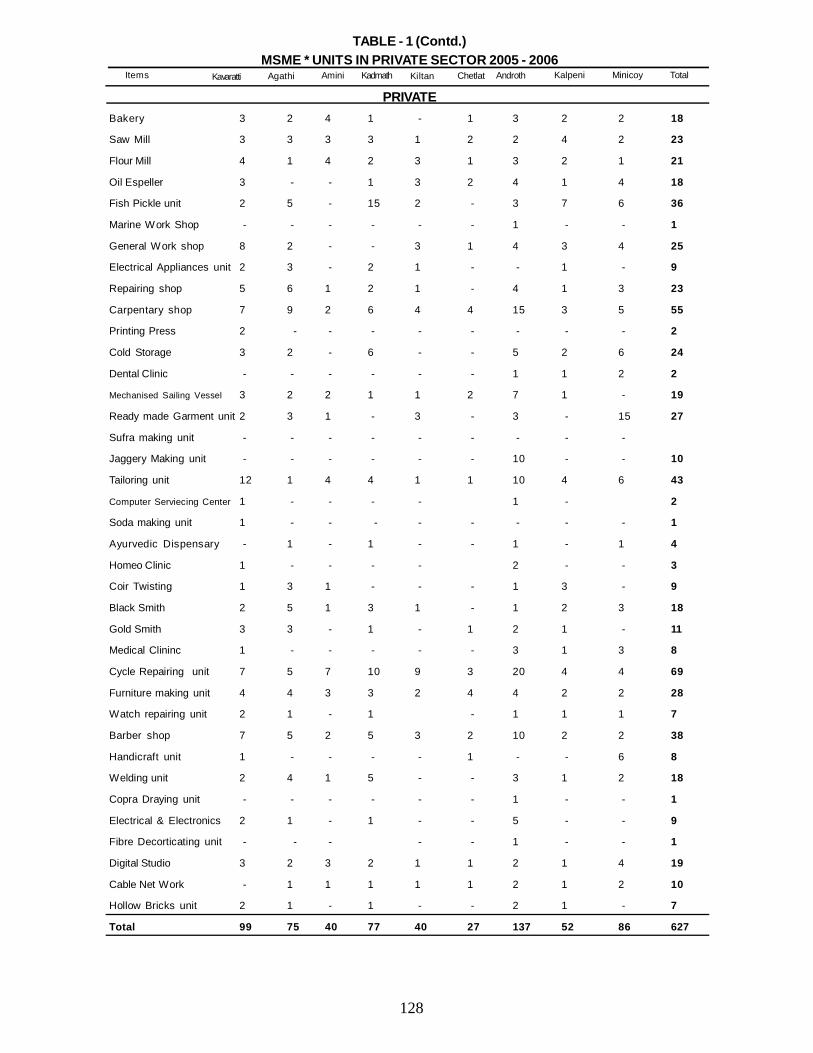
128
TABLE - 1 (Contd.)MSME * UNITS IN PRIVATE SECTOR 2005 - 2006
PRIVATEBakery 3 2 4 1 - 1 3 2 2 18
Saw Mill 3 3 3 3 1 2 2 4 2 23
Flour Mill 4 1 4 2 3 1 3 2 1 21
Oil Espeller 3 - - 1 3 2 4 1 4 18
Fish Pickle unit 2 5 - 15 2 - 3 7 6 36
Marine Work Shop - - - - - - 1 - - 1
General Work shop 8 2 - - 3 1 4 3 4 25
Electrical Appliances unit 2 3 - 2 1 - - 1 - 9
Repairing shop 5 6 1 2 1 - 4 1 3 23
Carpentary shop 7 9 2 6 4 4 15 3 5 55
Printing Press 2 - - - - - - - - 2
Cold Storage 3 2 - 6 - - 5 2 6 24
Dental Clinic - - - - - - 1 1 2 2
Mechanised Sailing Vessel 3 2 2 1 1 2 7 1 - 19
Ready made Garment unit 2 3 1 - 3 - 3 - 15 27
Sufra making unit - - - - - - - - -
Jaggery Making unit - - - - - - 10 - - 10
Tailoring unit 12 1 4 4 1 1 10 4 6 43
Computer Serviecing Center 1 - - - - 1 - 2
Soda making unit 1 - - - - - - - - 1
Ayurvedic Dispensary - 1 - 1 - - 1 - 1 4
Homeo Clinic 1 - - - - 2 - - 3
Coir Twisting 1 3 1 - - - 1 3 - 9
Black Smith 2 5 1 3 1 - 1 2 3 18
Gold Smith 3 3 - 1 - 1 2 1 - 11
Medical Clininc 1 - - - - - 3 1 3 8
Cycle Repairing unit 7 5 7 10 9 3 20 4 4 69
Furniture making unit 4 4 3 3 2 4 4 2 2 28
Watch repairing unit 2 1 - 1 - 1 1 1 7
Barber shop 7 5 2 5 3 2 10 2 2 38
Handicraft unit 1 - - - - 1 - - 6 8
Welding unit 2 4 1 5 - - 3 1 2 18
Copra Draying unit - - - - - - 1 - - 1
Electrical & Electronics 2 1 - 1 - - 5 - - 9
Fibre Decorticating unit - - - - - 1 - - 1
Digital Studio 3 2 3 2 1 1 2 1 4 19
Cable Net Work - 1 1 1 1 1 2 1 2 10
Hollow Bricks unit 2 1 - 1 - - 2 1 - 7
Total 99 75 40 77 40 27 137 52 86 627
Items Kavaratti Agathi Amini Kadmath Kiltan Chetlat Androth Kalpeni Minicoy Total
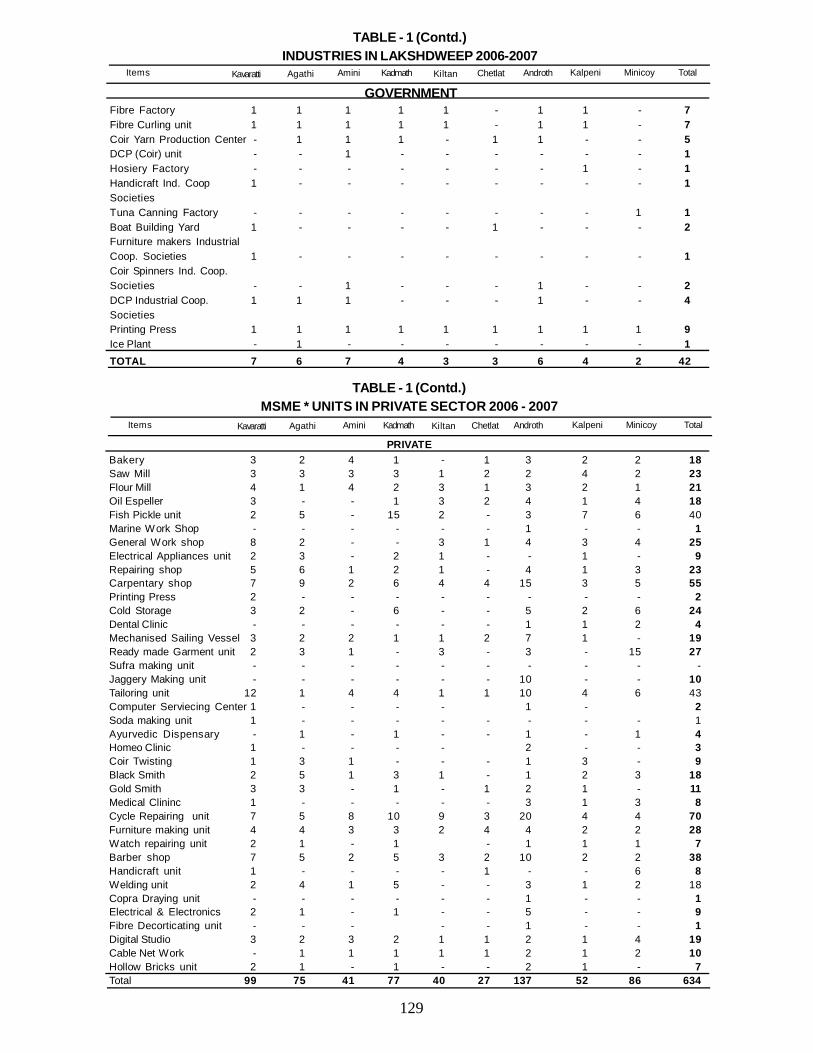
129
TABLE - 1 (Contd.)INDUSTRIES IN LAKSHDWEEP 2006-2007
GOVERNMENTFibre Factory 1 1 1 1 1 - 1 1 - 7Fibre Curling unit 1 1 1 1 1 - 1 1 - 7Coir Yarn Production Center - 1 1 1 - 1 1 - - 5DCP (Coir) unit - - 1 - - - - - - 1Hosiery Factory - - - - - - - 1 - 1Handicraft Ind. Coop 1 - - - - - - - - 1SocietiesTuna Canning Factory - - - - - - - - 1 1Boat Building Yard 1 - - - - 1 - - - 2Furniture makers IndustrialCoop. Societies 1 - - - - - - - - 1Coir Spinners Ind. Coop.Societies - - 1 - - - 1 - - 2DCP Industrial Coop. 1 1 1 - - - 1 - - 4SocietiesPrinting Press 1 1 1 1 1 1 1 1 1 9Ice Plant - 1 - - - - - - - 1TOTAL 7 6 7 4 3 3 6 4 2 42
Items Kavaratti Agathi Amini Kadmath Kiltan Chetlat Androth Kalpeni Minicoy Total
TABLE - 1 (Contd.)MSME * UNITS IN PRIVATE SECTOR 2006 - 2007
PRIVATEBakery 3 2 4 1 - 1 3 2 2 18Saw Mill 3 3 3 3 1 2 2 4 2 23Flour Mill 4 1 4 2 3 1 3 2 1 21Oil Espeller 3 - - 1 3 2 4 1 4 18Fish Pickle unit 2 5 - 15 2 - 3 7 6 40Marine Work Shop - - - - - - 1 - - 1General Work shop 8 2 - - 3 1 4 3 4 25Electrical Appliances unit 2 3 - 2 1 - - 1 - 9Repairing shop 5 6 1 2 1 - 4 1 3 23Carpentary shop 7 9 2 6 4 4 15 3 5 55Printing Press 2 - - - - - - - - 2Cold Storage 3 2 - 6 - - 5 2 6 24Dental Clinic - - - - - - 1 1 2 4Mechanised Sailing Vessel 3 2 2 1 1 2 7 1 - 19Ready made Garment unit 2 3 1 - 3 - 3 - 15 27Sufra making unit - - - - - - - - - -Jaggery Making unit - - - - - - 10 - - 10Tailoring unit 12 1 4 4 1 1 10 4 6 43Computer Serviecing Center 1 - - - - 1 - 2Soda making unit 1 - - - - - - - - 1Ayurvedic Dispensary - 1 - 1 - - 1 - 1 4Homeo Clinic 1 - - - - 2 - - 3Coir Twisting 1 3 1 - - - 1 3 - 9Black Smith 2 5 1 3 1 - 1 2 3 18Gold Smith 3 3 - 1 - 1 2 1 - 11Medical Clininc 1 - - - - - 3 1 3 8Cycle Repairing unit 7 5 8 10 9 3 20 4 4 70Furniture making unit 4 4 3 3 2 4 4 2 2 28Watch repairing unit 2 1 - 1 - 1 1 1 7Barber shop 7 5 2 5 3 2 10 2 2 38Handicraft unit 1 - - - - 1 - - 6 8Welding unit 2 4 1 5 - - 3 1 2 18Copra Draying unit - - - - - - 1 - - 1Electrical & Electronics 2 1 - 1 - - 5 - - 9Fibre Decorticating unit - - - - - 1 - - 1Digital Studio 3 2 3 2 1 1 2 1 4 19Cable Net Work - 1 1 1 1 1 2 1 2 10Hollow Bricks unit 2 1 - 1 - - 2 1 - 7Total 99 75 41 77 40 27 137 52 86 634
Items Kavaratti Agathi Amini Kadmath Kiltan Chetlat Androth Kalpeni Minicoy Total
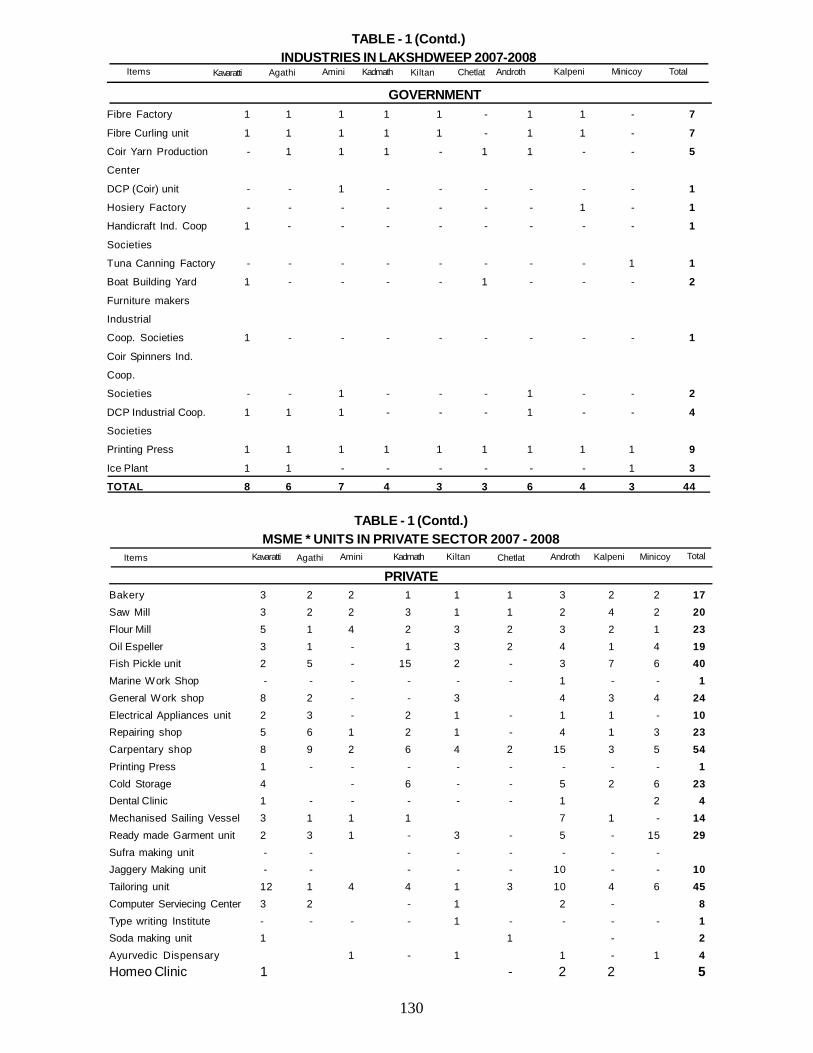
130
TABLE - 1 (Contd.)INDUSTRIES IN LAKSHDWEEP 2007-2008
GOVERNMENTFibre Factory 1 1 1 1 1 - 1 1 - 7
Fibre Curling unit 1 1 1 1 1 - 1 1 - 7
Coir Yarn Production - 1 1 1 - 1 1 - - 5
Center
DCP (Coir) unit - - 1 - - - - - - 1
Hosiery Factory - - - - - - - 1 - 1
Handicraft Ind. Coop 1 - - - - - - - - 1
Societies
Tuna Canning Factory - - - - - - - - 1 1
Boat Building Yard 1 - - - - 1 - - - 2
Furniture makers
Industrial
Coop. Societies 1 - - - - - - - - 1
Coir Spinners Ind.
Coop.
Societies - - 1 - - - 1 - - 2
DCP Industrial Coop. 1 1 1 - - - 1 - - 4
Societies
Printing Press 1 1 1 1 1 1 1 1 1 9
Ice Plant 1 1 - - - - - - 1 3
TOTAL 8 6 7 4 3 3 6 4 3 44
Items Kavaratti Agathi Amini Kadmath Kiltan Chetlat Androth Kalpeni Minicoy Total
TABLE - 1 (Contd.)MSME * UNITS IN PRIVATE SECTOR 2007 - 2008
PRIVATEBakery 3 2 2 1 1 1 3 2 2 17Saw Mill 3 2 2 3 1 1 2 4 2 20Flour Mill 5 1 4 2 3 2 3 2 1 23Oil Espeller 3 1 - 1 3 2 4 1 4 19Fish Pickle unit 2 5 - 15 2 - 3 7 6 40Marine Work Shop - - - - - - 1 - - 1General Work shop 8 2 - - 3 4 3 4 24Electrical Appliances unit 2 3 - 2 1 - 1 1 - 10Repairing shop 5 6 1 2 1 - 4 1 3 23Carpentary shop 8 9 2 6 4 2 15 3 5 54Printing Press 1 - - - - - - - - 1Cold Storage 4 - 6 - - 5 2 6 23Dental Clinic 1 - - - - - 1 2 4Mechanised Sailing Vessel 3 1 1 1 7 1 - 14Ready made Garment unit 2 3 1 - 3 - 5 - 15 29Sufra making unit - - - - - - - -Jaggery Making unit - - - - - 10 - - 10Tailoring unit 12 1 4 4 1 3 10 4 6 45Computer Serviecing Center 3 2 - 1 2 - 8Type writing Institute - - - - 1 - - - - 1Soda making unit 1 1 - 2Ayurvedic Dispensary 1 - 1 1 - 1 4Homeo Clinic 1 - 2 2 5
Items Kavaratti Agathi Amini Kadmath Kiltan Chetlat Androth Kalpeni Minicoy Total
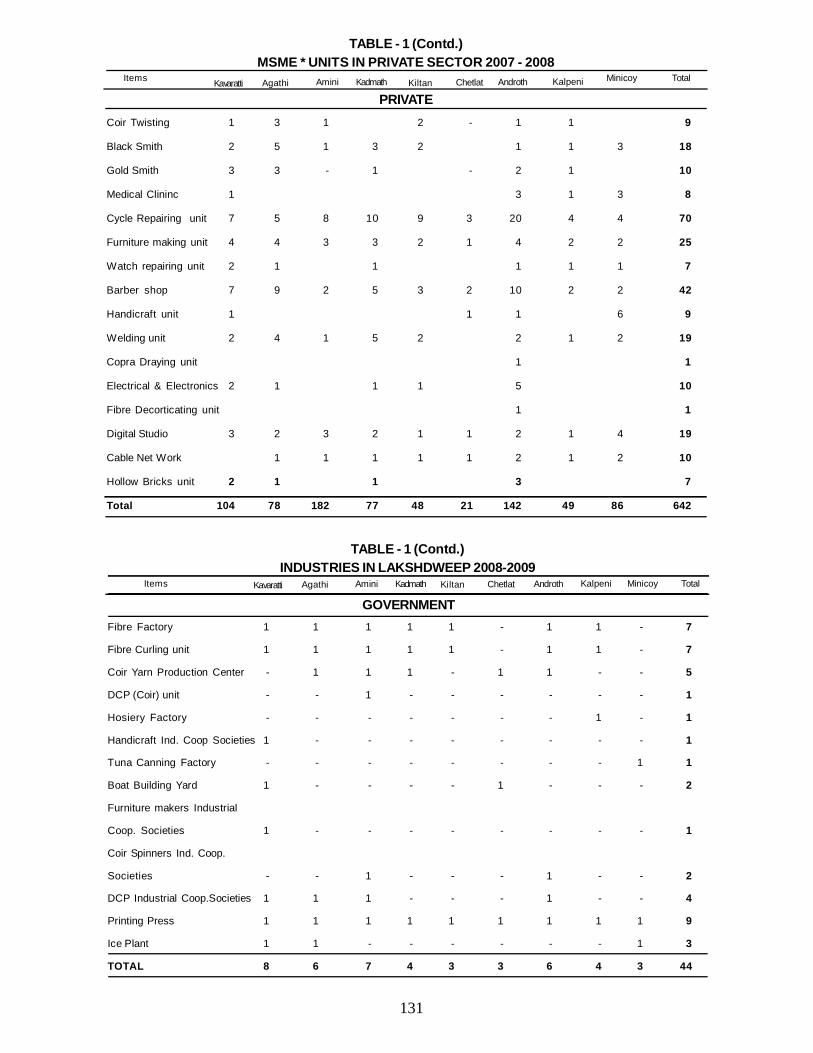
131
TABLE - 1 (Contd.)MSME * UNITS IN PRIVATE SECTOR 2007 - 2008
PRIVATECoir Twisting 1 3 1 2 - 1 1 9
Black Smith 2 5 1 3 2 1 1 3 18
Gold Smith 3 3 - 1 - 2 1 10
Medical Clininc 1 3 1 3 8
Cycle Repairing unit 7 5 8 10 9 3 20 4 4 70
Furniture making unit 4 4 3 3 2 1 4 2 2 25
Watch repairing unit 2 1 1 1 1 1 7
Barber shop 7 9 2 5 3 2 10 2 2 42
Handicraft unit 1 1 1 6 9
Welding unit 2 4 1 5 2 2 1 2 19
Copra Draying unit 1 1
Electrical & Electronics 2 1 1 1 5 10
Fibre Decorticating unit 1 1
Digital Studio 3 2 3 2 1 1 2 1 4 19
Cable Net Work 1 1 1 1 1 2 1 2 10
Hollow Bricks unit 2 1 1 3 7
Total 104 78 182 77 48 21 142 49 86 642
Items Kavaratti Agathi Amini Kadmath Kiltan Chetlat Androth Kalpeni Minicoy Total
TABLE - 1 (Contd.)INDUSTRIES IN LAKSHDWEEP 2008-2009
GOVERNMENTFibre Factory 1 1 1 1 1 - 1 1 - 7
Fibre Curling unit 1 1 1 1 1 - 1 1 - 7
Coir Yarn Production Center - 1 1 1 - 1 1 - - 5
DCP (Coir) unit - - 1 - - - - - - 1
Hosiery Factory - - - - - - - 1 - 1
Handicraft Ind. Coop Societies 1 - - - - - - - - 1
Tuna Canning Factory - - - - - - - - 1 1
Boat Building Yard 1 - - - - 1 - - - 2
Furniture makers Industrial
Coop. Societies 1 - - - - - - - - 1
Coir Spinners Ind. Coop.
Societies - - 1 - - - 1 - - 2
DCP Industrial Coop.Societies 1 1 1 - - - 1 - - 4
Printing Press 1 1 1 1 1 1 1 1 1 9
Ice Plant 1 1 - - - - - - 1 3
TOTAL 8 6 7 4 3 3 6 4 3 44
Items Kavaratti Agathi Amini Kadmath Kiltan Chetlat Androth Kalpeni Minicoy Total
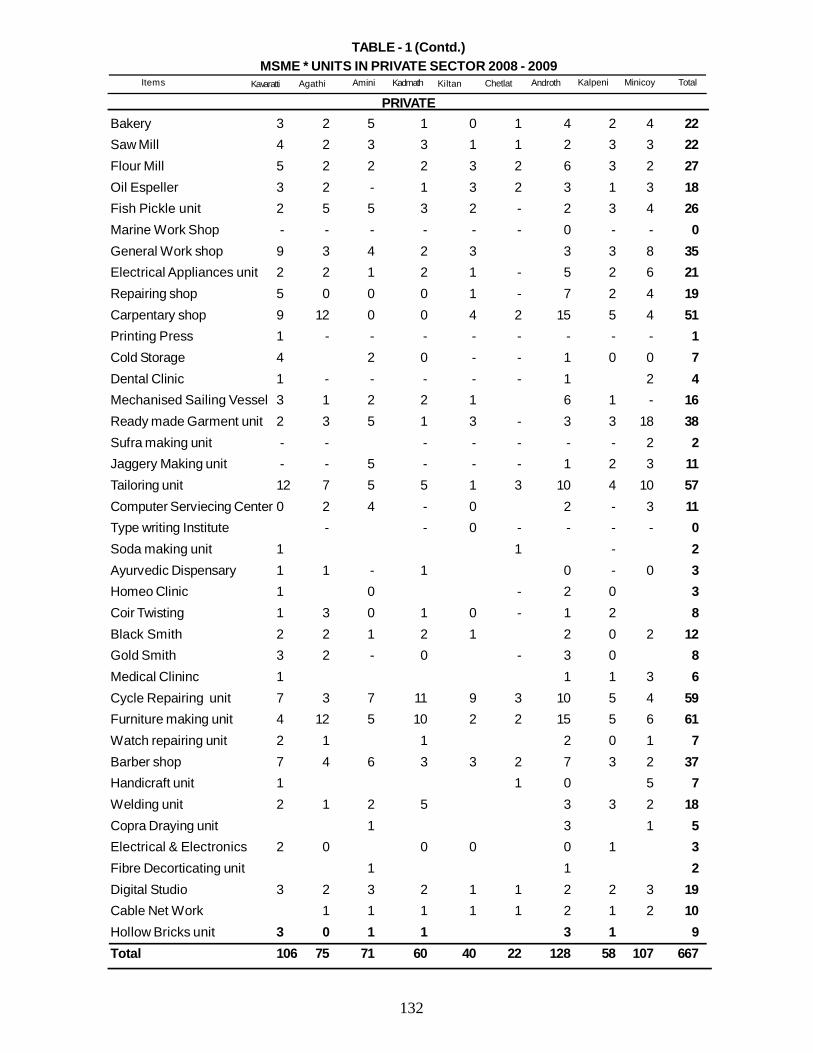
132
TABLE - 1 (Contd.)MSME * UNITS IN PRIVATE SECTOR 2008 - 2009
PRIVATEBakery 3 2 5 1 0 1 4 2 4 22Saw Mill 4 2 3 3 1 1 2 3 3 22Flour Mill 5 2 2 2 3 2 6 3 2 27Oil Espeller 3 2 - 1 3 2 3 1 3 18Fish Pickle unit 2 5 5 3 2 - 2 3 4 26Marine Work Shop - - - - - - 0 - - 0General Work shop 9 3 4 2 3 3 3 8 35Electrical Appliances unit 2 2 1 2 1 - 5 2 6 21Repairing shop 5 0 0 0 1 - 7 2 4 19Carpentary shop 9 12 0 0 4 2 15 5 4 51Printing Press 1 - - - - - - - - 1Cold Storage 4 2 0 - - 1 0 0 7Dental Clinic 1 - - - - - 1 2 4Mechanised Sailing Vessel 3 1 2 2 1 6 1 - 16Ready made Garment unit 2 3 5 1 3 - 3 3 18 38Sufra making unit - - - - - - - 2 2Jaggery Making unit - - 5 - - - 1 2 3 11Tailoring unit 12 7 5 5 1 3 10 4 10 57Computer Serviecing Center 0 2 4 - 0 2 - 3 11Type writing Institute - - 0 - - - - 0Soda making unit 1 1 - 2Ayurvedic Dispensary 1 1 - 1 0 - 0 3Homeo Clinic 1 0 - 2 0 3Coir Twisting 1 3 0 1 0 - 1 2 8Black Smith 2 2 1 2 1 2 0 2 12Gold Smith 3 2 - 0 - 3 0 8Medical Clininc 1 1 1 3 6Cycle Repairing unit 7 3 7 11 9 3 10 5 4 59Furniture making unit 4 12 5 10 2 2 15 5 6 61Watch repairing unit 2 1 1 2 0 1 7Barber shop 7 4 6 3 3 2 7 3 2 37Handicraft unit 1 1 0 5 7Welding unit 2 1 2 5 3 3 2 18Copra Draying unit 1 3 1 5Electrical & Electronics 2 0 0 0 0 1 3Fibre Decorticating unit 1 1 2Digital Studio 3 2 3 2 1 1 2 2 3 19Cable Net Work 1 1 1 1 1 2 1 2 10Hollow Bricks unit 3 0 1 1 3 1 9Total 106 75 71 60 40 22 128 58 107 667
Items Kavaratti Agathi Amini Kadmath Kiltan Chetlat Androth Kalpeni Minicoy Total
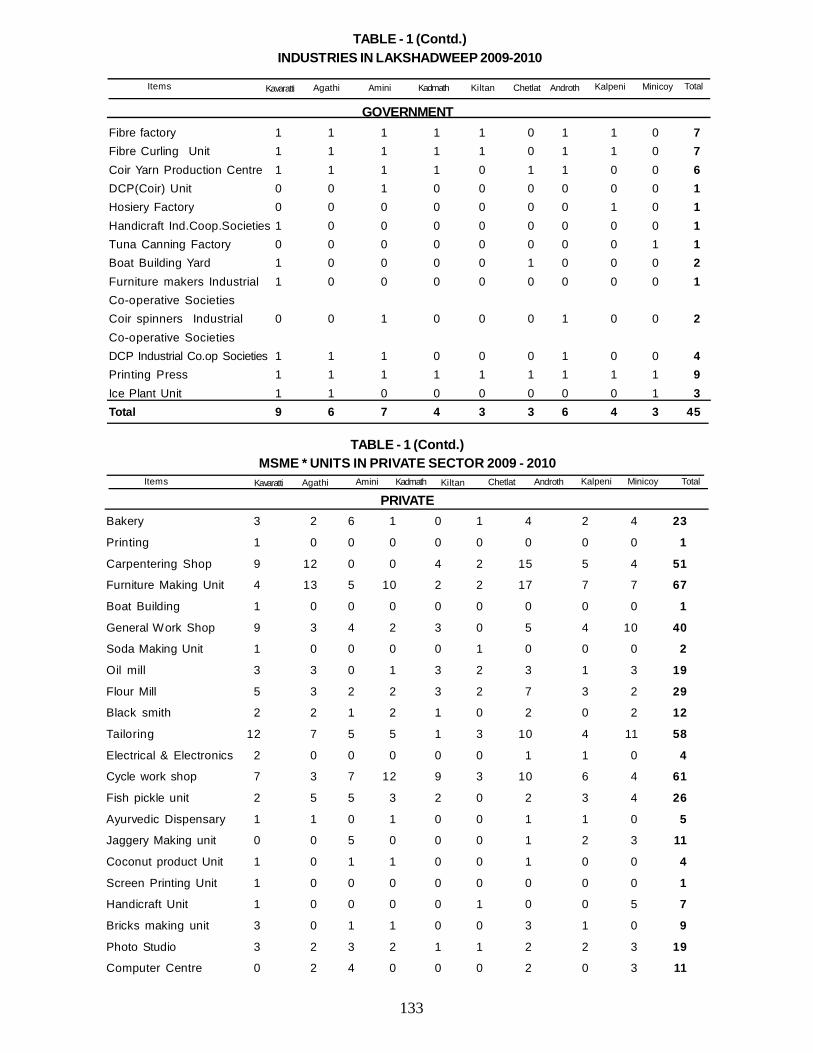
133
TABLE - 1 (Contd.)MSME * UNITS IN PRIVATE SECTOR 2009 - 2010
PRIVATEBakery 3 2 6 1 0 1 4 2 4 23
Printing 1 0 0 0 0 0 0 0 0 1
Carpentering Shop 9 12 0 0 4 2 15 5 4 51
Furniture Making Unit 4 13 5 10 2 2 17 7 7 67
Boat Building 1 0 0 0 0 0 0 0 0 1
General Work Shop 9 3 4 2 3 0 5 4 10 40
Soda Making Unit 1 0 0 0 0 1 0 0 0 2
Oil mill 3 3 0 1 3 2 3 1 3 19
Flour Mill 5 3 2 2 3 2 7 3 2 29
Black smith 2 2 1 2 1 0 2 0 2 12
Tailoring 12 7 5 5 1 3 10 4 11 58
Electrical & Electronics 2 0 0 0 0 0 1 1 0 4
Cycle work shop 7 3 7 12 9 3 10 6 4 61
Fish pickle unit 2 5 5 3 2 0 2 3 4 26
Ayurvedic Dispensary 1 1 0 1 0 0 1 1 0 5
Jaggery Making unit 0 0 5 0 0 0 1 2 3 11
Coconut product Unit 1 0 1 1 0 0 1 0 0 4
Screen Printing Unit 1 0 0 0 0 0 0 0 0 1
Handicraft Unit 1 0 0 0 0 1 0 0 5 7
Bricks making unit 3 0 1 1 0 0 3 1 0 9
Photo Studio 3 2 3 2 1 1 2 2 3 19
Computer Centre 0 2 4 0 0 0 2 0 3 11
Items Kavaratti Agathi Amini Kadmath Kiltan Chetlat Androth Kalpeni Minicoy Total
TABLE - 1 (Contd.)INDUSTRIES IN LAKSHADWEEP 2009-2010
Fibre factory 1 1 1 1 1 0 1 1 0 7Fibre Curling Unit 1 1 1 1 1 0 1 1 0 7Coir Yarn Production Centre 1 1 1 1 0 1 1 0 0 6DCP(Coir) Unit 0 0 1 0 0 0 0 0 0 1Hosiery Factory 0 0 0 0 0 0 0 1 0 1Handicraft Ind.Coop.Societies 1 0 0 0 0 0 0 0 0 1Tuna Canning Factory 0 0 0 0 0 0 0 0 1 1Boat Building Yard 1 0 0 0 0 1 0 0 0 2Furniture makers Industrial 1 0 0 0 0 0 0 0 0 1Co-operative SocietiesCoir spinners Industrial 0 0 1 0 0 0 1 0 0 2Co-operative SocietiesDCP Industrial Co.op Societies 1 1 1 0 0 0 1 0 0 4Printing Press 1 1 1 1 1 1 1 1 1 9Ice Plant Unit 1 1 0 0 0 0 0 0 1 3Total 9 6 7 4 3 3 6 4 3 45
Items Kavaratti Agathi Amini Kadmath Kiltan Chetlat Androth Kalpeni Minicoy Total
GOVERNMENT
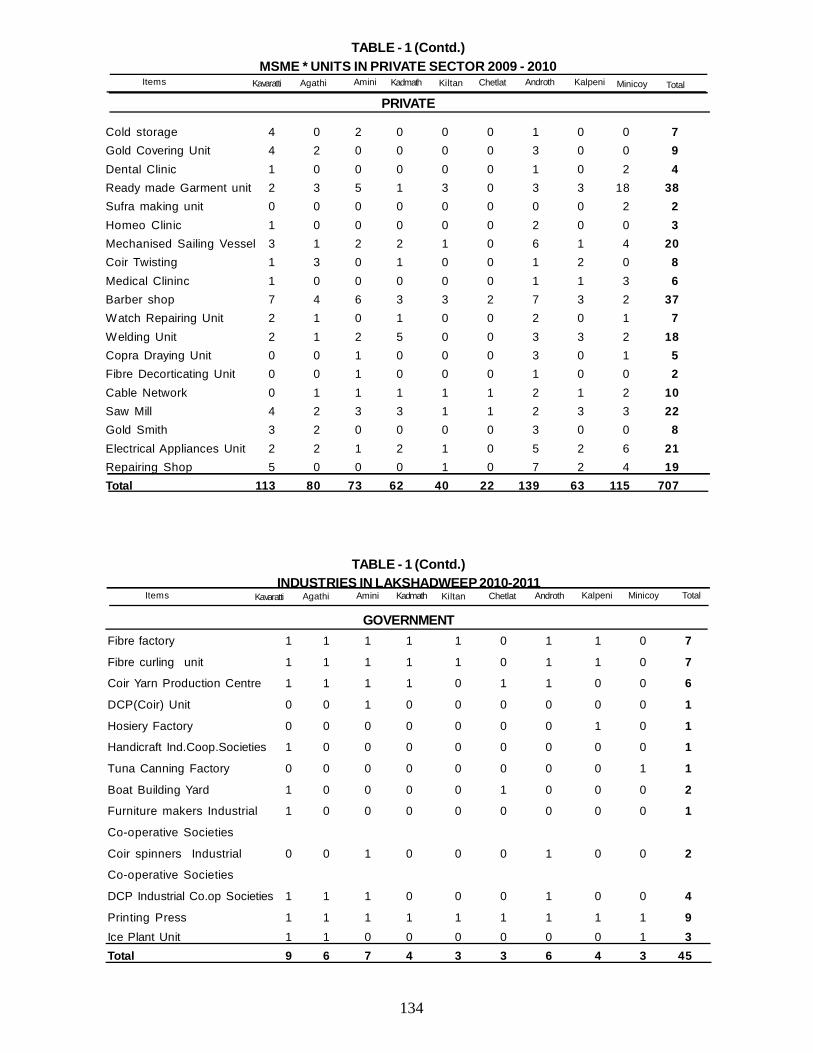
134
Cold storage 4 0 2 0 0 0 1 0 0 7Gold Covering Unit 4 2 0 0 0 0 3 0 0 9Dental Clinic 1 0 0 0 0 0 1 0 2 4Ready made Garment unit 2 3 5 1 3 0 3 3 18 38Sufra making unit 0 0 0 0 0 0 0 0 2 2Homeo Clinic 1 0 0 0 0 0 2 0 0 3Mechanised Sailing Vessel 3 1 2 2 1 0 6 1 4 20Coir Twisting 1 3 0 1 0 0 1 2 0 8Medical Clininc 1 0 0 0 0 0 1 1 3 6Barber shop 7 4 6 3 3 2 7 3 2 37Watch Repairing Unit 2 1 0 1 0 0 2 0 1 7Welding Unit 2 1 2 5 0 0 3 3 2 18Copra Draying Unit 0 0 1 0 0 0 3 0 1 5Fibre Decorticating Unit 0 0 1 0 0 0 1 0 0 2Cable Network 0 1 1 1 1 1 2 1 2 10Saw Mill 4 2 3 3 1 1 2 3 3 22Gold Smith 3 2 0 0 0 0 3 0 0 8Electrical Appliances Unit 2 2 1 2 1 0 5 2 6 21Repairing Shop 5 0 0 0 1 0 7 2 4 19Total 113 80 73 62 40 22 139 63 115 707
TABLE - 1 (Contd.)MSME * UNITS IN PRIVATE SECTOR 2009 - 2010
PRIVATEItems Kavaratti Agathi Amini Kadmath Kiltan Chetlat Androth Kalpeni Minicoy Total
TABLE - 1 (Contd.)INDUSTRIES IN LAKSHADWEEP 2010-2011
GOVERNMENTFibre factory 1 1 1 1 1 0 1 1 0 7
Fibre curling unit 1 1 1 1 1 0 1 1 0 7
Coir Yarn Production Centre 1 1 1 1 0 1 1 0 0 6
DCP(Coir) Unit 0 0 1 0 0 0 0 0 0 1
Hosiery Factory 0 0 0 0 0 0 0 1 0 1
Handicraft Ind.Coop.Societies 1 0 0 0 0 0 0 0 0 1
Tuna Canning Factory 0 0 0 0 0 0 0 0 1 1
Boat Building Yard 1 0 0 0 0 1 0 0 0 2
Furniture makers Industrial 1 0 0 0 0 0 0 0 0 1
Co-operative Societies
Coir spinners Industrial 0 0 1 0 0 0 1 0 0 2
Co-operative Societies
DCP Industrial Co.op Societies 1 1 1 0 0 0 1 0 0 4
Printing Press 1 1 1 1 1 1 1 1 1 9Ice Plant Unit 1 1 0 0 0 0 0 0 1 3Total 9 6 7 4 3 3 6 4 3 45
Items Kavaratti Agathi Amini Kadmath Kiltan Chetlat Androth Kalpeni Minicoy Total
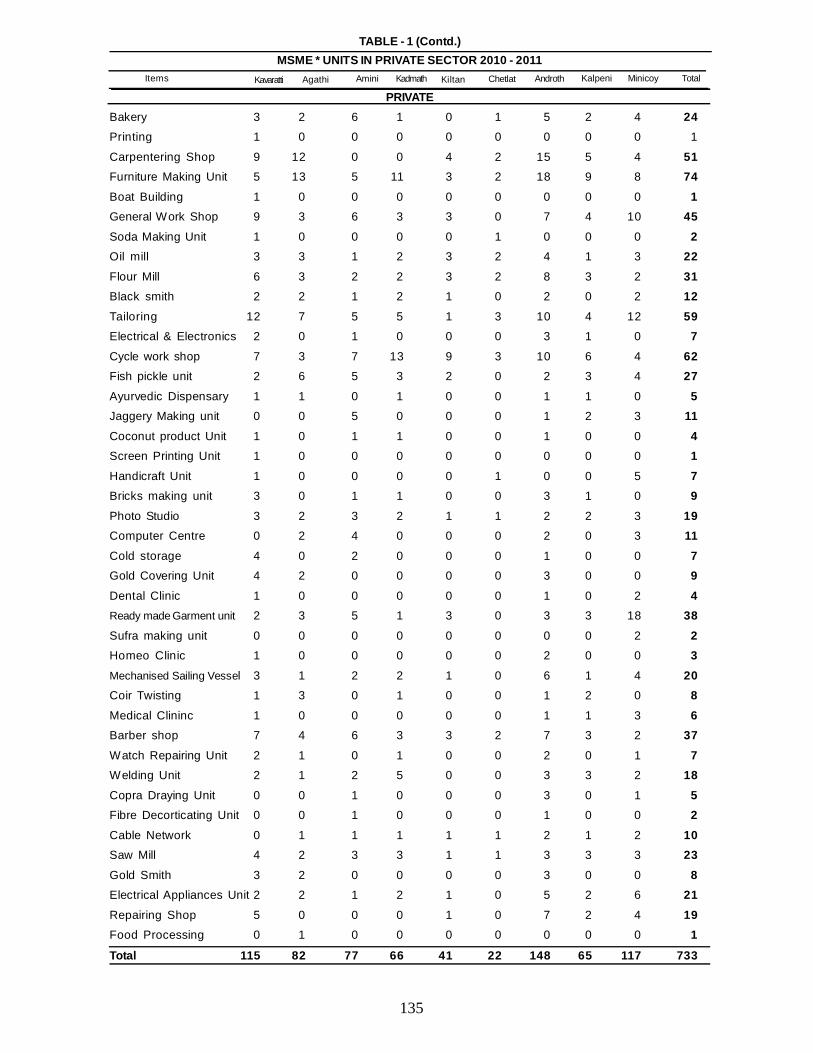
135
TABLE - 1 (Contd.)MSME * UNITS IN PRIVATE SECTOR 2010 - 2011
PRIVATEBakery 3 2 6 1 0 1 5 2 4 24Printing 1 0 0 0 0 0 0 0 0 1
Carpentering Shop 9 12 0 0 4 2 15 5 4 51Furniture Making Unit 5 13 5 11 3 2 18 9 8 74Boat Building 1 0 0 0 0 0 0 0 0 1General Work Shop 9 3 6 3 3 0 7 4 10 45Soda Making Unit 1 0 0 0 0 1 0 0 0 2Oil mill 3 3 1 2 3 2 4 1 3 22Flour Mill 6 3 2 2 3 2 8 3 2 31Black smith 2 2 1 2 1 0 2 0 2 12Tailoring 12 7 5 5 1 3 10 4 12 59Electrical & Electronics 2 0 1 0 0 0 3 1 0 7Cycle work shop 7 3 7 13 9 3 10 6 4 62Fish pickle unit 2 6 5 3 2 0 2 3 4 27Ayurvedic Dispensary 1 1 0 1 0 0 1 1 0 5Jaggery Making unit 0 0 5 0 0 0 1 2 3 11Coconut product Unit 1 0 1 1 0 0 1 0 0 4Screen Printing Unit 1 0 0 0 0 0 0 0 0 1Handicraft Unit 1 0 0 0 0 1 0 0 5 7Bricks making unit 3 0 1 1 0 0 3 1 0 9Photo Studio 3 2 3 2 1 1 2 2 3 19Computer Centre 0 2 4 0 0 0 2 0 3 11Cold storage 4 0 2 0 0 0 1 0 0 7Gold Covering Unit 4 2 0 0 0 0 3 0 0 9Dental Clinic 1 0 0 0 0 0 1 0 2 4Ready made Garment unit 2 3 5 1 3 0 3 3 18 38Sufra making unit 0 0 0 0 0 0 0 0 2 2Homeo Clinic 1 0 0 0 0 0 2 0 0 3Mechanised Sailing Vessel 3 1 2 2 1 0 6 1 4 20Coir Twisting 1 3 0 1 0 0 1 2 0 8Medical Clininc 1 0 0 0 0 0 1 1 3 6Barber shop 7 4 6 3 3 2 7 3 2 37Watch Repairing Unit 2 1 0 1 0 0 2 0 1 7Welding Unit 2 1 2 5 0 0 3 3 2 18Copra Draying Unit 0 0 1 0 0 0 3 0 1 5Fibre Decorticating Unit 0 0 1 0 0 0 1 0 0 2Cable Network 0 1 1 1 1 1 2 1 2 10Saw Mill 4 2 3 3 1 1 3 3 3 23Gold Smith 3 2 0 0 0 0 3 0 0 8Electrical Appliances Unit 2 2 1 2 1 0 5 2 6 21Repairing Shop 5 0 0 0 1 0 7 2 4 19Food Processing 0 1 0 0 0 0 0 0 0 1
Total 115 82 77 66 41 22 148 65 117 733
Items Kavaratti Agathi Amini Kadmath Kiltan Chetlat Androth Kalpeni Minicoy Total
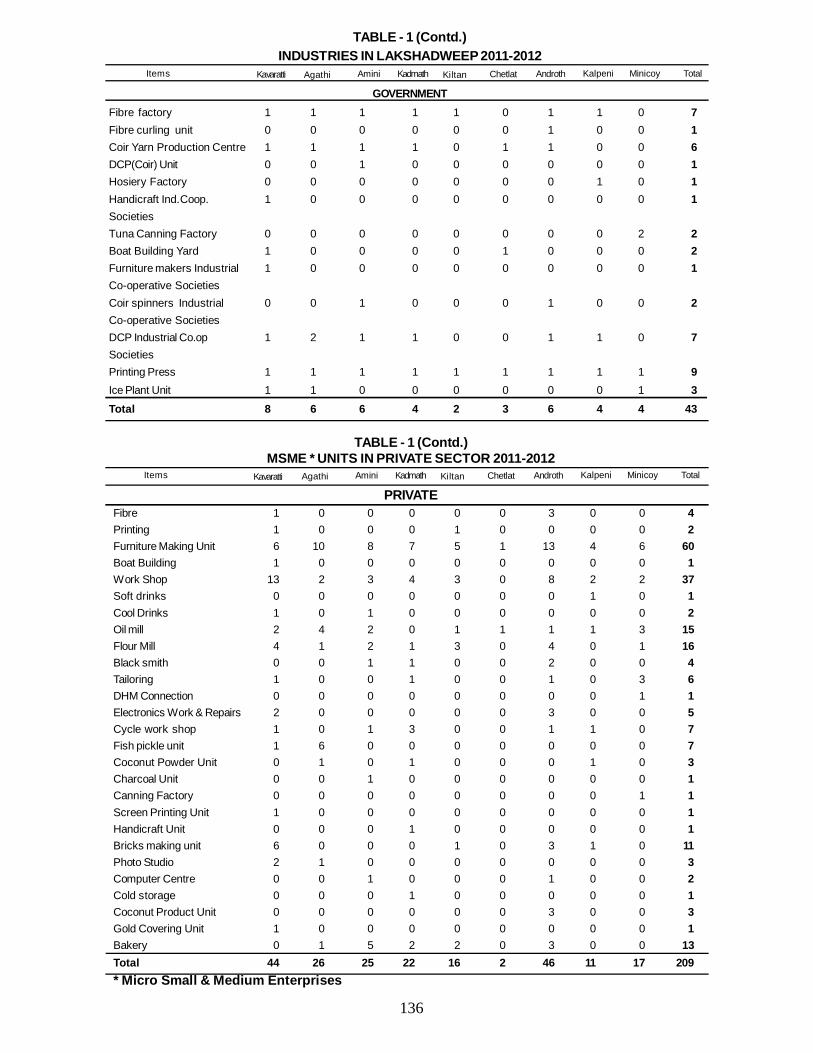
136
TABLE - 1 (Contd.)INDUSTRIES IN LAKSHADWEEP 2011-2012
GOVERNMENTFibre factory 1 1 1 1 1 0 1 1 0 7Fibre curling unit 0 0 0 0 0 0 1 0 0 1Coir Yarn Production Centre 1 1 1 1 0 1 1 0 0 6DCP(Coir) Unit 0 0 1 0 0 0 0 0 0 1Hosiery Factory 0 0 0 0 0 0 0 1 0 1Handicraft Ind.Coop. 1 0 0 0 0 0 0 0 0 1SocietiesTuna Canning Factory 0 0 0 0 0 0 0 0 2 2Boat Building Yard 1 0 0 0 0 1 0 0 0 2Furniture makers Industrial 1 0 0 0 0 0 0 0 0 1Co-operative SocietiesCoir spinners Industrial 0 0 1 0 0 0 1 0 0 2Co-operative SocietiesDCP Industrial Co.op 1 2 1 1 0 0 1 1 0 7SocietiesPrinting Press 1 1 1 1 1 1 1 1 1 9Ice Plant Unit 1 1 0 0 0 0 0 0 1 3Total 8 6 6 4 2 3 6 4 4 43
Items Kavaratti Agathi Amini Kadmath Kiltan Chetlat Androth Kalpeni Minicoy Total
TABLE - 1 (Contd.)MSME * UNITS IN PRIVATE SECTOR 2011-2012
PRIVATEFibre 1 0 0 0 0 0 3 0 0 4Printing 1 0 0 0 1 0 0 0 0 2Furniture Making Unit 6 10 8 7 5 1 13 4 6 60Boat Building 1 0 0 0 0 0 0 0 0 1Work Shop 13 2 3 4 3 0 8 2 2 37Soft drinks 0 0 0 0 0 0 0 1 0 1Cool Drinks 1 0 1 0 0 0 0 0 0 2Oil mill 2 4 2 0 1 1 1 1 3 15Flour Mill 4 1 2 1 3 0 4 0 1 16Black smith 0 0 1 1 0 0 2 0 0 4Tailoring 1 0 0 1 0 0 1 0 3 6DHM Connection 0 0 0 0 0 0 0 0 1 1Electronics Work & Repairs 2 0 0 0 0 0 3 0 0 5Cycle work shop 1 0 1 3 0 0 1 1 0 7Fish pickle unit 1 6 0 0 0 0 0 0 0 7Coconut Powder Unit 0 1 0 1 0 0 0 1 0 3Charcoal Unit 0 0 1 0 0 0 0 0 0 1Canning Factory 0 0 0 0 0 0 0 0 1 1Screen Printing Unit 1 0 0 0 0 0 0 0 0 1Handicraft Unit 0 0 0 1 0 0 0 0 0 1Bricks making unit 6 0 0 0 1 0 3 1 0 11Photo Studio 2 1 0 0 0 0 0 0 0 3Computer Centre 0 0 1 0 0 0 1 0 0 2Cold storage 0 0 0 1 0 0 0 0 0 1Coconut Product Unit 0 0 0 0 0 0 3 0 0 3Gold Covering Unit 1 0 0 0 0 0 0 0 0 1Bakery 0 1 5 2 2 0 3 0 0 13Total 44 26 25 22 16 2 46 11 17 209* Micro Small & Medium Enterprises
Items Kavaratti Agathi Amini Kadmath Kiltan Chetlat Androth Kalpeni Minicoy Total
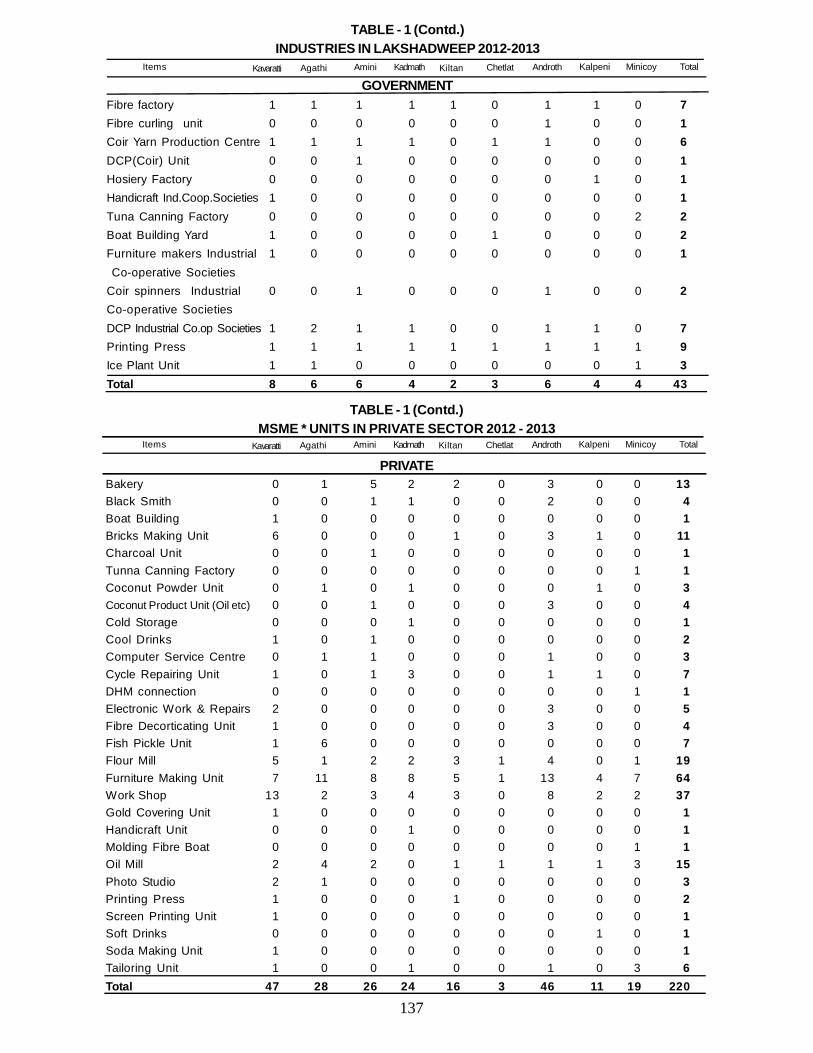
137
TABLE - 1 (Contd.)INDUSTRIES IN LAKSHADWEEP 2012-2013
GOVERNMENTFibre factory 1 1 1 1 1 0 1 1 0 7Fibre curling unit 0 0 0 0 0 0 1 0 0 1Coir Yarn Production Centre 1 1 1 1 0 1 1 0 0 6DCP(Coir) Unit 0 0 1 0 0 0 0 0 0 1Hosiery Factory 0 0 0 0 0 0 0 1 0 1Handicraft Ind.Coop.Societies 1 0 0 0 0 0 0 0 0 1Tuna Canning Factory 0 0 0 0 0 0 0 0 2 2Boat Building Yard 1 0 0 0 0 1 0 0 0 2Furniture makers Industrial 1 0 0 0 0 0 0 0 0 1 Co-operative SocietiesCoir spinners Industrial 0 0 1 0 0 0 1 0 0 2Co-operative SocietiesDCP Industrial Co.op Societies 1 2 1 1 0 0 1 1 0 7Printing Press 1 1 1 1 1 1 1 1 1 9Ice Plant Unit 1 1 0 0 0 0 0 0 1 3Total 8 6 6 4 2 3 6 4 4 43
Items Kavaratti Agathi Amini Kadmath Kiltan Chetlat Androth Kalpeni Minicoy Total
TABLE - 1 (Contd.)MSME * UNITS IN PRIVATE SECTOR 2012 - 2013
PRIVATEBakery 0 1 5 2 2 0 3 0 0 13Black Smith 0 0 1 1 0 0 2 0 0 4Boat Building 1 0 0 0 0 0 0 0 0 1Bricks Making Unit 6 0 0 0 1 0 3 1 0 11Charcoal Unit 0 0 1 0 0 0 0 0 0 1Tunna Canning Factory 0 0 0 0 0 0 0 0 1 1Coconut Powder Unit 0 1 0 1 0 0 0 1 0 3Coconut Product Unit (Oil etc) 0 0 1 0 0 0 3 0 0 4Cold Storage 0 0 0 1 0 0 0 0 0 1Cool Drinks 1 0 1 0 0 0 0 0 0 2Computer Service Centre 0 1 1 0 0 0 1 0 0 3Cycle Repairing Unit 1 0 1 3 0 0 1 1 0 7DHM connection 0 0 0 0 0 0 0 0 1 1Electronic Work & Repairs 2 0 0 0 0 0 3 0 0 5Fibre Decorticating Unit 1 0 0 0 0 0 3 0 0 4Fish Pickle Unit 1 6 0 0 0 0 0 0 0 7Flour Mill 5 1 2 2 3 1 4 0 1 19Furniture Making Unit 7 11 8 8 5 1 13 4 7 64Work Shop 13 2 3 4 3 0 8 2 2 37Gold Covering Unit 1 0 0 0 0 0 0 0 0 1Handicraft Unit 0 0 0 1 0 0 0 0 0 1Molding Fibre Boat 0 0 0 0 0 0 0 0 1 1Oil Mill 2 4 2 0 1 1 1 1 3 15Photo Studio 2 1 0 0 0 0 0 0 0 3Printing Press 1 0 0 0 1 0 0 0 0 2Screen Printing Unit 1 0 0 0 0 0 0 0 0 1Soft Drinks 0 0 0 0 0 0 0 1 0 1Soda Making Unit 1 0 0 0 0 0 0 0 0 1Tailoring Unit 1 0 0 1 0 0 1 0 3 6Total 47 28 26 24 16 3 46 11 19 220
Items Kavaratti Agathi Amini Kadmath Kiltan Chetlat Androth Kalpeni Minicoy Total
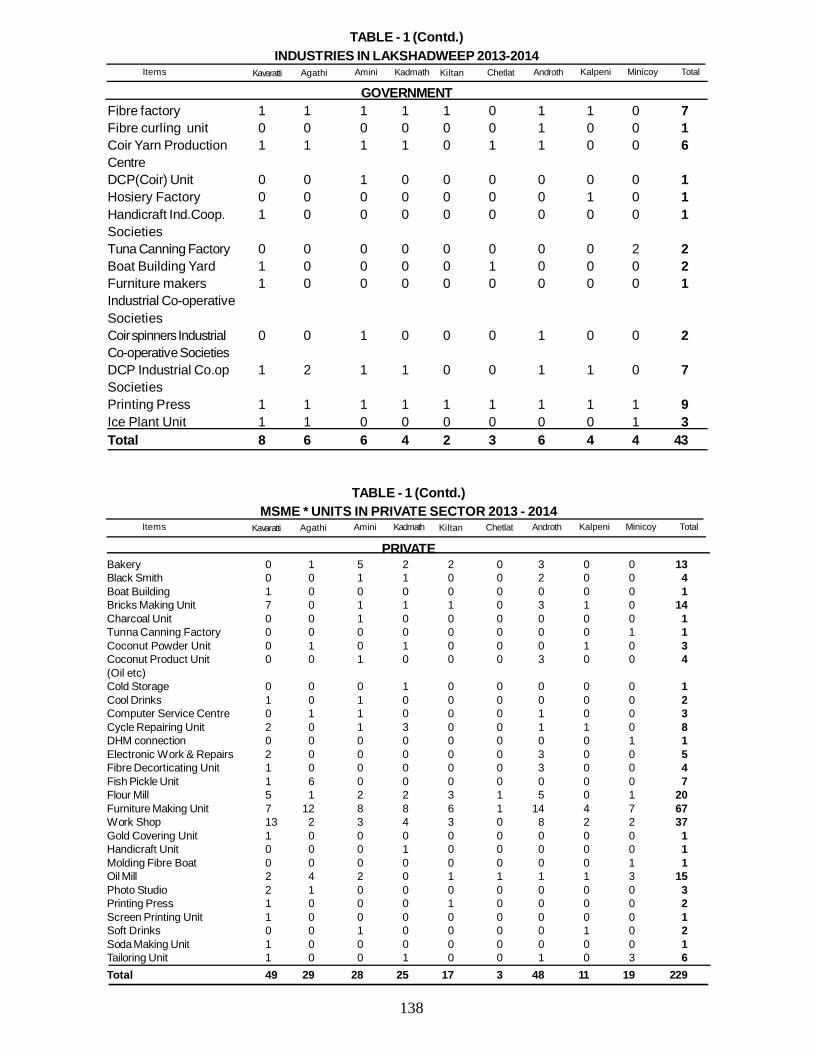
138
TABLE - 1 (Contd.)INDUSTRIES IN LAKSHADWEEP 2013-2014
GOVERNMENTFibre factory 1 1 1 1 1 0 1 1 0 7Fibre curling unit 0 0 0 0 0 0 1 0 0 1Coir Yarn Production 1 1 1 1 0 1 1 0 0 6CentreDCP(Coir) Unit 0 0 1 0 0 0 0 0 0 1Hosiery Factory 0 0 0 0 0 0 0 1 0 1Handicraft Ind.Coop. 1 0 0 0 0 0 0 0 0 1SocietiesTuna Canning Factory 0 0 0 0 0 0 0 0 2 2Boat Building Yard 1 0 0 0 0 1 0 0 0 2Furniture makers 1 0 0 0 0 0 0 0 0 1Industrial Co-operativeSocietiesCoir spinners Industrial 0 0 1 0 0 0 1 0 0 2Co-operative SocietiesDCP Industrial Co.op 1 2 1 1 0 0 1 1 0 7SocietiesPrinting Press 1 1 1 1 1 1 1 1 1 9Ice Plant Unit 1 1 0 0 0 0 0 0 1 3Total 8 6 6 4 2 3 6 4 4 43
Items Kavaratti Agathi Amini Kadmath Kiltan Chetlat Androth Kalpeni Minicoy Total
TABLE - 1 (Contd.)MSME * UNITS IN PRIVATE SECTOR 2013 - 2014
PRIVATEBakery 0 1 5 2 2 0 3 0 0 13Black Smith 0 0 1 1 0 0 2 0 0 4Boat Building 1 0 0 0 0 0 0 0 0 1Bricks Making Unit 7 0 1 1 1 0 3 1 0 14Charcoal Unit 0 0 1 0 0 0 0 0 0 1Tunna Canning Factory 0 0 0 0 0 0 0 0 1 1Coconut Powder Unit 0 1 0 1 0 0 0 1 0 3Coconut Product Unit 0 0 1 0 0 0 3 0 0 4(Oil etc)Cold Storage 0 0 0 1 0 0 0 0 0 1Cool Drinks 1 0 1 0 0 0 0 0 0 2Computer Service Centre 0 1 1 0 0 0 1 0 0 3Cycle Repairing Unit 2 0 1 3 0 0 1 1 0 8DHM connection 0 0 0 0 0 0 0 0 1 1Electronic Work & Repairs 2 0 0 0 0 0 3 0 0 5Fibre Decorticating Unit 1 0 0 0 0 0 3 0 0 4Fish Pickle Unit 1 6 0 0 0 0 0 0 0 7Flour Mill 5 1 2 2 3 1 5 0 1 20Furniture Making Unit 7 12 8 8 6 1 14 4 7 67Work Shop 13 2 3 4 3 0 8 2 2 37Gold Covering Unit 1 0 0 0 0 0 0 0 0 1Handicraft Unit 0 0 0 1 0 0 0 0 0 1Molding Fibre Boat 0 0 0 0 0 0 0 0 1 1Oil Mill 2 4 2 0 1 1 1 1 3 15Photo Studio 2 1 0 0 0 0 0 0 0 3Printing Press 1 0 0 0 1 0 0 0 0 2Screen Printing Unit 1 0 0 0 0 0 0 0 0 1Soft Drinks 0 0 1 0 0 0 0 1 0 2Soda Making Unit 1 0 0 0 0 0 0 0 0 1Tailoring Unit 1 0 0 1 0 0 1 0 3 6Total 49 29 28 25 17 3 48 11 19 229
Items Kavaratti Agathi Amini Kadmath Kiltan Chetlat Androth Kalpeni Minicoy Total
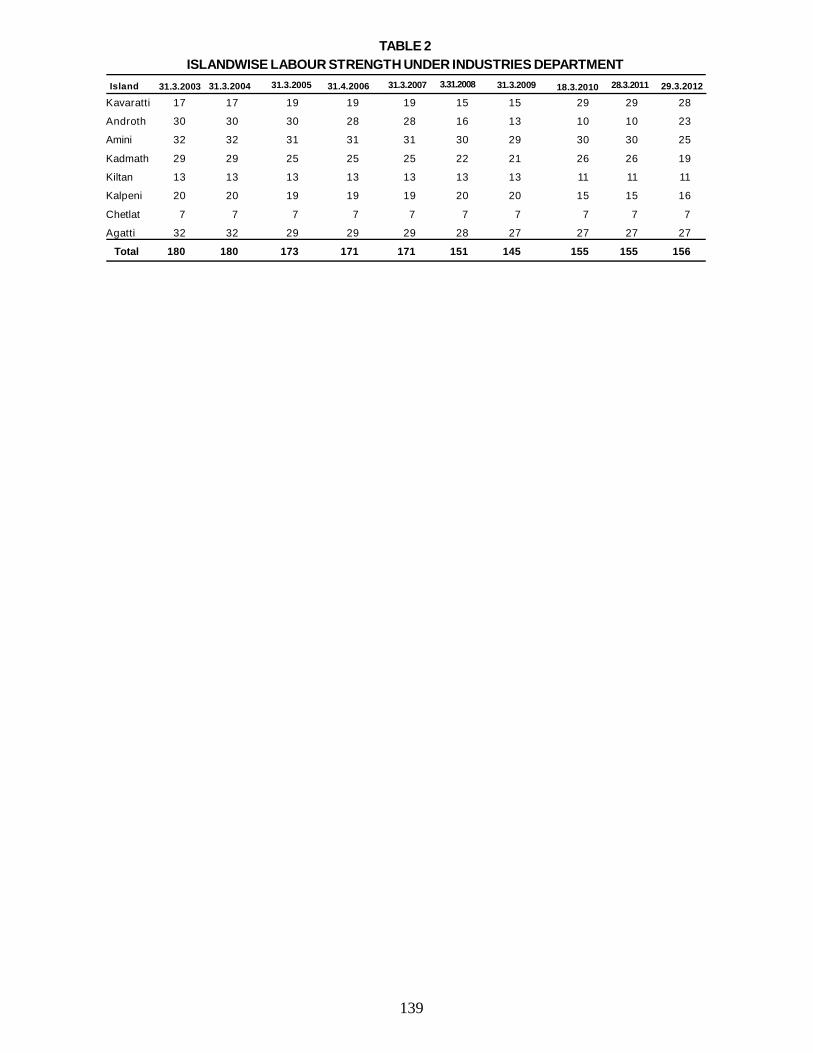
139
TABLE 2ISLANDWISE LABOUR STRENGTH UNDER INDUSTRIES DEPARTMENT
Kavaratti 17 17 19 19 19 15 15 29 29 28
Androth 30 30 30 28 28 16 13 10 10 23
Amini 32 32 31 31 31 30 29 30 30 25
Kadmath 29 29 25 25 25 22 21 26 26 19
Kiltan 13 13 13 13 13 13 13 11 11 11
Kalpeni 20 20 19 19 19 20 20 15 15 16
Chetlat 7 7 7 7 7 7 7 7 7 7
Agatti 32 32 29 29 29 28 27 27 27 27
Total 180 180 173 171 171 151 145 155 155 156
Island 31.3.2003 31.3.2004 31.3.2005 31.4.2006 31.3.2007 3.31.2008 31.3.2009 18.3.2010 28.3.2011 29.3.2012
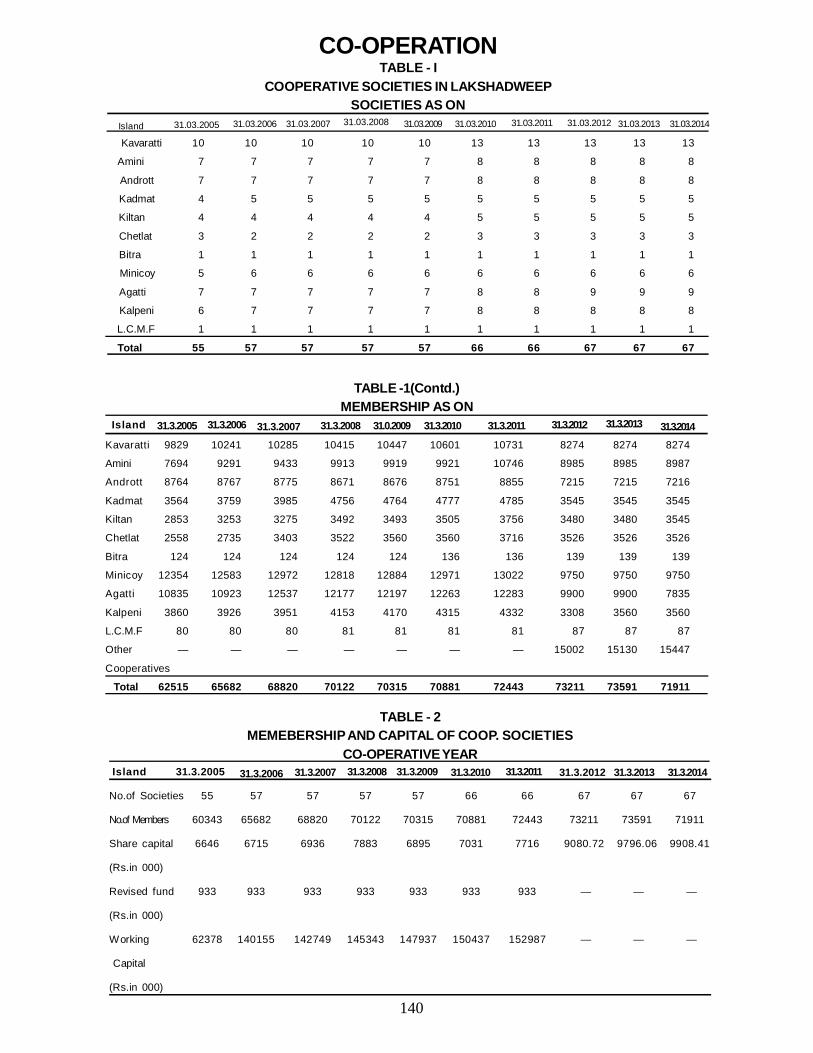
140
CO-OPERATIONTABLE - I
COOPERATIVE SOCIETIES IN LAKSHADWEEPSOCIETIES AS ON
Kavaratti 10 10 10 10 10 13 13 13 13 13
Amini 7 7 7 7 7 8 8 8 8 8
Andrott 7 7 7 7 7 8 8 8 8 8
Kadmat 4 5 5 5 5 5 5 5 5 5
Kiltan 4 4 4 4 4 5 5 5 5 5
Chetlat 3 2 2 2 2 3 3 3 3 3
Bitra 1 1 1 1 1 1 1 1 1 1
Minicoy 5 6 6 6 6 6 6 6 6 6
Agatti 7 7 7 7 7 8 8 9 9 9
Kalpeni 6 7 7 7 7 8 8 8 8 8
L.C.M.F 1 1 1 1 1 1 1 1 1 1
Total 55 57 57 57 57 66 66 67 67 67
Island 31.03.2005 31.03.2006 31.03.2007 31.03.2008 31.03.2009 31.03.2010 31.03.2011 31.03.2012 31.03.2013 31.03.2014
TABLE -1(Contd.)MEMBERSHIP AS ON
Kavaratti 9829 10241 10285 10415 10447 10601 10731 8274 8274 8274
Amini 7694 9291 9433 9913 9919 9921 10746 8985 8985 8987
Andrott 8764 8767 8775 8671 8676 8751 8855 7215 7215 7216
Kadmat 3564 3759 3985 4756 4764 4777 4785 3545 3545 3545
Kiltan 2853 3253 3275 3492 3493 3505 3756 3480 3480 3545
Chetlat 2558 2735 3403 3522 3560 3560 3716 3526 3526 3526
Bitra 124 124 124 124 124 136 136 139 139 139
Minicoy 12354 12583 12972 12818 12884 12971 13022 9750 9750 9750
Agatti 10835 10923 12537 12177 12197 12263 12283 9900 9900 7835
Kalpeni 3860 3926 3951 4153 4170 4315 4332 3308 3560 3560
L.C.M.F 80 80 80 81 81 81 81 87 87 87
Other — — — — — — — 15002 15130 15447
Cooperatives
Total 62515 65682 68820 70122 70315 70881 72443 73211 73591 71911
Island 31.3.2005 31.3.2006 31.3.2007 31.3.2008 31.0.2009 31.3.2010 31.3.2011 31.3.2012 31.3.2013 31.3.2014
TABLE - 2MEMEBERSHIP AND CAPITAL OF COOP. SOCIETIES
CO-OPERATIVE YEAR
No.of Societies 55 57 57 57 57 66 66 67 67 67
No.of Members 60343 65682 68820 70122 70315 70881 72443 73211 73591 71911
Share capital 6646 6715 6936 7883 6895 7031 7716 9080.72 9796.06 9908.41
(Rs.in 000)
Revised fund 933 933 933 933 933 933 933 — — —
(Rs.in 000)
Working 62378 140155 142749 145343 147937 150437 152987 — — —
Capital
(Rs.in 000)
Island 31.3.2005 31.3.2006 31.3.2007 31.3.2008 31.3.2009 31.3.2010 31.3.2011 31.3.2012 31.3.2013 31.3.2014
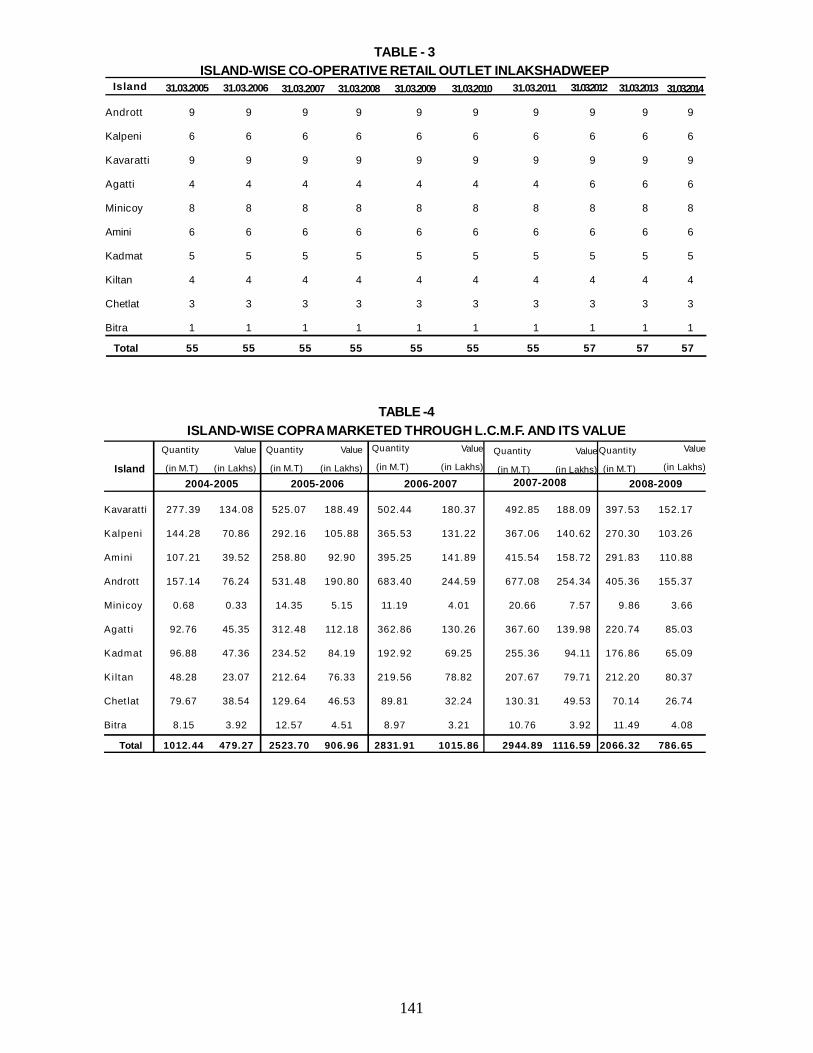
141
TABLE - 3ISLAND-WISE CO-OPERATIVE RETAIL OUTLET INLAKSHADWEEP
Andrott 9 9 9 9 9 9 9 9 9 9
Kalpeni 6 6 6 6 6 6 6 6 6 6
Kavaratti 9 9 9 9 9 9 9 9 9 9
Agatti 4 4 4 4 4 4 4 6 6 6
Minicoy 8 8 8 8 8 8 8 8 8 8
Amini 6 6 6 6 6 6 6 6 6 6
Kadmat 5 5 5 5 5 5 5 5 5 5
Kiltan 4 4 4 4 4 4 4 4 4 4
Chetlat 3 3 3 3 3 3 3 3 3 3
Bitra 1 1 1 1 1 1 1 1 1 1
Total 55 55 55 55 55 55 55 57 57 57
Island 31.03.2005 31.03.2006 31.03.2007 31.03.2008 31.03.2009 31.03.2010 31.03.2011 31.03.2012 31.03.2013 31.03.2014
TABLE -4ISLAND-WISE COPRA MARKETED THROUGH L.C.M.F. AND ITS VALUE
Kavaratti 277.39 134.08 525.07 188.49 502.44 180.37 492.85 188.09 397.53 152.17
Kalpeni 144.28 70.86 292.16 105.88 365.53 131.22 367.06 140.62 270.30 103.26
Amini 107.21 39.52 258.80 92.90 395.25 141.89 415.54 158.72 291.83 110.88
Andrott 157.14 76.24 531.48 190.80 683.40 244.59 677.08 254.34 405.36 155.37
Minicoy 0.68 0.33 14.35 5.15 11.19 4.01 20.66 7.57 9.86 3.66
Agat ti 92.76 45.35 312.48 112.18 362.86 130.26 367.60 139.98 220.74 85.03
Kadmat 96.88 47.36 234.52 84.19 192.92 69.25 255.36 94.11 176.86 65.09
Ki ltan 48.28 23.07 212.64 76.33 219.56 78.82 207.67 79.71 212.20 80.37
Chet lat 79.67 38.54 129.64 46.53 89.81 32.24 130.31 49.53 70.14 26.74
Bitra 8.15 3.92 12.57 4.51 8.97 3.21 10.76 3.92 11.49 4.08
Total 1012.44 479.27 2523.70 906.96 2831.91 1015.86 2944.89 1116.59 2066.32 786.65
Island
Quantity
(in M.T)
Value
(in Lakhs)
Quantity
(in M.T)
Value
(in Lakhs)
Quantity
(in M.T)
Value
(in Lakhs)
Quantity
(in M.T)
Value
(in Lakhs)
Quantity
(in M.T)
Value
(in Lakhs)
2004-2005 2005-2006 2006-2007 2007-2008 2008-2009
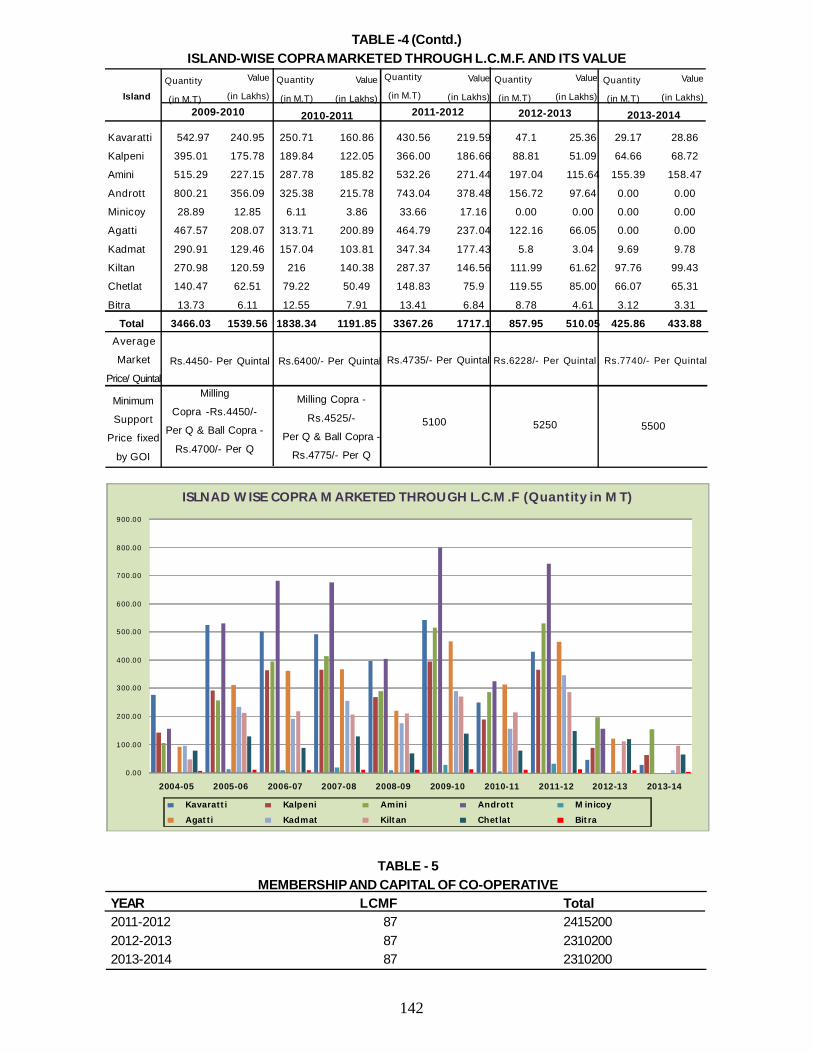
142
0 .0 0
1 0 0 .0 0
2 0 0 .0 0
3 0 0 .0 0
4 0 0 .0 0
5 0 0 .0 0
6 0 0 .0 0
7 0 0 .0 0
8 0 0 .0 0
9 0 0 .0 0
2 00 4 -0 5 2 0 05 -0 6 20 0 6-07 2 00 7-0 8 2 0 08 -0 9 20 0 9-1 0 2 01 0-11 2 0 11 -1 2 2 0 12 -1 3 20 1 3-14
ISLN A D W ISE C O P R A M A R KE T E D T H R O U G H L.C .M .F (Q u a n tity in M T )
K a va ra tt i Ka lp e n i A m in i A n d r o t t M in ico y
A g at ti Ka d m at K ilt an C h et la t B it ra
TABLE - 5MEMBERSHIP AND CAPITAL OF CO-OPERATIVE
YEAR LCMF Total2011-2012 87 24152002012-2013 87 23102002013-2014 87 2310200
Kavaratti 542.97 240.95 250.71 160.86 430.56 219.59 47.1 25.36 29.17 28.86
Kalpeni 395.01 175.78 189.84 122.05 366.00 186.66 88.81 51.09 64.66 68.72
Amini 515.29 227.15 287.78 185.82 532.26 271.44 197.04 115.64 155.39 158.47
Andrott 800.21 356.09 325.38 215.78 743.04 378.48 156.72 97.64 0.00 0.00
Minicoy 28.89 12.85 6.11 3.86 33.66 17.16 0.00 0.00 0.00 0.00
Agatti 467.57 208.07 313.71 200.89 464.79 237.04 122.16 66.05 0.00 0.00
Kadmat 290.91 129.46 157.04 103.81 347.34 177.43 5.8 3.04 9.69 9.78
Kiltan 270.98 120.59 216 140.38 287.37 146.56 111.99 61.62 97.76 99.43
Chetlat 140.47 62.51 79.22 50.49 148.83 75.9 119.55 85.00 66.07 65.31
Bitra 13.73 6.11 12.55 7.91 13.41 6.84 8.78 4.61 3.12 3.31
Total 3466.03 1539.56 1838.34 1191.85 3367.26 1717.1 857.95 510.05 425.86 433.88
TABLE -4 (Contd.)ISLAND-WISE COPRA MARKETED THROUGH L.C.M.F. AND ITS VALUE
IslandQuantity
(in M.T)
Value
(in Lakhs)
Quantity
(in M.T)
Value
(in Lakhs)
Quantity
(in M.T)
Value
(in Lakhs)
Quantity
(in M.T)
Value
(in Lakhs)
Quantity
(in M.T)
Value
(in Lakhs)2009-2010 2010-2011 2011-2012 2012-2013 2013-2014
Average
Market
Price/ Quintal
Rs.4450- Per Quintal Rs.6400/- Per Quintal Rs.4735/- Per Quintal Rs.6228/- Per Quintal Rs.7740/- Per Quintal
Minimum
Support
Price fixed
by GOI
Milling
Copra -Rs.4450/-
Per Q & Ball Copra -
Rs.4700/- Per Q
Milling Copra -
Rs.4525/-
Per Q & Ball Copra -
Rs.4775/- Per Q
5100 5250 5500
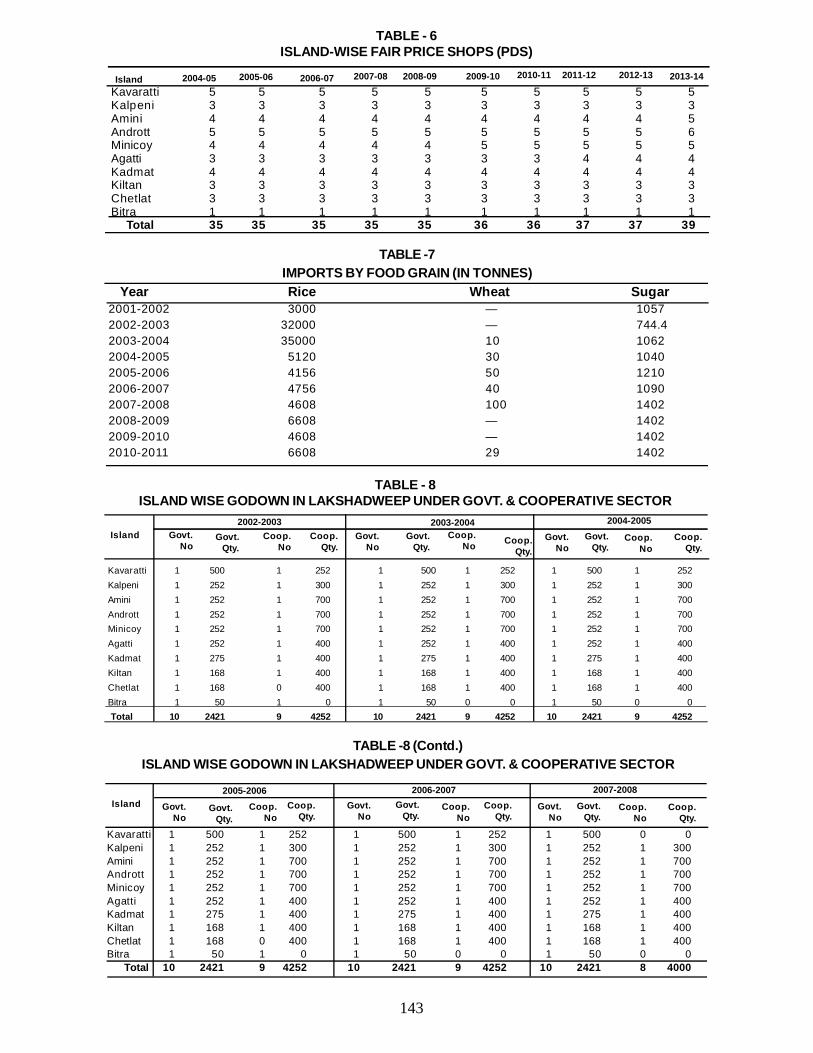
143
TABLE -7IMPORTS BY FOOD GRAIN (IN TONNES)
Year Rice Wheat Sugar2001-2002 3000 — 10572002-2003 32000 — 744.42003-2004 35000 10 10622004-2005 5120 30 10402005-2006 4156 50 12102006-2007 4756 40 10902007-2008 4608 100 14022008-2009 6608 — 14022009-2010 4608 — 14022010-2011 6608 29 1402
TABLE - 6ISLAND-WISE FAIR PRICE SHOPS (PDS)
Kavaratti 5 5 5 5 5 5 5 5 5 5Kalpeni 3 3 3 3 3 3 3 3 3 3Amini 4 4 4 4 4 4 4 4 4 5Andrott 5 5 5 5 5 5 5 5 5 6Minicoy 4 4 4 4 4 5 5 5 5 5Agatti 3 3 3 3 3 3 3 4 4 4Kadmat 4 4 4 4 4 4 4 4 4 4Kiltan 3 3 3 3 3 3 3 3 3 3Chetlat 3 3 3 3 3 3 3 3 3 3Bitra 1 1 1 1 1 1 1 1 1 1 Total 35 35 35 35 35 36 36 37 37 39
Island 2004-05 2005-06 2006-07 2007-08 2008-09 2009-10 2010-11 2011-12 2012-13 2013-14
Kavaratti 1 500 1 252 1 500 1 252 1 500 1 252Kalpeni 1 252 1 300 1 252 1 300 1 252 1 300Amini 1 252 1 700 1 252 1 700 1 252 1 700Andrott 1 252 1 700 1 252 1 700 1 252 1 700Minicoy 1 252 1 700 1 252 1 700 1 252 1 700Agatti 1 252 1 400 1 252 1 400 1 252 1 400Kadmat 1 275 1 400 1 275 1 400 1 275 1 400Kiltan 1 168 1 400 1 168 1 400 1 168 1 400Chetlat 1 168 0 400 1 168 1 400 1 168 1 400Bitra 1 50 1 0 1 50 0 0 1 50 0 0 Total 10 2421 9 4252 10 2421 9 4252 10 2421 9 4252
TABLE - 8ISLAND WISE GODOWN IN LAKSHADWEEP UNDER GOVT. & COOPERATIVE SECTOR
Island2002-2003 2003-2004 2004-2005
Govt.No
Govt.Qty.
Coop.No
Coop.Qty.
Govt.No
Govt.Qty.
Coop.No
Govt.No
Govt.Qty.
Coop.No
Coop.Qty.
Coop.Qty.
Kavaratti 1 500 1 252 1 500 1 252 1 500 0 0Kalpeni 1 252 1 300 1 252 1 300 1 252 1 300Amini 1 252 1 700 1 252 1 700 1 252 1 700Andrott 1 252 1 700 1 252 1 700 1 252 1 700Minicoy 1 252 1 700 1 252 1 700 1 252 1 700Agatti 1 252 1 400 1 252 1 400 1 252 1 400Kadmat 1 275 1 400 1 275 1 400 1 275 1 400Kiltan 1 168 1 400 1 168 1 400 1 168 1 400Chetlat 1 168 0 400 1 168 1 400 1 168 1 400Bitra 1 50 1 0 1 50 0 0 1 50 0 0 Total 10 2421 9 4252 10 2421 9 4252 10 2421 8 4000
TABLE -8 (Contd.)ISLAND WISE GODOWN IN LAKSHADWEEP UNDER GOVT. & COOPERATIVE SECTOR
Island2005-2006 2006-2007 2007-2008
Govt.No
Govt.Qty.
Coop.No
Coop.Qty.
Govt.No
Govt.Qty.
Coop.No
Coop.Qty.
Govt.No
Govt.Qty.
Coop.No
Coop.Qty.
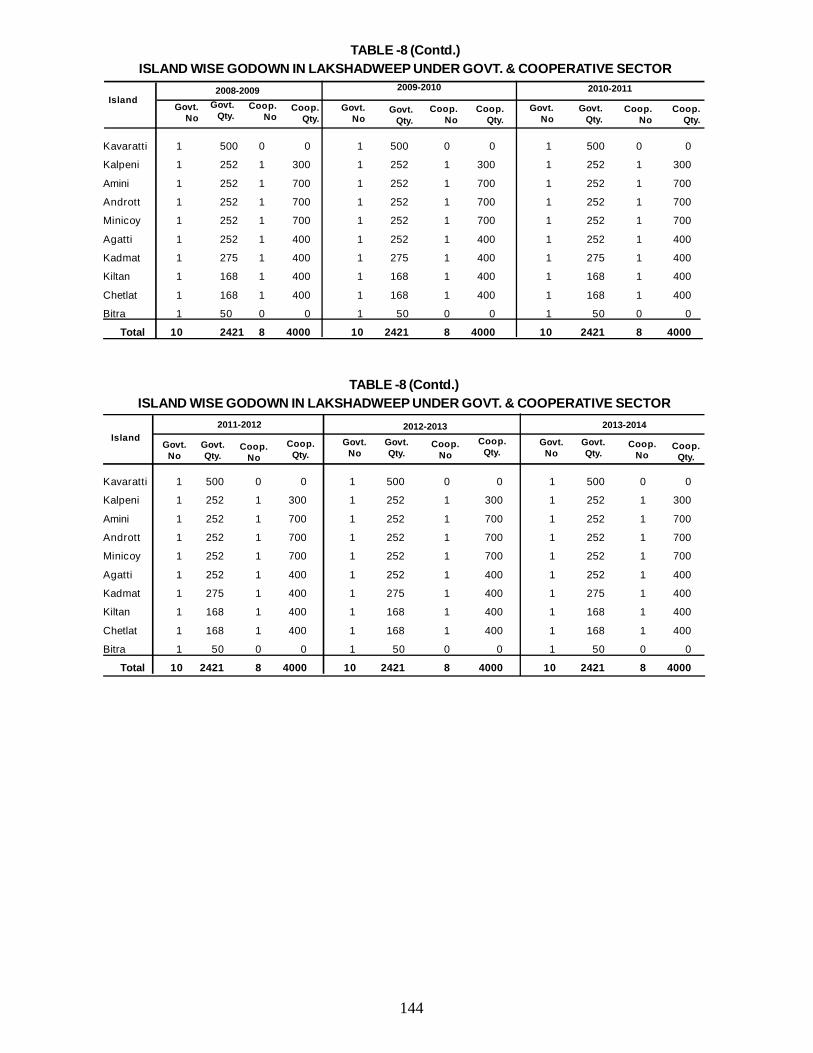
144
Kavaratti 1 500 0 0 1 500 0 0 1 500 0 0
Kalpeni 1 252 1 300 1 252 1 300 1 252 1 300
Amini 1 252 1 700 1 252 1 700 1 252 1 700
Andrott 1 252 1 700 1 252 1 700 1 252 1 700
Minicoy 1 252 1 700 1 252 1 700 1 252 1 700
Agatti 1 252 1 400 1 252 1 400 1 252 1 400
Kadmat 1 275 1 400 1 275 1 400 1 275 1 400
Kiltan 1 168 1 400 1 168 1 400 1 168 1 400
Chetlat 1 168 1 400 1 168 1 400 1 168 1 400
Bitra 1 50 0 0 1 50 0 0 1 50 0 0
Total 10 2421 8 4000 10 2421 8 4000 10 2421 8 4000
TABLE -8 (Contd.)ISLAND WISE GODOWN IN LAKSHADWEEP UNDER GOVT. & COOPERATIVE SECTOR
Island2008-2009 2009-2010 2010-2011
Govt.No
Govt.Qty.
Coop.No
Coop.Qty.
Govt.No
Govt.Qty.
Coop.No
Coop.Qty.
Govt.No
Govt.Qty.
Coop.No
Coop.Qty.
Kavaratti 1 500 0 0 1 500 0 0 1 500 0 0
Kalpeni 1 252 1 300 1 252 1 300 1 252 1 300
Amini 1 252 1 700 1 252 1 700 1 252 1 700
Andrott 1 252 1 700 1 252 1 700 1 252 1 700
Minicoy 1 252 1 700 1 252 1 700 1 252 1 700
Agatti 1 252 1 400 1 252 1 400 1 252 1 400
Kadmat 1 275 1 400 1 275 1 400 1 275 1 400
Kiltan 1 168 1 400 1 168 1 400 1 168 1 400
Chetlat 1 168 1 400 1 168 1 400 1 168 1 400
Bitra 1 50 0 0 1 50 0 0 1 50 0 0
Total 10 2421 8 4000 10 2421 8 4000 10 2421 8 4000
TABLE -8 (Contd.)ISLAND WISE GODOWN IN LAKSHADWEEP UNDER GOVT. & COOPERATIVE SECTOR
Island2011-2012 2012-2013 2013-2014
Govt.No
Govt.Qty.
Coop.No
Coop.Qty.
Govt.No
Govt.Qty.
Coop.No
Coop.Qty.
Govt.No
Govt.Qty.
Coop.No
Coop.Qty.
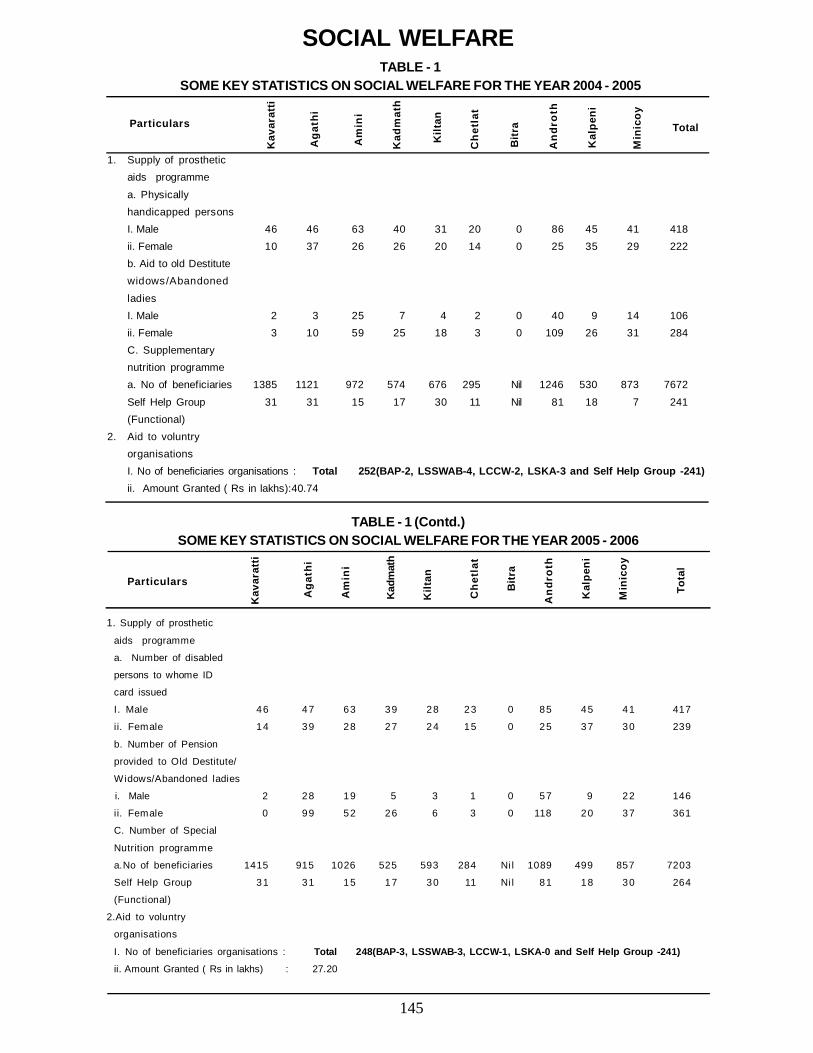
145
1. Supply of prosthetic
aids programme
a. Number of disabled
persons to whome ID
card issued
I. Male 46 47 63 39 28 23 0 85 45 41 417
ii. Female 14 39 28 27 24 15 0 25 37 30 239
b. Number of Pension
provided to Old Destitute/
Widows/Abandoned ladies
i. Male 2 28 19 5 3 1 0 57 9 22 146
ii. Female 0 99 52 26 6 3 0 118 20 37 361
C. Number of Special
Nutrition programme
a.No of beneficiaries 1415 915 1026 525 593 284 Ni l 1089 499 857 7203
Self Help Group 31 31 15 17 30 11 Ni l 81 18 30 264
(Functional)
2.Aid to voluntry
organisations
I. No of beneficiaries organisations : Total 248(BAP-3, LSSWAB-3, LCCW-1, LSKA-0 and Self Help Group -241)ii. Amount Granted ( Rs in lakhs) : 27.20
TABLE - 1 (Contd.)SOME KEY STATISTICS ON SOCIAL WELFARE FOR THE YEAR 2005 - 2006
Particulars
Kav
arat
ti
Aga
thi
Am
ini
Kad
mat
h
Kilt
an
Che
tlat
Bitr
a
And
roth
Kal
peni
Min
icoy
Tota
l
TABLE - 1SOME KEY STATISTICS ON SOCIAL WELFARE FOR THE YEAR 2004 - 2005
SOCIAL WELFARE
1. Supply of prostheticaids programme
a. Physicallyhandicapped personsI. Male 46 46 63 40 31 20 0 86 45 41 418ii. Female 10 37 26 26 20 14 0 25 35 29 222b. Aid to old Destitutewidows/Abandoned
ladiesI. Male 2 3 25 7 4 2 0 40 9 14 106ii. Female 3 10 59 25 18 3 0 109 26 31 284C. Supplementarynutrition programmea. No of beneficiaries 1385 1121 972 574 676 295 Nil 1246 530 873 7672
Self Help Group 31 31 15 17 30 11 Nil 81 18 7 241(Functional)
2. Aid to voluntryorganisationsI. No of beneficiaries organisations : Total 252(BAP-2, LSSWAB-4, LCCW-2, LSKA-3 and Self Help Group -241)ii. Amount Granted ( Rs in lakhs):40.74
Particulars
Kav
arat
ti
Aga
thi
Am
ini
Kad
mat
h
Kilt
an
Che
tlat
Bitr
a
And
roth
Kal
peni
Min
icoy
Total
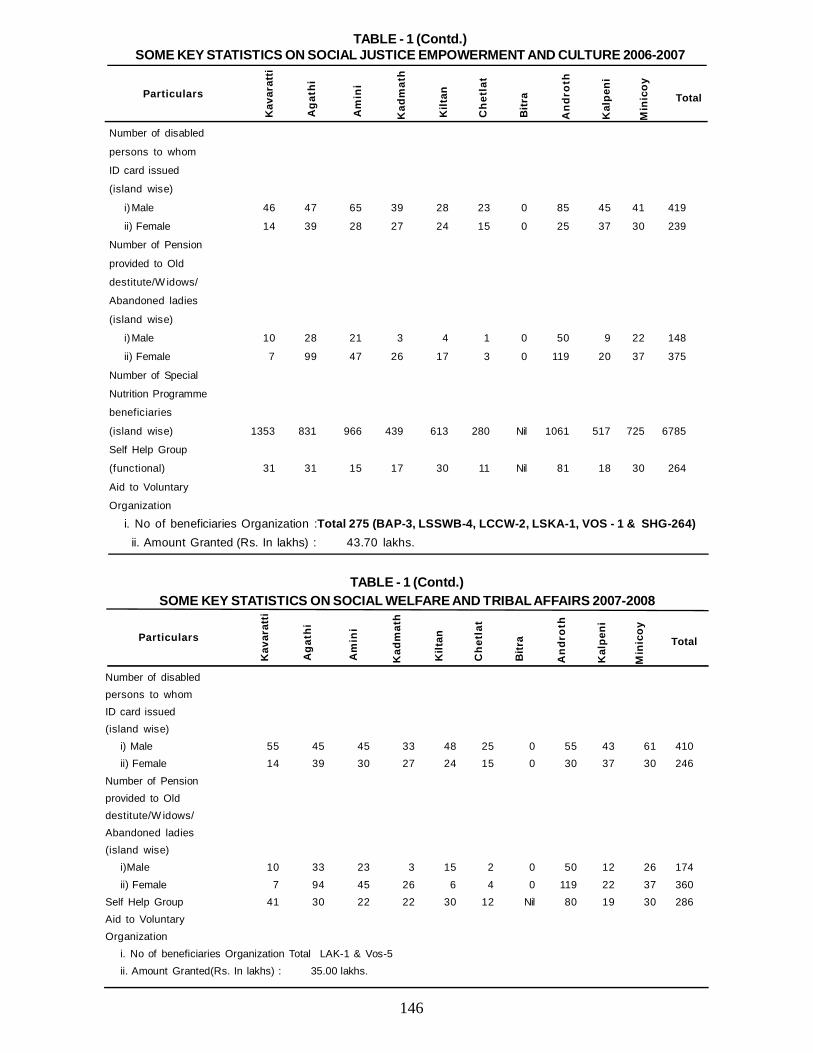
146
Number of disabled
persons to whom
ID card issued
(island wise)
i)Male 46 47 65 39 28 23 0 85 45 41 419
ii) Female 14 39 28 27 24 15 0 25 37 30 239
Number of Pension
provided to Old
destitute/W idows/
Abandoned ladies
(island wise)
i)Male 10 28 21 3 4 1 0 50 9 22 148
ii) Female 7 99 47 26 17 3 0 119 20 37 375
Number of Special
Nutrition Programme
beneficiaries
(island wise) 1353 831 966 439 613 280 Nil 1061 517 725 6785
Self Help Group
(functional) 31 31 15 17 30 11 Nil 81 18 30 264
Aid to Voluntary
Organization
i. No of beneficiaries Organization :Total 275 (BAP-3, LSSWB-4, LCCW-2, LSKA-1, VOS - 1 & SHG-264)ii. Amount Granted (Rs. In lakhs) : 43.70 lakhs.
TABLE - 1 (Contd.)SOME KEY STATISTICS ON SOCIAL JUSTICE EMPOWERMENT AND CULTURE 2006-2007
Kav
arat
ti
Particulars
Aga
thi
Am
ini
Kad
mat
h
Kilt
an
Che
tlat
Bitr
a
And
roth
Kal
peni
Min
icoy
Total
Number of disabledpersons to whomID card issued(island wise)
i) Male 55 45 45 33 48 25 0 55 43 61 410ii) Female 14 39 30 27 24 15 0 30 37 30 246
Number of Pensionprovided to Olddestitute/W idows/Abandoned ladies(island wise)
i)Male 10 33 23 3 15 2 0 50 12 26 174
ii) Female 7 94 45 26 6 4 0 119 22 37 360Self Help Group 41 30 22 22 30 12 Nil 80 19 30 286Aid to VoluntaryOrganization
i. No of beneficiaries Organization Total LAK-1 & Vos-5ii. Amount Granted(Rs. In lakhs) : 35.00 lakhs.
TABLE - 1 (Contd.)SOME KEY STATISTICS ON SOCIAL WELFARE AND TRIBAL AFFAIRS 2007-2008
Kav
arat
ti
Particulars
Aga
thi
Am
ini
Kad
mat
h
Kilt
an
Che
tlat
Bitr
a
And
roth
Kal
peni
Min
icoy
Total
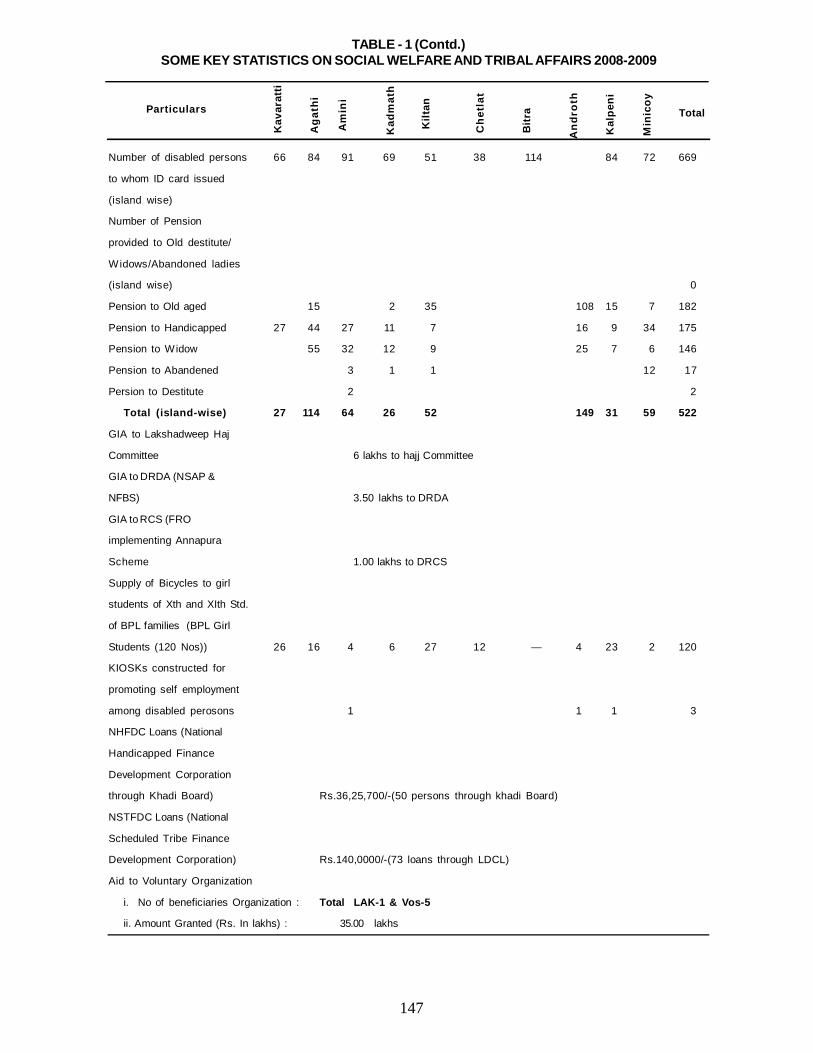
147
Number of disabled persons 66 84 91 69 51 38 114 84 72 669
to whom ID card issued
(island wise)
Number of Pension
provided to Old destitute/
Widows/Abandoned ladies
(island wise) 0
Pension to Old aged 15 2 35 108 15 7 182
Pension to Handicapped 27 44 27 11 7 16 9 34 175
Pension to Widow 55 32 12 9 25 7 6 146
Pension to Abandened 3 1 1 12 17
Persion to Destitute 2 2
Total (island-wise) 27 114 64 26 52 149 31 59 522
GIA to Lakshadweep Haj
Committee 6 lakhs to hajj Committee
GIA to DRDA (NSAP &
NFBS) 3.50 lakhs to DRDA
GIA to RCS (FRO
implementing Annapura
Scheme 1.00 lakhs to DRCS
Supply of Bicycles to girl
students of Xth and XIth Std.
of BPL families (BPL Girl
Students (120 Nos)) 26 16 4 6 27 12 — 4 23 2 120
KIOSKs constructed for
promoting self employment
among disabled perosons 1 1 1 3
NHFDC Loans (National
Handicapped Finance
Development Corporation
through Khadi Board) Rs.36,25,700/-(50 persons through khadi Board)
NSTFDC Loans (National
Scheduled Tribe Finance
Development Corporation) Rs.140,0000/-(73 loans through LDCL)
Aid to Voluntary Organization
i. No of beneficiaries Organization : Total LAK-1 & Vos-5
ii. Amount Granted (Rs. In lakhs) : 35.00 lakhs
TABLE - 1 (Contd.)SOME KEY STATISTICS ON SOCIAL WELFARE AND TRIBAL AFFAIRS 2008-2009
Kav
arat
ti
Particulars
Aga
thi
Am
ini
Kad
mat
h
Kilt
an
Che
tlat
Bitr
a
And
roth
Kal
peni
Min
icoy
Total
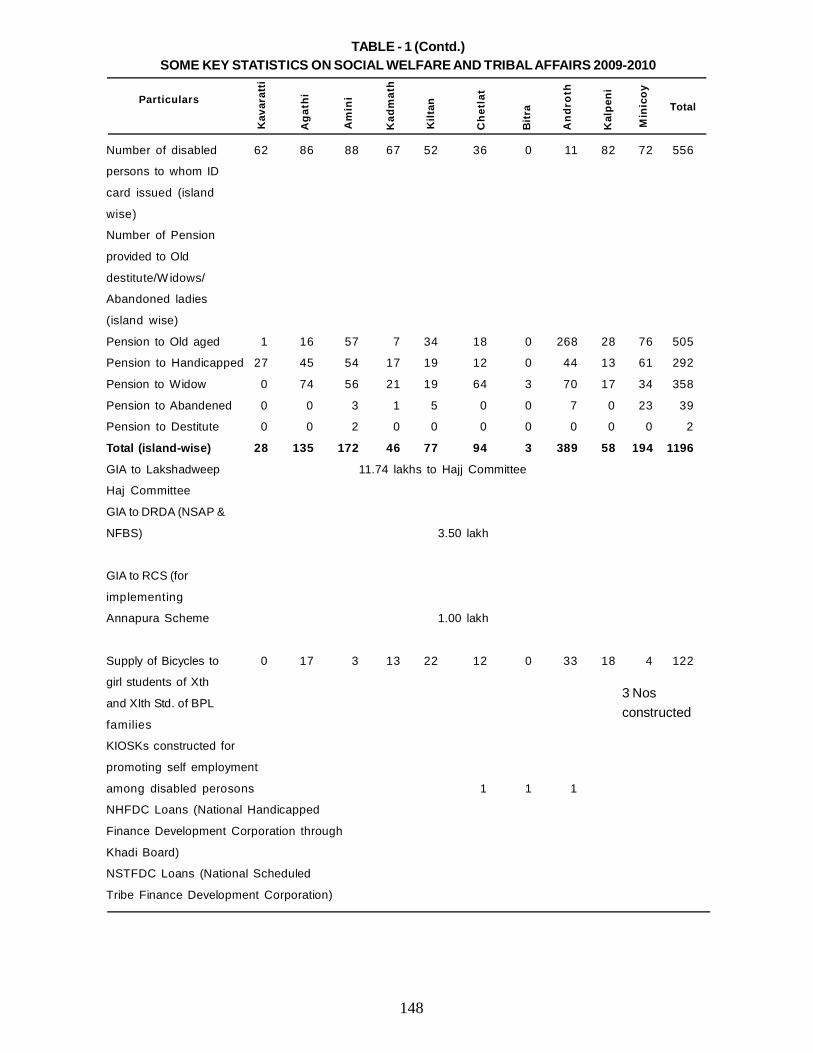
148
Number of disabled 62 86 88 67 52 36 0 11 82 72 556
persons to whom ID
card issued (island
wise)
Number of Pension
provided to Old
destitute/W idows/
Abandoned ladies
(island wise)
Pension to Old aged 1 16 57 7 34 18 0 268 28 76 505
Pension to Handicapped 27 45 54 17 19 12 0 44 13 61 292
Pension to Widow 0 74 56 21 19 64 3 70 17 34 358
Pension to Abandened 0 0 3 1 5 0 0 7 0 23 39
Pension to Destitute 0 0 2 0 0 0 0 0 0 0 2
Total (island-wise) 28 135 172 46 77 94 3 389 58 194 1196
GIA to Lakshadweep 11.74 lakhs to Hajj Committee
Haj Committee
GIA to DRDA (NSAP &
NFBS) 3.50 lakh
GIA to RCS (for
implementing
Annapura Scheme 1.00 lakh
Supply of Bicycles to 0 17 3 13 22 12 0 33 18 4 122
girl students of Xth
and XIth Std. of BPL
families
KIOSKs constructed for
promoting self employment
among disabled perosons 1 1 1
NHFDC Loans (National Handicapped
Finance Development Corporation through
Khadi Board)
NSTFDC Loans (National Scheduled
Tribe Finance Development Corporation)
TABLE - 1 (Contd.)SOME KEY STATISTICS ON SOCIAL WELFARE AND TRIBAL AFFAIRS 2009-2010
Particulars
Kav
arat
ti
Aga
thi
Am
ini
Kad
mat
h
Kilt
an
Che
tlat
Bitr
a
And
roth
Kal
peni
Min
icoy
Total
3 Nosconstructed
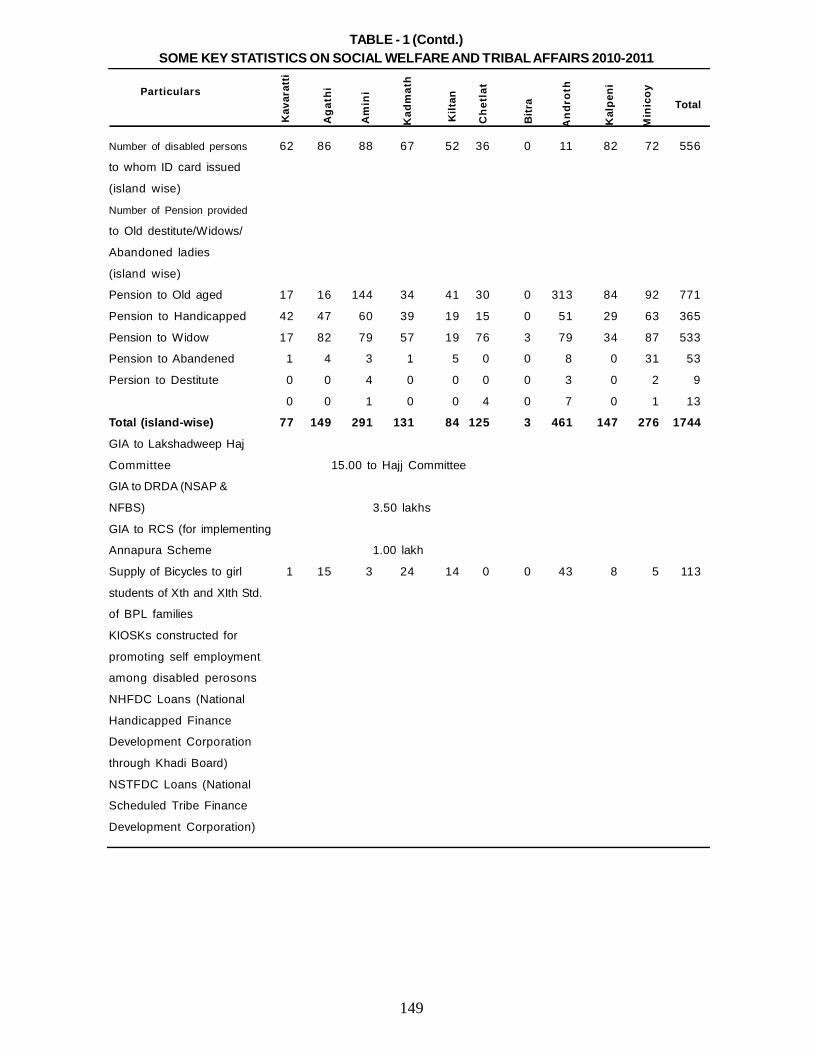
149
Number of disabled persons 62 86 88 67 52 36 0 11 82 72 556
to whom ID card issued
(island wise)
Number of Pension provided
to Old destitute/Widows/
Abandoned ladies
(island wise)
Pension to Old aged 17 16 144 34 41 30 0 313 84 92 771
Pension to Handicapped 42 47 60 39 19 15 0 51 29 63 365
Pension to Widow 17 82 79 57 19 76 3 79 34 87 533
Pension to Abandened 1 4 3 1 5 0 0 8 0 31 53
Persion to Destitute 0 0 4 0 0 0 0 3 0 2 9
0 0 1 0 0 4 0 7 0 1 13
Total (island-wise) 77 149 291 131 84 125 3 461 147 276 1744
GIA to Lakshadweep Haj
Committee 15.00 to Hajj Committee
GIA to DRDA (NSAP &
NFBS) 3.50 lakhs
GIA to RCS (for implementing
Annapura Scheme 1.00 lakh
Supply of Bicycles to girl 1 15 3 24 14 0 0 43 8 5 113
students of Xth and XIth Std.
of BPL families
KIOSKs constructed for
promoting self employment
among disabled perosons
NHFDC Loans (National
Handicapped Finance
Development Corporation
through Khadi Board)
NSTFDC Loans (National
Scheduled Tribe Finance
Development Corporation)
Particulars
Kav
arat
ti
Aga
thi
Am
ini
Kad
mat
h
Kilt
an
Che
tlat
Bitr
a
And
roth
Kal
peni
Min
icoy
Total
TABLE - 1 (Contd.)SOME KEY STATISTICS ON SOCIAL WELFARE AND TRIBAL AFFAIRS 2010-2011
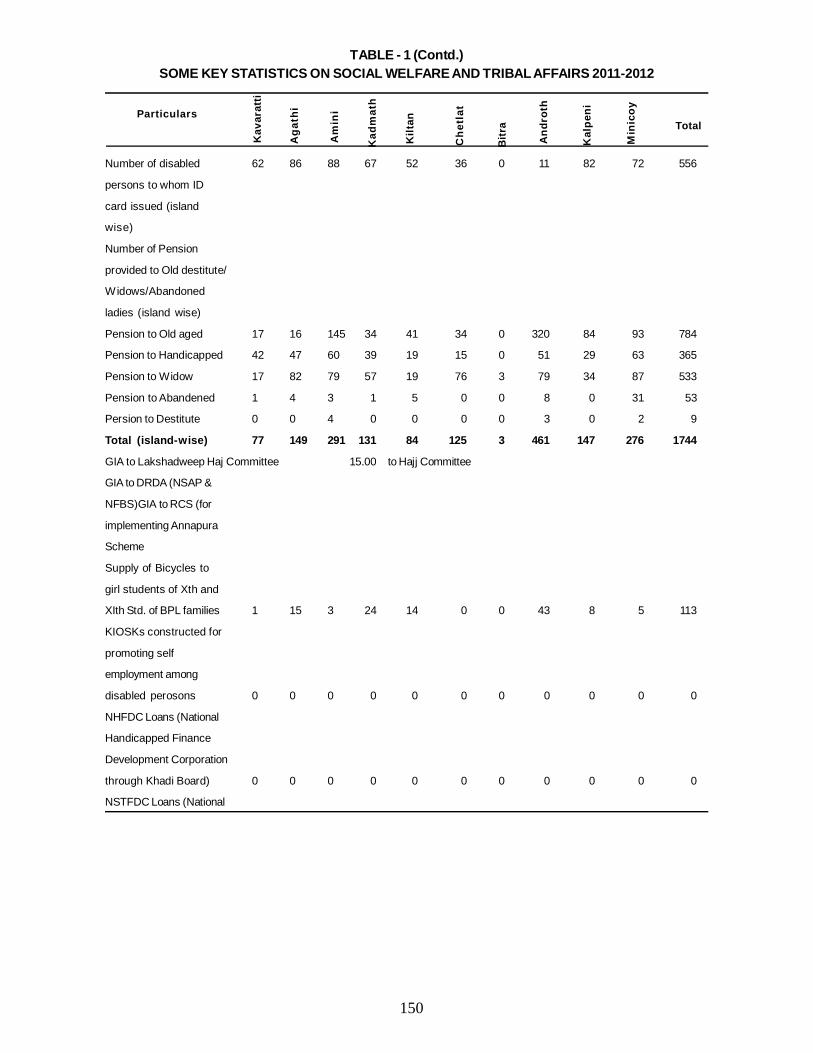
150
TABLE - 1 (Contd.)SOME KEY STATISTICS ON SOCIAL WELFARE AND TRIBAL AFFAIRS 2011-2012
Number of disabled 62 86 88 67 52 36 0 11 82 72 556
persons to whom ID
card issued (island
wise)
Number of Pension
provided to Old destitute/
Widows/Abandoned
ladies (island wise)
Pension to Old aged 17 16 145 34 41 34 0 320 84 93 784
Pension to Handicapped 42 47 60 39 19 15 0 51 29 63 365
Pension to Widow 17 82 79 57 19 76 3 79 34 87 533
Pension to Abandened 1 4 3 1 5 0 0 8 0 31 53
Persion to Destitute 0 0 4 0 0 0 0 3 0 2 9
Total (island-wise) 77 149 291 131 84 125 3 461 147 276 1744
GIA to Lakshadweep Haj Committee 15.00 to Hajj Committee
GIA to DRDA (NSAP &
NFBS)GIA to RCS (for
implementing Annapura
Scheme
Supply of Bicycles to
girl students of Xth and
XIth Std. of BPL families 1 15 3 24 14 0 0 43 8 5 113
KIOSKs constructed for
promoting self
employment among
disabled perosons 0 0 0 0 0 0 0 0 0 0 0
NHFDC Loans (National
Handicapped Finance
Development Corporation
through Khadi Board) 0 0 0 0 0 0 0 0 0 0 0
NSTFDC Loans (National
Particulars
Kav
arat
ti
Aga
thi
Am
ini
Kad
mat
h
Kilt
an
Che
tlat
Bitr
a
And
roth
Kal
peni
Min
icoy
Total
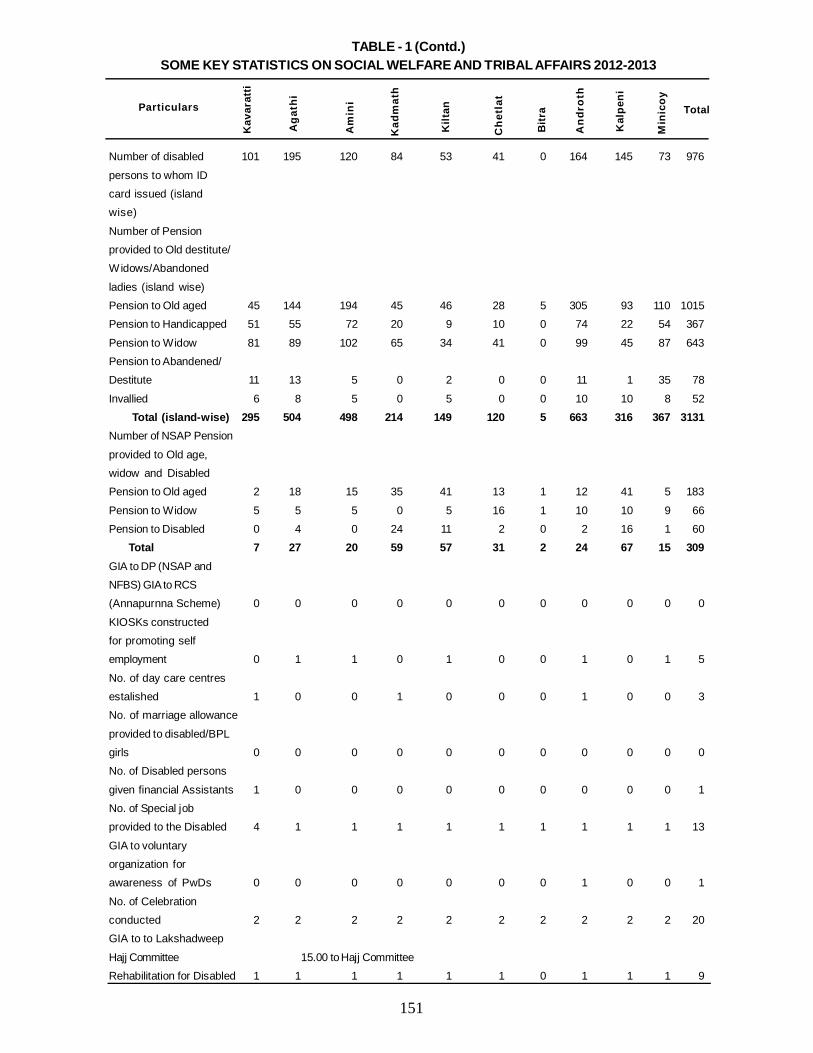
151
Number of disabled 101 195 120 84 53 41 0 164 145 73 976
persons to whom IDcard issued (islandwise)
Number of Pensionprovided to Old destitute/Widows/Abandoned
ladies (island wise)Pension to Old aged 45 144 194 45 46 28 5 305 93 110 1015Pension to Handicapped 51 55 72 20 9 10 0 74 22 54 367
Pension to Widow 81 89 102 65 34 41 0 99 45 87 643Pension to Abandened/Destitute 11 13 5 0 2 0 0 11 1 35 78
Invallied 6 8 5 0 5 0 0 10 10 8 52 Total (island-wise) 295 504 498 214 149 120 5 663 316 367 3131Number of NSAP Pension
provided to Old age,widow and DisabledPension to Old aged 2 18 15 35 41 13 1 12 41 5 183
Pension to Widow 5 5 5 0 5 16 1 10 10 9 66Pension to Disabled 0 4 0 24 11 2 0 2 16 1 60 Total 7 27 20 59 57 31 2 24 67 15 309GIA to DP (NSAP andNFBS) GIA to RCS(Annapurnna Scheme) 0 0 0 0 0 0 0 0 0 0 0
KIOSKs constructedfor promoting selfemployment 0 1 1 0 1 0 0 1 0 1 5
No. of day care centresestalished 1 0 0 1 0 0 0 1 0 0 3No. of marriage allowance
provided to disabled/BPLgirls 0 0 0 0 0 0 0 0 0 0 0No. of Disabled persons
given financial Assistants 1 0 0 0 0 0 0 0 0 0 1No. of Special jobprovided to the Disabled 4 1 1 1 1 1 1 1 1 1 13
GIA to voluntaryorganization forawareness of PwDs 0 0 0 0 0 0 0 1 0 0 1
No. of Celebrationconducted 2 2 2 2 2 2 2 2 2 2 20GIA to to Lakshadweep
Hajj Committee 15.00 to Hajj CommitteeRehabilitation for Disabled 1 1 1 1 1 1 0 1 1 1 9
TABLE - 1 (Contd.)SOME KEY STATISTICS ON SOCIAL WELFARE AND TRIBAL AFFAIRS 2012-2013
Particulars
Kav
arat
ti
Aga
thi
Am
ini
Kad
mat
h
Kilt
an
Che
tlat
Bitr
a
And
roth
Kal
peni
Min
icoy
Total
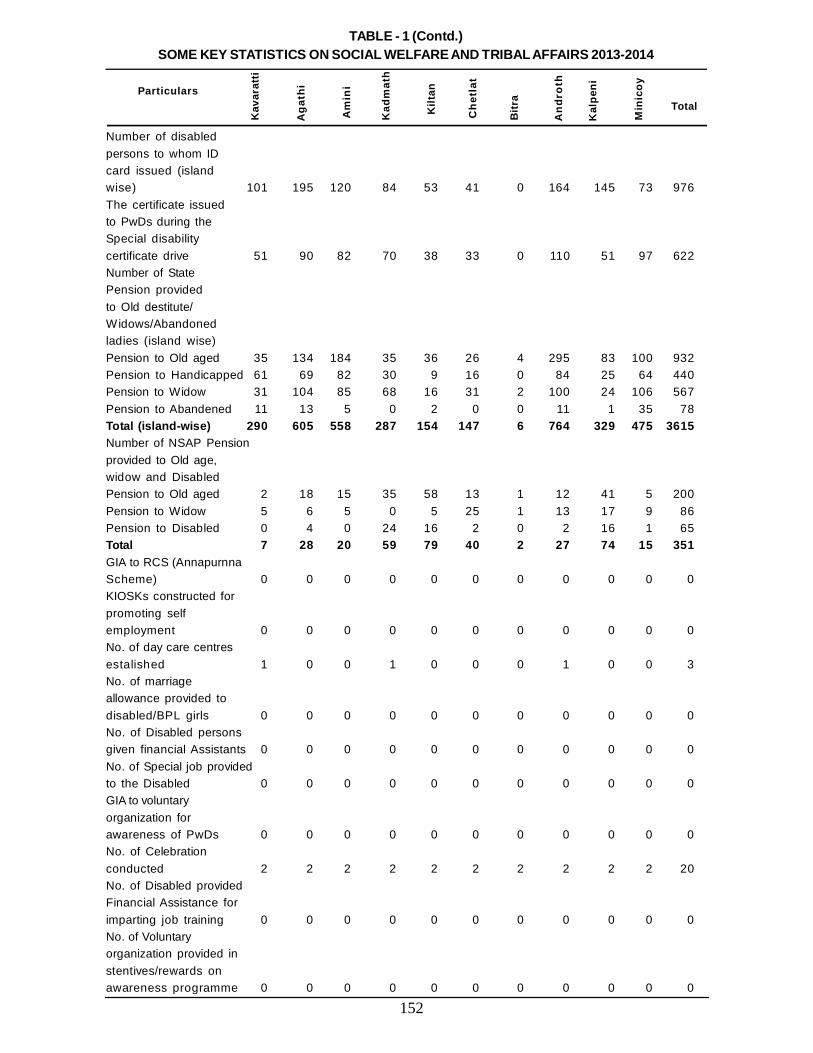
152
Number of disabledpersons to whom IDcard issued (islandwise) 101 195 120 84 53 41 0 164 145 73 976The certificate issuedto PwDs during theSpecial disabilitycertificate drive 51 90 82 70 38 33 0 110 51 97 622Number of StatePension providedto Old destitute/Widows/Abandonedladies (island wise)Pension to Old aged 35 134 184 35 36 26 4 295 83 100 932Pension to Handicapped 61 69 82 30 9 16 0 84 25 64 440Pension to Widow 31 104 85 68 16 31 2 100 24 106 567Pension to Abandened 11 13 5 0 2 0 0 11 1 35 78Total (island-wise) 290 605 558 287 154 147 6 764 329 475 3615Number of NSAP Pensionprovided to Old age,widow and DisabledPension to Old aged 2 18 15 35 58 13 1 12 41 5 200Pension to Widow 5 6 5 0 5 25 1 13 17 9 86Pension to Disabled 0 4 0 24 16 2 0 2 16 1 65Total 7 28 20 59 79 40 2 27 74 15 351GIA to RCS (AnnapurnnaScheme) 0 0 0 0 0 0 0 0 0 0 0KIOSKs constructed forpromoting selfemployment 0 0 0 0 0 0 0 0 0 0 0No. of day care centresestalished 1 0 0 1 0 0 0 1 0 0 3No. of marriageallowance provided todisabled/BPL girls 0 0 0 0 0 0 0 0 0 0 0No. of Disabled personsgiven financial Assistants 0 0 0 0 0 0 0 0 0 0 0No. of Special job providedto the Disabled 0 0 0 0 0 0 0 0 0 0 0GIA to voluntaryorganization forawareness of PwDs 0 0 0 0 0 0 0 0 0 0 0No. of Celebrationconducted 2 2 2 2 2 2 2 2 2 2 20No. of Disabled providedFinancial Assistance forimparting job training 0 0 0 0 0 0 0 0 0 0 0No. of Voluntaryorganization provided instentives/rewards onawareness programme 0 0 0 0 0 0 0 0 0 0 0
TABLE - 1 (Contd.)SOME KEY STATISTICS ON SOCIAL WELFARE AND TRIBAL AFFAIRS 2013-2014
Particulars
Kav
arat
ti
Aga
thi
Am
ini
Kad
mat
h
Kilt
an
Che
tlat
Bitr
a
And
roth
Kal
peni
Min
icoy
Total
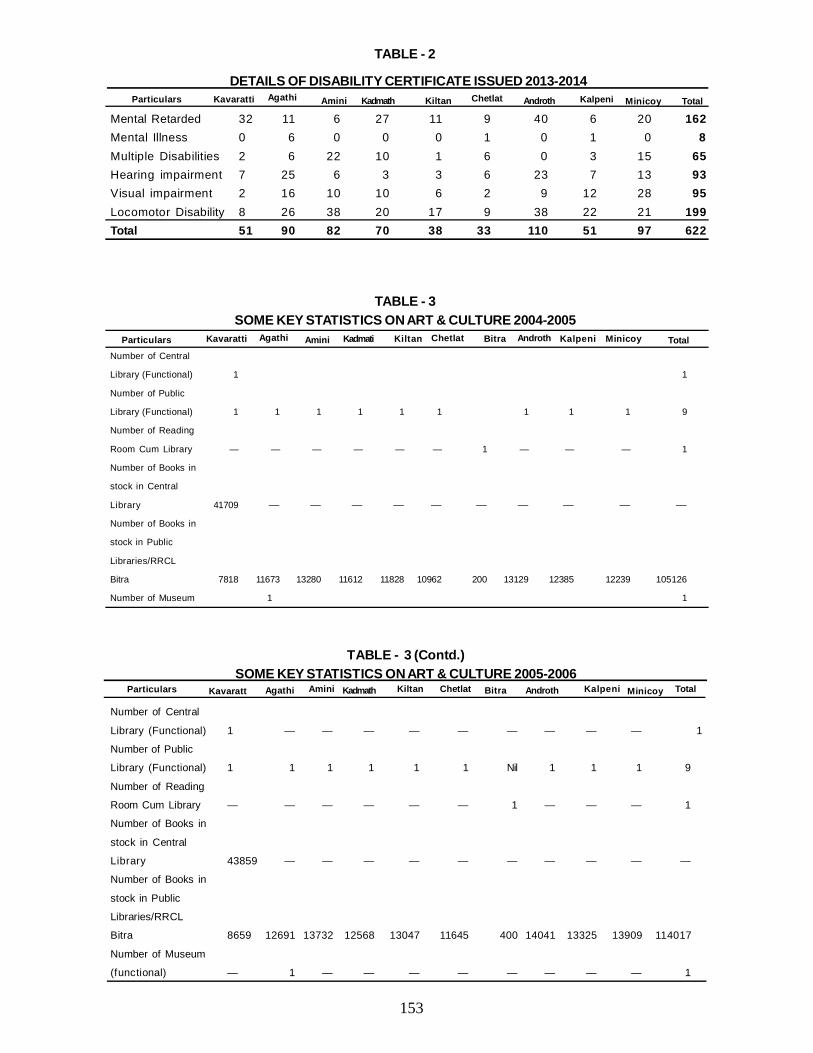
153
TABLE - 3 (Contd.)SOME KEY STATISTICS ON ART & CULTURE 2005-2006
Number of Central
Library (Functional) 1 — — — — — — — — — 1
Number of Public
Library (Functional) 1 1 1 1 1 1 Nil 1 1 1 9
Number of Reading
Room Cum Library — — — — — — 1 — — — 1
Number of Books in
stock in Central
Library 43859 — — — — — — — — — —
Number of Books in
stock in Public
Libraries/RRCL
Bitra 8659 12691 13732 12568 13047 11645 400 14041 13325 13909 114017
Number of Museum
(functional) — 1 — — — — — — — — 1
Kavaratt Agathi Amini Kadmath Kiltan Chetlat Bitra Androth Kalpeni Minicoy TotalParticulars
TABLE - 2
DETAILS OF DISABILITY CERTIFICATE ISSUED 2013-2014
Mental Retarded 32 11 6 27 11 9 40 6 20 162Mental Illness 0 6 0 0 0 1 0 1 0 8Multiple Disabilities 2 6 22 10 1 6 0 3 15 65Hearing impairment 7 25 6 3 3 6 23 7 13 93Visual impairment 2 16 10 10 6 2 9 12 28 95Locomotor Disability 8 26 38 20 17 9 38 22 21 199Total 51 90 82 70 38 33 110 51 97 622
Kavaratti Agathi Amini Kadmath Kiltan Chetlat Androth Kalpeni Minicoy TotalParticulars
KavarattiParticulars Agathi Amini Kadmati Kiltan Chetlat Bitra Androth Kalpeni Minicoy Total
TABLE - 3SOME KEY STATISTICS ON ART & CULTURE 2004-2005
Number of Central
Library (Functional) 1 1
Number of Public
Library (Functional) 1 1 1 1 1 1 1 1 1 9
Number of Reading
Room Cum Library — — — — — — 1 — — — 1
Number of Books in
stock in Central
Library 41709 — — — — — — — — — —
Number of Books in
stock in Public
Libraries/RRCL
Bitra 7818 11673 13280 11612 11828 10962 200 13129 12385 12239 105126
Number of Museum 1 1
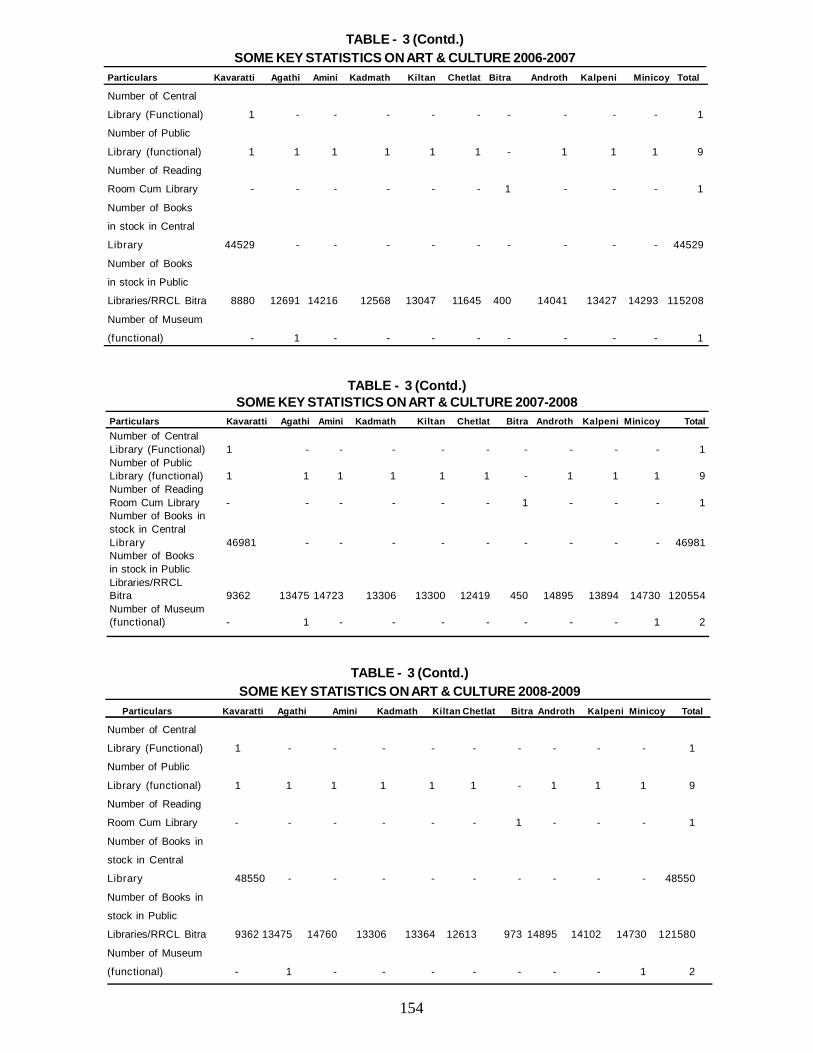
154
TABLE - 3 (Contd.)SOME KEY STATISTICS ON ART & CULTURE 2008-2009
Particulars Kavaratti Agathi Amini Kadmath Kiltan Chetlat Bitra Androth Kalpeni Minicoy Total
Number of Central
Library (Functional) 1 - - - - - - - - - 1
Number of Public
Library (functional) 1 1 1 1 1 1 - 1 1 1 9
Number of Reading
Room Cum Library - - - - - - 1 - - - 1
Number of Books in
stock in Central
Library 48550 - - - - - - - - - 48550
Number of Books in
stock in Public
Libraries/RRCL Bitra 9362 13475 14760 13306 13364 12613 973 14895 14102 14730 121580
Number of Museum
(functional) - 1 - - - - - - - 1 2
TABLE - 3 (Contd.)SOME KEY STATISTICS ON ART & CULTURE 2006-2007
Particulars Kavaratti Agathi Amini Kadmath Kiltan Chetlat Bitra Androth Kalpeni Minicoy Total
Number of Central
Library (Functional) 1 - - - - - - - - - 1
Number of Public
Library (functional) 1 1 1 1 1 1 - 1 1 1 9
Number of Reading
Room Cum Library - - - - - - 1 - - - 1
Number of Books
in stock in Central
Library 44529 - - - - - - - - - 44529
Number of Books
in stock in Public
Libraries/RRCL Bitra 8880 12691 14216 12568 13047 11645 400 14041 13427 14293 115208
Number of Museum
(functional) - 1 - - - - - - - - 1
TABLE - 3 (Contd.)SOME KEY STATISTICS ON ART & CULTURE 2007-2008
Particulars Kavaratti Agathi Amini Kadmath Kiltan Chetlat Bitra Androth Kalpeni Minicoy TotalNumber of CentralLibrary (Functional) 1 - - - - - - - - - 1Number of PublicLibrary (functional) 1 1 1 1 1 1 - 1 1 1 9Number of ReadingRoom Cum Library - - - - - - 1 - - - 1Number of Books instock in CentralLibrary 46981 - - - - - - - - - 46981Number of Booksin stock in PublicLibraries/RRCLBitra 9362 13475 14723 13306 13300 12419 450 14895 13894 14730 120554Number of Museum(functional) - 1 - - - - - - - 1 2
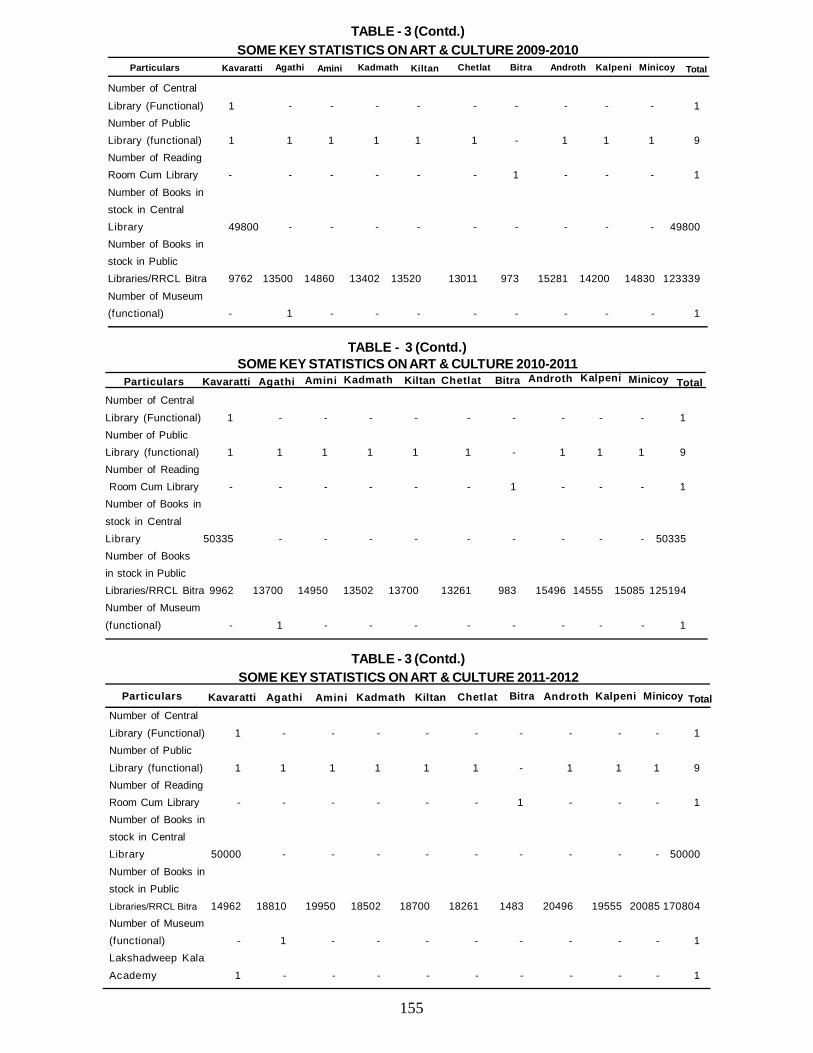
155
TABLE - 3 (Contd.)SOME KEY STATISTICS ON ART & CULTURE 2010-2011
Number of Central
Library (Functional) 1 - - - - - - - - - 1Number of PublicLibrary (functional) 1 1 1 1 1 1 - 1 1 1 9Number of Reading Room Cum Library - - - - - - 1 - - - 1Number of Books in
stock in CentralLibrary 50335 - - - - - - - - - 50335Number of Booksin stock in PublicLibraries/RRCL Bitra 9962 13700 14950 13502 13700 13261 983 15496 14555 15085 125194Number of Museum
(functional) - 1 - - - - - - - - 1
Particulars Kavaratti Agathi Amini Kadmath Kiltan Chetlat Bitra Androth Kalpeni Minicoy Total
TABLE - 3 (Contd.)SOME KEY STATISTICS ON ART & CULTURE 2009-2010
Number of Central
Library (Functional) 1 - - - - - - - - - 1Number of PublicLibrary (functional) 1 1 1 1 1 1 - 1 1 1 9Number of ReadingRoom Cum Library - - - - - - 1 - - - 1
Number of Books instock in CentralLibrary 49800 - - - - - - - - - 49800Number of Books instock in PublicLibraries/RRCL Bitra 9762 13500 14860 13402 13520 13011 973 15281 14200 14830 123339
Number of Museum(functional) - 1 - - - - - - - - 1
Particulars Kavaratti Agathi Amini Kadmath Kiltan Chetlat Bitra Androth Kalpeni Minicoy Total
TABLE - 3 (Contd.)SOME KEY STATISTICS ON ART & CULTURE 2011-2012
Number of Central
Library (Functional) 1 - - - - - - - - - 1Number of Public
Library (functional) 1 1 1 1 1 1 - 1 1 1 9Number of ReadingRoom Cum Library - - - - - - 1 - - - 1Number of Books instock in CentralLibrary 50000 - - - - - - - - - 50000
Number of Books instock in PublicLibraries/RRCL Bitra 14962 18810 19950 18502 18700 18261 1483 20496 19555 20085 170804Number of Museum(functional) - 1 - - - - - - - - 1Lakshadweep Kala
Academy 1 - - - - - - - - - 1
Particulars Kavaratti Agathi Amini Kadmath Kiltan Chetlat Bitra Androth Kalpeni Minicoy Total
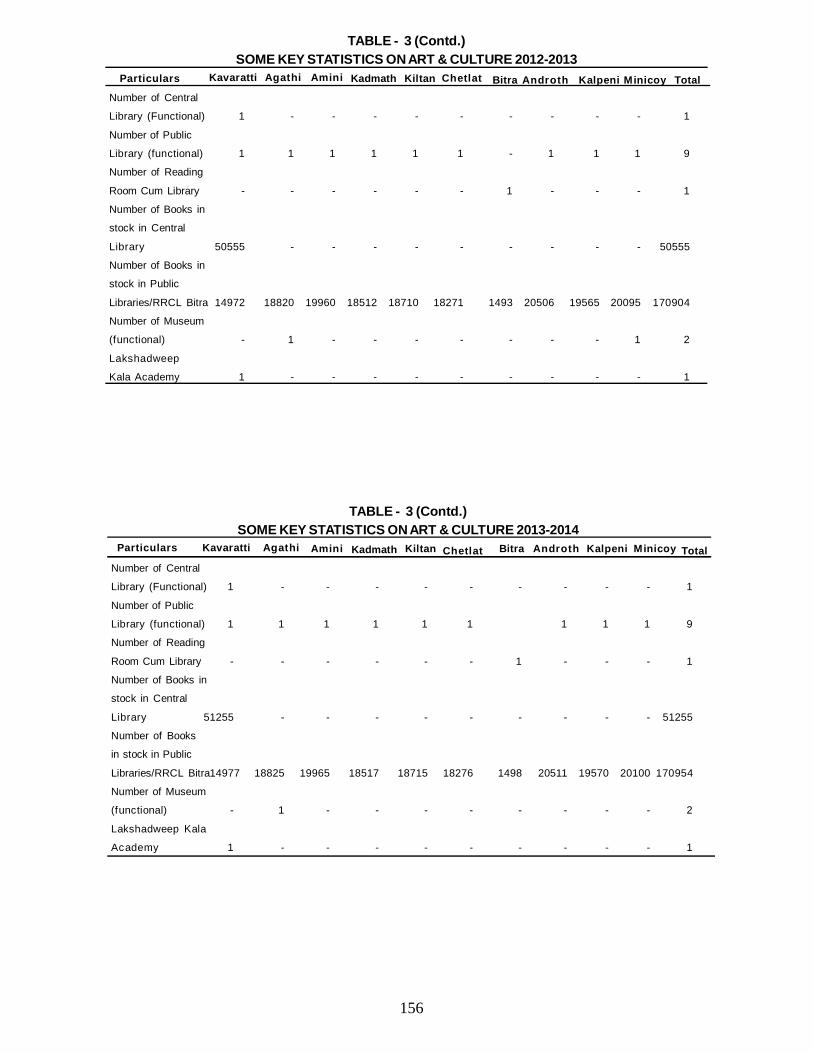
156
TABLE - 3 (Contd.)SOME KEY STATISTICS ON ART & CULTURE 2013-2014
Number of Central
Library (Functional) 1 - - - - - - - - - 1
Number of Public
Library (functional) 1 1 1 1 1 1 1 1 1 9
Number of Reading
Room Cum Library - - - - - - 1 - - - 1
Number of Books in
stock in Central
Library 51255 - - - - - - - - - 51255
Number of Books
in stock in Public
Libraries/RRCL Bitra14977 18825 19965 18517 18715 18276 1498 20511 19570 20100 170954
Number of Museum
(functional) - 1 - - - - - - - - 2
Lakshadweep Kala
Academy 1 - - - - - - - - - 1
Particulars Kavaratti Agathi Amini Kadmath Kiltan Chetlat Bitra Androth Kalpeni Minicoy Total
TABLE - 3 (Contd.)SOME KEY STATISTICS ON ART & CULTURE 2012-2013
Number of Central
Library (Functional) 1 - - - - - - - - - 1
Number of Public
Library (functional) 1 1 1 1 1 1 - 1 1 1 9
Number of Reading
Room Cum Library - - - - - - 1 - - - 1
Number of Books in
stock in Central
Library 50555 - - - - - - - - - 50555
Number of Books in
stock in Public
Libraries/RRCL Bitra 14972 18820 19960 18512 18710 18271 1493 20506 19565 20095 170904
Number of Museum
(functional) - 1 - - - - - - - 1 2
Lakshadweep
Kala Academy 1 - - - - - - - - - 1
Particulars Kavaratti Agathi Amini Kadmath Kiltan Chetlat Bitra Androth Kalpeni Minicoy Total
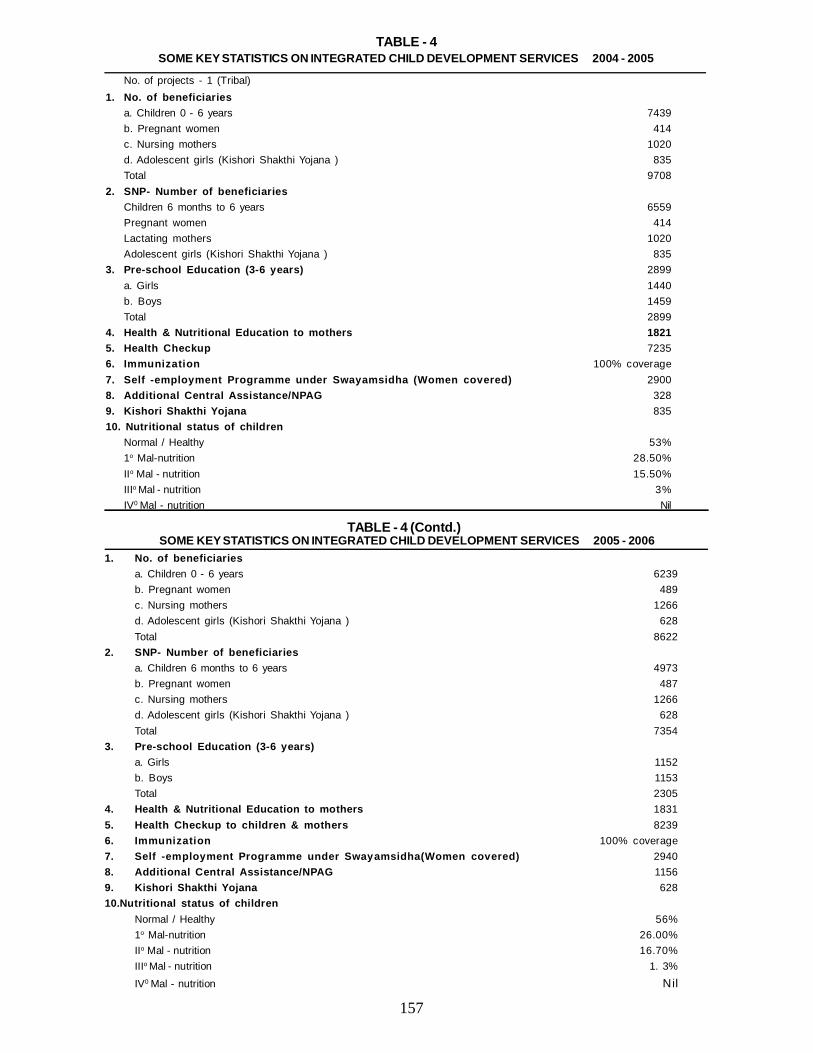
157
No. of projects - 1 (Tribal)1. No. of beneficiaries
a. Children 0 - 6 years 7439b. Pregnant women 414c. Nursing mothers 1020d. Adolescent girls (Kishori Shakthi Yojana ) 835Total 9708
2. SNP- Number of beneficiariesChildren 6 months to 6 years 6559Pregnant women 414Lactating mothers 1020Adolescent girls (Kishori Shakthi Yojana ) 835
3. Pre-school Education (3-6 years) 2899a. Girls 1440b. Boys 1459Total 2899
4. Health & Nutritional Education to mothers 18215. Health Checkup 72356. Immunization 100% coverage7. Self -employment Programme under Swayamsidha (Women covered) 29008. Additional Central Assistance/NPAG 3289. Kishori Shakthi Yojana 83510. Nutritional status of children
Normal / Healthy 53%1o Mal-nutrition 28.50%IIo Mal - nutrition 15.50%IIIo Mal - nutrition 3%IV0 Mal - nutrition Nil
SOME KEY STATISTICS ON INTEGRATED CHILD DEVELOPMENT SERVICES 2004 - 2005TABLE - 4
1. No. of beneficiariesa. Children 0 - 6 years 6239b. Pregnant women 489c. Nursing mothers 1266d. Adolescent girls (Kishori Shakthi Yojana ) 628Total 8622
2. SNP- Number of beneficiariesa. Children 6 months to 6 years 4973b. Pregnant women 487c. Nursing mothers 1266d. Adolescent girls (Kishori Shakthi Yojana ) 628Total 7354
3. Pre-school Education (3-6 years)a. Girls 1152b. Boys 1153Total 2305
4. Health & Nutritional Education to mothers 18315. Health Checkup to children & mothers 82396. Immunization 100% coverage7. Self -employment Programme under Swayamsidha(Women covered) 29408. Additional Central Assistance/NPAG 11569. Kishori Shakthi Yojana 62810.Nutritional status of children
Normal / Healthy 56%1o Mal-nutrition 26.00%IIo Mal - nutrition 16.70%IIIo Mal - nutrition 1. 3%
IV0 Mal - nutrition Nil
SOME KEY STATISTICS ON INTEGRATED CHILD DEVELOPMENT SERVICES 2005 - 2006TABLE - 4 (Contd.)
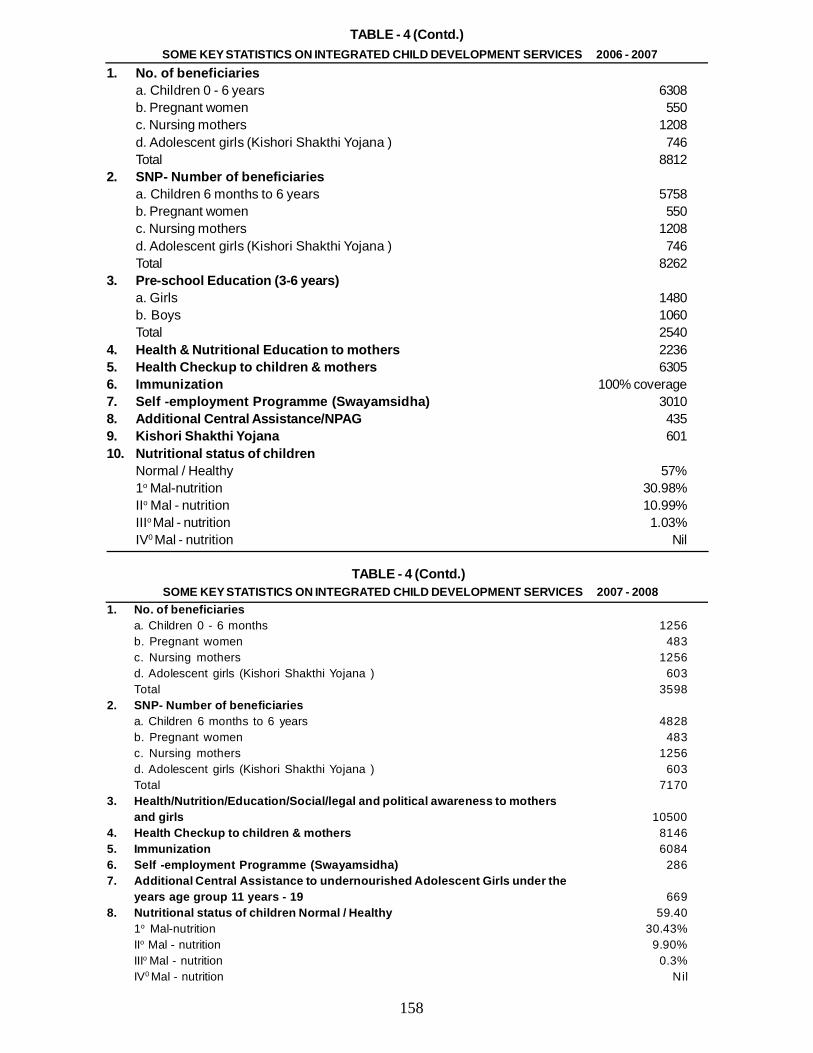
158
1. No. of beneficiariesa. Children 0 - 6 years 6308b. Pregnant women 550c. Nursing mothers 1208d. Adolescent girls (Kishori Shakthi Yojana ) 746Total 8812
2. SNP- Number of beneficiariesa. Children 6 months to 6 years 5758b. Pregnant women 550c. Nursing mothers 1208d. Adolescent girls (Kishori Shakthi Yojana ) 746Total 8262
3. Pre-school Education (3-6 years)a. Girls 1480b. Boys 1060Total 2540
4. Health & Nutritional Education to mothers 22365. Health Checkup to children & mothers 63056. Immunization 100% coverage7. Self -employment Programme (Swayamsidha) 30108. Additional Central Assistance/NPAG 4359. Kishori Shakthi Yojana 60110. Nutritional status of children
Normal / Healthy 57%1o Mal-nutrition 30.98%IIo Mal - nutrition 10.99%IIIo Mal - nutrition 1.03%IV0 Mal - nutrition Nil
SOME KEY STATISTICS ON INTEGRATED CHILD DEVELOPMENT SERVICES 2006 - 2007TABLE - 4 (Contd.)
1. No. of beneficiariesa. Children 0 - 6 months 1256b. Pregnant women 483c. Nursing mothers 1256d. Adolescent girls (Kishori Shakthi Yojana ) 603Total 3598
2. SNP- Number of beneficiariesa. Children 6 months to 6 years 4828b. Pregnant women 483c. Nursing mothers 1256d. Adolescent girls (Kishori Shakthi Yojana ) 603Total 7170
3. Health/Nutrition/Education/Social/legal and political awareness to mothersand girls 10500
4. Health Checkup to children & mothers 81465. Immunization 60846. Self -employment Programme (Swayamsidha) 2867. Additional Central Assistance to undernourished Adolescent Girls under the
years age group 11 years - 19 6698. Nutritional status of children Normal / Healthy 59.40
1o Mal-nutrition 30.43%IIo Mal - nutrition 9.90%IIIo Mal - nutrition 0.3%IV0 Mal - nutrition Nil
SOME KEY STATISTICS ON INTEGRATED CHILD DEVELOPMENT SERVICES 2007 - 2008TABLE - 4 (Contd.)
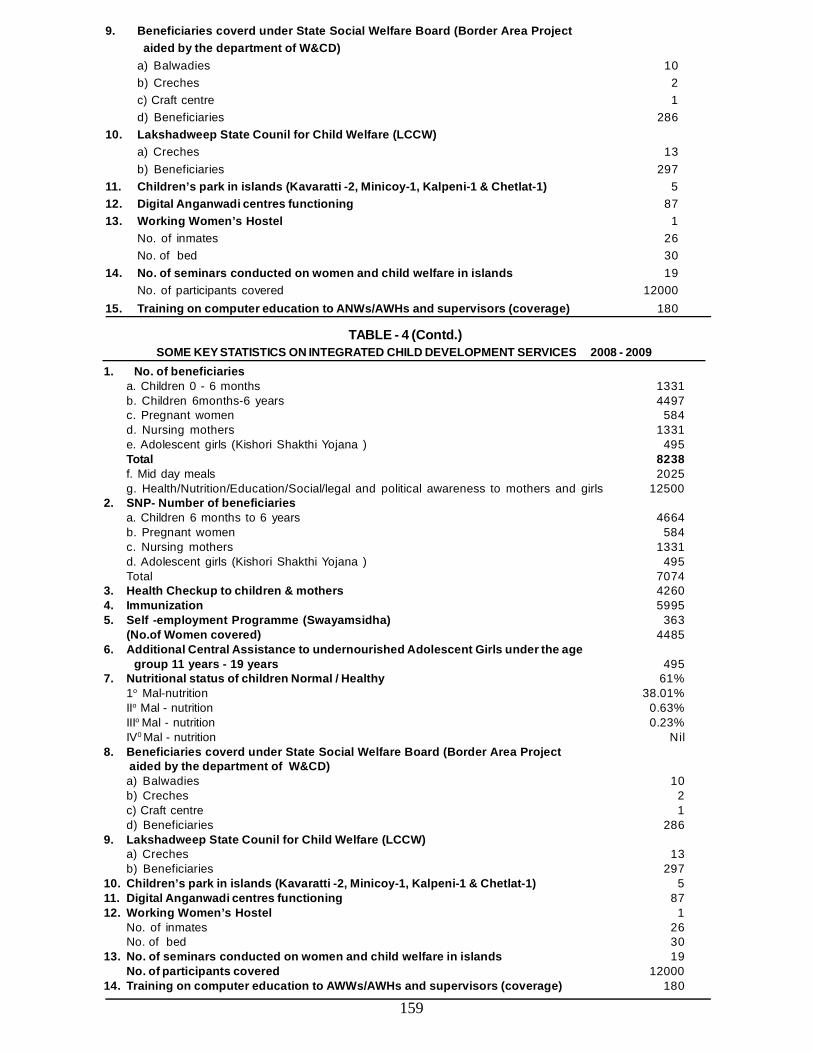
159
9. Beneficiaries coverd under State Social Welfare Board (Border Area Project aided by the department of W&CD)
a) Balwadies 10b) Creches 2c) Craft centre 1d) Beneficiaries 286
10. Lakshadweep State Counil for Child Welfare (LCCW)a) Creches 13b) Beneficiaries 297
11. Children’s park in islands (Kavaratti -2, Minicoy-1, Kalpeni-1 & Chetlat-1) 512. Digital Anganwadi centres functioning 8713. Working Women’s Hostel 1
No. of inmates 26No. of bed 30
14. No. of seminars conducted on women and child welfare in islands 19No. of participants covered 12000
15. Training on computer education to ANWs/AWHs and supervisors (coverage) 180
SOME KEY STATISTICS ON INTEGRATED CHILD DEVELOPMENT SERVICES 2008 - 2009TABLE - 4 (Contd.)
1. No. of beneficiariesa. Children 0 - 6 months 1331b. Children 6months-6 years 4497c. Pregnant women 584d. Nursing mothers 1331e. Adolescent girls (Kishori Shakthi Yojana ) 495Total 8238f. Mid day meals 2025g. Health/Nutrition/Education/Social/legal and political awareness to mothers and girls 12500
2. SNP- Number of beneficiariesa. Children 6 months to 6 years 4664b. Pregnant women 584c. Nursing mothers 1331d. Adolescent girls (Kishori Shakthi Yojana ) 495Total 7074
3. Health Checkup to children & mothers 42604. Immunization 59955. Self -employment Programme (Swayamsidha) 363
(No.of Women covered) 44856. Additional Central Assistance to undernourished Adolescent Girls under the age
group 11 years - 19 years 4957. Nutritional status of children Normal / Healthy 61%
1o Mal-nutrition 38.01%IIo Mal - nutrition 0.63%IIIo Mal - nutrition 0.23%IV0 Mal - nutrition Nil
8. Beneficiaries coverd under State Social Welfare Board (Border Area Project aided by the department of W&CD)a) Balwadies 10b) Creches 2c) Craft centre 1d) Beneficiaries 286
9. Lakshadweep State Counil for Child Welfare (LCCW)a) Creches 13b) Beneficiaries 297
10. Children’s park in islands (Kavaratti -2, Minicoy-1, Kalpeni-1 & Chetlat-1) 511. Digital Anganwadi centres functioning 8712. Working Women’s Hostel 1
No. of inmates 26No. of bed 30
13. No. of seminars conducted on women and child welfare in islands 19No. of participants covered 12000
14. Training on computer education to AWWs/AWHs and supervisors (coverage) 180
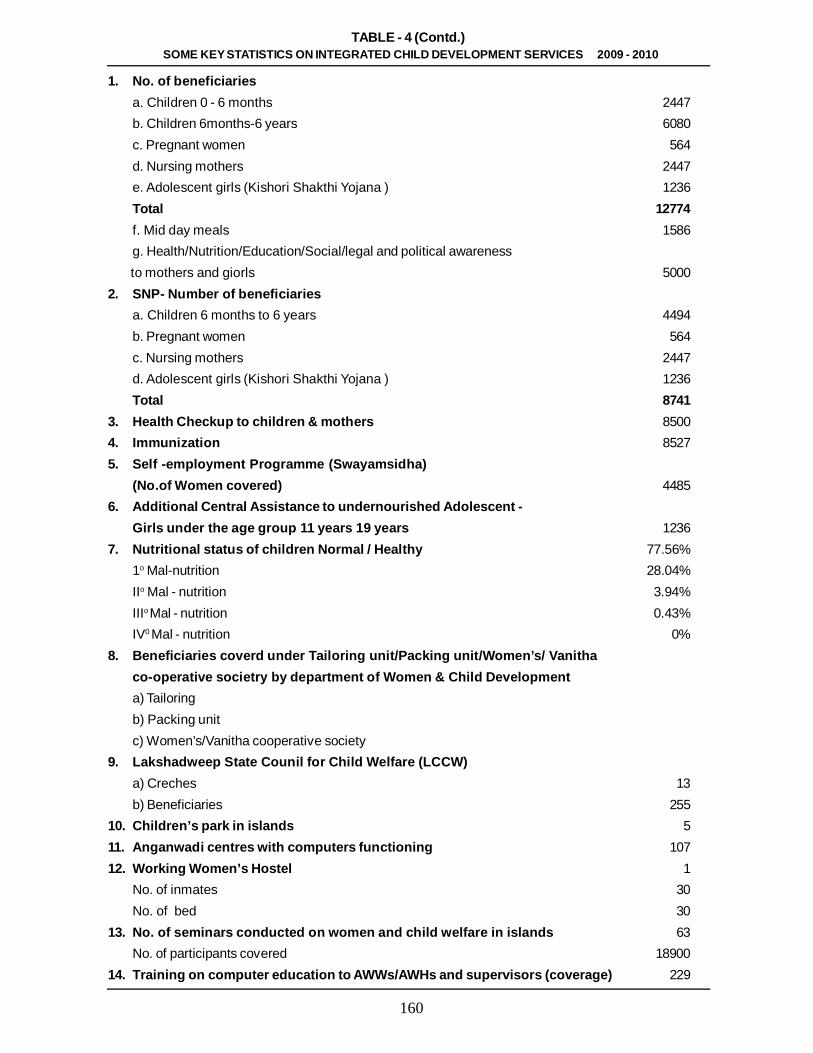
160
1. No. of beneficiariesa. Children 0 - 6 months 2447b. Children 6months-6 years 6080c. Pregnant women 564d. Nursing mothers 2447e. Adolescent girls (Kishori Shakthi Yojana ) 1236Total 12774f. Mid day meals 1586g. Health/Nutrition/Education/Social/legal and political awareness
to mothers and giorls 50002. SNP- Number of beneficiaries
a. Children 6 months to 6 years 4494b. Pregnant women 564c. Nursing mothers 2447d. Adolescent girls (Kishori Shakthi Yojana ) 1236Total 8741
3. Health Checkup to children & mothers 85004. Immunization 85275. Self -employment Programme (Swayamsidha)
(No.of Women covered) 44856. Additional Central Assistance to undernourished Adolescent -
Girls under the age group 11 years 19 years 12367. Nutritional status of children Normal / Healthy 77.56%
1o Mal-nutrition 28.04%IIo Mal - nutrition 3.94%IIIo Mal - nutrition 0.43%IV0 Mal - nutrition 0%
8. Beneficiaries coverd under Tailoring unit/Packing unit/Women’s/ Vanithaco-operative societry by department of Women & Child Developmenta) Tailoringb) Packing unitc) Women’s/Vanitha cooperative society
9. Lakshadweep State Counil for Child Welfare (LCCW)a) Creches 13b) Beneficiaries 255
10. Children’s park in islands 511. Anganwadi centres with computers functioning 10712. Working Women’s Hostel 1
No. of inmates 30No. of bed 30
13. No. of seminars conducted on women and child welfare in islands 63No. of participants covered 18900
14. Training on computer education to AWWs/AWHs and supervisors (coverage) 229
SOME KEY STATISTICS ON INTEGRATED CHILD DEVELOPMENT SERVICES 2009 - 2010TABLE - 4 (Contd.)
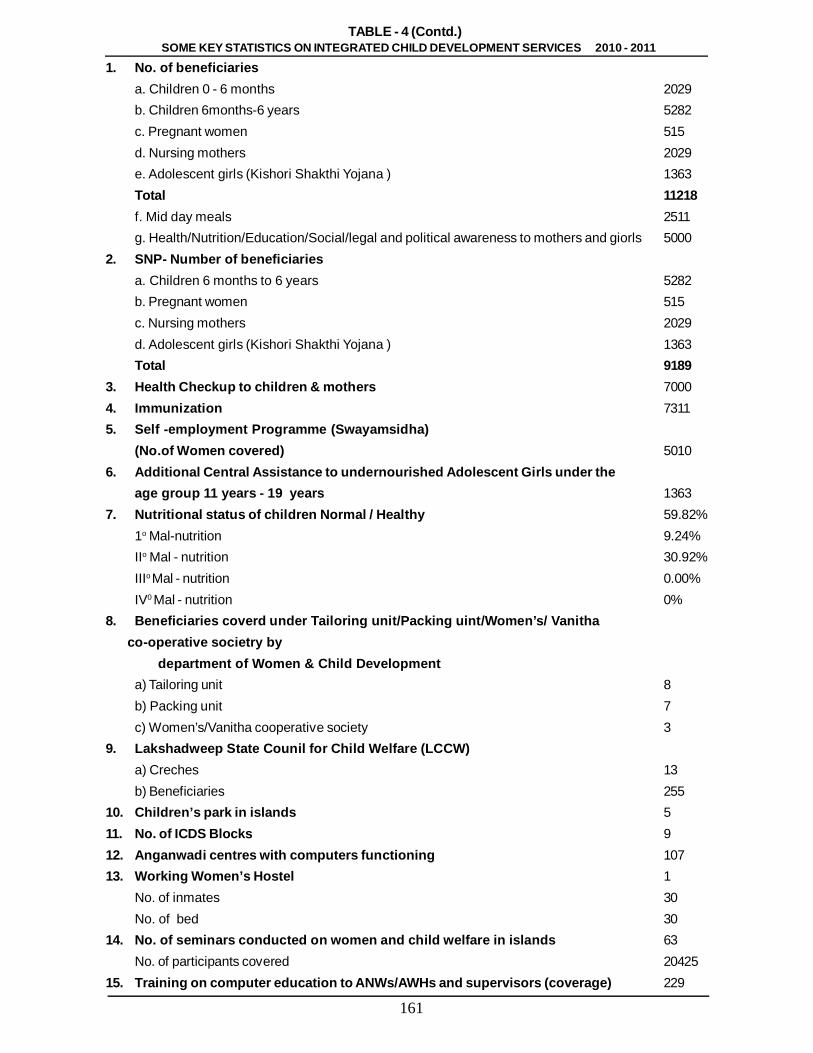
161
1. No. of beneficiariesa. Children 0 - 6 months 2029b. Children 6months-6 years 5282c. Pregnant women 515d. Nursing mothers 2029e. Adolescent girls (Kishori Shakthi Yojana ) 1363Total 11218f. Mid day meals 2511g. Health/Nutrition/Education/Social/legal and political awareness to mothers and giorls 5000
2. SNP- Number of beneficiariesa. Children 6 months to 6 years 5282b. Pregnant women 515c. Nursing mothers 2029d. Adolescent girls (Kishori Shakthi Yojana ) 1363Total 9189
3. Health Checkup to children & mothers 70004. Immunization 73115. Self -employment Programme (Swayamsidha)
(No.of Women covered) 50106. Additional Central Assistance to undernourished Adolescent Girls under the
age group 11 years - 19 years 13637. Nutritional status of children Normal / Healthy 59.82%
1o Mal-nutrition 9.24%IIo Mal - nutrition 30.92%IIIo Mal - nutrition 0.00%IV0 Mal - nutrition 0%
8. Beneficiaries coverd under Tailoring unit/Packing uint/Women’s/ Vanitha co-operative societry by
department of Women & Child Developmenta) Tailoring unit 8b) Packing unit 7c) Women’s/Vanitha cooperative society 3
9. Lakshadweep State Counil for Child Welfare (LCCW)a) Creches 13b) Beneficiaries 255
10. Children’s park in islands 511. No. of ICDS Blocks 912. Anganwadi centres with computers functioning 10713. Working Women’s Hostel 1
No. of inmates 30No. of bed 30
14. No. of seminars conducted on women and child welfare in islands 63No. of participants covered 20425
15. Training on computer education to ANWs/AWHs and supervisors (coverage) 229
SOME KEY STATISTICS ON INTEGRATED CHILD DEVELOPMENT SERVICES 2010 - 2011TABLE - 4 (Contd.)
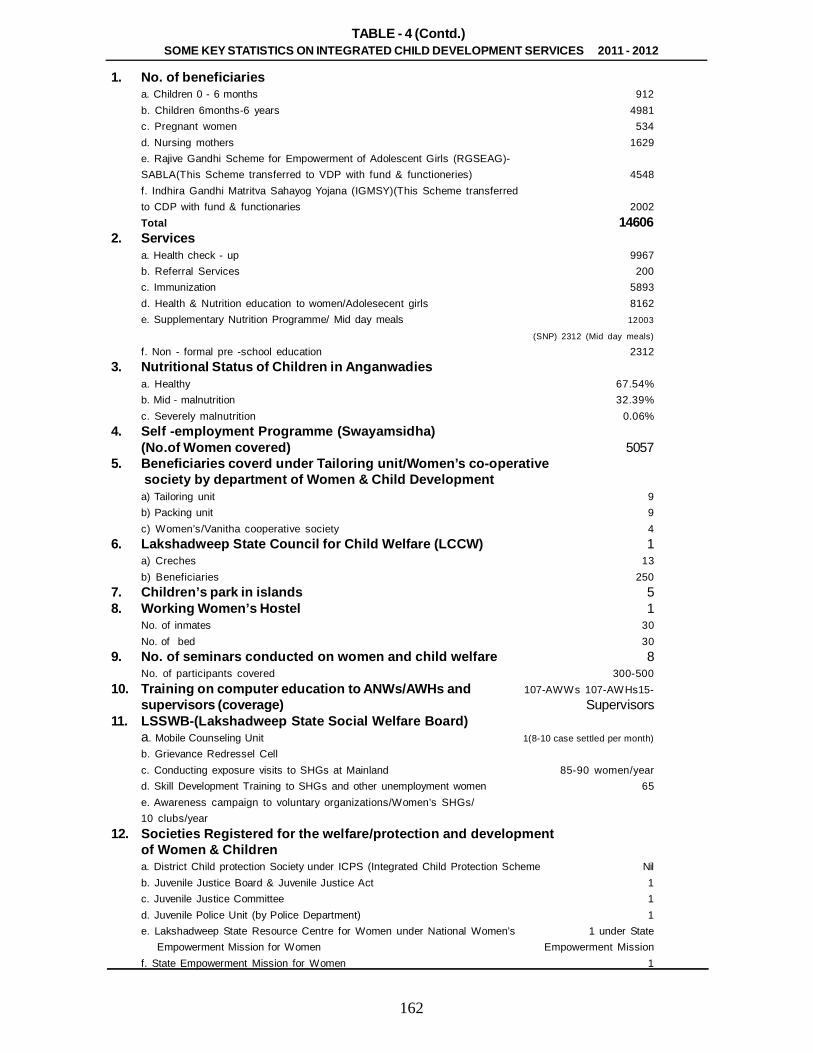
162
1. No. of beneficiariesa. Children 0 - 6 months 912b. Children 6months-6 years 4981c. Pregnant women 534d. Nursing mothers 1629e. Rajive Gandhi Scheme for Empowerment of Adolescent Girls (RGSEAG)-SABLA(This Scheme transferred to VDP with fund & functioneries) 4548f. Indhira Gandhi Matritva Sahayog Yojana (IGMSY)(This Scheme transferredto CDP with fund & functionaries 2002Total 14606
2. Servicesa. Health check - up 9967b. Referral Services 200c. Immunization 5893d. Health & Nutrition education to women/Adolesecent girls 8162e. Supplementary Nutrition Programme/ Mid day meals 12003
(SNP) 2312 (Mid day meals)
f. Non - formal pre -school education 23123. Nutritional Status of Children in Anganwadies
a. Healthy 67.54%b. Mid - malnutrition 32.39%c. Severely malnutrition 0.06%
4. Self -employment Programme (Swayamsidha)(No.of Women covered) 5057
5. Beneficiaries coverd under Tailoring unit/Women’s co-operative society by department of Women & Child Developmenta) Tailoring unit 9b) Packing unit 9c) Women’s/Vanitha cooperative society 4
6. Lakshadweep State Council for Child Welfare (LCCW) 1a) Creches 13b) Beneficiaries 250
7. Children’s park in islands 58. Working Women’s Hostel 1
No. of inmates 30No. of bed 30
9. No. of seminars conducted on women and child welfare 8No. of participants covered 300-500
10. Training on computer education to ANWs/AWHs and 107-AWWs 107-AWHs15-supervisors (coverage) Supervisors
11. LSSWB-(Lakshadweep State Social Welfare Board)a. Mobile Counseling Unit 1(8-10 case settled per month)
b. Grievance Redressel Cellc. Conducting exposure visits to SHGs at Mainland 85-90 women/yeard. Skill Development Training to SHGs and other unemployment women 65e. Awareness campaign to voluntary organizations/Women’s SHGs/10 clubs/year
12. Societies Registered for the welfare/protection and developmentof Women & Childrena. District Child protection Society under ICPS (Integrated Child Protection Scheme Nilb. Juvenile Justice Board & Juvenile Justice Act 1c. Juvenile Justice Committee 1d. Juvenile Police Unit (by Police Department) 1e. Lakshadweep State Resource Centre for Women under National Women’s 1 under State Empowerment Mission for Women Empowerment Missionf. State Empowerment Mission for Women 1
SOME KEY STATISTICS ON INTEGRATED CHILD DEVELOPMENT SERVICES 2011 - 2012TABLE - 4 (Contd.)
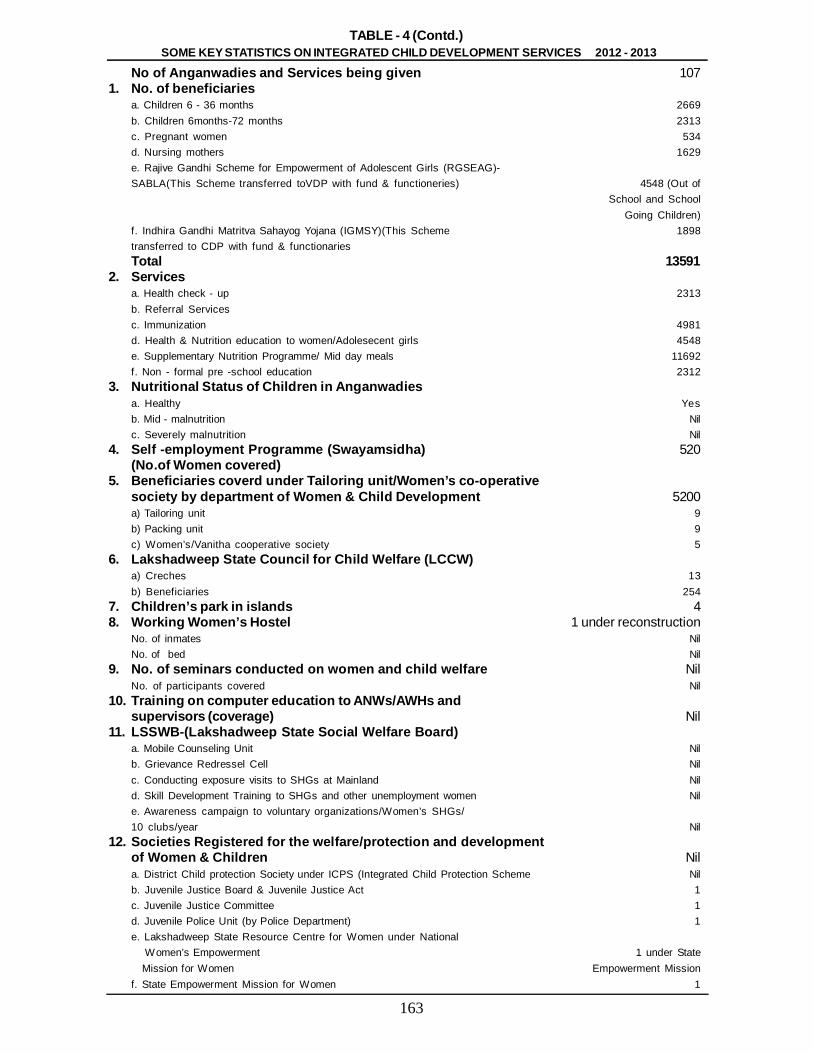
163
No of Anganwadies and Services being given 1071. No. of beneficiaries
a. Children 6 - 36 months 2669b. Children 6months-72 months 2313c. Pregnant women 534d. Nursing mothers 1629e. Rajive Gandhi Scheme for Empowerment of Adolescent Girls (RGSEAG)-SABLA(This Scheme transferred toVDP with fund & functioneries) 4548 (Out of
School and SchoolGoing Children)
f. Indhira Gandhi Matritva Sahayog Yojana (IGMSY)(This Scheme 1898transferred to CDP with fund & functionariesTotal 13591
2. Servicesa. Health check - up 2313b. Referral Servicesc. Immunization 4981d. Health & Nutrition education to women/Adolesecent girls 4548e. Supplementary Nutrition Programme/ Mid day meals 11692f. Non - formal pre -school education 2312
3. Nutritional Status of Children in Anganwadiesa. Healthy Yesb. Mid - malnutrition Nilc. Severely malnutrition Nil
4. Self -employment Programme (Swayamsidha) 520(No.of Women covered)
5. Beneficiaries coverd under Tailoring unit/Women’s co-operativesociety by department of Women & Child Development 5200a) Tailoring unit 9b) Packing unit 9c) Women’s/Vanitha cooperative society 5
6. Lakshadweep State Council for Child Welfare (LCCW)a) Creches 13b) Beneficiaries 254
7. Children’s park in islands 48. Working Women’s Hostel 1 under reconstruction
No. of inmates NilNo. of bed Nil
9. No. of seminars conducted on women and child welfare NilNo. of participants covered Nil
10. Training on computer education to ANWs/AWHs andsupervisors (coverage) Nil
11. LSSWB-(Lakshadweep State Social Welfare Board)a. Mobile Counseling Unit Nilb. Grievance Redressel Cell Nilc. Conducting exposure visits to SHGs at Mainland Nild. Skill Development Training to SHGs and other unemployment women Nile. Awareness campaign to voluntary organizations/Women’s SHGs/10 clubs/year Nil
12. Societies Registered for the welfare/protection and developmentof Women & Children Nila. District Child protection Society under ICPS (Integrated Child Protection Scheme Nilb. Juvenile Justice Board & Juvenile Justice Act 1c. Juvenile Justice Committee 1d. Juvenile Police Unit (by Police Department) 1e. Lakshadweep State Resource Centre for Women under National
Women’s Empowerment 1 under State Mission for Women Empowerment Missionf. State Empowerment Mission for Women 1
SOME KEY STATISTICS ON INTEGRATED CHILD DEVELOPMENT SERVICES 2012 - 2013TABLE - 4 (Contd.)
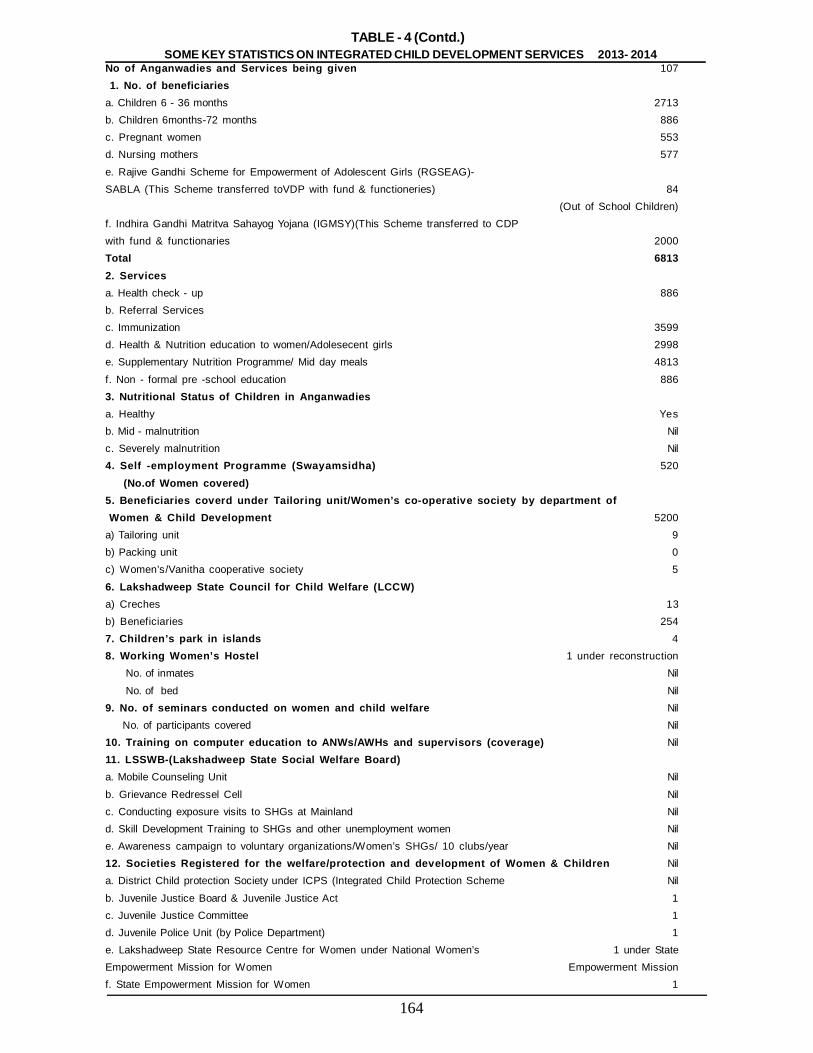
164
No of Anganwadies and Services being given 107 1. No. of beneficiariesa. Children 6 - 36 months 2713b. Children 6months-72 months 886c. Pregnant women 553d. Nursing mothers 577
e. Rajive Gandhi Scheme for Empowerment of Adolescent Girls (RGSEAG)-SABLA (This Scheme transferred toVDP with fund & functioneries) 84
(Out of School Children)f. Indhira Gandhi Matritva Sahayog Yojana (IGMSY)(This Scheme transferred to CDPwith fund & functionaries 2000Total 68132. Servicesa. Health check - up 886b. Referral Servicesc. Immunization 3599d. Health & Nutrition education to women/Adolesecent girls 2998e. Supplementary Nutrition Programme/ Mid day meals 4813
f. Non - formal pre -school education 8863. Nutritional Status of Children in Anganwadiesa. Healthy Yesb. Mid - malnutrition Nilc. Severely malnutrition Nil4. Self -employment Programme (Swayamsidha) 520
(No.of Women covered)5. Beneficiaries coverd under Tailoring unit/Women’s co-operative society by department ofWomen & Child Development 5200
a) Tailoring unit 9b) Packing unit 0c) Women’s/Vanitha cooperative society 5
6. Lakshadweep State Council for Child Welfare (LCCW)a) Creches 13b) Beneficiaries 2547. Children’s park in islands 48. Working Women’s Hostel 1 under reconstruction No. of inmates Nil
No. of bed Nil9. No. of seminars conducted on women and child welfare Nil No. of participants covered Nil10. Training on computer education to ANWs/AWHs and supervisors (coverage) Nil11. LSSWB-(Lakshadweep State Social Welfare Board)a. Mobile Counseling Unit Nil
b. Grievance Redressel Cell Nilc. Conducting exposure visits to SHGs at Mainland Nild. Skill Development Training to SHGs and other unemployment women Nile. Awareness campaign to voluntary organizations/Women’s SHGs/ 10 clubs/year Nil12. Societies Registered for the welfare/protection and development of Women & Children Nila. District Child protection Society under ICPS (Integrated Child Protection Scheme Nil
b. Juvenile Justice Board & Juvenile Justice Act 1c. Juvenile Justice Committee 1d. Juvenile Police Unit (by Police Department) 1e. Lakshadweep State Resource Centre for Women under National Women’s 1 under StateEmpowerment Mission for Women Empowerment Missionf. State Empowerment Mission for Women 1
SOME KEY STATISTICS ON INTEGRATED CHILD DEVELOPMENT SERVICES 2013- 2014TABLE - 4 (Contd.)
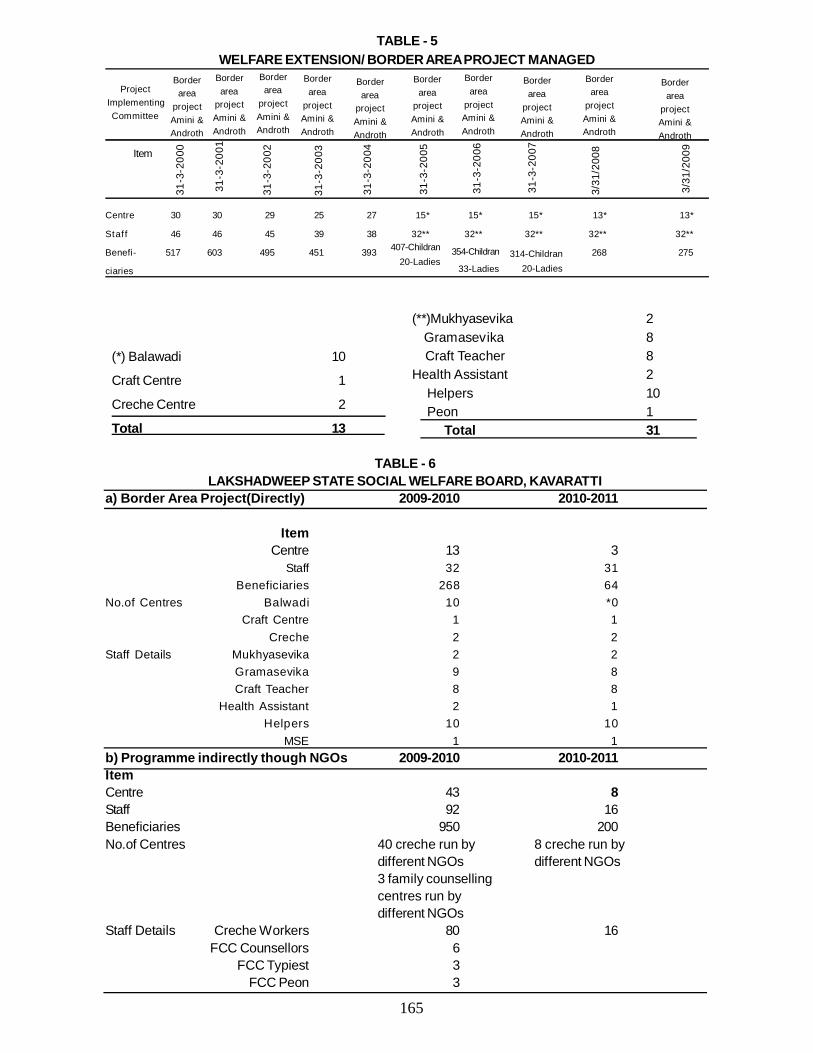
165
Centre 30 30 29 25 27 15* 15* 15* 13* 13*
Staf f 46 46 45 39 38 32** 32** 32** 32** 32**
Benefi- 517 603 495 451 393 268 275
ciaries
TABLE - 5WELFARE EXTENSION/ BORDER AREA PROJECT MANAGED
Project Implementing
Committee
Borderarea
projectAmini &Androth
Borderarea
projectAmini &Androth
Borderarea
projectAmini &Androth
Borderarea
projectAmini &Androth
Borderarea
projectAmini &Androth
Borderarea
projectAmini &Androth
Borderarea
projectAmini &Androth
Borderarea
projectAmini &Androth
Item
31-3
-200
0
31-3
-200
1
31-3
-200
2
31-3
-200
3
31-3
-200
4
31-3
-200
5
31-3
-200
6
31-3
-200
7
3/31
/200
8
407-Childran20-Ladies
354-Childran
33-Ladies314-Childran
20-Ladies
3/31
/200
9
Borderarea
projectAmini &Androth
Borderarea
projectAmini &Androth
(*) Balawadi 10
Craft Centre 1
Creche Centre 2
Total 13
(**)Mukhyasevika 2 Gramasevika 8 Craft Teacher 8Health Assistant 2 Helpers 10 Peon 1 Total 31
TABLE - 6LAKSHADWEEP STATE SOCIAL WELFARE BOARD, KAVARATTI
a) Border Area Project(Directly) 2009-2010 2010-2011
ItemCentre 13 3
Staff 32 31Beneficiaries 268 64
No.of Centres Balwadi 10 *0Craft Centre 1 1
Creche 2 2Staff Details Mukhyasevika 2 2
Gramasevika 9 8Craft Teacher 8 8
Health Assistant 2 1Helpers 10 10
MSE 1 1b) Programme indirectly though NGOs 2009-2010 2010-2011ItemCentre 43 8Staff 92 16Beneficiaries 950 200No.of Centres 40 creche run by 8 creche run by
different NGOs different NGOs3 family counsellingcentres run bydifferent NGOs
Staff Details Creche Workers 80 16FCC Counsellors 6
FCC Typiest 3FCC Peon 3
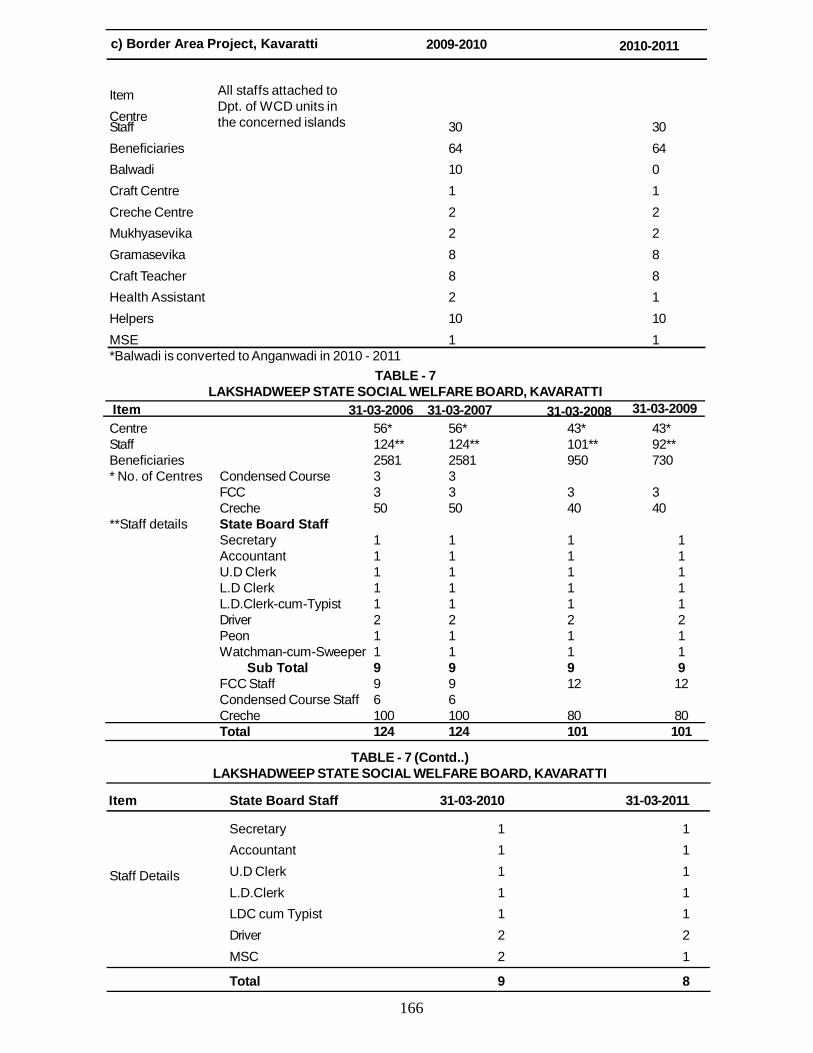
166
TABLE - 7 (Contd..)LAKSHADWEEP STATE SOCIAL WELFARE BOARD, KAVARATTI
Item State Board Staff 31-03-2010 31-03-2011
Secretary 1 1Accountant 1 1U.D Clerk 1 1L.D.Clerk 1 1LDC cum Typist 1 1Driver 2 2MSC 2 1
Total 9 8
Staff Details
ItemCentreStaff 30 30Beneficiaries 64 64Balwadi 10 0Craft Centre 1 1Creche Centre 2 2Mukhyasevika 2 2Gramasevika 8 8Craft Teacher 8 8Health Assistant 2 1Helpers 10 10MSE 1 1*Balwadi is converted to Anganwadi in 2010 - 2011
Centre 56* 56* 43* 43*Staff 124** 124** 101** 92**Beneficiaries 2581 2581 950 730* No. of Centres Condensed Course 3 3
FCC 3 3 3 3Creche 50 50 40 40
**Staff details State Board StaffSecretary 1 1 1 1Accountant 1 1 1 1U.D Clerk 1 1 1 1L.D Clerk 1 1 1 1L.D.Clerk-cum-Typist 1 1 1 1Driver 2 2 2 2Peon 1 1 1 1Watchman-cum-Sweeper 1 1 1 1 Sub Total 9 9 9 9FCC Staff 9 9 12 12Condensed Course Staff 6 6Creche 100 100 80 80Total 124 124 101 101
Item 31-03-2006 31-03-2007 31-03-2008 31-03-2009
TABLE - 7LAKSHADWEEP STATE SOCIAL WELFARE BOARD, KAVARATTI
c) Border Area Project, Kavaratti 2009-2010 2010-2011
All staffs attached toDpt. of WCD units inthe concerned islands
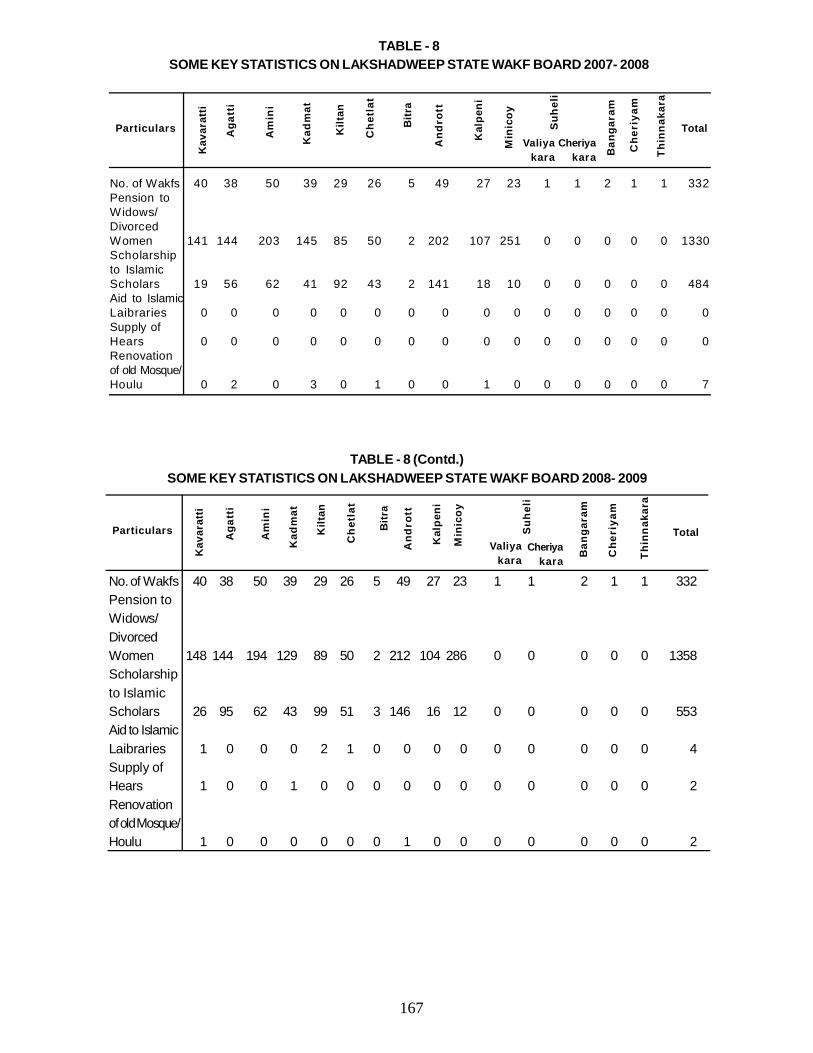
167
No. of Wakfs 40 38 50 39 29 26 5 49 27 23 1 1 2 1 1 332Pension toWidows/DivorcedWomen 141 144 203 145 85 50 2 202 107 251 0 0 0 0 0 1330Scholarshipto IslamicScholars 19 56 62 41 92 43 2 141 18 10 0 0 0 0 0 484Aid to IslamicLaibraries 0 0 0 0 0 0 0 0 0 0 0 0 0 0 0 0Supply ofHears 0 0 0 0 0 0 0 0 0 0 0 0 0 0 0 0Renovationof old Mosque/Houlu 0 2 0 3 0 1 0 0 1 0 0 0 0 0 0 7
TABLE - 8SOME KEY STATISTICS ON LAKSHADWEEP STATE WAKF BOARD 2007- 2008
Particulars
Kav
arat
ti
Aga
tti
Am
ini
Kad
mat
Kilt
an
Che
tlat
Bitr
a
And
rott
Kal
peni
Min
icoy
Suh
eli
Ban
gara
m
Che
riya
m
TotalValiya
kara Thin
naka
ra
Cheriyakara
No. of Wakfs 40 38 50 39 29 26 5 49 27 23 1 1 2 1 1 332Pension toWidows/DivorcedWomen 148 144 194 129 89 50 2 212 104 286 0 0 0 0 0 1358Scholarshipto IslamicScholars 26 95 62 43 99 51 3 146 16 12 0 0 0 0 0 553Aid to IslamicLaibraries 1 0 0 0 2 1 0 0 0 0 0 0 0 0 0 4Supply ofHears 1 0 0 1 0 0 0 0 0 0 0 0 0 0 0 2Renovationof old Mosque/Houlu 1 0 0 0 0 0 0 1 0 0 0 0 0 0 0 2
TABLE - 8 (Contd.)SOME KEY STATISTICS ON LAKSHADWEEP STATE WAKF BOARD 2008- 2009
Particulars
Kav
arat
ti
Aga
tti
Am
ini
Kad
mat
Kilt
an
Che
tlat
Bitr
a
And
rott
Kal
peni
Min
icoy
Suh
eli
Ban
gara
m
Che
riya
m
TotalValiya
kara Thin
naka
ra
Cheriyakara
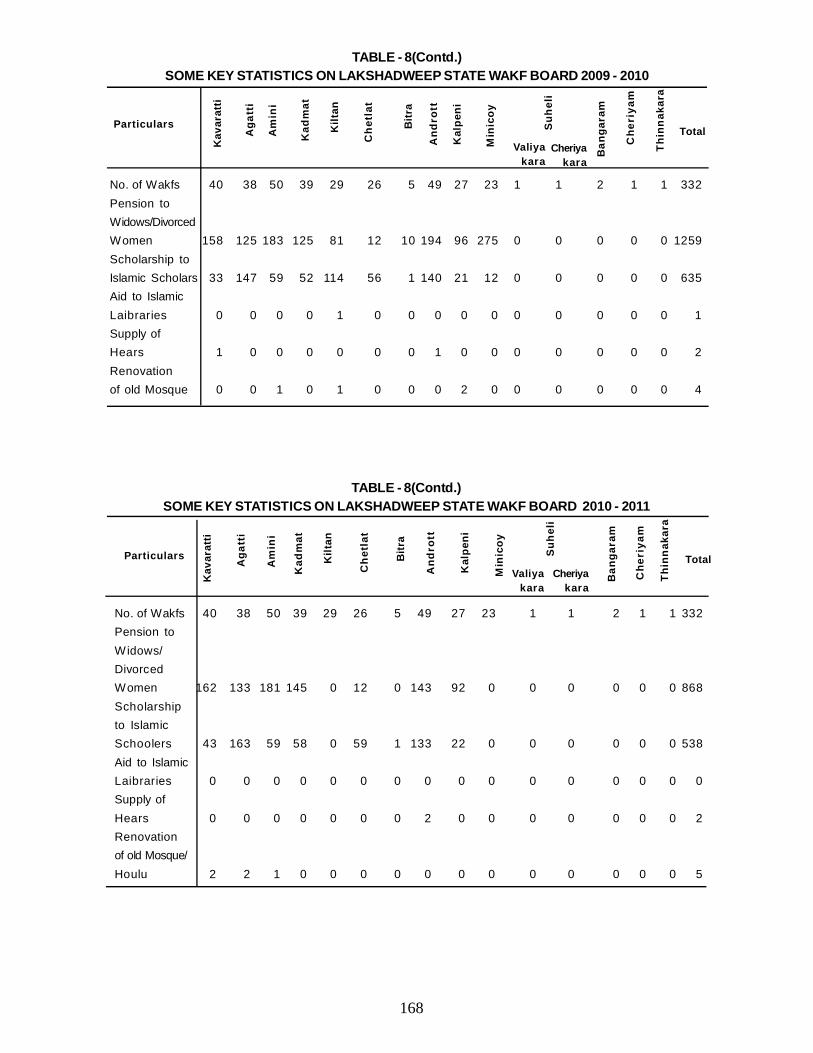
168
No. of Wakfs 40 38 50 39 29 26 5 49 27 23 1 1 2 1 1 332Pension toWidows/DivorcedWomen 158 125 183 125 81 12 10 194 96 275 0 0 0 0 0 1259Scholarship toIslamic Scholars 33 147 59 52 114 56 1 140 21 12 0 0 0 0 0 635Aid to IslamicLaibraries 0 0 0 0 1 0 0 0 0 0 0 0 0 0 0 1Supply ofHears 1 0 0 0 0 0 0 1 0 0 0 0 0 0 0 2Renovationof old Mosque 0 0 1 0 1 0 0 0 2 0 0 0 0 0 0 4
TABLE - 8(Contd.)SOME KEY STATISTICS ON LAKSHADWEEP STATE WAKF BOARD 2009 - 2010
Particulars
Kav
arat
ti
Aga
tti
Am
ini
Kad
mat
Kilt
an
Che
tlat
Bitr
a
And
rott
Kal
peni
Min
icoy
Suh
eli
Ban
gara
m
Che
riya
m
TotalValiya
kara
Thin
naka
ra
Cheriyakara
No. of Wakfs 40 38 50 39 29 26 5 49 27 23 1 1 2 1 1 332Pension toWidows/DivorcedWomen 162 133 181 145 0 12 0 143 92 0 0 0 0 0 0 868Scholarshipto IslamicSchoolers 43 163 59 58 0 59 1 133 22 0 0 0 0 0 0 538Aid to IslamicLaibraries 0 0 0 0 0 0 0 0 0 0 0 0 0 0 0 0Supply ofHears 0 0 0 0 0 0 0 2 0 0 0 0 0 0 0 2Renovationof old Mosque/Houlu 2 2 1 0 0 0 0 0 0 0 0 0 0 0 0 5
TABLE - 8(Contd.)SOME KEY STATISTICS ON LAKSHADWEEP STATE WAKF BOARD 2010 - 2011
Particulars
Kav
arat
ti
Aga
tti
Am
ini
Kad
mat
Kilt
an
Che
tlat
Bitr
a
And
rott
Kal
peni
Min
icoy
Suh
eli
Ban
gara
m
Che
riya
m
TotalValiya
kara
Thin
naka
ra
Cheriyakara
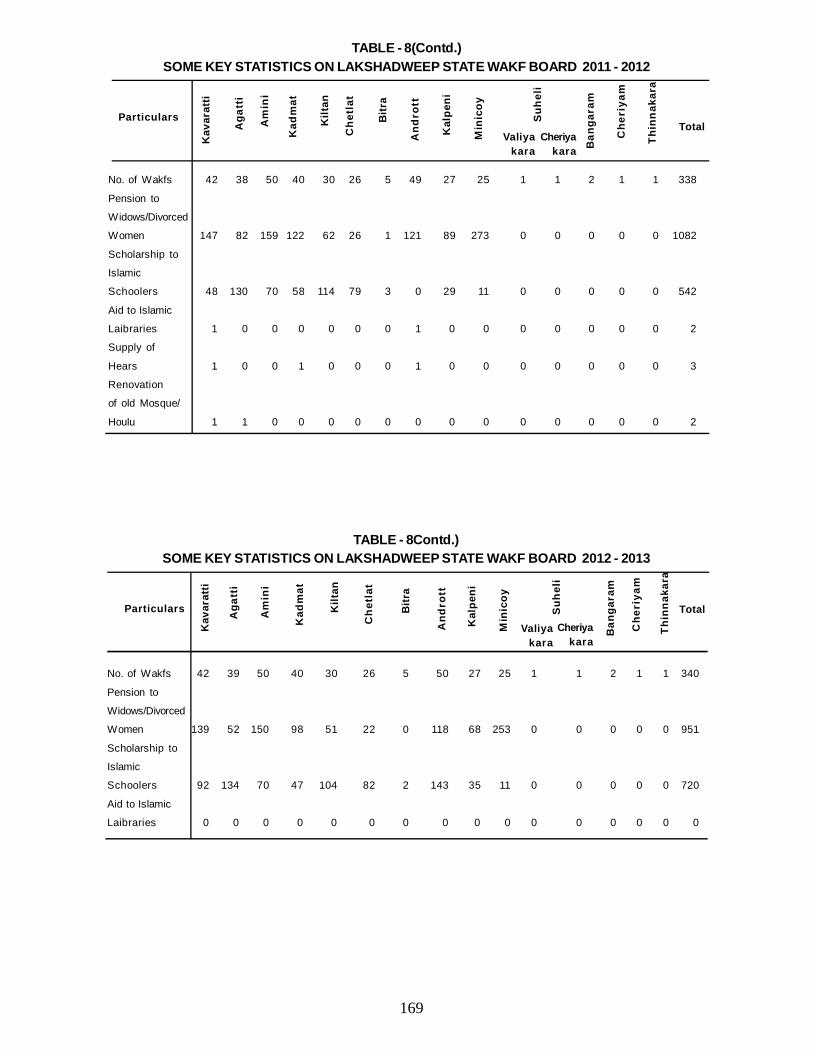
169
TABLE - 8(Contd.)SOME KEY STATISTICS ON LAKSHADWEEP STATE WAKF BOARD 2011 - 2012
No. of Wakfs 42 38 50 40 30 26 5 49 27 25 1 1 2 1 1 338
Pension to
Widows/Divorced
Women 147 82 159 122 62 26 1 121 89 273 0 0 0 0 0 1082
Scholarship to
Islamic
Schoolers 48 130 70 58 114 79 3 0 29 11 0 0 0 0 0 542
Aid to Islamic
Laibraries 1 0 0 0 0 0 0 1 0 0 0 0 0 0 0 2
Supply of
Hears 1 0 0 1 0 0 0 1 0 0 0 0 0 0 0 3
Renovation
of old Mosque/
Houlu 1 1 0 0 0 0 0 0 0 0 0 0 0 0 0 2
Particulars
Kav
arat
ti
Aga
tti
Am
ini
Kad
mat
Kilt
an
Che
tlat
Bitr
a
And
rott
Kal
peni
Min
icoy
Suh
eli
Ban
gara
m
Che
riya
m
TotalValiya
kara
Thin
naka
ra
Cheriyakara
No. of Wakfs 42 39 50 40 30 26 5 50 27 25 1 1 2 1 1 340
Pension to
Widows/Divorced
Women 139 52 150 98 51 22 0 118 68 253 0 0 0 0 0 951
Scholarship to
Islamic
Schoolers 92 134 70 47 104 82 2 143 35 11 0 0 0 0 0 720
Aid to Islamic
Laibraries 0 0 0 0 0 0 0 0 0 0 0 0 0 0 0 0
TABLE - 8Contd.)SOME KEY STATISTICS ON LAKSHADWEEP STATE WAKF BOARD 2012 - 2013
Particulars
Kav
arat
ti
Aga
tti
Am
ini
Kad
mat
Kilt
an
Che
tlat
Bitr
a
And
rott
Kal
peni
Min
icoy
Suh
eli
Ban
gara
m
Che
riya
m
Total
Valiyakara
Thin
naka
ra
Cheriyakara
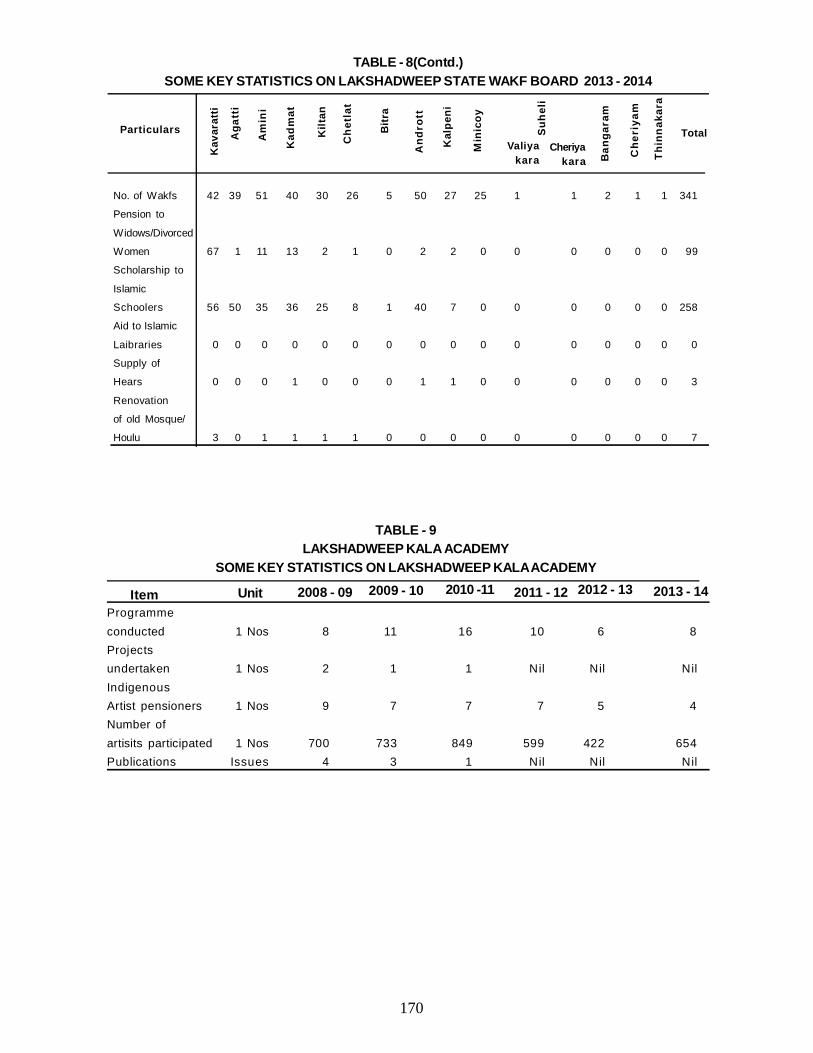
170
No. of Wakfs 42 39 51 40 30 26 5 50 27 25 1 1 2 1 1 341
Pension to
Widows/Divorced
Women 67 1 11 13 2 1 0 2 2 0 0 0 0 0 0 99
Scholarship to
Islamic
Schoolers 56 50 35 36 25 8 1 40 7 0 0 0 0 0 0 258
Aid to Islamic
Laibraries 0 0 0 0 0 0 0 0 0 0 0 0 0 0 0 0
Supply of
Hears 0 0 0 1 0 0 0 1 1 0 0 0 0 0 0 3
Renovation
of old Mosque/
Houlu 3 0 1 1 1 1 0 0 0 0 0 0 0 0 0 7
TABLE - 8(Contd.)SOME KEY STATISTICS ON LAKSHADWEEP STATE WAKF BOARD 2013 - 2014
Particulars
Kav
arat
ti
Aga
tti
Am
ini
Kad
mat
Kilt
an
Che
tlat
Bitr
a
And
rott
Kal
peni
Min
icoy
Suh
eli
Ban
gara
m
Che
riya
m
TotalValiya
kara Thin
naka
ra
Cheriyakara
Programmeconducted 1 Nos 8 11 16 10 6 8Projectsundertaken 1 Nos 2 1 1 Nil Nil NilIndigenousArtist pensioners 1 Nos 9 7 7 7 5 4Number ofartisits participated 1 Nos 700 733 849 599 422 654Publications Issues 4 3 1 Nil Nil Nil
TABLE - 9LAKSHADWEEP KALA ACADEMY
SOME KEY STATISTICS ON LAKSHADWEEP KALA ACADEMY
Item Unit 2008 - 09 2009 - 10 2010 -11 2011 - 12 2012 - 13 2013 - 14
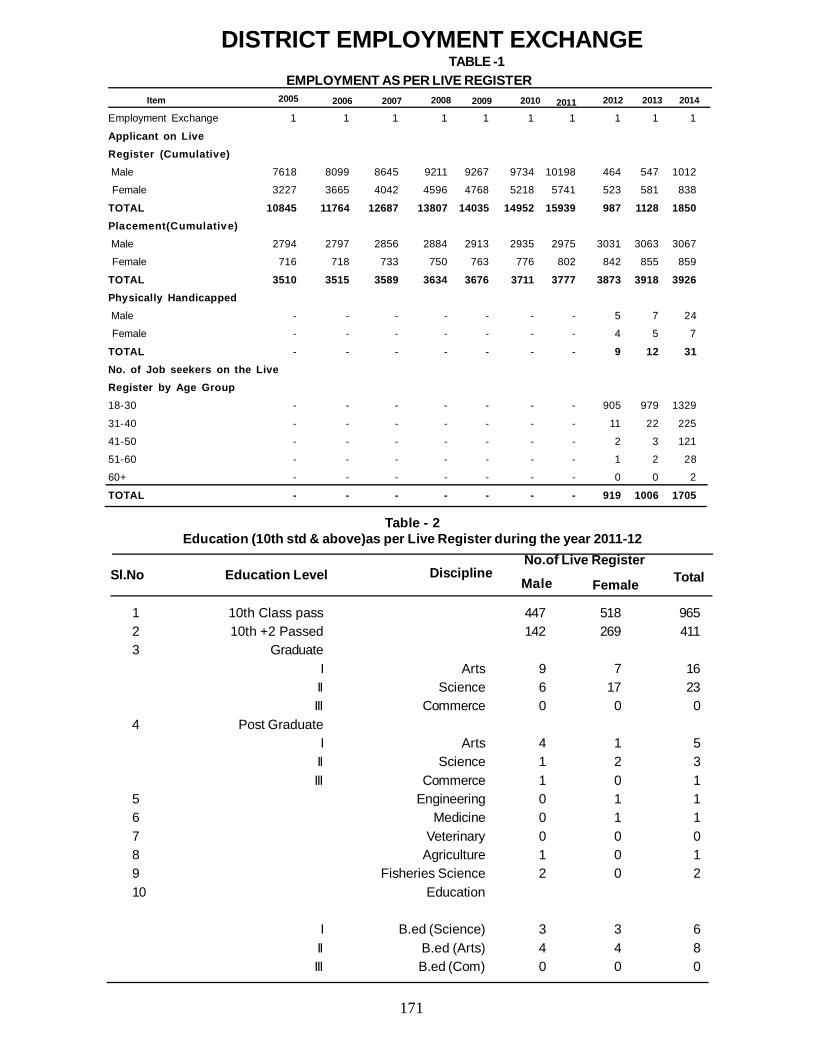
171
DISTRICT EMPLOYMENT EXCHANGETABLE -1
EMPLOYMENT AS PER LIVE REGISTER
Employment Exchange 1 1 1 1 1 1 1 1 1 1
Applicant on LiveRegister (Cumulative) Male 7618 8099 8645 9211 9267 9734 10198 464 547 1012
Female 3227 3665 4042 4596 4768 5218 5741 523 581 838
TOTAL 10845 11764 12687 13807 14035 14952 15939 987 1128 1850Placement(Cumulative) Male 2794 2797 2856 2884 2913 2935 2975 3031 3063 3067
Female 716 718 733 750 763 776 802 842 855 859
TOTAL 3510 3515 3589 3634 3676 3711 3777 3873 3918 3926Physically Handicapped Male - - - - - - - 5 7 24
Female - - - - - - - 4 5 7
TOTAL - - - - - - - 9 12 31No. of Job seekers on the LiveRegister by Age Group18-30 - - - - - - - 905 979 1329
31-40 - - - - - - - 11 22 225
41-50 - - - - - - - 2 3 121
51-60 - - - - - - - 1 2 28
60+ - - - - - - - 0 0 2
TOTAL - - - - - - - 919 1006 1705
Item 2005 2006 2007 2008 2009 2010 2011 2012 2013 2014
1 10th Class pass 447 518 9652 10th +2 Passed 142 269 4113 Graduate
I Arts 9 7 16II Science 6 17 23III Commerce 0 0 0
4 Post GraduateI Arts 4 1 5II Science 1 2 3III Commerce 1 0 1
5 Engineering 0 1 16 Medicine 0 1 17 Veterinary 0 0 08 Agriculture 1 0 19 Fisheries Science 2 0 210 Education
I B.ed (Science) 3 3 6II B.ed (Arts) 4 4 8III B.ed (Com) 0 0 0
Table - 2Education (10th std & above)as per Live Register during the year 2011-12
Sl.No Education LevelNo.of Live Register
DisciplineMale Female Total
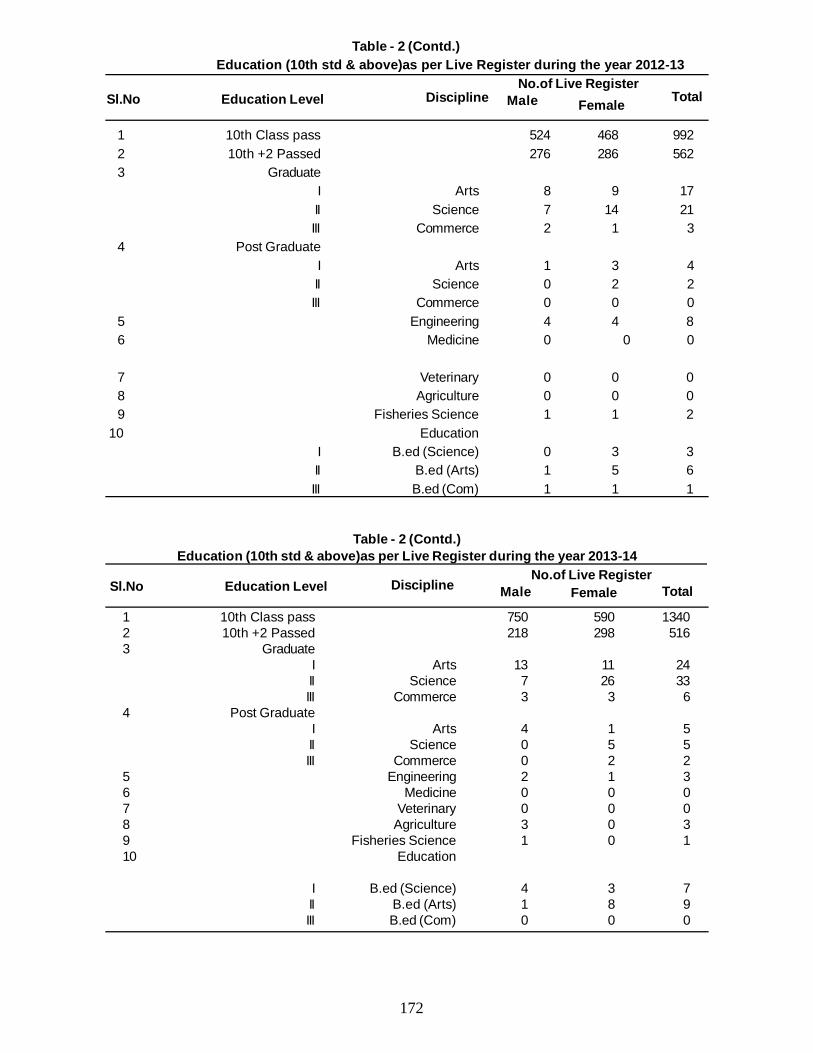
172
1 10th Class pass 750 590 13402 10th +2 Passed 218 298 5163 Graduate
I Arts 13 11 24II Science 7 26 33III Commerce 3 3 6
4 Post GraduateI Arts 4 1 5II Science 0 5 5III Commerce 0 2 2
5 Engineering 2 1 36 Medicine 0 0 07 Veterinary 0 0 08 Agriculture 3 0 39 Fisheries Science 1 0 110 Education
I B.ed (Science) 4 3 7II B.ed (Arts) 1 8 9III B.ed (Com) 0 0 0
Table - 2 (Contd.)Education (10th std & above)as per Live Register during the year 2013-14
Sl.No Education LevelNo.of Live Register
Male Female TotalDiscipline
1 10th Class pass 524 468 9922 10th +2 Passed 276 286 5623 Graduate
I Arts 8 9 17II Science 7 14 21III Commerce 2 1 3
4 Post GraduateI Arts 1 3 4II Science 0 2 2III Commerce 0 0 0
5 Engineering 4 4 86 Medicine 0 0 0
7 Veterinary 0 0 08 Agriculture 0 0 09 Fisheries Science 1 1 2
10 EducationI B.ed (Science) 0 3 3II B.ed (Arts) 1 5 6III B.ed (Com) 1 1 1
Table - 2 (Contd.) Education (10th std & above)as per Live Register during the year 2012-13
Sl.No Education LevelNo.of Live Register
Discipline Male Female Total
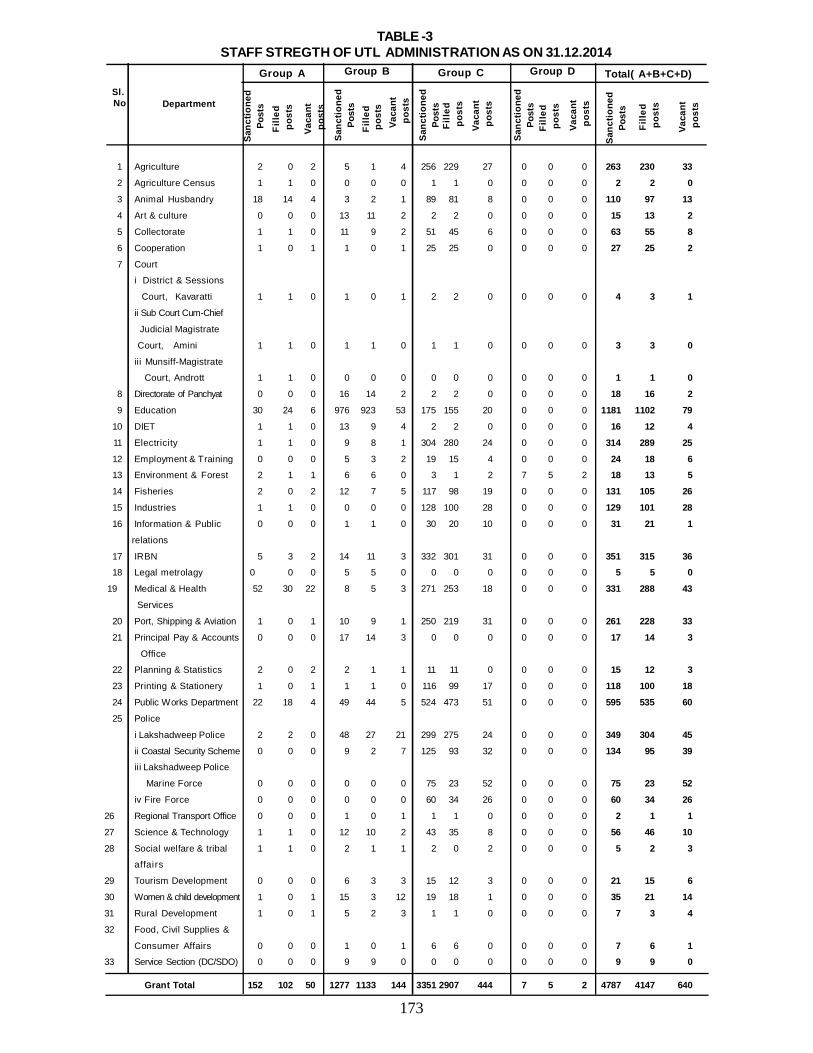
173
1 Agriculture 2 0 2 5 1 4 256 229 27 0 0 0 263 230 33
2 Agriculture Census 1 1 0 0 0 0 1 1 0 0 0 0 2 2 0
3 Animal Husbandry 18 14 4 3 2 1 89 81 8 0 0 0 110 97 13
4 Art & culture 0 0 0 13 11 2 2 2 0 0 0 0 15 13 2
5 Collectorate 1 1 0 11 9 2 51 45 6 0 0 0 63 55 8
6 Cooperation 1 0 1 1 0 1 25 25 0 0 0 0 27 25 2
7 Court
i District & Sessions
Court, Kavaratti 1 1 0 1 0 1 2 2 0 0 0 0 4 3 1
ii Sub Court Cum-Chief
Judicial Magistrate
Court, Amini 1 1 0 1 1 0 1 1 0 0 0 0 3 3 0
iii Munsiff-Magistrate
Court, Andrott 1 1 0 0 0 0 0 0 0 0 0 0 1 1 0
8 Directorate of Panchyat 0 0 0 16 14 2 2 2 0 0 0 0 18 16 2
9 Education 30 24 6 976 923 53 175 155 20 0 0 0 1181 1102 79
10 DIET 1 1 0 13 9 4 2 2 0 0 0 0 16 12 4
11 Electricity 1 1 0 9 8 1 304 280 24 0 0 0 314 289 25
12 Employment & Training 0 0 0 5 3 2 19 15 4 0 0 0 24 18 613 Environment & Forest 2 1 1 6 6 0 3 1 2 7 5 2 18 13 5
14 Fisheries 2 0 2 12 7 5 117 98 19 0 0 0 131 105 26
15 Industries 1 1 0 0 0 0 128 100 28 0 0 0 129 101 28
16 Information & Public 0 0 0 1 1 0 30 20 10 0 0 0 31 21 1
relations
17 IRBN 5 3 2 14 11 3 332 301 31 0 0 0 351 315 3618 Legal metrolagy 0 0 0 5 5 0 0 0 0 0 0 0 5 5 0
19 Medical & Health 52 30 22 8 5 3 271 253 18 0 0 0 331 288 43
Services
20 Port, Shipping & Aviation 1 0 1 10 9 1 250 219 31 0 0 0 261 228 33
21 Principal Pay & Accounts 0 0 0 17 14 3 0 0 0 0 0 0 17 14 3
Office
22 Planning & Statistics 2 0 2 2 1 1 11 11 0 0 0 0 15 12 3
23 Printing & Stationery 1 0 1 1 1 0 116 99 17 0 0 0 118 100 18
24 Public Works Department 22 18 4 49 44 5 524 473 51 0 0 0 595 535 60
25 Police
i Lakshadweep Police 2 2 0 48 27 21 299 275 24 0 0 0 349 304 45
ii Coastal Security Scheme 0 0 0 9 2 7 125 93 32 0 0 0 134 95 39iii Lakshadweep Police
Marine Force 0 0 0 0 0 0 75 23 52 0 0 0 75 23 52
iv Fire Force 0 0 0 0 0 0 60 34 26 0 0 0 60 34 26
26 Regional Transport Office 0 0 0 1 0 1 1 1 0 0 0 0 2 1 1
27 Science & Technology 1 1 0 12 10 2 43 35 8 0 0 0 56 46 10
28 Social welfare & tribal 1 1 0 2 1 1 2 0 2 0 0 0 5 2 3affairs
29 Tourism Development 0 0 0 6 3 3 15 12 3 0 0 0 21 15 6
30 Women & child development 1 0 1 15 3 12 19 18 1 0 0 0 35 21 14
31 Rural Development 1 0 1 5 2 3 1 1 0 0 0 0 7 3 4
32 Food, Civil Supplies &
Consumer Affairs 0 0 0 1 0 1 6 6 0 0 0 0 7 6 133 Service Section (DC/SDO) 0 0 0 9 9 0 0 0 0 0 0 0 9 9 0
Grant Total 152 102 50 1277 1133 144 3351 2907 444 7 5 2 4787 4147 640
TABLE -3STAFF STREGTH OF UTL ADMINISTRATION AS ON 31.12.2014
Group A
DepartmentSl. No
Group C Group D Total( A+B+C+D)Group B
Vaca
nt p
osts
Fille
d p
osts
Sanc
tione
dPo
sts
Vaca
nt p
osts
Fille
d p
osts
Sanc
tione
dPo
sts
Sanc
tione
dPo
sts
Sanc
tione
dPo
sts
Sanc
tione
dPo
sts
Fille
d p
osts
Fille
d p
osts
Fille
d p
osts
Vaca
nt p
osts
Vaca
nt p
osts
Vaca
nt p
osts
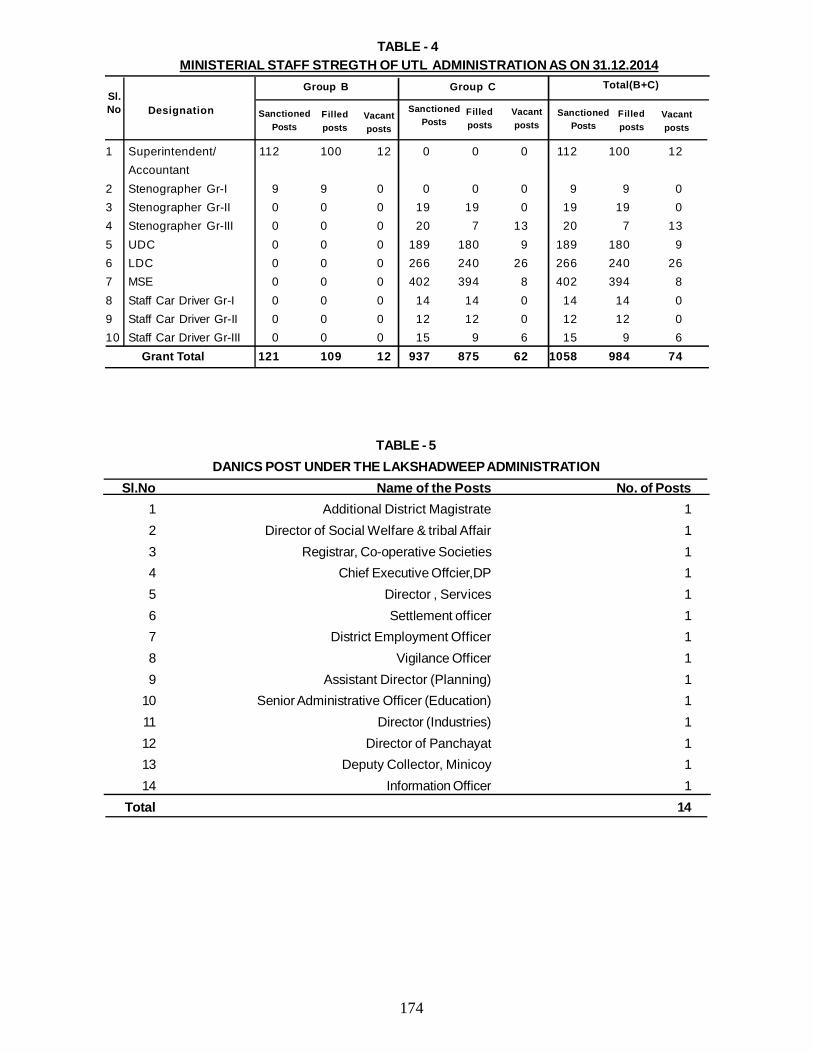
174
1 Superintendent/ 112 100 12 0 0 0 112 100 12Accountant
2 Stenographer Gr-I 9 9 0 0 0 0 9 9 03 Stenographer Gr-II 0 0 0 19 19 0 19 19 04 Stenographer Gr-III 0 0 0 20 7 13 20 7 135 UDC 0 0 0 189 180 9 189 180 96 LDC 0 0 0 266 240 26 266 240 267 MSE 0 0 0 402 394 8 402 394 88 Staff Car Driver Gr-I 0 0 0 14 14 0 14 14 09 Staff Car Driver Gr-II 0 0 0 12 12 0 12 12 010 Staff Car Driver Gr-III 0 0 0 15 9 6 15 9 6 Grant Total 121 109 12 937 875 62 1058 984 74
TABLE - 4MINISTERIAL STAFF STREGTH OF UTL ADMINISTRATION AS ON 31.12.2014
Sl.No Designation
Group B Group C Total(B+C)
Filledposts
Vacantposts
SanctionedPosts
SanctionedPosts
SanctionedPosts
Filledposts
Filledposts
Vacantposts
Vacantposts
TABLE - 5DANICS POST UNDER THE LAKSHADWEEP ADMINISTRATION
Sl.No Name of the Posts No. of Posts1 Additional District Magistrate 12 Director of Social Welfare & tribal Affair 13 Registrar, Co-operative Societies 14 Chief Executive Offcier,DP 15 Director , Services 16 Settlement officer 17 District Employment Officer 18 Vigilance Officer 19 Assistant Director (Planning) 1
10 Senior Administrative Officer (Education) 111 Director (Industries) 112 Director of Panchayat 113 Deputy Collector, Minicoy 114 Information Officer 1
Total 14
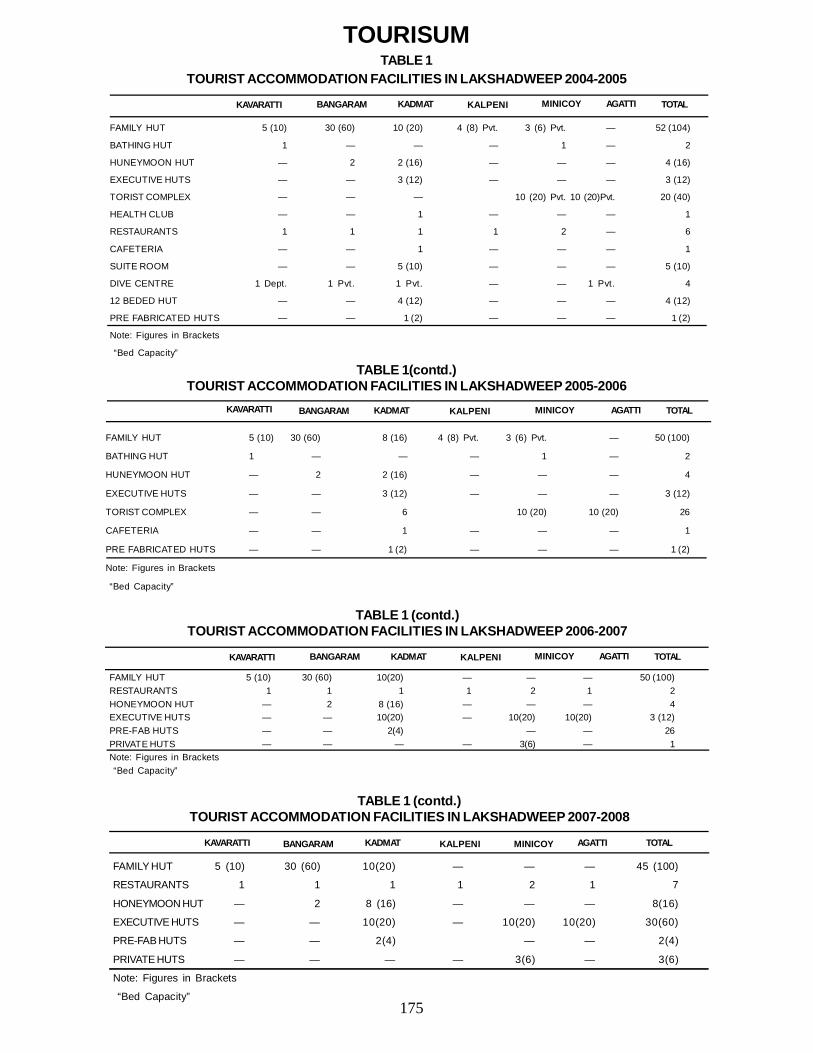
175
TOURISUMTABLE 1
TOURIST ACCOMMODATION FACILITIES IN LAKSHADWEEP 2004-2005
KAVARATTI BANGARAM KADMAT KALPENI MINICOY AGATTI TOTAL
FAMILY HUT 5 (10) 30 (60) 10 (20) 4 (8) Pvt. 3 (6) Pvt. — 52 (104)
BATHING HUT 1 — — — 1 — 2
HUNEYMOON HUT — 2 2 (16) — — — 4 (16)
EXECUTIVE HUTS — — 3 (12) — — — 3 (12)
TORIST COMPLEX — — — 10 (20) Pvt. 10 (20)Pvt. 20 (40)
HEALTH CLUB — — 1 — — — 1
RESTAURANTS 1 1 1 1 2 — 6
CAFETERIA — — 1 — — — 1
SUITE ROOM — — 5 (10) — — — 5 (10)
DIVE CENTRE 1 Dept. 1 Pvt. 1 Pvt. — — 1 Pvt. 4
12 BEDED HUT — — 4 (12) — — — 4 (12)
PRE FABRICATED HUTS — — 1 (2) — — — 1 (2)
Note: Figures in Brackets
“Bed Capacity”
FAMILY HUT 5 (10) 30 (60) 10(20) — — — 45 (100)
RESTAURANTS 1 1 1 1 2 1 7
HONEYMOON HUT — 2 8 (16) — — — 8(16)
EXECUTIVE HUTS — — 10(20) — 10(20) 10(20) 30(60)
PRE-FAB HUTS — — 2(4) — — 2(4)
PRIVATE HUTS — — — — 3(6) — 3(6)
Note: Figures in Brackets
“Bed Capacity”
TABLE 1 (contd.)TOURIST ACCOMMODATION FACILITIES IN LAKSHADWEEP 2007-2008
KAVARATTI BANGARAM KADMAT KALPENI MINICOY AGATTI TOTAL
FAMILY HUT 5 (10) 30 (60) 10(20) — — — 50 (100)RESTAURANTS 1 1 1 1 2 1 2HONEYMOON HUT — 2 8 (16) — — — 4EXECUTIVE HUTS — — 10(20) — 10(20) 10(20) 3 (12)PRE-FAB HUTS — — 2(4) — — 26PRIVATE HUTS — — — — 3(6) — 1Note: Figures in Brackets “Bed Capacity”
TABLE 1 (contd.)TOURIST ACCOMMODATION FACILITIES IN LAKSHADWEEP 2006-2007
KAVARATTI BANGARAM KADMAT KALPENI MINICOY AGATTI TOTAL
FAMILY HUT 5 (10) 30 (60) 8 (16) 4 (8) Pvt. 3 (6) Pvt. — 50 (100)
BATHING HUT 1 — — — 1 — 2
HUNEYMOON HUT — 2 2 (16) — — — 4
EXECUTIVE HUTS — — 3 (12) — — — 3 (12)
TORIST COMPLEX — — 6 10 (20) 10 (20) 26
CAFETERIA — — 1 — — — 1
PRE FABRICATED HUTS — — 1 (2) — — — 1 (2)
Note: Figures in Brackets
“Bed Capacity”
TABLE 1(contd.)TOURIST ACCOMMODATION FACILITIES IN LAKSHADWEEP 2005-2006
KAVARATTI BANGARAM KADMAT KALPENI MINICOY AGATTI TOTAL
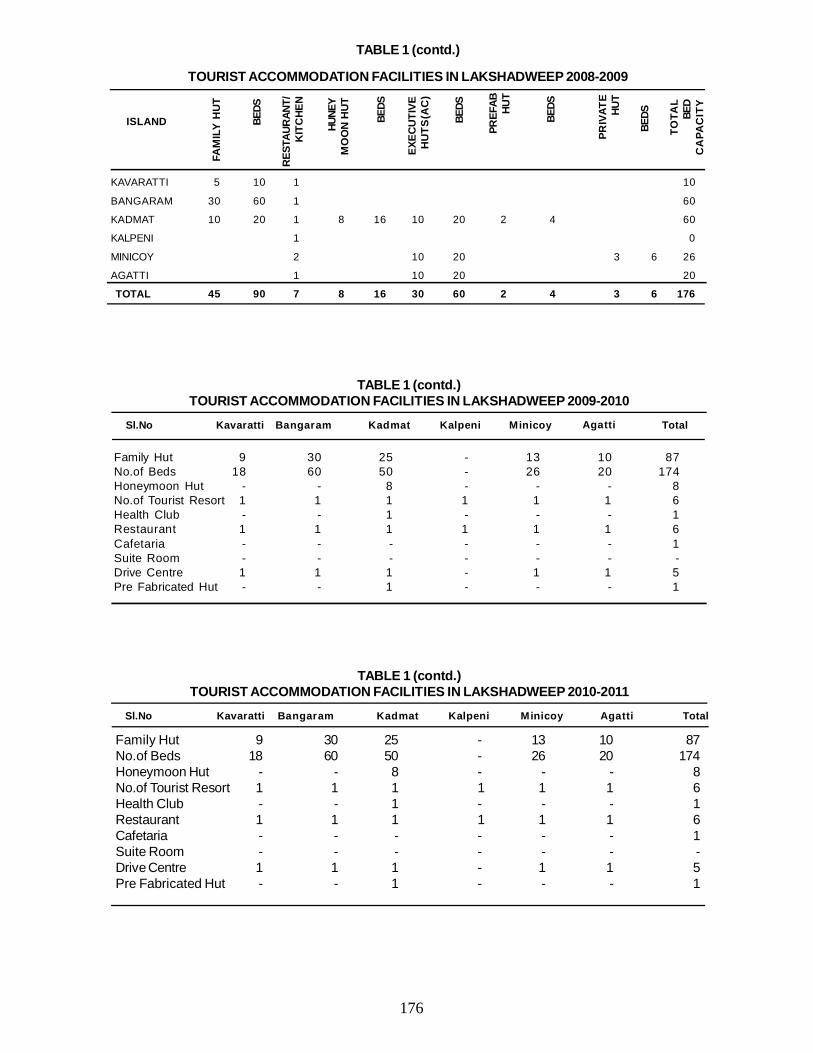
176
KAVARATTI 5 10 1 10
BANGARAM 30 60 1 60
KADMAT 10 20 1 8 16 10 20 2 4 60
KALPENI 1 0
MINICOY 2 10 20 3 6 26
AGATTI 1 10 20 20
TOTAL 45 90 7 8 16 30 60 2 4 3 6 176
TABLE 1 (contd.)
TOURIST ACCOMMODATION FACILITIES IN LAKSHADWEEP 2008-2009
ISLAND
FAM
ILY
HU
T
BEDS
RES
TAUR
ANT/
KIT
CHE
N
HUNE
YM
OO
N H
UT
BEDS
EXEC
UTI
VEH
UTS
(AC
)
BEDS
PREF
AB HUT
BEDS
PRIV
ATE
HUT
TOTA
LBE
DC
APA
CIT
Y
BEDS
Family Hut 9 30 25 - 13 10 87No.of Beds 18 60 50 - 26 20 174Honeymoon Hut - - 8 - - - 8No.of Tourist Resort 1 1 1 1 1 1 6Health Club - - 1 - - - 1Restaurant 1 1 1 1 1 1 6Cafetaria - - - - - - 1Suite Room - - - - - - -Drive Centre 1 1 1 - 1 1 5Pre Fabricated Hut - - 1 - - - 1
TABLE 1 (contd.)TOURIST ACCOMMODATION FACILITIES IN LAKSHADWEEP 2010-2011
Sl.No Kavaratti Bangaram Kadmat Kalpeni Minicoy Agatti Total
Family Hut 9 30 25 - 13 10 87No.of Beds 18 60 50 - 26 20 174Honeymoon Hut - - 8 - - - 8No.of Tourist Resort 1 1 1 1 1 1 6Health Club - - 1 - - - 1Restaurant 1 1 1 1 1 1 6Cafetaria - - - - - - 1Suite Room - - - - - - -Drive Centre 1 1 1 - 1 1 5Pre Fabricated Hut - - 1 - - - 1
TABLE 1 (contd.)TOURIST ACCOMMODATION FACILITIES IN LAKSHADWEEP 2009-2010
Sl.No Kavaratti Bangaram Kadmat Kalpeni Minicoy Agatti Total
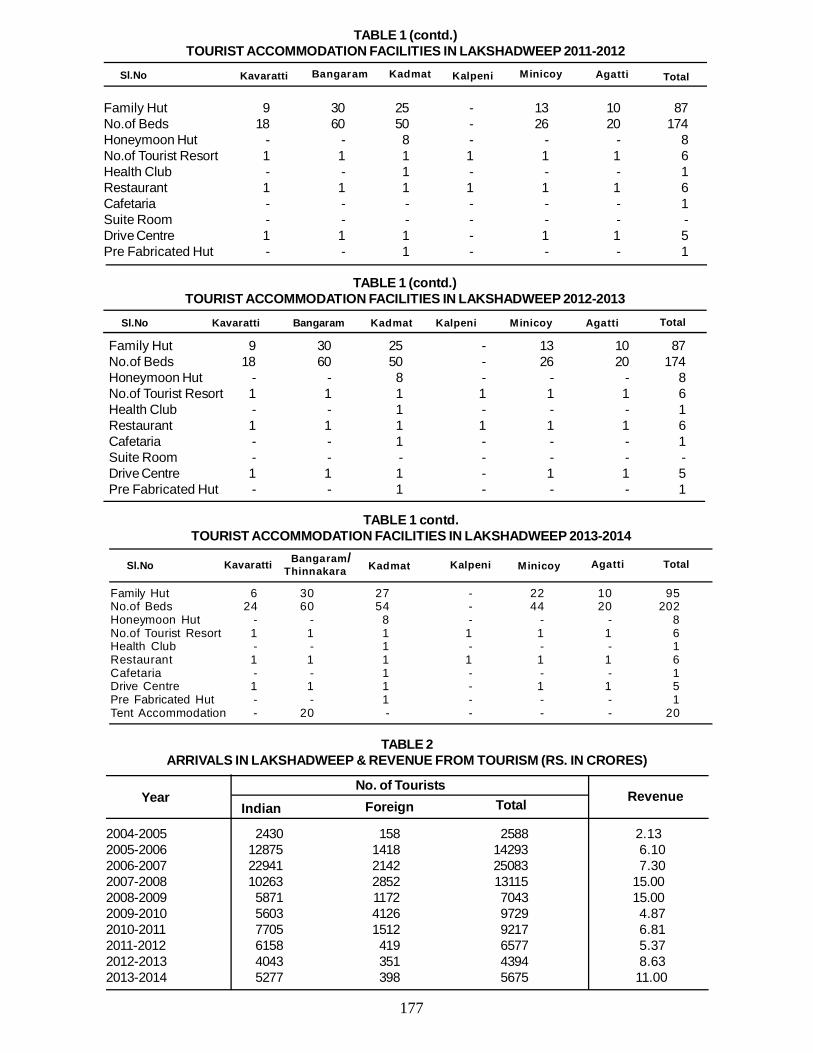
177
Family Hut 9 30 25 - 13 10 87No.of Beds 18 60 50 - 26 20 174Honeymoon Hut - - 8 - - - 8No.of Tourist Resort 1 1 1 1 1 1 6Health Club - - 1 - - - 1Restaurant 1 1 1 1 1 1 6Cafetaria - - - - - - 1Suite Room - - - - - - -Drive Centre 1 1 1 - 1 1 5Pre Fabricated Hut - - 1 - - - 1
TABLE 1 (contd.)TOURIST ACCOMMODATION FACILITIES IN LAKSHADWEEP 2011-2012
Sl.No Kavaratti Bangaram Kadmat Kalpeni Minicoy Agatti Total
Family Hut 9 30 25 - 13 10 87No.of Beds 18 60 50 - 26 20 174Honeymoon Hut - - 8 - - - 8No.of Tourist Resort 1 1 1 1 1 1 6Health Club - - 1 - - - 1Restaurant 1 1 1 1 1 1 6Cafetaria - - 1 - - - 1Suite Room - - - - - - -Drive Centre 1 1 1 - 1 1 5Pre Fabricated Hut - - 1 - - - 1
TABLE 1 (contd.)TOURIST ACCOMMODATION FACILITIES IN LAKSHADWEEP 2012-2013
Sl.No Kavaratti Bangaram Kadmat Kalpeni Minicoy Agatti Total
Family Hut 6 30 27 - 22 10 95No.of Beds 24 60 54 - 44 20 202Honeymoon Hut - - 8 - - - 8No.of Tourist Resort 1 1 1 1 1 1 6Health Club - - 1 - - - 1Restaurant 1 1 1 1 1 1 6Cafetaria - - 1 - - - 1Drive Centre 1 1 1 - 1 1 5Pre Fabricated Hut - - 1 - - - 1Tent Accommodation - 20 - - - - 20
TABLE 1 contd.TOURIST ACCOMMODATION FACILITIES IN LAKSHADWEEP 2013-2014
Sl.No Kavaratti Kadmat Kalpeni Minicoy Agatti TotalBangaram/Thinnakara
2004-2005 2430 158 2588 2.132005-2006 12875 1418 14293 6.102006-2007 22941 2142 25083 7.302007-2008 10263 2852 13115 15.002008-2009 5871 1172 7043 15.002009-2010 5603 4126 9729 4.872010-2011 7705 1512 9217 6.812011-2012 6158 419 6577 5.372012-2013 4043 351 4394 8.632013-2014 5277 398 5675 11.00
TABLE 2ARRIVALS IN LAKSHADWEEP & REVENUE FROM TOURISM (RS. IN CRORES)
YearNo. of Tourists
RevenueIndian Foreign Total
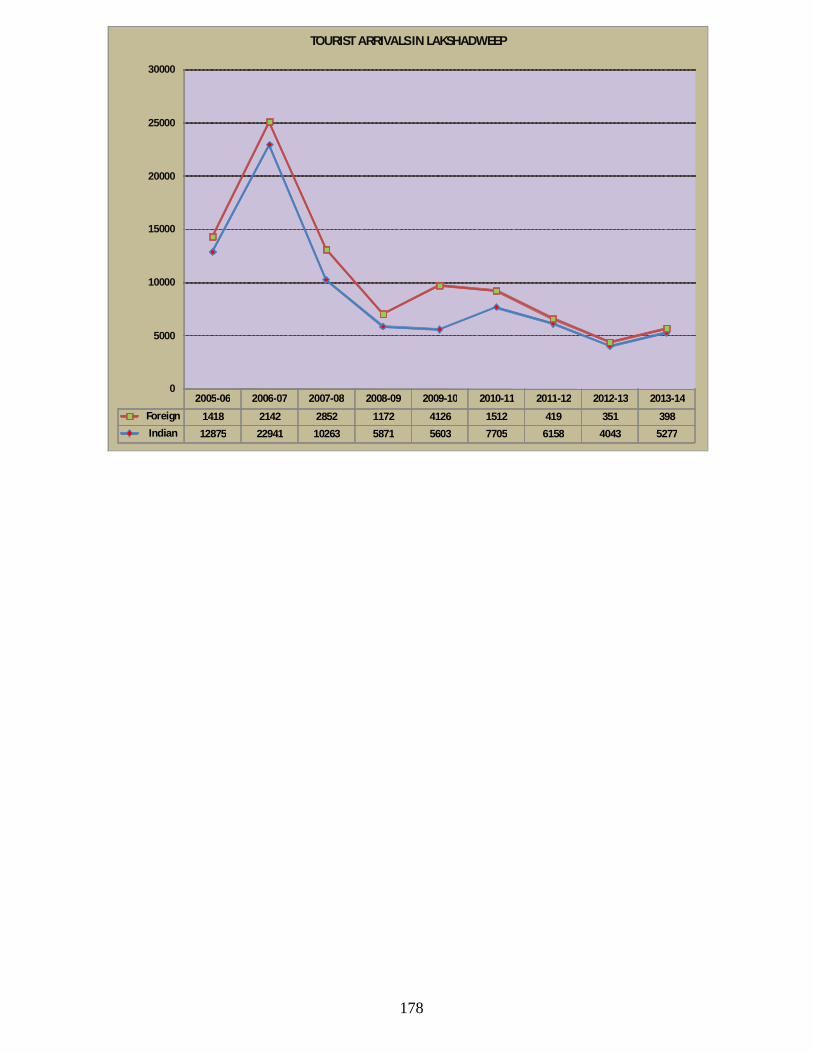
178
2005-06 2006-07 2007-08 2008-09 2009-10 2010-11 2011-12 2012-13 2013-14
Foreign 1418 2142 2852 1172 4126 1512 419 351 398Indian 12875 22941 10263 5871 5603 7705 6158 4043 5277
0
5000
10000
15000
20000
25000
30000
TOURIST ARRIVALS IN LAKSHADWEEP
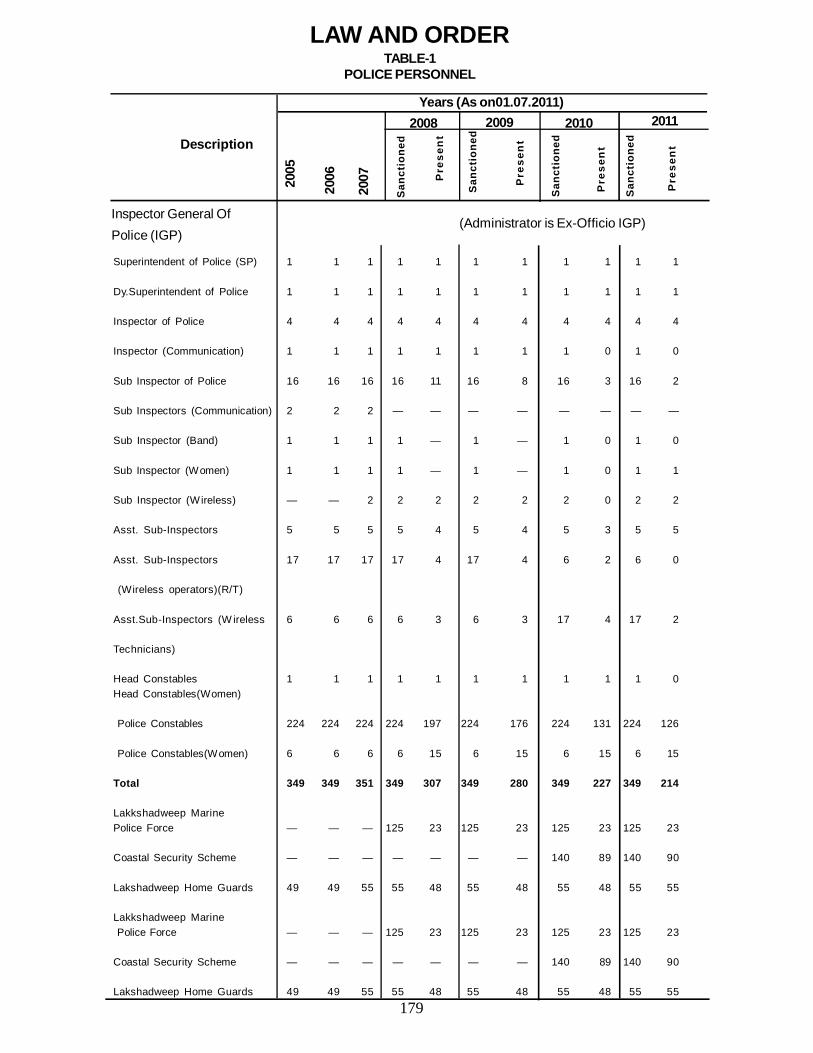
179
Superintendent of Police (SP) 1 1 1 1 1 1 1 1 1 1 1
Dy.Superintendent of Police 1 1 1 1 1 1 1 1 1 1 1
Inspector of Police 4 4 4 4 4 4 4 4 4 4 4
Inspector (Communication) 1 1 1 1 1 1 1 1 0 1 0
Sub Inspector of Police 16 16 16 16 11 16 8 16 3 16 2
Sub Inspectors (Communication) 2 2 2 — — — — — — — —
Sub Inspector (Band) 1 1 1 1 — 1 — 1 0 1 0
Sub Inspector (Women) 1 1 1 1 — 1 — 1 0 1 1
Sub Inspector (Wireless) — — 2 2 2 2 2 2 0 2 2
Asst. Sub-Inspectors 5 5 5 5 4 5 4 5 3 5 5
Asst. Sub-Inspectors 17 17 17 17 4 17 4 6 2 6 0
(Wireless operators)(R/T)
Asst.Sub-Inspectors (W ireless 6 6 6 6 3 6 3 17 4 17 2
Technicians)
Head Constables 1 1 1 1 1 1 1 1 1 1 0Head Constables(Women)
Police Constables 224 224 224 224 197 224 176 224 131 224 126
Police Constables(Women) 6 6 6 6 15 6 15 6 15 6 15
Total 349 349 351 349 307 349 280 349 227 349 214
Lakkshadweep MarinePolice Force — — — 125 23 125 23 125 23 125 23
Coastal Security Scheme — — — — — — — 140 89 140 90
Lakshadweep Home Guards 49 49 55 55 48 55 48 55 48 55 55
Lakkshadweep Marine Police Force — — — 125 23 125 23 125 23 125 23
Coastal Security Scheme — — — — — — — 140 89 140 90
Lakshadweep Home Guards 49 49 55 55 48 55 48 55 48 55 55
LAW AND ORDERTABLE-1
POLICE PERSONNEL
Inspector General OfPolice (IGP)
(Administrator is Ex-Officio IGP)
Description
Years (As on01.07.2011)
2005
2006
2007
2008
San
ctio
ned
Pre
sen
t
2009
San
ctio
ned
San
ctio
ned
San
ctio
ned
Pre
sen
t
Pre
sen
t
Pre
sen
t
20112010
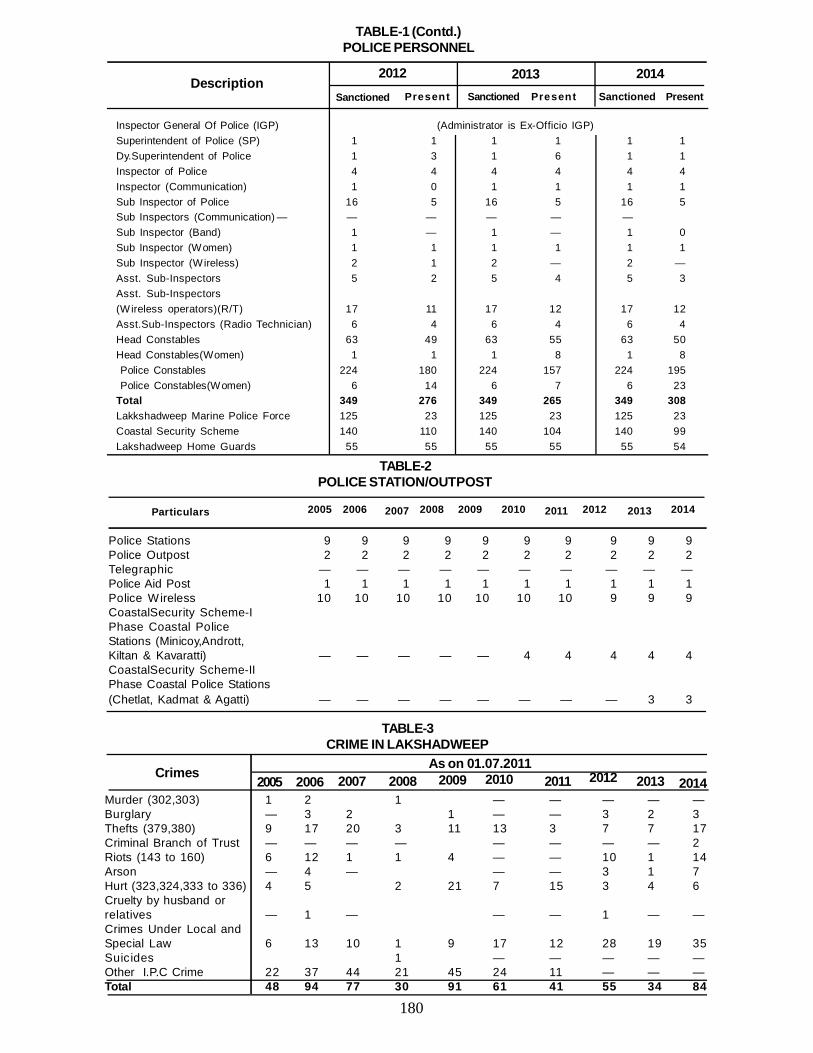
180
Police Stations 9 9 9 9 9 9 9 9 9 9Police Outpost 2 2 2 2 2 2 2 2 2 2Telegraphic — — — — — — — — — —Police Aid Post 1 1 1 1 1 1 1 1 1 1Police Wireless 10 10 10 10 10 10 10 9 9 9CoastalSecurity Scheme-IPhase Coastal PoliceStations (Minicoy,Andrott,Kiltan & Kavaratti) — — — — — 4 4 4 4 4CoastalSecurity Scheme-IIPhase Coastal Police Stations(Chetlat, Kadmat & Agatti) — — — — — — — — 3 3
TABLE-2POLICE STATION/OUTPOST
Particulars 20132005 2006 2007 2008 2009 2010 2011 2012 2014
Murder (302,303) 1 2 1 — — — — —Burglary — 3 2 1 — — 3 2 3Thefts (379,380) 9 17 20 3 11 13 3 7 7 17Criminal Branch of Trust — — — — — — — — 2Riots (143 to 160) 6 12 1 1 4 — — 10 1 14Arson — 4 — — — 3 1 7Hurt (323,324,333 to 336) 4 5 2 21 7 15 3 4 6Cruelty by husband orrelatives — 1 — — — 1 — —Crimes Under Local andSpecial Law 6 13 10 1 9 17 12 28 19 35Suicides 1 — — — — —Other I.P.C Crime 22 37 44 21 45 24 11 — — —Total 48 94 77 30 91 61 41 55 34 84
TABLE-3CRIME IN LAKSHADWEEP
Crimes As on 01.07.20112005 2006 2007 2008 2009 2010 2011 2012 2013 2014
Inspector General Of Police (IGP) (Administrator is Ex-Officio IGP)Superintendent of Police (SP) 1 1 1 1 1 1Dy.Superintendent of Police 1 3 1 6 1 1Inspector of Police 4 4 4 4 4 4Inspector (Communication) 1 0 1 1 1 1Sub Inspector of Police 16 5 16 5 16 5Sub Inspectors (Communication) — — — — — —Sub Inspector (Band) 1 — 1 — 1 0Sub Inspector (Women) 1 1 1 1 1 1Sub Inspector (Wireless) 2 1 2 — 2 —Asst. Sub-Inspectors 5 2 5 4 5 3Asst. Sub-Inspectors(Wireless operators)(R/T) 17 11 17 12 17 12Asst.Sub-Inspectors (Radio Technician) 6 4 6 4 6 4Head Constables 63 49 63 55 63 50Head Constables(Women) 1 1 1 8 1 8 Police Constables 224 180 224 157 224 195 Police Constables(Women) 6 14 6 7 6 23Total 349 276 349 265 349 308Lakkshadweep Marine Police Force 125 23 125 23 125 23Coastal Security Scheme 140 110 140 104 140 99Lakshadweep Home Guards 55 55 55 55 55 54
TABLE-1 (Contd.)POLICE PERSONNEL
DescriptionSanctioned
2012Sanctioned PresentSanctionedPresent
2013 2014Present
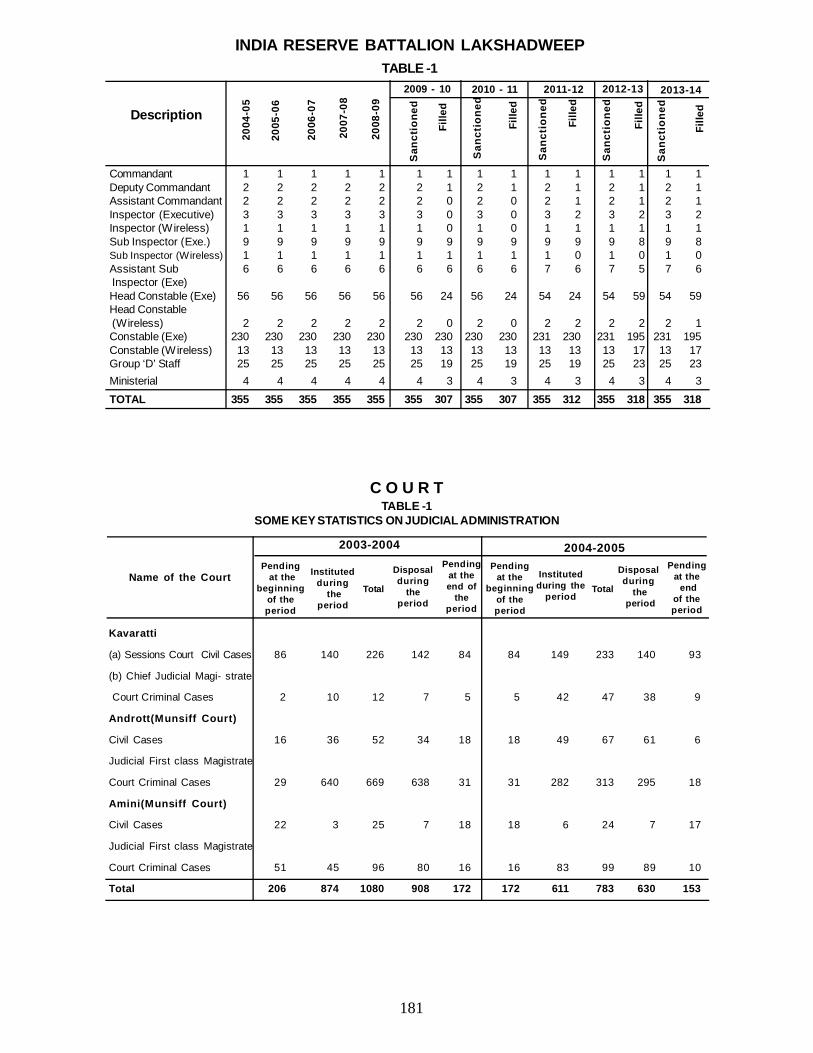
181
INDIA RESERVE BATTALION LAKSHADWEEPTABLE -1
Commandant 1 1 1 1 1 1 1 1 1 1 1 1 1 1 1Deputy Commandant 2 2 2 2 2 2 1 2 1 2 1 2 1 2 1Assistant Commandant 2 2 2 2 2 2 0 2 0 2 1 2 1 2 1Inspector (Executive) 3 3 3 3 3 3 0 3 0 3 2 3 2 3 2Inspector (Wireless) 1 1 1 1 1 1 0 1 0 1 1 1 1 1 1Sub Inspector (Exe.) 9 9 9 9 9 9 9 9 9 9 9 9 8 9 8Sub Inspector (Wireless) 1 1 1 1 1 1 1 1 1 1 0 1 0 1 0Assistant Sub 6 6 6 6 6 6 6 6 6 7 6 7 5 7 6 Inspector (Exe)Head Constable (Exe) 56 56 56 56 56 56 24 56 24 54 24 54 59 54 59Head Constable (Wireless) 2 2 2 2 2 2 0 2 0 2 2 2 2 2 1Constable (Exe) 230 230 230 230 230 230 230 230 230 231 230 231 195 231 195Constable (Wireless) 13 13 13 13 13 13 13 13 13 13 13 13 17 13 17Group ‘D’ Staff 25 25 25 25 25 25 19 25 19 25 19 25 23 25 23Ministerial 4 4 4 4 4 4 3 4 3 4 3 4 3 4 3TOTAL 355 355 355 355 355 355 307 355 307 355 312 355 318 355 318
Description
2004
-05
2005
-06
2006
-07
2007
-08
2008
-09
2009 - 10 2010 - 11 2011-12 2012-13 2013-14
San
ctio
ned
Fill
ed
Fill
ed
Fill
ed
Fill
ed
Fill
ed
San
ctio
ned
San
ctio
ned
San
ctio
ned
San
ctio
ned
Kavaratti
(a) Sessions Court Civil Cases 86 140 226 142 84 84 149 233 140 93
(b) Chief Judicial Magi- strate
Court Criminal Cases 2 10 12 7 5 5 42 47 38 9
Andrott(Munsiff Court)
Civil Cases 16 36 52 34 18 18 49 67 61 6
Judicial First class Magistrate
Court Criminal Cases 29 640 669 638 31 31 282 313 295 18
Amini(Munsiff Court)
Civil Cases 22 3 25 7 18 18 6 24 7 17
Judicial First class Magistrate
Court Criminal Cases 51 45 96 80 16 16 83 99 89 10
Total 206 874 1080 908 172 172 611 783 630 153
C O U R TTABLE -1
SOME KEY STATISTICS ON JUDICIAL ADMINISTRATION
Name of the CourtPending at the
beginningof theperiod
2003-2004
Institutedduring
theperiod
Total
Disposalduring
theperiod
Pendingat theend of
theperiod
Pendingat the
beginningof theperiod
Institutedduring the
period Total
Disposalduring
the period
Pendingat the end
of theperiod
2004-2005
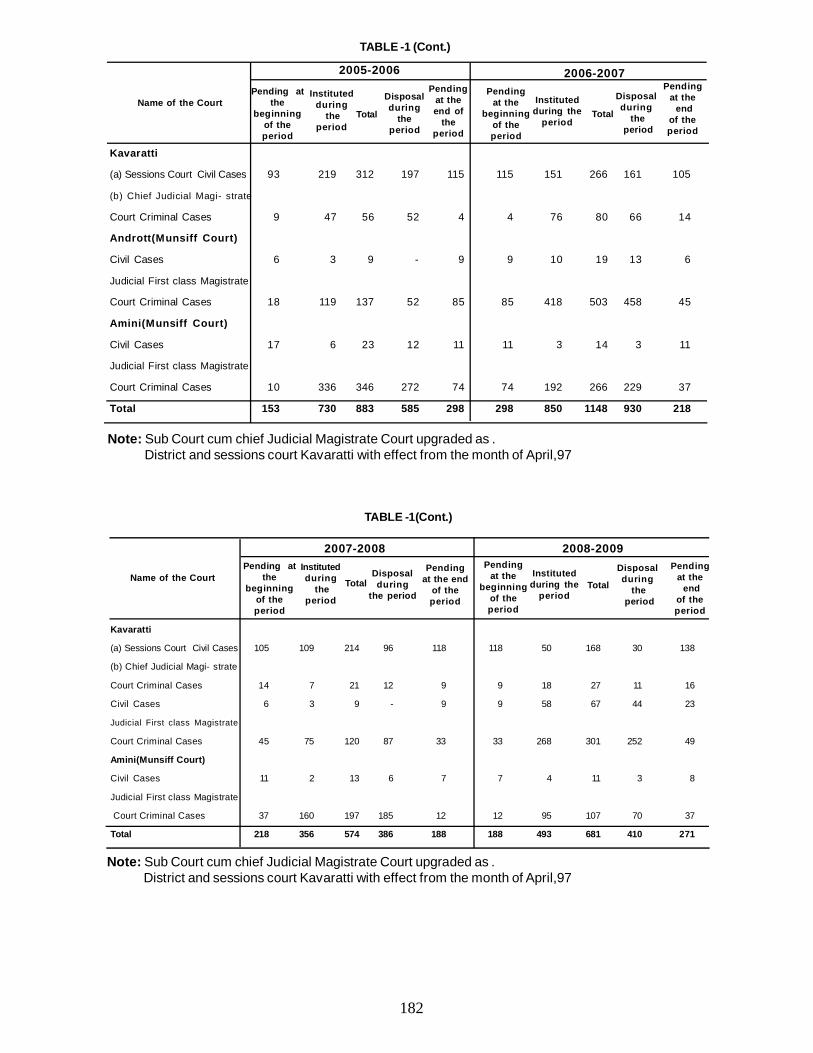
182
Note: Sub Court cum chief Judicial Magistrate Court upgraded as . District and sessions court Kavaratti with effect from the month of April,97
TABLE -1(Cont.)
Kavaratti
(a) Sessions Court Civil Cases 105 109 214 96 118 118 50 168 30 138
(b) Chief Judicial Magi- strate
Court Criminal Cases 14 7 21 12 9 9 18 27 11 16
Civil Cases 6 3 9 - 9 9 58 67 44 23
Judicial First class Magistrate
Court Criminal Cases 45 75 120 87 33 33 268 301 252 49
Amini(Munsiff Court)
Civil Cases 11 2 13 6 7 7 4 11 3 8
Judicial First class Magistrate
Court Criminal Cases 37 160 197 185 12 12 95 107 70 37
Total 218 356 574 386 188 188 493 681 410 271
Name of the CourtPending at
thebeginning
of theperiod
Institutedduring
theperiod
TotalPending
at the endof theperiod
Pendingat the
beginningof theperiod
Institutedduring the
period Total
Disposalduring
the period
2007-2008 2008-2009
Disposalduring
the period
Pendingat the end
of theperiod
Kavaratti
(a) Sessions Court Civil Cases 93 219 312 197 115 115 151 266 161 105
(b) Chief Judicial Magi- strate
Court Criminal Cases 9 47 56 52 4 4 76 80 66 14
Andrott(Munsiff Court)
Civil Cases 6 3 9 - 9 9 10 19 13 6
Judicial First class Magistrate
Court Criminal Cases 18 119 137 52 85 85 418 503 458 45
Amini(Munsiff Court)
Civil Cases 17 6 23 12 11 11 3 14 3 11
Judicial First class Magistrate
Court Criminal Cases 10 336 346 272 74 74 192 266 229 37
Total 153 730 883 585 298 298 850 1148 930 218
Note: Sub Court cum chief Judicial Magistrate Court upgraded as .District and sessions court Kavaratti with effect from the month of April,97
TABLE -1 (Cont.)
Name of the CourtPending at
thebeginning
of theperiod
2005-2006
Institutedduring
theperiod
Total
Disposalduring
theperiod
Pendingat theend of
theperiod
Pendingat the
beginningof theperiod
Institutedduring the
period Total
Disposalduring
the period
Pendingat the end
of theperiod
2006-2007
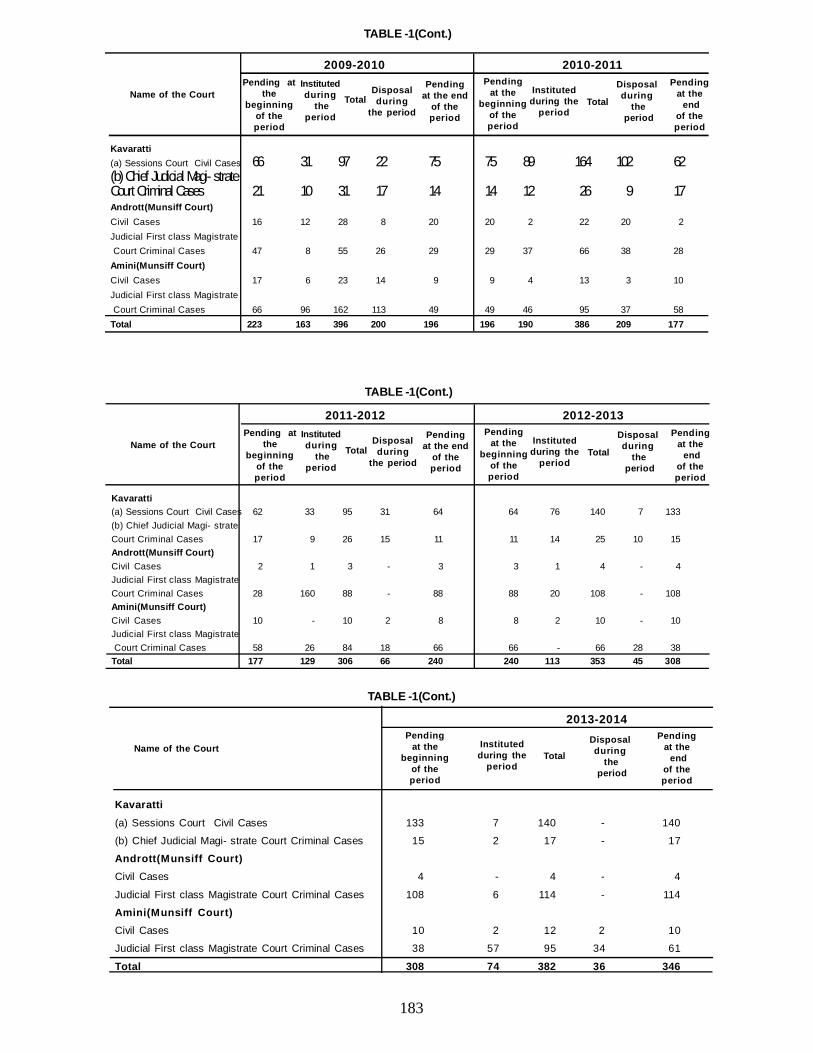
183
Kavaratti(a) Sessions Court Civil Cases 62 33 95 31 64 64 76 140 7 133(b) Chief Judicial Magi- strateCourt Criminal Cases 17 9 26 15 11 11 14 25 10 15Andrott(Munsiff Court)Civil Cases 2 1 3 - 3 3 1 4 - 4Judicial First class MagistrateCourt Criminal Cases 28 160 88 - 88 88 20 108 - 108Amini(Munsiff Court)Civil Cases 10 - 10 2 8 8 2 10 - 10Judicial First class Magistrate Court Criminal Cases 58 26 84 18 66 66 - 66 28 38Total 177 129 306 66 240 240 113 353 45 308
TABLE -1(Cont.)
Name of the CourtPending at
thebeginning
of theperiod
Institutedduring
theperiod
TotalPending
at the endof theperiod
Pendingat the
beginningof theperiod
Institutedduring the
period Total
Disposalduring
the period
2011-2012 2012-2013
Disposalduring
the period
Pendingat the end
of theperiod
TABLE -1(Cont.)
Kavaratti(a) Sessions Court Civil Cases 133 7 140 - 140
(b) Chief Judicial Magi- strate Court Criminal Cases 15 2 17 - 17
Andrott(Munsiff Court)Civil Cases 4 - 4 - 4
Judicial First class Magistrate Court Criminal Cases 108 6 114 - 114
Amini(Munsiff Court)Civil Cases 10 2 12 2 10
Judicial First class Magistrate Court Criminal Cases 38 57 95 34 61
Total 308 74 382 36 346
Name of the CourtPending
at thebeginning
of theperiod
Institutedduring the
period Total
Disposalduring
the period
2013-2014Pending
at the end
of theperiod
Kavaratti(a) Sessions Court Civil Cases 66 31 97 22 75 75 89 164 102 62(b) Chief Judicial Magi- strateCourt Criminal Cases 21 10 31 17 14 14 12 26 9 17Andrott(Munsiff Court)Civil Cases 16 12 28 8 20 20 2 22 20 2Judicial First class Magistrate Court Criminal Cases 47 8 55 26 29 29 37 66 38 28Amini(Munsiff Court)Civil Cases 17 6 23 14 9 9 4 13 3 10Judicial First class Magistrate Court Criminal Cases 66 96 162 113 49 49 46 95 37 58Total 223 163 396 200 196 196 190 386 209 177
TABLE -1(Cont.)
Name of the CourtPending at
thebeginning
of theperiod
Institutedduring
theperiod
TotalPending
at the endof theperiod
Pendingat the
beginningof theperiod
Institutedduring the
period Total
Disposalduring
the period
2009-2010 2010-2011
Disposalduring
the period
Pendingat the end
of theperiod
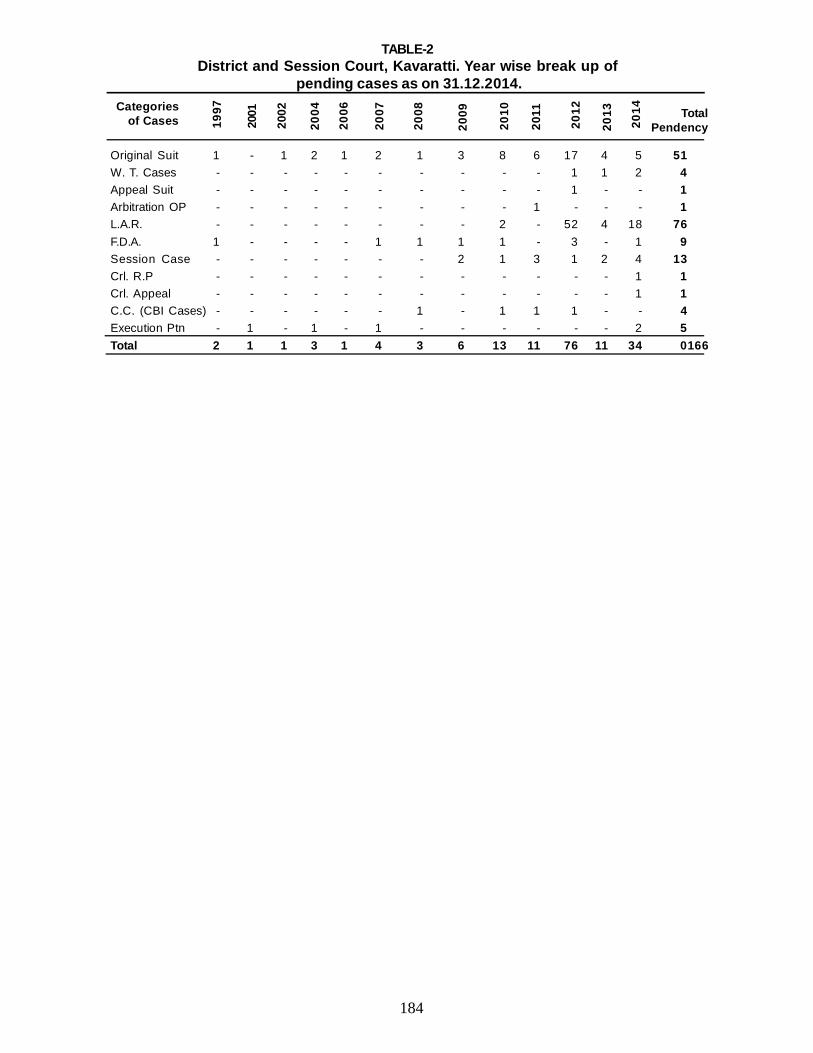
184
Original Suit 1 - 1 2 1 2 1 3 8 6 17 4 5 51W. T. Cases - - - - - - - - - - 1 1 2 4Appeal Suit - - - - - - - - - - 1 - - 1Arbitration OP - - - - - - - - - 1 - - - 1L.A.R. - - - - - - - - 2 - 52 4 18 76F.D.A. 1 - - - - 1 1 1 1 - 3 - 1 9Session Case - - - - - - - 2 1 3 1 2 4 13Crl. R.P - - - - - - - - - - - - 1 1Crl. Appeal - - - - - - - - - - - - 1 1C.C. (CBI Cases) - - - - - - 1 - 1 1 1 - - 4Execution Ptn - 1 - 1 - 1 - - - - - - 2 5Total 2 1 1 3 1 4 3 6 13 11 76 11 34 0166
TABLE-2District and Session Court, Kavaratti. Year wise break up of
pending cases as on 31.12.2014.Categories
of Cases 1997
2001
2002
2004
2006
2007
2008
2009
2010
2011
2012
2013
2014 Total
Pendency
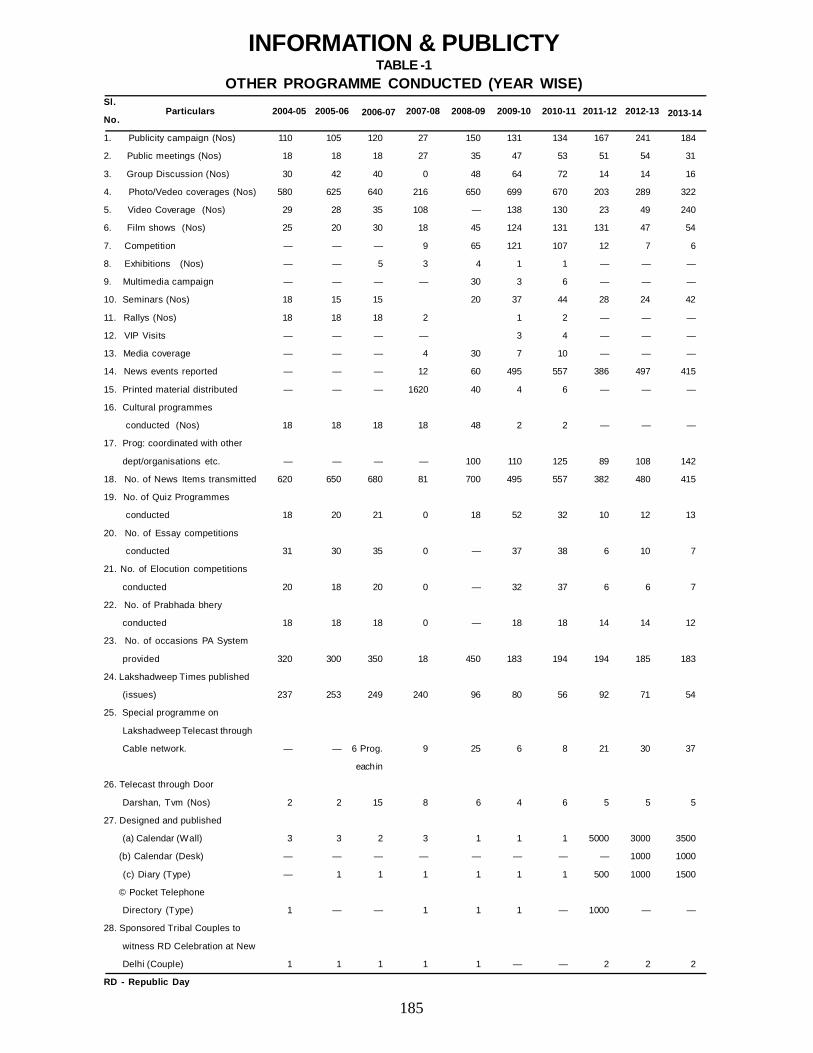
185
INFORMATION & PUBLICTYTABLE -1
OTHER PROGRAMME CONDUCTED (YEAR WISE)Sl.
No.
1. Publicity campaign (Nos) 110 105 120 27 150 131 134 167 241 184
2. Public meetings (Nos) 18 18 18 27 35 47 53 51 54 31
3. Group Discussion (Nos) 30 42 40 0 48 64 72 14 14 16
4. Photo/Vedeo coverages (Nos) 580 625 640 216 650 699 670 203 289 322
5. Video Coverage (Nos) 29 28 35 108 — 138 130 23 49 240
6. Film shows (Nos) 25 20 30 18 45 124 131 131 47 54
7. Competition — — — 9 65 121 107 12 7 6
8. Exhibitions (Nos) — — 5 3 4 1 1 — — —
9. Multimedia campaign — — — — 30 3 6 — — —
10. Seminars (Nos) 18 15 15 20 37 44 28 24 42
11. Rallys (Nos) 18 18 18 2 1 2 — — —
12. VIP Visits — — — — 3 4 — — —
13. Media coverage — — — 4 30 7 10 — — —
14. News events reported — — — 12 60 495 557 386 497 415
15. Printed material distributed — — — 1620 40 4 6 — — —
16. Cultural programmes
conducted (Nos) 18 18 18 18 48 2 2 — — —
17. Prog: coordinated with other
dept/organisations etc. — — — — 100 110 125 89 108 142
18. No. of News Items transmitted 620 650 680 81 700 495 557 382 480 415
19. No. of Quiz Programmes
conducted 18 20 21 0 18 52 32 10 12 13
20. No. of Essay competitions
conducted 31 30 35 0 — 37 38 6 10 7
21. No. of Elocution competitions
conducted 20 18 20 0 — 32 37 6 6 7
22. No. of Prabhada bhery
conducted 18 18 18 0 — 18 18 14 14 12
23. No. of occasions PA System
provided 320 300 350 18 450 183 194 194 185 183
24. Lakshadweep Times published
(issues) 237 253 249 240 96 80 56 92 71 54
25. Special programme on
Lakshadweep Telecast through
Cable network. — — 6 Prog. 9 25 6 8 21 30 37
each in
26. Telecast through Door
Darshan, Tvm (Nos) 2 2 15 8 6 4 6 5 5 5
27. Designed and published
(a) Calendar (Wall) 3 3 2 3 1 1 1 5000 3000 3500
(b) Calendar (Desk) — — — — — — — — 1000 1000
(c) Diary (Type) — 1 1 1 1 1 1 500 1000 1500
© Pocket Telephone
Directory (Type) 1 — — 1 1 1 — 1000 — —
28. Sponsored Tribal Couples to
witness RD Celebration at New
Delhi (Couple) 1 1 1 1 1 — — 2 2 2
RD - Republic Day
2004-05 Particulars 2005-06 2006-07 2007-08 2008-09 2009-10 2010-11 2011-12 2012-13 2013-14
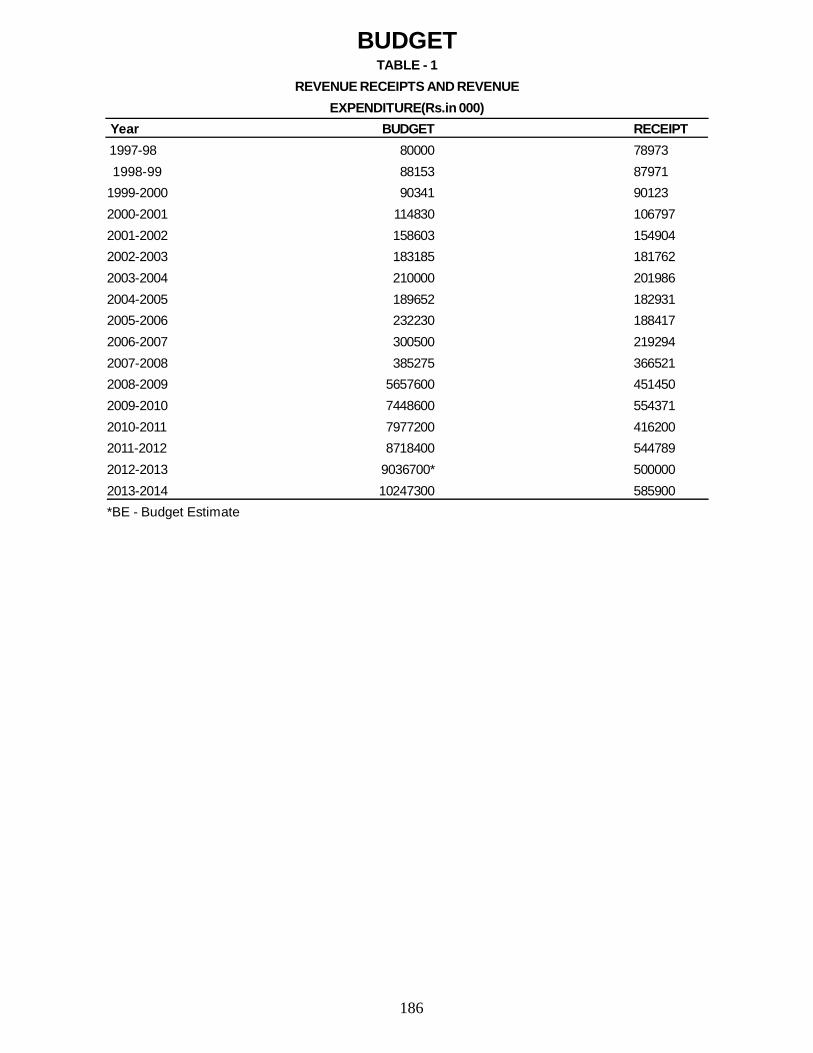
186
BUDGETTABLE - 1
REVENUE RECEIPTS AND REVENUEEXPENDITURE(Rs.in 000)
Year BUDGET RECEIPT 1997-98 80000 78973 1998-99 88153 879711999-2000 90341 901232000-2001 114830 1067972001-2002 158603 1549042002-2003 183185 1817622003-2004 210000 2019862004-2005 189652 1829312005-2006 232230 1884172006-2007 300500 2192942007-2008 385275 3665212008-2009 5657600 4514502009-2010 7448600 5543712010-2011 7977200 4162002011-2012 8718400 5447892012-2013 9036700* 5000002013-2014 10247300 585900*BE - Budget Estimate
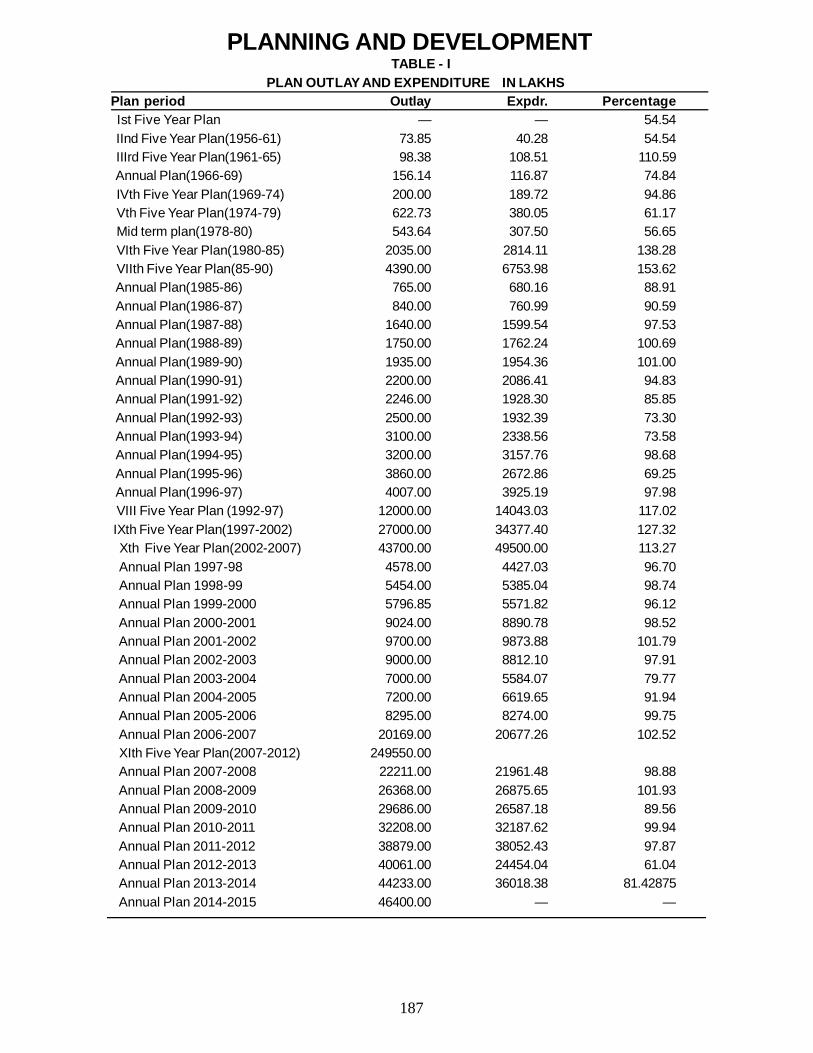
187
PLANNING AND DEVELOPMENT TABLE - I
PLAN OUTLAY AND EXPENDITURE IN LAKHSPlan period Outlay Expdr. Percentage Ist Five Year Plan — — 54.54 IInd Five Year Plan(1956-61) 73.85 40.28 54.54 IIIrd Five Year Plan(1961-65) 98.38 108.51 110.59 Annual Plan(1966-69) 156.14 116.87 74.84 IVth Five Year Plan(1969-74) 200.00 189.72 94.86 Vth Five Year Plan(1974-79) 622.73 380.05 61.17 Mid term plan(1978-80) 543.64 307.50 56.65 VIth Five Year Plan(1980-85) 2035.00 2814.11 138.28 VIIth Five Year Plan(85-90) 4390.00 6753.98 153.62 Annual Plan(1985-86) 765.00 680.16 88.91 Annual Plan(1986-87) 840.00 760.99 90.59 Annual Plan(1987-88) 1640.00 1599.54 97.53 Annual Plan(1988-89) 1750.00 1762.24 100.69 Annual Plan(1989-90) 1935.00 1954.36 101.00 Annual Plan(1990-91) 2200.00 2086.41 94.83 Annual Plan(1991-92) 2246.00 1928.30 85.85 Annual Plan(1992-93) 2500.00 1932.39 73.30 Annual Plan(1993-94) 3100.00 2338.56 73.58 Annual Plan(1994-95) 3200.00 3157.76 98.68 Annual Plan(1995-96) 3860.00 2672.86 69.25 Annual Plan(1996-97) 4007.00 3925.19 97.98 VIII Five Year Plan (1992-97) 12000.00 14043.03 117.02 IXth Five Year Plan(1997-2002) 27000.00 34377.40 127.32 Xth Five Year Plan(2002-2007) 43700.00 49500.00 113.27 Annual Plan 1997-98 4578.00 4427.03 96.70 Annual Plan 1998-99 5454.00 5385.04 98.74 Annual Plan 1999-2000 5796.85 5571.82 96.12 Annual Plan 2000-2001 9024.00 8890.78 98.52 Annual Plan 2001-2002 9700.00 9873.88 101.79 Annual Plan 2002-2003 9000.00 8812.10 97.91 Annual Plan 2003-2004 7000.00 5584.07 79.77 Annual Plan 2004-2005 7200.00 6619.65 91.94 Annual Plan 2005-2006 8295.00 8274.00 99.75 Annual Plan 2006-2007 20169.00 20677.26 102.52 XIth Five Year Plan(2007-2012) 249550.00 Annual Plan 2007-2008 22211.00 21961.48 98.88 Annual Plan 2008-2009 26368.00 26875.65 101.93 Annual Plan 2009-2010 29686.00 26587.18 89.56 Annual Plan 2010-2011 32208.00 32187.62 99.94 Annual Plan 2011-2012 38879.00 38052.43 97.87 Annual Plan 2012-2013 40061.00 24454.04 61.04 Annual Plan 2013-2014 44233.00 36018.38 81.42875 Annual Plan 2014-2015 46400.00 — —
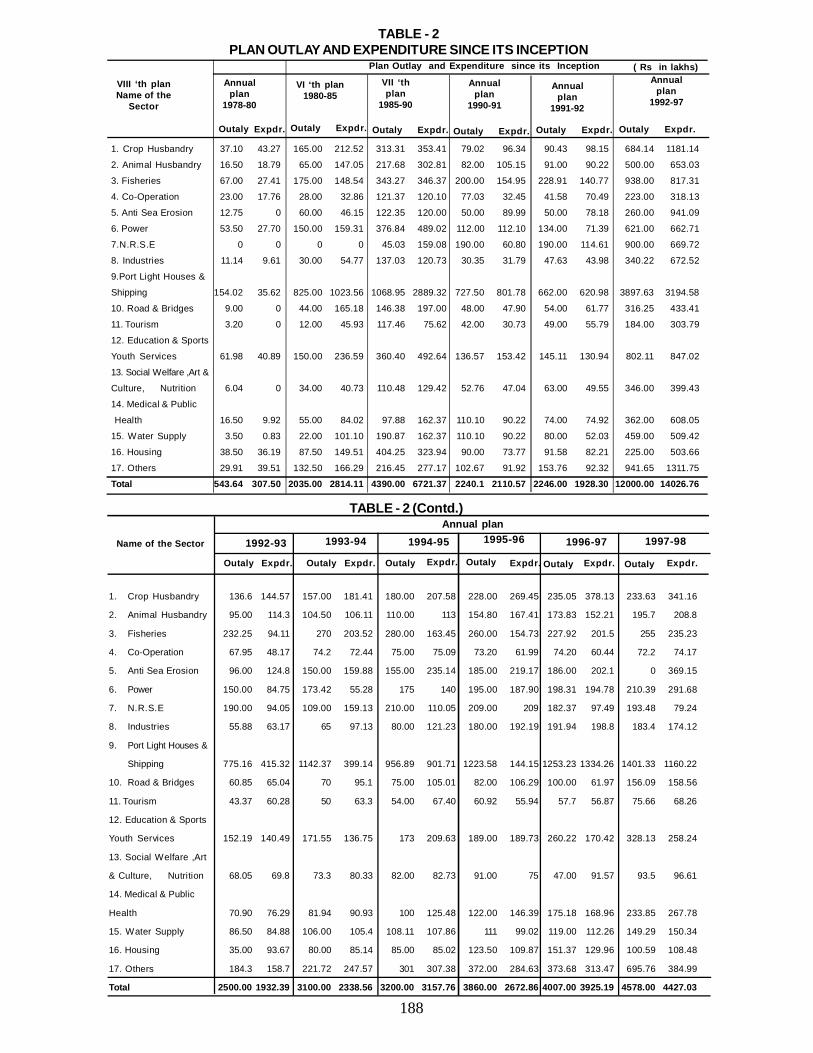
188
TABLE - 2PLAN OUTLAY AND EXPENDITURE SINCE ITS INCEPTION
1. Crop Husbandry 37.10 43.27 165.00 212.52 313.31 353.41 79.02 96.34 90.43 98.15 684.14 1181.14
2. Animal Husbandry 16.50 18.79 65.00 147.05 217.68 302.81 82.00 105.15 91.00 90.22 500.00 653.03
3. Fisheries 67.00 27.41 175.00 148.54 343.27 346.37 200.00 154.95 228.91 140.77 938.00 817.31
4. Co-Operation 23.00 17.76 28.00 32.86 121.37 120.10 77.03 32.45 41.58 70.49 223.00 318.13
5. Anti Sea Erosion 12.75 0 60.00 46.15 122.35 120.00 50.00 89.99 50.00 78.18 260.00 941.09
6. Power 53.50 27.70 150.00 159.31 376.84 489.02 112.00 112.10 134.00 71.39 621.00 662.71
7.N.R.S.E 0 0 0 0 45.03 159.08 190.00 60.80 190.00 114.61 900.00 669.72
8. Industries 11.14 9.61 30.00 54.77 137.03 120.73 30.35 31.79 47.63 43.98 340.22 672.52
9.Port Light Houses &
Shipping 154.02 35.62 825.00 1023.56 1068.95 2889.32 727.50 801.78 662.00 620.98 3897.63 3194.58
10. Road & Bridges 9.00 0 44.00 165.18 146.38 197.00 48.00 47.90 54.00 61.77 316.25 433.41
11. Tourism 3.20 0 12.00 45.93 117.46 75.62 42.00 30.73 49.00 55.79 184.00 303.79
12. Education & Sports
Youth Services 61.98 40.89 150.00 236.59 360.40 492.64 136.57 153.42 145.11 130.94 802.11 847.02
13. Social Welfare ,Art &
Culture, Nutrition 6.04 0 34.00 40.73 110.48 129.42 52.76 47.04 63.00 49.55 346.00 399.43
14. Medical & Public
Health 16.50 9.92 55.00 84.02 97.88 162.37 110.10 90.22 74.00 74.92 362.00 608.05
15. Water Supply 3.50 0.83 22.00 101.10 190.87 162.37 110.10 90.22 80.00 52.03 459.00 509.42
16. Housing 38.50 36.19 87.50 149.51 404.25 323.94 90.00 73.77 91.58 82.21 225.00 503.66
17. Others 29.91 39.51 132.50 166.29 216.45 277.17 102.67 91.92 153.76 92.32 941.65 1311.75
Total 543.64 307.50 2035.00 2814.11 4390.00 6721.37 2240.1 2110.57 2246.00 1928.30 12000.00 14026.76
Plan Outlay and Expenditure since its Inception ( Rs in lakhs)
VIII ‘th planName of the
Sector
Annualplan
1978-80
VI ‘th plan1980-85
VII ‘thplan
1985-90
Annualplan
1990-91
Annualplan
1991-92
Annualplan
1992-97
Expdr.Expdr.Outaly Outaly Expdr.Outaly Expdr.Outaly Expdr.Outaly Expdr.Outaly
1. Crop Husbandry 136.6 144.57 157.00 181.41 180.00 207.58 228.00 269.45 235.05 378.13 233.63 341.16
2. Animal Husbandry 95.00 114.3 104.50 106.11 110.00 113 154.80 167.41 173.83 152.21 195.7 208.8
3. Fisheries 232.25 94.11 270 203.52 280.00 163.45 260.00 154.73 227.92 201.5 255 235.23
4. Co-Operation 67.95 48.17 74.2 72.44 75.00 75.09 73.20 61.99 74.20 60.44 72.2 74.17
5. Anti Sea Erosion 96.00 124.8 150.00 159.88 155.00 235.14 185.00 219.17 186.00 202.1 0 369.15
6. Power 150.00 84.75 173.42 55.28 175 140 195.00 187.90 198.31 194.78 210.39 291.68
7. N.R.S.E 190.00 94.05 109.00 159.13 210.00 110.05 209.00 209 182.37 97.49 193.48 79.24
8. Industries 55.88 63.17 65 97.13 80.00 121.23 180.00 192.19 191.94 198.8 183.4 174.12
9. Port Light Houses &
Shipping 775.16 415.32 1142.37 399.14 956.89 901.71 1223.58 144.15 1253.23 1334.26 1401.33 1160.22
10. Road & Bridges 60.85 65.04 70 95.1 75.00 105.01 82.00 106.29 100.00 61.97 156.09 158.56
11. Tourism 43.37 60.28 50 63.3 54.00 67.40 60.92 55.94 57.7 56.87 75.66 68.26
12. Education & Sports
Youth Services 152.19 140.49 171.55 136.75 173 209.63 189.00 189.73 260.22 170.42 328.13 258.24
13. Social Welfare ,Art
& Culture, Nutrition 68.05 69.8 73.3 80.33 82.00 82.73 91.00 75 47.00 91.57 93.5 96.61
14. Medical & Public
Health 70.90 76.29 81.94 90.93 100 125.48 122.00 146.39 175.18 168.96 233.85 267.78
15. Water Supply 86.50 84.88 106.00 105.4 108.11 107.86 111 99.02 119.00 112.26 149.29 150.34
16. Housing 35.00 93.67 80.00 85.14 85.00 85.02 123.50 109.87 151.37 129.96 100.59 108.48
17. Others 184.3 158.7 221.72 247.57 301 307.38 372.00 284.63 373.68 313.47 695.76 384.99
Total 2500.00 1932.39 3100.00 2338.56 3200.00 3157.76 3860.00 2672.86 4007.00 3925.19 4578.00 4427.03
TABLE - 2 (Contd.)
Name of the Sector
Annual plan
1992-93 1993-94 1994-95 1995-96 1996-97 1997-98
Outaly Expdr. Outaly Expdr. Outaly Expdr. Outaly Expdr. Outaly Expdr. Outaly Expdr.
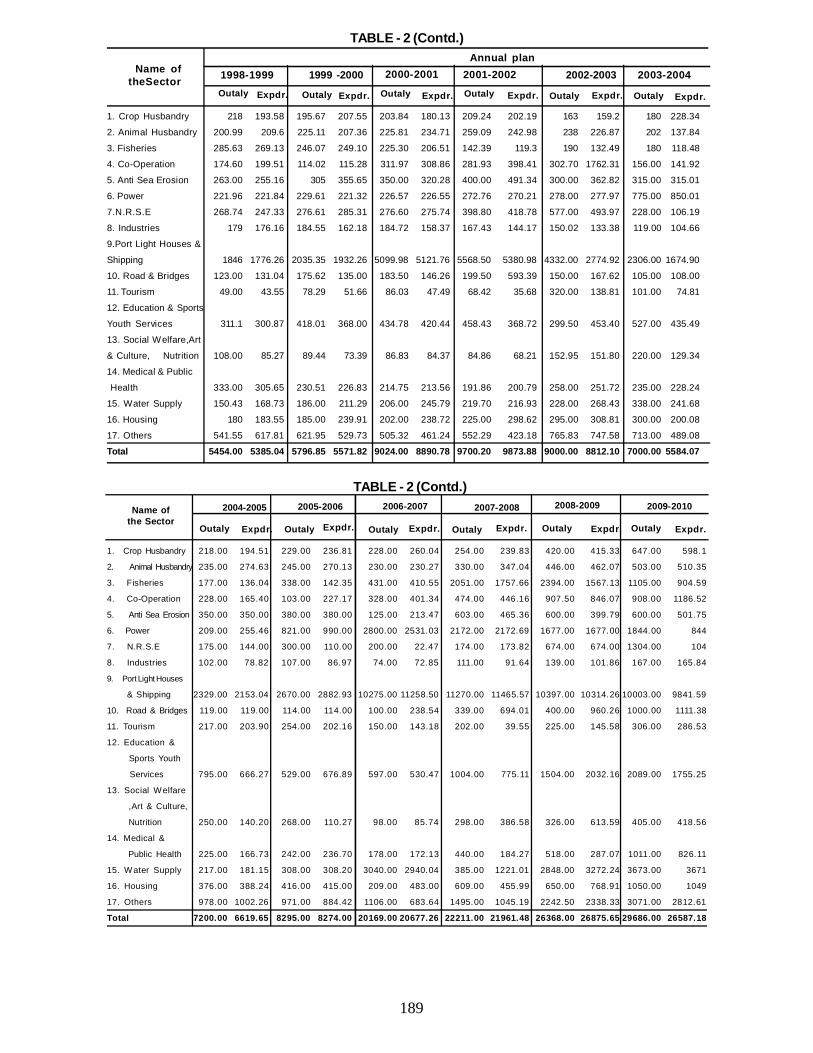
189
TABLE - 2 (Contd.)
1. Crop Husbandry 218 193.58 195.67 207.55 203.84 180.13 209.24 202.19 163 159.2 180 228.34
2. Animal Husbandry 200.99 209.6 225.11 207.36 225.81 234.71 259.09 242.98 238 226.87 202 137.84
3. Fisheries 285.63 269.13 246.07 249.10 225.30 206.51 142.39 119.3 190 132.49 180 118.48
4. Co-Operation 174.60 199.51 114.02 115.28 311.97 308.86 281.93 398.41 302.70 1762.31 156.00 141.92
5. Anti Sea Erosion 263.00 255.16 305 355.65 350.00 320.28 400.00 491.34 300.00 362.82 315.00 315.01
6. Power 221.96 221.84 229.61 221.32 226.57 226.55 272.76 270.21 278.00 277.97 775.00 850.01
7.N.R.S.E 268.74 247.33 276.61 285.31 276.60 275.74 398.80 418.78 577.00 493.97 228.00 106.19
8. Industries 179 176.16 184.55 162.18 184.72 158.37 167.43 144.17 150.02 133.38 119.00 104.66
9.Port Light Houses &
Shipping 1846 1776.26 2035.35 1932.26 5099.98 5121.76 5568.50 5380.98 4332.00 2774.92 2306.00 1674.90
10. Road & Bridges 123.00 131.04 175.62 135.00 183.50 146.26 199.50 593.39 150.00 167.62 105.00 108.00
11. Tourism 49.00 43.55 78.29 51.66 86.03 47.49 68.42 35.68 320.00 138.81 101.00 74.81
12. Education & Sports
Youth Services 311.1 300.87 418.01 368.00 434.78 420.44 458.43 368.72 299.50 453.40 527.00 435.49
13. Social Welfare,Art
& Culture, Nutrition 108.00 85.27 89.44 73.39 86.83 84.37 84.86 68.21 152.95 151.80 220.00 129.34
14. Medical & Public
Health 333.00 305.65 230.51 226.83 214.75 213.56 191.86 200.79 258.00 251.72 235.00 228.24
15. Water Supply 150.43 168.73 186.00 211.29 206.00 245.79 219.70 216.93 228.00 268.43 338.00 241.68
16. Housing 180 183.55 185.00 239.91 202.00 238.72 225.00 298.62 295.00 308.81 300.00 200.08
17. Others 541.55 617.81 621.95 529.73 505.32 461.24 552.29 423.18 765.83 747.58 713.00 489.08
Total 5454.00 5385.04 5796.85 5571.82 9024.00 8890.78 9700.20 9873.88 9000.00 8812.10 7000.00 5584.07
Name of theSector
Annual plan1998-1999 1999 -2000 2000-2001 2001-2002 2002-2003 2003-2004Outaly Expdr. Outaly Expdr. Outaly Expdr. Outaly Expdr. Outaly Expdr. Outaly Expdr.
1. Crop Husbandry 218.00 194.51 229.00 236.81 228.00 260.04 254.00 239.83 420.00 415.33 647.00 598.1
2. Animal Husbandry 235.00 274.63 245.00 270.13 230.00 230.27 330.00 347.04 446.00 462.07 503.00 510.35
3. Fisheries 177.00 136.04 338.00 142.35 431.00 410.55 2051.00 1757.66 2394.00 1567.13 1105.00 904.59
4. Co-Operation 228.00 165.40 103.00 227.17 328.00 401.34 474.00 446.16 907.50 846.07 908.00 1186.52
5. Anti Sea Erosion 350.00 350.00 380.00 380.00 125.00 213.47 603.00 465.36 600.00 399.79 600.00 501.75
6. Power 209.00 255.46 821.00 990.00 2800.00 2531.03 2172.00 2172.69 1677.00 1677.00 1844.00 844
7. N.R.S.E 175.00 144.00 300.00 110.00 200.00 22.47 174.00 173.82 674.00 674.00 1304.00 104
8. Industries 102.00 78.82 107.00 86.97 74.00 72.85 111.00 91.64 139.00 101.86 167.00 165.84
9. Port Light Houses
& Shipping 2329.00 2153.04 2670.00 2882.93 10275.00 11258.50 11270.00 11465.57 10397.00 10314.26 10003.00 9841.59
10. Road & Bridges 119.00 119.00 114.00 114.00 100.00 238.54 339.00 694.01 400.00 960.26 1000.00 1111.38
11. Tourism 217.00 203.90 254.00 202.16 150.00 143.18 202.00 39.55 225.00 145.58 306.00 286.53
12. Education &
Sports Youth
Services 795.00 666.27 529.00 676.89 597.00 530.47 1004.00 775.11 1504.00 2032.16 2089.00 1755.25
13. Social Welfare
,Art & Culture,
Nutrition 250.00 140.20 268.00 110.27 98.00 85.74 298.00 386.58 326.00 613.59 405.00 418.56
14. Medical &
Public Health 225.00 166.73 242.00 236.70 178.00 172.13 440.00 184.27 518.00 287.07 1011.00 826.11
15. Water Supply 217.00 181.15 308.00 308.20 3040.00 2940.04 385.00 1221.01 2848.00 3272.24 3673.00 3671
16. Housing 376.00 388.24 416.00 415.00 209.00 483.00 609.00 455.99 650.00 768.91 1050.00 1049
17. Others 978.00 1002.26 971.00 884.42 1106.00 683.64 1495.00 1045.19 2242.50 2338.33 3071.00 2812.61
Total 7200.00 6619.65 8295.00 8274.00 20169.00 20677.26 22211.00 21961.48 26368.00 26875.65 29686.00 26587.18
TABLE - 2 (Contd.)Name of
the Sector2004-2005 2005-2006 2006-2007 2007-2008 2008-2009 2009-2010
Outaly Expdr. Outaly Expdr. Outaly Expdr. Outaly Expdr. Outaly Expdr. Outaly Expdr.
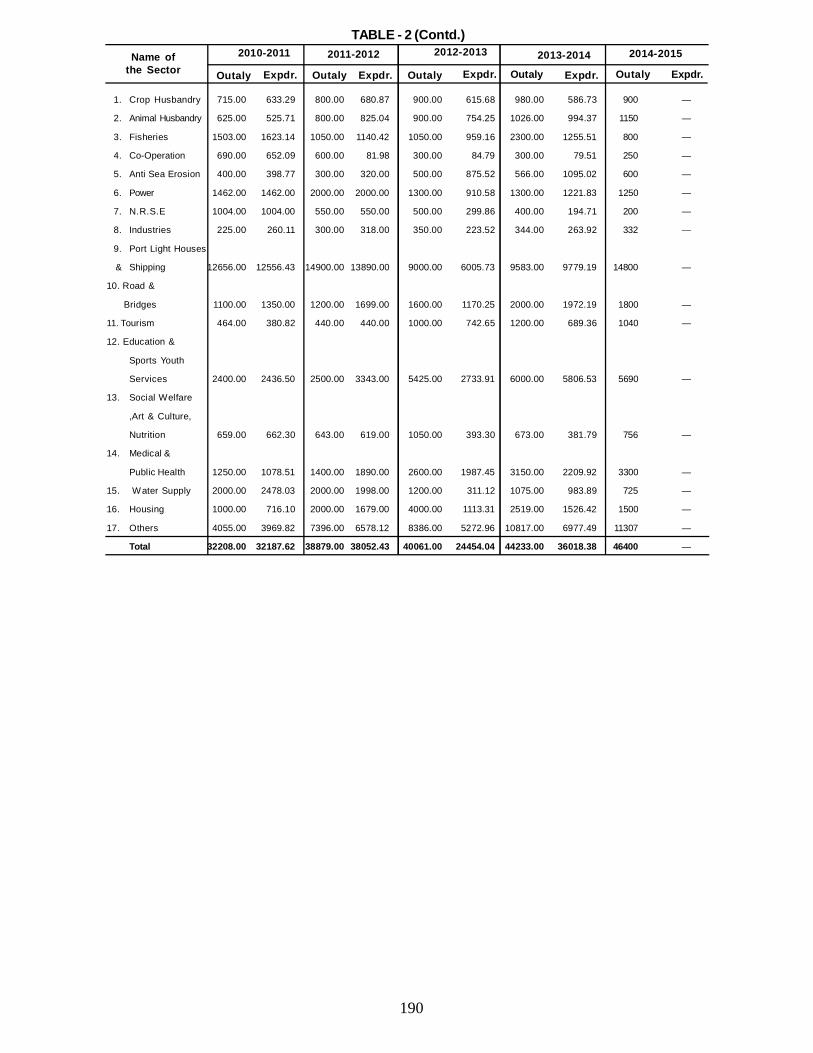
190
1. Crop Husbandry 715.00 633.29 800.00 680.87 900.00 615.68 980.00 586.73 900 —
2. Animal Husbandry 625.00 525.71 800.00 825.04 900.00 754.25 1026.00 994.37 1150 —
3. Fisheries 1503.00 1623.14 1050.00 1140.42 1050.00 959.16 2300.00 1255.51 800 —
4. Co-Operation 690.00 652.09 600.00 81.98 300.00 84.79 300.00 79.51 250 —
5. Anti Sea Erosion 400.00 398.77 300.00 320.00 500.00 875.52 566.00 1095.02 600 —
6. Power 1462.00 1462.00 2000.00 2000.00 1300.00 910.58 1300.00 1221.83 1250 —
7. N.R.S.E 1004.00 1004.00 550.00 550.00 500.00 299.86 400.00 194.71 200 —
8. Industries 225.00 260.11 300.00 318.00 350.00 223.52 344.00 263.92 332 —
9. Port Light Houses
& Shipping 12656.00 12556.43 14900.00 13890.00 9000.00 6005.73 9583.00 9779.19 14800 —
10. Road &
Bridges 1100.00 1350.00 1200.00 1699.00 1600.00 1170.25 2000.00 1972.19 1800 —
11. Tourism 464.00 380.82 440.00 440.00 1000.00 742.65 1200.00 689.36 1040 —
12. Education &
Sports Youth
Services 2400.00 2436.50 2500.00 3343.00 5425.00 2733.91 6000.00 5806.53 5690 —
13. Social Welfare
,Art & Culture,
Nutrition 659.00 662.30 643.00 619.00 1050.00 393.30 673.00 381.79 756 —
14. Medical &
Public Health 1250.00 1078.51 1400.00 1890.00 2600.00 1987.45 3150.00 2209.92 3300 —
15. Water Supply 2000.00 2478.03 2000.00 1998.00 1200.00 311.12 1075.00 983.89 725 —
16. Housing 1000.00 716.10 2000.00 1679.00 4000.00 1113.31 2519.00 1526.42 1500 —
17. Others 4055.00 3969.82 7396.00 6578.12 8386.00 5272.96 10817.00 6977.49 11307 —
Total 32208.00 32187.62 38879.00 38052.43 40061.00 24454.04 44233.00 36018.38 46400 —
TABLE - 2 (Contd.)Name of
the Sector2010-2011 2011-2012 2012-2013 2013-2014 2014-2015
Outaly Expdr. Outaly Expdr. Outaly Expdr. Outaly Expdr. Outaly Expdr.
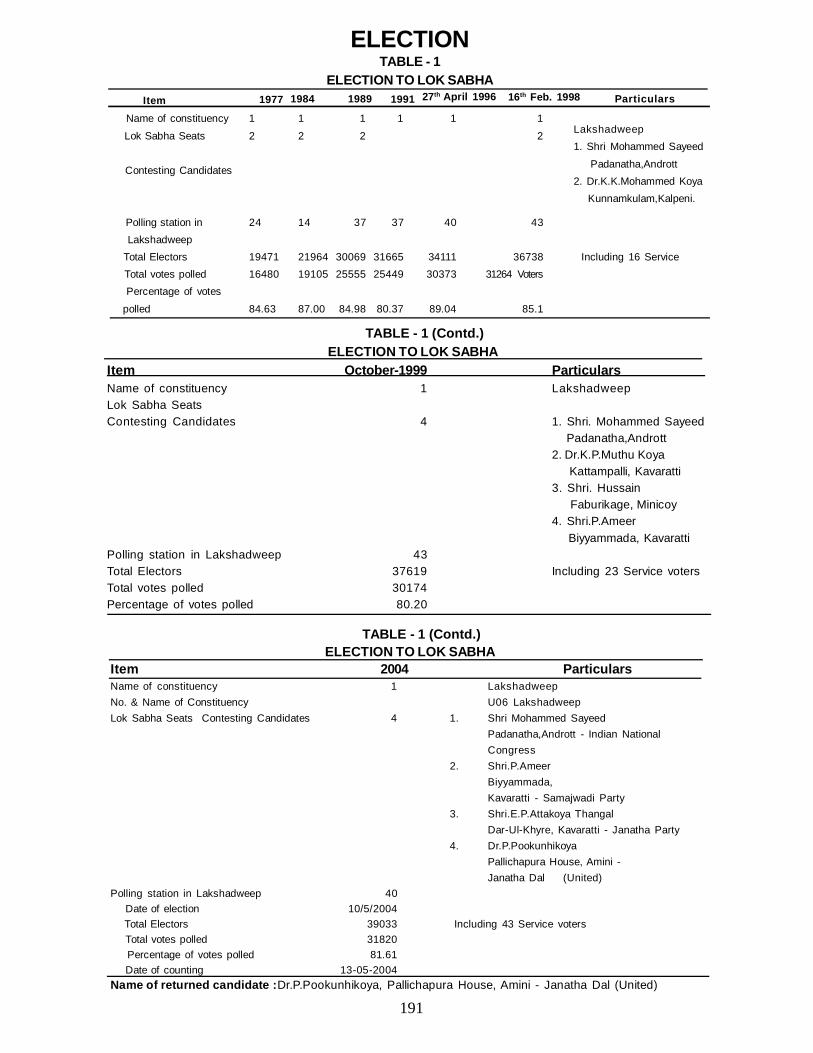
191
ELECTIONTABLE - 1
ELECTION TO LOK SABHA
Name of constituency 1 1 1 1 1 1
Lok Sabha Seats 2 2 2 2
Contesting Candidates
Polling station in 24 14 37 37 40 43 Lakshadweep Total Electors 19471 21964 30069 31665 34111 36738 Including 16 Service Total votes polled 16480 19105 25555 25449 30373 31264 Voters Percentage of votes
polled 84.63 87.00 84.98 80.37 89.04 85.1
Item 1977 1984 1989 1991 27th April 1996 16th Feb. 1998 Particulars
TABLE - 1 (Contd.) ELECTION TO LOK SABHA
Item October-1999 ParticularsName of constituency 1 LakshadweepLok Sabha SeatsContesting Candidates 4 1. Shri. Mohammed Sayeed
Padanatha,Andrott2. Dr.K.P.Muthu Koya Kattampalli, Kavaratti3. Shri. Hussain Faburikage, Minicoy4. Shri.P.Ameer Biyyammada, Kavaratti
Polling station in Lakshadweep 43Total Electors 37619 Including 23 Service votersTotal votes polled 30174Percentage of votes polled 80.20
TABLE - 1 (Contd.) ELECTION TO LOK SABHA
Item 2004 ParticularsName of constituency 1 LakshadweepNo. & Name of Constituency U06 LakshadweepLok Sabha Seats Contesting Candidates 4 1. Shri Mohammed Sayeed
Padanatha,Andrott - Indian NationalCongress
2. Shri.P.AmeerBiyyammada,Kavaratti - Samajwadi Party
3. Shri.E.P.Attakoya ThangalDar-Ul-Khyre, Kavaratti - Janatha Party
4. Dr.P.PookunhikoyaPallichapura House, Amini -Janatha Dal (United)
Polling station in Lakshadweep 40 Date of election 10/5/2004 Total Electors 39033 Including 43 Service voters Total votes polled 31820 Percentage of votes polled 81.61 Date of counting 13-05-2004Name of returned candidate :Dr.P.Pookunhikoya, Pallichapura House, Amini - Janatha Dal (United)
Lakshadweep1. Shri Mohammed Sayeed
Padanatha,Andrott2. Dr.K.K.Mohammed Koya Kunnamkulam,Kalpeni.
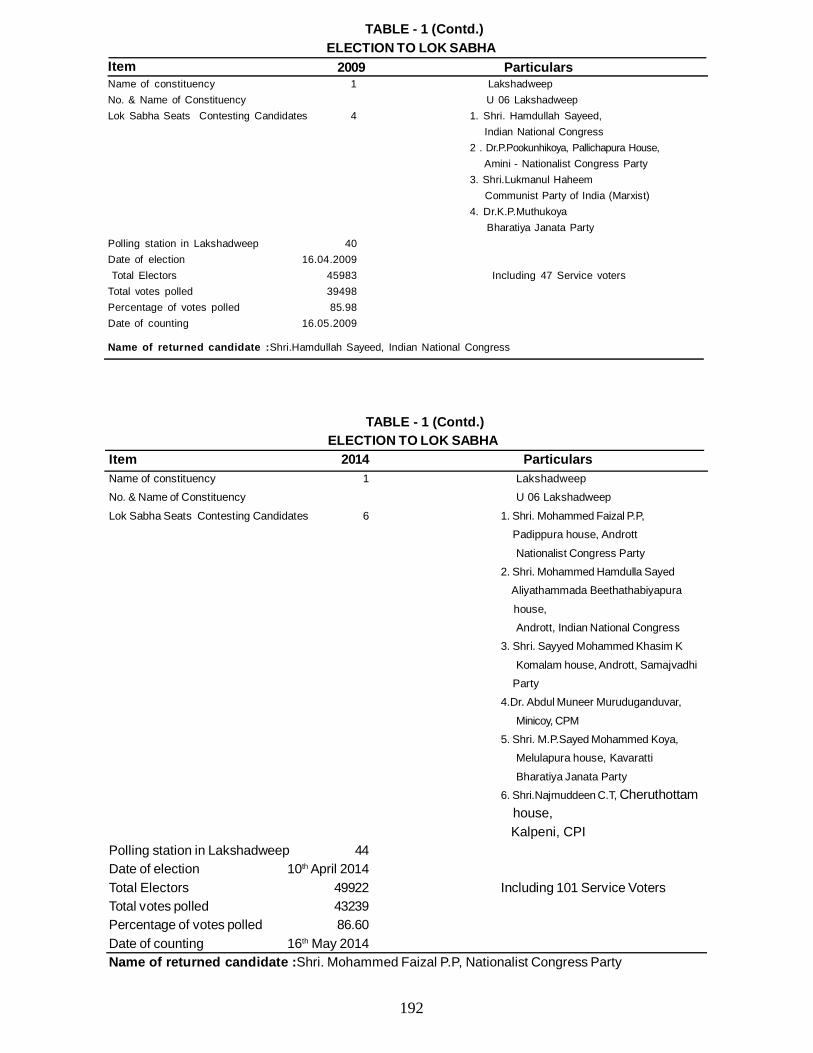
192
TABLE - 1 (Contd.) ELECTION TO LOK SABHA
ItemName of constituency 1 LakshadweepNo. & Name of Constituency U 06 LakshadweepLok Sabha Seats Contesting Candidates 4 1. Shri. Hamdullah Sayeed,
Indian National Congress2 . Dr.P.Pookunhikoya, Pallichapura House, Amini - Nationalist Congress Party3. Shri.Lukmanul Haheem Communist Party of India (Marxist)4. Dr.K.P.Muthukoya Bharatiya Janata Party
Polling station in Lakshadweep 40Date of election 16.04.2009 Total Electors 45983 Including 47 Service votersTotal votes polled 39498Percentage of votes polled 85.98Date of counting 16.05.2009
Name of returned candidate :Shri.Hamdullah Sayeed, Indian National Congress
2009 Particulars
TABLE - 1 (Contd.) ELECTION TO LOK SABHA
Item 2014 ParticularsName of constituency 1 LakshadweepNo. & Name of Constituency U 06 Lakshadweep
Lok Sabha Seats Contesting Candidates 6 1. Shri. Mohammed Faizal P.P, Padippura house, Andrott
Nationalist Congress Party2. Shri. Mohammed Hamdulla Sayed Aliyathammada Beethathabiyapura
house,Andrott, Indian National Congress
3. Shri. Sayyed Mohammed Khasim K
Komalam house, Andrott, Samajvadhi Party4.Dr. Abdul Muneer Muruduganduvar,
Minicoy, CPM5. Shri. M.P.Sayed Mohammed Koya,
Melulapura house, Kavaratti
Bharatiya Janata Party6. Shri.Najmuddeen C.T, Cheruthottam house, Kalpeni, CPI
Polling station in Lakshadweep 44Date of election 10th April 2014Total Electors 49922 Including 101 Service VotersTotal votes polled 43239Percentage of votes polled 86.60Date of counting 16th May 2014Name of returned candidate :Shri. Mohammed Faizal P.P, Nationalist Congress Party
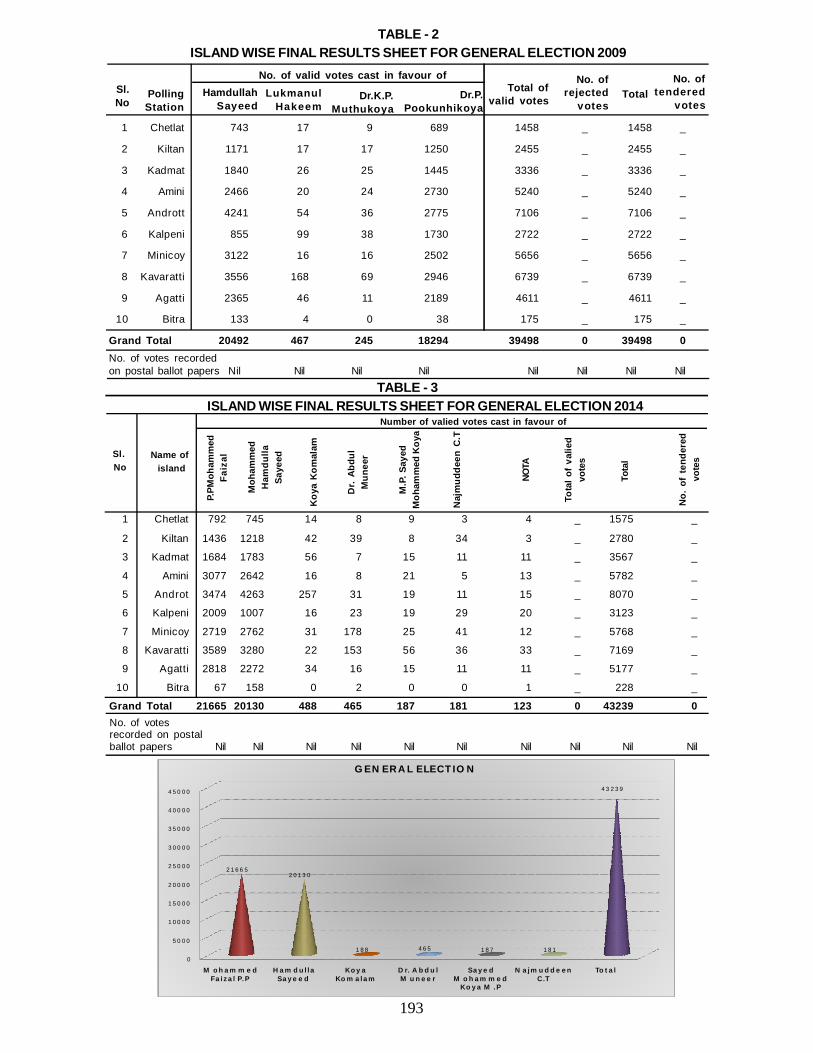
193
0
5 0 0 0
1 0 0 0 0
1 5 0 0 0
2 0 0 0 0
2 5 0 0 0
3 0 0 0 0
3 5 0 0 0
4 0 0 0 0
4 5 0 0 0
M o h a m m e d F a i z a l P. P
H a m d u l l a S a y e e d
K o y a K o m a l a m
D r. A b d u l M u n e e r
S a y e d M o h a m m e d
K o y a M . P
N a j m u d d e e n C .T
To t a l
2 1 6 6 52 0 1 3 0
1 8 8 4 6 5 1 8 7 1 8 1
4 3 2 3 9
G E N E R A L E L E C T I O N
TABLE - 3ISLAND WISE FINAL RESULTS SHEET FOR GENERAL ELECTION 2014
1 Chetlat 792 745 14 8 9 3 4 _ 1575 _
2 Kiltan 1436 1218 42 39 8 34 3 _ 2780 _
3 Kadmat 1684 1783 56 7 15 11 11 _ 3567 _
4 Amini 3077 2642 16 8 21 5 13 _ 5782 _
5 Androt 3474 4263 257 31 19 11 15 _ 8070 _
6 Kalpeni 2009 1007 16 23 19 29 20 _ 3123 _
7 Minicoy 2719 2762 31 178 25 41 12 _ 5768 _
8 Kavaratti 3589 3280 22 153 56 36 33 _ 7169 _
9 Agatti 2818 2272 34 16 15 11 11 _ 5177 _
10 Bitra 67 158 0 2 0 0 1 _ 228 _
Grand Total 21665 20130 488 465 187 181 123 0 43239 0No. of votesrecorded on postalballot papers Nil Nil Nil Nil Nil Nil Nil Nil Nil Nil
Sl. No
Number of valied votes cast in favour of
P.PM
oham
med
Faiz
al
Moh
amm
edH
amdu
llaSa
yeed
Koy
a K
omal
am
Dr.
Abdu
lM
unee
r
M.P
. Say
edM
oham
med
Koy
a
Naj
mud
deen
C.T
NOTA
Tota
l of
valie
dvo
tesName of
island
Tota
l
No.
of
tend
ered
vote
s
1 Chetlat 743 17 9 689 1458 _ 1458 _
2 Kiltan 1171 17 17 1250 2455 _ 2455 _
3 Kadmat 1840 26 25 1445 3336 _ 3336 _
4 Amini 2466 20 24 2730 5240 _ 5240 _
5 Andrott 4241 54 36 2775 7106 _ 7106 _
6 Kalpeni 855 99 38 1730 2722 _ 2722 _
7 Minicoy 3122 16 16 2502 5656 _ 5656 _
8 Kavaratti 3556 168 69 2946 6739 _ 6739 _
9 Agatti 2365 46 11 2189 4611 _ 4611 _
10 Bitra 133 4 0 38 175 _ 175 _
Grand Total 20492 467 245 18294 39498 0 39498 0No. of votes recordedon postal ballot papers Nil Nil Nil Nil Nil Nil Nil Nil
TABLE - 2ISLAND WISE FINAL RESULTS SHEET FOR GENERAL ELECTION 2009
Sl. No
No. of valid votes cast in favour ofHamdullah
SayeedLukmanul
HakeemDr.K.P.
MuthukoyaDr.P.
Pookunhikoya
Total ofvalid votes
No. of rejected
votesTotal
No. oftendered
votes PollingStation
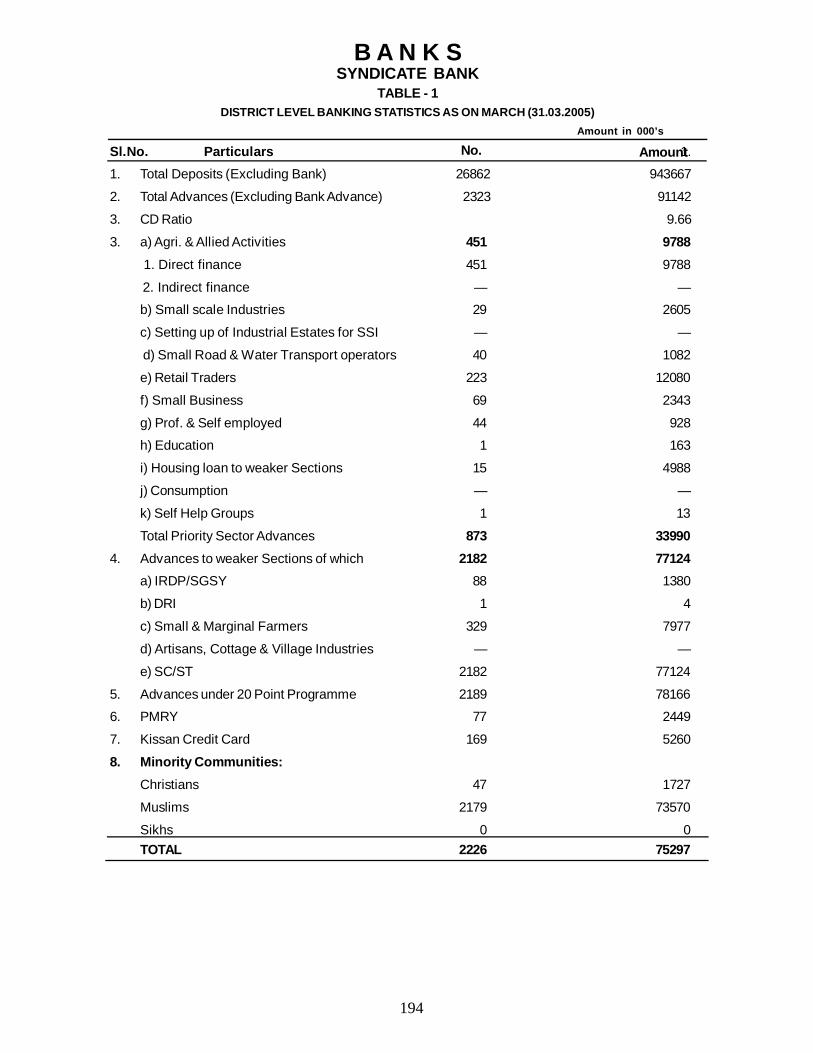
194
B A N K SSYNDICATE BANK
TABLE - 1DISTRICT LEVEL BANKING STATISTICS AS ON MARCH (31.03.2005)
Amount in 000’s
Sl.No. Particulars 1.
1. Total Deposits (Excluding Bank) 26862 943667
2. Total Advances (Excluding Bank Advance) 2323 91142
3. CD Ratio 9.66
3. a) Agri. & Allied Activities 451 9788 1. Direct finance 451 9788
2. Indirect finance — —
b) Small scale Industries 29 2605
c) Setting up of Industrial Estates for SSI — —
d) Small Road & Water Transport operators 40 1082
e) Retail Traders 223 12080
f) Small Business 69 2343
g) Prof. & Self employed 44 928
h) Education 1 163
i) Housing loan to weaker Sections 15 4988
j) Consumption — —
k) Self Help Groups 1 13
Total Priority Sector Advances 873 339904. Advances to weaker Sections of which 2182 77124
a) IRDP/SGSY 88 1380
b) DRI 1 4
c) Small & Marginal Farmers 329 7977
d) Artisans, Cottage & Village Industries — —
e) SC/ST 2182 77124
5. Advances under 20 Point Programme 2189 78166
6. PMRY 77 2449
7. Kissan Credit Card 169 5260
8. Minority Communities:Christians 47 1727
Muslims 2179 73570
Sikhs 0 0TOTAL 2226 75297
No. Amount
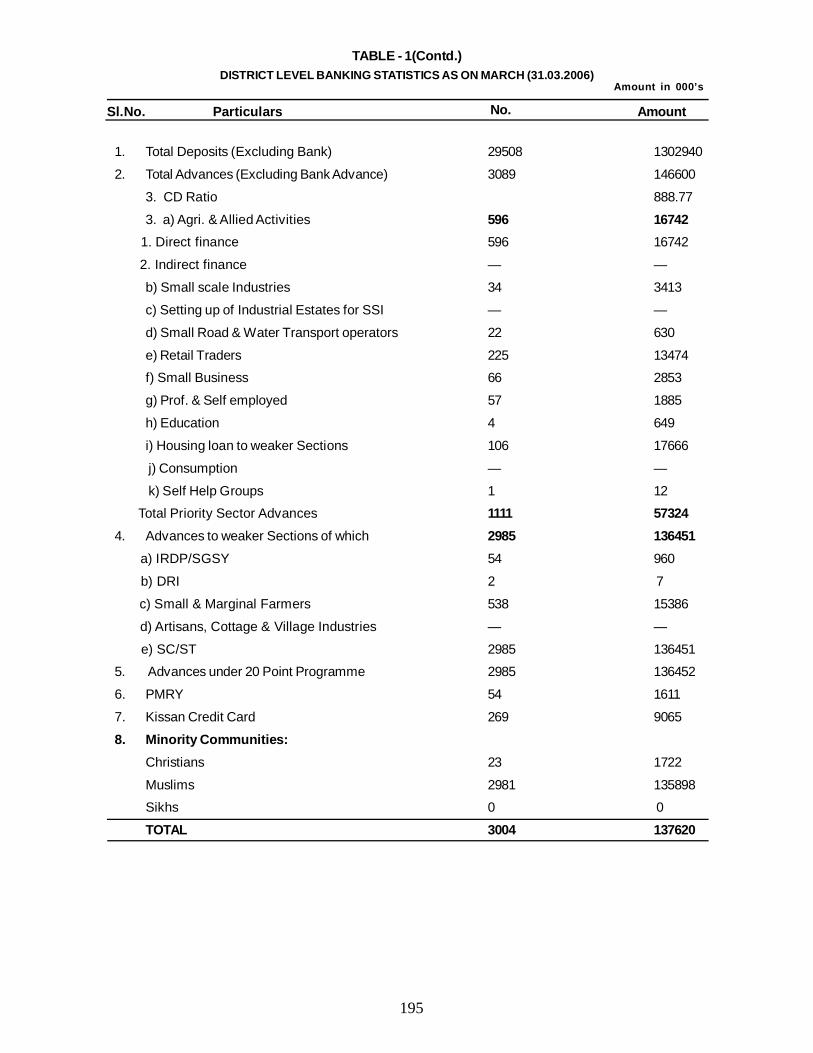
195
TABLE - 1(Contd.)DISTRICT LEVEL BANKING STATISTICS AS ON MARCH (31.03.2006)
Sl.No. Particulars
1. Total Deposits (Excluding Bank) 29508 1302940
2. Total Advances (Excluding Bank Advance) 3089 146600
3. CD Ratio 888.77
3. a) Agri. & Allied Activities 596 16742 1. Direct finance 596 16742
2. Indirect finance — —
b) Small scale Industries 34 3413
c) Setting up of Industrial Estates for SSI — —
d) Small Road & Water Transport operators 22 630
e) Retail Traders 225 13474
f) Small Business 66 2853
g) Prof. & Self employed 57 1885
h) Education 4 649
i) Housing loan to weaker Sections 106 17666
j) Consumption — —
k) Self Help Groups 1 12
Total Priority Sector Advances 1111 573244. Advances to weaker Sections of which 2985 136451
a) IRDP/SGSY 54 960
b) DRI 2 7
c) Small & Marginal Farmers 538 15386
d) Artisans, Cottage & Village Industries — —
e) SC/ST 2985 136451
5. Advances under 20 Point Programme 2985 136452
6. PMRY 54 1611
7. Kissan Credit Card 269 9065
8. Minority Communities:Christians 23 1722
Muslims 2981 135898
Sikhs 0 0
TOTAL 3004 137620
No. Amount
Amount in 000’s
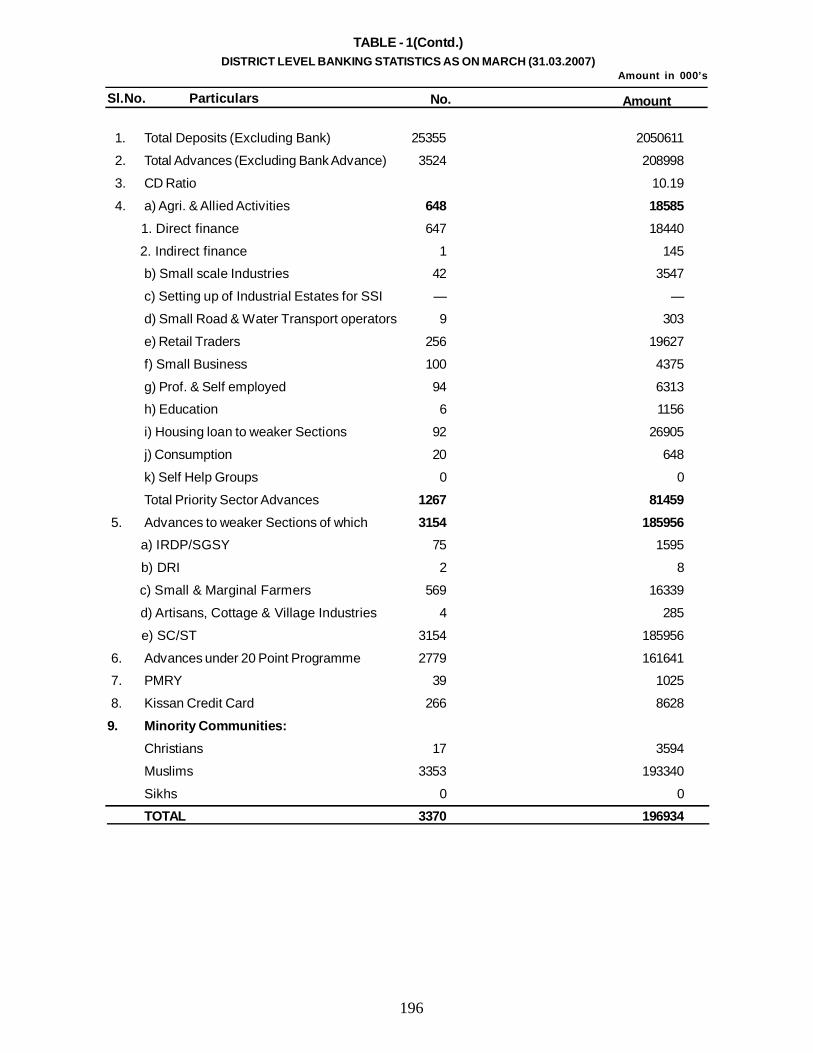
196
TABLE - 1(Contd.)DISTRICT LEVEL BANKING STATISTICS AS ON MARCH (31.03.2007)
Sl.No. Particulars
1. Total Deposits (Excluding Bank) 25355 2050611
2. Total Advances (Excluding Bank Advance) 3524 208998
3. CD Ratio 10.19
4. a) Agri. & Allied Activities 648 18585 1. Direct finance 647 18440
2. Indirect finance 1 145
b) Small scale Industries 42 3547
c) Setting up of Industrial Estates for SSI — —
d) Small Road & Water Transport operators 9 303
e) Retail Traders 256 19627
f) Small Business 100 4375
g) Prof. & Self employed 94 6313
h) Education 6 1156
i) Housing loan to weaker Sections 92 26905
j) Consumption 20 648
k) Self Help Groups 0 0
Total Priority Sector Advances 1267 81459 5. Advances to weaker Sections of which 3154 185956 a) IRDP/SGSY 75 1595
b) DRI 2 8
c) Small & Marginal Farmers 569 16339
d) Artisans, Cottage & Village Industries 4 285
e) SC/ST 3154 185956
6. Advances under 20 Point Programme 2779 161641
7. PMRY 39 1025
8. Kissan Credit Card 266 8628
9. Minority Communities:Christians 17 3594
Muslims 3353 193340
Sikhs 0 0
TOTAL 3370 196934
Amount in 000’s
No. Amount
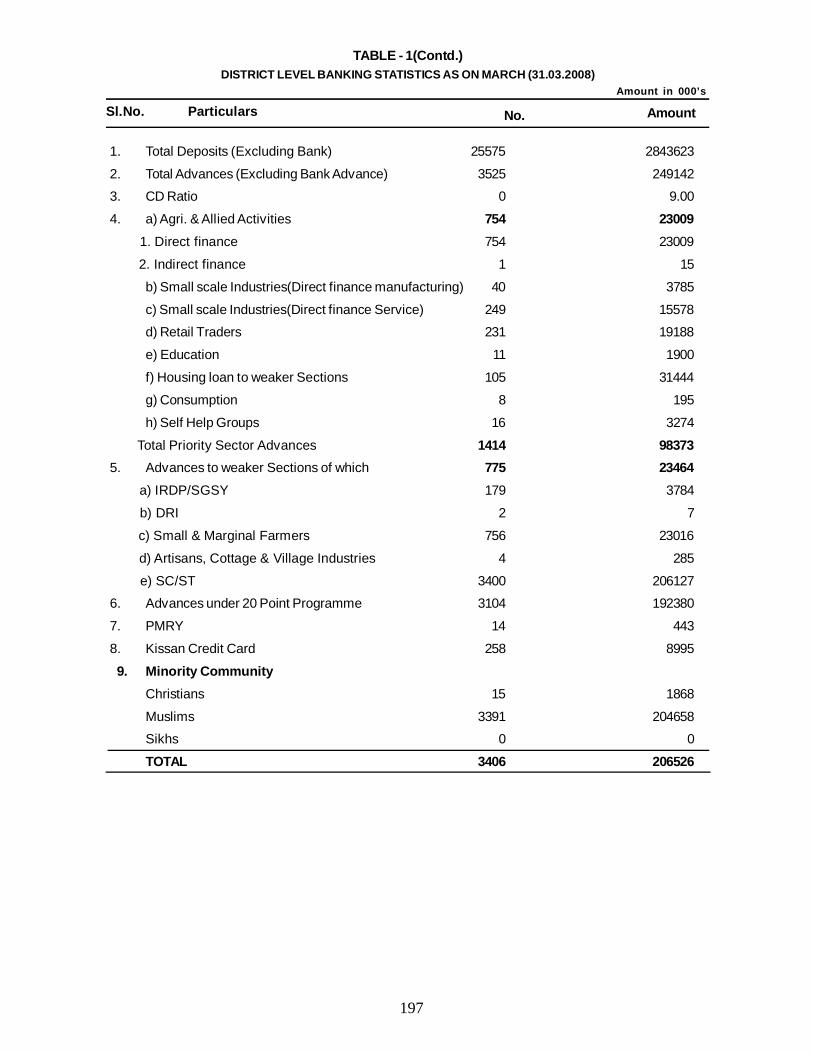
197
TABLE - 1(Contd.)DISTRICT LEVEL BANKING STATISTICS AS ON MARCH (31.03.2008)
Sl.No. Particulars
1. Total Deposits (Excluding Bank) 25575 2843623
2. Total Advances (Excluding Bank Advance) 3525 249142
3. CD Ratio 0 9.00
4. a) Agri. & Allied Activities 754 23009 1. Direct finance 754 23009
2. Indirect finance 1 15
b) Small scale Industries(Direct finance manufacturing) 40 3785
c) Small scale Industries(Direct finance Service) 249 15578
d) Retail Traders 231 19188
e) Education 11 1900
f) Housing loan to weaker Sections 105 31444
g) Consumption 8 195
h) Self Help Groups 16 3274
Total Priority Sector Advances 1414 98373 5. Advances to weaker Sections of which 775 23464 a) IRDP/SGSY 179 3784
b) DRI 2 7
c) Small & Marginal Farmers 756 23016
d) Artisans, Cottage & Village Industries 4 285
e) SC/ST 3400 206127
6. Advances under 20 Point Programme 3104 192380
7. PMRY 14 443
8. Kissan Credit Card 258 8995
9. Minority CommunityChristians 15 1868
Muslims 3391 204658
Sikhs 0 0
TOTAL 3406 206526
AmountNo.
Amount in 000’s
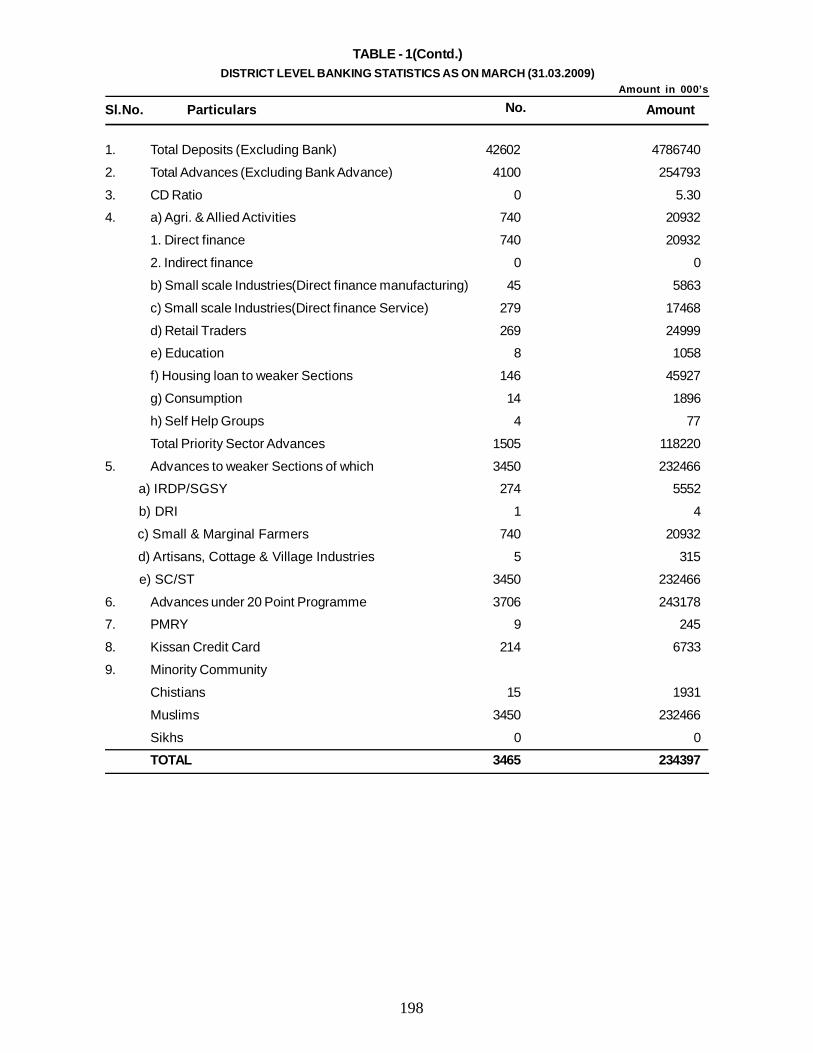
198
TABLE - 1(Contd.)DISTRICT LEVEL BANKING STATISTICS AS ON MARCH (31.03.2009)
Sl.No. Particulars
1. Total Deposits (Excluding Bank) 42602 4786740
2. Total Advances (Excluding Bank Advance) 4100 254793
3. CD Ratio 0 5.30
4. a) Agri. & Allied Activities 740 20932
1. Direct finance 740 20932
2. Indirect finance 0 0
b) Small scale Industries(Direct finance manufacturing) 45 5863
c) Small scale Industries(Direct finance Service) 279 17468
d) Retail Traders 269 24999
e) Education 8 1058
f) Housing loan to weaker Sections 146 45927
g) Consumption 14 1896
h) Self Help Groups 4 77
Total Priority Sector Advances 1505 118220
5. Advances to weaker Sections of which 3450 232466
a) IRDP/SGSY 274 5552
b) DRI 1 4
c) Small & Marginal Farmers 740 20932
d) Artisans, Cottage & Village Industries 5 315
e) SC/ST 3450 232466
6. Advances under 20 Point Programme 3706 243178
7. PMRY 9 245
8. Kissan Credit Card 214 6733
9. Minority Community
Chistians 15 1931
Muslims 3450 232466
Sikhs 0 0
TOTAL 3465 234397
AmountNo.Amount in 000’s
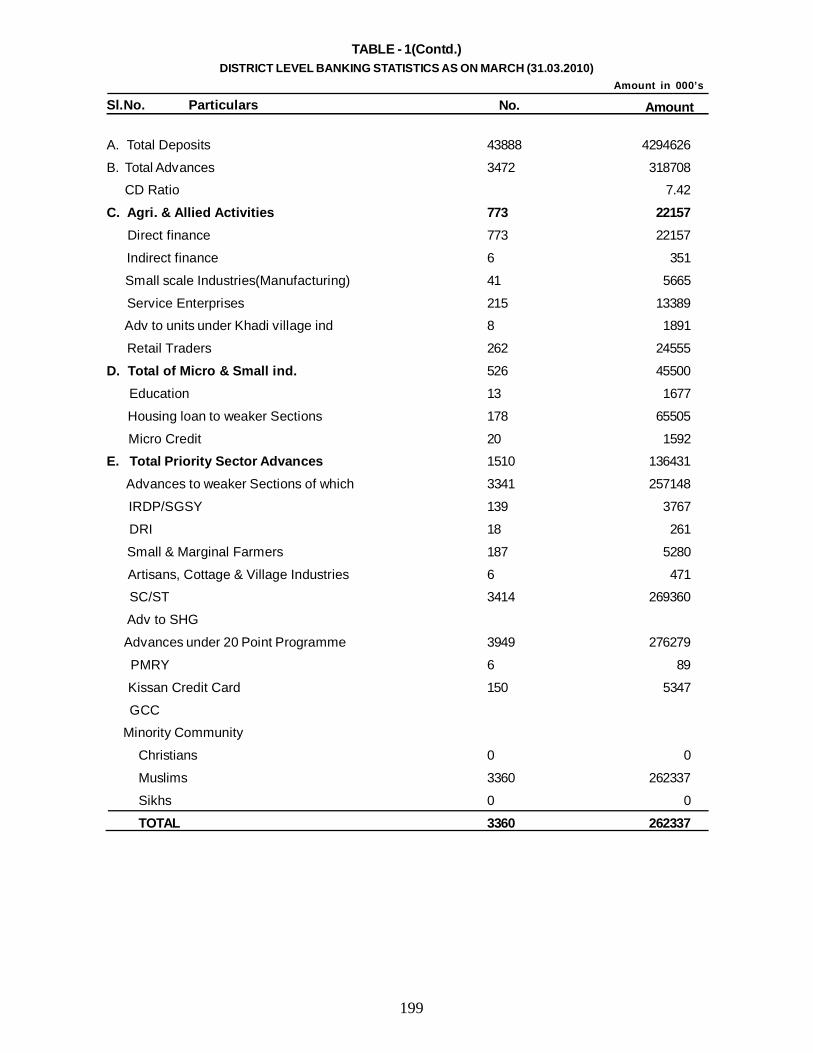
199
TABLE - 1(Contd.)DISTRICT LEVEL BANKING STATISTICS AS ON MARCH (31.03.2010)
Sl.No. Particulars
A. Total Deposits 43888 4294626
B. Total Advances 3472 318708
CD Ratio 7.42
C. Agri. & Allied Activities 773 22157 Direct finance 773 22157
Indirect finance 6 351
Small scale Industries(Manufacturing) 41 5665
Service Enterprises 215 13389
Adv to units under Khadi village ind 8 1891
Retail Traders 262 24555
D. Total of Micro & Small ind. 526 45500
Education 13 1677
Housing loan to weaker Sections 178 65505
Micro Credit 20 1592
E. Total Priority Sector Advances 1510 136431
Advances to weaker Sections of which 3341 257148
IRDP/SGSY 139 3767
DRI 18 261
Small & Marginal Farmers 187 5280
Artisans, Cottage & Village Industries 6 471
SC/ST 3414 269360
Adv to SHG
Advances under 20 Point Programme 3949 276279
PMRY 6 89
Kissan Credit Card 150 5347
GCC
Minority Community
Christians 0 0
Muslims 3360 262337
Sikhs 0 0
TOTAL 3360 262337
No. AmountAmount in 000’s
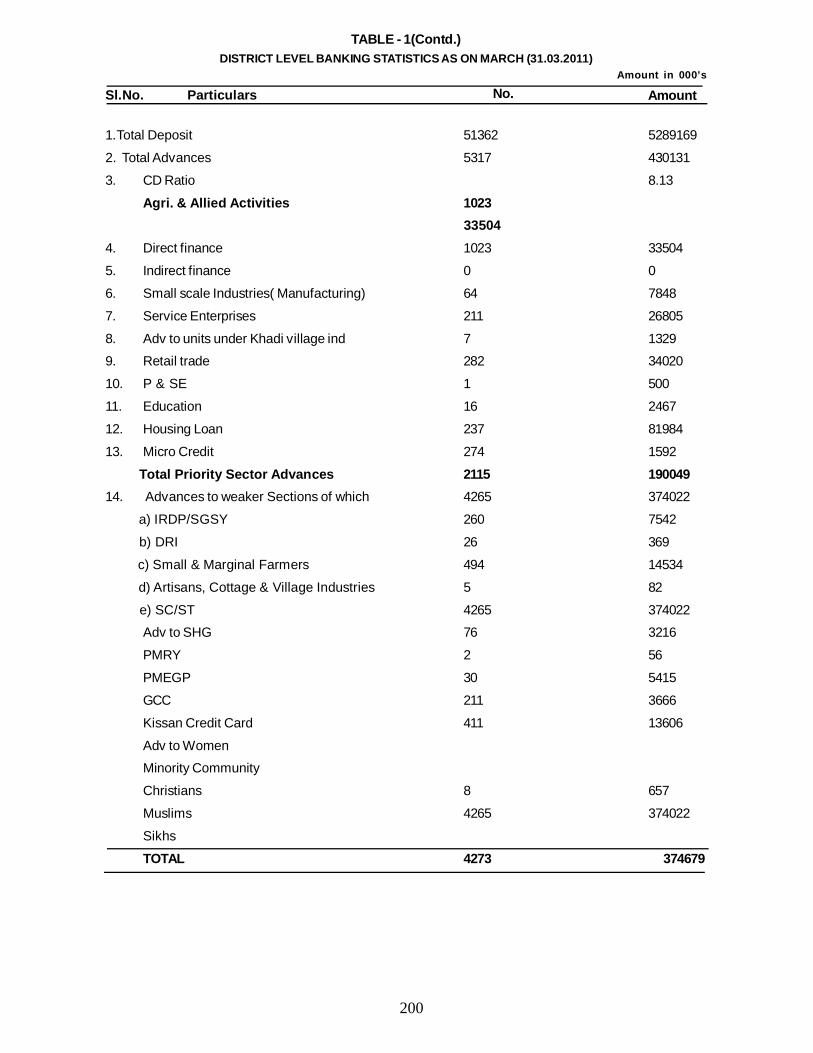
200
TABLE - 1(Contd.)DISTRICT LEVEL BANKING STATISTICS AS ON MARCH (31.03.2011)
Sl.No. Particulars
1.Total Deposit 51362 5289169
2. Total Advances 5317 430131
3. CD Ratio 8.13
Agri. & Allied Activities 1023 33504
4. Direct finance 1023 33504
5. Indirect finance 0 0
6. Small scale Industries( Manufacturing) 64 7848
7. Service Enterprises 211 26805
8. Adv to units under Khadi village ind 7 1329
9. Retail trade 282 34020
10. P & SE 1 500
11. Education 16 2467
12. Housing Loan 237 81984
13. Micro Credit 274 1592
Total Priority Sector Advances 2115 19004914. Advances to weaker Sections of which 4265 374022
a) IRDP/SGSY 260 7542
b) DRI 26 369
c) Small & Marginal Farmers 494 14534
d) Artisans, Cottage & Village Industries 5 82
e) SC/ST 4265 374022
Adv to SHG 76 3216
PMRY 2 56
PMEGP 30 5415
GCC 211 3666
Kissan Credit Card 411 13606
Adv to Women
Minority Community
Christians 8 657
Muslims 4265 374022
Sikhs
TOTAL 4273 374679
No. AmountAmount in 000’s
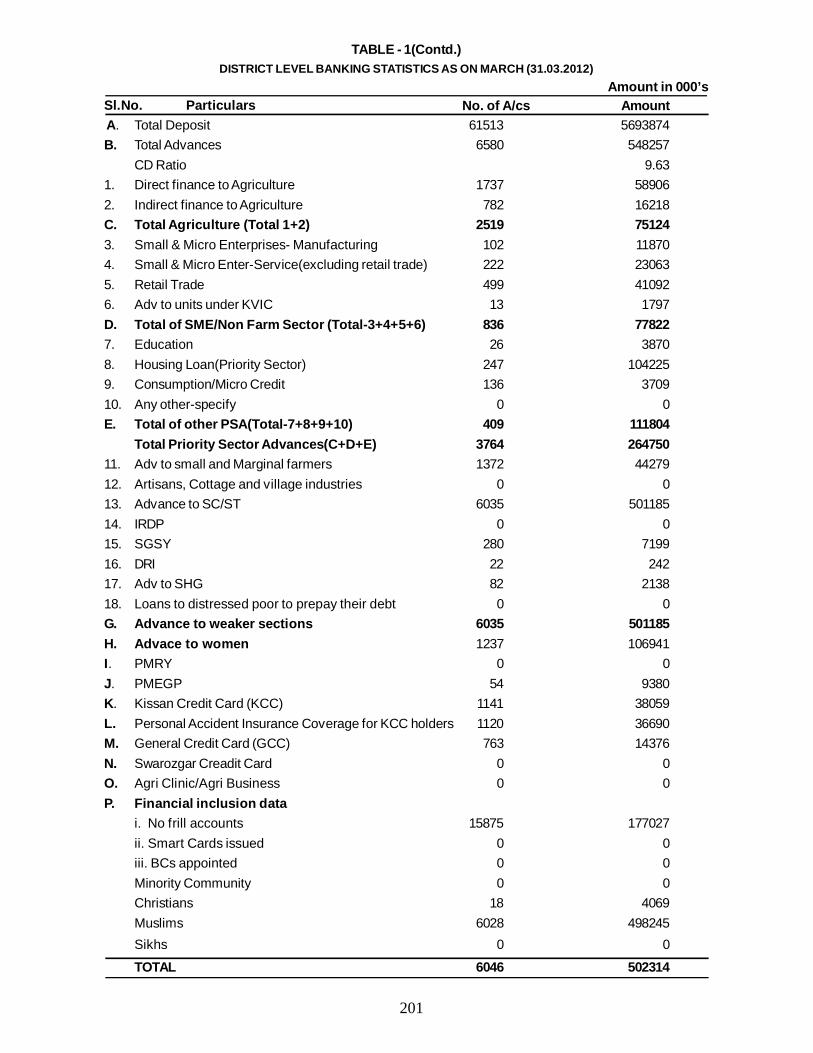
201
TABLE - 1(Contd.)DISTRICT LEVEL BANKING STATISTICS AS ON MARCH (31.03.2012)
Amount in 000’sSl.No. ParticularsA. Total Deposit 61513 5693874B. Total Advances 6580 548257
CD Ratio 9.631. Direct finance to Agriculture 1737 589062. Indirect finance to Agriculture 782 16218C. Total Agriculture (Total 1+2) 2519 751243. Small & Micro Enterprises- Manufacturing 102 118704. Small & Micro Enter-Service(excluding retail trade) 222 230635. Retail Trade 499 410926. Adv to units under KVIC 13 1797D. Total of SME/Non Farm Sector (Total-3+4+5+6) 836 778227. Education 26 38708. Housing Loan(Priority Sector) 247 1042259. Consumption/Micro Credit 136 370910. Any other-specify 0 0E. Total of other PSA(Total-7+8+9+10) 409 111804
Total Priority Sector Advances(C+D+E) 3764 26475011. Adv to small and Marginal farmers 1372 4427912. Artisans, Cottage and village industries 0 013. Advance to SC/ST 6035 50118514. IRDP 0 015. SGSY 280 719916. DRI 22 24217. Adv to SHG 82 213818. Loans to distressed poor to prepay their debt 0 0G. Advance to weaker sections 6035 501185H. Advace to women 1237 106941I. PMRY 0 0J. PMEGP 54 9380K. Kissan Credit Card (KCC) 1141 38059L. Personal Accident Insurance Coverage for KCC holders 1120 36690M. General Credit Card (GCC) 763 14376N. Swarozgar Creadit Card 0 0O. Agri Clinic/Agri Business 0 0P. Financial inclusion data
i. No frill accounts 15875 177027ii. Smart Cards issued 0 0iii. BCs appointed 0 0Minority Community 0 0Christians 18 4069Muslims 6028 498245Sikhs 0 0
TOTAL 6046 502314
No. of A/cs Amount
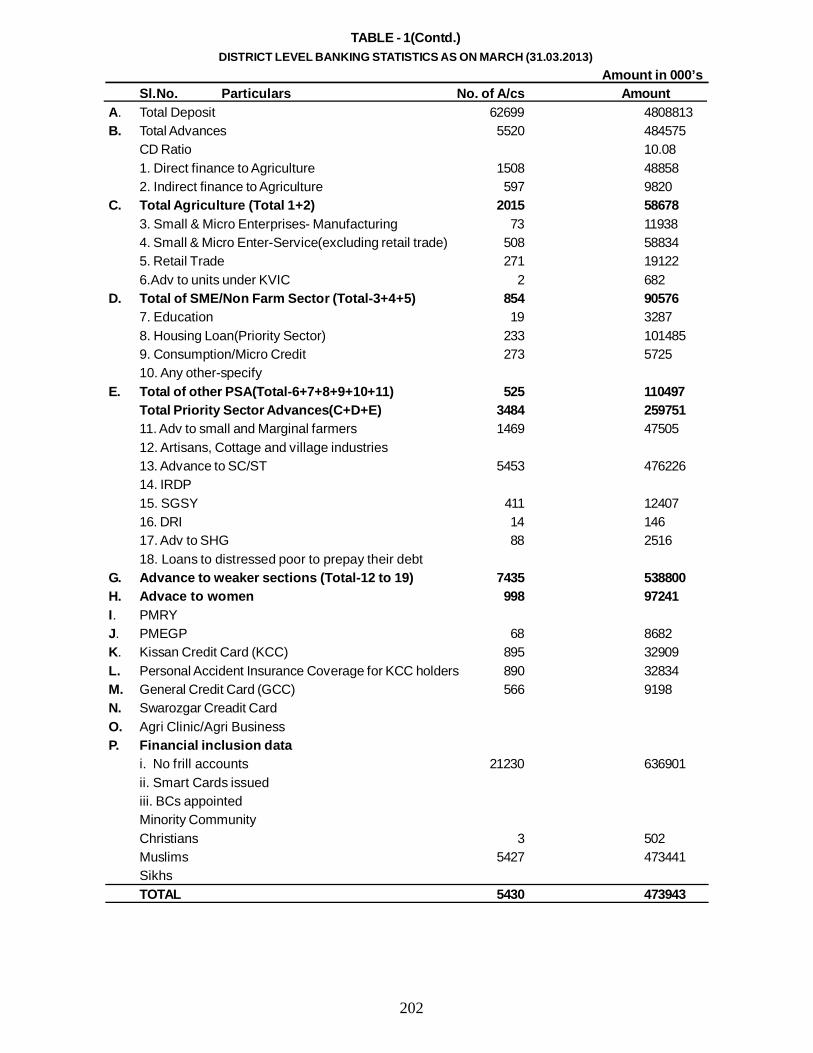
202
TABLE - 1(Contd.)DISTRICT LEVEL BANKING STATISTICS AS ON MARCH (31.03.2013)
Amount in 000’sSl.No. Particulars No. of A/cs Amount
A. Total Deposit 62699 4808813B. Total Advances 5520 484575
CD Ratio 10.081. Direct finance to Agriculture 1508 488582. Indirect finance to Agriculture 597 9820
C. Total Agriculture (Total 1+2) 2015 586783. Small & Micro Enterprises- Manufacturing 73 119384. Small & Micro Enter-Service(excluding retail trade) 508 588345. Retail Trade 271 191226.Adv to units under KVIC 2 682
D. Total of SME/Non Farm Sector (Total-3+4+5) 854 905767. Education 19 32878. Housing Loan(Priority Sector) 233 1014859. Consumption/Micro Credit 273 572510. Any other-specify
E. Total of other PSA(Total-6+7+8+9+10+11) 525 110497Total Priority Sector Advances(C+D+E) 3484 25975111. Adv to small and Marginal farmers 1469 4750512. Artisans, Cottage and village industries13. Advance to SC/ST 5453 47622614. IRDP15. SGSY 411 1240716. DRI 14 14617. Adv to SHG 88 251618. Loans to distressed poor to prepay their debt
G. Advance to weaker sections (Total-12 to 19) 7435 538800H. Advace to women 998 97241I. PMRYJ. PMEGP 68 8682K. Kissan Credit Card (KCC) 895 32909L. Personal Accident Insurance Coverage for KCC holders 890 32834M. General Credit Card (GCC) 566 9198N. Swarozgar Creadit CardO. Agri Clinic/Agri BusinessP. Financial inclusion data
i. No frill accounts 21230 636901ii. Smart Cards issuediii. BCs appointedMinority CommunityChristians 3 502Muslims 5427 473441SikhsTOTAL 5430 473943
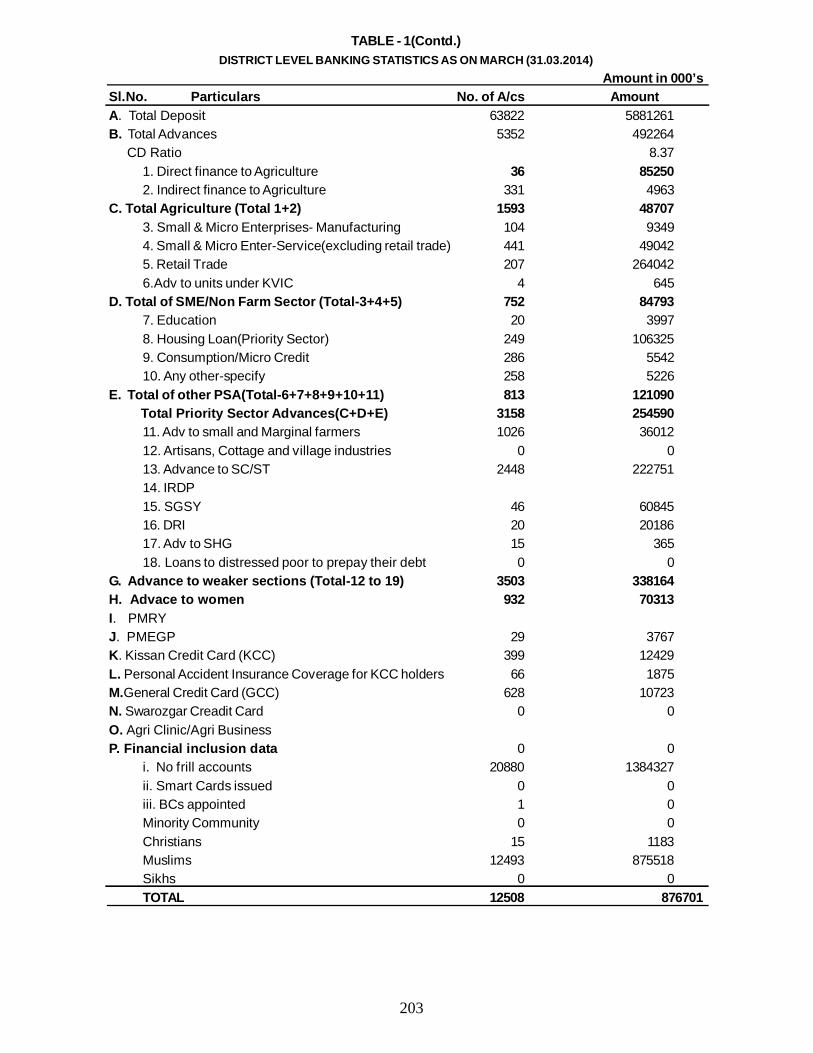
203
TABLE - 1(Contd.)DISTRICT LEVEL BANKING STATISTICS AS ON MARCH (31.03.2014)
Amount in 000’sSl.No. Particulars No. of A/cs AmountA. Total Deposit 63822 5881261B. Total Advances 5352 492264 CD Ratio 8.37
1. Direct finance to Agriculture 36 852502. Indirect finance to Agriculture 331 4963
C. Total Agriculture (Total 1+2) 1593 487073. Small & Micro Enterprises- Manufacturing 104 93494. Small & Micro Enter-Service(excluding retail trade) 441 490425. Retail Trade 207 2640426.Adv to units under KVIC 4 645
D. Total of SME/Non Farm Sector (Total-3+4+5) 752 847937. Education 20 39978. Housing Loan(Priority Sector) 249 1063259. Consumption/Micro Credit 286 554210. Any other-specify 258 5226
E. Total of other PSA(Total-6+7+8+9+10+11) 813 121090 Total Priority Sector Advances(C+D+E) 3158 254590
11. Adv to small and Marginal farmers 1026 3601212. Artisans, Cottage and village industries 0 013. Advance to SC/ST 2448 22275114. IRDP15. SGSY 46 6084516. DRI 20 2018617. Adv to SHG 15 36518. Loans to distressed poor to prepay their debt 0 0
G. Advance to weaker sections (Total-12 to 19) 3503 338164H. Advace to women 932 70313I. PMRYJ. PMEGP 29 3767K. Kissan Credit Card (KCC) 399 12429L. Personal Accident Insurance Coverage for KCC holders 66 1875M.General Credit Card (GCC) 628 10723N. Swarozgar Creadit Card 0 0O. Agri Clinic/Agri BusinessP. Financial inclusion data 0 0
i. No frill accounts 20880 1384327ii. Smart Cards issued 0 0iii. BCs appointed 1 0Minority Community 0 0Christians 15 1183Muslims 12493 875518Sikhs 0 0TOTAL 12508 876701
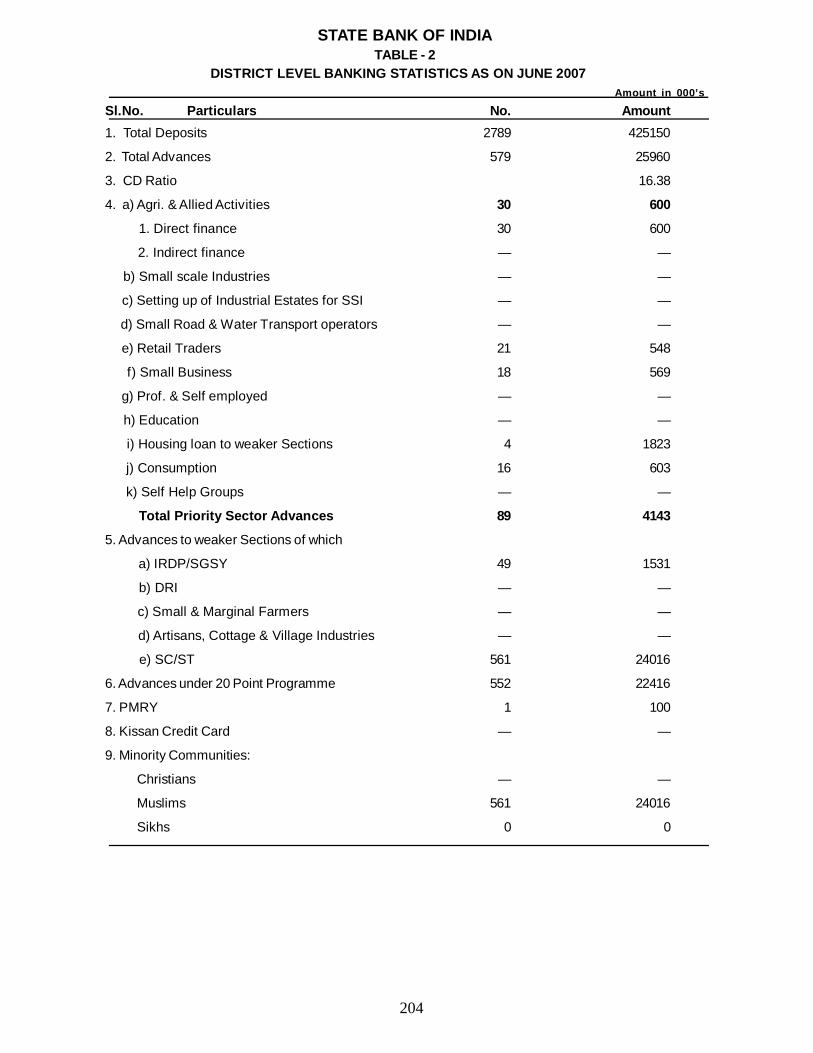
204
STATE BANK OF INDIATABLE - 2
DISTRICT LEVEL BANKING STATISTICS AS ON JUNE 2007Amount in 000’s
Sl.No. Particulars No. Amount1. Total Deposits 2789 425150
2. Total Advances 579 25960
3. CD Ratio 16.38
4. a) Agri. & Allied Activities 30 600
1. Direct finance 30 600
2. Indirect finance — —
b) Small scale Industries — —
c) Setting up of Industrial Estates for SSI — —
d) Small Road & Water Transport operators — —
e) Retail Traders 21 548
f) Small Business 18 569
g) Prof. & Self employed — —
h) Education — —
i) Housing loan to weaker Sections 4 1823
j) Consumption 16 603
k) Self Help Groups — —
Total Priority Sector Advances 89 4143
5. Advances to weaker Sections of which
a) IRDP/SGSY 49 1531
b) DRI — —
c) Small & Marginal Farmers — —
d) Artisans, Cottage & Village Industries — —
e) SC/ST 561 24016
6. Advances under 20 Point Programme 552 22416
7. PMRY 1 100
8. Kissan Credit Card — —
9. Minority Communities:
Christians — —
Muslims 561 24016
Sikhs 0 0
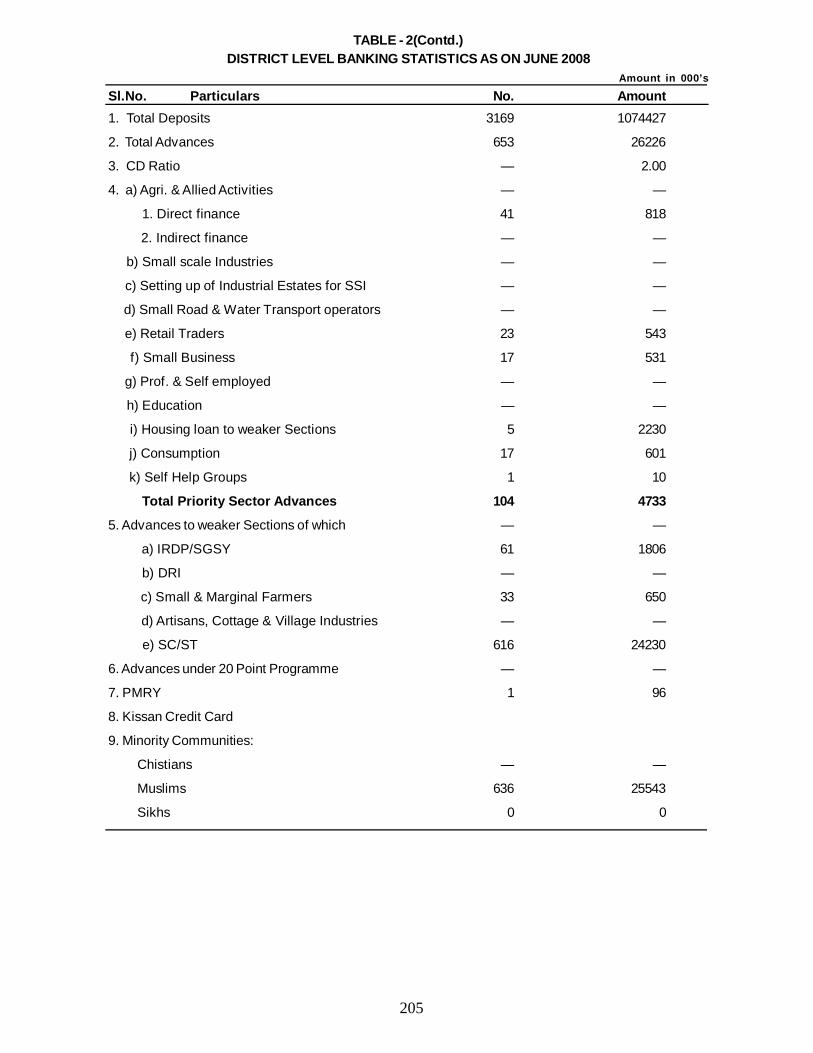
205
TABLE - 2(Contd.)DISTRICT LEVEL BANKING STATISTICS AS ON JUNE 2008
Amount in 000’s
Sl.No. Particulars No. Amount1. Total Deposits 3169 1074427
2. Total Advances 653 26226
3. CD Ratio — 2.00
4. a) Agri. & Allied Activities — —
1. Direct finance 41 818
2. Indirect finance — —
b) Small scale Industries — —
c) Setting up of Industrial Estates for SSI — —
d) Small Road & Water Transport operators — —
e) Retail Traders 23 543
f) Small Business 17 531
g) Prof. & Self employed — —
h) Education — —
i) Housing loan to weaker Sections 5 2230
j) Consumption 17 601
k) Self Help Groups 1 10
Total Priority Sector Advances 104 4733
5. Advances to weaker Sections of which — —
a) IRDP/SGSY 61 1806
b) DRI — —
c) Small & Marginal Farmers 33 650
d) Artisans, Cottage & Village Industries — —
e) SC/ST 616 24230
6. Advances under 20 Point Programme — —
7. PMRY 1 96
8. Kissan Credit Card
9. Minority Communities:
Chistians — —
Muslims 636 25543
Sikhs 0 0
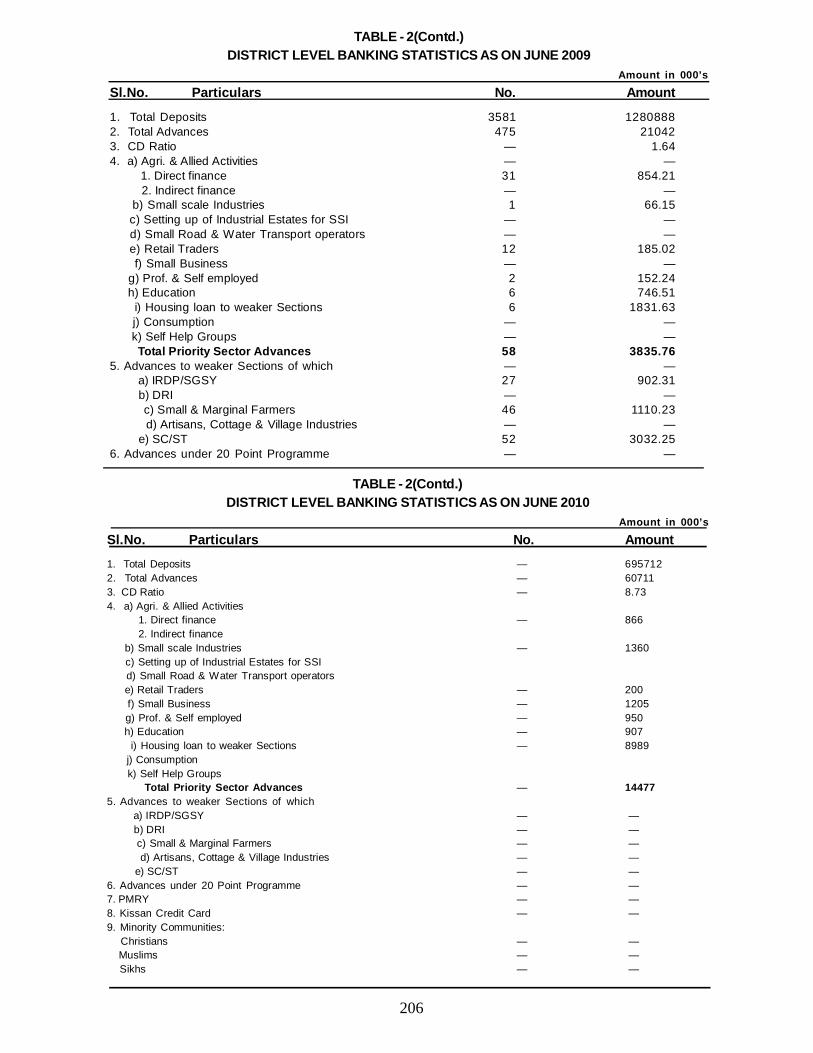
206
TABLE - 2(Contd.)DISTRICT LEVEL BANKING STATISTICS AS ON JUNE 2009
Amount in 000’s
Sl.No. Particulars No. Amount
1. Total Deposits 3581 12808882. Total Advances 475 210423. CD Ratio — 1.644. a) Agri. & Allied Activities — — 1. Direct finance 31 854.21 2. Indirect finance — — b) Small scale Industries 1 66.15 c) Setting up of Industrial Estates for SSI — — d) Small Road & Water Transport operators — — e) Retail Traders 12 185.02 f) Small Business — — g) Prof. & Self employed 2 152.24 h) Education 6 746.51 i) Housing loan to weaker Sections 6 1831.63 j) Consumption — — k) Self Help Groups — — Total Priority Sector Advances 58 3835.765. Advances to weaker Sections of which — — a) IRDP/SGSY 27 902.31 b) DRI — — c) Small & Marginal Farmers 46 1110.23 d) Artisans, Cottage & Village Industries — — e) SC/ST 52 3032.256. Advances under 20 Point Programme — —
TABLE - 2(Contd.)DISTRICT LEVEL BANKING STATISTICS AS ON JUNE 2010
Amount in 000’s
Sl.No. Particulars No. Amount1. Total Deposits — 6957122. Total Advances — 607113. CD Ratio — 8.734. a) Agri. & Allied Activities 1. Direct finance — 866 2. Indirect finance b) Small scale Industries — 1360 c) Setting up of Industrial Estates for SSI d) Small Road & Water Transport operators e) Retail Traders — 200 f) Small Business — 1205 g) Prof. & Self employed — 950 h) Education — 907 i) Housing loan to weaker Sections — 8989 j) Consumption k) Self Help Groups Total Priority Sector Advances — 144775. Advances to weaker Sections of which a) IRDP/SGSY — — b) DRI — — c) Small & Marginal Farmers — — d) Artisans, Cottage & Village Industries — — e) SC/ST — —6. Advances under 20 Point Programme — —7. PMRY — —8. Kissan Credit Card — —9. Minority Communities: Christians — — Muslims — — Sikhs — —
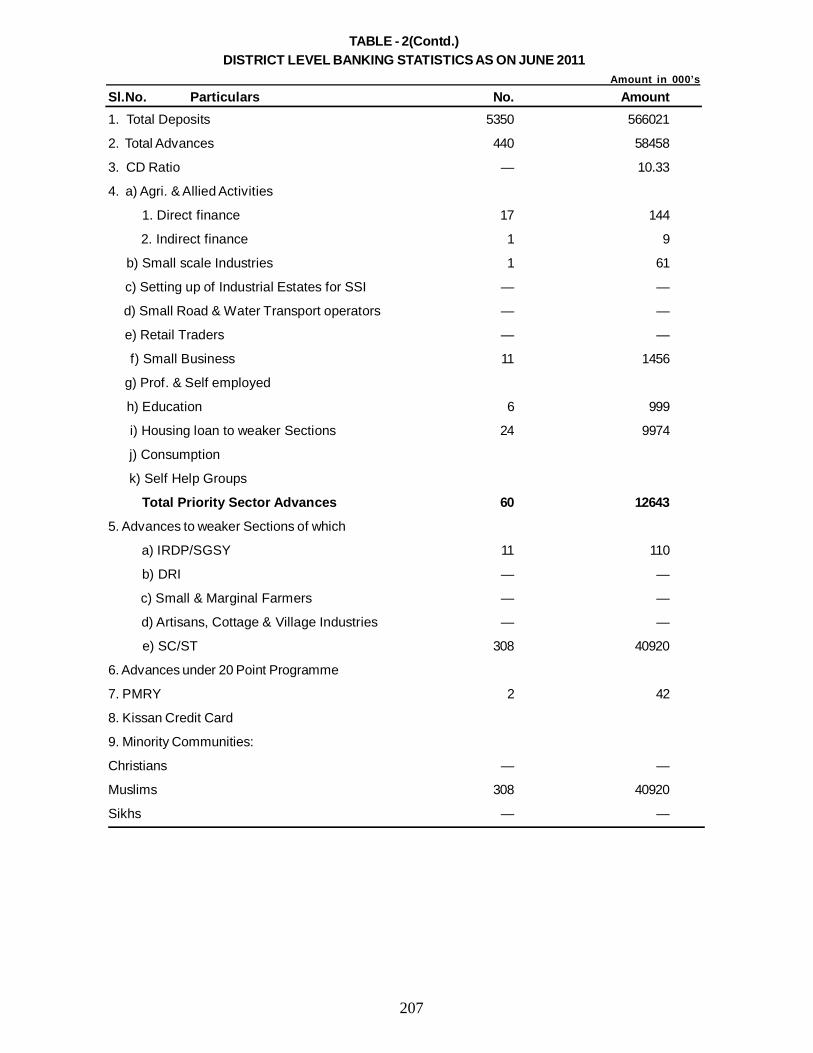
207
TABLE - 2(Contd.)DISTRICT LEVEL BANKING STATISTICS AS ON JUNE 2011
Amount in 000’s
Sl.No. Particulars No. Amount1. Total Deposits 5350 566021
2. Total Advances 440 58458
3. CD Ratio — 10.33
4. a) Agri. & Allied Activities
1. Direct finance 17 144
2. Indirect finance 1 9
b) Small scale Industries 1 61
c) Setting up of Industrial Estates for SSI — —
d) Small Road & Water Transport operators — —
e) Retail Traders — —
f) Small Business 11 1456
g) Prof. & Self employed
h) Education 6 999
i) Housing loan to weaker Sections 24 9974
j) Consumption
k) Self Help Groups
Total Priority Sector Advances 60 12643
5. Advances to weaker Sections of which
a) IRDP/SGSY 11 110
b) DRI — —
c) Small & Marginal Farmers — —
d) Artisans, Cottage & Village Industries — —
e) SC/ST 308 40920
6. Advances under 20 Point Programme
7. PMRY 2 42
8. Kissan Credit Card
9. Minority Communities:
Christians — —
Muslims 308 40920
Sikhs — —
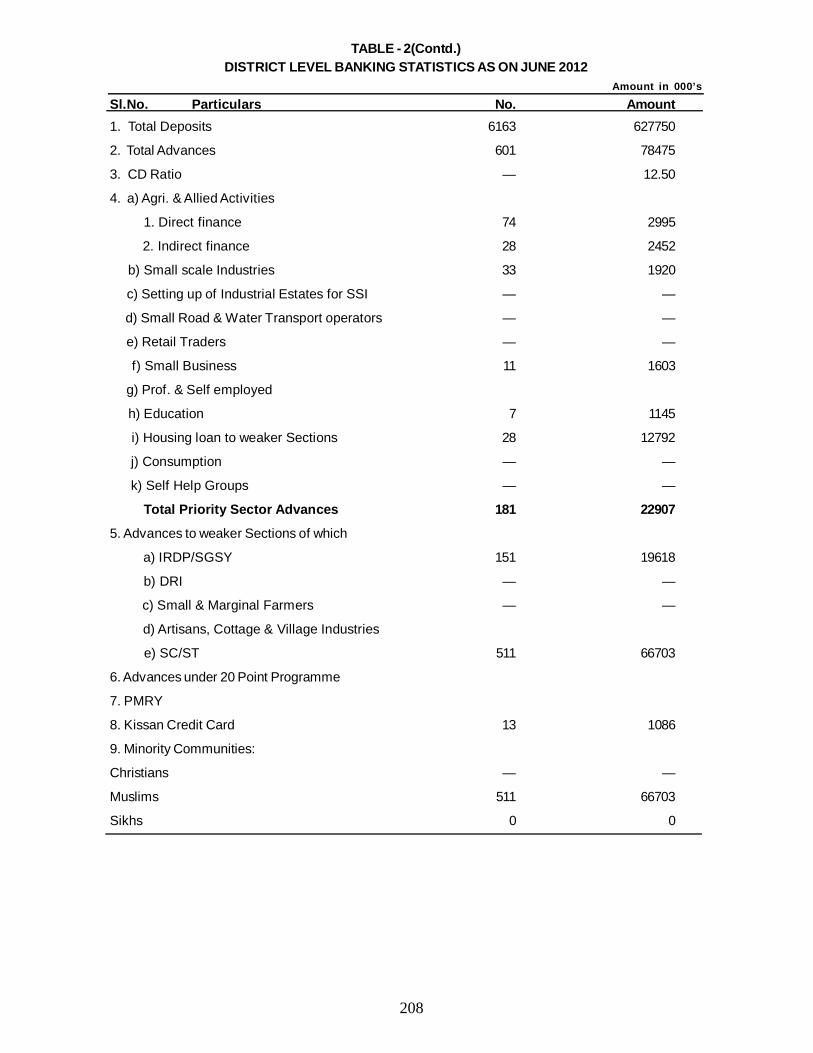
208
TABLE - 2(Contd.)DISTRICT LEVEL BANKING STATISTICS AS ON JUNE 2012
Amount in 000’s
Sl.No. Particulars No. Amount1. Total Deposits 6163 627750
2. Total Advances 601 78475
3. CD Ratio — 12.50
4. a) Agri. & Allied Activities
1. Direct finance 74 2995
2. Indirect finance 28 2452
b) Small scale Industries 33 1920
c) Setting up of Industrial Estates for SSI — —
d) Small Road & Water Transport operators — —
e) Retail Traders — —
f) Small Business 11 1603
g) Prof. & Self employed
h) Education 7 1145
i) Housing loan to weaker Sections 28 12792
j) Consumption — —
k) Self Help Groups — —
Total Priority Sector Advances 181 22907
5. Advances to weaker Sections of which
a) IRDP/SGSY 151 19618
b) DRI — —
c) Small & Marginal Farmers — —
d) Artisans, Cottage & Village Industries
e) SC/ST 511 66703
6. Advances under 20 Point Programme
7. PMRY
8. Kissan Credit Card 13 1086
9. Minority Communities:
Christians — —
Muslims 511 66703
Sikhs 0 0
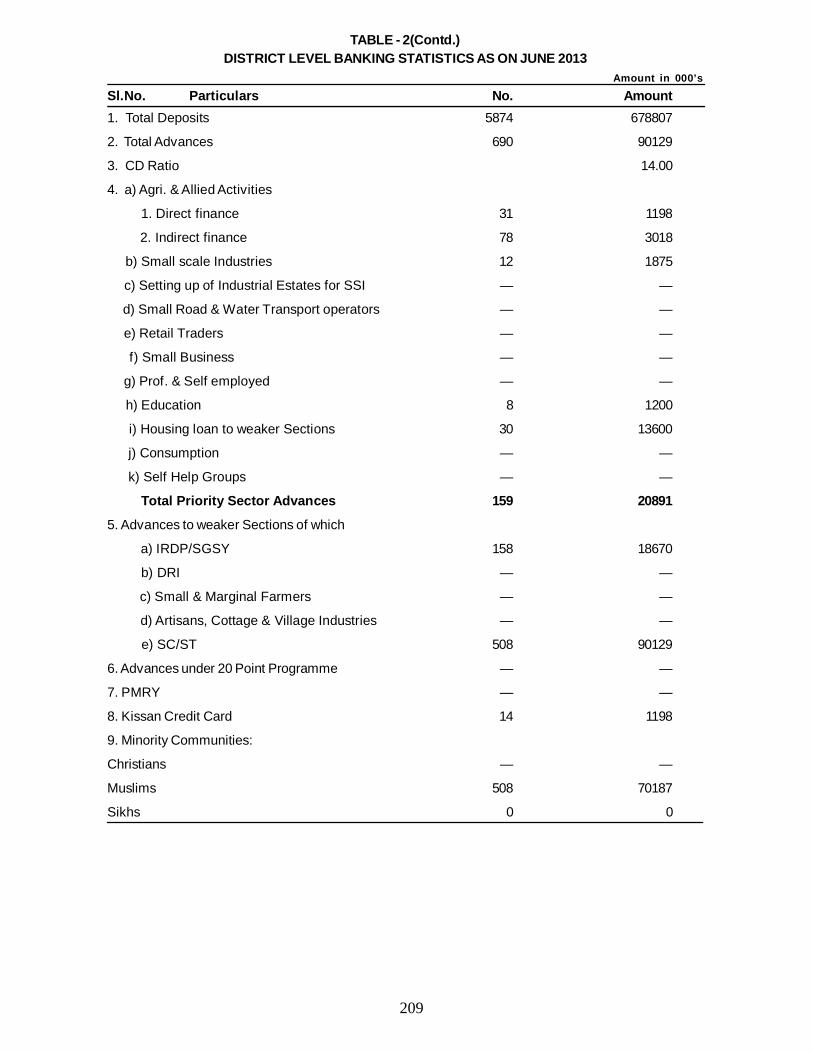
209
TABLE - 2(Contd.)DISTRICT LEVEL BANKING STATISTICS AS ON JUNE 2013
Amount in 000’s
Sl.No. Particulars No. Amount1. Total Deposits 5874 678807
2. Total Advances 690 90129
3. CD Ratio 14.00
4. a) Agri. & Allied Activities
1. Direct finance 31 1198
2. Indirect finance 78 3018
b) Small scale Industries 12 1875
c) Setting up of Industrial Estates for SSI — —
d) Small Road & Water Transport operators — —
e) Retail Traders — —
f) Small Business — —
g) Prof. & Self employed — —
h) Education 8 1200
i) Housing loan to weaker Sections 30 13600
j) Consumption — —
k) Self Help Groups — —
Total Priority Sector Advances 159 20891
5. Advances to weaker Sections of which
a) IRDP/SGSY 158 18670
b) DRI — —
c) Small & Marginal Farmers — —
d) Artisans, Cottage & Village Industries — —
e) SC/ST 508 90129
6. Advances under 20 Point Programme — —
7. PMRY — —
8. Kissan Credit Card 14 1198
9. Minority Communities:
Christians — —
Muslims 508 70187
Sikhs 0 0
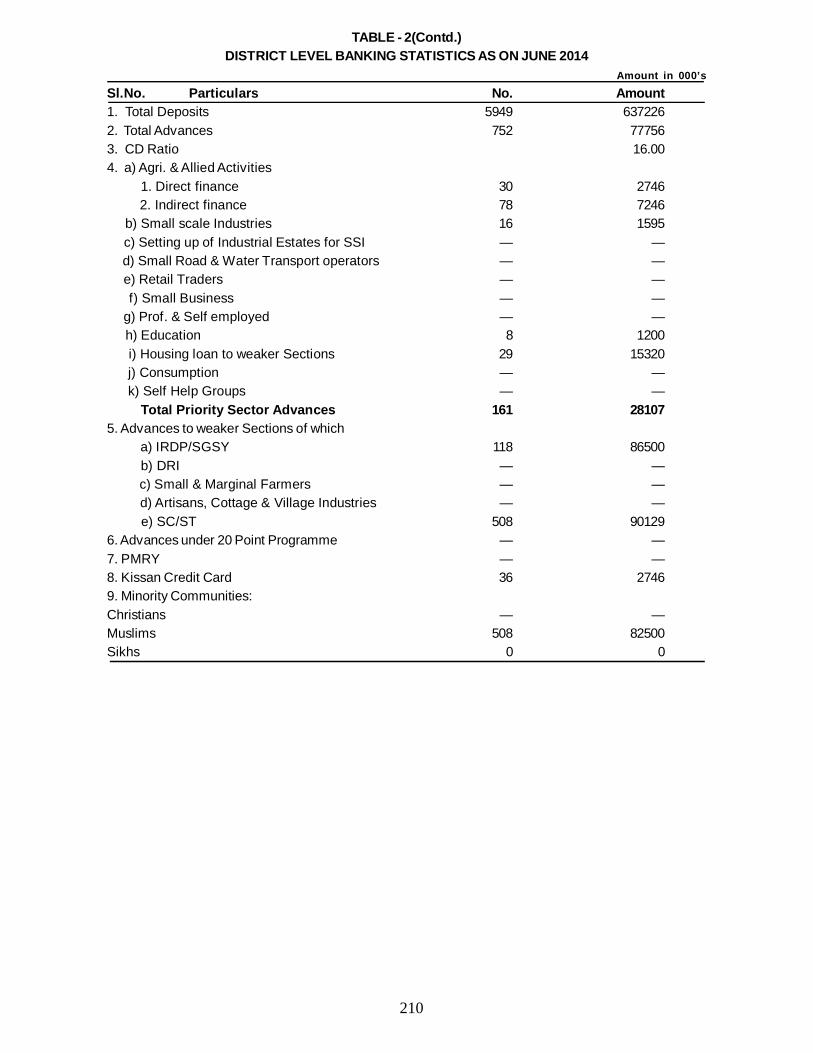
210
TABLE - 2(Contd.)DISTRICT LEVEL BANKING STATISTICS AS ON JUNE 2014
Amount in 000’s
Sl.No. Particulars No. Amount1. Total Deposits 5949 6372262. Total Advances 752 777563. CD Ratio 16.004. a) Agri. & Allied Activities 1. Direct finance 30 2746 2. Indirect finance 78 7246 b) Small scale Industries 16 1595 c) Setting up of Industrial Estates for SSI — — d) Small Road & Water Transport operators — — e) Retail Traders — — f) Small Business — — g) Prof. & Self employed — — h) Education 8 1200 i) Housing loan to weaker Sections 29 15320 j) Consumption — — k) Self Help Groups — — Total Priority Sector Advances 161 281075. Advances to weaker Sections of which a) IRDP/SGSY 118 86500 b) DRI — — c) Small & Marginal Farmers — — d) Artisans, Cottage & Village Industries — — e) SC/ST 508 901296. Advances under 20 Point Programme — —7. PMRY — —8. Kissan Credit Card 36 27469. Minority Communities:Christians — —Muslims 508 82500Sikhs 0 0
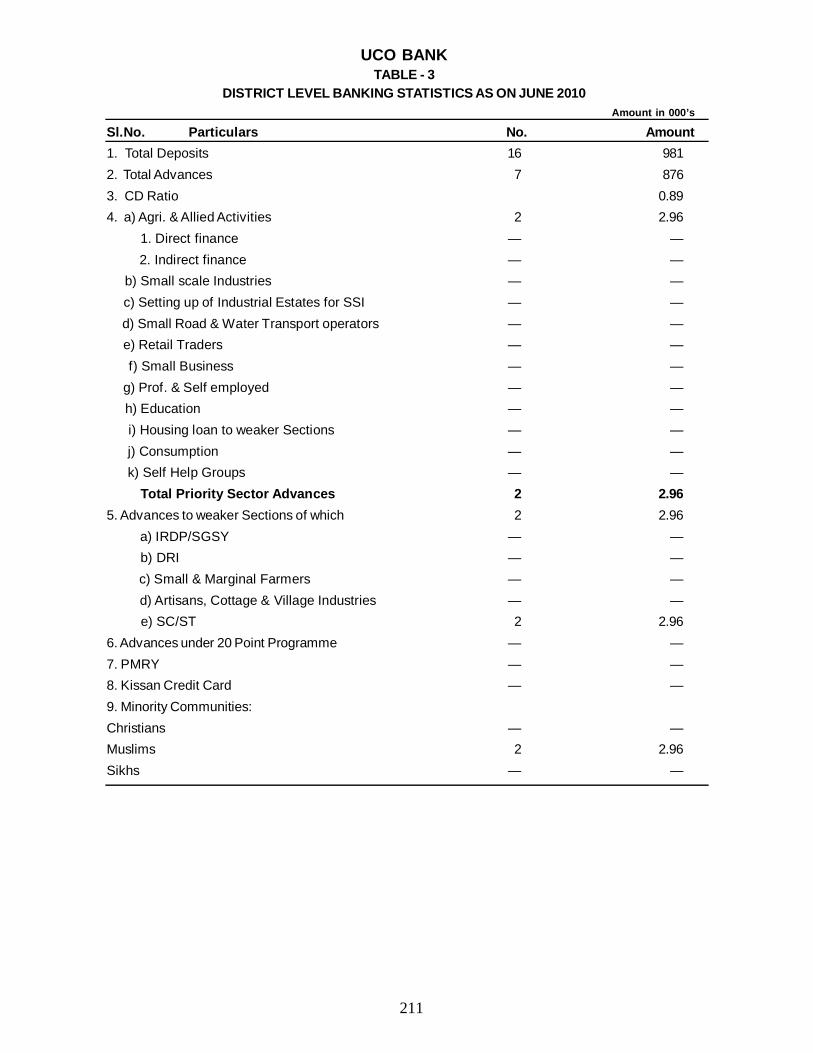
211
UCO BANKTABLE - 3
DISTRICT LEVEL BANKING STATISTICS AS ON JUNE 2010 Amount in 000’s
Sl.No. Particulars No. Amount1. Total Deposits 16 9812. Total Advances 7 8763. CD Ratio 0.894. a) Agri. & Allied Activities 2 2.96 1. Direct finance — — 2. Indirect finance — — b) Small scale Industries — — c) Setting up of Industrial Estates for SSI — — d) Small Road & Water Transport operators — — e) Retail Traders — — f) Small Business — — g) Prof. & Self employed — — h) Education — — i) Housing loan to weaker Sections — — j) Consumption — — k) Self Help Groups — — Total Priority Sector Advances 2 2.965. Advances to weaker Sections of which 2 2.96 a) IRDP/SGSY — — b) DRI — — c) Small & Marginal Farmers — — d) Artisans, Cottage & Village Industries — — e) SC/ST 2 2.966. Advances under 20 Point Programme — —7. PMRY — —8. Kissan Credit Card — —9. Minority Communities:Christians — —Muslims 2 2.96Sikhs — —
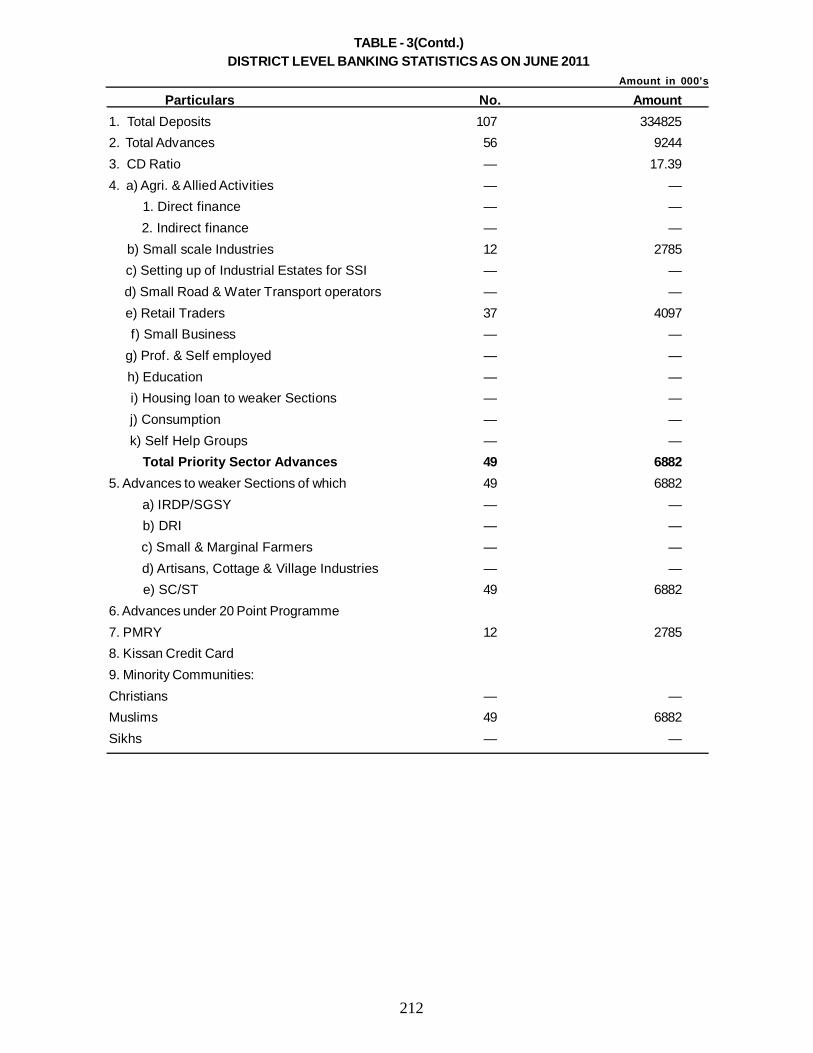
212
TABLE - 3(Contd.)DISTRICT LEVEL BANKING STATISTICS AS ON JUNE 2011
Amount in 000’s
Particulars No. Amount1. Total Deposits 107 3348252. Total Advances 56 92443. CD Ratio — 17.394. a) Agri. & Allied Activities — — 1. Direct finance — — 2. Indirect finance — — b) Small scale Industries 12 2785 c) Setting up of Industrial Estates for SSI — — d) Small Road & Water Transport operators — — e) Retail Traders 37 4097 f) Small Business — — g) Prof. & Self employed — — h) Education — — i) Housing loan to weaker Sections — — j) Consumption — — k) Self Help Groups — — Total Priority Sector Advances 49 68825. Advances to weaker Sections of which 49 6882 a) IRDP/SGSY — — b) DRI — — c) Small & Marginal Farmers — — d) Artisans, Cottage & Village Industries — — e) SC/ST 49 68826. Advances under 20 Point Programme7. PMRY 12 27858. Kissan Credit Card9. Minority Communities:Christians — —Muslims 49 6882Sikhs — —
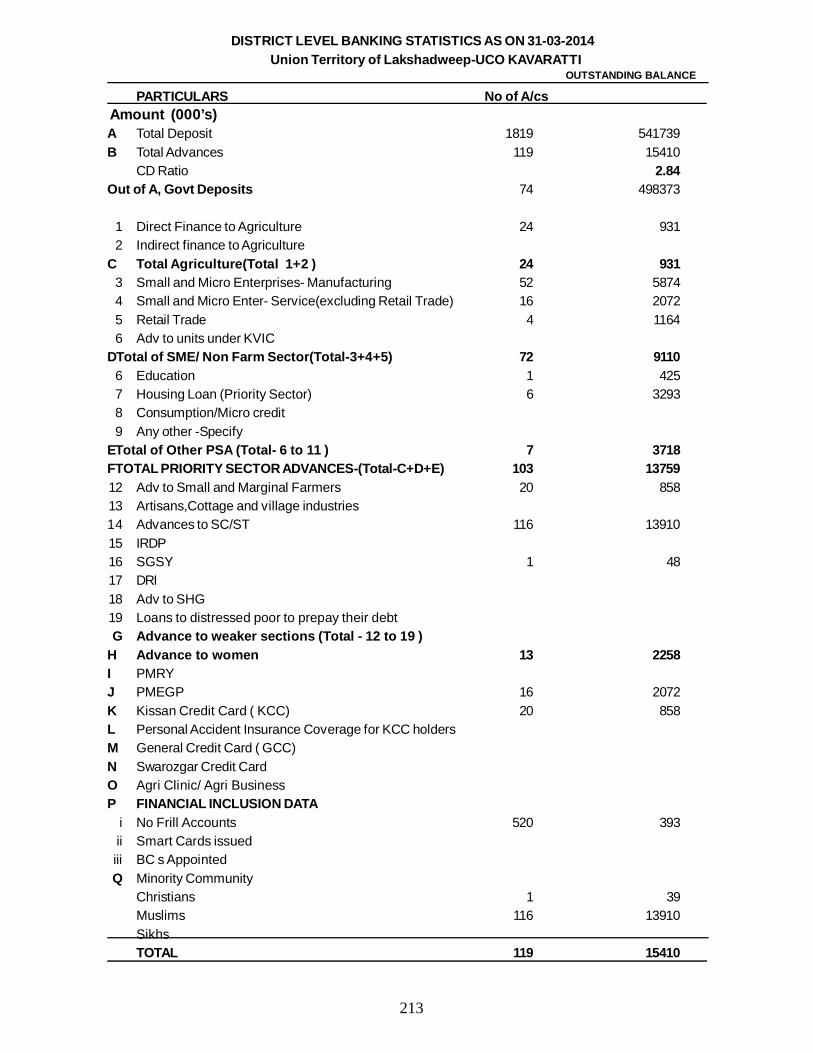
213
PARTICULARS No of A/cs Amount (000’s)A Total Deposit 1819 541739B Total Advances 119 15410
CD Ratio 2.84Out of A, Govt Deposits 74 498373
1 Direct Finance to Agriculture 24 9312 Indirect finance to Agriculture
C Total Agriculture(Total 1+2 ) 24 9313 Small and Micro Enterprises- Manufacturing 52 58744 Small and Micro Enter- Service(excluding Retail Trade) 16 20725 Retail Trade 4 11646 Adv to units under KVIC
DTotal of SME/ Non Farm Sector(Total-3+4+5) 72 91106 Education 1 4257 Housing Loan (Priority Sector) 6 32938 Consumption/Micro credit9 Any other -Specify
ETotal of Other PSA (Total- 6 to 11 ) 7 3718FTOTAL PRIORITY SECTOR ADVANCES-(Total-C+D+E) 103 1375912 Adv to Small and Marginal Farmers 20 85813 Artisans,Cottage and village industries14 Advances to SC/ST 116 1391015 IRDP16 SGSY 1 4817 DRI18 Adv to SHG19 Loans to distressed poor to prepay their debtG Advance to weaker sections (Total - 12 to 19 )
H Advance to women 13 2258I PMRYJ PMEGP 16 2072K Kissan Credit Card ( KCC) 20 858L Personal Accident Insurance Coverage for KCC holdersM General Credit Card ( GCC)N Swarozgar Credit CardO Agri Clinic/ Agri BusinessP FINANCIAL INCLUSION DATA
i No Frill Accounts 520 393ii Smart Cards issuediii BC s AppointedQ Minority Community
Christians 1 39Muslims 116 13910SikhsTOTAL 119 15410
DISTRICT LEVEL BANKING STATISTICS AS ON 31-03-2014Union Territory of Lakshadweep-UCO KAVARATTI
OUTSTANDING BALANCE
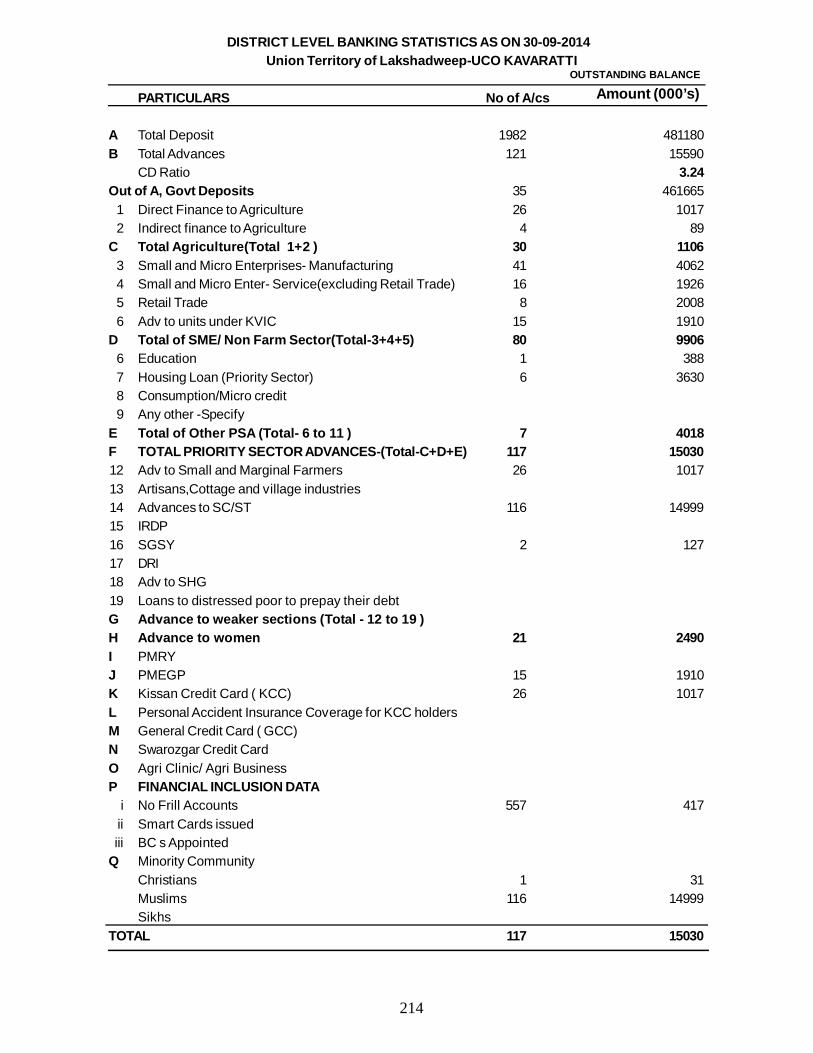
214
DISTRICT LEVEL BANKING STATISTICS AS ON 30-09-2014Union Territory of Lakshadweep-UCO KAVARATTI
PARTICULARS No of A/cs
A Total Deposit 1982 481180B Total Advances 121 15590
CD Ratio 3.24Out of A, Govt Deposits 35 461665
1 Direct Finance to Agriculture 26 10172 Indirect finance to Agriculture 4 89
C Total Agriculture(Total 1+2 ) 30 11063 Small and Micro Enterprises- Manufacturing 41 40624 Small and Micro Enter- Service(excluding Retail Trade) 16 19265 Retail Trade 8 20086 Adv to units under KVIC 15 1910
D Total of SME/ Non Farm Sector(Total-3+4+5) 80 99066 Education 1 3887 Housing Loan (Priority Sector) 6 36308 Consumption/Micro credit9 Any other -Specify
E Total of Other PSA (Total- 6 to 11 ) 7 4018F TOTAL PRIORITY SECTOR ADVANCES-(Total-C+D+E) 117 1503012 Adv to Small and Marginal Farmers 26 101713 Artisans,Cottage and village industries14 Advances to SC/ST 116 1499915 IRDP16 SGSY 2 12717 DRI18 Adv to SHG19 Loans to distressed poor to prepay their debtG Advance to weaker sections (Total - 12 to 19 )H Advance to women 21 2490I PMRYJ PMEGP 15 1910K Kissan Credit Card ( KCC) 26 1017L Personal Accident Insurance Coverage for KCC holdersM General Credit Card ( GCC)N Swarozgar Credit CardO Agri Clinic/ Agri BusinessP FINANCIAL INCLUSION DATA
i No Frill Accounts 557 417ii Smart Cards issuediii BC s Appointed
Q Minority CommunityChristians 1 31Muslims 116 14999Sikhs
TOTAL 117 15030
OUTSTANDING BALANCE
Amount (000’s)
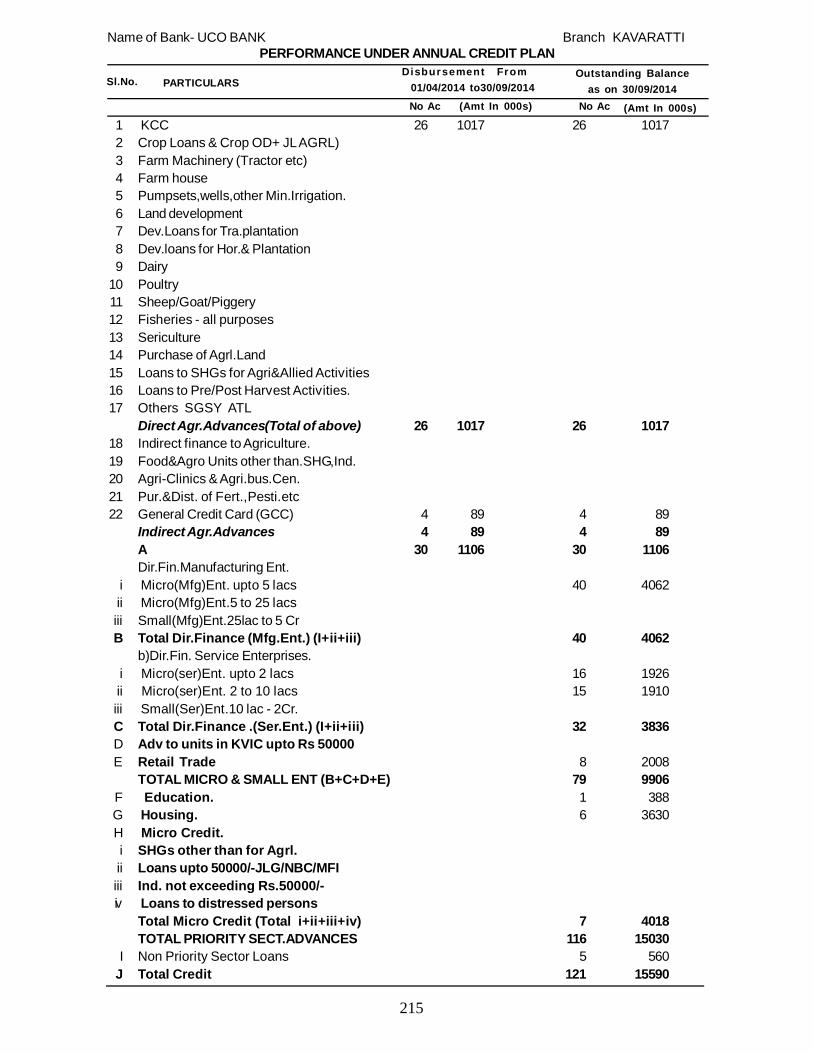
215
1 KCC 26 1017 26 10172 Crop Loans & Crop OD+ JL AGRL)3 Farm Machinery (Tractor etc)4 Farm house5 Pumpsets,wells,other Min.Irrigation.6 Land development7 Dev.Loans for Tra.plantation8 Dev.loans for Hor.& Plantation9 Dairy
10 Poultry11 Sheep/Goat/Piggery12 Fisheries - all purposes13 Sericulture14 Purchase of Agrl.Land15 Loans to SHGs for Agri&Allied Activities16 Loans to Pre/Post Harvest Activities.17 Others SGSY ATL
Direct Agr.Advances(Total of above) 26 1017 26 101718 Indirect finance to Agriculture.19 Food&Agro Units other than.SHG,Ind.20 Agri-Clinics & Agri.bus.Cen.21 Pur.&Dist. of Fert.,Pesti.etc22 General Credit Card (GCC) 4 89 4 89
Indirect Agr.Advances 4 89 4 89A 30 1106 30 1106Dir.Fin.Manufacturing Ent.
i Micro(Mfg)Ent. upto 5 lacs 40 4062ii Micro(Mfg)Ent.5 to 25 lacsiii Small(Mfg)Ent.25lac to 5 CrB Total Dir.Finance (Mfg.Ent.) (I+ii+iii) 40 4062
b)Dir.Fin. Service Enterprises.i Micro(ser)Ent. upto 2 lacs 16 1926ii Micro(ser)Ent. 2 to 10 lacs 15 1910iii Small(Ser)Ent.10 lac - 2Cr.C Total Dir.Finance .(Ser.Ent.) (I+ii+iii) 32 3836D Adv to units in KVIC upto Rs 50000E Retail Trade 8 2008
TOTAL MICRO & SMALL ENT (B+C+D+E) 79 9906F Education. 1 388G Housing. 6 3630H Micro Credit.i SHGs other than for Agrl.ii Loans upto 50000/-JLG/NBC/MFIiii Ind. not exceeding Rs.50000/-iv Loans to distressed persons
Total Micro Credit (Total i+ii+iii+iv) 7 4018TOTAL PRIORITY SECT.ADVANCES 116 15030
I Non Priority Sector Loans 5 560J Total Credit 121 15590
Name of Bank- UCO BANK Branch KAVARATTIPERFORMANCE UNDER ANNUAL CREDIT PLAN
Sl.No. PARTICULARSOutstanding Balance
as on 30/09/2014Disbursement From
01/04/2014 to30/09/2014
No Ac (Amt In 000s) No Ac (Amt In 000s)
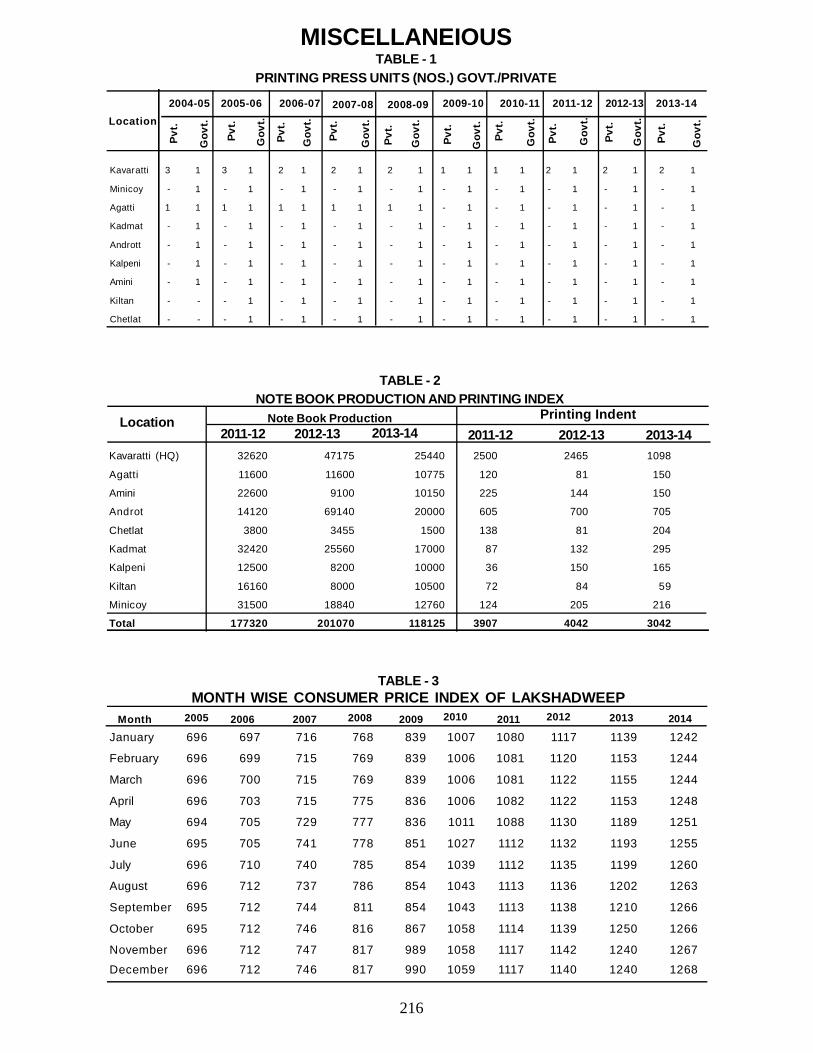
216
Kavaratti 3 1 3 1 2 1 2 1 2 1 1 1 1 1 2 1 2 1 2 1
Minicoy - 1 - 1 - 1 - 1 - 1 - 1 - 1 - 1 - 1 - 1
Agatti 1 1 1 1 1 1 1 1 1 1 - 1 - 1 - 1 - 1 - 1
Kadmat - 1 - 1 - 1 - 1 - 1 - 1 - 1 - 1 - 1 - 1
Andrott - 1 - 1 - 1 - 1 - 1 - 1 - 1 - 1 - 1 - 1
Kalpeni - 1 - 1 - 1 - 1 - 1 - 1 - 1 - 1 - 1 - 1
Amini - 1 - 1 - 1 - 1 - 1 - 1 - 1 - 1 - 1 - 1
Kiltan - - - 1 - 1 - 1 - 1 - 1 - 1 - 1 - 1 - 1
Chetlat - - - 1 - 1 - 1 - 1 - 1 - 1 - 1 - 1 - 1
MISCELLANEIOUSTABLE - 1
PRINTING PRESS UNITS (NOS.) GOVT./PRIVATE
Location2004-05 2005-06 2006-07 2007-08 2008-09 2009-10 2010-11 2011-12 2012-13 2013-14
Pvt.
Pvt.
Pvt.
Pvt.
Pvt.
Pvt.
Pvt.
Pvt.
Pvt.
Gov
t.
Gov
t.
Gov
t.
Gov
t.
Gov
t.
Gov
t.
Gov
t.
Gov
t.
Gov
t.
Pvt.
Gov
t.
TABLE - 2NOTE BOOK PRODUCTION AND PRINTING INDEX
Note Book Production
Kavaratti (HQ) 32620 47175 25440 2500 2465 1098
Agatti 11600 11600 10775 120 81 150
Amini 22600 9100 10150 225 144 150
Androt 14120 69140 20000 605 700 705
Chetlat 3800 3455 1500 138 81 204
Kadmat 32420 25560 17000 87 132 295
Kalpeni 12500 8200 10000 36 150 165
Kiltan 16160 8000 10500 72 84 59
Minicoy 31500 18840 12760 124 205 216
Total 177320 201070 118125 3907 4042 3042
Location2012-13 2013-14 2011-12 2012-13 2013-142011-12
Printing Indent
TABLE - 3MONTH WISE CONSUMER PRICE INDEX OF LAKSHADWEEP
January 696 697 716 768 839 1007 1080 1117 1139 1242
February 696 699 715 769 839 1006 1081 1120 1153 1244
March 696 700 715 769 839 1006 1081 1122 1155 1244
April 696 703 715 775 836 1006 1082 1122 1153 1248
May 694 705 729 777 836 1011 1088 1130 1189 1251
June 695 705 741 778 851 1027 1112 1132 1193 1255
July 696 710 740 785 854 1039 1112 1135 1199 1260
August 696 712 737 786 854 1043 1113 1136 1202 1263
September 695 712 744 811 854 1043 1113 1138 1210 1266
October 695 712 746 816 867 1058 1114 1139 1250 1266
November 696 712 747 817 989 1058 1117 1142 1240 1267
December 696 712 746 817 990 1059 1117 1140 1240 1268
Month 2005 2006 2007 2008 2009 2010 2011 2012 2013 2014
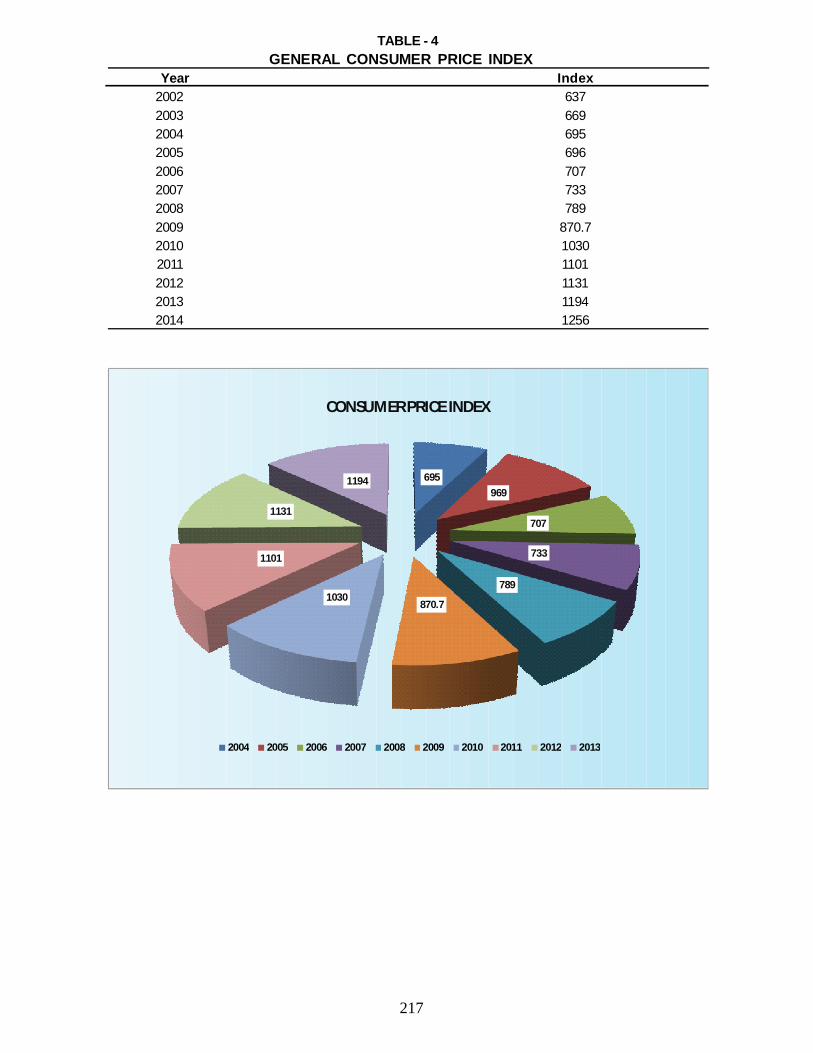
217
TABLE - 4 GENERAL CONSUMER PRICE INDEX
Year Index2002 6372003 6692004 6952005 6962006 7072007 7332008 7892009 870.72010 10302011 11012012 11312013 11942014 1256
695969
707
733
789
870.71030
1101
1131
1194
CONSUMER PRICE INDEX
2004 2005 2006 2007 2008 2009 2010 2011 2012 2013
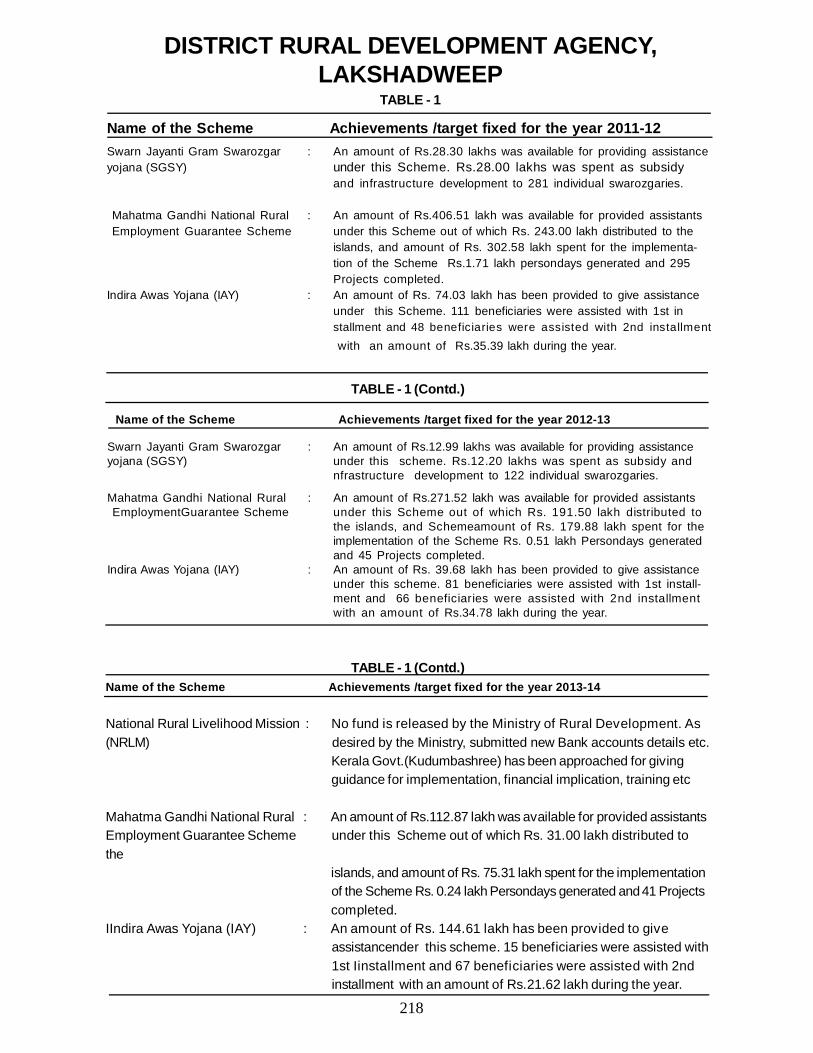
218
TABLE - 1 (Contd.)Name of the Scheme Achievements /target fixed for the year 2013-14
National Rural Livelihood Mission : No fund is released by the Ministry of Rural Development. As(NRLM) desired by the Ministry, submitted new Bank accounts details etc.
Kerala Govt.(Kudumbashree) has been approached for giving guidance for implementation, financial implication, training etc
Mahatma Gandhi National Rural : An amount of Rs.112.87 lakh was available for provided assistantsEmployment Guarantee Scheme under this Scheme out of which Rs. 31.00 lakh distributed tothe
islands, and amount of Rs. 75.31 lakh spent for the implementation of the Scheme Rs. 0.24 lakh Persondays generated and 41 Projects completed.
IIndira Awas Yojana (IAY) : An amount of Rs. 144.61 lakh has been provided to give assistancender this scheme. 15 beneficiaries were assisted with 1st Iinstallment and 67 beneficiaries were assisted with 2nd installment with an amount of Rs.21.62 lakh during the year.
Name of the Scheme Achievements /target fixed for the year 2012-13
Swarn Jayanti Gram Swarozgar : An amount of Rs.12.99 lakhs was available for providing assistanceyojana (SGSY) under this scheme. Rs.12.20 lakhs was spent as subsidy and
nfrastructure development to 122 individual swarozgaries.
Mahatma Gandhi National Rural : An amount of Rs.271.52 lakh was available for provided assistants EmploymentGuarantee Scheme under this Scheme out of which Rs. 191.50 lakh distributed to
the islands, and Schemeamount of Rs. 179.88 lakh spent for theimplementation of the Scheme Rs. 0.51 lakh Persondays generatedand 45 Projects completed.
Indira Awas Yojana (IAY) : An amount of Rs. 39.68 lakh has been provided to give assistanceunder this scheme. 81 beneficiaries were assisted with 1st install-ment and 66 beneficiaries were assisted with 2nd installmentwith an amount of Rs.34.78 lakh during the year.
TABLE - 1 (Contd.)
DISTRICT RURAL DEVELOPMENT AGENCY,LAKSHADWEEP
TABLE - 1
Name of the Scheme Achievements /target fixed for the year 2011-12Swarn Jayanti Gram Swarozgar : An amount of Rs.28.30 lakhs was available for providing assistanceyojana (SGSY) under this Scheme. Rs.28.00 lakhs was spent as subsidy
and infrastructure development to 281 individual swarozgaries.
Mahatma Gandhi National Rural : An amount of Rs.406.51 lakh was available for provided assistants Employment Guarantee Scheme under this Scheme out of which Rs. 243.00 lakh distributed to the
islands, and amount of Rs. 302.58 lakh spent for the implementa-tion of the Scheme Rs.1.71 lakh persondays generated and 295Projects completed.
Indira Awas Yojana (IAY) : An amount of Rs. 74.03 lakh has been provided to give assistanceunder this Scheme. 111 beneficiaries were assisted with 1st installment and 48 beneficiaries were assisted with 2nd installment with an amount of Rs.35.39 lakh during the year.
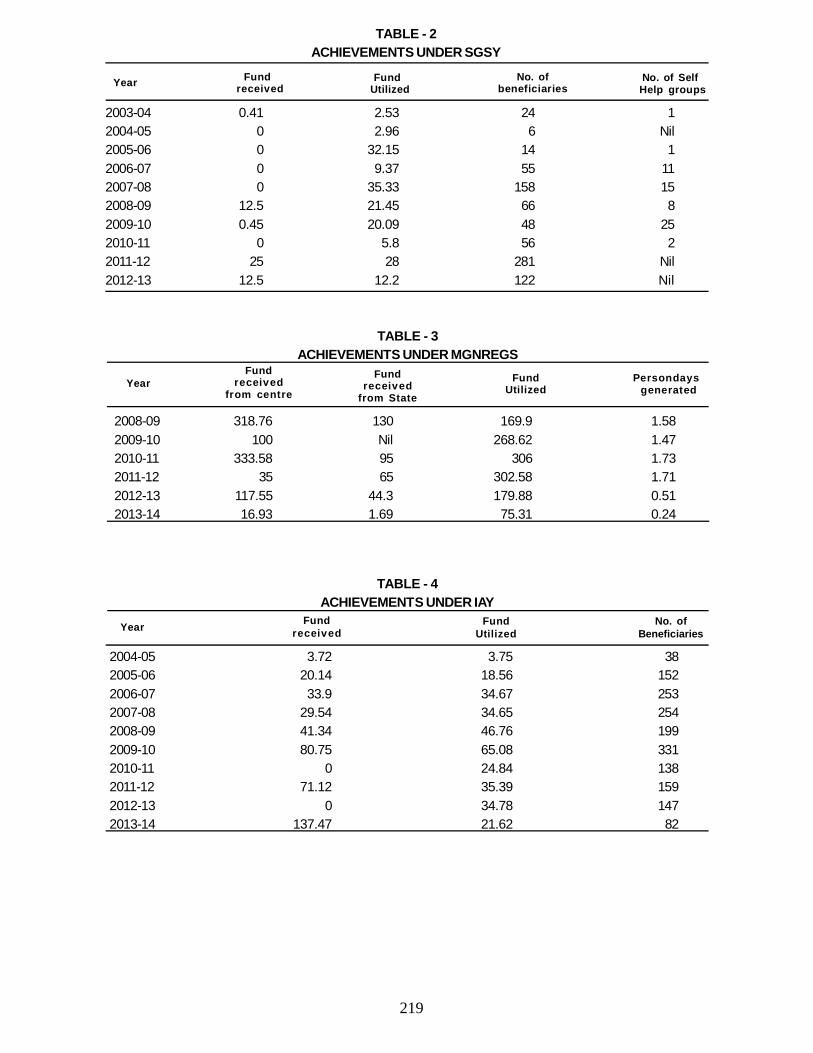
219
Year
TABLE - 2ACHIEVEMENTS UNDER SGSY
2003-04 0.41 2.53 24 12004-05 0 2.96 6 Nil2005-06 0 32.15 14 12006-07 0 9.37 55 112007-08 0 35.33 158 152008-09 12.5 21.45 66 82009-10 0.45 20.09 48 252010-11 0 5.8 56 22011-12 25 28 281 Nil2012-13 12.5 12.2 122 Nil
Fund received
Fund Utilized
No. ofbeneficiaries
No. of Self Help groups
TABLE - 3ACHIEVEMENTS UNDER MGNREGS
2008-09 318.76 130 169.9 1.582009-10 100 Nil 268.62 1.472010-11 333.58 95 306 1.732011-12 35 65 302.58 1.712012-13 117.55 44.3 179.88 0.512013-14 16.93 1.69 75.31 0.24
YearFund
receivedfrom centre
Fundreceived
from State
FundUtilized
Persondays generated
2004-05 3.72 3.75 382005-06 20.14 18.56 1522006-07 33.9 34.67 2532007-08 29.54 34.65 2542008-09 41.34 46.76 1992009-10 80.75 65.08 3312010-11 0 24.84 1382011-12 71.12 35.39 1592012-13 0 34.78 1472013-14 137.47 21.62 82
TABLE - 4ACHIEVEMENTS UNDER IAY
Year Fundreceived
FundUtilized
No. ofBeneficiaries
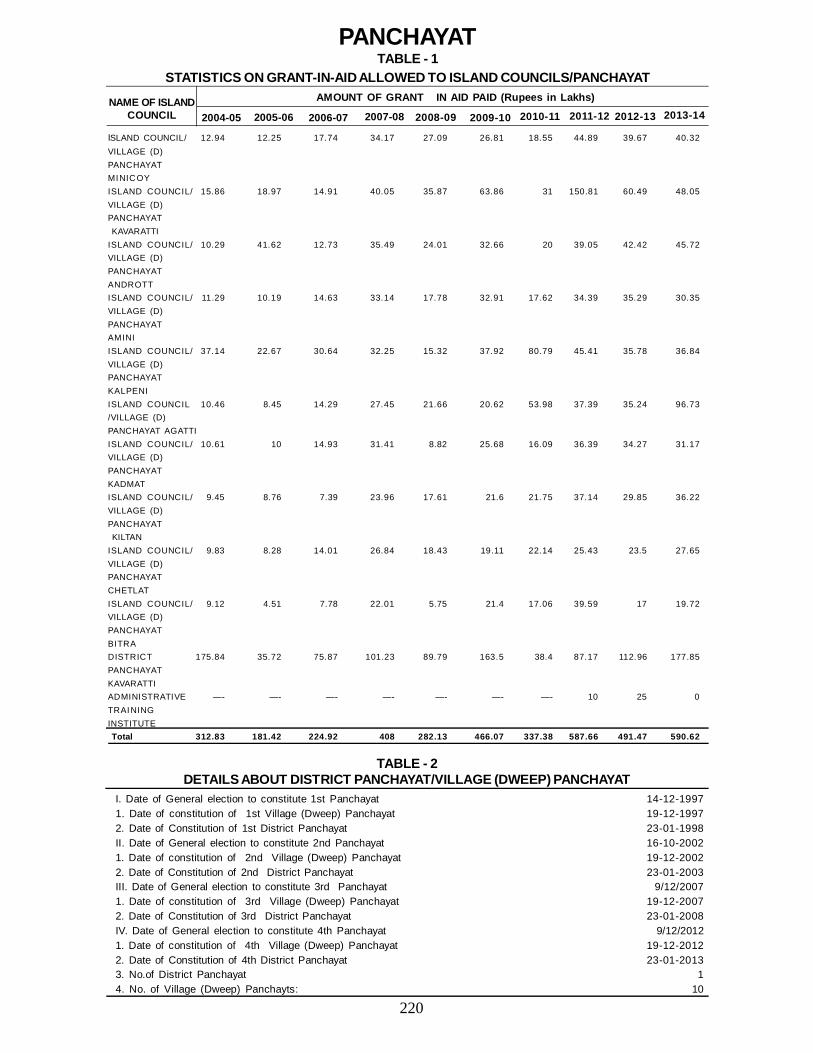
220
ISLAND COUNCIL/ 12.94 12.25 17.74 34.17 27.09 26.81 18.55 44.89 39.67 40.32VILLAGE (D)PANCHAYATMINICOYISLAND COUNCIL/ 15.86 18.97 14.91 40.05 35.87 63.86 31 150.81 60.49 48.05VILLAGE (D)PANCHAYAT KAVARATTIISLAND COUNCIL/ 10.29 41.62 12.73 35.49 24.01 32.66 20 39.05 42.42 45.72VILLAGE (D)PANCHAYATANDROTTISLAND COUNCIL/ 11.29 10.19 14.63 33.14 17.78 32.91 17.62 34.39 35.29 30.35VILLAGE (D)PANCHAYATAMINIISLAND COUNCIL/ 37.14 22.67 30.64 32.25 15.32 37.92 80.79 45.41 35.78 36.84VILLAGE (D)PANCHAYATKALPENIISLAND COUNCIL 10.46 8.45 14.29 27.45 21.66 20.62 53.98 37.39 35.24 96.73/VILLAGE (D)PANCHAYAT AGATTIISLAND COUNCIL/ 10.61 10 14.93 31.41 8.82 25.68 16.09 36.39 34.27 31.17VILLAGE (D)PANCHAYATKADMATISLAND COUNCIL/ 9.45 8.76 7.39 23.96 17.61 21.6 21.75 37.14 29.85 36.22VILLAGE (D)PANCHAYAT KILTANISLAND COUNCIL/ 9.83 8.28 14.01 26.84 18.43 19.11 22.14 25.43 23.5 27.65VILLAGE (D)PANCHAYATCHETLATISLAND COUNCIL/ 9.12 4.51 7.78 22.01 5.75 21.4 17.06 39.59 17 19.72VILLAGE (D)PANCHAYATBITRADISTRICT 175.84 35.72 75.87 101.23 89.79 163.5 38.4 87.17 112.96 177.85PANCHAYATKAVARATTIADMINISTRATIVE —- —- —- —- —- —- —- 10 25 0TRAININGINSTITUTE Total 312.83 181.42 224.92 408 282.13 466.07 337.38 587.66 491.47 590.62
PANCHAYATTABLE - 1
STATISTICS ON GRANT-IN-AID ALLOWED TO ISLAND COUNCILS/PANCHAYAT
NAME OF ISLANDCOUNCIL
AMOUNT OF GRANT IN AID PAID (Rupees in Lakhs)
2004-05 2005-06 2006-07 2007-08 2008-09 2009-10 2010-11 2011-12 2012-13 2013-14
TABLE - 2DETAILS ABOUT DISTRICT PANCHAYAT/VILLAGE (DWEEP) PANCHAYAT
I. Date of General election to constitute 1st Panchayat 14-12-19971. Date of constitution of 1st Village (Dweep) Panchayat 19-12-19972. Date of Constitution of 1st District Panchayat 23-01-1998II. Date of General election to constitute 2nd Panchayat 16-10-20021. Date of constitution of 2nd Village (Dweep) Panchayat 19-12-20022. Date of Constitution of 2nd District Panchayat 23-01-2003III. Date of General election to constitute 3rd Panchayat 9/12/20071. Date of constitution of 3rd Village (Dweep) Panchayat 19-12-20072. Date of Constitution of 3rd District Panchayat 23-01-2008IV. Date of General election to constitute 4th Panchayat 9/12/20121. Date of constitution of 4th Village (Dweep) Panchayat 19-12-20122. Date of Constitution of 4th District Panchayat 23-01-20133. No.of District Panchayat 14. No. of Village (Dweep) Panchayts: 10
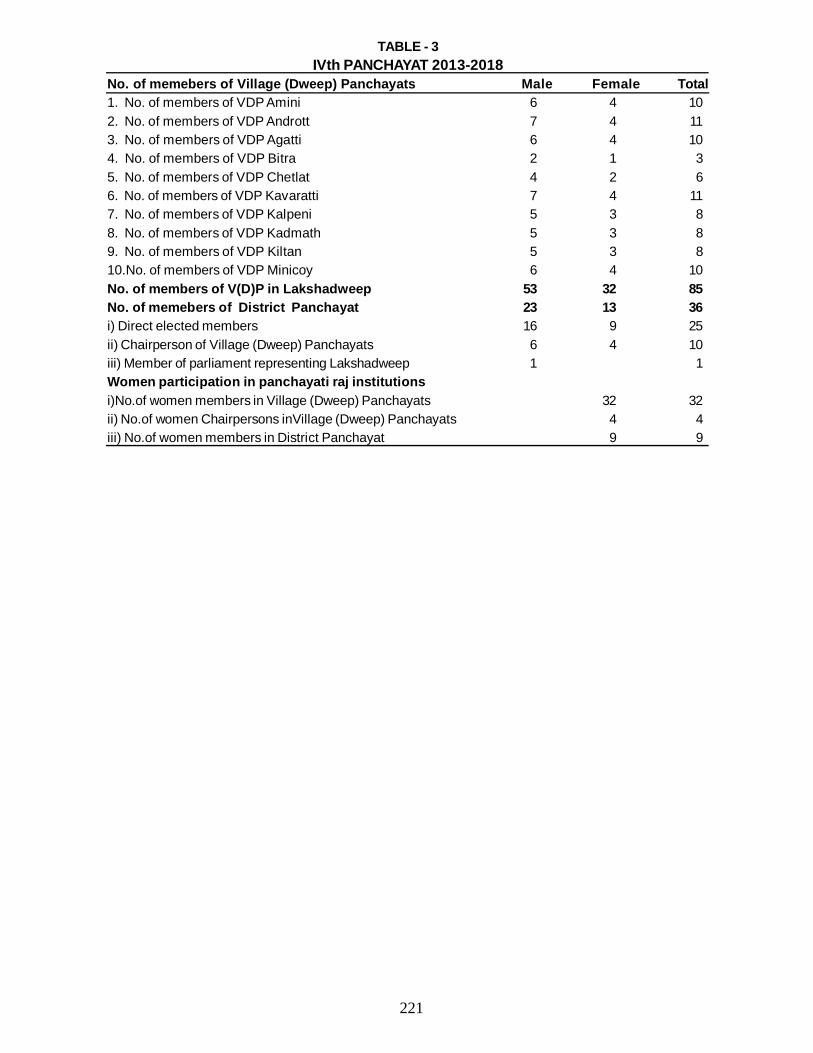
221
TABLE - 3IVth PANCHAYAT 2013-2018
No. of memebers of Village (Dweep) Panchayats Male Female Total1. No. of members of VDP Amini 6 4 102. No. of members of VDP Andrott 7 4 113. No. of members of VDP Agatti 6 4 104. No. of members of VDP Bitra 2 1 35. No. of members of VDP Chetlat 4 2 66. No. of members of VDP Kavaratti 7 4 117. No. of members of VDP Kalpeni 5 3 88. No. of members of VDP Kadmath 5 3 89. No. of members of VDP Kiltan 5 3 810.No. of members of VDP Minicoy 6 4 10No. of members of V(D)P in Lakshadweep 53 32 85No. of memebers of District Panchayat 23 13 36i) Direct elected members 16 9 25ii) Chairperson of Village (Dweep) Panchayats 6 4 10iii) Member of parliament representing Lakshadweep 1 1Women participation in panchayati raj institutionsi)No.of women members in Village (Dweep) Panchayats 32 32ii) No.of women Chairpersons inVillage (Dweep) Panchayats 4 4iii) No.of women members in District Panchayat 9 9
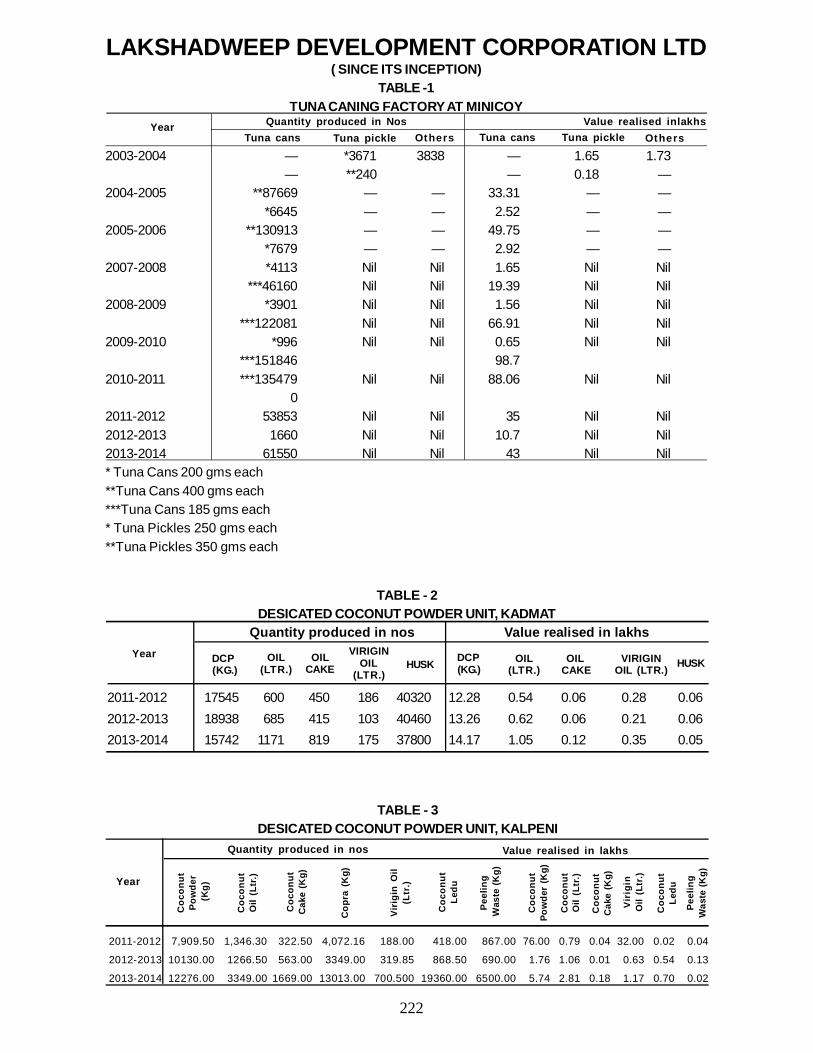
222
2011-2012 7,909.50 1,346.30 322.50 4,072.16 188.00 418.00 867.00 76.00 0.79 0.04 32.00 0.02 0.04
2012-2013 10130.00 1266.50 563.00 3349.00 319.85 868.50 690.00 1.76 1.06 0.01 0.63 0.54 0.13
2013-2014 12276.00 3349.00 1669.00 13013.00 700.500 19360.00 6500.00 5.74 2.81 0.18 1.17 0.70 0.02
LAKSHADWEEP DEVELOPMENT CORPORATION LTD( SINCE ITS INCEPTION)
TABLE -1TUNA CANING FACTORY AT MINICOY
Quantity produced in Nos Value realised inlakhs
2003-2004 — *3671 3838 — 1.65 1.73— **240 — 0.18 —
2004-2005 **87669 — — 33.31 — —*6645 — — 2.52 — —
2005-2006 **130913 — — 49.75 — —*7679 — — 2.92 — —
2007-2008 *4113 Nil Nil 1.65 Nil Nil***46160 Nil Nil 19.39 Nil Nil
2008-2009 *3901 Nil Nil 1.56 Nil Nil***122081 Nil Nil 66.91 Nil Nil
2009-2010 *996 Nil Nil 0.65 Nil Nil***151846 98.7
2010-2011 ***135479 Nil Nil 88.06 Nil Nil0
2011-2012 53853 Nil Nil 35 Nil Nil2012-2013 1660 Nil Nil 10.7 Nil Nil2013-2014 61550 Nil Nil 43 Nil Nil* Tuna Cans 200 gms each**Tuna Cans 400 gms each***Tuna Cans 185 gms each* Tuna Pickles 250 gms each**Tuna Pickles 350 gms each
YearTuna cans Tuna pickle Others Tuna cans Tuna pickle Others
2011-2012 17545 600 450 186 40320 12.28 0.54 0.06 0.28 0.062012-2013 18938 685 415 103 40460 13.26 0.62 0.06 0.21 0.062013-2014 15742 1171 819 175 37800 14.17 1.05 0.12 0.35 0.05
TABLE - 2DESICATED COCONUT POWDER UNIT, KADMAT
Quantity produced in nos Value realised in lakhsYear DCP
(KG.)OIL
(LTR.)OIL
CAKEVIRIGIN
OIL(LTR.)
HUSK DCP (KG.)
OIL(LTR.)
OIL CAKE
VIRIGINOIL (LTR.) HUSK
TABLE - 3DESICATED COCONUT POWDER UNIT, KALPENI
Year
Quantity produced in nos Value realised in lakhs
Coc
onut
Pow
der
(Kg)
Coc
onut
Oil
(Ltr
.)
Coc
onut
Cak
e (K
g)
Cop
ra (
Kg)
Viri
gin
Oil
(Ltr
.)
Coc
onut
Ledu
Peel
ing
Was
te (K
g)
Coc
onut
Pow
der
(Kg)
Coc
onut
Oil
(Ltr
.)
Coc
onut
Cak
e (K
g)
Vir
igin
Oil
(Ltr
.)
Coc
onut
Ledu
Peel
ing
Was
te (K
g)
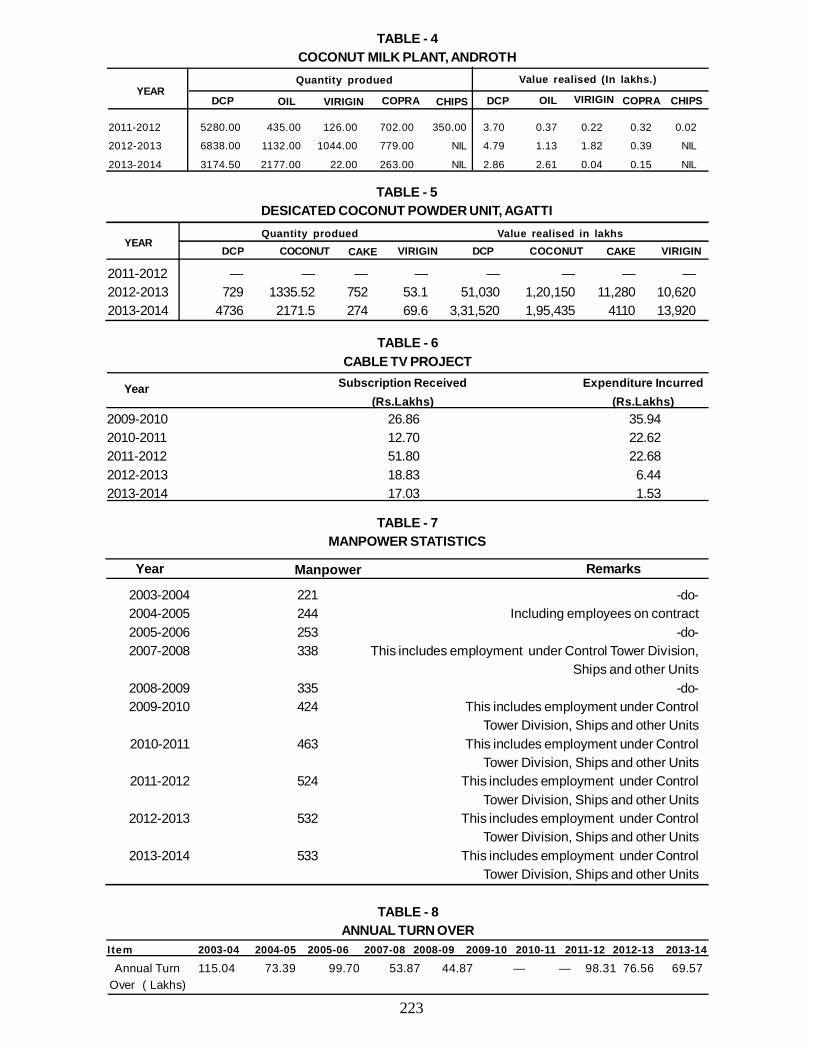
223 Over ( Lakhs)
2011-2012 5280.00 435.00 126.00 702.00 350.00 3.70 0.37 0.22 0.32 0.02
2012-2013 6838.00 1132.00 1044.00 779.00 NIL 4.79 1.13 1.82 0.39 NIL
2013-2014 3174.50 2177.00 22.00 263.00 NIL 2.86 2.61 0.04 0.15 NIL
YEAR
TABLE - 4COCONUT MILK PLANT, ANDROTHQuantity produed Value realised (In lakhs.)
DCP OIL VIRIGIN COPRA CHIPS DCP OIL VIRIGIN COPRA CHIPS
TABLE - 5DESICATED COCONUT POWDER UNIT, AGATTI
YEARQuantity produed Value realised in lakhs
DCP COCONUT CAKE VIRIGIN DCP COCONUT CAKE VIRIGIN
2011-2012 — — — — — — — —2012-2013 729 1335.52 752 53.1 51,030 1,20,150 11,280 10,6202013-2014 4736 2171.5 274 69.6 3,31,520 1,95,435 4110 13,920
TABLE - 6CABLE TV PROJECT
2009-2010 26.86 35.942010-2011 12.70 22.622011-2012 51.80 22.682012-2013 18.83 6.442013-2014 17.03 1.53
Year Subscription Received(Rs.Lakhs)
Expenditure Incurred(Rs.Lakhs)
2003-2004 221 -do-2004-2005 244 Including employees on contract2005-2006 253 -do-2007-2008 338 This includes employment under Control Tower Division,
Ships and other Units2008-2009 335 -do-2009-2010 424 This includes employment under Control
Tower Division, Ships and other Units2010-2011 463 This includes employment under Control
Tower Division, Ships and other Units2011-2012 524 This includes employment under Control
Tower Division, Ships and other Units2012-2013 532 This includes employment under Control
Tower Division, Ships and other Units2013-2014 533 This includes employment under Control
Tower Division, Ships and other Units
Year
TABLE - 7MANPOWER STATISTICS
Manpower Remarks
TABLE - 8ANNUAL TURN OVER
I tem 2003-04 2004-05 2005-06 2007-08 2008-09 2009-10 2010-11 2011-12 2012-13 2013-14
Annual Turn 115.04 73.39 99.70 53.87 44.87 — — 98.31 76.56 69.57
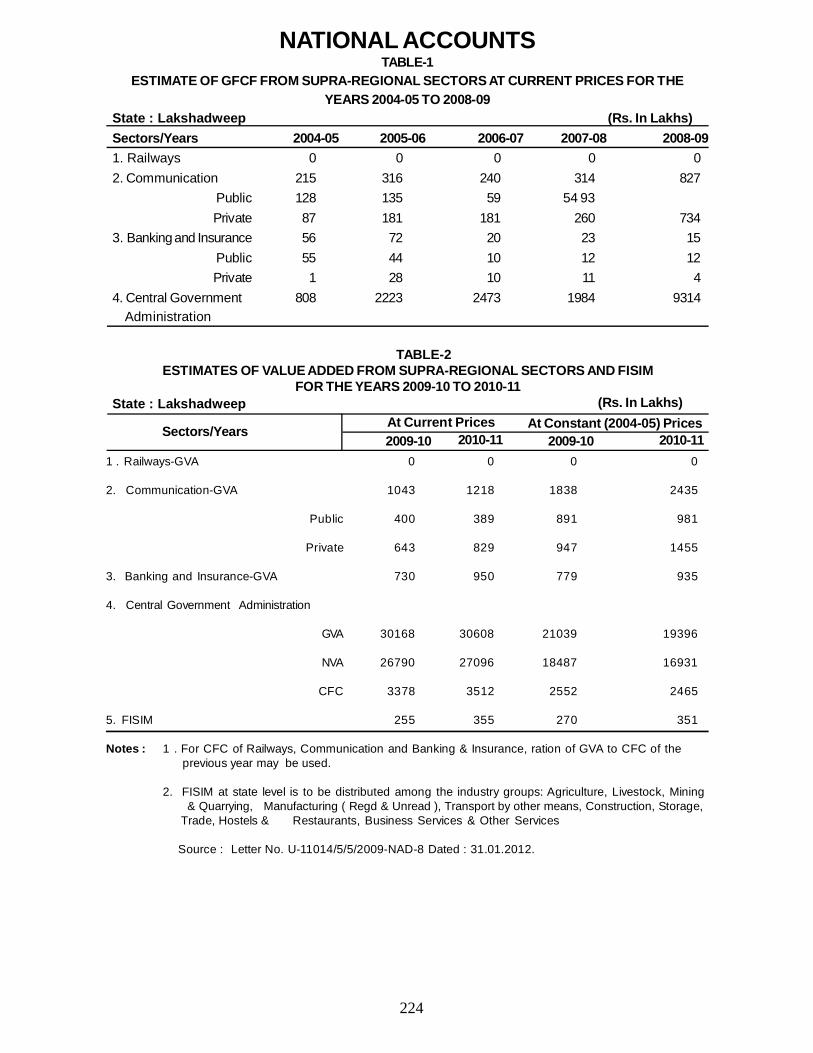
224
State : Lakshadweep (Rs. In Lakhs)Sectors/Years 2004-05 2005-06 2006-07 2007-08 2008-091. Railways 0 0 0 0 02. Communication 215 316 240 314 827
Public 128 135 59 54 93Private 87 181 181 260 734
3. Banking and Insurance 56 72 20 23 15Public 55 44 10 12 12Private 1 28 10 11 4
4. Central Government 808 2223 2473 1984 9314 Administration
NATIONAL ACCOUNTSTABLE-1
ESTIMATE OF GFCF FROM SUPRA-REGIONAL SECTORS AT CURRENT PRICES FOR THEYEARS 2004-05 TO 2008-09
1 . Railways-GVA 0 0 0 0
2. Communication-GVA 1043 1218 1838 2435
Public 400 389 891 981
Private 643 829 947 1455
3. Banking and Insurance-GVA 730 950 779 935
4. Central Government Administration
GVA 30168 30608 21039 19396
NVA 26790 27096 18487 16931
CFC 3378 3512 2552 2465
5. FISIM 255 355 270 351
Notes : 1 . For CFC of Railways, Communication and Banking & Insurance, ration of GVA to CFC of the previous year may be used.
2. FISIM at state level is to be distributed among the industry groups: Agriculture, Livestock, Mining & Quarrying, Manufacturing ( Regd & Unread ), Transport by other means, Construction, Storage, Trade, Hostels & Restaurants, Business Services & Other Services
Source : Letter No. U-11014/5/5/2009-NAD-8 Dated : 31.01.2012.
TABLE-2ESTIMATES OF VALUE ADDED FROM SUPRA-REGIONAL SECTORS AND FISIM
FOR THE YEARS 2009-10 TO 2010-11State : Lakshadweep (Rs. In Lakhs)
Sectors/Years At Current Prices At Constant (2004-05) Prices2009-10 2010-11 2009-10 2010-11
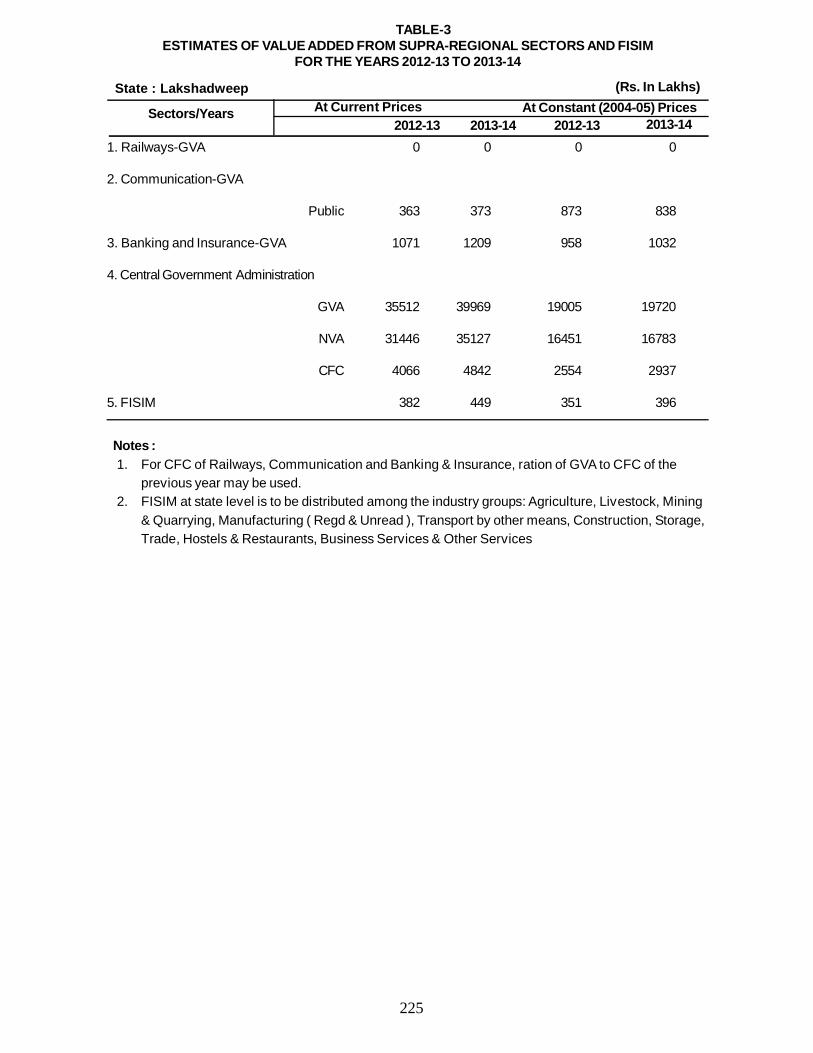
225
Notes : 1. For CFC of Railways, Communication and Banking & Insurance, ration of GVA to CFC of the
previous year may be used. 2. FISIM at state level is to be distributed among the industry groups: Agriculture, Livestock, Mining
& Quarrying, Manufacturing ( Regd & Unread ), Transport by other means, Construction, Storage,Trade, Hostels & Restaurants, Business Services & Other Services
TABLE-3ESTIMATES OF VALUE ADDED FROM SUPRA-REGIONAL SECTORS AND FISIM
FOR THE YEARS 2012-13 TO 2013-14
State : Lakshadweep (Rs. In Lakhs)
Sectors/Years At Current Prices At Constant (2004-05) Prices2012-13 2013-14 2012-13 2013-14
1. Railways-GVA 0 0 0 0
2. Communication-GVA
Public 363 373 873 838
3. Banking and Insurance-GVA 1071 1209 958 1032
4. Central Government Administration
GVA 35512 39969 19005 19720
NVA 31446 35127 16451 16783
CFC 4066 4842 2554 2937
5. FISIM 382 449 351 396
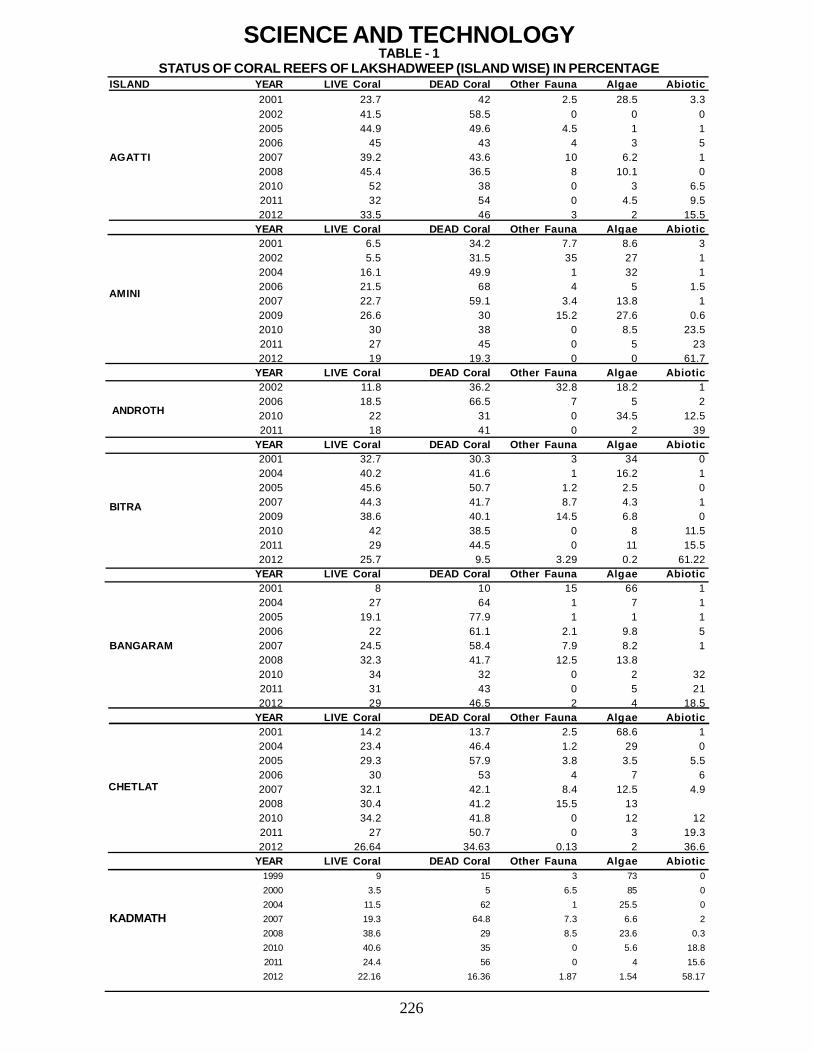
226
SCIENCE AND TECHNOLOGYTABLE - 1
STATUS OF CORAL REEFS OF LAKSHADWEEP (ISLAND WISE) IN PERCENTAGEISLAND YEAR LIVE Coral DEAD Coral Other Fauna Algae Abiotic
2001 23.7 42 2.5 28.5 3.32002 41.5 58.5 0 0 02005 44.9 49.6 4.5 1 12006 45 43 4 3 5
AGATTI 2007 39.2 43.6 10 6.2 12008 45.4 36.5 8 10.1 02010 52 38 0 3 6.52011 32 54 0 4.5 9.52012 33.5 46 3 2 15.5
YEAR LIVE Coral DEAD Coral Other Fauna Algae Abiotic2001 6.5 34.2 7.7 8.6 32002 5.5 31.5 35 27 12004 16.1 49.9 1 32 12006 21.5 68 4 5 1.52007 22.7 59.1 3.4 13.8 12009 26.6 30 15.2 27.6 0.62010 30 38 0 8.5 23.52011 27 45 0 5 232012 19 19.3 0 0 61.7
YEAR LIVE Coral DEAD Coral Other Fauna Algae Abiotic2002 11.8 36.2 32.8 18.2 12006 18.5 66.5 7 5 22010 22 31 0 34.5 12.52011 18 41 0 2 39
YEAR LIVE Coral DEAD Coral Other Fauna Algae Abiotic2001 32.7 30.3 3 34 02004 40.2 41.6 1 16.2 12005 45.6 50.7 1.2 2.5 02007 44.3 41.7 8.7 4.3 12009 38.6 40.1 14.5 6.8 02010 42 38.5 0 8 11.52011 29 44.5 0 11 15.52012 25.7 9.5 3.29 0.2 61.22
YEAR LIVE Coral DEAD Coral Other Fauna Algae Abiotic2001 8 10 15 66 12004 27 64 1 7 12005 19.1 77.9 1 1 12006 22 61.1 2.1 9.8 5
BANGARAM 2007 24.5 58.4 7.9 8.2 12008 32.3 41.7 12.5 13.82010 34 32 0 2 322011 31 43 0 5 212012 29 46.5 2 4 18.5
YEAR LIVE Coral DEAD Coral Other Fauna Algae Abiotic2001 14.2 13.7 2.5 68.6 12004 23.4 46.4 1.2 29 02005 29.3 57.9 3.8 3.5 5.52006 30 53 4 7 62007 32.1 42.1 8.4 12.5 4.92008 30.4 41.2 15.5 132010 34.2 41.8 0 12 122011 27 50.7 0 3 19.32012 26.64 34.63 0.13 2 36.6
YEAR LIVE Coral DEAD Coral Other Fauna Algae Abiotic1999 9 15 3 73 02000 3.5 5 6.5 85 02004 11.5 62 1 25.5 0
KADMATH 2007 19.3 64.8 7.3 6.6 22008 38.6 29 8.5 23.6 0.32010 40.6 35 0 5.6 18.82011 24.4 56 0 4 15.62012 22.16 16.36 1.87 1.54 58.17
AMINI
ANDROTH
BITRA
CHETLAT
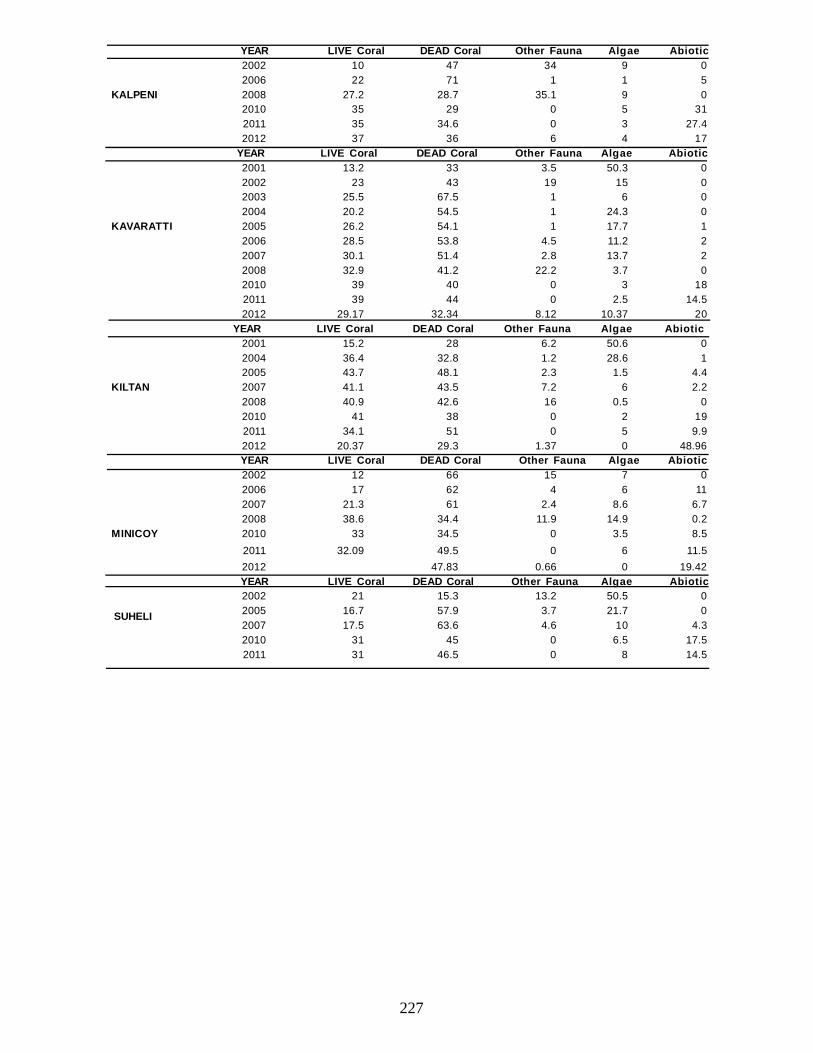
227
YEAR LIVE Coral DEAD Coral Other Fauna Algae Abiotic2002 10 47 34 9 02006 22 71 1 1 5
KALPENI 2008 27.2 28.7 35.1 9 02010 35 29 0 5 312011 35 34.6 0 3 27.42012 37 36 6 4 17
YEAR LIVE Coral DEAD Coral Other Fauna Algae Abiotic2001 13.2 33 3.5 50.3 02002 23 43 19 15 02003 25.5 67.5 1 6 02004 20.2 54.5 1 24.3 0
KAVARATTI 2005 26.2 54.1 1 17.7 12006 28.5 53.8 4.5 11.2 22007 30.1 51.4 2.8 13.7 22008 32.9 41.2 22.2 3.7 02010 39 40 0 3 182011 39 44 0 2.5 14.52012 29.17 32.34 8.12 10.37 20
YEAR LIVE Coral DEAD Coral Other Fauna Algae Abiotic2001 15.2 28 6.2 50.6 02004 36.4 32.8 1.2 28.6 12005 43.7 48.1 2.3 1.5 4.4
KILTAN 2007 41.1 43.5 7.2 6 2.22008 40.9 42.6 16 0.5 02010 41 38 0 2 192011 34.1 51 0 5 9.92012 20.37 29.3 1.37 0 48.96YEAR LIVE Coral DEAD Coral Other Fauna Algae Abiotic2002 12 66 15 7 02006 17 62 4 6 112007 21.3 61 2.4 8.6 6.72008 38.6 34.4 11.9 14.9 0.2
MINICOY 2010 33 34.5 0 3.5 8.52011 32.09 49.5 0 6 11.52012 47.83 0.66 0 19.42YEAR LIVE Coral DEAD Coral Other Fauna Algae Abiotic2002 21 15.3 13.2 50.5 02005 16.7 57.9 3.7 21.7 02007 17.5 63.6 4.6 10 4.32010 31 45 0 6.5 17.52011 31 46.5 0 8 14.5
SUHELI
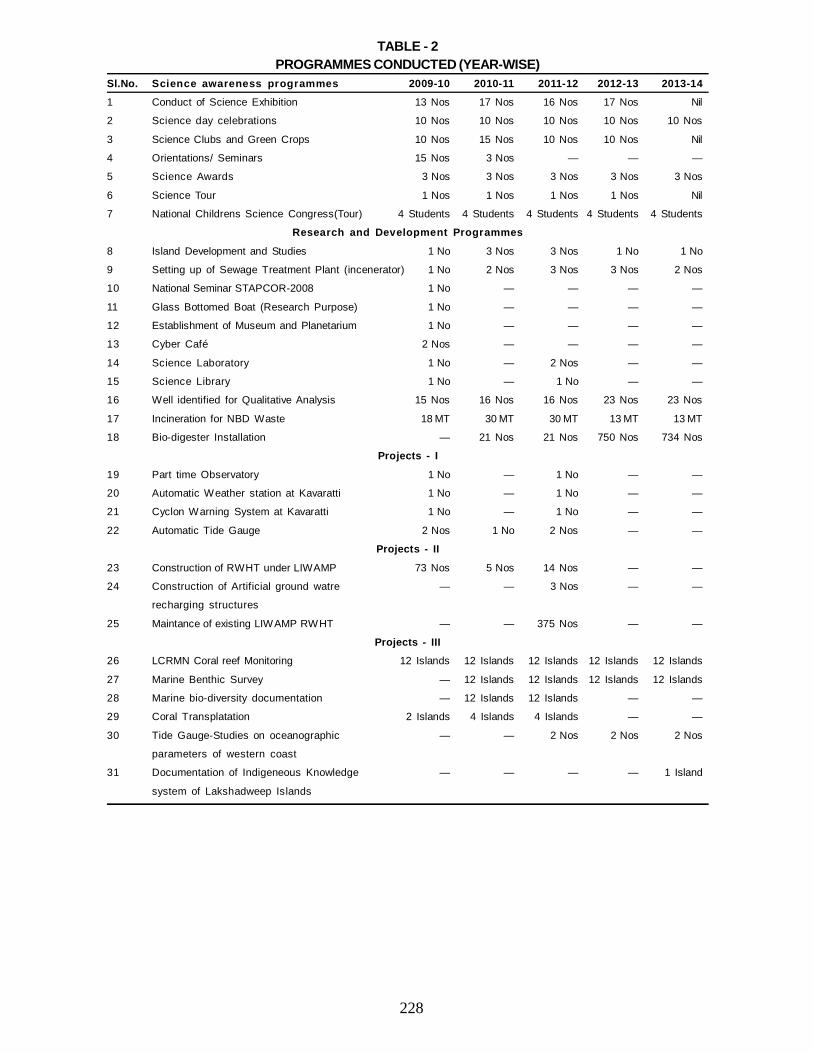
228
TABLE - 2PROGRAMMES CONDUCTED (YEAR-WISE)
Sl.No. Science awareness programmes 2009-10 2010-11 2011-12 2012-13 2013-14
1 Conduct of Science Exhibition 13 Nos 17 Nos 16 Nos 17 Nos Nil
2 Science day celebrations 10 Nos 10 Nos 10 Nos 10 Nos 10 Nos
3 Science Clubs and Green Crops 10 Nos 15 Nos 10 Nos 10 Nos Nil
4 Orientations/ Seminars 15 Nos 3 Nos — — —
5 Science Awards 3 Nos 3 Nos 3 Nos 3 Nos 3 Nos
6 Science Tour 1 Nos 1 Nos 1 Nos 1 Nos Nil
7 National Childrens Science Congress(Tour) 4 Students 4 Students 4 Students 4 Students 4 Students
Research and Development Programmes
8 Island Development and Studies 1 No 3 Nos 3 Nos 1 No 1 No
9 Setting up of Sewage Treatment Plant (incenerator) 1 No 2 Nos 3 Nos 3 Nos 2 Nos
10 National Seminar STAPCOR-2008 1 No — — — —
11 Glass Bottomed Boat (Research Purpose) 1 No — — — —
12 Establishment of Museum and Planetarium 1 No — — — —
13 Cyber Café 2 Nos — — — —
14 Science Laboratory 1 No — 2 Nos — —
15 Science Library 1 No — 1 No — —
16 Well identified for Qualitative Analysis 15 Nos 16 Nos 16 Nos 23 Nos 23 Nos
17 Incineration for NBD Waste 18 MT 30 MT 30 MT 13 MT 13 MT
18 Bio-digester Installation — 21 Nos 21 Nos 750 Nos 734 Nos
Projects - I
19 Part time Observatory 1 No — 1 No — —
20 Automatic Weather station at Kavaratti 1 No — 1 No — —
21 Cyclon Warning System at Kavaratti 1 No — 1 No — —
22 Automatic Tide Gauge 2 Nos 1 No 2 Nos — —
Projects - II
23 Construction of RWHT under LIWAMP 73 Nos 5 Nos 14 Nos — —
24 Construction of Artificial ground watre — — 3 Nos — —
recharging structures
25 Maintance of existing LIWAMP RWHT — — 375 Nos — —
Projects - III
26 LCRMN Coral reef Monitoring 12 Islands 12 Islands 12 Islands 12 Islands 12 Islands
27 Marine Benthic Survey — 12 Islands 12 Islands 12 Islands 12 Islands
28 Marine bio-diversity documentation — 12 Islands 12 Islands — —
29 Coral Transplatation 2 Islands 4 Islands 4 Islands — —
30 Tide Gauge-Studies on oceanographic — — 2 Nos 2 Nos 2 Nos
parameters of western coast
31 Documentation of Indigeneous Knowledge — — — — 1 Island
system of Lakshadweep Islands
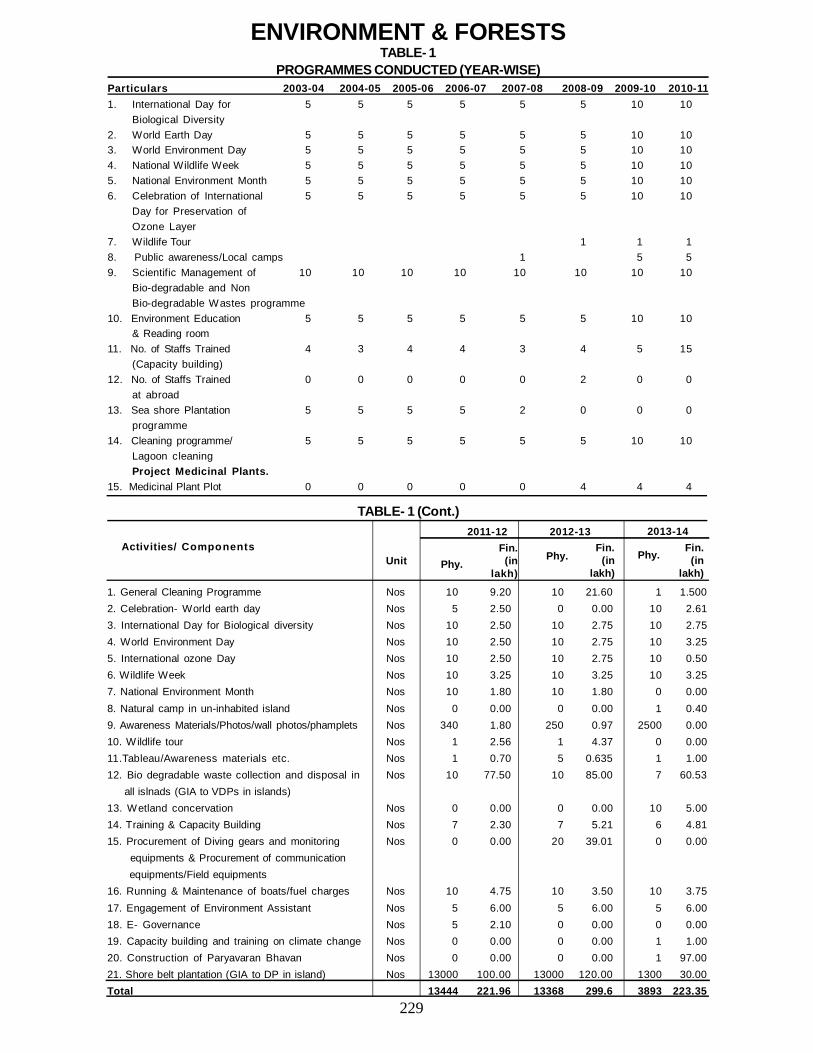
229
1. General Cleaning Programme Nos 10 9.20 10 21.60 1 1.5002. Celebration- World earth day Nos 5 2.50 0 0.00 10 2.613. International Day for Biological diversity Nos 10 2.50 10 2.75 10 2.754. World Environment Day Nos 10 2.50 10 2.75 10 3.255. International ozone Day Nos 10 2.50 10 2.75 10 0.506. Wildlife Week Nos 10 3.25 10 3.25 10 3.257. National Environment Month Nos 10 1.80 10 1.80 0 0.008. Natural camp in un-inhabited island Nos 0 0.00 0 0.00 1 0.409. Awareness Materials/Photos/wall photos/phamplets Nos 340 1.80 250 0.97 2500 0.0010. Wildlife tour Nos 1 2.56 1 4.37 0 0.0011.Tableau/Awareness materials etc. Nos 1 0.70 5 0.635 1 1.0012. Bio degradable waste collection and disposal in Nos 10 77.50 10 85.00 7 60.53 all islnads (GIA to VDPs in islands)13. Wetland concervation Nos 0 0.00 0 0.00 10 5.0014. Training & Capacity Building Nos 7 2.30 7 5.21 6 4.8115. Procurement of Diving gears and monitoring Nos 0 0.00 20 39.01 0 0.00 equipments & Procurement of communication equipments/Field equipments16. Running & Maintenance of boats/fuel charges Nos 10 4.75 10 3.50 10 3.7517. Engagement of Environment Assistant Nos 5 6.00 5 6.00 5 6.0018. E- Governance Nos 5 2.10 0 0.00 0 0.0019. Capacity building and training on climate change Nos 0 0.00 0 0.00 1 1.0020. Construction of Paryavaran Bhavan Nos 0 0.00 0 0.00 1 97.0021. Shore belt plantation (GIA to DP in island) Nos 13000 100.00 13000 120.00 1300 30.00Total 13444 221.96 13368 299.6 3893 223.35
TABLE- 1 (Cont.)
Unit
2011-12 2012-13 2013-14
Phy.Fin. (in
lakh)Phy.
Fin. (in
lakh)Phy. Fin.
(in lakh)
Activities/ Components
ENVIRONMENT & FORESTSTABLE- 1
PROGRAMMES CONDUCTED (YEAR-WISE)Particulars 2003-04 2004-05 2005-06 2006-07 2007-08 2008-09 2009-10 2010-111. International Day for 5 5 5 5 5 5 10 10
Biological Diversity2. World Earth Day 5 5 5 5 5 5 10 103. World Environment Day 5 5 5 5 5 5 10 104. National Wildlife Week 5 5 5 5 5 5 10 105. National Environment Month 5 5 5 5 5 5 10 106. Celebration of International 5 5 5 5 5 5 10 10
Day for Preservation ofOzone Layer
7. Wildlife Tour 1 1 18. Public awareness/Local camps 1 5 59. Scientific Management of 10 10 10 10 10 10 10 10
Bio-degradable and NonBio-degradable Wastes programme
10. Environment Education 5 5 5 5 5 5 10 10& Reading room
11. No. of Staffs Trained 4 3 4 4 3 4 5 15(Capacity building)
12. No. of Staffs Trained 0 0 0 0 0 2 0 0at abroad
13. Sea shore Plantation 5 5 5 5 2 0 0 0programme
14. Cleaning programme/ 5 5 5 5 5 5 10 10Lagoon cleaningProject Medicinal Plants.
15. Medicinal Plant Plot 0 0 0 0 0 4 4 4
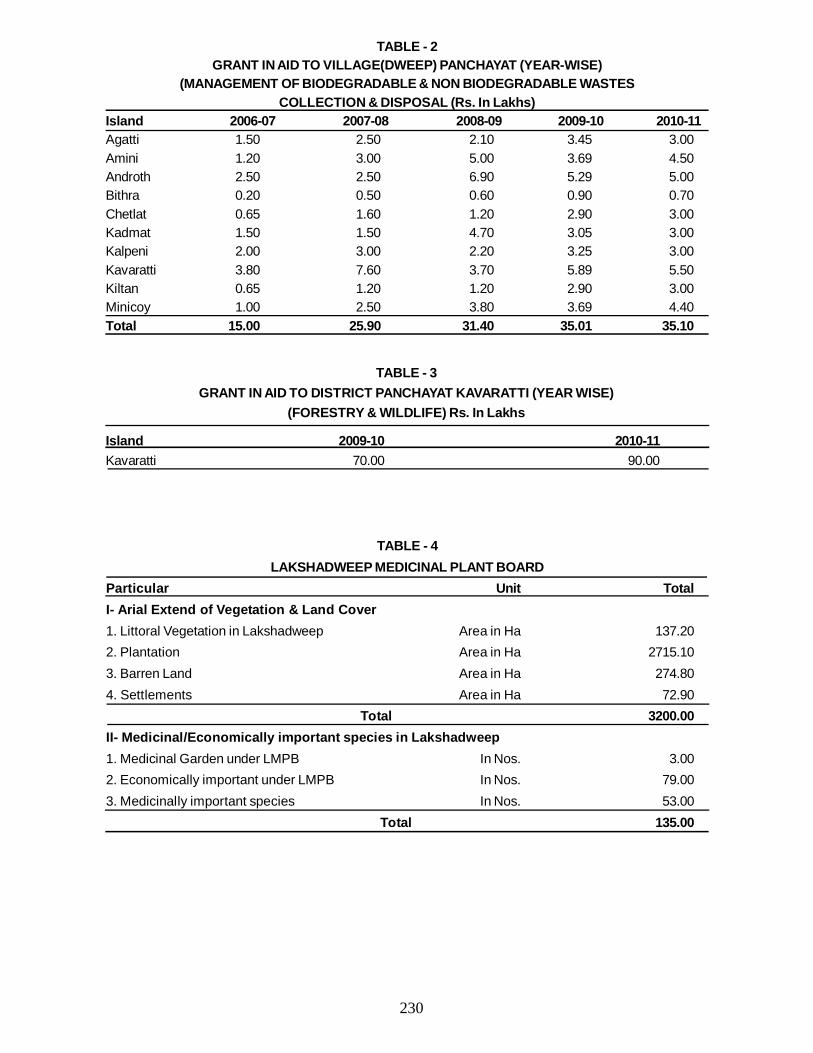
230
TABLE - 2GRANT IN AID TO VILLAGE(DWEEP) PANCHAYAT (YEAR-WISE)
(MANAGEMENT OF BIODEGRADABLE & NON BIODEGRADABLE WASTESCOLLECTION & DISPOSAL (Rs. In Lakhs)
Island 2006-07 2007-08 2008-09 2009-10 2010-11Agatti 1.50 2.50 2.10 3.45 3.00Amini 1.20 3.00 5.00 3.69 4.50Androth 2.50 2.50 6.90 5.29 5.00Bithra 0.20 0.50 0.60 0.90 0.70Chetlat 0.65 1.60 1.20 2.90 3.00Kadmat 1.50 1.50 4.70 3.05 3.00Kalpeni 2.00 3.00 2.20 3.25 3.00Kavaratti 3.80 7.60 3.70 5.89 5.50Kiltan 0.65 1.20 1.20 2.90 3.00Minicoy 1.00 2.50 3.80 3.69 4.40Total 15.00 25.90 31.40 35.01 35.10
TABLE - 3GRANT IN AID TO DISTRICT PANCHAYAT KAVARATTI (YEAR WISE)
(FORESTRY & WILDLIFE) Rs. In Lakhs
Island 2009-10 2010-11Kavaratti 70.00 90.00
TABLE - 4LAKSHADWEEP MEDICINAL PLANT BOARD
Particular Unit TotalI- Arial Extend of Vegetation & Land Cover1. Littoral Vegetation in Lakshadweep Area in Ha 137.202. Plantation Area in Ha 2715.103. Barren Land Area in Ha 274.804. Settlements Area in Ha 72.90 Total 3200.00II- Medicinal/Economically important species in Lakshadweep1. Medicinal Garden under LMPB In Nos. 3.002. Economically important under LMPB In Nos. 79.003. Medicinally important species In Nos. 53.00 Total 135.00
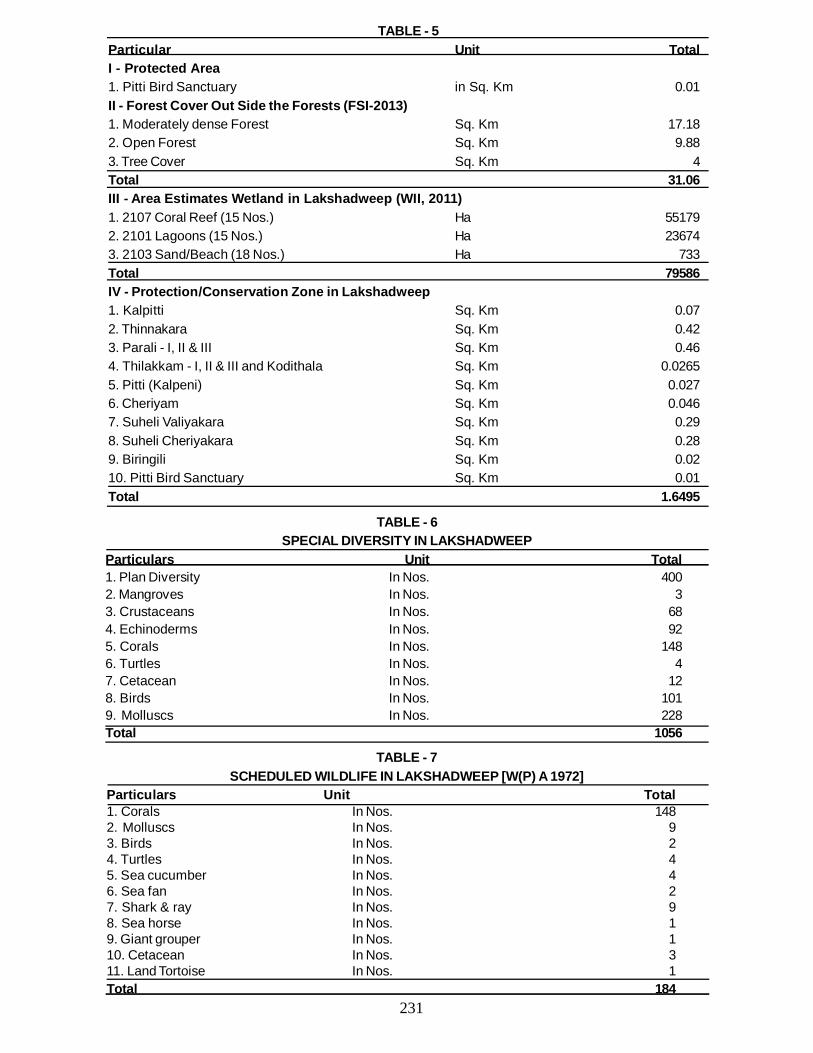
231
TABLE - 5Particular Unit TotalI - Protected Area1. Pitti Bird Sanctuary in Sq. Km 0.01II - Forest Cover Out Side the Forests (FSI-2013)1. Moderately dense Forest Sq. Km 17.182. Open Forest Sq. Km 9.883. Tree Cover Sq. Km 4Total 31.06III - Area Estimates Wetland in Lakshadweep (WII, 2011)1. 2107 Coral Reef (15 Nos.) Ha 551792. 2101 Lagoons (15 Nos.) Ha 236743. 2103 Sand/Beach (18 Nos.) Ha 733Total 79586IV - Protection/Conservation Zone in Lakshadweep1. Kalpitti Sq. Km 0.072. Thinnakara Sq. Km 0.423. Parali - I, II & III Sq. Km 0.464. Thilakkam - I, II & III and Kodithala Sq. Km 0.02655. Pitti (Kalpeni) Sq. Km 0.0276. Cheriyam Sq. Km 0.0467. Suheli Valiyakara Sq. Km 0.298. Suheli Cheriyakara Sq. Km 0.289. Biringili Sq. Km 0.0210. Pitti Bird Sanctuary Sq. Km 0.01Total 1.6495
TABLE - 6SPECIAL DIVERSITY IN LAKSHADWEEP
Particulars Unit Total1. Plan Diversity In Nos. 4002. Mangroves In Nos. 33. Crustaceans In Nos. 684. Echinoderms In Nos. 925. Corals In Nos. 1486. Turtles In Nos. 47. Cetacean In Nos. 128. Birds In Nos. 1019. Molluscs In Nos. 228Total 1056
TABLE - 7SCHEDULED WILDLIFE IN LAKSHADWEEP [W(P) A 1972]
Particulars Unit Total1. Corals In Nos. 1482. Molluscs In Nos. 93. Birds In Nos. 24. Turtles In Nos. 45. Sea cucumber In Nos. 46. Sea fan In Nos. 27. Shark & ray In Nos. 98. Sea horse In Nos. 19. Giant grouper In Nos. 110. Cetacean In Nos. 311. Land Tortoise In Nos. 1Total 184
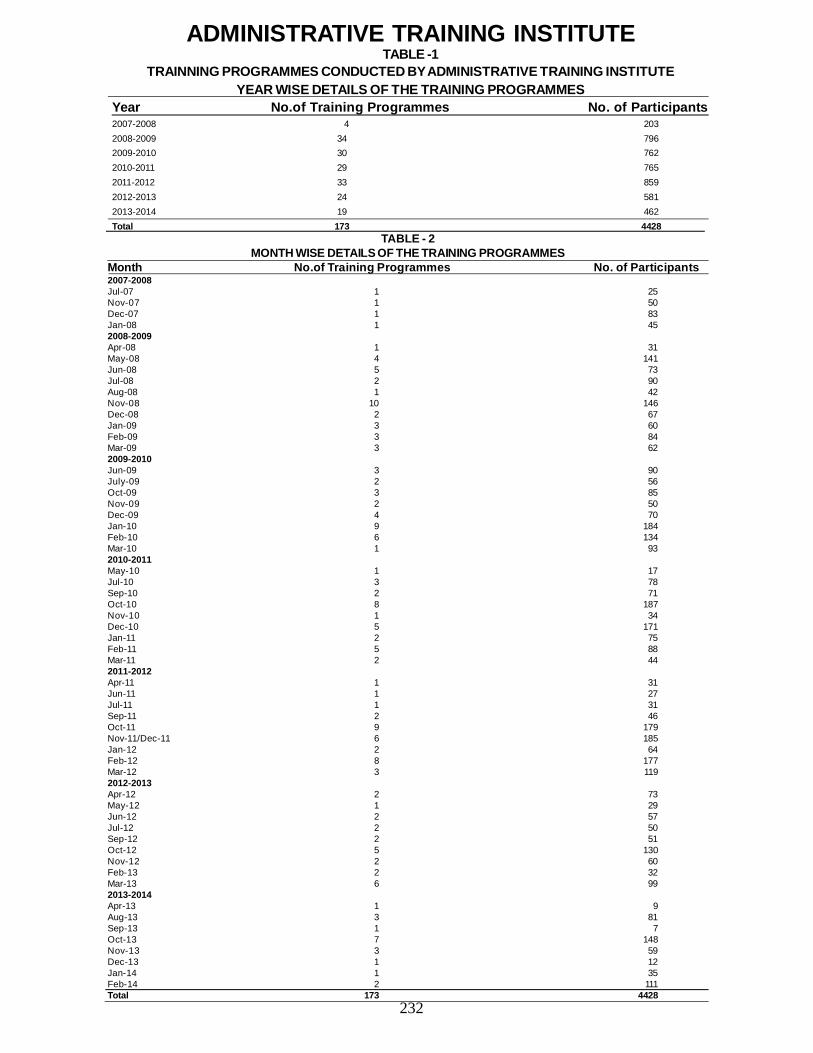
232
ADMINISTRATIVE TRAINING INSTITUTETABLE -1
TRAINNING PROGRAMMES CONDUCTED BY ADMINISTRATIVE TRAINING INSTITUTEYEAR WISE DETAILS OF THE TRAINING PROGRAMMES
Year No.of Training Programmes No. of Participants2007-2008 4 2032008-2009 34 7962009-2010 30 7622010-2011 29 7652011-2012 33 8592012-2013 24 5812013-2014 19 462Total 173 4428
TABLE - 2MONTH WISE DETAILS OF THE TRAINING PROGRAMMES
Month No.of Training Programmes No. of Participants2007-2008Jul-07 1 25Nov-07 1 50Dec-07 1 83Jan-08 1 452008-2009Apr-08 1 31May-08 4 141Jun-08 5 73Jul-08 2 90Aug-08 1 42Nov-08 10 146Dec-08 2 67Jan-09 3 60Feb-09 3 84Mar-09 3 622009-2010Jun-09 3 90July-09 2 56Oct-09 3 85Nov-09 2 50Dec-09 4 70Jan-10 9 184Feb-10 6 134Mar-10 1 932010-2011May-10 1 17Jul-10 3 78Sep-10 2 71Oct-10 8 187Nov-10 1 34Dec-10 5 171Jan-11 2 75Feb-11 5 88Mar-11 2 442011-2012Apr-11 1 31Jun-11 1 27Jul-11 1 31Sep-11 2 46Oct-11 9 179Nov-11/Dec-11 6 185Jan-12 2 64Feb-12 8 177Mar-12 3 1192012-2013Apr-12 2 73May-12 1 29Jun-12 2 57Jul-12 2 50Sep-12 2 51Oct-12 5 130Nov-12 2 60Feb-13 2 32Mar-13 6 992013-2014Apr-13 1 9Aug-13 3 81Sep-13 1 7Oct-13 7 148Nov-13 3 59Dec-13 1 12Jan-14 1 35Feb-14 2 111Total 173 4428
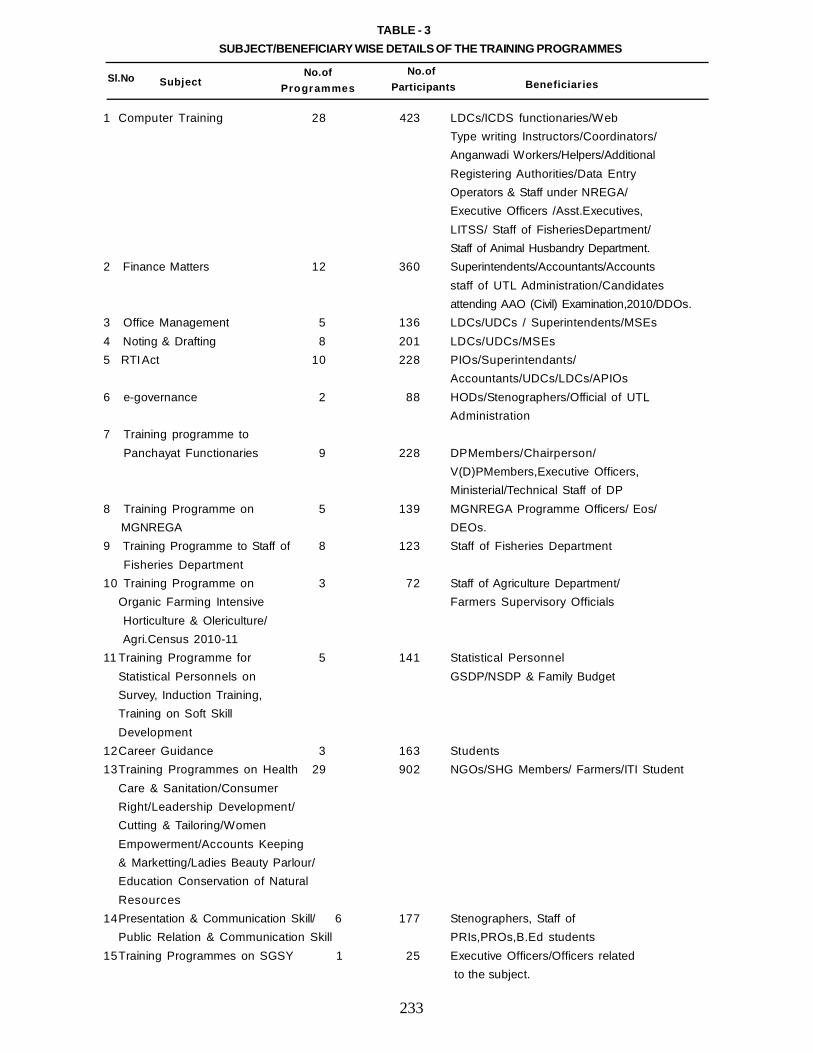
233
Sl.No SubjectNo.of
ProgrammesNo.of
Participants Beneficiaries
TABLE - 3SUBJECT/BENEFICIARY WISE DETAILS OF THE TRAINING PROGRAMMES
1 Computer Training 28 423 LDCs/ICDS functionaries/WebType writing Instructors/Coordinators/Anganwadi Workers/Helpers/AdditionalRegistering Authorities/Data EntryOperators & Staff under NREGA/Executive Officers /Asst.Executives,LITSS/ Staff of FisheriesDepartment/Staff of Animal Husbandry Department.
2 Finance Matters 12 360 Superintendents/Accountants/Accountsstaff of UTL Administration/Candidatesattending AAO (Civil) Examination,2010/DDOs.
3 Office Management 5 136 LDCs/UDCs / Superintendents/MSEs4 Noting & Drafting 8 201 LDCs/UDCs/MSEs5 RTI Act 10 228 PIOs/Superintendants/
Accountants/UDCs/LDCs/APIOs6 e-governance 2 88 HODs/Stenographers/Official of UTL
Administration7 Training programme to
Panchayat Functionaries 9 228 DPMembers/Chairperson/V(D)PMembers,Executive Officers,Ministerial/Technical Staff of DP
8 Training Programme on 5 139 MGNREGA Programme Officers/ Eos/ MGNREGA DEOs.
9 Training Programme to Staff of 8 123 Staff of Fisheries Department Fisheries Department
10 Training Programme on 3 72 Staff of Agriculture Department/Organic Farming Intensive Farmers Supervisory Officials Horticulture & Olericulture/ Agri.Census 2010-11
11 Training Programme for 5 141 Statistical PersonnelStatistical Personnels on GSDP/NSDP & Family BudgetSurvey, Induction Training,Training on Soft SkillDevelopment
12Career Guidance 3 163 Students13Training Programmes on Health 29 902 NGOs/SHG Members/ Farmers/ITI Student
Care & Sanitation/ConsumerRight/Leadership Development/Cutting & Tailoring/WomenEmpowerment/Accounts Keeping& Marketting/Ladies Beauty Parlour/Education Conservation of NaturalResources
14Presentation & Communication Skill/ 6 177 Stenographers, Staff ofPublic Relation & Communication Skill PRIs,PROs,B.Ed students
15Training Programmes on SGSY 1 25 Executive Officers/Officers related to the subject.
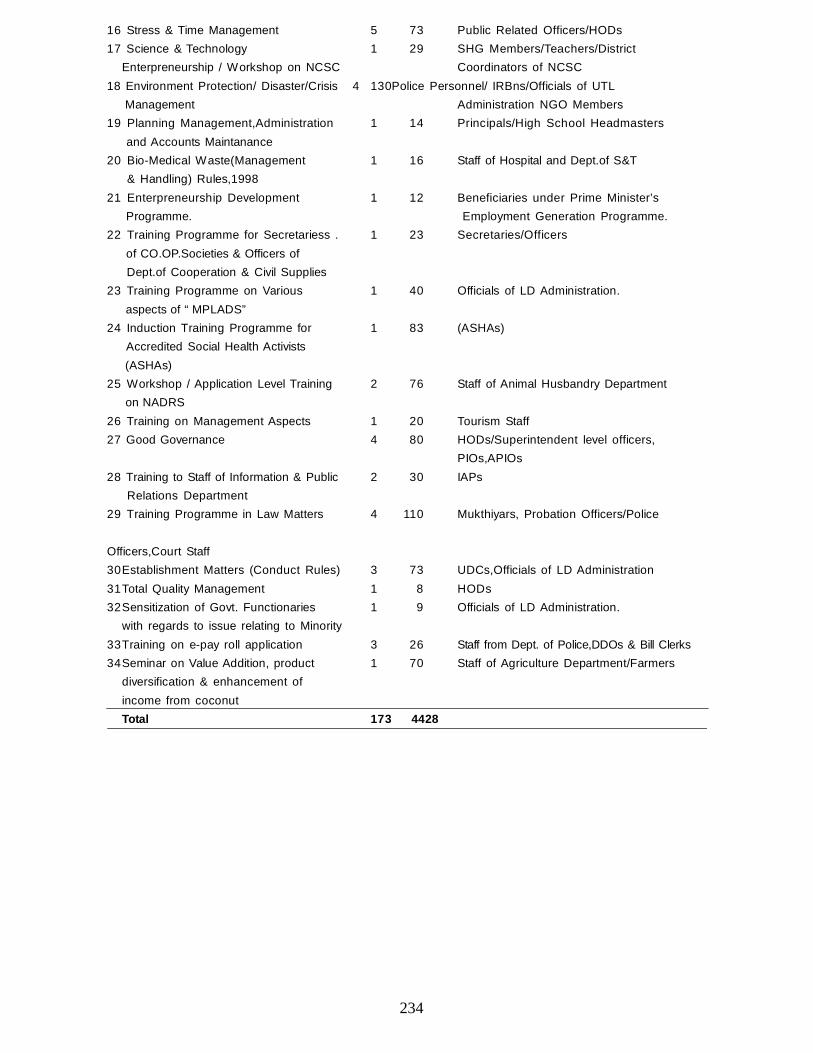
234
16 Stress & Time Management 5 73 Public Related Officers/HODs17 Science & Technology 1 29 SHG Members/Teachers/District
Enterpreneurship / Workshop on NCSC Coordinators of NCSC18 Environment Protection/ Disaster/Crisis 4 130Police Personnel/ IRBns/Officials of UTL Management Administration NGO Members19 Planning Management,Administration 1 14 Principals/High School Headmasters
and Accounts Maintanance20 Bio-Medical Waste(Management 1 16 Staff of Hospital and Dept.of S&T
& Handling) Rules,199821 Enterpreneurship Development 1 12 Beneficiaries under Prime Minister’s Programme. Employment Generation Programme.22 Training Programme for Secretariess . 1 23 Secretaries/Officers
of CO.OP.Societies & Officers of Dept.of Cooperation & Civil Supplies
23 Training Programme on Various 1 40 Officials of LD Administration. aspects of “ MPLADS”
24 Induction Training Programme for 1 83 (ASHAs) Accredited Social Health Activists (ASHAs)
25 Workshop / Application Level Training 2 76 Staff of Animal Husbandry Department on NADRS
26 Training on Management Aspects 1 20 Tourism Staff27 Good Governance 4 80 HODs/Superintendent level officers,
PIOs,APIOs28 Training to Staff of Information & Public 2 30 IAPs
Relations Department29 Training Programme in Law Matters 4 110 Mukthiyars, Probation Officers/Police
Officers,Court Staff30Establishment Matters (Conduct Rules) 3 73 UDCs,Officials of LD Administration31Total Quality Management 1 8 HODs32Sensitization of Govt. Functionaries 1 9 Officials of LD Administration.
with regards to issue relating to Minority33Training on e-pay roll application 3 26 Staff from Dept. of Police,DDOs & Bill Clerks34Seminar on Value Addition, product 1 70 Staff of Agriculture Department/Farmers
diversification & enhancement ofincome from coconutTotal 173 4428
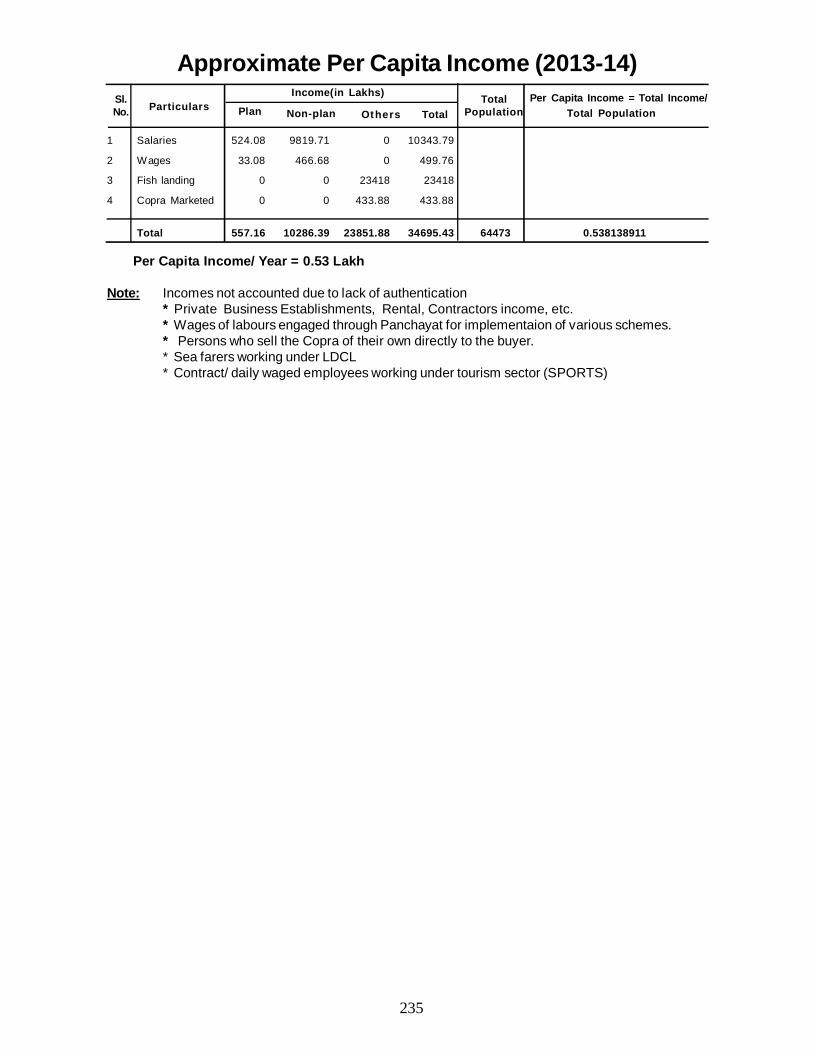
235
1 Salaries 524.08 9819.71 0 10343.79
2 Wages 33.08 466.68 0 499.76
3 Fish landing 0 0 23418 23418
4 Copra Marketed 0 0 433.88 433.88
Total 557.16 10286.39 23851.88 34695.43 64473 0.538138911
Per Capita Income/ Year = 0.53 Lakh
Note: Incomes not accounted due to lack of authentication* Private Business Establishments, Rental, Contractors income, etc.* Wages of labours engaged through Panchayat for implementaion of various schemes.* Persons who sell the Copra of their own directly to the buyer.* Sea farers working under LDCL* Contract/ daily waged employees working under tourism sector (SPORTS)
Approximate Per Capita Income (2013-14)Sl.No. Particulars
Income(in Lakhs) TotalPopulationPlan Non-plan Others Total
Per Capita Income = Total Income/Total Population
Related Documents