Azimuthal anisotropy from OBS observations in Mahanadi offshore, India Nittala Satyavani 1 , Mrinal K. Sen 2 , Maheswar Ojha 1 , and Kalachand Sain 1 Abstract We have carried out an ocean bottom seismometer (OBS) survey in a grid along with multichannel seismic survey for gas hydrate exploration in the Mahanadi offshore, India. Here, we report on some interesting ob- servations in seismic waveform data and their interpretations. These include sudden amplitude dimming in the multichannel data that is azimuth- and space-dependent and a clear manifestation of seismic anisotropy in the region. We observe significant patterns of shear wave splitting in the azimuthal gathers in the OBS data, clearly isolating the fast (S1) and slow (S2) axes of propagation in the radial azimuthal gathers. Further, am- plitude nulls and amplitude maxima are observed in the transverse azimuthal gathers. These two features are diagnostic of the existence and orientation of anisotropy which is also modeled by generating full waveform synthetic seismograms. We interpret the occurrence of anisotropy to be due to the presence of fractures. The strike of this fracture set is inferred to be ∼130° from the S1 and S2 orientation and variation in the P-wave amplitude with azimuth. The density of fracture network is estimated by full wave modeling of the OBS data. A good match between the synthetic and observed data is noticed for a near vertical fracture (dip angle of about 85°). The seismic image obtained from the 2D high-resolution multichannel profiles correlate well with the OBS results. Based on these analyses, we are able to delineate a fracture zone, which is linked to the near vertical faulting in the gas hydrate layers. Introduction Four-component seismic data offer clear insights into the phenomenon of wave propagation as they effectively capture the complete seismic wave field. Although P- wave data are acquired routinely, evaluation of shear wave velocity (V S ) assumes importance in hydrocarbon exploration. On encountering anisotropic (transversely isotropic) media, S-waves split into fast and slow arrivals (modes) in orthogonal directions with different polariza- tions, aligned in parallel and perpendicular directions to the axis of symmetry of transversely isotropic media. This phenomenon is known as S-wave splitting (Lynn and Thomsen, 1990; Thomsen, 1999; Tsvankin et al., 2010). By virtue of this specific character of splitting, the polarized S-wave data S1 and S2 can be used effi- ciently in delineating the anisotropic character of the subsurface. The simplest forms of anisotropy relevant to explo- ration seismics are vertical transverse isotropy (VTI), where the plane of symmetry is parallel to the sedi- ment layering and horizontal transverse isotropy (HTI), where the plane of symmetry is perpendicular to the sediment layering. VTI is caused by fine layering in thin sand/shale sequences, while HTI is often due to fault/ fracture systems occurring in near-vertical range (Wild, 2011). HTI in the subsurface can significantly influence the wave propagation modes and is of great interest in characterizing the hydrocarbon reservoirs/gas hydrate formations occurring in layered media. The study of vertical fracturing is of particular interest to gas hydrate studies for two reasons: (1) vertical, aligned cracks can act as conduits for the emplacement of methane into the hydrate stability zone and (2) the hydrate layers themselves are capable of triggering fractures when the pressure in these zones is greater than the confining pressure. Further, depending on the degree of intercon- nectivity, the presence of interconnected fractures may affect fluid flow within the medium, causing permeabil- ity anisotropy. Identification of such fracture systems and their azimuthal orientation is imperative in both of these situations. The splitting phenomenon is an ex- cellent diagnostic of the presence of near-vertical frac- tures/cracks and is a frontline research field in the area of production and reservoir engineering. 1 CSIR-National Geophysical Research Institute, Hyderabad, India. E-mail: [email protected]; [email protected]; [email protected]. 2 CSIR-National Geophysical Research Institute, Hyderabad, India and the University of Texas at Austin, Institute for Geophysics, Austin, Texas, USA. E-mail: [email protected]. Manuscript received by the Editor 26 February 2013; revised manuscript received 11 July 2013; published online 22 October 2013. This paper appears in Interpretation, Vol. 1, No. 2 (November 2013); p. T187–T198, 12 FIGS. http://dx.doi.org/10.1190/INT-2013-0018.1. © 2013 Society of Exploration Geophysicists and American Association of Petroleum Geologists. All rights reserved. t Technical paper Interpretation / November 2013 T187 Interpretation / November 2013 T187 Downloaded 12/14/13 to 189.146.147.94. Redistribution subject to SEG license or copyright; see Terms of Use at http://library.seg.org/

Azimutal Anistropy From OBS Observations in India
Oct 23, 2015
Welcome message from author
This document is posted to help you gain knowledge. Please leave a comment to let me know what you think about it! Share it to your friends and learn new things together.
Transcript

Azimuthal anisotropy from OBS observationsin Mahanadi offshore, India
Nittala Satyavani1, Mrinal K. Sen2, Maheswar Ojha1, and Kalachand Sain1
Abstract
We have carried out an ocean bottom seismometer (OBS) survey in a grid along with multichannel seismicsurvey for gas hydrate exploration in the Mahanadi offshore, India. Here, we report on some interesting ob-servations in seismic waveform data and their interpretations. These include sudden amplitude dimming inthe multichannel data that is azimuth- and space-dependent and a clear manifestation of seismic anisotropyin the region. We observe significant patterns of shear wave splitting in the azimuthal gathers in the OBS data,clearly isolating the fast (S1) and slow (S2) axes of propagation in the radial azimuthal gathers. Further, am-plitude nulls and amplitude maxima are observed in the transverse azimuthal gathers. These two features arediagnostic of the existence and orientation of anisotropy which is also modeled by generating full waveformsynthetic seismograms. We interpret the occurrence of anisotropy to be due to the presence of fractures. Thestrike of this fracture set is inferred to be ∼130° from the S1 and S2 orientation and variation in theP-wave amplitude with azimuth. The density of fracture network is estimated by full wave modeling ofthe OBS data. A good match between the synthetic and observed data is noticed for a near vertical fracture(dip angle of about 85°). The seismic image obtained from the 2D high-resolution multichannel profiles correlatewell with the OBS results. Based on these analyses, we are able to delineate a fracture zone, which is linked tothe near vertical faulting in the gas hydrate layers.
IntroductionFour-component seismic data offer clear insights into
the phenomenon of wave propagation as they effectivelycapture the complete seismic wave field. Although P-wave data are acquired routinely, evaluation of shearwave velocity (VS) assumes importance in hydrocarbonexploration. On encountering anisotropic (transverselyisotropic) media, S-waves split into fast and slow arrivals(modes) in orthogonal directions with different polariza-tions, aligned in parallel and perpendicular directionsto the axis of symmetry of transversely isotropic media.This phenomenon is known as S-wave splitting (Lynnand Thomsen, 1990; Thomsen, 1999; Tsvankin et al.,2010). By virtue of this specific character of splitting,the polarized S-wave data S1 and S2 can be used effi-ciently in delineating the anisotropic character of thesubsurface.
The simplest forms of anisotropy relevant to explo-ration seismics are vertical transverse isotropy (VTI),where the plane of symmetry is parallel to the sedi-ment layering and horizontal transverse isotropy (HTI),where the plane of symmetry is perpendicular to the
sediment layering. VTI is caused by fine layering in thinsand/shale sequences, while HTI is often due to fault/fracture systems occurring in near-vertical range (Wild,2011). HTI in the subsurface can significantly influencethe wave propagation modes and is of great interest incharacterizing the hydrocarbon reservoirs/gas hydrateformations occurring in layered media. The study ofvertical fracturing is of particular interest to gas hydratestudies for two reasons: (1) vertical, aligned cracks canact as conduits for the emplacement of methane intothe hydrate stability zone and (2) the hydrate layersthemselves are capable of triggering fractures whenthe pressure in these zones is greater than the confiningpressure. Further, depending on the degree of intercon-nectivity, the presence of interconnected fractures mayaffect fluid flow within the medium, causing permeabil-ity anisotropy. Identification of such fracture systemsand their azimuthal orientation is imperative in bothof these situations. The splitting phenomenon is an ex-cellent diagnostic of the presence of near-vertical frac-tures/cracks and is a frontline research field in the areaof production and reservoir engineering.
1CSIR-National Geophysical Research Institute, Hyderabad, India. E-mail: [email protected]; [email protected];[email protected].
2CSIR-National Geophysical Research Institute, Hyderabad, India and the University of Texas at Austin, Institute for Geophysics, Austin, Texas,USA. E-mail: [email protected].
Manuscript received by the Editor 26 February 2013; revised manuscript received 11 July 2013; published online 22 October 2013. This paperappears in Interpretation, Vol. 1, No. 2 (November 2013); p. T187–T198, 12 FIGS.
http://dx.doi.org/10.1190/INT-2013-0018.1. © 2013 Society of Exploration Geophysicists and American Association of Petroleum Geologists. All rights reserved.
t
Technical paper
Interpretation / November 2013 T187Interpretation / November 2013 T187
Dow
nloa
ded
12/1
4/13
to 1
89.1
46.1
47.9
4. R
edis
trib
utio
n su
bjec
t to
SEG
lice
nse
or c
opyr
ight
; see
Ter
ms
of U
se a
t http
://lib
rary
.seg
.org
/

Association of anisotropy with gas hydrate depositsis widely observed. Several types of data and differentmethodologies are in vogue to detect the anisotropycaused due to gas hydrate deposits. Gas-hydrate-relatedanisotropy has been reported in the Blake ridge regionoffshore North Carolina, employing vertical seismicprofiling (VSP) technique (Pecher et al., 2003), whilein Vancouver it was determined using resistivity-at-bit(RAB) images in IODP holes (Weinberger and Brown,2006). Walkaway VSPs and traveltime modeling (Kumaret al., 2006) were independently used to infer the gashydrate related anisotropy at the Hydrate ridge, off-shore Oregon. In the Storegga slide region, azimuthalsplitting of PS-mode converted waves (C-waves) wasused to delineate anisotropy (Haacke and Westbrook,2006; Exley et al., 2010). Anisotropy due to the presenceof fractures in gas hydrate bearing sediments is re-ported at several locations, namely, Krishna-Godavari(KG) basin, Eastern Margin of India (Cook et al., 2010;Ghosh et al., 2010); Gulf of Mexico (Cook et al., 2008;Boswell et al., 2012), and Ulleung basin, Korea (Chunet al., 2008; Lee and Collett, 2012).
Presence of gas hydrates in the eastern margin of In-dia was inferred earlier from several studies (Sain andGupta, 2008, 2012; Satyavani et al., 2008; Shankar et al.,2012; N. Satyavani, personal communication, 2013).These inferences were subsequently confirmed by asubsea drilling carried out by Expedition-01 of the Na-tional Gas Hydrate Program (NGHP). This drillingexpedition was aimed at assessment and characteriza-tion of the gas hydrate deposits along the continentalmargins of India. Of the 21 sites drilled, 19 are locatedin the Eastern Margin of India (15 in KG basin and 4 inMahanadi basin). The drilling results (Collett et al.,2008a) provide corroborating evidence for presenceof gas hydrates in these two basins. Subsequently,the National Geophysical Research Institute (NGRI)
carried out a seismic experiment (Sain et al., 2012) dur-ing 2010 in these two basins and acquired a large vol-ume of 2D seismic data augmented with ocean bottomseismometer (OBS) data. The 4C OBS data were ac-quired using 25 stations each in these two basins.
Here, we examine the OBS data acquired in theMahanadi basin to study the anisotropic character ofthis region. Significant patterns of S-wave splitting areobserved in the radial and transverse gathers of OBSdata, suggesting the presence of azimuthal anisotropy.These observations are substantiated by full wave mod-eling, using a reflectivity-based forward modeling algo-rithm (Mallick and Frazer, 1987). The results obtainedby synthetic modeling are correlated with the high-resolution multichannel seismic (MCS) data acquiredin the same grid. The inferences drawn from theMCS images complement the OBS data modeling.
The Mahanadi basin — General geology and gashydrate potential
The Mahanadi basin is a major sedimentary basinlocated in the east coast of India, covering a total areaof 55,000 km2, of which 14,000 km2 lie in the offshorewithin the water depths of 377–2386 m (Figure 1).The Mahanadi basin attracts the attention of hydrocar-bon industry because of its proximity to the KG basin, aproven petroliferous basin and a producing oilfield. TheMahanadi basin is tectonically separated from the KGbasin by the 85°E ridge. This basin has a widercontinental shelf as a consequence of a more pro-nounced deltaic activity during the mid-late Mioceneperiod. The Permo-Triassic and Jurassic sediments fillthe onshore part of an old Gondwana graben of Maha-nadi basin that continues offshore having numerouscanyon-like features (Bastia, 2006). The channelswithin these canyons act as conduits for transportingcoarser clastic sediments into deepwater areas. Thebathymetry profiles in this basin also reveal severalchannels in the slope region and several sedimentslumps/topographic highs (Subrahmanyam et al.,2008) favorable for hydrocarbon accumulation. This ba-sin belongs to a petroleum province and the hydrocar-bon prospects of the offshore basin are rated to be good(Jagannathan et al., 1983; Fuloria, 1993; Bastia, 2006).Analysis of 3D seismic data from Mahanadi offshore re-veals bottom-simulating reflector (BSR)-like features at300–400 m below the seafloor (mbsf), indicating thepresence of gas hydrates. The amplitude versus offset(AVO) anomalies suggest presence of free gas in thisregion (Prakash et al., 2010). Numerous polygonal faultsystems are seen in the upper few hundred meters ofthe seismic section and the amplitude of the BSR is verystrong at some locations and feeble at other locations;these differences in amplitudes are attributed to differ-ent saturations of free gas (Prakash et al., 2010). The 2DMCS data acquired by NGRI also indicates the presenceof gas hydrate accumulations (Sain et al., 2012). Resultsfrom the NGHP Exp-01 drilling expedition also reporta fully developed gas hydrate system at Site-19 and
Figure 1. Regional map showing the study area. The Krishna-Godavari (KG) and Mahanadi offshore regions are shown inyellow and red open squares, respectively. The orange-col-ored solid square shows the OBS survey region. S9 and S19are the two NGHP drill locations that indicated presence ofgas hydrate.
T188 Interpretation / November 2013
Dow
nloa
ded
12/1
4/13
to 1
89.1
46.1
47.9
4. R
edis
trib
utio
n su
bjec
t to
SEG
lice
nse
or c
opyr
ight
; see
Ter
ms
of U
se a
t http
://lib
rary
.seg
.org
/
occurrence of gas hydrates at another site, namely Site-9. In Site-9, gas hydrates occur at ∼290 mbsf with 10%of the pore space occupied either by gas hydrate abovethe BSR or by free gas below (Collett et al., 2008b).
OBS data and observationsOBS data were acquired in the Mahanadi basin dur-
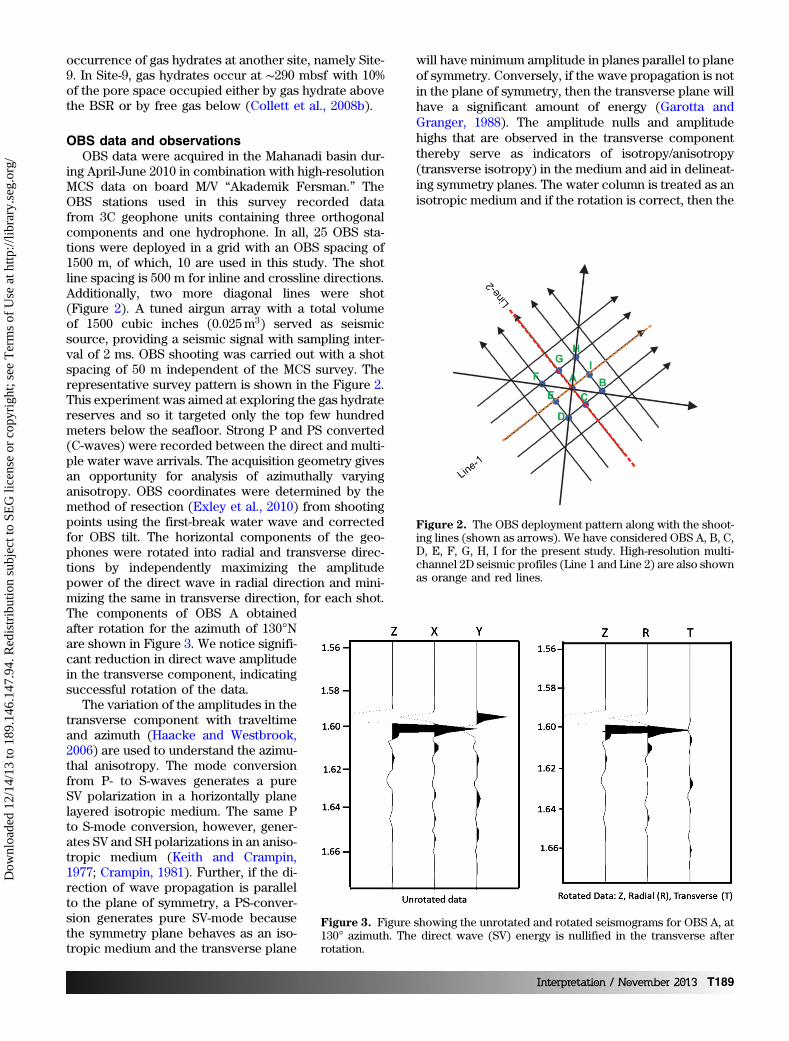
ing April-June 2010 in combination with high-resolutionMCS data on board M/V “Akademik Fersman.” TheOBS stations used in this survey recorded datafrom 3C geophone units containing three orthogonalcomponents and one hydrophone. In all, 25 OBS sta-tions were deployed in a grid with an OBS spacing of1500 m, of which, 10 are used in this study. The shotline spacing is 500 m for inline and crossline directions.Additionally, two more diagonal lines were shot(Figure 2). A tuned airgun array with a total volumeof 1500 cubic inches (0.025m3) served as seismicsource, providing a seismic signal with sampling inter-val of 2 ms. OBS shooting was carried out with a shotspacing of 50 m independent of the MCS survey. Therepresentative survey pattern is shown in the Figure 2.This experiment was aimed at exploring the gas hydratereserves and so it targeted only the top few hundredmeters below the seafloor. Strong P and PS converted(C-waves) were recorded between the direct and multi-ple water wave arrivals. The acquisition geometry givesan opportunity for analysis of azimuthally varyinganisotropy. OBS coordinates were determined by themethod of resection (Exley et al., 2010) from shootingpoints using the first-break water wave and correctedfor OBS tilt. The horizontal components of the geo-phones were rotated into radial and transverse direc-tions by independently maximizing the amplitudepower of the direct wave in radial direction and mini-mizing the same in transverse direction, for each shot.The components of OBS A obtainedafter rotation for the azimuth of 130°Nare shown in Figure 3. We notice signifi-cant reduction in direct wave amplitudein the transverse component, indicatingsuccessful rotation of the data.
The variation of the amplitudes in thetransverse component with traveltimeand azimuth (Haacke and Westbrook,2006) are used to understand the azimu-thal anisotropy. The mode conversionfrom P- to S-waves generates a pureSV polarization in a horizontally planelayered isotropic medium. The same Pto S-mode conversion, however, gener-ates SV and SH polarizations in an aniso-tropic medium (Keith and Crampin,1977; Crampin, 1981). Further, if the di-rection of wave propagation is parallelto the plane of symmetry, a PS-conver-sion generates pure SV-mode becausethe symmetry plane behaves as an iso-tropic medium and the transverse plane
will have minimum amplitude in planes parallel to planeof symmetry. Conversely, if the wave propagation is notin the plane of symmetry, then the transverse plane willhave a significant amount of energy (Garotta andGranger, 1988). The amplitude nulls and amplitudehighs that are observed in the transverse componentthereby serve as indicators of isotropy/anisotropy(transverse isotropy) in the medium and aid in delineat-ing symmetry planes. The water column is treated as anisotropic medium and if the rotation is correct, then the
Figure 2. The OBS deployment pattern along with the shoot-ing lines (shown as arrows). We have considered OBS A, B, C,D, E, F, G, H, I for the present study. High-resolution multi-channel 2D seismic profiles (Line 1 and Line 2) are also shownas orange and red lines.
Figure 3. Figure showing the unrotated and rotated seismograms for OBS A, at130° azimuth. The direct wave (SV) energy is nullified in the transverse afterrotation.
Interpretation / November 2013 T189
Dow
nloa
ded
12/1
4/13
to 1
89.1
46.1
47.9
4. R
edis
trib
utio
n su
bjec
t to
SEG
lice
nse
or c
opyr
ight
; see
Ter
ms
of U
se a
t http
://lib
rary
.seg
.org
/

transverse component P-wave does not have any directwave energy.
Figure 4 shows a representative receiver mode ge-ometry of the azimuthal coverage at OBS A. The OBSis located at the center of the survey and the acquisitionlines are around it. For the purpose of creating azimu-thal gathers, we select the shots at an offset of 1 kmaround the OBS (Sil et al., 2010). Within this offsetrange, lateral homogeneity assumption is reasonablygood. Ideally, to improve the signal-to-noise ratio, theC-waves need to be normal moveout-corrected andthen stacked. However, such a scheme would relyheavily on proper velocity analysis, which is compli-cated due to velocity difference in P- and S-waves,and also due to the presence of anisotropy. Instead,we flatten the direct arrival by shifting seismic datato a time corresponding to direct arrival traveltime atzero offset. Such a flattening of direct arrivals also re-sults in sufficient flattening of the C-waves (Figure 5),because they propagate with slow velocity. This proc-ess is equivalent to application of trim statics that ac-counts for small variations in the shot locations andpositions the shots effectively at 1 km radius aroundthe OBS (Sil et al., 2010). The quality of data is in gen-eral very good, as can be seen in Figure 5, showing theP-waves, converted PS, and the multiples.
The raw radial and transverse components of the azi-muthal receiver gather obtained by rotation of the dataas described above is shown in Figure 6a and 6b. Thegathers are now examined for the typical signs ofanisotropy, namely cos 4θ (four amplitude maxima in360°) in the transverse component and cos 2θ (two am-plitude maxima in 360°) in the radial component (Sil
et al., 2010). The polarity flip in the transverse compo-nent at every 90° azimuth interval is also observed, in-dicating anisotropy (HTI) in other azimuths, while in theplane of symmetry, there is null amplitude (Crampin,1985; Tatham et al., 1992; Gaiser, 1999; Haacke et al.,2009; Maultzsch et al., 2009; Simmons, 2009; Sil et al.,2010). The fast (S1) and slow axes (S2) are detectedin the azimuthal radial gathers. The S1 axis is identifiedby locating the zones of increased amplitude (maximumenergy) implying the faster wave propagation, while S2axis is identified by locating the zones of amplitudeminima and slow velocity of propagation. The fast andslow axes for OBS A can therefore be detected in theradial component as shown in Figure 6a. This entireexercise is repeated for the four OBS around the centralOBS A, namely B, D, F, and H. This analysis helped usto examine the consistency of the orientation of thesymmetry planes and also to delineate the lateral areainfluenced by anisotropy. The OBS D (southwest ofOBS A) and F (west of OBS A) show the slow axis inthe same direction as that of OBS A, i.e., at 130°N and310°N while OBS I (east of OBS A) shows predominantslow axis at 310°N. The other OBS, namely OBS H(north of OBS A), did not show any predominant split-ting (Figure 7). The region enclosed by OBS GACDEFshows similar patterns of splitting at almost similar azi-muths, allowing us to infer anisotropy in the rectangulararea bounded by GACDEF.
Synthetic modelingWe carried out 1D synthetic modeling of the ampli-
tudes and waveforms to delineate the fractures andconstrain the fracture parameters, namely, fracturedensity, azimuth, and dip angle in a vertical varyingearth model. Forward modeling is carried out with thesynthetic seismograms generated using the reflectivitycode (Mallick and Frazer, 1987). This code can incorpo-rate vertical and inclined fractures in the sedimentarystrata and generates 3C synthetic seismograms forthe subsurface model. It can handle any degree/sym-metry of anisotropy, including triclinic (21 elastic con-stants). As it is based on reflectivity, it can take care ofeffects-like transmission, conversion, and internal mul-tiples. These seismograms are more accurate thanthose obtained from ray theory and are efficient in in-vestigating the effects of anisotropy in layered subsur-face. Anisotropy may be specified by assigning values tothe 21 elastic constants in any layer of the input model,which can be generated for an assumed fracture modeldefined by the strike, tilt angle, and density.
For modeling purposes, we consider a simple four-layer case below the 2.0 km thick water column.The first layer is 160 m thick with V ¼ 1.65 km∕s,VS ¼ 0.5 km∕s, and density ðρÞ ¼ 1.4 g∕cc. The secondlayer is relatively thin, 50 m layer with VP ¼ 1.75 km∕s,VS ¼ 0.65 km∕s, and ρ ¼ 1.6 g∕cc. The third layer isvisualized as the gas hydrate layer with a set of inclinedfractures that cause anisotropic effects. Anisotropy isincluded in this layer by specifying elastic constants
Figure 4. Azimuthal coverage for OBS A (located at center)shown along with the shooting lines. The lines are the shoot-ing lines passing over the OBS A and the numbers are theazimuths.
T190 Interpretation / November 2013
Dow
nloa
ded
12/1
4/13
to 1
89.1
46.1
47.9
4. R
edis
trib
utio
n su
bjec
t to
SEG
lice
nse
or c
opyr
ight
; see
Ter
ms
of U
se a
t http
://lib
rary
.seg
.org
/
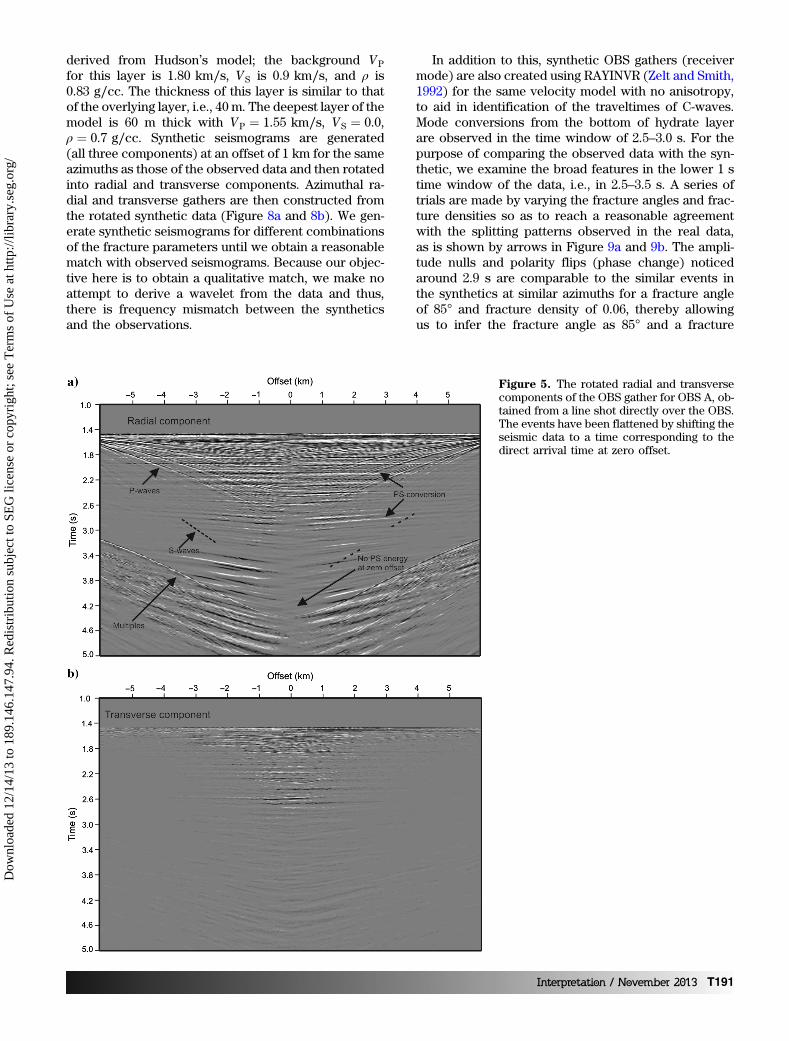
derived from Hudson’s model; the background VPfor this layer is 1.80 km∕s, VS is 0.9 km∕s, and ρ is0.83 g∕cc. The thickness of this layer is similar to thatof the overlying layer, i.e., 40 m. The deepest layer of themodel is 60 m thick with VP ¼ 1.55 km∕s, VS ¼ 0.0,ρ ¼ 0.7 g∕cc. Synthetic seismograms are generated(all three components) at an offset of 1 km for the sameazimuths as those of the observed data and then rotatedinto radial and transverse components. Azimuthal ra-dial and transverse gathers are then constructed fromthe rotated synthetic data (Figure 8a and 8b). We gen-erate synthetic seismograms for different combinationsof the fracture parameters until we obtain a reasonablematch with observed seismograms. Because our objec-tive here is to obtain a qualitative match, we make noattempt to derive a wavelet from the data and thus,there is frequency mismatch between the syntheticsand the observations.
In addition to this, synthetic OBS gathers (receivermode) are also created using RAYINVR (Zelt and Smith,1992) for the same velocity model with no anisotropy,to aid in identification of the traveltimes of C-waves.Mode conversions from the bottom of hydrate layerare observed in the time window of 2.5–3.0 s. For thepurpose of comparing the observed data with the syn-thetic, we examine the broad features in the lower 1 stime window of the data, i.e., in 2.5–3.5 s. A series oftrials are made by varying the fracture angles and frac-ture densities so as to reach a reasonable agreementwith the splitting patterns observed in the real data,as is shown by arrows in Figure 9a and 9b. The ampli-tude nulls and polarity flips (phase change) noticedaround 2.9 s are comparable to the similar events inthe synthetics at similar azimuths for a fracture angleof 85° and fracture density of 0.06, thereby allowingus to infer the fracture angle as 85° and a fracture
Figure 5. The rotated radial and transversecomponents of the OBS gather for OBS A, ob-tained from a line shot directly over the OBS.The events have been flattened by shifting theseismic data to a time corresponding to thedirect arrival time at zero offset.
Interpretation / November 2013 T191
Dow
nloa
ded
12/1
4/13
to 1
89.1
46.1
47.9
4. R
edis
trib
utio
n su
bjec
t to
SEG
lice
nse
or c
opyr
ight
; see
Ter
ms
of U
se a
t http
://lib
rary
.seg
.org
/
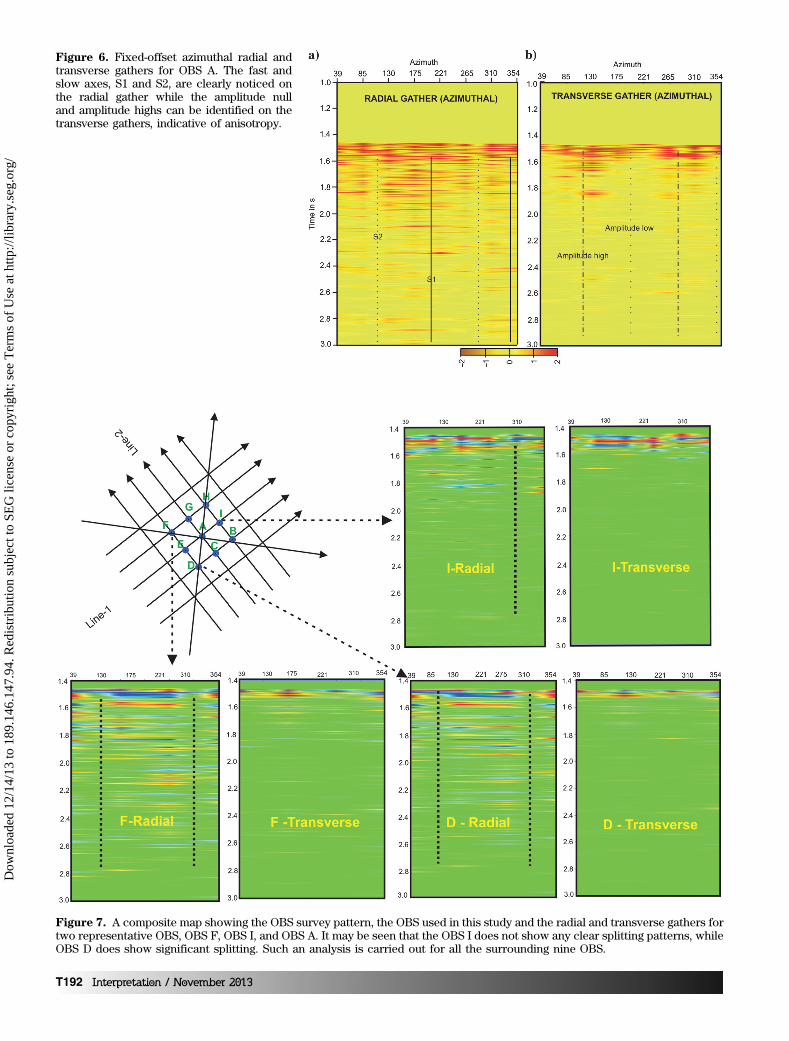
Figure 7. A composite map showing the OBS survey pattern, the OBS used in this study and the radial and transverse gathers fortwo representative OBS, OBS F, OBS I, and OBS A. It may be seen that the OBS I does not show any clear splitting patterns, whileOBS D does show significant splitting. Such an analysis is carried out for all the surrounding nine OBS.
Figure 6. Fixed-offset azimuthal radial andtransverse gathers for OBS A. The fast andslow axes, S1 and S2, are clearly noticed onthe radial gather while the amplitude nulland amplitude highs can be identified on thetransverse gathers, indicative of anisotropy.
T192 Interpretation / November 2013
Dow
nloa
ded
12/1
4/13
to 1
89.1
46.1
47.9
4. R
edis
trib
utio
n su
bjec
t to
SEG
lice
nse
or c
opyr
ight
; see
Ter
ms
of U
se a
t http
://lib
rary
.seg
.org
/
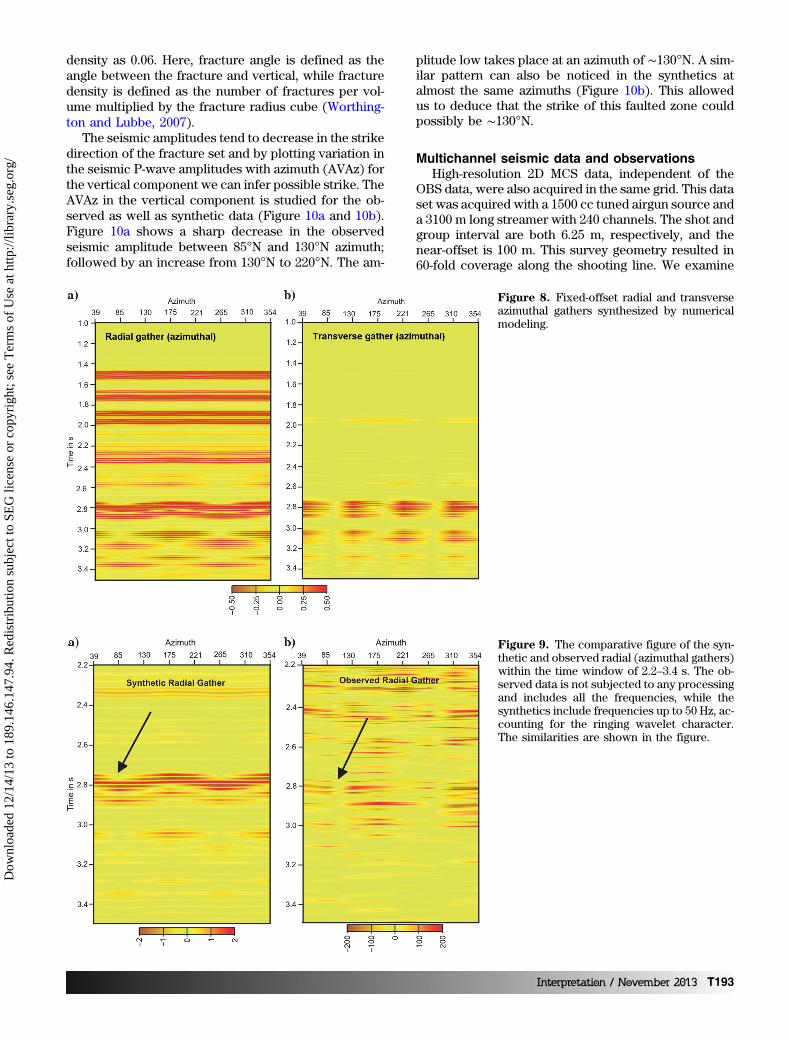
density as 0.06. Here, fracture angle is defined as theangle between the fracture and vertical, while fracturedensity is defined as the number of fractures per vol-ume multiplied by the fracture radius cube (Worthing-ton and Lubbe, 2007).
The seismic amplitudes tend to decrease in the strikedirection of the fracture set and by plotting variation inthe seismic P-wave amplitudes with azimuth (AVAz) forthe vertical component we can infer possible strike. TheAVAz in the vertical component is studied for the ob-served as well as synthetic data (Figure 10a and 10b).Figure 10a shows a sharp decrease in the observedseismic amplitude between 85°N and 130°N azimuth;followed by an increase from 130°N to 220°N. The am-
plitude low takes place at an azimuth of ∼130°N. A sim-ilar pattern can also be noticed in the synthetics atalmost the same azimuths (Figure 10b). This allowedus to deduce that the strike of this faulted zone couldpossibly be ∼130°N.
Multichannel seismic data and observationsHigh-resolution 2D MCS data, independent of the
OBS data, were also acquired in the same grid. This dataset was acquired with a 1500 cc tuned airgun source anda 3100 m long streamer with 240 channels. The shot andgroup interval are both 6.25 m, respectively, and thenear-offset is 100 m. This survey geometry resulted in60-fold coverage along the shooting line. We examine
Figure 8. Fixed-offset radial and transverseazimuthal gathers synthesized by numericalmodeling.
Figure 9. The comparative figure of the syn-thetic and observed radial (azimuthal gathers)within the time window of 2.2–3.4 s. The ob-served data is not subjected to any processingand includes all the frequencies, while thesynthetics include frequencies up to 50 Hz, ac-counting for the ringing wavelet character.The similarities are shown in the figure.
Interpretation / November 2013 T193
Dow
nloa
ded
12/1
4/13
to 1
89.1
46.1
47.9
4. R
edis
trib
utio
n su
bjec
t to
SEG
lice
nse
or c
opyr
ight
; see
Ter
ms
of U
se a
t http
://lib
rary
.seg
.org
/

the high-resolution seismic images obtained from thissurvey to verify the results obtained from the OBSdata modeling. As mentioned earlier, the MCS andOBS surveys were carried out independent of eachother, but along the same lines to facilitate the correla-tion between the two data sets.
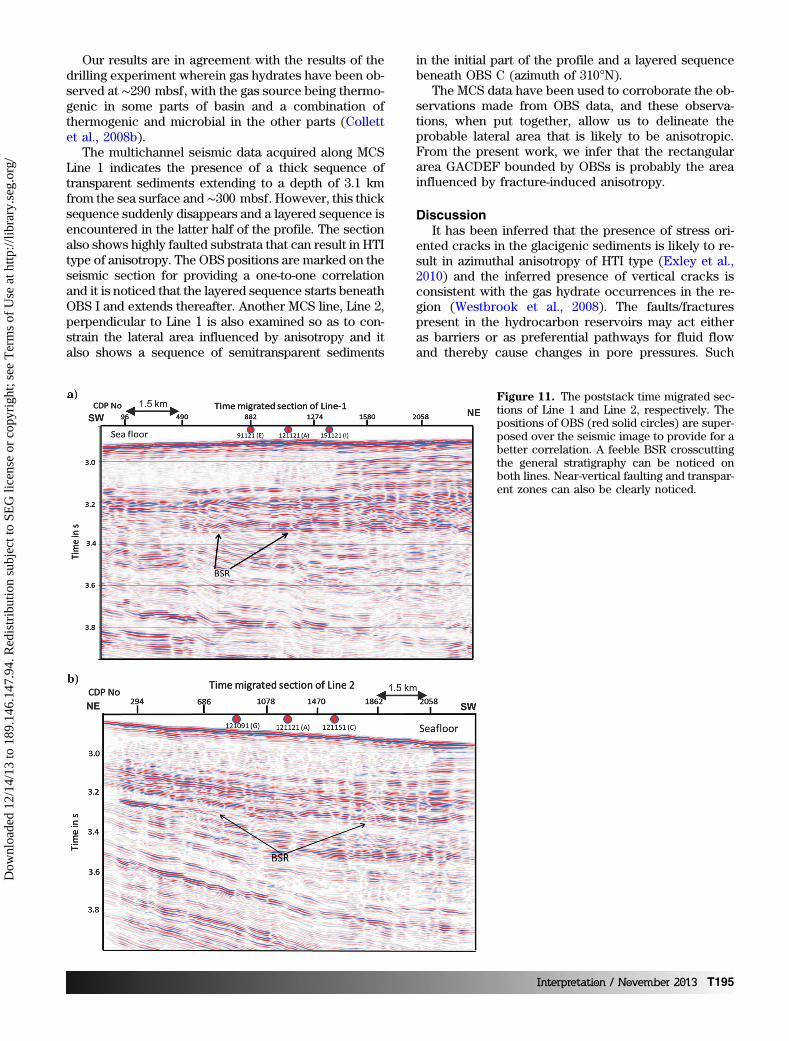
Two seismic sections (Line 1 and Line 2) along theshooting lines passing through OBS positions E, A, I andG, A, C are presented in Figure 11a and 11b, respec-tively. For OBS A, these two lines are along theazimuths of ∼221°N-41°N and ∼310°N-130°N, respec-tively. The OBS positions are shown on the seismic im-age to provide a direct link between these two types ofdata sets. There is significant dimming of seismic ampli-tudes in parts of these lines. Figure 11a correspondingto Line 1 shows significant reduction of amplitude in theSW part of the section between seafloor and two-waytime of nearly 3.2 s. We notice similar anomalous behav-ior in the northwest part of Line 2 (Figure 11b). Sucheffects can be explained by changes in lithology, butsuch drastic changes in lithology are not expected inthis area. Upon careful examination, we notice thatthese observed effects in the multichannel sectioncan be related to the observations made in the OBSdata, as discussed in the previous section. The azimuthsof these two lines are nearly coincident with the direc-
tions of minimum amplitude caused by azimuthal AVO,as observed in the OBS data located on these lines. Itappears that the region of low-amplitude in MCS datacoincides with our anisotropic region inferred fromthe OBS data. By coincidence, the azimuth of theMCS line is along the direction of P-wave amplitudeminimum observed in the OBS data (Figure 12). Simi-larly, the remaining part of the profile coincides withour inferred zone of isotropy, where we observe layer-ing. Numerous vertical/near-vertical faults are also seenin the section.
The observations made from the streamer data indi-cate that the entire rectangular region falling within thelimits of OBS locations A, C, D, and E could be aniso-tropic, as the signal strength is very low in this region.This region is shown as masked rectangle in theFigure 12. However, the results derived using the radialand transverse components of the OBS study revealedthat the splitting patterns are dominantly observed inthe region bounded by OBS positions G, A, C, D, E,and F. The results obtained from the OBS data arenot only in agreement with the MCS data, but also de-fine a larger region that is anisotropic.
ResultsS-wave splitting is a diagnostic of the subsurface
anisotropy and exhibits alternating zones of null ampli-tude and high amplitude in the transverse componentsof the 3C OBS data. In our analysis, we observedfour such zones of null amplitudes and high ampli-tudes evenly distributed in azimuth in the transversecomponent of the azimuthal gather of the OBS data re-corded in the Mahanadi basin. The azimuthal gather ofthe radial component shows the fast (S1) and slow(S2) modes of propagation, indicating the presenceof azimuthal anisotropy and also provides orientationof fractures.
The splitting pattern is seen almost over the entiretime length of 4 s, implying a deep-seated source ofanisotropy perhaps caused by a set of near-verticalfractures occurring in the deeper sediments. The ampli-tudes observed in the time window of 2.5–3.5 s matchwith those in the synthetic data after inclusion of a setof fractures having a fracture density of 0.06 and a dip of85°. These occur at a depth of about 260 m below theseafloor within the hydrated zone.
The AVAz study for the vertical component data ofOBS A matches with that of the synthetic data. The am-plitudes seem to attain minimum at an azimuth of∼130°N and is interpreted as the likely strike directionof this fracture set.
Mahanadi basin has a fully developed fault systemthat is conducive for the formation of gas hydratesand the significant splitting patterns confirm the pres-ence of such faults. The synthetic modeling allows usto infer that the observed anisotropy could be due toa set of aligned fractures in the gas hydrate zone, pre-vailing at a depth of 260 mbsf.
Figure 10. The variation in seismic amplitude for the verticalcomponent (P-wave) as a function of azimuth plotted for ob-served and synthetic data for OBS A. A clear reduction in seis-mic amplitudes can be noticed at an azimuth of 130°, in thesynthetic as well as observed data.
T194 Interpretation / November 2013
Dow
nloa
ded
12/1
4/13
to 1
89.1
46.1
47.9
4. R
edis
trib
utio
n su
bjec
t to
SEG
lice
nse
or c
opyr
ight
; see
Ter
ms
of U
se a
t http
://lib
rary
.seg
.org
/
Our results are in agreement with the results of thedrilling experiment wherein gas hydrates have been ob-served at ∼290 mbsf, with the gas source being thermo-genic in some parts of basin and a combination ofthermogenic and microbial in the other parts (Collettet al., 2008b).
The multichannel seismic data acquired along MCSLine 1 indicates the presence of a thick sequence oftransparent sediments extending to a depth of 3.1 kmfrom the sea surface and ∼300 mbsf. However, this thicksequence suddenly disappears and a layered sequence isencountered in the latter half of the profile. The sectionalso shows highly faulted substrata that can result in HTItype of anisotropy. The OBS positions are marked on theseismic section for providing a one-to-one correlationand it is noticed that the layered sequence starts beneathOBS I and extends thereafter. Another MCS line, Line 2,perpendicular to Line 1 is also examined so as to con-strain the lateral area influenced by anisotropy and italso shows a sequence of semitransparent sediments
in the initial part of the profile and a layered sequencebeneath OBS C (azimuth of 310°N).
The MCS data have been used to corroborate the ob-servations made from OBS data, and these observa-tions, when put together, allow us to delineate theprobable lateral area that is likely to be anisotropic.From the present work, we infer that the rectangulararea GACDEF bounded by OBSs is probably the areainfluenced by fracture-induced anisotropy.
DiscussionIt has been inferred that the presence of stress ori-
ented cracks in the glacigenic sediments is likely to re-sult in azimuthal anisotropy of HTI type (Exley et al.,2010) and the inferred presence of vertical cracks isconsistent with the gas hydrate occurrences in the re-gion (Westbrook et al., 2008). The faults/fracturespresent in the hydrocarbon reservoirs may act eitheras barriers or as preferential pathways for fluid flowand thereby cause changes in pore pressures. Such
Figure 11. The poststack time migrated sec-tions of Line 1 and Line 2, respectively. Thepositions of OBS (red solid circles) are super-posed over the seismic image to provide for abetter correlation. A feeble BSR crosscuttingthe general stratigraphy can be noticed onboth lines. Near-vertical faulting and transpar-ent zones can also be clearly noticed.
Interpretation / November 2013 T195
Dow
nloa
ded
12/1
4/13
to 1
89.1
46.1
47.9
4. R
edis
trib
utio
n su
bjec
t to
SEG
lice
nse
or c
opyr
ight
; see
Ter
ms
of U
se a
t http
://lib
rary
.seg
.org
/

systems tend to cause anisotropy, because the resultingchanges in the stress will not behave isotropicallyaround the pores spaces/fractures. If the lithology ismore porous, then the gas hydrates are likely to bethe pore-filling type and if the lithology has little poros-ity, then the gas hydrates are likely to be formed as frac-ture-filling or fracture lining type. S-wave splitting canalso be caused due to the differential stress affectingthe grain boundaries and microcracks (Sayers and Ka-chanov, 2002), in addition to the near-vertical faulting.However, we have not considered that process as a con-tributor to the observed anisotropy, as we are mostlyrestricting our study to PS-mode conversions occurringat later times. In the present study, we notice significantconsistency in splitting patterns, with an increase in thePS time and as described by Exley et al. (2010), it mightsuggest that the splitting signal encountered is a cumu-lative signal emerging from the total sediment column.
ConclusionsThe OBS data set acquired in the Mahanadi offshore
gives us the opportunity to look into the azimuthalanisotropy. The S-wave splitting analysis is carriedout using 10 OBSs surrounding one central OBS andthe results show the significant consistency in splittingpatterns, allowing us to define the lateral area that isassociated with anisotropy.
A simple qualitative comparison and the match be-tween the synthetic and observed data indicate that anear-vertical fracture (dip angle of 85°) is able to ex-plain the observed anisotropy.
The seismic P-wave images obtained using 2D high-resolution MCS data give an idea about the existenceof fractures. However, the information provided bysuch analysis is not precise. We demonstrate that anintegrated interpretation of MCS and OBS data helpin the delineation of the lateral area that is anisotropic
and also provide the much required information aboutthe direction of anisotropic axes. The results from ourstudy can be used in a rock-physics modeling to arriveat precise quantitative estimation of hydrate saturation.
AcknowledgmentsTheDirector ofCSIR-NGRI is thanked for his kind con-
sent topublishthiswork.Theauthorsaregrateful toHarshGupta for his encouragement to carry out this work, andthe Ministry of Earth Sciences for providing the financialsupport. The cruise team comprising personnel from theGas-Hydrate Group at NGRI and the staff of M/V “Akade-mik Fersman” is also thanked for acquiring valuable dataused in this study. N. Satyavani thanks M. Ravikumar,D. S. Ramesh, and Kusumita Arora for helpful discus-sions. This is a contribution to SHORE-PSC 0205 projectof the 12th five-year plan of CSIR-NGRI.
ReferencesBastia, R., 2006, An overview of Indian sedimentary basins
with special focus on emerging east coast deep-waterfrontiers: The Leading Edge, 25, 818–829.
Boswell, R., M. Frye, D. Shelander, W. Shedd, D. R.McConnell, and A. Cook, 2012, Architecture of gas-hydrate-bearing sands from Walker Ridge 313, GreenCanyon 955, and Alaminos Canyon 21: Northern deep-water Gulf of Mexico: Marine and Petroleum Geology,34, 134–149.
Chun, J. H., Y. I. Kwon, H. Y. Lee, H. J. Kim, J. H. Kim, Y. S.Park, C. W. Jeon, J. W. Lee, G. O. An, B. K. Son, J. Ko,B. J. Ryu, D. Sunwoo, J. H. Oh, Y. Lee, T. J. Cheong, J. Y.Lee, and N. K. Kang, 2008, Shallow gas hydrate in deepsea sediments in the Ulleung back-arc basin, offshoreKorea: Proceedings of the 6th International Conferenceon Gas Hydrates.
Collett, T. S., M. Riedel, J. Cochran, R. Boswell, J. Presley,P. Kumar, A. V. Sathe, A. K. Sethi, M. Lall, and V. K.Sibal, NGHP Expedition 01 Scientists, 2008a, NGHPExpedition 01 2006, Initial Reports. Directorate Generalof Hydrocarbons: NOIDA and Ministry of Petroleum &Natural Gas, India.
Collett, T. S., M. Riedel, J. Cochran, R. Boswell, P. Kumar,and A. V. Sathe, 2008b, Indian continental margin gashydrate prospects: Results of the Indian national gas hy-drate program (NGHP) Expedition-01: Proceedings ofthe 6th International Conference on Gas Hydrates.
Cook, A., B. Anderson, A. Malinverno, S. Mrozewski, andD. Goldberg, 2010, Electrical anisotropy due to gas hy-drate-filled fractures: Geophysics, 75, no. 6, F173–F185,doi: 10.1190/1.3506530.
Cook, A. E., D. Goldberg, and R. L. Kleinberg, 2008, Frac-ture-controlled gas hydrate systems in the northern Gulfof Mexico: Marine and Petroleum Geology, 25, 932–941,doi: 10.1016/j.marpetgeo.2008.01.013.
Crampin, S., 1981, A review of wave propagation inanisotropic and cracked elastic media: Wave Motion,3, 343–391.
Figure 12. Area of anisotropy as deduced from the OBS andMCS data sets. Letters A, B, I denote the OBS positions. TheOBS shooting lines are shown as black lines. The MCS linesare shown in dashed magenta lines. The pale green box showsthe area of anisotropy as delineated from the MCS data alone,while the blue box (inclusive of pale green color box), showsthe area of anisotropy delineated by the OBS data.
T196 Interpretation / November 2013
Dow
nloa
ded
12/1
4/13
to 1
89.1
46.1
47.9
4. R
edis
trib
utio
n su
bjec
t to
SEG
lice
nse
or c
opyr
ight
; see
Ter
ms
of U
se a
t http
://lib
rary
.seg
.org
/

Crampin, S., 1985, Evaluation of anisotropy by shear-wavesplitting: Geophysics, 50, 142–152, doi: 10.1190/1.1441824.
Exley, R. J. K., G. K. Westbrook, R. R. Haacke, and S.Peacock, 2010, Detection of seismic anisotropy usingocean bottom seismometers: A case study from thenorthern headwall of the Storegga Slide: GeophysicalJournal International, 183, 188–210, doi: 10.1111/j.1365-246X.2010.04730.x.
Fuloria, R. C., 1993, Geology and hydrocarbon prospects ofMahanadi Basin, India, in S. K. Biswas, ed., Secondseminar on petroliferous basins of India: Part 2 IndianPetroleum Publishers, 1, 355–369.
Gaiser, J. E., 1999, Applications for vector coordinatesystems of 3-D converted-wave data: The Leading Edge,18, 1290.
Garotta, R., and P.Y. Granger, 1988, Acquisition and pro-cessing of 3C × 3D data using converted waves: 58th An-nual International Meeting, SEG, Expanded Abstracts,995–997.
Ghosh, R., S. Kalachand, and M. Ojha, 2010, Effectivemedium modeling of gas hydrate‐filled fractures usingthe sonic log in the Krishna‐Godavari basin, offshoreeastern India: Journal of Geophysical Research, 115,B06101, doi: 10.1029/2009JB006711.
Haacke, R. R., and G. K. Westbrook, 2006, A fast, robustmethod for detecting and characterizing the azimuthalanisotropy with marine PS converted waves and its ap-plication to the west Svalbard continental slope: Geo-physical Journal International, 167, 1402–1412.
Haacke, R. R., G. K. Westbrook, and S. Peacock, 2009,Layer stripping of shear wave splitting in marine PSwaves: Geophysical Journal International, 176, 782–804.
Jagannathan, C. R., C. Ratnam, N. C. Baishya, and U.Dasgupta, 1983, Geology of offshore Mahanadi Basin:Petroleum Asia Journal, 6, 101–104.
Keith, C. M., and S. Crampin, 1977, Seismic body waves inanisotropic media: Reflection and refraction at a planeinterface: Geophysical Journal of the Royal Astronomi-cal Society, 49, 181–208.
Kumar, D., M. K. Sen, N. L. Bangs, C. Wang, and I. Pecher,2006, Seismic anisotropy at Hydrate Ridge: GeophysicalResearch Letters, 33, L01306, doi: 10.1029/2005GL023945.
Lee, M. W., and T. S. Collett, 2012, Characteristics and in-terpretation of fracture-filled gas hydrate — An exam-ple from the Ulleung Basin, East Sea of Korea: Journalof Marine and Petroleum Geology, 47, 168–181.
Lynn, H. B., and L. A. Thomsen, 1990, Reflection shear-wave data collected near the principal axes of azimuthalanisotropy: Geophysics, 55, 147–156, doi: 10.1190/1.1442821.
Mallick, S., and L. N. Frazer, 1987, Practical aspects of re-flectivity modeling: Geophysics, 52, 1355–1364, doi: 10.1190/1.1442248.
Maultzsch, S., R. Nawab, S. Yuh, M. Idrees, and B. Frignet,2009, An integrated multi-azimuth VSP study for frac-
ture characterization in the vicinity of a well: Geophysi-cal Prospecting, 57, 263–274.
Pecher, I. A., W. S. Holbrook, M. K. Sen, D. Lizarralde, W. T.Wood, D. R. Hutchinson, W. P. Dillon, H. Hoskins, andR. A. Stephen, 2003, Seismic anisotropy in gas-hydrateand gas-bearing sediments on the Blake Ridge, froma walkaway vertical seismic profile: Geophysical Re-search Letters, 30: 1733.
Prakash, A., B. G. Samanta, and N. P. Singh, 2010, A seis-mic study to investigate the prospect of gas hydrate inMahanadi deep water basin, northeastern continentalmargin of India: Marine Geophysical Researches, 31,253–262.
Sain, K., and H. K. Gupta, 2008, Gas hydrates: Indianscenario: Journal of the Geological Society of India,72, 299–311.
Sain, K., and H. K. Gupta, 2012, Gas hydrates in India: Poten-tial and development: Gondwana Research, 22, 645–657.
Sain, K., M. Ojha, N. Satyavani, G. A. Ramadoss, T.Ramprasad, S. K. Das, and Gupta Harsh, 2012, Gas-hydrates in the Krishna-Godavari and Mahanadi Basins:New data: Journal of the Geological Society of India, 79,553–556.
Satyavani, N., K. Sain, M. Lall, and B. J. P. Kumar, 2008,Seismic attribute study for gas hydrates in the AndamanOffshore India: Marine Geophysical Researches, 29:167–175.
Sayers, C., and M. Kachanov, 2002/1995, Microcrack in-duced elastic wave anisotropy of brittle rock: Journalof Geophysical Research, 100, 4149–4156.
Shankar, U., K. Sain, and M. Riedel, 2012, Geothermal mod-eling for the base of gas hydrate stability zone and sat-uration of gas hydrate in the Krishna-Godavari Basin,eastern Indian margin: Journal of the Geological Societyof India, 79, 299–309.
Sil, S., R. Srivastava, and M. K. Sen, 2010, Observations ofshear wave splitting in the multicomponent node datafrom Atlantis field, Gulf of Mexico: Geophysical Pro-specting, 58, 953–964.
Simmons, J. L., 2009, Converted-wave splitting estimationand compensation: Geophysics, 74, no. 1, D37–D48, doi:10.1190/1.3036009.
Subrahmanyam, V., A. S. Subrahmanyam, G. P. S. Murty,and K. S. R. Murthy, 2008, Morphology and tectonicsof Mahanadi Basin, northeastern continental marginof India from geophysical studies: Marine Geology,253, 63–72. doi: 10.1016/j.margeo.2008.04.007.
Tatham, R. H., M. D. Matthews, K. K. Sekharan, C. J. Wade,and M. LiroL, 1992, A physical model study of shear-wavesplitting and fracture intensity: Geophysics, 57, 647–652,doi: 10.1190/1.1443278.
Thomsen, L., 1999, Converted-wave reflection seismologyover inhomogeneous, anisotropic media: Geophysics,64, 678–690, doi: 10.1190/1.1444577.
Tsvankin, I., J. Gaiser, V. Grechka, M. van der Baan, and L.Thomsen, 2010, Seismic anisotropy in exploration and
Interpretation / November 2013 T197
Dow
nloa
ded
12/1
4/13
to 1
89.1
46.1
47.9
4. R
edis
trib
utio
n su
bjec
t to
SEG
lice
nse
or c
opyr
ight
; see
Ter
ms
of U
se a
t http
://lib
rary
.seg
.org
/
reservoir characterization: An overview: Geophysics,75, no. 5, 75A15–75A29, doi: 10.1190/1.3481775.
Weinberger, J. L., and K. M. Brown, 2006, Fracture net-works and hydrate distribution at Hydrate Ridge, Oregon:Earth and Planetary Science Letters, 245, 123–136.
Westbrook, G. K., S. Chand, G. Rossi, C. Long, S. Bunz, A.Camerlenghi, J. M. Carcione, S. Dean, J. P. Foucher, E.Flueh, D. Gei, R. R. Haacke, G. Madrussani, J. Mienert,T. A. Minshull, H. Nouze, S. Peacock, T. J. Reston, M.Vanneste, and M. Zillmer, 2008, Estimation of gas-hydrate concentration from multi-component seismicdata at sites on the continental margins of NW Svalbardand the Storegga region of Norway: Marine and Petro-leum Geology, 25, 744–758.
Wild, P., 2011, Practical applications of seismic anisotropy:First Break, 29, 117–124.
Worthington, M. H., and R. Lubbe, 2007, The scaling offracture compliance, in L. Lonerga, R. J. H. Jolly, K.Rawnsley, and D. J. Sanderson, eds., Fractured reser-voirs: Geological Society of London Special Publication,270, 73–82.
Zelt, C. A., and R. B. Smith, 1992, Seismic traveltime inver-sion for 2D crustal velocity structure: Geophysical Jour-nal International, 108, 16–34.
Nittala Satyavani received an M.S.(1998) in exploration geophysics fromAndhra University and a Ph.D. (2002)from the National Geophysical Re-search Institute. Her research focusedon a novel approach to delineate theseismic velocities from the CDP re-flection data in presence of dippingstrata in the Aravalli Fold Belt region.
This was the first time that the velocity-depth configurationwas published along this tectonic province. Thereafter, shejoined the Gas Hydrate Group and is now actively engagedin the niche areas of seismic data processing, seismic attrib-ute analysis, traveltime tomography, prestack depth migra-tion, and seismic interpretation. She was actively involvedin the data acquisition for gas hydrates carried out by NGRIin the Eastern Margin of India. She is a member of SEG,EAGE, and the Geological Society of India. She has 19 pub-lications and 20 technical presentations at various nationaland international conferences.
Mrinal K. Sen received an M.Sc ingeophysics from ISM Dhanbad andPh.D. from University of Hawaii atManoa. He is currently the directorof the CSIR-National Geophysical Re-search Institute, India and Professorand Jackson Chair in Applied Seismol-ogy at UT Austin (on leave). Hisresearch interests include seismic
wave propagation and inverse theory. He has co-authoredtwo books on geophysical inversion.
Maheswar Ojha received a B.Sc.(1999) in physics (hons) from the Uni-versity of Calcutta, an M.Sc.Tech(2003) in applied geophysics fromthe Indian School of Mines, Dhanbad,and a Ph.D. (2009) in gas hydrate geo-physics from Osmania University, Hy-derabad. He is working on processing,modeling and full-waveform inversion
of multichannel and ocean bottom seismic data coupledwith rock physics modeling for the exploration of gashydrate.
Kalachand Sain received anM.Sc.Tech (1988) in applied geophys-ics from the Indian School of Mines,Dhanbad, and a Ph.D. in controlled-source seismology from OsmaniaUniversity, Hyderabad. He visitedCambridge University and RiceUniversity as a postdoctoral fellow.He is working as a senior principal sci-
entist and head of the Gas Hydrate Group at CSIR-NGRI.His main interests include exploration of gas hydrates,delineation of subvolcanic sediments and understandinggeotectonics based on traveltime tomography, AVO mod-eling, full-waveform inversion, seismic attenuation, attrib-utes, impedance inversion, rock physics modeling,prestack depth migration etc. He has published more than140 research articles and guided applied geophysicsM.Sc.Tech students for 55 dissertations. He is recognizedby many awards/fellowships; notable among them are Fel-low of National Academy of Sciences, India, AP ScientistAward, Young Scientist Award of CSIR, National MineralAward, Best Paper Award by International Associationfor Gondwana Research, Best Poster Award byInternational Conference on Oil & Gas by PETROTECH,Bureau Member of International Lithosphere Program,Raman Fellowship, BOYSCAST Fellowship, Krishnan GoldMedal of IGU, Prem Bahadur Memorial Lecture of IGC etc.He is a member of several national committees and edito-rial boards of international journals like Episodes, Journalof Geological Society of India, International Journal ofEarth Science & Engineering, and Geohorizons. Heserved as a guest editor for Elsevier’sMarine & PetroleumGeology and as a member of the editorial board for Spring-er’s second edition of Encyclopedia for Solid Earth Geo-physics.
T198 Interpretation / November 2013
Dow
nloa
ded
12/1
4/13
to 1
89.1
46.1
47.9
4. R
edis
trib
utio
n su
bjec
t to
SEG
lice
nse
or c
opyr
ight
; see
Ter
ms
of U
se a
t http
://lib
rary
.seg
.org
/
Related Documents


![Proyecto_melamine-OBS[1] Obs Burga](https://static.cupdf.com/doc/110x72/577c81d71a28abe054ae5c7d/proyectomelamine-obs1-obs-burga.jpg)


