ÀXES & PUBLIC SPENDING IN INDONESIA OPAY AND WHO BENEFITS? eeg~ THE ORLDBANK Australlan MINISTRY OF FINANCE IBRD •lIDA l WORLD BANK GROUP A d ý REPUBLIK INDONESIA

Welcome message from author
This document is posted to help you gain knowledge. Please leave a comment to let me know what you think about it! Share it to your friends and learn new things together.
Transcript
ÀXES & PUBLICSPENDING IN INDONESIA
OPAY AND WHO BENEFITS?
eeg~
THE ORLDBANK Australlan
MINISTRY OF FINANCE IBRD •lIDA l WORLD BANK GROUP A d ý
REPUBLIK INDONESIA

The World Bank ThWolBak PIEDN
Office Jakarta 11 tetN OEBR21
Indonesia Stock Exchange Wahnt ,DC243
Building Tower II/12th Floor
JI. Jend. Sudirman Kay.
52-53F(2252 15756
Jakarta 12910 ww .olbn or
P (6221) 5299-3000
F (6221) 5299-3111
Th WorldwBankbPRINTED/INS.
Taxes andPublicSpending The World Bank does not e n
in Indonesia: Wh/7o pays and gurnethac rcyo ofshbudri.
who benefits is a product of thdaaicueinti Foayqesosrgrig
the staff'of the World Bank. wokThbonaistisrp t,le ecnat
The findings, interpretations, clr,dnmntos n
and conclusions expressed oteinonaonswn VvAts
herein do not necessarily o n a nti okd vltscwrdakog
reflect the views of the ntipyayugeto
Board of Executive Directors tepr fteWrdBn n ate a-o
of the World Bank or the cnenn h ea tts (wioC olbn.r)
Govenmen the repese guarfanteerithey accrac ofe

OCTOBER 2015
Acknowledgements
Taxes and Public Spending in Indonesia: Who pays and The paper is a policy-oriented summary of Jellema,who benefits was prepared by Indonesia's Fiscal Policy Wai-Poi and Afkar (2015). For further information, pleaseAgency (Badon Kebokon Fiskol, or BKF) at the Ministry contact Matthew Wai-Poi (mwaipoi4worldbank.org).of Finance, Government of Indonesia, and the WorldBank's Poverty & Equity Global Practice. Financial support for this background paper and its
accompanying technical working paper was provided
The BKF team was led by Luky Alfirman (Director of by the Australian Department of Foreign Affairs andMacroeconomic Policy Center, PKEM-BKF) and included Trade through the trust fund for the Partnership forArti Dyah Woroutami (Head of Welfare and Labor Sub- Knowledge-based Poverty Reduction. The trust funddivision of PKEM-BKF) and Ahmad Fikri Aulia (Executive is under the strategic oversight of Bambang Widianto,
of Welfare and Labor Sub-division of PKEM-BKF), under Executive Secretary of the National Team for thethe guidance of Suahasil Nazara, Chairman of the Fiscal Acceleration of Poverty Reduction (Tim NasionalPolicy Agency Percepatan Penanggulangan Kemiskinan, or TNP2K)
and Rahma Iryanti of the National Development PlanningThe World Bank team included Rythia Afkar (Consultant, Agency (Badan Perencanaan Pembangunan Nasional,GPVDR), Jon Jellema (Consultant, GPVDR) and Matthew or Bappenas).Wai-Poi (Senior Economist, GPVDR). The team, led byVivi Alatas (Lead Economist, GPVDR), provides technical
and policy advice based on sound empirical research and The paper was edited by Peter Miwe. Layout for thisanalysis to the Government of Indonesia to support its paper was done by Bentuk Team (Andreas Pranoto,efforts to reduce poverty, vulnerability and inequality. Muhammad Kamal, Phoebe Wathoel, Randy Kurnia).
TAXES AND PUBLIC SPENDING IN INDONESIA
2
Table of
01 ACKNOWLEDGEMENTS
02 TABLE OF CONTENTS
03 LIST OF ACRONYMS, ABBREVIATIONS, AND INDONESIAN TERMS
04 EXECUTIVE SUMMARY
06 1. RISING INEQUALITY IN INDONESIA: CAUSES AND CONSEQUENCES
13 II. ADDRESSING INEQUALITY: THE ROLE OF FISCAL POLICY
15 III. WHAT THE GOVERNMENT CHOOSES TO SPEND ON CAN AFFECT INEQUALITY
26 IV. HOW THE GOVERNMENT CHOOSES TO RAISE MONEY CAN AFFECT INEQUALITY
30 V. CONCLUSION
33 REFERENCES
TAXES AND PUBLIC SPENDING IN INDONESIA
3 OCTOBER 2015
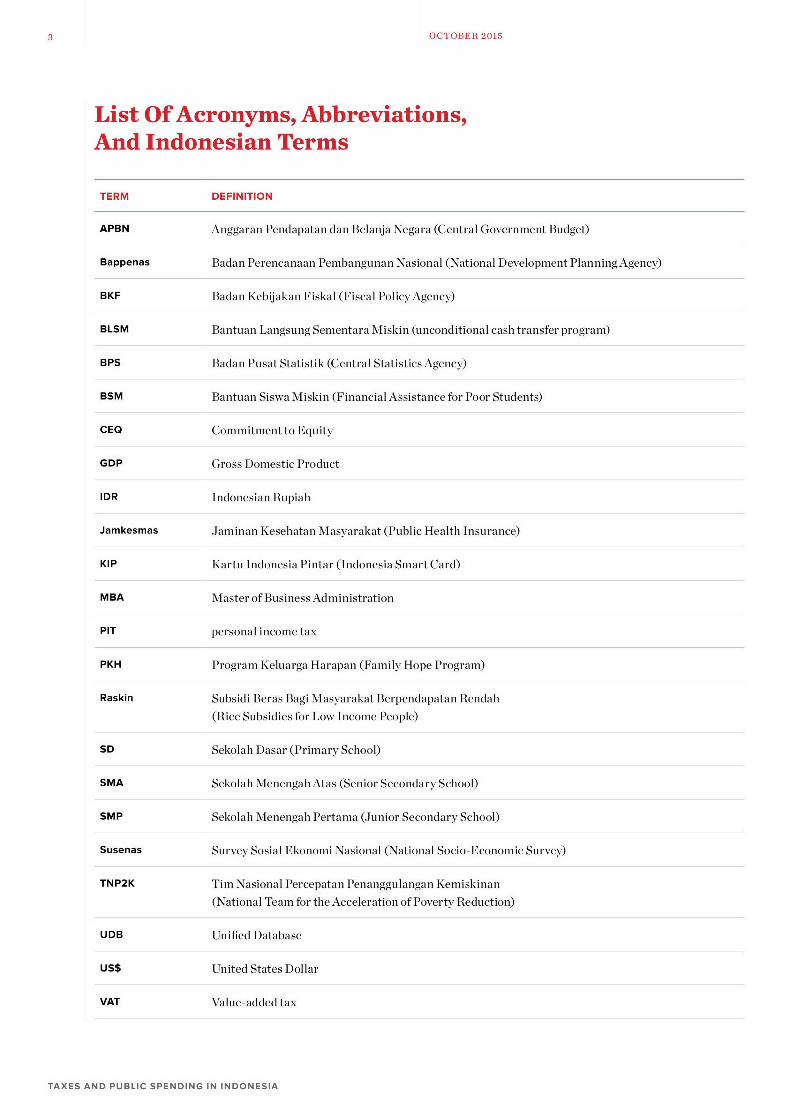
List Of Acronyms, Abbreviations,And Indonesian Terms
TERM DEFINITION
APBN Anggaran Pendapatan dan Belanja Negara (Central Government Budget)
Bappenas Badan Perencanaan Pembangunan Nasional (National Development Planning Agency)
BKF Badan Kebijakan Fiskal (Fiscal Policy Agency)
BLSM Bantuan Langsung Sementara Miskin (unconditional cash transfer program)
BPS Badan Pusat Statistik (Central Statistics Agency)
BSM Bantuan Siswa Miskin (Financial Assistance for Poor Students)
CEO Commitment to Equity
GDP Gross Domestic Product
IDR Indonesian Rupiah
Jamkesmas Jaminan Kesehatan Masyarakat (Public Health Insurance)
KIP Kartu Indonesia Pintar (Indonesia Smart Card)
MBA Master of Business Administration
PIT personal income tax
PKH Program Keluarga Harapan (Family Hope Program)
Raskin Subsidi Beras Bagi Masyarakat Berpendapatan Rendah
(Rice Subsidies for Low Income People)
SD Sekolah Dasar (Primary School)
SMA Sekolah MenengahAtas (Senior Secondary School)
SMP Sekolah Menengah Pertama (Junior Secondary School)
Susenas Survey Sosial Ekonomi Nasional (National Socio-Economic Survey)
TNP2K Tim Nasional Percepatan Penanggulangan Kemiskinan
(National Team for the Acceleration of Poverty Reduction)
UDB Unified Database
US$ United States Dollar
VAT Value-added tax
TAXES AND PUBLIC SPENDING IN INDONESIA
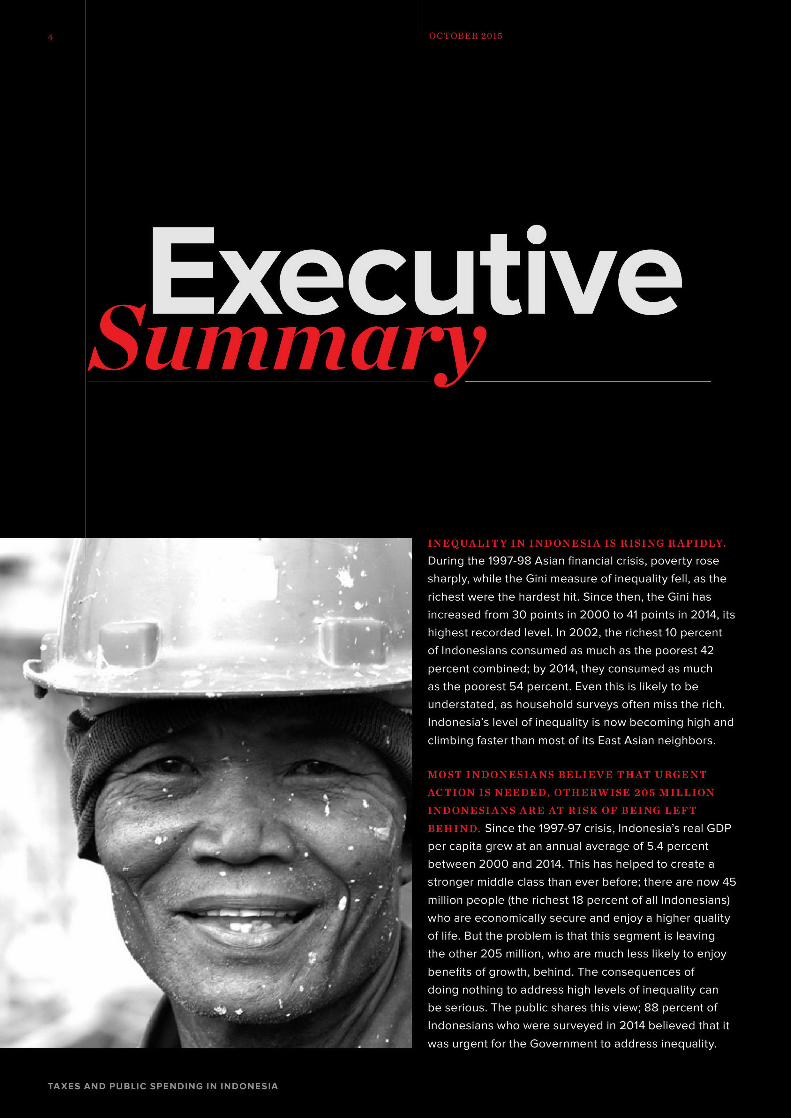
Executive
During the 1997-98 Asian financial crisis, poverty rose
sharply, while the Gini measure of inequality fell, as the
richest were the hardest hit. Since then, the Gini has
increased from 30 points in 2000 to 41 points in 2014, its
highest recorded level. In 2002, the richest 10 percent
of Indonesians consumed as much as the poorest 42
percent combined; by 2014, they consumed as much
as the poorest 54 percent. Even this is likely to be
understated, as household surveys often miss the rich.
Indonesia's level of inequality is now becoming high and
climbing faster than most of its East Asian neighbors.
Since the 1997-97 crisis, Indonesia's real GDP
per capita grew at an annual average of 5.4 percent
between 2000 and 2014. This has helped to create a
stronger middle class than ever before; there are now 45
million people (the richest l8 percent of all Indonesians)
who are economically secure and enjoy a higher quality
of life. But the problem is that this segment is leaving
the other 205 million, who are much less likely to enjoy
benefits of growth, behind. The consequences of
doing nothing to address high levels of inequality can
be serious. The public shares this view; 88 percent of
. .... Indonesians who were surveyed in 2014 believed that it
was urgent for the Government to address inequality.
In Indonesia, indirect taxes such as value-added
Fiscal policy - how and where the Government spends, tax and tobacco excise are relatively neutral and do
and how it raises money to fund this spending - is one of not have much impact on inequality. Revenue from
the four main policy responses to addressing inequality'. personal income tax is low in Indonesia, making up only
Some countries have successfully used fiscal policy to 10 percent of tax revenues, or around 1.9 percent of GDP.
reduce their levels of inequality; South Africa and Brazil's An increase in compliance and a broader tax base would
Gini coefficients fell by 17.5 and 14 points, respectively. increase revenues and also lower inequality. Global
In contrast, Indonesia's fiscal policy (based on 2012 data) experience shows, however, that progressive taxation
only reduced the Gini by 3 points. With growing concern benefitting poor and vulnerable households can only
about rising inequality levels, Indonesia should look to help tackle inequality if it is done in a sustainable way. In
address the problem through fiscal policy, among others. other countries, personal incomes tax raises significantly
more revenue and is borne to a much greater degree by
the rich, helping to reduce inequality directly, as well as
funding pro-poor spending.
Education spending,
which by law makes up 20 percent of the budget, is
inequality-reducing, although not as much as in other
countries. But Indonesia spends little on programs that are
most effective in reducing inequality. Health spending, for This paper uses 2012 data but a number of new and
example, benefits the poor relative to their income than it important developments have taken place since then.
does the rich. However, the low level of spending means Changes in fuel subsidy policies and an accompanying
it has little relatively little impact on inequality. Similarly, expansion in the scholarships program and the
social assistance programs are the most strongly pro-poor, distribution of temporary cash assistance took place
but they have little impact on inequality levels due to their during 2013-15. As a result, further research is now
small size. While other countries have effectively used needed to factor in these recent developments and also
cash transfers to reduce inequality, Indonesia invests the to bring in other key components of fiscal policy, such
least in these programs even though they are the most as personal income tax, that were not included in this
cost-effective inequality reducing programs. research. To address this, the Fiscal Policy Agency of
Indonesia's Ministry of Finance will collaborate with the
World Bank on follow-up analytical activities.
6 OCTOBER 2015
*RISINGINE QUALITY ININDONESIA:
Inequality has been increasing with economic growthbeing primarily enjoyed by relatively few households
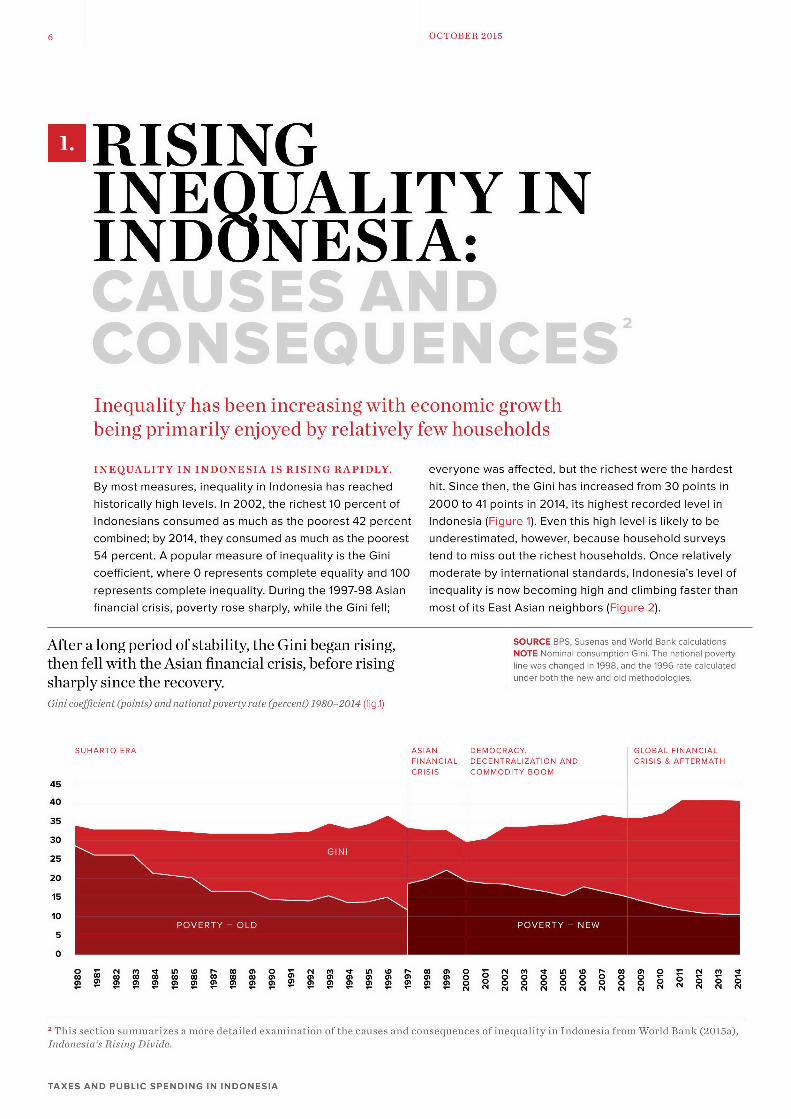
INEQUALITY IN INDONESIA IS RISING RAPIDLY. everyone was affected, but the richest were the hardest
By most measures, inequality in Indonesia has reached hit. Since then, the Gini has increased from 30 points in
historically high levels. In 2002, the richest 10 percent of 2000 to 41 points in 2014, its highest recorded level inIndonesians consumed as much as the poorest 42 percent Indonesia (Figure 1). Even this high level is likely to becombined; by 2014, they consumed as much as the poorest underestimated, however, because household surveys54 percent. A popular measure of inequality is the Gini tend to miss out the richest households. Once relativelycoefficient, where 0 represents complete equality and 100 moderate by international standards, Indonesia's level of
represents complete inequality. During the 1997-98 Asian inequality is now becoming high and climbing faster than
financial crisis, poverty rose sharply, while the Gini fell; most of its East Asian neighbors (Figure 2).
After a long period of stability, the Gini began rising, SOURCE BPS, Susenas and World Bank calculationsNOTE Nominal consumption Gini. The national poverty
then fell with the Asian financial crisis, before rising line was changed in 1998, and the 1996 rate calculated
sharply since the recovery. under both the new and old methodologies.
Gini coefficient (points) and national poverty rate (percent) 1980-2014 (fig.1)
SUHARTO ERA ASIAN DEMOCRACY, GLOBAL FINANCIALFINANCIAL DECENTRALIZATION AND CRISIS & AFTERMATHCRISIS COMMODITY BOOM
45
40
35
30
25 GN
20
15
10
0
00 0i000 w w w AA 011 1700 0 0 09! M iC ic iC ic 0 0 0 0 0 0 0 0
V T rTrVr VTrTrTr 9!rrVrVrT rT rrV rN NN N ON ON ON ON 'N ON ON N NN
2 This section summarizes a more detailed examination of the causes and consequences of inequality in Indonesia from World Bank (2015a),
Indonesia's Rising Divide.
TAXES AND PUBLIC SPENDING IN INDONESIA
7 RISING INEQUALITY IN INDONESIA: OCTOBER 2015CAUSES AND CONSEQUENCES
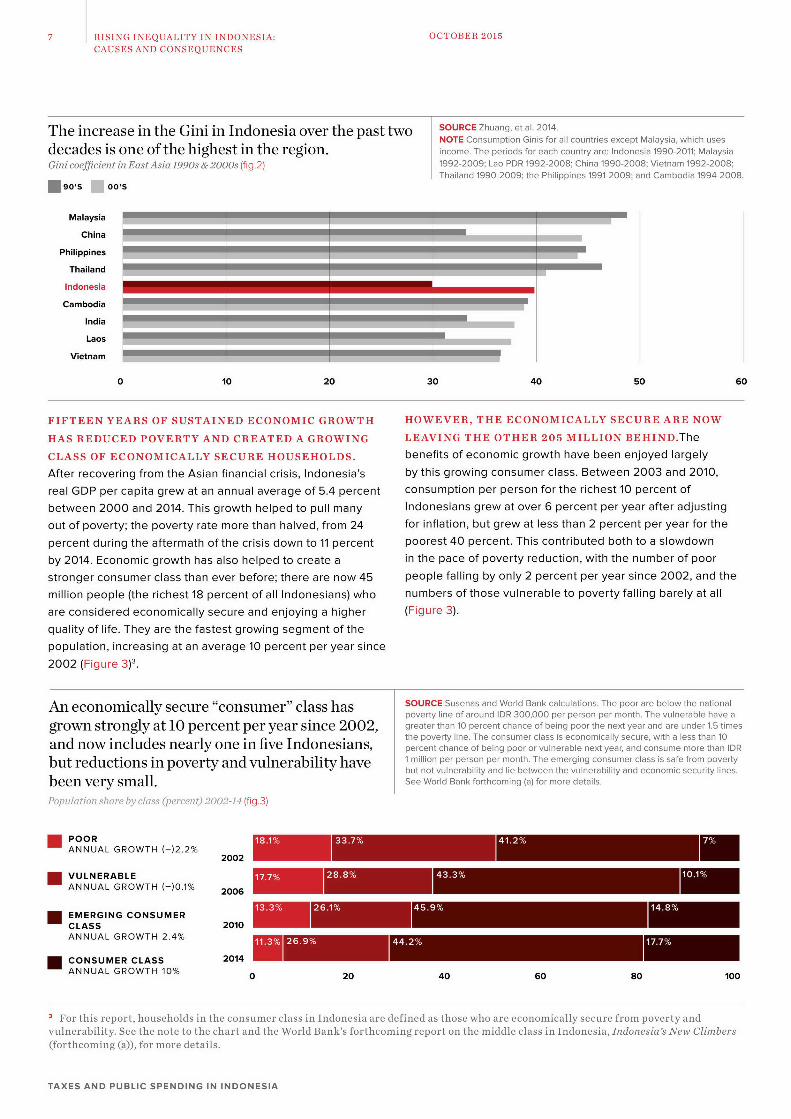
The increase in the Gini in Indonesia over the past two SOURCE Zhuang, et al. 2014.NOTE Consumption Ginis for all countries except Malaysia, which uses
decades is one of the highest in the region. income. The periods for each country are: Indonesia 1990-2011; Malaysia
Gini coefficient in East Asia l990s &2000s (fig.2) 1992-2009; Lao PDR 1992-2008; China 1990-2008; Vietnam 1992-2008;Thailand 1990-2009; the Philippines 1991-2009; and Cambodia 1994-2008.
090's oo's
Malaysia
China
Philippines
Thailand
Indonesia--
Cambodia
India
Laos
Vietnam
0 10 20 30 40 50 60
FIFTEEN YEARS OF SUSTAINED ECONOMIC GROWTH HOWEVER, THE ECONOMICALLY SECURE ARE NOW
HAS REDUCED POVERTY AND CREATED A GROWING LEAVING THE OTHER 205 MILLION BEHIND.The
CLASS OF ECONOMICALLY SECURE HOUSEHOLDS. benefits of economic growth have been enjoyed largely
After recovering from the Asian financial crisis, Indonesia's by this growing consumer class. Between 2003 and 2010,
real GDP per capita grew at an annual average of 5.4 percent consumption per person for the richest 10 percent of
between 2000 and 2014. This growth helped to pull many Indonesians grew at over 6 percent per year after adjusting
out of poverty; the poverty rate more than halved, from 24 for inflation, but grew at less than 2 percent per year for the
percent during the aftermath of the crisis down to 11 percent poorest 40 percent. This contributed both to a slowdown
by 2014. Economic growth has also helped to create a in the pace of poverty reduction, with the number of poor
stronger consumer class than ever before; there are now 45 people falling by only 2 percent per year since 2002, and the
million people (the richest 18 percent of all Indonesians) who numbers of those vulnerable to poverty falling barely at all
are considered economically secure and enjoying a higher (Figure 3).quality of life. They are the fastest growing segment of the
population, increasing at an average 10 percent per year since
2002 (Figure 3)3.
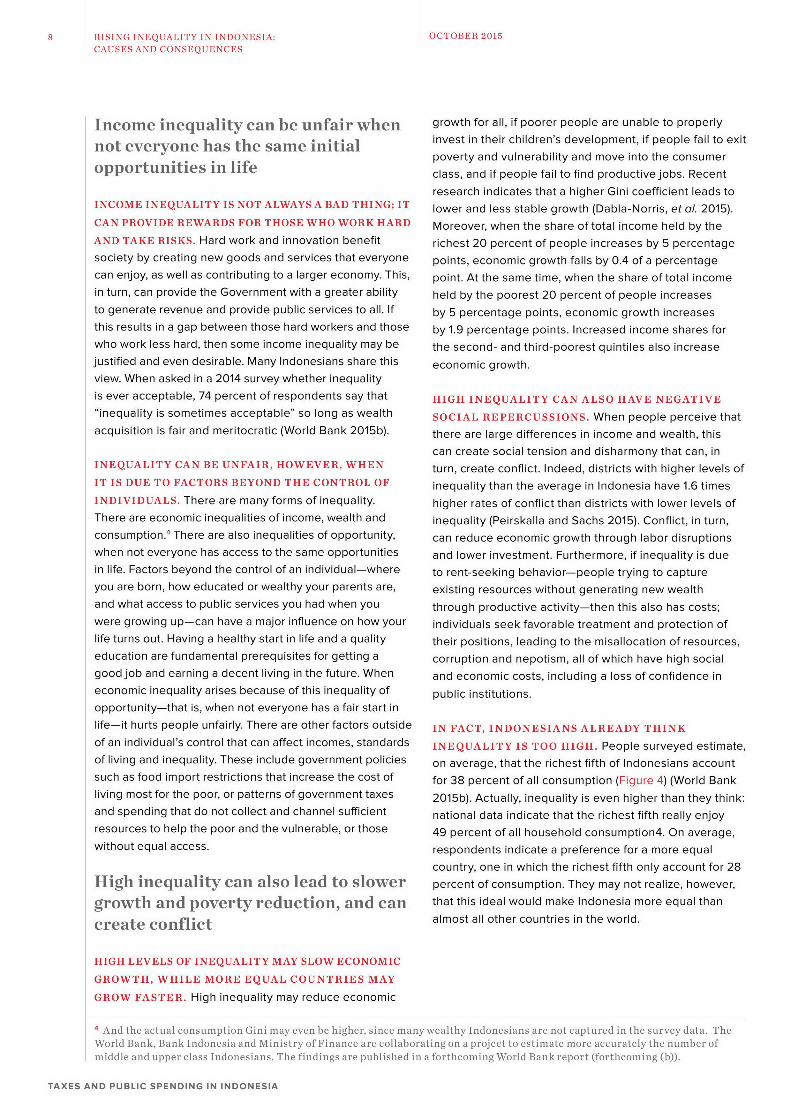
An economically secure "consumer" class has SOURCE Susenas and World Bank calculations. The poor are below the nationalpoverty line of around DR 300,000 per person per month. The vulnerable have a
grown strongly at 10 percent per year since 2002, greater than 10 percent chance of being poor the next year and are under 1.5 timesthe poverty line. The consumer class is economically secure, with a less than 10
and now includes nearly one in five Indonesians, percent chance of being poor or vulnerable next year, and consume more than R
but reductions in poverty and vulnerability have 1 million per person per month. The emerging consumer class is safe from povertybut not vulnerability and lie between the vulnerability and economic security lines.
been very small. See World Bank forthcoming (a) for more details.
P1pmlaiiln share by class (m mrcenr i o 2002-14 (fig.3)
POORANNUAL GROWTH (-)2.2% 2002
VULNERABLEANNUAL GROWTH (-)0.1% 2006
EMERGING CONSUMERCLASS 2010ANNUAL GROWTH 2.4%
CONSUMER CLASS 2014ANNUAL GROWTH 10% 0 20 40 60 80 100
For this report, households in the consumer class in Indonesia are defined as those who are economically secure from poverty and
vulnerability. See the note to the chart and the World Bank's forthcoming report on the middle class in Indonesia, Indonesia's New Climbers
(forthcoming (a)), for more details.
TAXES AND PUBLIC SPENDING IN INDONESIA
8 RISING INEQUALITY IN INDONESIA: OCTOBER 2015CAUSES AND CONSEQUENCES
Income inequality can be unfair when growth for all, if poorer people are unable to properly
not everyone has the same initial invest in their children's development, if people fail to exit
opportunitiespoverty and vulnerability and move into the consumeroppotuntiesin ifeclass, and if people fail to find productive jobs. Recent
research indicates that a higher Gini coefficient leads toINCOME INEQUALITY IS NOT ALWAYS A BAD THING; IT lower and less stable growth (Dabla-Norris, et a. 2015).CAN PROVIDE REWARDS FOR THOSE WHO WORK HARD Moreover, when the share of total income held by the
AND TAKE RISKS. Hard work and innovation benefit richest 20 percent of people increases by 5 percentagesociety by creating new goods and services that everyone points, economic growth falls by 0.4 of a percentagecan enjoy, as well as contributing to a larger economy. This, point. At the same time, when the share of total incomein turn, can provide the Government with a greater ability held by the poorest 20 percent of people increasesto generate revenue and provide public services to all. If by 5 percentage points, economic growth increasesthis results in a gap between those hard workers and those by 1.9 percentage points. Increased income shares forwho work less hard, then some income inequality may be the second- and third-poorest quintiles also increasejustified and even desirable. Many Indonesians share this economic growth.view. When asked in a 2014 survey whether inequalityis ever acceptable, 74 percent of respondents say that HIGH INEQUALITY CAN ALSO HAVE NEGATIVE"inequality is sometimes acceptable" so long as wealth SOCIAL REPERCUSSIONS. When people perceive thatacquisition is fair and meritocratic (World Bank 2015b). there are large differences in income and wealth, this
can create social tension and disharmony that can, inINEQUALITY CAN BE UNFAIR, HOWEVER, WHEN turn, create conflict. Indeed, districts with higher levels ofIT IS DUE TO FACTORS BEYOND THE CONTROL OF inequality than the average in Indonesia have 1.6 times
INDIVIDUALS. There are many forms of inequality. higher rates of conflict than districts with lower levels ofThere are economic inequalities of income, wealth and inequality (Peirskalla and Sachs 2015). Conflict, in turn,consumption.4 There are also inequalities of opportunity, can reduce economic growth through labor disruptionswhen not everyone has access to the same opportunities and lower investment. Furthermore, if inequality is duein life. Factors beyond the control of an individual-where to rent-seeking behavior-people trying to captureyou are born, how educated or wealthy your parents are, existing resources without generating new wealthand what access to public services you had when you through productive activity-then this also has costs;were growing up-can have a major influence on how your individuals seek favorable treatment and protection oflife turns out. Having a healthy start in life and a quality their positions, leading to the misallocation of resources,education are fundamental prerequisites for getting a corruption and nepotism, all of which have high socialgood job and earning a decent living in the future. When and economic costs, including a loss of confidence ineconomic inequality arises because of this inequality of public institutions.opportunity-that is, when not everyone has a fair start inlife-it hurts people unfairly. There are other factors outside IN FACT, INDONESIANS ALREADY THINK
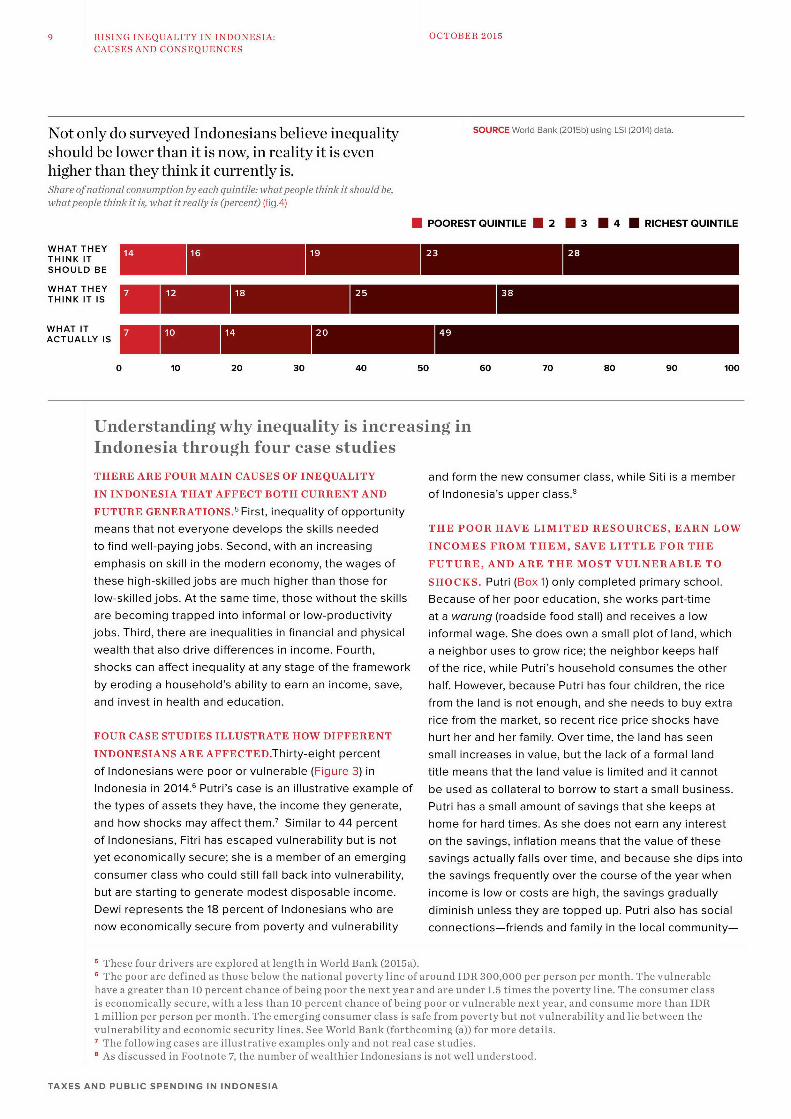
of an individual's control that can affect incomes, standards INEQUALITY IS TOO HIGH. People surveyed estimateof living and inequality. These include government policies on average, that the richest fifth of Indonesians accountsuch as food import restrictions that increase the cost of for 38 percent of all consumption (Figure 4) (World Bankliving most for the poor, or patterns of government taxes 2015b). Actually, inequality is even higher than they think:and spending that do not collect and channel sufficient national data indicate that the richest fifth really enjoyresources to help the poor and the vulnerable, or those 49 percent of all household consumption4. On average,without equal access. respondents indicate a preference for a more equal
country, one in which the richest fifth only account for 28High inequality can also lead to slower percent of consumption. They may not realize, however,
growth and poverty reduction, and can that this ideal would make Indonesia more equal than
create conflict almost all other countries in the world.
HIGH LEVELS OF INEQUALITY MAY SLOW ECONOMIC
GROWTH, WHILE MORE EQUAL COUNTRIES MAY
GROW FASTER. High inequality may reduce economic
r And the actual consumption Gini may even be higher, since many wealthy Indonesians are not captured in the survey data. TheWorld Bank, Bank Indonesia and Ministry of Finance are collaborating on a project to estimate more accurately the number ofmiddle and upper class Indonesians. The findings are published in a forthcoming World Bank report (forthcoming (b)).
TAXES AND PUBLIC SPENDING IN INDONESIA
9 RISING INEQUALITY IN INDONESIA: OCTOBER 2015CAUSES AND CONSEQUENCES
Not only do surveyed Indonesians believe inequality SOURCE World Bank (2015b) using LSI (2014) data.
should be lower than it is now, in reality it is evenhigher than they think it currently is.Share ofnational consumption by each quintile: what people think it should be,what people think it is, what it really is (percent) (fig.4)
U POOREST QUINTILE U 2 U 3 U 4 U RICHEST QUINTILE
WHAT THEYTHINK ITSHOULD BE
WHAT THEYTHINK IT IS
WHAT ITACTUALLY IS
O 10 20 30 40 50 60 70 80 90 100
Understanding why inequality is increasing inIndonesia through four case studies
THERE ARE FOUR MAIN CAUSES OF INEQUALITY and form the new consumer class, while Siti is a member
IN INDONESIA THAT AFFECT BOTH CURRENT AND of Indonesia's upper class.'
FUTURE GENERATIONS. 5 First, inequality of opportunity
means that not everyone develops the skills needed THE POOR HAVE LIMITED RESOURCES, EARN LOW
to find well-paying jobs. Second, with an increasing INCOMES FROM THEM, SAVE LITTLE FOR THE
emphasis on skill in the modern economy, the wages of FUTURE, AND ARE THE MOST VULNERABLE TO
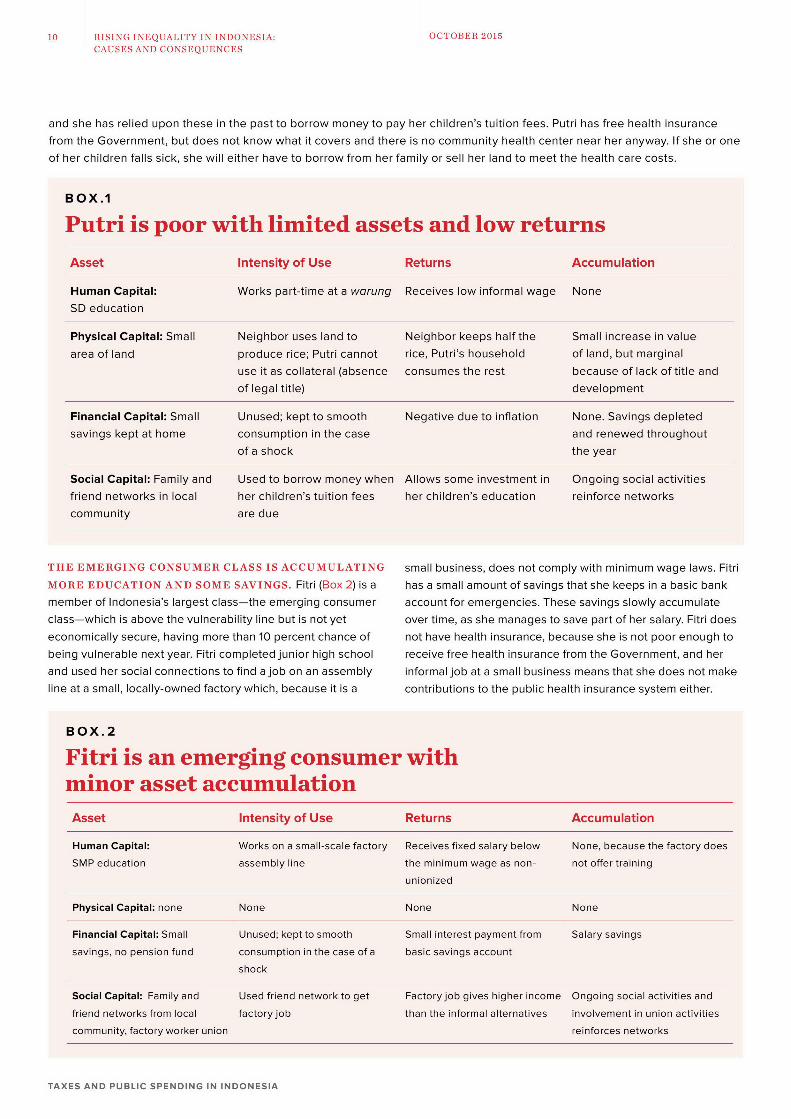
these high-skilled jobs are much higher than those for SHOCKS. Putri (Box 1) only completed primary school.
low-skilled jobs. At the same time, those without the skills Because of her poor education, she works part-time
are becoming trapped into informal or low-productivity at a warung (roadside food stall) and receives a lowjobs. Third, there are inequalities in financial and physical informal wage. She does own a small plot of land, which
wealth that also drive differences in income. Fourth, a neighbor uses to grow rice; the neighbor keeps halfshocks can affect inequality at any stage of the framework of the rice, while Putri's household consumes the other
by eroding a household's ability to earn an income, save, half. However, because Putri has four children, the riceand invest in health and education. from the land is not enough, and she needs to buy extra
rice from the market, so recent rice price shocks have
FOUR CASE STUDIES ILLUSTRATE HOW DIFFERENT hurt her and her family. Over time, the land has seen
INDONESIANS ARE AFFECTED.Thirty-eight percent small increases in value, but the lack of a formal land
of Indonesians were poor or vulnerable (Figure 3) in title means that the land value is limited and it cannotIndonesia in 2014.6 Putri's case is an illustrative example of be used as collateral to borrow to start a small business.
the types of assets they have, the income they generate, Putri has a small amount of savings that she keeps atand how shocks may affect them.' Similar to 44 percent home for hard times. As she does not earn any interest
of Indonesians, Fitri has escaped vulnerability but is not on the savings, inflation means that the value of these
yet economically secure; she is a member of an emerging savings actually falls overtime, and because she dips intoconsumer class who could still fall back into vulnerability, the savings frequently over the course of the year whenbut are starting to generate modest disposable income. income is low or costs are high, the savings gradually
Dewi represents the 18 percent of Indonesians who are diminish unless they are topped up. Putri also has socialnow economically secure from poverty and vulnerability connections-friends and family in the local community-
These four drivers are explored at length in World Bank (2015a).The poor are defined as those below the national poverty line of around IDR 300,000 per person per month. The vulnerable
have a greater than 10 percent chance of being poor the next year and are under 1.5 times the poverty line. The consumer class
is economically secure, with a less than 10 percent chance of being poor or vulnerable next year, and consume more than IDR1 million per person per month. The emerging consumer class is safe from poverty but not vulnerability and lie between the
vulnerability and economic security lines. See World Bank (forthcoming (a)) for more details.
The following cases are illustrative examples only and not real case studies.
sAs discussed in Footnote 7, the number ofwealthier Indonesians is not well understood.
TAXES AND PUBLIC SPENDING IN INDONESIA
10 RISING INEQUALITY IN INDONESIA: OCTOBER 2015CAUSES AND CONSEQUENCES
and she has relied upon these in the past to borrow money to pay her children's tuition fees. Putri has free health insurancefrom the Government, but does not know what it covers and there is no community health center near her anyway. If she or oneof her children falls sick, she will either have to borrow from her family or sell her land to meet the health care costs.
BOX.1
Putri is poor with limited assets and low returns
Asset Intensity of Use Returns Accumulation
Human Capital: Works part-time at a warung Receives low informal wage NoneSD education
Physical Capital: Small Neighbor uses land to Neighbor keeps half the Small increase in value
area of land produce rice; Putri cannot rice, Putri's household of land, but marginal
use it as collateral (absence consumes the rest because of lack of title andof legal title) development
Financial Capital: Small Unused; kept to smooth Negative due to inflation None. Savings depletedsavings kept at home consumption in the case and renewed throughout
of a shock the year
Social Capital: Family and Used to borrow money when Allows some investment in Ongoing social activitiesfriend networks in local her children's tuition fees her children's education reinforce networkscommunity are due
THE EMERGING CONSUMER CLASS IS ACCUMULATING small business, does not comply with minimum wage laws. Fitri
MORE EDUCATION AND SOME SAVINGS. Fitri (Box 2) is a has a small amount of savings that she keeps in a basic bank
member of Indonesia's largest class-the emerging consumer account for emergencies. These savings slowly accumulateclass-which is above the vulnerability line but is not yet over time, as she manages to save part of her salary. Fitri doeseconomically secure, having more than 10 percent chance of not have health insurance, because she is not poor enough tobeing vulnerable next year. Fitri completed junior high school receive free health insurance from the Government, and herand used her social connections to find a job on an assembly informal job at a small business means that she does not makeline at a small, locally-owned factory which, because it is a contributions to the public health insurance system either.
BOX.2
Fitri is an emerging consumer withminor asset accumulationAsset Intensity of Use Returns Accumulation
Human Capital: Works on a small-scale factory Receives fixed salary below None, because the factory does
SMP education assembly line the minimum wage as non- not offer training
unionized
Physical Capital: none None None None
Financial Capital: Small Unused; kept to smooth Small interest payment from Salary savings
savings, no pension fund consumption in the case of a basic savings account
shock
Social Capital: Family and Used friend network to get Factory job gives higher income Ongoing social activities and
friend networks from local factory job than the informal alternatives involvement in union activities
community, factory worker union reinforces networks
TAXES AND PUBLIC SPENDING IN INDONESIA
11 RISING INEQUALITY IN INDONESIA: OCTOBER 2015CAUSES AND CONSEQUENCES
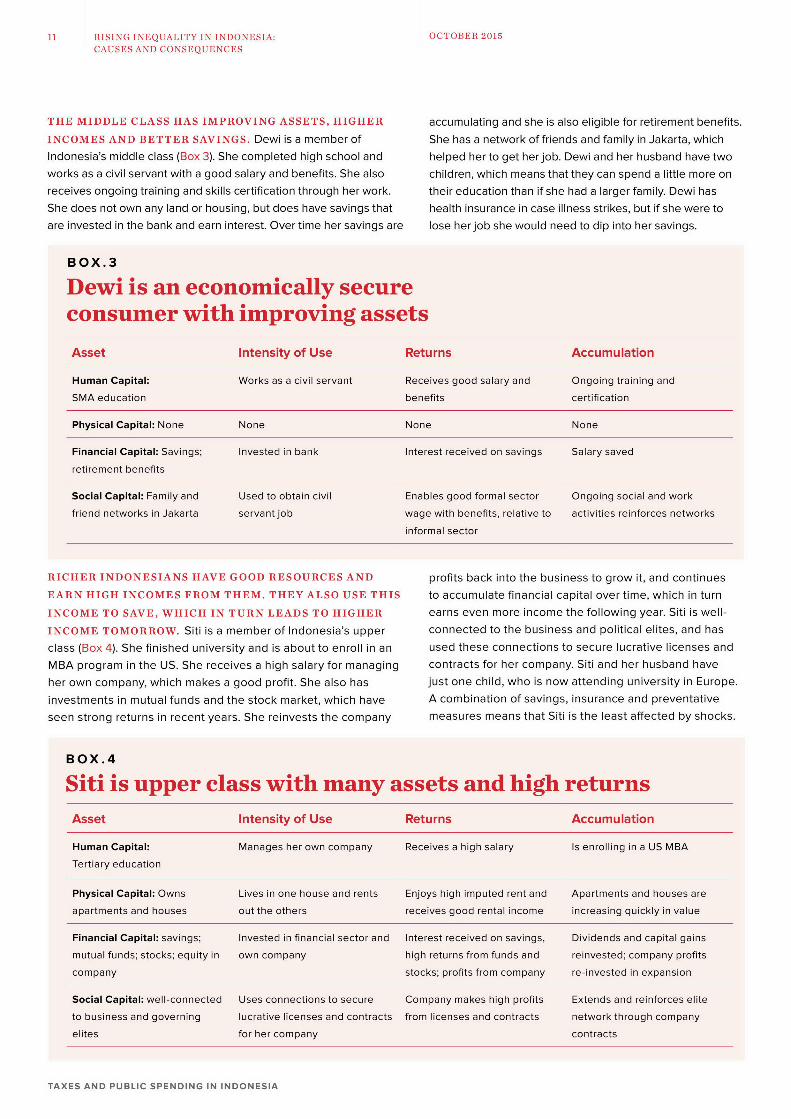
THE MIDDLE CLASS HAS IMPROVING ASSETS, HIGHER accumulating and she is also eligible for retirement benefits.
INCOMES AND BETTER SAVINGS. Dewi is a member of She has a network of friends and family in Jakarta, which
Indonesia's middle class (Box 3). She completed high school and helped her to get her job. Dewi and her husband have twoworks as a civil servant with a good salary and benefits. She also children, which means that they can spend a little more onreceives ongoing training and skills certification through her work. their education than if she had a larger family. Dewi hasShe does not own any land or housing, but does have savings that health insurance in case illness strikes, but if she were toare invested in the bank and earn interest. Over time her savings are lose her job she would need to dip into her savings.
BOX.3
Dewi is an economically secureconsumer with improving assets
Asset Intensity of Use Returns Accumulation
Human Capital: Works as a civil servant Receives good salary and Ongoing training and
SMA education benefits certification
Physical Capital: None None None None
Financial Capital: Savings; Invested in bank Interest received on savings Salary saved
retirement benefits
Social Capital: Family and Used to obtain civil Enables good formal sector Ongoing social and work
friend networks in Jakarta servant job wage with benefits, relative to activities reinforces networks
informal sector
RICHER INDONESIANS HAVE GOOD RESOURCES AND profits back into the business to grow it, and continues
EARN HIGH INCOMES FROM THEM. THEY ALSO USE THIS to accumulate financial capital over time, which in turn
INCOME TO SAVE, WHICH IN TURN LEADS TO HIGHER earns even more income the following year. Siti is well-
INCOME TOMORROW. Siti is a member of Indonesia's upper connected to the business and political elites, and has
class (Box 4). She finished university and is about to enroll in an used these connections to secure lucrative licenses and
MBA program in the US. She receives a high salary for managing contracts for her company. Siti and her husband have
her own company, which makes a good profit. She also has just one child, who is now attending university in Europe.
investments in mutual funds and the stock market, which have A combination of savings, insurance and preventative
seen strong returns in recent years. She reinvests the company measures means that Siti is the least affected by shocks.
BOX.4
Siti is upper class with many assets and high returnsAsset Intensity of Use Returns Accumulation
Human Capital: Manages her own company Receives a high salary Is enrolling in a US MBA
Tertiary education
Physical Capital: Owns Lives in one house and rents Enjoys high imputed rent and Apartments and houses are
apartments and houses out the others receives good rental income increasing quickly in value
Financial Capital: savings; Invested in financial sector and Interest received on savings, Dividends and capital gains
mutual funds; stocks; equity in own company high returns from funds and reinvested; company profits
company stocks; profits from company re-invested in expansion
Social Capital: well-connected Uses connections to secure Company makes high profits Extends and reinforces elite
to business and governing lucrative licenses and contracts from licenses and contracts network through company
elites for her company contracts
TAXES AND PUBLIC SPENDING IN INDONESIA

12 RISING INEQUALITY IN INDONESIA: OCTOBER 2015CAUSES AND CONSEQUENCES
RECENT CHANGES IN THE FOUR
MAIN CAUSES OF INEQUALITY
ALSO MEAN IT IS INCREASING.
While gaps in access to health and
education have closed, a qualitygap remains. As a result, the gapsin health and education outcomeshave not closed as much the gapsin access. Consequently, althoughmany poorer children are staying in
school longer, they are not receivingthe skills they need for better jobswhen they graduate. And the stakes
are getting higher. With the demandfor skilled labor increasing constantly,the gap between skilled andunskilled wages is also increasing,which means that inequality due towage income is also on the rise. At
the same time, not only do a smallnumber of Indonesians hold most
of the financial and physical wealth,this concentration of wealth hasbeen increasing even further, alsocontributing to higher inequality.Finally, shocks are becoming more
prevalent, making it increasingly hardfor Indonesians outside of the top
20 percent to climb up the economicladder. For example, people are livinglonger but obesity is also increasing,so non-communicable diseasessuch as diabetes are becoming anincreasingly common problem.
Given the high level of inequality in Indonesia and publicconcern, the consequences of doing nothing could beserious; urgent action is needed
GIVEN THIS PERCEPTION, MOST INDONESIANS FOUR HIGH PRIORITY ACTIONS FOR REDUCING
FEEL THAT URGENT ACTION IS NEEDED, WHICH IS INEQUALITY HAVE BEEN IDENTIFIED (WORLD
WHY INEQUALITY HAS BECOME A MAJOR PUBLIC BANK 2015A). These are: improving local service
ISSUE. Inequality was a key issue in the run-up to the delivery to provide health and education opportunities for
Indonesian presidential election in 2014, with major all; creating better jobs and skills training opportunities
national and international media outlets reporting on for the workforce; ensuring better protection from shocks;
rising inequality and both presidential candidates making and getting fiscal policy right. Thinking about fiscal policy
public statements about strategies to reduce inequality. means thinking about how and where the Government
They have the support of the public; 47 percent of those spends its money, and how it raises money to fund this
surveyed say it is "very urgent" for the Government to spending. This last action is the focus of this paper.
address inequality, and another 41 percent believe it is"quite urgent" (World Bank 2015b).
TAXES AND PUBLIC SPENDING IN INDONESIA
13 OCTOBER 2015
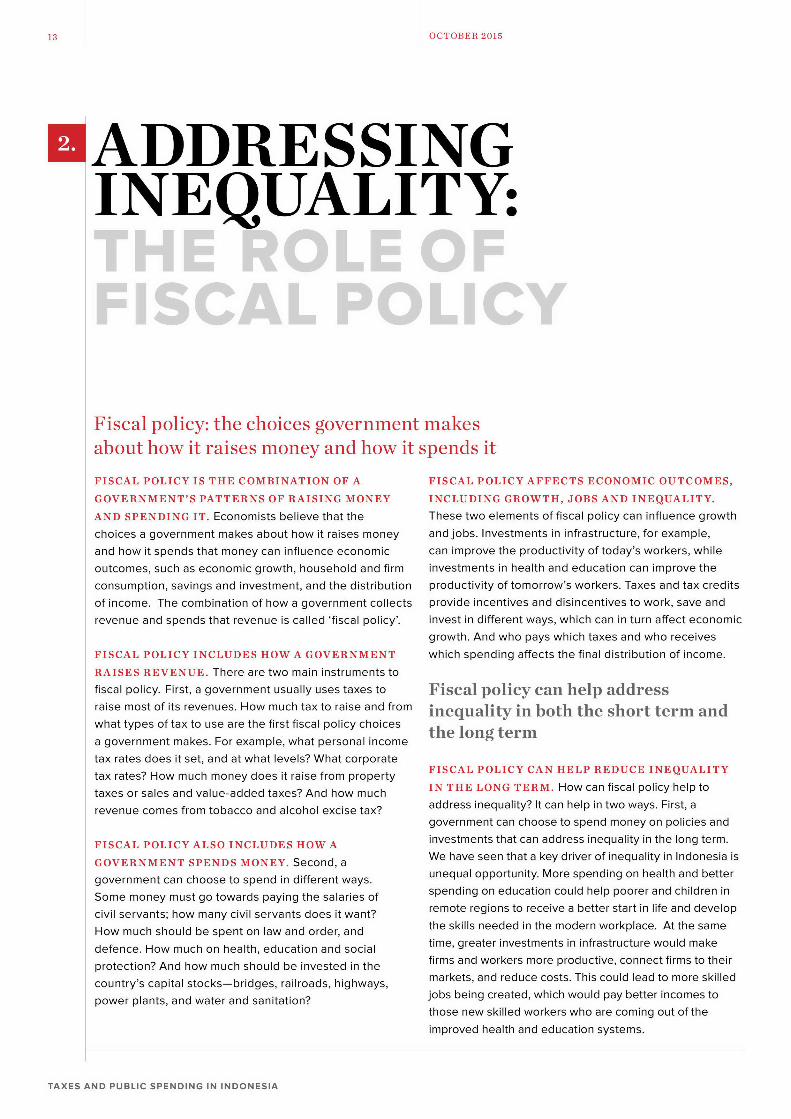
ADDRESSINGINEQUALITY:
Fiscal policy: the choices government makesabout how it raises money and how it spends it
FISCAL POLICY IS THE COMBINATION OF A FISCAL POLICY AFFECTS ECONOMIC OUTCOMES,
GOVERNMENT'S PATTERNS OF RAISING MONEY INCLUDING GROWTH, JOBS AND INEQUALITY.
AND SPENDING IT. Economists believe that the These two elements of fiscal policy can influence growth
choices a government makes about how it raises money and jobs. Investments in infrastructure, for example,
and how it spends that money can influence economic can improve the productivity of today's workers, while
outcomes, such as economic growth, household and firm investments in health and education can improve the
consumption, savings and investment, and the distribution productivity of tomorrow's workers. Taxes and tax credits
of income. The combination of how a government collects provide incentives and disincentives to work, save and
revenue and spends that revenue is called 'fiscal policy'. invest in different ways, which can in turn affect economicgrowth. And who pays which taxes and who receives
FISCAL POLICY INCLUDES HOW A GOVERNMENT which spending affects the final distribution of income.
RAISES REVENUE. There are two main instruments to
fiscal policy. First, a government usually uses taxes to Fiscal policy can help addressraise most of its revenues. How much tax to raise and from inequality in both the short term andwhat types of tax to use are the first fiscal policy choices
a government makes. For example, what personal income
tax rates does it set, and at what levels? What corporate
tax rates? How much money does it raise from property FISCAL POLICY CAN HELP REDUCE INEQUALITY
taxes or sales and value-added taxes? And how much IN THE LONG TERM. How can fiscal policy help to
revenue comes from tobacco and alcohol excise tax? address inequality? It can help in two ways. First, agovernment can choose to spend money on policies and
FISCAL POLICY ALSO INCLUDES HOW A investments that can address inequality in the long term.GOVENMET SPNDSMONY. Scon, aWe have seen that a key driver of inequality in Indonesia isGOVERNMENT SPENDS MONEY. Second, a
government can choose to spend in different ways. unequal opportunity. More spending on health and better
Some money must go towards paying the salaries of spending on education could help poorer and children in
civil servants; how many civil servants does it want? remote regions to receive a better start in life and develop
How much should be spent on law and order, and the skills needed in the modern workplace. At the same
defence. How much on health, education and social time, greater investments in infrastructure would make
protection? And how much should be invested in the firms and workers more productive, connect firms to their
country's capital stocks-bridges, railroads, highways, markets, and reduce costs. This could lead to more skilled
power plants, and water and sanitation? jobs being created, which would pay better incomes tothose new skilled workers who are coming out of theimproved health and education systems.
TAXES AND PUBLIC SPENDING IN INDONESIA

14 ADDRESSSING INEQUALITY: OCTOBER 2015THE ROLE OF FISCAL POLICY
FISCAL POLICY CAN ALSO HELP TO REDUCE other private transfers, but before they pay any taxes and
INEQUALITY IN THE SHORT TERM. Unlike many pension contributions, and before they receive any public
policies for reducing inequality, fiscal policy can also benefits, whether directly (such as cash transfers or taxhave significant short-term effects. For example, greater credits), indirectly (such as by purchasing subsidized rice
investments in health and education for today's children or gasoline), or in-kind (such as subsidized education and
are a vital part of reducing inequality. But these policies health). The second stage of income is final income, which
will take years to have an impact. Fiscal policy can address is a household's market income, plus all direct, indirect
inequality now in two ways. First, it can raise revenues and in-kind benefits received from a government, less allusing taxes that are paid more by richer households. For taxes it has paid.
example, in many countries, the rich pay more in personal
income taxes. Second, it can spend in ways that benefit A NUMBER OF COUNTRIES HAVE INTENTIONALLY
the poor and vulnerable the most. For example, spending USED FISCAL POLICY TO REDUCE INEQUALITY.on targeted social assistance for the poor and vulnerable However, in Indonesia, fiscal policy currently has little
can help invest in their children's health and education, impact on inequality. In a number of countries, often
reducing inequality tomorrow, while also providing them in Latin America where inequality is the highest of anyincome support, reducing inequality today. region, the choice of taxes and spending has been
made with a view to reducing inequality. We can see
Fiscal policy has been used in other how inequality in a country changes when we compare
countries to significantly reduce the distribution of market incomes (unaffected by fiscal
inequality, but currently in Indonesia policy) and final incomes (fully affected by fiscal policy). Inin Brazil, for example, the Gini coefficient for market income
it does not significantly change is 14 points higher than it is for final income, indicating
inequality a very large reduction in inequality due to fiscal policy(FIGURE 5). In South Africa it is even higher (17.5 points).
THERE ARE TWO TIMES AT WHICH WE CAN Reductions of 6 points or more are also seen in Costa
ESTIMATE HOUSEHOLD INCOMES: BEFORE THE Rica, Uruguay, Mexico and Bolivia. However, in Indonesia,
IMPAT O AN FICALPOLIY AD ATERTHE the Gini coefficient is reduced by only 2.5 points, theIMPACT OF ANY FISCAL POLICY AND AFTER THE
IMPAT O AL FICALPOLIY. onsdertwosecond-lowest in the 12-country study set after Ethiopia.IMPACT OF ALL FISCAL POLICY. Consider two
diffren stges f icom. Th fist s maketincme. The rest of this paper explores why this should be so. Whodifferent stages of income. The first is market income.
This is the income a household receives from all wages whic tend ow much?and salaries, all rents, interest and dividends, and allpu
The impact of fiscal policy on inequality is very different across thecountries studied. For example, the Gini falls by less than 3 points
in Indonesia, but by 14 points in Brazil and 17.5 in South Africa.
Reduction in Ginicoefficientfrom market income tofinol income. (fig.5)
04
0 4i 0 44
a- -J W 0 W0 0LU - 0. M U I
SOURCE Armenia (Younger et of. 2014); Bolivia (Paz et of. 2014); Brazil (Higgins and Pereira 2014); Ethiopia(Woldehanna et af. 2014); Mexico (Scott 2014); Peru (Jaramillo 2014); Uruguay (Bucheli et ofL 2014); Lustig (2014)based on Costa Rica (Sauma et of. 2014), El Salvador (Beneke ie Sanfeliu et o 2014), and Guatemala (Cabrera etofL 2014); South Africa (Inchauste et oa 2014); and own estimabes for Indonesia based on Susenas 2012.
TAXES AND PUBLIC SPENDING IN INDONESIA
15 OCTOBER 2015
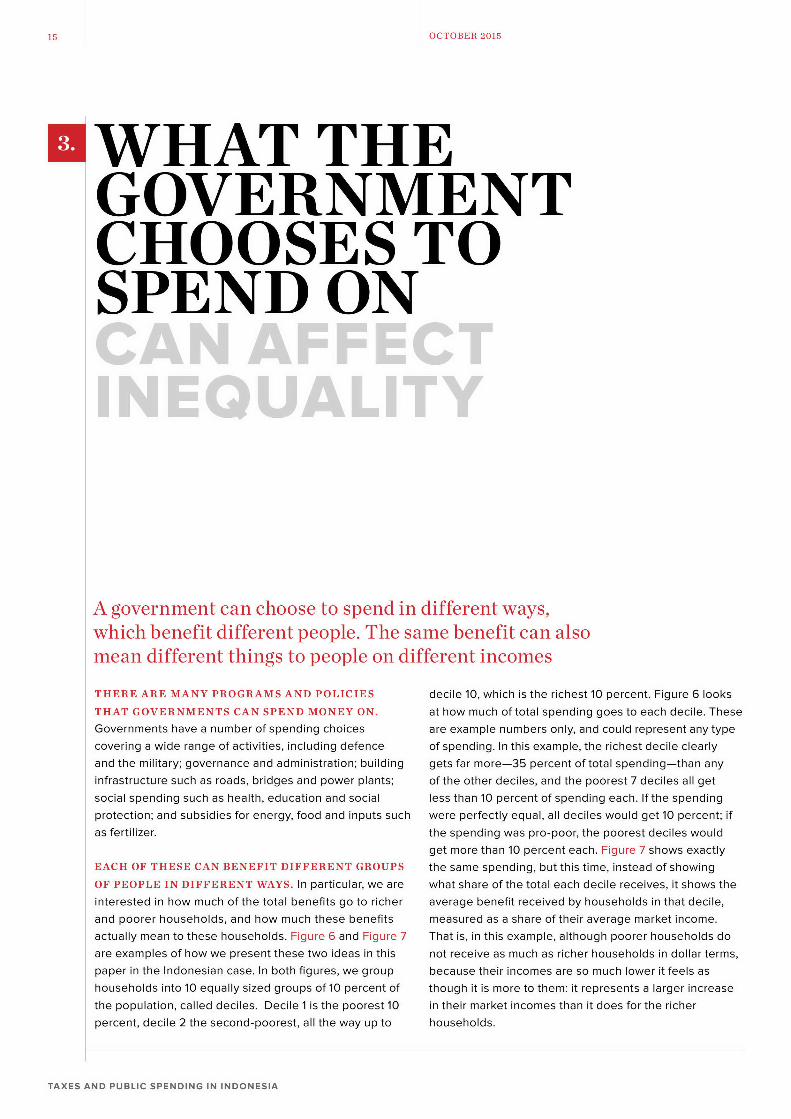
WHAT THEGOVERNMENTCHOOSES TOSPEND ON
A government can choose to spend in different ways,which benefit different people. The same benefit can alsomean different things to people on different incomes
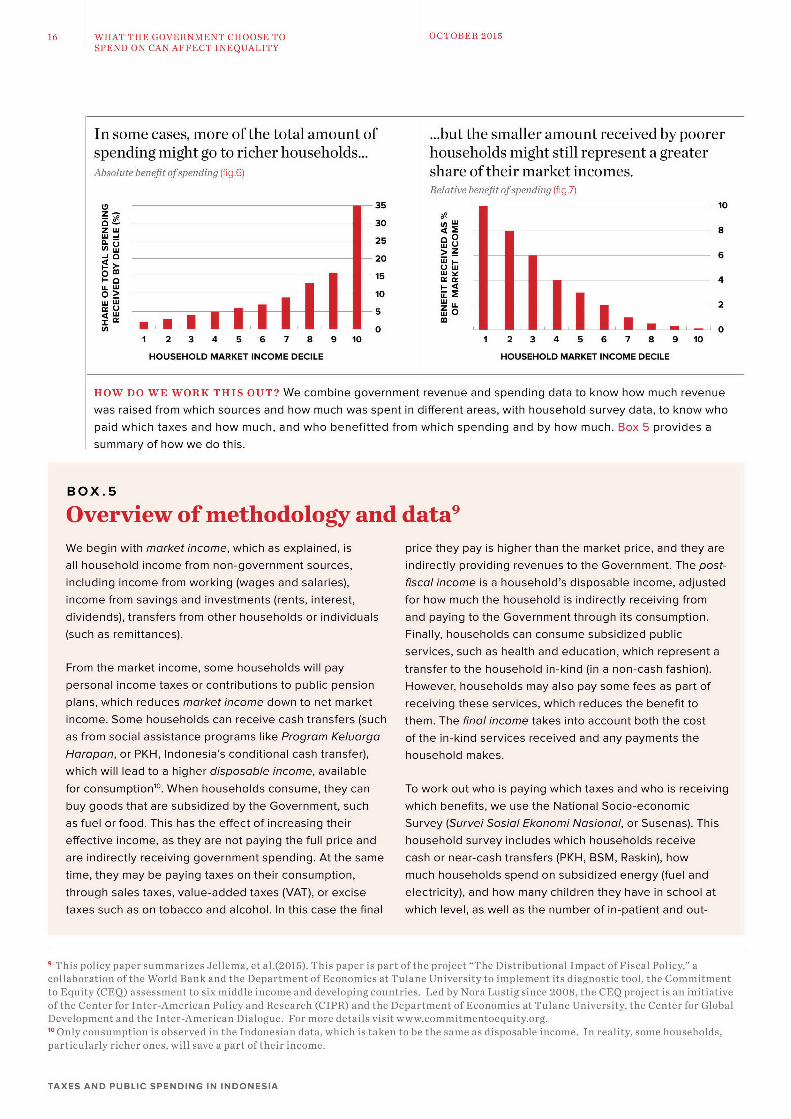
THERE ARE MANY PROGRAMS AND POLICIES decile 10, which is the richest 10 percent. Figure 6 looks
THAT GOVERNMENTS CAN SPEND MONEY ON. at how much of total spending goes to each decile. These
Governments have a number of spending choices are example numbers only, and could represent any typecovering a wide range of activities, including defence of spending. In this example, the richest decile clearlyand the military; governance and administration; building gets far more-35 percent of total spending-than anyinfrastructure such as roads, bridges and power plants; of the other deciles, and the poorest 7 deciles all getsocial spending such as health, education and social less than 10 percent of spending each. If the spendingprotection; and subsidies for energy, food and inputs such were perfectly equal, all ceciles would get 10 percent; ifas fertilizer. the spending was pro-poor, the poorest deciles would
get more than 10 percent each. Figure 7 shows exactlyEACH OF THESE CAN BENEFIT DIFFERENT GROUPS the same spending, but this time, instead of showing
OF PEOPLE IN DIFFERENT WAYS. In particular, we are what share of the total each decile receives, it shows the
interested in how much of the total benefits go to richer average benefit received by households in that decile,and poorer households, and how much these benefits measured as a share of their average market income.actually mean to these households. Figure 6 and Figure 7 That is, in this example, although poorer households doare examples of how we present these two ideas in this not receive as much as richer households in dollar terms,paper in the Indonesian case. In both figures, we group because their incomes are so much lower it feels ashouseholds into 10 equally sized groups of 10 percent of though it is more to them: it represents a larger increasethe population, called deciles. Decile 1 is the poorest 10 in their market incomes than it does for the richerpercent, decile 2 the second-poorest, all the way up to households.
TAXES AND PUBLIC SPENDING IN INDONESIA
16 WHAT THE GOVERNMENT CHOOSE TO OCTOBER 2015SPEND ON CAN AFFECT INEQUALITY
In some cases, more of the total amount of ...but the smaller amount received by poorerspending might go to richer households... households might still represent a greaterAbsolute benefit of spending (fig.6) share of their market incomes.
Relative benefit ofspending (fig.7)35 10
30 V 8
25
a~ -20 6
LU U--0 1 0
HOW O WEWORKTHI OUT We ombie gvernent.eveue and smaendn atamonowhmc reevdbypoeu
wasraiedfro wichsouce anhwmchwasspetndffrenueols wiht osehld reysn da toreaterh
summaryf tfeirwarwetdonthmss
all houehold icome frm non-overnmet sourcs, indrelytiinitofsening tothfigenen.7)pot
0 > 1 iL10
W4 8
m0 0
1 2 3 4 5 6 7 8 910 1 2 3 4 5 6 7 8 910
HOUSEHOLD MARKET INCOME DECILE HOUSEHOLD MARKET INCOME DECILE
HOW DO WE WORK THIS OUT? We combine government revenue and spending data to know how much revenue
was raised from which sources and how much was spent in different areas, with househo ld survey data, to know who
paid which taxes and how much, and who benefitted from which spending and by how much. Box 5 provides a
summary of how we do this.
BOX.5
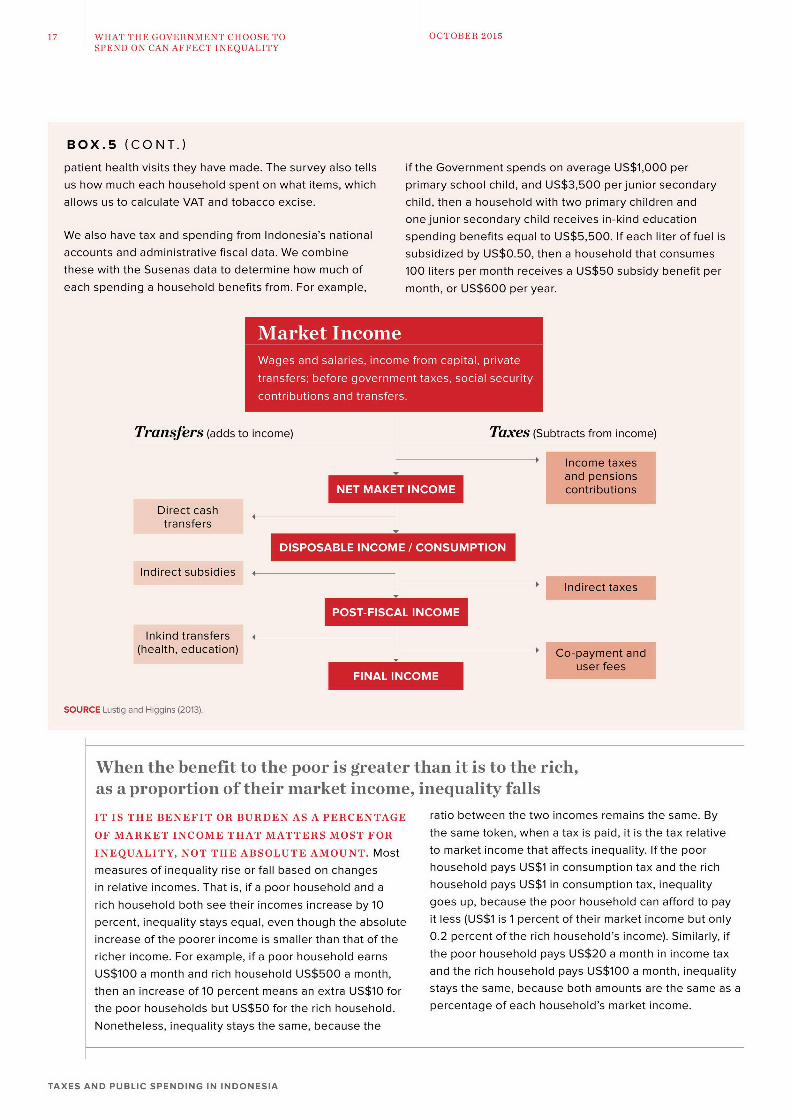
Overview of methodology and datahWe begin with market income, which as explained, istrase the heh n (in a noncah fhon).all household income from non-government sources, Howeverouhds may ao pay somerfes as partincluding income from working (wages and salaries), receivingothes se hich ducste nef tincome from savings and investments (rents, interest, uch the omehtakes inoract bte cosdividends), transfers from other households or individuals of the in-kndmervcesrecivedandanypayentoth
(such as remittances).onesiays conitional cashtransfer),bhoseholdpmakes
whichces will lea tolt an higheron dwspscbh income,n avial
From the market i ncome, some ho lds will pay y ansTorwo t hois pain w i a a h isringpersonal income taxes or contributions to public pension w eef, eus the atonal soeconomic
plans, which reduces me are ot phold srvices which huos tho ee ivincome. Some households can receive cash transfers (such ch or nach ta es into ac Ran) hoas from social assistance programs like Program Keluargo ftei-idsrie eevdadaypyet h
Haropon, or PKH, Indonesia's conditional cash transfer), hueodmks
which will lead to a higher disposable income, available
for consumption'o. When households consume, they can T okotwoi aigwihtxsadwoi eevn
buy goods that are subsidized by the Government, such wihbnft,w s h ainlScoeooi
as fuel or food. This has the effect of increasing theirSuvy(reioslEknmNson,oruea).Ts
effective income, as they are not paying the full price and hueodsre nldswihhueod eev
are indirectly receiving government spending. At the same cahonerastasfs(PHBSV,Rki)hw
time, they may be paying taxes on their consumption, much households spend on subsidized energy (fuel and
through sales taxes, value-added taxes (VAT), or excise electricity), and how many children they have in school attaxes such as on tobacco and alcohol. In this case the final which level, as well as the number of in-patient and out-
This policy paper summarizes Jellema, et al.(2015). This paper is part ofthe project "The Distributional Impact of Fiscal Policy," acollahoration of the World Bank and the Department of Economics at Tulane University to implement its diagnostic tool, the Commitmentto Equity (CEQ) assessment to six middle income and developing countries. Led by Nora Lustig since 2008, the CEQ project is an initiativeof the Center for Inter-American Policy and Research (CIPR) and the Department of Economics at Tulane University, the Center for GlohalDevelopment and the Inter-American Dialogue. For more details visit www.commitmentoequity.org.
consumption is ohserved in the Indonesian data, which is taken to be the same as disposable income. In reality, some households,particularly richer ones, will save a part ofwtheir income.
TAXES AND PUBLIC SPENDING IN INDONESIA
17 WHAT THE GOVERNMENT CHOOSE TO OCTOBER 2015SPEND ON CAN AFFECT INEQUALITY
BOX.5 (CONT.)
patient health visits they have made. The survey also tells if the Government spends on average US$1,000 perus how much each household spent on what items, which primary school child, and US$3,500 per junior secondaryallows us to calculate VAT and tobacco excise. child, then a household with two primary children and
one junior secondary child receives in-kind educationWe also have tax and spending from Indonesia's national spending benefits equal to US$5,500. If each liter of fuel isaccounts and administrative fiscal data. We combine subsidized by US$0.50, then a household that consumesthese with the Susenas data to determine how much of 100 liters per month receives a US$50 subsidy benefit pereach spending a household benefits from. For example, month, or US$600 per year.
Market Income
Transfers (adds to income) TaXeS (Subtracts from income)
Direct cashtransfers
Indirect subsidies I
Inkind transfers(health, education)
SOURCE Lustig and Higgins (2013).
When the benefit to the poor is greater than it is to the rich,as a proportion of their market income, inequality falls
IT IS THE BENEFIT OR BURDEN AS A PERCENTAGE ratio between the two incomes remains the same. By
OF MARKET INCOME THAT MATTERS MOST FOR the same token, when a tax is paid, it is the tax relative
INEQUALITY, NOT THE ABSOLUTE AMOUNT. Most to market income that affects inequality. If the poor
measures of inequality rise or fall based on changes household pays US$1 in consumption tax and the rich
in relative incomes. That is, if a poor household and a household pays US$1 in consumption tax, inequality
rich household both see their incomes increase by 10 goes up, because the poor household can afford to pay
percent, inequality stays equal, even though the absolute it less (US$1 is 1 percent of their market income but onlyincrease of the poorer income is smaller than that of the 0.2 percent of the rich household's income). Similarly, if
richer income. For example, if a poor household earns the poor household pays US$20 a month in income tax
US$100 a month and rich household US$500 a month, and the rich household pays US$100 a month, inequality
then an increase of 10 percent means an extra US$10 for stays the same, because both amounts are the same as athe poor households but US$50 for the rich household, percentage of each household's market income.
Nonetheless, inequality stays the same, because the
TAXES AND PUBLIC SPENDING IN INDONESIA
18 WHAT THE GOVERNMENT CHOOSE TO OCTOBER 2015SPEND ON CAN AFFECT INEQUALITY
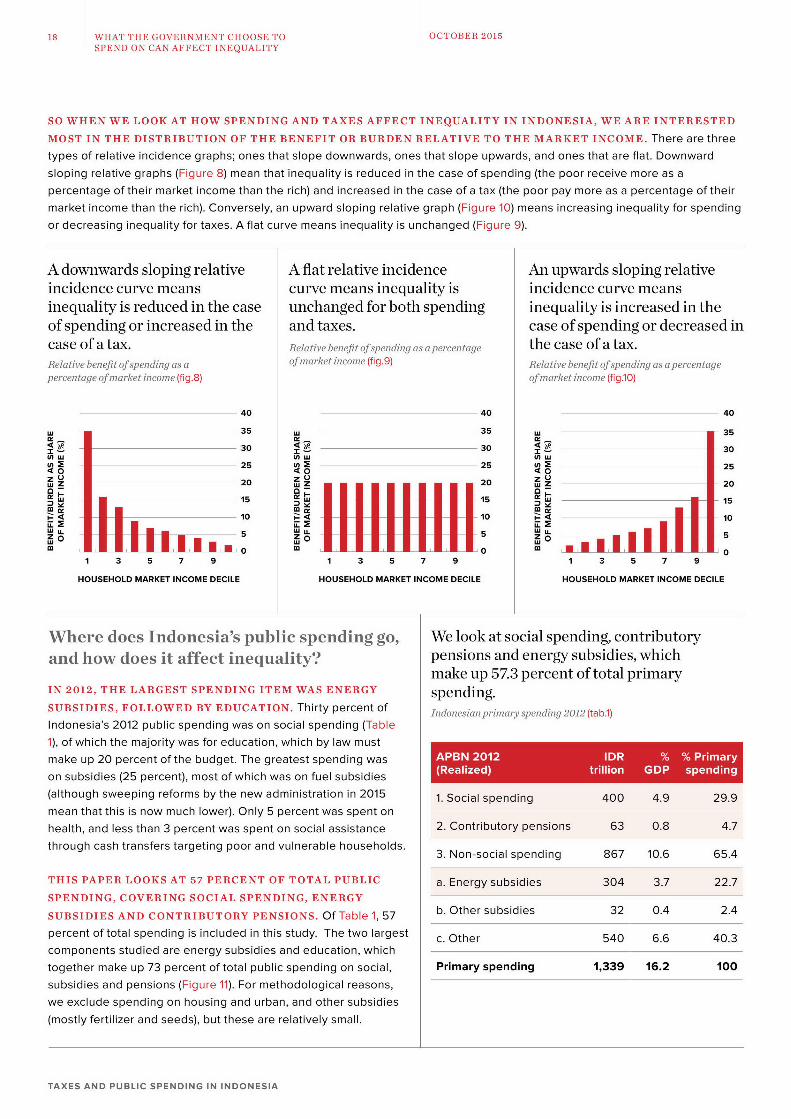
SO WHEN WE LOOK AT HOW SPENDING AND TAXES AFFECT INEQUALITY IN INDONESIA, WE ARE INTERESTED
MOST IN THE DISTRIBUTION OF THE BENEFIT OR BURDEN RELATIVE TO THE MARKET INCOME. There are threetypes of relative incidence graphs; ones that slope downwards, ones that slope upwards, and ones that are flat. Downward
sloping relative graphs (Figure 8) mean that inequality is reduced in the case of spending (the poor receive more as apercentage of their market income than the rich) and increased in the case of a tax (the poor pay more as a percentage of theirmarket income than the rich). Conversely, an upward sloping relative graph (Figure 10) means increasing inequality for spendingor decreasing inequality for taxes. A flat curve means inequality is unchanged (Figure 9).
A downwards sloping relative A flat relative incidence An upwards sloping relativeincidence curve means curve means inequality is incidence curve meansinequality is reduced in the case unchanged for both spending inequality is increased in theof spending or increased in the and taxes. case of spending or decreased incase of a taX. Relative benefit ofspending as a percentage the case of a tax.Relative benefit ofspending as a ofmarket income (fig.9) Relative benefit ofspending as a percentage
percentage ofmarket income (fig.8) ofmarket income (fig10)
40 40 40
W 35 m 35 W 35
30 30 -3 30
25 -25 (n0 2540 0
20 20 20
1 35 5 75 9U 115 7 91 3
j~410 ~ 4 10 10
11 1101 0 00
1 3 5 7 9 1 3 5 7 9 1 3 5 7 9
HOUSEHOLD MARKET INCOME DECILE HOUSEHOLD MARKET INCOME DECILE HOUSEHOLD MARKET INCOME DECILE
Where does Indonesia's public spending go, We look at social spending, contributoryand how does it affect inequality? pensions and energy subsidies, which
make up 57.3 percent of total primaryIN 2012, THE LARGEST SPENDING ITEM WAS ENERGY spending.SUBSIDIES, FOLLOWED BY EDUCATION. Thirty percent of Indonesian primary spending 2012 (tabl)
Indonesia's 2012 public spending was on social spending (Table1), of which the majority was for education, which by law mustmake up 20 percent of the budget. The greatest spending was 0
on subsidies (25 percent), most of which was on fuel subsidies (Reaized) ii GDP spening
(although sweeping reforms by the new administration in 2015 1. Social spending 400 4.9 29.9mean that this is now much lower). Only 5 percent was spent onhealth, and less than 3 percent was spent on social assistance 2. Contributory pensions 63 0.8 4.7
through cash transfers targeting poor and vulnerable households. 3 o-oilsedn 6 06 6.
3. Non-tsocial spending ,86 contributor
THIS PAPER LOOKS AT 57 PERCENT OF TOTAL PUBLIC a. Energy subsidies 304 3.7 22.7SPENDING, COVERING SOCIAL SPENDING, ENERGY
SUBSIDIES AND CONTRIBUTORY PENSIONS. Of Table 1, 57 b. Other subsidies 32 0.4 2.4
percent of total spending is included in this study. The two largest c. Other 540 6.6 40.3components studied are energy subsidies and education, whichtogether make up 73 percent of total public spending on social, Primary spending 1,339 16.2 100subsidies and pensions (Figure 11). For methodological reasons,
we exclude spending on housing and urban, and other subsidies
(mostly fertilizer and seeds), but these are relatively small.
TAXES AND PUBLIC SPENDING IN INDONESIA

19 WHAT THE GOVERNMENT CHOOSE TO OCTOBER 2015SPEND ON CAN AFFECT INEQUALITY
Of this, a combined 73 percent goes to energy (38 SOURCE Ministry of Finance
percent) and education (35 percent).
2012APBN (Realized) social, pension and subsidy spending by type (fig.11)
SUBSIDIES SOCIAL SPENDING
7.8 38.O' 9.1V 0.6
4.0W 1.9 35.1V 3.4
0 CONTRIBUTORY PENSIONS U OTHER SUBSIDIES U ENERGY SUBSIDIES U HOUSING & URBAN
E HEALTH U EDUCATION U NON-CONTRIBUTORY PENSIONS U CASH TRANSFERS
The most spending goes on energy subsidies, which do little toreduce inequality, although they still have significant value forthe poor and vulnerable
EIGHT TIMES MORE ENERGY SUBSIDIES-THE NONETHELESS, THE SUBSIDIES MEAN SLIGHTLY
LARGEST SPENDING ITEM-GO TO THE RICHEST MORE TO THE POOR AND VULNERABLE AS A
DECILE THAN TO THE POOREST DECILE.Energy SHARE OF THEIR INCOME. When we consider the
subsidies, which make up 25 percent of all spending benefits received as a proportion of their market income,
and 38 percent of spending looked at in this paper, are the distribution is much flatter, with subsidies received
enjoyed significantly more by richer households, which meaning slightly more to the poorest four deciles than the
are more likely to have cars and motorcycles, than by richer ones (Figure 13). As a consequence, subsidies have
poorer households. Over half of the subsidies go to the relatively little impact on inequality one way or another.
top three deciles, with one-quarter alone to the richest 10 Given the large amount spent on them, they represent
percent (Figure 12). The poor and vulnerable-the poorest poor value for money if they are intended to benefit the
40 percent of Indonesians-receive only 20 percent of all poor and vulnerable the most. Still, representing around
energy subsidy benefits. 9-10 percent of market income for most Indonesians, their
removal will be felt.
Most subsidy spending goes to ...but it means slightly more as a share of theirricher households... income to the poor and vulnerable.Absolute benefit ofenergy subsidy spending (fig.12) Relative benefit ofenergy subsidy spending (fig 13)
0 30 12
z m_25 2 10LU -J 0
I-0 20______?!_____F
UU.W
W W WuI
1 2 3 4 5 6 7 8 9 10 1 2 3 4 5 6 7 8 9 10
HOUSEHOLD MARKET INCOME DECILE HOUSEHOLD MARKET INCOME DECILE
SOURCE Susenas 2012, APBN 2012 (Realized), World Bank calculations. SOURCE Susenas 2012, APBN 2012 (Realized), World Bank calculations.
TAXES AND PUBLIC SPENDING IN INDONESIA

20 WHAT THE GOVERNMENT CHOOSE TO OCTOBER 2015SPEND ON CAN AFFECT INEQUALITY
Education benefits are significantly more for poorer householdsas a share of income, and are significantly inequality-reducing,although not as much as in other countries
RICHER HOUSEHOLDS RECEIVE SIMILAR HOWEVER, BECAUSE OF THEIR MUCH LOWER
LEVELS OF EDUCATION SPENDING AS POORER INCOMES, THE BENEFITS ARE WORTH FAR MORE
HOUSEHOLDS, BUT BECAUSE OF OUT-OF-POCKET TO POORER HOUSEHOLDS, MAKING EDUCATION
EXPENSES, THEY PAY MORE INTO THE SYSTEM. SPENDING INEQUALITY-REDUCING IN INDONESIA.
When considered in absolute terms, richer households When webenefit slightly more from education spending than poorer consider the education benefits as a share of markethouseholds (Figure 14). Despite having fewer children who income, it is nearly 20 percent for the poorest decileare more likely to be enrolled in private schools", their compared with only 2 percent for the richest decilechildren are also more likely to be enrolled at the more (Figure 15). A similar pattern holds after accountingexpensive secondary and tertiary levels. However, when for out-of-pocket costs. As a consequence, educationwe include out-of-pocket expenses such as school fees, spending is inequality-reducing in Indonesia.
the net benefit of education spending is slightly higher forpoorer households (Figure 14).
Most households receive similar education ...but relative to household income, educationbenefits, but because richer households pay spending benefits poorer households muchmore out-of-pocket, poorer households more than richer ones.receive a much greater net benefit than Relative benefit ofeducation spending and burden of
richer households... out-of-pocket expenses (fig.15)
Absolute benefit ofeducation spending and burden of
out-of-pocket expenses (fig.14)
0 15 30Z - 0
W10 20
5- W 15
0 ?!~U. U U
4 W-5 Zm
-101 2 3 4 5 6 7 8 9 10 1 2 3 4 5 6 7 8 9 10
HOUSEHOLD MARKET INCOME DECILE HOUSEHOLD MARKET INCOME DECILE
* OUT-OF-POCKET EXPENSES * EDUCATION BENEFIT EDUCATION BENEFIT NET BENEFIT
NET BENEFIT
SOURCE Susenas 2012, APBN 2012 (Realized), World Bank calculations. SOURCE Susenas 2012, APBN 2012 (Realized), World Bank calculations.
NONETHELESS, EDUCATION SPENDING BENEFITS POORER HOUSEHOLDS AND REDUCES INEQUALITY
BY MUCH LESS IN INDONESIA THAN IN OTHER COUNTRIES. When we compare who benefits from education
spending in Indonesia with other countries studied, poorer households, especially those in the poorest decile,
benefit much more as a percentage of their market income in other countries. This likely reflects a greater focus onprimary education spending in these countries.
" Although private schools also receive some public subsidies, which are captured in this analysis.
TAXES AND PUBLIC SPENDING IN INDONESIA
21 WHAT THE GOVERNMENT CHOOSE TO OCTOBER 2015SPEND ON CAN AFFECT INEQUALITY
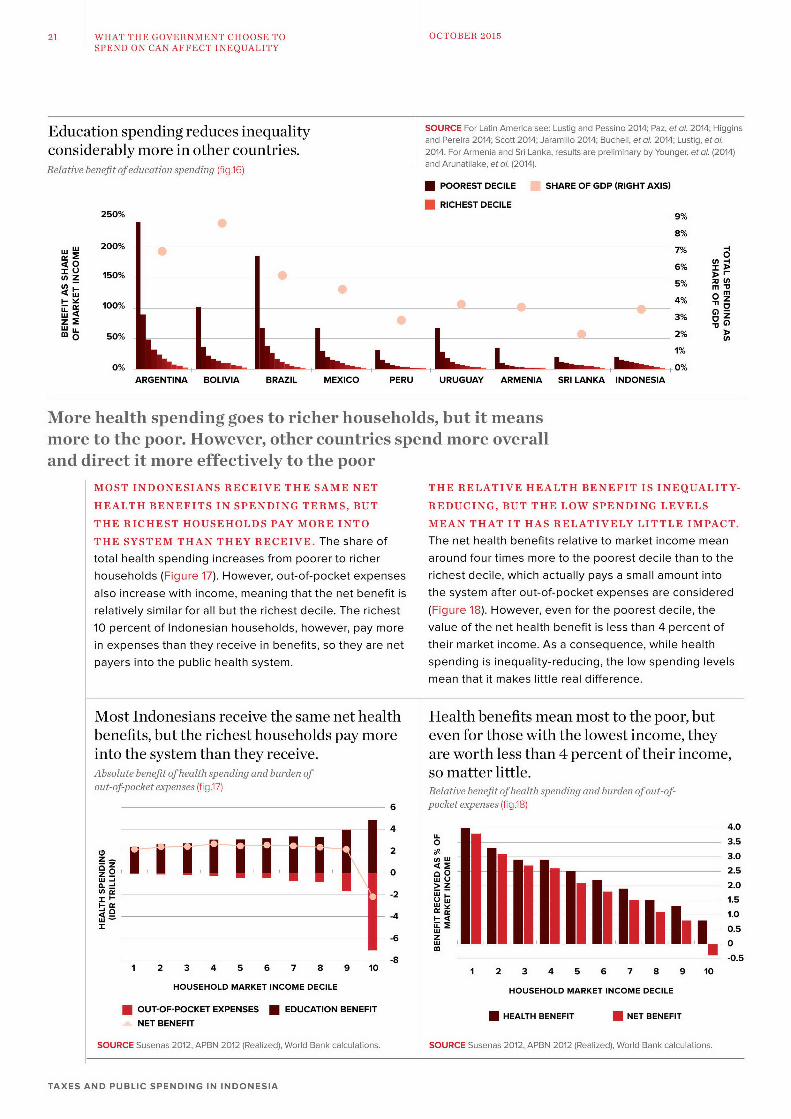
Education spending reduces inequality SOURCE For Latin America see: Lustig and Pessino 2014; Paz, etaL 2014; Higginsand Pereira 2014; Scott 2014; Jaramillo 2014; Bucheli, et a. 2014; Lustig, et oL
considerably more in other countries. 2014. For Armenia and Sri Lanka, results are preliminary by Younger, et oL (2014)
Relative benefit ofeducation spending (fig.16) and Arunatilake, et of. (2014).
POOREST DECILE SHARE OF GDP (RIGHT AXIS)
RICHEST DECILE250% 9%
8%W 200% 7% O
M 0O 6% z>
150% 5%>_ _
O 50%2
50%
ARGENTINA BOLIVIA BRAZIL MEXICO PERU URUGUAY ARMENIA SRI LANKA INDONESIA
More health spending goes to richer households, but it meansmore to the poor. However, other countries spend more overalland direct it more effectively to the poor
MOST INDONESIANS RECEIVE THE SAME NET THE RELATIVE HEALTH BENEFIT IS INEQUALITY-
HEALTH BENEFITS IN SPENDING TERMS, BUT REDUCING, BUT THE LOW SPENDING LEVELS
THE RICHEST HOUSEHOLDS PAY MORE INTO MEAN THAT IT HAS RELATIVELY LITTLE IMPACT.
THE SYSTEM THAN THEY RECEIVE. The share of The net health benefits relative to market income mean
total health spending increases from poorer to richer around four times more to the poorest decile than to the
households (Figure 17). However, out-of-pocket expenses richest decile, which actually pays a small amount into
also increase with income, meaning that the net benefit is the system after out-of-pocket expenses are considered
relatively similar for all but the richest decile. The richest (Figure 18). However, even for the poorest decile, the
10 percent of Indonesian households, however, pay more value of the net health benefit is less than 4 percent of
in expenses than they receive in benefits, so they are net their market income. As a consequence, while health
payers into the public health system. spending is inequality-reducing, the low spending levelsmean that it makes little real difference.
Most Indonesians receive the same net health Health benefits mean most to the poor, butbenefits, but the richest households pay more even for those with the lowest income, theyinto the system than they receive. are worth less than 4 percent of their income,Absolute benefit ofhealth spending and burden of so matter little.out-of-pocket expenses (fig.17) Relative benefit of health spending and burden of out-of-
6 pocket expenses (fig.18)
4 4.0
Z U 350alt 3 .
Z00 0 O 2.5
ar worhlsthn4pretothiin m,
[L > Z2.0II--2 Wi1i
-44 1.0LUL
-6 Z0.W
1~- 2 -0 0.51 01 2 3 4 5 6 7 8 9 10
HOUSEHOLD MARKET INCOME DECILE HOUSEHOLD MARKET INCOME DECILE
*OUT-OF-POCKET EXPENSES * EDUCATION BENEFIT UHEALTH BENEFIT *NET BENEFITNET BENEFIT
SOURCE Susenas 2012, APBN 2012 (Realized), World Bank calculations. SOURCE Susenas 2012, APBN 2012 (Realized), World Bank calculations.
TAXES AND PUBLIC SPENDING IN INDONESIA
22 WHAT THE GOVERNMENT CHOOSE TO OCTOBER 2015SPEND ON CAN AFFECT INEQUALITY
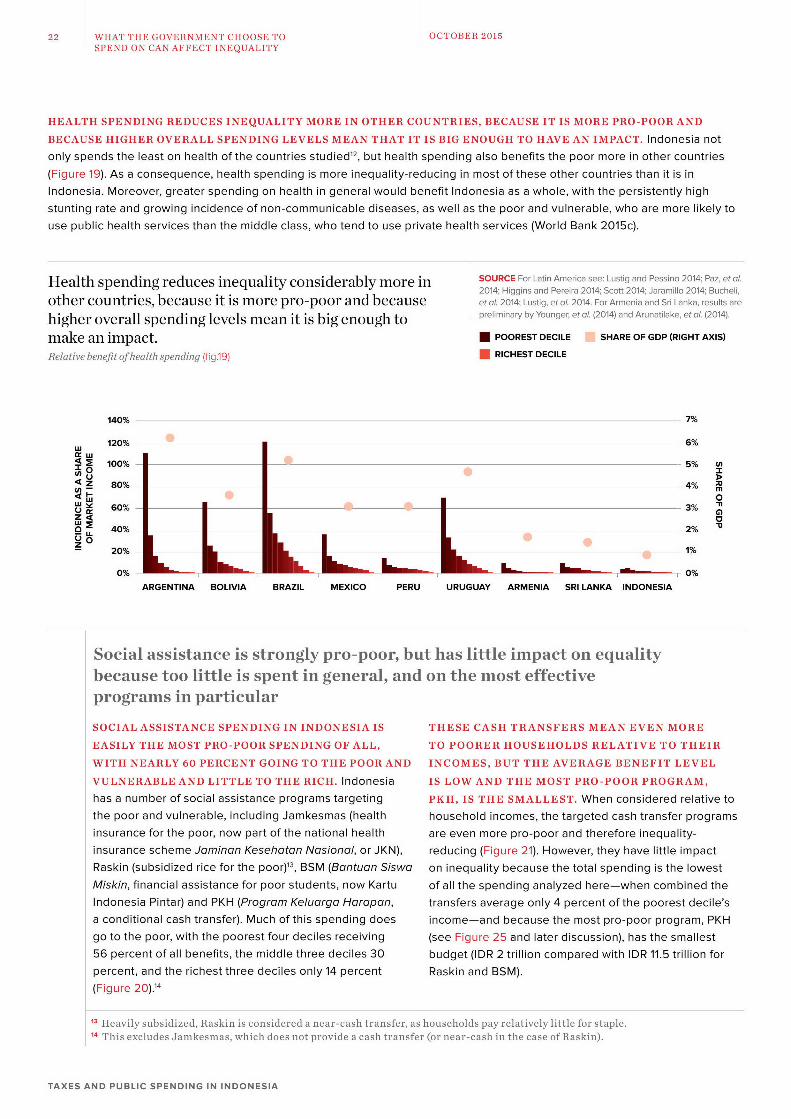
HEALTH SPENDING REDUCES INEQUALITY MORE IN OTHER COUNTRIES, BECAUSE IT IS MORE PRO-POOR AND
BECAUSE HIGHER OVERALL SPENDING LEVELS MEAN THAT IT IS BIG ENOUGH TO HAVE AN IMPACT. Indonesia not
only spends the least on health of the countries studied12 , but health spending also benefits the poor more in other countries
(Figure 19). As a consequence, health spending is more inequality-reducing in most of these other countries than it is in
Indonesia. Moreover, greater spending on health in general would benefit Indonesia as a whole, with the persistently high
stunting rate and growing incidence of non-communicable diseases, as well as the poor and vulnerable, who are more likely to
use public health services than the middle class, who tend to use private health services (World Bank 2015c).
Health spending reduces inequality considerably more in SOURCE For Latin America see: Lustig and Pessino 2014; Paz, etaol2014; Higgins and Pereira 2014; Scott 2014; Jaramillo 2014; Bucheli,
other countries, because it is more pro-poor and because etaol 2014; Lustig, et al. 2014. For Armenia and Sri Lanka, results are
higher overall spending levels mean it is big enough to preliminary by Younger, eta. (2014) and Arunatilake, et al (2014).
make an impact. * POOREST DECILE SHARE OF GDP (RIGHT AXIS)
Relative benefit ofhealth spending (fig.19) U RICHEST DECILE
140% - 7%
120% - 6%
42 100% % (X 0
~Z 80%4% ;tn-M
U 60% -% -
_ 4000
0 20% 1%
0%U 0%ARGENTINA BOLIVIA BRAZIL MEXICO PERU URUGUAY ARMENIA SRI LANKA INDONESIA
Social assistance is strongly pro-poor, but has little impact on equalitybecause too little is spent in general, and on the most effectiveprograms in particular
SOCIAL ASSISTANCE SPENDING IN INDONESIA IS THESE CASH TRANSFERS MEAN EVEN MORE
EASILY THE MOST PRO-POOR SPENDING OF ALL, TO POORER HOUSEHOLDS RELATIVE TO THEIR
WITH NEARLY 60 PERCENT GOING TO THE POOR AND INCOMES, BUT THE AVERAGE BENEFIT LEVEL
VULNERABLE AND LITTLE TO THE RICH. Indonesia IS LOW AND THE MOST PRO-POOR PROGRAM,
has a number of social assistance programs targeting PKH, IS THE SMALLEST. When considered relative tothe poor and vulnerable, including Jamkesmas (health household incomes, the targeted cash transfer programsinsurance for the poor, now part of the national health are even more pro-poor and therefore inequality-insurance scheme Jaminan Kesehoton Nasional, or JKN), reducing (Figure 21). However, they have little impactRaskin (subsidized rice for the poor)13 , BSM (Bantuan Siswo on inequality because the total spending is the lowest
Miskin, financial assistance for poor students, now Kartu of all the spending analyzed here-when combined theIndonesia Pintar) and PKH (Program Keluorgo Horopon, transfers average only 4 percent of the poorest decile's
a conditional cash transfer). Much of this spending does income-and because the most pro-poor program, PKHgo to the poor, with the poorest four deciles receiving (see Figure 25 and later discussion), has the smallest56 percent of all benefits, the middle three deciles 30 budget (IDR 2 trillion compared with IDR 11.5 trillion forpercent, and the richest three deciles only 14 percent Raskin and BSM).(Figure 20).14
" Heavily subsidized, Raskin is considered a near-cash transfer, as households pay relatively little for staple.
14 This excludes Jamkesmas, which does not provide a cash transfer (or near-cash in the case of Raskin).
TAXES AND PUBLIC SPENDING IN INDONESIA

23 WHAT THE GOVERNMENT CHOOSE TO OCTOBER 2015SPEND ON CAN AFFECT INEQUALITY
The poor and vulnerable receive the majority of ...although the benefits are small relative tocash transfers, making them the most pro-poor household income and the most inequality-of all spending... reducing program (PKH) receives the least funding.Absolute benefit ofcash transfer spending (fig.20) Relative benefit ofcash transfer spending (fig.21)
20 4
82SmU 1 5 oe 3
10 2
10 M rLm- aUm
0 >
1 2 3 4 5 6 7 8 9 10 1 2 3 4 5 6 7 8 910
HOUSEHOLD MARKET INCOME DECILE HOUSEHOLD MARKET INCOME DECILE
RASKIN AND BSM PKH ALL TRANSFERS
SOURCE Susenas 2012, APBN 2012 (Realized), World Bank calculations. SOURCE Susenas 2012, APBN 2012 (Realized), World Bank calculations.NOTE Includes PKH, Raskin and BSM. NOTE Includes PKH, Raskin and BSM.
AS WITH HEALTH AND EDUCATION, OTHER COUNTRIES ACHIEVE FAR MORE INEQUALITY REDUCTION
THROUGH CASH TRANSFERS THROUGH MUCH GREATER SCALE AND EVEN MORE PRO-POOR TARGETING.
Indonesia's spending on conditional cash transfers (PKH in Indonesia), which is less than 0.1 percent of GDP, is far lower than inthe other countries studied, and the value of the average transfer to the poor relative to their income is far less.
Conditional cash transfer spending reduces inequality SOURCE For Latin America see: Lustig and Pessino 2014; Paz, etal.2014; Higgins and Pereira 2014; Scott 2014; Jaramillo 2014; Bucheli,
significantly in a number other countries, by reaching the etl 2014; Lustig, etal. 2014. For Armenia and Sri Lanka, results are
poor better and providing a larger benefit. preliminary by Younger, etl (2014) and Arunatilake, etal. (2014).
Relative benefit offlagship conditional cash transfer spending (fig.22) U POOREST DECILE SHARE OF GDP (RIGHT AXIS)
* RICHEST DECILE
80% -4.0%
70% -3.5%
620% 3.0%
10% - 2.5%
10% - 0.0% Ma1u 0% - -1__ _ _ __ _ _ _ _ _ _ .5% -
20% -- 1 .0% M
ARGENTINA BOLIVIA BRAZIL MEXICO PERU URUGUAY ARMENIA SRI LANKA INDONESIA
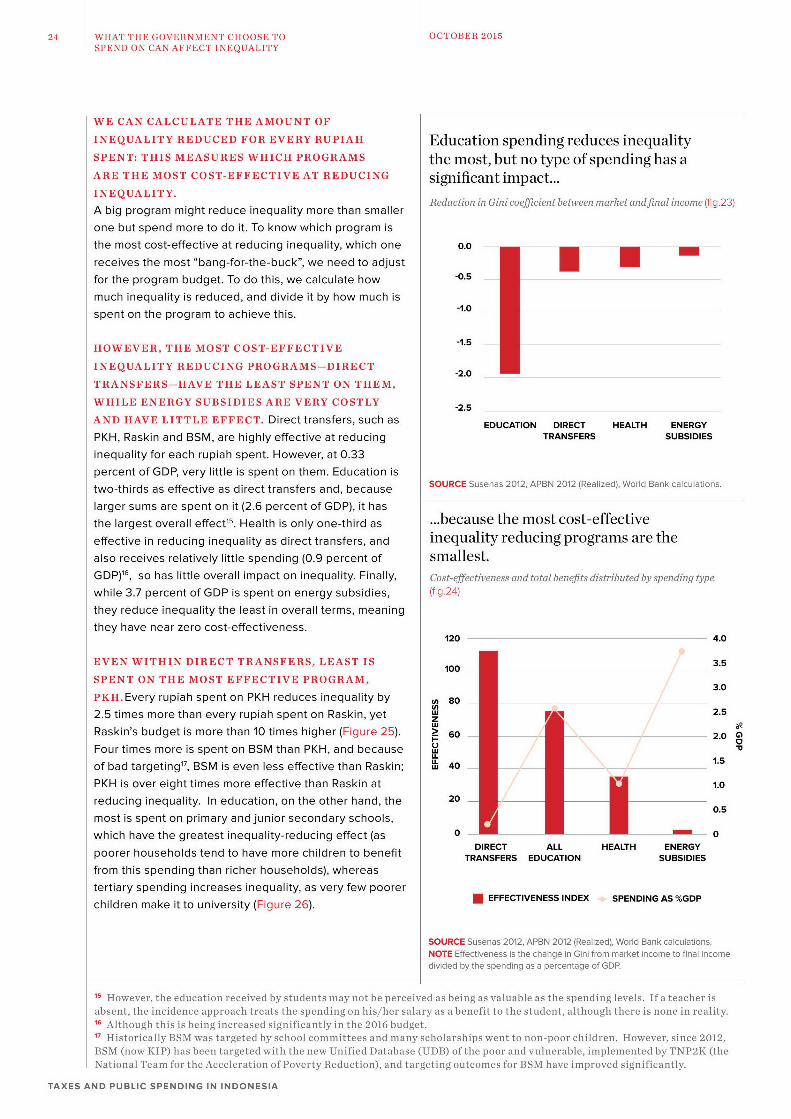
Public spending in Indonesia NO SINGLE TYPE OF SPENDING ACHIEVES SIGNIFICANT REDUCTIONS
achieves relatively little IN INEQUALITY, BUT THE LARGEST IMPACT COMES FROM EDUCATION
decrease in iny SPENDING. Total education spending, which is the second-largest spendinginequality item after subsidies, reduces the Gini by 1.9 points when moving from market
because least is spent on income to final income. This means that it has the largest impact, but this is still
those programs that are the relatively small (Figure 23). Taken together, direct transfers, health spending
most effective and subsidies reduce the Gini by less than 1 point.
TAXES AND PUBLIC SPENDING IN INDONESIA
24 WHAT THE GOVERNMENT CHOOSE TO OCTOBER 2015SPEND ON CAN AFFECT INEQUALITY
WE CAN CALCULATE THE AMOUNT OF
INEQUALITY REDUCED FOR EVERY RUPIAH Education spending reduces inequalitySPENT: THIS MEASURES WHICH PROGRAMS the most, but no type of spending has aARE THE MOST COST-EFFECTIVE AT REDUCING significant impact...INEQUALITY. Reduction in Gini coefficient between morket andfinl income (fig.23)
A big program might reduce inequality more than smallerone but spend more to do it. To know which program isthe most cost-effective at reducing inequality, which one 0.0
receives the most "bang-for-the-buck", we need to adjustfor the program budget. To do this, we calculate how 05
much inequality is reduced, and divide it by how much isspent on the program to achieve this. 1.0
HOWEVER, THE MOST COST-EFFECTIVEt,y.5
INEQUALITY REDUCING PROGRAMS-DIRECT -.
-2.0
TRANSFERS-HAVE THE LEAST SPENT ON THEM,
WHILE ENERGY SUBSIDIES ARE VERY COSTLY -2.5
AND HAVE LITTLE EFFECT. Direct transfers, such as EDUCATION DIRECT HEALTH ENERGY
PKH, Raskin and BSM, are highly effective at reducing TRANSFERS SUBSIDIES
inequality for each rupiah spent. However, at 0.33percent of GDP, very little is spent on them. Education istwo-thirds as effective as direct transfers and, because SOURCE Susenas 2012, APBN 2012 (Realized), World Bank calculations.
larger sums are spent on it (2.6 percent of GDP), it hasthe largest overall effect". Health is only one-third as ...because the most cost-effectiveeffective in reducing inequality as direct transfers, and inequality reducing programs are thealso receives relatively little spending (0.9 percent of smallest.GDP)"6, so has little overall impact on inequality. Finally, Cost-effectiveness ond totol benefits distributed by spending type
while 3.7 percent of GDP is spent on energy subsidies, (fig.24)
they reduce inequality the least in overall terms, meaningthey have near zero cost-effectiveness.
120 4.0
EVEN WITHIN DIRECT TRANSFERS, LEAST IS 103.5
SPENT ON THE MOST EFFECTIVE PROGRAM, 3.0
PKH.SEvery rupiah spent on PKH reduces inequality by c a
2.5 times more than every rupiah spent on Raskin, yet 2.5
Raskin's budget is more than 10 times higher (Figure 25). i60 2.0
Four times more is spent on BSM than PKH, and because UWoffbadntlef isbeyd, BSM is even less effective than Raskin; e 40
PKH is over eight times more effective than Raskin at1.reducing inequality. In education, on the other hand, the 200.most is spent on primary and junior secondary schools,which have the greatest inequality-reducing effect (as 0 0
DIRECT ALL HEALTH ENERGYpoorer households tend to have more children to benefit TRANSFERS EDUCATION SUBSIDIES
from this spending than richer households), whereastertiary spending increases inequality, as very few poorerchildren make itto university (Figure 26). EFFECTIVENESS INDEX SPENDING AS %GDP
SOURCE usenas 2012, APN 2012 (Realized), World Bank calculations.NOTE Effectiveness is the change in Gini from market income to final incomedivided by the spending as a percentage of GDP.
1K However, the education received by students may not be perceived as being as valuable as the spending levels. If teacher is
absent, the incidence approach treats the spending on his/her salary as a benefit to the student, although there is none in reality.Although this is being increased significantly in the 2016 budget.Historically BSM was targeted by school committees and many scholarships went to non-poor children. However, since 2012,
BSm (now KIP) has been targeted with the new Unified Database (UDB) of the poor and vulnerable, implemented by TNP2K (theNational Team for the Acceleration of Poverty Reduction), and targeting outcomes for BSM have improved significantly.
TAXES AND PUBLIC SPENDING IN INDONESIA

25 WHAT THE GOVERNMENT CHOOSE TO OCTOBER 2015SPEND ON CAN AFFECT INEQUALITY
Of the direct transfers, the least is spent on the ...because the most cost-effective inequality-most cost-effective program, PKH... reducing programs are the smallest.
Cost-effectiveness and total benefits distributed by spending type Cost-effectiveness and total benefits distributed by spending type
(fig.25) (fig.26)
350 0.3 120 1.2
300 1000.2 1.0
tn 250 U 80z zw 200 0.2 w 60 0.8
U 150 09U40 '1 0.1 w 0.6
LU 100 20
50 0
0 0.0 -20 10.2PKH RASKIN BSM PRIMARY JUNIOR SENIOR TERTIARY
SECONDARY SECONDARY
0 EFFECTIVENESS INDEX SPENDING AS %GDP * EFFECTIVENESS INDEX SPENDING AS %GDP
SOURCE Susenas 2012, APBN 2012 (Realized), World Bank calculations. SOURCE Susenas 2012, APBN 2012 (Realized), World Bank calculations.NOTE Effectiveness is the change in Gini from market income to final income NOTE Effectiveness is the change in Gini from market income to final incomedivided by the spending as a percentage of GDP. divided by the spending as a percentage of GDP.
TAXES AND PUBLIC SPENDING IN INDONESIA
26 OCTOBER 2015
DHOW THEGOVERNMENTCHOOSES TORAISE MONEY
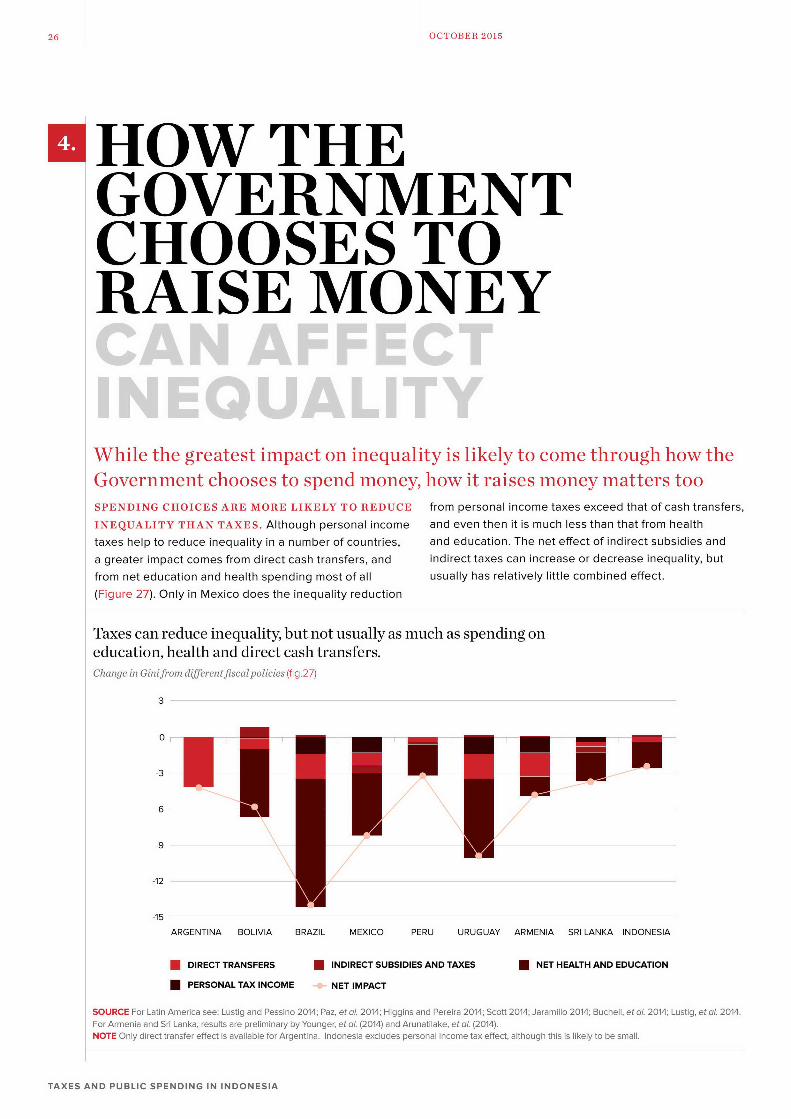
While the greatest impact on inequality is likely to come through how theGovernment chooses to spend money, how it raises money matters tooSPENDING CHOICES ARE MORE LIKELY TO REDUCE from personal income taxes exceed that of cash transfers,
INEQUALITY THAN TAXES. Although personal income and even then it is much less than that from health
taxes help to reduce inequality in a number of countries, and education. The net effect of indirect subsidies and
a greater impact comes from direct cash transfers, and indirect taxes can increase or decrease inequality, but
from net education and health spending most of all usually has relatively little combined effect.
(Figure 27). Only in Mexico does the inequality reduction
Taxes can reduce inequality, but not usually as much as spending oneducation, health and direct cash transfers.Change in Ginifrom differentfiscal policies (fig.27)
3
0
-9N
-12
-15
ARGENTINA BOLIVIA BRAZIL MEXICO PERU URUGUAY ARMENIA SRI LANKA INDONESIA
DIRECT TRANSFERS INDIRECT SUBSIDIES AND TAXES * NET HEALTH AND EDUCATION
PERSONAL TAX INCOME NET IMPACT
SOURCE For Latin America see: Lustig and Pessino 2014; Paz, et o 2014; Higgins and Pereira 2014; Scott 2014; Jaramillo 2014; Bucheli, eta. 2014; Lustig, et a. 2014.For Armenia and Sri Lanka, results are preliminary by Younger, et oL (2014) and Arunatilake, et of (2014)NOTE Only direct transfer effect is available for Argentina. Indonesia excludes personal income tax effect, although this is likely to be small.
TAXES AND PUBLIC SPENDING IN INDONESIA
27 HOW THE GOVERNMENT CHOOSES TO OCTOBER 2015RAISE MONEY CAN AFFECT INEQUALITY
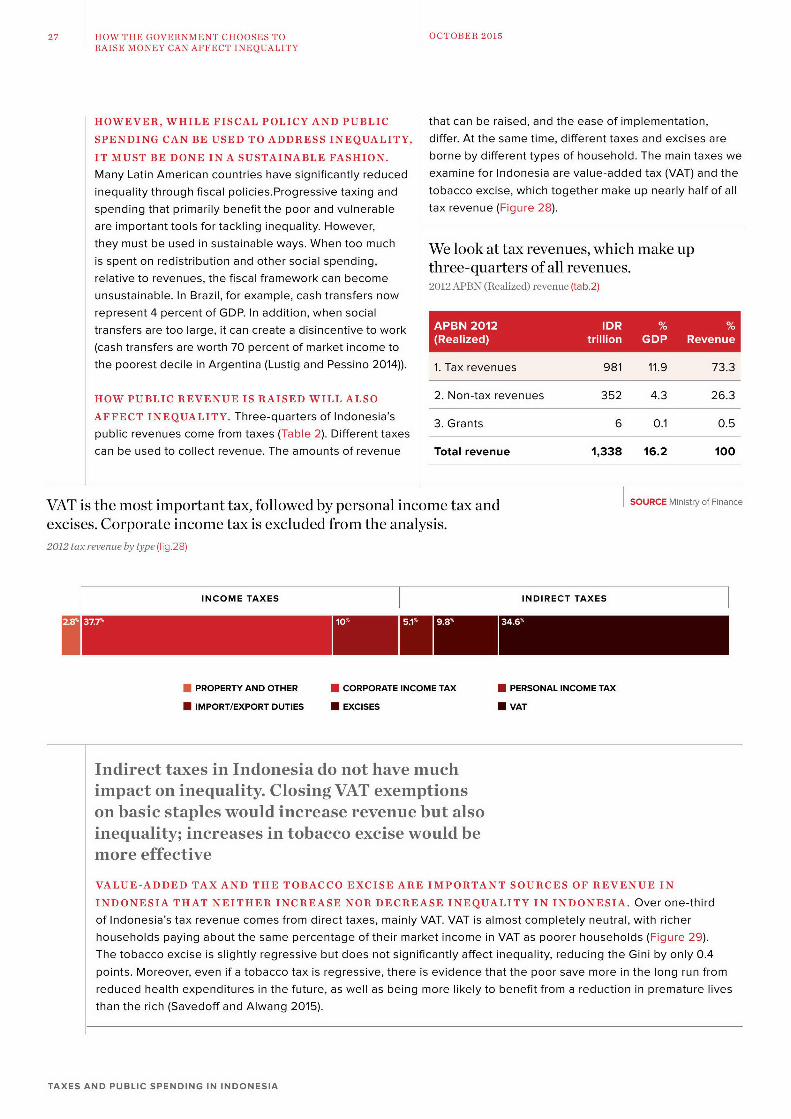
HOWEVER, WHILE FISCAL POLICY AND PUBLIC that can be raised, and the ease of implementation,
SPENDING CAN BE USED TO ADDRESS INEQUALITY, differ. At the same time, different taxes and excises are
IT MUST BE DONE IN A SUSTAINABLE FASHION. borne by different types of household. The main taxes we
Many Latin American countries have significantly reduced examine for Indonesia are value-added tax (VAT) and the
inequality through fiscal policies.Progressive taxing and tobacco excise, which together make up nearly half of all
spending that primarily benefit the poor and vulnerable tax revenue (Figure 28).are important tools for tackling inequality. However,
they must be used in sustainable ways. When too much We look at tax revenues, which make upis spent on redistribution and other social spending, three-quarters of all revenues.relative to revenues, the fiscal framework can become
unsustainable. In Brazil, for example, cash transfers now
represent 4 percent of GDP. In addition, when social
transfers are too large, it can create a disincentive to work
(cash transfers are worth 70 percent of market income tothe poorest clecile in Argentina (Lustig and Pessino 2014)). 1. Tax revenues 981 11.9 73.3
HOW PUBLIC REVENUE IS RAISED WILL ALSO 2. Non-tax revenues 352 4.3 26.3
AFFECT INEQUALITY. Three-quarters of Indonesia's 3. Grants 6 0.1 0.5public revenues come from taxes (Table 2). Different taxesa
can be used to collect revenue. The amounts of revenue Total revenue 1,338 16.2 100
VAT is the most important tax, followed by personal income tax and SOURCE Ministry of Finance
excises. Corporate income tax is excluded from the analysis.2012 tax revenue by type (fig.28)
0 PROPERTY AND OTHER U CORPORATE INCOME TAX U PERSONAL INCOME TAX
N IMPORTVEXPORT DUTIES N EXCISES N VAT
Indirect taxes in Indonesia do not have muchimpact on inequality. Closing VAT exemptionson basic staples would increase revenue but alsoinequality; increases in tobacco excise would bemore effective
VALUE-ADDED TAX AND THE TOBACCO EXCISE ARE IMPORTANT SOURCES OF REVENUE IN
INDONESIA THAT NEITHER INCREASE NOR DECREASE INEQUALITY IN INDONESIA. Over one-third
of Indonesia's tax revenue comes from direct taxes, mainly VAT. VAT is almost completely neutral, with richerhouseholds paying about the same percentage of their market income in VAT as poorer households (Figure 29).The tobacco excise is slightly regressive but does not significantly affect inequality, reducing the Gini by only 0.4
points. Moreover, even if a tobacco tax is regressive, there is evidence that the poor save more in the long run fromreduced health expenditures in the future, as well as being more likely to benefit from a reduction in premature lives
than the rich (Savedoff and Alwang 2015).
TAXES AND PUBLIC SPENDING IN INDONESIA
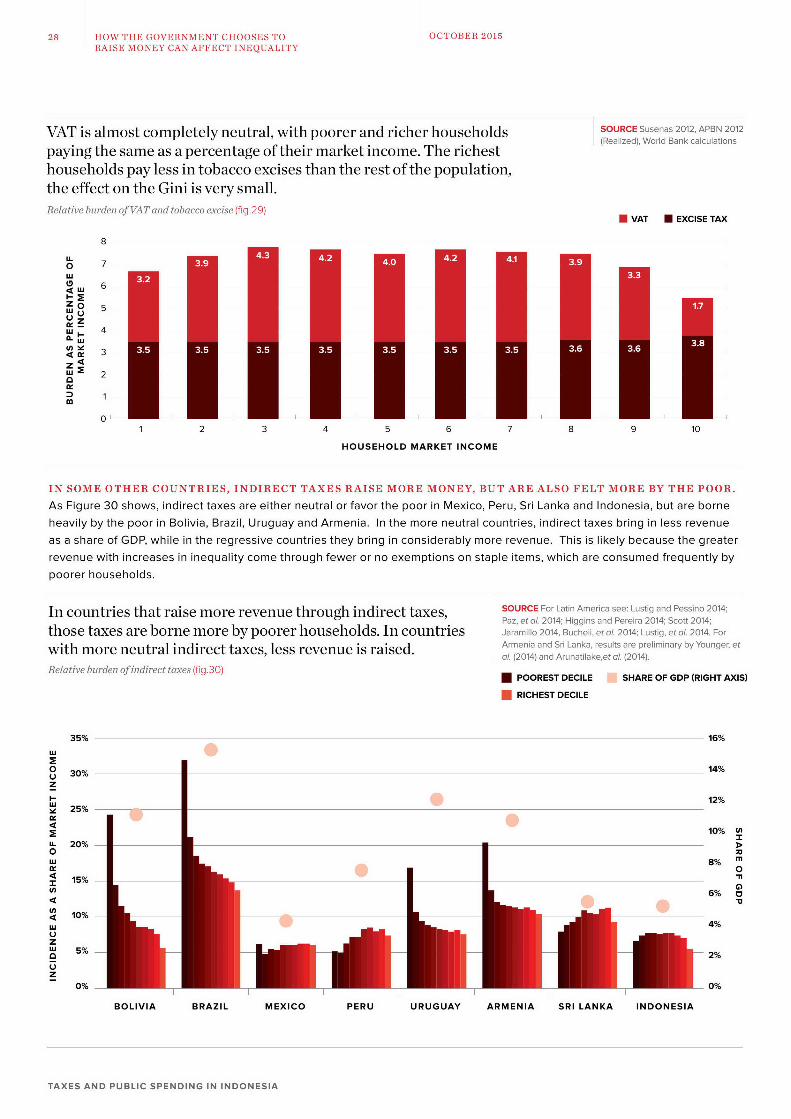
28 HOW THE GOVERNMENT CHOOSES TO OCTOBER 2015RAISE MONEY CAN AFFECT INEQUALITY
VAT is almost completely neutral, with poorer and richer households SOURCE Susenas 2012, APBN 2012
paying the same as a percentage of their market income. The richest (Realized), World Bank calculations
households pay less in tobacco excises than the rest of the population,the effect on the Gini is very small.Relative burden ofVAT and tobacco excise (fig.29)
U VAT U EXCISE TAX
8
** 7
4W
0 5
LU uLU ZM~ 3z 4
0
Z 1
01 2 3 4 5 6 7 8 9 10
HOUSEHOLD MARKET INCOME
IN SOME OTHER COUNTRIES, INDIRECT TAXES RAISE MORE MONEY, BUT ARE ALSO FELT MORE BY THE POOR.
As Figure 30 shows, indirect taxes are either neutral or favor the poor in Mexico, Peru, Sri Lanka and Indonesia, but are borneheavily by the poor in Bolivia, Brazil, Uruguay and Armenia. In the more neutral countries, indirect taxes bring in less revenueas a share of GDP, while in the regressive countries they bring in considerably more revenue. This is likely because the greater
revenue with increases in inequality come through fewer or no exemptions on staple items, which are consumed frequently by
poorer households.
In countries that raise more revenue through indirect taxes, SOURCE For Latin America see: Lustig and Pessino 2014;Paz, et aL 2014; Higgins and Pereira 2014; Scott 2014;
those taxes are borne more by poorer households. In countries Jaramillo 2014, Bucheli, et a. 2014; Lustig, et al. 2014. For
with more neutral indirect taxes, less revenue is raised. Armenia and Sri Lanka, results are preliminary by Younger, etat (2014) and Arunatilake,et a. (2014).
Relative burden ofindirect taxes (fig.30) POOREST DECILE SHARE OF GDP (RIGHT AXIS)
RICHEST DECILE
35% 16%
-12%LU
e 25%
10% U)X
LL 20% >O am 8% m
015% -
w 6%
4 10%W 4%
LU0LU 5% 2%
0% 0%
BOLIVIA BRAZIL MEXICO PERU URUGUAY ARMENIA SRI LANKA INDONESIA
TAXES AND PUBLIC SPENDING IN INDONESIA
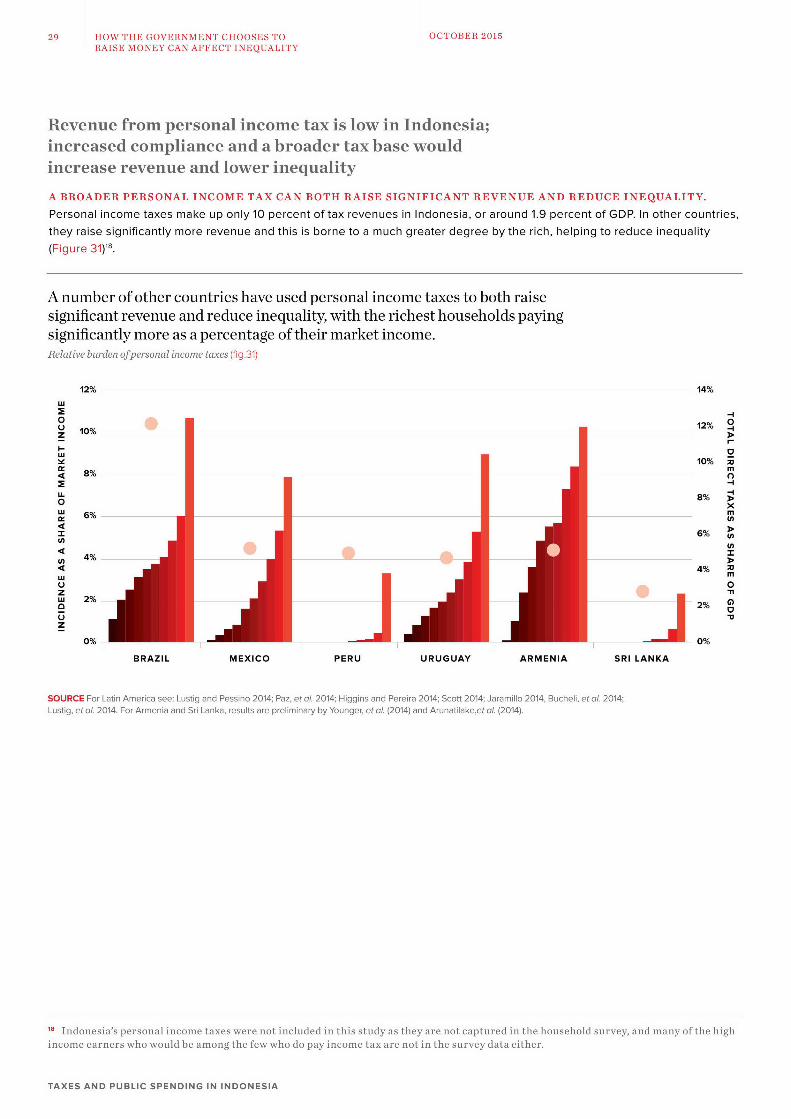
29 HOW THE GOVERNMENT CHOOSES TO OCTOBER 2015RAISE MONEY CAN AFFECT INEQUALITY
Revenue from personal income tax is low in Indonesia;increased compliance and a broader tax base wouldincrease revenue and lower inequality
A BROADER PERSONAL INCOME TAX CAN BOTH RAISE SIGNIFICANT REVENUE AND REDUCE INEQUALITY.
Personal income taxes make up only 10 percent of tax revenues in Indonesia, or around 1.9 percent of GDP. In other countries,they raise significantly more revenue and this is borne to a much greater degree by the rich, helping to reduce inequality(Figure 31).
A number of other countries have used personal income taxes to both raisesignificant revenue and reduce inequality, with the richest households payingsignificantly more as a percentage of their market income.Relative burden ofpersonal income taxes (fig.31)
12% 14%
m2 -1
0U10% 12%
10% 18%m
O 8% 0% -
%8% XWi 6% M
44m mn
6%Z(n
4% 244% X
o 0Z -nIWi 2% 2
Z
0% 0%
BRAZIL MEXICO PERU URUGUAY ARMENIA SRI LANKA
SOURCE For Latin America see: Lustig and Pessino 2014; Paz, et at 2014; Higgins and Pereira 2014; Scott 2014; Jaramillo 2014, Bucheli, et oL 2014;Lustig, et at 2014. For Armenia and Sri Lanka, results are preliminary by Younger, et aL (2014) and Arunatilake,et aL (2014).
" Indonesia's personal income taxes were not included in this study as they are not captured in the household survey, and many of the high
income earners who would be among the few who do pay income tax are not in the survey data either.
TAXES AND PUBLIC SPENDING IN INDONESIA
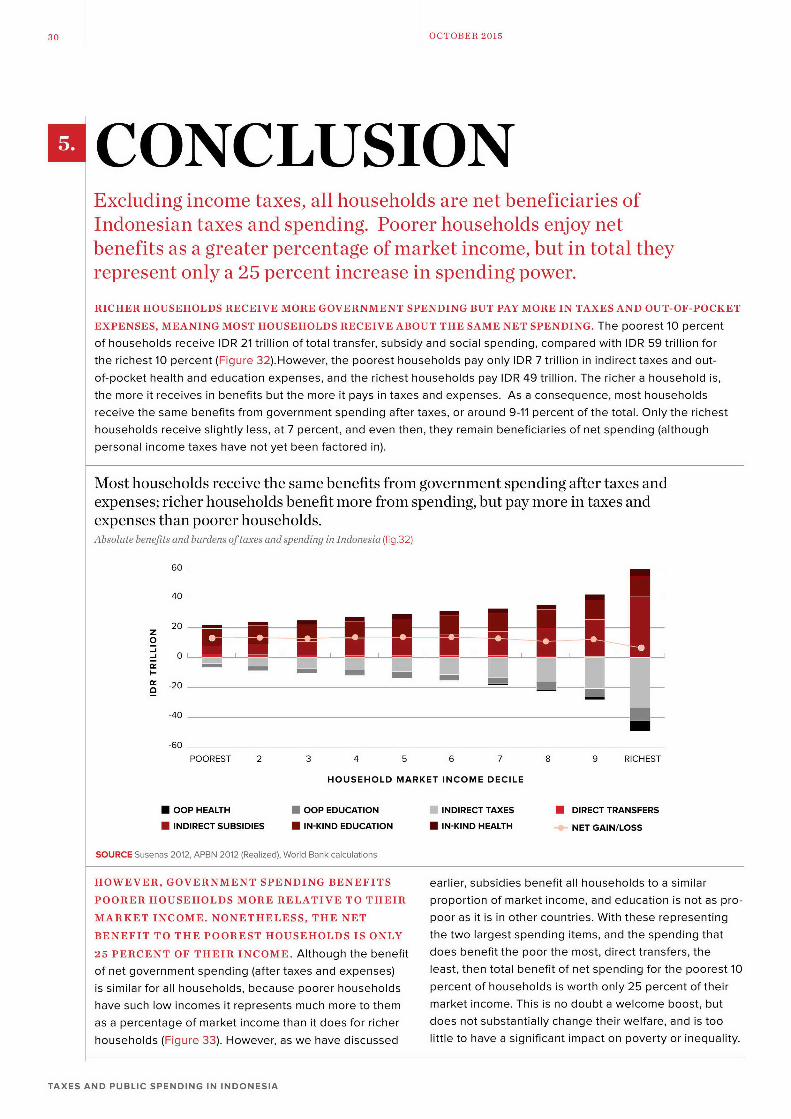
30 OCTOBER 2015
CONCLUSIONExcluding income taxes, all households are net beneficiaries ofIndonesian taxes and spending. Poorer households enjoy netbenefits as a greater percentage of market income, but in total theyrepresent only a 25 percent increase in spending power.
RICHER HOUSEHOLDS RECEIVE MORE GOVERNMENT SPENDING BUT PAY MORE IN TAXES AND OUT-OF-POCKET
EXPENSES, MEANING MOST HOUSEHOLDS RECEIVE ABOUT THE SAME NET SPENDING. The poorest 10 percent
of households receive IDR 21 trillion of total transfer, subsidy and social spending, compared with IDR 59 trillion forthe richest 10 percent (Figure 32).However, the poorest households pay only IDR 7 trillion in indirect taxes and out-
of-pocket health and education expenses, and the richest households pay IDR 49 trillion. The richer a household is,the more it receives in benefits but the more it pays in taxes and expenses. As a consequence, most householdsreceive the same benefits from government spending after taxes, or around 9-11 percent of the total. Only the richesthouseholds receive slightly less, at 7 percent, and even then, they remain beneficiaries of net spending (althoughpersonal income taxes have not yet been factored in).
Most households receive the same benefits from government spending after taxes andexpenses; richer households benefit more from spending, but pay more in taxes andexpenses than poorer households.Absolute benefits and burdens oftaxes and spending in Indonesia (fig.32)
60
40- - -U
20w WP _ _ _
-20
-40m
-60
POOREST 2 3 4 5 6 7 8 9 RICHEST
HOUSEHOLD MARKET INCOME DECILE
0 OOP HEALTH N OOP EDUCATION INDIRECT TAXES U DIRECT TRANSFERS
0 INDIRECT SUBSIDIES U IN-KIND EDUCATION U IN-KIND HEALTH NET GAIN/LOSS
SOURCE Susenas 2012, APBN 2012 (Realized), World Bank calculations
HOWEVER, GOVERNMENT SPENDING BENEFITS earlier, subsidies benefit all households to a similar
POORER HOUSEHOLDS MORE RELATIVE TO THEIR proportion of market income, and education is not as pro-
MARKET INCOME. NONETHELESS, THE NET poor as it is in other countries. With these representing
BENEFIT TO THE POOREST HOUSEHOLDS IS ONLY the two largest spending items, and the spending that
25 PERCENT OF THEIR INCOME. Although the benefit does benefit the poor the most, direct transfers, the
of net government spending (after taxes and expenses) least, then total benefit of net spending for the poorest 10is similar for all households, because poorer households percent of households is worth only 25 percent of their
have such low incomes it represents much more to them market income. This is no doubt a welcome boost, but
as a percentage of market income than it does for richer does not substantially change their welfare, and is too
households (Figure 33). However, as we have discussed little to have a significant impact on poverty or inequality.
TAXES AND PUBLIC SPENDING IN INDONESIA
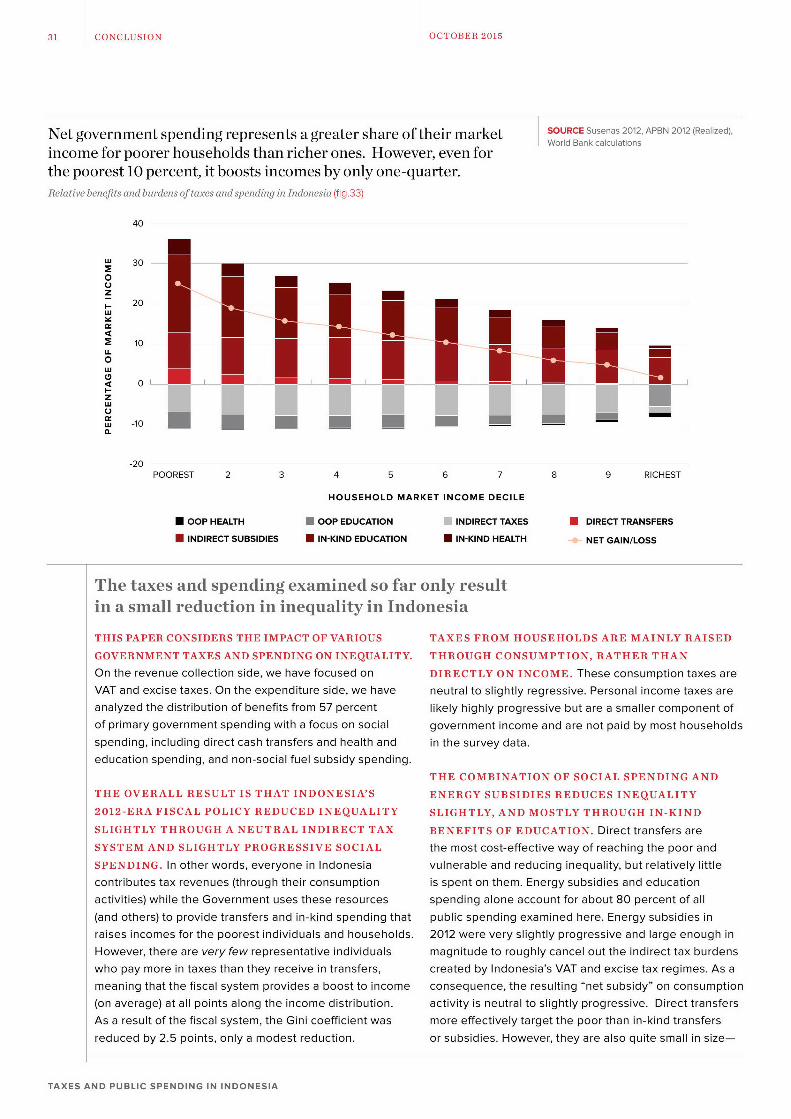
31 CONCLUSION OCTOBER 2015
Net government spending represents a greater share of their market SOURCE Susenas 2012, APBN 2012 (Realized),World Bank calculations
income for poorer households than richer ones. However, even forthe poorest 10 percent, it boosts incomes by only one-quarter.Relative benefits and burdens oftaxes and spending in Indonesia (fig.33)
40
m 30
0UZ
-20
LL
POOREST 2 3 4 5 6 7 8 9 RICHEST
HOUSEHOLD MARKET INCOME DECILE
H OOP HEALTH U OOP EDUCATION INDIRECT TAXES U DIRECT TRANSFERS
* INDIRECT SUBSIDIES U IN-KIND EDUCATION U IN-KIND HEALTH NET GAIN/LOSS
The taxes and spending examined so far oniy resultin a small reduction in inequality in Indonesia
THIS PAPER CONSIDERS THE IMPACT OF VARIOUS TAXES FROM HOUSEHOLDS ARE MAINLY RAISED
GOVERNMENT TAXES AND SPENDING ON INEQUALITY. TRUHCNUPIN AHRTA
On the revenue collection side, we have focused onDIETYOIN M.ThscouptntaearVAT and excise taxes. On the expenditure side, we have netatosihlrgesv.Proalncmtxsae
analyzed the distribution of benefits from 57 percent lkl ihyporsiebtaeasalrcmoeto
of primary government spending with a focus on social goennticmadarntpidbmsthuhls
spending, including direct cash transfers and health and intesryda.education spending, and non-social fuel subsidy spending.
THE OVERALL RESULT IS THAT INDONESIA'SENRYSBIESEDCSNQULT
2012-ERA FISCAL POLICY REDUCED INEQUALITY SIHL,ADMSL HOG NKN
SLIGHTLY THROUGH A NEUTRAL INDIRECT TAX BEEISOEDCTN.irctanfsae
SYSTEM AND SLIGHTLY PROGRESSIVE SOCIAL tems otefciewyo ecigtepo n
SPENDING. In other words, everyone in Indonesiavunrbeadeucgieqltybtrltvlyite
contributes tax revenues (through their consumption i pn nte.Eeg usde n dctoactivities) while the Government uses these resources sedn ln con o bu 0preto l
(and others) to provide transfers and in-kind spending that pbi pnigeaie ee nrysbiisiraises incomes for the poorest individuals and households.202wrveysihlpogsieanlreeouhnHowever, there are very few representative individuals mgiuet ogl aclotteidrc a udnwho pay more in taxes than they receive in transfers, craebyIdns'sVTndxietxrgms.Aameaning that the fiscal system provides a boost to income cosqee,terulig"tsbid"ncnumin(on average) at all points along the income distribution. ciiyi eta osihl rgesv.Drc rnfrAs a result of the fiscal system, the Gini coefficient was moefecilytrtthporhainkdtases
reducd by .5 pints,onlyamodstrductin,lo subidies. progresve t are als smaller componentze-
TAXESGHNDY,UBLICMOPTLDINGROUGHNIN-KIND
BEEISO0DCTO.Drc rnfr r
th otcs-fetv ayo ecigtepo n
vunrbeadrdcn0nqaiy u eaieyltl
isseto hm nry usde n dctospnigaoeacutfr bu 0preto l
pulcsedn xmndhee nrysbiisi
202wrMeysihl rgesv n ag nuhimantd toruhycaclotth1niet0a udn
TAE ADPBISENINGDINEC INSDNESA I-IDEUATO NKN ELTEANLS
32 CONCLUSION OCTOBER 2015
total spending on all direct transfers represents is lessthan 0.5 percent of GDP-and either provide relatively FURTHERMORE, A NUMBER OF KEY FISCAL
small benefit packages or do not have very broad POLICIES HAVE BEEN EXCLUDED FROM THE
coverage. As a result, the inequality and poverty reduction CURRENT ANALYSIS: PERSONAL INCOME TAXES
impacts of these transfers are limited. In-kind benefits, AND INFRASTRUCTURE. Personal income tax (PIT)
which are generally larger in terms of transfer size than is missing because most (wealthier) PIT payers are not
are direct transfer, are received only upon access, and covered in the survey data. Moreover, the absence ofpoorer households in Indonesia have far lower rates of these wealthier households will also distort the 2012
secondary- and tertiary-level education access than do results presented here. This is because these households
rich households, which limits the progressiveness of these are likely to pay higher VAT, as well as PIT, and potentially
sizeable transfer programs. benefit more from certain types of spending (such as fuelsubsidies) but less from others (such as education if they
WHILE FISCAL POLICY DOES ACHIEVE A LIMITED are sending their children to private schools). That means
DEGREE OF REDISTRIBUTION IN INDONESIA, IT IS that the richest decile of households may no longer still
LESS THAN IS ACHIEVED IN MOST OTHER COUNTRIES be net recipients of fiscal taxes and spending. Finally,
STUDIED, OFTEN BY A NUMBER OF TIMES. The modest infrastructure spending has been excluded because of
impacts of fiscal policy result from low direct income tax the methodological difficulties in allocating the benefits of
collection and low social spending levels, as well as the such spending across households.
fact that untargeted energy subsidies and education
expenditures-both of which are roughly neutral in TO ADDRESS BOTH THESE RECENT DEVELOPMENTS
distribution and not pro-poor-are the largest budget AND MISSING ANALYZES, THE FISCAL POLICY
items. Compared with the rest of the CEQ country set, AGENCY AND WORLD BANK HAVE AGREED A JOINT
Indonesia begins with a relatively low market income WORK PROGRAM THAT WILL:
Gini. But other countries with similarly low market income 1. Extend the analysis to the 2013 budget, capturing theGinis-Armenia or Ethiopia-do better than Indonesia in effects ofthe fuel subsidy reforms and temporary cashterms of inequality reduction through fiscal policy (while compensation;spending similarly low amounts). Regardless of the ideal 2. Extend the analysis to the 2015 budget, capturing thesize of fiscal spending in Indonesia, policymakers could removal of fuel subsidies, temporary cash assistancefurther enhance income equality and reduce the number and expansion of BSM and PKH;of impoverished citizens by shifting fiscal priorities.
3. Extend the analysis to capture both higher income
Further research is needed to bring in earners and personal income taxes by building uponthe top incomes methodology and data of Wai-Poi, et
other key components of fiscal policy aL (forthcoming); and
4. Pilot new methodological approaches to capturing theTHIS PAPER USES 2012 DATA, THE LATEST incidence of infrastructure spending.
AVAILABLE DATA AT THE TIME. Since then, a
number of new and important developments have takenplace. First, fixed fuel prices were increased in 2013, andaccompanied by an expansion in the BSM scholarshipsprogram and the distribution of temporary cash assistance
in the form of BLSM (Bantuan Longsung SementoraMiskin). At the end of 2014, fuel prices were raised againand a further round of BLSM issued. At the beginningof 2015, fuel subsidies were removed for gasoline andlowered for diesel, and further expansions made for BSMand PKH.
TAXES AND PUBLIC SPENDING IN INDONESIA
33 OCTOBER 2015
References
Arunatilake, N., Inchauste, G. and Lustig, N. 2014. Forthcoming paper (untitled).
Beneke de Sanfeliu, Margarita, Nora Lustig and Jose Andres Oliva. 2014. La incidencia de los impuestos y el gostosocial sabre la pobreza y la desigualdad en El Salvador.
Bucheli, M., N. Lustig, M. Rossi and F. Amabile. 2014. Social Spending, Taxes and Income Redistribution in Uruguay.
In Lustig, Nora, Carola Pessino and John Scott. (eds.) The Redistributive Impact of Taxes and Social Spendingin Latin America. Special Issue, Public Finance Review: 42(3).
Cabrera, Maynor, Nora Lustig and Hilicias E. Moran. 2014. Fiscal Policy, Inequality and the Ethnic Divide in Guatemala.Commitment to Equity Working Paper 20. Center for Inter-American Policy and Research and Department ofEconomics, Tulane University and Inter American Dialogue.
Dabla-Norris, E., K. Kochhar, N. Suphaphiphat, F. Ricka and E. Tsounta. 2015. Causes and Consequences of IncomeInequality: a global perspective. IMF Staff Discussion Note SDN/15/13. Washington, DC: International Monetary
Fund.
Higgins, S. and C. Pereira. 2014. The Effects of Brazil's Taxation and Social Spending on the Distribution of HouseholdIncome. In Lustig, Nora, Carola Pessino and John Scott, eds. The Redistributive Impact of Taxes and Social Spendingin Latin America. Special Issue, Public Finance Review: 42(3).
Inchauste, Gabriela, Nora Lustig, Mashekwa Maboshe, Catriona Purfield, and Ingrid Woolard. 2015. The DistributionalImpact of Fiscal Policy in South Africa. CEO Working Paper No. 29, Center for Inter-American Policy and Research
and Department of Economics, Tulane University and Inter-American Dialogue.
Jaramillo, Miguel. 2014. The Incidence of Social Spending and Taxes in Peru. In Lustig, Nora, Carola Pessino and JohnScott, eds. The Redistributive Impact of Taxes and Social Spending in Latin America. Special Issue, Public FinanceReview: 42(3).
Jellema, J., M. Wai-Poi and A. Afkar. 2015. Fiscal Policy, Redistribution, and Inequality in Indonesia (Working Paper).Washington, DC: World Bank.
Lembaga Survei Indonesia (LSI). 2014. Inequality Perceptions Survey. Jakarta: Lembaga Survei Indonesia.
Lustig, Nora. 2014. Taxes, Transfers, Inequality and the Poor in the Developing World. Round 1. CEO Working Paper No.23, Center for Inter-American Policy and Research and Department of Economics, Tulane University and Inter-American Dialogue.
Lustig, Nora and Sean Higgins. 2013. Commitment to Equity Assessment (CEO): Estimating the Incidence of SocialSpending, Subsidies and Taxes. (Handbook). CEO Working Paper No. 1, July 2011; revised January 2013. New
Orleans: Tulane University.
Lustig, N. and C. Pessino. 2014. Social Spending and Income Redistribution in Argentina in the 2000s: The Rising Roleof Noncontributory Pensions. Pubic Finance Review. Published online 20 Nov 2013.
Lustig, N., C. Pessino and J. Scott. 2013. The Impact of Taxes and Social Spending on Inequality and Poverty inArgentina, Bolivia, Brazil, Mexico, Peru and Uruguay: An Overview. CEO Working Paper No. 3. Center for Inter-American Policy and Research and Department of Economics, Tulane University and Inter-American Dialogue.
Paz Arauco, V., GG. Molina, W. Jimenez Pozo, W. and E. Yaiez Aguilar. 2014. Explaining Low Redistributive Impact in
Bolivia. In Lustig, Nora, Carola Pessino and John Scott, eds. The Redistributive Impact of Taxes and Social Spendingin Latin America. Special Issue, Public Finance Review: 42(3).
TAXES AND PUBLIC SPENDING IN INDONESIA
34 OCTOBER 2015
References
Peirskalla, Jan and Audrey Sacks. 2015. Unpacking the Effect of Decentralization on Conflict: Lessons from Indonesia.Unpublished Manuscript.
Sauma, Juan Diego Trejos. 2014. Social Public Spending, Taxes, Redistribution of Income, and Poverty in Costa. CEOWorking Paper No. 18. Center for Inter-American Policy and Research and Department of Economics, Tulane
University and Inter-American Dialogue.
Savedoff, William and Albert Alwang. 2015. The Single Best Health Policy in the World: Tobacco Taxes. CGD PolicyPaper 062. Washington DC: Center for Global Development.
Scott, John. 2014. Redistributive Impact and Efficiency of Mexico's Fiscal System. In Lustig, Nora, Carola Pessino andJohn Scott, eds. The Redistributive Impact of Taxes and Social Spending in Latin America. Special Issue, PublicFinance Review: 42(3).
Wai-Poi, M., Wihardja, M. and Mervisiano, M. (Forthcoming). The Problem with Taxes: Measuring Top Incomes inIndonesia (Working paper). Jakarta: World Bank.
Woldehanna, Tassew, Eyasu Tsehaye, Gabriela Inchauste, Ruth Hill and Nora Lustig. 2014. Fiscal Incidence in Ethiopia.In World Bank. 2014. Ethiopia Poverty Assessment. Washington DC: World Bank.
World Bank. 2014. Delivering Change. Indonesia Economic Quarterly, December 2014. Jakarta: World Bank.
World Bank. 2015a. Indonesia's Rising Divide: Why inequality is rising, Why it matters and what can be done. Jakarta:
World Bank.
World Bank. 2015b. A Perceived Divide: How Indonesians think about inequality and what should be done (WorkingPaper). Jakarta: World Bank.
World Bank. Forthcoming (a). Indonesia's New Climbers: Who are the middle class and what does it mean for thecountry? Jakarta: World Bank.
World Bank. Forthcoming (b). Report on top incomes in Indonesia (Working Paper). Jakarta: World Bank.
Younger, S. and A. Khachatryan. 2014. Fiscal Incidence in Armenia. Background Paper for World Bank (forthcoming)Armenia Public Expenditure Review.
Zhuang, J., R. Kanbur and C. Rhee. 2014. Asia's income inequalities. In Zhuang, J., R. Kanbur and C. Rhee, eds.Inequality in Asia and the Pacific: Trends, Drivers, and Policy Implications. New York: Asia Development Bank andRoutledge.
TAXES AND PUBLIC SPENDING IN INDONESIA
Related Documents