Table of Contents UNITED STATES SECURITIES AND EXCHANGE COMMISSION Washington, D.C. 20549 FORM 10-Q (Mark One) x QUARTERLY REPORT PURSUANT TO SECTION 13 OR 15(d) OF THE SECURITIES EXCHANGE ACT OF 1934 For the quarterly period ended June 30, 2019 OR ¨ TRANSITION REPORT PURSUANT TO SECTION 13 OR 15(d) OF THE SECURITIES EXCHANGE ACT OF 1934 For the transition period from to Commission File No. 001-38469 AXA Equitable Holdings, Inc. (Exact name of registrant as specified in its charter) Delaware 90-0226248 (State or other jurisdiction of incorporation or organization) (I.R.S. Employer Identification No.) 1290 Avenue of the Americas, New York, New York 10104 (Address of principal executive offices) (Zip Code) (212) 554-1234 (Registrant’s telephone number, including area code) Not applicable (Former name, former address, and former fiscal year if changed since last report.) Indicate by check mark whether the registrant (1) has filed all reports required to be filed by Section 13 or 15(d) of the Securities Exchange Act of 1934 during the preceding 12 months (or for such shorter period that the registrant was required to file such reports), and (2) has been subject to such filing requirements for the past 90 days. Yes x No ¨ Indicate by check mark whether the registrant has submitted electronically every Interactive Data File required to be submitted pursuant to Rule 405 of Regulation S-T (§232.405 of this chapter) during the preceding 12 months (or for such shorter period that the registrant was required to submit such files). Yes x No ¨ Indicate by check mark whether the registrant is a large accelerated filer, an accelerated filer, a non-accelerated filer, a smaller reporting company or an “emerging growth company”. See definition of “accelerated filer,” “large accelerated filer,” “smaller reporting company” and “emerging growth company” in Rule 12b-2 of the Exchange Act. Large accelerated filer ¨ Accelerated filer ¨ Non-accelerated filer x Smaller reporting company ¨ Emerging growth company ¨ If an emerging growth company, indicate by check mark if the registrant has elected not to use the extended transition period for complying with any new or revised financial accounting standards provided pursuant to Section 13 (a) of the Exchange Act. ¨ Indicate by check mark whether the registrant is a shell company (as defined in Rule 12b-2 of the Exchange Act). Yes ¨ No x Securities registered pursuant to Section 12(b) of the Act: Title of each class Trading symbol Name of exchange on which registered Common Stock EQH New York Stock Exchange As of August 8, 2019 , 491,148,524 shares of the registrant’s Common Stock, $0.01 par value, were outstanding.

Welcome message from author
This document is posted to help you gain knowledge. Please leave a comment to let me know what you think about it! Share it to your friends and learn new things together.
Transcript

Table of Contents
UNITED STATESSECURITIES AND EXCHANGE COMMISSION
Washington, D.C. 20549
FORM 10-Q (Mark One)
x QUARTERLY REPORT PURSUANT TO SECTION 13 OR 15(d) OF THE SECURITIES EXCHANGE ACT OF 1934
For the quarterly period ended June 30, 2019OR
¨ TRANSITION REPORT PURSUANT TO SECTION 13 OR 15(d) OF THE SECURITIES EXCHANGE ACT OF 1934
For the transition period from to Commission File No. 001-38469
AXA Equitable Holdings, Inc.(Exact name of registrant as specified in its charter)
Delaware 90-0226248(State or other jurisdiction of incorporation or organization) (I.R.S. Employer Identification No.)
1290 Avenue of the Americas, New York, New York 10104(Address of principal executive offices) (Zip Code)
(212) 554-1234(Registrant’s telephone number, including area code)
Not applicable(Former name, former address, and former fiscal year if changed since last report.)
Indicate by check mark whether the registrant (1) has filed all reports required to be filed by Section 13 or 15(d) of the Securities Exchange Act of 1934 during the preceding 12months (or for such shorter period that the registrant was required to file such reports), and (2) has been subject to such filing requirements for the past 90 days. Yes xx No ¨̈
Indicate by check mark whether the registrant has submitted electronically every Interactive Data File required to be submitted pursuant to Rule 405 of Regulation S-T(§232.405 of this chapter) during the preceding 12 months (or for such shorter period that the registrant was required to submit such files). Yes x No ¨̈
Indicate by check mark whether the registrant is a large accelerated filer, an accelerated filer, a non-accelerated filer, a smaller reporting company or an “emerging growthcompany”. See definition of “accelerated filer,” “large accelerated filer,” “smaller reporting company” and “emerging growth company” in Rule 12b-2 of the Exchange Act.
Large accelerated filer¨
Accelerated filer¨
Non-accelerated filerx
Smaller reporting company¨
Emerging growth company¨
If an emerging growth company, indicate by check mark if the registrant has elected not to use the extended transition period for complying with any new or revised financialaccounting standards provided pursuant to Section 13 (a) of the Exchange Act. ¨
Indicate by check mark whether the registrant is a shell company (as defined in Rule 12b-2 of the Exchange Act). Yes ¨¨No x
Securities registered pursuant to Section 12(b) of the Act:
Title of each class Trading symbol Name of exchange on which registeredCommon Stock EQH New York Stock Exchange
As of August 8, 2019 , 491,148,524 shares of the registrant’s Common Stock, $0.01 par value, were outstanding.

TABLE OF CONTENTS
Page
PART I - FINANCIAL INFORMATION Item 1. Consolidated Financial Statements Unaudited Consolidated Balance Sheets, June 30, 2019 and December 31, 2018 2
Unaudited Consolidated Statements of Income (Loss), Three and Six Months Ended June 30, 2019 and 2018 3
Unaudited Consolidated Statements of Comprehensive Income (Loss), Three and Six Months Ended June 30, 2019 and 2018 4
Unaudited Consolidated Statements of Equity, Three and Six Months Ended June 30, 2019 and 2018 5
Unaudited Consolidated Statements of Cash Flows, Six Months Ended June 30, 2019 and 2018 7
Notes to Consolidated Financial Statements (Unaudited) 9
Note 1 - Organization 9
Note 2 - Significant Accounting Policies 9
Note 3 - Investments 15
Note 4 - Derivatives 22
Note 5 - Closed Block 28
Note 6 - Insurance Liabilities 29
Note 7 - Fair Value Disclosures 33
Note 8 - Leases 48
Note 9 - Employee Benefit Plans 50
Note 10 - Income Taxes 50
Note 11 - Related Party Transactions 50
Note 12 - Equity 51
Note 13 - Redeemable Noncontrolling Interest 53
Note 14 - Commitments and Contingent Liabilities 53
Note 15 - Business Segment Information 56
Note 16 - Earnings Per Share 59
Note 17 - Revision of Prior Period Financial Statements 59
Note 18 - Subsequent Events 64
Item 2. Management’s Discussion and Analysis of Financial Condition and Results of Operations 65Item 3. Quantitative and Qualitative Disclosures About Market Risk 104Item 4. Controls and Procedures 105
PART II - OTHER INFORMATION Item 1. Legal Proceedings 107Item 1A. Risk Factors 107Item 2. Unregistered Sales of Equity Securities and Use of Proceeds 107Item 3. Defaults Upon Senior Securities 107Item 4. Mine Safety Disclosures 107Item 5. Other Information 107Item 6. Exhibits 109
SIGNATURES 110

Table of Contents
NOTE REGARDING FORWARD-LOOKING STATEMENTS AND INFORMATION
Certain of the statements included or incorporated by reference in this Quarterly Report on Form 10-Q constitute forward-looking statements within themeaning of the Private Securities Litigation Reform Act of 1995. Words such as “expects,” “believes,” “anticipates,” “intends,” “seeks,” “aims,” “plans,”“assumes,” “estimates,” “projects,” “should,” “would,” “could,” “may,” “will,” “shall” or variations of such words are generally part of forward-lookingstatements. Forward-looking statements are made based on management’s current expectations and beliefs concerning future developments and their potentialeffects upon AXA Equitable Holdings, Inc. (“Holdings”) and its consolidated subsidiaries. “We,” “us” and “our” refer to Holdings and its consolidatedsubsidiaries, unless the context refers only to Holdings as a corporate entity. There can be no assurance that future developments affecting Holdings will be thoseanticipated by management. Forward-looking statements include, without limitation, all matters that are not historical facts.
These forward-looking statements are not a guarantee of future performance and involve risks and uncertainties, and there are certain important factors thatcould cause actual results to differ, possibly materially, from expectations or estimates reflected in such forward-looking statements, including, among others: (i)conditions in the financial markets and economy, including equity market declines and volatility, interest rate fluctuations, impacts on our goodwill and changes inliquidity and access to and cost of capital; (ii) operational factors, including reliance on the payment of dividends to Holdings by its subsidiaries, remediation ofour material weaknesses, fulfilling our obligations related to being a public company, indebtedness, elements of our business strategy not being effective inaccomplishing our objectives, protection of confidential customer information or proprietary business information, information systems failing or beingcompromised and strong industry competition; (iii) credit, counterparties and investments, including counterparty default on derivative contracts, failure offinancial institutions, defaults, errors or omissions by third parties and affiliates and gross unrealized losses on fixed maturity and equity securities; (iv) ourreinsurance and hedging programs; (v) our products, structure and product distribution, including variable annuity guaranteed benefits features within certain of ourproducts, complex regulation and administration of our products, variations in statutory capital requirements, financial strength and claims-paying ratings and keyproduct distribution relationships; (vi) estimates, assumptions and valuations, including risk management policies and procedures, potential inadequacy of reserves,actual mortality, longevity and morbidity experience differing from pricing expectations or reserves, amortization of deferred acquisition costs and financialmodels; (vii) our Investment Management and Research segment, including fluctuations in assets under management, the industry-wide shift from actively-managed investment services to passive services and potential termination of investment advisory agreements; (viii) legal and regulatory risks, including federaland state legislation affecting financial institutions, insurance regulation and tax reform; (ix) risks related to our continuing relationship with AXA, includingconflicts of interest, waiver of corporate opportunities and costs associated with separation and rebranding; and (x) risks related to our common stock and futureofferings, including the market price for our common stock being volatile and potential stock price declines due to future sales of shares by existing stockholders.
Forward-looking statements should be read in conjunction with the other cautionary statements, risks, uncertainties and other factors identified in Holdings’Annual Report on Form 10-K for the year ended December 31, 2018 , as amended or supplemented in our subsequently filed Quarterly Report on Form 10-Q,including in the section entitled “Risk Factors,” and elsewhere in this Quarterly Report on Form 10-Q. Further, any forward-looking statement speaks only as ofthe date on which it is made, and we undertake no obligation to update or revise any forward-looking statement to reflect events or circumstances after the date onwhich the statement is made or to reflect the occurrence of unanticipated events, except as otherwise may be required by law.
1
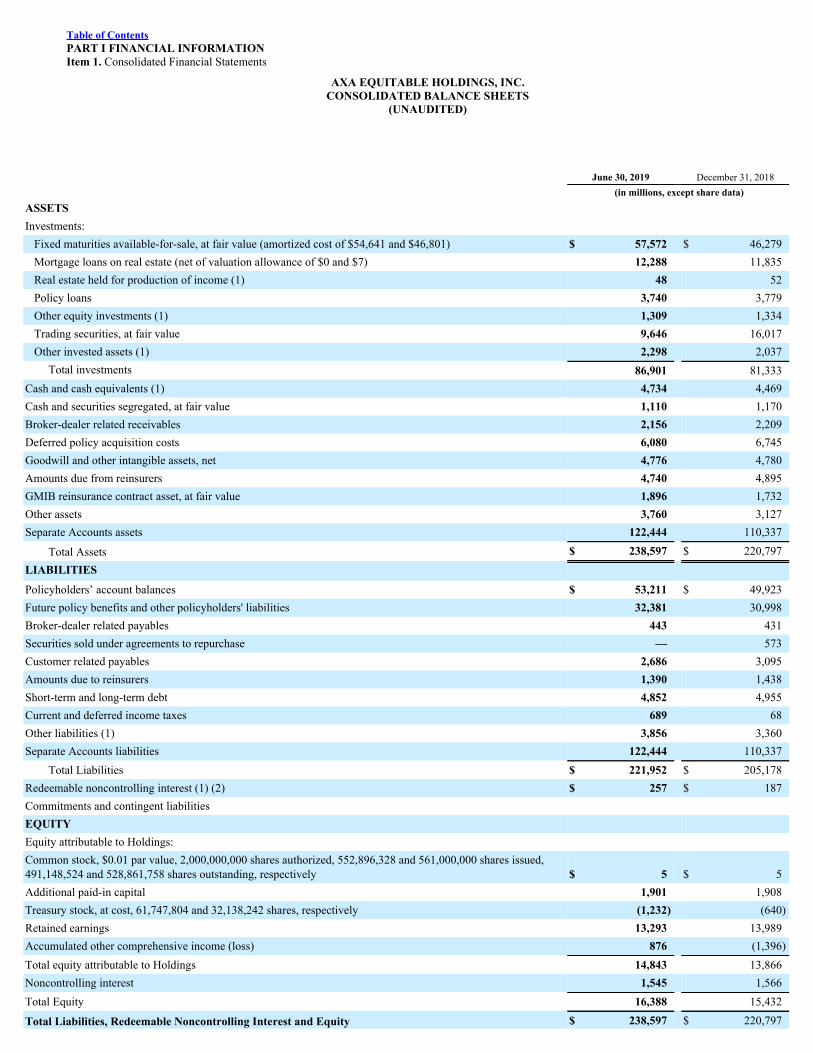
Table of ContentsPART I FINANCIAL INFORMATIONItem 1. Consolidated Financial Statements
AXA EQUITABLE HOLDINGS, INC.CONSOLIDATED BALANCE SHEETS
(UNAUDITED)
June 30, 2019 December 31, 2018 (in millions, except share data)ASSETS Investments:
Fixed maturities available-for-sale, at fair value (amortized cost of $54,641 and $46,801) $ 57,572 $ 46,279Mortgage loans on real estate (net of valuation allowance of $0 and $7) 12,288 11,835Real estate held for production of income (1) 48 52Policy loans 3,740 3,779Other equity investments (1) 1,309 1,334Trading securities, at fair value 9,646 16,017Other invested assets (1) 2,298 2,037
Total investments 86,901 81,333Cash and cash equivalents (1) 4,734 4,469Cash and securities segregated, at fair value 1,110 1,170Broker-dealer related receivables 2,156 2,209Deferred policy acquisition costs 6,080 6,745Goodwill and other intangible assets, net 4,776 4,780Amounts due from reinsurers 4,740 4,895GMIB reinsurance contract asset, at fair value 1,896 1,732Other assets 3,760 3,127Separate Accounts assets 122,444 110,337
Total Assets $ 238,597 $ 220,797LIABILITIES Policyholders’ account balances $ 53,211 $ 49,923Future policy benefits and other policyholders' liabilities 32,381 30,998Broker-dealer related payables 443 431Securities sold under agreements to repurchase — 573Customer related payables 2,686 3,095Amounts due to reinsurers 1,390 1,438Short-term and long-term debt 4,852 4,955Current and deferred income taxes 689 68Other liabilities (1) 3,856 3,360Separate Accounts liabilities 122,444 110,337
Total Liabilities $ 221,952 $ 205,178Redeemable noncontrolling interest (1) (2) $ 257 $ 187Commitments and contingent liabilities EQUITY Equity attributable to Holdings: Common stock, $0.01 par value, 2,000,000,000 shares authorized, 552,896,328 and 561,000,000 shares issued,491,148,524 and 528,861,758 shares outstanding, respectively $ 5 $ 5Additional paid-in capital 1,901 1,908Treasury stock, at cost, 61,747,804 and 32,138,242 shares, respectively (1,232) (640)Retained earnings 13,293 13,989Accumulated other comprehensive income (loss) 876 (1,396)Total equity attributable to Holdings 14,843 13,866Noncontrolling interest 1,545 1,566Total Equity 16,388 15,432
Total Liabilities, Redeemable Noncontrolling Interest and Equity $ 238,597 $ 220,797

______________(1) See Note 2 for details of balances with variable interest entities.(2) See Note 13 for details of Redeemable noncontrolling interest.
See Notes to Consolidated Financial Statements (Unaudited).
2

Table of ContentsAXA EQUITABLE HOLDINGS, INC.
CONSOLIDATED STATEMENTS OF INCOME (LOSS)(UNAUDITED)
Three Months Ended June 30, Six Months Ended June 30,
2019 2018 2019 2018 (in millions, except per share data)REVENUES Policy charges and fee income $ 941 $ 964 $ 1,872 $ 1,930Premiums 280 275 563 554Net derivative gains (losses) (236) (46) (1,866) (282)Net investment income (loss) 976 596 1,991 1,187Investment gains (losses), net (12) (22) (23) 80Investment management and service fees 1,072 1,075 2,071 2,130Other income 139 124 266 241
Total revenues 3,160 2,966 4,874 5,840 BENEFITS AND OTHER DEDUCTIONS Policyholders’ benefits 896 900 1,776 1,494Interest credited to policyholders’ account balances 314 268 618 539Compensation and benefits 512 520 1,021 1,099Commissions and distribution-related payments 307 287 588 578Interest expense 57 60 113 106Amortization of deferred policy acquisition costs 177 185 375 357Other operating costs and expenses 456 424 866 917
Total benefits and other deductions 2,719 2,644 5,357 5,090Income (loss) from continuing operations, before income taxes 441 322 (483) 750Income tax (expense) benefit (11) (61) 204 (152)Net income (loss) 430 261 (279) 598
Less: Net income (loss) attributable to the noncontrolling interest 67 97 133 220
Net income (loss) attributable to Holdings $ 363 $ 164 $ (412) $ 378
EARNINGS PER SHARE Earnings per share - Common stock:
Basic $ 0.74 $ 0.29 $ (0.82) $ 0.67
Diluted $ 0.74 $ 0.29 $ (0.82) $ 0.67
Weighted average common shares outstanding: Basic 491.1 561.0 504.5 561.0
Diluted 491.9 561.1 504.5 561.1
See Notes to Consolidated Financial Statements (Unaudited).
3

Table of ContentsAXA EQUITABLE HOLDINGS, INC.
CONSOLIDATED STATEMENTS OF COMPREHENSIVE INCOME (LOSS)(UNAUDITED)
Three Months Ended June 30, Six Months Ended June 30,
2019 2018 2019 2018 (in millions)COMPREHENSIVE INCOME (LOSS) Net income (loss) $ 430 $ 261 $ (279) $ 598Other comprehensive income (loss) net of income taxes:
Change in unrealized gains (losses), net of reclassification adjustment (1) 1,369 (349) 2,203 (1,311)Changes in defined benefit plan related items not yet recognized in periodicbenefit cost, net of reclassification adjustment 18 1 67 134Foreign currency translation adjustment (1) 1 (8) — (11)
Total other comprehensive income (loss), net of income taxes 1,388 (356) 2,270 (1,188)Comprehensive income (loss) 1,818 (95) 1,991 (590)
Less: Comprehensive income (loss) attributable to the noncontrollinginterest 66 105 131 234
Comprehensive income (loss) attributable to Holdings $ 1,752 $ (200) $ 1,860 $ (824)______________(1) A reclassification of $1 million and $3 million has been made to the previously reported amounts for the three and six months ended June 30, 2018 , respectively, to
conform to the current period’s presentation.
See Notes to Consolidated Financial Statements (Unaudited).
4

Table of ContentsAXA EQUITABLE HOLDINGS, INC.
CONSOLIDATED STATEMENTS OF EQUITY(UNAUDITED)
Three Months Ended June 30,
Equity Attributable to Holdings
Common
Stock
AdditionalPaid-inCapital
TreasuryStock
RetainedEarnings
Accumulated OtherComprehensiveIncome (Loss)
TotalHoldingsEquity
Non-controlling
Interest Total Equity (in millions)
April 1, 2019 $ 5 $ 1,881 $ (1,234) $ 13,004 $ (513) $ 13,143 $ 1,539 $ 14,682Stock compensation — 28 2 — — 30 3 33Retirement of common stock — — — (1) — (1) — (1)Dividends paid to noncontrolling interest — — — — — — (56) (56)Stockholder dividends (cash dividends declaredper common share of $0.15 during the threemonths ended June 30, 2019) — — — (73) — (73) — (73)Net income (loss) — — — 363 — 363 60 423Other comprehensive income (loss) — — — — 1,389 1,389 (1) 1,388Other — (8) — — — (8) — (8)
June 30, 2019 $ 5 $ 1,901 $ (1,232) $ 13,293 $ 876 $ 14,843 $ 1,545 $ 16,388
April 1, 2018 $ 5 $ 2,051 $ — $ 12,437 $ (946) $ 13,547 $ 3,035 $ 16,582
Repurchase of AB Holding units — — — — — — (11) (11)
Dividends paid to noncontrolling interest — — — — — — (81) (81)
Purchase of AB Units by Holdings — — — — — — (1,521) (1,521)Purchase of AllianceBernstein Units fromnoncontrolling interest — 17 — — — 17 — 17
Net income (loss) — — — 164 — 164 83 247
Other comprehensive income (loss) — — — — (364) (364) 8 (356)
Other — — — — — — (26) (26)
June 30, 2018 $ 5 $ 2,068 $ — $ 12,601 $ (1,310) $ 13,364 $ 1,487 $ 14,851
5

Table of ContentsAXA EQUITABLE HOLDINGS, INC.
CONSOLIDATED STATEMENTS OF EQUITY — CONTINUED(UNAUDITED)
Six Months Ended June 30,
Equity Attributable to Holdings
Common
Stock
AdditionalPaid-inCapital
TreasuryStock
RetainedEarnings
Accumulated OtherComprehensiveIncome (Loss)
TotalHoldingsEquity
Non-controlling
Interest Total Equity (in millions)
January 1, 2019 $ 5 $ 1,908 $ (640) $ 13,989 $ (1,396) $ 13,866 $ 1,566 $ 15,432
Stock compensation — 9 2 — — 11 12 23
Purchase of treasury stock — — (594) — — (594) — (594)
Retirement of common stock — — — (143) — (143) — (143)
Repurchase of AB Holding units — — — — — — (21) (21)
Dividends paid to noncontrolling interest — — — — — — (124) (124)Stockholder dividends (cash dividends declaredper common share of $0.28 in 2019) — — — (141) — (141) — (141)
Net income (loss) — — — (412) — (412) 114 (298)
Other comprehensive income (loss) — — — — 2,272 2,272 (2) 2,270
Other — (16) — — — (16) — (16)
June 30, 2019 $ 5 $ 1,901 $ (1,232) $ 13,293 $ 876 $ 14,843 $ 1,545 $ 16,388
January 1, 2018 $ 5 $ 1,299 $ — $ 12,225 $ (108) $ 13,421 $ 3,097 $ 16,518
Stock compensation — 57 — — — 57 — 57
Repurchase of AB Holding units — — — — — — (12) (12)
Dividends paid to noncontrolling interest — — — — — — (216) (216)
Stockholder dividends — — — (15) — (15) — (15)
Capital contribution from parent — 695 — — — 695 — 695
Purchase of AB Units by Holdings — — — — — — (1,521) (1,521)Purchase of AllianceBernstein Units fromnoncontrolling interest — 17 — — — 17 — 17Cumulative effect of adoption of revenuerecognition standard ASC 606 — — — 13 — 13 19 32
Net income (loss) — — — 378 — 378 186 564
Other comprehensive income (loss) — — — — (1,202) (1,202) 14 (1,188)
Other — — — — — — (80) (80)
June 30, 2018 $ 5 $ 2,068 $ — $ 12,601 $ (1,310) $ 13,364 $ 1,487 $ 14,851
See Notes to Consolidated Financial Statements (Unaudited).
6

Table of ContentsAXA EQUITABLE HOLDINGS, INC.
CONSOLIDATED STATEMENTS OF CASH FLOWS(UNAUDITED)
Six Months Ended June 30,
2019 2018 (in millions)Cash flows from operating activities:
Net income (loss) $ (279) $ 598Adjustments to reconcile Net income (loss) to Net cash provided by (used in) operating activities:
Interest credited to policyholders’ account balances 618 539Policy charges and fee income (1,872) (1,930)Net derivative (gains) losses 1,866 282Investment (gains) losses, net 23 (80)Realized and unrealized (gains) losses on trading securities (456) 237Non-cash long term incentive compensation expense (1) 68 —Non-cash pension plan restructuring — 101Amortization and depreciation (1) 433 348Equity (income) loss from limited partnerships (41) (59)
Changes in: Net broker-dealer and customer related receivables/payables (384) 479Reinsurance recoverable (1) (65) 29Segregated cash and securities, net 60 (473)Capitalization of deferred policy acquisition costs (1) (362) (332)Future policy benefits 1 (186)Current and deferred income taxes 23 182Other, net (1) (58) (77)
Net cash provided by (used in) operating activities $ (425) $ (342) Cash flows from investing activities:
Proceeds from the sale/maturity/prepayment of: Fixed maturities, available-for-sale $ 5,201 $ 6,307Mortgage loans on real estate 288 153Trading account securities 7,662 4,866Real estate joint ventures 2 139Short-term investments (1) 1,613 2,756Other 115 122
Payment for the purchase/origination of: Fixed maturities, available-for-sale (12,916) (6,031)Mortgage loans on real estate (757) (1,004)Trading account securities (715) (5,075)Short-term investments (1) (1,598) (1,586)Other (113) (110)
Cash settlements related to derivative instruments (1,112) (970)Repayments of loans to affiliates — 1,230Investment in capitalized software, leasehold improvements and EDP equipment (39) (46)Other, net (1) (73) 480
Net cash provided by (used in) investing activities $ (2,442) $ 1,231 Cash flows from financing activities:
Policyholders’ account balances: Deposits $ 4,920 $ 4,426Withdrawals (2,382) (2,178)Transfers (to) from Separate Accounts 831 866

Change in short-term financings (104) (1,341)Issuance of long-term debt — 4,058Repayment of loans from affiliates — (3,000)Change in collateralized pledged assets (9) 31Change in collateralized pledged liabilities 1,483 455
7
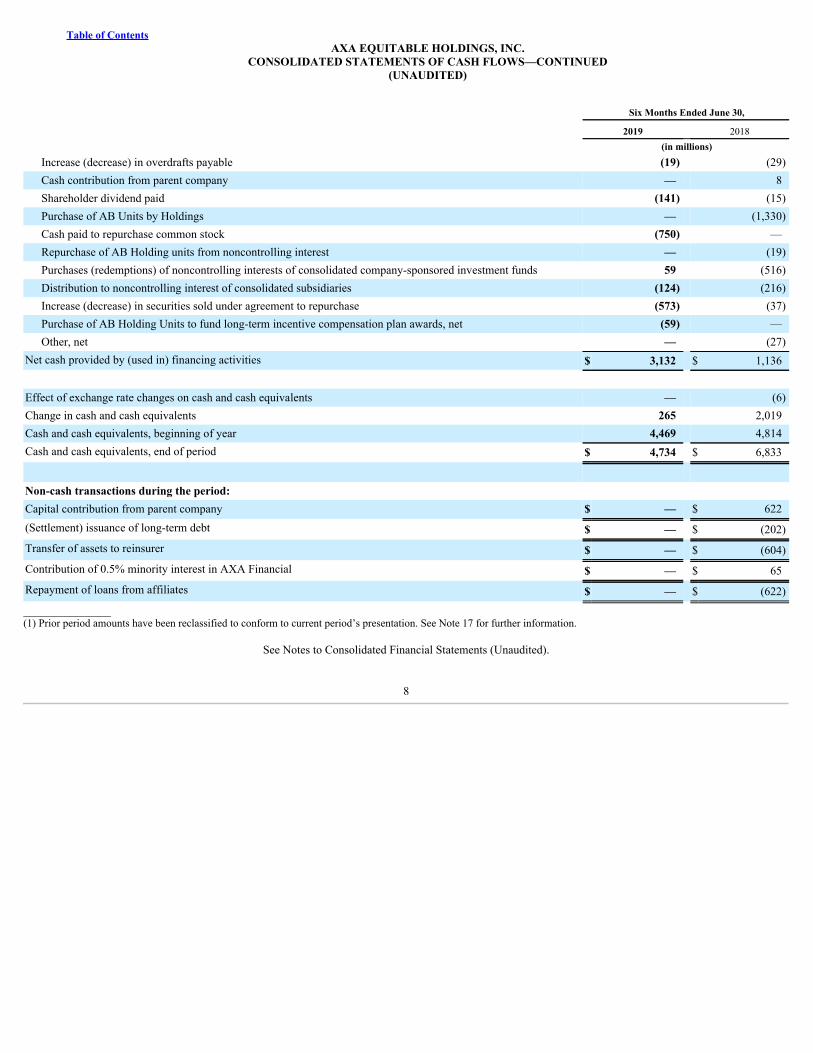
Table of ContentsAXA EQUITABLE HOLDINGS, INC.
CONSOLIDATED STATEMENTS OF CASH FLOWS—CONTINUED(UNAUDITED)
Six Months Ended June 30,
2019 2018 (in millions)
Increase (decrease) in overdrafts payable (19) (29)Cash contribution from parent company — 8Shareholder dividend paid (141) (15)Purchase of AB Units by Holdings — (1,330)Cash paid to repurchase common stock (750) —Repurchase of AB Holding units from noncontrolling interest — (19)Purchases (redemptions) of noncontrolling interests of consolidated company-sponsored investment funds 59 (516)Distribution to noncontrolling interest of consolidated subsidiaries (124) (216)Increase (decrease) in securities sold under agreement to repurchase (573) (37)Purchase of AB Holding Units to fund long-term incentive compensation plan awards, net (59) —Other, net — (27)
Net cash provided by (used in) financing activities $ 3,132 $ 1,136 Effect of exchange rate changes on cash and cash equivalents — (6)Change in cash and cash equivalents 265 2,019Cash and cash equivalents, beginning of year 4,469 4,814Cash and cash equivalents, end of period $ 4,734 $ 6,833
Non-cash transactions during the period: Capital contribution from parent company $ — $ 622(Settlement) issuance of long-term debt $ — $ (202)Transfer of assets to reinsurer $ — $ (604)Contribution of 0.5% minority interest in AXA Financial $ — $ 65Repayment of loans from affiliates $ — $ (622)_______________(1) Prior period amounts have been reclassified to conform to current period’s presentation. See Note 17 for further information.
See Notes to Consolidated Financial Statements (Unaudited).
8

Table of ContentsAXA EQUITABLE HOLDINGS, INC.
NOTES TO CONSOLIDATED FINANCIAL STATEMENTS(UNAUDITED)
1 ) ORGANIZATION
AXA Equitable Holdings, Inc. (“Holdings” and, collectively with its consolidated subsidiaries, the “Company”) is the holding company for a diversifiedfinancial services organization. As of June 30, 2019 and December 31, 2018 , AXA S.A. (“AXA”), a French holding company for the AXA Group,owned approximately 40% and 59% , respectively, of the outstanding common stock of Holdings. In connection with AXA’s secondary offering in June2019, the underwriters exercised their option to purchase additional shares, further reducing AXA’s ownership to approximately 39% as of July 8, 2019.
The Company conducts operations in four segments: Individual Retirement, Group Retirement, Investment Management and Research, and ProtectionSolutions. The Company’s management evaluates the performance of each of these segments independently.
• The Individual Retirement segment offers a diverse suite of variable annuity products which are primarily sold to affluent and high net worthindividuals saving for retirement or seeking retirement income.
• The Group Retirement segment offers tax-deferred investment and retirement services or products to plans sponsored by educational entities,municipalities and not-for-profit entities as well as small and medium-sized businesses.
• The Investment Management and Research segment provides diversified investment management, research and related solutions globally to abroad range of clients through three main client channels—Institutional, Retail and Private Wealth Management—and distributes its institutionalresearch products and solutions through Bernstein Research Services. The Investment Management and Research segment reflects the businessof AllianceBernstein Holding L.P. (“AB Holding”), AllianceBernstein L.P. (“ABLP”) and their subsidiaries (collectively, “AB”).
• The Protection Solutions segment includes the Company’s life insurance and group employee benefits businesses. The life insurance businessoffers a variety of variable universal life, indexed universal life and term life products to help affluent and high net worth individuals, as well assmall and medium-sized business owners, with their wealth protection, wealth transfer and corporate needs. Our group employee benefitsbusiness offers a suite of life, short- and long-term disability, dental and vision insurance products to small and medium-size businesses acrossthe United States.
The Company reports certain activities and items that are not included in our segments in Corporate and Other. Corporate and Other includes certain ofour financing and investment expenses. It also includes: the AXA Advisors broker-dealer business, closed block of life insurance (the “ClosedBlock”), run-off variable annuity reinsurance business, run-off group pension business, run-off health business, benefit plans for our employees, certainstrategic investments and certain unallocated items, including capital and related investments, interest expense and financing fees and corporate expense.
At both June 30, 2019 and December 31, 2018 , the Company’s economic interest in AB was approximately 65% . The general partner of AB,AllianceBernstein Corporation (the “General Partner”), is a wholly-owned subsidiary of the Company. Because the General Partner has the authority tomanage and control the business of AB, AB is consolidated in the Company’s financial statements for all periods.
2 ) SIGNIFICANT ACCOUNTING POLICIES
Basis of Presentation
The unaudited interim consolidated financial statements have been prepared in accordance with accounting principles generally accepted in the UnitedStates of America (“U.S. GAAP”) on a basis consistent with reporting interim financial information in accordance with instructions to Form 10-Q andArticle 10 of Regulation S-X of the Securities and Exchange Commission (“SEC”). Intercompany balances and transactions have been eliminated.
In the opinion of management, all adjustments necessary for a fair statement of the financial position and results of operations have been made. All suchadjustments are of a normal, recurring nature. Interim results are not necessarily
9

Table of ContentsAXA EQUITABLE HOLDINGS, INC.
NOTES TO CONSOLIDATED FINANCIAL STATEMENTS(UNAUDITED)
indicative of the results that may be expected for the full year. These financial statements should be read in conjunction with the Company’s AnnualReport on Form 10-K for the year ended December 31, 2018 .
The terms “ second quarter 2019 ” and “ second quarter 2018 ” refer to the three months ended June 30, 2019 and 2018 , respectively. The terms “ first sixmonths of 2019 ” and “ first six months of 2018 ” refer to the six months ended June 30, 2019 and 2018 , respectively.
Adoption of New Accounting Pronouncements
Description Effect on the Financial Statement or Other Significant MattersASU 2017-12: Derivatives and Hedging (Topic 815), as clarified and amended by ASU 2019-04: Codification Improvements to Topic 326, FinancialInstruments—Credit Losses; Topic 815, Derivatives and Hedging; and Topic 825, Financial Instruments
The amendments in these ASUs better align an entity’s riskmanagement activities and financial reporting for hedging relationshipsthrough changes to both the designation and measurement guidance forqualifying hedging relationships and the presentation of hedge results.
On January 1, 2019, the Company adopted the new hedging guidance. Adoptionof this guidance did not have a material impact on the Company’s consolidatedfinancial statements.
ASU 2017-08: Receivables—Nonrefundable Fees and Other Costs (Subtopic 310-20)
This ASU requires certain premiums on callable debt securities to beamortized to the earliest call date and is intended to better align interestincome recognition with the manner in which market participants pricethese instruments.
On January 1, 2019, the Company adopted the new guidance on accounting forcertain premiums on callable debt securities. As the Company’s existingaccounting practices aligned with the guidance in the ASU, adoption of the newstandard did not have a material impact on the Company’s consolidated financialstatements.
ASU 2016-02: Leases (Topic 842)
This ASU contains revised guidance to lease accounting that willrequire lessees to recognize on the balance sheet a “right-of-use” assetand a lease liability for virtually all lease arrangements, including thoseembedded in other contracts. Lessor accounting will remainsubstantially unchanged from the current model but has been updated toalign with certain changes made to the lessee model.
On January 1, 2019, the Company adopted the new leases standard using thesimplified modified retrospective transition method, as of the adoption date.Prior comparable periods will not be adjusted or presented under this method.We applied several practical expedients offered by ASC 842 upon adoption ofthis standard. These included continuing to account for existing leases based onjudgment made under legacy U.S. GAAP as it relates to determiningclassification of leases, unamortized initial direct costs and whether contracts areleases or contain leases. We also used the practical expedient to use hindsight indetermining lease terms (using knowledge and expectations as of the standard’sadoption date instead of the previous assumptions under legacy U.S. GAAP) andevaluated impairment of our right-of-use (“RoU”) assets in the transition period(using most up-to-date information.) Adoption of this standard resulted in therecognition, as of January 1, 2019, of additional RoU operating lease assets of$799 million reported in Other assets and operating lease liabilities of $1,024million reported in Other liabilities in accompanying consolidated balancesheets. The operating RoU assets recognized as of January 1, 2019 are net ofdeferred rent of $105 million and liabilities associated with previouslyrecognized impairments of $120 million. See Note 8 for additional information.
Future Adoption of New Accounting Pronouncements
Description Effective Date and Method of AdoptionEffect on the Financial Statement or Other
Significant MattersASU 2018-17: Consolidation (Topic 810): Targeted Improvements to Related Party Guidance for Variable Interest Entities
This ASU provides guidance requiring that indirectinterests held through related parties in commoncontrol arrangements be considered on aproportional basis for determining whether feespaid to decision makers and service providers arevariable interests.
Effective for fiscal years beginning afterDecember 15, 2019, and interim periods withinthose fiscal years. Early adoption is permitted. Allentities are required to apply the amendments inthis update retrospectively with a cumulative-effect adjustment to retained earnings at thebeginning of the earliest period presented.
Management currently is evaluating the impactthat adoption of this guidance will have on theCompany’s consolidated financial statements andrelated disclosures.
10
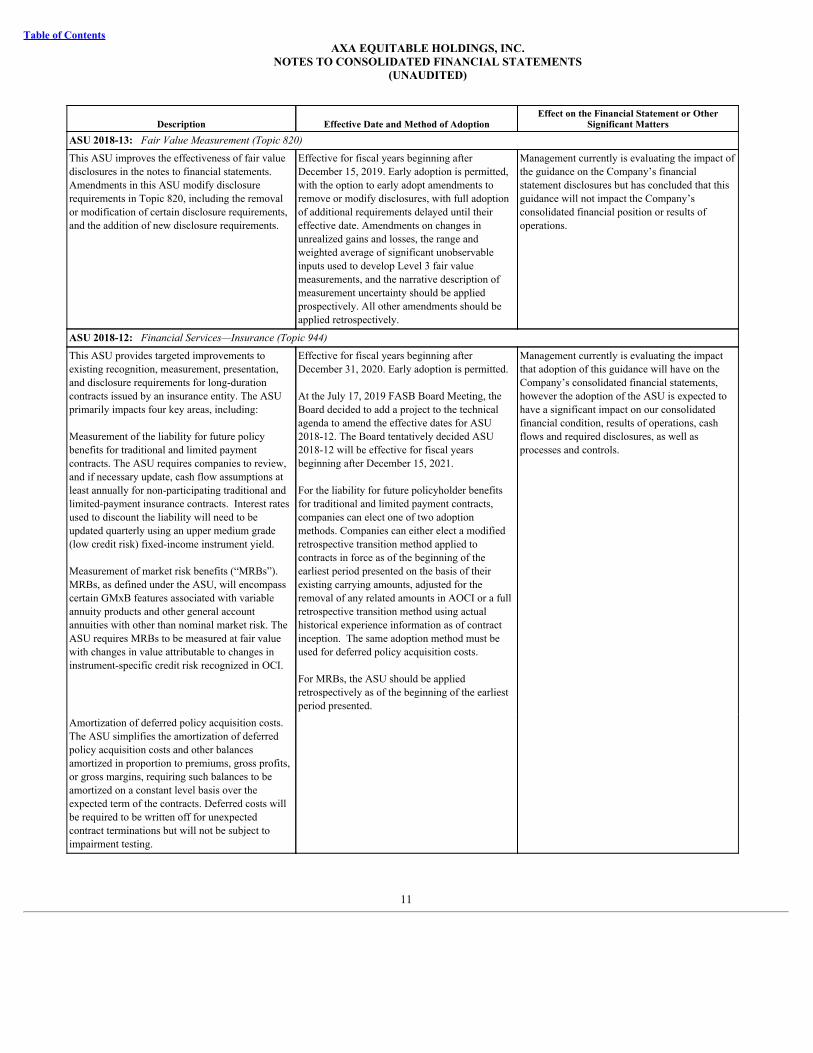
Table of ContentsAXA EQUITABLE HOLDINGS, INC.
NOTES TO CONSOLIDATED FINANCIAL STATEMENTS(UNAUDITED)
Description Effective Date and Method of AdoptionEffect on the Financial Statement or Other
Significant MattersASU 2018-13: Fair Value Measurement (Topic 820)
This ASU improves the effectiveness of fair valuedisclosures in the notes to financial statements.Amendments in this ASU modify disclosurerequirements in Topic 820, including the removalor modification of certain disclosure requirements,and the addition of new disclosure requirements.
Effective for fiscal years beginning afterDecember 15, 2019. Early adoption is permitted,with the option to early adopt amendments toremove or modify disclosures, with full adoptionof additional requirements delayed until theireffective date. Amendments on changes inunrealized gains and losses, the range andweighted average of significant unobservableinputs used to develop Level 3 fair valuemeasurements, and the narrative description ofmeasurement uncertainty should be appliedprospectively. All other amendments should beapplied retrospectively.
Management currently is evaluating the impact ofthe guidance on the Company’s financialstatement disclosures but has concluded that thisguidance will not impact the Company’sconsolidated financial position or results ofoperations.
ASU 2018-12: Financial Services—Insurance (Topic 944)
This ASU provides targeted improvements toexisting recognition, measurement, presentation,and disclosure requirements for long-durationcontracts issued by an insurance entity. The ASUprimarily impacts four key areas, including:
Measurement of the liability for future policybenefits for traditional and limited paymentcontracts. The ASU requires companies to review,and if necessary update, cash flow assumptions atleast annually for non-participating traditional andlimited-payment insurance contracts. Interest ratesused to discount the liability will need to beupdated quarterly using an upper medium grade(low credit risk) fixed-income instrument yield.
Measurement of market risk benefits (“MRBs”).MRBs, as defined under the ASU, will encompasscertain GMxB features associated with variableannuity products and other general accountannuities with other than nominal market risk. TheASU requires MRBs to be measured at fair valuewith changes in value attributable to changes ininstrument-specific credit risk recognized in OCI.
Effective for fiscal years beginning afterDecember 31, 2020. Early adoption is permitted.
At the July 17, 2019 FASB Board Meeting, theBoard decided to add a project to the technicalagenda to amend the effective dates for ASU2018-12. The Board tentatively decided ASU2018-12 will be effective for fiscal yearsbeginning after December 15, 2021.
For the liability for future policyholder benefitsfor traditional and limited payment contracts,companies can elect one of two adoptionmethods. Companies can either elect a modifiedretrospective transition method applied tocontracts in force as of the beginning of theearliest period presented on the basis of theirexisting carrying amounts, adjusted for theremoval of any related amounts in AOCI or a fullretrospective transition method using actualhistorical experience information as of contractinception. The same adoption method must beused for deferred policy acquisition costs.
For MRBs, the ASU should be appliedretrospectively as of the beginning of the earliestperiod presented.
Management currently is evaluating the impactthat adoption of this guidance will have on theCompany’s consolidated financial statements,however the adoption of the ASU is expected tohave a significant impact on our consolidatedfinancial condition, results of operations, cashflows and required disclosures, as well asprocesses and controls.
Amortization of deferred policy acquisition costs.The ASU simplifies the amortization of deferredpolicy acquisition costs and other balancesamortized in proportion to premiums, gross profits,or gross margins, requiring such balances to beamortized on a constant level basis over theexpected term of the contracts. Deferred costs willbe required to be written off for unexpectedcontract terminations but will not be subject toimpairment testing.
11
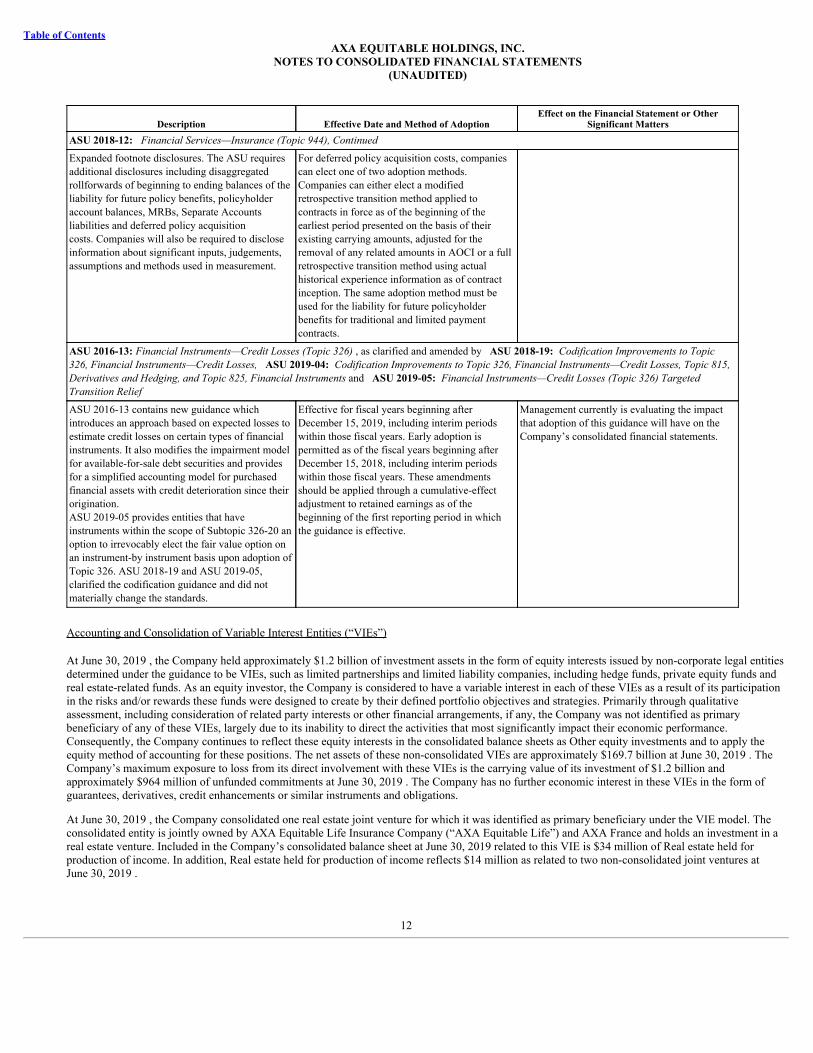
Table of ContentsAXA EQUITABLE HOLDINGS, INC.
NOTES TO CONSOLIDATED FINANCIAL STATEMENTS(UNAUDITED)
Description Effective Date and Method of AdoptionEffect on the Financial Statement or Other
Significant MattersASU 2018-12: Financial Services—Insurance (Topic 944), Continued
Expanded footnote disclosures. The ASU requiresadditional disclosures including disaggregatedrollforwards of beginning to ending balances of theliability for future policy benefits, policyholderaccount balances, MRBs, Separate Accountsliabilities and deferred policy acquisitioncosts. Companies will also be required to discloseinformation about significant inputs, judgements,assumptions and methods used in measurement.
For deferred policy acquisition costs, companiescan elect one of two adoption methods.Companies can either elect a modifiedretrospective transition method applied tocontracts in force as of the beginning of theearliest period presented on the basis of theirexisting carrying amounts, adjusted for theremoval of any related amounts in AOCI or a fullretrospective transition method using actualhistorical experience information as of contractinception. The same adoption method must beused for the liability for future policyholderbenefits for traditional and limited paymentcontracts.
ASU 2016-13: Financial Instruments—Credit Losses (Topic 326) , as clarified and amended by ASU 2018-19: Codification Improvements to Topic326, Financial Instruments—Credit Losses, ASU 2019-04: Codification Improvements to Topic 326, Financial Instruments—Credit Losses, Topic 815,Derivatives and Hedging, and Topic 825, Financial Instruments and ASU 2019-05: Financial Instruments—Credit Losses (Topic 326) TargetedTransition Relief
ASU 2016-13 contains new guidance whichintroduces an approach based on expected losses toestimate credit losses on certain types of financialinstruments. It also modifies the impairment modelfor available-for-sale debt securities and providesfor a simplified accounting model for purchasedfinancial assets with credit deterioration since theirorigination.ASU 2019-05 provides entities that haveinstruments within the scope of Subtopic 326-20 anoption to irrevocably elect the fair value option onan instrument-by instrument basis upon adoption ofTopic 326. ASU 2018-19 and ASU 2019-05,clarified the codification guidance and did notmaterially change the standards.
Effective for fiscal years beginning afterDecember 15, 2019, including interim periodswithin those fiscal years. Early adoption ispermitted as of the fiscal years beginning afterDecember 15, 2018, including interim periodswithin those fiscal years. These amendmentsshould be applied through a cumulative-effectadjustment to retained earnings as of thebeginning of the first reporting period in whichthe guidance is effective.
Management currently is evaluating the impactthat adoption of this guidance will have on theCompany’s consolidated financial statements.
Accounting and Consolidation of Variable Interest Entities (“VIEs”)
At June 30, 2019 , the Company held approximately $1.2 billion of investment assets in the form of equity interests issued by non-corporate legal entitiesdetermined under the guidance to be VIEs, such as limited partnerships and limited liability companies, including hedge funds, private equity funds andreal estate-related funds. As an equity investor, the Company is considered to have a variable interest in each of these VIEs as a result of its participationin the risks and/or rewards these funds were designed to create by their defined portfolio objectives and strategies. Primarily through qualitativeassessment, including consideration of related party interests or other financial arrangements, if any, the Company was not identified as primarybeneficiary of any of these VIEs, largely due to its inability to direct the activities that most significantly impact their economic performance.Consequently, the Company continues to reflect these equity interests in the consolidated balance sheets as Other equity investments and to apply theequity method of accounting for these positions. The net assets of these non-consolidated VIEs are approximately $169.7 billion at June 30, 2019 . TheCompany’s maximum exposure to loss from its direct involvement with these VIEs is the carrying value of its investment of $1.2 billion andapproximately $964 million of unfunded commitments at June 30, 2019 . The Company has no further economic interest in these VIEs in the form ofguarantees, derivatives, credit enhancements or similar instruments and obligations.
At June 30, 2019 , the Company consolidated one real estate joint venture for which it was identified as primary beneficiary under the VIE model. Theconsolidated entity is jointly owned by AXA Equitable Life Insurance Company (“AXA Equitable Life”) and AXA France and holds an investment in areal estate venture. Included in the Company’s consolidated balance sheet at June 30, 2019 related to this VIE is $34 million of Real estate held forproduction of income. In addition, Real estate held for production of income reflects $14 million as related to two non-consolidated joint ventures atJune 30, 2019 .
12

Table of ContentsAXA EQUITABLE HOLDINGS, INC.
NOTES TO CONSOLIDATED FINANCIAL STATEMENTS(UNAUDITED)
Included in the Company’s consolidated balance sheet at June 30, 2019 are assets of $327 million , liabilities of $18 million and redeemablenoncontrolling interest of $166 million associated with the consolidation of AB-sponsored investment funds under the VIE model. Also included in theCompany’s consolidated balance sheet at June 30, 2019 are assets of $182 million , liabilities of $18 million and redeemable noncontrolling interest of$46 million from consolidation of AB-sponsored investment funds under the Voting Interest Entity (“VOE”) model. Of the assets of these consolidatedfunds, $181 million are presented within Other invested assets and $2 million are presented in Cash and cash equivalents and $18 million liabilities ofthese consolidated funds are presented with Other liabilities in the Company’s consolidated balance sheet at June 30, 2019 . Ownership interests not heldby the Company relating to consolidated VIEs and VOEs are presented either as redeemable or non-redeemable noncontrolling interest, as appropriate.The Company is not required to provide financial support to these company-sponsored investment funds, and only the assets of such funds are available tosettle each fund’s own liabilities.
As of June 30, 2019 , the net assets of investment products sponsored by AB that are non-consolidated VIEs are approximately $100.9 billion , and theCompany’s maximum exposure to loss from its direct involvement with these VIEs is its investment of $13 million at June 30, 2019 . The Company hasno further commitments to or economic interest in these VIEs.
Assumption Updates and Model Changes
In 2018, the Company began conducting its annual review of the Company’s assumptions and models during the third quarter, consistent with industrypractice. The annual review encompasses assumptions underlying the valuation of unearned revenue liabilities, embedded derivatives for the Company’sinsurance business, liabilities for future policyholder benefits, deferred policy acquisition cost (“DAC”) and deferred sales inducement (“DSI”) assets.Accordingly, t here were no material assumption changes in the three or six months ended June 30, 2019 or 2018 .
Reclassification of DAC Capitalization
During the fourth quarter of 2018, the Company changed the presentation of the capitalization of DAC in the consolidated statements of income for allprior periods presented herein by netting the capitalized amounts within the applicable expense line items, such as Compensation and benefits,Commissions and distribution-related payments and Other operating costs and expenses. Previously, the Company had netted the capitalized amountswithin the Amortization of DAC. There was no impact on Net income (loss) or Comprehensive income (loss) from this reclassification.
The reclassification adjustments for the three and six months ended June 30, 2018 are presented in the table below. Capitalization of DAC reclassified toCompensation and benefits, Commissions and distribution-related payments, and Other operating costs and expenses reduced the amounts previouslyreported in those expense line items, while the capitalization of DAC reclassified from the Amortization of deferred policy acquisition costs line itemincreases that expense line item.
13
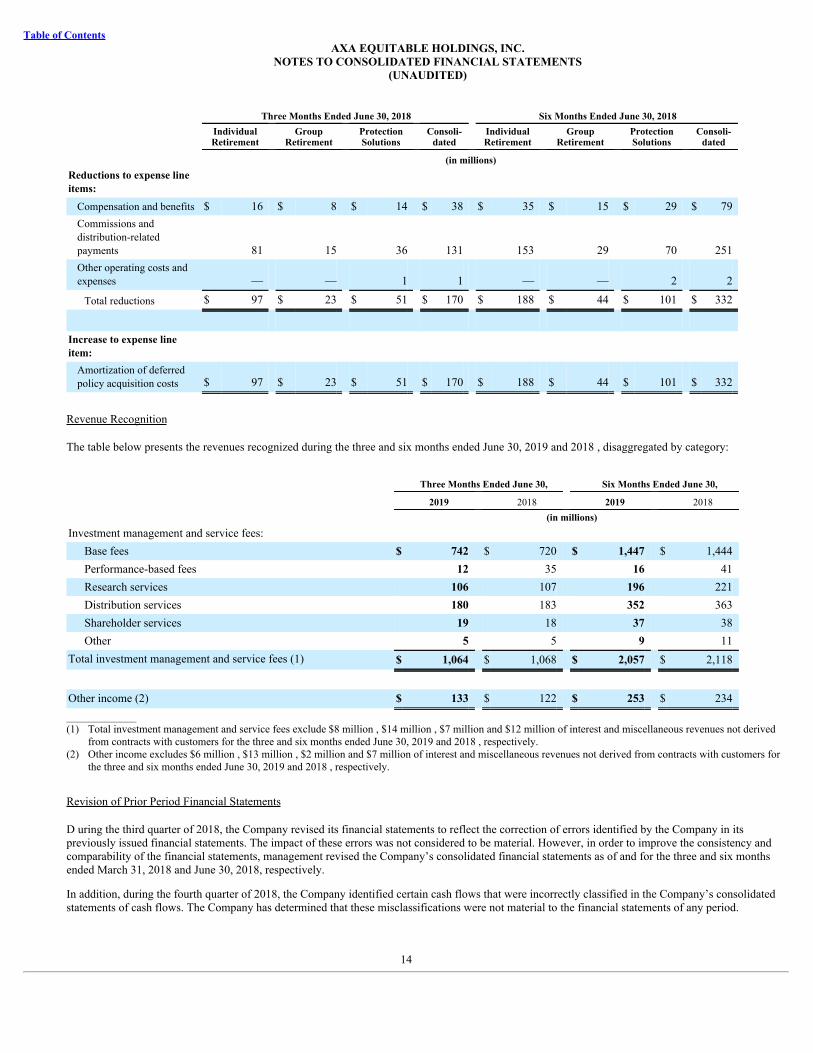
Table of ContentsAXA EQUITABLE HOLDINGS, INC.
NOTES TO CONSOLIDATED FINANCIAL STATEMENTS(UNAUDITED)
Three Months Ended June 30, 2018 Six Months Ended June 30, 2018
IndividualRetirement
GroupRetirement
ProtectionSolutions
Consoli-dated
IndividualRetirement
GroupRetirement
ProtectionSolutions
Consoli-dated
(in millions)Reductions to expense lineitems:
Compensation and benefits $ 16 $ 8 $ 14 $ 38 $ 35 $ 15 $ 29 $ 79Commissions anddistribution-relatedpayments 81 15 36 131 153 29 70 251Other operating costs andexpenses — — 1 1 — — 2 2
Total reductions $ 97 $ 23 $ 51 $ 170 $ 188 $ 44 $ 101 $ 332
Increase to expense lineitem:
Amortization of deferredpolicy acquisition costs $ 97 $ 23 $ 51 $ 170 $ 188 $ 44 $ 101 $ 332
Revenue Recognition
The table below presents the revenues recognized during the three and six months ended June 30, 2019 and 2018 , disaggregated by category:
Three Months Ended June 30, Six Months Ended June 30,
2019 2018 2019 2018 (in millions)
Investment management and service fees: Base fees $ 742 $ 720 $ 1,447 $ 1,444Performance-based fees 12 35 16 41Research services 106 107 196 221Distribution services 180 183 352 363Shareholder services 19 18 37 38Other 5 5 9 11
Total investment management and service fees (1) $ 1,064 $ 1,068 $ 2,057 $ 2,118
Other income (2) $ 133 $ 122 $ 253 $ 234_____________(1) Total investment management and service fees exclude $8 million , $14 million , $7 million and $12 million of interest and miscellaneous revenues not derived
from contracts with customers for the three and six months ended June 30, 2019 and 2018 , respectively.(2) Other income excludes $6 million , $13 million , $2 million and $7 million of interest and miscellaneous revenues not derived from contracts with customers for
the three and six months ended June 30, 2019 and 2018 , respectively.
Revision of Prior Period Financial Statements
D uring the third quarter of 2018, the Company revised its financial statements to reflect the correction of errors identified by the Company in itspreviously issued financial statements. The impact of these errors was not considered to be material. However, in order to improve the consistency andcomparability of the financial statements, management revised the Company’s consolidated financial statements as of and for the three and six monthsended March 31, 2018 and June 30, 2018, respectively.
In addition, during the fourth quarter of 2018, the Company identified certain cash flows that were incorrectly classified in the Company’s consolidatedstatements of cash flows. The Company has determined that these misclassifications were not material to the financial statements of any period.
14

Table of ContentsAXA EQUITABLE HOLDINGS, INC.
NOTES TO CONSOLIDATED FINANCIAL STATEMENTS(UNAUDITED)
The impact of items included in the revision tables included in Note 17 on the consolidated statement of cash flows for the six months ended June 30,2018 were corrected in the comparative consolidated statements of cash flows included herein . The items for the nine months ended September 30, 2018will be corrected in the Company’s comparative consolidated statements of cash flows to be included in the Form 10-Q filing as of and for the three andnine months ended September 30, 2019. See Note 17 for further information.
3 ) INVESTMENTS
Fixed Maturities
The following tables provide information relating to fixed maturities classified as available-for-sale (“AFS”).
Available-for-Sale Fixed Maturities by Classification
Amortized Cost Gross Unrealized
Gains Gross Unrealized
Losses Fair Value OTTI in AOCI (4) (in millions)June 30, 2019: Fixed Maturities:
Corporate (1) $ 39,787 $ 1,805 $ 64 $ 41,528 $ —U.S. Treasury, government and agency 12,648 1,108 39 13,717 —States and political subdivisions 495 70 — 565 —Foreign governments 467 36 5 498 —Residential mortgage-backed (2) 208 13 — 221 —Asset-backed (3) 617 3 2 618 2Redeemable preferred stock 419 10 4 425 —
Total at June 30, 2019 $ 54,641 $ 3,045 $ 114 $ 57,572 $ 2
December 31, 2018: Fixed Maturities:
Corporate (1) $ 30,572 $ 406 $ 800 $ 30,178 $ —U.S. Treasury, government and agency 14,004 295 470 13,829 —States and political subdivisions 415 47 1 461 —Foreign governments 524 19 13 530 —Residential mortgage-backed (2) 225 10 1 234 —Asset-backed (3) 612 1 12 601 2Redeemable preferred stock 449 15 18 446 —
Total at December 31, 2018 $ 46,801 $ 793 $ 1,315 $ 46,279 $ 2______________(1) Corporate fixed maturities include both public and private issues.(2) Includes publicly traded agency pass-through securities and collateralized obligations.(3) Includes credit-tranched securities collateralized by sub-prime mortgages and other asset types and credit tenant loans.(4) Amounts represent OTTI losses in AOCI, which were not included in Net income (loss).
The contractual maturities of AFS fixed maturities at June 30, 2019 are shown in the table below. Bonds not due at a single maturity date have beenincluded in the table in the final year of maturity. Actual maturities may differ from contractual maturities because borrowers may have the right to call orprepay obligations with or without call or prepayment penalties.
15

Table of ContentsAXA EQUITABLE HOLDINGS, INC.
NOTES TO CONSOLIDATED FINANCIAL STATEMENTS(UNAUDITED)
Contractual Maturities of Available-for-Sale Fixed Maturities
Amortized Cost Fair Value (in millions)June 30, 2019: Due in one year or less $ 2,881 $ 2,899Due in years two through five 14,384 14,765Due in years six through ten 19,124 20,179Due after ten years 17,008 18,465
Subtotal 53,397 56,308Residential mortgage-backed 208 221Asset-backed 617 618Redeemable preferred stock 419 425Total at June 30, 2019 $ 54,641 $ 57,572
The following table shows proceeds from sales, gross gains (losses) from sales for AFS fixed maturities during the three and six months ended June 30,2019 and 2018 .
Proceeds and Gains (Losses) on Sales for Available-for-Sale Fixed Maturities
Three Months Ended June 30, Six Months Ended June 30,
2019 2018 2019 2018 (in millions)Proceeds from sales $ 1,614 $ 1,145 $ 3,064 $ 5,025Gross gains on sales $ 10 $ 17 $ 18 $ 172Gross losses on sales $ (7) $ (36) $ (25) $ (88)
The following table sets forth the amount of credit loss impairments on AFS fixed maturities held by the Company at the dates indicated and thecorresponding changes in such amounts.
Available-for-Sale Fixed Maturities - Credit Loss Impairments
Three Months Ended June 30, Six Months Ended June 30,
2019 2018 2019 2018 (in millions)Balances, beginning of period $ (26) $ (18) $ (58) $ (18)Previously recognized impairments on securities that matured, paid,prepaid or sold 1 1 33 1
Recognized impairments on securities impaired to fair value thisperiod (1) — — — —
Impairments recognized this period on securities not previouslyimpaired — — — —
Additional impairments this period on securities previously impaired — — — —Increases due to passage of time on previously recorded credit losses — — — —Accretion of previously recognized impairments due to increases inexpected cash flows — — — —
Balances at June 30, $ (25) $ (17) $ (25) $ (17)______________(1) Represents circumstances where the Company determined in the current period that it intends to sell the security, or it is more likely than not that it will be
required to sell the security before recovery of the security’s amortized cost.
Net unrealized investment gains (losses) on fixed maturities classified as AFS are included in the consolidated balance sheets as a component of AOCI.
16

Table of ContentsAXA EQUITABLE HOLDINGS, INC.
NOTES TO CONSOLIDATED FINANCIAL STATEMENTS(UNAUDITED)
Changes in net unrealized investment gains (losses) recognized in AOCI include reclassification adjustments to reflect amounts realized in Net income(loss) for the current period that had been part of OCI in earlier periods. The tables that follow below present a roll-forward of net unrealized investmentgains (losses) recognized in AOCI:
Net Unrealized Gains (Losses) on Available-for-Sale Fixed Maturities
Net UnrealizedGains (Losses) on
Investments DAC Policyholders’
Liabilities
Deferred Income
Tax Asset (Liability)
AOCI Gain(Loss) Related toNet Unrealized
InvestmentGains (Losses)
(in millions)Balances at April 1, 2019 $ 1,187 $ (601) $ 12 $ (126) $ 472Net investment gains (losses) arising duringthe period 1,746 — — — 1,746Reclassification adjustment:
Included in Net income (loss) (4) — — — (4)Excluded from Net income (loss) (1) — — — — —
Impact of net unrealized investment gains(losses) on:
DAC — 49 — — 49Deferred income taxes — — — (355) (355)Policyholders’ liabilities — — (100) — (100)
Net unrealized investment gains (losses)excluding OTTI losses 2,929 (552) (88) (481) 1,808Net unrealized investment gains (losses) withOTTI losses 2 — — — 2Balances at June 30, 2019 $ 2,931 $ (552) $ (88) $ (481) $ 1,810
Balances at April 1, 2018 $ 216 $ (17) $ (128) $ (144) $ (73)Net investment gains (losses) arising duringthe period (503) — — — (503)Reclassification adjustment:
Included in Net income (loss) 19 — — — 19Excluded from Net income (loss) (1) — — — — —
Impact of net unrealized investment gains(losses) on:
DAC — 104 — — 104Deferred income taxes — — — 78 78Policyholders’ liabilities — — 8 — 8
Net unrealized investment gains (losses)excluding OTTI losses (268) 87 (120) (66) (367)Net unrealized investment gains (losses) withOTTI losses 2 — 1 (1) 2Balances at June 30, 2018 $ (266) $ 87 $ (119) $ (67) $ (365)______________(1) Represents “transfers out” related to the portion of OTTI losses during the period that were not recognized in Net income (loss) for securities with no prior OTTI
losses.
17

Table of ContentsAXA EQUITABLE HOLDINGS, INC.
NOTES TO CONSOLIDATED FINANCIAL STATEMENTS(UNAUDITED)
Net UnrealizedGains (Losses) on
Investments DAC Policyholders’
Liabilities
Deferred Income
Tax Asset (Liability)
AOCI Gain(Loss) Related toNet Unrealized
InvestmentGains (Losses)
(in millions)Balances at January 1, 2019 $ (522) $ 100 $ (73) $ 104 $ (391)Net investment gains (losses) arising duringthe period 3,456 — — — 3,456Reclassification adjustment:
Included in Net income (loss) (5) — — — (5)Excluded from Net income (loss) (1) — — — — —
Impact of net unrealized investment gains(losses) on:
DAC — (652) — — (652)Deferred income taxes — — — (585) (585)Policyholders’ liabilities — — (15) — (15)
Net unrealized investment gains (losses)excluding OTTI losses 2,929 (552) (88) (481) 1,808Net unrealized investment gains (losses) withOTTI losses 2 — — — 2Balances at June 30, 2019 $ 2,931 $ (552) $ (88) $ (481) $ 1,810
Balances at January 1, 2018 $ 1,871 $ (358) $ (238) $ (397) $ 878Net investment gains (losses) arising duringthe period (2,049) — — — (2,049)Reclassification adjustment:
Included in Net income (loss) (90) — — — (90)Excluded from Net income (loss) (1) — — — — —
Impact of net unrealized investment gains(losses) on:
DAC — 445 — — 445Deferred income taxes — — — 331 331Policyholders’ liabilities — — 118 — 118
Net unrealized investment gains (losses)excluding OTTI losses (268) 87 (120) (66) (367)Net unrealized investment gains (losses) withOTTI losses 2 — 1 (1) 2Balances at June 30, 2018 $ (266) $ 87 $ (119) $ (67) $ (365)______________(1) Represents “transfers out” related to the portion of OTTI losses during the period that were not recognized in Net income (loss) for securities with no prior OTTI
losses.
The following tables disclose the fair values and gross unrealized losses of the 331 securities at June 30, 2019 and the 1,700 securities at December 31,2018 that are not deemed to be other-than-temporarily impaired, aggregated by investment category and length of time that individual securities havebeen in a continuous unrealized loss position for the specified periods at the dates indicated:
18

Table of ContentsAXA EQUITABLE HOLDINGS, INC.
NOTES TO CONSOLIDATED FINANCIAL STATEMENTS(UNAUDITED)
Continuous Gross Unrealized Losses for Available-for-Sale Fixed Maturities
Less Than 12 Months 12 Months or Longer Total
Fair Value
GrossUnrealized
Losses Fair Value
GrossUnrealized
Losses Fair Value
GrossUnrealized
Losses (in millions)June 30, 2019: Fixed Maturities:
Corporate $ 331 $ 4 $ 1,884 $ 60 $ 2,215 $ 64U.S. Treasury, government and agency — — 2,432 39 2,432 39Foreign governments — — 47 5 47 5Residential mortgage-backed — — — — — —Asset-backed 295 1 42 1 337 2Redeemable preferred stock 120 2 21 2 141 4
Total at June 30, 2019 $ 746 $ 7 $ 4,426 $ 107 $ 5,172 $ 114
December 31, 2018: Fixed Maturities:
Corporate $ 8,964 $ 313 $ 8,244 $ 487 $ 17,208 $ 800U.S. Treasury, government and agency 1,077 53 4,306 417 5,383 470States and political subdivisions — — 19 1 19 1Foreign governments 109 3 76 10 185 13Residential mortgage-backed — — 29 1 29 1Asset-backed 563 11 13 1 576 12Redeemable preferred stock 165 13 33 5 198 18
Total at December 31, 2018 $ 10,878 $ 393 $ 12,720 $ 922 $ 23,598 $ 1,315
The Company’s investments in fixed maturities do not include concentrations of credit risk of any single issuer greater than 10% of the consolidatedequity of the Company, other than securities of the U.S. government, U.S. government agencies, and certain securities guaranteed by the U.S.government. The Company maintains a diversified portfolio of corporate securities across industries and issuers and does not have exposure to any singleissuer in excess of 0.6% of total corporate securities. The largest exposures to a single issuer of corporate securities held at June 30, 2019 andDecember 31, 2018 were $267 million and $226 million , respectively, representing 1.6% and 1.5% of the consolidated equity of the Company.
Corporate high yield securities, consisting primarily of public high yield bonds, are classified as other than investment grade by the various ratingagencies, i.e., a rating below Baa3/BBB- or the National Association of Insurance Commissioners (“NAIC”) designation of 3 (medium investment grade),4 or 5 (below investment grade) or 6 (in or near default). At June 30, 2019 and December 31, 2018 , respectively, approximately $1,349 million and$1,268 million , or 2.5% and 2.7% , of the $54,641 million and $46,801 million aggregate amortized cost of fixed maturities held by the Company wereconsidered to be other than investment grade. These securities had unrealized losses of $17 million and $31 million at June 30, 2019 and December 31,2018 , respectively.
At June 30, 2019 and December 31, 2018 , respectively, the $107 million and $922 million of gross unrealized losses of twelve months or more wereconcentrated in corporate and U.S. Treasury, government and agency securities. In accordance with the policy described in Note 2 , the Companyconcluded that an adjustment to income for OTTI for these securities was not warranted at either June 30, 2019 or 2018 . At June 30, 2019 andDecember 31, 2018 , the Company did not intend to sell the securities nor will it likely be required to dispose of the securities before the anticipatedrecovery of their remaining amortized cost basis.
At June 30, 2019 and December 31, 2018 , the fair value of the Company’s trading account securities was $9,646 million and $16,017 million ,respectively. At June 30, 2019 and December 31, 2018 , trading account securities
19
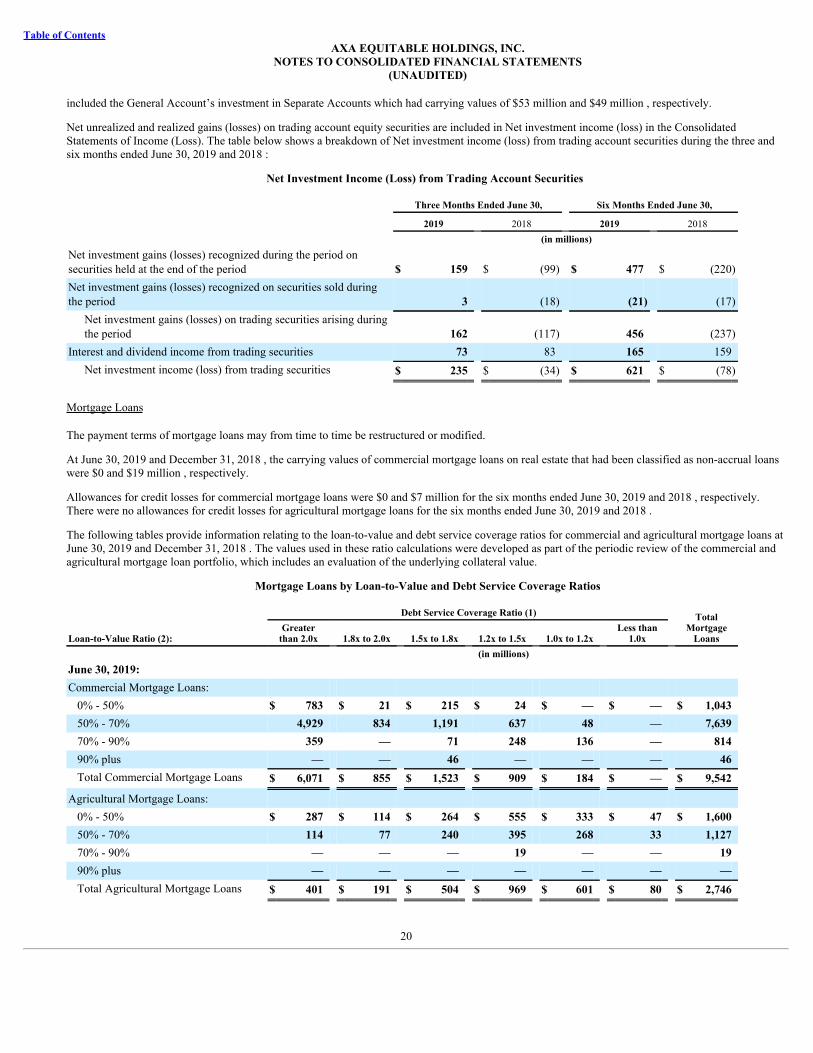
Table of ContentsAXA EQUITABLE HOLDINGS, INC.
NOTES TO CONSOLIDATED FINANCIAL STATEMENTS(UNAUDITED)
included the General Account’s investment in Separate Accounts which had carrying values of $53 million and $49 million , respectively.
Net unrealized and realized gains (losses) on trading account equity securities are included in Net investment income (loss) in the ConsolidatedStatements of Income (Loss). The table below shows a breakdown of Net investment income (loss) from trading account securities during the three andsix months ended June 30, 2019 and 2018 :
Net Investment Income (Loss) from Trading Account Securities
Three Months Ended June 30, Six Months Ended June 30,
2019 2018 2019 2018 (in millions)Net investment gains (losses) recognized during the period onsecurities held at the end of the period $ 159 $ (99) $ 477 $ (220)Net investment gains (losses) recognized on securities sold duringthe period 3 (18) (21) (17)
Net investment gains (losses) on trading securities arising duringthe period 162 (117) 456 (237)
Interest and dividend income from trading securities 73 83 165 159Net investment income (loss) from trading securities $ 235 $ (34) $ 621 $ (78)
Mortgage Loans
The payment terms of mortgage loans may from time to time be restructured or modified.
At June 30, 2019 and December 31, 2018 , the carrying values of commercial mortgage loans on real estate that had been classified as non-accrual loanswere $0 and $19 million , respectively.
Allowances for credit losses for commercial mortgage loans were $0 and $7 million for the six months ended June 30, 2019 and 2018 , respectively.There were no allowances for credit losses for agricultural mortgage loans for the six months ended June 30, 2019 and 2018 .
The following tables provide information relating to the loan-to-value and debt service coverage ratios for commercial and agricultural mortgage loans atJune 30, 2019 and December 31, 2018 . The values used in these ratio calculations were developed as part of the periodic review of the commercial andagricultural mortgage loan portfolio, which includes an evaluation of the underlying collateral value.
Mortgage Loans by Loan-to-Value and Debt Service Coverage Ratios
Debt Service Coverage Ratio (1) TotalMortgage
LoansLoan-to-Value Ratio (2):Greater
than 2.0x 1.8x to 2.0x 1.5x to 1.8x 1.2x to 1.5x 1.0x to 1.2x Less than
1.0x (in millions)June 30, 2019: Commercial Mortgage Loans:
0% - 50% $ 783 $ 21 $ 215 $ 24 $ — $ — $ 1,04350% - 70% 4,929 834 1,191 637 48 — 7,63970% - 90% 359 — 71 248 136 — 81490% plus — — 46 — — — 46Total Commercial Mortgage Loans $ 6,071 $ 855 $ 1,523 $ 909 $ 184 $ — $ 9,542
Agricultural Mortgage Loans: 0% - 50% $ 287 $ 114 $ 264 $ 555 $ 333 $ 47 $ 1,60050% - 70% 114 77 240 395 268 33 1,12770% - 90% — — — 19 — — 1990% plus — — — — — — —Total Agricultural Mortgage Loans $ 401 $ 191 $ 504 $ 969 $ 601 $ 80 $ 2,746
20
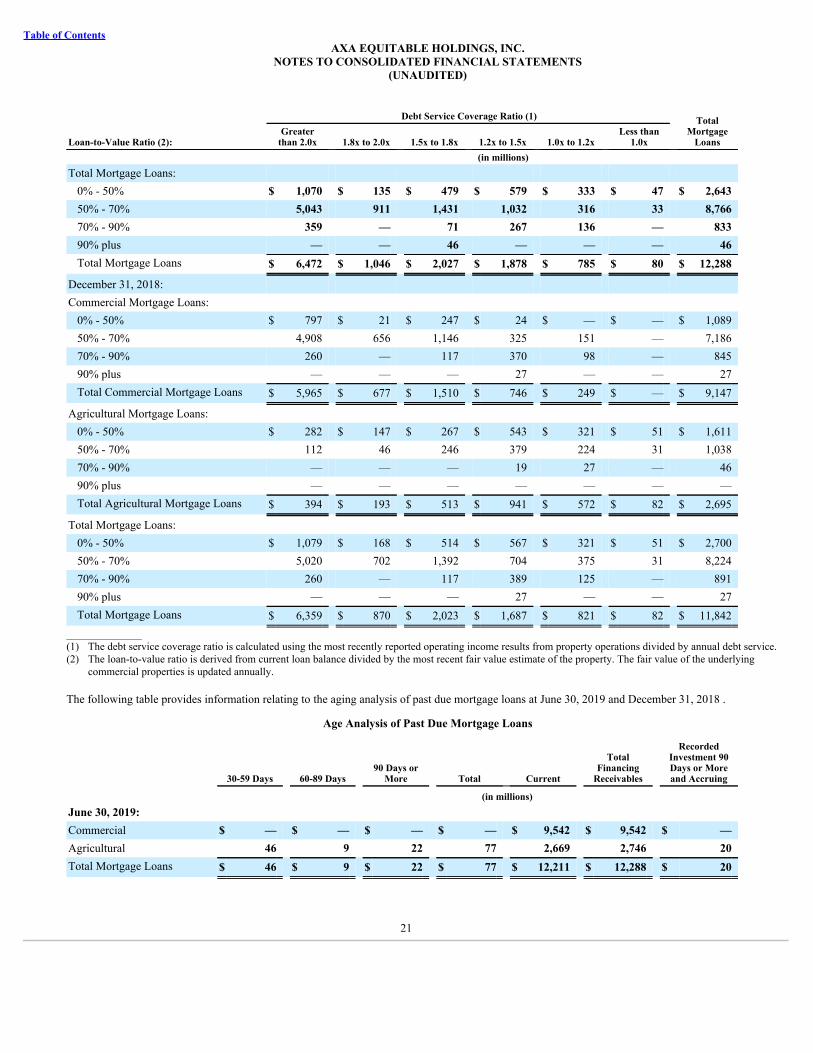
Table of ContentsAXA EQUITABLE HOLDINGS, INC.
NOTES TO CONSOLIDATED FINANCIAL STATEMENTS(UNAUDITED)
Debt Service Coverage Ratio (1) TotalMortgage
LoansLoan-to-Value Ratio (2):Greater
than 2.0x 1.8x to 2.0x 1.5x to 1.8x 1.2x to 1.5x 1.0x to 1.2x Less than
1.0x (in millions)Total Mortgage Loans:
0% - 50% $ 1,070 $ 135 $ 479 $ 579 $ 333 $ 47 $ 2,64350% - 70% 5,043 911 1,431 1,032 316 33 8,76670% - 90% 359 — 71 267 136 — 83390% plus — — 46 — — — 46Total Mortgage Loans $ 6,472 $ 1,046 $ 2,027 $ 1,878 $ 785 $ 80 $ 12,288
December 31, 2018: Commercial Mortgage Loans:
0% - 50% $ 797 $ 21 $ 247 $ 24 $ — $ — $ 1,08950% - 70% 4,908 656 1,146 325 151 — 7,18670% - 90% 260 — 117 370 98 — 84590% plus — — — 27 — — 27Total Commercial Mortgage Loans $ 5,965 $ 677 $ 1,510 $ 746 $ 249 $ — $ 9,147
Agricultural Mortgage Loans: 0% - 50% $ 282 $ 147 $ 267 $ 543 $ 321 $ 51 $ 1,61150% - 70% 112 46 246 379 224 31 1,03870% - 90% — — — 19 27 — 4690% plus — — — — — — —Total Agricultural Mortgage Loans $ 394 $ 193 $ 513 $ 941 $ 572 $ 82 $ 2,695
Total Mortgage Loans: 0% - 50% $ 1,079 $ 168 $ 514 $ 567 $ 321 $ 51 $ 2,70050% - 70% 5,020 702 1,392 704 375 31 8,22470% - 90% 260 — 117 389 125 — 89190% plus — — — 27 — — 27Total Mortgage Loans $ 6,359 $ 870 $ 2,023 $ 1,687 $ 821 $ 82 $ 11,842
______________(1) The debt service coverage ratio is calculated using the most recently reported operating income results from property operations divided by annual debt service.(2) The loan-to-value ratio is derived from current loan balance divided by the most recent fair value estimate of the property. The fair value of the underlying
commercial properties is updated annually.
The following table provides information relating to the aging analysis of past due mortgage loans at June 30, 2019 and December 31, 2018 .
Age Analysis of Past Due Mortgage Loans
30-59 Days 60-89 Days 90 Days or
More Total Current
TotalFinancing
Receivables
RecordedInvestment 90Days or Moreand Accruing
(in millions) June 30, 2019: Commercial $ — $ — $ — $ — $ 9,542 $ 9,542 $ —Agricultural 46 9 22 77 2,669 2,746 20Total Mortgage Loans $ 46 $ 9 $ 22 $ 77 $ 12,211 $ 12,288 $ 20
21
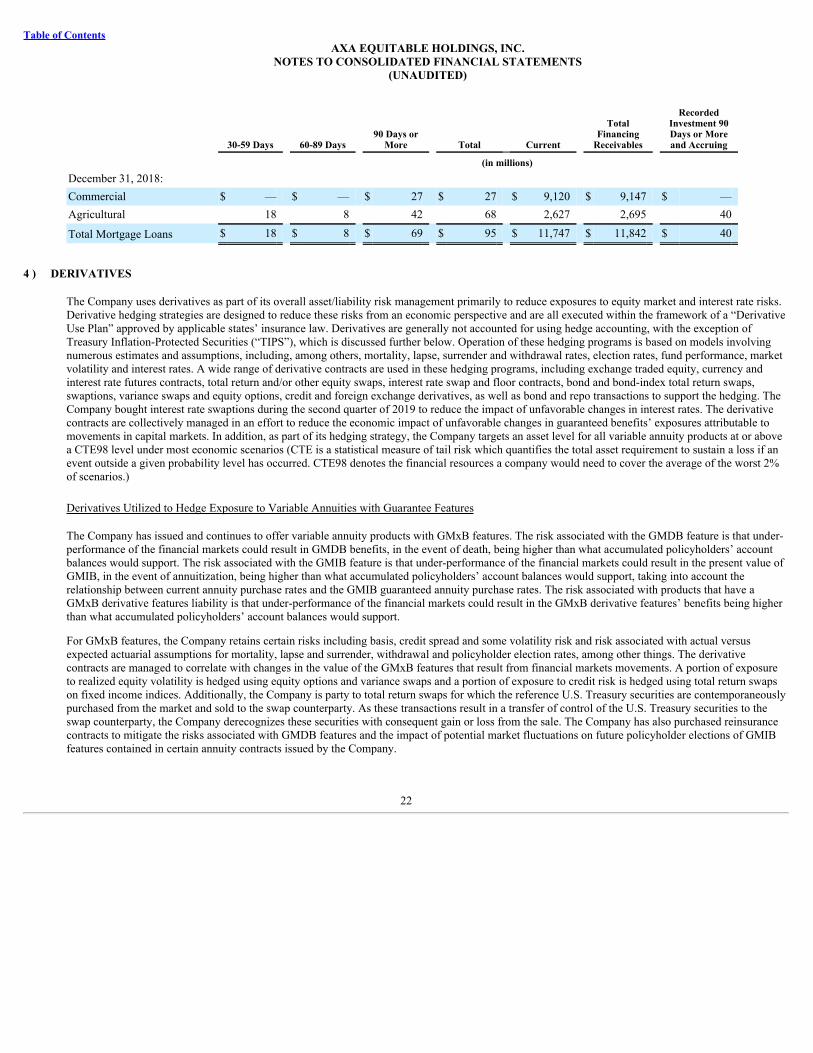
Table of ContentsAXA EQUITABLE HOLDINGS, INC.
NOTES TO CONSOLIDATED FINANCIAL STATEMENTS(UNAUDITED)
30-59 Days 60-89 Days 90 Days or
More Total Current
TotalFinancing
Receivables
RecordedInvestment 90Days or Moreand Accruing
(in millions) December 31, 2018: Commercial $ — $ — $ 27 $ 27 $ 9,120 $ 9,147 $ —Agricultural 18 8 42 68 2,627 2,695 40
Total Mortgage Loans $ 18 $ 8 $ 69 $ 95 $ 11,747 $ 11,842 $ 40
4 ) DERIVATIVES
The Company uses derivatives as part of its overall asset/liability risk management primarily to reduce exposures to equity market and interest rate risks.Derivative hedging strategies are designed to reduce these risks from an economic perspective and are all executed within the framework of a “DerivativeUse Plan” approved by applicable states’ insurance law. Derivatives are generally not accounted for using hedge accounting, with the exception ofTreasury Inflation-Protected Securities (“TIPS”), which is discussed further below. Operation of these hedging programs is based on models involvingnumerous estimates and assumptions, including, among others, mortality, lapse, surrender and withdrawal rates, election rates, fund performance, marketvolatility and interest rates. A wide range of derivative contracts are used in these hedging programs, including exchange traded equity, currency andinterest rate futures contracts, total return and/or other equity swaps, interest rate swap and floor contracts, bond and bond-index total return swaps,swaptions, variance swaps and equity options, credit and foreign exchange derivatives, as well as bond and repo transactions to support the hedging. TheCompany bought interest rate swaptions during the second quarter of 2019 to reduce the impact of unfavorable changes in interest rates. The derivativecontracts are collectively managed in an effort to reduce the economic impact of unfavorable changes in guaranteed benefits’ exposures attributable tomovements in capital markets. In addition, as part of its hedging strategy, the Company targets an asset level for all variable annuity products at or abovea CTE98 level under most economic scenarios (CTE is a statistical measure of tail risk which quantifies the total asset requirement to sustain a loss if anevent outside a given probability level has occurred. CTE98 denotes the financial resources a company would need to cover the average of the worst 2%of scenarios.)
Derivatives Utilized to Hedge Exposure to Variable Annuities with Guarantee Features
The Company has issued and continues to offer variable annuity products with GMxB features. The risk associated with the GMDB feature is that under-performance of the financial markets could result in GMDB benefits, in the event of death, being higher than what accumulated policyholders’ accountbalances would support. The risk associated with the GMIB feature is that under-performance of the financial markets could result in the present value ofGMIB, in the event of annuitization, being higher than what accumulated policyholders’ account balances would support, taking into account therelationship between current annuity purchase rates and the GMIB guaranteed annuity purchase rates. The risk associated with products that have aGMxB derivative features liability is that under-performance of the financial markets could result in the GMxB derivative features’ benefits being higherthan what accumulated policyholders’ account balances would support.
For GMxB features, the Company retains certain risks including basis, credit spread and some volatility risk and risk associated with actual versusexpected actuarial assumptions for mortality, lapse and surrender, withdrawal and policyholder election rates, among other things. The derivativecontracts are managed to correlate with changes in the value of the GMxB features that result from financial markets movements. A portion of exposureto realized equity volatility is hedged using equity options and variance swaps and a portion of exposure to credit risk is hedged using total return swapson fixed income indices. Additionally, the Company is party to total return swaps for which the reference U.S. Treasury securities are contemporaneouslypurchased from the market and sold to the swap counterparty. As these transactions result in a transfer of control of the U.S. Treasury securities to theswap counterparty, the Company derecognizes these securities with consequent gain or loss from the sale. The Company has also purchased reinsurancecontracts to mitigate the risks associated with GMDB features and the impact of potential market fluctuations on future policyholder elections of GMIBfeatures contained in certain annuity contracts issued by the Company.
22

Table of ContentsAXA EQUITABLE HOLDINGS, INC.
NOTES TO CONSOLIDATED FINANCIAL STATEMENTS(UNAUDITED)
Derivatives Utilized to Hedge Crediting Rate Exposure on SCS, SIO, MSO and IUL Products/Investment Options
The Company hedges crediting rates in the Structured Capital Strategies (“SCS”) variable annuity, Structured Investment Option in the EQUI-VESTvariable annuity series (“SIO”), Market Stabilizer Option (“MSO”) in the variable life insurance products and Indexed Universal Life (“IUL”) insuranceproducts. These products permit the contract owner to participate in the performance of an index, ETF or commodity price movement up to a cap for a setperiod of time. They also contain a protection feature, in which the Company will absorb, up to a certain percentage, the loss of value in an index, ETF orcommodity price, which varies by product segment.
In order to support the returns associated with these features, the Company enters into derivative contracts whose payouts, in combination with fixedincome investments, emulate those of the index, ETF or commodity price, subject to caps and buffers, thereby substantially reducing any exposure tomarket-related earnings volatility.
Derivatives Used to Hedge Equity Market Risks Associated with the General Account’s Seed Money Investments in Retail Mutual Funds
The Company’s General Account seed money investments in retail mutual funds expose us to market risk, including equity market risk which is partiallyhedged through equity-index futures contracts to minimize such risk.
Derivatives Used for General Account Investment Portfolio
The Company maintains a strategy in its General Account investment portfolio to replicate the credit exposure of fixed maturity securities otherwisepermissible for investment under its investment guidelines through the sale of credit default swaps (“CDSs”). Under the terms of these swaps, theCompany receives quarterly fixed premiums that, together with any initial amount paid or received at trade inception, replicate the credit spread otherwisecurrently obtainable by purchasing the referenced entity’s bonds of similar maturity. These credit derivatives generally have terms of five years or lessand are recorded at fair value with changes in fair value, including the yield component that emerges from initial amounts paid or received, reported inNet derivative gains (losses).
The Company manages its credit exposure taking into consideration both cash and derivatives-based positions and selects the reference entities in itsreplicated credit exposures in a manner consistent with its selection of fixed maturities. In addition, the Company generally transacts the sale of CDSs insingle name reference entities of investment grade credit quality and with counterparties subject to collateral posting requirements. If there is an event ofdefault by the reference entity or other such credit event as defined under the terms of the swap contract, the Company is obligated to perform under thecredit derivative and, at the counterparty’s option, either pay the referenced amount of the contract less an auction-determined recovery amount or pay thereferenced amount of the contract and receive in return the defaulted or similar security of the reference entity for recovery by sale at the contractsettlement auction.
To date, there have been no events of default or circumstances indicative of a deterioration in the credit quality of the named referenced entities to requireor suggest that the Company will have to perform under these CDSs. The maximum potential amount of future payments the Company could be requiredto make under these credit derivatives is limited to the par value of the referenced securities which is the U.S. dollar or euro-equivalent of the derivative’snotional amount. The Standard North American CDS Contract (“SNAC”) or Standard European Corporate Contract (“STEC”) under which the Companyexecutes these CDS sales transactions does not contain recourse provisions for recovery of amounts paid under the credit derivative.
The Company purchased 30-year TIPS and other sovereign bonds, both inflation linked and non-inflation linked, as General Account investments andenters into asset or cross-currency basis swaps, to result in payment of the given bond’s coupons and principal at maturity in the bond’s specified currencyto the swap counterparty in return for fixed dollar amounts. These swaps, when considered in combination with the bonds, together result in a net positionthat is intended to replicate a dollar-denominated fixed-coupon cash bond with a yield higher than a term-equivalent U.S. Treasury bond.
In June 2019, the Company terminated a program to mitigate its duration gap using total return swaps for which the reference U.S. Treasury securities aresold to the swap counterparty under arrangements economically similar to repurchase agreements. The Company terminated $3,881 million , in notional,of total return swaps reported in other invested assets in the Company’s balance sheet. The terminated total return swaps had a gain of $121 million .
23
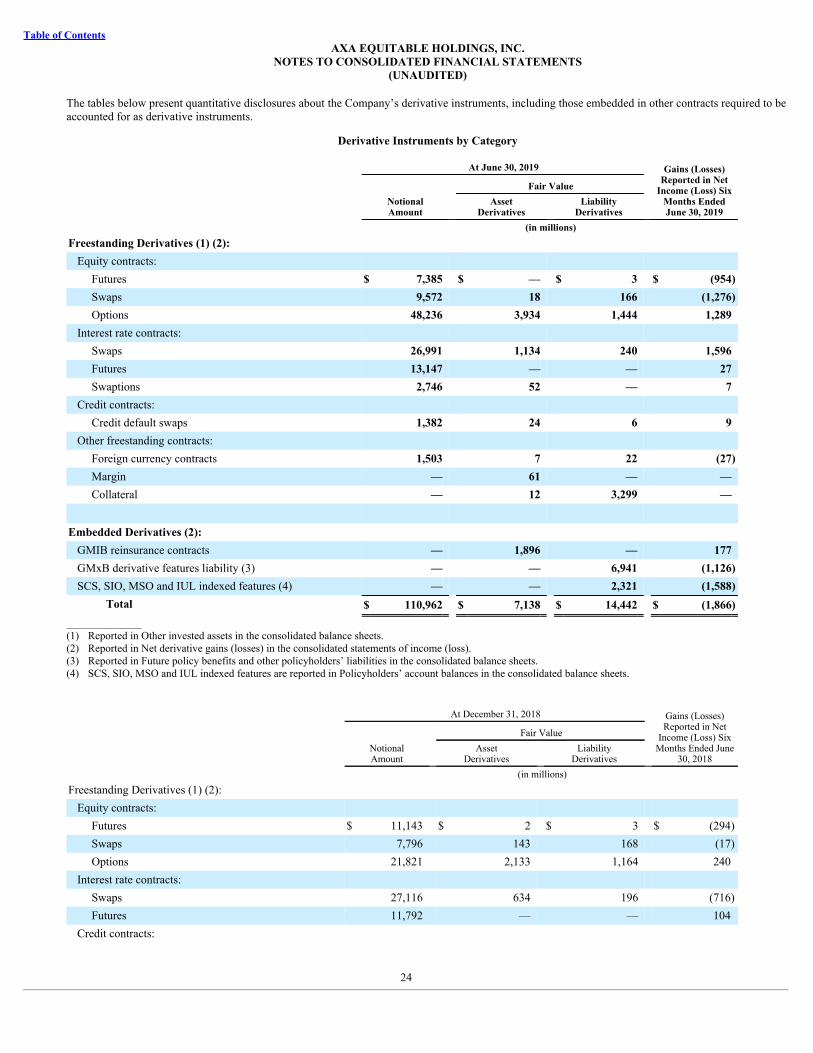
Table of ContentsAXA EQUITABLE HOLDINGS, INC.
NOTES TO CONSOLIDATED FINANCIAL STATEMENTS(UNAUDITED)
The tables below present quantitative disclosures about the Company’s derivative instruments, including those embedded in other contracts required to beaccounted for as derivative instruments.
Derivative Instruments by Category
At June 30, 2019 Gains (Losses)Reported in Net
Income (Loss) SixMonths EndedJune 30, 2019
Fair Value
NotionalAmount
AssetDerivatives
LiabilityDerivatives
(in millions)Freestanding Derivatives (1) (2):
Equity contracts: Futures $ 7,385 $ — $ 3 $ (954)Swaps 9,572 18 166 (1,276)Options 48,236 3,934 1,444 1,289
Interest rate contracts: Swaps 26,991 1,134 240 1,596Futures 13,147 — — 27Swaptions 2,746 52 — 7
Credit contracts: Credit default swaps 1,382 24 6 9
Other freestanding contracts: Foreign currency contracts 1,503 7 22 (27)Margin — 61 — —Collateral — 12 3,299 —
Embedded Derivatives (2): GMIB reinsurance contracts — 1,896 — 177GMxB derivative features liability (3) — — 6,941 (1,126)SCS, SIO, MSO and IUL indexed features (4) — — 2,321 (1,588)
Total $ 110,962 $ 7,138 $ 14,442 $ (1,866)______________(1) Reported in Other invested assets in the consolidated balance sheets.(2) Reported in Net derivative gains (losses) in the consolidated statements of income (loss).(3) Reported in Future policy benefits and other policyholders’ liabilities in the consolidated balance sheets.(4) SCS, SIO, MSO and IUL indexed features are reported in Policyholders’ account balances in the consolidated balance sheets.
At December 31, 2018 Gains (Losses)Reported in Net
Income (Loss) SixMonths Ended June
30, 2018
Fair Value
NotionalAmount
AssetDerivatives
LiabilityDerivatives
(in millions)Freestanding Derivatives (1) (2):
Equity contracts: Futures $ 11,143 $ 2 $ 3 $ (294)Swaps 7,796 143 168 (17)Options 21,821 2,133 1,164 240
Interest rate contracts: Swaps 27,116 634 196 (716)Futures 11,792 — — 104
Credit contracts:
24
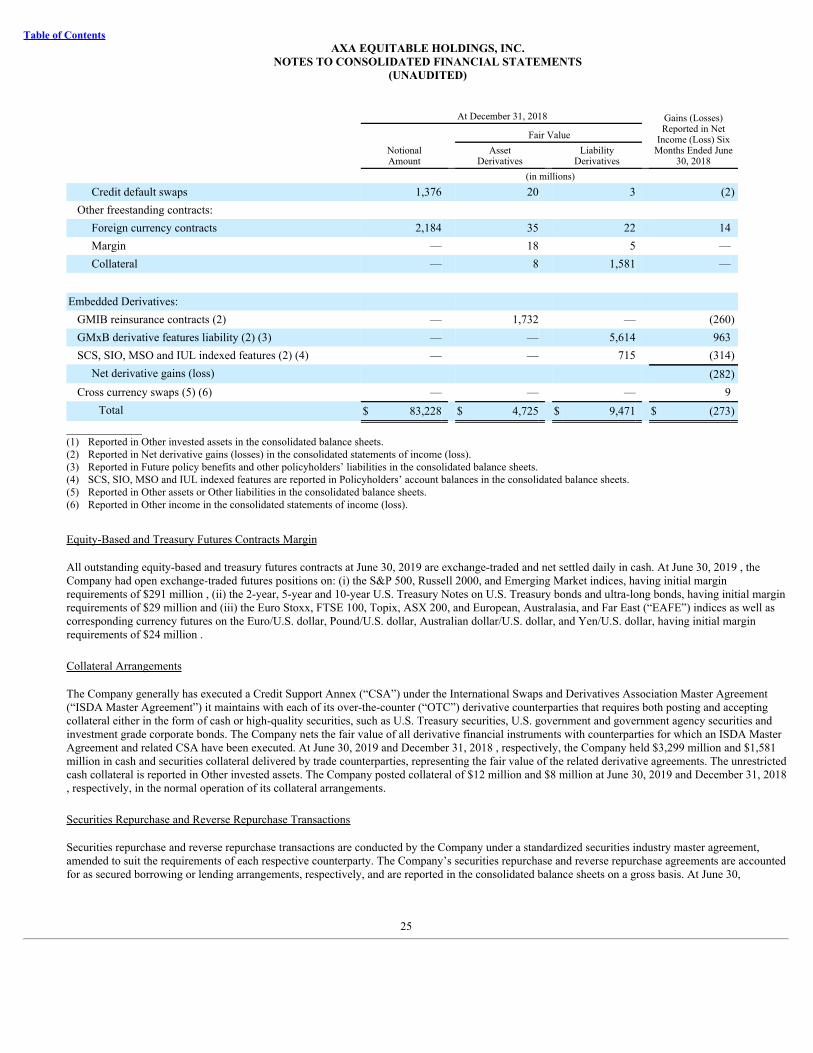
Table of ContentsAXA EQUITABLE HOLDINGS, INC.
NOTES TO CONSOLIDATED FINANCIAL STATEMENTS(UNAUDITED)
At December 31, 2018 Gains (Losses)Reported in Net
Income (Loss) SixMonths Ended June
30, 2018
Fair Value
NotionalAmount
AssetDerivatives
LiabilityDerivatives
(in millions)Credit default swaps 1,376 20 3 (2)
Other freestanding contracts: Foreign currency contracts 2,184 35 22 14Margin — 18 5 —Collateral — 8 1,581 —
Embedded Derivatives: GMIB reinsurance contracts (2) — 1,732 — (260)GMxB derivative features liability (2) (3) — — 5,614 963SCS, SIO, MSO and IUL indexed features (2) (4) — — 715 (314)
Net derivative gains (loss) (282)Cross currency swaps (5) (6) — — — 9
Total $ 83,228 $ 4,725 $ 9,471 $ (273)______________(1) Reported in Other invested assets in the consolidated balance sheets.(2) Reported in Net derivative gains (losses) in the consolidated statements of income (loss).(3) Reported in Future policy benefits and other policyholders’ liabilities in the consolidated balance sheets.(4) SCS, SIO, MSO and IUL indexed features are reported in Policyholders’ account balances in the consolidated balance sheets.(5) Reported in Other assets or Other liabilities in the consolidated balance sheets.(6) Reported in Other income in the consolidated statements of income (loss).
Equity-Based and Treasury Futures Contracts Margin
All outstanding equity-based and treasury futures contracts at June 30, 2019 are exchange-traded and net settled daily in cash. At June 30, 2019 , theCompany had open exchange-traded futures positions on: (i) the S&P 500, Russell 2000, and Emerging Market indices, having initial marginrequirements of $291 million , (ii) the 2-year, 5-year and 10-year U.S. Treasury Notes on U.S. Treasury bonds and ultra-long bonds, having initial marginrequirements of $29 million and (iii) the Euro Stoxx, FTSE 100, Topix, ASX 200, and European, Australasia, and Far East (“EAFE”) indices as well ascorresponding currency futures on the Euro/U.S. dollar, Pound/U.S. dollar, Australian dollar/U.S. dollar, and Yen/U.S. dollar, having initial marginrequirements of $24 million .
Collateral Arrangements
The Company generally has executed a Credit Support Annex (“CSA”) under the International Swaps and Derivatives Association Master Agreement(“ISDA Master Agreement”) it maintains with each of its over-the-counter (“OTC”) derivative counterparties that requires both posting and acceptingcollateral either in the form of cash or high-quality securities, such as U.S. Treasury securities, U.S. government and government agency securities andinvestment grade corporate bonds. The Company nets the fair value of all derivative financial instruments with counterparties for which an ISDA MasterAgreement and related CSA have been executed. At June 30, 2019 and December 31, 2018 , respectively, the Company held $3,299 million and $1,581million in cash and securities collateral delivered by trade counterparties, representing the fair value of the related derivative agreements. The unrestrictedcash collateral is reported in Other invested assets. The Company posted collateral of $12 million and $8 million at June 30, 2019 and December 31, 2018, respectively, in the normal operation of its collateral arrangements.
Securities Repurchase and Reverse Repurchase Transactions
Securities repurchase and reverse repurchase transactions are conducted by the Company under a standardized securities industry master agreement,amended to suit the requirements of each respective counterparty. The Company’s securities repurchase and reverse repurchase agreements are accountedfor as secured borrowing or lending arrangements, respectively, and are reported in the consolidated balance sheets on a gross basis. At June 30,
25

Table of ContentsAXA EQUITABLE HOLDINGS, INC.
NOTES TO CONSOLIDATED FINANCIAL STATEMENTS(UNAUDITED)
2019 and December 31, 2018 , the balance outstanding under securities repurchase transactions was $0 and $573 million , respectively. The Companyutilized these repurchase and reverse repurchase agreements for asset liability and cash management purposes. For other instruments used for asset andliability management purposes, see Note 14 .
The following table presents information about the Company’s offsetting of financial assets and liabilities and derivative instruments at June 30, 2019 .
Offsetting of Financial Assets and Liabilities and Derivative InstrumentsAt June 30, 2019
Gross Amount
Recognized
Gross AmountOffset in the
Balance Sheets
Net AmountPresented in theBalance Sheets
(in millions)Assets:
Total derivatives (1) $ 5,242 $ 5,155 $ 87Other financial instruments 2,211 — 2,211
Other invested assets $ 7,453 $ 5,155 $ 2,298
Liabilities: Total derivatives (2) $ 5,155 $ 5,130 $ 25Other financial liabilities 3,831 — 3,831
Other liabilities $ 8,986 $ 5,130 $ 3,856______________(1) Excludes Investment Management and Research segment’s derivative assets of consolidated VIEs/VOEs.(2) Excludes Investment Management and Research segment’s derivative liabilities of consolidated VIEs/VOEs.
The following table presents information about the Company’s gross collateral amounts that are not offset in the consolidated balance sheets at June 30,2019 .
Collateral Amounts Not Offset in the Consolidated Balance SheetsAt June 30, 2019
Net AmountPresented in theBalance Sheets
Collateral (Received)/Held
Financial
Instruments Cash Net Amount (in millions)Assets:
Total derivatives (1) $ 3,288 $ 238 $ 2,963 $ 87Other financial instruments 2,211 — — 2,211
Other invested assets $ 5,499 $ 238 $ 2,963 $ 2,298
Liabilities: Total derivatives (2) $ 25 $ — $ — $ 25Other financial liabilities 3,831 — — 3,831
Other liabilities $ 3,856 $ — $ — $ 3,856______________(1) Excludes Investment Management and Research segment’s derivative assets of consolidated VIEs/VOEs.(2) Excludes Investment Management and Research segment’s derivative liabilities of consolidated VIEs/VOEs.
The Company had no securities sold under agreements to repurchase at June 30, 2019 .
The following table presents information about the Company’s offsetting financial assets and liabilities and derivative instruments at December 31, 2018 .
26
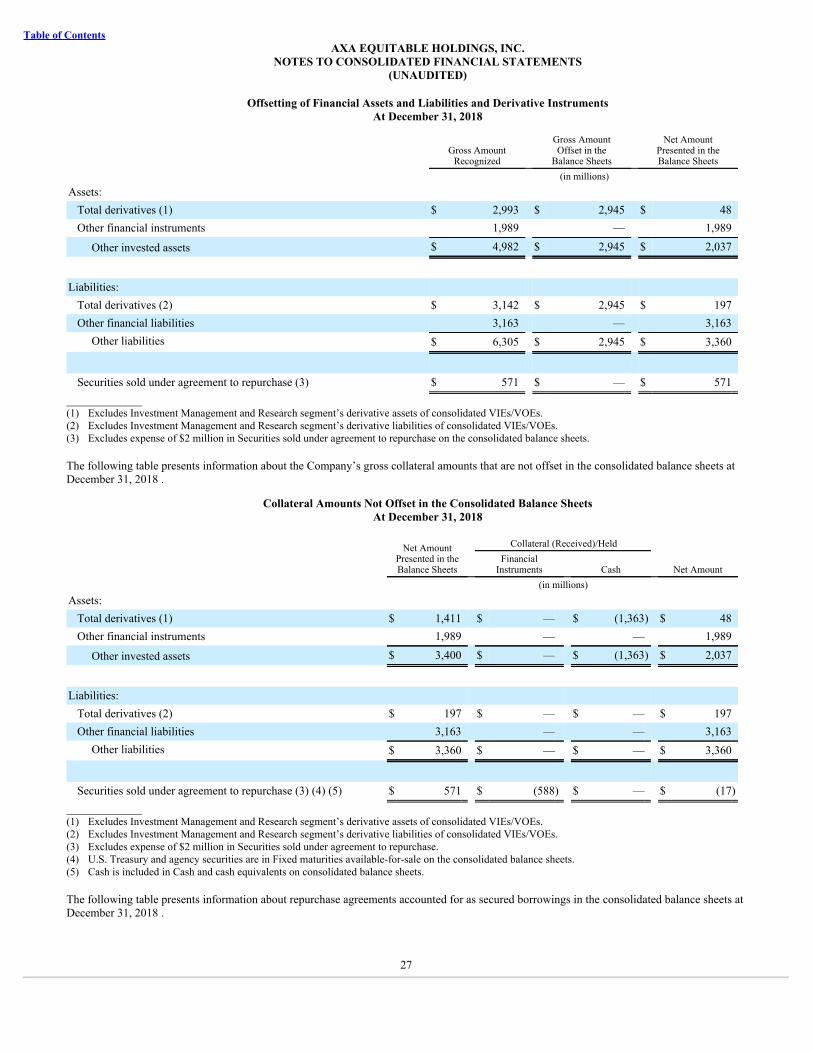
Table of ContentsAXA EQUITABLE HOLDINGS, INC.
NOTES TO CONSOLIDATED FINANCIAL STATEMENTS(UNAUDITED)
Offsetting of Financial Assets and Liabilities and Derivative InstrumentsAt December 31, 2018
Gross Amount
Recognized
Gross AmountOffset in the
Balance Sheets
Net AmountPresented in theBalance Sheets
(in millions)Assets:
Total derivatives (1) $ 2,993 $ 2,945 $ 48Other financial instruments 1,989 — 1,989
Other invested assets $ 4,982 $ 2,945 $ 2,037
Liabilities: Total derivatives (2) $ 3,142 $ 2,945 $ 197Other financial liabilities 3,163 — 3,163
Other liabilities $ 6,305 $ 2,945 $ 3,360
Securities sold under agreement to repurchase (3) $ 571 $ — $ 571______________(1) Excludes Investment Management and Research segment’s derivative assets of consolidated VIEs/VOEs.(2) Excludes Investment Management and Research segment’s derivative liabilities of consolidated VIEs/VOEs.(3) Excludes expense of $2 million in Securities sold under agreement to repurchase on the consolidated balance sheets.
The following table presents information about the Company’s gross collateral amounts that are not offset in the consolidated balance sheets atDecember 31, 2018 .
Collateral Amounts Not Offset in the Consolidated Balance SheetsAt December 31, 2018
Net AmountPresented in theBalance Sheets
Collateral (Received)/Held
Financial
Instruments Cash Net Amount (in millions)Assets:
Total derivatives (1) $ 1,411 $ — $ (1,363) $ 48Other financial instruments 1,989 — — 1,989
Other invested assets $ 3,400 $ — $ (1,363) $ 2,037
Liabilities: Total derivatives (2) $ 197 $ — $ — $ 197Other financial liabilities 3,163 — — 3,163
Other liabilities $ 3,360 $ — $ — $ 3,360
Securities sold under agreement to repurchase (3) (4) (5) $ 571 $ (588) $ — $ (17)______________(1) Excludes Investment Management and Research segment’s derivative assets of consolidated VIEs/VOEs.(2) Excludes Investment Management and Research segment’s derivative liabilities of consolidated VIEs/VOEs.(3) Excludes expense of $2 million in Securities sold under agreement to repurchase.(4) U.S. Treasury and agency securities are in Fixed maturities available-for-sale on the consolidated balance sheets.(5) Cash is included in Cash and cash equivalents on consolidated balance sheets.
The following table presents information about repurchase agreements accounted for as secured borrowings in the consolidated balance sheets atDecember 31, 2018 .
27
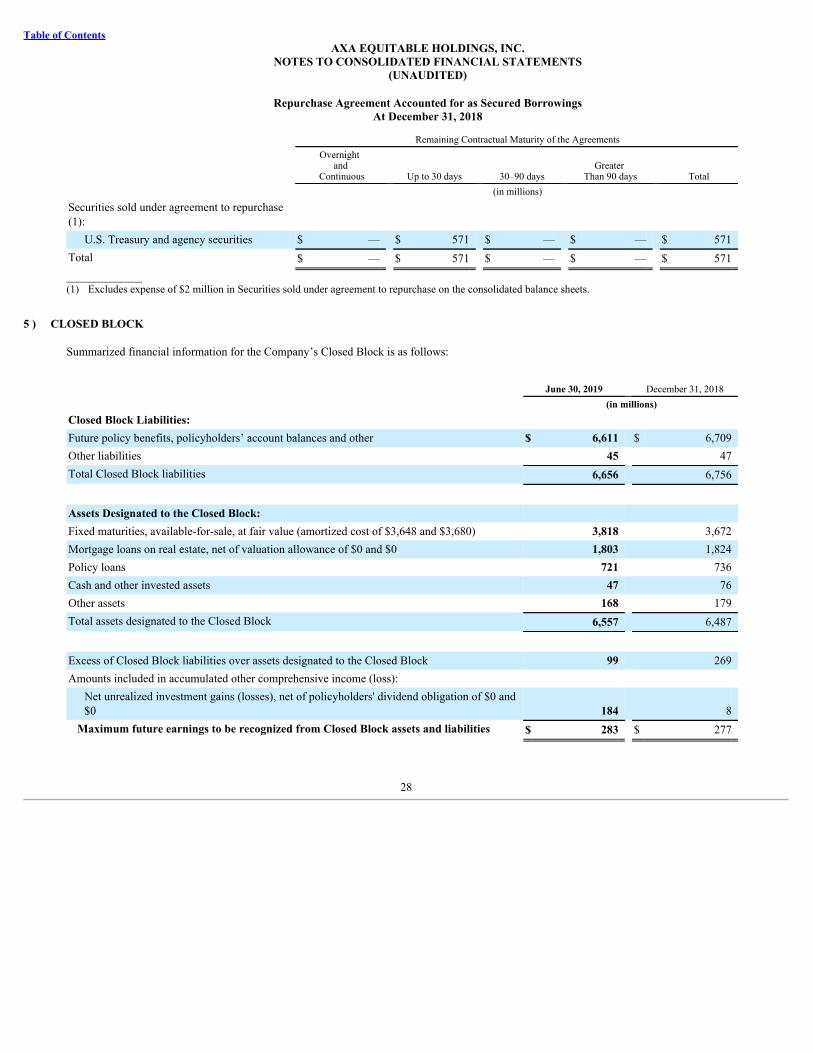
Table of ContentsAXA EQUITABLE HOLDINGS, INC.
NOTES TO CONSOLIDATED FINANCIAL STATEMENTS(UNAUDITED)
Repurchase Agreement Accounted for as Secured BorrowingsAt December 31, 2018
Remaining Contractual Maturity of the Agreements
Overnight and
Continuous Up to 30 days 30–90 days Greater
Than 90 days Total (in millions)Securities sold under agreement to repurchase (1):
U.S. Treasury and agency securities $ — $ 571 $ — $ — $ 571Total $ — $ 571 $ — $ — $ 571______________(1) Excludes expense of $2 million in Securities sold under agreement to repurchase on the consolidated balance sheets.
5 ) CLOSED BLOCK
Summarized financial information for the Company’s Closed Block is as follows:
June 30, 2019 December 31, 2018 (in millions)Closed Block Liabilities: Future policy benefits, policyholders’ account balances and other $ 6,611 $ 6,709Other liabilities 45 47Total Closed Block liabilities 6,656 6,756
Assets Designated to the Closed Block: Fixed maturities, available-for-sale, at fair value (amortized cost of $3,648 and $3,680) 3,818 3,672Mortgage loans on real estate, net of valuation allowance of $0 and $0 1,803 1,824Policy loans 721 736Cash and other invested assets 47 76Other assets 168 179Total assets designated to the Closed Block 6,557 6,487
Excess of Closed Block liabilities over assets designated to the Closed Block 99 269Amounts included in accumulated other comprehensive income (loss):
Net unrealized investment gains (losses), net of policyholders' dividend obligation of $0 and$0 184 8
Maximum future earnings to be recognized from Closed Block assets and liabilities $ 283 $ 277
28

Table of ContentsAXA EQUITABLE HOLDINGS, INC.
NOTES TO CONSOLIDATED FINANCIAL STATEMENTS(UNAUDITED)
The Company’s Closed Block revenues and expenses are as follows:
Three Months Ended June 30, Six Months Ended June 30,
2019 2018 2019 2018 (in millions)Revenues: Premiums and other income $ 46 $ 49 $ 94 $ 100Net investment income (loss) 72 73 139 146Investment gains (losses), net — — (1) 1
Total revenues 118 122 232 247
Benefits and Other Deductions: Policyholders’ benefits and dividends 114 123 235 249Other operating costs and expenses — — 1 2
Total benefits and other deductions 114 123 236 251Net income (loss) before income taxes 4 (1) (4) (4)
Income tax (expense) benefit (1) — (2) 1Net income (loss) $ 3 $ (1) $ (6) $ (3)
6 ) INSURANCE LIABILITIES
Variable Annuity Contracts – GMDB, GMIB, GIB and GWBL and Other Features
The Company has certain variable annuity contracts with GMDB, GMIB, GIB and GWBL and other features in-force that guarantee one of the following:
• Return of Premium: the benefit is the greater of current account value or premiums paid (adjusted for withdrawals);
• Ratchet: the benefit is the greatest of current account value, premiums paid (adjusted for withdrawals), or the highest account value on anyanniversary up to contractually specified ages (adjusted for withdrawals);
• Roll-Up: the benefit is the greater of current account value or premiums paid (adjusted for withdrawals) accumulated at contractually specifiedinterest rates up to specified ages;
• Combo: the benefit is the greater of the ratchet benefit or the roll-up benefit, which may include either a five year or an annual reset; or
• Withdrawal: the withdrawal is guaranteed up to a maximum amount per year for life.
Liabilities for Variable Annuity Contracts with GMDB and GMIB Features without No-Lapse Guarantee Rider (“NLG”) Feature
The change in the liabilities for variable annuity contracts with GMDB and GMIB features and no NLG feature are summarized in the tables below. Theamounts for the direct contracts (before reinsurance ceded) and assumed contracts are reflected in the consolidated balance sheets in Future policybenefits and other policyholders’ liabilities. The amounts for the ceded contracts are reflected in the consolidated balance sheets in Amounts due fromreinsurers.
Change in Liability for Variable Annuity Contracts with GMDB Features and No NLG Feature
29
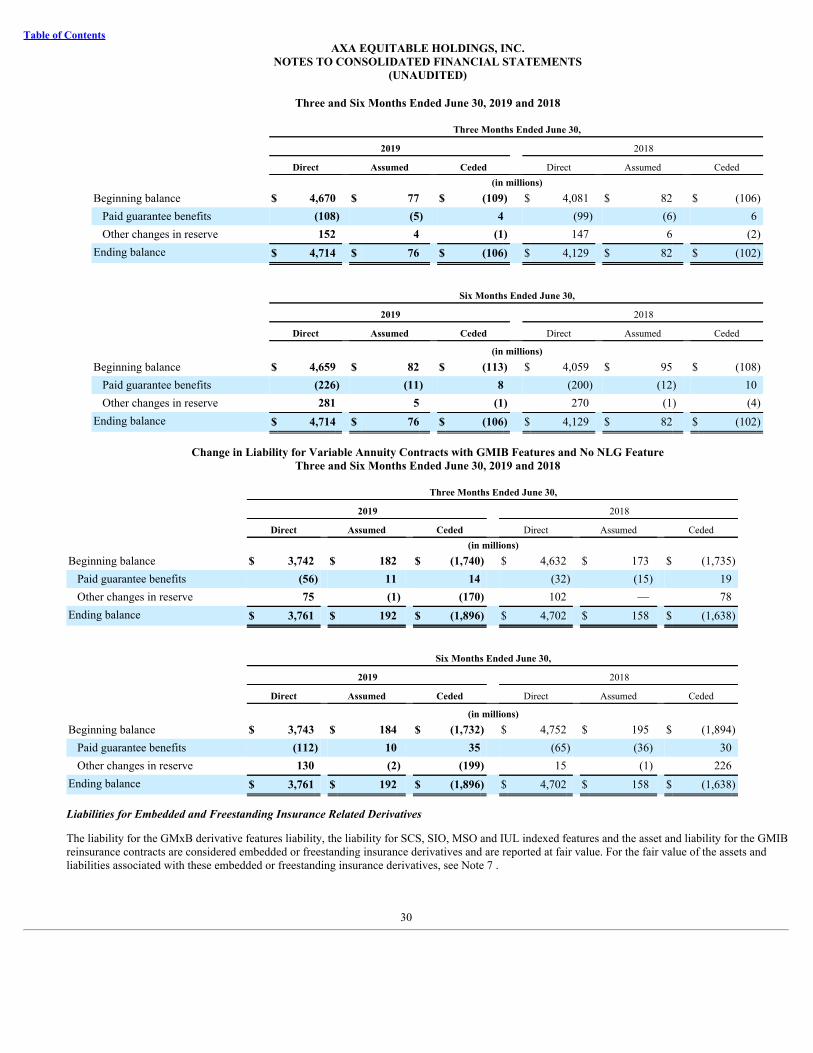
Table of ContentsAXA EQUITABLE HOLDINGS, INC.
NOTES TO CONSOLIDATED FINANCIAL STATEMENTS(UNAUDITED)
Three and Six Months Ended June 30, 2019 and 2018
Three Months Ended June 30,
2019 2018
Direct Assumed Ceded Direct Assumed Ceded (in millions)Beginning balance $ 4,670 $ 77 $ (109) $ 4,081 $ 82 $ (106)
Paid guarantee benefits (108) (5) 4 (99) (6) 6Other changes in reserve 152 4 (1) 147 6 (2)
Ending balance $ 4,714 $ 76 $ (106) $ 4,129 $ 82 $ (102)
Six Months Ended June 30,
2019 2018
Direct Assumed Ceded Direct Assumed Ceded (in millions)Beginning balance $ 4,659 $ 82 $ (113) $ 4,059 $ 95 $ (108)
Paid guarantee benefits (226) (11) 8 (200) (12) 10Other changes in reserve 281 5 (1) 270 (1) (4)
Ending balance $ 4,714 $ 76 $ (106) $ 4,129 $ 82 $ (102)
Change in Liability for Variable Annuity Contracts with GMIB Features and No NLG FeatureThree and Six Months Ended June 30, 2019 and 2018
Three Months Ended June 30,
2019 2018
Direct Assumed Ceded Direct Assumed Ceded (in millions)Beginning balance $ 3,742 $ 182 $ (1,740) $ 4,632 $ 173 $ (1,735)
Paid guarantee benefits (56) 11 14 (32) (15) 19Other changes in reserve 75 (1) (170) 102 — 78
Ending balance $ 3,761 $ 192 $ (1,896) $ 4,702 $ 158 $ (1,638)
Six Months Ended June 30,
2019 2018
Direct Assumed Ceded Direct Assumed Ceded (in millions)Beginning balance $ 3,743 $ 184 $ (1,732) $ 4,752 $ 195 $ (1,894)
Paid guarantee benefits (112) 10 35 (65) (36) 30Other changes in reserve 130 (2) (199) 15 (1) 226
Ending balance $ 3,761 $ 192 $ (1,896) $ 4,702 $ 158 $ (1,638)
Liabilities for Embedded and Freestanding Insurance Related Derivatives
The liability for the GMxB derivative features liability, the liability for SCS, SIO, MSO and IUL indexed features and the asset and liability for the GMIBreinsurance contracts are considered embedded or freestanding insurance derivatives and are reported at fair value. For the fair value of the assets andliabilities associated with these embedded or freestanding insurance derivatives, see Note 7 .
30

Table of ContentsAXA EQUITABLE HOLDINGS, INC.
NOTES TO CONSOLIDATED FINANCIAL STATEMENTS(UNAUDITED)
Account Values and Net Amount at Risk
Account Values and Net Amount at Risk (“NAR”) for direct and assumed variable annuity contracts in-force with GMDB and GMIB features as ofJune 30, 2019 are presented in the following tables by guarantee type. For contracts with the GMDB feature, the NAR in the event of death is the amountby which the GMDB feature exceeds the related Account Values. For contracts with the GMIB feature, the NAR in the event of annuitization is theamount by which the present value of the GMIB benefits exceed the related Account Values, taking into account the relationship between current annuitypurchase rates and the GMIB guaranteed annuity purchase rates. Since variable annuity contracts with GMDB features may also offer GMIB guaranteesin the same contract, the GMDB and GMIB amounts listed are not mutually exclusive.
Direct Variable Annuity Contracts with GMDB and GMIB FeaturesAt June 30, 2019
Guarantee Type
Return ofPremium Ratchet Roll-Up Combo Total
(in millions, except age and interest rate)Variable annuity contracts with GMDB features Account Values invested in:
General Account $ 14,359 $ 98 $ 60 $ 181 $ 14,698Separate Accounts 46,724 9,102 3,147 32,812 91,785
Total Account Values $ 61,083 $ 9,200 $ 3,207 $ 32,993 $ 106,483
Net amount at risk, gross $ 119 $ 61 $ 1,959 $ 18,185 $ 20,324Net amount at risk, net of amounts reinsured $ 119 $ 58 $ 1,367 $ 18,185 $ 19,729
Average attained age of policyholders (in years) 51.4 67.3 73.9 69.4 55.3Percentage of policyholders over age 70 10.3% 44.3% 66.8% 51.6% 19.1%Range of contractually specified interest rates N/A N/A 3% - 6% 3% - 6.5% 3% - 6.5%
Variable annuity contracts with GMIB features Account Values invested in:
General Account $ — $ — $ 21 $ 240 $ 261Separate Accounts — — 22,504 35,730 58,234
Total Account Values $ — $ — $ 22,525 $ 35,970 $ 58,495
Net amount at risk, gross $ — $ — $ 908 $ 9,154 $ 10,062Net amount at risk, net of amounts reinsured $ — $ — $ 286 $ 8,297 $ 8,583
Average attained age of policyholders (in years) N/A N/A 68.5 69.1 69.0Weighted average years remaining until annuitization N/A N/A 1.7 0.4 0.5Range of contractually specified interest rates N/A N/A 3% - 6% 3% - 6.5% 3% - 6.5%
31

Table of ContentsAXA EQUITABLE HOLDINGS, INC.
NOTES TO CONSOLIDATED FINANCIAL STATEMENTS(UNAUDITED)
Assumed Variable Annuity Contracts with GMDB and GMIB FeaturesAt June 30, 2019
Guarantee Type
Return ofPremium Ratchet Roll-Up Combo Total
(in millions, except age and interest rates)Variable annuity contracts with GMDB features Reinsured account values $ 933 $ 5,299 $ 272 $ 1,159 $ 7,663Net amount at risk assumed $ 5 $ 257 $ 19 $ 178 $ 459
Average attained age of policyholders (in years) 68 72 77 75 72Percentage of policyholders over age 70 44.3% 63.2% 79.0% 74.4% 63.2%Range of contractually specified interest rates (1) N/A N/A 3%-10% 5%-10% 3%-10%
Variable annuity contracts with GMIB features Reinsured account values $ 906 $ 45 $ 245 $ 1,193 $ 2,389Net amount at risk assumed $ 1 $ — $ 34 $ 302 $ 337
Average attained age of policyholders (in years) 72 74 72 69 70Percentage of policyholders over age 70 63.7% 64.1% 60.3% 51.5% 57.3%Range of contractually specified interest rates N/A N/A 3.3%-6.5% 6%-6% 3.3%-6.5%______________(1) In general, for policies with the highest contractual interest rate shown ( 10% ), the rate applied only for the first 10 years after issue, which has now elapsed.
For more information about the reinsurance programs of the Company’s GMDB and GMIB exposure, see “Reinsurance Agreements” in Note 10 of theNotes to the Consolidated Financial Statements included in the Annual Report on Form 10-K for the year ended December 31, 2018.
Separate Accounts Investments by Investment Category Underlying Variable Annuity Contracts with GMDB and GMIB Features
The total account values of variable annuity contracts with GMDB and GMIB features include amounts allocated to the guaranteed interest option, whichis part of the General Account and variable investment options that invest through Separate Accounts in variable insurance trusts. The following tablepresents the aggregate fair value of assets, by major investment category, held by Separate Accounts that support variable annuity contracts with GMDBand GMIB features. The investment performance of the assets impacts the related account values and, consequently, the NAR associated with the GMDBand GMIB benefits and guarantees. Because the Company’s variable annuity contracts offer both GMDB and GMIB features, GMDB and GMIB amountsare not mutually exclusive.
Investment in Variable Insurance Trust Mutual Funds
June 30, 2019 December 31, 2018
Mutual Fund Type GMDB GMIB GMDB GMIB
(in millions)Equity $ 40,627 $ 17,529 $ 35,541 $ 15,759Fixed income 5,278 2,788 5,173 2,812Balanced 45,023 37,646 41,588 33,974Other 858 271 852 290Total $ 91,786 $ 58,234 $ 83,154 $ 52,835
32

Table of ContentsAXA EQUITABLE HOLDINGS, INC.
NOTES TO CONSOLIDATED FINANCIAL STATEMENTS(UNAUDITED)
Hedging Programs for GMDB, GMIB, GIB and Other Features
The Company has a program intended to hedge certain risks associated first with the GMDB feature and with the GMIB feature of the Accumulator seriesof variable annuity products. The program has also been extended to cover other guaranteed benefits as they have been made available. This programutilizes derivative contracts, such as exchange-traded equity, currency and interest rate futures contracts, total return and/or equity swaps, interest rateswap and floor contracts, swaptions, variance swaps as well as equity options, that collectively are managed in an effort to reduce the economic impact ofunfavorable changes in guaranteed benefits’ exposures attributable to movements in the capital markets. At the present time, this program hedges certaineconomic risks on products sold from 2001 forward, to the extent such risks are not externally reinsured.
These programs do not qualify for hedge accounting treatment. Therefore, gains (losses) on the derivatives contracts used in these programs, includingcurrent period changes in fair value, are recognized in Net derivative gains (losses) in the period in which they occur, and may contribute to income (loss)volatility.
Variable and Interest-Sensitive Life Insurance Policies - NLG
The NLG feature contained in variable and interest-sensitive life insurance policies keeps them in force in situations where the policy value is notsufficient to cover monthly charges then due. The NLG remains in effect so long as the policy meets a contractually specified premium funding test andcertain other requirements.
The change in the fair value of the NLG feature reflected in the General Account in Future policy benefits and other policyholders’ liabilities in theconsolidated balance sheets, is summarized in the table below.
Direct Liability (1)
Three Months Ended June 30, Six Months Ended June 30,
2019 2018 2019 2018 (in millions)Beginning Balance $ 825 $ 704 $ 812 $ 709
Paid guaranteed benefits (3) (1) (10) (9)Other changes in reserves 21 26 41 29
Ending Balance $ 843 $ 729 $ 843 $ 729______________(1) There were no amounts of reinsurance ceded in any period presented.
7 ) FAIR VALUE DISCLOSURES
The accounting guidance establishes a fair value hierarchy that requires an entity to maximize the use of observable inputs and minimize the use ofunobservable inputs when measuring fair value, and identifies three levels of inputs that may be used to measure fair value:
Level 1 Unadjusted quoted prices for identical instruments in active markets. Level 1 fair values generally are supported by market transactions thatoccur with sufficient frequency and volume to provide pricing information on an ongoing basis.
Level 2 Observable inputs other than Level 1 prices, such as quoted prices for similar instruments, quoted prices in markets that are not active, and inputsto model-derived valuations that are directly observable or can be corroborated by observable market data.
Level 3 Unobservable inputs supported by little or no market activity and often requiring significant management judgment or estimation, such as anentity’s own assumptions about the cash flows or other significant components of value that market participants would use in pricing the asset orliability.
The Company uses unadjusted quoted market prices to measure fair value for those instruments that are actively traded in financial markets. In caseswhere quoted market prices are not available, fair values are measured using present value or other valuation techniques. The fair value determinations aremade at a specific point in time, based on available market information and judgments about the financial instrument, including estimates of the timingand amount of expected future cash flows and the credit standing of counterparties. Such adjustments do not reflect any
33

Table of ContentsAXA EQUITABLE HOLDINGS, INC.
NOTES TO CONSOLIDATED FINANCIAL STATEMENTS(UNAUDITED)
premium or discount that could result from offering for sale at one time the Company’s entire holdings of a particular financial instrument, nor do theyconsider the tax impact of the realization of unrealized gains or losses. In many cases, the fair value cannot be substantiated by direct comparison toindependent markets, nor can the disclosed value be realized in immediate settlement of the instrument.
Management is responsible for the determination of the value of investments carried at fair value and the supporting methodologies and assumptions.Under the terms of various service agreements, the Company often utilizes independent valuation service providers to gather, analyze, and interpretmarket information and derive fair values based upon relevant methodologies and assumptions for individual securities. These independent valuationservice providers typically obtain data about market transactions and other key valuation model inputs from multiple sources and, through the use ofwidely accepted valuation models, provide a single fair value measurement for individual securities for which a fair value has been requested. As furtherdescribed below with respect to specific asset classes, these inputs include, but are not limited to, market prices for recent trades and transactions incomparable securities, benchmark yields, interest rate yield curves, credit spreads, quoted prices for similar securities, and other market-observableinformation, as applicable. Specific attributes of the security being valued also are considered, including its term, interest rate, credit rating, industrysector, and when applicable, collateral quality and other security- or issuer-specific information. When insufficient market observable information isavailable upon which to measure fair value, the Company either will request brokers knowledgeable about these securities to provide a non-binding quoteor will employ internal valuation models. Fair values received from independent valuation service providers and brokers and those internally modeled orotherwise estimated are assessed for reasonableness.
Assets and liabilities measured at fair value on a recurring basis are summarized below. At June 30, 2019 and December 31, 2018 , no assets wererequired to be measured at fair value on a non-recurring basis. Fair value measurements are required on a non-recurring basis for certain assets, includinggoodwill and mortgage loans on real estate, only when an OTTI or other event occurs. When such fair value measurements are recorded, they must beclassified and disclosed within the fair value hierarchy. The Company recognizes transfers between valuation levels at the beginning of the reportingperiod.
Fair Value Measurements at June 30, 2019
Level 1 Level 2 Level 3 Total (in millions)Assets: Investments:
Fixed maturities, available-for-sale: Corporate (1) $ — $ 40,226 $ 1,302 $ 41,528U.S. Treasury, government and agency — 13,717 — 13,717States and political subdivisions — 525 40 565Foreign governments — 498 — 498Residential mortgage-backed (2) — 221 — 221Asset-backed (3) — 84 534 618Redeemable preferred stock 159 266 — 425
Total fixed maturities, available-for-sale 159 55,537 1,876 57,572Other equity investments 12 — 71 83Trading securities 489 9,122 35 9,646Other invested assets:
Short-term investments — 350 — 350Assets of consolidated VIEs/VOEs 123 340 28 491Swaps — 731 — 731Credit default swaps — 18 — 18Futures (3) — — (3)Options — 2,490 — 2,490Swaptions — 52 — 52
Total other invested assets 120 3,981 28 4,129
34
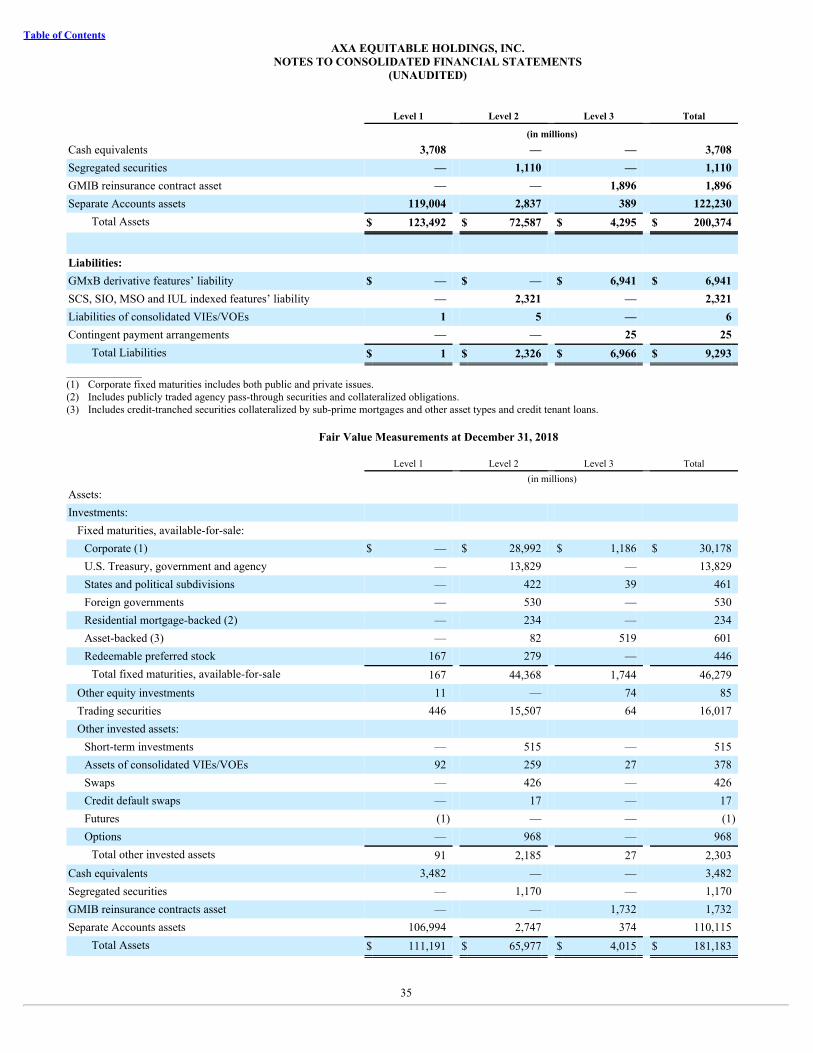
Table of ContentsAXA EQUITABLE HOLDINGS, INC.
NOTES TO CONSOLIDATED FINANCIAL STATEMENTS(UNAUDITED)
Level 1 Level 2 Level 3 Total (in millions)Cash equivalents 3,708 — — 3,708Segregated securities — 1,110 — 1,110GMIB reinsurance contract asset — — 1,896 1,896Separate Accounts assets 119,004 2,837 389 122,230
Total Assets $ 123,492 $ 72,587 $ 4,295 $ 200,374
Liabilities: GMxB derivative features’ liability $ — $ — $ 6,941 $ 6,941SCS, SIO, MSO and IUL indexed features’ liability — 2,321 — 2,321Liabilities of consolidated VIEs/VOEs 1 5 — 6Contingent payment arrangements — — 25 25
Total Liabilities $ 1 $ 2,326 $ 6,966 $ 9,293______________(1) Corporate fixed maturities includes both public and private issues.(2) Includes publicly traded agency pass-through securities and collateralized obligations.(3) Includes credit-tranched securities collateralized by sub-prime mortgages and other asset types and credit tenant loans.
Fair Value Measurements at December 31, 2018
Level 1 Level 2 Level 3 Total (in millions)Assets: Investments:
Fixed maturities, available-for-sale: Corporate (1) $ — $ 28,992 $ 1,186 $ 30,178U.S. Treasury, government and agency — 13,829 — 13,829States and political subdivisions — 422 39 461Foreign governments — 530 — 530Residential mortgage-backed (2) — 234 — 234Asset-backed (3) — 82 519 601Redeemable preferred stock 167 279 — 446
Total fixed maturities, available-for-sale 167 44,368 1,744 46,279Other equity investments 11 — 74 85Trading securities 446 15,507 64 16,017Other invested assets:
Short-term investments — 515 — 515Assets of consolidated VIEs/VOEs 92 259 27 378Swaps — 426 — 426Credit default swaps — 17 — 17Futures (1) — — (1)Options — 968 — 968
Total other invested assets 91 2,185 27 2,303Cash equivalents 3,482 — — 3,482Segregated securities — 1,170 — 1,170GMIB reinsurance contracts asset — — 1,732 1,732Separate Accounts assets 106,994 2,747 374 110,115
Total Assets $ 111,191 $ 65,977 $ 4,015 $ 181,183
35

Table of ContentsAXA EQUITABLE HOLDINGS, INC.
NOTES TO CONSOLIDATED FINANCIAL STATEMENTS(UNAUDITED)
Level 1 Level 2 Level 3 Total (in millions)Liabilities: GMxB derivative features’ liability $ — $ — $ 5,614 $ 5,614SCS, SIO, MSO and IUL indexed features’ liability — 715 — 715Liabilities of consolidated VIEs/VOEs — 7 — 7Contingent payment arrangements — — 7 7
Total Liabilities $ — $ 722 $ 5,621 $ 6,343______________(1) Corporate fixed maturities includes both public and private issues.(2) Includes publicly traded agency pass-through securities and collateralized obligations.(3) Includes credit-tranched securities collateralized by sub-prime mortgages and other asset types and credit tenant loans.
The fair values of the Company’s public fixed maturities are generally based on prices obtained from independent valuation service providers and forwhich the Company maintains a vendor hierarchy by asset type based on historical pricing experience and vendor expertise. Although each securitygenerally is priced by multiple independent valuation service providers, the Company ultimately uses the price received from the independent valuationservice provider highest in the vendor hierarchy based on the respective asset type, with limited exception. To validate reasonableness, prices also areinternally reviewed by those with relevant expertise through comparison with directly observed recent market trades. Consistent with the fair valuehierarchy, public fixed maturities validated in this manner generally are reflected within Level 2, as they are primarily based on observable pricing forsimilar assets and/or other market observable inputs. If the pricing information received from independent valuation service providers is not reflective ofmarket activity or other inputs observable in the market, the Company may challenge the price through a formal process in accordance with the terms ofthe respective independent valuation service provider agreement. If as a result it is determined that the independent valuation service provider is able toreprice the security in a manner agreed as more consistent with current market observations, the security remains within Level 2. Alternatively, a Level 3classification may result if the pricing information then is sourced from another vendor, non-binding broker quotes, or internally-developed valuations forwhich the Company’s own assumptions about market-participant inputs would be used in pricing the security.
The fair values of the Company’s private fixed maturities are determined from prices obtained from independent valuation service providers. Prices notobtained from an independent valuation service provider are determined by using a discounted cash flow model or a market comparable companyvaluation technique. In certain cases, these models use observable inputs with a discount rate based upon the average of spread surveys collected fromprivate market intermediaries who are active in both primary and secondary transactions, taking into account, among other factors, the credit quality andindustry sector of the issuer and the reduced liquidity associated with private placements. Generally, these securities have been reflected within Level 2.For certain private fixed maturities, the discounted cash flow model or a market comparable company valuation technique may also incorporateunobservable inputs, which reflect the Company’s own assumptions about the inputs market participants would use in pricing the asset. To the extentmanagement determines that such unobservable inputs are significant to the fair value measurement of a security, a Level 3 classification generally ismade.
The net fair value of the Company’s freestanding derivative positions as disclosed in Note 4 are generally based on prices obtained either fromindependent valuation service providers or derived by applying market inputs from recognized vendors into industry standard pricing models. Themajority of these derivative contracts are traded in the OTC derivative market and are classified in Level 2. The fair values of derivative assets andliabilities traded in the OTC market are determined using quantitative models that require use of the contractual terms of the derivative instruments andmultiple market inputs, including interest rates, prices, and indices to generate continuous yield or pricing curves, including overnight index swap (“OIS”)curves, and volatility factors, which then are applied to value the positions. The predominance of market inputs is actively quoted and can be validatedthrough external sources or reliably interpolated if less observable. If the pricing information received from independent valuation service providers is notreflective of market activity or other inputs observable in the market, the Company may challenge the price through a formal process in accordance withthe terms of the respective independent valuation service provider agreement. If as a result it is determined that the independent valuation service provideris able to reprice the derivative instrument in a manner agreed as more consistent with current market observations, the position remains within Level 2.Alternatively, a Level 3 classification may result if the pricing information then is sourced from
36
Table of ContentsAXA EQUITABLE HOLDINGS, INC.
NOTES TO CONSOLIDATED FINANCIAL STATEMENTS(UNAUDITED)
another vendor, non-binding broker quotes, or internally-developed valuations for which the Company’s own assumptions about market-participant inputswould be used in pricing the security.
Investments classified as Level 1 primarily include redeemable preferred stock, trading securities, cash equivalents and Separate Accounts assets. Fairvalue measurements classified as Level 1 include exchange-traded prices of fixed maturities, equity securities and derivative contracts, and net assetvalues for transacting subscriptions and redemptions of mutual fund shares held by Separate Accounts. Cash equivalents classified as Level 1 includemoney market accounts, overnight commercial paper and highly liquid debt instruments purchased with an original maturity of three months or less andare carried at cost as a proxy for fair value measurement due to their short-term nature.
Investments classified as Level 2 are measured at fair value on a recurring basis and primarily include U.S. government and agency securities and certaincorporate debt securities, such as public and private fixed maturities. As market quotes generally are not readily available or accessible for thesesecurities, their fair value measures are determined utilizing relevant information generated by market transactions involving comparable securities andoften are based on model pricing techniques that effectively discount prospective cash flows to present value using appropriate sector-adjusted creditspreads commensurate with the security’s duration, also taking into consideration issuer-specific credit quality and liquidity. Segregated securitiesclassified as Level 2 are U.S. Treasury bills segregated by AB in a special reserve bank custody account for the exclusive benefit of brokerage customers,as required by Rule 15c3-3 of the Exchange Act and for which fair values are based on quoted yields in secondary markets.
Observable inputs generally used to measure the fair value of securities classified as Level 2 include benchmark yields, reported secondary trades, issuerspreads, benchmark securities and other reference data. Additional observable inputs are used when available, and as may be appropriate, for certainsecurity types, such as prepayment, default, and collateral information for the purpose of measuring the fair value of mortgage- and asset-backedsecurities. The Company’s AAA-rated mortgage- and asset-backed securities are classified as Level 2 for which the observability of market inputs to theirpricing models is supported by sufficient, albeit more recently contracted, market activity in these sectors.
Certain Company products such as the SCS and EQUI-VEST variable annuity products, and in the MSO fund available in some life contracts offerinvestment options which permit the contract owner to participate in the performance of an index, ETF or commodity price. These investment options,which depending on the product and on the index selected can currently have 1, 3, 5 or 6 year terms, provide for participation in the performance ofspecified indices, ETF or commodity price movement up to a segment-specific declared maximum rate. Under certain conditions that vary by product,e.g., holding these segments for the full term, these segments also shield policyholders from some or all negative investment performance associated withthese indices, ETF or commodity prices. These investment options have defined formulaic liability amounts, and the current values of the optioncomponent of these segment reserves are accounted for as Level 2 embedded derivatives. The fair values of these embedded derivatives are based on dataobtained from independent valuation service providers.
The Company’s investments classified as Level 3 primarily include corporate debt securities, such as private fixed maturities. Determinations to classifyfair value measures within Level 3 of the valuation hierarchy generally are based upon the significance of the unobservable factors to the overall fairvalue measurement. Included in the Level 3 classification are fixed maturities with indicative pricing obtained from brokers that otherwise could not becorroborated to market observable data. The Company applies various due diligence procedures, as considered appropriate, to validate these non-bindingbroker quotes for reasonableness, based on its understanding of the markets, including use of internally-developed assumptions about inputs a marketparticipant would use to price the security. In addition, asset-backed securities are classified as Level 3.
The Company also issues certain benefits on its variable annuity products that are accounted for as derivatives and are also considered Level 3. TheGMIBNLG feature allows the policyholder to receive guaranteed minimum lifetime annuity payments based on predetermined annuity purchase ratesapplied to the contract’s benefit base if and when the contract account value is depleted and the NLG feature is activated. The GMWB feature allows thepolicyholder to withdraw at minimum, over the life of the contract, an amount based on the contract’s benefit base. The GWBL feature allows thepolicyholder to withdraw, each year for the life of the contract, a specified annual percentage of an amount based on the contract’s benefit base. TheGMAB feature increases the contract account value at the end of a specified period to a GMAB base. The GIB feature provides a lifetime annuity basedon predetermined annuity purchase rates if and when the contract account value is depleted. This lifetime annuity is based on predetermined annuitypurchase rates applied to a GIB base.
37

Table of ContentsAXA EQUITABLE HOLDINGS, INC.
NOTES TO CONSOLIDATED FINANCIAL STATEMENTS(UNAUDITED)
Level 3 also includes the GMIB reinsurance contract assets, which are accounted for as derivative contracts. The GMIB reinsurance contract asset andliabilities’ fair value reflects the present value of reinsurance premiums and recoveries and risk margins over a range of market consistent economicscenarios while GMxB derivative features liability reflects the present value of expected future payments (benefits) less fees, adjusted for risk marginsand nonperformance risk, attributable to GMxB derivative features’ liability over a range of market-consistent economic scenarios.
The valuations of the GMIB reinsurance contract asset and GMxB derivative features liability incorporate significant non-observable assumptions relatedto policyholder behavior, risk margins and projections of equity Separate Accounts funds. The credit risks of the counterparty and of the Company areconsidered in determining the fair values of its GMIB reinsurance contract asset and GMxB derivative features liability positions, respectively, aftertaking into account the effects of collateral arrangements. Incremental adjustment to the swap curve for non-performance risk is made to the fair values ofthe GMIB reinsurance contract asset and liabilities and GMIBNLG feature to reflect the claims-paying ratings of counterparties and the Company. Equityand fixed income volatilities were modeled to reflect current market volatilities. Due to the unique, long duration of the GMIBNLG feature, adjustmentswere made to the equity volatilities to remove the illiquidity bias associated with the longer tenors and risk margins were applied to the non-capital markets inputs to the GMIBNLG valuations.
After giving consideration to collateral arrangements, the Company reduced the fair value of its GMIB reinsurance contract asset by $80 million and $112million at June 30, 2019 and December 31, 2018 , respectively, to recognize incremental counterparty non-performance risk and reduced the fair value ofits GMIB reinsurance contract liabilities by $32 million and $41 million at June 30, 2019 and December 31, 2018 , respectively, to recognize its ownincremental non-performance risk.
Lapse rates are adjusted at the contract level based on a comparison of the actuarially calculated guaranteed values and the current policyholder accountvalue, which include other factors such as considering surrender charges. Generally, lapse rates are assumed to be lower in periods when a surrendercharge applies. A dynamic lapse function reduces the base lapse rate when the guaranteed amount is greater than the account value as in the moneycontracts are less likely to lapse. For valuing the embedded derivative, lapse rates vary throughout the period over which cash flows are projected.
The Company’s Level 3 liabilities include contingent payment arrangements associated with acquisitions in 2010, 2014, 2016 and 2019 by AB. At eachreporting date, AB estimates the fair values of the contingent consideration expected to be paid based upon revenue and discount rate projections, usingunobservable market data inputs, which are included in Level 3 of the valuation hierarchy. The Company’s consolidated VIEs/VOEs hold investmentsthat are classified as Level 3, primarily corporate bonds that are vendor priced with no ratings available, bank loans, non-agency collateralized mortgageobligations and asset-backed securities.
During the six months ended June 30, 2019 , AFS fixed maturities with fair values of $73 million were transferred out of Level 3 and into Level 2principally due to the availability of trading activity and/or market observable inputs to measure and validate their fair values. In addition, AFS fixedmaturities with fair value of $14 million were transferred from Level 2 into the Level 3 classification. These transfers in the aggregate representapproximately 0.5% of total equity at June 30, 2019 .
During the six months ended June 30, 2018 , AFS fixed maturities with fair values of $28 million were transferred out of Level 3 and into Level 2principally due to the availability of trading activity and/or market observable inputs to measure and validate their fair values. In addition, AFS fixedmaturities with fair value of $65 million were transferred from Level 2 into the Level 3 classification. These transfers in the aggregate representapproximately 0.6% of total equity at June 30, 2018 .
The tables below present reconciliations for all Level 3 assets and liabilities for the three and six months ended June 30, 2019 and 2018 .
38

Table of ContentsAXA EQUITABLE HOLDINGS, INC.
NOTES TO CONSOLIDATED FINANCIAL STATEMENTS(UNAUDITED)
Level 3 Instruments - Fair Value Measurements
Corporate State and Political
Subdivisions Asset-backed Redeemable
Preferred Stock (in millions)Balance, April 1, 2019 $ 1,180 $ 40 $ 534 $ —Total gains (losses), realized and unrealized, included in:
Income (loss) as: Net investment income (loss) 2 — — —Investment gains (losses), net — — — —
Subtotal 2 — — —Other comprehensive income (loss) 1 1 1 —
Purchases 152 — (1) —Sales (26) (1) — —Settlements — — — —Transfers into Level 3 (1) (3) — — —Transfers out of Level 3 (1) (4) — — —Balance, June 30, 2019 $ 1,302 $ 40 $ 534 $ —
Balance, April 1, 2018 $ 1,253 $ 39 $ 540 $ —Total gains (losses), realized and unrealized, included in:
Income (loss) as: Net investment income (loss) 3 — — —Investment gains (losses), net 1 — — —
Subtotal 4 — — —Other comprehensive income (loss) 7 — (1) —
Purchases 11 — — —Sales (101) (1) (1) —Transfers into Level 3 (1) (2) — — —Transfers out of Level 3 (1) (12) — — —Balance, June 30, 2018 $ 1,160 $ 38 $ 538 $ —______________(1) Transfers into/out of Level 3 classifications are reflected at beginning of period fair values.
Corporate State and Political
Subdivisions Asset-backed Redeemable
Preferred Stock (in millions)
Balance, January 1, 2019 $ 1,186 $ 39 $ 519 $ —Total gains (losses), realized and unrealized, included in:
Income (loss) as: Net investment income (loss) 3 — — —Investment gains (losses), net — — — —
Subtotal 3 — — —Other comprehensive income (loss) 10 2 5 —
Purchases 222 — 10 —Sales (60) (1) — —Transfers into Level 3 (1) 14 — — —Transfers out of Level 3 (1) (73) — — —Balance, June 30, 2019 $ 1,302 $ 40 $ 534 $ —
39
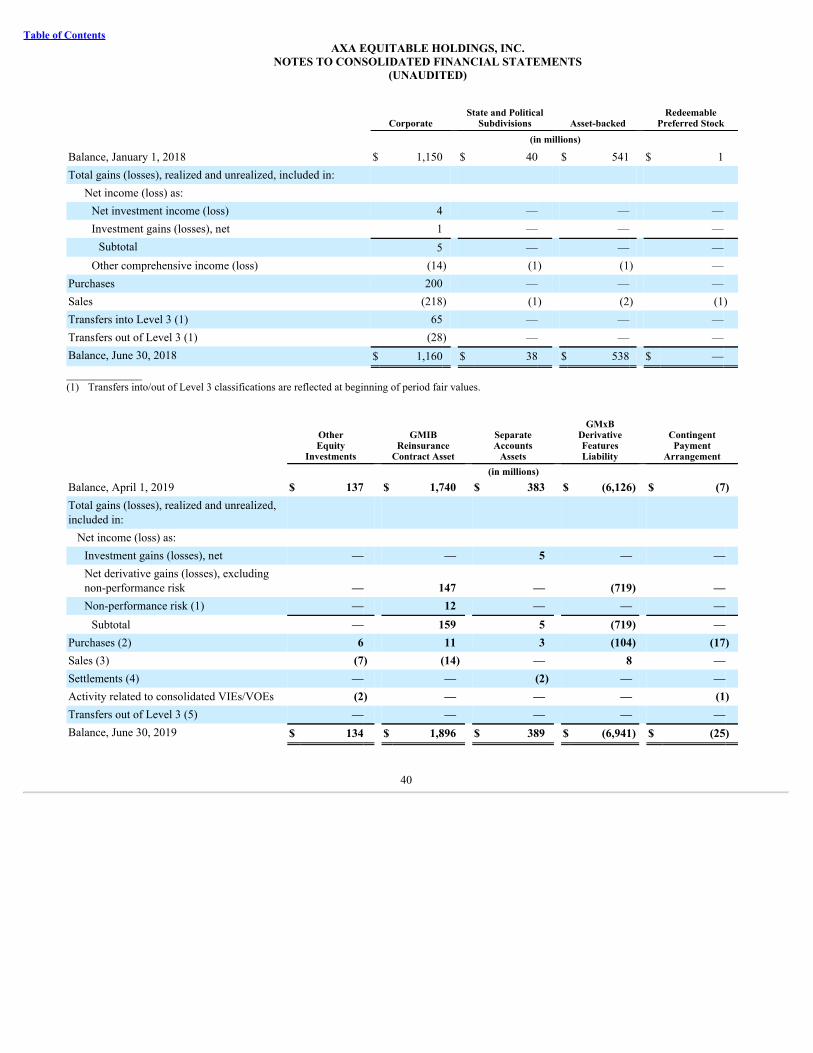
Table of ContentsAXA EQUITABLE HOLDINGS, INC.
NOTES TO CONSOLIDATED FINANCIAL STATEMENTS(UNAUDITED)
Corporate State and Political
Subdivisions Asset-backed Redeemable
Preferred Stock (in millions)
Balance, January 1, 2018 $ 1,150 $ 40 $ 541 $ 1Total gains (losses), realized and unrealized, included in:
Net income (loss) as: Net investment income (loss) 4 — — —Investment gains (losses), net 1 — — —
Subtotal 5 — — —Other comprehensive income (loss) (14) (1) (1) —
Purchases 200 — — —Sales (218) (1) (2) (1)Transfers into Level 3 (1) 65 — — —Transfers out of Level 3 (1) (28) — — —Balance, June 30, 2018 $ 1,160 $ 38 $ 538 $ —______________(1) Transfers into/out of Level 3 classifications are reflected at beginning of period fair values.
OtherEquity
Investments
GMIBReinsurance
Contract Asset
SeparateAccounts
Assets
GMxBDerivativeFeaturesLiability
ContingentPayment
Arrangement (in millions)Balance, April 1, 2019 $ 137 $ 1,740 $ 383 $ (6,126) $ (7)Total gains (losses), realized and unrealized,included in:
Net income (loss) as: Investment gains (losses), net — — 5 — —Net derivative gains (losses), excludingnon-performance risk — 147 — (719) —Non-performance risk (1) — 12 — — —
Subtotal — 159 5 (719) —Purchases (2) 6 11 3 (104) (17)Sales (3) (7) (14) — 8 —Settlements (4) — — (2) — —Activity related to consolidated VIEs/VOEs (2) — — — (1)Transfers out of Level 3 (5) — — — — —Balance, June 30, 2019 $ 134 $ 1,896 $ 389 $ (6,941) $ (25)
40
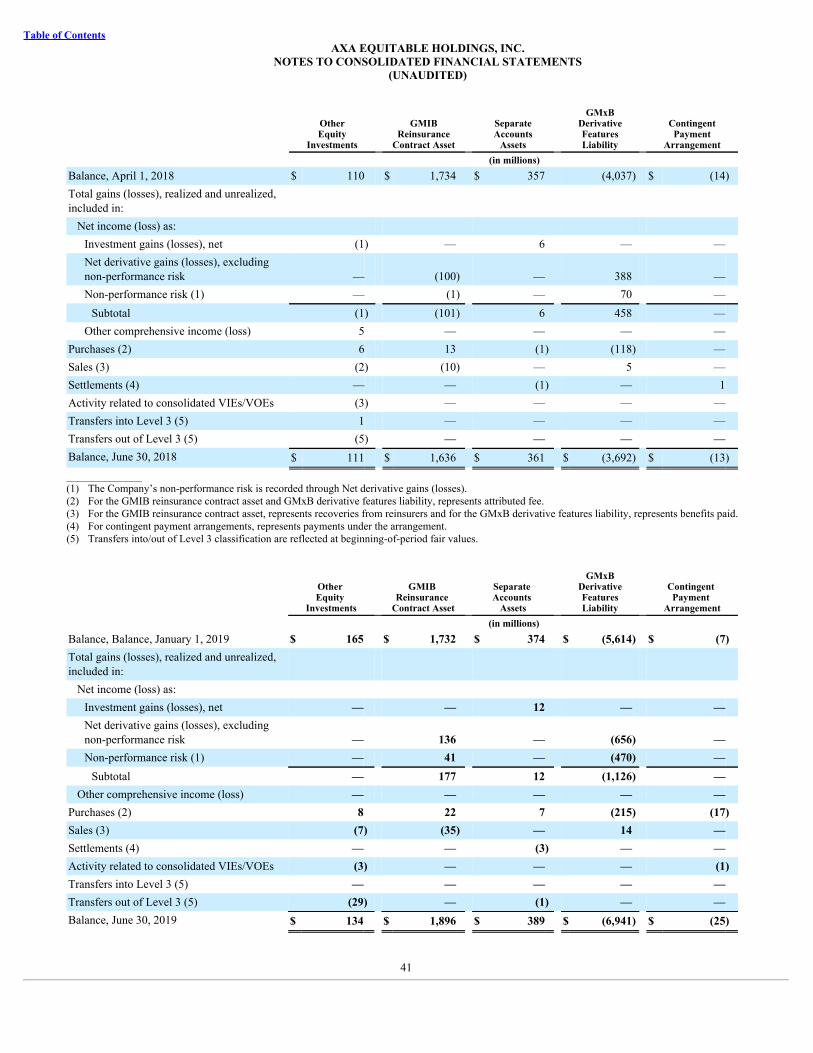
Table of ContentsAXA EQUITABLE HOLDINGS, INC.
NOTES TO CONSOLIDATED FINANCIAL STATEMENTS(UNAUDITED)
OtherEquity
Investments
GMIBReinsurance
Contract Asset
SeparateAccounts
Assets
GMxBDerivativeFeaturesLiability
ContingentPayment
Arrangement (in millions)Balance, April 1, 2018 $ 110 $ 1,734 $ 357 (4,037) $ (14)Total gains (losses), realized and unrealized,included in:
Net income (loss) as: Investment gains (losses), net (1) — 6 — —Net derivative gains (losses), excludingnon-performance risk — (100) — 388 —Non-performance risk (1) — (1) — 70 —
Subtotal (1) (101) 6 458 —Other comprehensive income (loss) 5 — — — —
Purchases (2) 6 13 (1) (118) —Sales (3) (2) (10) — 5 —Settlements (4) — — (1) — 1Activity related to consolidated VIEs/VOEs (3) — — — —Transfers into Level 3 (5) 1 — — — —Transfers out of Level 3 (5) (5) — — — —Balance, June 30, 2018 $ 111 $ 1,636 $ 361 $ (3,692) $ (13)______________(1) The Company’s non-performance risk is recorded through Net derivative gains (losses).(2) For the GMIB reinsurance contract asset and GMxB derivative features liability, represents attributed fee.(3) For the GMIB reinsurance contract asset, represents recoveries from reinsurers and for the GMxB derivative features liability, represents benefits paid.(4) For contingent payment arrangements, represents payments under the arrangement.(5) Transfers into/out of Level 3 classification are reflected at beginning-of-period fair values.
Other Equity
Investments
GMIB Reinsurance
Contract Asset
Separate Accounts
Assets
GMxBDerivativeFeaturesLiability
Contingent Payment
Arrangement (in millions)Balance, Balance, January 1, 2019 $ 165 $ 1,732 $ 374 $ (5,614) $ (7)Total gains (losses), realized and unrealized,included in:
Net income (loss) as: Investment gains (losses), net — — 12 — —Net derivative gains (losses), excludingnon-performance risk — 136 — (656) —Non-performance risk (1) — 41 — (470) —
Subtotal — 177 12 (1,126) —Other comprehensive income (loss) — — — — —
Purchases (2) 8 22 7 (215) (17)Sales (3) (7) (35) — 14 —Settlements (4) — — (3) — —Activity related to consolidated VIEs/VOEs (3) — — — (1)Transfers into Level 3 (5) — — — — —Transfers out of Level 3 (5) (29) — (1) — —Balance, June 30, 2019 $ 134 $ 1,896 $ 389 $ (6,941) $ (25)
41

Table of ContentsAXA EQUITABLE HOLDINGS, INC.
NOTES TO CONSOLIDATED FINANCIAL STATEMENTS(UNAUDITED)
Other Equity
Investments
GMIB Reinsurance
Contract Asset
Separate Accounts
Assets
GMxBDerivativeFeaturesLiability
Contingent Payment
Arrangement (in millions)Balance, Balance, January 1, 2018 $ 99 $ 1,894 $ 349 (4,451) $ (15)Total gains (losses), realized and unrealized,included in:
Net income (loss) as: Investment gains (losses), net (1) — 13 — —Net derivative gains (losses), excludingnon-performance risk — (255) — 845 —Non-performance risk (1) — (5) — 118 —
Subtotal (1) (260) 13 963 —Other comprehensive income (loss) 6 — — — —
Purchases (2) 10 23 2 (214) —Sales (3) (2) (21) (1) 10 —Settlements (4) — — (2) — 2Activity related to consolidated VIEs/VOEs (2) — — — —Transfers into Level 3 (5) 6 — — — —Transfers out of Level 3 (5) (5) — — — —Balance, June 30, 2018 $ 111 $ 1,636 $ 361 $ (3,692) $ (13)______________(1) The Company’s non-performance risk is recorded through Net derivative gains (losses).(2) For the GMIB reinsurance contract asset and GMxB derivative features liability, represents attributed fee.(3) For the GMIB reinsurance contract asset, represents recoveries from reinsurers and for the GMxB derivative features liability, represents benefits paid.(4) For contingent payment arrangements, represents payments under the arrangement.(5) Transfers into/out of Level 3 classification are reflected at beginning-of-period fair values.
The table below details changes in unrealized gains (losses) for the six months ended June 30, 2019 and 2018 by category for Level 3 assets and liabilitiesstill held at June 30, 2019 and 2018 .
Change in Unrealized Gains (Losses) for Level 3 Instruments
Net Income (Loss)
Investment Gains
(Losses), Net Net Derivative Gains
(Losses) OCI (in millions)Held at June 30, 2019:
Change in unrealized gains (losses): Fixed maturities, available-for-sale:
Corporate $ — $ — $ 10State and political subdivisions — — 3Asset-backed — — 5
Subtotal — — 18GMIB reinsurance contracts — 177 —Separate Accounts assets (1) 12 — —GMxB derivative features liability — (1,126) —
Total $ 12 $ (949) $ 18
42

Table of ContentsAXA EQUITABLE HOLDINGS, INC.
NOTES TO CONSOLIDATED FINANCIAL STATEMENTS(UNAUDITED)
Net Income (Loss)
Investment Gains
(Losses), Net Net Derivative Gains
(Losses) OCI (in millions)Held at June 30, 2018:
Change in unrealized gains (losses): Fixed maturities, available-for-sale:
Corporate $ — $ — $ (15)Commercial mortgage-backed — — —State and political subdivisions — — (1)Asset-backed — — 1
Subtotal — — (15)GMIB reinsurance contracts — (260) —Separate Accounts assets (1) 13 — —GMxB derivative features liability — 963 —
Total $ 13 $ 703 $ (15)______________(1) There is an investment expense that offsets this investment gain (loss).
The following tables disclose quantitative information about Level 3 fair value measurements by category for assets and liabilities at June 30, 2019 andDecember 31, 2018 .
Quantitative Information about Level 3 Fair Value Measurements at June 30, 2019
Fair Value
Valuation Technique
Significant Unobservable Input Range
WeightedAverage
(in millions) Assets: Investments:
Fixed maturities, available-for-sale:
Corporate $ 127 Matrix pricingmodel
Spread over benchmark
15 - 580 bps
95 bps
749
Market comparable companies
EBITDA multiplesDiscount rate
Cash flow multiples
4.1x - 44.6x 7.5% - 16.5%
7.5x - 16.5x
15.8x 11.1% 11.1x
Other equity investments 35
Discounted cashflow
Earnings multipleDiscount factorDiscount years
9.4x 10.0%
12
Separate Accounts assets 363
Third partyappraisal
Capitalization rateExit capitalization rate
Discount rate
4.4% 5.5% 6.4%
1 Discounted cashflow
Spread over U.S. Treasury curveDiscount factor
238 bps 4.3%
GMIB reinsurance contract asset 1,896
Discounted cashflow
Lapse ratesWithdrawal ratesUtilization rates
Non-performance riskVolatility rates - Equity
Mortality rates (1):Ages 0 - 40
Ages 41 - 60Ages 60 - 115
1% - 6.27% 0% - 8% 0% - 16%
46 - 127 bps 8% - 31%
0.01% - 0.18% 0.07% - 0.54% 0.42% - 42.0%
43

Table of ContentsAXA EQUITABLE HOLDINGS, INC.
NOTES TO CONSOLIDATED FINANCIAL STATEMENTS(UNAUDITED)
Fair Value
Valuation Technique
Significant Unobservable Input Range
WeightedAverage
(in millions) Liabilities:
GMIBNLG 6,620
Discounted cashflow
Non-performance riskLapse rates
Withdrawal ratesAnnuitization
Mortality rates (1):Ages 0 - 40
Ages 41 - 60Ages 60 - 115
149 bps 0.8% - 26.2%
0.0% - 12.144% 0.0% - 100.0%
0.01% - 0.19% 0.06% - 0.53% 0.41% - 41.2%
Assumed GMIB ReinsuranceContracts
192
Discounted cashflow
Lapse ratesWithdrawal rates (Age 0 - 85)
Withdrawal rates (Age 86+)Utilization rates
Non-performance riskVolatility rates - Equity
1.1% - 11.2% 0.6% - 22.2% 1.2% - 100.0% 0.0% - 30.0% 0.75% - 1.75% 8.0% - 31.0%
GWBL/GMWB 152
Discounted cashflow
Lapse ratesWithdrawal ratesUtilization rates
Volatility rates - Equity
0.5% - 5.7% 0.0% - 7.0%
100% after delay 8.0% - 31.0%
GIB (28)
Discounted cashflow
Lapse ratesWithdrawal ratesUtilization rates
Volatility rates - Equity
0.5% - 5.7% 0.0% - 8.0%
0.0% - 16.0% 8.0% - 31.0%
GMAB 5 Discounted cashflow
Lapse ratesVolatility rates - Equity
0.5% - 11.0% 8.0% - 31.0%
______________(1) Mortality rates vary by age and demographic characteristic such as gender. Mortality rate assumptions are based on a combination of company and industry
experience. A mortality improvement assumption is also applied. For any given contract, mortality rates vary throughout the period over which cash flows areprojected for purposes of valuating the embedded derivatives.
Quantitative Information about Level 3 Fair Value Measurements at December 31, 2018
Fair Value
Valuation Technique
Significant Unobservable Input Range
WeightedAverage
(in millions) Assets: Investments:
Fixed maturities, available-for-sale:
Corporate $ 99 Matrix pricing model Spread over benchmark 15 - 580 bps 109 bps
881
Market comparablecompanies
EBITDA multiples Discount rate
Cash flow multiples
4.1x - 37.8x 6.4% - 16.5% 1.8x - 18.0x
12.1x 10.7% 11.4x
Other equity investments 35
Discounted cash flow
Earnings multiple Discount factor Discount years
9.4x 10.0%
12
Separate Accounts assets 352
Third party appraisal
Capitalization rate Exit capitalization rate
Discount rate
4.4% 5.6% 6.5%
1 Discounted cash flow Spread over U.S. Treasury curve
Discount factor 248bps
5.1%
GMIB reinsurance contract asset 1,732
Discounted cash flow
Lapse rates Withdrawal rates Utilization rates
Non-performance risk Volatility rates - Equity
Mortality rates (1): Ages 0 - 40
Ages 41 - 60 Ages 60 - 115
1% - 6.27% 0% - 8% 0% - 16%
74 - 159 bps 10% - 34%
0.01% - 0.18% 0.07% - 0.54% 0.42% - 42.0%

44

Table of ContentsAXA EQUITABLE HOLDINGS, INC.
NOTES TO CONSOLIDATED FINANCIAL STATEMENTS(UNAUDITED)
Fair Value
Valuation Technique
Significant Unobservable Input Range
WeightedAverage
(in millions) Liabilities:
GMIBNLG 5,341
Discounted cash flow
Non-performance risk Lapse rates
Withdrawal rates Annuitization
Mortality rates (1): Ages 0 - 40
Ages 41 - 60 Ages 60 - 115
189 bps 0.8% - 26.2% 0.0% - 12.1%
0.0% - 100.0%
0.01% - 0.19% 0.06% - 0.53% 0.41% - 41.2%
Assumed GMIB ReinsuranceContracts
183
Discounted cash flow
Lapse rates Withdrawal rates (Age 0 - 85)
Withdrawal rates (Age 86+) Utilization rates
Non-performance risk Volatility rates - Equity
1.1% - 11.2% 0.7% - 22.2%
1.3% - 100.0% 0.0% - 30.0% 1.1% - 2.4%
10.0% - 34.0%
GWBL/GMWB 130
Discounted cash flow
Lapse rates Withdrawal rates Utilization rates
Volatility rates - Equity
0.5% - 5.7% 0.0% - 7.0%
100% after delay 10.0% - 34.0%
GIB (48)
Discounted cash flow
Lapse rates Withdrawal rates Utilization rates
Volatility rates - Equity
0.5% - 5.7% 0.0% - 8.0% 0.0% - 16.0% 10.0% - 34.0%
GMAB 7 Discounted cash flow Lapse rates
Volatility rates - Equity 0.5% - 11.0% 10.0% - 34.0%
______________(1) Mortality rates vary by age and demographic characteristic such as gender. Mortality rate assumptions are based on a combination of company and industry
experience. A mortality improvement assumption is also applied. For any given contract, mortality rates vary throughout the period over which cash flows areprojected for purposes of valuating the embedded derivatives.
Excluded from the tables above at June 30, 2019 and December 31, 2018 , respectively, are approximately $1,124 million and $915 million of Level 3 fairvalue measurements of investments for which the underlying quantitative inputs are not developed by the Company and are not readily available. Theseinvestments primarily consist of certain privately placed debt securities with limited trading activity, including residential mortgage- and asset-backedinstruments, and their fair values generally reflect unadjusted prices obtained from independent valuation service providers and indicative, non-bindingquotes obtained from third-party broker-dealers recognized as market participants. Significant increases or decreases in the fair value amounts receivedfrom these pricing sources may result in the Company’s reporting significantly higher or lower fair value measurements for these Level 3 investments.
The fair value of private placement securities is determined by application of a matrix pricing model or a market comparable company value technique.The significant unobservable input to the matrix pricing model valuation technique is the spread over the industry-specific benchmark yield curve.Generally, an increase or decrease in spreads would lead to directionally inverse movement in the fair value measurements of these securities. Thesignificant unobservable input to the market comparable company valuation technique is the discount rate. Generally, a significant increase (decrease) inthe discount rate would result in significantly lower (higher) fair value measurements of these securities.
Residential mortgage-backed securities classified as Level 3 primarily consist of non-agency paper with low trading activity. Included in the tables aboveat June 30, 2019 and December 31, 2018 , there were no Level 3 securities that were determined by application of a matrix pricing model and for whichthe spread over the U.S. Treasury curve is the most significant unobservable input to the pricing result. Generally, a change in spreads would lead todirectionally inverse movement in the fair value measurements of these securities.
Asset-backed securities classified as Level 3 primarily consist of non-agency mortgage loan trust certificates, including subprime and Alt-A paper, credittenant loans, and equipment financings. Included in the tables above at June 30, 2019 and December 31, 2018 , there were no securities that weredetermined by the application of matrix-pricing for which the spread over the U.S. Treasury curve is the most significant unobservable input to the pricing
45

Table of ContentsAXA EQUITABLE HOLDINGS, INC.
NOTES TO CONSOLIDATED FINANCIAL STATEMENTS(UNAUDITED)
result. Significant increases (decreases) in spreads would result in significantly lower (higher) fair value measurements.
Included in other equity investments classified as Level 3 are reporting entities’ venture capital securities in the Technology, Media andTelecommunications industries. The fair value measurements of these securities include significant unobservable inputs including an enterprise value torevenue multiples and a discount rate to account for liquidity and various risk factors. Significant increases (decreases) in the enterprise value to revenuemultiple inputs in isolation would result in a significantly higher (lower) fair value measurement. Significant increases (decreases) in the discount ratewould result in a significantly lower (higher) fair value measurement.
Separate Accounts assets classified as Level 3 in the table at June 30, 2019 and December 31, 2018 , primarily consist of a private real estate fund andmortgage loans. A third-party appraisal valuation technique is used to measure the fair value of the private real estate investment fund, includingconsideration of observable replacement cost and sales comparisons for the underlying commercial properties, as well as the results from applying adiscounted cash flow approach. Significant increase (decrease) in isolation in the capitalization rate and exit capitalization rate assumptions used in thediscounted cash flow approach to the appraisal value would result in a higher (lower) measure of fair value. With respect to the fair value measurement ofmortgage loans a discounted cash flow approach is applied, a significant increase (decrease) in the assumed spread over U.S. Treasury securities wouldproduce a lower (higher) fair value measurement. Changes in the discount rate or factor used in the valuation techniques to determine the fair values ofthese private equity investments and mortgage loans generally are not correlated to changes in the other significant unobservable inputs. Significantincrease (decrease) in isolation in the discount rate or factor would result in significantly lower (higher) fair value measurements. These fair valuemeasurements are determined using substantially the same valuation techniques as earlier described above for the Company’s General Accountinvestments in these securities.
Significant unobservable inputs with respect to the fair value measurement of the Level 3 GMIB reinsurance contract asset and the Level 3 liabilitiesidentified in the table above are developed using the Company data. Validations of unobservable inputs are performed to the extent the Company hasexperience. When an input is changed the model is updated and the results of each step of the model are analyzed for reasonableness.
The significant unobservable inputs used in the fair value measurement of the Company’s GMIB reinsurance contract asset are lapse rates, withdrawalrates, and GMIB utilization rates. Significant increases in GMIB utilization rates or decreases in lapse or withdrawal rates in isolation would tend toincrease the GMIB reinsurance contract asset.
Fair value measurement of the GMIB reinsurance contract asset and liabilities includes dynamic lapse and GMIB utilization assumptions wherebyprojected contractual lapses and GMIB utilization reflect the projected net amount of risks of the contract. As the net amount of risk of a contractincreases, the assumed lapse rate decreases and the GMIB utilization increases. Increases in volatility would increase the asset and liabilities.
The significant unobservable inputs used in the fair value measurement of the Company’s GMIBNLG liability are lapse rates, withdrawal rates, GMIButilization rates, adjustment for Non-performance risk and NLG forfeiture rates. NLG forfeiture rates are caused by excess withdrawals above the annualGMIB accrual rate that cause the NLG to expire. Significant decreases in lapse rates, NLG forfeiture rates, adjustment for non-performance risk andGMIB utilization rates would tend to increase the GMIBNLG liability, while decreases in withdrawal rates and volatility rates would tend to decrease theGMIBNLG liability.
The significant unobservable inputs used in the fair value measurement of the Company’s GMWB and GWBL liability are lapse rates and withdrawalrates. Significant increases in withdrawal rates or decreases in lapse rates in isolation would tend to increase these liabilities. Increases in volatility wouldincrease these liabilities.
At June 30, 2019 and December 31, 2018 , there were acquisition-related contingent liabilities of $26 million and $7 million , relating to AB’s 2019 and2016 acquisitions. The 2019 acquisition was valued at June 30, 2019 using expected revenue growth rates ranging from 0.7% to 2.5% per year and adiscount rate of 10.4% , reflecting a 3.5% risk-free rate, based on AB’s cost of debt, and a 6.9% market price of risk adjustment rate. The 2016 acquisitionwas valued using a revenue growth rate of 26.0% and a discount rate ranging from 3.2% to 3.7% .
Certain financial instruments are exempt from the requirements for fair value disclosure, such as insurance liabilities other than financial guarantees andinvestment contracts, limited partnerships accounted for under the equity method and pension and other postretirement obligations.
46

Table of ContentsAXA EQUITABLE HOLDINGS, INC.
NOTES TO CONSOLIDATED FINANCIAL STATEMENTS(UNAUDITED)
The carrying values and fair values at June 30, 2019 and December 31, 2018 for financial instruments not otherwise disclosed in Notes 3 and 4 arepresented in the table below.
Carrying Values and Fair Values for Financial Instruments Not Otherwise Disclosed
Carrying Value
Fair Value
Level 1 Level 2 Level 3 Total (in millions)June 30, 2019:
Mortgage loans on real estate $ 12,288 $ — $ — $ 12,429 $ 12,429FHLBNY Funding Agreements $ 4,001 $ — $ 4,039 $ — $ 4,039Policy loans $ 3,740 $ — $ — $ 4,566 $ 4,566Policyholders’ liabilities: Investment contracts $ 2,084 $ — $ — $ 2,248 $ 2,248Short-term and long-term debt $ 4,852 $ — $ 5,087 $ — $ 5,087Separate Accounts liabilities $ 8,381 $ — $ — $ 8,381 $ 8,381
December 31, 2018: Mortgage loans on real estate $ 11,835 $ — $ — $ 11,494 $ 11,494FHLBNY Funding Agreements $ 4,002 $ — $ 3,956 $ — $ 3,956Policy loans $ 3,779 $ — $ — $ 4,183 $ 4,183Policyholders’ liabilities: Investment contracts $ 2,127 $ — $ — $ 2,174 $ 2,174Short-term and long-term debt $ 4,955 $ — $ 4,749 $ — $ 4,749Separate Accounts liabilities $ 7,406 $ — $ — $ 7,406 $ 7,406
As our COLI policies are recorded at their cash surrender value, they are not required to be included in the table above.
Fair values for commercial and agricultural mortgage loans on real estate are measured by discounting future contractual cash flows to be received on themortgage loan using interest rates at which loans with similar characteristics and credit quality would be made. The discount rate is derived based on theappropriate U.S. Treasury rate with a like term to the remaining term of the loan to which a spread reflective of the risk premium associated with thespecific loan is added. Fair values for mortgage loans anticipated to be foreclosed and problem mortgage loans are limited to the fair value of theunderlying collateral, if lower.
Fair values for the Company’s long-term debt related to real estate joint ventures are determined by a third-party appraisal and assessed forreasonableness. The Company’s short-term debt primarily includes commercial paper with short-term maturities and carrying value approximates fairvalue. The fair values for the Company’s other long-term debt are determined by Bloomberg’s evaluated pricing service, which uses direct observationsor observed comparables.
The fair value of policy loans is calculated by discounting expected cash flows based upon the U.S. treasury yield curve and historical loan repaymentpatterns.
The fair values of the Company's funding agreements are determined by discounted cash flow analysis based on the indicative funding agreement ratespublished by the FHLB.
The fair values for the Company’s association plans contracts, supplementary contracts not involving life contingencies (“SCNILC”), deferred annuitiesand certain annuities, which are included in Policyholders’ account balances and liabilities for investment contracts with fund investments in SeparateAccounts are estimated using projected cash flows discounted at rates reflecting current market rates. Significant unobservable inputs reflected in the cashflows include lapse rates and withdrawal rates. Incremental adjustments may be made to the fair value to reflect non-performance risk. Certain otherproducts such as Access Accounts and Escrow Shield Plus product reserves are held at book value.
47

Table of ContentsAXA EQUITABLE HOLDINGS, INC.
NOTES TO CONSOLIDATED FINANCIAL STATEMENTS(UNAUDITED)
8 ) LEASES
Leases with an initial term of 12 months or less are not recorded on the balance sheet; we recognize lease expense for these leases on a straight-line basisover the lease term. For those leases with a term greater than one year, the Company recognizes on the balance sheet at the time of lease commencementor modification a right of use (“RoU”) operating lease asset and a lease liability, initially measured at the present value of the lease payments. Lease costsare recognized in the income statement over the lease term on a straight-line basis. RoU assets represent our right to use an underlying asset for the leaseterm and lease liabilities represent our obligation to make lease payments arising from the lease.
The Company's lease population primarily consists of real estate leases for office space. The Company also has operating leases for various types offurniture and office equipment. For certain equipment leases, the Company applies a portfolio approach to effectively account for the operating lease RoUassets and liabilities. For certain lease agreements entered into or reassessed after the adoption of ASC 842, the Company elected to combine the lease andrelated non-lease components for its operating leases; however, the non-lease components associated with the Company’s operating leases are primarilyvariable in nature and as such are not included in the determination of the RoU asset and lease liability but are recognized in the period in which theobligation for those payments is incurred.
The Company’s operating leases may include options to extend or terminate the lease, which are not included in the determination of the RoU asset orlease liability unless they are reasonably certain to be exercised. The Company's operating leases have remaining lease terms of one year to 12 years,some of which include options to extend the leases. The Company typically does not include its renewal options in its lease terms for calculating its RoUoperating lease asset and lease liability as the renewal options allow the Company to maintain operational flexibility and the Company is not reasonablycertain it will exercise these renewal options until close to the initial end date of the lease. The Company’s lease agreements do not contain any materialresidual value guarantees or material restrictive covenants.
As the Company's leases do not provide an implicit rate, we used an incremental borrowing rate based on the information available at the leasecommencement date in determining the present value of lease payments.
The Company primarily subleases floor space within our New Jersey and New York lease properties to various third parties. The lease term for thesubleases typically corresponds to the head lease term.
Balance Sheet Classification of Operating Lease Assets and Liabilities
Balance Sheet Line Item June 30, 2019
(in millions)Assets
Operating lease asset Other Assets $ 726Liabilities
Operating lease liability Other Liabilities $ 938
The table below summarizes the components of lease costs for the three and six months ended June 30, 2019 .
Lease Costs
Three Months Ended
June 30, 2019 Six Months Ended
June 30, 2019 (in millions)Operating lease cost (1) $ 46 $ 93Variable operating lease cost $ 11 $ 24Sublease income $ (18) $ (37)Short-term lease expense $ 1 $ 2_____________(1) The Operating lease cost for the three months ended March 31, 2019 previously reported as $81 million , has been revised to $47 million to properly exclude
impairments recognized prior to the adoption of ASC 842.
48

Table of ContentsAXA EQUITABLE HOLDINGS, INC.
NOTES TO CONSOLIDATED FINANCIAL STATEMENTS(UNAUDITED)
Maturities of lease liabilities as of June 30, 2019 are as follows:
Maturities of Lease Liabilities
June 30, 2019 (in millions)Operating Leases: 2019 $ 1102020 2042021 1902022 1722023 157Thereafter 198Total lease payments 1,031Less: Interest (93)
Present value of lease liabilities $ 938
As of June 30, 2019 , AXA Equitable Life entered into one additional operating real estate lease that has not yet commenced with an estimated total baserent of approximately $11 million . This operating lease will commence in 2019 with a lease term of ten years . During October 2018, AB signed a lease,which commences in mid-2020, relating to 205,000 square feet of space at AB’s new Nashville headquarters. The estimated total base rent obligation(excluding taxes, operating expenses and utilities) over the 15 -year initial lease term is $126 million . During April 2019, AB signed a lease, whichcommences in 2024, relating to approximately 190,000 square feet of space in New York City. The estimated total base rent obligation (excluding taxes,operating expenses and utilities) over the 20 -year lease term is approximately $448 million .
The below table shows the weighted average operating lease term and discount rate for the Company and its subsidiaries. The averages presented areblended rates derived by weighting the calculated values from internal lease systems of our subsidiaries with the proportional value of their leaseliabilities.
Weighted Average of Lease Term and Discount Rate
June 30, 2019
Weighted average remaining operating lease term 6 yearsWeighted average discount rate for operating leases 3.32%
Supplemental cash flow information related to leases was as follows:
Lease Liabilities Information
Six Months Ended
June 30, 2019 (in millions)Cash paid for amounts included in the measurement of lease liabilities:
Operating cash flows from operating leases $ 113Non-cash transactions:
Leased assets obtained in exchange for new operating lease liabilities $ 11
49

Table of ContentsAXA EQUITABLE HOLDINGS, INC.
NOTES TO CONSOLIDATED FINANCIAL STATEMENTS(UNAUDITED)
The following table presents the Company’s future minimum lease obligation under ASC 840 as of December 31, 2018 :
December 31, 2018Calendar Year (in millions)2019 $ 2122020 $ 1862021 $ 1812022 $ 1662023 $ 155Thereafter $ 293
9 ) EMPLOYEE BENEFIT PLANS
Holdings sponsors the MONY Life Retirement Income Security Plan for Employees and AXA Equitable Life sponsors the AXA Equitable RetirementPlan (the “AXA Equitable Life QP”), both of which are frozen qualified defined benefit plans covering eligible employees and financial professionals.Holdings is primarily liable for both plans. AXA Equitable Life is secondarily liable for obligations under the AXA Equitable Life QP.
AB maintains a qualified, noncontributory, defined benefit retirement plan covering current and former employees who were employed by AB in theUnited States prior to October 2, 2000. Benefits are based on years of credited service, average final base salary and primary Social Security benefits.
Components of certain benefit costs for the Company were as follows:
Three Months Ended June 30, Six Months Ended June 30,
2019 2018 2019 2018 (in millions)Net Periodic Pension Expense (Qualified Plans):
Service cost $ 2 $ 2 $ 4 $ 4Interest cost 22 22 44 43Expected return on assets (39) (40) (77) (83)Actuarial (gain) loss — 1 — 1Net amortization 20 20 40 46Partial settlement — 2 — 101
Total $ 5 $ 7 $ 11 $ 112
10 ) INCOME TAXES
Income tax expense for the three and six months ended June 30, 2019 and 2018 was computed using an estimated annual effective tax rate (“ETR”), withdiscrete items recognized in the period in which they occur. The estimated ETR is revised, as necessary, at the end of successive interim reportingperiods. During the second quarter of 2019, the Company released a state income tax liability due to recently drafted regulations. The benefit recorded inthe Company’s financial statements was $63 million .
11 ) RELATED PARTY TRANSACTIONS
The Company’s significant transactions during the six months ended June 30, 2019 with related parties are summarized below.
Termination of Trademark License Agreement
50

Table of ContentsAXA EQUITABLE HOLDINGS, INC.
NOTES TO CONSOLIDATED FINANCIAL STATEMENTS(UNAUDITED)
On March 28, 2019 , AXA terminated the Trademark License Agreement, dated May 4, 2018 , between Holdings and AXA (the “Trademark LicenseAgreement”). Accordingly, we expect to rebrand and cease use, pursuant to the Trademark License Agreement, of the “AXA” brand, name and logowithin 18 months of March 28, 2019 (subject to such extensions as permitted under the Trademark License Agreement).
AXA Secondary Offering of Holdings Common Stock and Holdings Share Buyback
On March 25, 2019 , AXA completed a follow-on secondary offering of 46 million shares of common stock of Holdings and the sale to Holdings of30 million shares of common stock of Holdings.
12 ) EQUITY
Dividends to Shareholders
On February 14, 2019 and May 23, 2019 , Holdings’ Board of Directors declared a cash dividend on Holdings’ common stock of $0.13 and $0.15 pershare, respectively, payable on March 15, 2019 and June 11, 2019 to shareholders of record as of March 5, 2019 and June 3, 2019 , respectively. OnAugust 8, 2019 , Holdings’ Board of Directors declared a cash dividend on Holdings’ common stock of $0.15 per share, payable on August 29, 2019 toshareholders of record as of August 22, 2019 . The payment of any future dividends will be at the discretion of Holdings’ Board of Directors and willdepend on various factors.
Share Repurchase
In January 2019, Holdings entered into an Accelerated Share Repurchase agreement (the “ASR”) with a third-party financial institution to repurchase anaggregate of $150 million of Holdings’ common stock. Pursuant to the ASR, Holdings made a prepayment of $150 million and received initial deliveryof seven million shares. The ASR terminated during the first quarter of 2019, at which time an additional one million shares were delivered, at an averagepurchase price of $ 18.51 per share based on the volume-weighted average price of Holding’s common stock traded during the pricing period, less anagreed discount. Shares repurchased under the ASR were retired upon receipt resulting in a reduction of Holding’s total issued shares as of June 30, 2019.
On February 27, 2019, Holdings’ Board of Directors authorized a $800 million share repurchase program. Under this authorization, Holdings, may, fromtime to time through December 31, 2019, purchase shares of its common stock through various means. Holdings may choose to suspend or discontinuethe repurchase program at any time. The repurchase program does not obligate Holdings to purchase any particular number of shares.
On March 25, 2019, AXA completed a secondary offering of 46 million shares of common stock of Holdings and the sale to Holdings of 30 millionshares of common stock of Holdings. Following the completion of the share buyback by Holdings, Holdings had approximately $200 million remainingunder its share repurchase program authorization.
Accumulated Other Comprehensive Income (Loss)
AOCI represents cumulative gains (losses) on items that are not reflected in Net income (loss). The balances as of June 30, 2019 and 2018 follow:
June 30,
2019 2018 (in millions)Unrealized gains (losses) on investments (1) $ 1,799 $ (486)Defined benefit pension plans (901) (821)Foreign currency translation adjustments (1) (62) (41)
Total accumulated other comprehensive income (loss) 836 (1,348)Less: Accumulated other comprehensive income (loss) attributable to noncontrolling interest (40) (38)
Accumulated other comprehensive income (loss) attributable to Holdings $ 876 $ (1,310)______________
51

Table of ContentsAXA EQUITABLE HOLDINGS, INC.
NOTES TO CONSOLIDATED FINANCIAL STATEMENTS(UNAUDITED)
(1) A reclassification of $8 million has been made to the June 30, 2018 previously reported balances to conform to the current period’s presentation.
The components of OCI, net of taxes for the three and six months ended June 30, 2019 and 2018 follow:
Three Months Ended June 30, Six Months Ended June 30,
2019 2018 2019 2018 (in millions)Change in net unrealized gains (losses) on investments:
Net unrealized gains (losses) arising during the period 1,381 (397) $ 2,723 $ (1,618)(Gains) losses reclassified to Net income (loss) during the period(1) (4) 16 5 (72)
Net unrealized gains (losses) on investments 1,377 (381) 2,728 (1,690)Adjustments for policyholders’ liabilities, DAC, insuranceliability loss recognition and other (2) (8) 32 (525) 379
Change in unrealized gains (losses), net of adjustments (net ofdeferred income tax expense (benefit) of $362, $(94), $580and $(349)) 1,369 (349) 2,203 (1,311)
Change in defined benefit plans: Reclassification to Net income (loss) of amortization of net priorservice credit included in net periodic cost 18 1 67 134
Change in defined benefit plans (net of deferred income taxexpense (benefit) of $(5), $(1), $17 and $34) 18 1 67 134
Foreign currency translation adjustments: Foreign currency translation gains (losses) arising during theperiod (2) 1 (8) — (11)
Foreign currency translation adjustment 1 (8) — (11)Total other comprehensive income (loss), net of income taxes 1,388 (356) 2,270 (1,188)
Less: Other comprehensive income (loss) attributable tononcontrolling interest (1) 8 (2) 14
Other comprehensive income (loss) attributable to Holdings $ 1,389 $ (364) $ 2,272 $ (1,202)______________(1) See “Reclassification adjustments” in Note 3 . Reclassification amounts presented net of income tax expense (benefit) of $(1) million , $4 million , $1 million and
$(19) million for the three and six months ended June 30, 2019 and 2018 , respectively.(2) A reclassification of $1 million and $3 million has been made to the previously reported amounts for the three and six months ended June 30, 2018 to conform to
the current period’s presentation.
Investment gains and losses reclassified from AOCI to Net income (loss) primarily consist of realized gains (losses) on sales and OTTI of AFS securitiesand are included in Total investment gains (losses), net on the consolidated statements of income (loss). Amounts reclassified from AOCI to Net income(loss) as related to defined benefit plans primarily consist of amortizations of net (gains) losses and net prior service cost (credit) recognized as acomponent of net periodic cost and reported in Compensation and benefit expenses in the consolidated statements of income (loss). Amounts presented inthe table above are net of tax.
52

Table of ContentsAXA EQUITABLE HOLDINGS, INC.
NOTES TO CONSOLIDATED FINANCIAL STATEMENTS(UNAUDITED)
13 ) REDEEMABLE NONCONTROLLING INTEREST
The changes in the components of redeemable noncontrolling interests were:
Three Months Ended June 30, Six Months Ended June 30,
2019 2018 2019 2018 (in millions)Balance, beginning of period $ 207 $ 1,024 $ 187 $ 626Net earnings (loss) attributable to redeemable noncontrollinginterests 7 14 19 34Purchase/change of redeemable noncontrolling interests 43 (892) 51 (514)
Balance, end of period $ 257 $ 146 $ 257 $ 146
14 ) COMMITMENTS AND CONTINGENT LIABILITIES
Litigation
Litigation, regulatory and other loss contingencies arise in the ordinary course of the Company’s activities as a diversified financial services firm. TheCompany is a defendant in a number of litigation matters arising from the conduct of its business. In some of these matters, claimants seek to recover verylarge or indeterminate amounts, including compensatory, punitive, treble and exemplary damages. Modern pleading practice in the U.S. permitsconsiderable variation in the assertion of monetary damages and other relief. Claimants are not always required to specify the monetary damages theyseek, or they may be required only to state an amount sufficient to meet a court’s jurisdictional requirements. Moreover, some jurisdictions allowclaimants to allege monetary damages that far exceed any reasonably possible verdict. The variability in pleading requirements and past experiencedemonstrates that the monetary and other relief that may be requested in a lawsuit or claim often bears little relevance to the merits or potential value of aclaim. Litigation against the Company includes a variety of claims including, among other things, insurers’ sales practices, alleged agent misconduct,alleged failure to properly supervise agents, contract administration, product design, features and accompanying disclosure, cost of insurance increases,the use of captive reinsurers, payments of death benefits and the reporting and escheatment of unclaimed property, alleged breach of fiduciary duties,alleged mismanagement of client funds and other matters.
As with other financial services companies, the Company periodically receives informal and formal requests for information from various state andfederal governmental agencies and self-regulatory organizations in connection with inquiries and investigations of the products and practices of theCompany or the financial services industry. It is the practice of the Company to cooperate fully in these matters.
The outcome of a litigation or regulatory matter is difficult to predict, and the amount or range of potential losses associated with these or other losscontingencies requires significant management judgment. It is not possible to predict the ultimate outcome or to provide reasonably possible losses orranges of losses for all pending regulatory matters, litigation and other loss contingencies. While it is possible that an adverse outcome in certain casescould have a material adverse effect upon the Company’s financial position, based on information currently known, management believes that neither theoutcome of pending litigation and regulatory matters, nor potential liabilities associated with other loss contingencies, are likely to have such an effect.However, given the large and indeterminate amounts sought in certain litigation and the inherent unpredictability of all such matters, it is possible that anadverse outcome in certain of the Company’s litigation or regulatory matters, or liabilities arising from other loss contingencies, could, from time to time,have a material adverse effect upon the Company’s results of operations or cash flows in a particular quarterly or annual period.
For some matters where a loss is reasonably possible, the Company is able to estimate a possible range of loss. For such matters in which a loss isprobable, an accrual has been made. For matters where the Company, however, believes a loss is reasonably possible, but not probable, no accrual isrequired. For matters for which an accrual has been made, but there remains a reasonably possible range of loss in excess of the amounts accrued or formatters where no accrual is required, the Company develops an estimate of the unaccrued amounts of the reasonably possible range of losses. As
53

Table of ContentsAXA EQUITABLE HOLDINGS, INC.
NOTES TO CONSOLIDATED FINANCIAL STATEMENTS(UNAUDITED)
of June 30, 2019 , the Company estimates the aggregate range of reasonably possible losses, in excess of any amounts accrued for these matters as of suchdate, to be up to approximately $100 million .
For other matters, the Company is currently not able to estimate the reasonably possible loss or range of loss. The Company is often unable to estimate thepossible loss or range of loss until developments in such matters have provided sufficient information to support an assessment of the range of possibleloss, such as quantification of a damage demand from plaintiffs, discovery from plaintiffs and other parties, investigation of factual allegations, rulings bya court on motions or appeals, analysis by experts and the progress of settlement discussions. On a quarterly and annual basis, the Company reviewsrelevant information with respect to litigation and regulatory contingencies and updates the Company’s accruals, disclosures and reasonably possiblelosses or ranges of loss based on such reviews.
In August 2015, a lawsuit was filed in Connecticut Superior Court, Judicial Division of New Haven entitled Richard T. O’Donnell, on behalf of himselfand all others similarly situated v. AXA Equitable Life Insurance Company. This lawsuit is a putative class action on behalf of all persons who purchasedvariable annuities from AXA Equitable Life, which were subsequently subjected to the volatility management strategy and who suffered injury as a resultthereof. Plaintiff asserts a claim for breach of contract alleging that AXA Equitable Life implemented the volatility management strategy in violation ofapplicable law. In November 2015, the Connecticut Federal District Court transferred this action to the United States District Court for the SouthernDistrict of New York. In March 2017, the Southern District of New York granted AXA Equitable Life’s motion to dismiss the complaint. In April 2017,the plaintiff filed a notice of appeal. In April 2018, the United States Court of Appeals for the Second Circuit reversed the trial court’s decision withinstructions to remand the case to Connecticut state court. In September 2018, the Second Circuit issued its mandate, following AXA Equitable Life’snotification to the court that it would not file a petition for writ of certiorari. The case was transferred in December 2018 and is pending in ConnecticutSuperior Court, Judicial District of Stamford. We are vigorously defending this matter.
In February 2016, a lawsuit was filed in the United States District Court for the Southern District of New York entitled Brach Family Foundation, Inc. v.AXA Equitable Life Insurance Company. This lawsuit is a putative class action brought on behalf of all owners of universal life (“UL”) policies subject toAXA Equitable Life’s COI rate increase. In early 2016, AXA Equitable Life raised COI rates for certain UL policies issued between 2004 and 2007,which had both issue ages 70 and above and a current face value amount of $1 million and above. A second putative class action was filed in Arizona in2017 and consolidated with the Brach matter. The current consolidated amended class action complaint alleges the following claims: breach of contract;misrepresentations by AXA Equitable Life in violation of Section 4226 of the New York Insurance Law; violations of New York General Business LawSection 349; and violations of the California Unfair Competition Law, and the California Elder Abuse Statute. Plaintiffs seek: (a) compensatory damages,costs, and, pre- and post-judgment interest; (b) with respect to their claim concerning Section 4226, a penalty in the amount of premiums paid by theplaintiffs and the putative class; and (c) injunctive relief and attorneys’ fees in connection with their statutory claims. Five other federal actionschallenging the COI rate increase are also pending against AXA Equitable Life and have been coordinated with the Brach action for the purposes of pre-trial activities. They contain allegations similar to those in the Brach action as well as additional allegations for violations of various states’ consumerprotection statutes and common law fraud. Two actions are also pending against AXA Equitable Life in New York state court. AXA Equitable Life isvigorously defending each of these matters.
Obligation under funding agreements
As a member of the FHLBNY, AXA Equitable Life has access to collateralized borrowings. It also may issue funding agreements to the FHLBNY. Boththe collateralized borrowings and funding agreements would require AXA Equitable Life to pledge qualified mortgage-backed assets and/or governmentsecurities as collateral. AXA Equitable Life issues short-term funding agreements to the FHLBNY and uses the funds for asset, liability and cashmanagement purposes. AXA Equitable Life issues long-term funding agreements to the FHLBNY and uses the funds for spread lending purposes. Forother instruments used for asset liability management purposes see Note 4 . Funding agreements are reported in Policyholders’ account balances in theconsolidated balance sheets.
54
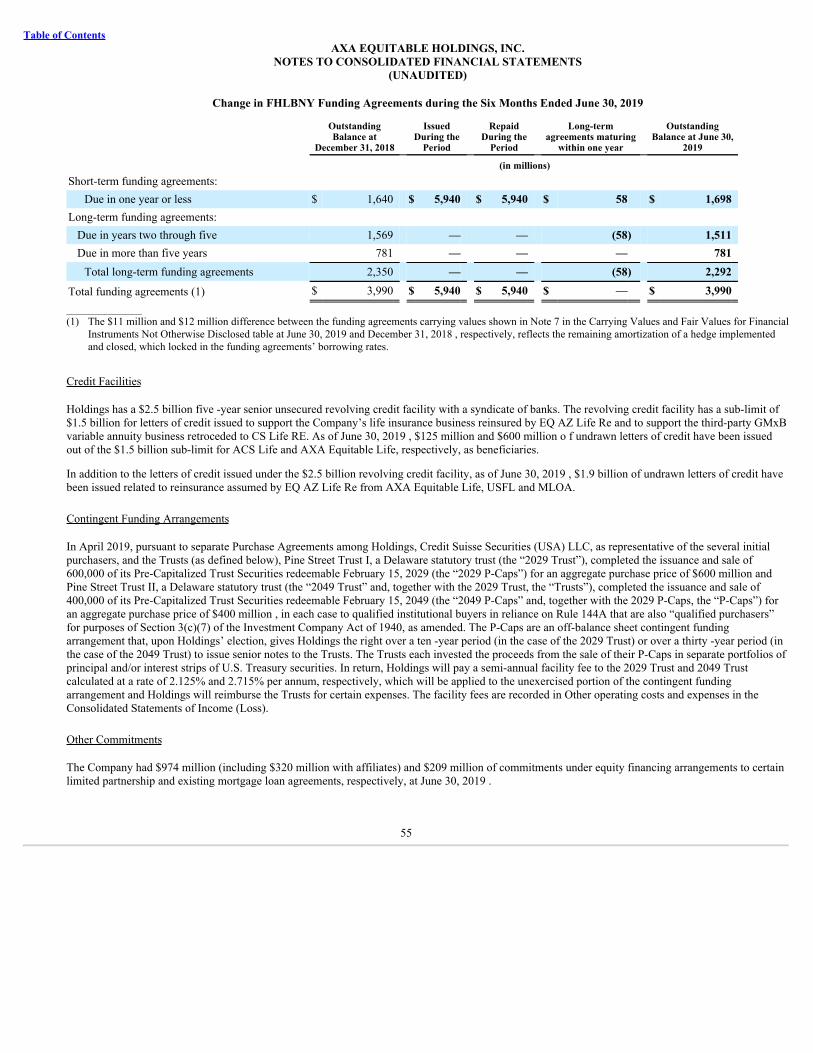
Table of ContentsAXA EQUITABLE HOLDINGS, INC.
NOTES TO CONSOLIDATED FINANCIAL STATEMENTS(UNAUDITED)
Change in FHLBNY Funding Agreements during the Six Months Ended June 30, 2019
OutstandingBalance at
December 31, 2018
IssuedDuring the
Period
RepaidDuring the
Period
Long-termagreements maturing
within one year
OutstandingBalance at June 30,
2019 (in millions)Short-term funding agreements:
Due in one year or less $ 1,640 $ 5,940 $ 5,940 $ 58 $ 1,698Long-term funding agreements:
Due in years two through five 1,569 — — (58) 1,511Due in more than five years 781 — — — 781
Total long-term funding agreements 2,350 — — (58) 2,292
Total funding agreements (1) $ 3,990 $ 5,940 $ 5,940 $ — $ 3,990______________(1) The $11 million and $12 million difference between the funding agreements carrying values shown in Note 7 in the Carrying Values and Fair Values for Financial
Instruments Not Otherwise Disclosed table at June 30, 2019 and December 31, 2018 , respectively, reflects the remaining amortization of a hedge implementedand closed, which locked in the funding agreements’ borrowing rates.
Credit Facilities
Holdings has a $2.5 billion five -year senior unsecured revolving credit facility with a syndicate of banks. The revolving credit facility has a sub-limit of$1.5 billion for letters of credit issued to support the Company’s life insurance business reinsured by EQ AZ Life Re and to support the third-party GMxBvariable annuity business retroceded to CS Life RE. As of June 30, 2019 , $125 million and $600 million o f undrawn letters of credit have been issuedout of the $1.5 billion sub-limit for ACS Life and AXA Equitable Life, respectively, as beneficiaries.
In addition to the letters of credit issued under the $2.5 billion revolving credit facility, as of June 30, 2019 , $1.9 billion of undrawn letters of credit havebeen issued related to reinsurance assumed by EQ AZ Life Re from AXA Equitable Life, USFL and MLOA.
Contingent Funding Arrangements
In April 2019, pursuant to separate Purchase Agreements among Holdings, Credit Suisse Securities (USA) LLC, as representative of the several initialpurchasers, and the Trusts (as defined below), Pine Street Trust I, a Delaware statutory trust (the “2029 Trust”), completed the issuance and sale of600,000 of its Pre-Capitalized Trust Securities redeemable February 15, 2029 (the “2029 P-Caps”) for an aggregate purchase price of $600 million andPine Street Trust II, a Delaware statutory trust (the “2049 Trust” and, together with the 2029 Trust, the “Trusts”), completed the issuance and sale of400,000 of its Pre-Capitalized Trust Securities redeemable February 15, 2049 (the “2049 P-Caps” and, together with the 2029 P-Caps, the “P-Caps”) foran aggregate purchase price of $400 million , in each case to qualified institutional buyers in reliance on Rule 144A that are also “qualified purchasers”for purposes of Section 3(c)(7) of the Investment Company Act of 1940, as amended. The P-Caps are an off-balance sheet contingent fundingarrangement that, upon Holdings’ election, gives Holdings the right over a ten -year period (in the case of the 2029 Trust) or over a thirty -year period (inthe case of the 2049 Trust) to issue senior notes to the Trusts. The Trusts each invested the proceeds from the sale of their P-Caps in separate portfolios ofprincipal and/or interest strips of U.S. Treasury securities. In return, Holdings will pay a semi-annual facility fee to the 2029 Trust and 2049 Trustcalculated at a rate of 2.125% and 2.715% per annum, respectively, which will be applied to the unexercised portion of the contingent fundingarrangement and Holdings will reimburse the Trusts for certain expenses. The facility fees are recorded in Other operating costs and expenses in theConsolidated Statements of Income (Loss).
Other Commitments
The Company had $974 million (including $320 million with affiliates) and $209 million of commitments under equity financing arrangements to certainlimited partnership and existing mortgage loan agreements, respectively, at June 30, 2019 .
55

Table of ContentsAXA EQUITABLE HOLDINGS, INC.
NOTES TO CONSOLIDATED FINANCIAL STATEMENTS(UNAUDITED)
15 ) BUSINESS SEGMENT INFORMATION
The Company has four reportable segments: Individual Retirement, Group Retirement, Investment Management and Research and Protection Solutions.
These segments reflect the manner by which the Company’s chief operating decision maker views and manages the business. A brief description of thesesegments follows:
• The Individual Retirement segment offers a diverse suite of variable annuity products which are primarily sold to affluent and high net worthindividuals saving for retirement or seeking retirement income.
• The Group Retirement segment offers tax-deferred investment and retirement services or products to plans sponsored by educational entities,municipalities and not-for-profit entities as well as small and medium-sized businesses.
• The Investment Management and Research segment provides diversified investment management, research and related solutions globally to abroad range of clients through three main client channels - Institutional, Retail and Private Wealth Management and distributes its institutionalresearch products and solutions through Bernstein Research Services.
• The Protection Solutions segment includes our life insurance and group employee benefits businesses. Our life insurance business offers avariety of variable universal life, universal life and term life products to help affluent and high net worth individuals, as well as small andmedium-sized business owners, with their wealth protection, wealth transfer and corporate needs. Our group employee benefits business offers asuite of dental, vision, life, and short- and long-term disability and other insurance products to small and medium-size businesses across theUnited States.
Measurement
Operating earnings (loss) is the financial measure which primarily focuses on the Company’s segments’ results of operations as well as the underlyingprofitability of the Company’s core business. By excluding items that can be distortive and unpredictable such as investment gains (losses) andinvestment income (loss) from derivative instruments, the Company believes Operating earnings (loss) by segment enhances the understanding of theCompany’s underlying drivers of profitability and trends in the Company’s segments.
In the first quarter of 2019, the Company updated its Operating earnings measure to exclude market value adjustments impacting the DAC amortizationfor its SCS variable annuity product in order to be consistent with the treatment of the market value adjustments on the SCS liability and with industrypractice. The presentation of Operating earnings in prior periods was not revised to reflect this modification, however, the Company estimated that hadthe treatment in the Company’s Operating earnings measure of the Amortization of DAC for SCS been modified in the first quarter of 2018, the pre-taximpact on Operating earnings of excluding the SCS-related DAC amortization from Operating earnings would have been a decrease of $52 million , $17million and $4 million during the first, second and third quarters of 2018, respectively, and an increase of $17 million during the fourth quarter of 2018.
Operating earnings is calculated by adjusting each segment’s Net income (loss) attributable to Holdings for the following items:
• Items related to variable annuity product features, which include certain changes in the fair value of the derivatives and other securities we use tohedge these features, the effect of benefit ratio unlock adjustments and changes in the fair value of the embedded derivatives reflected withinvariable annuity products’ net derivative results and the impact of these items on DAC amortization;
• Investment (gains) losses, which includes other-than-temporary impairments of securities, sales or disposals of securities/investments, realizedcapital gains/losses and valuation allowances;
• Net actuarial (gains) losses, which includes actuarial gains and losses as a result of differences between actual and expected experience onpension plan assets or projected benefit obligation during a given period related to pension, other postretirement benefit obligations, and the one-time impact of the settlement of the defined benefit obligation;
56
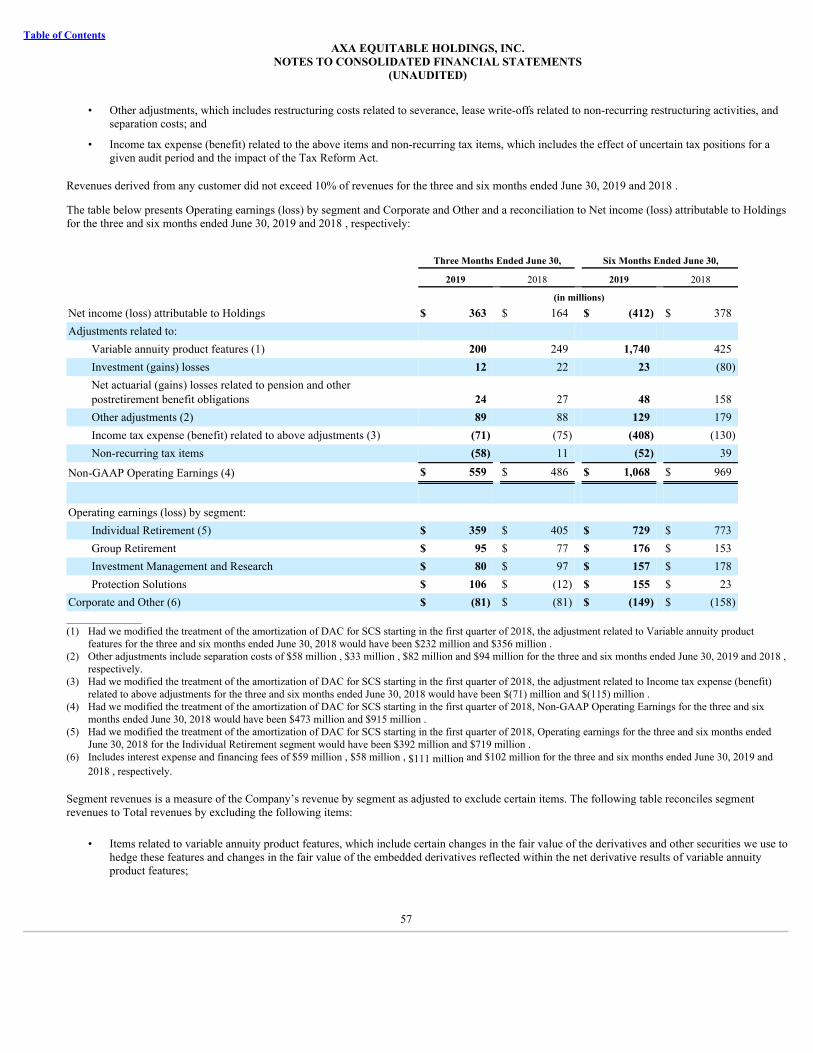
Table of ContentsAXA EQUITABLE HOLDINGS, INC.
NOTES TO CONSOLIDATED FINANCIAL STATEMENTS(UNAUDITED)
• Other adjustments, which includes restructuring costs related to severance, lease write-offs related to non-recurring restructuring activities, andseparation costs; and
• Income tax expense (benefit) related to the above items and non-recurring tax items, which includes the effect of uncertain tax positions for agiven audit period and the impact of the Tax Reform Act.
Revenues derived from any customer did not exceed 10% of revenues for the three and six months ended June 30, 2019 and 2018 .
The table below presents Operating earnings (loss) by segment and Corporate and Other and a reconciliation to Net income (loss) attributable to Holdingsfor the three and six months ended June 30, 2019 and 2018 , respectively:
Three Months Ended June 30, Six Months Ended June 30,
2019 2018 2019 2018 (in millions)Net income (loss) attributable to Holdings $ 363 $ 164 $ (412) $ 378Adjustments related to:
Variable annuity product features (1) 200 249 1,740 425Investment (gains) losses 12 22 23 (80)Net actuarial (gains) losses related to pension and otherpostretirement benefit obligations 24 27 48 158Other adjustments (2) 89 88 129 179Income tax expense (benefit) related to above adjustments (3) (71) (75) (408) (130)Non-recurring tax items (58) 11 (52) 39
Non-GAAP Operating Earnings (4) $ 559 $ 486 $ 1,068 $ 969
Operating earnings (loss) by segment: Individual Retirement (5) $ 359 $ 405 $ 729 $ 773Group Retirement $ 95 $ 77 $ 176 $ 153Investment Management and Research $ 80 $ 97 $ 157 $ 178Protection Solutions $ 106 $ (12) $ 155 $ 23
Corporate and Other (6) $ (81) $ (81) $ (149) $ (158)______________(1) Had we modified the treatment of the amortization of DAC for SCS starting in the first quarter of 2018, the adjustment related to Variable annuity product
features for the three and six months ended June 30, 2018 would have been $232 million and $356 million .(2) Other adjustments include separation costs of $58 million , $33 million , $82 million and $94 million for the three and six months ended June 30, 2019 and 2018 ,
respectively.(3) Had we modified the treatment of the amortization of DAC for SCS starting in the first quarter of 2018, the adjustment related to Income tax expense (benefit)
related to above adjustments for the three and six months ended June 30, 2018 would have been $(71) million and $(115) million .(4) Had we modified the treatment of the amortization of DAC for SCS starting in the first quarter of 2018, Non-GAAP Operating Earnings for the three and six
months ended June 30, 2018 would have been $473 million and $915 million .(5) Had we modified the treatment of the amortization of DAC for SCS starting in the first quarter of 2018, Operating earnings for the three and six months ended
June 30, 2018 for the Individual Retirement segment would have been $392 million and $719 million .(6) Includes interest expense and financing fees of $59 million , $58 million , $111 million and $102 million for the three and six months ended June 30, 2019 and
2018 , respectively.
Segment revenues is a measure of the Company’s revenue by segment as adjusted to exclude certain items. The following table reconciles segmentrevenues to Total revenues by excluding the following items:
• Items related to variable annuity product features, which include certain changes in the fair value of the derivatives and other securities we use tohedge these features and changes in the fair value of the embedded derivatives reflected within the net derivative results of variable annuityproduct features;
57
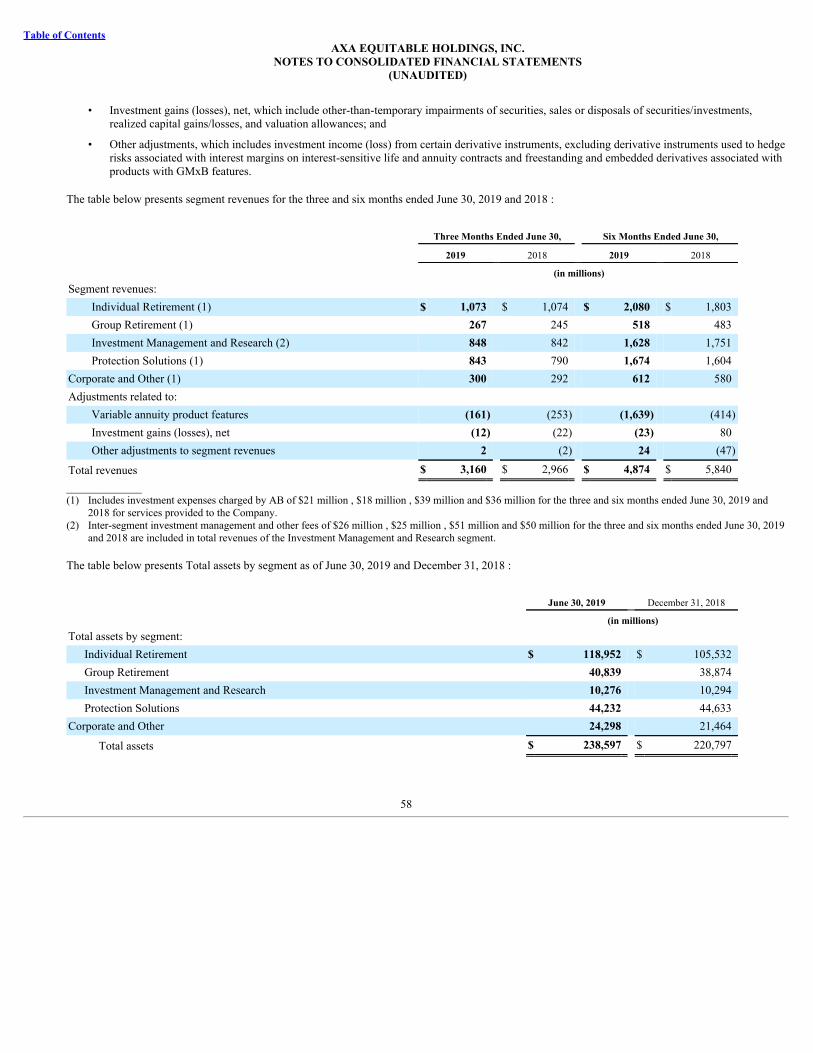
Table of ContentsAXA EQUITABLE HOLDINGS, INC.
NOTES TO CONSOLIDATED FINANCIAL STATEMENTS(UNAUDITED)
• Investment gains (losses), net, which include other-than-temporary impairments of securities, sales or disposals of securities/investments,realized capital gains/losses, and valuation allowances; and
• Other adjustments, which includes investment income (loss) from certain derivative instruments, excluding derivative instruments used to hedgerisks associated with interest margins on interest-sensitive life and annuity contracts and freestanding and embedded derivatives associated withproducts with GMxB features.
The table below presents segment revenues for the three and six months ended June 30, 2019 and 2018 :
Three Months Ended June 30, Six Months Ended June 30,
2019 2018 2019 2018 (in millions)Segment revenues:
Individual Retirement (1) $ 1,073 $ 1,074 $ 2,080 $ 1,803Group Retirement (1) 267 245 518 483Investment Management and Research (2) 848 842 1,628 1,751Protection Solutions (1) 843 790 1,674 1,604
Corporate and Other (1) 300 292 612 580Adjustments related to:
Variable annuity product features (161) (253) (1,639) (414)Investment gains (losses), net (12) (22) (23) 80Other adjustments to segment revenues 2 (2) 24 (47)
Total revenues $ 3,160 $ 2,966 $ 4,874 $ 5,840______________(1) Includes investment expenses charged by AB of $21 million , $18 million , $39 million and $36 million for the three and six months ended June 30, 2019 and
2018 for services provided to the Company.(2) Inter-segment investment management and other fees of $26 million , $25 million , $51 million and $50 million for the three and six months ended June 30, 2019
and 2018 are included in total revenues of the Investment Management and Research segment.
The table below presents Total assets by segment as of June 30, 2019 and December 31, 2018 :
June 30, 2019 December 31, 2018 (in millions)Total assets by segment:
Individual Retirement $ 118,952 $ 105,532Group Retirement 40,839 38,874Investment Management and Research 10,276 10,294Protection Solutions 44,232 44,633
Corporate and Other 24,298 21,464
Total assets $ 238,597 $ 220,797
58

Table of ContentsAXA EQUITABLE HOLDINGS, INC.
NOTES TO CONSOLIDATED FINANCIAL STATEMENTS(UNAUDITED)
16 ) EARNINGS PER SHARE
The following table presents the weighted average shares outstanding, basic earnings per common share and diluted earnings per common share:
Three Months Ended June 30, Six Months Ended June 30,
2019 2018 2019 2018 (in millions)Weighted average common shares outstanding:
Weighted average common shares outstanding - basic 491.1 561.0 504.5 561.0Effect of dilutive securities:
Employee share awards (1) 0.8 0.1 — 0.1
Weighted average common shares outstanding - diluted (2) 491.9 561.1 504.5 561.1
Net income (loss): Net income (loss) $ 430 $ 261 $ (279) $ 598
Less: Net income (loss) attributable to the noncontrolling interest 67 97 133 220
Net income (loss) attributable to Holdings common shareholders $ 363 $ 164 $ (412) $ 378
Earnings per common share: Basic $ 0.74 $ 0.29 $ (0.82) $ 0.67
Diluted $ 0.74 $ 0.29 $ (0.82) $ 0.67_____________(1) Calculated using the treasury stock method.(2) Shares in the diluted EPS calculation represent basic shares for the six-month period ended June 30, 2019 due to the net loss in this period. The shares excluded
from the calculation were 0.6 million shares.
For the three and six months ended June 30, 2019 and 2018 , 4.2 million , 6.1 million , 3.7 million and 3.8 million shares of outstanding stock awards,respectively, were not included in the computation of diluted earnings per share because their effect was anti-dilutive.
17 ) REVISION OF PRIOR PERIOD FINANCIAL STATEMENTS
Reclassification of DAC Capitalization
During the fourth quarter of 2018, the Company changed the presentation of the capitalization of DAC in the consolidated statements of income for allprior periods presented herein by netting the capitalized amounts within the applicable expense line items, such as Compensation and benefits,Commissions and distribution-related payments and Other operating costs and expenses. Previously, the Company had netted the capitalized amountswithin the Amortization of DAC. There was no impact on Net income (loss) or Comprehensive income (loss) from this reclassification. See Note 2 forfurther details of this reclassification.
Revisions of Prior Period Financial Statements
D uring the third quarter of 2018, the Company revised its financial statements to reflect the correction of errors identified by the Company in itspreviously issued financial statements. The impact of these errors was not considered to be material. However, in order to improve the consistency andcomparability of the financial statements, management revised the Company’s consolidated financial statements as of and for the three and six monthsended March 31, 2018 and June 30, 2018, respectively.
In addition, during the fourth quarter of 2018, the Company identified certain cash flows that were incorrectly classified in the Company’s consolidatedstatements of cash flows. The Company has determined that these misclassifications were not material to the financial statements of any period.
59
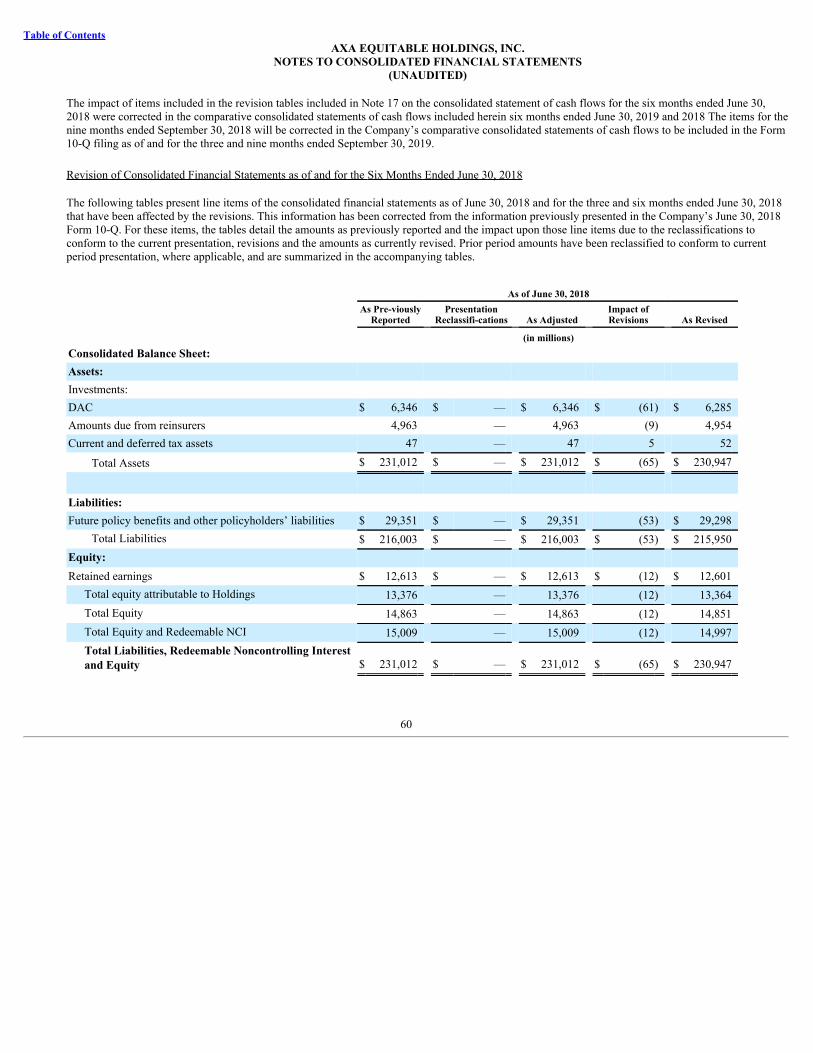
Table of ContentsAXA EQUITABLE HOLDINGS, INC.
NOTES TO CONSOLIDATED FINANCIAL STATEMENTS(UNAUDITED)
The impact of items included in the revision tables included in Note 17 on the consolidated statement of cash flows for the six months ended June 30,2018 were corrected in the comparative consolidated statements of cash flows included herein six months ended June 30, 2019 and 2018 The items for thenine months ended September 30, 2018 will be corrected in the Company’s comparative consolidated statements of cash flows to be included in the Form10-Q filing as of and for the three and nine months ended September 30, 2019.
Revision of Consolidated Financial Statements as of and for the Six Months Ended June 30, 2018
The following tables present line items of the consolidated financial statements as of June 30, 2018 and for the three and six months ended June 30, 2018that have been affected by the revisions. This information has been corrected from the information previously presented in the Company’s June 30, 2018Form 10-Q. For these items, the tables detail the amounts as previously reported and the impact upon those line items due to the reclassifications toconform to the current presentation, revisions and the amounts as currently revised. Prior period amounts have been reclassified to conform to currentperiod presentation, where applicable, and are summarized in the accompanying tables.
As of June 30, 2018
As Pre-viously
Reported Presentation
Reclassifi-cations As Adjusted Impact ofRevisions As Revised
(in millions)Consolidated Balance Sheet: Assets: Investments: DAC $ 6,346 $ — $ 6,346 $ (61) $ 6,285Amounts due from reinsurers 4,963 — 4,963 (9) 4,954Current and deferred tax assets 47 — 47 5 52
Total Assets $ 231,012 $ — $ 231,012 $ (65) $ 230,947
Liabilities: Future policy benefits and other policyholders’ liabilities $ 29,351 $ — $ 29,351 (53) $ 29,298
Total Liabilities $ 216,003 $ — $ 216,003 $ (53) $ 215,950Equity: Retained earnings $ 12,613 $ — $ 12,613 $ (12) $ 12,601
Total equity attributable to Holdings 13,376 — 13,376 (12) 13,364Total Equity 14,863 — 14,863 (12) 14,851Total Equity and Redeemable NCI 15,009 — 15,009 (12) 14,997Total Liabilities, Redeemable Noncontrolling Interestand Equity $ 231,012 $ — $ 231,012 $ (65) $ 230,947
60

Table of ContentsAXA EQUITABLE HOLDINGS, INC.
NOTES TO CONSOLIDATED FINANCIAL STATEMENTS(UNAUDITED)
Three Months Ended June 30, 2018
As Pre-viously
Reported Presentation
Reclassifi-cations As Adjusted Impact ofRevisions As Revised
(in millions)Consolidated Statement of Income (Loss): Revenues: Policy charges and fee income $ 987 $ — $ 987 $ (23) $ 964Net derivative gains (losses) (73) — (73) 27 (46)
Total revenues 2,962 — 2,962 4 2,966Benefits and other deductions: Policyholders’ benefits 920 — 920 (20) 900Amortization of deferred policy acquisition costs (1) 170 169 16 185
Total benefits and other deductions 2,648 — 2,648 (4) 2,644Income (loss) from continuing operations, before incometaxes 314 — 314 8 322
Income tax (expense) benefit (59) — (59) (2) (61)Net income (loss) 255 — 255 6 261Net income (loss) attributable to Holdings $ 158 $ — $ 158 $ 6 $ 164
Six Months Ended June 30, 2018
As Pre-viously
Reported Presentation
Reclassifi-cations As Adjusted Impact ofRevisions As Revised
(in millions)Consolidated Statement of Income (Loss): Revenues: Policy charges and fee income $ 1,959 $ — $ 1,959 $ (29) $ 1,930Net derivative gains (losses) (354) — (354) 72 (282)
Total revenues 5,797 — 5,797 43 5,840Benefits and other deductions: Policyholders’ benefits 1,528 — 1,528 (34) 1,494Amortization of deferred policy acquisition costs 14 332 346 11 357
Total benefits and other deductions 5,113 — 5,113 (23) 5,090Income (loss) from continuing operations, before incometaxes 684 — 684 66 750
Income tax (expense) benefit (138) — (138) (14) (152)Net income (loss) 546 — 546 52 598Net income (loss) attributable to Holdings $ 326 $ — $ 326 $ 52 $ 378
61

Table of ContentsAXA EQUITABLE HOLDINGS, INC.
NOTES TO CONSOLIDATED FINANCIAL STATEMENTS(UNAUDITED)
Three Months Ended June 30, 2018
As Pre-viously
Reported Presentation
Reclassifi-cations As Adjusted Impact ofRevisions As Revised
(in millions)
Comprehensive Income (Loss): Net income (loss) $ 255 $ — $ 255 $ 6 $ 261
Other Comprehensive income (loss) net of income taxes: Foreign currency translation adjustment (9) — (9) 1 (8)Change in unrealized gains (losses), net of reclassificationadjustment (348) — (348) (1) (349)
Comprehensive income (loss) (101) — (101) 6 (95)
Comprehensive income (loss) attributable to Holdings $ (206) $ — $ (206) $ 6 $ (200)
Six Months Ended June 30, 2018
As Pre-viously
Reported Presentation
Reclassifi-cations As Adjusted Impact ofRevisions As Revised
(in millions)
Comprehensive Income (Loss): Net income (loss) $ 546 $ — $ 546 $ 52 $ 598
Other Comprehensive income (loss), net of taxes: Foreign currency translation adjustment (14) — (14) 3 (11)Change in unrealized gains (losses), net of reclassificationadjustment (1,308) — (1,308) (3) (1,311)
Comprehensive income (loss) (642) — (642) 52 (590)
Comprehensive income (loss) attributable to Holdings $ (876) $ — $ (876) $ 52 $ (824)
Three Months Ended June 30, 2018
As Pre-viously
Reported Presentation
Reclassifi-cations As Adjusted Impact ofRevisions As Revised
(in millions)Consolidated Statement of Equity: Net income (loss) attributable to Holdings $ 158 $ — $ 158 $ 6 $ 164
Retained earnings, end of period $ 12,595 $ — $ 12,595 $ 6 $ 12,601Total Holdings’ equity, end of period $ 13,358 $ — $ 13,358 $ 6 $ 13,364Total Equity, End of Period $ 14,845 $ — $ 14,845 $ 6 $ 14,851
62

Table of ContentsAXA EQUITABLE HOLDINGS, INC.
NOTES TO CONSOLIDATED FINANCIAL STATEMENTS(UNAUDITED)
Six Months Ended June 30, 2018
As Pre-viously
Reported Presentation
Reclassifi-cations As Adjusted Impact ofRevisions As Revised
(in millions)Consolidated Statement of Equity: Retained earnings, beginning of year $ 12,289 $ — $ 12,289 $ (64) $ 12,225Net income (loss) attributable to Holdings 326 — 326 52 378
Retained earnings, end of period $ 12,613 $ — $ 12,613 $ (12) $ 12,601Total Holdings’ equity, end of period $ 13,376 $ — $ 13,376 $ (12) $ 13,364Total Equity, End of Period $ 14,863 $ — $ 14,863 $ (12) $ 14,851
63

Table of ContentsAXA EQUITABLE HOLDINGS, INC.
NOTES TO CONSOLIDATED FINANCIAL STATEMENTS(UNAUDITED)
Six Months Ended June 30, 2018
As Pre-viously
Reported
PresentationReclassifi-
cations As Adjusted Impact ofRevisions As Revised
(in millions)Consolidated Statements of Cash Flows: Cash flow from operating activities: Net income (loss) $ 546 $ — $ 546 $ 52 $ 598
Adjustments to reconcile Net income (loss) to Net cashprovided by (used in) operating activities:
Policy charges and fee income (1,959) — (1,959) 29 (1,930)Net derivative (gains) losses 354 — 354 (72) 282Amortization of deferred sales commission 13 (13) — — —Amortization and depreciation (32) 369 337 11 348Amortization of deferred cost of reinsurance asset 10 (10) — — —Distributions from joint ventures and limited partnerships 44 (44) — — —Equity (income) loss from limited partnerships — (59) (59) — (59)
Changes in: Reinsurance recoverable 20 — 20 9 29Capitalization of deferred policy acquisition costs 14 (346) (332) — (332)Future policy benefits (171) — (171) (15) (186)Current and deferred income taxes 224 — 224 (42) 182Other, net (180) 103 (77) — (77)
Net cash provided by (used in) operating activities $ (314) $ — $ (314) $ (28) $ (342)Cash flows from investing activities:
Proceeds from the sale/maturity/prepayment of: Short-term investments $ — $ 2,756 $ 2,756 $ — $ 2,756
Payment for the purchase/origination of: Short-term investments — (1,586) (1,586) — (1,586)
Cash settlements related to derivative instruments (333) — (333) (637) (970)Change in short-term investments 1,170 (1,170) — — —Other, net 419 — 419 61 480
Net cash provided by (used in) investing activities $ 1,807 $ — $ 1,807 $ (576) $ 1,231Cash flows from financing activities:
Policyholders’ account balances: Deposits $ 5,567 $ — $ 5,567 $ (1,141) $ 4,426Withdrawals (2,750) — (2,750) 572 (2,178)Transfers (to) from Separate Accounts (307) — (307) 1,173 866
Net cash provided by (used in) financing activities $ 532 $ — $ 532 $ 604 $ 1,136
18 ) SUBSEQUENT EVENTS
In connection with AXA’s secondary offering in June 2019, the underwriters exercised their option to purchase six million additional shares, reducingAXA’s ownership to approximately 39% as of July 8, 2019 .
On August 8, 2019, Holdings’ Board of Directors declared a cash dividend on Holdings’ common stock of $0.15 per share, payable on August 29, 2019 ,to shareholders of record as of August 22, 2019 . The payment of any future dividends will be at the discretion of Holdings’ Board of Directors and willdepend on various factors.
64
Table of Contents
Item 2. Management’s Discussion and Analysis of Financial Condition and Results of Operations
The following discussion and analysis of our financial condition and results of operations should be read in its entirety and in conjunction with theconsolidated financial statements and related notes contained in Part I, Item 1 of this Quarterly Report on Form 10-Q, as well as “Management’s Discussion andAnalysis of Financial Condition and Results of Operations” section contained in our Annual Report on Form 10-K for the year ended December 31, 2018 (“2018Form 10-K”).
In addition to historical data, this discussion contains forward-looking statements about our business, operations and financial performance based on currentexpectations that involve risks, uncertainties and assumptions. Actual results may differ materially from those discussed in the forward-looking statements as aresult of various factors. See the Note Regarding Forward-Looking Statements and Information. Investors are directed to consider the risks and uncertaintiesdiscussed in Part II, Item 1A of this Quarterly Report on Form 10-Q, as well as in other documents we have filed with the Securities and Exchange Commission(“SEC”).
Executive Summary
Overview
We are one of America’s leading financial services companies, providing: (i) advice and solutions for helping Americans set and meet their retirement goalsand protect and transfer their wealth across generations; and (ii) a wide range of investment management insights, expertise and innovations to drive betterinvestment decisions and outcomes for clients worldwide.
We manage our business through four segments: Individual Retirement, Group Retirement, Investment Management and Research, and Protection Solutions.We report certain activities and items that are not included in these segments in Corporate and Other. See Note 15 of the Notes to the Consolidated FinancialStatements for further information on our segments.
We benefit from our complementary mix of businesses. This business mix provides diversity in our earnings sources, which helps offset fluctuations in marketconditions and variability in business results, while offering growth opportunities.
Revenues
Our revenues come from three principal sources:
• fee income derived from our retirement and protection products and our investment management and research services;
• premiums from our traditional life insurance and annuity products; and
• investment income from our General Account investment portfolio.
Our fee income varies directly in relation to the amount of the underlying AV or benefit base of our retirement and protection products and the amount ofAUM of our Investment Management and Research business. AV and AUM, each as defined in “—Key Operating Measures,” are influenced by changes ineconomic conditions, primarily equity market returns, as well as net flows. Our premium income is driven by the growth in new policies written and thepersistency of our in-force policies, both of which are influenced by a combination of factors, including our efforts to attract and retain customers and marketconditions that influence demand for our products. Our investment income is driven by the yield on our General Account investment portfolio and is impacted bythe prevailing level of interest rates as we reinvest cash associated with maturing investments and net flows to the portfolio.
Benefits and Other Deductions
Our primary expenses are:
• policyholders’ benefits and interest credited to policyholders’ account balances;
• sales commissions and compensation paid to intermediaries and advisors that distribute our products and services; and
• compensation and benefits provided to our employees and other operating expenses.
Policyholders’ benefits are driven primarily by mortality, customer withdrawals, and benefits which change in response to changes in capital marketconditions. In addition, some of our policyholders’ benefits are directly tied to the AV and benefit base of our variable annuity products. Interest credited topolicyholders varies in relation to the amount of the underlying AV or benefit base. Sales commissions and compensation paid to intermediaries and advisors varyin relation to premium and fee
65

Table of Contents
income generated from these sources, whereas compensation and benefits to our employees are more constant and decline with increases in efficiency. Our abilityto manage these expenses across various economic cycles and products is critical to the profitability of our company.
Net Income Volatility
We have offered and continue to offer variable annuity products with variable annuity guaranteed benefits (“GMxB”) features. The future claims exposure onthese features is sensitive to movements in the equity markets and interest rates. Accordingly, we have implemented hedging and reinsurance programs designed tomitigate the economic exposure to us from these features due to equity market and interest rate movements. Changes in the values of the derivatives associatedwith these programs due to equity market and interest rate movements are recognized in the periods in which they occur while corresponding changes in offsettingliabilities are recognized over time. This results in net income volatility as further described below. See “—Significant Factors Impacting Our Results—Impact ofHedging and GMIB Reinsurance on Results.”
In addition to our dynamic hedging strategy, we have static hedge positions designed to mitigate the adverse impact of changing market conditions on ourstatutory capital. We believe this program will continue to preserve the economic value of our variable annuity contracts and better protect our target variableannuity asset level. However, these static hedge positions increase the size of our derivative positions and may result in higher net income volatility on a period-over-period basis.
Due to the impacts on our net income of equity market and interest rate movements and other items that are not part of the underlying profitability drivers ofour business, we evaluate and manage our business performance using Non-GAAP Operating Earnings, a non-GAAP financial measure that is intended to removethese impacts from our results. See “—Key Operating Measures—Non-GAAP Operating Earnings.”
Significant Factors Impacting Our Results
The following significant factors have impacted, and may in the future impact, our financial condition, results of operations or cash flows.
Impact of Hedging and GMIB Reinsurance on Results
We have offered and continue to offer variable annuity products with GMxB features. The future claims exposure on these features is sensitive to movementsin the equity markets and interest rates. Accordingly, we have implemented hedging and reinsurance programs designed to mitigate the economic exposure to usfrom these features due to equity market and interest rate movements. These programs include:
• Variable annuity hedging programs. We use a dynamic hedging program (within this program, generally, we reevaluate our economic exposure at leastdaily and rebalance our hedge positions accordingly) to mitigate certain risks associated with the GMxB features that are embedded in our liabilities forour variable annuity products. This program utilizes various derivative instruments that are managed in an effort to reduce the economic impact ofunfavorable changes in GMxB features’ exposures attributable to movements in the equity markets and interest rates. Although this program is designedto provide a measure of economic protection against the impact of adverse market conditions, it does not qualify for hedge accounting treatment.Accordingly, changes in value of the derivatives will be recognized in the period in which they occur with offsetting changes in reserves partiallyrecognized in the current period, resulting in net income volatility. In addition to our dynamic hedging program, we have a hedging program using statichedge positions (derivative positions intended to be held to maturity with less frequent re-balancing) to protect our statutory capital against stressscenarios. This program in addition to our dynamic hedge program has increased the size of our derivative positions, resulting in an increase in netincome volatility. The impacts are most pronounced for variable annuity products in our Individual Retirement segment.
• GMIB reinsurance contracts. Historically, GMIB reinsurance contracts were used to cede to non-affiliated reinsurers a portion of our exposure to variableannuity products that offer a GMIB feature. We account for the GMIB reinsurance contracts as derivatives and report them at fair value. Gross GMIBreserves are calculated on the basis of assumptions related to projected benefits and related contract charges over the lives of the contracts. Accordingly,our gross reserves will not immediately reflect the offsetting impact on future claims exposure resulting from the same capital market or interest ratefluctuations that cause gains or losses on the fair value of the GMIB reinsurance contracts. Because changes in the fair value of the GMIB reinsurancecontracts are recorded in the period in which they occur and a majority of the changes in gross reserves for GMIB are recognized over time, net incomewill be more volatile.
66

Table of Contents
Effect of Assumption Updates on Operating Results
Most of the variable annuity products, variable universal life insurance and universal life insurance products we offer maintain policyholder deposits that arereported as liabilities and classified within either Separate Accounts liabilities or policyholder account balances. Our products and riders also impact liabilities forfuture policyholder benefits and unearned revenues and assets for DAC and deferred sales inducements (“DSI”). The valuation of these assets and liabilities (otherthan deposits) are based on differing accounting methods depending on the product, each of which requires numerous assumptions and considerable judgment. Theaccounting guidance applied in the valuation of these assets and liabilities includes, but is not limited to, the following: (i) traditional life insurance products forwhich assumptions are locked in at inception; (ii) universal life insurance and variable life insurance secondary guarantees for which benefit liabilities aredetermined by estimating the expected value of death benefits payable when the account balance is projected to be zero and recognizing those benefits ratably overthe accumulation period based on total expected assessments; (iii) certain product guarantees for which benefit liabilities are accrued over the life of the contract inproportion to actual and future expected policy assessments; and (iv) certain product guarantees reported as embedded derivatives at fair value.
Our actuaries oversee the valuation of these product liabilities and assets and review underlying inputs and assumptions. We comprehensively review theactuarial assumptions underlying these valuations and update assumptions during the third quarter of each year. Assumptions are based on a combination ofcompany experience, industry experience, management actions and expert judgment and reflect our best estimate as of the date of each financialstatement. Changes in assumptions can result in a significant change to the carrying value of product liabilities and assets and, consequently, the impact could bematerial to earnings in the period of the change.
Macroeconomic and Industry Trends
Our business and consolidated results of operations are significantly affected by economic conditions and consumer confidence, conditions in the globalcapital markets and the interest rate environment.
Financial and Economic Environment
A wide variety of factors continue to impact global financial and economic conditions. These factors include, among others, concerns over economic growthin the United States, continued low interest rates, falling unemployment rates, the U.S. Federal Reserve’s potential plans to lower short-term interest rates,fluctuations in the strength of the U.S. dollar, the uncertainty created by what actions the current administration may pursue, concerns over global trade wars,changes in tax policy, global economic factors including programs by the European Central Bank and the United Kingdom’s vote to exit from the European Unionand other geopolitical issues. Additionally, many of the products and solutions we sell are tax-advantaged or tax-deferred. If U.S. tax laws were to change, suchthat our products and solutions are no longer tax-advantaged or tax-deferred, demand for our products could materially decrease.
Stressed conditions, volatility and disruptions in the capital markets, particular markets, or financial asset classes can have an adverse effect on us, in partbecause we have a large investment portfolio and our insurance liabilities and derivatives are sensitive to changing market factors. An increase in market volatilitycould affect our business, including through effects on the yields we earn on invested assets, changes in required reserves and capital and fluctuations in the valueof our AUM, AV or AUA. These effects could be exacerbated by uncertainty about future fiscal policy, changes in tax policy, the scope of potential deregulationand levels of global trade.
In the short- to medium-term, the potential for increased volatility, coupled with prevailing interest rates remaining below historical averages, could pressuresales and reduce demand for our products as consumers consider purchasing alternative products to meet their objectives. In addition, this environment could makeit difficult to consistently develop products that are attractive to customers. Financial performance can be adversely affected by market volatility and equity marketdeclines as fees driven by AV and AUM fluctuate, hedging costs increase and revenues decline due to reduced sales and increased outflows.
We monitor the behavior of our customers and other factors, including mortality rates, morbidity rates, annuitization rates and lapse and surrender rates, whichchange in response to changes in capital market conditions, to ensure that our products and solutions remain attractive and profitable. For additional information onour sensitivity to interest rates and capital market prices, See “Quantitative and Qualitative Disclosures About Market Risk.”
Interest Rate Environment
We believe the interest rate environment will continue to impact our business and financial performance in the future for several reasons, including thefollowing:
67

Table of Contents
• Certain of our variable annuity and life insurance products pay guaranteed minimum interest crediting rates. We are required to pay these guaranteedminimum rates even if earnings on our investment portfolio decline, with the resulting investment margin compression negatively impacting earnings. Inaddition, we expect more policyholders to hold policies with comparatively high guaranteed rates longer (lower lapse rates) in a low interest rateenvironment. Conversely, a rise in average yield on our investment portfolio should positively impact earnings. Similarly, we expect policyholders wouldbe less likely to hold policies with existing guaranteed rates (higher lapse rates) as interest rates rise.
• A prolonged low interest rate environment also may subject us to increased hedging costs or an increase in the amount of statutory reserves that ourinsurance subsidiaries are required to hold for GMxB features, lowering their statutory surplus, which would adversely affect their ability to pay dividendsto us. In addition, it may also increase the perceived value of GMxB features to our policyholders, which in turn may lead to a higher rate of annuitizationand higher persistency of those products over time. Finally, low interest rates may continue to cause an acceleration of DAC amortization or reserveincrease due to loss recognition for interest sensitive products, primarily for our Protection Solutions segment.
Regulatory Developments
Our life insurance subsidiaries are regulated primarily at the state level, with some policies and products also subject to federal regulation. On an ongoingbasis, regulators refine capital requirements and introduce new reserving standards. See “Business—Regulation” and “Risk Factors—Legal and Regulatory Risks”in the 2018 Form 10-K. Regulations recently adopted or currently under review can potentially impact our statutory reserve and capital requirements.
• National Association of Insurance Commissioners (“NAIC”) . In 2015, the NAIC Financial Condition (E) Committee established a working group tostudy and address, as appropriate, regulatory issues resulting from variable annuity captive reinsurance transactions, including reforms that wouldimprove the current statutory reserve and RBC framework for insurance companies that sell variable annuity products. In August 2018, the NAIC adoptedthe new framework developed and proposed by this working group. Following its referral to various NAIC committees to develop the full implementationdetails, the new framework is expected to be operational in January 2020. Among other changes, the new framework includes new prescriptions forreflecting hedge effectiveness, investment returns, interest rates, mortality and policyholder behavior in calculating statutory reserves and RBC. Onceeffective, it is expected to materially change the level of variable annuity reserves and RBC requirements as well as their sensitivity to capital marketsincluding interest rate, equity markets, volatility and credit spreads. Overall, we believe the NAIC reform has moved variable annuity capital standardstowards an economic framework and is consistent with how we manage our business. However, it is expected that the NYDFS will propose a rule foradoption that will differ from the standards of the NAIC framework. Other state insurance regulators may propose and adopt standards different from theNAIC framework.
• Fiduciary Rules/ “Best Interest” Standards of Conduct. In the wake of the March 2018 federal appeals court decision to vacate the DOL Rule, the NAICas well as state regulators are currently considering whether to apply an impartial conduct standard similar to the DOL Rule to recommendations made inconnection with certain annuities and, in one case, to life insurance policies. For example, the NAIC is actively working on a proposal to raise the advicestandard for annuity sales and in July 2018, the NYDFS issued a final version of Regulation 187 that adopts a “best interest” standard forrecommendations regarding the sale of life insurance and annuity products in New York. Regulation 187 took effect on August 1, 2019 with respect toannuity sales and will take effect on February 1, 2020 for life insurance sales and is applicable to sales of life insurance and annuity products in NewYork. In November 2018, the primary agent groups in New York launched a legal challenge against the NYDFS over the adoption of Regulation 187. It isnot possible to predict whether this challenge will be successful. We have developed our compliance framework for Regulation 187 with respect toannuity sales and are assessing the impact it may have on our life insurance business. In addition, state regulators and legislatures in Nevada, New Jerseyand Maryland have proposed measures that would make broker-dealers, sales agents, and investment advisers and their representatives to be subject to afiduciary duty when providing products and services to customers, including pension plans and IRAs. Beyond the New York regulation, the likelihood ofenactment of any such state-based regulation is uncertain at this time, but if implemented, these regulations could have adverse effects on our businessand consolidated results of operations.
• In June 2019, the SEC released a set of rules that, among other things, enhance the existing standard of conduct for broker-dealers to require them to actin the best interest of their clients; clarify the nature of the fiduciary obligations owed by registered investment advisers to their clients; impose newdisclosure requirements aimed at ensuring investors understand the nature of their relationship with their investment professionals; and restrict certainbroker-
68

Table of Contents
dealers and their financial professionals from using the terms “adviser” or “advisor”. The effective date for compliance with these rule s is June 30, 2020.Investment advisers to retail clients will also be required to file new Form CRS, providing disclosures about its standard of conduct and conflicts ofinterest, with the SEC and deliver copies of the Form to its retail clients. The intent of these rules is to impose on broker-dealers an enhanced duty of careto their customers similar to that which applies to investment advisers under existing law. We are currently assessing these rules to determine the impactthey may have on our business.
• Derivatives Regulation . The amount of collateral we are required to pledge and the expenses we incur under our derivatives transactions are expected toincrease as a result of the requirement to pledge initial margin for non-centrally cleared derivative transactions ( “OTC” derivatives) entered into after thephase-in period, which will likely be applicable to us in September 2020 as a result of adoption by the Office of the Comptroller of the Currency(“OCC”), the Federal Reserve Board, the FDIC, the Farm Credit Administration and the Federal Housing Finance Agency and and the CFTC of finalmargin requirements for OTC derivatives. Also, in June 2019, the SEC adopted a set of rules that establish capital, margin and segregation requirementsfor security-based swaps. The rules are part of the larger regulatory framework that the SEC is establishing over non-bank security-based swap dealers(“SBSD’s”), non-bank major security-based swap dealers (“MSBSP’s”), and certain broker-dealers that are not SBSD’s that imposes registration,disqualification, recordkeeping and reporting requirements, and cross-border regulation. The rules will become effective 60 days after publication in theFederal Register. The compliance date for the new rules is 18 months after the later of (i) the effective date of the final rules establishing recordkeepingand reporting requirements for SBSD’s and MSBSP’s or (ii) the effective date of the final rules on cross-border application of security-based swaprequirements, which have been proposed and are pending. We are monitoring these developments and evaluating the potential effect these rules mighthave on our business.
Impact of the Tax Reform Act
On December 22, 2017, President Trump signed into law the Tax Reform Act, a broad overhaul of the U.S. Internal Revenue Code that changed long-standingprovisions governing the taxation of U.S. corporations, including life insurance companies.
The Tax Reform Act reduced the federal corporate income tax rate to 21% and repealed the corporate Alternative Minimum Tax (“AMT”) while keepingexisting AMT credits. It also contained measures affecting our insurance companies, including changes to the DRD, insurance reserves and tax DAC, and measuresaffecting our international operations. As a result of the Tax Reform Act, our Net Income and Non-GAAP Operating Earnings has improved and the tax liability onthe earnings of our foreign subsidiaries has decreased.
In August 2018, the NAIC adopted changes to the RBC calculation, including the C-3 Phase II Total Asset Requirement for variable annuities, to reflect the21% corporate income tax rate in RBC, which resulted in a reduction to our Combined RBC Ratio.
Overall, the Tax Reform Act had a net positive economic impact on us and we continue to monitor regulations related to this reform.
Separation Costs
In connection with the IPO and transitioning to operating as a stand-alone public company, we have incurred and expect to continue to incur one-time andrecurring expenses. These expenses primarily relate to information technology, compliance, internal audit, finance, risk management, procurement, client service,human resources and other support services. The process of replicating and replacing functions, systems and infrastructure provided by AXA or certain of itsaffiliates in order to operate on a stand-alone basis is currently underway. Furthermore, as a result of AXA ceasing to own at least a majority of our outstandingcommon stock, we incurred, and continue to incur, additional expenses. These expenses, any recurring expenses, including under the Transitional ServicesAgreement, and any additional one-time expenses, including as a result of rebranding, we may incur may be material. See “Risk Factors” in the 2018 Form 10-Kfor additional information.
We estimate that the aggregate amount of the total separation expenses described above will be between approximately $650 million and $700 million .Through June 30, 2019 , a total of $392 million has been incurred, of which $58 million , $82 million , $33 million , and $94 million was incurred in the three andsix months ended June 30, 2019 and 2018 , respectively.
Productivity Strategies
69
Table of Contents
Retirement and Protection Businesses
We continue to build upon our productivity improvements through which we have delivered more than $350 million in efficiency improvements from 2012through 2017. Our productivity strategy includes several initiatives, including relocating some of our real estate footprint away from the New York metropolitanarea, replacing or updating less efficient legacy technology infrastructure and expanding existing outsourcing arrangements, which we believe will reduce costs andimprove productivity.
We anticipate that the savings from these initiatives will offset any incremental ongoing expenses that we incur as a standalone company, and we expect theseinitiatives to improve our operating leverage, increasing our Non-GAAP Operating Earnings by approximately $75 million pre-tax per annum by 2020.
Investment Management and Research Business
AB has announced that it will establish its corporate headquarters in, and relocate approximately 1,050 jobs located in the New York metro area to, Nashville,Tennessee. For more detail on the costs and expense savings AB expects to incur as a result of this relocation, see AB’s Quarterly Report on Form 10-Q for thequarterly period ended June 30, 2019 .
Key Operating Measures
In addition to our results presented in accordance with U.S. GAAP, we report Non-GAAP Operating Earnings, Non-GAAP Operating ROE, Non-GAAPOperating ROC by segment for our Individual Retirement, Group Retirement and Protection Solutions segments, and Non-GAAP Operating Earnings per share,each of which is a measure that is not determined in accordance with U.S. GAAP. Management believes that the use of these non-GAAP financial measures,together with relevant U.S. GAAP measures, provides a better understanding of our results of operations and the underlying profitability drivers and trends of ourbusiness. These non-GAAP financial measures are intended to remove from our results of operations the impact of market changes (where there is mismatch in thevaluation of assets and liabilities) as well as certain other expenses which are not part of our underlying profitability drivers or likely to re-occur in the foreseeablefuture, as such items fluctuate from period-to-period in a manner inconsistent with these drivers. These measures should be considered supplementary to our resultsthat are presented in accordance with U.S. GAAP and should not be viewed as a substitute for the U.S. GAAP measures. Other companies may use similarly titlednon-GAAP financial measures that are calculated differently from the way we calculate such measures. Consequently, our non-GAAP financial measures may notbe comparable to similar measures used by other companies.
We also discuss certain operating measures, including AUM, AUA, AV, Protection Solutions Reserves and certain other operating measures, whichmanagement believes provide useful information about our businesses and the operational factors underlying our financial performance.
Non-GAAP Operating Earnings
Non-GAAP Operating Earnings is an after-tax non-GAAP financial measure used to evaluate our financial performance on a consolidated basis that isdetermined by making certain adjustments to our consolidated after-tax net income attributable to Holdings. The most significant of such adjustments relates to ourderivative positions, which protect economic value and statutory capital, and are more sensitive to changes in market conditions than the variable annuity productliabilities as valued under U.S. GAAP. This is a large source of volatility in net income.
In the first quarter of 2019, we modified our Non-GAAP Operating Earnings measure’s treatment of the impact of timing differences on the amortization ofDAC resulting from market value adjustments for our SCS variable annuity product. As a result of this modification, the amortization of DAC for our SCS productincluded in Non-GAAP Operating Earnings was changed to be determined based on our SCS product's gross profits included in Non-GAAP Operating Earnings,consistent with both our exclusion from Non-GAAP Operating Earnings of other items that are distortive to the underlying drivers of our financial performance ona consolidated basis and with industry practice. Our presentation of Non-GAAP Operating Earnings in prior periods was not revised to reflect this modification,however, had we modified the treatment of the amortization of DAC for SCS starting in the first quarter of 2018, SCS-related DAC amortization excluded fromNon-GAAP Operating Earnings would have been $52 million, $17 million and $4 million lower during the first, second and third quarters of 2018, respectively,and $17 million higher during the fourth quarter of 2018.
70

Table of Contents
Non-GAAP Operating Earnings equals our consolidated after-tax net income attributable to Holdings adjusted to eliminate the impact of the following items:
• Items related to variable annuity product features, which include certain changes in the fair value of the derivatives and other securities we use to hedgethese features, the effect of benefit ratio unlock adjustments and changes in the fair value of the embedded derivatives reflected within variable annuityproducts’ net derivative results and the impact of these items on DAC amortization;
• Investment (gains) losses, which includes other-than-temporary impairments of securities, sales or disposals of securities/investments, realized capitalgains/losses and valuation allowances;
• Net actuarial (gains) losses, which includes actuarial gains and losses as a result of differences between actual and expected experience on pension planassets or projected benefit obligation during a given period related to pension, other postretirement benefit obligations, and the one-time impact of thesettlement of the defined benefit obligation;
• Other adjustments, which includes restructuring costs related to severance, lease write-offs related to non-recurring restructuring activities, and separationcosts; and
• Income tax expense (benefit) related to the above items and non-recurring tax items, which includes the effect of uncertain tax positions for a given auditperiod and the impact of the Tax Reform Act.
Because Non-GAAP Operating Earnings excludes the foregoing items that can be distortive or unpredictable, management believes that this measure enhancesthe understanding of the Company’s underlying drivers of profitability and trends in our business, thereby allowing management to make decisions that willpositively impact our business.
We use the prevailing corporate federal income tax rate of 21%, while taking into account any non-recurring differences for events recognized differently inour financial statements and federal income tax returns as well as partnership income taxed at lower rates when reconciling Net income (loss) attributable toHoldings to Non-GAAP Operating Earnings.
The table below presents a reconciliation of Net income (loss) attributable to Holdings to Non-GAAP Operating Earnings for the three and six months endedJune 30, 2019 and 2018 :
Three Months Ended June 30, Six Months Ended June 30,
2019 2018 2019 2018 (in millions)Net income (loss) attributable to Holdings $ 363 $ 164 $ (412) $ 378Adjustments related to:
Variable annuity product features (1) 200 249 1,740 425Investment (gains) losses 12 22 23 (80)Net actuarial (gains) losses related to pension and other postretirement benefitobligations 24 27 48 158Other adjustments (2) 89 88 129 179Income tax expense (benefit) related to above adjustments (3) (71) (75) (408) (130)Non-recurring tax items (58) 11 (52) 39
Non-GAAP Operating Earnings (4) $ 559 $ 486 $ 1,068 $ 969______________(1) Had we modified the treatment of the amortization of DAC for SCS starting in the first quarter of 2018, the adjustment related to Variable annuity product features for the
three and six months ended June 30, 2018 would have been $232 million and $356 million .(2) Other adjustments include separation costs of $58 million , $33 million , $82 million and $94 million for the three and six months ended June 30, 2019 and 2018 ,
respectively.(3) Had we modified the treatment of the amortization of DAC for SCS starting in the first quarter of 2018, the adjustment related to Income tax expense (benefit) related to
above adjustments for the three and six months ended June 30, 2018 would have been $(71) million and $(115) million .(4) Had we modified the treatment of the amortization of DAC for SCS starting in the first quarter of 2018, Non-GAAP Operating Earnings for the three and six months ended
June 30, 2018 would have been $473 million and $915 million .
Non-GAAP Operating ROE and Non-GAAP Operating ROC by Segment
71
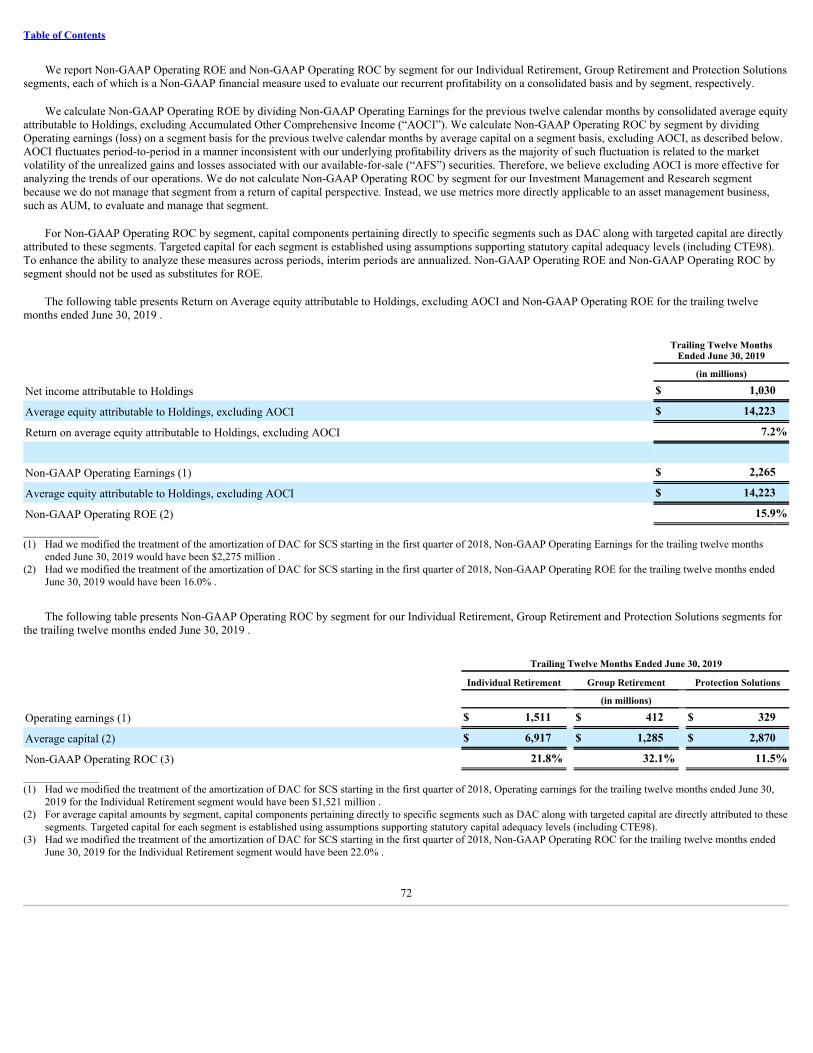
Table of Contents
We report Non-GAAP Operating ROE and Non-GAAP Operating ROC by segment for our Individual Retirement, Group Retirement and Protection Solutionssegments, each of which is a Non-GAAP financial measure used to evaluate our recurrent profitability on a consolidated basis and by segment, respectively.
We calculate Non-GAAP Operating ROE by dividing Non-GAAP Operating Earnings for the previous twelve calendar months by consolidated average equityattributable to Holdings, excluding Accumulated Other Comprehensive Income (“AOCI”). We calculate Non-GAAP Operating ROC by segment by dividingOperating earnings (loss) on a segment basis for the previous twelve calendar months by average capital on a segment basis, excluding AOCI, as described below.AOCI fluctuates period-to-period in a manner inconsistent with our underlying profitability drivers as the majority of such fluctuation is related to the marketvolatility of the unrealized gains and losses associated with our available-for-sale (“AFS”) securities. Therefore, we believe excluding AOCI is more effective foranalyzing the trends of our operations. We do not calculate Non-GAAP Operating ROC by segment for our Investment Management and Research segmentbecause we do not manage that segment from a return of capital perspective. Instead, we use metrics more directly applicable to an asset management business,such as AUM, to evaluate and manage that segment.
For Non-GAAP Operating ROC by segment, capital components pertaining directly to specific segments such as DAC along with targeted capital are directlyattributed to these segments. Targeted capital for each segment is established using assumptions supporting statutory capital adequacy levels (including CTE98).To enhance the ability to analyze these measures across periods, interim periods are annualized. Non-GAAP Operating ROE and Non-GAAP Operating ROC bysegment should not be used as substitutes for ROE.
The following table presents Return on Average equity attributable to Holdings, excluding AOCI and Non-GAAP Operating ROE for the trailing twelvemonths ended June 30, 2019 .
Trailing Twelve Months
Ended June 30, 2019 (in millions)
Net income attributable to Holdings $ 1,030
Average equity attributable to Holdings, excluding AOCI $ 14,223
Return on average equity attributable to Holdings, excluding AOCI 7.2%
Non-GAAP Operating Earnings (1) $ 2,265
Average equity attributable to Holdings, excluding AOCI $ 14,223
Non-GAAP Operating ROE (2) 15.9%______________(1) Had we modified the treatment of the amortization of DAC for SCS starting in the first quarter of 2018, Non-GAAP Operating Earnings for the trailing twelve months
ended June 30, 2019 would have been $2,275 million .(2) Had we modified the treatment of the amortization of DAC for SCS starting in the first quarter of 2018, Non-GAAP Operating ROE for the trailing twelve months ended
June 30, 2019 would have been 16.0% .
The following table presents Non-GAAP Operating ROC by segment for our Individual Retirement, Group Retirement and Protection Solutions segments forthe trailing twelve months ended June 30, 2019 .
Trailing Twelve Months Ended June 30, 2019
Individual Retirement Group Retirement Protection Solutions (in millions)
Operating earnings (1) $ 1,511 $ 412 $ 329
Average capital (2) $ 6,917 $ 1,285 $ 2,870
Non-GAAP Operating ROC (3) 21.8% 32.1% 11.5%______________(1) Had we modified the treatment of the amortization of DAC for SCS starting in the first quarter of 2018, Operating earnings for the trailing twelve months ended June 30,
2019 for the Individual Retirement segment would have been $1,521 million .(2) For average capital amounts by segment, capital components pertaining directly to specific segments such as DAC along with targeted capital are directly attributed to these
segments. Targeted capital for each segment is established using assumptions supporting statutory capital adequacy levels (including CTE98).(3) Had we modified the treatment of the amortization of DAC for SCS starting in the first quarter of 2018, Non-GAAP Operating ROC for the trailing twelve months ended
June 30, 2019 for the Individual Retirement segment would have been 22.0% .
72
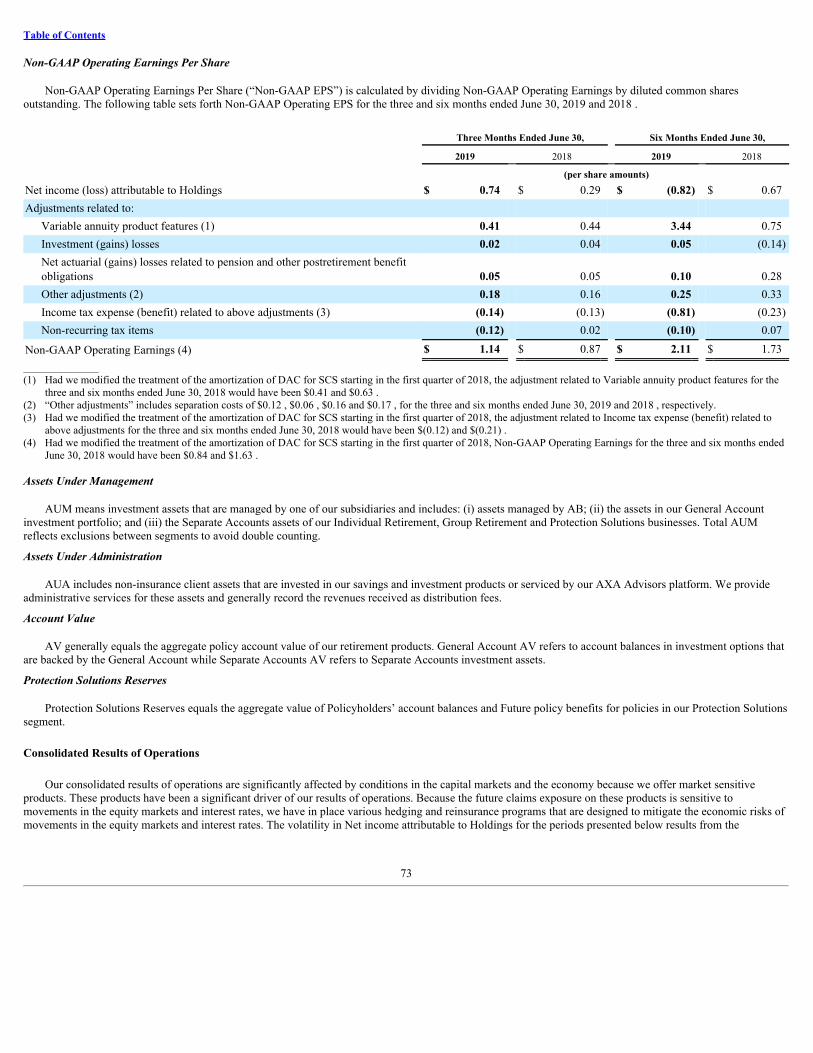
Table of Contents
Non-GAAP Operating Earnings Per Share
Non-GAAP Operating Earnings Per Share (“Non-GAAP EPS”) is calculated by dividing Non-GAAP Operating Earnings by diluted common sharesoutstanding. The following table sets forth Non-GAAP Operating EPS for the three and six months ended June 30, 2019 and 2018 .
Three Months Ended June 30, Six Months Ended June 30,
2019 2018 2019 2018 (per share amounts)Net income (loss) attributable to Holdings $ 0.74 $ 0.29 $ (0.82) $ 0.67Adjustments related to:
Variable annuity product features (1) 0.41 0.44 3.44 0.75Investment (gains) losses 0.02 0.04 0.05 (0.14)Net actuarial (gains) losses related to pension and other postretirement benefitobligations 0.05 0.05 0.10 0.28Other adjustments (2) 0.18 0.16 0.25 0.33Income tax expense (benefit) related to above adjustments (3) (0.14) (0.13) (0.81) (0.23)Non-recurring tax items (0.12) 0.02 (0.10) 0.07
Non-GAAP Operating Earnings (4) $ 1.14 $ 0.87 $ 2.11 $ 1.73______________(1) Had we modified the treatment of the amortization of DAC for SCS starting in the first quarter of 2018, the adjustment related to Variable annuity product features for the
three and six months ended June 30, 2018 would have been $0.41 and $0.63 .(2) “Other adjustments” includes separation costs of $0.12 , $0.06 , $0.16 and $0.17 , for the three and six months ended June 30, 2019 and 2018 , respectively.(3) Had we modified the treatment of the amortization of DAC for SCS starting in the first quarter of 2018, the adjustment related to Income tax expense (benefit) related to
above adjustments for the three and six months ended June 30, 2018 would have been $(0.12) and $(0.21) .(4) Had we modified the treatment of the amortization of DAC for SCS starting in the first quarter of 2018, Non-GAAP Operating Earnings for the three and six months ended
June 30, 2018 would have been $0.84 and $1.63 .
Assets Under Management
AUM means investment assets that are managed by one of our subsidiaries and includes: (i) assets managed by AB; (ii) the assets in our General Accountinvestment portfolio; and (iii) the Separate Accounts assets of our Individual Retirement, Group Retirement and Protection Solutions businesses. Total AUMreflects exclusions between segments to avoid double counting.
Assets Under Administration
AUA includes non-insurance client assets that are invested in our savings and investment products or serviced by our AXA Advisors platform. We provideadministrative services for these assets and generally record the revenues received as distribution fees.
Account Value
AV generally equals the aggregate policy account value of our retirement products. General Account AV refers to account balances in investment options thatare backed by the General Account while Separate Accounts AV refers to Separate Accounts investment assets.
Protection Solutions Reserves
Protection Solutions Reserves equals the aggregate value of Policyholders’ account balances and Future policy benefits for policies in our Protection Solutionssegment.
Consolidated Results of Operations
Our consolidated results of operations are significantly affected by conditions in the capital markets and the economy because we offer market sensitiveproducts. These products have been a significant driver of our results of operations. Because the future claims exposure on these products is sensitive tomovements in the equity markets and interest rates, we have in place various hedging and reinsurance programs that are designed to mitigate the economic risks ofmovements in the equity markets and interest rates. The volatility in Net income attributable to Holdings for the periods presented below results from the
73

Table of Contents
mismatch between: (i) the change in carrying value of the reserves for GMDB and certain GMIB features that do not fully and immediately reflect the impact ofequity and interest market fluctuations; and (ii) the change in fair value of products with the GMIB feature that has a no-lapse guarantee, and our hedging andreinsurance programs.
Reclassification of DAC Capitalization
During the fourth quarter of 2018, we changed our presentation of the capitalization of DAC in the consolidated statements of income for all prior periodspresented herein by netting the capitalized amounts within the applicable expense line items, such as Compensation and benefits, Commissions and distribution-related payments, and Other operating costs and expenses. Previously, the capitalized amounts were netted within the Amortization of DAC. There was no impacton Net income (loss) or Non-GAAP Operating Earnings of this reclassification.
The reclassification adjustments for the three and six months ended June 30, 2018 are presented in the tables below. Capitalization of DAC reclassified toCompensation and benefits, Commissions and distribution-related payments, and Other operating costs and expenses reduced the amounts previously reported inthose expense line items, whereas the capitalization of DAC reclassified from the Amortization of DAC line item increases that expense line item.
Three Months Ended June 30, 2018 Six Months Ended June 30, 2018
IndividualRetirement
GroupRetirement
ProtectionSolutions
Consoli-dated
IndividualRetirement
GroupRetirement
ProtectionSolutions
Consoli-dated
(in millions)Reductions to expense line items:
Commissions and distribution-related payments $ 81 $ 15 $ 36 $ 131 $ 153 $ 29 $ 70 $ 251Compensation and benefits andother operating costs and expenses 16 8 15 39 35 15 31 81
Total reductions $ 97 $ 23 $ 51 $ 170 $ 188 $ 44 $ 101 $ 332
Increase to expense line item: Amortization of deferred policyacquisition costs $ 97 $ 23 $ 51 $ 170 $ 188 $ 44 $ 101 $ 332
DAC Amortization for SCS
In the first quarter of 2019, the Company updated its Operating earnings measure to exclude market value adjustments impacting the DAC amortization for itsSCS variable annuity product in order to be consistent with the treatment of the market value adjustments on the SCS liability and with industry practice. Thepresentation of Operating earnings in prior periods was not revised to reflect this modification, however, the Company estimated that had the treatment in theCompany’s Operating earnings measure of the Amortization of DAC for SCS been modified in the first quarter of 2018, the pre-tax impact on Operating earningsof excluding the SCS-related DAC amortization from Operating earnings would have been a decrease of $52 million , $17 million and $4 million during the first,second and third quarters of 2018, respectively, and an increase of $17 million during the fourth quarter of 2018.
Ownership and Consolidation of AllianceBernstein
Our indirect, wholly owned subsidiary, AllianceBernstein Corporation, is the General Partner of AB. Accordingly, AB is consolidated in our financialstatements, and its results are fully reflected in our consolidated financial statements. Our blended economic interest in AB was approximately 65% during both thethree and six months of 2019 and approximately 59% and 52% during the three and six months of 2018 , respectively.
Effective Tax Rates
For interim reporting periods, we calculate income tax expense using an estimated annual effective tax rate (“ETR”), with discrete items recognized in theperiod in which they occur.
Consolidated Results of Operations
The following table summarizes our consolidated statements of income (loss) for the three and six months ended June 30, 2019 and 2018 :
74
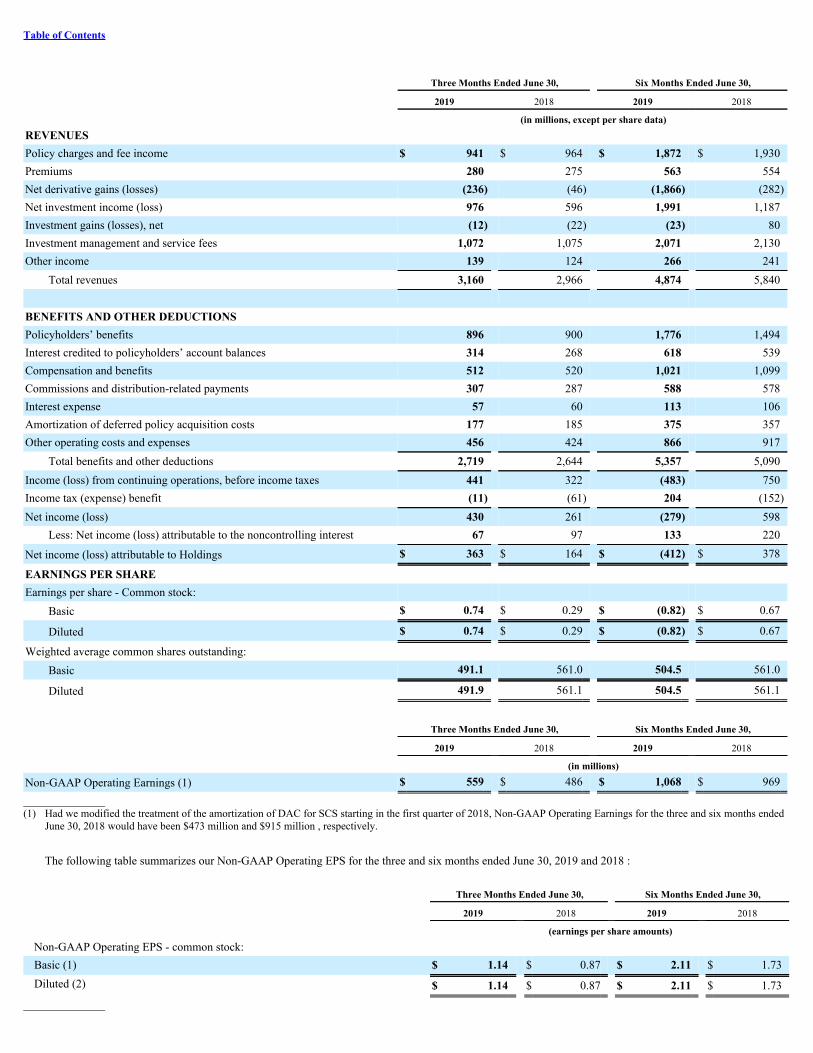
Table of Contents
Three Months Ended June 30, Six Months Ended June 30,
2019 2018 2019 2018 (in millions, except per share data)REVENUES Policy charges and fee income $ 941 $ 964 $ 1,872 $ 1,930Premiums 280 275 563 554Net derivative gains (losses) (236) (46) (1,866) (282)Net investment income (loss) 976 596 1,991 1,187Investment gains (losses), net (12) (22) (23) 80Investment management and service fees 1,072 1,075 2,071 2,130Other income 139 124 266 241
Total revenues 3,160 2,966 4,874 5,840 BENEFITS AND OTHER DEDUCTIONS Policyholders’ benefits 896 900 1,776 1,494Interest credited to policyholders’ account balances 314 268 618 539Compensation and benefits 512 520 1,021 1,099Commissions and distribution-related payments 307 287 588 578Interest expense 57 60 113 106Amortization of deferred policy acquisition costs 177 185 375 357Other operating costs and expenses 456 424 866 917
Total benefits and other deductions 2,719 2,644 5,357 5,090Income (loss) from continuing operations, before income taxes 441 322 (483) 750Income tax (expense) benefit (11) (61) 204 (152)Net income (loss) 430 261 (279) 598
Less: Net income (loss) attributable to the noncontrolling interest 67 97 133 220
Net income (loss) attributable to Holdings $ 363 $ 164 $ (412) $ 378
EARNINGS PER SHARE Earnings per share - Common stock:
Basic $ 0.74 $ 0.29 $ (0.82) $ 0.67
Diluted $ 0.74 $ 0.29 $ (0.82) $ 0.67
Weighted average common shares outstanding: Basic 491.1 561.0 504.5 561.0
Diluted 491.9 561.1 504.5 561.1
Three Months Ended June 30, Six Months Ended June 30,
2019 2018 2019 2018 (in millions)
Non-GAAP Operating Earnings (1) $ 559 $ 486 $ 1,068 $ 969______________(1) Had we modified the treatment of the amortization of DAC for SCS starting in the first quarter of 2018, Non-GAAP Operating Earnings for the three and six months ended
June 30, 2018 would have been $473 million and $915 million , respectively.
The following table summarizes our Non-GAAP Operating EPS for the three and six months ended June 30, 2019 and 2018 :
Three Months Ended June 30, Six Months Ended June 30,
2019 2018 2019 2018 (earnings per share amounts)
Non-GAAP Operating EPS - common stock: Basic (1) $ 1.14 $ 0.87 $ 2.11 $ 1.73Diluted (2) $ 1.14 $ 0.87 $ 2.11 $ 1.73
______________

75

Table of Contents
(1) Had we modified the treatment of the amortization of DAC for SCS starting in the first quarter of 2018, Non-GAAP Operating EPS - common stock, basic for the three andsix months ended June 30, 2018 would have been $0.84 and $1.63 , respectively.
(2) Had we modified the treatment of the amortization of DAC for SCS starting in the first quarter of 2018, Non-GAAP Operating EPS - common stock, diluted for the threeand six months ended June 30, 2018 would have been $0.84 and $1.63 , respectively.
The following discussion compares the results for the three and six months ended June 30, 2019 to the results for the three and six months ended June 30, 2018.
Three Months Ended June 30, 2019 Compared to Three Months Ended June 30, 2018
Net Income Attributable to Holdings
Net income (loss) attributable to Holdings increased by $199 million , to net income of $363 million for the three months ended June 30, 2019 from netincome of $164 million for the three months ended June 30, 2018 , primarily driven by the following notable items:
• Net investment income (loss) increased by $380 million mainly due to a change in the market value of trading securities supporting our variable annuityproducts mainly driven by lower interest rates.
• Investment gains (losses), net increased by $10 million due to 2018 higher losses from our General Account investment portfolio, partially offset by a realestate impairment in 2019.
• Net income (loss) attributable to the noncontrolling interest decreased by $30 million mainly due to lower AB Net income.
• Income tax expense decreased by $50 million driven primarily by a $63 million income tax benefit from the release of a state income tax liability in thethree months ended June 30, 2019, partially offset by higher pre-tax income.
Partially offsetting this increase were the following notable items:
• Net derivative gains (losses) decreased by $190 million mainly due to a higher increase in the fair value of the GMIBNLG liability, partially offset byincome from freestanding derivatives.
• Interest credited to policyholders’ account balances increased by $46 million mainly driven by our Individual Retirement segment, reflecting an increasein SCS AV and by our Protection Solutions segment, reflecting an increase in Indexed Universal Life reserves due to new business, partially offset byhigher Net derivative gains (losses), and higher interest credited on funding agreements.
• Compensation, benefits and other operating expenses increased by $24 million mainly due to higher separation costs.
• Commissions and distribution-related payments increased by $20 million mainly driven by higher distribution-related payments in our InvestmentManagement and Research segment and higher broker-dealer sales.
Non-GAAP Operating Earnings
Non-GAAP Operating Earnings increased by $73 million to $559 million during the three months ended June 30, 2019 from $486 million in the three monthsended June 30, 2018 . Had we modified the treatment of the amortization of DAC for SCS starting in the first quarter of 2018, Non-GAAP Operating Earnings forthe three months ended June 30, 2019 would have increased $86 million from $473 million in the three months ended June 30, 2018 . The following notable itemswere the primary drivers for the increase in Non-GAAP Operating Earnings.
• Net investment income increased by $116 million mainly due to the positive impacts of higher asset balances, General Account investment portfoliooptimization and higher seed money investment income.
• Amortization of DAC decreased by $50 million mainly driven by our Protection Solutions segment as this segment is no longer in loss recognition,partially offset by an increase in our Individual Retirement segment, due to the impact of interest rate and equity market movements on our SCS block inthe three months ended June 30, 2018. Had the treatment in our Non-GAAP Operating Earnings measure of the Amortization of DAC for SCS beenmodified starting in the first quarter of 2018, the SCS-related DAC amortization excluded from Non-GAAP Operating Earnings would have been $17million lower, decreasing Non-GAAP Operating Earnings.
• Earnings attributable to the noncontrolling interest decreased by $7 million mainly in our Investment Management and Research segment due to lowerAB Operating earnings.
76

Table of Contents
Partially offsetting this increase were the following notable items:
• Interest credited to policyholders’ account balances increased by $47 million mainly driven by our Individual Retirement segment, reflecting an increasein SCS AV due to higher sales, and by our Protection Solutions segment, mainly due to an increase in Indexed Universal Life reserves due to newbusiness, partially offset by higher Net derivative gains (losses), and higher interest credited on funding agreements.
• Net derivative gains (losses) decreased by $21 million mainly due to a $9 million and $8 million decrease in our Investment Management and Researchand Individual Retirement segments.
• Commissions and distribution-related payments increased by $20 million mainly driven by higher distribution-related payments in our InvestmentManagement and Research segment and higher broker-dealer sales.
• Income tax expense increased by $11 million mainly driven by higher pre-tax earnings partially offset by a lower effective tax rate. Had the treatment inour Non-GAAP Operating Earnings measure of the Amortization of DAC for SCS been modified starting in the first quarter of 2018, income tax benefitexcluded from Non-GAAP Operating Earnings would have been $4 million lower.
Six Months Ended June 30, 2019 Compared to Six Months Ended June 30, 2018
Net Income Attributable to Holdings
Net income (loss) attributable to Holdings decreased by $790 million , due to a net loss of $412 million for the six months ended June 30, 2019 from netincome of $378 million for the six months ended June 30, 2018 , primarily driven by the following notable items:
• Net derivative gains (losses) decreased by $1,584 million mainly due to increases in the fair value of the GMIBNLG liability, partially offset by incomefrom freestanding derivatives reflecting lower interest rates.
• Policyholders’ benefits increased by $282 million mainly driven by our Individual Retirement and Protection Solutions segments. The increase in ourIndividual Retirement segment was primarily due to the favorable impact of higher interest rates in the first six months of 2018. The assumption updatesin the third quarter of 2018 reduced the impact of interest rates on GMxB policyholders’ benefits in the first six months of 2019. The increase in ourProtection Solutions segment was primarily due to higher expected claims as the book is aging, combined with adverse mortality experience in the firstquarter of 2019.
• Investment gains (losses), net decreased by $103 million primarily due to higher gains from our General Account investment portfolio optimization in2018 and a real estate impairment in 2019.
• Revenue from fees and related items (“fee-type revenue”), including Policy charges and fee income, Premiums, Investment Management service fees andOther income, decreased by $83 million mainly driven by our Individual Retirement and Investment Management and Research segments. The decreasein the Individual Retirement segment was mainly due to lower average Separate Accounts AV in 2019 compared to 2018 as a result of a decline in equitymarkets in the fourth quarter of 2018. The decrease in our Investment Management segment was primarily due to lower Bernstein Research Servicesrevenues and lower performance-based fees.
• Interest credited to policyholders’ account balances increased by $79 million mainly driven by our Individual Retirement segment, reflecting an increasein SCS AV and by our Protection Solutions segment, mainly reflecting an increase in Indexed Universal Life reserves due to new business, partially offsetby higher Net derivative gains (losses), and higher interest credited on funding agreements.
• Amortization of DAC increased by $18 million mainly due to higher amortization in our Individual Retirement segment, primarily due to the impact ofinterest rate and equity market movements on assets supporting our SCS block, partially offset by lower amortization in our Protection Solutions segmentresulting from no longer being in loss recognition.
• Commissions and distribution-related payments increased by $10 million mainly driven by higher commission expense due to higher broker-dealer salesand higher distribution-related payments in our Investment Management and Research segment.
Partially offsetting this decrease were the following notable items:
77

Table of Contents
• Net investment income (loss) increased by $804 million mainly due to a change in the market value of trading securities supporting our variable annuityproducts due to lower interest rates.
• Compensation, benefits and other operating expenses decreased by $129 million mainly due to the partial settlement of the employee pension plan in thefirst six months of 2018 and lower separation costs.
• Net income (loss) attributable to noncontrolling interest decreased by $87 million mainly due to lower AB Net income and from the increase in ourownership percentage of AB that reduced the noncontrolling interest's share of AB's Net income.
• Income tax expense decreased by $356 million driven primarily by a pre-tax loss in the first six months of 2019 compared to pre-tax income in the firstsix months of 2018 and by a $63 million income tax benefit from the release of a state income tax liability in the six months ended June 30, 2019.
Non-GAAP Operating Earnings
Non-GAAP Operating Earnings increased by $99 million to $1,068 million during the six months ended June 30, 2019 from $969 million in the six monthsended June 30, 2018 . Had we modified the treatment of the amortization of DAC for SCS starting in the first quarter of 2018, Non-GAAP Operating Earnings forthe six months ended June 30, 2019 would have increased $153 million from $915 million in the six months ended June 30, 2018 . The following notable itemswere the primary drivers for the increase in Non-GAAP Operating Earnings.
• Net derivative gains (losses) increased by $244 million mainly due to a $271 million increase in our Individual Retirement segment due to decreasinginterest rates in 2019 compared to 2018.
• Net investment income increased by $207 million mainly due to the positive impacts of higher asset balances, General Account investment portfoliooptimization and higher seed money investment income.
• Amortization of DAC decreased by $75 million mainly driven by our Protection Solutions segment as this segment is no longer in loss recognition,partially offset by an increase in our Individual Retirement segment, due to the impact of interest rate and equity market movements on our SCS block inthe first six months of 2018. Had the treatment in our Non-GAAP Operating Earnings measure of the Amortization of DAC for SCS been modifiedstarting in the first quarter of 2018, the SCS-related DAC amortization excluded from Non-GAAP Operating Earnings would have been $69 millionlower, decreasing Non-GAAP Operating Earnings.
• Compensation, benefits and other operating costs and expenses decreased by $55 million mainly due to productivity initiatives, as well as a decrease inour Investment Management and Research segment driven by the non-recurrence of a $43 million expense related to the impact of adopting revenuerecognition standard ASC 606 in 2018, partially offset by higher operating expenses.
• Earnings attributable to the noncontrolling interest decreased by $78 million mainly in our Investment Management and Research segment due to lowerAB Operating earnings and from the increase in our ownership percentage of AB that reduced the noncontrolling interest’s share of AB’s Operatingearnings.
Partially offsetting this increase were the following notable items:
• Policyholders’ benefits increased by $293 million mainly driven by our Individual Retirement and Protection Solutions segment. The increase in ourIndividual Retirement segment, which was offset by an increase in Net derivatives gains (losses), was primarily due to the favorable impact of higherinterest rates in the first six months of 2018. The assumption updates in the third quarter of 2018 reduced the impact of interest rates on GMxBpolicyholders’ benefits in the first six months of 2019. The increase in our Protection Solutions segment was primarily due to higher expected claims asthe book is aging, combined with adverse mortality experience in the first quarter of 2019.
• Fee-type revenue decreased by $160 million mainly driven by our Investment Management and Research and Individual Retirement segments. Thedecrease in our Investment Management and Research segment was mainly due to lower performance-based fees, primarily due to the non-recurrence of a$78 million increase in revenues in the first six months of 2018 from the impact of adopting revenue recognition standard ASC 606 in 2018 and lowerBernstein Research Services revenues. The decrease in the Individual Retirement segment was mainly due to lower average Separate Accounts AV in2019 compared to 2018 as a result of the decline in equity markets in the fourth quarter of 2018.
78

Table of Contents
• Interest credited to policyholders’ account balances increased by $79 million mainly driven by our Individual Retirement segment, reflecting an increasein SCS AV due to higher sales, and by our Protection Solutions segment, mainly due to an increase in Indexed Universal Life reserves due to newbusiness, partially offset by higher Net derivative gains (losses), and higher interest credited on funding agreements.
• Interest expense and financing fees increased by $12 million mainly in Corporate and Other driven by the issuance of $3.8 billion of debt in April 2018.
• Commissions and distribution-related payments increased by $10 million mainly driven by higher commission expense due to higher broker-dealer salesand higher distribution-related payments in our Investment Management and Research segment.
• Income tax expense increased by $6 million mainly driven by higher pre-tax earnings partially offset by a lower effective tax rate. Had the treatment inour Non-GAAP Operating Earnings measure of the Amortization of DAC for SCS been modified starting in the first quarter of 2018, income tax benefitexcluded from Non-GAAP Operating Earnings would have been $15 million lower.
Results of Operations by Segment
We manage our business through the following four segments: Individual Retirement, Group Retirement, Investment Management and Research, andProtection Solutions. We report certain activities and items that are not included in our four segments in Corporate and Other. The following section presents ourdiscussion of Operating earnings (loss) by segment and AUM, AV and Protection Solutions Reserves by segment, as applicable. Consistent with U.S. GAAPguidance for segment reporting, Operating earnings (loss) is our U.S. GAAP measure of segment performance. See Note 15 of the Notes to the ConsolidatedFinancial Statements for further information on our segments.
The following table summarizes Operating earnings (loss) by segment and Corporate and Other for the periods presented:
Three Months Ended June 30, Six Months Ended June 30,
2019 2018 2019 2018 (in millions)Operating earnings (loss):
Individual Retirement (1) $ 359 $ 405 $ 729 $ 773Group Retirement 95 77 176 153Investment Management and Research 80 97 157 178Protection Solutions 106 (12) 155 23
Corporate and Other (81) (81) (149) (158)Non-GAAP Operating Earnings (2) $ 559 $ 486 $ 1,068 $ 969
______________(1) Had we modified the treatment of the amortization of DAC for SCS starting in the first quarter of 2018, Operating earnings for the three and six months ended June 30,
2018 for the Individual Retirement segment would have been $392 million and $719 million , respectively.(2) Had we modified the treatment of the amortization of DAC for SCS starting in the first quarter of 2018, Non-GAAP Operating Earnings for the three and six months ended
June 30, 2018 would have been $473 million and $915 million , respectively.
Effective Tax Rates by Segment
For interim reporting periods, we calculate income tax expense using an estimated annual effective tax rate (“ETR”), with discrete items recognized in theperiod in which they occur. Income tax expense is calculated using the ETR and then allocated to our business segments using a 17% ETR for our retirement andprotection businesses (Individual Retirement, Group Retirement, and Protection Solutions) and a 28% ETR for Investment Management and Research for the sixmonths ended June 30, 2019.
Individual Retirement
The Individual Retirement segment includes our variable annuity products which primarily meet the needs of individuals saving for retirement or seekingretirement income.
79
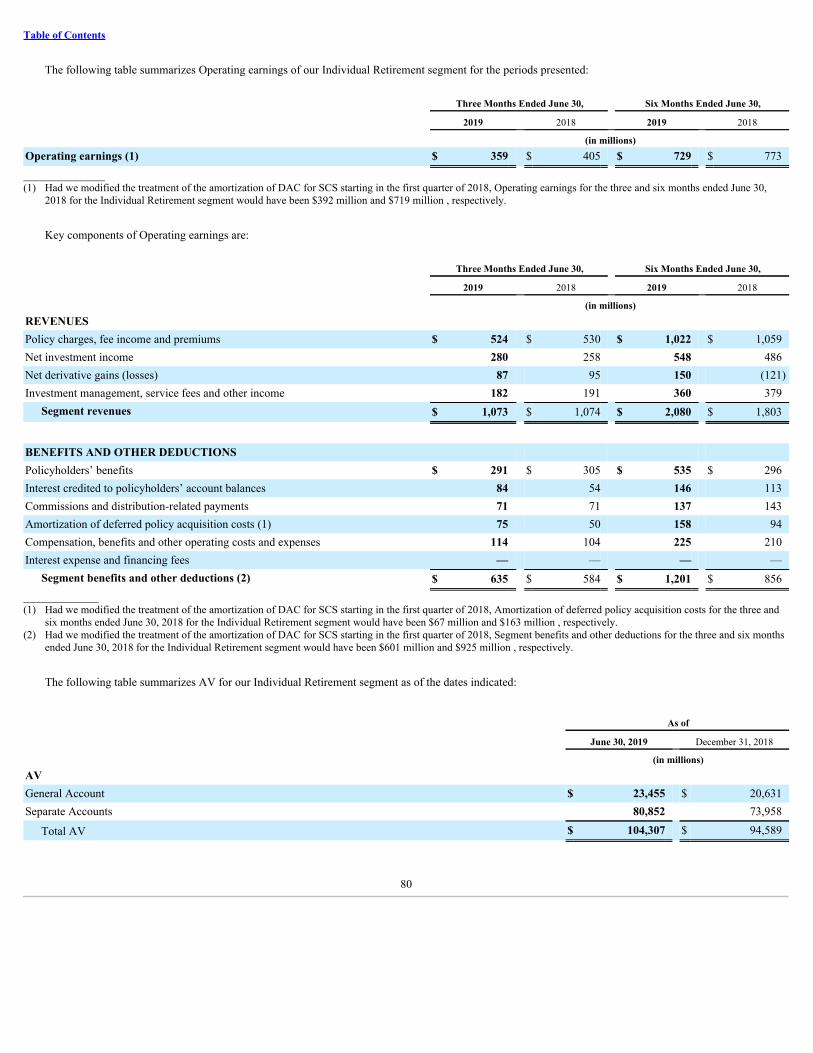
Table of Contents
The following table summarizes Operating earnings of our Individual Retirement segment for the periods presented:
Three Months Ended June 30, Six Months Ended June 30,
2019 2018 2019 2018 (in millions)Operating earnings (1) $ 359 $ 405 $ 729 $ 773______________(1) Had we modified the treatment of the amortization of DAC for SCS starting in the first quarter of 2018, Operating earnings for the three and six months ended June 30,
2018 for the Individual Retirement segment would have been $392 million and $719 million , respectively.
Key components of Operating earnings are:
Three Months Ended June 30, Six Months Ended June 30,
2019 2018 2019 2018 (in millions)REVENUES Policy charges, fee income and premiums $ 524 $ 530 $ 1,022 $ 1,059Net investment income 280 258 548 486Net derivative gains (losses) 87 95 150 (121)Investment management, service fees and other income 182 191 360 379
Segment revenues $ 1,073 $ 1,074 $ 2,080 $ 1,803
BENEFITS AND OTHER DEDUCTIONS Policyholders’ benefits $ 291 $ 305 $ 535 $ 296Interest credited to policyholders’ account balances 84 54 146 113Commissions and distribution-related payments 71 71 137 143Amortization of deferred policy acquisition costs (1) 75 50 158 94Compensation, benefits and other operating costs and expenses 114 104 225 210Interest expense and financing fees — — — —
Segment benefits and other deductions (2) $ 635 $ 584 $ 1,201 $ 856______________(1) Had we modified the treatment of the amortization of DAC for SCS starting in the first quarter of 2018, Amortization of deferred policy acquisition costs for the three and
six months ended June 30, 2018 for the Individual Retirement segment would have been $67 million and $163 million , respectively.(2) Had we modified the treatment of the amortization of DAC for SCS starting in the first quarter of 2018, Segment benefits and other deductions for the three and six months
ended June 30, 2018 for the Individual Retirement segment would have been $601 million and $925 million , respectively.
The following table summarizes AV for our Individual Retirement segment as of the dates indicated:
As of
June 30, 2019 December 31, 2018 (in millions)AV General Account $ 23,455 $ 20,631Separate Accounts 80,852 73,958
Total AV $ 104,307 $ 94,589
80
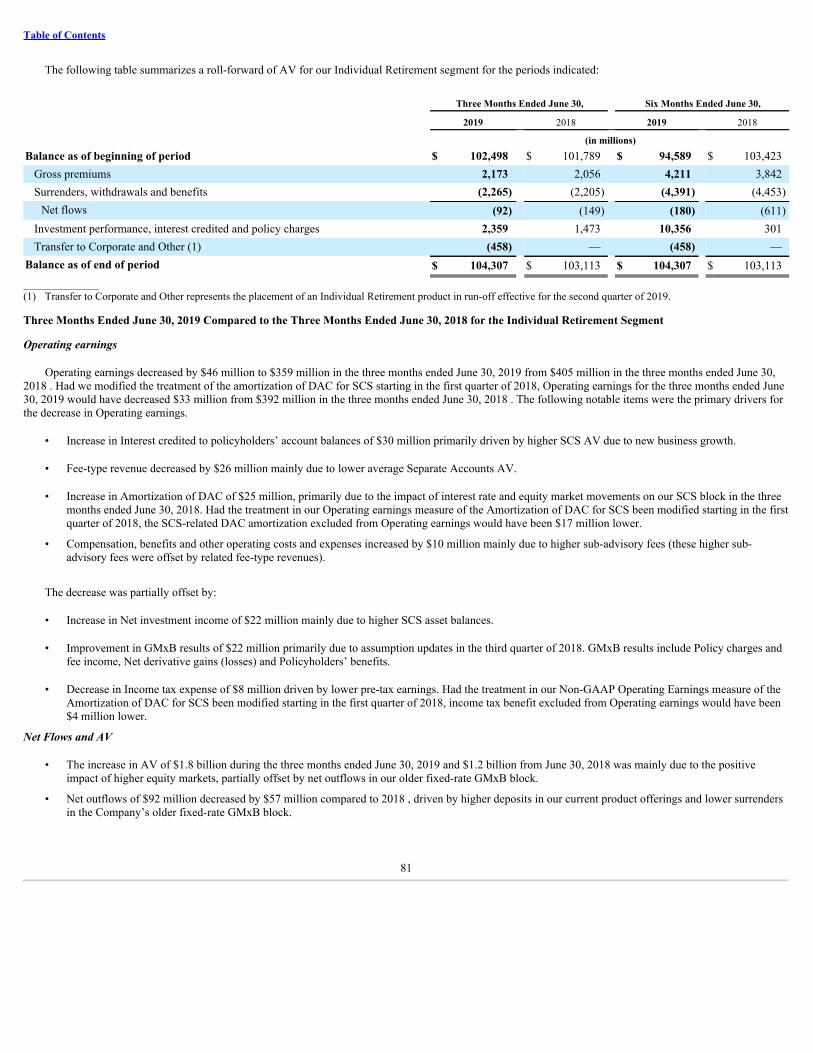
Table of Contents
The following table summarizes a roll-forward of AV for our Individual Retirement segment for the periods indicated:
Three Months Ended June 30, Six Months Ended June 30,
2019 2018 2019 2018 (in millions)Balance as of beginning of period $ 102,498 $ 101,789 $ 94,589 $ 103,423
Gross premiums 2,173 2,056 4,211 3,842Surrenders, withdrawals and benefits (2,265) (2,205) (4,391) (4,453)
Net flows (92) (149) (180) (611)Investment performance, interest credited and policy charges 2,359 1,473 10,356 301Transfer to Corporate and Other (1) (458) — (458) —
Balance as of end of period $ 104,307 $ 103,113 $ 104,307 $ 103,113______________(1) Transfer to Corporate and Other represents the placement of an Individual Retirement product in run-off effective for the second quarter of 2019.
Three Months Ended June 30, 2019 Compared to the Three Months Ended June 30, 2018 for the Individual Retirement Segment
Operating earnings
Operating earnings decreased by $46 million to $359 million in the three months ended June 30, 2019 from $405 million in the three months ended June 30,2018 . Had we modified the treatment of the amortization of DAC for SCS starting in the first quarter of 2018, Operating earnings for the three months ended June30, 2019 would have decreased $33 million from $392 million in the three months ended June 30, 2018 . The following notable items were the primary drivers forthe decrease in Operating earnings.
• Increase in Interest credited to policyholders’ account balances of $30 million primarily driven by higher SCS AV due to new business growth.
• Fee-type revenue decreased by $26 million mainly due to lower average Separate Accounts AV.
• Increase in Amortization of DAC of $25 million, primarily due to the impact of interest rate and equity market movements on our SCS block in the threemonths ended June 30, 2018. Had the treatment in our Operating earnings measure of the Amortization of DAC for SCS been modified starting in the firstquarter of 2018, the SCS-related DAC amortization excluded from Operating earnings would have been $17 million lower.
• Compensation, benefits and other operating costs and expenses increased by $10 million mainly due to higher sub-advisory fees (these higher sub-advisory fees were offset by related fee-type revenues).
The decrease was partially offset by:
• Increase in Net investment income of $22 million mainly due to higher SCS asset balances.
• Improvement in GMxB results of $22 million primarily due to assumption updates in the third quarter of 2018. GMxB results include Policy charges andfee income, Net derivative gains (losses) and Policyholders’ benefits.
• Decrease in Income tax expense of $8 million driven by lower pre-tax earnings. Had the treatment in our Non-GAAP Operating Earnings measure of theAmortization of DAC for SCS been modified starting in the first quarter of 2018, income tax benefit excluded from Operating earnings would have been$4 million lower.
Net Flows and AV
• The increase in AV of $1.8 billion during the three months ended June 30, 2019 and $1.2 billion from June 30, 2018 was mainly due to the positiveimpact of higher equity markets, partially offset by net outflows in our older fixed-rate GMxB block.
• Net outflows of $92 million decreased by $57 million compared to 2018 , driven by higher deposits in our current product offerings and lower surrendersin the Company’s older fixed-rate GMxB block.
81

Table of Contents
Six Months Ended June 30, 2019 Compared to Six Months Ended June 30, 2018 for the Individual Retirement Segment
Operating earnings
Operating earnings decreased by $44 million to $729 million in the first six months of 2019 from $773 million in the first six months of 2018 . Had wemodified the treatment of the amortization of DAC for SCS starting in the first quarter of 2018, Operating earnings for the six months ended June 30, 2019 wouldhave increased $10 million from $719 million in the six months ended June 30, 2018 . The following notable items were the primary drivers for the decrease inOperating earnings.
• Increase in Amortization of DAC of $64 million, primarily due to the impact of interest rate and equity market movements on our SCS block in the firstsix months of 2018. Had the treatment in our Operating earnings measure of the Amortization of DAC for SCS been modified starting in the first quarterof 2018, the SCS-related DAC amortization excluded from Operating earnings would have been $69 million lower.
• Fee-type revenue decreased by $56 million mainly due to lower average Separate Accounts AV in 2019 compared to 2018 as a result of the sharp declinein equity markets in the fourth quarter of 2018.
• Increase in Interest credited to policyholders’ account balances of $33 million primarily driven by higher SCS AV due to new business growth.
• Compensation, benefits and other operating costs and expenses increased by $15 million primarily due to higher sub-advisory fee expenses (these highersub-advisory fees were offset by related fee-type revenues).
The decrease was partially offset by:
• Increase in Net investment income of $62 million mainly due to higher SCS asset balances partially offset by lower investment income from assetssupporting our GMxB products.
• Improvement in GMxB results of $31 million primarily due to assumption updates in the third quarter of 2018. GMxB results include Policy charges andfee income, Net derivative gains (losses) and Policyholders’ benefits.
• Decrease in Income tax expense of $24 million driven by lower pre-tax earnings as well as a lower effective tax rate. Had the treatment in our Non-GAAPOperating Earnings measure of the Amortization of DAC for SCS been modified starting in the first quarter of 2018, income tax benefit excluded fromOperating earnings would have been $15 million lower.
Net Flows and AV
• The increase in AV of $9.7 billion during the six months ended June 30, 2019 was due to higher equity markets partially offset by net outflows in ourolder fixed-rate GMxB block.
• Net outflows of $180 million improved by $431 million compared to 2018 , driven by higher deposits in our current product offerings and lowersurrenders in the Company’s older fixed-rate GMxB block.
Group Retirement
The Group Retirement segment offers tax-deferred investment and retirement services or products to plans sponsored by educational entities, municipalitiesand not-for-profit entities, as well as small and medium-sized businesses.
The following table summarizes Operating earnings of our Group Retirement segment for the periods presented:
Three Months Ended June 30, Six Months Ended June 30,
2019 2018 2019 2018 (in millions)
Operating earnings $ 95 $ 77 $ 176 $ 153
82

Table of Contents
Key components of Operating earnings are:
Three Months Ended June 30, Six Months Ended June 30,
2019 2018 2019 2018 (in millions)REVENUES Policy charges, fee income and premiums $ 69 $ 70 $ 134 $ 134Net investment income 150 124 284 255Net derivative gains (losses) (2) 2 2 1Investment management, service fees and other income 50 49 98 93
Segment revenues $ 267 $ 245 $ 518 $ 483
BENEFITS AND OTHER DEDUCTIONS Policyholders’ benefits $ 1 $ — $ 1 $ —Interest credited to policyholders’ account balances 75 74 148 144Commissions and distribution-related payments 11 12 21 22Amortization of deferred policy acquisition costs 10 6 22 17Compensation, benefits and other operating costs and expenses 54 59 114 113Interest expense and financing fees — — — —
Segment benefits and other deductions $ 151 $ 151 $ 306 $ 296
The following table summarizes AV for our Group Retirement segment as of the dates indicated:
As of
June 30, 2019 December 31, 2018 (in millions)AV General Account $ 11,892 $ 11,619Separate Accounts 24,165 20,782
Total AV $ 36,057 $ 32,401
The following table summarizes a roll-forward of AV for our Group Retirement segment for the periods indicated:
Three Months Ended June 30, Six Months Ended June 30,
2019 2018 2019 2018 (in millions)Balance as of beginning of period $ 35,077 $ 33,918 $ 32,401 $ 33,906
Gross premiums 910 885 1,750 1,722Surrenders, withdrawals and benefits (746) (734) (1,479) (1,470)
Net flows 164 151 271 252Investment performance, interest credited and policy charges 816 580 3,385 491
Balance as of end of period $ 36,057 $ 34,649 $ 36,057 $ 34,649
Three Months Ended June 30, 2019 Compared to the Three Months Ended June 30, 2018 for the Group Retirement Segment
Operating earnings
Operating earnings increased by $18 million to $95 million in the three months ended June 30, 2019 from $77 million in the three months ended June 30, 2018primarily attributable to the following:
• Net investment income increased by $26 million due to higher asset balances.
83

Table of Contents
• Decrease in Compensation, benefits and other operating costs and expenses of $5 million driven by productivity initiatives.
The increase was partially offset by the following:
• Decrease in Net derivative gains (losses) of $4 million primarily due to losses on freestanding derivatives.
• Increase in income tax expense of $4 million driven by higher pre-tax operating earnings.
Net Flows and AV
• The increase in the AV of $1.0 billion during the three months ended June 30, 2019 and $1.4 billion from June 30, 2018 was primarily due to higherequity markets and positive net flows.
• Net inflows of $164 million improved by $13 million compared to 2018, driven by strong inflows and lower surrenders.
Six Months Ended June 30, 2019 Compared to Six Months Ended June 30, 2018 for the Group Retirement Segment
Operating earnings
Operating earnings increased by $23 million to $176 million for the first six months of 2019 from $153 million in the first six months of 2018 .
The increase is primarily attributable to the following:
• Net investment income increased by $29 million due to higher asset balances and our General Account investment portfolio optimization.
• Increase in fee-type revenues of $5 million due to higher average Separate Accounts AV, reflecting higher equity markets.
The increase was partially offset by the following:
• Interest credited to policyholders’ account balances increased by $4 million due to AV growth.
Net Flows and AV
• The increase in AV of $3.7 billion during the six months ended June 30, 2019 was primarily due to higher equity -markets and positive net flows.
• Net flows of $271 million improved by $19 million compared to 2018, driven by strong inflows and lower surrenders.
Investment Management and Research
The Investment Management and Research segment provides diversified investment management, research and related services to a broad range of clientsaround the world. Operating earnings (loss), net of tax, presented here represents our blended economic interest in AB of approximately 65% during both the threeand six months of 2019 and approximately 59% and 52% during the three and six months of 2018 , respectively.
The following table summarizes Operating earnings of our Investment Management and Research segment for the periods presented:
Three Months Ended June 30, Six Months Ended June 30,
2019 2018 2019 2018 (in millions)Operating earnings $ 80 $ 97 $ 157 $ 178
84

Table of Contents
Key components of Operating earnings are:
Three Months Ended June 30, Six Months Ended June 30,
2019 2018 2019 2018 (in millions)REVENUES Policy charges, fee income and premiums $ — $ — $ — $ —Net investment income 15 4 39 7Net derivative gains (losses) (9) — (29) 2Investment management, service fees and other income 842 838 1,618 1,742
Segment revenues $ 848 $ 842 $ 1,628 $ 1,751
BENEFITS AND OTHER DEDUCTIONS Policyholders’ benefits $ — $ — $ — $ —Interest credited to policyholders’ account balances — — — —Commissions and distribution-related payments 116 106 222 216Amortization of deferred policy acquisition costs — — — —Compensation, benefits and other operating costs and expenses 547 513 1,056 1,075Interest expense and financing fees 3 2 7 4
Segment benefits and other deductions $ 666 $ 621 $ 1,285 $ 1,295
Changes in AUM in the Investment Management and Research segment for the periods presented were as follows:
Three Months Ended June 30, Six Months Ended June 30,
2019 2018 2019 2018 (in billions)Balance as of beginning of period $ 554.7 $ 549.5 $ 516.4 554.5Long-term flows:
Sales/new accounts 27.3 19.0 50.3 53.2Redemptions/terminations (16.1) (23.3) (34.2) (54.5)Cash flow/unreinvested dividends (1.7) (3.4) (5.5) (8.8)Net long-term (outflows) inflows 9.5 (7.7) 10.6 (10.1)
AUM adjustment (1) (0.9) — (0.9) —Market appreciation (depreciation) 17.5 (2.0) 54.7 (4.6)Net change 26.1 (9.7) 64.4 (14.7)
Balance as of end of period $ 580.8 $ 539.8 $ 580.8 $ 539.8
______________(1) Approximately $900 million of non-investment management fee earning taxable and tax-exempt money market assetswere removed from assets under management during the second quarter of 2019.
Average AUM in the Investment Management and Research segment for the periods presented by distribution channel and investment services were asfollows:
Three Months Ended June 30, Six Months Ended June 30,
2019 2018 2019 2018 (in billions)Distribution Channel: Institutions $ 262.1 $ 256.7 $ 257.2 $ 262.7Retail 207.3 191.0 200.1 192.7Private Wealth Management 96.5 94.5 94.9 94.2Total $ 565.9 $ 542.2 $ 552.2 $ 549.6
85

Table of Contents
Three Months Ended June 30, Six Months Ended June 30,
2019 2018 2019 2018 (in billions)Investment Service: Equity Actively Managed $ 157.4 $ 145.4 $ 152.6 $ 144.4Equity Passively Managed (1) 56.1 52.7 54.9 53.7Fixed Income Actively Managed – Taxable 233.5 230.6 228.6 236.9Fixed Income Actively Managed – Tax-exempt 44.1 41.1 43.3 40.8Fixed Income Passively Managed (1) 9.4 10.0 9.4 10.0Other (2) 65.4 62.4 63.4 63.8Total $ 565.9 $ 542.2 $ 552.2 $ 549.6______________(1) Includes index and enhanced index services.(2) Includes multi-asset solutions and services, and certain alternative investments.
Three Months Ended June 30, 2019 Compared to the Three Months Ended June 30, 2018 for the Investment Management and Research Segment
Operating earnings
Operating earnings decreased by $17 million in the three months ended June 30, 2019 to $80 million from $97 million in the three months ended June 30,2018 primarily attributable to the following:
• Compensation, benefits and other operating costs and expenses increased $34 million primarily due to higher general and administrative expenses.
• Higher commissions and distribution-related payments of $10 million due to higher payments to financial intermediaries for distribution of AB mutualfunds.
• Net derivative gains (losses) decreased $9 million primarily due to derivative losses mainly offsetting the increase in Net investment income.
This decrease was partially offset by the following:
• Increase in Net investment income of $11 million mainly offsetting the decrease in Net derivative gains (losses).
• Earnings attributable to the noncontrolling interest decreased by $14 million due to lower AB Operating earnings.
Long-Term Net Flows and AUM
• Total AUM as of June 30, 2019 was $580.8 billion , up $26.1 billion , or 4.7% , compared to March 31, 2019 . The increase during the second quarter of2019 was driven by market appreciation of $17.5 billion and net inflows of $9.5 billion (net inflows of $5.9 billion and $4.2 billion for Retail andInstitutions, respectively, offset by Private Wealth Management net outflows of $0.6 billion ).
Six Months Ended June 30, 2019 Compared to Six Months Ended June 30, 2018 for the Investment Management and Research Segment
Operating earnings
Operating earnings decreased by $21 million in the first six months of 2019 to $157 million from $178 million in the first six months of 2018 primarilyattributable to the following:
• Decrease in fee-type revenues of $124 million mainly due lower performance-based fees, primarily due to the non-recurrence of a $78 million increase inrevenues in the first six months of 2018 from the impact of adopting revenue recognition standard ASC 606 in 2018 and lower Bernstein ResearchServices revenues.
• Net derivative gains (losses) decreased $31 million primarily due to derivative losses mainly offsetting the increase in Net investment income.
86

Table of Contents
• Higher commissions and distribution-related payments of $6 million due to higher payments to financial intermediaries for distribution of AB mutualfunds.
This decrease was partially offset by the following:
• Increase in Net investment income of $32 million mainly offsetting the decrease in Net derivative gains (losses).
• Compensation, benefits and other operating costs and expenses decreased $19 million primarily due to the non-recurrence of a $43 million expenserelated to the impact of adopting revenue recognition standard ASC 606 in the first six months of 2018 partially offset by higher general andadministrative expenses.
• Earnings attributable to the noncontrolling interest decreased by $86 million due to lower AB Operating earnings and from the increase in our ownershippercentage of AB that reduced the noncontrolling interests’ share of AB’s Operating earnings.
Long-Term Net Flows and AUM
• T otal AUM as of June 30, 2019 was $580.8 billion , up $41.0 billion , or 7.6% , compared to June 30, 2018 . During the twelve months ended June 30,2019 AUM increased as a result of market appreciation of $29.3 billion and net inflows of $12.6 billion (Retail net inflows of $13.1 billion , andInstitutional net inflows of $0.3 billion , offset by net outflows of $0.8 billion for Private Wealth Management).
Protection Solutions
The Protection Solutions segment includes our life insurance and employee benefits businesses. We provide a targeted range of products aimed at serving thefinancial needs of our clients throughout their lives, including VUL, IUL and term life products. In 2015, we entered the employee benefits market and currentlyoffer a suite of dental, vision, life, as well as short- and long-term disability insurance products to small and medium-size businesses.
In recent years, we have refocused our product offering and distribution towards less capital intensive, higher return accumulation and protection products. Weplan to improve our Operating earnings over time through earnings generated from sales of our repositioned product portfolio and by proactively managing andoptimizing our in-force book.
The following table summarizes Operating earnings (loss) of our Protection Solutions segment for the periods presented:
Three Months Ended June 30, Six Months Ended June 30,
2019 2018 2019 2018 (in millions)Operating earnings $ 106 $ (12) $ 155 $ 23
Key components of Operating earnings (loss) are:
Three Months Ended June 30, Six Months Ended June 30,
2019 2018 2019 2018 (in millions)REVENUES Policy charges, fee income and premiums $ 530 $ 537 $ 1,072 $ 1,077Net investment income 248 194 472 414Net derivative gains (losses) 1 3 11 2Investment management, service fees and other income 64 56 119 111
Segment revenues $ 843 $ 790 $ 1,674 $ 1,604
87

Table of Contents
Three Months Ended June 30, Six Months Ended June 30,
2019 2018 2019 2018 (in millions)BENEFITS AND OTHER DEDUCTIONS Policyholders’ benefits $ 419 $ 419 $ 871 $ 828Interest credited to policyholders’ account balances 127 120 265 242Commissions and distribution-related payments 43 39 81 71Amortization of deferred policy acquisition costs 50 133 100 246Compensation, benefits and other operating costs and expenses 75 94 170 190Interest expense and financing fees — — — —
Segment benefits and other deductions $ 714 $ 805 $ 1,487 $ 1,577
The following table summarizes Protection Solutions Reserves for our Protection Solutions segment as of the dates presented:
As of
June 30, 2019 December 31, 2018 (in millions)Protection Solutions Reserves (1)
General Account $ 17,716 $ 17,562Separate Accounts 12,903 11,393
Total Protection Solutions Reserves $ 30,619 $ 28,955______________(1) Does not include Protection Solutions Reserves for our Employee Benefits business as it is a start-up business and therefore has immaterial in-force policies.
The following table presents our in-force face amounts for the periods indicated, respectively, for our individual life insurance products:
As of
June 30, 2019 December 31, 2018 (in billions)In-force face amount by product: (1) Universal Life (2) $ 54.5 $ 55.9Indexed Universal Life 24.3 22.9Variable Universal Life (3) 127.1 127.3Term 235.4 234.9Whole Life 1.4 1.4
Total in-force face amount $ 442.7 $ 442.4______________(1) Includes individual life insurance and does not include Employee Benefits as it is a start-up business and therefore has immaterial in-force policies.(2) Universal Life includes Guaranteed Universal Life.(3) Variable Universal Life includes VL and COLI.
Three Months Ended June 30, 2019 Compared to the Three Months Ended June 30, 2018 for the Protection Solutions Segment
Operating earnings
Operating earnings increased by $118 million to $106 million in the three months ended June 30, 2019 compared to an Operating (loss) of $12 million in thethree months ended June 30, 2018 primarily attributable to the following:
• Decrease in Amortization of DAC of $83 million as the Protection Solutions segment is no longer in loss recognition.
88
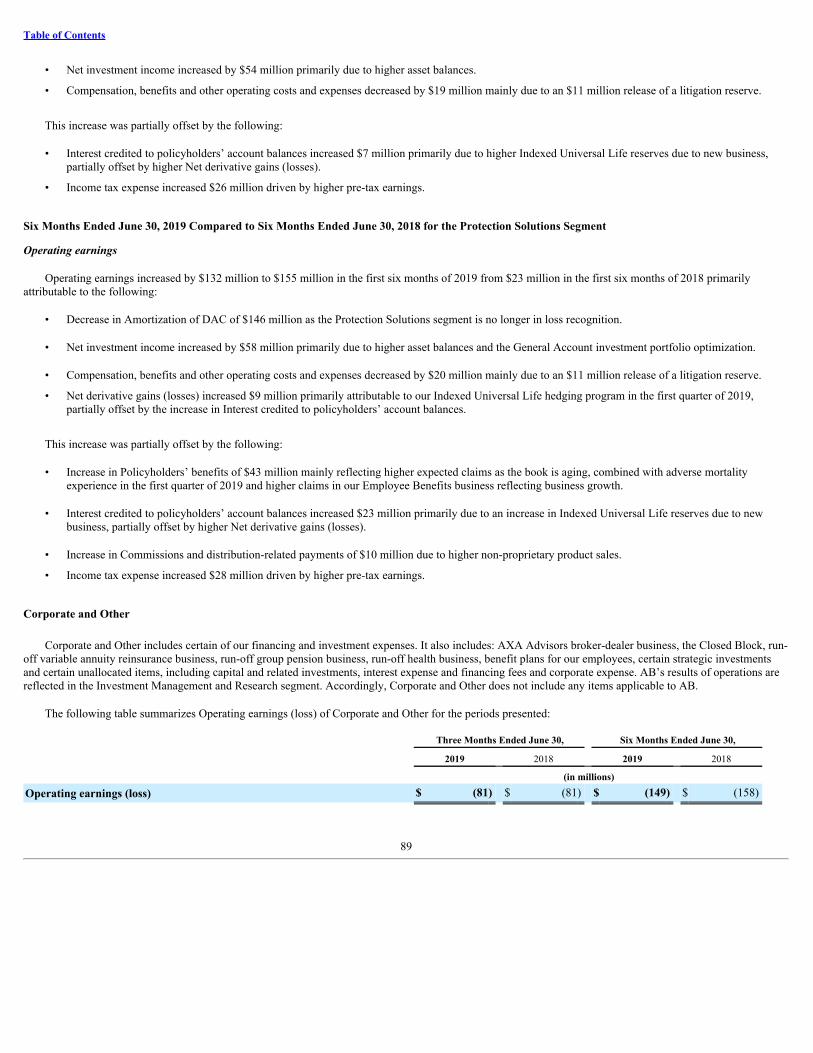
Table of Contents
• Net investment income increased by $54 million primarily due to higher asset balances.
• Compensation, benefits and other operating costs and expenses decreased by $19 million mainly due to an $11 million release of a litigation reserve.
This increase was partially offset by the following:
• Interest credited to policyholders’ account balances increased $7 million primarily due to higher Indexed Universal Life reserves due to new business,partially offset by higher Net derivative gains (losses).
• Income tax expense increased $26 million driven by higher pre-tax earnings.
Six Months Ended June 30, 2019 Compared to Six Months Ended June 30, 2018 for the Protection Solutions Segment
Operating earnings
Operating earnings increased by $132 million to $155 million in the first six months of 2019 from $23 million in the first six months of 2018 primarilyattributable to the following:
• Decrease in Amortization of DAC of $146 million as the Protection Solutions segment is no longer in loss recognition.
• Net investment income increased by $58 million primarily due to higher asset balances and the General Account investment portfolio optimization.
• Compensation, benefits and other operating costs and expenses decreased by $20 million mainly due to an $11 million release of a litigation reserve.
• Net derivative gains (losses) increased $9 million primarily attributable to our Indexed Universal Life hedging program in the first quarter of 2019,partially offset by the increase in Interest credited to policyholders’ account balances.
This increase was partially offset by the following:
• Increase in Policyholders’ benefits of $43 million mainly reflecting higher expected claims as the book is aging, combined with adverse mortalityexperience in the first quarter of 2019 and higher claims in our Employee Benefits business reflecting business growth.
• Interest credited to policyholders’ account balances increased $23 million primarily due to an increase in Indexed Universal Life reserves due to newbusiness, partially offset by higher Net derivative gains (losses).
• Increase in Commissions and distribution-related payments of $10 million due to higher non-proprietary product sales.
• Income tax expense increased $28 million driven by higher pre-tax earnings.
Corporate and Other
Corporate and Other includes certain of our financing and investment expenses. It also includes: AXA Advisors broker-dealer business, the Closed Block, run-off variable annuity reinsurance business, run-off group pension business, run-off health business, benefit plans for our employees, certain strategic investmentsand certain unallocated items, including capital and related investments, interest expense and financing fees and corporate expense. AB’s results of operations arereflected in the Investment Management and Research segment. Accordingly, Corporate and Other does not include any items applicable to AB.
The following table summarizes Operating earnings (loss) of Corporate and Other for the periods presented:
Three Months Ended June 30, Six Months Ended June 30,
2019 2018 2019 2018 (in millions)
Operating earnings (loss) $ (81) $ (81) $ (149) $ (158)
89

Table of Contents
General Account Investment Portfolio
The General Account investment portfolio supports the insurance and annuity liabilities of our Individual Retirement, Group Retirement and ProtectionSolutions businesses. Our General Account investment portfolio investment strategy seeks to achieve sustainable risk-adjusted returns by focusing on principalpreservation, investment return, duration and liquidity requirements by product class and the diversification of risks. Investment activities are undertaken accordingto investment policy statements that contain internally established guidelines and are required to comply with applicable laws and insurance regulations. Risktolerances are established for credit risk, market risk, liquidity risk and concentration risk across types of issuers and asset classes and that seek to mitigate theimpact of cash flow variability arising from these risks.
The General Account investment portfolio consists largely of investment grade fixed maturities, short-term investments, commercial and agricultural mortgageloans, alternative investments and other financial instruments. Fixed maturities include publicly issued corporate bonds, government bonds, privately placed notesand bonds, bonds issued by states and municipalities, mortgage-backed securities and asset-backed securities.
The General Account investment portfolio also includes credit derivatives to replicate exposure to individual securities or pools of securities as a means ofachieving credit exposure similar to bonds of the underlying issuer(s) more efficiently. In addition, from time to time we use derivatives for hedging purposes toreduce our exposure to equity markets, interest rates and credit spreads.
As part of our asset and liability management strategies, we maintain a weighted average duration for our General Account investment portfolio that is withinan acceptable range of the estimated duration of our liabilities given our risk appetite and hedging programs. Our asset and liability management strategies areapplied to portfolio duration groups within the General Account investment portfolio. For example, we maintain a “short duration” group comprised primarily ofinvestment grade fixed maturity securities that are aligned with the duration of product liabilities with an average duration of less than six years (e.g., our SCSproduct). As of June 30, 2019 and December 31, 2018 , 65% and 69% of the fixed maturities in the short duration group were rated NAIC 1, and 35% and 31%were rated NAIC 2, respectively. During the first quarter of 2019, new purchases from both new money flows and portfolio rebalancing activity were designated asavailable-for-sale (“AFS”) included in fixed maturities. The remaining trading securities in the Short Duration VA portfolio will be opportunistically rebalanced toAFS and shown with fixed maturities, which is consistent with other portfolios in our General Account. We expect this rebalancing to largely occur over the nextseveral quarters. New AFS assets included in fixed maturities was $8.4 billion as of June 30, 2019 .
Investment portfolios are primarily managed by legal entity with dedicated portfolios for certain blocks of business. For portfolios that back multiple productgroups, investment results are allocated to business segments.
Investment Results of the General Account Investment Portfolio
The following table summarizes the General Account investment portfolio results with Non-GAAP Operating Earnings adjustments by asset category for theperiods indicated. This presentation is consistent with how we measure investment performance for management purposes.
90

Table of Contents
Three Months Ended June 30,
2019 2018
Yield Amount (2) Yield Amount (2) (Dollars in millions)Fixed Maturities:
Income (loss) 4.00 % $ 516 3.90 % $ 435Ending assets 54,315 44,154
Mortgages: Income (loss) 4.26 % 130 4.28 % 122Ending assets 12,288 11,808
Real Estate Held for the Production of Income: Interest expense and other — % — (0.44)% (1)Ending assets 48 53
Other Equity Investments (1): Income (loss) 9.29 % 31 6.60 % 21Ending assets 1,334 1,311
Policy Loans: Income (loss) 5.44 % 51 5.65 % 54Ending assets 3,740 3,739
Cash and Short-Term Investments: Income (loss) 0.98 % 8 1.02 % 12Ending assets 3,296 5,763
Repurchase and Funding Agreements: Interest expense and other (24) (25)Ending assets (liabilities) (4,001) (4,843)
Total Invested Assets: Income (loss) 4.18 % 712 4.04 % 618Ending assets 71,020 61,985
Short Duration Fixed Maturities: Income (loss) 3.04 % 79 2.52 % 80Ending assets 8,797 13,247
Total: Investment income (loss) 4.03 % 791 3.78 % 698Less: investment fees (0.08)% (16) (0.08)% (14)
Investment income, net 3.95 % $ 775 3.70 % $ 684
Ending Net Assets $ 79,817 $ 75,232
91
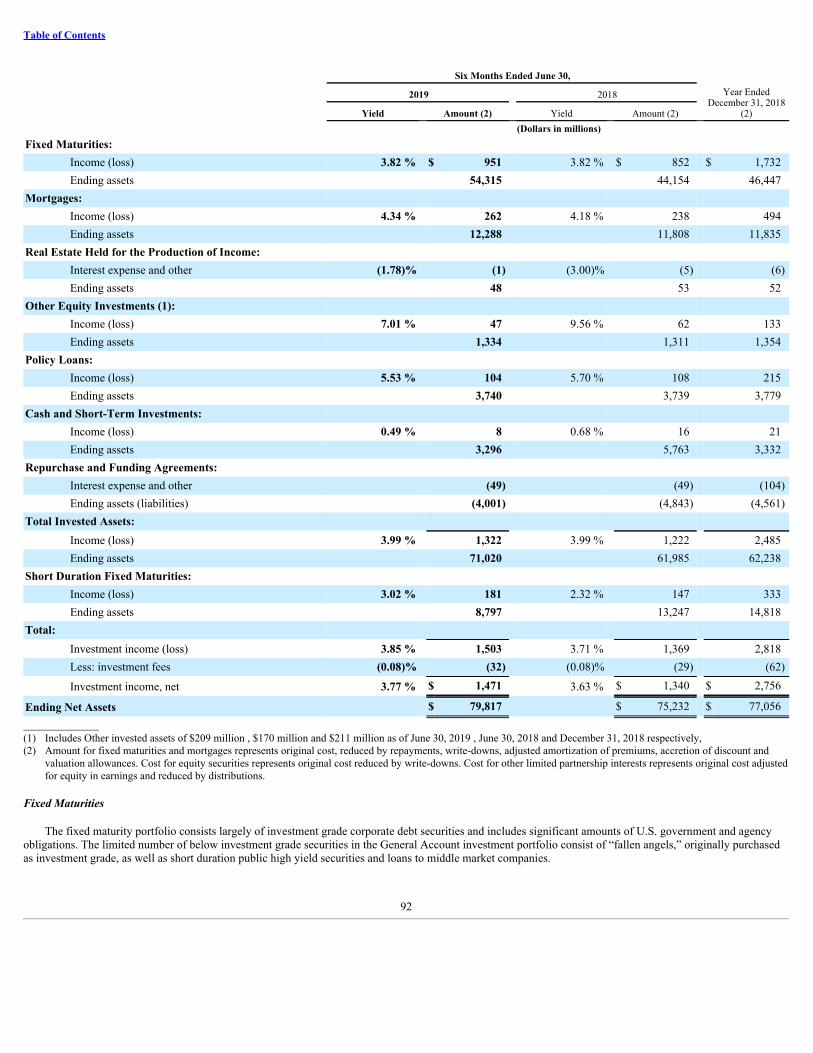
Table of Contents
Six Months Ended June 30, Year Ended
December 31, 2018(2)
2019 2018 Yield Amount (2) Yield Amount (2) (Dollars in millions)Fixed Maturities:
Income (loss) 3.82 % $ 951 3.82 % $ 852 $ 1,732Ending assets 54,315 44,154 46,447
Mortgages: Income (loss) 4.34 % 262 4.18 % 238 494Ending assets 12,288 11,808 11,835
Real Estate Held for the Production of Income: Interest expense and other (1.78)% (1) (3.00)% (5) (6)Ending assets 48 53 52
Other Equity Investments (1): Income (loss) 7.01 % 47 9.56 % 62 133Ending assets 1,334 1,311 1,354
Policy Loans: Income (loss) 5.53 % 104 5.70 % 108 215Ending assets 3,740 3,739 3,779
Cash and Short-Term Investments: Income (loss) 0.49 % 8 0.68 % 16 21Ending assets 3,296 5,763 3,332
Repurchase and Funding Agreements: Interest expense and other (49) (49) (104)Ending assets (liabilities) (4,001) (4,843) (4,561)
Total Invested Assets: Income (loss) 3.99 % 1,322 3.99 % 1,222 2,485Ending assets 71,020 61,985 62,238
Short Duration Fixed Maturities: Income (loss) 3.02 % 181 2.32 % 147 333Ending assets 8,797 13,247 14,818
Total: Investment income (loss) 3.85 % 1,503 3.71 % 1,369 2,818Less: investment fees (0.08)% (32) (0.08)% (29) (62)
Investment income, net 3.77 % $ 1,471 3.63 % $ 1,340 $ 2,756
Ending Net Assets $ 79,817 $ 75,232 $ 77,056______________(1) Includes Other invested assets of $209 million , $170 million and $211 million as of June 30, 2019 , June 30, 2018 and December 31, 2018 respectively,(2) Amount for fixed maturities and mortgages represents original cost, reduced by repayments, write-downs, adjusted amortization of premiums, accretion of discount and
valuation allowances. Cost for equity securities represents original cost reduced by write-downs. Cost for other limited partnership interests represents original cost adjustedfor equity in earnings and reduced by distributions.
Fixed Maturities
The fixed maturity portfolio consists largely of investment grade corporate debt securities and includes significant amounts of U.S. government and agencyobligations. The limited number of below investment grade securities in the General Account investment portfolio consist of “fallen angels,” originally purchasedas investment grade, as well as short duration public high yield securities and loans to middle market companies.
92

Table of Contents
Fixed Maturities by Industry
The following table sets forth these fixed maturities by industry category as of the dates indicated along with their associated gross unrealized gains and losses.
Fixed Maturities by Industry (1)
Amortized Cost Gross Unrealized
Gains Gross Unrealized
Losses Fair Value Percentage of Total
(%) (in millions)As of June 30, 2019: Corporate Securities:
Finance $ 10,231 $ 374 $ 9 $ 10,596 19%Manufacturing 11,149 518 18 11,649 20%Utilities 4,603 242 7 4,838 8%Services 5,694 276 12 5,958 10%Energy 3,130 150 10 3,270 6%Retail and wholesale 2,849 142 5 2,986 5%Transportation 1,651 93 3 1,741 3%Other 169 7 — 176 —%
Total corporate securities 39,476 1,802 64 41,214 71%U.S. government 12,633 1,108 39 13,702 24%Residential mortgage-backed (2) 208 13 — 221 1%Preferred stock 419 10 4 425 1%State & municipal 495 70 — 565 1%Foreign governments 467 36 5 498 1%Asset-backed securities 617 3 2 618 1%Total $ 54,315 $ 3,042 $ 114 $ 57,243 100%
As of December 31, 2018 Corporate Securities:
Finance $ 6,343 $ 77 $ 124 $ 6,296 14%Manufacturing 9,123 105 273 8,955 20%Utilities 4,413 80 121 4,372 9%Services 4,317 52 102 4,267 9%Energy 2,347 40 75 2,312 5%Retail and wholesale 2,163 19 49 2,133 5%Transportation 1,357 29 54 1,332 3%Other 171 4 2 173 —%Total corporate securities 30,234 406 800 29,840 65%
U.S. government and agency 13,989 295 470 13,814 30%Residential mortgage-backed (2) 225 9 — 234 1%Preferred stock 448 15 18 445 1%State & municipal 415 48 1 462 1%Foreign governments 524 19 13 530 1%Asset-backed securities 612 1 12 601 1%Total $ 46,447 $ 793 $ 1,314 $ 45,926 100%______________(1) Investment data has been classified based on standard industry categorizations for domestic public holdings and similar classifications by industry for all other holdings.(2) Includes publicly traded agency pass-through securities and collateralized obligations.
93

Table of Contents
Fixed Maturities Credit Quality
The Securities Valuation Office (“SVO”) of the National Association of Insurance Commissioners (“NAIC”) evaluates the investments of insurers forregulatory reporting purposes and assigns fixed maturities to one of six categories (“NAIC Designations”). NAIC Designations of “1” or “2” include fixedmaturities considered investment grade, which include securities rated Baa3 or higher by Moody’s or BBB- or higher by Standard & Poor’s. NAIC Designations of“3” through “6” are referred to as below investment grade, which include securities rated Ba1 or lower by Moody’s and BB+ or lower by Standard & Poor’s. As aresult of time lags between the funding of investments and the completion of the SVO filing process, the fixed maturity portfolio typically includes securities thathave not yet been rated by the SVO as of each balance sheet date. Pending receipt of SVO ratings, the categorization of these securities by NAIC designation isbased on the expected ratings indicated by internal analysis.
The following table sets forth the General Account’s fixed maturities portfolio by NAIC rating at the dates indicated.
Fixed Maturities
NAIC Designation Rating Agency Equivalent Amortized Cost
Gross UnrealizedGains
Gross UnrealizedLosses Fair Value
(in millions) As of June 30, 2019: 1 Aaa, Aa, A $ 36,232 $ 2,196 $ 56 $ 38,372 2 Baa 16,828 834 38 17,624 Investment grade 53,060 3,030 94 55,996 3 Ba 670 7 7 670 4 B 568 4 12 560 5 Caa 14 — 1 13 6 Ca, C 3 1 — 4 Below investment grade 1,255 12 20 1,247 Total Fixed Maturities $ 54,315 $ 3,042 $ 114 $ 57,243
As of December 31, 2018: 1 Aaa, Aa, A $ 30,805 $ 587 $ 835 $ 30,557 2 Baa 14,541 202 437 14,306 Investment grade 45,346 789 1,272 44,863 3 Ba 589 1 18 572 4 B 489 1 22 468 5 Caa 18 1 1 18 6 Ca, C 5 1 1 5 Below investment grade 1,101 4 42 1,063 Total Fixed Maturities $ 46,447 $ 793 $ 1,314 $ 45,926
Mortgage Loans
The mortgage portfolio primarily consists of commercial and agricultural mortgage loans. The investment strategy for the mortgage loan portfolio emphasizesdiversification by property type and geographic location with a primary focus on asset quality. The tables below show the breakdown of the amortized cost of theGeneral Account’s investments in mortgage loans by geographic region and property type as of the dates indicated.
94

Table of Contents
Mortgage Loans by Region and Property Type
June 30, 2019 December 31, 2018
Amortized
Cost % of Total Amortized
Cost % of Total (in millions)By Region: U.S. Regions:
Pacific $ 3,490 28.4% $ 3,288 27.7%Middle Atlantic 3,242 26.4 3,183 26.9South Atlantic 1,364 11.1 1,207 10.2East North Central 982 8.0 963 8.1Mountain 1,023 8.3 1,014 8.6West North Central 915 7.5 910 7.7West South Central 578 4.7 578 4.9New England 555 4.5 556 4.7East South Central 139 1.1 143 1.2
Total Mortgage Loans $ 12,288 100.0% $ 11,842 100.0%By Property Type: Office $ 4,052 33.0% $ 3,977 33.6%Multifamily 3,682 30.0 3,440 29.0Agricultural loans 2,746 22.3 2,695 22.8Retail 666 5.4 667 5.6Industrial 416 3.4 333 2.8Hospitality 382 3.1 384 3.3Other 344 2.8 346 2.9Total Mortgage Loans $ 12,288 100.0% $ 11,842 100.0%
The General Account investment portfolio reflects certain differences from the presentation of the U.S. GAAP Consolidated Financial Statements. Thispresentation is consistent with how we manage the General Account investment portfolio. For further investment information, please refer to Note 3 and Note 4 inthe Notes to the Consolidated Financial Statements.
Liquidity and Capital Resources
Liquidity refers to our ability to generate adequate amounts of cash from our operating, investment and financing activities to meet our cash requirements witha prudent margin of safety. Capital refers to our long-term financial resources available to support business operations and future growth. Our ability to generateand maintain sufficient liquidity and capital is dependent on the profitability of our businesses, timing of cash flows related to our investments and products, ourability to access the capital markets, general economic conditions and the alternative sources of liquidity and capital described herein. When considering ourliquidity and cash flows, it is important to distinguish between the needs of Holdings and the needs of our insurance and non-insurance subsidiaries. We alsodistinguish and separately manage the liquidity and capital resources of our retirement and protection businesses, including our Individual Retirement, GroupRetirement and Protection Solutions segments, and our Investment Management and Research segment.
Sources and Uses of Liquidity and Capital Position of Holdings
As a holding company with no business operations of its own, Holdings primarily derives cash flows from dividends from its subsidiaries and distributionsrelated to its economic interest in AB, nearly all of which is currently held outside our insurance company subsidiaries. These principal sources of liquidity areaugmented by cash and short-term investments held by Holdings and access to bank lines of credit and the capital markets. The main uses of liquidity for Holdingsare interest payments and debt repayment, payment of dividends and other distributions to stockholders, which may include stock repurchases, and capitalcontributions, if needed, to our insurance subsidiaries. Our principal sources of liquidity and our capital position are described in the following paragraphs.
95

Table of Contents
Cash Distributions from Our Subsidiaries
In 2019 , Holdings has received net cash distributions from AB of $221 million and $1.0 billion in dividends from AXA Equitable Life. Also, Holdingsreceived $576 million from AXA Equitable Life as repayment of principal of $572 million and interest of $4 million related to a $572 million surplus note. In2018, Holdings received net cash distributions from subsidiaries of $1.4 billion . These net cash distributions comprised of $1.1 billion in dividends from ourinsurance subsidiaries, $255 million in distributions from AB and $45 million in distributions from AXA Advisors.
Distributions from Insurance Subsidiaries
Our insurance companies are subject to limitations on the payment of dividends and other transfers of funds to Holdings and other affiliates under applicableinsurance law and regulation. Also, more generally, the ability of our insurance subsidiaries to pay dividends can be affected by market conditions and other factorsbeyond our control.
Under New York insurance law applicable to AXA Equitable Life, a domestic stock life insurer may not, without prior approval of the NYDFS, pay adividend to its stockholders exceeding an amount calculated under either the Earned Surplus Standard or the Alternative Standard. Dividends exceeding theseprescribed limits require the insurer to file a notice of its intent to declare the dividends with the NYDFS and prior approval or non-disapproval from the NYDFS.Also, in 2016, the NYDFS issued a circular letter to its regulated insurance companies stating that ordinary dividends which exceed an insurer’s positiveunassigned funds (as reported on the insurer’s most recent annual statement) may fail one of the qualitative tests imposed by the Earned Surplus Standard. Giventhe circular letter, it is possible that the NYDFS could limit the amount of ordinary dividends declared by AXA Equitable Life under the Earned Surplus Standardto the amount of AXA Equitable Life’s positive unassigned funds.
In December 2018, AXA Equitable Life transferred its interests in ABLP, AB Holding and the General Partner to a newly formed subsidiary and distributedthe shares of that subsidiary to its direct parent which subsequently distributed such shares to Holdings (the “AB Ownership Transfer”). In connection with the ABOwnership Transfer, AXA Equitable Life paid an extraordinary cash dividend of $572 million and issued a surplus note to Holdings in the same amount. AXAEquitable Life repaid the outstanding principal balance of the surplus note in March 2019.
Applying the formulas under the dividend standards above, AXA Equitable Life could pay ordinary dividends in 2019 of up to $2.1 billion under the EarnedSurplus Standard, assuming the amount was limited to the amount of AXA Equitable Life’s positive unassigned funds as described above. However, in connectionwith the AB Ownership Transfer, AXA Equitable Life agreed with the NYDFS that it would not seek a dividend of greater than $1.0 billion under the EarnedSurplus Standard during 2019. The repayment of the $572 million surplus note and interest of $4 million in March 2019 and the $1.0 billion dividend paid in July2019 resulted in a total cash payout from AXA Equitable Life of $1.6 billion in 2019.
Distributions from AllianceBernstein
ABLP is required to distribute all of its Available Cash Flow, as defined in the Partnership Agreement of ABLP, to the holders of AB Units and to the GeneralPartner. Available Cash Flow can be summarized as the cash flow received by ABLP from operations minus such amounts as the General Partner determines, in itssole discretion, should be retained by ABLP for use in its business, or plus such amounts as the General Partner determines, in its sole discretion, should bereleased from previously retained cash flow. Distributions by ABLP are made 1% to the General Partner and 99% among the limited partners.
Typically, Available Cash Flow has been the adjusted diluted net income per unit for the quarter multiplied by the number of general and limited partnershipinterests at the end of the quarter. In future periods, management of AB anticipates that Available Cash Flow will be based on adjusted diluted net income per unit,unless management of AB determines, with the concurrence of the Board of Directors of AB, that one or more adjustments that are made for adjusted net incomeshould not be made with respect to the Available Cash Flow calculation.
AB Holding is required to distribute all of its Available Cash Flow, as defined in the Amended and Restated Agreement of Limited Partnership of ABHolding, to holders of AB Holding Units pro rata in accordance with their percentage interest in AB Holding. Available Cash Flow is defined as the cashdistributions AB Holding receives from ABLP minus such amounts as the General Partner determines, in its sole discretion, should be retained by AB Holding foruse in its business (such as the payment of taxes) or plus such amounts as the General Partner determines, in its sole discretion, should be released from previouslyretained cash flow. AB Holding is dependent on the quarterly cash distributions it receives from ABLP, which is subject to the performance of capital markets andother factors beyond our control. Distributions from AB Holding are made pro rata based on the holder’s percentage ownership interest in AB Holding.
96
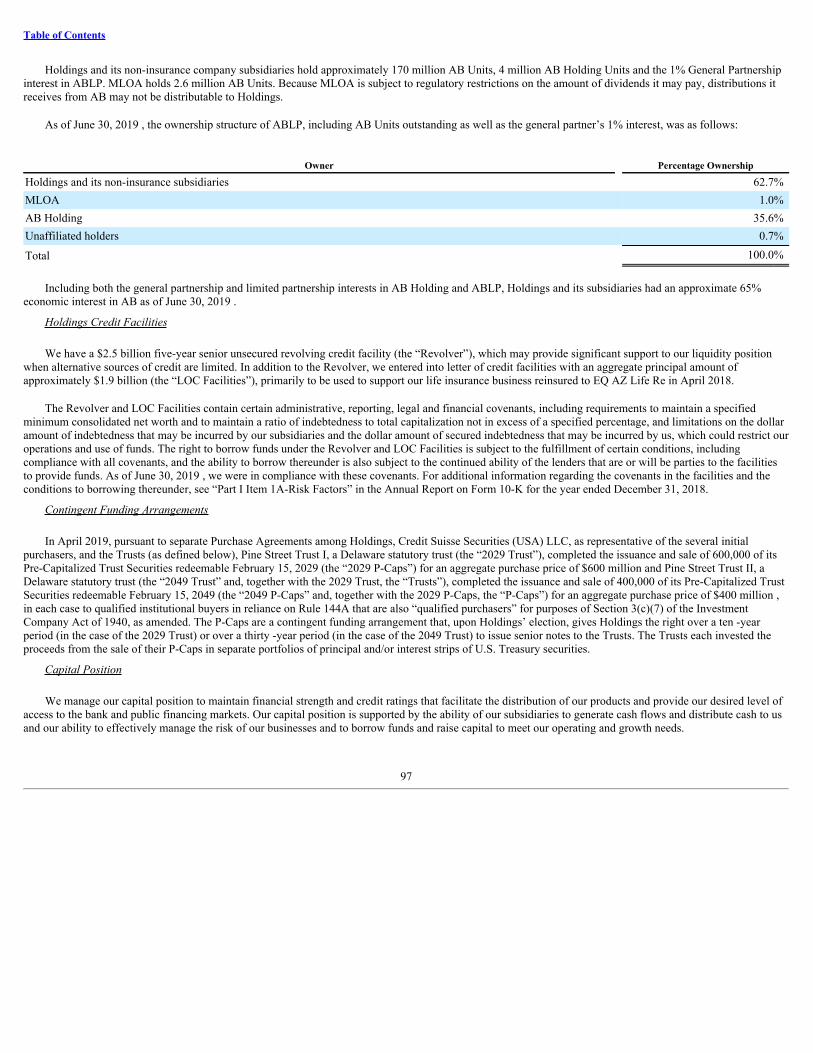
Table of Contents
Holdings and its non-insurance company subsidiaries hold approximately 170 million AB Units, 4 million AB Holding Units and the 1% General Partnershipinterest in ABLP. MLOA holds 2.6 million AB Units. Because MLOA is subject to regulatory restrictions on the amount of dividends it may pay, distributions itreceives from AB may not be distributable to Holdings.
As of June 30, 2019 , the ownership structure of ABLP, including AB Units outstanding as well as the general partner’s 1% interest, was as follows:
Owner Percentage Ownership
Holdings and its non-insurance subsidiaries 62.7%MLOA 1.0%AB Holding 35.6%Unaffiliated holders 0.7%
Total 100.0%
Including both the general partnership and limited partnership interests in AB Holding and ABLP, Holdings and its subsidiaries had an approximate 65%economic interest in AB as of June 30, 2019 .
Holdings Credit Facilities
We have a $2.5 billion five-year senior unsecured revolving credit facility (the “Revolver”), which may provide significant support to our liquidity positionwhen alternative sources of credit are limited. In addition to the Revolver, we entered into letter of credit facilities with an aggregate principal amount ofapproximately $1.9 billion (the “LOC Facilities”), primarily to be used to support our life insurance business reinsured to EQ AZ Life Re in April 2018.
The Revolver and LOC Facilities contain certain administrative, reporting, legal and financial covenants, including requirements to maintain a specifiedminimum consolidated net worth and to maintain a ratio of indebtedness to total capitalization not in excess of a specified percentage, and limitations on the dollaramount of indebtedness that may be incurred by our subsidiaries and the dollar amount of secured indebtedness that may be incurred by us, which could restrict ouroperations and use of funds. The right to borrow funds under the Revolver and LOC Facilities is subject to the fulfillment of certain conditions, includingcompliance with all covenants, and the ability to borrow thereunder is also subject to the continued ability of the lenders that are or will be parties to the facilitiesto provide funds. As of June 30, 2019 , we were in compliance with these covenants. For additional information regarding the covenants in the facilities and theconditions to borrowing thereunder, see “Part I Item 1A-Risk Factors” in the Annual Report on Form 10-K for the year ended December 31, 2018.
Contingent Funding Arrangements
In April 2019, pursuant to separate Purchase Agreements among Holdings, Credit Suisse Securities (USA) LLC, as representative of the several initialpurchasers, and the Trusts (as defined below), Pine Street Trust I, a Delaware statutory trust (the “2029 Trust”), completed the issuance and sale of 600,000 of itsPre-Capitalized Trust Securities redeemable February 15, 2029 (the “2029 P-Caps”) for an aggregate purchase price of $600 million and Pine Street Trust II, aDelaware statutory trust (the “2049 Trust” and, together with the 2029 Trust, the “Trusts”), completed the issuance and sale of 400,000 of its Pre-Capitalized TrustSecurities redeemable February 15, 2049 (the “2049 P-Caps” and, together with the 2029 P-Caps, the “P-Caps”) for an aggregate purchase price of $400 million ,in each case to qualified institutional buyers in reliance on Rule 144A that are also “qualified purchasers” for purposes of Section 3(c)(7) of the InvestmentCompany Act of 1940, as amended. The P-Caps are a contingent funding arrangement that, upon Holdings’ election, gives Holdings the right over a ten -yearperiod (in the case of the 2029 Trust) or over a thirty -year period (in the case of the 2049 Trust) to issue senior notes to the Trusts. The Trusts each invested theproceeds from the sale of their P-Caps in separate portfolios of principal and/or interest strips of U.S. Treasury securities.
Capital Position
We manage our capital position to maintain financial strength and credit ratings that facilitate the distribution of our products and provide our desired level ofaccess to the bank and public financing markets. Our capital position is supported by the ability of our subsidiaries to generate cash flows and distribute cash to usand our ability to effectively manage the risk of our businesses and to borrow funds and raise capital to meet our operating and growth needs.
97
Table of Contents
Capital Management
Our Board and senior management are directly involved in the development of our capital management policies. Accordingly, capital actions, includingproposed changes to the annual capital plan, capital targets and capital policies, are approved by the Board.
Dividend Declared and Paid
On February 14, 2019 and May 23, 2019 , Holdings’ Board of Directors declared a cash dividend on Holdings’ common stock of $0.13 and $0.15 per share,respectively, payable on March 15, 2019 and June 11, 2019 to shareholders of record as of March 5, 2019 and June 3, 2019 , respectively. On August 8, 2019 ,Holdings’ Board of Directors declared a cash dividend on Holdings’ common stock of $0.15 per share, payable on August 29, 2019 to shareholders of record as ofAugust 22, 2019 .
The declaration and payment of future dividends is subject to the discretion of our Board of Directors and depends on our financial condition, results ofoperations, cash requirements, future prospects, regulatory restrictions on the payment of dividends by Holdings’ insurance subsidiaries and other factors deemedrelevant by the Board.
Share Repurchase Program
On February 27, 2019, Holdings’ Board of Directors authorized a $800 million share repurchase program. Under this authorization, Holdings, may, from timeto time through December 31, 2019, purchase shares of its common stock through various means. Holdings may choose to suspend or discontinue the repurchaseprogram at any time. The repurchase program does not obligate Holdings to purchase any particular number of shares.
On March 25, 2019 , AXA completed a secondary offering of 46 million shares of common stock of Holdings and the sale to Holdings of 30 million shares ofcommon stock of Holdings. Following the completion of the share buyback by Holdings, Holdings had $200 million remaining under its share repurchase programauthorization.
Accelerated Share Repurchase Agreement
In January 2019, Holdings entered into an Accelerated Share Repurchase agreement (the “ASR”) with a third-party financial institution to repurchase anaggregate of $150 million of Holdings’ common stock. Holdings received seven million shares upon entering the ASR in January and one million shares uponsettlement of the ASR, which terminated on March 1, 2019.
Sources and Uses of Liquidity of Our Insurance Subsidiaries
The principal sources of liquidity for our insurance subsidiaries are premiums, investment and fee income, deposits associated with our insurance and annuityoperations, cash and invested assets, as well as internal borrowings. The principal uses of that liquidity include benefits, claims and dividends paid to policyholdersand payments to policyholders in connection with surrenders and withdrawals. Other uses of liquidity include commissions, general and administrative expenses,purchases of investments, the payment of dividends to Holdings and hedging activity. Certain of our insurance subsidiaries’ principal sources and uses of liquidityare described in the paragraphs that follow.
We manage the liquidity of our insurance subsidiaries with the objective of ensuring that they are able to meet payment obligations linked to our IndividualRetirement, Group Retirement and Protection Solutions businesses and to their outstanding debt and derivative positions, including in our hedging programs,without support from Holdings. We employ an asset/liability management approach specific to the requirements of each of our insurance businesses. We measureliquidity against internally-developed benchmarks that consider the characteristics of our asset portfolio and the liabilities that it supports. We consider attributes ofthe various categories of our liquid assets (for example, type of asset and credit quality) in calculating internal liquidity indicators for our insurance and reinsuranceoperations. Our liquidity benchmarks are established for various stress scenarios and durations, including company-specific and market-wide events. The scenarioswe use to evaluate the liquidity of our subsidiaries are defined to allow operating entities to operate without support from Holdings.
Liquid Assets
The investment portfolios of our insurance subsidiaries are a significant component of our overall liquidity. Liquid assets include cash and cash equivalents,short-term investments, U.S. Treasury fixed maturities, fixed maturities that are not designated as held-to-maturity and public equity securities. We believe that ourbusiness operations and the liquidity profile of our assets provide sufficient liquidity under reasonably foreseeable stress scenarios for each of our insurancesubsidiaries.
See “—General Account Investment Portfolio” and Note 3 and Note 4 for a description of our retirement and protection businesses’ portfolio of liquid assets.
98
Table of Contents
Hedging Activities
Because the future claims exposure on our insurance products, and in particular our variable annuity products with GMxB features, is sensitive to movementsin the equity markets and interest rates, we have in place various hedging and reinsurance programs that are designed to mitigate the economic risks of movementsin the equity markets and interest rates. We use derivatives as part of our overall asset/liability risk management program primarily to reduce exposures to equitymarket and interest rate risks. In addition, we use credit derivatives to replicate exposure to individual securities or pools of securities as a means of achievingcredit exposure similar to bonds of the underlying issuer(s) more efficiently. The derivative contracts are an integral part of our risk management program,especially for the management of our variable annuities program, and are collectively managed to reduce the economic impact of unfavorable movements in capitalmarkets. These derivative transactions require liquidity to meet payment obligations such as payments for periodic settlements, purchases, maturities andterminations as well as liquid assets pledged as collateral related to any decline in the net estimated fair value. Collateral calls represent one of our biggest driversfor liquidity needs for our insurance subsidiaries. Historically, we have managed our liquidity needs related to our derivative portfolio at Holdings and AXA REArizona on a combined basis. Due to the limited size of the AXA RE Arizona investment portfolio, we historically supported its collateral funding needs throughAXA Financial’s commercial paper program. Following the GMxB Unwind, which was effected on April 12, 2018, our derivatives contracts reside primarilywithin AXA Equitable Life. As AXA Equitable Life has a significantly larger investment portfolio than AXA RE Arizona had, we have reduced the need foroverall liquidity going forward.
FHLB Membership
AXA Equitable Life is a member of the Federal Home Loan Bank of New York (“FHLBNY”), which provides AXA Equitable Life with access tocollateralized borrowings and other FHLBNY products. At June 30, 2019 , Holdings had $1.7 billion of outstanding short-term funding agreements and$2.3 billion of long-term outstanding funding agreements issued to the FHLBNY and had posted $6.3 billion securities as collateral for funding agreements. Inaddition, AXA Equitable Life implemented a hedge to lock in the funding agreements borrowing rate, and $11 million of hedge impact was reported as fundingagreement carrying value. MLOA is a member of the Federal Home Loan Bank of San Francisco.
Sources and Uses of Liquidity of our Investment Management and Research Segment
The principal sources of liquidity for our Investment Management and Research business include investment management fees and borrowings under itsrevolving credit facility and commercial paper program. The principal uses of liquidity include general and administrative expenses, business financing anddistributions to holders of AB Units and AB Holding Units plus interest and debt service. The primary liquidity risk for our fee-based Investment Management andResearch business is its profitability, which is impacted by market conditions and our investment management performance.
As of June 30, 2019 and December 31, 2018 , AB had $443 million and $521 million , respectively, in commercial paper outstanding with weighted averageinterest rates of approximately 2.7% for both periods. The commercial paper is short term in nature, and as such, recorded value is estimated to approximate fairvalue (and considered a Level 2 security in the fair value hierarchy). Average daily borrowings of commercial paper during the first six months of 2019 and the fullyear 2018 were $517 million and $350 million , respectively, with weighted average interest rates of approximately 2.7% and 2.0% , respectively.
AB has a $800 million committed, unsecured senior revolving credit facility (the “AB Credit Facility”) that matures September 27, 2023. The credit facilityprovides for possible increases in the principal amount by up to an aggregate incremental amount of $200 million . Any such increase is subject to the consent ofthe affected lenders. The AB Credit Facility is available for AB and SCB LLC, for business purposes, including the support of AB’s commercial paper program.Both AB and SCB LLC can draw directly under the AB Credit Facility and AB management expects to draw on the AB Credit Facility from time to time. AB hasagreed to guarantee the obligations of SCB LLC under the AB Credit Facility.
The AB Credit Facility contains affirmative, negative and financial covenants, which are customary for facilities of this type, including, among other things,restrictions on dispositions of assets, restrictions on liens, a minimum interest coverage ratio and a maximum leverage ratio. As of June 30, 2019 , AB was incompliance with these covenants.
As of June 30, 2019 and December 31, 2018 , AB and SCB LLC had no amounts outstanding under the AB Credit Facility. During the first six months of2019 and the full year 2018 , AB and SCB LLC did not draw upon the AB Credit Facility.
AB has a $200 million committed, unsecured senior revolving credit facility (the “AB Revolver”) that matures on November 16, 2021. The AB Revolver isavailable for AB’s and SCB LLC’s business purposes, including the provision of additional liquidity to meet funding requirements primarily related to SCB LLC’soperations. Both AB and SCB LLC can draw directly under the AB Revolver and management expects to draw on the AB Revolver from time to time. AB hasagreed to
99

Table of Contents
guarantee the obligations of SCB LLC under the AB Revolver. The AB Revolver contains affirmative, negative and financial covenants that are identical to thoseof the AB Credit Facility. As of June 30, 2019 , AB had no amounts outstanding under the AB Revolver. As of December 31, 2018 , AB had $25 millionoutstanding under the AB Revolver with an interest rate of 3.4% . Average daily borrowing of the AB Revolver during the first six months of 2019 and full year2018 were $33 million and $19 million , respectively, with weighted average interest rates of approximately 3.4% and 2.8% , respectively.
In addition, SCB LLC also has three uncommitted lines of credit with three financial institutions. Two of these lines of credit permit SCB LLC to borrow up toan aggregate of $175 million , with AB named as an additional borrower, while the other line has no stated limit. As of June 30, 2019 and December 31, 2018 ,SCB LLC had no bank loans outstanding. Average daily borrowings of bank loans during first six months of 2019 and full year 2018 were $2 million and$3 million , respectively, with weighted average interest rates of approximately 1.7% and 1.6% , respectively.
Consolidated Cash Flow Analysis
We believe that cash flows from our operations on a consolidated basis are adequate to satisfy current liquidity requirements. The continued adequacy of ourliquidity will depend upon factors such as future market conditions, changes in interest rate levels, policyholder perceptions of our financial strength, policyholderbehavior, the effectiveness of our hedging programs, catastrophic events and the relative safety and attractiveness of competing products. Changes in any of thesefactors may result in reduced or increased cash outflows. Our insurance subsidiaries’ cash flows from investment activities result from repayments of principal,proceeds from maturities and sales of invested assets and investment income, net of amounts reinvested. The primary liquidity risks with respect to these cashflows are the risk of default by debtors or bond insurers, our counterparties’ willingness to extend repurchase agreements, commitments to invest and marketvolatility. We closely manage these risks through our asset/liability management process and regular monitoring of our liquidity position.
Six Months Ended June 30,
2019 2018 (in millions)Cash and Cash Equivalents, beginning of period $ 4,469 $ 4,814
Net cash provided by (used in) operating activities (425) (342)Net cash provided by (used in) investing activities (2,442) 1,231Net cash provided by (used in) financing activities 3,132 1,136Net increase (decrease) 265 2,025
Effect of exchange rate changes on cash and cash equivalents — (6)Cash and Cash Equivalents, end of period $ 4,734 $ 6,833
Six Months Ended June 30, 2019 Compared to Six Months Ended June 30, 2018
Cash and cash equivalents at June 30, 2019 were $4.7 billion , a decrease of $2.1 billion from $6.8 billion at June 30, 2018 .
Net cash used in operating activities was $ (425) million in the six months ended June 30, 2019 ; an increase of $(83) million from the $ (342) million net cashused in operating activities in the six months ended June 30, 2018 . Cash flows from operating activities include such sources as premiums, investmentmanagement and advisory fees and investment income offset by such uses as life insurance benefit payments, policyholder dividends, compensation payments,other cash expenditures and tax payments.
Net cash used in investing activities was $(2.4) billion in the six months ended June 30, 2019 ; $3.7 billion less than the $1.2 billion net cash provided byinvesting activities in the six months ended June 30, 2018 . The decrease was primarily related to a $1.2 billion decrease in repayment of loans to affiliates, $1.2billion lower net change in short-term investments, $591 million higher net purchases of investments, $553 million lower decrease for other investing activitiesprimarily related to changes in investments of consolidated VIEs and $ 142 million higher cash outflows from cash settlements related to derivatives.
Cash flows provided by financing activities were $3.1 billion in the six months ended June 30, 2019 ; $2.0 billion higher than the $1.1 billion net cashprovided by financing activities in the six months ended June 30, 2018 . The increase was primarily driven by the $ 3.0 billion decrease in repayments of loans toaffiliates, the $1.3 billion lower purchases of AB Units by Holdings , $1.2 billion lower cash repayments of short-term financings, $ 988 million higher cashinflows due to net pledges of collateral, $ 575 million higher cash inflows for purchases of noncontrolling interest of consolidated company-sponsored investmentfunds, $ 255 million higher net deposits to policyholders' account balances and $ 92 million lower cash outflows
100

Table of Contents
from the distribution to noncontrolling interest of consolidated subsidiaries. These were offset by $4.1 billion lower borrowings of public debt, $ 750 million cashpaid to repurchase common stock, $ 536 million net decrease in securities sold under repurchase agreements and $ 126 million higher dividends paid toshareholders.
Statutory Capital of Our Insurance Subsidiaries
Our capital management framework is primarily based on statutory RBC standards and the CTE asset standard for our variable annuity business.
RBC requirements are used as minimum capital requirements by the NAIC and the state insurance departments to evaluate the capital condition of regulatedinsurance companies. RBC is based on a formula calculated by applying factors to various asset, premium, claim, expense and statutory reserve items. The formulatakes into account the risk characteristics of the insurer, including asset risk, insurance risk, interest rate risk, market risk and business risk and is calculated on aquarterly basis and made public on an annual basis. The formula is used as an early warning regulatory tool to identify possible inadequately capitalized insurersfor purposes of initiating regulatory action, and not as a means to rank insurers generally. These rules apply to our insurance company subsidiaries and not toHoldings. State insurance laws provide insurance regulators the authority to require various actions by, or take various actions against, insurers whose totaladjusted capital does not meet or exceed certain RBC levels. At the date of the most recent annual statutory financial statements filed with insurance regulators, thetotal adjusted capital of each of these insurance company subsidiaries subject to these requirements was in excess of each of those RBC levels.
CTE is a statistical measure of tail risk which quantifies the total asset requirement to sustain a loss if an event outside a given probability level has occurred.In the case of our analysis of variable annuity guarantees, CTE98 denotes the financial resources a company would need to cover the average of the worst 2% ofscenarios.
We target to maintain an asset level for all variable annuity products at or above a CTE98 level. For our non-variable annuity insurance liabilities, we target tomaintain an RBC ratio of 350%–400% .
Captive Reinsurance Companies
We use captive reinsurance companies to more effectively manage our reserves and capital on an economic basis and to enable the aggregation and transfer ofrisks. Our captive reinsurance companies assume business from affiliates only and are closed to new business. All of our captive reinsurance companies are whollyowned subsidiaries and are located in the United States. In addition to state insurance regulation, our captives are subject to internal policies governing theiractivities. We continue to analyze the use of our existing captive reinsurance structures, as well as additional third-party reinsurance arrangements.
101
Table of Contents
Description of Certain Indebtedness
The following table sets forth our total consolidated borrowings as of the dates indicated. Our financial strategy going forward will remain subject to marketconditions and other factors. For example, we may from time to time enter into additional bank or other financing arrangements, including public or private debt,structured facilities and contingent capital arrangements, under which we could incur additional indebtedness.
June 30, 2019
Holdings AB Consolidated (in millions)Short-term debt:
AB commercial paper (with interest rate of 2.7%) $ — $ 443 $ 443Total short-term debt — 443 443
Long-term debt: Senior Notes (5.00%, due 2048) 1,480 — 1,480Senior Notes (4.35%, due 2028) 1,486 — 1,486Senior Notes (3.90%, due 2023) 794 — 794Delayed Draw Term Loan (3-month LIBOR + 1.125%, due 2021) 300 — 300Senior Debentures, 7.0%, due 2028 349 — 349
Total long-term debt 4,409 — 4,409
Total borrowings $ 4,409 $ 443 $ 4,852
December 31, 2018
Holdings AB Consolidated (in millions)Short-term debt:
AB commercial paper (with interest rate of 2.7%) $ — $ 521 $ 521AB revolving credit facility (with interest rate of 3.4%) — 25 25
Total short-term debt — 546 546Long-term debt:
Senior Notes (5.00%, due 2048) 1,480 — 1,480Senior Notes (4.35%, due 2028) 1,486 — 1,486Senior Notes (3.90%, due 2023) 794 — 794Delayed Draw Term Loan (3-month LIBOR + 1.125%, due 2021) 300 — 300Senior Debentures, 7.0%, due 2028 349 — 349
Total long-term debt 4,409 — 4,409
Total borrowings $ 4,409 $ 546 $ 4,955
Notes and Debentures
In April 2018, we issued $3.8 billion in aggregate principal amount of notes (consisting of $800 million aggregate principal amount of 3.9% Senior Notes due2023, $1.5 billion aggregate principal amount of 4.35% Senior Notes due 2028 and $1.5 billion aggregate principal amount of 5.0% Senior Notes due 2048) tothird party investors. As of June 30, 2019 , we had outstanding $349 million aggregate principal amount of 7.0% Senior Debentures due 2028 (the “SeniorDebentures”).
The Senior Notes and Senior Debentures contain customary affirmative and negative covenants, including a limitation on certain liens and a limit on theCompany’s ability to consolidate, merge or sell or otherwise dispose of all or substantially all of its assets. The Senior Notes and Senior Debentures also includecustomary events of default (with customary grace periods, as applicable), including provisions under which, upon the occurrence of an event of default, alloutstanding Senior Notes and Senior Debentures may be accelerated. As of June 30, 2019 , we were in compliance with all covenants.
102

Table of Contents
Term Loan
In May 2018, we borrowed $300 million under a $500 million three-year senior unsecured delayed draw term loan agreement (the “DDTL”) and terminatedthe remaining $200 million capacity. The DDTL contains certain administrative, reporting, legal and financial covenants, including requirements to maintain aspecified minimum consolidated net worth and to maintain a ratio of indebtedness to total capitalization not in excess of a specified percentage, and limitations onthe dollar amount of indebtedness that may be incurred by our subsidiaries and the dollar amount of secured indebtedness that may be incurred by us, which couldrestrict our operations and use of funds. As of June 20, 2019, we were in compliance with these covenants.
For additional information regarding the covenants in the DDTL, see “Part I Item 1A-Risk Factors” in the Annual Report on Form 10-K for the year endedDecember 31, 2018.
Ratings
Financial strength ratings (which are sometimes referred to as “claims-paying” ratings) and credit ratings are important factors affecting public confidence inan insurer and its competitive position in marketing products. Our credit ratings are also important for our ability to raise capital through the issuance of debt andfor the cost of such financing.
Financial strength ratings represent the opinions of rating agencies regarding the financial ability of an insurance company to meet its obligations under aninsurance policy. Credit ratings represent the opinions of rating agencies regarding an entity’s ability to repay its indebtedness. The following table summarizes theratings for Holdings and certain of its subsidiaries. S&P, Moody’s and AM Best all have a stable outlook.
AM Best S&P Moody’s
Last review date 12/17/2018 7/19/2019 5/9/2019Financial Strength Ratings: AXA Equitable Life A A+ A2MLOA A A+ A2
Credit Ratings: Holdings bbb+ BBB+ Baa2
Last Review Date 11/09/18 04/10/19AB — A/Stable/A-1 A2
SUPPLEMENTARY INFORMATION
We are involved in a number of ventures and transactions with AXA and certain of its affiliates. See Note 11 of the Notes to the Consolidated FinancialStatements included herein and Note 12 in the Notes to Consolidated Financial Statements included in the Annual Report on Form 10-K for the yearended December 31, 2018.
Contractual Obligations
Our consolidated contractual agreements include policyholder obligations, long-term debt, commercial paper, employee benefits, operating leases and variousfunding commitments. See “Supplementary Information – Contractual Obligations” in “Management’s Discussion and Analysis of Financial Condition and Resultsof Operations” in the Annual Report on Form 10-K for the year ended December 31, 2018 for additional information.
Off-Balance Sheet Arrangements
At June 30, 2019 , we were not a party to any off-balance sheet transactions other than those guarantees and commitments described in Note 14 of the Notes tothe Consolidated Financial Statements included herein.
103

Table of Contents
Summary of Critical Accounting Estimates
The preparation of financial statements in conformity with U.S. GAAP requires management to adopt accounting policies and make estimates andassumptions that affect amounts reported in our consolidated financial statements included elsewhere herein. For a discussion of our significant accountingpolicies, see Note 2 of the Notes to the Consolidated Financial Statements included in our 2018 Form 10-K. The most critical estimates include those used indetermining:
• liabilities for future policy benefits;
• accounting for reinsurance;
• capitalization and amortization of DAC and policyholder bonus interest credits;
• estimated fair values of investments in the absence of quoted market values and investment impairments;
• estimated fair values of freestanding derivatives and the recognition and estimated fair value of embedded derivatives requiring bifurcation;
• goodwill and related impairment;
• measurement of income taxes and the valuation of deferred tax assets; and
• liabilities for litigation and regulatory matters.
In applying our accounting policies, we make subjective and complex judgments that frequently require estimates about matters that are inherently uncertain.Many of these policies, estimates and related judgments are common in the insurance and financial services industries while others are specific to our business andoperations. Actual results could differ from these estimates.
A discussion of each of the critical accounting estimates may be found in the 2018 Form 10-K in “Management’s Discussion and Analysis of FinancialCondition and Results of Operations — Summary of Critical Accounting Estimates.”
Item 3. Quantitative and Qualitative Disclosures About Market Risk
There have been no material changes to the quantitative and qualitative disclosures about market risk described in the Annual Report on Form 10-K for theyear ended December 31, 2018 in “Quantitative and Qualitative Disclosures About Market Risk”.
104
Table of Contents
Item 4.
CONTROLS AND PROCEDURES
Evaluation of Disclosure Controls and Procedures
The management of the Company, with the participation of the Company’s Chief Executive Officer (CEO) and Chief Financial Officer (CFO), has evaluatedthe effectiveness of the Company’s disclosure controls and procedures (as defined in Rule 13a-15(e) under the Securities Exchange Act of 1934, as amended) as ofJune 30, 2019 . This evaluation is performed to determine if our disclosure controls and procedures are effective to provide reasonable assurance that informationrequired to be disclosed by the Company in the reports that it files or submits under the Securities and Exchange Act of 1934, as amended, is accumulated andcommunicated to management, including the Company’s CEO and CFO, as appropriate, to allow timely decisions regarding required disclosure and are effectiveto provide reasonable assurance that such information is recorded, processed, summarized and reported within the time periods specified by the Securities andExchange Commission’s rules and forms.
Due to the material weaknesses described below, the Company’s CEO and CFO, concluded that the Company’s disclosure controls and procedures were noteffective as of June 30, 2019 .
As previously reported, the Company identified two material weaknesses in the design and operation of the Company’s internal control over financialreporting. A material weakness is a deficiency, or a combination of deficiencies, in internal control over financial reporting, such that there is a reasonablepossibility that a material misstatement of a company’s annual or interim financial statements will not be prevented or detected on a timely basis. The Company’smanagement, including the Company’s CEO and CFO, have concluded that we do not:
(i) maintain effective controls to timely validate that actuarial models are properly configured to capture all relevant product features and provide reasonableassurance timely reviews of assumptions and data have occurred, and, as a result, errors were identified in future policyholders’ benefits and deferredpolicy acquisition costs balances; and
(ii) maintain sufficient experienced personnel to prepare the Company’s consolidated financial statements and to verify consolidating and adjusting journalentries are completely and accurately recorded to the appropriate accounts or segments and, as a result, errors were identified in the consolidated financialstatements, including in the presentation and disclosure between sections of the statements of cash flows.
These material weaknesses resulted in misstatements in the Company’s previously issued annual and interim financial statements and resulted in:
(i) the revision of the interim financial statements for the nine, six, and three months ended September 30, June 30, and March 31, 2018 and 2017,respectively, and the annual financial statements for the year ended December 31, 2017;
(ii) the amended restatement of the interim financial statements for the nine months ended September 30, 2017 and the six months ended June 30, 2017, andthe year ended December 31, 2016 and revisions for the six and three months ended June 30, 2018 and March 31, 2018, respectively, and the threemonths ended March 31, 2017 and the years ended December 31, 2017, 2015, 2014, and 2013, respectively
(iii) the revision of the annual financial statements for the year ended December 31, 2017 and amended the restated annual financial statements for the yearended December 31, 2016, and amended the restated interim financial statements for the nine and six months ended September 30, 2017, and June 30,2017, respectively;
(iv) the restatements of the interim financial statements for the nine and six months ended September 30, 2017 and June 30, 2017, respectively, therestatement of the annual financial statements for the year ended December 31, 2016, the revision of the interim financial statements for the nine and sixmonths ended September 30, 2016 and June 30, 2016, respectively, and the revision of the annual financial statements for the year ended December 31,2015; and
(v) the restatement of the interim financial statements for the six months ended June 30, 2017 and the revision of the annual financial statements for the yearsended December 31, 2016, 2015 and 2014, respectively, and the interim financial statements for the six months ended June 30, 2016.
These revisions and restatements were directly related to the material weaknesses described above and not indicative of any new material weaknesses. Untilremediated, there is a reasonable possibility that these material weaknesses could result in a
105

Table of Contents
material misstatement of the Company’s consolidated financial statements or disclosures that would not be prevented or detected.
Remediation Status of Material Weaknesses
Management continues to execute its plan moving towards remediation of the material weaknesses. Since identifying the material weaknesses, managementhas performed the following activities:
Material Weakness Related to Actuarial Models, Assumptions and Data
• We have designed and implemented an enhanced model validation control framework, including a rotational schedule to periodically re-validate all U.S.GAAP models.
• We have designed and implemented enhanced controls and governance processes for new model implementations.
• We have designed and implemented enhanced controls for model changes.
• We have designed and implemented enhanced controls over the annual assumption setting process, including a comprehensive master assumptioninventory and risk framework.
• We have completed a current state assessment of significant data flows feeding actuarial models and assumptions. We have initiated a validation reviewand a control design assessment of these data flows.
• We are in the process of designing and implementing new controls over the reliability of data feeding significant actuarial models.
Material Weakness Related to Insufficient Personnel and Journal Entry Process
• With respect to insufficient personnel, we have strengthened our finance team by adding approximately 25 employees to the Accounting and FinancialReporting areas. Of these additional resources, eleven have a CPA license, eight have worked at a “Big 4” public accounting firm and the remainder haveworked in a finance area within a public company. We have conducted both specific job-related training and general training on SOX controls and U.S.GAAP-related technical topics to new and existing staff.
• To improve controls over journal entries, a less controlled secondary process that was used for consolidating certain entities, reflecting adjustments toprior periods, and generating the business segment disclosures has been eliminated. Beginning with third quarter 2018, all journal entries are recorded inthe Company’s general ledger and the secondary process is no longer necessary.
• We have enhanced the controls over journal entries through the implementation of new standards designed to ensure effective review and approval ofjournal entries with sufficient supporting documentation.
• We have designed and implemented new management review controls within the period end financial reporting process that will operate at a level ofprecision sufficient to detect errors that could result in a material misstatement.
While progress has been made to remediate both material weaknesses, as of June 30, 2019 , we are still in the process of developing and implementing theenhanced processes and procedures and testing the operating effectiveness of these improved controls. We believe our actions will be effective in remediating thematerial weaknesses, and we continue to devote significant time and attention to these efforts. In addition, the material weaknesses will not be consideredremediated until the applicable remedial processes and procedures have been in place for a sufficient period of time and management has concluded, throughtesting, that these controls are effective. Accordingly, the material weaknesses are not remediated as of June 30, 2019 .
Changes in Internal Control Over Financial Reporting
As described above, the Company continues to design and implement additional controls in connection with its remediation plan. These remediation effortsrelated to the material weaknesses described above represent changes in our internal control over financial reporting for the quarter ended June 30, 2019 that havematerially affected, or are reasonably likely to materially affect, the Company’s internal control over financial reporting.
106

Table of Contents
PART II
OTHER INFORMATION
Item 1. Legal Proceedings
See Note 14 of Notes to Consolidated Financial Statements contained herein. Except as disclosed in Note 14 of Notes to Consolidated Financial Statements,there have been no new material legal proceedings and no new material developments in legal proceedings previously reported in the Annual Report on Form 10-Kfor the year ended December 31, 2018 .
Item 1A. Risk Factors
You should carefully consider the risks described in the “Risk Factors” section included in our Annual Report on Form 10-K for the year ended December 31,2018, as amended or supplemented in our subsequently filed Quarterly Report on Form 10-Q. These risks could materially affect our business, consolidated resultsof operations or financial condition. These risks are not exclusive, and additional risks to which we are subject include, but are not limited to, the factorsmentioned under “Forward-Looking Statements” above and the risks of our businesses described elsewhere in this Quarterly Report on Form 10-Q.
Item 2. Unregistered Sales of Equity Securities and Use of Proceeds
The following table provides information about purchases by Holdings during the three months ended June 30, 2019 , of its common stock:
PeriodTotal Number of Shares
Purchased Average Price Paid per Share
Total Number of SharesPurchased as Part of Publicly
Announced Plans or Programs
Approximate Dollar Value ofShares that May Yet Be
Purchased Under the Plans orPrograms
4/1/19 through 4/30/19 — $ — — $ 200,375,0005/1/19 through 5/31/19 — $ — — $ 200,375,0006/1/19 through 6/30/19 — $ — — $ 200,375,000
Total — $ — — $ 200,375,000
Item 3. Defaults Upon Senior Securities
None.
Item 4. Mine Safety Disclosures
None.
Item 5. Other Information
Iran Threat Reduction and Syria Human Rights Act
Holdings and its subsidiaries had no transactions or activities requiring disclosure under the Iran Threat Reduction and Syria Human Rights Act, nor were theyinvolved in the AXA Group matters described immediately below.
The non-U.S. based subsidiaries of AXA operate in compliance with applicable laws and regulations of the various jurisdictions in which they operate,including applicable international (United Nations and European Union) laws and regulations. While AXA Group companies based and operating outside theUnited States generally are not subject to U.S. law, as an international group, AXA has in place policies and standards (including the AXA Group InternationalSanctions Policy) that apply to all AXA Group companies worldwide and often impose requirements that go well beyond local law.
AXA has informed us that AXA Konzern AG, an AXA insurance subsidiary organized under the laws of Germany, provides accident and health insurance todiplomats based at the Iranian Embassy in Berlin, Germany. The total annual premium of these policies is approximately $109,150 and the annual net profit arisingfrom these policies, which is difficult to calculate with precision, is estimated to be $18,385.
In addition, AXA has informed us that AXA Insurance Ireland, an AXA insurance subsidiary, provides statutorily required
107

Table of Contents
car insurance under four separate policies to the Iranian Embassy in Dublin, Ireland. AXA has informed us that compliance with the Declined Cases Agreement ofthe Irish Government prohibits the cancellation of these policies unless another insurer is willing to assume the coverage. The total annual premium for thesepolicies is approximately $7,115 and the annual net profit arising from these policies, which is difficult to calculate with precision, is estimated to be $853.
Also, AXA has informed us that AXA Sigorta, a subsidiary of AXA organized under the laws of the Republic of Turkey, provides car insurance coverage forvehicle pools and compulsory earthquake coverage of the Iranian General Consulate and the Iranian Embassy in Istanbul, Turkey. Motor liability insurancecoverage is compulsory in Turkey and cannot be canceled unilaterally. The total annual premium in respect of these policies is approximately $3,150 and theannual net profit, which is difficult to calculate with precision, is estimated to be $473.
Additionally, AXA has informed us that AXA Winterthur, an AXA insurance subsidiary organized under the laws of Switzerland, provides NaftiranIntertrade, a wholly-owned subsidiary of the Iranian state-owned National Iranian Oil Company, with life, disability and accident coverage for its employees. Inaddition, AXA Winterthur also provides car and property insurance coverage for the Iranian Embassy in Bern. The provision of these forms of coverage ismandatory in Switzerland. The total annual premium of these policies is approximately $396,597 and the annual net profit arising from these policies, which isdifficult to calculate with precision, is estimated to be $59,489.
Also, AXA has informed us that AXA Egypt, an AXA insurance subsidiary organized under the laws of Egypt, provides the Iranian state-owned IranDevelopment Bank, two life insurance contracts, covering individuals who have loans with the bank. The total annual premium of these policies is approximately$20,650 and annual net profit arising from these policies, which is difficult to calculate with precision, is estimated to be $2,000.
Lastly, AXA has informed us that AXA XL, which AXA acquired during the third quarter of 2018, through various non-U.S. subsidiaries, provides insuranceto marine policyholders located outside of the U.S. or reinsurance coverage to non-U.S. insurers of marine risks as well as mutual associations of ship owners thatprovide their members with protection and liability coverage. The provision of these coverages may involve entities or activities related to Iran, includingtransporting crude oil, petrochemicals and refined petroleum products. AXA XL’s non-U.S. subsidiaries insure or reinsure multiple voyages and fleets containingmultiple ships, so they are unable to attribute gross revenues and net profits from such marine policies to activities with Iran. As the activities of these insureds andre-insureds are permitted under applicable laws and regulations, AXA XL intends for its non-U.S. subsidiaries to continue providing such coverage to its insuredsand re-insureds to the extent permitted by applicable law.
The aggregate annual premium for the above-referenced insurance policies is approximately $536,662, representing approximately 0.0007% of AXA’s 2018consolidated revenues, which exceed $100 billion. The related net profit, which is difficult to calculate with precision, is estimated to be $81,200, representingapproximately 0.002% of AXA’s 2018 aggregate net profit.
Amendment to the AXA Equitable Supplemental Severance Plan for Executives
The AXA Equitable Supplemental Severance Plan for Executives was amended effective August 9, 2019 to provide benefits to eligible executives in the caseof involuntary termination of employment without cause. Prior to the amendment, benefits under the plan were only available in the case of involuntarytermination of employment for certain specified reasons.
108

Table of Contents
Item 6. Exhibits
Number Description and Method of Filing
10.1 †# Waiver Agreement, dated May 9, 2019, to Mark Pearson’s Employment Agreement dated March 9, 2011.
10.2 †# AXA Equitable Supplemental Severance Plan for Executives, as amended and restated as of August 9, 2019.
31.1 # Certification of the Registrant’s Chief Executive Officer pursuant to Section 302 of the Sarbanes-Oxley Act of 2002
31.2 # Certification of the Registrant’s Chief Financial Officer pursuant to Section 302 of the Sarbanes-Oxley Act of 2002
32.1 # Certification of the Registrant’s Chief Executive Officer pursuant to Section 906 of the Sarbanes-Oxley Act of 2002
32.2 # Certification of the Registrant’s Chief Financial Officer pursuant to Section 906 of the Sarbanes-Oxley Act of 2002
101.INS XBRL Instance Document101.SCH XBRL Taxonomy Extension Schema Document101.CAL XBRL Taxonomy Extension Calculation Linkbase Document101.LAB XBRL Taxonomy Extension Label Linkbase Document101.PRE XBRL Taxonomy Extension Presentation Linkbase Document101.DEF XBRL Taxonomy Extension Definition Linkbase Document
______________# Filed herewith.† Identifies each management contract or compensatory plan or arrangement.
109

Table of Contents
SIGNATURES
Pursuant to the requirements of the Securities Exchange Act of 1934, AXA Equitable Holdings, Inc. has duly caused this report to be signed on its behalf bythe undersigned, thereunto duly authorized.
Date: August 9, 2019 AXA EQUITABLE HOLDINGS, INC.
By: /s/ Anders Malmström Name: Anders Malmström Title: Senior Executive Vice President and Chief Financial Officer
Date: August 9, 2019 /s/ William Eckert Name: William Eckert Title: Senior Vice President, Chief Accounting Officer and Controller
110

May 9, 2019
Mr. Mark PearsonAXA Equitable Holdings, Inc.1290 Avenue of the Americas, 16 th floorNew York, New York 10104
Dear Mr. Pearson:
This letter confirms our understanding regarding your waiver in connection with your employment agreement dated March 9, 2011 (the“Agreement”). Please confirm this understanding by signing below.
The Agreement provides that you will serve as the Chair of the Board of AXA Equitable Life Insurance Company (“AEL Chair”) during youremployment term. The Agreement further provides that you may terminate your employment for “Good Reason” and receive certain severancebenefits if you are removed as AEL Chair.
Mr. Ramon de Oliveira was appointed as AEL Chair on March 26, 2019. As discussed, you have agreed that you will waive your right under theAgreement to terminate your employment for Good Reason due to your removal as AEL Chair so long as Mr. de Oliveira serves as AEL Chair. Bysigning below, you confirm that you have irrevocably waived this right.
Sincerely,
/s/ Jeff Hurd Jeff HurdChief Operating Officer
ACCEPTED AND AGREED TO:
/s/ Mark Pearson Mark Pearson

AXA Equitable Supplemental Severance Plan for ExecutivesAs Amended and Restated as of August 9, 2019
Section I. Purpose
The purpose of the AXA Equitable Supplemental Severance Plan for Executives (the “Supplemental Plan”) is to provide supplemental severancebenefits for individuals who have been elected by the Board of Directors of AXA Equitable Life Insurance Company (“AXA Equitable”) as ManagingDirectors or higher (“Executives”) in the event of certain types of terminations of employment These severance benefits are intended solely tosupplement, and shall not be duplicative of, any severance benefits for which an Executive may be eligible under the AXA Equitable SeveranceBenefit Plan (“Basic Severance Plan”).
Section II. Coordination with Basic Severance Plan
All provisions of the Basic Severance Plan including, without limitation, all terms and conditions for the payment of Severance Benefits, shall apply tothis Supplemental Plan and are incorporated by reference into this Supplemental Plan. To the extent there is a conflict between this SupplementalPlan and the Basic Severance Plan, this Supplemental Plan will govern.
Section III. Definitions
The following definitions shall apply for purposes of this Supplemental Plan and any capitalized terms that are not otherwise defined herein are asdefined in the Basic Severance Plan.
EQHEQH shall mean AXA Equitable Holdings, Inc.
Bonus AmountThe Bonus Amount for an Eligible Executive shall mean the greatest of:
• the most recent annual short-term incentive compensation award paid to the Eligible Executive prior to the Notice Date;• the average of the three most recent short-term incentive compensation awards paid to the Eligible Executive prior to the Notice Date;
and• the annual target short-term incentive compensation award for the Eligible Executive for the year in which the Notice Date occurs;
CauseCause shall mean the Eligible Executive’s:
• violation of law during the course of his or her employment;• material breach of any Company policy related to workplace conduct;• conduct resulting in damage to Company assets;• conduct that is materially injurious to the Company, monetarily or otherwise;• disclosure of confidential and/or proprietary information in violation of Company policies or standards; or• breach of his or her duty of loyalty to the Company.
Change in ControlChange in Control shall have the meaning set forth in the AXA Equitable Holdings, Inc. 2018 Omnibus Incentive Plan, as amended from time totime.
CIC ExecutiveCIC Executive shall mean an Eligible Executive who is a MC Member, the AXA Equitable Chief Human Resources Officer, the AXA Equitable ChiefInformation Officer or the AXA Equitable Chief Transformation Officer.
CompanyCompany shall mean EQH and its Subsidiaries.
1

Eligible ExecutiveEligible Executive shall mean: (a) an Executive who is Job Eliminated, (b) an Executive whose employment is Terminated without Cause or (c) aCIC Executive whose employment is Terminated for Good Reason within 12 months after a Change in Control.
Good ReasonGood Reason shall mean:
• a material dimunition of a CIC Executive’s duties, authority or responsibilities;• a material reduction in a CIC Executive’s base compensation (other than in connection with, and substantially proportionate to, reductions
by the Company of the compensation of other similarly situated senior executives); and• a material change in the geographic location of a CIC Executive’s position
MC MemberMC Member shall mean an Eligible Executive who is a member of the EQH Management Committee.
Notice DateNotice Date shall mean the date an Eligible Executive receives Notice of Job Elimination or that a CIC Executive provides notice of Termination forGood Reason.
SubsidiarySubsidiary shall mean any entity that is directly or indirectly controlled by EQH or any entity in which EQH directly or indirectly has at least a 50%equity interest
Termination DateTermination Date shall mean, In the case of a Job Elimination, the Eligible Executive’s Job Elimination Date and in the case of a TerminationWithout Cause or a Termination for Good Reason, the Eligible Executive’s last day of employment.
Termination without CauseTermination without Cause means termination of an Eligible Executive’s employment by the Company without Cause other than a Job Elimination.
Termination for Good ReasonTermination for Good Reason shall mean a voluntary termination of employment by a CIC Executive after having delivered to the Company notice oftermination due to the existence of a Good Reason condition within 90 days of its initial existence which is not remedied by the Company within 30days of the notice.
Section IV. Benefits
Subject to the terms and conditions set forth in the Basic Severance Plan, an Eligible Executive shall be eligible for the following benefits to theextent not provided to the Eligible Executive under the Basic Severance Plan:
(a) Severance Pay equal to fifty-two weeks of Salary, payable in accordance with Section 5.2 of the Basic Severance Plan; provided that , inthe case of a MC Member, the number “fifty-two” in this sentence shall be replaced by “seventy-eight”;
(b) An additional amount of Severance Pay, payable in accordance with Section 5.2 of the Basic Severance Plan, equal to the EligibleExecutive’s Bonus Amount; provided that, in the case of a MC Member, the additional amount of Severance Pay shall be equal to 150% ofthe Eligible Executive’s Bonus Amount;
(c) a lump sum payment equal to the sum of: (i) the Eligible Executive’s annual target short-term incentive compensation for the year in whichthe Notice Date occurs, pro-rated based on the number of the Eligible Executive’s full calendar months of service in that year, and (ii)$40,000, less applicable withholdings and deductions, made on the first business day on or after the 90 th day following the EligibleExecutive’s Termination Date; and
2

(d) in the event that the Notice Date occurs during the period beginning on January 1 of a calendar year and ending on the date on which short-term incentive compensation awards are paid under the AXA Equitable Holdings, Inc. Short-Term Incentive Compensation Plan for the priorcalendar year, the Eligible Executive shall receive a lump sum payment equal to his or her annual target short-term incentive compensationfor the prior year.
No amounts paid under this Supplemental Plan will be deemed to be compensation for purposes of any Company benefit plan or program.
Section V. Change in Control
In the event that a CIC Executive’s Termination Date occurs within twelve months after a Change in Control:• the number of weeks of Salary payable as Severance Pay to the CIC Executive under Section IV(a) above shall be one hundred and four;
and• the amount payable as Severance Pay under Section IV(b) above shall be equal to 200% of the CIC Executive’s Bonus Amount.
Section VI. Restrictive Covenants
In addition to any eligibility requirements under the Basic Severance Plan, to be eligible to receive benefits under this Supplemental Plan, an EligibleExecutive must agree that he or she will not, for 12 months following the Termination Date, directly or indirectly:
• provide services in any capacity for any entity that conducts business competitive to that of EQH or one of its Subsidiaries;• individually or on behalf of any other person or business entity of any type, hire or attempt to hire any employee, agent or agency, broker,
broker-dealer, financial planner, registered principal or representative who is, or during the 6 months preceding the Eligible Executive’sTermination Date was, employed or associated with EQH or one of its Subsidiaries; or
• either for his or her own benefit or for the benefit of another, attempt to solicit any person or entity that is, or during the 6 months precedingthe Eligible Executive’s Termination Date was, a customer of EQH or one of its Subsidiaries.
Section VII. Section 409A
(a) If any payment, compensation or other benefit provided to an Eligible Executive in connection with his or her termination of employment isdetermined, in whole or in part, to constitute “nonqualified deferred compensation” within the meaning of Section 409A of the Code (“Section409A”) and the Eligible Executive is a specified employee as defined in Section 409A(a)(2)(B)(i), then such “nonqualified deferredcompensation” will not be paid before (i) the first regularly scheduled payroll date following the sixth (6th) month of such Eligible Executive’sTermination Date or (ii) the first regularly scheduled payroll date following such Eligible Executive’s death, if earlier (the “New PaymentDate”). The aggregate of any payments that otherwise would have been paid to the Eligible Executive during the period between the EligibleExecutive’s Termination Date and the New Payment Date will be paid to such Eligible Executive in a lump sum on such New Payment Date.Thereafter, any payments that remain outstanding as of the day immediately following the New Payment Date will be paid without delayover the time period originally scheduled, in accordance with the terms of this Supplemental Plan.
(b) If under this Supplemental Plan, an amount is paid in two or more installments, each installment shall be treated as a separate payment forpurposes of Section 409A.
(c) A termination of employment shall not be deemed to have occurred for purposes of any provision of this Supplemental Plan providing for thepayment of any amounts or benefits subject to Section 409A upon or following a termination of employment unless such termination is alsoa “separation from service” as defined in Treas. Reg. Section 1.409A-1(h), provided that a separation from service will be deemed to haveoccurred where AXA Equitable and an Eligible Executive reasonably anticipate that the level of bona fide services such Eligible Executivewould perform after that date for AXA Equitable and all persons with whom AXA Equitable would be considered a single employer underSections 414(b) and 414(c) of the Code would
3

permanently decrease to less than 50% of the average level of bona fide services provided by such Eligible Executive in the immediatelypreceding 12 months. In addition, an 80% test will be used to in applying Sections 1563(a)(1), (2) and (3) of the Code for purposes ofdetermining a controlled group of corporations under Section 414(b) of the Code and in applying Treas. Reg. Section 1.414(c)-2 forpurposes of determining trades or businesses that are under common control for purposes of Section 414(c) of the Code.
Section VIII. Effective Date
The original effective date of this Supplemental Plan is November 20, 2008. This Supplemental Plan was amended and restated effective as ofMarch 4, 2011, January 1, 2014 and May 9, 2018, and is hereby subsequently amended and restated effective as of August 9, 2019.
4

Exhibit 31.1
CERTIFICATION PURSUANT TO 18 U.S.C. SECTION 1350, AS ADOPTED PURSUANT TO SECTION 302 OF THE SARBANES-OXLEY ACT OF 2002
I, Mark Pearson, President and Chief Executive Officer of AXA Equitable Holdings, Inc., certify that:
1) I have reviewed this quarterly report on Form 10-Q of AXA Equitable Holdings, Inc. (the “Registrant”);
2) Based on my knowledge, this report does not contain any untrue statement of a material fact or omit to state a material fact necessary to make the statementsmade, in light of the circumstances under which such statements were made, not misleading with respect to the period covered by this report;
3) Based on my knowledge, the financial statements, and other financial information included in this report, fairly present in all material respects the financialcondition, results of operations and cash flows of the Registrant as of, and for, the periods presented in this report;
4) The Registrant’s other certifying officer and I are responsible for establishing and maintaining disclosure controls and procedures (as defined in Exchange ActRules 13a-15(e) and 15d-15(e)) for the Registrant and have:
a) Designed such disclosure controls and procedures, or caused such disclosure controls and procedures to be designed under our supervision, to ensurethat material information relating to the Registrant, including its consolidated subsidiaries, is made known to us by others within those entities, particularly duringthe period in which this report is being prepared;
b) Evaluated the effectiveness of the Registrant’s disclosure controls and procedures and presented in this report our conclusions about the effectivenessof the disclosure controls and procedures, as of the end of the period covered by this report based on such evaluation; and
c) Disclosed in this report any change in the Registrant’s internal control over financial reporting that occurred during the Registrant’s most recent fiscalquarter (the Registrant’s fourth fiscal quarter in the case of an annual report) that has materially affected, or is reasonably likely to materially affect, theRegistrant’s internal control over financial reporting; and
5) The Registrant’s other certifying officer and I have disclosed, based on our most recent evaluation of internal control over financial reporting, to the Registrant’sauditors and the audit committee of the Registrant’s board of directors (or persons performing the equivalent functions):
a) All significant deficiencies and material weaknesses in the design or operation of internal control over financial reporting which are reasonably likely toadversely affect the Registrant’s ability to record, process, summarize and report financial information; and
b) Any fraud, whether or not material, that involves management or other employees who have a significant role in the Registrant’s internal control overfinancial reporting.
Date: August 9, 2019
/s/ Mark PearsonMark PearsonPresident and Chief Executive Officer

Exhibit 31.2
CERTIFICATION PURSUANT TO 18 U.S.C. SECTION 1350, AS ADOPTED PURSUANT TO SECTION 302 OF THE SARBANES-OXLEY ACT OF 2002
I, Anders Malmström, Senior Executive Vice President and Chief Financial Officer of AXA Equitable Holdings, Inc., certify that:
1) I have reviewed this quarterly report on Form 10-Q of AXA Equitable Holdings, Inc. (the “Registrant”);
2) Based on my knowledge, this report does not contain any untrue statement of a material fact or omit to state a material fact necessary to make the statementsmade, in light of the circumstances under which such statements were made, not misleading with respect to the period covered by this report;
3) Based on my knowledge, the financial statements, and other financial information included in this report, fairly present in all material respects the financialcondition, results of operations and cash flows of the Registrant as of, and for, the periods presented in this report;
4) The Registrant’s other certifying officer and I are responsible for establishing and maintaining disclosure controls and procedures (as defined in Exchange ActRules 13a-15(e) and 15d-15(e)) for the Registrant and have:
a) Designed such disclosure controls and procedures, or caused such disclosure controls and procedures to be designed under our supervision, to ensurethat material information relating to the Registrant, including its consolidated subsidiaries, is made known to us by others within those entities, particularly duringthe period in which this report is being prepared;
b) Evaluated the effectiveness of the Registrant’s disclosure controls and procedures and presented in this report our conclusions about the effectivenessof the disclosure controls and procedures, as of the end of the period covered by this report based on such evaluation; and
c) Disclosed in this report any change in the Registrant’s internal control over financial reporting that occurred during the Registrant’s most recent fiscalquarter (the Registrant’s fourth fiscal quarter in the case of an annual report) that has materially affected, or is reasonably likely to materially affect, theRegistrant’s internal control over financial reporting; and
5) The Registrant’s other certifying officer and I have disclosed, based on our most recent evaluation of internal control over financial reporting, to the Registrant’sauditors and the audit committee of the Registrant’s board of directors (or persons performing the equivalent functions):
a) All significant deficiencies and material weaknesses in the design or operation of internal control over financial reporting which are reasonably likely toadversely affect the Registrant’s ability to record, process, summarize and report financial information; and
b) Any fraud, whether or not material, that involves management or other employees who have a significant role in the Registrant’s internal control overfinancial reporting.
Date: August 9, 2019
/s/ Anders MalmströmAnders MalmströmSenior Executive Vice President and Chief Financial Officer

Exhibit 32.1
CERTIFICATION PURSUANT TO 18 U.S.C. SECTION 1350, AS ADOPTED PURSUANT TO SECTION 906 OF THE SARBANES-OXLEY ACT OF 2002
In connection with the Quarterly Report on Form 10-Q of AXA Equitable Holdings, Inc. (the “Company”) for the quarter ended June 30, 2019 , as filed with theSecurities and Exchange Commission on the date hereof (the “Report”), I, Mark Pearson, President and Chief Executive Officer of the Company, certify, pursuantto 18 U.S.C. Section 1350, as adopted pursuant to Section 906 of the Sarbanes-Oxley Act of 2002, that:
(1) the Report fully complies with the requirements of Section 13(a) or 15(d) of the Securities Exchange Act of 1934, as amended; and
(2) the information contained in the Report fairly presents, in all material respects, the financial condition and results of operations of the Company.
Date: August 9, 2019
/s/ Mark PearsonMark PearsonPresident and Chief Executive Officer

Exhibit 32.2
CERTIFICATION PURSUANT TO 18 U.S.C. SECTION 1350, AS ADOPTED PURSUANT TO SECTION 906 OF THE SARBANES-OXLEY ACT OF 2002
In connection with the Quarterly Report on Form 10-Q of AXA Equitable Holdings, Inc. (the “Company”) for the quarter ended June 30, 2019 , as filed with theSecurities and Exchange Commission on the date hereof (the “Report”), I, Anders Malmström, Senior Executive Vice President and Chief Financial Officer of theCompany, certify, pursuant to 18 U.S.C. Section 1350, as adopted pursuant to Section 906 of the Sarbanes-Oxley Act of 2002, that:
(1) the Report fully complies with the requirements of Section 13(a) or 15(d) of the Securities Exchange Act of 1934, as amended; and
(2) the information contained in the Report fairly presents, in all material respects, the financial condition and results of operations of the Company.
Date: August 9, 2019
/s/ Anders MalmströmAnders MalmströmSenior Executive Vice President andChief Financial Officer
Related Documents


