A National Study of The Urban High School Principalship by Santee C. Ruffin, Jr. Dissertation submitted to the Faculty of the Virginia Polytechnic Institute and State University in partial fulfillment of the requirements for the degree of Doctor of Education in Educational Administration APPROVED: Wayne M. Worner, Chairman Kéaneth E. Underwood 7 Houston Conley t; ß?/,awrence J. Weber Glen E. Robinson August 1989 Blacksburg, Virginia

Welcome message from author
This document is posted to help you gain knowledge. Please leave a comment to let me know what you think about it! Share it to your friends and learn new things together.
Transcript
A National Study of
The Urban High School Principalship
by
Santee C. Ruffin, Jr.
Dissertation submitted to the Faculty of the
Virginia Polytechnic Institute and State University
in partial fulfillment of the requirements for the degree of
Doctor of Education
in
Educational Administration
APPROVED:
Wayne M. Worner, Chairman
Kéaneth E. Underwood 7 Houston Conley t;
ß?/,awrence J. Weber Glen E. Robinson
August 1989
Blacksburg, Virginia
A National Study of
The Urban High School Principalship
by
Santee C. Ruffin, Jr.
Wayne M. Worner, Chairman
Educational-Administration
(ABSTRACT)
This study was conducted to obtain the views and rec-
ommendations of urban high school principals regarding the
principals themselves, their schools, students and communi-
ties, and the professional growth needs of the principals.
The study will also serve as a resource for the National As-
sociation of Secondary School Principals' Urban Schools Com-
mittee as it develops programs and activities to assist urban
high school principals.
Eight hundred fifteen of 1,259 urban high school prin-
cipals responded to a survey. Descriptive research method-
ology was used in the study of the principals from the one
hundred largest cities, according to population, in the na-
tion.
The majority of the principals were white males who av-
eraged 50 years in age. There are more black and female high
school principals in the urban districts (26% and 22.1% re-
spectively) than there are in rural and suburban districts
(3.8% and 12% respectively). These principals view student
absenteeism as the greatest hindrance to academic achieve-
ment. They believe they have moderate authority over what
takes place in their buildings and tend to be satisfied with
their positions. The urban principals believe their stu-
dents' academic competencies are average to below average.
They also believe 80% or more of the students are having
their needs met by teachers who they consider to be above
average.
The majority (74.5%) are members of NASSP. The results
of the study indicate NASSP should initiate professional
growth programs that bring recognition to urban high school
principals and meet their unique needs.
ACK§gwLED§§MENT$
I wish to express my deepest appreciation and gratitude
to a number of people whose support, understanding, patience,
expertise and encouragement helped to make this dissertation
possible.
To Wayne Worner, chairman of my doctoral committee, my
eternal appreciation of your patience, deep sincerity, know-
ledge and motivational strategies. To Ken Underwood, for
your continuous encouragement. To Houston Conley, for your
warm and caring advice. A sincere thank you to Larry Weber
and Glenn Robinson, the remaining members of my committee,
for your constant support, information and time.
Acknowledgements iv

DEDICAIIOQ
To
JANET, SHAWN and NICOLE
Dedication V

TABLE OE CONTENTSI
chapter 1 ...................... 1
Introduction ..................... 1
Statement of the Problem .............. 3
Statement of Purpose ................ 4
Significance of the Study ............. 5
Definitions .................... 6
Limitations of the Study .............. 7
Organization of the Study ........l..... 7
chapter 2 ...................... 9
Review of Literature ................. 9
Urban Communities and Their Schools ........ 9
Urban High School Reform Efforts .......... 16
The Urban High School Principalship ........ 28
Summary 37
Chapter 3 ...................... 39
Methodology ..................... 39
Research Methodology ................ 39
Population ..................... 41
Instrumentation .................. 41
Collection of Data ................. 45
Method of Analysis ................. 46
éTable of Contents . vi

Summary ...................... 47
chapter 4 ...................... 48
Results ....................... 48
Demographic Profile of Urban High School Principals 48
Demographic Data Describing Urban Schools and Students 65
Problems and Challenge Facing Urban High School Prin-
cipals ...................... 78
Respondents' Recommendations for Affecting Positive
Change in Their Schools .............. 82
Respondents' Views of Their Status, Authority, Job
Satisfaction, and The Status of Their Schools, School
Districts, and Communities ............ 85
The Educational Status of Urban Schools in General . 96
. Respondents' Professional Development Needs . . . 100
Summary ..................... 103
Chapter 5 ..................... 107
Summary, Conclusions and Recommendations ...... 107
Introduction ................... 107
Collection of Data ................ 109
Eindings ..................... 111
Demographic Profile of Principals ....... 111
Demographic Data Describing Urban Schools and Stu-
dents ..................... 112
Problems and Challenges of the Principals . . . 114
Table of Contents vii
Recommendations for Affecting Positive Change . 114
Principals' Status and Degrees of Satisfaction in
Their Schools, School Districts and Communities 115
Educational Status of Urban Schools and Students 116
Urban Principals Professional Development Needs 117
Conclusions ................... 118
Recommendations ................. 122
References ..................... 126
Appendix A. cities That contain the Population Surveyed
(Largest 100 cities in the United States) ..... 131
Appendix B. Letter and Preliminary Questionnaire . . 134
Appendix C. Letter and Questionnaire Regarding Instru-
ment Validation .................. 140
Appendix D. Letter and Final Version of Questionnaire 144
Appendix E. Follow-up Letter to Non—Respondents . . 150
Vita ........................ 152
Table of Contents viii

LIST OF TABLES
Table 1. Distribution of Respondents by Age ..... 49
Table 2. Gender of Respondents ........... 51
Table 3. Ethnic Distribution of Respondents ..... 52
Table 4. Highest College Degrees Held by Respondents 53
Table 5. Respondents Experience as Secondary SchoolPrincipals ................. 54
Table 6. Respondents' Experience as Assistant Principalsat the Secondary School Level ....... 56
Table 7. Principals' Teaching Experience at the Second-ary School Level Prior to Becoming a SecondarySchool Principal .............. 57
Table 8. Salary Distribution for School Year 1988-89 58
Table 9. Length of Principals' Contracts for the SchoolYear 1988-89 ................ 59
Table 10. Time Principals Spend at School on a TypicalSchool Day (Excluding Evenings and Weekends) 61
Table 11. Extra Hours Spent Per Week Beyond the TypicalWeek (Based on Typical Days) ........ 62
Table 12. Degree of Satisfaction in Current Positions asPrincipals ................. 63
Table 13. Respondents' Membership in the National Asso-ciation of Secondary School Principals . . . 64
Table 14. Number of Urban High School Principals thatResponded According to the Regions Defined bythe National Association of Secondary SchoolPrincipals ................. 66
Table 15. States and the Number of Schools Responding tothe Survey ................. 67
Table 16. Approximate Populations of Cities in Which theHigh Schools of the Respondents are Located 68
Table 17. Types of Schools Participating in the Study 69
List of Tables ix
Table 18. Grades Included in the Schools that Partic-ipated in the Survey ............ 71
Table 19. Student Enrollments in Respondents' Schools 72
Table 20. Racial-Ethnic Mix of the Student Populationsin the Respondents' Schools ........ 73
Table 21. Average Daily Rate of Attendance ...... 75
Table 22. Percentage of Students Who Participate inSchools' Free or Reduced Rate Lunch Programs 76
Table 23. Number of Teachers (in Full-Time Equivalents)Employed in Respondents' Schools ...... 77
Table 24. Racial-Ethnic Mix of Teaching Staffs in Re-spondents’ Schools ............. 79
Table 25. Number of Assistant Principals Assigned to Re-spondents’ Schools ............. 80
Table 26. Factors Considered to be Hindering AcademicAchievement in Respondents' Schools .... 81
Table 27. Principal's Rating of Factors that Would Havethe Most Significant Impact on Raising AcademicAchievement ................ 83
Table 28. Principal's Recommendations for Expenditure ofAdditional Operating Funds ($100 per studentfor three years) .............. 84
Table 29. Goals Considered by Principals to be Most Im-portant for Their Schools and Their Students 86
Table 30. Principals' Perceptions of Their Roles inAchieving Their School's Goals ....... 87
Table 31. Principals' Status and Satisfaction With TheirPositions ................. 89
Table 32. Urban Principals' Assessments of Their ProgressToward Meeting the Goals for Their Schools and
Their Students ............... 90
Table 33. Principals Opportunities to Interview Prospec-tive Teachers Before They are Assigned to the
Principals' Schools ............ 91
List of Tables x

Table 34. Principals Description of the Authority TheyHave in Selecting Teachers for Their Schools 93
Table 35. Principals' Belief That the Authority They Havefor Operating the School Matches Their Respon-sibility .................. 94
Table 36. Respondents' Descriptions of Their Level ofAuthority to Make Decisions Concerning TheirOwn Schools ................ 95
Table 37. Principals' Perceptions of the Amount of In-fluence They Have on Their School Districts'Decisions that Affect Secondary Schools . . 97
Table 38. Respondents' Descriptions of the Levels ofCompetency of Most of Their Students in Regardto Basic Skills .............. 98
Table 39. The Degree to Which Principals Believe TheirStudents Are Having Their Needs Met as theSchools Currently Operate ......... 99
Table 40. Respondents' Rating of Their Teaching Staffs 101
Table 41. Principals' Descriptions of Their Communities'Attitudes Toward Public Schools and the Valueof Education ............... 102
Table 42. Areas in Which Urban Principals Would MostLike to Increase Their Personal Skills and/orKnowledge ................ 104
Table 43. Respondents' Ranking of Proposed NASSP Con-ducted Programs for Urban High School Princi-pals ................... 105
List of Tables . xi
CHAPIER l
INTkODUCT;ON
A principal of a middle class suburban high school, upon
meeting a principal of a high school located in the heart of
the nation’s third largest city, asks, "Considering all of
the problems the city schools have, how do you urban high
school principals survive?"
The urban principal very quickly proceeds to tell about
all the positive activities that go on in his school, but
admits he has problems and he needs help. The suburban
principal asks why those who work outside of the cities seem
to know so little about the challenges and needs of urban
high school principals. The big city principal's response
is, "No one asks."
What are urban principals like? What do they like about
their positions? What are their challenges and needs? Urban
principals, like their suburban and rural counterparts, are
being told what is wrong with their schools and what must be
done to improve them. As a result of studies such as A_Nap;ph
at Risk (National Commission cu1 Excellence i11 Education,
1983); Elgh School (Boyer, 1983); Horace's Compromise (Sizer,
1984); A Place Called Schogl (Goodlad, 1984); and An Imper-
iled Gehergtigp (Carnegie Foundation for the Advancement of
Chapter 1 1
Teaching, 1988) high school principals are confronted with
lists of recommendations and mandates coming from research-
ers, educators, and politicians. However, there is little
evidence that there are lists of needs and recommendations
coming from the principals. This is especially true i11 the
case of urban high school principals.
A lack of information may be part of the reason. Some
Americans may still be operating from a "blackboard jungle"
myth of urban education, completely unaware that the video
terminal has replaced many of the blackboards, and that the
only jungle is in the vocational horticulture program (Coun-
cil of Great City Schools, 1987). A lack of information
about the views of urban principals is the basis for this
study.
In May of 1988, the National Association of Secondary
School Principals' Board of Directors authorized an Urban
Schools Committee. The charge to this committee was to ad-
vise the Board of Directors regarding the professional needs
of urban administrators, and to suggest specific professional
growth activities. While it was understood that letters,
telephone calls, and informal surveys would be part of a
continuous data gathering system, the NASSP Executive Direc-
tor and Board of Directors concurred with the NASSP Director
of Urban Services' belief that a descriptive study of the
urban high school principalship was in order.
Chapter 1 2
This study identifies the problems, priorities, needs,
and role perceptions of urban high school principals. The
study also serves as a reference for the leadership and staff
of the National Association of Secondary School Principals
as they plan and implement programs for urban high school
principals.
In addition, the study represents a collaborative effort
by Virginia Polytechnic Institute and State University and
the National Association of Secondary School Principals to
produce a relevant and useful dissertation within the param-
eters of acceptable scholarship.
Statement of the Problem
. Recent studies indicate many urban high schools, have
problems that must be brought under control or eliminated if
these schools are to become effective learning institutions.
Studies such as A Nation at Risk (1983), High School (1983),
and An imneriied Generation (1988) suggest schools--including
urban schools--need strong leadership in order to succeed.
The literature indicates very little effort has been made to
solicit the opinions, suggestions, frustrations, limita-
tions, and goals and objectives of the principals. This is
particularly true as far as urban high school principals are
concerned.
Chapter 1 3
The National Association of Secondary School Principals,
a major provider of professional growth opportunities for
high school principals, seeks to become better informed about
the professional needs of urban high school principals by
asking the principals themselves. At the present time, lit-
tle research is available which reflects the views of prac-
ticing urban high school principals regarding their
professional development needs.
Statement of Puggggg
The study will provide the National Association of Sec-
ondary School Principals with a body of knowledge that will
enable its newly formed Urban Schools Committee to plan pro-
grams and services that are related to the data acquired by
this study. Although NASSP recently completed a study of the
high school principalship, High School Leaders and, Their
Schools (1988), there was only a superficial investigation
of the urban high school principalship. Of the 4,719 admin-
istrators surveyed in the study, 655 identified themselves
as working in an urban school setting. The unique charac-
teristics that might have existed within the group of urban
administrators were lost when their responses were aggre-
gated.
This study was designed to obtain responses from urban
principals regarding the following:
Chapter 1 4
1. The demographic profile of the urban high school princi-
pal;
2. the demographic profile of urban schools and the students
they serve;
3. the problems and challenges facing urban high schools;
4. recommendations for affecting positive change in urban
high schools;
5. respondents' views of their status, authority job satis-
faction and the status of their schools, school dis-
tricts, and communities; and
6. the professional development needs of urban high school
principals.
Significance of the Study
This study represents the first major effort, by a na-
tional educational organization, to obtain the views of urban
high school administrators during the current decade. The
literature review reveals no evidence that a national survey
of the professional needs and school improvement suggestions
of urban high school principals has been conducted during the
past lO years.
The National Association of Secondary School Principals,
while interested in the needs of urban high school princi-
pals, has never conducted a national survey of these admin-
istrators. It was anticipated the study would produce the
WChapter 1 _ 5
data which are needed to design and implement programs and
services specifically for urban high school principals. The
study should also serve as a resource for persons seeking the
views of practicing administrators' regarding the urban high
school principalship.
Definitions
Urban Community. A land mass, usually but not exclu-
sively called a city, that contains a high density population
which tends to be multicultured and multi—racial; containing
a wide range of social economic levels among the populous;
and differs from that which is customarily referred to as
being suburban and rural.
lnne; City. A portion of a city or urban community that
is usually identified, with a high concentration of minority
groups (as opposed to the peripheries); high levels of pov-
erty; low educational levels among adults; high crime rates
and little upward mobility among the residents.
U;ban äigh Sghool. A secondary school that has a grad-
uating twelfth grade class and exists in that which has been
defined as an urban community.
Urban Eigh School Principal. The chief executive in
charge of a high school that exists in an urban community as
previously defined.
Chapter 1 6
NASSL. The National Association of Secondary School
Principals, a professional growth organization composed of
approximately 40,000 members who are mainly, but not exclu-
sively, high school and middle school principals and assist-
ant principals.
Limitations of the Study
1. The study is limited because there is no similar study
to which the new findings can be compared.
2. The applicability of the findings may be limited because
a clear and nationally accepted definition of an urban
high school does not exist at this time.
organization of the Study
This study of the opinions of urban high school princi-
pals and their schools is divided into five chapters.
Chapter one contains an introduction, statement of
problem, statement of purpose, significance of the study,
definitions, and limitations of the study.
Chapter two contains a review of the literature relevant
to urban communities and the schools, urban school reform
efforts, and the high school principalship.
Chapter three provides a description of the research
methodology used in the study. This describes development
Chapter 1 7

of the instrument, selection of population, data collection
procedures, and methods of analysis.
Chapter four describes the findings of the survey and
provides an analysis of the data.
Chapter five contains the summary, conclusions, and the
recommendations of the study.
Chapter 1 8

cHAPTEg 2
REVIEW OF LITERATUR;
The purpose of this chapter is to present a review of
the literature related to urban communities and their
schools; urban school reform; and the urban. high school
principalship.
Urban Communities and [hei; Schools
From its very beginning, urban education has been viewed
as that which is essentially for the poor. Carl Kaestle
(1983), in describing the evolution of urban schools, indi-
cates that as early as 1791, New York City had a concern about
the poor children whose parents could not send them to the
"independent pay" schools. This desire to educate the masses
was not born of men's love of his fellow man, however. As
industrialization increased in the cities, churches and the
elite populous saw education as means of social stability and
proper behavior.
Kaestle reported:
Even before the 1830s, despite the fact that a majorityof the working class was still native—born, the rheto-ric and mission of the school movement in the coastalcities were heavily influenced by the fear of immigrantvice, infidelity, and crime (1983, p. 36).
Chapter 2 9
During the industrialization period of America's growth,
there was a tremendous influx of non-Protestant immigrants
from Ireland, Germany, Italy, and several Slavic nations.
These immigrants and their children created fear among con-
servative citizens in cities such as New York and Boston
(Tyack, 1974, pp. 32-33). The conservatives worried about
ethnic and religious riots, social outbursts, and maintenance
of traditional control. Thus, as the concern for educating
the new immigrant children grew, the desire for organized
police forces in the cities also grew, The creation of ef-
ficient and uniformed police paralleled the movement to
standardize schooling. Both were, in part, responses to the
immigrant poor (Tyack, 1976, p. 33).
Urbanization of the nation occurred at its fastest rate
(during the period from 1820 to 1860. During this period, the
number of people living in urban settlements grew from
693,255 to 6,216,518. Elementary schools, for certain
portions of these years, had student-teacher ratios of one
teacher for every 100 students (Tyack, 1974, pp. 30-31).
During the 1800s, high schools were viewed as being for
middle class children. The United States Bureau of the Cen-
sus in 1870 indicated only two percent of the population
graduated from high school (16,000). By 1890, 3.5 percent
graduated (43,731); and in 1900, 6.4 percent (94,883) fin-
ished high school. These small percentages of graduates re-
4Chapter 2 . 10
presented mainly the middle class students (Tyack, 1974, p.
57).
Large portions of the working class student population
did not continue their education into the high school ranks.
For example, in 1880, in St. Louis, only 31.7 percent of the
children of working class parents, ages 13 to 16, were in
school. However, 64.1 percent of the children of white col-
lar families and 80 percent of the professional family stu-
dents were enrolled in high schools (Tyack, 19794, p. 58).
Both Carl Kaestle and David Tyack have suggested early
urban education was consumed with the need for morality and
order among the new ethnic groups who had settled in America.
Race issues as we now know them (white versus black and
brown) were not high priority items. However, the matter of
educating free blacks in the North existed even in the
eighteenth century.
Religious groups assumed a major portion of the burden
of educating the poor and black children. The Quakers played
a major role in educating black children in cities such as
Boston, Philadelphia, and New York. The success of African
free schools of the late 1700s and the early 1800s demon-
strated to some whites the fallacy of the widespread belief
in Negro inferiority. Black students, when given the oppor-
tunity, proved their competency in the classroom (Kaestle,
1983, pp. 37-38).
Chapter 2 ll
As early as 1897, W. E. B. DuBois, a black scholar, re-
ported 85 percent of the "Negro" children aged 6 to 13 in
Philadelphia's seventh ward, attended school for at least
part of the year. The illiteracy rate for the black youth
aged 10 to 20 years was only four percent (Tyack, 1974, p.
123). In spite of the biases exhibited toward immigrant
children and the segregation of black students before and
after the Civil War, some education was occurring.
Thomas Hunt (1976) identified a number of similarities
among immigrant and black Americans:
1. There was a large immigration to the cities bywhites and a huge out—migration from the South byblacks.
2. The immigrants and the blacks were considered un- _desirable by other whites in the cities.
3. Housing conditions were poor and crowded.
4. Serious communication problems existed because ofthe immigrants' inability to use the English lan-guage adequately.
5. Immigrants and blacks had lower IQ scores thanother city dwellers.
6. Immigrants and blacks were unable to do well onstandardized tests.
7. A social gap between teachers and immigrant andblack students.
8. Immoral behavior was alleged to occur among immi-grants and blacks.
9. Trade unions, fearing low pay scales due to a largelabor market, excluded these workers.
10. School bureaucracies impeded the educational expe-riences of immigrant and black children.
Chapter 2 12

11. The Americanization of immigrant and black childrenfrequently occurred at the expense of their cul-tures and personal dignity (Hunt, 1976, pp.424-428).
The major differences prevailing between the groups as cited
by Hunt were:
1. Blacks are held back because of objections to theirrace. Many whites view blacks as less than capableof serving adequately on their own.
2. Blacks cannot assimilate into the white communitybecause of skin color.
3. Blacks still carry the legacy of slavery.
Hunt's contention is supported by David Tyack:
Despite frequent good intentions and abundant rhetoricabout equal educational opportunity, schools haverarely taught the children of the poor effectively—-andthis failure has been systematic, not idiosyncratic(1976, p. ll).
These three authors (Hunt, Keastle, and Tyack) agree
that urban education in the past represented a means of pro-
viding basic educational skills to poor immigrant children
and eventually to free African American children. The goals
of those providing the education seemed directed more toward
producing orderly and responsible citizens who were capable
of serving as good employees in the urban factories than to-
ward promoting scholarship.
Although the 1954 Supreme Court decision, Brown gg
Topeka Board of Education, struck down segregation in public
schools (Alexander, Corns, & McCann, 1976, pp. 641-647), ur-
ban schools and their communities still tend to be consumed
Chapter 2 13

by matters of class and race. This is especially true in
northern cities. Heightened residential segregation in
Boston, Washington, New York, and Chicago, which was
exacerbated by the flight of affluent white people to private
parochial, and suburban public schools, has deepened the
isolation of the poorest children (Kozol, 1989, p. 7). In
addition, these cities' school districts have student en-
rollments whose majorities are those persons who are labeled
"minorities" (mainly black and hispanic) (National School
Boards Association, 1988, p. 12).
An early commentary on the conditions and needs of the
nation's inner-cities was made by James B. Conant (Slums ang
Suburbs, 1961). The former president of Harvard University
compared the life-styles and schools of those who lived in
the suburbs with those who lived in city slums. In his de-
scription of urban slums, he cited, poverty, lack of jobs for
blacks, defacto segregation in school districts and individ-
ual schools (especially the high schools), inadequate state
funding of urban schools, and the small numbers of poor and
minority students moving on to higher education.
Thus, it was 28 years ago that Conant cited the impor-
tance of considering the aptitude and background of büack
urban students when assessing scholastic achievement:
A very important fact not to be overlooked is that thecomparison of average scores leaves out of account theoverlap of scores that, as far as I know, is foundwhenever such comparisons are made. There are alwayssome Negroes who score better than most whites and some
Chapter 2 14
whites who score lower than most Negroes. Importanttoo, is the fact that such a test correlates highlywith reading ability. Children who for one reason oranother have learned to read will do better on thiskind of test (S.A.T.) than children who have notlearned. In the suburban school practically all thechildren read well; in the slum few do (1961, p. 13).
Recently, Johathan Kozol, in his article, "A Report Card
on Schools After 20 Years," reported that in many instances,
conditions have worsened (1989). Kozol stated:
Reduced federal expenditures for public education, di-minished funding for compensatory programs (e.g., HeadStart and Chapter I), and the diminished local tax baseof the poorest districts, have led to a deteriorationboth of faculty morale and essential infrastructive--buildings and classroom materials-—in most inner-cityschools (1988, p. 7).
During the 1970s, in the book Urban Education in the
1910s, Kozol warned:
An ominous cloud hangs over the major cities of Amer-ica: It is the danger that our ghetto schools, havinglong ceased to educate children entrusted to theircare, will shortly cease to function altogether (1971,p. 3).
As one examines urban schools and their communities, it
is important to remember James Conant's contention that all
ethnic groups have varying degrees of academic ability. The
major factors contributing to low achievement in schools are
being disadvantaged economically, educationally, and so-
cially. Robert Havighurst has argued there is no single
ethnic group of any size that can be said to be disadvantaged
educationally and economically as a total group.
Poor people are found in practically all ethnic groups,but the highest proportions of the poor are found among
4Chapter 2 . 15

CauCaSiahS, Negroes, Puerto Ricans, Mexican—Americans,and American Indians (Havighurst, 1971, p. 46).
The poor education provided in many of the nation's ur-
ban schools has also been well documented. As early as 1971,
Kenneth B. Clark suggested we have "talked the issue to
death." Clark also indicated:
No school boards, no educational officials from therank of superintendent of schools to classroom teachercan now deny that there is inefficient education forlower-status, low income, and minority group youngstersin urban public schools (1971, p. 95).
More than a decade ago, in the book Urban Education in
the 1970s (1971), Harry Passow, a professor of.education and
chairman of the Committee on Urban Education at the Teachers
College Columbia University; Kenneth Clark, a professor of
psychology at the City University of New York; Henry Levin,
a professor of education at Stanford University; and others
called for urban school reform. This was well before the
highly publicized reform efforts that were initiated in 1983.
urban High School Reform Efforts
Nation af Risk: The Imnerafiye for Educational Reform
initiated national concern and became the most influential
document of the recent national reform effort (Apple, 1988,
p. 272). This national report presented findings that con-
tinue to promote school reform at the state and local dis-
trict levels.
Chapter 2 16
Most of the reform efforts suggested by the Ration at
Risk report were related to a desire to keep the United
States internationally competitive and a recognition of the
need to develop a more literate and technically skilled pop-
ulous in order to maintain world leadership. Very early in
the report there is mention of the United States lagging be-
hind Japan in making automobiles more efficiently, Korea in
having the world's most efficient steel mill, and Germany
producing better tools. The document stated:
Knowledge, learning, information, and skilled intelli-gence are the raw materials of international commerceand are today spreading throughout the world as Vigor-ously as miracle drugs, synthetic fertilizers, and bluejeans did earlier. If only to keep and improve on theslim competitive edge we still retain in world markets,we must dedicate ourselves to the reform of our educa-tional system for the benefit of all--old and youngalike, affluent and poor, majority and minority.Learning is the indispensable investment required for
_ success in the "information age" we are entering (Ra-tion at Risk, 1983, pp. 6-7).
The report expressed a national desire to promote edu-
cational excellence at the "individual learner level" in ways
that test and push back personal limits, in school and in the
workplace. The need for this promotion of excellence was
documented. Deficiencies in secondary school curricula,
course selection, homework students are required to complete;
adult literacy; declining expenditures for education; length
of school years; teacher preparation; and time management
were cited (pp. 18-23), and recommendations for improvement
were provided (pp. 23-26). Yet, the long existing defi-
Chapter 2 17
ciencies in urban schools, which according to the United
States Department of Education enroll 30% of the nation's
11,849,669 students (Johnson, 1989, p. 6) were addressed by
only one reference to the poor and to minorities.
Demographic data suggest poverty, class, and race are
analogous to most urban school districts. As white students
move out of the cities, the majority populations of the na-
tion's large school systems are composed of minorities—-i.e.,
African-Americans, Hispanics, Asians, and American Indians.
Cities such as Los Angeles, New York, Chicago, Philadelphia,
Detroit, and Washington, D.C. have majority-minority student
populations. In fact, by 1980, of all the blacks (88%) and
hispanics (71%) living in metropolitan areas, 81% and 50%,
respectively, lived in the inner cities (Usdan, 1984, pp.
399-414).
Recently, demographic researchers such as Linda
Darling-Hammond (1985) and Harold Hodgkinson (1985) have
provided statistics regarding the current status and future
conditions in large cities. Their findings support the need
for· urban, education reform. In, a 1985 report entitled,
Eguality and Excellence: The Educational Status of Black
Americans, Darling-Hammond indicated:
• In 1982, 49 percent of the black children in thenation lived with one parent and 8 percent livedwith neither parent.
• In 1982 nearly half (47.6 percent) of all blackchildren 18 years of age and under lived in house-
Chapter 2 18

holds below the poverty line. This compares toonly 17 percent of white children.
• Black students, on average, receive educationalprograms and offerings that. differ in kind andcontent from those of white students. These dif-ferences in the substance of education have graveimplications for educational achievement and ca-reer options.
• Black students are disproportionately more likelyto be enrolled in special education programs andless likely to be enrolled in programs for thegifted and talented than are white students.
• At the high school level, blacks are underrepre-sented in academic programs and overrepresented invocational education where they receive less edu-cational preparation in areas such as English,mathematics, and science.
•Among college bound seniors in 1981, most blackstudents had taken fewer years of coursework inmathematics, physical sciences, and social studiesthan their white counterparts.
• In 1982, 42 percent of black college students wereenrolled in two-year colleges.
• Students in low income and predominantly minorityschools have less access to microcomputers, andteachers trained in the uses of computers(Darling-Hammond, 1985, pp. 1-3).
Linda Darling-Hammond has also suggested:
Excellence for black students will not become a realityunless and until they receive enriched curricular op-portunities in elementary and secondary schools, suf-ficient financial assistance to pursue higher educationopportunities, and instruction from well-qualified
teachers (p. 4).
Harold Hodgkinson informs us that of every 1OO children
born today:
• Twelve will be born out of wedlock,
Chapter 2 19

• Eorty will be born to parents who divorce beforethe child is 18,
• Five will be born to parents who separate,
• Two will be born to parents of whom one will diebefore the child reaches 18, and
• Forty—one will reach age eighteen normally (All OneSystem, 1985, p. 3).
Hodgkinson also notes:
• Ninety percent of the increase in children borninto poverty is from households headed by a femaleblack or hispanic.
• Although two of three poor children are white, thepercentage of black children living with one parentwho is poor is much higher, and most children whostay in poverty for more than four years (only onein three children does) are black.
• Today (1985), we are a nation of 14.6 millionHispanics and 26.5 million blacks. But by the year2000, we will be a nation of 44 million blacks and47 million Hispanics.
• The task will be not to lower the standards but toincrease the effort.
• There has been a rapid increase in minorities amongthe youth population. Because their numbers arenow so_large, if they do not succeed, all of us
will have diminished futures. That is the new re-ality (p. 18).
Jeannie Oakes (1987) reviewed the urban education reform
picture in her report entitled Imnroying Inner—City Schgols:
• The challenges to urban education have increasedover the past decade. Dramatic population shifts,including the out-migration of many middle-classminorities from central cities and an influx ofpoor Hispanic immigrants, have effected a greater
isolation of low—income and minority children inthe poorest neighborhoods.
AChapter 2 _ 20
• Efforts to increase the "effectiveness" of schools,curricula, and instruction. Based largely on thefindings of "effective-schools" and "effective-teaching" research, this type of reform includespolicies aimed at creating "effective" school cli-mates and strengthening curricula and instruction.Specific approaches include site—based school-improvement projects; efforts to focus curriculummore squarely on basic skills and to match curric-ulum objectives with student assessment; and in-service training programs to help teachers upgradetheir instructional skills.
• Alternative delivery systems. Many districts areattempting to provide special academic or voca-tional opportunities to a subpopulatidn of stu-dents. These efforts include reorganizing schoolcalendars into year-round schedules (primarily tomaximize the use of facilities and time); the cre-ation of special programs and schools (e.g., magnetschools); and voluntary desegregation plans.
• Early childhood programs. These efforts build onthe past success of Head Start programs and repre-sent district-level efforts to intervene early toprevent future educational difficulties.
• Social supports. Social support programs attemptto prevent "at risk" students from dropping out.Most prominent among such programs are school—basedhealth and contraceptive clinics, substance-abuseprograms, and special schools and child—care ser-vices for teenage mothers.
• Cooperative partnerships. Urban districts are at-tempting to go beyond traditional relationshipswith business, community groups, and universitiesto garner additional support and resources for awide array of schooling goals. These programs in-clude business/school partnerships, university/school-district collaborations, and joint projectsof community groups and school districts (Oakes,1987, p. v).
In addition, Oakes also states:
General knowledge of the educational needs of low in-come and minority children and past research suggest anumber of promising directions, including the provisionof rich curricula and challenging instruction; stress-
Chapter 2 21

ing prevention rather than. remediation; structuringsupportive school communities; and providing studentswith tangible evidence that effort at school can resultin real-world rewards.
Moreover, other research suggests that these strategiesare most likely to be developed and implemented suc-cessfully when urban districts increase the capacityof the staffs at individual schools; provide greaterincentives to principals and teachers to alter tradi-tional practices; and foster relationships amongschools, parents, and communities that can providesupport for these efforts (Oakes, p. vii).
Ernest Boyer in the culminating chapter of his report,
High Schogl, presented 12 priorities for improving high
schools:
1. A high school must have a clear mission that isshared by teachers, students, administrators, andparents.
2. Schools are obligated to assist all studentsinbecomingproficient in the written and oral use ofthe English language.
3. There should be a core curriculum that extends be-yond the specialties and focuses on moretranscendent issues, moving from courses to coher-ence (foreign language, the arts, civics, non-western studies, technology, the meaning of work,and the importance of health).
4. High schools should help all students move withconfidence from school to work and further educa-tion.
5. There should be a new Carnegie unit as part of arequirement that all high school students involvethemselves in volunteer work in the schools or intheir communities.
6. The teaching profession should be renewed by lim-iting teachers to four classes per day; increasingsalaries by 25 percent; creating a competitivegrant fund for teachers; and the elimination ofroutine lunchroom and hall monitoring duties.
7. Teachers should use a variety of teaching styles.
Chapter 2 22

8. Every school district should have technology usagepolicies.
9. Greater flexibility in the use of time and schoolsize will help schools achieve their educationalgoals for all students.
10. High school principals should be well prepared forthe position and have greater· control over· thehiring and firing of teachers and their schoolbudgets. Every principal should have a School Im-provement Fund, discretionary money to provide timeand materials for program development and for spe-cial seminars and staff retreats.
11. There should be stronger relations between highschools, colleges, and the business world.
12. The total public has to make a commitment to im-prove schools (Boyer, 1983, pp. 301-319).
These priorities are directed toward high schools in
general. Thus, they address only some of the needs of urban
high students, teachers, and administrators.
However, Oakes suggested specific policy considerations
for improving urban schools. She said, "The most promising
strategies for urban districts attempting to help inner-city
students break the cycle of school failure, unemployment, and
social disintegration are those that will:
• Build capacity at local sites
• Provide school autonomy and flexibility in design-ing and implementing improvement plans
• Take a broad rather than a narrow view of curric-ulum and instruction
• Reorganize classroom teaching and learning to pro-mote urban children's positive self-perceptions,effort, and school performance
Chapter 2 23
• Provide real-life incentives for urban children toachieve at school
• Coordinate efforts with the self-interests of otherinstitutions and agencies to provide social andeconomic opportunities beyond the reach of theschool (0akes, 1987, p. 50).
Oakes also indicated these strategies are not out of
reach. There is knowledge available upon which to base
interventions.
These promising strategies diverge from ‘traditionalurban school practice, and their widespread implemen-tation will require urban educators to assume new rolesand responsibilities and. to restructure schools andlearning. The potential problems of current reformefforts are perhaps not surprising, since the mostpromising strategies directly challenge long-standing,systemic features of urban school districts. The mag-nitude of current problems and the limits on resourcesalso make it difficult for districts to undertake thesweeping reforms needed to improve academic and socialoutcomes for students in the most troubled central andcity neighborhoods (p. ix).
lAlthough further documentation of the need for urban
education reform at all levels does not seem necessary, re-
ports on urban schools continue to be presented. This con-
tention is supported by examples such as the staff of the
Chicago Tribune's self-explanatory publication, Chicago
Sghools: Worst ig America (1988) and the Carnegie Foundation
for the Advancement of Teaching's report, An Imperiied Gen-
eratign: Saying Urban Schools (1988), which made suggestions
for improvement that were quite similar to those made by
Ernest Boyer in High Schooi.
Chapter 2 24

The current state of many urban high schools is aptly
described in Gene Maeroff’s Withered Hopes, Stillborn Dreams:
The Qismal Panorama of Urban Schools (1988). He suggests:
What is clearly needed is a fresh approach to urbaneducation, involving smaller learning units and a dif-ferent philosophy of instruction. The goal must be tocreate within each learning unit a sense of communityand a desire on the part of the students to belong tothat community (Kappan, 1988, p. 634).
Maeroff makes a number of points:
• The inner city has long been populated by poorpeople, but what makes the situation differenttoday--and exacerbates the isolation--is theflight of middle class blacks and the virtualabandonment of entire black neighborhoods to thepoorest of the poor. Schools in big cities mustdo more to lure poor minority youngsters into themainstream by counteracting the isolation of theirlives. Urban black students are surrounded byfailure, both in and our of school. Their senseof the future is stunted, unlike more advantagedyoungsters, it does not include academic achieve—ment in any way. Hopes wither; dreams arestillborn.
• In big city schools accumulated academic neglectis abundantly evident. As a result, most graduatesof urban high schools serving primarilyimpoverished minority students have not read andexplored the same literature, science, mathemat-ics, foreign languages and social studies as theirsuburban and small town counterparts.
• The possibility of pursuing careers in mathematicsand science is foreclosed for most urban minoritystudents long before they finish high school. Theresult is that, in the entire United States in1986, of the 3,003 doctorates in the physical sci-ences awarded to American citizens, only 25 wereawarded to hüacks and 53 to hispanics. Of the1,379 doctorates in engineering awarded to Ameri-cans, only 14 were awarded to küacks and 25 toHispanics.
• Part of the difficulty lies in the teaching. Forevery student inspired by a teacher, too often
Chapter 2 _ 25
there is another turned off by a teacher unequippedto deal with the needs of disadvantaged children.High schools in the inner city must become morelike elementary schools, proffering supportive en-vironments that bolster the confidence of students.The schools should present themselves to studentsnot as places where they can work for a hmtter"tomorrow" but as places where they can create abetter "today."
• Urban schools have no monopoly on uninspiredteaching, but it takes a terrible toll on studentswho are already unmotivated (Kappan, 1988, pp.634-638).
Urban. education. is not at all gloom and. doom. The
Council of Great City Schools, in Challenges tg Urbah Edgca-
tign; Results in the Making, reports the nation's largest
cities are making progress, but much is to be done. The re-
port suggests urban education is everyone's business.
It quotes James Baines of William Patterson College:
No institution in society is working harder to realizethe promise of our Constitution and our commitment tojustice and equity than are the urban schools. Letthose condemn them make half the effort and we wouldbe a new society tomorrow (1987, p. 1).
The State of New Jersey has initiated a plan for as-
sisting urban school districts that includes steps for the
state taking control of local school districts "that fail to
meet minimum state standards after repeated levels of moni-
toring and assistance" (Urban Education in New Jersey, 1988,
p. 7). Portland, Oregon, published a plan for Increaslng the
Achieyement of Black Male Students (1988); and Denver,
Colorado, drafted a Strateglc Plah for 1989-1994 that lists
15 specific activities for improving its schools.
Chapter 2 26

These state and local district reform efforts are also
supported by the educational excellence research of Ronald
Edmonds (1979), Michael Rutter (1979), and Lawrence Lazotte
(1980).
While the findings of these three researchers were not
identical, five consistent correlates for elementary schools
emerged from the studies:
1. Strong principal leadership;
2. A safe school climate conducive to learning;
3. A curriculum emphasizing the basic skills;
4. Teachers with high expectations for all of theirstudents; and
5. A system for mentoring and assessing student per-formance (Yin & White, 1986, p. 66).
The Charles F. Kettering Foundation sponsored a program
that resynthesized the available effective schools litera-
ture, creating a list of 14 correlates of effective high
schools which included the main correlates for elementary
schools. The synthesized correlates, which were used as
criteria by the U.S. Department of Education in 1982-84 to
carry out a high school recognition program included:
1. The principal as an instructional leader
2. A safe, orderly climate
3. An emphasis on basic skills
4. Teachers with high expectations for the achievementof all students
Chapter 2 27

5. A system for monitoring and assessing school per-formance
6. The pronouncement of clear academic goals
7. A sense of teacher efficacy over the conduct of theschool
8. The existence of rewards and incentives for indi-vidual teachers and students
9. The development of community support for the school
10. Concentration on academic learning time
11. Emphasis on frequent and monitored homework
12. A coordinated curriculum
13. The use of a variety of teaching strategies
14. Opportunities for student responsibilities inschool affairs (Yin & White, 1986, p. 67).
As one examines the literature of urban school reform,
the importance of leadership at the building level is appar-
ent. Boyer writes of "The Principal as Leader" who must be
properly prepared for the job; have greater authority over
the functions for which they are responsible; and be recog-
nized for their service to students and staffs (gigh School,
pp. 219-229).
The Urban High School Phigcigalshig
The school reform movement initiated by the §g;igg_g;
gisg report has had an effect on the urban principalship as
Chapter 2 28

well as rural and suburban principals. Urban principals have
been told to become educational leaders.
It has been suggested that times have changed from the
period of which Edwin Bridges writes:
The urban principal spends the day countering the ini-tiatives of others. Upon entering the schoolhousedoor, the principal confronts a steady flow of problemsituations. Regardless of the school's socio-economicsetting, the urban principal is apt to encounterroughly one hundred problems daily (1978, p. 13).
Urban principals, regardless of their personal and pro-
fessional characteristics, face fundamental role tasks; that
is, problematic issues with which each executive must deal
in seeking to make productive use of himself and his organ-
izational position (Bridges, 1978, p. 8). Essentially, the
urban high school principalship entails some dimensions that
are unique and differ from the usual experiences of their
suburban and rural counterparts. However, the basic respon-
sibility is common--the principal as leader.
The National Association of Secondary School Principals,
in an effort to assist urban high school principals to con-
duct self assessments and strengthen their leadership styles,
conducted the NASSP Urban Principals Leadership Center during
1987-88. The center's program emphasized collaborative
leadership in planning and implementing programs.
The emphasis on "principal as leader" may have added a
new dimension to the traditional distinction between the dual
roles of "principal as educator" and "principal as adminis-
Chapter 2 29

trator" (Blank, 1987). Rolf Blank believes this new dimen-
sion is related to the "effective school" research conducted
by Ronald Edmonds (1979), Micheal Rutter (1979), and the re-
cent research of Boyer (1983), Lightfoot (1983), Coleman, et
al. (1981), Sizer (1984), and others.
Blank also indicates,
A common finding of these studies is the critical roleof the principal as leader in creating school condi-tions that lead to higher student academicperformance--conditions such as setting high standardsand goals, planning and coordination with staff, ori-entation toward innovation, frequent monitoring ofstaff and student performance, and involving parentsand the community (E.R.S. Spectrum, 1987, p, 24).
Blank also suggests that principal leadership may be an
important and influential concept for improving schools; but
indicates there are relatively few data available on the role
of principals and the characteristics of principal leader-
ship, particularly in high schools (1987, p. 2). He states
most of the effective school research has occurred at the
elementary school level.
Rolf Blank indicates there are six characteristics or
areas of leadership that have been analyzed in recent studies
of high schools:
1. Instructional improvement and innovation
INDICATORS:
a. Curriculum or instructional innovation led bythe principal.
b. Principal role in decisions on curriculum de-sign and changes in curriculum.
c. Principal efforts to increase academic learn-ing time during the school day.
4Chapter 2 _ 30

2. Educational goal consensus
INDICATOR:
a. Degree of consensus among staff on annual goalsfor the school.
3. Staff Development
INDICATORS:
a. Principal role in decisions on staff develop-ment programs.
b. Proportion of time in faculty meetings spenton curriculum and instruction matters.
4. Seeking district or community support/resources
INDICATOR:
a. Recent principal request to district forsupport/resources.
5. Involving staff in planning
INDICATORS:
a. School policy or program change from teachers'_ initiative.
b. Number of principal meetings per week withteachers (individual or group).
6. Making decisions of central importance-—exercisingauthority with school policy and organization
INDICATORS:
a. Principal role in selecting faculty.b. Principal role in deciding rules for student
behavior.c. Principal role in scheduling and assigning
teachers.
Blank contends the three conditions that capture impor-
tant differences among urban high schools and the differences
in urban high school leadership are: "school size (total en-
rollment); socio-economic status of students (proportion of
Chapter 2 31

disadvantaged students in the school); and district role in
decisions affecting the school (centralization/ decentrali-
zation)" (Blank, 1987, pp. 26-27).
In addition, it is suggested that from many quarters,
educational administrators, principals in particular, are
told to be instructional leaders. However, at the same time,
principals are being asked to influence instruction in or-
ganizations that seem to have structures defying their ef-
forts. Two of these structures are: principals' time being
consumed by managerial tasks, and the degree of acceptance
and participation on the part of teachers (Gallagher, 1989,
p. 117).
Another educational deterrent is the lack of discre-
tionary funds to meet specific needs in individual schools.
Ernest Boyer indicates high school principals, in general,
have little or no control over their budgets and rarely have
discretionary funds. Their ability to reward outstanding
teachers, deal with unsatisfactory teaching, or develop new
programs is shockingly restricted (Boyer, 1983, p. 226).
Currently, the formal preparation of prospective prin-
cipals is a major concern of superintendents, school boards,
and the future principals themselves. There is, however,
little evidence of attention to preparation strategies for
urban administrators.
Eugene Eubanks and Daniel Levene (1987) say that recog-
nition of the importance of principals and other administra-
Chapter 2 32

tors in creating more effective schools is almost universal
and, "nearly everyone agrees that outstanding administrators
are required if instruction is to become significantly more
effective, and that the general level of leadership must be
much improved in the future" (1987, p. 27).
School administrators serving at all levels, and their
national professional organizations, are now advocating the
principles of school-based management (also referred to as
site-based management). A task force, composed of represen-
tatives of the American Association of School Administrators,
the National Association of Elementary School Principals, and
the National Association of Secondary School Principals, has
produced a publication entitled, Senggl-Baeed Management.
The task force suggests, "School—based management offers re-
alistic hope of improved student and teacher performance"
(NASSP, 1988, p. 2).
Essentially, school-based management is "a process that
involves the individuals responsible for implementing deci-
sions in actually making those decisions. Decisions are made
at the level closest to the issue being addressed" (NASSP,
1988, p. 5).
The task force, in describing the role of the principal
in school-based management, indicated the principal is the
only one in a school building who sees the whole school. This
means the principalship is even more important in a system
Chapter 2 33

of school-based management. The task force also suggests
some of the areas in which principals must be proficient:
Instructional leadership and curriculum awareness
Business management
Personnel management
Facilities, maintenance, and property management
Security
Counseling
Communicating
Community relations.
The task force also stated, "along with increased au-
thority for making decisions comes increased accountability."
Schools will be expected to develop clear sets of objectives
and have their performances meet the objectives. Those who
consistently do not meet their objectives may be removed
(NASSP, 1988, p.
ll).Meanwhile,urban principals publicly express their con-
cerns and frustrations as leaders of urban high schools. The
Harvard University Principals Center hehi a "Conversation
with Urban High School Principals" in 1987. Participating
urban high school principals discussed the following:
• The importance of a principal combining "guts andintelligence" in attempting to reach educationalgoals.
Chapter 2 34
• Principals should have more control over personneldecisions (hiring and firing of staff).
• A reputation for being effective principals (turn-ing schools around) can become a burden. You be-come a "fireman."
• Significant parental and community involvement iscritical to school improvement.
• It is important to help all parents make a realconnection to the school, not just bring in thoseparents whose children are in trouble.
• The high dropout rates in urban schools and de-creasing number of black students enrolled andgraduating from college.
• The high unemployment rate among black youth, es-pecially black males.
• The importance of interacting and supporting atrisk students.
• There is a strong· need to recognize and rewardstudents who are successful in school.
• Students need to be groomed to take the P.S.A.T.and S.A.T. examinations rather than leaving it tochance.
• Mentoring should not be limited to the collegebound students.
• The academic program in a school is only as goodas its faculty.
• Good teachers need to be recognized and supported(Steinberg & Astrein, 1987, pp. 1-11).
These principa1s' comments suggest a deep concern about
the educational lives of urban high school students. Yet,
the role of being an instructional leader seems mired in the
everyday management and organizational matters (Bridges,
1978, pp. 1-21). Perhaps this situation supports Thomas
Chapter 2 . 35
Sergiovanni's belief that the principal's key function in
effective schools is establishing goal consensus among staff
and developing an institutional identity (Educational Lead-
ership, 1984, pp. 4-14).
Thus, urban high school principals find themselves in
administrative assignments--sometimes without explanation
for the assignment (Boyer, 1983, p. 221). These administra-
tors also have inordinate amounts of day·to-day crisis situ-
ations; large percentages of students functioning below grade
level; apathetic parents; high levels of poverty; bureau-
cratic school systems; teachers who may or may not fit their
assignments; union contracts that regulate student disci-
pline, class size, scheduling, salaries, and provide for an
elaborate grievance procedures which limit the principals;
discretionary power; racial and/or class sensitivities; and
communities demanding improvement of schools (Bridges, 1978,
pp. 9-15). Today's principals, like business leaders, are
expected to have a "bias for action, being actively involved,
and value driven" (Peters & Waterman, 1982).
According to Judith Alamprese and Nancy Brigham, a
principal's efforts to improve the management of a high
school should include two critical components:
1. Practices implemented to facilitate direct, opencommunication with staff and students; to act asan advocate for the school; and to streamline ad-ministrative procedures.
2. Practices that enable the principal to gain directknowledge of all school operations and to enforce
Chapter 2 36
a clear set of performance related goals (Alamprese& Brigham, 1986, p. 43).
Summary
This review of the literature has examined the histor-
ical and research aspects of urban schools and their commu-
nities, urban school reform, and the urban high school
principalship. The purpose of the review was (1) to describe
urban education and the challenges faced by urban educators
in the past, and (2) to identify those problems and profes-
sional expectations they must address today.
The review of literature suggests the major studies of
public education prompted by the Eatign at Risk report seemed
to examine only superficially the problems and concerns of
urban educators and students. However, some demographers and
urban education researchers have documented the need for high
quality learning experiences for urban students. Poor and
minority students in urban schools, especially the high
schools, need teachers who know how to teach them and prin-
cipals who know how to provide the proper educational envi-
ronment and the leadership that must accompany these efforts.
The literature provides numerous suggestions for im-
proving urban schools. However, there is little evidence
that practicing urban high school principals have been asked
directly what they deem educationally important; what impedes
Chapter 2 37
their efforts to improve their schools; what specific efforts
must occur in order to meet the educational goals and their
(principals) specific roles in achieving their expressed
goals. Thus, this study attempts to remedy this deficiency
by asking urban high school principals, directly, to indicate
their problems and concerns. In addition, the study asks
them to indicate what they believe is necessary to improve
their schools and what their professional organization,
NASSP, can do to assist them.
Chapter 2 38

CHAPTER 3
METHODOLOGY
The purpose of this chapter is to describe the research
methodology used in the study, describe the population se-
lection procedures, explain the development of the survey
instrument (questionnaire) and its administration, and pro-
vide an explanation of the statistical procedures used in
analyzing the data.
Research Methodology
Descriptive research methodology was used in this study.
In descriptive survey research, data are obtained from a
clearly defined population. Descriptive survey research is
characterized by classification of the data. The data may
be terms descriptive of the population, as inferred in the
sample, or they may be univariate frequency distributions
(for example; ages, weights, test scores, or other measures).
They may also be counts of different answers given in inter-
views or to a questionnaire. When summaries of such data
result in statements or inferences concerning the population,
these statements are descriptive generalizations, or laws
(Englehart, 1972, pp. 293-294).
Chapter 3 39
Weinberg and Schumaker (1969) in their discussion of
descriptive research indicated:
The methods of descriptive statistics entail specifyinga population of interest and then collecting the meas-urements of all members of that population. These or-iginal measurements or scores are called raw data. Theraw data themselves are descriptive, but the scienceof descriptive statistics deals with methods of deriv-ing from raw data measurements that are more terselydescriptive of the original population. In fact, itis the type of measure once removed from the raw datathat is of prime importance to the statistician andresearch worker. For instance, the average IQ of mem-bers of an army battalion is obviously much more com-prehensible and meaningful than the list of thousandsof IQ scores as they were originally obtained. But italmost goes without saying that an understanding of theexact meaning of an average is necessary to interpretan average in any particular case. The descriptivestatistical approach makes use of all the data con-cerning a population, and it entails deriving descrip-tive statistical measurements from data (Weinberg &Schumaker, 1969, pp. 4-5).
Survey research has the advantage of a wide scope: a
great deal of information can be obtained from a large popu-
lation. While surveys tend to be more expensive than labo-
ratory and field experiments and field studies, for the
amount and quality of information they yield, they are eco-
nomical (Kerlinger, 1973, p. 422).
The researcher elected to use descriptive survey proce-
dures using a questionnaire to obtain information regarding
urban high school principals' opinions and concerns related
to fulfilling their professional responsibilities, and to
study the relationship of these factors and selected and de-
mographic and personal variables.
Chapter 3 40
The study was sponsored by the National Association of
Secondary School Principals, a national professional organ-
ization. The findings of this study will be published during
the fall of 1989.
Population
The researcher, after consultation with the dissertation
committee, determined the population to be used in the study
would be all of the high school principals in the largest 100
cities in the United States (World Almanac, 1987) (see Ap-
pendix A).
The population was identified from a list of all high
school principals in the 100 cities that was prepared by
Quality Education Data, Inc. (Denver, Colorado). Those
schools that did not have a twelfth grade graduating class
or a minimum of 200 students were deleted. Thus, the popu-
lation for the study was determined to be 1,259 urban high
school principals.
Instnumentatiog
The survey instrument was developed for two purposes.
The first purpose was to collect opinions, concerns, selected
demographic information, and recommendations for affecting
positive change from urban high school principals. The sec-
·Chapter 3 _ 41
ond purpose was to identify topics and issues that could be
used to develop programs and services for urban high school
principals by the National Association of Secondary School
Principals.
In an effort to ask relevant questions which the re-
searcher believed the principals would be able to answer, a
group of practicing urban high school principals were asked
to participate in the construction of the survey instrument.
The desire for clarity and relevance was stimulated by Jean
Converse and Stanley Presser (1988) who remind researchers
that we sometimes ask people questions in the manner in which
are familiar rather than in a manner that enables people to
understand and accurately respond to the question (p. 57).
A preliminary questionnaire was sent to 20 urban high
school principals. They were asked to respond to four items
which would generate items that might be included in the
survey instrument (Appendix B).
The items to which the 20 principals responded were:
1. List five specific actions necessary to make the school
the type of learning institution it should be.
2. List those matters that should be considered national
issues and concerns regarding urban high schools.
3. Define/describe what the word 'urban' means.
4. Define/describe the characteristics of an urban high
school.
Chapter 3 42
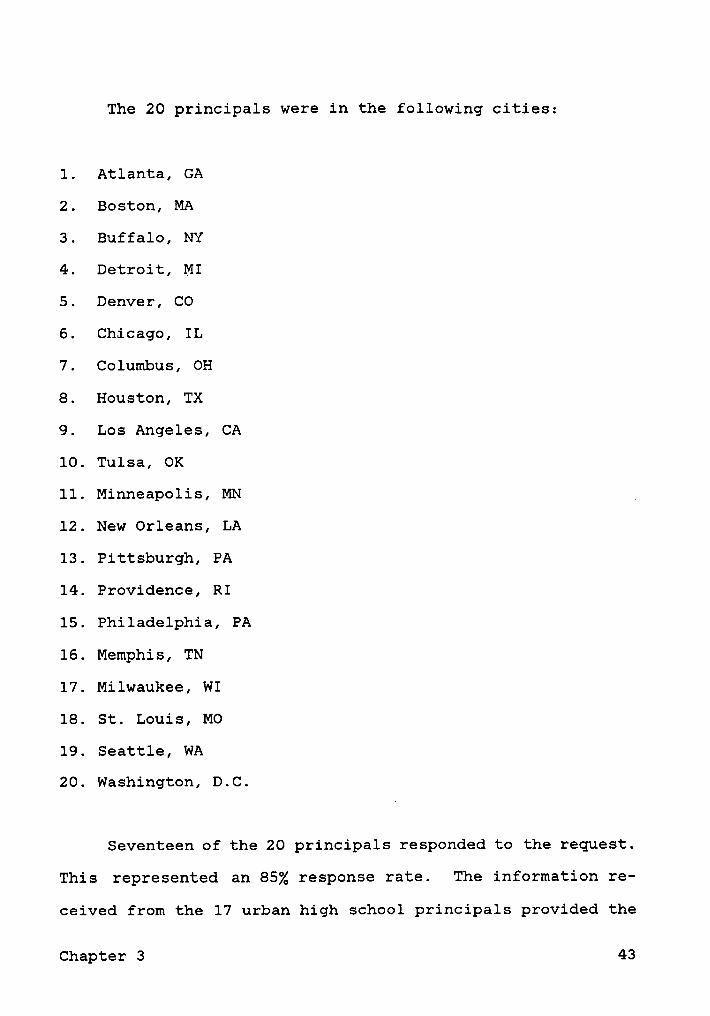
The 20 principals were in the following cities:
1. Atlanta, GA
2. Boston, MA
3. Buffalo, NY
4. Detroit, MI
5. Denver, CO
6. Chicago, IL
7. Columbus, OH
8. Houston, TX
9. Los Angeles, CA
10. Tulsa, OK
11. Minneapolis, MN
12. New Orleans, LA
13. Pittsburgh, PA
14. Providence, RI
15. Philadelphia, PA
16. Memphis, TN
17. Milwaukee, WI
18. St. Louis, MO
19. Seattle, WA
20. Washington, D.C.
Seventeen of the 20 principals responded to the request.
This represented an 85% response rate. The information re-
ceived from the 17 urban high school principals provided the
Chapter 3 43

basis for development of the survey instrument. A draft of
the survey instrument was presented to the dissertation com-
mittee on December 14, 1988. It was agreed that the instru-
ment would be field tested using the 17 principals who
responded to the original questionnaire and the seven members
of the NASSP Urban Schools Committee. The committee was in-
cluded because it would use the findings of the study as a
basis for developing programs and services for urban high
school principals.
As part of the survey instrument Validation procedure,
a letter of explanation and the draft of the survey instru-
ment were sent to 23 high school principals on January 23,
1989. The name of one principal was deleted from the ori-
ginal list of 24 because of retirement.
In addition to completing the questionnaire, the prin-
cipals were asked to respond to the following questions:
1. How long did it take you to complete the form?
2. List (by number) those items you found to be am-biguous and/or awkwardly worded and indicate whyyou believe them to be so.
3. List the items you do not understand and indicatewhy you do not understand them.
4. List those items you believe should be deleted andstate why they should be deleted.
5. Are there any items that should be modified?Please list them and suggest how they should bemodified.
6. Are there any items you believe should be added?Please list them (Appendix C).
Chapter 3 44
Twenty-two of the 23 principals involved in the field
testing of the questionnaire responded. This was a 96% re-
sponse rate.
After reviewing the field test results with the disser-
tation chairman, the researcher determined no changes in the
wording of the items were necessary. Principals reported the
amount of time required to complete the questionnaire ranged
from 10 to 30 minutes. The mean time required was 20 minutes.
collection of Data
The printed survey instrument, accompanied by a letter,
was sent to 1,259 urban high school principals between March
1 and March 3, 1989. They were asked to complete the ques-
_tionnaire and return it to NASSP in the postage paid envelope
that had been provided (Appendix D).
By March 29, 1989, 578 questionnaires had been returned.
This represented a 46% return rate.‘
A follow-up letter was sent on March 31, 1989, to those
principals who did not respond (Appendix E). By May 11,
1989, a total of 815 survey instruments had been returned.
Thus, the response to the survey was 65%.
Edward Lehman's "Tests of Significance and Partial Re-
turns to Mail Questionnaires" approach to analyzing late and
non—responses was used:
Chapter 3 45
To explore the possibility that participants who didnot return questionnaires had different attitudes thanthose who did return them, a technique in which re-sponses of early and late respondents were compared andwas applied to the data. Research indicates that thoseresponding late are similar in attitudes and charac-teristics to those who do not respond at all (Lehman,1963, pp. 284-289).
A comparison of the responses received prior to and after the
follow up letter indicated no observable differences in the
demographic profile or responses of the two groups suggesting
generalizability of the findings to the entire population is
appropriate.
Method of Analysis
A11 of the questionnaires were examined to determine if
they met the basic criteria for inclusion in the study (city,
student enrollment, and a twelfth grade graduating class).
Those questionnaires that did not meet the criteria were
discarded.
All data were coded and entered into the computer. The
data were analyzed using the Statistical Anaiysis System.
Frequencies, ranges, percentages, means and other appropriate
statistics were computed and are reported in table form in
Chapter 4.
Chapter 3 . 46

Summary
The purpose of this chapter was to describe the research
methodology used in developing the survey instrument, data
collection procedures, and the statistical procedures used
in analyzing the collected data.
Chapter 3 47
CHAgTEg 4
RESULTS
The purpose of this chapter is to present the response
data and discuss the findings. The chapter is divided into
the following major sections: Demographic Profile of the
Respondents; Demographic Data that Describes Urban High
Schools and Students; Problems and Challenges Facing Urban
High Schools; Respondents' Recommendations for Affecting
Positive Change in Urban High Schools; Respondents' Views of
Their Status, Authority, Job Satisfaction and the Status of
Their Schools, School Districts and Communities; and the
Professional Development Needs of Urban High School Princi-
pals.
Demograghic Profile of Urban High School Prigcigals
Age of respondents. Table 1 shows that over 50 percent
of the respondents (51.4%) are 50 years or more in age. The
average age of the high school principals is 50 years
(rounded to the whole number. However, the largest group of
respondents (197 or 24.2%) were between 45 to 49 years of
age. The respondents ranged in age from 28 to 70 years.
Chapter 4 48
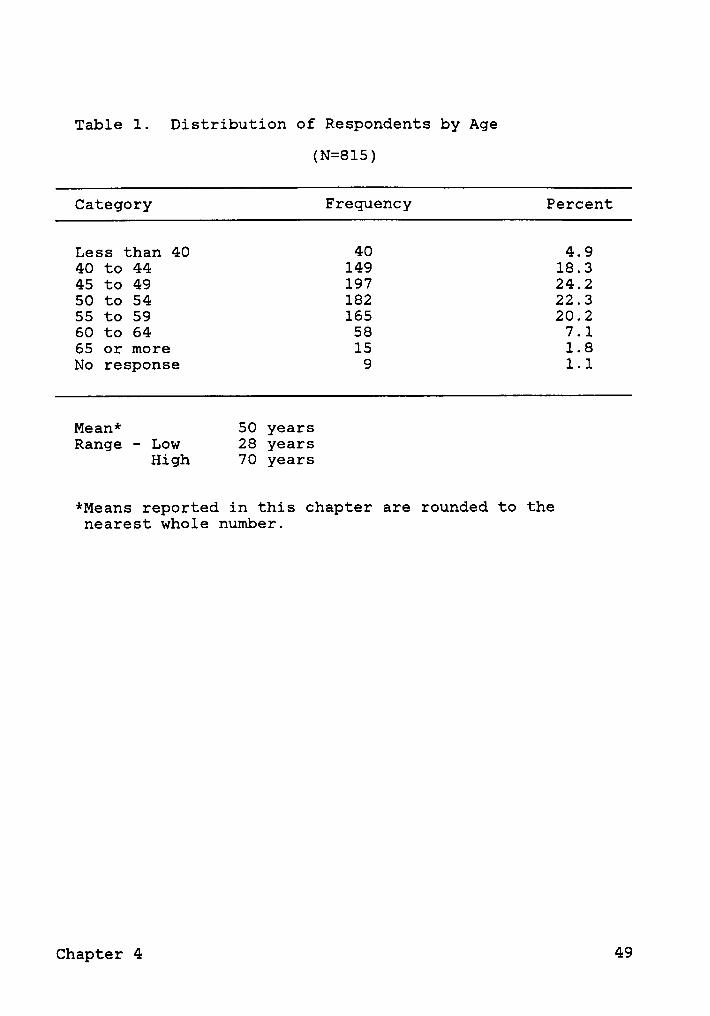
Table 1. Distribution of Respondents by Age
(N=8l5)
Category Frequency Percent
Less than 40 40 4.940 to 44 149 18.345 to 49 197 24.250 to 54 182 22.355 to 59 165 20.260 to 64 58 7.165 or more 15 1.8No response 9 1.1
Mean* 50 yearsRange - Low 28 years
High 70 years
*Means reported in this chapter are rounded to thenearest whole number.
Chapter 4 49

Gghder of respondents. As Table 2 indicates, the ma-
jority of the respondents (630 or 77.3%) were male and 180
or 22.1% of the principals were female.
Ethnic distribution of respondents. The number and
percent of respondents by ethnic heritage are shown in Table
3. The largest group of urban principals were white (531 or
65.2%). The next largest ethnic representation (212 or 26%)
were black, followed by Hispanics (53 or 6.5%).
Highest college degrees helg by respondents. All but
four (0.5%) of the respondents reported having at least a
masters degree. Table 4 indicates 435 or 53.4% of the re-
spondents have masters degrees; 180 or 22.1% have postmasters
certificates; and 188 or 23.1% urban high school principals
have doctoral degrees.
Respondgnts' experience as secohdary school principals.
The respondents' average number of years of experience as a
secondary school principal was 10. Table 5 indicates the
largest group of principals (192 or 23.6%) had 6 to 10 years
of experience. The range of experience was from 1. to 37
years.
3c§pohgeh;s' experience ih curreht gistricts. Table 5
shows the respondents have served as principals in the dis-
tricts to which they are currently assigned for an average
of nine years. The largest group in the categories listed
were those who have served in their current district between
Chapter 4 50
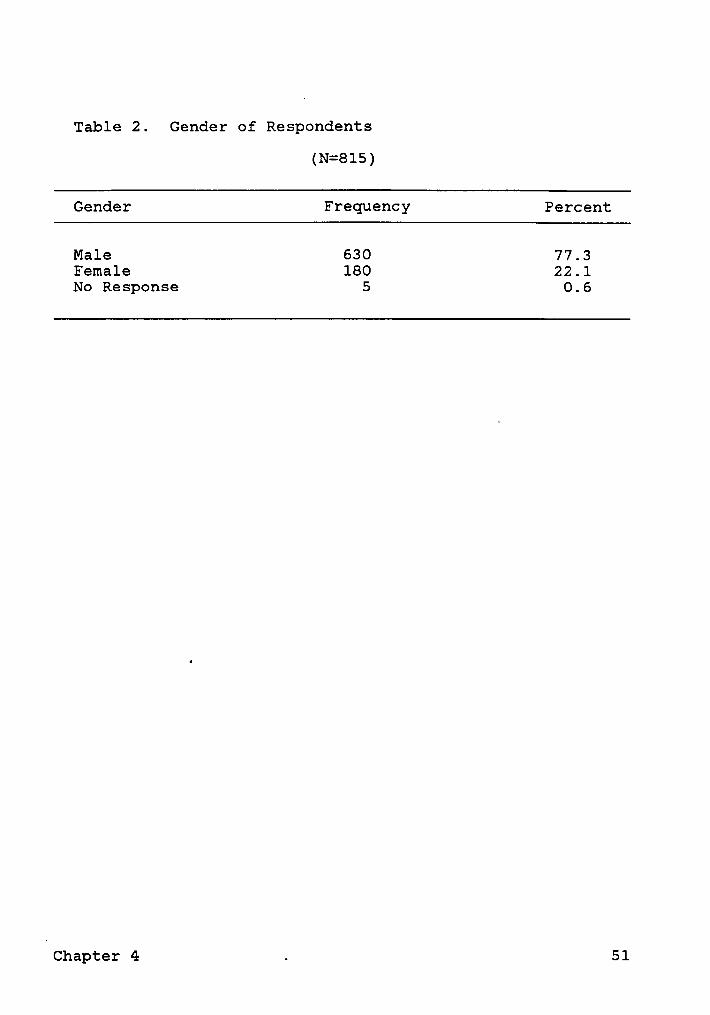
Table 2. Gender of Respondents
(N=815)
Gender Frequency Percent
Male 630 77.3Female 180 22.1No Response 5 0.6
Chapter 4 . 51

Table 3. Ethnic Distribution of Respondents
(N=815)
Ethnic Group Frequency Percent
White 531 65.2Black 212 26.0Hispanic 53 6.5American Indian 6 0.7Asian 7 0.9Other 2 0.2
Chapter 4 52

Table 4. Highest College Degrees Held by Respondents
(N=815)
Degree Frequency Percent
Bachelors 4 O.5Masters 435 53.4Six Year Certificate 180 22.1
(Postmasters work)Doctoral Degree 188 23.1No Response 8 1.0
Chapter 4 53
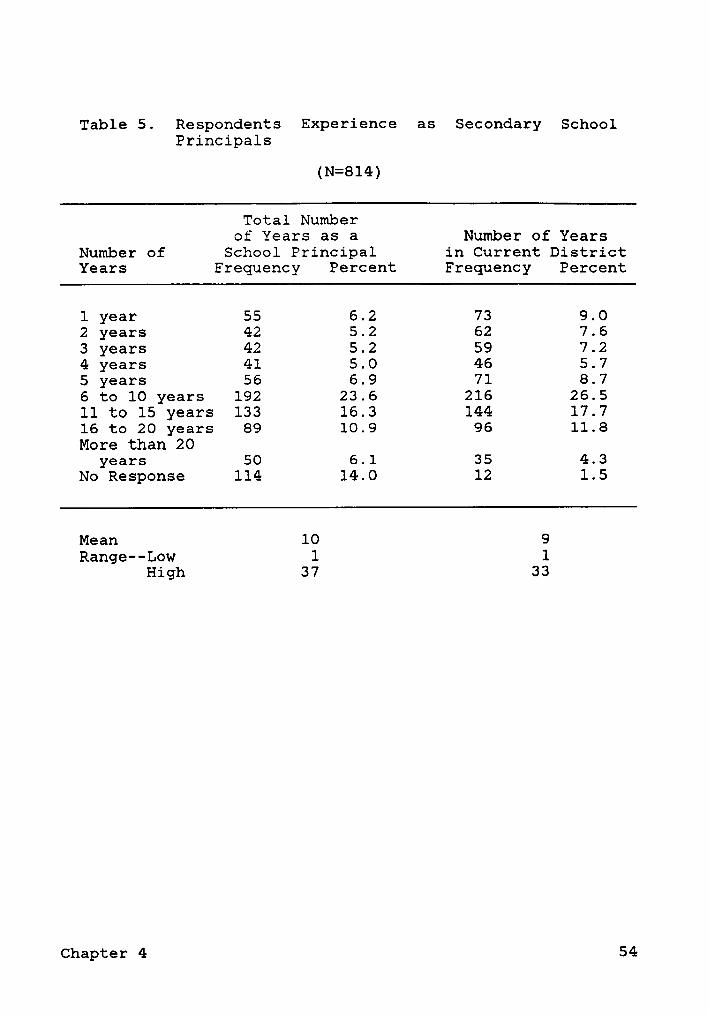
Table 5. Respondents Experience as Secondary SchoolPrincipals
(N=814)
Total Numberof Years as a Number of Years
Number of School Principal in Current DistrictYears Frequency Percent Frequency Percent
1 year 55 6.2 73 9.02 years 42 5.2 62 7.63 years 42 5.2 59 7.24 years 41 5.0 46 5.75 years 56 6.9 71 8.76 to 10 years 192 23.6 216 26.511 to 15 years 133 16.3 144 17.716 to 20 years 89 10.9 96 11.8More than 20
years 50 6.1 35 4.3No Response 114 14.0 12 1.5
Mean 10 9Range--Low 1 1
High 37 33
Chapter 4 54
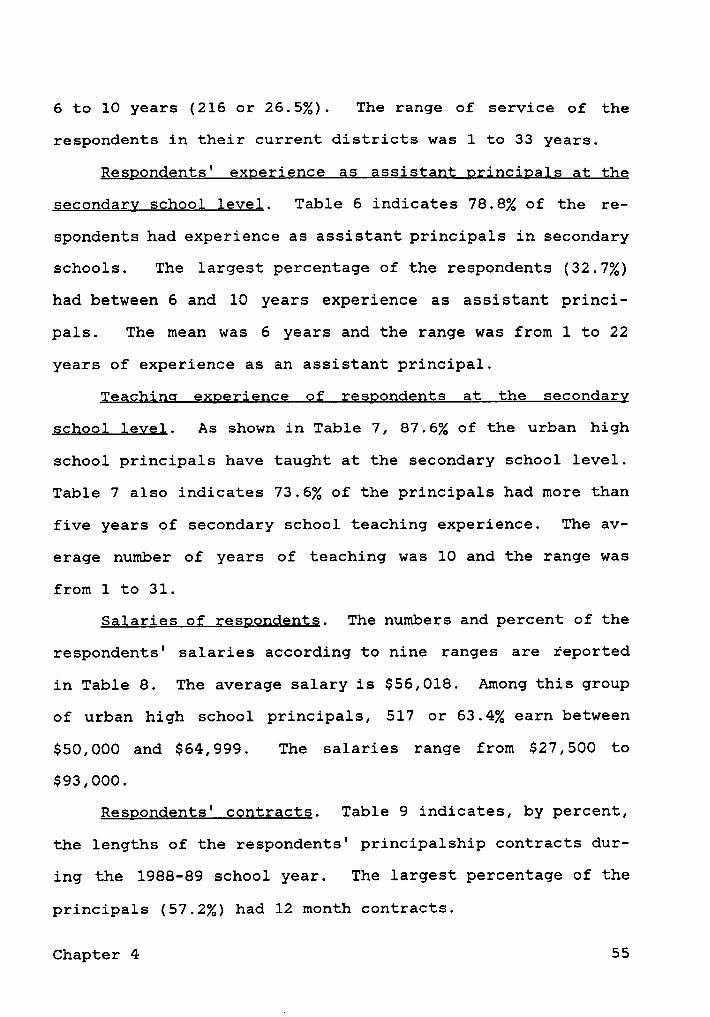
6 to 10 years (216 or 26.5%). The range of service of the
respondents in their current districts was 1 to 33 years.
3espondents' expehience as assistant principals at the
segondary school leyel. Table 6 indicates 78.8% of the re-
spondents had experience as assistant principals in secondary
schools. The largest percentage of the respondents (32.7%)
had between 6 and 10 years experience as assistant princi-
pals. The mean was 6 years and the range was from 1 to 22
years of experience as an assistant principal.
Ieachihg experience of respondents at the secondary
sghool leyel. As shown in Table 7, 87.6% of the urban high
school principals have taught at the secondary school level.
Table 7 also indicates 73.6% of the principals had more than
five years of secondary school teaching experience. The av-
erage number of years of teaching was 10 and the range was
from 1 to 31.
Salaries of respondepts. The numbers and percent of the
respondents' salaries according to nine ranges are reported
in Table 8. The average salary is $56,018. Among this group
of urban high school principals, 517 or 63.4% earn between
$50,000 and $64,999. The salaries range from $27,500 to
$93,000.
Respopdents' contracts. Table 9 indicates, by percent,
the lengths of the respondents' principalship contracts dur-
ing the 1988-89 school year. The largest percentage of the
principals (57.2%) had 12 month contracts.
Chapter 4 55
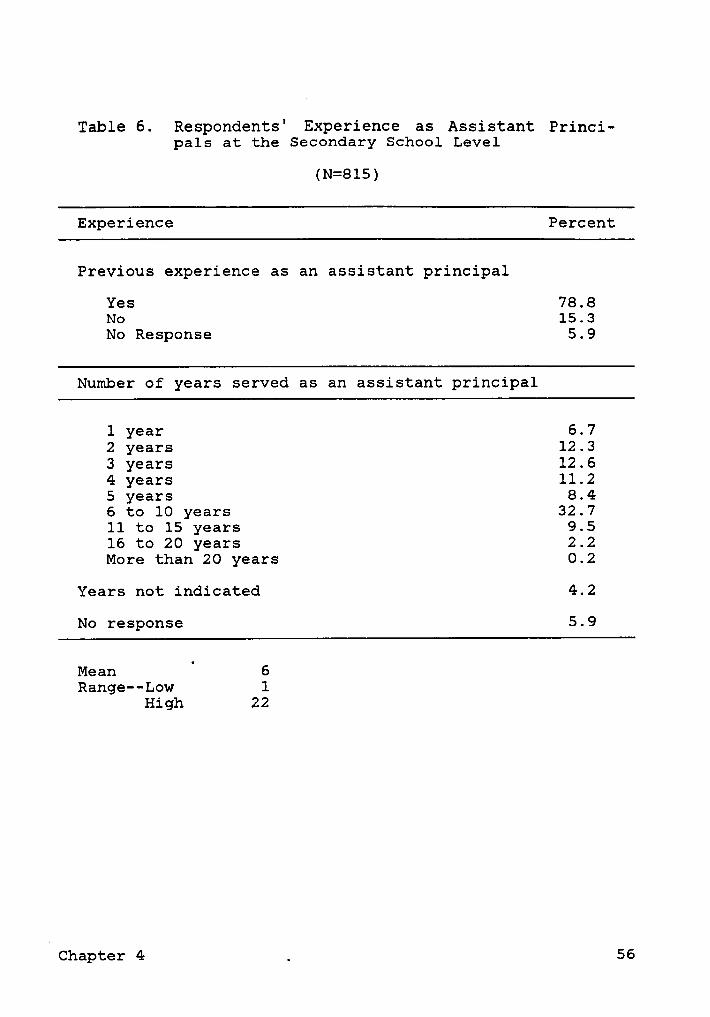
Table 6. Respondents' Experience as Assistant Princi-pals at the Secondary School Level
(N=815)
Experience Percent
Previous experience as an assistant principal
Yes 78.8No 15.3No Response 5.9
Number of years served as an assistant principal
1 year 6.72 years 12.33 years 12.64 years 11.25 years 8.46 to 10 years 32.711 to 15 years 9.516 to 20 years 2.2More than 20 years 0.2
Years not indicated 4.2
No response 5.9
MeanU
6Range-—Low 1
High 22
4Chapter 4 . 56

Table 7. Principals' Teaching Experience at the Second-ary School Level Prior to Becoming a SecondarySchool Principal
(N=815)
Experience Percent
Experience teaching at secondary level
Yes 87.6No. 6.5No Response 5.9
Number of years of teaching at the secondary level
1 year 0.82 years 2.43 years 5.54 years 4.95 years 10.16 to 10 years 36.8ll to 15 years 20.316 to 20 years 10.8More than 20 years 5.7
Years not indicated 4.2
No response 5.9
Mean 10Range-—Low 1
High 31
Chapter 4 57
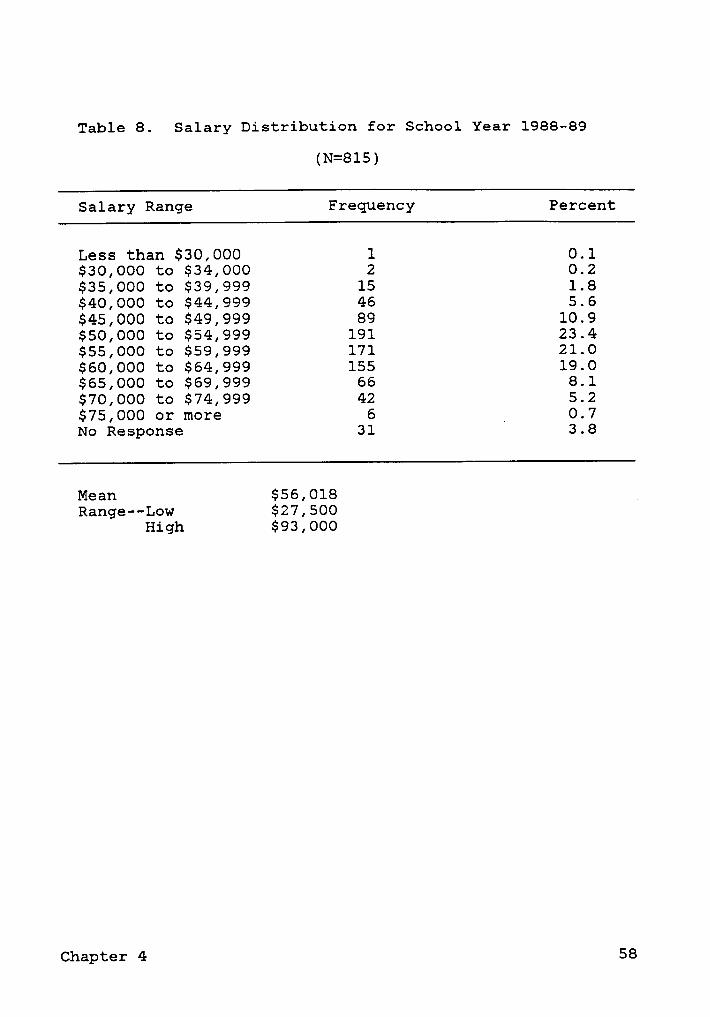
Table 8. Salary Distribution for School Year 1988-89
(N=815)
Salary Range Frequency Percent
Less than $30,000 1 0.1$30,000 to $34,000 2 0.2$35,000 to $39,999 15 1.8$40,000 to $44,999 46 5.6$45,000 to $49,999 89 10.9$50,000 to $54,999 191 23.4$55,000 to $59,999 171 21.0$60,000 to $64,999 155 19.0$65,000 to $69,999 66 8.1$70,000 to $74,999 42 5.2$75,000 or more 6 _ 0.7No Response 31 3.8
Mean $56,018Range-—Low $27,500
High $93,000
Chapter 4 58
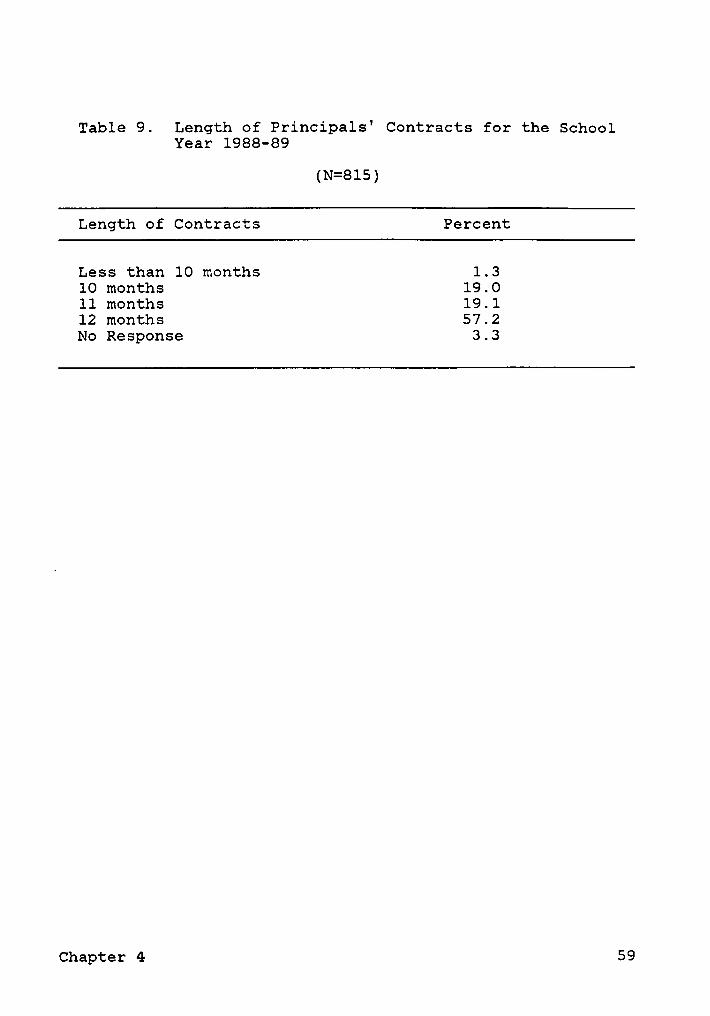
Table 9. Length of Principals‘ Contracts for the SchoolYear 1988-89
(N=8l5)
Length of Contracts Percent
Less than 10 months 1.310 months 19.011 months 19.112 months 57.2No Response 3.3
Chapter 4 59
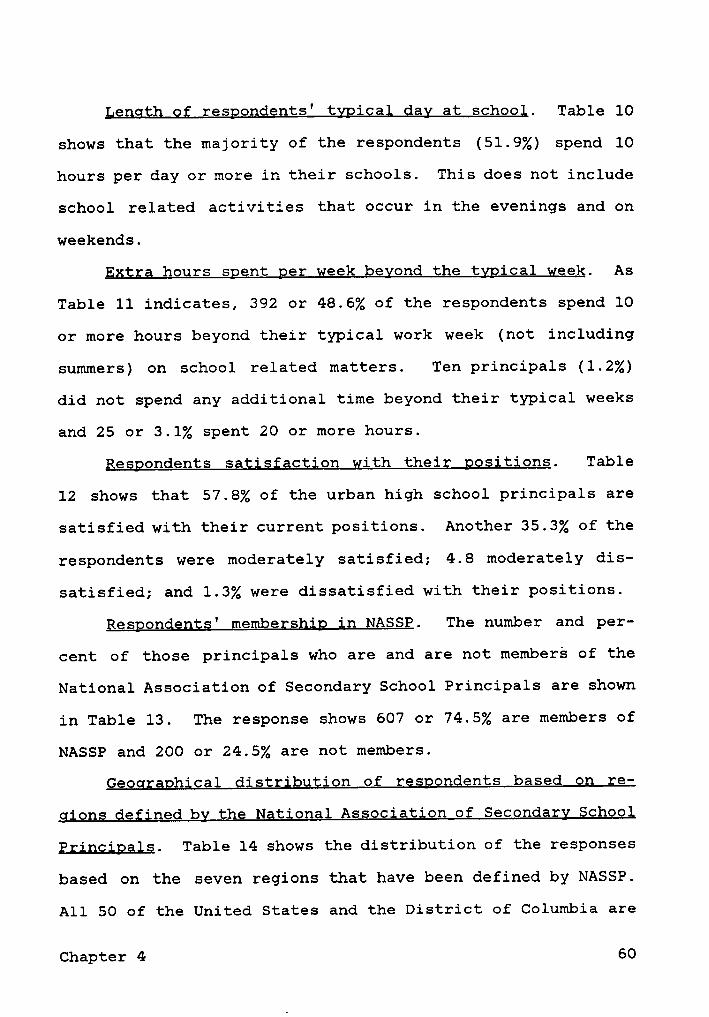
Lehgrh Q; respondents' typigal day at school. Table 10
shows that the majority of the respondents (51.9%) spend 10
hours per day or more in their schools. This does not include
school related activities that occur in the evenings and on
weekends.
Extra hours spent per yeek beyond the typical yeek. As
Table 11 indicates, 392 or 48.6% of the respondents spend 10
or more hours beyond their typical work week (not including
summers) on school related matters. Ten principals (1.2%)
did not spend any additional time beyond their typical weeks
and 25 or 3.1% spent 20 or more hours.
Respondents satisfaction yith their positions. Table
12 shows that 57.8% of the urban high school principals are
satisfied with their current positions. Another 35.3% of the
respondents were moderately satisfied; 4.8 moderately dis-
satisfied; and 1.3% were dissatisfied with their positions.
hespongeh;s' membership in NASSP. The number and per-
cent of those principals who are and are not members of the
National Association of Secondary School Principals are shown
in Table 13. The response shows 607 or 74.5% are members of
NASSP and 200 or 24.5% are not members.
Geographical distribghion of respondents based on re-
gions defiped by the National Association of Secondary School
Erihcipals. Table 14 shows the distribution of the responses
based on the seven regions that have been defined by NASSP.
All 50 of the United States and the District of Columbia are
Chapter 4 60
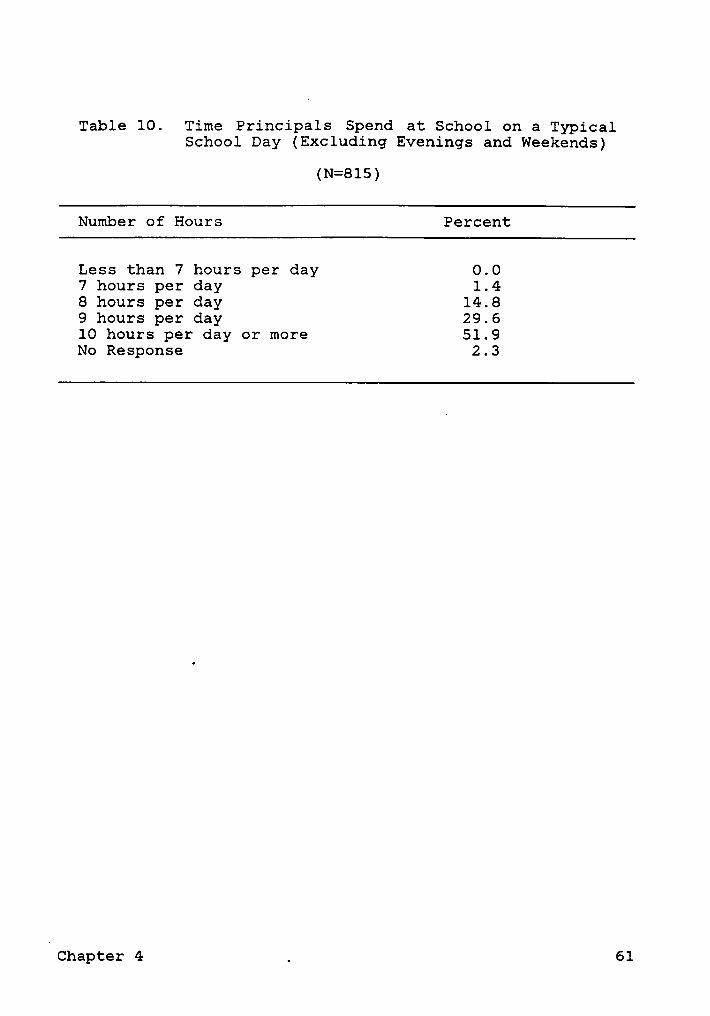
Table 10. Time Principals Spend at School on a TypicalSchool Day (Excluding Evenings and Weekends)
(N=815)
Number of Hours Percent
Less than 7 hours per day 0.07 hours per day 1.48 hours per day 14.89 hours per day 29.610 hours per day or more 51.9No Response 2.3
.Chapter 4 . 61
Table 11. Extra Hours Spent Per Week Beyond the TypicalWeek (Based on Typical Days)
(N=806)
Number of Extra Hours Per Week Frequency Percent
5 or less 171 21.16 to 10 329 40.811 to 15 149 18.516 to 20 80 9.9More than 20 hours 25 3.1No Response 52 6.5
Chapter 4 62

Table 12. Degree of Satisfaction in Current Positionsas Principals
(N=815)
Satisfaction Percent
Satisfied 57.8Moderately Satisfied 35.3Moderately Dissatisfied 4.8Dissatisfied 1.3No Response 0.7
Chapter 4 63
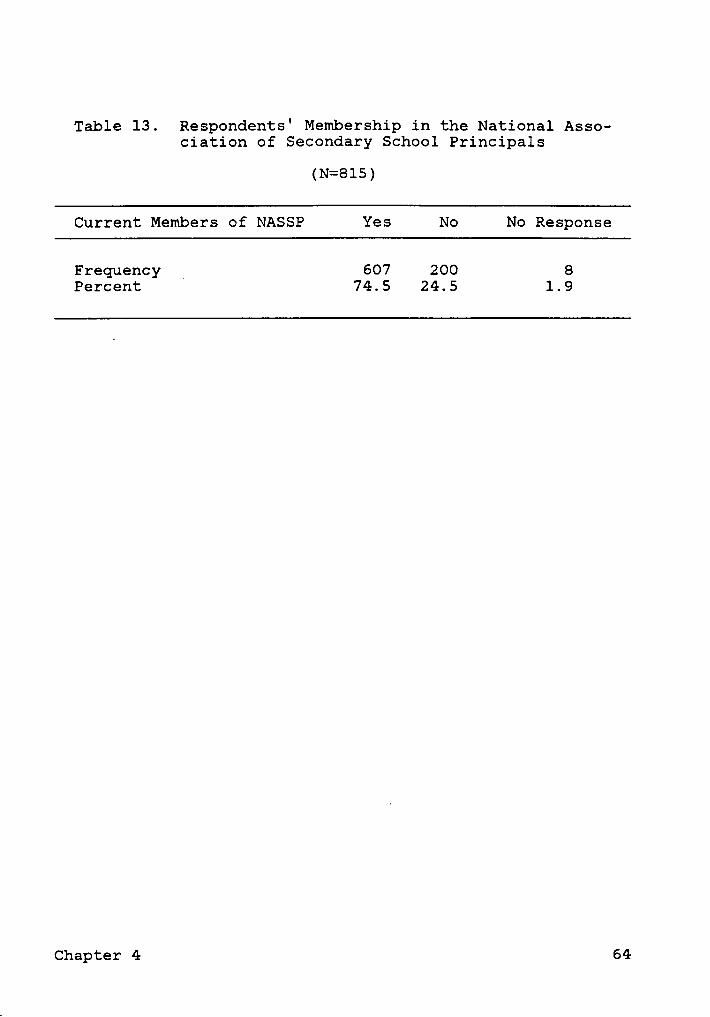
Table 13. Respondents' Membership in the National Asso-ciation of Secondary School Principals
(N=8l5)
Current Members of NASSP Yes No No Response
Frequency » 607 200 8Percent 74.5 24.5 1.9
Chapter 4 64
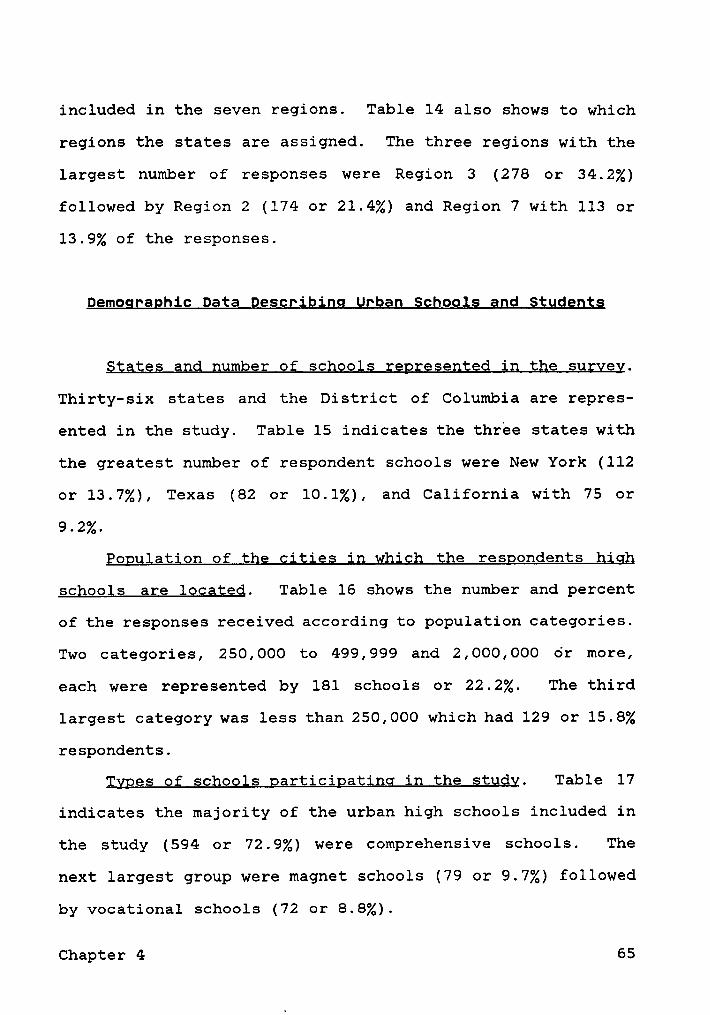
included in the seven regions. Table 14 also shows to which
regions the states are assigned. The three regions with the
largest number of responses were Region 3 (278 or 34.2%)
followed by Region 2 (174 or 21.4%) and Region 7 with 113 or
13.9% of the responses.
Demogpaphic Data Describing Urban Schools and Students
§;etee ahg humber of schools represehped ih the spryey.
Thirty-six states and the District of Columbia are repres-
ented in the study. Table 15 indicates the three states with
the greatest number of respondent schools were New York (112
or 13.7%), Texas (82 or 10.1%), and California with 75 or
9.2%.
Popplatlon of the cities in which the respondents high
schools are located. Table 16 shows the number and percent
of the responses received according to population categories.
Two categories, 250,000 to 499,999 and 2,000,000 or umre,
each were represented by 181 schools or 22.2%. The third
largest category was less than 250,000 which had 129 or 15.8%
respondents.
Types of schools participating in the study. Table 17
indicates the majority of the urban high schools included in
the study (594 or 72.9%) were comprehensive schools. The
next largest group were magnet schools (79 or 9.7%) followed
by vocational schools (72 or 8.8%).
Chapter 4 65
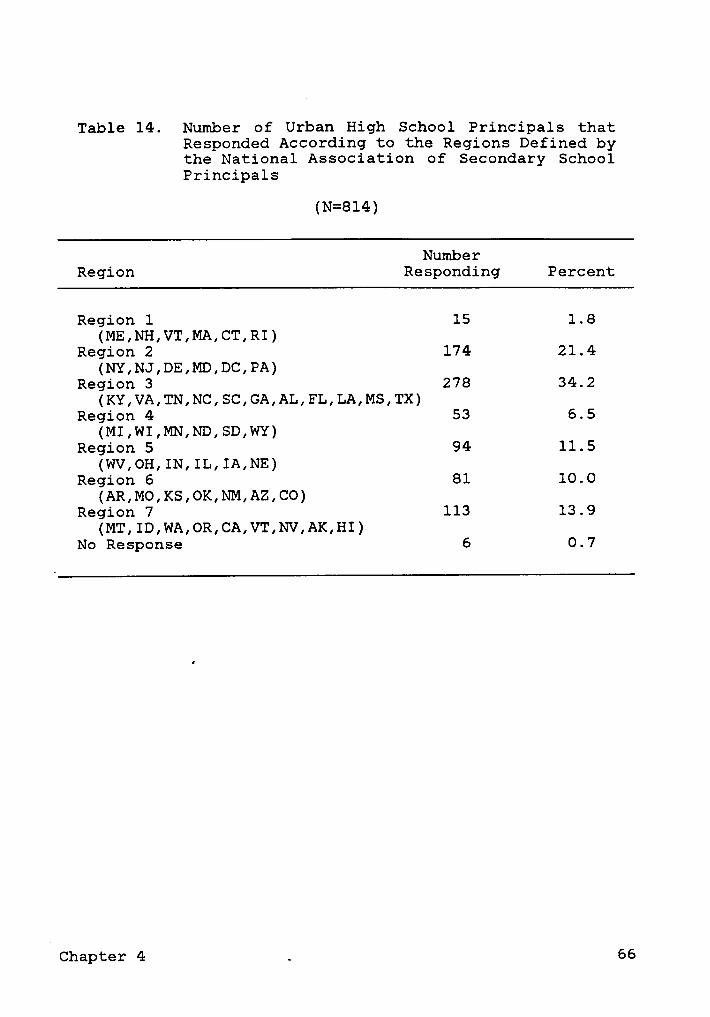
Table 14. Number of Urban High School Principals thatResponded According to the Regions Defined bythe National Association of Secondary SchoolPrincipals
(N=8l4)
NumberRegion Responding Percent
Region 1 15 1.8(ME,NH,VT,MA,CT,RI)
Region 2 174 21.4(NY,NJ,DE,M,DC,PA)
Region 3 278 34.2(KY,VA,TN,NC,SC,GA,AL,FL,LA,MS,TX)
Region 4 53 6.5(MI,WI,MN,ND,SD,WY)
Region 5 94 11.5(WV,OH,IN,IL,IA,NE)
Region 6 81 10.0(AR,MO,KS,OK,NM,AZ,CO)
Region 7 113 13.9(MT,ID,WA,OR,CA,VT,NV,AK,HI)
No Response 6 O.7
Chapter 4 . 66

Table 15. States and the Number of Schools Respondingto the Survey
(N=815)
States Represented Frequency Percent
Alabama 19 2.3Alaska 6 0.7Arizona 17 2.1California 75 9.2Colorado 15 1.8District of Columbia 9 1.1Florida 50 6.1Georgia 17 2.1Hawaii 4 0.5Illinois 39 4.8Indiana 9 1.1Iowa 6 0.7Kansas 11 1.3Kentucky 3 0.4Louisiana 31 3.8Maryland 17 2.1Massachusetts 15 1.8Michigan 24 2.9Minnesota 16 2.0Mississippi 3 0.4Missouri 10 1.2Nebraska 5 0.6Nevada 8 1.0New Jersey 3 0.4New Mexico 12 1.5New York 112 13.7North Carolina 14 1.7Ohio 35 4.3Oklahoma 16 2.0Oregon 5 0.6Pennsylvania 33 4.0Tennessee 43 5.3Texas 82 10.1Utah 2 0.2Virginia 16 2.0Washington 14 1.7Wisconsin 13 1.6No Response 6 0.7
Chapter 4 67
Table 16. Approximate Populations of Cities in Which theHigh Schools of the Respondents are Located
(N=815)
Populations Number of Respondents Percent
Less than 250,000 129 15.8250,000 to 499,999 181 22.2500,000 to 749,999 104 12.8750,000 to 999,999 66 8.11,000,000 to 1,249,000 69 8.51,250,000 to 1,499,999 2 0.21,500,000 to 1,749,999 22 2.71,750,000 to 1,999,999 5 0.62,000,000 or more 181 22.2No Response 56 6.9
Chapter 4 68

Table 17. Types of Schools Participating in the Study
(N=8l5)
Type of School Frequency Percent
Comprehensive 594 72.9Vocational 72 8.8Magnet 79 9.7Alternative 60 7.4No Response 10 1.2
Chapter 4 69
Grades included in the schools that participated ih the
sggyey. Table 18 shows the majority of the schools (618 or
75.8%) contained grades 9 through 12. The next largest group
of schools were those that had grades 10 to 12 (105 or 12.9%).
Studeht enrollment in respondent schools. Student en-
rollments in the respondent schools ranged from 200 to 7,200.
Table 19 shows a frequency distribution that indicates all
size categories listed in the survey have noticeable repre-
sentation in the study. The mean is 1,513 students (rounded
to a whole number).
Racial-ethnic mix of the student populatiohs. Table 20
indicates there were no all white, Hispanic, Asian or Ameri-
can Indian student populations included in the study. How-
ever, 4.3% of the schools reported 100% black populations.
Table 20 also shows 30.1% of the respondents reported white
student enrollments of 1 to 25%; 26.5% reported white en-
rollments of 26 to 50%; 19.1% of the principals indicated
they had white student enrollments of 51 to 75%; and 11.5%
of the administrators reported 76 to 99% white student en-
rollments. Nearly half (46.6%) of the schools enroll 1-25%
Hispanic students. Approximately half (54.1%) of the re-
spondents also reported Asian enrollments of 1 to 25%.
Ayegage daily attendance. Table 21 shows 96 schools
(11.8%) reported average daily attendance rates 95% or more;
307 or 37.7% averaged 90 to 94% students in attendance each
day; and 189 or 23.2% reported 85 to 89% average daily at-
Chapter 4 70

Table 18. Grades Included in the Schools that Partic-ipated in the Survey
(N=815)
Grades in Schools Frequency Percent
Grades 7 to 12 47 5.8Grades 8 to 12 11 1.3Grades 9 to 12 618 75.8Grades 10 to 12 105 12.9Grades 11 to 12 6 0.7No Response 10 1.2
'Chapter 4 _ 71
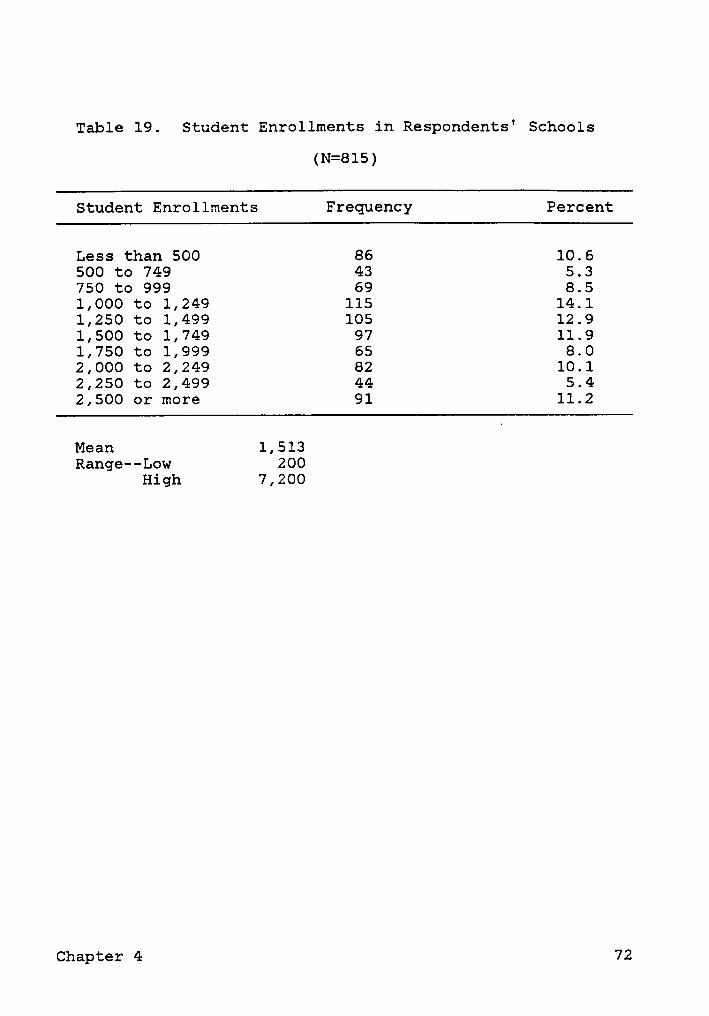
Table 19. Student Enrollments in Respondents' Schools
(N=8l5)
Student Enrollments Frequency Percent
Less than 500 86 10.6500 to 749 43 5.3750 to 999 69 8.51,000 to 1,249 115 14.11,250 to 1,499 105 12.91,500 to 1,749 97 11.91,750 to 1,999 65 8.02,000 to 2,249 82 10.12,250 to 2,499 44 5.42,500 or more 91 11.2
Mean 1,513Range——Low 200
High 7,200
Chapter 4 72
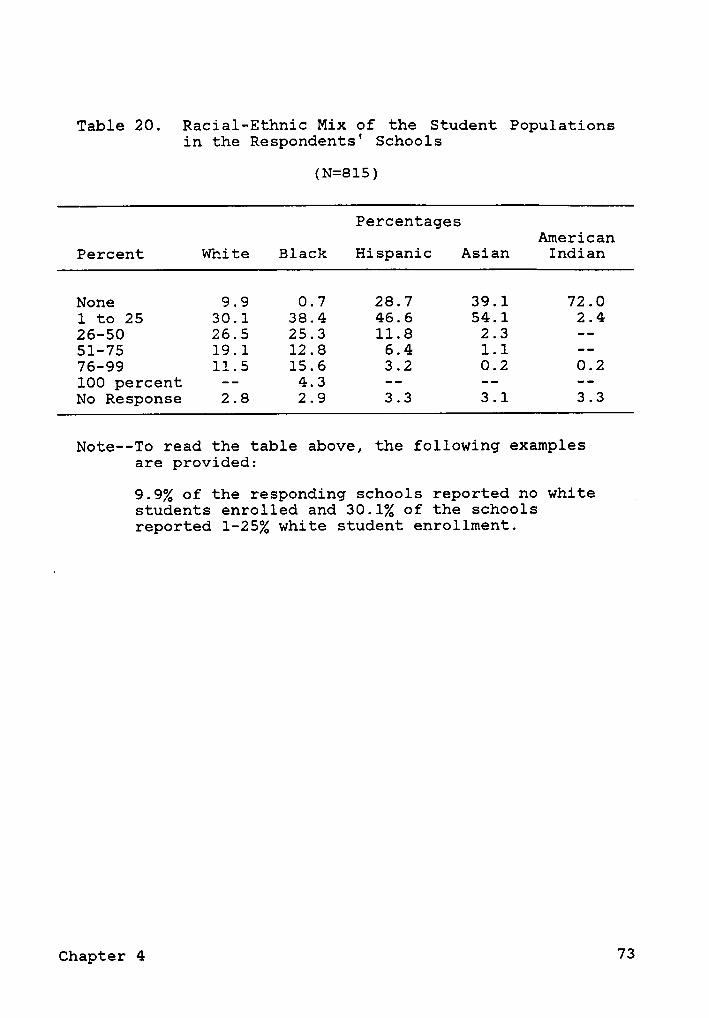
Table 20. Racial—Ethnic Mix of the Student Populationsin the Respondents' Schools
(N=8l5)
PercentagesAmerican
Percent White Black Hispanic Asian Indian
None 9.9 0.7 28.7 39.1 72.01 to 25 30.1 38.4 46.6 54.1 2.426-50 26.5 25.3 11.8 2.3 --51-75 19.1 12.8 6.4 1.1 --76-99 11.5 15.6 3.2 0.2 0.2100 percent -- 4.3 -- -- --No Response 2.8 2.9 3.3 3.1 3.3
Note--To read the table above, the following examplesare provided:
9.9% of the responding schools reported no whitestudents enrolled and 30.1% of the schoolsreported 1-25% white student enrollment.
Chapter 4 73
tendance. One hundred ninety-three schools (23.6%) indicated
their average daily attendance was 80% or less.
Students participating in free or reduced rate lunch
programs. Table 22 indicates 155 schools or 19.1% have 10%
or less students participating i11 a free or reduced rate
lunch program; 123 or 15.1% have 11 to 20% of their students
participate; 109 schools or 13.4% provide free or reduced
rate lunches to 21 to 30% of their students; 31 to 40% of the
students receive these lunches in 97 or 11.9% of the urban
schools; and 274 urban high schools or 33.7% provide free or
reduced rate lunches to more than 40% of their students.
Number of teachers (ip full-time eguiyaiepts) emplpyeg
in respondents' schools. Table 23 shows the number of
teachers employed in urban high schools by size categories.
The largest category (165 or 20.2%) was the 75 to 99 teachers
group. This was followed by the 100 to 124 teacher category
with 156 or 19.1% respondents so indicating. Sixty-five
schools (8.0%) employ 150 or more teachers.
Racigi—ethnic nügc of teaching staffs. Less than one
percent (0.4%) of the respondents' schools have no white
teachers on their staffs. However, Table 24 shows 4.2% have
no black staff members; 44.8% have no Hispanic teachers;
67.2% have no Asian staff members; and 84.5% ck: not have
American Indians teachers. The data indicate 39.4% of the
urban high schools have staffs composed of 76 to 99% white
teachers. Black teachers most often (52.2% of the time)
Chapter 4 74

Table 21. Average Daily Rate of Attendance
(N=815)
Average Daily Rate of Attendance Frequency Percent
80% or less 193 23.685 to 89% 189 23.290 to 94% 307 37.795 percent or more 96 11.8No Response 30 3.7
Chapter 4 75
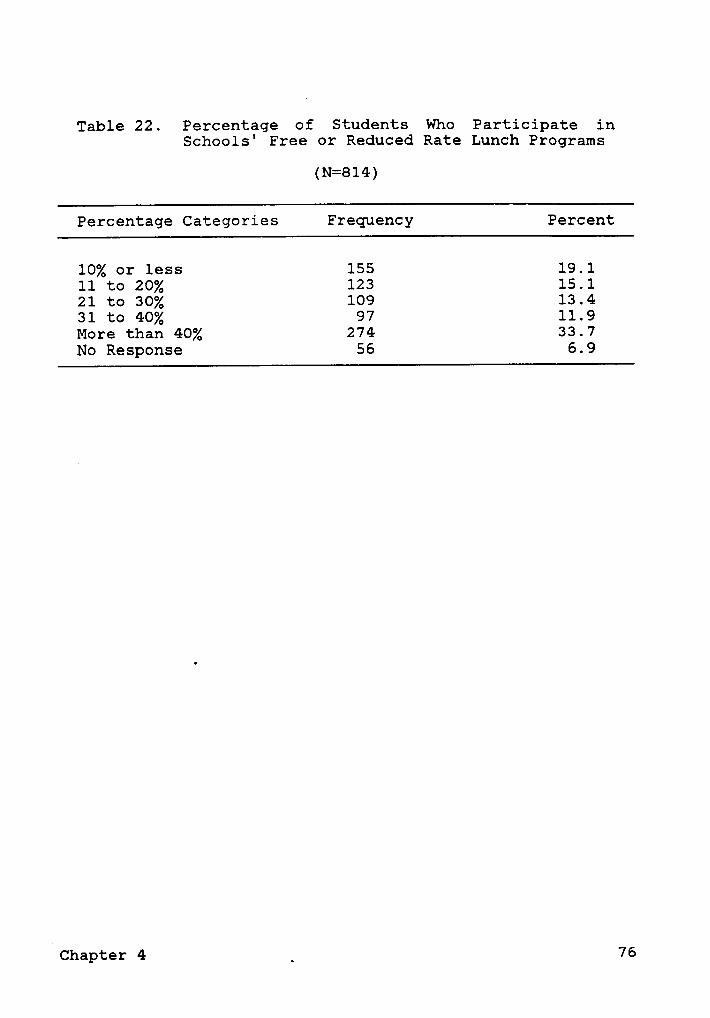
Table 22. Percentage of Students Who Participate inSchools' Free or Reduced Rate Lunch Programs
(N=814)
Percentage Categories Frequency Percent
10% or less 155 19.111 to 20% 123 15.121 to 30% 109 13.431 to 40% 97 11.9More than 40% 274 33.7No Response 56 6.9
4Chapter 4 _ 76

Table 23. Number of Teachers (in Full-Time Equivalents)Employed in Respondents' Schools
(N=815)
Number of Teachers Frequency Percent
Less than 25 56 6.925 to 49 99 12.150 to 74 149 18.375 to 99 165 20.2100 to 124 156 19.1125 to 149 90 11.0150 or more 65 8.0No Response 35 4.3
Mean 89
Chapter 4 77

represent 1 to 25% of the total teaching force; in 25% of the
urban schools, they constitute 26 to 50% of the teaching
staff. In nmst urban high schools, Hispanic, Asian and
American Indian teachers are even less well represented.
Number of assistant principals assigned to ;espogQeg;s'
gghgglg. Table 25 indicates 90.6% of the schools have as-
sistant principals. The data illustrate 62.7% of the re-
sponding principals have three or more assistant principals.
Within that group, 9.9% of the schools have six or more as-
sistant principals.
Problems and Challenge Facing Urban High School Princigals
The urban high school principals were requested to in-
dicate to what extent 28 previously identified factors hinder
student achievement in their schools. Table 26 shows the
rankings of the factors in the order the principals consid-
ered them to be severe problems to not being problems. Re-
sponses are shown by frequency, percent and weighted (l=not
a problem, 2=slight problem, 3=moderate problem, and 4=severe
problem) mean. The respondents consider student absenteeism
to be the most severe problem (mean = 3.25). This was fol-
lowed by inadequate parental interest (2.99), inadequate
money available (2.96), inadequate student self-motivation
to learn (2.84), and students lacking organizational skills
(2.77). Student discipline was not viewed as a problem.
Chapter 4 78
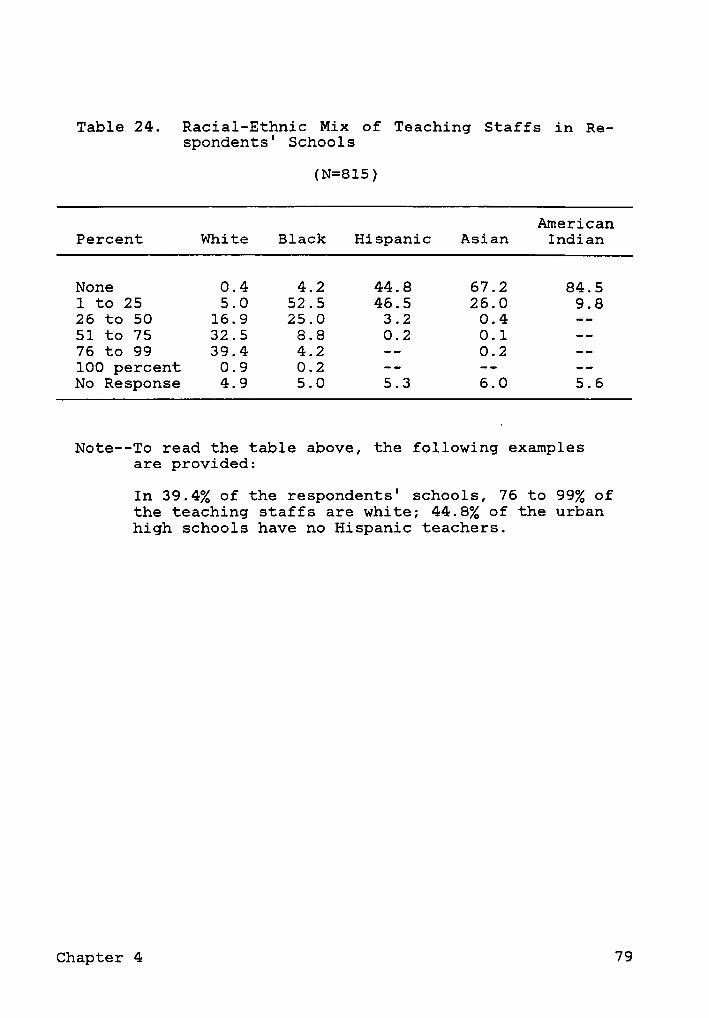
Table 24. Racial-Ethnic Mix of Teaching Staffs in Re-spondents' Schools
(N=8l5)
AmericanPercent White Black Hispanic Asian Indian
None 0.4 4.2 44.8 67.2 84.51 to 25 5.0 52.5 46.5 26.0 9.826 to 50 16.9 25.0 3.2 0.4 --51 to 75 32.5 8.8 0.2 0.1 -—76 to 99 39.4 4.2 -- 0.2 --100 percent 0.9 0.2 -- --
-—No Response 4.9 5.0 5.3 6.0 5.6
Note-—To read the table above, the following examplesare provided:
In 39.4% of the respondents' schools, 76 to 99% ofthe teaching staffs are white; 44.8% of the urbanhigh schools have no Hispanic teachers.
Chapter 4 79

Table 25. Number of Assistant Principals Assigned toRespondents' Schools
(N=815)
Assistant Principals Assigned N Percent
Schools Having No Assistant Principals 60 7.4
Schools with Assistant Principals 738 90.6
1 Assistant Principal 57 9.82 Assistant Principals 161 27.63 Assistant Principals 189 32.44 Assistant Principals 91 15.65 Assistant Principals 28 4.86 or more Assistant Principals 58 9.9
No Response 17 2.1
Chapter 4 80
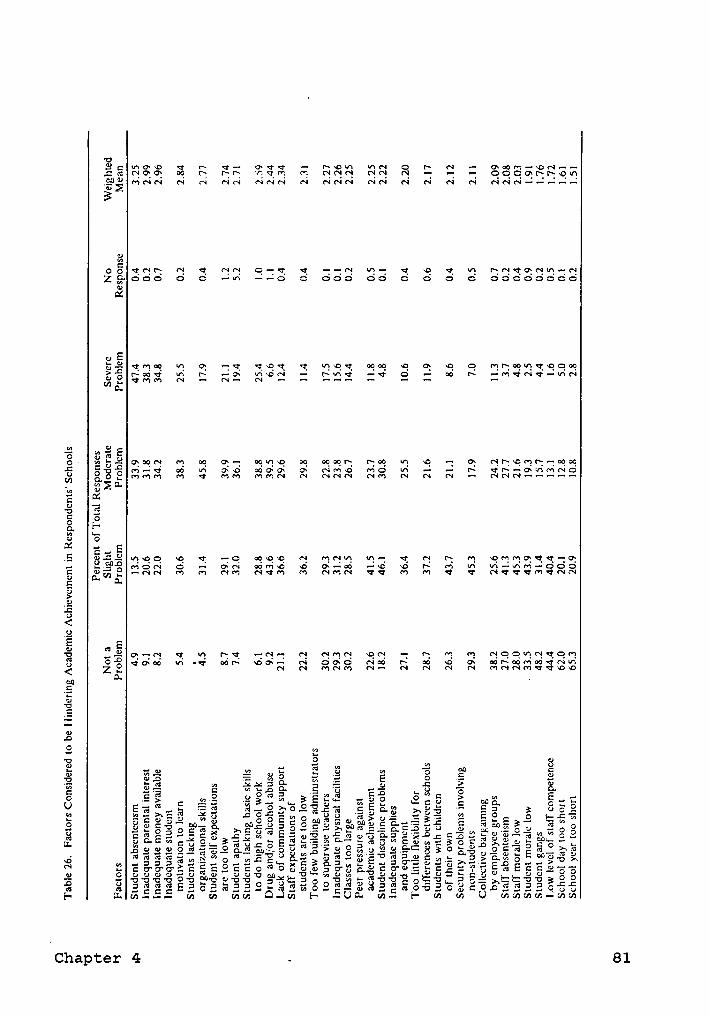
’°2'cäEßq)
en
°°§
Ngso
3<·9
C:4
Q
·
**1coci
l"{O v:4
hl:
°i·O
öl
Vx?
6
Nqä
og
N:4
‘“
ZO
¤~
&"ZN
NNso
QO O.
(si
ON
N'^
_
NN
oQ
NN
C;
N2
"3
22
..2
..
25_
62
25
.4·¤t
N..
U2
G
Q',
Oi
O~
>__¤
O¤o
äow
¢ -
2¤~
•.¤„ vcd
::4
;~i°"°
mq
.
__;1~N
N,
V1‘^Q
6***
"'Zvu
N
CS
...2
vz
'“
Q
O
·—
·v
6
g
Z:-al
3
..gov
cU1
2,,,E
N6:
an
‘
022
..v
6
2
¤.°-¤
O,
..2M
ON
_§_gg;
„-;¤·a„
-—0
°'
n
co
6‘^
E
cd
"'
co
""‘
Q-
co
A
O.N
an
.0
n
O,
so
6
cl"'
OQ
ag
-
A·_QO
E
5.;;:2
Ol!]ao
NM
0
Q-äßan
ol
·g~
ä
E„-sw
N**,3
Z~2=·¤
E
.2.
-6O
N„;¤~
v‘^
0
NN
sg
N6
NVQ
<
N
_
N
:~
~:i
_c
9,
N2ln
N
5
QO
so
E
‘”'$3„‘¤¤•-
<t~d
N
O
¤;:
02
nN
NN
c:
Z-°Q
sd
"‘ -r~
M""
-so
N
-
vN
o;N
N:~
_M
-D
0-
ol
-v~;
N-
°°v
näln
an
A"
.D°
-6
¤@
"NC
2
;~
v
N
2
N..
„<
-¤
nE
°2
v*"•
¤>
ON
-6
·¤
N
so
-...
N
vM
en
NN
uriM
C
dm
N.;cl
8
Qv;‘—
E5
N-
vcS°*
3
0
N°°··-
N6
23
E2
” .6
N
u.
Eää
N-2
ev
Nn
•
Q*‘
„
3
2ä:Es
„2
3
36
¤·-:
¢¤:.0
r=
ol
äägäß
:3
ü„2=
2
"S¤c
ä
2~2„59ä2ö
2533
3
E
«~•«~2N
..„
¢::Iev..O
;
b
__;
..„
made
g3?=;:3¤ä
55«
2
N·
E
C
"'
2
h
(AQ
u:"°-O'¤g§¤>'—-CV2
¢:°‘¤
O
a
::l_¤:C
-_Eo
Q
pt
.:
6
2:
c
·^3·2C.—„%°>
=··*62
3°
I-
m_,o¤0
><·é·
>2
g¤.g__:
«..‘¤
,.
gg-4
"‘2:%
g_"'°'“¤·=°-
?•‘¤¤¤0
Q
NDS
E
8
ggoäaäugaäßu
«„
EQ
§
—
cz
-,..
•-
Q
.:2
·
r'ua2:2
—3„
u:
ßgsgg¤gg¤ts' gecommendations for Affecting Positiv; Qhang;
in Their Schools
Three items in the survey were designed to obtain the
respondents' recommendations and priorities for affecting
positive change in their schools.
Facrgrs respondents belieye yguld haye the most ;lghl§-
lgant impagt on ralsing academic achleyement. Table 27 shows
the frequency and percent regarding those factors the re-
spondents believed would have the most significant impact on
raising academic achievement of students. Raising students'
perceptions of their own abilities rated highest among the
respondents (376 or 46.1%). This was followed by increasing
parental involvement in student education (271 or 33.3%) and
raising staff perceptions of student abilities (263 or
32.3%). The matter of more autonomy for building principals
ranked eighth.
Responden;s' gse of an additional one hundred dollar;
per student jor each of the next three years. Table 28 in-
dicates the largest number of principals (92 or 13.2%) would
use the additional funds to increase the amount of training
and staff development provided for teachers. Additional
teachers/smaller class size (85 or 12.2%) was next and addi-
tional instructional materials (80 or 11.4%) ranked third.
Respondents' most lmportant goals for their schools and
students. Table 29 lists the frequency and percent regarding
Chapter 4 82
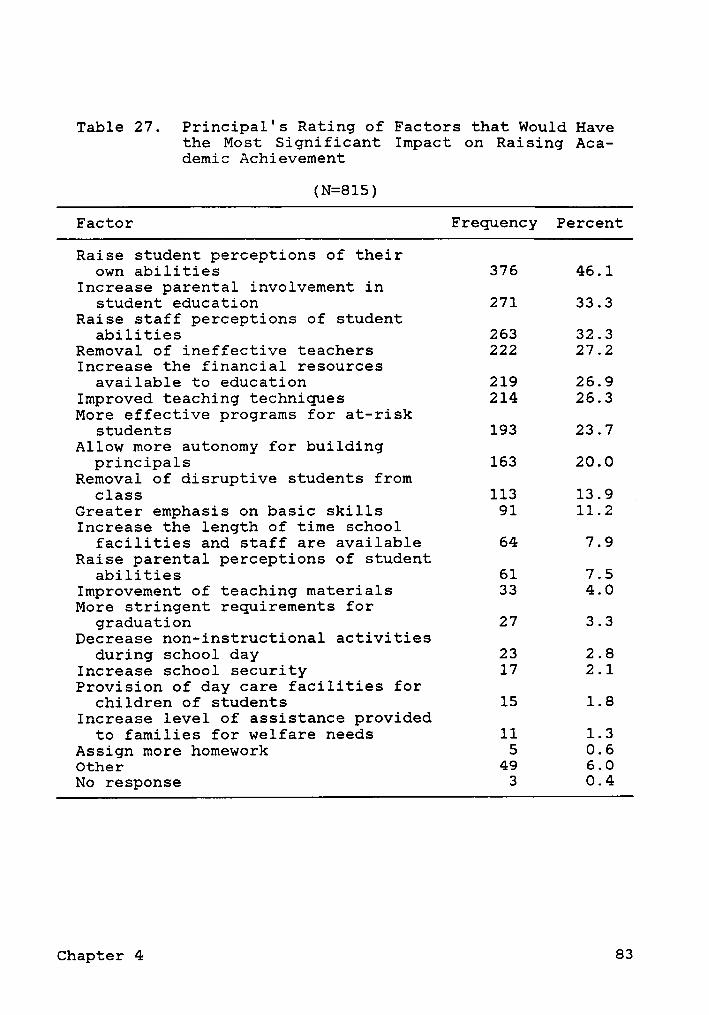
Table 27. Principal's Rating of Factors that Would Havethe Most Significant Impact on Raising Aca-demic Achievement
(N=8l5)
Factor Frequency Percent
Raise student perceptions of theirown abilities 376 46.1
Increase parental involvement instudent education 271 33.3
Raise staff perceptions of studentabilities 263 32.3
Removal of ineffective teachers 222 27.2Increase the financial resources
available to education 219 26.9Improved teaching techniques 214 26.3More effective programs for at-risk
students 193 23.7Allow more autonomy for building
principals 163 20.0Removal of disruptive students from
class 113 13.9Greater emphasis on basic skills 91 11.2Increase the length of time school
facilities and staff are available 64 7.9Raise parental perceptions of student
abilities 61 7.5Improvement of teaching materials 33 4.0More stringent requirements for
graduation 27 3.3Decrease non-instructional activities
during school day 23 2.8Increase school security 17 2.1Provision of day care facilities for
children of students 15 1.8Increase level of assistance provided
to families for welfare needs 11 1.3Assign more homework 5 0.6Other 49 6.0No response 3 0.4
Chapter 4 83

Table 28. Principal's Recommendations for Expenditureof Additional Operating Funds ($100 per stu-dent for three years)
(N=699)
Way in Which Funds Would be Used Frequency Percent
More training and staff developmentfor teachers 92 13.2
Additional teachers/smaller class size 85 12.2Additional instructional materials 80 11.4At-risk student programs 56 8.0Additional supplies and equipment 49 7.0Student motivational and incentive
programs 49 7.0Computers for instructional purposes 47 6.7Tutoring services 45 6.4Additional support services and
programs 35 5.0Additional counselors 31 4.4Improve facilities 19 2.7Curriculum revision 17 2.4Increase parent involvement in the
schools 13 1.9Student self-concept and self worth
programs 11 1.6Basic skills programs 9 1.3Case workers for home and community
contacts 8 1.1More co-curricular activities for
students 7 1.0Teacher incentive programs 6 0.9Increased security 4 0.6Other 28 4.0
Chapter 4 84
the urban principals' most important goals for their schools
and students. Increasing academic achievement was the most
important goal to the largest number of respondents (251 or
30.8%). Adequately preparing students for college and/or
work was next (108 or 13.3%); and promoting equity and ex-
cellence for all students (73 or 9.0%) was third.
Respghdehts' gerceptions gf their roles ih achieylhg
their goals. As a follow up to asking the urban principals
to indicate the most important goals for their schools, the
respondents were requested to state their perceived roles in
achieving their goals. Table 30 shows the largest number of
respondents (254 or 31.2%) saw themselves as leaders in the
schools' efforts to achieving the goals. Being a facilitator
ranked second (188 or 23.1%); and serving as a motivator was
third (73 or 9.0%).
Resgondents' Views of Iheih Status, Agthohlty, Job
Satisfactionl and [he Status of Their Schools; School
Distr;cts„ and Communities
Sgarus factors. Table 31 shows respondents rate job
security higher than the prestige attached to their posi-
tions. Slightly more than 67% of the principals described
their job security as being good while 46.9% rated the pres-
tige attached to the principalship as "good." Recognition
Chapter 4 85
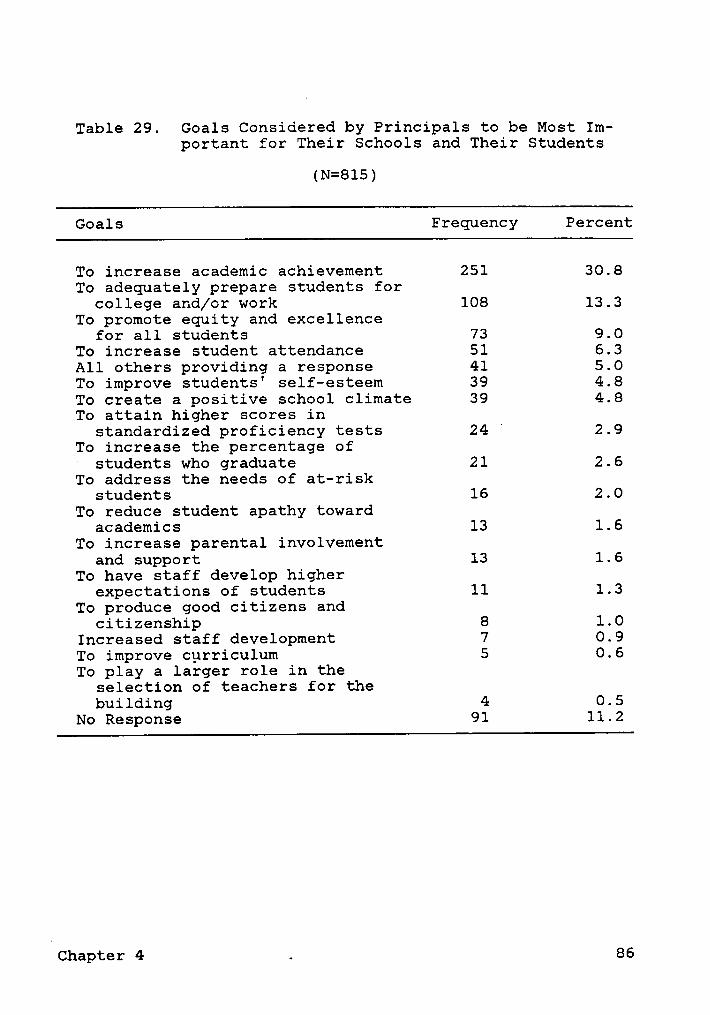
Table 29. Goals Considered by Principals to be Most Im-portant for Their Schools and Their Students
(N=815)
Goals Frequency Percent
To increase academic achievement 251 30.8To adequately prepare students for
college and/or work 108 13.3To promote equity and excellence
for all students 73 9.0To increase student attendance 51 6.3All others providing a response 41 5.0To improve students' self-esteem 39 4.8To create a positive school climate 39 4.8To attain higher scores in
standardized proficiency tests 24 ' 2.9To increase the percentage of
students who graduate 21 2.6To address the needs of at-risk
students 16 2.0To reduce student apathy toward
academics 13 1.6To increase parental involvement
and support 13 1.6To have staff develop higher
expectations of students 11 1.3To produce good citizens and
citizenship 8 1.0Increased staff development 7 0.9To improve curriculum 5 0.6To play a larger role in the
selection of teachers for thebuilding 4 0.5
No Response 91 11.2
Chapter 4 . 86

Table 30. Principals' Perceptions of Their Roles inAchieving Their School's Goals
(N=815)
Roles Frequency Percent
Being a leader 254 31.2Being a facilitator 188 23.1Serving as a motivator 73 9.0A provider of resources 42 5.2Providing staff development
activities 38 4.7All others providing a response 32 3.9Serving as a role model 18 2.2Providing the proper school
climate 18 2.2Hiring the best teachers 14 1.7Securing parental interest and
support 5 0.6Directing the empowerment of
teachers 3 0.4No Response 130 16.0
Chapter 4 · 87
from central office and/or school board was considered fair
(42.7%), 28.2% rated it good, and 27.7% saw it as poor.
Satisfaction. Table 31 also describes the degree of
satisfaction the respondents expressed regarding eight fac-
tors. Seven of the eight factors were viewed as being good
by the principals. The exception was their daily schedules.
The principals' interaction with students was rated highest
in the good category (83.4%); interaction with teachers was
second (81.6%); and general career satisfaction (78.8%) was
third. The daily schedule was viewed as good by 39.5% of the
principals, fair by 42.5% and poor by 16.6%.
Respongents assessments of their progress towatg meeting
the goals of their schools and thei; students. Table 32
shows 49.1% of the urban high school principals indicated
they have met their goals for their schools; 36.3% said they
did not meet their goals; and 13% indicated they have ex-
ceeded their goals.
Principals' opportunities to interyiew prospectiyg
teachers befote they are assigned to the pringipals'
schools. Table 33 indicates 32.8% of the respondents always
interview prospective teachers before those teachers are as-
signed to their schools; 45.9% usually interview the pro-
spective teachers and approximately one-fifth of the
respondents (20.2%) do not interview prospective teachers.
Respondents’ description of the authority they haye in
selecting teachers for their schools. Table 34 shows that
Chapter 4 88
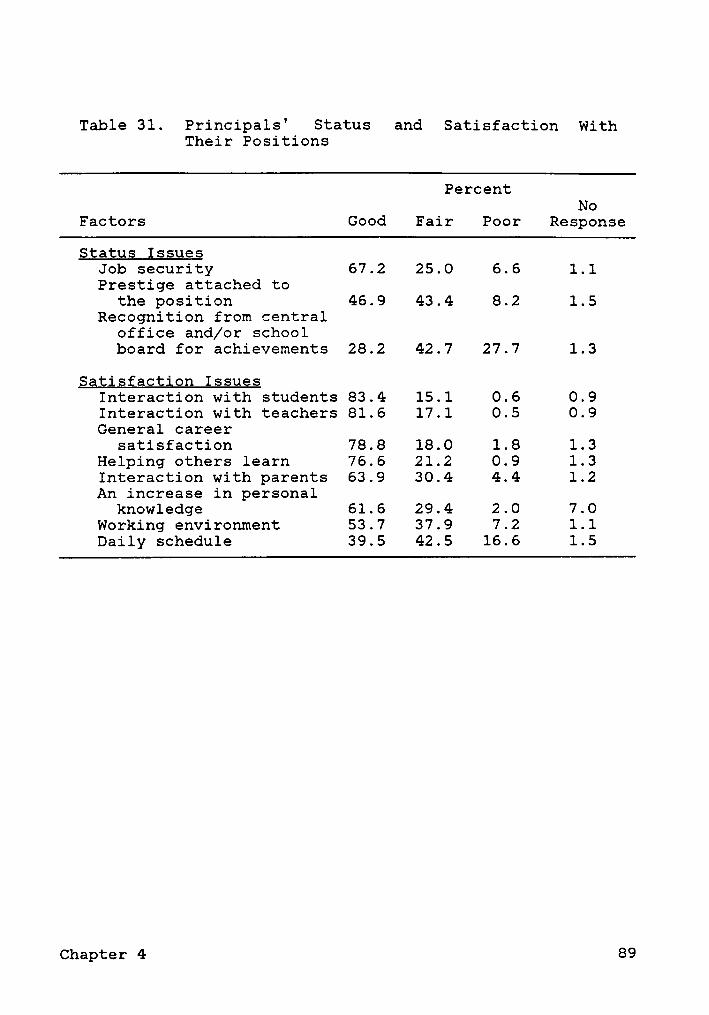
Table 31. Principals' Status and Satisfaction WithTheir Positions
PercentNo
Factors Good Fair Poor Response
Status IssuesJob security 67.2 25.0 6.6 1.1Prestige attached to
the position 46.9 43.4 8.2 1.5Recognition from central
office and/or schoolboard for achievements 28.2 42.7 27.7 1.3
Satisfaction IssuesInteraction with students 83.4 15.1 0.6 0.9Interaction with teachers 81.6 17.1 0.5 0.9General career
satisfaction 78.8 18.0 1.8 1.3Helping others learn 76.6 21.2 0.9 1.3Interaction with parents 63.9 30.4 4.4 1.2An increase in personal
knowledge 61.6 29.4 2.0 7.0Working environment 53.7 37.9 7.2 1.1Daily schedule 39.5 42.5 16.6 1.5
Chapter 4 89

Table 32. Urban Principals' Assessments of TheirProgress Toward Meeting the Goals for TheirSchools and Their Students
(N=815)
Progress Toward Meeting Goalsfor Schools and Students Percent
Have exceeded my goals 13.0
Have met my goals 49.1
Have not met my goals 36.3
No response 1.6
Chapter 4 90
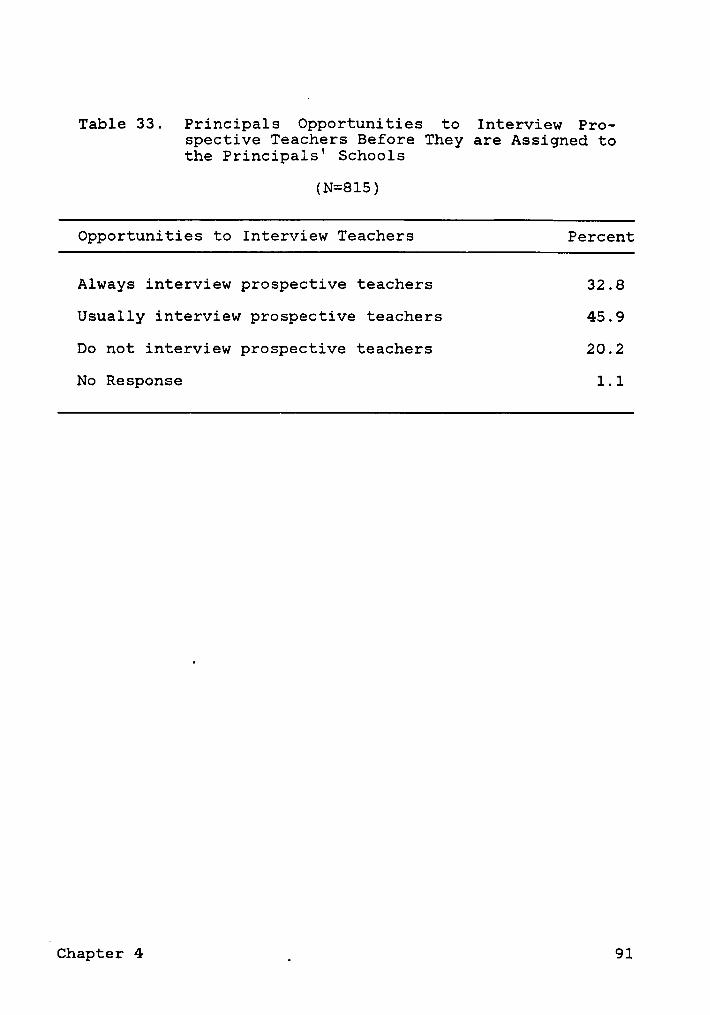
Table 33. Principals Opportunities to Interview Pro-spective Teachers Before They are Assigned tothe Principals' Schools
(N=8l5)
Opportunities to Interview Teachers Percent
Always interview prospective teachers 32.8
Usually interview prospective teachers 45.9
Do not interview prospective teachers 20.2
No Response 1.1
4Chapter 4 _ 91

the majority of the respondents (440 or 54%) share authority
with their central offices in selecting teachers for their
schools; 117 or 14.4% of the principals have primary author-
ity for hiring teachers; and 253 or 31.0% have little or no
authority.
£rlnelpals' response to the gneetlon, "ln genegel le the
authority to run your school giyen to you by the school boagg
and central administration in balance ygith the degree to
which you age held responslble yhen things go yrong?" Table
35 indicates the majority of the respondents (426 or 52.3%)
do not believe their authority to run their schools is in
balance with the degree to which they are held responsible
when things go wrong. The number of principals who believed
their autonomy was consistent with the degree of responsi-
bility was 369 or 45.3%.
Respondents‘ descriptions of their leyel of authorlty
to make declsions concerning thelg oyn schools. Table 36
describes the level of authority the principals believe they
have in regard to making decisions concerning their own
schools. The majority of respondents (447 or 54.8%) indi-
cated their authority was moderate; 167 or 20.5% stated they
have high levels of authority; and 193 or 23.7% indicated
their levels of authority are low. Two principals (0.2%)
feel they have no authority to make decisions concerning
their own schools.
Chapter 4 92
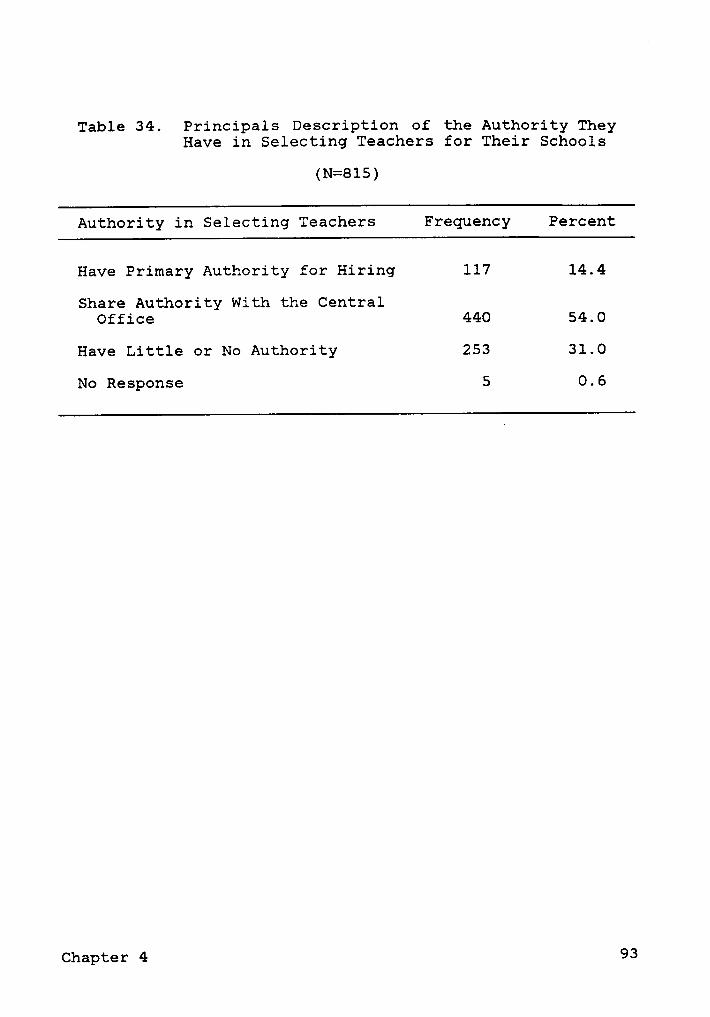
Table 34. Principals Description of the Authority TheyHave in Selecting Teachers for Their Schools
(N=815)
Authority in Selectinq Teachers Frequency Percent
Have Primary Authority for Hiring 117 14.4
Share Authority With the CentralOffice 440 54.0
Have Little or No Authority 253 31.0
No Response 5 0.6
Chapter 4 93

Table 35. Principals' Belief' That the Authority TheyHave for Operating the School Matches TheirResponsibility
(N=8l5)
Response Frequency Percent
Yes 369 45.3
No 426 52.3
No Response 20 2.5
Chapter 4 94
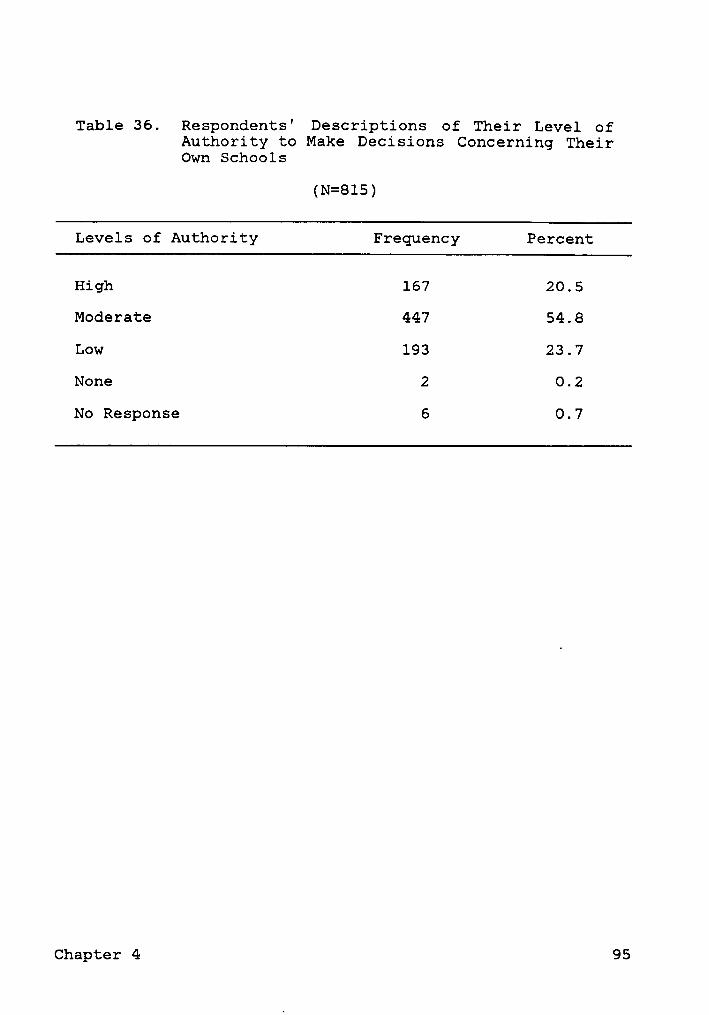
Table 36. Respondents' Descriptions of Their Level ofAuthority to Make Decisions Concerning TheirOwn Schools
(N=8l5)
Levels of Authority Frequency Percent
High 167 20.5
Moderate 447 54.8
Low 193 23.7
None 2 0.2
No Response 6 0.7
Chapter 4 95
£;incipais' gercegtions of the amount of inflwence they
haye oye; their school distric;s' decisions that affect sec-
ondary schoois. Table 37 shows that 347 or 42.6% of the re-
spondents believe they have some influence on school district
decisions which affect their schools. A like sized group
(41.2%) believe they have little influence on such decisions.
The Educational Status of Urban Schools in General
Respondehts' descriptions of the leyels of competency
of most of their sgudents in gegard to basic skill;. Table
38 indicates that 44.0% of the urban high school principals
consider the competency of their students to be average.
However, 23.5% consider their students above average and
31.2% believe their students are below average.
The degree to which the prihcipals belieye their stu-
dents are haying their needs met as their schools currently
operate. Table 39 shows that 552 or 67.7% of the respondents
indicated most (80% or more) of their students were having
their needs met. Of that figure, 188 principals (23.1%) re-
ported that 80 to 89% of their students' needs were being
met. Two hundred eighty-three (34.7%) indicated that 90 to
99% of their students' needs were being met.
gespondents rating of thei; teaching staffs. The ma-
jority of the urban high school principals (464 or 56.9%)
indicated their teaching staffs were rated above average.
(Chapter 4 _ 96
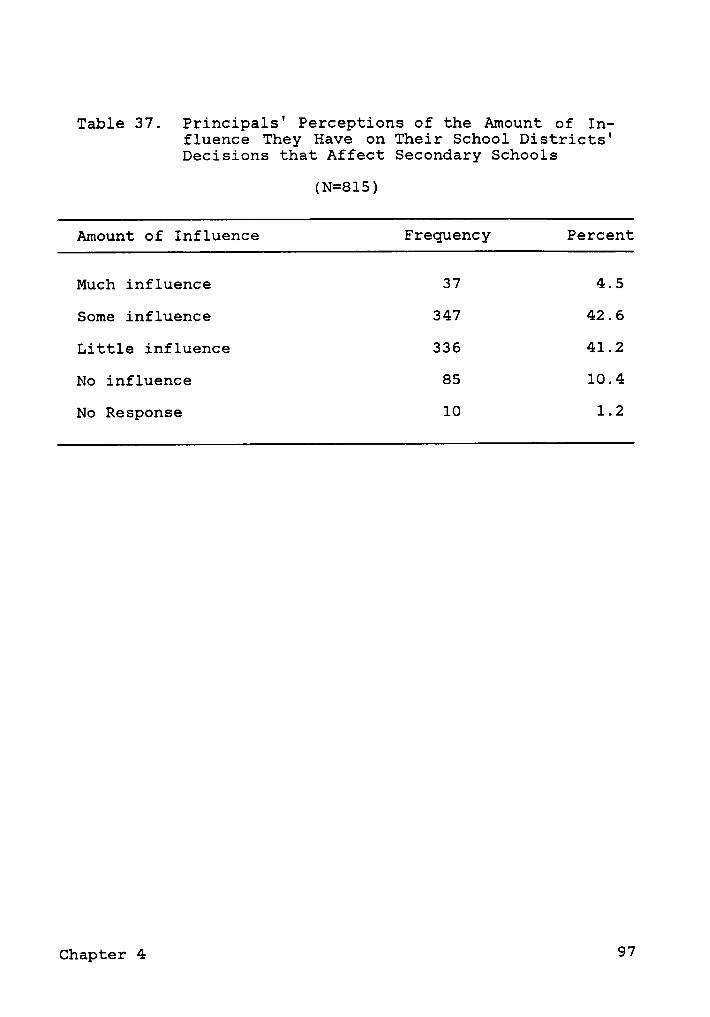
Table 37. Principa1s' Perceptions of the Amount of In-fluence They Have on Their School Districts'Decisions that Affect Secondary Schools
(N=815)
Amount of Influence Frequency Percent
Much influence 37 4.5Some influence 347 42.6Little influence 336 41.2No influence 85 10.4No Response 10 1.2
Chapter 4 97

Table 38. Respondents' Descriptions of' the Levels ofCompetency of Most of Their Students in Regardto Basic Skills
(N=815)
Levels of Competency Percent
Well above average 5.3
Above average 18.2
Average 44.0
Below Average 27.2
Well Below Average 4.0
No Response 1.2
Chapter 4 98
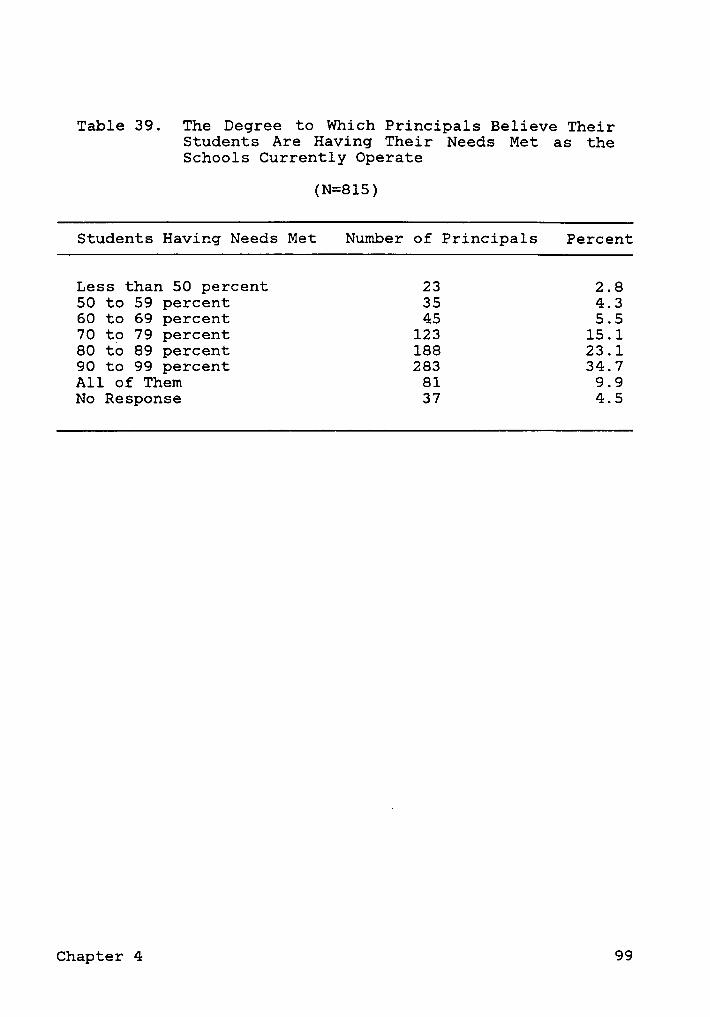
Table 39. The Degree to Which Principals Believe TheirStudents Are Having Their Needs Met as theSchools Currently Operate
(N=8l5)
Students Having Needs Met Number of Principals Percent
Less than 50 percent 23 2.850 to 59 percent 35 4.360 to 69 percent 45 5.570 to 79 percent 123 15.180 to 89 percent 188 23.190 to 99 percent 283 34.7All of Them 81 9.9No Response 37 4.5
Chapter 4 99
Table 4O shows that in addition, 237 or 29.1% rated their
teachers average; 13 or 1.6% were reported as being below
average; and 93 principals or 11.4% of the respondents rated
their teaching staffs outstanding. None of the respondents
indicated their staffs were poor.
£;ihcipals’ descriptions of their commphities' gpti-
tuggs toward public schools and the yalue of edugatioh. Ta-
ble 41 indicates the respondents‘ communities' attitudes
toward public schools were not rated as high as the communi-
ties' attitudes toward the value of education. On a range
from very positive to very negative, 6.9% of the communities
were reported as viewing public schools as very positive;
33.6% as positive; 35.1% average; 21.2% as negative; and 2.1%
viewed public schools as very negative.
In regard to the communities' attitudes toward the value
of education, Table 41 shows that 14.8% of the respondents'
communities viewed education as very positive; 42.3% as pos-
itive; 36.7% average; and 5% viewed education as negative.
None of the communities were reported as viewing the value
of education as very negative.
Respopdents' Professional Development Needs
Areas in which urban principals would most like po ih-
crease their personal skills andgor knowledge. Table 42
identifies the areas in which respondents would most like to
Chapter 4 1OO
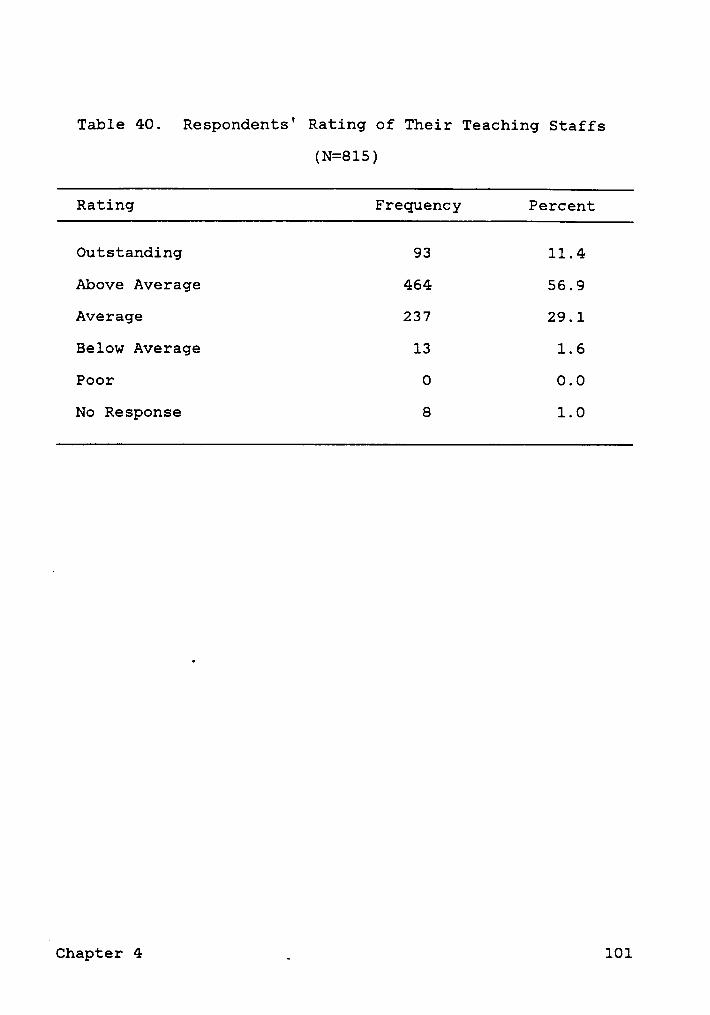
Table 40. Respondents' Rating of Their Teaching Staffs
(N=815)
Rating Frequency Percent
Outstanding 93 11.4
Above Average 464 56.9
Average 237 29.1
Below Average 13 1.6
Poor 0 0.0
No Response 8 1.0
éChapter 4 _ 101

Table 41. Principals' Descriptions of Their Communi-ties' Attitudes Toward Public Schools and theValue of Education
(N=815)
Public's Attitude Public's ValueAbout Schools of Education
Attitudes Percent Percent
Very Positive 6.9 14.8
Positive 33.6 42.3
Average 35.1 36.7
Negative 21.2 - 5.0
Very Negative 2.1 --
No Response 1.1 1.1
Chapter 4 102
increase their personal skills and/or knowledge. Mastery of
new technology was rated highest (86 or 11.1%) followed by
teacher supervision (68 or 8.8%); ability to motivate stu-
dents (44 or 5.7%); curriculum planning (36 or 4.6%); and
time management (35 or 4.5%).
Respondents' ranking of possible NASSQ copdgcted pro-
gpams for urban high school principals. The respondents were
asked to rate five proposed NASSP conducted programs that
would be designed specifically for them. The ratings were
ranked from 5=most helpful to 1=least helpful. Table 43
shows a national recognition program for urban principals was
rated most helpful by 200 or 24.5% of the respondents. How-
ever, 210 or 25.8% principals also rated a national recogni-
tion program least helpful. Special publications targeted
.to urban principals was next as being most helpful (160 or
19.6%) followed by national conferences for urban principals
(150 or 18.4%); an urban education column in the NASSP news-
letter (88 or 10.8%); and urban education sessions at the
NASSP Convention (63 or 7.7%).
Summary
This chapter provides the results of the collected data.
It indicates that urban high school principals tend to be
white males who are approximately 50 years of age. Urban
principals view student attendance as the number one hin-
Chapter 4 103

Table 42. Areas in Which Urban Principals Would MostLike to Increase Their Personal Skills and/orKnowledge
(N=815)
Skill and/or Knowledge Area Frequency Percent
No Response 188 23.1Mastery of new technology 86 10.6Teacher supervision 68 8.3Ability to motivate students 44 5.4Curriculum planning 36 4.4Time management 35 4.3Ability to plan and conduct staff
development programs 32 3.9Ability to motivate staff 31 3.8Ability to assist at risk students 26 3.2Improve people skills 25 3.1Leadership strategies 24 2.9Teacher evaluation 22 2.7Communication (written and/or oral) 20 2.5Management skills 20 2.5Budget making/finance 17 2.1Learning styles 15 1.8Working with parents 14 1.7Site based management 9 1.1Organizational skills 9 1.1Use of research 8 1.0Public relations 7 0.9Labor relations (including
negotiations) 6 0.8Public speaking 5 0.6Race relations 5 0.6Better understanding of legal
aspects of the position 5 0.6Mastery of a foreign language 4 0.5Making a master schedule 4 0.5Ability to increase community
involvement 4 0.5Strategy planning 4 0.5Managing politics 3 0.4A11 others providing a response 38 4.7
Chapter 4 104

E 3 Q 3 Q 3 3N°‘
-—·°‘
N .-7:O:¢'*'—=i‘.=2E¤T:F“."2—··EZ';··::}_
Ö S 8 ·— N N E"’
fl °°°‘
"Ng
E ~= 3 ~2 cz -1 =v; E.: -:~ M r~ xr z~ oo
cgi-€—U u.:-:1:..GZ4·PES•—«§¤71'dzä"‘!‘.GP ¤·¤42 -—„¤ O KN M V O~ NQ, D: 0 O V
-M sn
=¤ EE cu ,1 N vv ~o O 6¤. ¤ Ct ·-Z 6 «~i ·c<3 9 G4; "
N N N °‘ ....q :;.;:1*-1: S"?L ¤ 1:*6 Eéö.2"‘
G y},
<>° M Mfä u D ZS- ~¤ E E E =* E: E E1:1In
D·- ..„o*-1 § oc ~o M ¤~ ~o o«' C G G ® (D G QO
E QL Ü -— N-
N —• •-
Q äü“
2 *2L PZ;·¤ DE?2g .¤E£:g gg E? 3 $8 % E 3 äO :° 'U(UO-
vzUI< „.Z 8 „·5’°
:: 34; v o <:> c~ m a~U 1 1 •-
„ .v= Z..¤.2 oc 14: vs M oc oo
c: ¤°·E o§¤L L;_¤LQ- ..·-...°
2:8ä' 0*-.:>«
. gäuäE mc; o c N N o~ NQ 2 lf} (*1 (N ¤— V Vi
‘ :2Z!:U-¤C2Ä -: agv1 :1U A- *5- vM E ... E
° E„«; -‘= __ S.V g Qä ä 2 3
°‘N 111 9; ~.« oP M ·n v m N
-Z
Chapter4 105

drance to higher academic achievement in their schools.
These administrators believe they have moderate authority
over what takes place in their buildings, tend to be satis-
fied with their positions, and desire to improve their su-
pervisory skills. The majority of the principals believe
they are meeting their schools' goals, have staffs that are
above average and students whose needs are being met. The
majority of the respondents indicated their students' levels
of competency in regard to basic skills is average to below
average. These principals, the majority of whom work 10
hours or more per day, believe their interaction with stu-
dents and teachers is good.
A large majority (74.5%) are members of the National
Association of Secondary School Principals and would like the
Association to provide professional growth activities that
are specifically designed for urban high school principals.
iChapter 4 - 106

CHAPTER §
SUMMARY; CONCLQSIONS AND RECOMMENQATIONS
Introduction
This study was conducted to gain the views and sug-
gestions of urban high school principals in regard to their
positions, schools, school districts, communities, goals, and
professional growth needs. The study represents a
collaborative effort by Virginia Polytechnic Institute and
State University and the National Association of Secondary
School Principals. The rationale for the study was twofold:
(1) to produce a relevant and useful dissertation within the
parameters of acceptable scholarship; and (2) to assist the
National Association of Secondary School Principals and its
newly formed Urban Schools Committee in developing programs
and activities for urban high school principals.
The high school principals in the nation's largest 100
cities, according to population, were selected to participate
in the study. The schools were required to have a minimum
student enrollment of 200 students and a twelfth grade grad-
uating class.
The literature review in Chapter 2 addresses Urban Com-
munities and Their Schools; Urban High School Reform Efforts;
Chapter 5 107

and the Urban High School Principalship. Essentially, the
literature indicates the dilemmas and challenges of educating
urban children have been in existence for over 160 years.
During the nineteenth century and into the twentieth century,
the education of white immigrant children in the cities was
the concern of urban educators. As economic opportunities
and assimilation into the cultural mainstream occurred for
urban whites, urban educators were faced with large numbers
of blacks moving from rural settings into the cities and a
mass exodus of white families from the cities. These urban
communities and their schools are now composed mainly of
African Americans, Hispanics and Asians. Some cities are
witnessing changes in their minority population from predom—
inantly black to majority Hispanic.
As early as 1961, scholars such as James Conant wrote
of urban slums and suburbs and their schools. He indicated
poverty, race, neglect, lack of appropriate teaching methods,
and inadequate funds contributed to the plight of' urban
school children. Conant's beliefs were reinforced ixx the
1970s by Harry Passow, Henry Levine, Jonathan Kozal and oth-
ers. Now, in the 1980s, urban school research such as that
undertaken by the Carnegie Foundation for the Advancement of
Teaching (An Imperiled Generation, 1988) indicates urban
schools continue to be less than adequate.
The school reform movement of the 1980s which was
prompted by The Nation at Risk (1983) was targeted to Ameri-
Chapter 5 108
can education in general and in particular the status of the
nation as a world economic power. The concerns for the na-
tion's urban schools seemed to be an afterthought. Demo-
graphic researchers Linda Darling-Hammond (1985), and Harold
Hodgkinson (1985) have provided data which suggest the nation
faces a serious crisis if urban schools and their communities
are ignored. Jeannie Oakes (1987), Rolf Blank (1987), The
Council of Great City Schools, and others have suggested
strategies for improving urban schools. Some states
(Virginia, Tennessee, New Jersey, Florida, and others) and
local school systems such as Atlanta, Denver, and Portland,
are implementing programs designed to address the needs of
urban schools.
A major component in much of the urban school reform
literature is leadership, especially at the high school
level. Ernest Boyer (1983), Jeannie Oakes (1987), Rolf Blank
(1987), and others have examined the changing role of the
high school principal and provide suggestions for enhancing
leadership functions at the principal level.
Collection of Data
In order to design an appropriate data gathering in-
strument, twenty urban high school principals were asked to
list specific programs and activities they believed had to
occur in urban schools in order to make them the types of
Chapter 5 109
learning institutions they thought they should be. These
principals were also asked to list matters that they believed
should be considered national issues and concerns regarding
urban high schools. Seventeen (85%) of the principals re-
sponded. Their responses were important contributions to the
development of the first draft of the survey instrument.
Twenty—three principals, representing all geographic
regions of the United States, were then requested to complete
and critique the draft of the survey instrument. Twenty-two
principals (96%) responded to the request. The survey in-
strument, in its final form, was mailed to 1,259 urban high
school principals. Eight hundred fifteen principals returned
the instrument. Thus, 65% of the urban high school principal
population participated in this national survey* of ‘urban
.schools.
The survey was used to collect data in the following
areas: the demographic profile of the urban high school
principal; the demographic profile of urban schools and the
students they serve; the problems and challenges facing urban
high schools; recommendations for affecting positive change
in urban high schools; respondents' views of their status,
authority, job satisfaction, and the status of their schools,
school districts, communities; and the professional develop-
ment needs of urban high school principals.
The method of analysis and statistical treatments ap-
plied to the data are reflected in the descriptions and ta-
Chapter 5 110

bles which appear in Chapter 4. The data, where appropriate,
have been compared to that which was reported in the National
Association of Secondary School Principals' publication, gigh
School Leaders and Their Schools (1988).
Findings
Demographic Profile of Principals
The majority of urban high school principals in the na-
tion's 100 largest cities are white (65.2%) males (77.3%) who
have masters degrees or higher (98.6%). The female repre-
sentation is 21.2% and black principals (male and female)
represent 26% of the population included in the study.
The respondents averaged 10 years of experience as sec-
ondary school principals and six years of service as assist-
ant principals. In addition, they had taught at the
secondary schopl level on the average of 10 years. Of those
responding, six hundred thirty-one urban high school princi-
pals (77.4%) earned $50,000 or more. Their salaries ranged
from $27,500 to $93,000.
More than half of the principals (57.2%) are on 12 month
contracts and 51.9% of them spend over 10 hours per day in
their schools. Two hundred fifty-four (31.5%) urban high
school principals spend an additional ten hours or more be-
yond their typical work weeks on school related matters. The
'Chapter 5 - 111
majority of the urban high school principals (57.8%) are
satisfied with their positions. Approximately three out of
four (74.5%) are members of the National Association of Sec-
ondary School Principals.
Demographic Data Describing Urban Schools and Students
Thirty-three states and the District of Columbia were
represented in the study. New York, Texas and California
provided the greatest percentage of responses (13.7%, 10.1%
and 9.2% respectively). Just over half of the responses
(50.8%) came from cities with populations of less than
750,000. In addition, 22.2% of the responses came from
cities with populations of 2,000,000 or more.
The majority of the respondents' schools (594 or 72.9%)
were comprehensive high schools (as opposed to vocational,
magnet, and alternative schools) that had included a twelfth
grade graduating class. Six hundred eighteen (75.8%) of the
schools were composed of grades 9 to 12 and the average stu-
dent enrollment for all of the 815 schools that participated
in the study was 1,513. Only 96 schools (11.8%) had average
daily attendance rates of 95% or more. The second largest
average daily attendance grouping was in the 90 to 94% cate-
gory (307 or 37.7%). One hundred schools or (12.2%) had less
than 80% average daily attendance.
Chapter 5 112
The response addressing the racial-ethnic mix of student
populations indicates less than one percent of the urban high
schools do not have any black students enrolled; 9.9% do not
enroll any white students. Larger percentages of schools
report no Hispanic (28.7%), Asian (39.1%), and American In-
dian (72%) students. The only schools that have enrollments
that are totally of one ethnic group are the 4.3% which re-
port 100% black student enrollments.
The average urban high school employs 89 teachers, most
of whom are white. The respondents reported 32.5% of the
schools had teaching staffs that were 51 to 75% white. An-
other 39.4% of the schools had staffs composed of 76 to 99%
white teachers. Most of the minority teachers were in the 1
to 25% category. Fewer than 1% of the urban principals in-
dicated they had no white teachers on their staffs; 4.2% had
no black teachers. However, percentages of schools that did
not have Hispanic, Asian and American Indian teachers were
44.8%, 67.2% and 84.5% respectively. With regard to assist-
ant principal staffing, 90.6% of the schools indicated they
had assistant principals and all but 9.8% of those schools
reported having at least two assistant principals.
Problems and Challenges of the Principals
Student absenteeism, less than adequate parental inter-
est, and inadequate money available head the list of 28 fac-
Chapter 5 113
tors the respondents viewed as problems or challenges. These
were followed by: students having inadequate motivation to
learn, students lacking organizational skills and having low
self expectations respectively. The length of the school day
and school year were twenty—seventh and twenty-eighth on the
list.
Recommendations for Affecting Positive Change
The urban high school principals were requested to se-
lect three factors, from a list of 19, that would have the
most significant impact on raising the academic achievement
of their students. Raising student perceptions of their own
abilities headed the list (376 or 46.1%). The other factors
selected by at least 25% of the respondents were: increased
parental involvement; raise staff perceptions of student
abilities; removal of ineffective teachers; increase the fi-
nancial resources; and improve teaching techniques. Assign-
ing more homework was last on the list.
When asked what they would do with an extra one hundred
dollars per student for each of the next three years, the
respondents' first choice was more training and staff devel-
opment for teachers. This was followed by additional
teachers/smaller class size and additional instructional ma-
terials. Teacher incentive programs were listed by less than
one percent of the respondents.
Chapter 5 114

When asked to state the most important goal for their
schools, 251 or 30.8% of the principals made increasing aca-
demic achievement the number one goal. It was followed by
the goal of adequately preparing students for college and/or
work (108 or 13.3%). A companion question asked the princi-
pals what they perceived as their roles in achieving their
stated goals. Being a leader ranked highest (254 or 31.2%);
being a facilitator was next (188 or 23.1%).
Principa1s' status and Degrees of Satisfaction in Their
Schools, School Districts and Communities
The majority of the urban high school principals (67%)
believed their job security was good and nearly half (49%)
believed the prestige attached to the position was good.
However, only 28.2% viewed the recognition they received from
central office and/or school boards for achievements as good.
With regard to job satisfaction issues, interaction with
students was rated highest followed by interaction with
teachers, general career satisfaction and helping others
learn.
Nearly half of the principals (49.1%) felt they had met
their goals and 13% indicated they had exceeded their goals.
However, the majority of the respondents (52.3%) believed
they did not have the authority to administer their schools
commensurate with the accountability demands. Only 32.8% of
Chapter 5 115
the urban principals indicated they always interviewed
teachers before they were assigned to their schools and 447
or 54.8% believed their levels of authority to make decisions
concerning their own schools was only "moderate." Only 37
or 4.5% of the principals indicated they had much (as opposed
to some, little, and no) influence on the school districts'
decisions which affect their schools.
Educational Status of Urban Schools and Students
When asked about the students' levels of competency re-
garding basic skills, 5.3% of respondents indicated the stu-
dents' levels of competency were well above average; 18.2%
reported the levels as above average; 44% said average; 27.2%
indicated the levels were below average; and 4% reported
students' levels of competency in basic skills were reported
well below average. However, 67.7% of the principals be-
lieved 80% or more of their students were having their needs
met as their schools currently operated; and the majority of
the urban high school principals (464 or 56.9%) considered
their staffs to be above average.
The principals indicated their communities view the
value of education higher than they rate the public schools.
For example, 14.8% of the principals feel their communities
view the value of education as very positive while only 6.9%
rate public schools to be very positive. In the positive
-Chapter 5 - 116
category, 42.3% of the principals' communities view the value
of education. as positive while only* 33.6% gave an equal
ranking to public schools. When considering that which was
negative, 21.2% of the urban principals' communities rate the
public schools as negative. Yet, only 5% of the communities
view the value of education as negative. In addition, the
respondents indicated 2.1% of the communities considered
public schools to be very negative while none of the commu-
nities were reported as being very negative toward the value
of education.
Urban Principals Professional Development Needs
The respondents, when asked to identify the areas in
.which they would most like to increase their skills and/or
knowledge, rated mastery of new technology highest (11.1%).
Only 68 (8.8%) principals indicated they would like to in-
crease their skills in teacher supervision.l
The respondents indicated all five of the programs they
were asked to rate were of value. This suggests NASSP should
consider conducting all five programs in some manner. The
three programs that were viewed as most helpful (national
recognition program for urban principals, special publica-
tions targeted to urban principals, and national conferences
for urban principals) were also viewed as the least helpful
in terms of percentages. This suggests that while some pro-
Chapter 5 117

grams may be attractive to one group of principals, those
same programs may not be appealing to another group. As a
consequence, the association should pursue a variety of ini-
tiatives designed to reach a broad range of member interests.
In addition, NASSP should frequently evaluate the new pro-
grams regarding their general acceptance by the urban prin-
cipal membership.
Conclusions
This study provides a national profile of the Ihigh
school principals in the nation's one hundred largest cities.
It reports the demographics related to the urban principals;
the demographics of urban schools and the students they
serve; the problems and challenges facing urban high schools;
recommendations for affecting positive change in urban high
schools; the views of their status, authority, job satisfac-
tion and the status of their schools, school districts and
communities; and the professional development needs of urban
high school principals. In addition, this study provides
data that will assist the National Association of Secondary
School Principals in developing programs and activities for
its urban principal membership and all others who may be in-
terested.
The majority of urban high school principals who par-
ticipated in the survey were white males (65.2%) who average
·Chapter 5 . 118
5O years in age. The percentage of black urban high school
principals indicated in this study (26%) is higher than the
3.8% figure that was reported in the National Association of
Secondary School Principals' 1988 national study of high
schools (High School Leaders and Their Schools, 1988) which
included urban, suburban, and rural high schools. The per-
centage of females reported in this study (22.1%) is consid-
erably larger than 12% reported in the same 1988 NASSP
national study. This study reports the responses of 815 ur-
ban high school principals compared with 716 responses to the
earlier (1988) NASSP study.
Women and minority administrators, while greater in
number in urban schools as opposed to rural and suburban
schools, continue to be underrepresented in the nation's high
schools. The majority of the urban high school principals
who participated in the survey were white males (65.2%). The
percentage of black and female urban high school principals
were 26% and 22.1% respectively. Only 53 principals indi-
cated they were Hispanic.
The professional needs of the principals seem relevant
and reasonable. If estimated means were assigned to the five
activities the principals were asked to rate, they would all
be close to 3 on the scale of 1 to 5. Therefore all are
worthy of consideration by the Board of Directors of the Na-
tional Association of Secondary School Principals and the
association's Urban Schools Committee. The principals indi-
Chapter 5 119

cated by their responses that NASSP should conduct programs
and activities that address the unique needs of urban high
school principals. The programs would contribute to the ac-
ceptance and recognition of urban high school principals.
Minority teachers appear not to be adequately repres-
ented in urban schools when compared to urban student popu-
lations. While the overall enrollment of white students in
urban high schools is less than blacks (but more than
Hispanics and Asians) there are considerably more white
teachers working in urban high schools than there are black
teachers. The respondents indicated 39.4% of the schools had
white teaching staffs in the 76 to 99% category. Only 4.2%
of the schools had black staffs that were equally as large.
In addition, 32.5% of the schools had white teaching staffs
in the 51 to 75% category as opposed to only 8.8% of the
schools having black teaching staffs in the same category.
Hispanics, Asians, and American Indians are less represented
than blacks.
Urban high school principals indicated that low student
attendance represents the greatest hindrance to academic
achievement. This conclusion. is drawn from the findings
listed in Table 26. While it would be difficult to argue
against the belief that students cannot be taught if they do
not come to school, the ten factors that followed student
absenteeism in the ranking would suggest there is a tendency
to blame the victims (students, parents and communities) for
Chapter 5 120

less than desirable academic achievement. However, the urban
high school principals' list of factors they believed would
have the most significant impact on raising academic
achievement, indicated a willingness on the part of school
principals to address the barriers to academic achievement.
Factors such as raising staffs' perceptions of student abil-
ities, improved teaching techniques and more effective pro-
grams for at risk students were among the highest ranked
(four of the first seven) suggestions for raising academic
achievement. This suggests that while the principals may
"blame the victims," they are willing to recommend actions
within their control to address the problem of low academic
achievement.
The principals' responses regarding what they would do
with an extra one hundred dollars per student for the next
three years have merit. However, as a write—in item, the
responses did not suggest much creativity on the part of the
principals or interest on the part of the 116 who did not
answer the question. It is possible that they did not un-
derstand the question, have resigned themselves to living
with the problems, or did not grasp the significance of the
amounts of money that would be available to be used at their
discretion. For example, the average sized school with a
1,500 student enrollment would have $450,000 at their dis-
posal for needed programs.
Chapter 5 121
With regard to the students' basic skills competencies,
the respondents considered then: to be average. However,
67.7% of these urban high school principals believe over 80%
of their students are having their needs met. In addition
the majority of the principals (464 or 56.9%) rated their
teaching staffs above average and another 237 or 29.1% con-
sider their staffs average. Ninety-three principals (11.4%)
rated·their staffs outstanding. These findings represent a
conflict and once again hint of blaming the victims. They
also raise the question of the staffs' and principals' ex-
pectations of students. In spite of this, principals believe
their communities look favorably upon public schools but at
a slightly lower level than they value education.
Recommendations
Several recommendations for future research are offered
as an outgrowth of the analysis of this study.I
The discrepancies that exist regarding the principals'
contention that the competency levels of their students are
average yet the students' needs are being met by better than
average teaching staffs, strongly suggests a study that spe-
cifically addresses this issue. Factors such as staff ex-
pectations of students, racism, classism and benign neglect
should be included in such a study.
Chapter 5 122
There is a need to sharpen the focus on the leadership
function of urban high school principals as it relates to
school improvement. There is a need to know if these prin-
cipals understand and accept the importance of their leader-
ship roles. This is critical and should be addressed before
there is greater movement toward site-based management in
some urban schools and/or school districts.
A secondary analysis of the data gathered in this study
that compares responses according to regions, age, sex, race
and principals' length of experience would make a contrib-
ution to the field or urban education.n
In addition, there is a need to determine if there are
differences in urban high schools within given cities. For
example, a comparison of urban schools that have a majority
of white students to schools having black majorities regard-
ing academic achievement, staff expectations, community sup-
port, attendance and rating of teaching staffs. Similar
studies could address the achievement levels of ethnic groups
related to economic level, locations of schools (city versus
inner-city), size of school, size of school districts, and
race of principals.
Recommendations to the National Association of Secondary
School Principals include the following:
1. A national conference for urban principals thataddresses use of modern technology, teachersupervision/evaluation, improving staff expecta-tions of students and strategies for improvingstudent attendance should be planned.
Chapter 5 - 123

2. An urban education column should be publishedmonthly in the NASSP NEWSLEADER.
3. Urban education programs and workshops should be-come regular components of the NASSP national con-vention.
4. At least one monograph that addresses a specificneed or concern in urban education should be pub-lished. For example, one-topic publications thataddress areas such as strategies for improvingstudent attendance, improving students self expec-tations, and increasing parental involvement wouldbe of value.
5. A variety of strategies to increase positive re-cognition of urban high school principals and theirschools should be developed. For example, pub-lishing profiles of individual principals and/ortheir staffs in the NASSP NEWSLEADER would tend toenhance the image of urban educators.
The feasibility of a national urban high school princi-
pal recognition program should be studied. However, this
activity should be approached with caution because of strong
negative responses to this proposal which matched the strong
positive responses.
It is recommended that NASSP collaborate with other or-
ganizations and agencies to recruit women and minorities into
the field of educational administration. Especially among
those teachers who currently serve in urban high schools.
This should be a national initiative that enlists the aid of
higher education institutions in the recruitment and training
efforts.
While there is no intention to suggest that members of
an ethnic or racial group can only be taught by teachers who
Chapter 5 124

are of the same group, it is recommended that NASSP actively
participate in minority teacher recruitment programs and en-
list the aid of the membership in developing local programs.
This effort could include enhancement of Future Teachers of
America programs; college scholarships for minority students
who want to major in education and are willing to teach in
urban high schools upon graduation from college; greater em-
phasis on the field of education by urban high school coun-
selors; and a larger number of magnet high schools for future
educators.
Based on the types of responses provided by the princi-
pals when they were asked what they would do with $100 per
student for three years and the growing national interest in.
site-based management, it is recommended that topics such as
strategic planning, program planning and evaluation, and
preparation of budget be included in NASSP publications tar-
geted for urban high school principals.
Finally, there is a need to continue association efforts
to examine the unique problems facing the urban high school
in America and those who serve as principals in those
schools. The formal appointment of an Urban Schools Commit-
tee represents a first step in addressing those concerns.
Hopefully this document will provide information useful to
the committee as it responds to the challenge of improving
the urban high school.
Chapter 5 125

REFERENCES
Alamprese, J. A., & Brigham, N. (1986). Managing together;Handbook of district and high school practices toyard ex-cellence (p. 43). Washington, DC: Cosmos Corporation.
Alexander, K., Corns, R., & McCann, W. (1969). Publigschool law: Cases and materials (pp. 641-647). St. Paul,MN: West Publishing Company.
Apple, M. W. (1988, August). What reform talk does: Creat-ing new inequalities in education. Educatighal Adminis-tration, 24(3), 272-281.
Blank, R. K. (1986). The rola of pringipal as leader:Analysis of yariation in leadership of urbap highschools. Washington, DC: Cosmos Corporation.
Blank, R. K. (1987). In what areas do prlhcipals proyideschool leadership? Evidence from a National Sample ofUrban High Schools. Arlington, VA: E.R.S. Spectrum.
Boamd of Trustees of the Carnegie Foundation for the Ad-vancement of Teaching. (1988). An imperiled generation:Saying urban schools. Princeton, NJ: Carnegie Foundation.
Boyer, E. L. (1983). High school: A report on secondaryeducation in America. New York: Harper and Row.
Bridges, E. M. (1978). The principalship as a career. InD. A. Erickson, & T. L. Reller (Eds.), The principal inmetropolitan schools (pp. 1-21). Berkeley, CA: McCutchanPublishing Company.
Chicago schools: Worst in America. (1988). ChicagoTribune.
Clarke, K. (1971). Education in the ghetto: A human con-cern. In H. Passow (Ed.), Urban education in the l970s(pp. 94-96). New York: Columbia University Teachers Col-lege Press.
Commission on Minority Participation in Education and Ameri-can Life. (1988). One third of a nation. Washington,DC: American Council on Education.
Conant, J. B. (1961). Slums ang suburbs. New York:McGraw-Hill.
References 126

Converse, J. M., & Presser, S. (1986). Suryey gpestions:Hahdggaftihg the standardized ghestionnaire, BeverlyHills, CA: Sage Publications.
Council of Great City Schools. (1987). Challehges to ugbaheducation: Results in the making. Washington, DC, p. 1.
Darling-Hammond, L. (1985). Egaality and excellence: Theeducational status of black Americans. New York: CollegeBoard.
Denver Public School System. (1989). Denyer public schoolsstrategic plan. Denver, CO.
Edmonds, R. (1979, October). Effectiye schogls for the gg-hah poor (pp. 15-24). ASCD Educational Leadership.
Education Research Association. (1988). Handbook of' re-search on educational administration. N. J. Boayan (Ed.),New York: Longman,
Eubanks, E. E., & Levin, D, U. (1987). Administratiye angorganlzational arrangements and considerations ini chil-dren America's challenge (pp. 19-41). Washington, DC: TheBureau of Educational Research, School of Education,Howard University.
Gallagher, K, S. (1988-89). Changing school goals: Lessonsfor a high school principal. National Forum of Educa-tional Administration and Superyision Journal, p. 117.
Goodlad, J. I. (1984). A place called school: Prospegts fo;the future. New York: McGraw Hill, _
William T. Grant Foundation Commission on Work, Family andCitizenship. (1988, January). The forgotteh half: Noh-College youth in America. An Interim Report on theSchool-to-work Transition.
Havighurst, R, J, (1971). Public education for disadvan-taged urban minorities. In H. Passow (Ed.), Urban Educa-tion for the 1970s (pp. 46-60). New York: ColumbiaTeachers College Press.
Hodgkinson, H. L. (1985). All one system. Washington, DC:Institute for Educational Leadership.
Hunt, T. (1976). The schooling of immigrants and blackAmericans: Some similarities and differences. The Jour-nal of Negro Education, §5(4), pp. 423-31.
References 127
Johnson, F. (1989). Assigning type of locale codes to thslQ87-88 CCD public school uniyerse: Technlcal repprt.Washington, DC: National Center for Educational Statis-tics, U. S. Department of Education, p. 6.
Kaestle, C. F. (1973). The eyolution of an urban schoolsystem: Ney York City, 1750-1850 (p. 94). Cambridge, MA:Harvard University Press.
Kaestle, C. F. (1983). Pillars of the republic: Commgnschools and American soclety, l780-l860. New York: Hilland Wang.
Kerlinger, F. N. (1973). Foundations of behayiprslresearch. New York: Holt, Rinehart and Winston.
Kozol, J. (1970, January-February). In H. Passow (Ed.).,Roxbnry, yay out of a fortress. Think, 36. Urban Educa-tion in the 1970s. New York: Columbia Teachers College.
Kozol, J. (1989, January). A report card on schools after20 years. Ann Arbor, MI: The Education Digest.
Lehman, E. C. (1963). Tests of significance and partialreturns to mail questionnaires. Rural Sociology, MontanaState University, 28, pp. 284-289.
Levin, H. M. (1971). Why ghetto schools fail. In Currentreadings in urban education. Compiled by R. R.Heidenreich. Arlington, VA: College Readings, Inc.,273-278.
Lezotte, L., et al. (1980). School learning climate angstudent achieyement. Tallahassee, FL: Florida State Uni-versity. ,
Lightfood, A. (1978). Urban education in soclalperspectiye. Chicago: Rand McNalley College Publishing.
Maeroff, G. (1988, May). Withered hopes, stillborn dreams:The dlsmal panorama of urban schools. Phi Delta Kappan.
National Association of Secondary School Principals. (1988).School based management: A strategy for better learning.Reston, VA: NASSP.
National Commission on Excellence in Education. (1983). Anation at risk: The imperatiye for educatlonal reform.Washington, DC: U. S. Printing Office.
References - 128
New Jersey Education Association. (1987). The Urban Chal-lghge. Trenton, NJ: NJEA.
Oakes, J. (1987). Improying inner—city schools: Currentdirections in urban district reform. Santa Monica, CA:Rand Corporation.
Passow, A. H. (Ed.), (1971). Urban Education in the 1970s.In Qpban Education in the l970s (pp. 1-45). New York:Columbia Teachers College Press.
Pellicer, L. O., et al. (1988). High school leaders andtheir schools, Volume I: A national profile. Reston, VA:National Association of Secondary School Principals.
Peters, T. J., & Waterman, R. H., Jr. (1985). In search ofexcellehce: The leadership difference. New York: RandomHouse.
Rutter, M., Maughan, B., Mortimore, P., & Ouston, J. (1979).Fifteeh thousand hours: Secondary schools and their ef-fects <n1 children. Cambridge, MA: Harvard UniversityPress.
Sizer, T. R. (1984). Horace's compromise: The dilemma ofthg Amerigah high school. Boston, MA: Houghton Mifflin.
Steinberg, A., & Astrein, B. (1987, May). A conyersatighgigh high school principals. Cambridge, MA: Harvard Uni-versity Principals Center.
School-Based Management Task Force. (1988). School basegmanagement: A sprgtegy for bette; learning. Reston, VA:NASSP.
Tyack, D. B. (1974). The one best system: A history gfAmerigah grhan gdugatiog. Cambridge, MA: Harvard Press.
Usdan, M. D. (1984). New trends in urban demography. Edg-cagioh ggg Qpbah Sociepy, l§, 399-414.
U. S. Bureau of the Census. (1987). One hundred most popu-lated cities ranked by July 1, 1984 estimated. WphlgAlmahgc (pp. 223-224). New York: Pharos Books.
U. S. Department of Education. (1984). A nation responds:Eecent efforts to improye education. Washington, DC: U.S. Government Printing Office.
References 129

Weinberg, G. H., & Schumaker, J. A. (1969). Statistics: Apjntuitiye approach (2nd ed.) (pp. 4-5). Belmont, CA:Brooks/Cole Publishing Company.
Yin, R. K., & White, L. J. (1986, September). Managing forexcellence in urban high schools: District and schoolroles. Washington, DC: Cosmos Corporation.
References 130

AEPENDI; A. CITIES THAT CONTAIN THE POPULATION SURVEYED
QLAAGEST 100 CITIES IN THE UNITED STATES)
Appendix A. Cities That Contain the Population Surveyed(Largest 100 Cities in the United States) 131
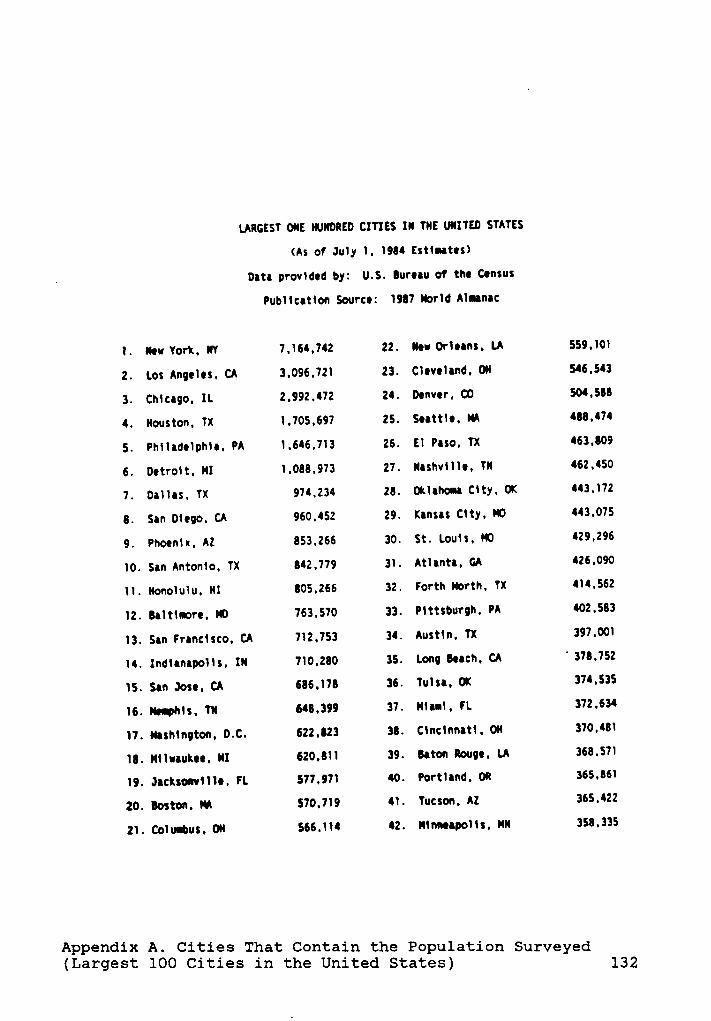
LARGEST ONE NUNDRED CITIES IN TNE UNITED STATES
(As of July 1, 1984 Estlnatesl
. Data provlded by: U.S. Bureau of the Cansus
Publlcatlon Source: 1987 Norld Alnanac
1. Neu York, NY 7,164,742 22. Neu Orleans, LA 559,101
2. Los Angeles, CA 3,096,721 23. Cleveland, ON 546,543
3. Chlcago, IL 2,992,472 24. Denver, CO 504,588
4. Nouston, TX 1,705,697 25. Seattle, NA 488,474
5. Phlladelphla, PA 1,646,713 26. E1 Paso. TX 463,809
6. Detrolt, NI 1,088,973 27. Nashvllle, TN 462,450
7. Dallas, TX 974,234 28. Oklahoma Clty, OK 443,172
8. San Dlego, CA 960,452 29. Kansas Clty, NO 443,075
9. Phoenlx, AZ 853,266 30. St. Louls, NO 429.296
10. San Antonio, TX 842,779 31. Atlanta, GA 426,090
ll. Nonolulu, NI 805,266 32. Forth North, TX 414,562
12. Baltimore, ND 763,570 33. Pittsburgh, PA 402,583
13. San Francisco, CA 712,753 34. Austin, TX 397,001
14. Indianapolis, IN 710,280 35. Long Beach, CA ' 378,752
15. San Jose, CA 686,178 36. Tulsa, OK 374,535
16. Nenphls, TN 648.399 37. Nlanl, FL 372.634
17. Nashlngton, D.C. 622,823 38. Clnclnnatl, ON 370,481
18. Nlluaukee, NI 620,811 39. Baton Rouge, LA 368,571
19. Jacksonville, FL 577,971 40. Portland, OR 365,861
20. Boston, NA 570,719 41. Tucson, AZ 365,422
21. Colunbus, ON 566,114 42. Nlnneapolls, NN 358,335
Appendix A. Cities That Contain the Population Surveyed(Largest 100 Cities in the United States) 132
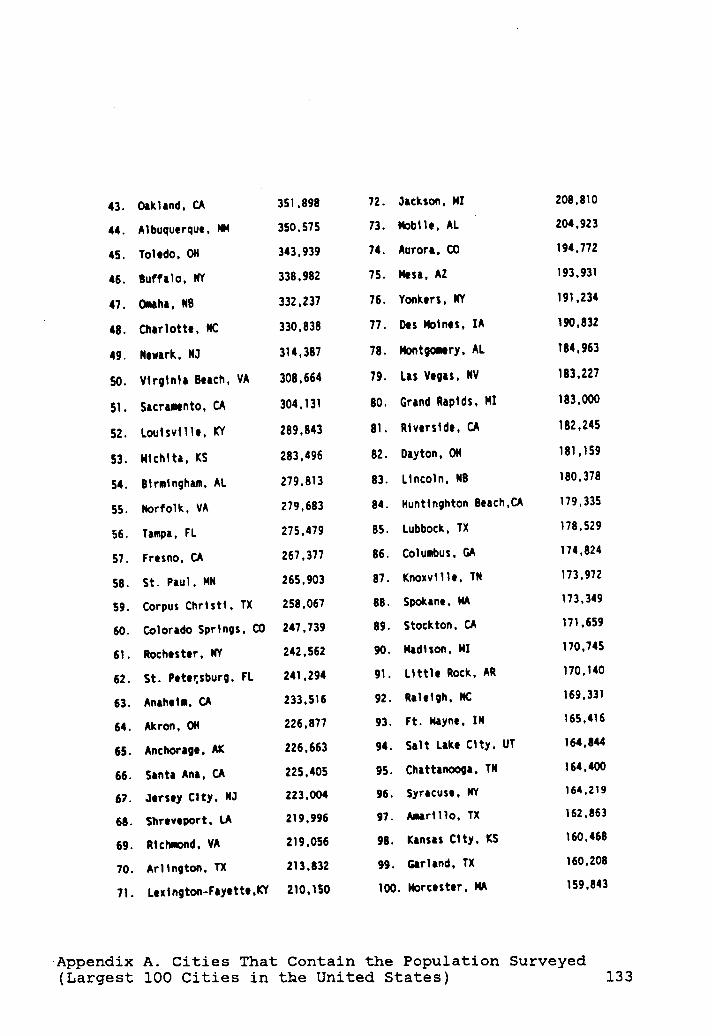
43. Oakland, CA 351,898 72. Jackson, NI 208,810
44. Albuquerque, NM 350,575 73. Noblle, AL· 204,923
45. Toledo, ON 343,939 74. Aurora, CD 194,772
46. Buffalo, NY 338,982 75. Nesa, AZ 193,931
47. Omaha, NB 332,237 76. Yonkers, NY 191,234
l48. Charlotte, NC 330,838 77. Des Nolnes, IA 190,832
49. Newark, NJ 314,387 78. Nontgonery, AL 184,963
50. Vlrglnla Beach, VA 308,664 79. Las Vegas, NV 183,227
51. Sacramento, CA 304,131 80. Grand Raplds, NI 183,000
52. Loulsvllle, KY 289,843 81. Rlverslde, CA 182,245
53. Nlchlta, KS 283,496 82. Dayton, ON 181,159
54. Blrmlngham, AL 279,813 83. Lincoln, NB 180,378
55. Norfolk, VA 279,683 84. Nuntlnghton 8each,CA 179,335
56. Tampa, FL 275,479 85. Lubbock, TX 178,529
57. Fresno, CA 267,377 86. Columbus, GA 174,824
S8. St. Paul, NN 265,903 87. Knoxvllle, TN 173,972
59. Corpus Christl, TX 258,067 88. Spokane, NA 173,349
60. Colorado Springs, CO 247,739 89. Stockton, CA 171,659
61. Rochester. NY 242,562 90. Nadlson, NI 170,745
62. St. Petersburg, FL 241,294 91. Llttle Rock, AR 170,140
63. Anaheln, CA 233,516 92. Raleigh, NC 169,331
64. Akron, DN 226,877 93. Ft. Nayne, IN 165,416
65. Anchorage, AK 226,663 94. Salt Lake Clty, UT 164,844
66. Santa Ana, CA 225,405 95. Chattanooga, TN 164,400
67. Jersey City, NJ 223,004 96. Syracuse, NY 164,219
68. Shreveport, LA 219,996 97. Anarlllo, TX 162,863
69. Richmond, VA 219,056 98. Kansas Clty, KS 160,468
70. Arlington. TX 213,832 99. Garland, TX 160,208
71. Lexington-Fayette,KY 210,150 100. Norcester, MA 159,843
·Appendix A. Cities That Contain the Population Surveyed(Largest 100 Cities in the United States) 133
APPENDQX B. LETTER AND PRELIMINARY QUESTIONNAIR§_
Appendix B. Letter and Preliminary Questionnaire 134

The National Association ot Secondary School Principals1904 Association Drive • Raston. Virginia 22091
• Tel: 703-060-0200_”
February 19, 1988
Hr. Willie R. Gentry, PrincipalUorthing Senior High School9215 ScottHouston, TX 7705l
Dear Hillie:
NASSP, through its Office of Urban Services, plans to conduct a
national study of urban high school princlpals. In order to develop a survey
instrument that is relevant and capable of drawing national attention to the
needs and concerns of urban high school principals, I am asking you to assist
me in developing the questionnarie.
Here is the plan:
l. l am asking you to list what you consider to be the five greatest
educational needs that exist in your school. (See attached form)
2. List what you believe to be the five most important national
issues urban high school principals should be concerned about now
and in the future. (See attached form)
3. Define the words 'urban' and 'urban high school'.
4. I will compile master lists nf the school•1evel needs and those
issues identified as being important concerns for urban educators
in general.
5. I will send you ny compilations and ask you to rate them based on
what you consider to be the most important to that which you
believe to have the least importance.
6. After receiving your ratings, l will develop a survey instrunent
that will reflect the iput made by you and nineteen other urban
principals from across the nation.
7. There is a possibility 1 will seek your opinion of the instrument
prior to mailing it to a sample of principals.
Servmg all Ac-unistvators in Middle Level and High School Education
Appendix B. Letter and Preliminary Questionnaire 135

Hr. Uillie Gentry, Principal -2-February 19, 1988
Please rest assured that all of your responses will be treated in a
confidential nanner. Thus, please feel free to be as candid as possible.
Upon coupletion of the study, I will be pleased to send you a copy of
the sununry of the research.
You and the other nineteen urban high school principals who have been
chosen to participate in the initial stages of this study have an opportunity
to help set the focus of what I hope will be a significant contribution to the
profession.
Your willingness to participate in this research activity will be
deeply appreciated. I look forward to receiving your first response at your
earliest convenience, and I wish you the very best in all of your endeavors.
Sincerely,
Santee C. Ruffin, Jr.Director of Urban Services
SCR:ab
Attachments
Appendix B. Letter and Preliminary Questionnaire 135
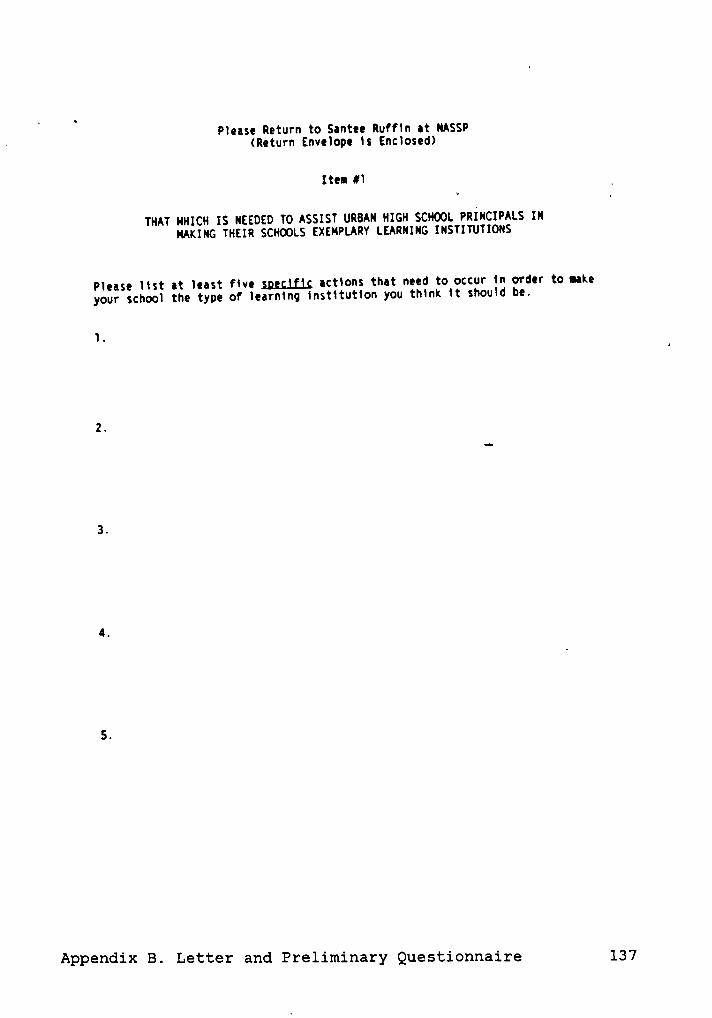
~ Please Return to Santee Ruffln at NASSP· (Return Envelope ls Enclosed>
Item #1 _
THAT NHICH IS NEEOEO TO ASSIST URBAN HIGH SCHOOL PRINCIPALS INHAKING THEIR SCHCDLS EXENPLARY LEARNING INSTITUTIONS
Please list at least flve ;g_e_gj_ü_; actlons that need to occur ln order to nake
your school the type of learning lnstltutlon you thlnk lt should be.
l.
2.
3.
4.
5.
Appendix B. Letter and Preliminary Questionnaire 137
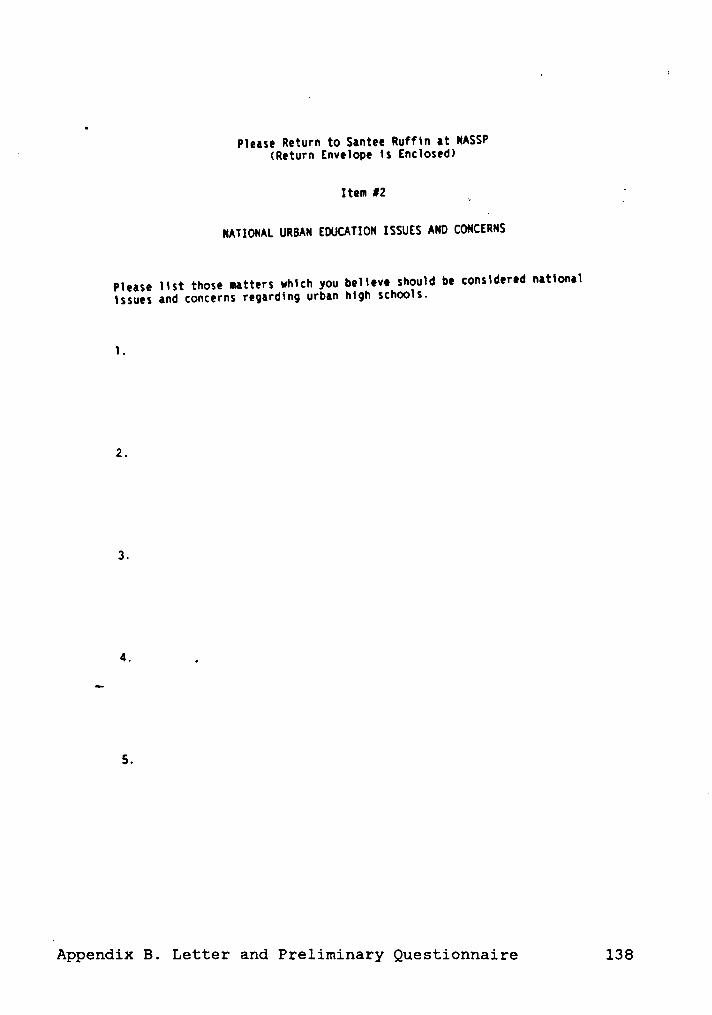
_ Please Return to Santee Ruffln at NASSP(Return Envelope ls Enclosed)
Item #2 gr ~
NATIONAL URBAN EDUCATION ISSUES AND CONCERNS
Please llst those matters vhlch you belleve should be considered nationallssues and concerns regarding urban high schools.
l.
2.
3.
4. _
i
Appendix B. Letter and Preliminary Questionnaire 138

UPlease Return to Santee Ruffln at NASSP
~(Return Envelope ls Enclosed)
Item #3 A
DESCRIPTIONS/DEFINITIONS OR 'URBAN° AND 'URBAN H1GN SCNOOL'
1. Please deflne/descrlbe what the word 'urban' neans to you. Please limlt
your response to space provided below.)
2. Please define/descrlbe what you believe ls an 'urban hlgh school'.
Append1x B. Letter and Preliminary Questionnaire 139
AEEENQIX C. LETTEB AND QUESTIONNAIRE REGARDING INSTRUMENI
VALIDAT;0N
Appendix C. Letter and Questionnaire RegardingInstrument Validation 140

SIVEY IEACTIG Füll
l. Mou long dld lt take you to talete the survey forn?
______,nlnut•s
2. Please list (by nueberl those ltens you found to be adslquous and/ov
awkuardly norded and lndlcate why you believe then to be so.
3. Please list Itens you do not understand and lndicate why
4. Please llst those ltens you believe should be deleted and state why
Appendix C. Letter and Questionnaire RegardingInstrument Val1dation 141
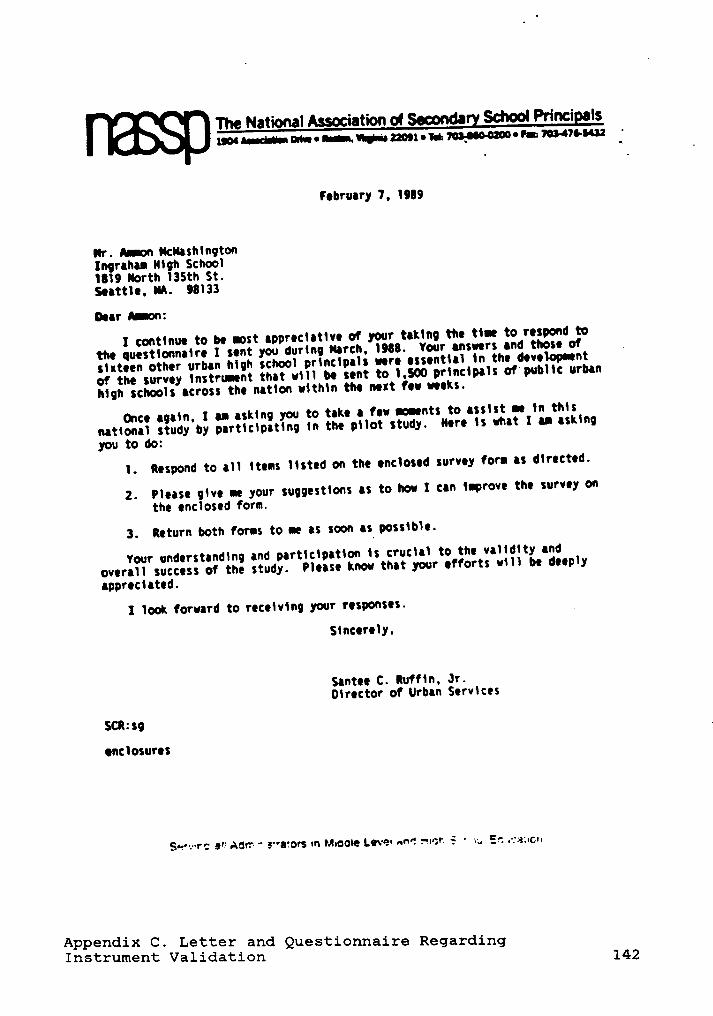
The National Association of Secondary School Princigls1so•a¤•ann•¤nw••n•n¤cIhynnzz¤•x•1w¤1ba•oo¤o¤•P•¤1oe•1•a•sz ·
February 7, ISU9
Nr. Ain NcllashlngtonIngrahan Nlgh Schooll8l9 North l35th St.Seattle, NA. 98l33
Dear Annonc
I continue to be wost appreclatlve of your taking the tlne to respond to
the guestlonnalre I sent you durlng Narch, l9ß8. Your answers and those of
slxteen other urban high school prlnclpals were essential in the developeent
of the survey lnstrunent that will be sent to l,SO0 prlnclpals of public urban
high schools across the nation wlthln the next few weeks.
Once agaln, I an asklng you to take a few woeents to asslst ee ln this
national study by partlclpatlng ln the pilot study. Nere ls what I an asklng
you to do:
l. Respond to all Items llsted on the enclosed survey forn as dlrected.
2. Please glve ne your suggestions as to how I can leprove the survey on
the enclosed form.
3. Return both forns to ee as soon as possible.
Your understanding and partlclpatlon ts cruclal to the valldlty and
overall success of the study. Please know that your efforts will be deeply
appreclated.
I look forward to recelvtng your responses.
Slncerely,
Santee C. Ruffln, Jr.Director of Urban Services
SCR:sg
enclosures
Sw-.-·r: av Adr: * s•·a1ors in M•¤o•e Levei mc rich S ·i, in ,·_-3;-;;.
Appendix C. Letter and Questionnaire R d'
Instrument Validationegar lng
142
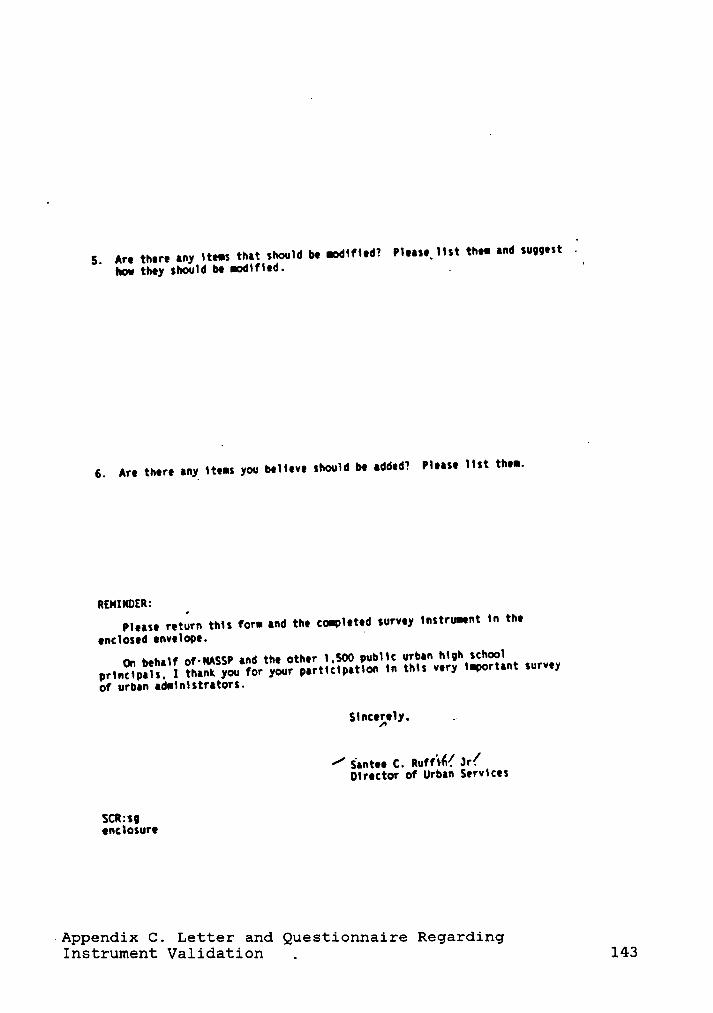
5. Are there any itens that should be nodlfied? Please_l\st then and suggest .
hou they should be nodlfled. _ .
6. Are there any itens you believe should be added? Please llst then.
REMINDER:
Please return this forn and the conpleted survey instrunent ln the
enclosed envelope.‘
On behalf of-NASSP and the other l,S00 public urban hlgh school
prlncipals, I thank you for your participation ln this very lnportant survey
of urban adnlnlstrators.
Slncegely, -
/ sum c. nurr'+6( ar!Director of Urban Services
SCR:sgenclosure
«Appendix C. Letter and Questionnaire RegardingInstrument Val1dat1on
_ 143
APPENQIX D, LETTER AND FINAL VERSION OF QUESTIONNAIRE
Appendix D. Letter and Final Version of Questionnaire 144
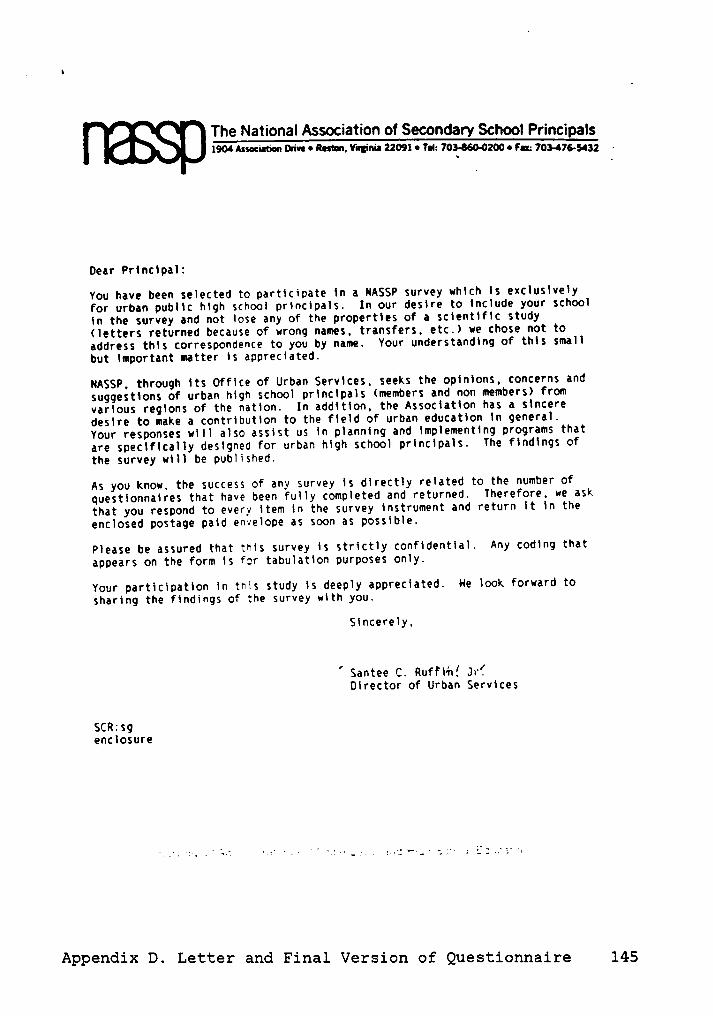
_ \
The National Association of Secondary School Principals1904 Association Give • Resten, Virginia 22091 • Tel: 703-060-0200 • Fu; 703-476-5432 ·
Dear Principal:
You have been selected to partlcipate in a NASSP survey which ls excluslvely
for urban public hlgh school prlnclpals. In our deslre to include your school
ln the survey and not lose any of the properties of a sclentlflc study
(letters returned because of wrong names, transfers, etc.) we chose not to
address thls correspondence to you by name. Your understanding of this small
but important matter ls appreclated.
NASSP, through lts Office of Urban Servlces, seeks the oplnions, concerns and
suggestions of urban hlgh school prlnclpals (members and non members) from
various regions of the nation. In addition, the Association has a slncere
deslre to make a contribution to the field of urban education ln general.
Your responses will also asslst us ln planning and lmplementlng programs that
are speclflcally designed for urban high school prlnclpals. The flndlngs of
the survey wlll be published.
As you know, the success of any survey ls directly related to the number of
questionnalres that have been fully completed and returned. Therefore, we ask
that you respond to every item in the survey instrument and return it in the
enclosed postage paid envelope as soon as possible.
Please be assured that this survey is strictly confidentlal. Any coding that
appears on the form ls for tabulation purposes only.
Your participation in this study ls deeply appreciated. He look forward to
sharing the flndings of the survey with you.
Slncerely,
’Santee C. Rufflhf Jr?Director of Urban Services
SCR:sgenclosure
Appendix D. Letter and Final Version of Questionnaire 145
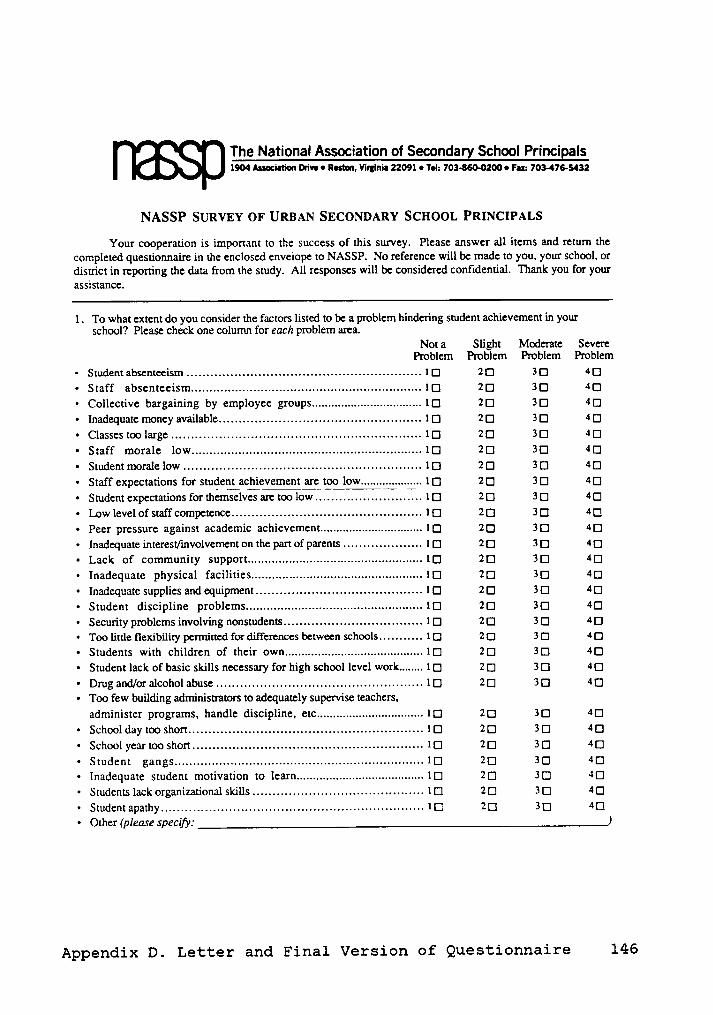
The National Association of Secondary School Principals1904 Association onva • Rostnn, Vlaglnia 22091 • Tai: 703460-0200 • Fax: 703-476-5432
NASSP SURVEY OF URBAN Sacomoanv SCHOOL PRINCIPALS
Your cooperation is important to the success of this survey. Please answer all items and retum thecompleted questionnaire in the enclosed envelope to NASSP. No reference will be made to you, your school, ordistrict in reporting the data from the study. All responses will be considered confidential. Thank you for yourassistance.
l . To what extent do you consider the factors listed to be a problem hindering student achievement in yourschool'? Please check one column for each problem area.
Not a Slight Moderate SevereProblem Problem Problem Problem
• Student absenteeism ........................................................... I Q 2 Q 3 Q 4 Q
·Staff absenteeism............................................................... IQ 2Q 3Q 4Q
• Collective bargaining by employee groups.................................. IQ 2 Q 3 Q 4 Q• Inadequate money available................................................... 1 Q 2 Q 3 Q 4 Q• Classes too large ............................................................... IQ 2 Q 3 Q 4 Q• Staff morale low................................................................ IQ 2 Q 3 Q 4 Q• Student morale low ............................................................ IQ 2 Q 3 Q 4 Q• Staff expectations for student achievement are too low.................... IQ 2Q 3Q 4Q• Student expectations for themgelvesare too IQ 2 Q 3 Q 4 Q• Low level of staff competence................................................ I Q 2 Q 3 Q 4 Q•
Peer pressure against academic achievement................................ IQ 2Q 3 Q 4Q• Inadequate interest/involvement on the part of parents .................... I Q 2 Q 3 Q 4 Q• Lack of community support................................................... IQ 2Q 3 Q 4Q• Inadequate physical facilities.................................................. IQ 2 Q 3 Q 4Q• Inadequate supplies and equipment.......................................... I Q 2 Q 3 Q 4 Q• Student discipline problems................................................... IQ 2Q 3 Q 4Q• Security problems involving nonstudents................................... I Q 2 Q 3 Q 4 Q• Too little flexibility permitted for differences between schools........... IQ 2 Q 3 Q 4 Q
·Students with children of their own.......................................... IQ 2 Q 3 Q 4Q
• Student lack of basic skills necessary for high school level work........ IQ ZQ 3 Q 4Q• Drug and/or alcohol abuse .................................................... I Q 2 Q 3 Q 4 Q• Too few building adminisuators to adequately supervise teachers,
administer programs, handle discipline, etc................................. IQ 2Q 3 Q 4 Q• School day too short........................................................... I Q 2 Q 3 Q 4 Q• School year too short.......................................................... IQ 2 Q 3 Q 4 Q• Student gangs................................................................... IQ 2Q 3Q 4Q• Inadequate student motivation to learn....................................... IQ 2 Q 3 Q 4Q•
Students lack organizational skills........................................... I Q 2 Q 3 Q 4 Q• Student apathy.............................................,.................... I Q 2 Q 3 Q 4 Q• Other (pleare specüy: )
Appendix D. Letter and Final Version of Questionnaire 146

2. IrI your opinion, which three of the following would have the most significant impact on raising the academicachievement of students in your school? (Please check na more than three.)IQ Raise student perceptions of their own abilitiesIQ Raise staff perceptions of student abilitiesIQ Raise parental perceptions of student abilitiesIQ More effective programs for at-risk studentsIQ Improved teaching techniquesIQ Increase parental involvement in student educationIQ Decrease ir1 time allocated to noninsuuctional activities during the school dayIQ Removal of disruptive students from classesIQ Increase in level of assistance provided to farnilies for welfare needs such as food and shelterIQ Greater emphasis on basic skillsIQ Increase school securityIQ Removal of ineffective teachersIQ More suingent requirements for grade promotionIQ Provision ofday care facilities for children of studentsIQ Assign more homeworkIQ Increase the length of time that school facilities and staff are available to students after the regular dayIQ Improvement in quality and/or quantity of instructional materialsI Q Increase the financial resources available to educationIQ Allow more autonomy for building principalsIQ Other (please specüy: I
3. If you were provided with an extra $100 per student for each of the next three years, with the allocation ofthese funds at your discretion, what would be your highest priority for the use of these ftmds?
4. How would you describe your current position as principal in terms of the following factors. Please checkone column for each factor.
Good Fair Poor• Satisfaction involved with helping others to learn........................................ I Q 2Q 3 Q• General career satisfaction ..................................................................I Q 2 Q 3 Q•Interaction with students ....................................................................IQ 2Q 3Q• Interaction with teachers.....................................................................IQ 2Q 3Q• Interaction with parents......................................................................IQ 2Q 3 Q• Salary..........................................................................................I Q 2Q 3 Q• Job security...................................................................................IQ 2Q 3Q• Prestige attached to the position............................................................I Q 2Q 3 Q
·Working environment.......................................................................I Q 2 Q
”3Q
·Daily schedule................................................................................IQ 2 Q 3 Q• Recognition from central office and/or school board for achievements................ IQ 2Q 3 Q• Increase in personal knowledge and skills................................................I Q 2 Q 3Q• Other (please specüßt: I
STATUS QUESTIONS -- PERSONAL AND PROFESSIONAL CHARACTERISTICS
5. What is your age? years 7. What is your gender?
6. With which racial or ethnic group would you IÜ Mak 2 Ü Fcma-icid°mlf}' Y°“*’$¢lF? 8. What is the highest college degree you hold?IÜ www IQ Bachelor's degree2Ü Black _ 2Q Master's degree3 Ü H*$Pam¢ 3 Q 6-year certificate4 Ü AITl€I'lCHl'l Illdlan 4 Ü Dgcggyal dggyggSQ Asian6Q Other
Appendix D. Letter and Final Version of Questionnaire 147
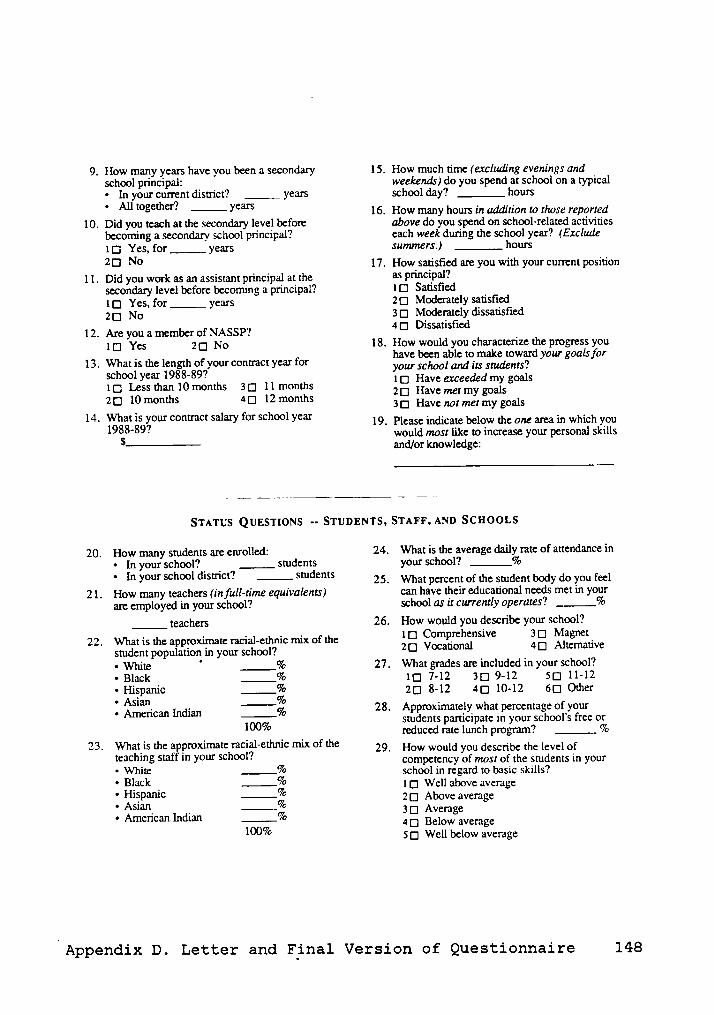
9. How many years have you been a secondary 15. How much time (excluding evenings undschool principal: weekend:) do ou spend at school on a icalY [YP• In your cun·ent district? years school day? hours• 7Au Ö°g°[hcr' ·‘· years 16. How many hours in addition to those reported
10. Did you teach at the secondary level before above do you spend on school-related activitiesbecoming a secondary school principal? each week during the school year? (Exclude1 Q Yes, for years summer:.) hours
2 Ü Ne 17. Howsatisüed are you with your current position
11. Did you work as an assistant principal at the @5 P¤¤¢IPal?secondary level before becoming a principal? 1 Q Satrstied1 Q Yes, for years 2 Q Moderately satistied2 Q No 3 Q Moderately dissatisfied
12. Are you a member or NASSP? "Ü D¤sss¤s“=s
1Q Yes 2 Q No 18. How would you characterize the progress you
ls Wjw js es *jggg¤8<g„v<>·¤ www vw wÄÖÜscoo year — .1Q Less than 10 months 3Q ll monthsgg:2Q
10mont.hs 4Q 12 months am Have mimcimv goais14 sswv m S°"°°‘ y°a’ 19. Prease indicate berow the one area in which you
s‘ would most like to increase your personal skills
——*—— and/or knowledge:
STATUS QUEST10NS -- STUDENTS, STAFF, AND ScH00r.s
20. How many students are enrolled: 24. What is the average daily rate of attendance in• In your school? students your school? %
'n‘ y°“’ S°"°°‘ ‘aS‘a°‘? ——- S“"m“S 25. What pereeut or the student body do you feel
21. How many teachers (infull-time equivalents) can have their educational needs met in yourare employed in your school? school as it currently operates? %
teachers 26. How would you describe your school?
22. What is the approximate meier-erhuro mix or the‘Ü
C°‘“P.’°*‘°“S"’° S Ü Ma€“°‘.
student population in your school? ZÜ V°eaa°nal 4 Ü Anemaave• White ° % 27. What grades are included in your school?• Black ___? 1Q 7-12 3Q 9-12 5Q 11-12• Hispanic __ 6 2Q 8-12 4Q 10-12 6Q Other. · <7_
äägican Indian lr}; 28. Approximateily what percentage ofiyourTina, students partrcrpate rn your school s free or
° reduced rate lunch program? %
23. What is the approximate racial-ethnic mix of the 29· How would you descnbc [hc Icvci Ofteaching Same ‘n your Scnccla competency of most of the students in your° gb? i-? school in regard to basic skills?° **-9
—— 0 W ll bo·w-pm ..% QS3 Q Average
mencan an ———° 4Q Below average
100% S Q Well below average
Appendix D. Letter and Final Version of Questionnaire 148

30. How would you rate your teaching staff? 36. Please check below the statement that bestrg Qutstandjng describes your authority over the selection ofgc] Above average teachers for your school. (Check ONE.)3 El Average IÜ Have primary authority for hiring4 Q Below average 2Q Share authority with central office5 Q Poor 3 Q Have little or no authority
31. Are there any assistant principals assigned to 37. Do you have the opportunity to interviewyour school? prospective teachers before assignment to yourIQ Yes (how many: l 2Q No school?
32. In what state is your school located? l El Yss- always ZE! Yss- ¤s¤ally 3 ¤ Na——— 38. In general is the authority to run your school____givento you by the school board and central
33- Wllatls das apvwxlmaw ¤¤r>¤la„g¤¤¤ al als my aamlhraa-aaah th haiahee with the degree talll Wlllch Y°lll s°ll°°l ls l°°al°d· which you are held responsible when things go————-— wrong?
34. How would you describe the general attitude in IQ Yes 2l] Noy°-T wmm-mty www-d [-C: 39. How much influence do you think you have on
· Public schools school dlstrict decisions that affect secondary1Q Very positive schools and secondary education?2Q Positive IQ Much influence 3Q Little influence3 Q Average 2Q Some influence 4 Q No influence4 Ü N°ga°"° _ 40. What one goal do you consider most important5 Ü V°lY ll°gall"° for your school and its students?
• Value ofeducationig Very positive2QPositive3Q
Average4Q Negative5 g Vety negative What do you see as your role in achieving this
·>35. How would you describe the level ofauthority
go---
that principals in your district have tomakedecisionsconceming their ownschools?1
Q High 3 Q Low2Q Moderate 4Q None
NASSP PROGRAMS FOR URBAN PRINCIPALS
41. NASSP would like some input from you as to programs that might benefit urban principals. Please rank thefive types of programs listed below from 5 (most helpful) to 1 (least helpful) using each rank number onlyonce._ Conducting national conferences and workshops for urban high school principals_ Providing an urban education column in NASSP's newsletter___ Conducting urban education sessions at the annual NASSP convention__ Producing special publications targeted to the needs of urban principals_ Conducting a national recognition program for urban secondary school principals
42. Do you have any suggestions for other programs that could be instituted by NASSP?
Please return to: NASSP URBAN PRINCIPALS SuRvr~:v1904 Association Drive • Reston, Virginia 22091
Appendix D. Letter and Final Version of Questionnaire 149
APPENDIX E. FOLLOw—UP LETTEB TO NON-RESPONDENTS
Appendix E. Follow-up Letter to Non-Respondents 150
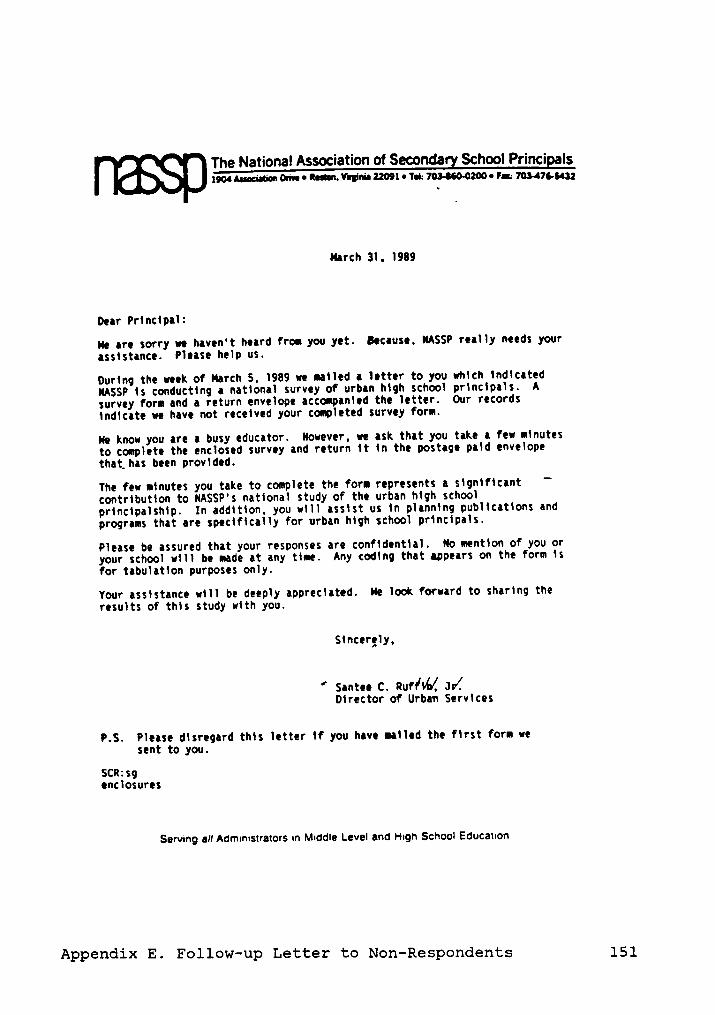
The National Association of Secondary School PrinciglsI904Aaa•ciaüen¤i•e•R•¤tt.V'¤1•¤ia2209I•T•I; 703460-02D0•F¤; 703476-$032
Harch 31. 1989
Dear Prlnclpal:
He are sorry we haven't heard from you yet. Because, HASSP really needs your
assistance. Please help us.
Durlng the week of March 5, 1989 we malled a letter to you which lndlcated
HASSP ls conductlng a national survey of urban hlgh school prlnclpals. A
survey form and a return envelope acconpanled the letter. Our recordslndlcate we have not received your completed survey form.
He know you are a busy educator. However, we ask that you take a few minutesto complete the enclosed survey and return lt tn the postage pald envelopethat_has been provided.
The few minutes you take to complete the form represents a slgnlflcant‘
contrlbutlon to NASSP's national study of the urban hlgh schoolprtnclpalshlp. In addition, you wlll asslst us ln planntng publications and
programs that are speclflcally for urban high school prtnclpals.
Please be assured that your responses are confldentlal. No mentlon of you or
your school wlll be made at any tlme. Any coding that appears on the form ls
for tabulatlon purposes only.
Your assistance wlll be deeply appreclated. He look forward to sharing the
results of thls study with you.
Slncerely,
’Santee C. Ruffvb( Jv(Director of Urban Services
P.S. Please dlsregard thls letter lf you have malled the flrst form wesent to you.
SCR:sgenclosures
Serving all Administrators in Middle Level and High School Education
Appendix E. Follow—up Letter to Non-Respondents 151

Related Documents