Please cite this paper as: de Mello, L. (2008), "Avoiding the Value Added Tax: Theory and Cross-Country Evidence", OECD Economics Department Working Papers, No. 604, OECD publishing, © OECD. doi:10.1787/242167601452 OECD Economics Department Working Papers No. 604 Avoiding the Value Added Tax THEORY AND CROSS-COUNTRY EVIDENCE Luiz de Mello * JEL Classification: C70, E62, H26 * OECD, France

Welcome message from author
This document is posted to help you gain knowledge. Please leave a comment to let me know what you think about it! Share it to your friends and learn new things together.
Transcript
Please cite this paper as:
de Mello, L. (2008), "Avoiding the Value Added Tax:Theory and Cross-Country Evidence", OECD EconomicsDepartment Working Papers, No. 604, OECD publishing,© OECD.doi:10.1787/242167601452
OECD Economics DepartmentWorking Papers No. 604
Avoiding the Value AddedTax
THEORY AND CROSS-COUNTRY EVIDENCE
Luiz de Mello*
JEL Classification: C70, E62, H26
*OECD, France

Unclassified ECO/WKP(2008)12 Organisation de Coopération et de Développement Économiques Organisation for Economic Co-operation and Development 14-Apr-2008
___________________________________________________________________________________________
_____________ English - Or. English ECONOMICS DEPARTMENT
AVOIDING THE VALUE ADDED TAX: THEORY AND CROSS-COUNTRY EVIDENCE
ECONOMICS DEPARTMENT WORKING PAPER No. 604
By
Luiz de Mello
All Economics Department Working Papers are available through OECD's Internet Web site at:
http://www.oecd.org/eco/Working_Papers
JT03244074
Document complet disponible sur OLIS dans son format d'origine
Complete document available on OLIS in its original format
EC
O/W
KP
(2008)1
2
Un
classified
En
glish
- Or. E
ng
lish
ECO/WKP(2008)12
2
ABSTRACT/RESUME
Avoiding the value added tax: Theory and cross-country evidence
This paper develops a differential game of tax avoidance by modelling the interactions between a taxpayer
and the tax authority. This framework is particularly useful for explicitly modelling situations of conflict.
The solution to the game is a non-co-operative Nash that depends on the resources that need to be used by
the tax authority to enforce legislation and the cost to be borne by the taxpayer in tax compliance, provided
that the curvature of the utility functions is bounded. Empirical evidence is provided for the value added
tax (VAT) using a cross-section of OECD and non-OECD countries. OECD indicators of tax
administration efficiency are included in the regressions. The empirical findings show that VAT efficiency,
defined as the ratio of collections as a share of consumption to the statutory rate, rises the lower the VAT
rate, the lower the share of administrative costs in tax revenue (proxying for the efficiency of tax
administration), the more pro-competition the regulatory framework in product markets (measuring
non-tax incentives for non-compliance) and the better the country’s governance indicators (regulatory
quality, rule of law and government effectiveness).
This paper is forthcoming in the Public Finance Review.
JEL codes: H26, E62, C70
Keywords: value added tax, evasion, avoidance, differential game
*****
Évasion de la TVA : Théorie et Comparaisons Internationales
Ce document développe un jeu différentiel des évasions fiscales en modélisant les interactions entre les
contribuables et les administrations fiscales. Ce cadre est particulièrement adapté à la modélisation des
situations de conflit. La solution du jeu est un équilibre de Nash non-coopératif qui dépend des ressources
dont ont besoin les administrations fiscales pour appliquer la législation et les coûts imputés aux
contribuables dans le respect des obligations fiscales, à condition que la dérivée première de la fonction
d’utilité soit bornée. L’analyse empirique utilise la TVA d’un échantillon de pays de l’OCDE et non-
OCDE. Les indicateurs OCDE d’efficacité des administrations fiscales sont intégrés aux régressions. Les
résultats montrent que l’efficacité de la TVA (définie comme le ratio entre les revenus de la TVA divisé
par la consommation et le taux de la TVA), augmente inversement au taux de la TVA et à la part des coûts
administratifs dans les revenus des impôts (un indicateur d’efficacité des administrations fiscales). Par
contre, l’efficacité de la TVA augment proportionnellement au biais pro-compétition des réglementations
des marchés des produits et aux indicateurs de bonne gouvernance (qualité des réglementations, règle de
droit et efficacité du gouvernement).
A paraître prochainement dans Public Finance Review.
JEL classification : H26, E62, C70
Mots clés : taxe à la valeur ajoutée, TVA, évasion, jeu différentiel
Copyright © OECD, 2008. All rights reserved.
Application for permission to reproduce or translate all, or part of, this material should be made to:
Head of Publications Service, OECD, 2 rue André-Pascal, 75775 PARIS CEDEX 16, France.
ECO/WKP(2008)12
3
Table of contents
Avoiding the value added tax: Theory and cross-country evidence ......................................................... 5
1. Introduction .......................................................................................................................................... 5 2. The theoretical model ........................................................................................................................... 7 3. The empirical evidence ....................................................................................................................... 11
The estimating equation ......................................................................................................................... 11 The data .................................................................................................................................................. 12 The results .............................................................................................................................................. 13
4. Conclusions ........................................................................................................................................ 17
Bibliography .................................................................................................................................................. 18
Tables
1. Descriptive statistics ...................................................................................................................... 13 2. VAT efficiency: OECD and non-OECD countries ........................................................................ 14 3. VAT efficiency: Regulatory restrictiveness ................................................................................... 16
Figure
1. The Nash equilibrium..................................................................................................................... 11

ECO/WKP(2008)12
4
|

ECO/WKP(2008)12
5
Avoiding the value added tax: Theory and cross-country evidence
By
Luiz de Mello1
1. Introduction
The literature on tax evasion/avoidance, surveyed by Slemrod and Itzhaki (2000), focuses on the
incentives facing taxpayers not to comply with the tax code and the instruments at the disposal of the tax
authority to identify and curb abuse. The theory, pioneered by Allingham and Sandmo (1972), uses a
principal agent setting to model the interactions between the tax authority and the taxpayers. Account is
taken of the costs of compliance, which are borne by the taxpayer, and those of enforcement, which accrue
to the tax authority, as well as the taxpayers’ degree of risk aversion. The theory’s predictions are relatively
straightforward: the level of the tax burden, the complexity of the tax code and inefficiency in tax
administration are the main culprits for non-compliance. Attention is most often focused on direct taxes,
rather than indirect taxes, such as the VAT.
Against this background, this paper’s contribution is two-fold. First, the interactions between the
taxpayer and the tax authority are modelled in a differential game, instead of a principal agent, framework.
This modelling strategy is novel, because differential games have not yet been used widely in tax theory.2
They are nevertheless particularly appealing for modelling situations of conflict explicitly as an optimal
control problem. The different payoffs of the taxpayer and the tax authority can be modelled separately,
and a law of motion for the variable describing the players’ moves can be defined explicitly. The solution
to the game, which follows the “tax as a gamble” tradition of Allingham and Sandmo (1972), is shown to
be a non-co-operative Nash that depends on the resources deployed by the tax authority to enforce the tax
legislation and the cost to be borne by the taxpayer in tax avoidance/evasion, provided that the curvature of
the utility function of the taxpayer and that of the tax authority is bounded.
Second, the focus of the empirical analysis will be on the VAT. In doing so, the paper aims to shed
additional light on the determinants of compliance with a tax that is considered less prone to evasion than
other direct and indirect taxes on account of the self-enforcing incentives created by the invoice-credit
mechanism for collection. Taxpayers have a strong incentive to purchase taxable inputs from registered
taxpayers, because they cannot otherwise claim a credit when selling their output. Invoices therefore
provide a good “audit trail” that facilitates the detection of non-compliance.3 A focus on the VAT is also
1. I am indebted to Jim Alm and Diego Moccero for their valuable comments but remain solely responsible
for any remaining errors and omissions. Special thanks go to Mee-Lan Frank for excellent technical
preparation.
2. See Dockner et al. (2000) for more information on the solution of differential games and applications to
economics and management science. The literature offers important applications in management science
(Feichtinger, 1983a and 1983b; Erickson, 1995), industrial economics (Bower et al., 1996) and political
economy (Balakrishnan and Eliashberg, 1995). General theoretical considerations on differential games are
found in Kamien and Schwartz (1981), Basar and Olsder (1982), and Chiang (1992).
3. This self-enforcement property was taken into account by de Paula and Scheinkman (2006) in a model of
informality, which they tested using Brazilian firm-level data. The authors found that informality was
higher, controlling for other determinants, in sectors where the VAT is not collected based on the
ECO/WKP(2008)12
6
important, because revenue from this tax already accounts for a high (and rising) share of collections in the
OECD area and beyond. Some countries are adopting the VAT to replace sales taxes (Australia recently,
for example), while others are shifting the composition of the tax take away from direct taxes as a means of
alleviating the tax burden on capital and labour. Developing countries are also adopting the VAT as trade
liberalisation is reducing their traditional reliance on import duties as a means of raising revenue.
Empirical evidence will be based on VAT efficiency (i.e. the ratio of collections as a share of
consumption to the statutory tax rate), rather than direct estimates of non-compliance, which tend to be
overly sensitive to the estimating methodology. Because tax evasion is not observable directly, it needs to
be estimated. An option for doing so is to compare actual and potential revenue, where the latter is
computed for a potential tax base estimated from the national accounts (for recent surveys see
Schneider, 2004, and Alm et al., 2006). The main weakness of this method is that it requires considerable
judgement on the part of the analyst to accurately define the potential tax base by taking into account the
relevant provisions of the tax code, including exemptions.4 Alternatively, tax compliance can be inferred
from audit records (see Engel et al., 1998 and 2001, for an empirical analysis based on Chilean data). But it
is difficult to deal with the problem that audits are carried out on businesses/individuals that are perceived
by the tax authority as having a higher probability of non-compliance in the first place, which creates an
identification problem for the econometrician. Essentially as a result of these methodological difficulties,
estimates of VAT non-compliance vary considerably across countries.5
Of course, non-compliance is not the only culprit for low tax efficiency. It also depends on the breadth
of the relevant tax bases, which depends on the tax code. Some effort will therefore be needed to capture
these effects. In addition, emphasis will be placed in the empirical analysis on measuring the quality of tax
administration using a dataset compiled by the OECD for its member countries and selected non-members.
Empirical analysis has so far suffered from a dearth of such internationally comparable indicators,
including the cost of tax administration, and the effectiveness of audits and other supervisory instruments,
among others. Omission of such indicators biases parameter estimates, because it underestimates
enforcement effects. Indicators of regulatory restrictiveness in product markets and governance in general
(rule of law and quality of the bureaucracy) will also be considered as non-tax proxies for non-compliance.
Again, the empirical literature on tax evasion has so far omitted such controls, thereby understating the
burden of regulation, which may encourage non-compliance, on tax efficiency. However, a variety of
governance indicators have been experimented with as predictors of business informality
(Friedman et al., 2000; Krakowski, 2005). Political economy indicators, such as the durability of the
political regime, have been used by Aizenman and Jinjarak (2005) as determinants of VAT efficiency.
Agha and Haughton (1996) is a precursor in the empirical analysis of the determinants of VAT efficiency
based on the differences in VAT systems across countries.
invoice-credit mechanism, but by presumptive methods. For more information on these collection
mechanisms currently in place in Brazil, see de Mello (2008).
4. Measurement errors in the national accounts, which are far from negligible, also complicate the analysis.
Moreover, the methodology does not allow for distinguishing tax avoidance, which is not unlawful, from
outright evasion, which is.
5 In the European Union, evasion rates are estimated to have ranged from about 2.5% of the computed
potential tax base in the Netherlands to over 34% in Italy on average during 1994-96 (Nam et al., 2003). In
Chile, the evasion rate is estimated at about 21% of the potential tax base on average during 1996-2000
(SII, 1996 and 2005), or at about 24% of average real sales, and to exhibit considerable disparity across
sectors, ranging from 73% in retailing to 13% in hotels and restaurants (Engel et al., 1998). In the case of
Colombia, VAT evasion is estimated at about 28% in 1994, with a higher rate for domestically-produced
goods and services than for imports (Steiner and Soto, 1998). An important consideration is that evasion
rates are interrelated across taxes. In the case of Chile, for example, about three-quarters of the estimated
non-compliance with the income tax are estimated to stem from VAT evasion (Jorratt and Serra, 1999).

ECO/WKP(2008)12
7
The main empirical findings of the paper are that VAT efficiency is inversely related to the statutory
rate and the share of tax administration costs in tax revenue (proxying for tax administration efficiency).
VAT efficiency also tends to be higher in countries where the regulatory framework in product markets is
pro-business and governance (regulatory quality, rule of law and government effectiveness) is strong.
Moreover, VAT productivity does not seem to differ in a statistically significant manner between OECD
members and non-members. Finally, the ratio of administrative costs to tax revenue is the best-performing
indicator of tax administration quality used in the empirical analysis, with other metrics, such as the ratio
of audit and other non-audit verification assessments to net revenue having a much lower predictive power.
The paper is organised as follows. Section 2 describes the theoretical model. Section 3 reports the
empirical findings based on a sample of OECD and non-OECD countries. Section 4 concludes.
2. The theoretical model
Following the seminal work of Allingham and Sandmo (1972), tax compliance is conventionally
modelled on the basis of the incentives facing the taxpayer for abiding by the tax code (which depend
predominantly on the tax rate and the complexity of tax legislation) and the costs he/she incurs to conceal
tax liabilities and/or to exploit loopholes in the law. The decision to evade is affected by the quality of tax
administration, given that taxpayers who are suspected of non-compliance are likely to be audited and
punished, if caught. In turn, the tax authority faces a cost of enforcement. In a broad class of models,
solution to the tax game depends on the taxpayer’s degree of risk aversion. The distinction between
evasion, which is illegal, and lawful avoidance, which arises from the presence of loopholes in the law, as
well as tax arbitrage, is not essential in these “tax evasion as a gamble” theoretical models.
Against this background, it is convenient to model the interactions between the payoff of the taxpayer
and that of the tax authority using a differential game. This modelling strategy is novel in the tax evasion
literature, which tends to define the utility functions of the taxpayer and that of the tax authority
independently.6 Differential games originated in optimal control theory and are especially suited to model
situations of conflict, because they seek a balance of optimal strategies followed by two opposing players.
Differential games belong to a sub-class of dynamic games referred to as state space games, where a state
variable describes the state of a dynamic system at any point during the game. Differential-game modelling
therefore requires the definition of a state variable to describe the players’ moves and their differential
equations of motion. Instead, in a principal agent setting, the solution to the problem follows from an
incentive-compatibility constraint, rather than the solution of an optimal control problem for the players’
payoffs and a law of motion for the state variable. The precursors to differential games are the
pursuit-evasion games used in a military context (see Isaacs, 1999, for more information). In a basic
setting, there are two players with conflicting goals, such as the case of a taxpayer and the tax authority.
The model presented below follows the tradition of the police/thief differential game modelled by
Sethi (1979) and Feichtinger (1983a and 1983b) in that enforcement costs are taken into account and the
payoffs are modelled jointly, but differs from it in the definition of the state variables and the hazard
function.
The differential tax compliance game can be defined as follows. Without loss of generality, and
following the literature, the terms tax avoidance and evasion are used interchangeably. There are two
players: a taxpayer, labelled P, and the tax authority, labelled A. The utility functions are denoted )( kku ,
for ),( PAk , where k denotes the tax liability. The utility function captures parameters such as “tax
morality”, or a preference inherent to the taxpayer for complying (or not) with the tax code. Let 0'Pu
6. Interactions between tax policy and tax administration are examined by Tanzi and Pellechio (1996), among
others.
ECO/WKP(2008)12
8
and 0'' Pu , for 0P , and 0'Au and 0'' Au , for 0A , such that an increase in declared tax
liability reduces (increases) utility for the taxpayer (the tax authority), where k
kkk
d
duu
)(' and
2
2
)(
)(''
k
kkk
d
udu
for ),( PAk . The taxpayer may comply with tax legislation with a probability
0 1 or not, in which case the probability of non-compliance is ( 1 ). The decision on how much
tax liability to declare to the tax authority is taken by the taxpayer at the beginning of the game and is not
adjusted during the game. At the same time, the tax authority has a view of how much tax the taxpayer
should pay. Let also 0)( APu and 0)( PAu .
Let there be an audit function, h, so that the probability of being audited, provided that the taxpayer is
not complying with the tax code, increases with the gap between the tax liability assessed by the tax
authority and the amount declared by the taxpayer, PA .
7 This audit function determines the law of
motion of the probability of compliance, such that:
)(1
PAh
, with 0h , 1)( Ah and 0)0( hh . (1)
Let the audit function be additively separable, and let there be a cost of enforcement (measured in
utility terms), including that of carrying out audits and other assessment functions, to be borne by the tax
authority, 0Ap . Assume that this enforcement cost is independent of the tax liability gap (PA ) at
no loss of generality and, for simplicity, that it is equal to the tax filing cost to be borne by the taxpayer in
the case of full compliance, PA pp . In addition, when non-compliance is detected, the delinquent
taxpayer pays a penalty equal to PK (also measured in utility terms), which is for simplicity independent
of the tax liability gap and that AP KK , for 0PK .
8 In other words, non-compliance gives the
taxpayer a payoff of )( PPu with probability 1 , for AP , net of the tax filing cost (
Pp , with
probability ) and the non-compliance penalty if caught (PK , with ). If the tax authority believes the
taxpayer is not complying based on its assessment of his/her tax liability, its payoff is )( AAu with
probability 1 , net of administrative costs (Ap , with probability ) and the non-compliance penalty
paid by the taxpayer (PK , with ).
Both the taxpayer and the tax authority solve the problem of maximizing discounted utility over time,
once all costs/benefits of compliance/enforcement and non-compliance penalties have been factored in,
subject to Equation (1). The maximization problem can be formalised as follows.
0
])1)(([max dtKpueJ iiiiti
i
, (2)
7. This audit function is not based on the idea of an endogenous audit rule, according to which taxpayers do
face a pre-determined probability of being audited, but one that depends on the information reported to the
tax authority in tax returns. See Alm and McKee (2000) for more discussion and evidence.
8. The assumption of symmetry in the enforcement/avoidance costs and that the non-compliance penalty is
invariant to the tax liability is for simplicity only.
ECO/WKP(2008)12
9
such that
1)(
PAh , where 0 , PAi , , and is a discount rate, which is assumed for
simplicity to be the same for the taxpayer and the tax authority.
Problem (2) is a differential game. The solution is not sub-game perfect, because it is not a
Nash equilibrium for every sub-game with different starting conditions (Kamien and Schwartz, 1981;
Shubik, 1982).
The Hamiltonian associated with Problem (2) is defined as:
iPAiiiii phKuH )1)](()()([( , (3)
where i is the adjoint variable (shadow price) associated with the control problem.
The first-order conditions are:
h
uK
iii
' , for the non-trivial case where 1 . (4)
Taking Equation (4) into account, the first-order condition for the constraint (ii
iH
)
becomes:
)'
()('
)(h
uKph
h
uu
iiiPA
iiii
. (5)
The transversality condition is standard: 0)(lim
tH i
t. Differentiating Equation (4) with respect to
time and substituting it into Equation (5) yields:
)'
()('
)(''
h
uKph
h
uu
h
u iiiPA
iiii
i
. (6)
By Equation (6), equilibrium is reached ( 0i ) if and only if:
])(['
)( iiii
i
PA Kpuu
hh . (7)
Letting )()(
')( i
ii
ii h
u
u
,
)(1
i
i h
, and
'
)(i
iii
u
hKp, Equation (7) can be
re-written as:
)]([1
)( Pi
i
A hh
. (8)

ECO/WKP(2008)12
10
Substituting Equation (8) into Equation (1), and recalling that equilibrium is reached when 0 ,
yields:
0)1)](()1
1([(
P
ii
i
h . (9)
By Equation (9), either 1 , which is trivial, or 1
)( *
i
iPh
.
To see that the solution of Problem (2) is a Nash-equilibrium, using Equations (6) and (1), and
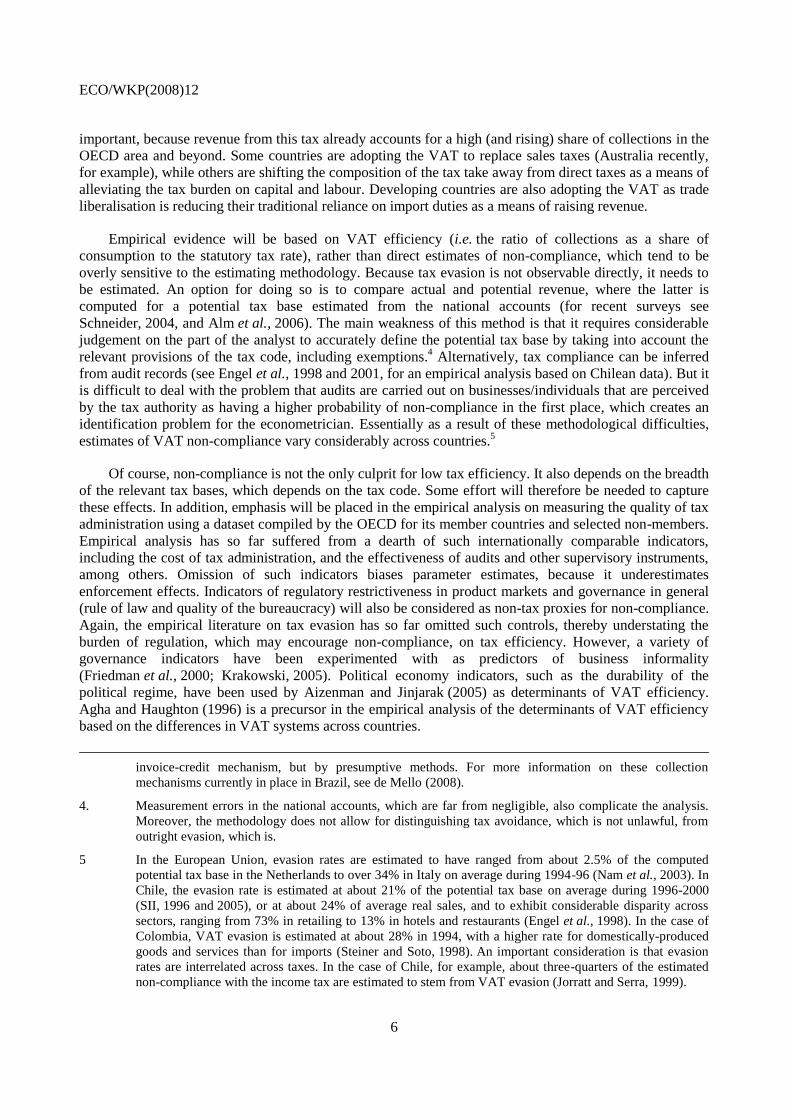
assuming that 0''' iu , consider the system below:
*
*
)1(
0''
'
ii
i
ii
hhu
uhh
. (10)
Equation (10) can be written as Axx for )( ix , such that the roots ( 1 and 2 ) of the
characteristic equation of matrix A ( ||2 AtrA , where 21 trA is the trace of A and 21|| A
is the determinant of A) are h1 and
''
'2 i
i
u
uhh . If
''
'i
i
u
uhh , then 02 and the
solution to system (10) is a stable node, given that 01 . This implies that he curvature of the utility
function is bounded: h
B
1 , where ''
'i
i
u
uB . The solution to Equation (10), E, is depicted in Figure 1.
Because the equilibrium point is a stable node, all trajectories below the 0 locus, where by
Equation (1) 1 , around E, converge to E. Finally, if 0* P , then 0i , by Equation (9), and
0* A , by Equation (8). It then follows from 0i that )'( iii Kuh
p
.
Figure 1. The Nash equilibrium
0
0
i*
1E

ECO/WKP(2008)12
11
This model is general enough to encompass the VAT. It is often argued that the use of the
invoice-credit mechanism for collection makes the VAT self-enforcing, as taxpayers have strong incentives
to trade with registered taxpayers to be entitled to a credit. In doing so, their tax liability can be reduced.
The cost of enforcement facing the tax authority can therefore be argued to be lower than in the case of a
tax that does not exhibit this self-enforcing property. In this case, the enforcement cost borne by the tax
authority falls relative to the compliance cost facing the taxpayer. The assumption that PA pp may
therefore be somewhat stronger in the case of VAT compliance than another tax. It is easy to see that this
assumption is by no means essential in the game. Relaxing it would affect the equilibrium level of tax
liability, but not the stability properties of the game.
3. The empirical evidence
The estimating equation
By Equation (9), the equilibrium level of tax liability is 1
*
. It depends on the parameters of
the utility functions of the taxpayer and the tax authority (captured by ), the shape of the audit function
( h ), the compliance costs borne by the taxpayer and the tax authority p , the non-compliance penalty
( K ) and the discount factor ( ). The model predicts that the equilibrium level of tax liability depends
positively on the penalty for non-compliance and the compliance costs.
Since tax avoidance is not observed directly, and country-specific information is overly sensitive to
differences in the methodology used to quantify unpaid taxes and is not readily available in a comparable
manner for a large enough set of countries, the option of gauging the extent of non-compliance by the
VAT’s C-efficiency, which is calculated by dividing the VAT’s revenue-to-consumption ratio by its
statutory rate, becomes appealing.9 To the extent that avoidance reduces revenue for a given tax rate, it
lowers C-efficiency. Of course, C-efficiency also depends on specific features of the VAT code, including
exemptions and the level of the business registration threshold, which narrow the tax base, and the extent
of zero-rating, which creates a credit and therefore reduces net revenue, among other factors.10
Therefore, it
should be recognised that the use of C-efficiency as a proxy for tax avoidance is not without problems, but
unavoidable against the backdrop of severe data constraints.
Letting the tax administration costs depend ultimately on the efficiency of tax administration and
those to be borne by the taxpayer on the complexity of the tax code and on the level of the tax rate, which
creates incentives for non-compliance, the equation to be estimated below can be defined as follows:
nnnnnn eXaFaTaraarP 54321)( , (11)
where n
n
nr
RrP )( denotes C-efficiency in country n, nR is the ratio of VAT revenue to
consumption, nr is the statutory VAT rate, nT is a measure of tax administration quality, nF is an
9. See Baca-Campodonico et al. (2006) for evidence on evasion of bank transactions taxes based on tax
productivity equations.
10. While business registration thresholds vary considerably across countries, exemptions typically affect
agricultural goods and selected inputs, fuels, passenger transport, and selected financial transactions and
services. See Ebrill et al. (2001) for more information.
ECO/WKP(2008)12
12
indicator of regulatory restrictiveness, nX is a vector of additional variables included in the regression to
capture non-tax determinants of C-efficiency, and ne is an error term.
The empirical study which uses an estimating strategy that is closest to the one pursued below is
Aizenman and Jinjarak (2005). They extend a model by Cukierman, Edwards and Tabellini (1992), which
focuses on the relationship between tax reform and political instability. The Aizenman-Jinjarak regressions
use tax C-efficiency and effective collection (i.e. VAT revenue divided by value added) as the dependent
variables and are based on a much larger data set, comprising both OECD and non-OECD countries.
Nevertheless, they do not include the tax rate or indicators of tax administration quality, regulatory
restrictiveness in product markets and governance among the regressors. These explanatory variables are
important because, based on the differential game above, VAT avoidance depends on the incentives facing
the taxpayer for not complying with the tax code, which includes the level of the tax rate and regulatory
restrictiveness, and the efforts deployed by the tax authority to enforce compliance.
The data
The empirical evidence to be reported below is based on a cross-section of OECD and a few
non-OECD countries.11
It uses OECD data on VAT collections and indicators of quality of tax
administration. Information on statutory VAT rates is available from PricewaterhouseCoopers and has
been used widely in cross-country empirical work on the VAT. The World Bank’s Doing Business and
GRICS (Governance Research Indicator Country Snapshot) indicators are used to capture the quality of
governance, in the case of GRICS, and the regulatory framework in product markets, in the case of the
Doing Business indicators. The 2003 version of the Doing Business indicators is used, because the OECD
indicator of tax administration efficiency is available for 2003. The GRICS indicator of government
effectiveness, regulatory quality and rule of law are available for all countries included in the sample from
1996. The data used in the analysis are for 2000 so as to allow for a lag relative to 2003, the date for which
VAT collection data are available.
Other variables are used to capture the effect of non-tax determinants on C-efficiency, including trade
openness (i.e. share of exports and imports in GDP) and the urbanisation rate. Trade openness proxies for
the relative ease of collection of import duties in relation to the taxation of domestic consumption, and the
urbanisation rate proxies for the size of agriculture in GDP, a sector where tax avoidance (due to
informality) tends to be pervasive in many countries and where special payment and filing regimes are in
place in most countries. Based on the empirical literature (Aizenman and Jinjarak, 2005), these variables
are powerful determinants of VAT efficiency. The rate of growth of GDP is often used as an additional
regressor on account of the fact that tax collection tends to rise faster in a growing economy.12
To avoid
biases related to the potential endogeneity of some of these variables, a time lag is considered, and the data
refer to the average of the relevant variables over the period spanning 1995 through 2000.
On the basis of the descriptive statistics reported in Table 1, there appears to be considerable variation
across countries in VAT rates and revenue yields, but less so in C-efficiency. Regional patterns appear to
be of little use to highlight common features in VAT taxation: while some countries levy a relatively
uniform rate, such as Chile, for example, others in the same region have a complicated rate structure, such
11. The full sample of 42 countries includes all OECD countries that have a VAT, in addition to Argentina,
Brazil, Chile, China, Cyprus, Estonia, Latvia, Lithuania, Malta, Russia, Singapore, Slovenia and
South Africa.
12. This is based on Andreoni’s (1992) model. Accordingly, taxpayers are credit constrained and penalties are
high on tax evasion. In this set-up, taxpayers chose to evade taxes in bad times and to repay them in good
times so as to smooth income over the business cycle.

ECO/WKP(2008)12
13
as Brazil, even though the efficiency of the VAT is comparable in these countries. Within the OECD area,
Italy and Austria have the same statutory rate of 20%, but Italy has lower efficiency. As noted above, such
variations are related not only to the extent of non-compliance, but also to the fact that many tax codes
apply different rates to different goods and services. In addition, several goods/services are exempt from
VAT, whereas others are zero-rated.
The results
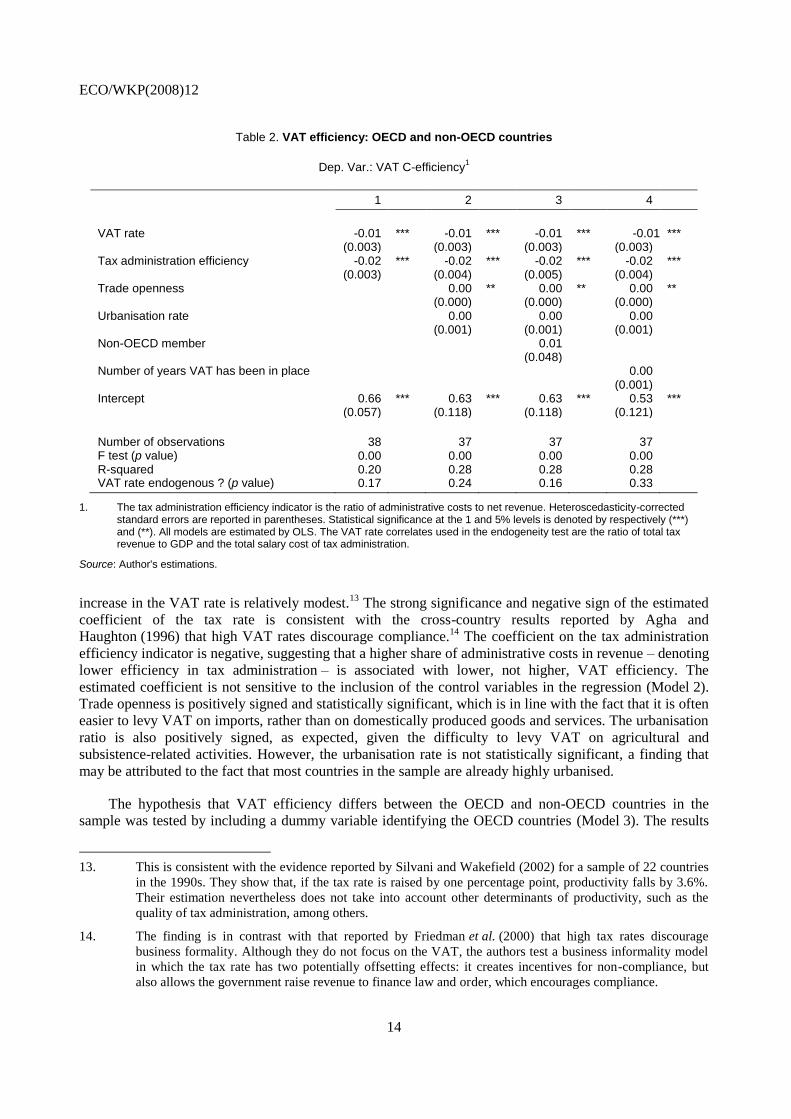
Preliminary findings are reported in Table 2. A simple model that includes only the tax rate and the
tax administration efficiency indicator suggests that VAT efficiency is affected adversely by the level of
the statutory rate and the ratio of tax administration costs to net revenue (Model 1). The coefficient on the
tax rate is small in magnitude, although it is highly significant, so that the loss in efficiency due to an
Table 1. Descriptive statistics
Mean Standard deviation
Maxi- mum
Mini- mum
No. obs.
Source
VAT revenue-to-GDP ratio (2003)1 7.0 2.0 10.1 1.8 42 OECD
VATrate 17.5 5.0 25.0 5.0 42 PricewaterhouseCoopers VAT C-efficiency 0.6 0.2 0.9 0.1 42 Author’s calculation Ratio of administrative costs to 100 units if next revenue (2000-04 average, in per cent)
1.4 1.7 11.4 0.5 39 OECD
Doing business indicators (2003) World Bank Time to start a business (days) 36.6 30.2 152.0 2.0 37 World Bank Procedures to start a business (number) 8.2 3.9 17.0 2.0 37 World Bank Cost to start a business (per cent income per capita) 11.0 10.2 40.4 0.0 37 World Bank
Governance indicators Government effectiveness 1.2 0.7 2.3 0.1 43 World Bank Regulatory quality 1.0 0.5 2.1 0.0 43 World Bank Rule of law 1.2 0.7 2.1 0.1 43 World Bank
Trade openness (share of imports plus exports in GDP, in per cent, 1995-2000 average)
78.7 46.2 236.7 18.9 43 World Bank (WDI)
Rate of growth of urbanisation (in per cent, 1995-2000 average) 1.1 0.9 3.6 0.1 44 World Bank (WDI)
1. The figure for Brazil is available from national sources and refers to the ICMS, a state-level VAT, and the PIS-Pasep, a federal tax. The VAT rate refers to the average of these two rates (weighted by revenue collection).
Source: OECD (2006), Tax Administration in OECD and selected non-OECD countries, PricewaterhouseCoopers and World Bank.
ECO/WKP(2008)12
14
Table 2. VAT efficiency: OECD and non-OECD countries
Dep. Var.: VAT C-efficiency1
1 2 3 4
VAT rate -0.01 *** -0.01 *** -0.01 *** -0.01 *** (0.003) (0.003) (0.003) (0.003) Tax administration efficiency -0.02 *** -0.02 *** -0.02 *** -0.02 *** (0.003) (0.004) (0.005) (0.004) Trade openness 0.00 ** 0.00 ** 0.00 ** (0.000) (0.000) (0.000) Urbanisation rate 0.00 0.00 0.00 (0.001) (0.001) (0.001) Non-OECD member 0.01 (0.048) Number of years VAT has been in place 0.00 (0.001) Intercept 0.66 *** 0.63 *** 0.63 *** 0.53 *** (0.057) (0.118) (0.118) (0.121)
Number of observations 38 37 37 37 F test (p value) 0.00 0.00 0.00 0.00 R-squared 0.20 0.28 0.28 0.28 VAT rate endogenous ? (p value) 0.17 0.24 0.16 0.33
1. The tax administration efficiency indicator is the ratio of administrative costs to net revenue. Heteroscedasticity-corrected standard errors are reported in parentheses. Statistical significance at the 1 and 5% levels is denoted by respectively (***) and (**). All models are estimated by OLS. The VAT rate correlates used in the endogeneity test are the ratio of total tax revenue to GDP and the total salary cost of tax administration.
Source: Author's estimations.
increase in the VAT rate is relatively modest.13
The strong significance and negative sign of the estimated
coefficient of the tax rate is consistent with the cross-country results reported by Agha and
Haughton (1996) that high VAT rates discourage compliance.14
The coefficient on the tax administration
efficiency indicator is negative, suggesting that a higher share of administrative costs in revenue – denoting
lower efficiency in tax administration – is associated with lower, not higher, VAT efficiency. The
estimated coefficient is not sensitive to the inclusion of the control variables in the regression (Model 2).
Trade openness is positively signed and statistically significant, which is in line with the fact that it is often
easier to levy VAT on imports, rather than on domestically produced goods and services. The urbanisation
ratio is also positively signed, as expected, given the difficulty to levy VAT on agricultural and
subsistence-related activities. However, the urbanisation rate is not statistically significant, a finding that
may be attributed to the fact that most countries in the sample are already highly urbanised.
The hypothesis that VAT efficiency differs between the OECD and non-OECD countries in the
sample was tested by including a dummy variable identifying the OECD countries (Model 3). The results
13. This is consistent with the evidence reported by Silvani and Wakefield (2002) for a sample of 22 countries
in the 1990s. They show that, if the tax rate is raised by one percentage point, productivity falls by 3.6%.
Their estimation nevertheless does not take into account other determinants of productivity, such as the
quality of tax administration, among others.
14. The finding is in contrast with that reported by Friedman et al. (2000) that high tax rates discourage
business formality. Although they do not focus on the VAT, the authors test a business informality model
in which the tax rate has two potentially offsetting effects: it creates incentives for non-compliance, but
also allows the government raise revenue to finance law and order, which encourages compliance.
ECO/WKP(2008)12
15
show that VAT efficiency does not differ in a statistically significant manner across country groupings.
Interaction terms between the OECD membership dummy and the tax rate and the tax administration
efficiency indicator were also experimented with, but found to be statistically insignificant at classical
levels. This finding confirms the hypothesis that OECD membership is not an important determinant of
VAT productivity in the sample under examination. The results are also robust to the inclusion of a dummy
variable identifying the emerging-market economies within the OECD area (Czech Republic, Hungary,
Korea, Mexico, Poland, Slovak Republic and Turkey), in addition to the non-OECD countries in the
sample (not reported). Inclusion of the number of years since VAT was introduced as an additional
regressor to measure VAT administration efficiency does not change the results qualitatively (Model 4).
This indicator was found by Agha and Haughton (1996) to be a powerful determinant of VAT compliance,
but more recent studies have failed to find a strong correlation between VAT efficiency and the VAT age
indicator (Aizenman and Jinjarak, 2005).
The VAT rate may be endogenous due to Laffer-curve effects; therefore, it is important to test for
endogeneity. To do so, the determinants of the tax rate that are uncorrelated with VAT efficiency were
selected on the basis of the raw correlations between the VAT rate and the potential correlates available in
the data set. The ratio of total tax revenue to GDP, the average rate of change in the urbanisation rate over
the period 1995-2000 and the salary cost of tax administration were found to be correlated with the VAT
rate at the one percent level of significance. The rate of growth of urbanisation was nevertheless not
retained, because it was not found to be significant at classical levels in a regression of the VAT rate on its
correlates, as well as the regressors included in the productivity equation. The test statistics reported for
each model are the p-values associated with an F test for the exclusion of the residuals of the VAT rate
regression from the productivity regressions. The test statistics suggest that the VAT rate is not
endogenous, which validates the estimation of the regressions by OLS.
A number of robustness checks were carried out. Other OECD indicators of tax administration
efficiency, such as the share in net revenue of assessment values of audits and non-audit procedures and
the share of tax administration staff allocated to audit activities, were experimented with instead of the
ratio of administrative costs to revenue. Although signed as expected, the estimated coefficients (not
reported) were not found to be statistically significant at classical levels. This is possibly due to a loss in
degrees of freedom, especially when the ratio of value of assessments based on non-audit verification
procedures to net revenue was used, because information is valid only for a smaller set of countries
(20 countries in the sample). Including average GDP growth during 1995-2000 as an additional control
variable does not affect the results qualitatively, but this variable is highly correlated with trade openness
and the urbanisation rate, and is therefore omitted from the full set of controls. Neither are the results
affected by the inclusion of a dummy variable to identify Cyprus (not reported), a country that has the
highest ratio of tax administration cost to revenue in the sample. A relative income variable, defined as per
capita income (measured in PPP terms) in relation to that of the United States, was also experimented with
as an additional regressor, but was found to be statistically insignificant (not reported). Finally, an effort
was made to control for the level of the registration threshold for VAT, but data are only available for a
small sub-set of countries.15
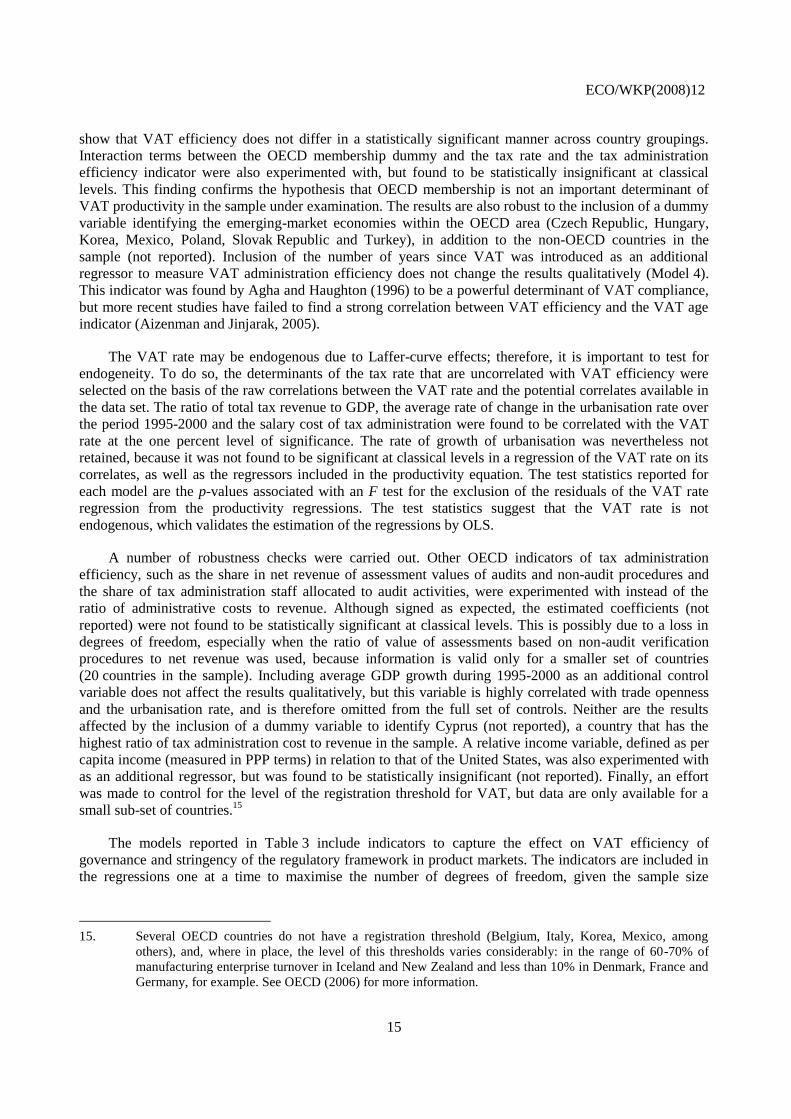
The models reported in Table 3 include indicators to capture the effect on VAT efficiency of
governance and stringency of the regulatory framework in product markets. The indicators are included in
the regressions one at a time to maximise the number of degrees of freedom, given the sample size
15. Several OECD countries do not have a registration threshold (Belgium, Italy, Korea, Mexico, among
others), and, where in place, the level of this thresholds varies considerably: in the range of 60-70% of
manufacturing enterprise turnover in Iceland and New Zealand and less than 10% in Denmark, France and
Germany, for example. See OECD (2006) for more information.
ECO/WKP(2008)12
16
Table 3. VAT efficiency: Regulatory restrictiveness
Dep. Var.: VAT C-efficiency1
Doing Business indicators GRICS indicators
Procedures
to start a business
Time to start a business
Cots to start a business
Government effectiveness
Regulatory quality
Rule of law
VAT rate -0.01 *** -0.01 *** -0.01 *** -0.01 *** -0.01 *** -0.01 *** (0.003) (0.003) (0.003) (0.003) (0.004) (0.003) Tax administration efficiency 0.12 -0.03 -0.03 *** -0.02 *** -0.02 *** -0.02 *** (0.038) (0.034) (0.032) (0.004) (0.004) (0.004) PMR/Governance indicator -0.02 *** -0.00 ** -0.01 * 0.09 ** 0.08 * 0.09 *** (0.005) (0.001) (0.003) (0.038) (0.045) (0.032) Trade openness 0.00 0.00 0.00 0.00 ** 0.00 ** 0.00 ** (0.001) (0.001) (0.001) (0.000) (0.000) (0.000) Urbanisation rate 0.00 0.00 0.00 0.00 0.00 0.00 (0.001) (0.002) (0.002) (0.002) (0.001) (0.001) Intercept 0.87 *** 0.66 *** 0.80 *** 0.62 *** 0.58 *** 0.61 *** (0.109) (0.144) (0.132) (0.119) (0.147) (0.115)
Number of observations 32 32 32 37 37 37 F test (p value) 0.00 0.00 0.00 0.00 0.00 0.00 R-squared 0.39 0.28 0.37 0.44 0.36 0.46 VAT rate endogenous (p value) 0.92 0.63 0.91 0.20 0.15 0.23
1. The tax administration efficiency indicator is the ratio of administrative costs to net revenue. Heteroscedasticity-corrected standard errors are reported in parentheses. Statistical significance at the 1, 5 and 10% levels is denoted by respectively (***), (**) and (*). All models are estimated by OLS. The VAT rate correlates used in the endogeneity test are the ratio of total tax revenue to GDP and the total salary cost of tax administration.
Source: Author's estimations.
ECO/WKP(2008)12
17
constraints imposed by the data. As discussed above, a more restrictive regulatory environment is
hypothesised to encourage non-compliance because it fosters informality, which reduces the efficiency of
the VAT for a given tax rate. Overall, the results are supportive of this hypothesis. Other indicators were
experimented with, including those of overall administrative regulation and burden on entrepreneurship,
which were signed as expected but not a classical level of significance.16
The Doing Business indicators measuring difficulties in starting a business in terms of the number of
procedures, the time they take and their costs, are all negatively associated with VAT efficiency at classical
levels of significance. Trade openness and the tax administration efficiency indicators nevertheless lose
significance when the Doing Business indicators are included in the regressions. The findings also suggest
that poor governance (measured by the World Bank’s GRICS indicators of quality of regulations, rule of
law and government efficiency) is associated with low VAT efficiency. Unlike the regressions that
included the Doing Business indicators, trade openness and the tax administration efficiency indicator
remain statistically significant and are correctly signed. The GRICs indicators were experimented with by
Krakowski (2005) and found to be by and large poor predictors of business informality in cross-country
regressions.
4. Conclusions
This paper modelled VAT evasion using a differential game between the taxpayer and the tax
authority. The solution to the game was shown to be a non-co-operative Nash equilibrium that depends on
the resources that need to be devoted by the tax authority to enforce the tax legislation and on the cost to be
borne by the taxpayer in tax avoidance/evasion, provided that the curvature of the utility functions of the
taxpayer and of the tax authority is bounded. Empirical analysis in this area is complicated by the fact that
tax evasion is not observable directly. Estimates based on tax audits and/or computations of potential tax
bases are overly sensitive to differences in the estimating methodological and are not readily available in a
comparable fashion for a sufficiently large set of countries. To overcome this data constraint, evidence was
reported for VAT efficiency, defined as the ratio of collections as a share of consumption to the statutory
rate, using a cross-section of OECD and non-OECD countries.
The novelty of the empirical analysis is the use of a set of cross-country indicators of tax
administration efficiency constructed by the OECD. Such indicators, which are shown to be important
determinants of tax evasion, have so far been overlooked in the empirical literature. Additional indicators
of restrictiveness in product market regulations and governance were also used in the analysis. The main
findings are that, controlling for a number of non-tax determinants, VAT efficiency rises the lower the
statutory rate, the lower the share of administrative costs in tax revenue (proxying for the efficiency of tax
administration), the more pro-business the regulatory framework in product markets and the better the
country’s governance indicators (regulatory quality, rule of law and government effectiveness). There does
not appear to be a discernible difference in VAT productivity between OECD and non-OECD countries in
the sample, despite considerable cross-country differences in VAT revenue yields and statutory rates, or
between the non-OECD countries and the emerging-market economies in the OECD area, on the one hand,
and the other OECD countries, on the other.
16. This finding is in line with those reported by Friedman et al. (2000) using the Heritage Foundation and
Freedom House indicators of regulatory burden in that regulation that stifles competition discourages
compliance.
ECO/WKP(2008)12
18
Bibliography
Aizenman, J. and Y. Jinjarak (2005), “The Collection Efficiency of the Value Added Tax: Theory and
International Evidence”, Unpublished manuscript, University of California, Santa Cruz, CA.
Agha, A. and J. Haughton (1996), “Designing VAT Systems: Some Efficiency Considerations”, Review of
Economics and Statistics, Vol. 78, pp. 303-8.
Allingham, M. and A. Sandmo, (1972), “Income Tax Evasion: A Theoretical Analysis”, Journal of Public
Economics, Vol. 1, pp. 323-38.
Alm, J. and M. McKee (2000), “Tax Compliance as a Coordination Game”, Unpublished manuscript,
Georgia State University, Atlanta, GA.
Alm, J., J. Martinez-Vazquez and F. Schneider (2006), “Sizing the Problem of the Hard to Tax”, in J. Alm,
J. Martinez-Vazquez and M. Rider (eds.), The Challenges of Tax Reform in a Global Economy,
Springer.
Andreoni, J. (1992), “IRS as a Money Shark: Tax Compliance with Borrowing Constraints”, Journal of
Public Economics, Vol. 49, pp. 35-46.
Baca-Campodonico, J., L. de Mello and A. Kirilenko (2005), “The Rates and Revenue of Bank Transaction
Taxes”, OECD Economics Department Working Paper, No. 494, OECD, Paris.
Balakrishnan, P.V. and J. Eliashberg (1995), “An Analytical Process Model of Two-party Negotiations”,
Management Science, Vol. 41, pp. 226-43.
Basar, T., and G. Olsder (1982), Dynamic Noncooperative Game Theory, Academic Press, New York, NY.
Bower, A.G., S. Garber and J.C. Watson (1996), “Learning about a Population of Agents and the Evolution
of Trust and Cooperation”, International Journal of Industrial Organization, Vol. 15, pp. 165-90.
Chiang, A. (1992), Elements of Dynamic Optimization, McGraw-Hill, New York, NY.
Cukierman, A., S. Edwards and G. Tabellini (1992), “Seignorage and Political Instability”, American
Economic Review, Vol. 82, pp. 537-55.
de Mello, L. (2008), “The Brazilian “Tax War”: The Case of Value-Added Tax Competition Among the
States”, Public Finance Review, forthcoming.
de Paula, A. and J. Scheinkman (2006), “The Informal Sector”, Unpublished manuscript, University of
Pennsylvania, Philadelphia, PA.
Dockner, E., S. Jorgensen, N. van Long and G. Sorger (2000), Differential Games in Economics and
Management Science, Cambridge University Press, Cambridge.
ECO/WKP(2008)12
19
Ebrill, L., M. Keen, J. Bodin and V. Summers (2001), The Modern VAT, International Monetary Fund,
Washington, DC.
Engel, E.M.R.A., A. Galetovic and C.E. Raddatz (1998), “Estimación de la Evasión del IVA Mediante el
Método de Punto Fijo”, Estudos Tributarios, Internal Revenue Service, Santiago.
Engel, E.M.R.A., A. Galetovic and C.E. Raddatz (2001), “A Note of Enforcement Spending and VAT
Revenues”, Review of Economics and Statistics, Vol. 83, pp. 384-87.
Erickson, G.M. (1995), “Differential Game Models of Advertising Competition”, European Journal of
Operational Research, Vol. 83, pp. 431-8.
Feichtinger, G. (1983a), “A Differential Games Solution to a Model of Competition between a Thief and
the Police”, Management Science, Vol. 29, pp. 686-700.
Feichtinger, G., and S. Jorgensen (1983b), “Differential Game Models in Management”, European Journal
of Operational Research, Vol. 14, pp. 137-155.
Friedman, E., S. Johnson, D. Kaufmann and P. Zoido-Lobaton (2000), “Dodging the Grabbing Hand: The
Determinants of unofficial Activity in 69 Countries”, Journal of Public Economics, Vol. 76,
pp. 459-93.
Internal Revenue Service (SII) (1996), “Estimación de la Evasión en el IVA”, Serie Actualizada
1989-1996, Internal Revenue Service, Santiago.
Internal Revenue Service (SII) (2005), Ley Contra la Evasión Tributaria: Compromisos y Cumplimientos
en el Ámbito de la Administración Tributaria Interna, Internal Revenue Service, Santiago.
Issacs, R. (1999), Differential Games, Dover, Mineola, NY.
Jorratt, M. and P. Serra (1999), “Estimación de la Evasión en el Impuesto a las Empresas en Chile”,
Unpublished manuscript, Department of Industrial Engineering, University of Chile, Santiago.
Kamien, M.I. and N.L. Schwartz (1981), Dynamic Optimization, North-Holland, Amsterdam.
Krakowski, M. (2005), “Determinants of the Informal Economy: The Importance of Regional Factors”,
HWWA Discussion Paper, No. 313, Hamburg Institute of International Economics, Hamburg,
Germany.
Nam, C.W, A. Gebauer and R. Parsche (2003), “Is the Completion of the EU Single Market Hindered by
Tax Evasion?”, Working Paper, No. 974, IFO, Munich, Germany.
OECD (2006), Tax Administration in OECD and Selected Non-OECD Countries: Comparative
Information Series (2006), OECD, Paris.
PricewaterhouseCoopers (2006), “Retail Sales Tax Compliance Costs: A National Estimate”,
Pricewaterhouse Coopers.
Schneider, F. (2004), “The Size of the Shadow Economies of 145 Countries all over the World: First
Results over the Period 1999 to 2003”, Working Paper, No. 1431, Institute for the Study of Labour
(IZA), Bonn University, Bonn.
ECO/WKP(2008)12
20
Sethi, S.P. (1979), “Optimal Pilfering Policies for Dynamic Continuous Thieves”, Management Science,
Vol. 25, pp. 535-42.
Shubik, M. (1982), Game Theory in the Social Sciences: Concepts and Solutions, MIT University Press,
Cambridge.
Silvani, C. and S. Wakefield (2002), “Relación entre la Tasa y la Productividad de un Impuesto”, Paper
presented at the XXXVI Meeting of the Inter-American Centre of Tax Administration (CIAT),
Quebec, Canada.
Slemrod, J. and S. Itzhaki (2000), “Tax Avoidance, Evasion, and Administration”, Working Paper,
No. 7473, National Bureau of Economic Research, Cambridge, MA.
Steiner, R. and C. Soto (1998), “IVA: Productividad, Evasión y Progresividad”, Working Paper, No. 3,
Fundación para la Educación Superior y el Desarrollo, Bogota, Colombia.
Tanzi, V. and A. Pellechio (1996), “The Reform of Tax Administration”, in C. Clague (ed.), Institutions
and Economic Development: Implications of a New-Institutional-Economics Approach for Growth,
Poverty Reduction, Democracy, and International Assistance, Johns Hopkins Press, Baltimore, MD.
ECO/WKP(2008)12
21
WORKING PAPERS
The full series of Economics Department Working Papers can be consulted at www.oecd.org/eco/Working_Papers/
603. Oil Price Shocks, Rigidities and the Conduct of Monetary Policy: Some Lessons from a New
Keynesian Perspective
(April 2008) Romain Duval and Lukas Vogel
602. The Contribution of Economic Geography to GDP Per Capita
(April 2008) Hervé Boulhol, Alain de Serres and Margit Molnar
601. Estimating a supply block for Poland
(April 2008) Rafal Kierzenkowski, Patric Ollivaud, Franck Sédillot and Philippe Briard
600. Product market regulation and economic performance across Indian states
(March 2008) Paul Conway, Richard Herd and Thomas Chalaux
599. Improving product market regulation in India: an international and cross-state comparison
(March 2008) Paul Conway and Richard Herd
598. Revenue buoyancy and its fiscal policy implications
(February 2008) Isabelle Joumard and Christophe André
597. Monetary policy, market excesses and financial turmoil
(February 2008) Rudiger Ahrend, Boris Cournède and Robert Price
596. Explaining differences in hours worked among OECD countries: an empirical analysis
(February 2008) Sven Blondal and Jean-Marc Burniaux
595. Fiscal policy in India: past reforms and future challenges
(February 2008) Richard Herd and Willi Leibfritz
594. The significance of Switzerland’s enormous current-account surplus
(March 2008) Peter Jarrett and Céline Letremy
593. Interdependencies between monetary policy and foreign-exchange intervention under inflation
targeting: the case of Brazil and the Czech Republic
(January 2008) Jean-Yves Gnabo, Luiz de Mello and Diego Moccero
592. Solow or Lucas? Testing growth models using panel data from OECD countries
(December 2007) Jens Arnold, Andrea Bassanini and Stefano Scarpetta
591. The private internal rates of return to tertiary education: new estimates for 21 OECD countries
(December 2007) Romina Boarini and Hubert Strauss.
590. Making federalism work
(December 2007) Alexandra Bibbee
589. The wage premium on tertiary education: New estimates for 21 OECD countries
(December 2007) Hubert Strauss and Christine de la Maisonneuve

ECO/WKP(2008)12
22
588. Enhancing the benefits of financial liberalisation
(March 2007) Stefan Ide, Jens Høj and Patrick Lenain
587. Improving incentives in tertiary education
(March 2007) Jens Høj
586. Globalisation and the European Union: which countries are best placed to cope?
(December 2007) David Rae and Marte Sollie
585. Primary and secondary education in the United States
(November 2007) Peter Tulip and Gregory Wurzburg
584. Financing higher education in the United States
(November 2007) Peter Tulip
583. Corporate net lending: a review of recent trends
(November 2007) Christophe André, Stéphanie Guichard, Mike Kennedy and David Turner
581. Local government finances: The link between intergovernmental transfers and net worth
(September 2007) Luiz de Mello
580. Boosting Austria's innovation performance improving innovation
(September 2007) Willi Leibfritz and Jürgen Janger
579. Improving employment prospects in the Slovak Republic: Building on past reforms
(September 2007) Andres Fuentes
578. Improving education outcomes in the Slovak Republic
(September 2007) David Carey
577. Regulatory reforms in Sweden have boosted productivity
(September 2007) Espen Erlandsen and Jens Lundsgaard
576. The policy determinants of investment in tertiary education
(September 2007) Joaquim Oliveira Martins, Romina Boarini, Hubert Strauss,
Christine de la Maisonneuve and Clarice Saadi
575. Product market competition in the OECD countries: taking stock and moving forward
(September 2007) Jens Høj, Miguel Jimenez, Maria Maher, Giuseppe Nicoletti
and Michael Wise
574. Too little destruction too little creation: A Schumpeterian diagnosis of barriers to sustained growth
in Ukraine
(September 2007) Christian Gianella and William Tompson
573. How do the OECD Growth Projections for the G7 Economies Perform? A post-mortem
(September 2007) Lukas Vogel
572. Austria’s deepening economic integration with Central and Eastern Europe
(August 2007) Rina Bhattacharya
Related Documents


