For the year ended 31 July 2019 Annual Report and Financial Statements AVIVA INVESTORS MANAGER OF MANAGER ICVC (ICVC2)

Welcome message from author
This document is posted to help you gain knowledge. Please leave a comment to let me know what you think about it! Share it to your friends and learn new things together.
Transcript

For the year ended 31 July 2019
Annual Report and Financial Statements
A V I V A I N V E S T O R SM A N A G E R O F M A N A G E RI C V C ( I C V C 2 )

W
avivainvestors.com | Aviva Investors Manager of Manager ICVC (ICVC2) Annual Report and Financial Statements for the year ended 31 July 2019
1
CONTENTS
Company Information* 2
Report of the Authorised Corporate Director* 3
Statement of Cross Holdings 5
Policies and Risks 6
Aviva Investors UK Listed Equity High Alpha Fund 9
Aviva Investors UK Listed Equity MoM 1 Fund 25
Aviva Investors UK Equity MoM 2 Fund 39
Aviva Investors US Equity MoM 1 Fund 51
Aviva Investors Euro Equity MoM 1 Fund 61
Aviva Investors Euro Equity MoM 2 Fund 73
Aviva Investors Apac Equity MoM 1 Fund 85
Aviva Investors Japan Equity MoM 1 Fund 97
Aviva Investors EM Equity MoM 1 Fund 113
Aviva Investors Sterling Credit MoM 1 Fund 125
Statement of the Authorised Corporate Director’s Responsibilities* 133
Authorised Corporate Director’s Statement* 133
Statement of the Depositary’s Responsibilities and Depositary’s Report to the Shareholders 134
Independent Auditors’ Report to the Shareholders of Aviva Investors Manager of Manager ICVC (ICVC2) 135
Securities Financing Transactions Regulation Disclosure 137
General Information 137
* These items (as well as each sub-fund’s Investment Objective, Investment Policy, Fund Manager’s Report, Portfolio Statement and Material Portfolio Changes) comprise the Authorised Corporate Director’s Report for the purposes of the rules contained in the Collective Investment Schemes Sourcebook (“the Regulations”).
Aviva Investors Manager of Manager ICVC (ICVC2) Annual Report and Financial Statements for the year ended 31 July 2019 | avivainvestors.com
Company Information
2
AUTHORISED CORPORATE DIRECTORAviva Investors UK Fund Services LimitedSt Helen’s1 UndershaftLondon, EC3P 3DQ
Aviva Investors UK Fund Services Limited (the ACD) is a wholly owned subsidiary of Aviva Investors Holdings Limited, a company incorporated in the United Kingdom and within the Aviva Group of Companies. The ACD is a member of the Investment Association and is authorised and regulated by the Financial Conduct Authority.
DIRECTORSI BuckleS EbenstonD Skinner (resigned 16 July 2019)J Leadsom (resigned 27 September 2019)D ClaytonM CrastonG MillerM White (appointed 10 October 2019)
REGISTRAR AND ADMINISTRATORDST Financial Services Europe Ltd DST HouseSt Nicholas LaneBasildonEssex, SS15 5FS
FUND ACCOUNTING AND PRICING AGENTJ.P. Morgan Chase Bank, National Association (London Branch)25 Bank StreetCanary WharfLondon, E14 5JP
INVESTMENT MANAGERAviva Investors Global Services LimitedSt Helen’s1 UndershaftLondon, EC3P 3DQ
Aviva Investors Global Services Limited is a member of the Investment Association and is authorised and regulated by the Financial Conduct Authority. The ultimate parent company of Aviva Investors Global Services Limited is Aviva Plc.
TRUSTEE AND DEPOSITARYJ.P. Morgan Europe Limited25 Bank StreetCanary WharfLondon, E14 5JP
J.P.Morgan Europe Limited is authorised by the Prudential Regulation Authority and regulated by the Financial Conduct Authority and the Prudential Regulation Authority.
INDEPENDENT AUDITORSPricewaterhouseCoopers LLPAtria One144 Morrison StEdinburgh, EH3 8EX
COMPANY INFORMATION
avivainvestors.com | Aviva Investors Manager of Manager ICVC (ICVC2) Annual Report and Financial Statements for the year ended 31 July 2019
Report of the Authorised Corporate Director
3
THE COMPANYAviva Investors Manager of Manager ICVC (ICVC2) (“the Company”) is an Open-Ended Investment Company (OEIC) with variable capital incorporated in England and Wales since 23 October 2001. The property of the Company is entrusted to J.P. Morgan Europe Limited (“the Depositary”). The shareholders are not liable for any debts of the Company.
The object of the Company is to invest the scheme property in transferable securities, money market instruments, derivative instruments and forward transactions, deposits and units of collective investment schemes in accordance with the COLL Sourcebook with the aim of spreading investment risk and giving its shareholders the benefit of the results of the management of that property.
The Company has an umbrella structure and currently has three sub-funds (“Funds”) which are available for investment, each with a different investment objective. In the financial statements you will find an investment review for each Fund which includes details of the investment objectives.
AUTHORISED STATUSFrom 23 October 2001 the Company was authorised as an Open-Ended Investment Company under Regulation 7 of the Open-Ended Investment Companies Regulations 1996 (superseded by Regulation 12 of the Open-Ended Investment Companies Regulations 2001).
The Company is authorised to operate as a “UCITS Scheme” for the purposes of the COLL sourcebook.
SIGNIFICANT INFORMATIONOn 2 January 2019, the name of the Aviva Investors UK Oppportunities Fund was changed to the Aviva Investors UK Listed Equity High Alpha Fund. At the same time the investment objective was clarified to provide further detail about the Fund, although there were no changes made to the way the Fund is run. At the time of these changes, the amount of the Fund that may be invested in other collective investment schemes was changed from 5% to 10%.
With effect from 4 February 2019, following approval form the FCA to do so, the investment objective and policy for the Aviva Investors Japan MoM1 Fund were clarified. No change was made to the way that the Fund is run.
With effect from 29 April 2019, additional quarterly interim distribution periods were introduced for the following sub-funds of the scheme, which to that point had only had annual and half yearly distributions:
• Aviva Investors UK Equity MoM 2 Fund
• Aviva Investors UK Equity MoM 3 Fund
• Aviva Investors US Equity MoM 1 Fund
• Aviva Investors Euro Equity MoM 1 Fund
• Aviva Investors Euro Equity MoM 2 Fund
• Aviva Investors Apac Equity MoM 1 Fund; and
• Aviva Investors EM Equity MoM 1 Fund.
With effect from 5 June 2019, the following funds commenced termination, and are no longer available for investment:
• Aviva Investors UK Equity MoM 2 Fund;
• Aviva Investors UK Equity MoM 3 Fund;
• Aviva Investors US Equity MoM 1 Fund;
• Aviva Investors Euro Equity MoM 1 Fund;
• Aviva Investors Euro Equity MoM 2 Fund;
• Aviva Investors Apac Equity MoM 1 Fund;
• Aviva Investors UK Gilts MoM 1 Fund;
• Aviva Investors UK Credit MoM 1 Fund;
• Aviva Investors Global Agg MoM 1 Fund; and
• Aviva Investors EM Equity MoM 1 Fund.
On 7 August 2019, the name of the Aviva Investors UK Equity MoM 1 Fund was changed to the Aviva Investors UK Listed Equity MoM 1 Fund. At the same time, the ACD made a number of changes to that Fund’s investment objective and policy in response to new requirement set out in FCA PS19/04. These changes were communicated in a mailing to investors. If you want further information on the changes made, please see https://www.avivainvestors.com/en-gb/capabilities/ regulatory/amms/
REPORT OF THE AUTHORISED CORPORATE DIRECTOR
Aviva Investors Manager of Manager ICVC (ICVC2) Annual Report and Financial Statements for the year ended 31 July 2019 | avivainvestors.com
Company Information
4
REMUNERATION POLICYIn line with the requirements of the Undertakings for Collective Investment in Transferable Securities Directive V (“UCITS V”), Aviva Investors UK Fund Services Limited (“AIUKFSL”) is subject to a remuneration policy which is consistent with the principles outlined in the European Securities and Markets Authority guidelines on sound remuneration policies under the UCITS Directive.
Aviva Investors’ remuneration framework is based on a total reward approach and is designed to reflect the success or failure against a range of personal and company performance objectives. There are four components of pay: base salary; annual bonus (including deferred bonus); long term incentive plan; and benefits. Aviva believes in rewarding strong performance and the achievement of our business and individual goals; however, the manner in which these goals are achieved is also an important factor in determining outcomes. Annual bonus awards are discretionary and where bonuses are £75,000 and over, a 3 year deferral with pro-rata vesting in Aviva Investors funds and/or Aviva Group plc shares occurs.
The extent to which each aspect of performance affects the overall payment level depends on the role and responsibilities of the individual. Performance is measured against personal objectives, including Risk and Control objectives, as well as Aviva Investors’ and the business unit performance against agreed targets. a combination of individual, business unit, Aviva Investors and Group performance over an appropriate period.
The financial considerations includes the following comparisons:–• Actual results vs. prior period results• Actual results vs. agreed plans• Actual results relative to competitors• Actual results vs., and progress towards, our long-term
target ambition.• The non-financial considerations include risk, conduct, culture,
customer and employee engagement metrics, with Aviva values clearly underpinning all our decisions. In certain roles, adherence to Responsible Investment and ESG principles will also be a consideration.
• The Performance assessment does not encourage risk taking outside the Aviva Investors stated risk appetite, and includes mechanisms by which performance against risk and conduct related measures has a significant impact on the availability and size of business and individual variable awards.
The remuneration policies are designed to ensure that any relevant conflicts of interest can be managed appropriately at all times and that the remuneration of its senior staff is in line with the risk policies and objectives of the UCITS funds it manages, and takes into account the promotion of sound and effective risk management and the achievement of fair outcomes for all customers.
REPORT OF THE AUTHORISED CORPORATE DIRECTOR (CONTINUED)
AIUKFSL has no employees but is a wholly owned subsidiary of Aviva Investors Holdings Limited. For the year to 31 December 2018, apportioned remuneration based on the time assessed to be spent on AIUKFSL UCITS activity paid by Aviva Plc, the ultimate parent of AIUKFSL, to its senior management team, and staff whose actions have a material impact on the risk profile of AIUKFSL (“Code staff”), is as follows:
Senior Management Other Code Staff
Total Remuneration: £0.36m £0.38mOf which, Fixed Remuneration: 34% 39%
Variable Remuneration: 60% 54%Pension/Benefits: 6% 7%
Number of Code staff: 10 7
THE FINANCIAL STATEMENTSWe are pleased to present the annual financial statements of the Company for the year ended 31 July 2019. As required by the Regulations, information for each of the Funds has also been included in these financial statements. On the following pages we review the performance of each of those Funds during the year. We hope that you find our review useful and informative.
ANNUAL GENERAL MEETINGSThe Company will not be holding Annual General Meetings.

avivainvestors.com | Aviva Investors Manager of Manager ICVC (ICVC2) Annual Report and Financial Statements for the year ended 31 July 2019
Statement of Cross Holdings
5
STATEMENT OF CROSS HOLDINGS
There are no cross holdings as at 31 July 2019.

Aviva Investors Manager of Manager ICVC (ICVC2) Annual Report and Financial Statements for the year ended 31 July 2019 | avivainvestors.com
Policies and Risks
6
POLICIES AND RISKS
ACCOUNTING POLICIESa Basis of accountingThe financial statements have been prepared under the historical cost basis, as modified by the revaluation of investments, and in accordance with the Statement of Recommended Practice for UK Authorised Funds issued by the Investment Management Association (IMA) (now The Investment Association) in May 2014 (SORP 2014), and in accordance with United Kingdom Generally Accepted Accounting Practice as defined within FRS 102 The Financial Reporting Standard applicable in the UK and Republic of Ireland.
The Authorised Corporate Director intends to terminate the following funds:
• Aviva Investors UK Equity MoM 2 Fund;
• Aviva Investors US Equity MoM 1 Fund;
• Aviva Investors Euro Equity MoM 1 Fund;
• Aviva Investors Euro Equity MoM 2 Fund;
• Aviva Investors Apac Equity MoM 1 Fund;
• Aviva Investors EM Equity MoM 1 Fund;
• Aviva Investors Sterling Credit MoM 1 Fund
These Funds will be terminated at the earliest opportunity following approval of the financial statements and therefore the financial statements of these Funds have been prepared on a basis other than going concern and any additional costs in respect of the termination of these Funds will be borne by the ACD. Comparative financial information continues to be prepared under the going concern basis. In applying this basis of preparation, the assets and liabilities of this Fund continues to be stated at their fair value which materially equate to their realisable values. No adjustments were necessary in the Funds’ financial statements to reduce assets to their realisable values, to provide for liabilities arising from the termination or to reclassify fixed assets and long term liabilities as current assets and liabilities.
Aviva Investors UK Listed Equity High Alpha Fund, Aviva Investors UK Listed Equity MoM 1 Fund and Aviva Investors Japan Equity MoM 1 Fund have been prepared on a going concern basis.
b Share classesThe Funds have three types of share classes: retail shares (class 1), institutional shares (class 2) and shares held by associated undertakings of Aviva Plc (class 3). Each share class bears different charges and consequently the level of revenue allocated to each share class will differ. Some share classes consist of income shares only, whilst others consist of accumulation shares only.
c Recognition of revenueDividends are recognised when the investment is quoted ex-dividend. Interest arising on fixed interest stocks is recognised on an effective yield basis. Deposit interest and other revenues are recognised on an accruals basis.
Special dividends are either treated as income or capital depending on the facts of each dividend.
d ExpensesAll expenses, except those relating to the purchase and sale of investments and transaction charges, are charged to revenue of the respective Funds, on an accruals basis.
e Treatment of derivativesIn determining the accounting treatment for derivatives, consideration is given to the instrument itself and the Funds’ objectives for investment in derivative instruments.
Where positions are held to protect capital, the returns are treated as capital. Where positions are held to generate revenue, the returns are treated as revenue. Where positions generate total returns, these returns are apportioned between capital and revenue to properly reflect the nature of the transaction.
f Underwriting commission Underwriting commission is accounted for when the issue underwritten takes place and is normally taken to revenue. Where the Company is required to take up all the shares underwritten, the commission received is treated as a deduction from the cost of the shares taken up. Where the Company is required to take up a proportion of the shares underwritten, the same proportion of the commission received is treated as a deduction from the cost of shares taken up and the balance is taken to revenue.
g Dilution Levy PolicyThe Company reserves the right to charge a dilution levy (Investor Protection Fee) to protect existing investors in a fund from the costs of buying or selling investments that may result from the sale and/or purchase of shares in that Fund. The amount of any such dilution levy is calculated by reference to the estimated costs of dealing in the underlying investments, including any dealing spreads, broker commissions and taxes. When the Company impose a dilution levy on a particular investor or group of investors, this is paid into the Fund and helps to protect existing investors from the costs of the resultant transactions. For details of the circumstances in which a dilution levy may be imposed, dilution levies applied in a fund historically, and on what values, please see the Company’s Prospectus.
h Basis of valuation of investmentsQuoted investmentsThe quoted investments of the Company have been valued at bid market value at 2pm on the last working day of the accounting period for all Funds with the exception of the Aviva Investors UK Listed Equity High Alpha Fund which has been valued at midday. Investments in Luxembourg SICAVs are valued using their single quoted price.
Unquoted and unapproved investmentsThe unquoted and unapproved investments of the Company have been valued by the Investment Manager using available information, such as recent transaction prices, valuations from reliable sources, financial performance and other relevant factors, to arrive at an estimated fair value.
Suspended securitiesSuspended securities have been valued at the suspended market price per share or valued by the Investment Manager using available information to arrive at an estimated fair value.
Delisted securitiesDelisted securities have been valued at nil pence per share.
Forward foreign currency contractsThe Company’s forward foreign currency positions on the last working day of the accounting period are included in the portfolio statement as an asset or liability so as to reflect the value of each contract.

avivainvestors.com | Aviva Investors Manager of Manager ICVC (ICVC2) Annual Report and Financial Statements for the year ended 31 July 2019
Policies and Risks
7
POLICIES AND RISKS (CONTINUED)
FINANCIAL INSTRUMENTSThe Company’s financial instruments, other than derivatives, comprise securities and other investments, cash balances and debtors and creditors that arise directly from its operations, for example, in respect of sales and purchases awaiting settlement, amounts receivable for creations and payable for liquidations, and debtors for accrued income.
The Company also enters into derivative transactions including but not limited to, in the form of forward foreign currency contracts, credit default swaps, interest rate swaps, equity variance swaps, options and stock index futures.
The Company uses these financial instruments as a cheaper or more liquid alternative to other investments, to hedge or reduce overall risk, or in pursuit of its investment objectives. In particular, forward foreign currency contracts are used to manage currency risk arising from holdings of overseas securities. Stock index futures are used to manage market price risk arising from the time lag between funds being receivable or payable by the Company and investment or disinvestment in underlying securities. Options are used to generate additional income.
Interest rate swaps and swaptions are generally held to mitigate exposure to interest rate movements which could adversely affect the value of bonds held within the fund portfolios. Credit default swaps are used to manage credit and seek specific credit exposure through buying and selling protection.
Interest and finance charges from interest rate swaps are taken to revenue. The premiums from credit default swaps are taken to revenue. The gains and losses on interest rate swaps and credit default swaps are taken to capital.
The Company has exposure to a number of different risks to varying degrees. The main risks it faces from its financial instruments and the Manager’s policies for managing these risks are summarised below:
a Foreign currency riskThe Funds can be exposed to foreign currency risk as a result of investing in assets denominated in currencies other than Sterling. Where the manager deems it necessary, this exposure to foreign currency fluctuations is mitigated by the use of forward foreign currency contracts. Numerical disclosures can be found in the notes to the financial statements for each Fund.
b Interest rate riskThe value of debt securities may be affected by interest rate movements or the expectation of such movements in the future. Interest receivable on bank deposits or payable on bank overdraft positions will be affected by fluctuations in interest rates. The Investment Manager manages this risk by maintaining a balanced portfolio with due consideration to interest rate and redemption profiles. Interest rate risk is also managed by ensuring that deposits mature within a relatively short period. Where relevant, numerical disclosures can be found in the notes to the financial statements for each Fund.
ACCOUNTING POLICIES (CONTINUED)Over the counter (OTC) derivativesOTC derivatives are either valued by the relevant counterparty or by the Investment Manager using available information to arrive at an estimated fair value.
Exchange traded derivatives (ETDs)ETDs are included at the aggregate unrealised market value of the open contracts.
CIS investmentsCIS investments are valued at the last share price available at the valuation point.
i Exchange ratesAssets and liabilities held in foreign currencies are translated at the rate ruling at 2pm on the last working day of the accounting period for all Funds with the exception of the Aviva Investors UK Listed Equity High Alpha Fund which was translated at midday. Revenue and expenditure items are translated at the rate ruling at the date of the transaction.
j Taxation and deferred taxationProvision for Corporation Tax is based at the current rate, as appropriate, on the excess of taxable revenue over allowable expenses, with relief for overseas taxation taken as appropriate. Deferred taxation is provided using the liability method on all timing differences that have originated but not reversed at the balance sheet date, calculated at the rate for the period in which it is anticipated the timing differences will reverse, based on rates that have been enacted or substantially enacted at the balance sheet date. Deferred tax assets are recognised only when, on the basis of available evidence, it is more likely than not that there will be taxable profits in the future against which the deferred tax asset can be offset.
DISTRIBUTION POLICIESa Distribution policyWhere appropriate, the Company will pay any surplus revenue as a revenue distribution or accumulation of capital. The Aviva Investors Sterling Credit MoM 1 Fund (closed on 6 December 2017) was more than 60% invested in qualifying investments (as defined by the relevant legislation) and paid interest distributions. All the other Funds pay dividend distributions.
Full details are set out in the distribution tables.
b Treatment of stock dividendsThe ordinary element of stock dividends is treated as revenue and forms part of the Fund’s distribution. The value of the stock dividend is based on the market value of the shares on the dates they are quoted ex-dividend. Where an enhancement is offered, the amount by which the market value of the shares (on the date they are quoted ex-dividend) exceeds the cash dividend is treated as capital.
c Treatment of management expensesThe ACD’s periodic charge is charged to income of all the Funds except for Aviva Investors Sterling Credit MoM 1 Fund (closed on 6 December 2017) which offset the ACD’s periodic charge to capital for the purpose of the distribution.
All other expenses, except those relating to the purchase and sale of investments, are charged against revenue. Expenses are accounted for on an accruals basis.

Aviva Investors Manager of Manager ICVC (ICVC2) Annual Report and Financial Statements for the year ended 31 July 2019 | avivainvestors.com
Policies and Risks
8
POLICIES AND RISKS (CONTINUED)
FINANCIAL INSTRUMENTS (CONTINUED)c Market riskThe Funds‘ investment portfolios are exposed to market price fluctuations which are monitored by the Manager in pursuance of the investment objectives and policies of the Funds. Adherence to investment and borrowing powers set out in the Instrument of Incorporation and in the Collective Investment Schemes Sourcebook of the Financial Conduct Authority, mitigates the risk of excessive exposure to any particular type of security or issuer.
Further information on the investment portfolios is set out in the investment reports and portfolio statements, of the individual Funds.
d Credit riskThe Funds restrict their exposure to credit losses on derivative instruments by trading via International Swap and Derivative Association (ISDA) Master Arrangements with each counterparty.
The Funds are exposed to the risk that a bond issuer may default on the interest payments or the redemption of the bond. The Funds manage this risk by maintaining a balanced portfolio with due consideration to interest rate and redemption profiles and the credit worthiness of the bond issuer.
e Liquidity riskThis is the risk that there is insufficient liquidity which restricts a Fund’s investment opportunities or ability to pay liabilities at short notice. This risk is managed by ensuring that overdrafts are monitored and maintained within investment limits and exposure to unquoted or illiquid securities is limited.
f Counterparty RiskThere is a risk that the Counterparty will not be able to settle its obligations under the agreement. This is mitigated by an assessment of the credit worthiness of the Counterparty, and the use of multiple counterparties to ensure that no more than 20% of the Fund value is exposed to one counterparty.
Further information on the investment portfolio is set out in the investment reports and portfolio statements.
avivainvestors.com | Aviva Investors Manager of Manager ICVC (ICVC2) Annual Report and Financial Statements for the year ended 31 July 2019
Aviva Investors UK Listed Equity High Alpha Fund
9
The name of the Fund was changed from the Aviva Investors UK Opportunities Fund on 2 January 2019.
INVESTMENT OBJECTIVEThe Fund aims to grow your investment and generate a higher return than the FTSE® All-Share Index over the long term (5 years or more) by investing in shares of UK companies.
INVESTMENT POLICYCore investment: At least 80% of the Fund will be invested in shares of UK companies, or non-UK companies which are listed in the UK or which have significant trading activities in the UK.
Other investments: The Fund may also invest in shares of unlisted companies, other funds, (including funds managed by Aviva Investors companies), cash and deposits.
Strategy: The Fund is actively managed, and the Investment Manager generally takes a medium-term outlook when selecting companies with the aim of generating a higher return than the FTSE® All-Share Index (this is also known as generating “alpha”). The Investment Manager will invest in opportunities which may be viewed as contrarian to the overall market, but does not adopt a style bias. This will result in the Fund taking high conviction positions in companies where the manager believes future earnings growth prospects are undervalued by the market. In addition, there are often companies where the Investment Manager has identified catalysts for recovery such as management change or an improving business environment. This investment approach may result in higher risk or price volatility with the aim to generate a higher return than the Index over the long term (“alpha”).
The process for making investment decisions follows detailed analysis based on a wide range of financial metrics and research. This includes consideration of environmental, social and governance (ESG) criteria, but there are no specific ESG restrictions on the Investment Manager’s decision making, which is in line with the Fund’s objectives. Decisions are supported by active engagement with companies and use of voting rights, with the intention of positively influencing company behaviour to contribute to competitive returns. Further information regarding how we integrate ESG into our investment approach and how we engage with companies is available on our website and in the prospectus.
Performance and Risk Measurement: The Fund’s performance is compared against the FTSE® AllShare Index (the “Index”).
The Fund does not base its investment process upon the Index, so will not hold every company in the Index and will also hold companies that do not form part of it.
The Fund uses a “tracking error” to measure the variation between the Fund’s returns and the returns of the Index. In general, the lower the tracking error, the more closely the Index is tracked by the Fund, and vice-versa. The Fund is expected to have an average yearly tracking error of between 3% and 8% when compared to the Index. In certain conditions the Fund may be outside of this range.
The FTSE® All Share Index represents the performance of all eligible companies listed on the London Stock Exchange, and 98% of the UK’s market capitalisation (total market value of a company’s outstanding shares).
The benchmark index has been selected for performance and risk measurement because it is representative of the type of companies in which the Fund is likely to invest, and it is therefore an appropriate comparator for the Fund’s performance
FUND MANAGER’S REPORTPerformanceOver the twelve months ended 31 July 2019 the Fund* returned (12.52)% (net of fees). The Fund’s benchmark, the FTSE® All-Share Index, returned 1.27% over the same period.
Over a 5-year rolling period ended 31 July 2019 the Fund (net of fees) delivered a return of 2.99% compared with a return of 6.80% for the FTSE® All-Share Index benchmark, an underperformance of 3.81%.
ReviewDuring the fourth quarter of 2018, escalating trade tensions between the US and China and concerns that the Federal Reserve (Fed) had tightened US monetary policy too aggressively unsettled investors. Accordingly, equity markets worldwide recorded sharp falls. Since the turn of the calendar year, global equity indices have rebounded despite volatility briefly reasserting itself as US-China trade tensions escalated in May. The catalyst for the turnaround came with a change in direction at the US Federal Reserve, which back-tracked from its tightening monetary policy and confirmed there would be no further interest rate hikes this year before opting to cut its key Fed Funds rate by 0.25% at the end of the review period.
The UK equity market gained ground but underperformed global indices over the review period. Uncertainty over Brexit negotiations, and the terms of the UK’s exit from the EU, has weighed on investor sentiment. The risk of a disorderly Brexit increased in July, with the new Prime Minister emphasising the desire to leave the EU ‘come what may’ by the end of October. After UK economic growth picked up during the first quarter, with businesses stockpiling as a contingency measure in the event of a disorderly exit from the EU, the economy shrank during the second quarter for the first time in almost seven years. Stockpiling activity slowed and Brexit uncertainty intensified against a backdrop of weaker global growth.
Despite policy mitigation, Chinese stimulus and lower US interest rates, markets and business sentiment have remained defensive. Consequently, the performance trends seen in 2018 have continued into 2019 with financials and economically sensitive sectors performing poorly versus less cyclical areas such as healthcare and consumer staples. Increased perceived risks of a UK and/or global recession have been the key drivers of share price performance, overriding relative valuations.
Throughout the review period, we positioned the portfolio towards economically sensitive and domestically-focused stocks. Valuations in these areas of the UK equity market remain extremely depressed due to concerns over the risk of a pronounced economic slowdown or recession, in the event of a disorderly ‘no deal’ Brexit or a prolonged US-led trade war.
AVIVA INVESTORS UK LISTED EQUITY HIGH ALPHA FUND
Aviva Investors Manager of Manager ICVC (ICVC2) Annual Report and Financial Statements for the year ended 31 July 2019 | avivainvestors.com
Aviva Investors UK Listed Equity High Alpha Fund
10
AVIVA INVESTORS UK LISTED EQUITY HIGH ALPHA FUND (CONTINUED)
FUND MANAGER’S REPORT (CONTINUED)As a result, the negative impact on earnings and valuations of these stocks, particularly relative to more defensive sectors, has been almost fully discounted by the market. However, there remains still the prospect that economic logic prevails, and that the worst-case scenarios of a disorderly Brexit or global tariff wars do not materialise. This would provide the opportunity for a re-rating for economically sensitive and domestically- focused stocks.
The Fund remains particularly exposed to the industrials and materials sectors, focusing on companies where we believe the through-cycle earnings prospects are undervalued. Current holdings include mining group Anglo American, chemical maker Elementis, packaging group DS Smith and airline IAG. Domestic stocks where valuations have been hit by ongoing Brexit worries combined with a weak sterling are also overweighted in the portfolio. Notable examples are pub group Mitchells & Butler, retailer Dixons Carphone, commercial property group Land Securities, Tesco and Barclays. Traditional valuations of these stocks such as price to earnings, price to book and dividend yield are attractive on an absolute and relative basis to the market and company valuation histories.
In contrast, the Fund has low exposure to growth stocks, and less cyclical sectors such as consumer staples and healthcare, where valuations are high on a relative and historical basis. As a result, we do not hold positions in beverages group Diageo, pharmaceutical AstraZeneca and household goods supplier Unilever.
Fund performance was disappointing over the review period, primarily due to our positioning bias towards domestic and cyclical value stocks, and away from defensive growth stocks with relatively high valuations. A few stock specific positons have been misjudged, most notably Thomas Cook. The travel group had announced a rescue deal with Chinese backer Forsun that would see it take a majority stake in Thomas Cook’s tour operating business and a minority stake in the airline business, in exchange for £750m funding. Given previous reassurances we had received from management regarding the company’s funding position, we were disappointed when this deal was announced and we have exited this holding. Since exiting this holding Thomas Cook have announced that they have gone into administration.
Looking at fund activity, we participated in the IPO of travel booking app Trainline, as the company has strong growth prospects in Europe. Additions have also been made to UK-centric holdings that had lagged due to Brexit fears and where valuations remained compelling, such as BT, Land Securities and Barclays. Oil stocks which had also fallen back on global growth concerns, Premier Oil and Wood Group, were also increased. We added to our position in chemical maker Elementis following positive results which demonstrated improved trading. Our holding in construction group Morgan Sindall was increased after recent weakness given a positive outlook for its construction and regeneration business. Against this, holdings in DS Smith, Mitchells & Butler and Standard Chartered were reduced as the review period ended, after strong relative performance, as well as Shell, which performed well post its strategy day. All stocks mentioned remain significant holdings.
OutlookLooking forward, Brexit and global trade risks continue to weigh heavily on market sentiment, with economically sensitive stocks and financials on heavily discounted valuations relative to non-cyclical stocks. Global recession concerns remain high, while sterling weakness and the low valuation of UK domestic-oriented stocks are now close to discounting all but the worst-case Brexit scenarios. Any resolution of US and Chinese trade negotiations and Brexit should significantly benefit the Fund’s performance, while downside risks are more fully discounted. We believe the balance of probabilities now strongly favours our portfolio positioning, while this is reinforced at the stock specific level where individual company analysis substantiates our top-down valuation comparatives. This should over time see a re-rating of our holdings versus the rest of the market and deliver relative improved performance against the Fund’s benchmark.
September 2019* Fund performance figures – share class 1, source Lipper Hindsight, net of fees, net income reinvested in GBP. Unless otherwise indicated, all data has been sourced by Aviva Investors Global Services Limited.As noted above, the performance figures in this commentary have been sourced from an external party and are based on published prices. The performance figures quoted in the comparative tables on page 12 are based on the net asset value per the published accounts and may be different due to post year end accounting adjustments. “FTSE” is a trade mark jointly acquired by the London Stock Exchange Plc and The Financial Times Limited and is used by FTSE International Limited (“FTSE”) under Licence. FTSE does not sponsor, endorse or promote this product and is not in any way connected to it and does not accept any liability in relation to its issue, operation and trading. All copyright in the index values and constituent list vests in FTSE. Any opinions expressed are those of the Fund manager. They should not be viewed as a guarantee of a return from an investment in the Funds. The content of the commentary should not be viewed as a recommendation to invest nor to buy or sell stocks. Past performance is not a guide to future performance. The value of an investment in the Fund and any income from it may go down as well as up, and the investor may not get back the original amount invested.
Material Portfolio ChangesPurchases Sales
Aviva Investors Sterling Liquidity Fund Class 3, Income shares, GBP
Aviva Investors Sterling Liquidity Fund Class 3, Income shares, GBP
British American Tobacco HSBC Holdings
Thomas Cook Group BP
Elementis Energean Oil & Gas
Kier Group Cineworld Group
Land Securities Group Imperial Brands
BP ITV
John Wood Group Vodafone Group
GVC Holdings Countryside Properties
Premier Oil British American Tobacco

avivainvestors.com | Aviva Investors Manager of Manager ICVC (ICVC2) Annual Report and Financial Statements for the year ended 31 July 2019
Aviva Investors UK Listed Equity High Alpha Fund
11
AVIVA INVESTORS UK LISTED EQUITY HIGH ALPHA FUND (CONTINUED)
Synthetic Risk and Reward Indicator
Lower risk Higher risk
Typically lower rewards Typically higher rewards
1 2 3 4 5 6 7The Fund has been allocated a risk number based on the historic volatility of its share price. Where insufficient share price information is available, the risk number has been based on the historic volatility of the asset classes appropriate to the Fund.– This indicator is based on historical data, calculated using European Union
rules, and may not be a reliable indication of the future risk profile of the Fund.
– Investment may be restricted to a limited number of holdings, industries, or Countries. The Fund share price may be more exposed to specific events and as a result may experience large daily price changes.
– The risk and reward category shown is not guaranteed to remain unchanged and may change over time. The lowest category does not mean ‘risk free’.
– Further information on the risks applicable to the Fund is detailed in the Fund’s Key Investor Information Document, and a full description is set out in the Prospectus, both of which are available on the internet at www.avivainvestors.com or from the ACD on request.
Aviva Investors Manager of Manager ICVC (ICVC2) Annual Report and Financial Statements for the year ended 31 July 2019 | avivainvestors.com
Aviva Investors UK Listed Equity High Alpha Fund
12
Class 1 Accumulation 2019
p per share2018
p per share2017
p per share
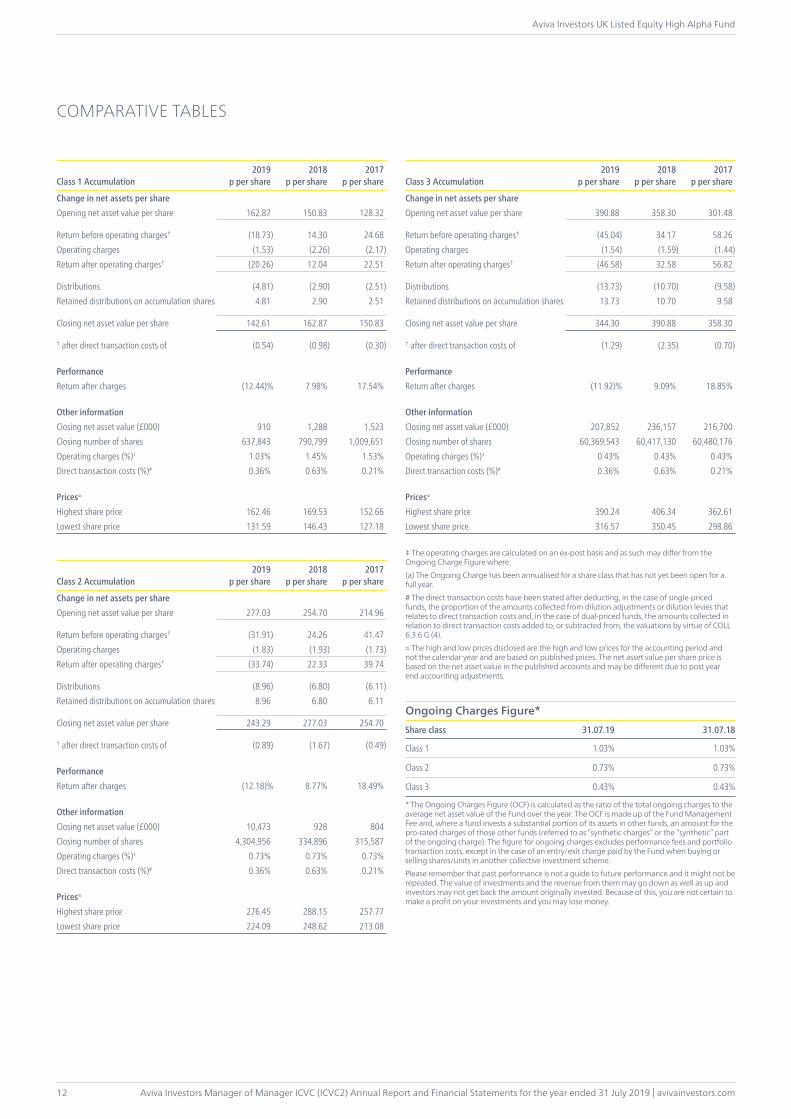
Change in net assets per shareOpening net asset value per share 162.87 150.83 128.32
Return before operating charges† (18.73) 14.30 24.68Operating charges (1.53) (2.26) (2.17)Return after operating charges† (20.26) 12.04 22.51
Distributions (4.81) (2.90) (2.51)Retained distributions on accumulation shares 4.81 2.90 2.51
Closing net asset value per share 142.61 162.87 150.83
† after direct transaction costs of (0.54) (0.98) (0.30)
PerformanceReturn after charges (12.44)% 7.98% 17.54%
Other informationClosing net asset value (£000) 910 1,288 1,523Closing number of shares 637,843 790,799 1,009,651Operating charges (%)‡ 1.03% 1.45% 1.53%Direct transaction costs (%)# 0.36% 0.63% 0.21%
Prices≈
Highest share price 162.46 169.53 152.66Lowest share price 131.59 146.43 127.18
Class 2 Accumulation2019
p per share2018
p per share2017
p per share
Change in net assets per shareOpening net asset value per share 277.03 254.70 214.96
Return before operating charges† (31.91) 24.26 41.47Operating charges (1.83) (1.93) (1.73)Return after operating charges† (33.74) 22.33 39.74
Distributions (8.96) (6.80) (6.11)Retained distributions on accumulation shares 8.96 6.80 6.11
Closing net asset value per share 243.29 277.03 254.70
† after direct transaction costs of (0.89) (1.67) (0.49)
PerformanceReturn after charges (12.18)% 8.77% 18.49%
Other informationClosing net asset value (£000) 10,473 928 804Closing number of shares 4,304,956 334,896 315,587Operating charges (%)‡ 0.73% 0.73% 0.73%Direct transaction costs (%)# 0.36% 0.63% 0.21%
Prices≈
Highest share price 276.45 288.15 257.77Lowest share price 224.09 248.62 213.08
Class 3 Accumulation2019
p per share2018
p per share2017
p per share
Change in net assets per shareOpening net asset value per share 390.88 358.30 301.48
Return before operating charges† (45.04) 34.17 58.26Operating charges (1.54) (1.59) (1.44)Return after operating charges† (46.58) 32.58 56.82
Distributions (13.73) (10.70) (9.58)Retained distributions on accumulation shares 13.73 10.70 9.58
Closing net asset value per share 344.30 390.88 358.30
† after direct transaction costs of (1.29) (2.35) (0.70)
PerformanceReturn after charges (11.92)% 9.09% 18.85%
Other informationClosing net asset value (£000) 207,852 236,157 216,700Closing number of shares 60,369,543 60,417,130 60,480,176Operating charges (%)‡ 0.43% 0.43% 0.43%Direct transaction costs (%)# 0.36% 0.63% 0.21%
Prices≈
Highest share price 390.24 406.34 362.61Lowest share price 316.57 350.45 298.86
‡ The operating charges are calculated on an ex-post basis and as such may differ from the Ongoing Charge Figure where:(a) The Ongoing Charge has been annualised for a share class that has not yet been open for a full year.# The direct transaction costs have been stated after deducting, in the case of single-priced funds, the proportion of the amounts collected from dilution adjustments or dilution levies that relates to direct transaction costs and, in the case of dual-priced funds, the amounts collected in relation to direct transaction costs added to, or subtracted from, the valuations by virtue of COLL 6.3.6 G (4).≈ The high and low prices disclosed are the high and low prices for the accounting period and not the calendar year and are based on published prices. The net asset value per share price is based on the net asset value in the published accounts and may be different due to post year end accounting adjustments.
Ongoing Charges Figure*Share class 31.07.19 31.07.18
Class 1 1.03% 1.03%
Class 2 0.73% 0.73%
Class 3 0.43% 0.43%
* The Ongoing Charges Figure (OCF) is calculated as the ratio of the total ongoing charges to the average net asset value of the Fund over the year. The OCF is made up of the Fund Management Fee and, where a fund invests a substantial portion of its assets in other funds, an amount for the pro-rated charges of those other funds (referred to as “synthetic charges” or the “synthetic” part of the ongoing charge). The figure for ongoing charges excludes performance fees and portfolio transaction costs, except in the case of an entry/exit charge paid by the Fund when buying or selling shares/units in another collective investment scheme.Please remember that past performance is not a guide to future performance and it might not be repeated. The value of investments and the revenue from them may go down as well as up and investors may not get back the amount originally invested. Because of this, you are not certain to make a profit on your investments and you may lose money.
COMPARATIVE TABLES

avivainvestors.com | Aviva Investors Manager of Manager ICVC (ICVC2) Annual Report and Financial Statements for the year ended 31 July 2019
Aviva Investors UK Listed Equity High Alpha Fund
13
PORTFOLIO STATEMENTAs at 31 July 2019
Investment Currency HoldingMarket Value
£000 % of Net Assets
Equities 99.43% (97.37%)
Communication Services 5.38% (11.09%)Diversified Telecommunication Services 1.96% (1.86%)BT Group GBP 2,236,006 4,306 1.96 4,306 1.96
Entertainment 1.45% (3.12%)Cineworld Group GBP 1,238,601 3,173 1.45 3,173 1.45
Media 1.97% (4.10%)Next Fifteen Communications Group# GBP 721,366 4,328 1.97 4,328 1.97
Wireless Telecommunication Services 0.00% (2.01%)Communication Services total 11,807 5.38
Consumer Discretionary 12.70% (4.74%)Distributors 1.51% (0.96%)Inchcape GBP 527,078 3,313 1.51 3,313 1.51
Hotels, Restaurants & Leisure 5.11% (0.00%)888 Holdings GBP 2,269,954 3,487 1.59GVC Holdings GBP 666,239 3,995 1.82Mitchells & Butlers GBP 1,220,401 3,722 1.70 11,204 5.11
Household Durables 3.31% (2.88%)Bellway GBP 224,701 6,689 3.05Countryside Properties GBP 195,899 573 0.26 7,262 3.31
Internet & Direct Marketing Retail 1.08% (0.00%)Trainline GBP 562,791 2,369 1.08 2,369 1.08
Multiline Retail 0.00% (0.90%)
Specialty Retail 1.69% (0.00%)Dixons Carphone GBP 3,027,552 3,692 1.69 3,692 1.69Consumer Discretionary total 27,840 12.70
Consumer Staples 6.08% (3.41%)Food & Staples Retailing 2.18% (1.06%)Tesco GBP 2,140,312 4,779 2.18 4,779 2.18
Tobacco 3.90% (2.35%)British American Tobacco GBP 288,405 8,551 3.90 8,551 3.90Consumer Staples total 13,330 6.08
Energy 19.27% (19.99%)Energy Equipment & Services 3.76% (3.54%)Gulf Marine Services GBP 8,999,772 857 0.39John Wood Group GBP 1,358,582 7,390 3.37 8,247 3.76
Aviva Investors Manager of Manager ICVC (ICVC2) Annual Report and Financial Statements for the year ended 31 July 2019 | avivainvestors.com
Aviva Investors UK Listed Equity High Alpha Fund
14
PORTFOLIO STATEMENT (CONTINUED)As at 31 July 2019
Investment Currency HoldingMarket Value
£000 % of Net Assets
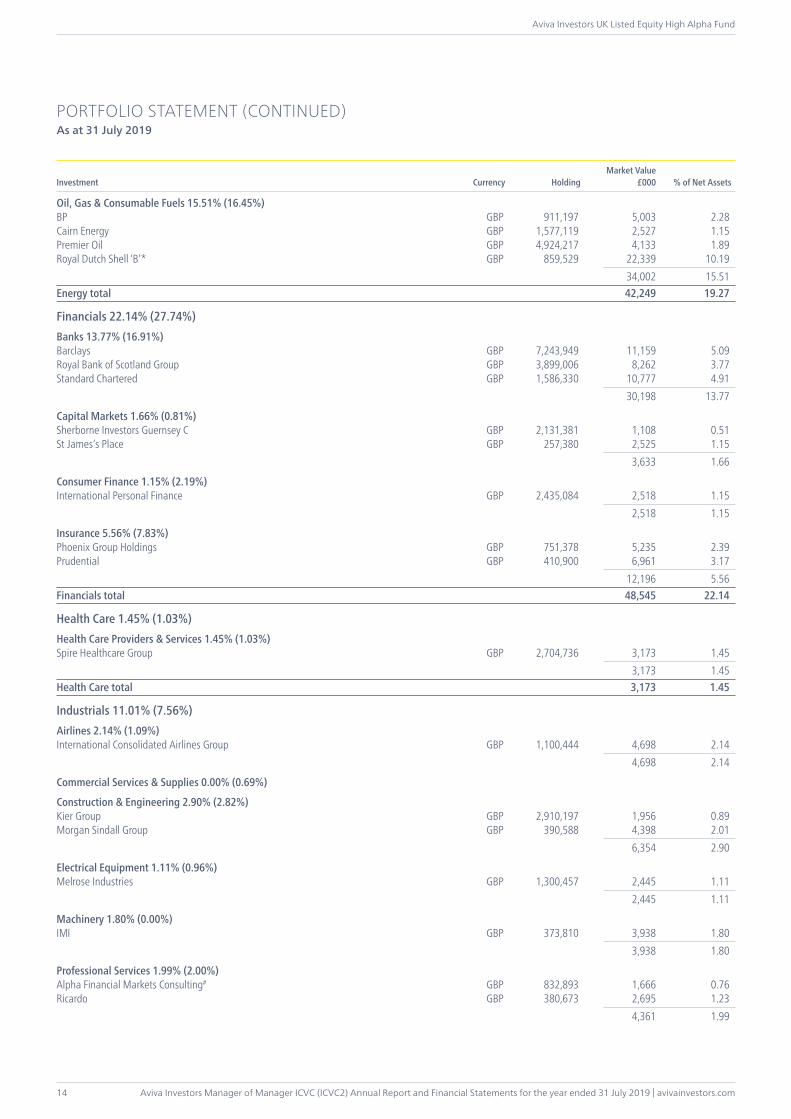
Oil, Gas & Consumable Fuels 15.51% (16.45%)BP GBP 911,197 5,003 2.28Cairn Energy GBP 1,577,119 2,527 1.15Premier Oil GBP 4,924,217 4,133 1.89Royal Dutch Shell ‘B’* GBP 859,529 22,339 10.19 34,002 15.51Energy total 42,249 19.27
Financials 22.14% (27.74%)Banks 13.77% (16.91%)Barclays GBP 7,243,949 11,159 5.09Royal Bank of Scotland Group GBP 3,899,006 8,262 3.77Standard Chartered GBP 1,586,330 10,777 4.91 30,198 13.77
Capital Markets 1.66% (0.81%)Sherborne Investors Guernsey C GBP 2,131,381 1,108 0.51St James’s Place GBP 257,380 2,525 1.15 3,633 1.66
Consumer Finance 1.15% (2.19%)International Personal Finance GBP 2,435,084 2,518 1.15 2,518 1.15
Insurance 5.56% (7.83%)Phoenix Group Holdings GBP 751,378 5,235 2.39Prudential GBP 410,900 6,961 3.17 12,196 5.56Financials total 48,545 22.14
Health Care 1.45% (1.03%)Health Care Providers & Services 1.45% (1.03%)Spire Healthcare Group GBP 2,704,736 3,173 1.45 3,173 1.45Health Care total 3,173 1.45
Industrials 11.01% (7.56%)Airlines 2.14% (1.09%)International Consolidated Airlines Group GBP 1,100,444 4,698 2.14 4,698 2.14
Commercial Services & Supplies 0.00% (0.69%)
Construction & Engineering 2.90% (2.82%)Kier Group GBP 2,910,197 1,956 0.89Morgan Sindall Group GBP 390,588 4,398 2.01 6,354 2.90
Electrical Equipment 1.11% (0.96%)Melrose Industries GBP 1,300,457 2,445 1.11 2,445 1.11
Machinery 1.80% (0.00%)IMI GBP 373,810 3,938 1.80 3,938 1.80
Professional Services 1.99% (2.00%)Alpha Financial Markets Consulting# GBP 832,893 1,666 0.76Ricardo GBP 380,673 2,695 1.23 4,361 1.99

avivainvestors.com | Aviva Investors Manager of Manager ICVC (ICVC2) Annual Report and Financial Statements for the year ended 31 July 2019
Aviva Investors UK Listed Equity High Alpha Fund
15
PORTFOLIO STATEMENT (CONTINUED)As at 31 July 2019
Investment Currency HoldingMarket Value
£000 % of Net Assets
Trading Companies & Distributors 1.07% (0.00%)Grafton Group GBP 318,006 2,345 1.07 2,345 1.07Industrials total 24,141 11.01
Information Technology 0.00% (1.05%)IT Services 0.00% (1.05%)
Software 0.00% (0.00%)Izodia^ GBP 1,192,922 – – – –Information Technology total – –
Materials 19.41% (19.39%)Chemicals 2.15% (0.00%)Elementis GBP 3,141,953 4,707 2.15 4,707 2.15
Construction Materials 1.79% (2.28%)CRH GBP 142,632 3,927 1.79 3,927 1.79
Containers & Packaging 2.97% (3.54%)DS Smith GBP 1,783,178 6,503 2.97 6,503 2.97
Metals & Mining 12.50% (13.57%)Anglo American GBP 418,370 8,616 3.93BHP Group GBP 414,516 8,278 3.77Glencore GBP 3,535,799 9,513 4.34Petra Diamonds GBP 8,477,533 1,000 0.46 27,407 12.50Materials total 42,544 19.41
Real Estate 1.99% (1.37%)Equity Real Estate Investment Trusts (REITs) 1.99% (1.37%)Land Securities Group GBP 543,256 4,358 1.99 4,358 1.99Real Estate total 4,358 1.99
Equities total 217,987 99.43
Liquidity Funds 0.73% (0.00%)Aviva Investors Sterling Liquidity Fund Class 3, Income shares, GBP† GBP 1,600,000 1,600 0.73Liquidity Funds total 1,600 0.73
Investment assets 219,587 100.16Net other liabilities (352) (0.16)Net assets 219,235 100.00
All holdings are ordinary shares or stock units and admitted to an official stock exchange unless otherwise stated.The comparative percentage figures in brackets are as at 31 July 2018.# Security traded on another regulated market.^ Unlisted, suspended or delisted security.† A related party to the Fund.* As at period end, the security was in breach of the UCITS concentration regulations COLL 5.2.11 R (5)). As of the date of publication of the accounts (29 November 2019), the security is no longer in breach.
Aviva Investors Manager of Manager ICVC (ICVC2) Annual Report and Financial Statements for the year ended 31 July 2019 | avivainvestors.com
Aviva Investors UK Listed Equity High Alpha Fund
16
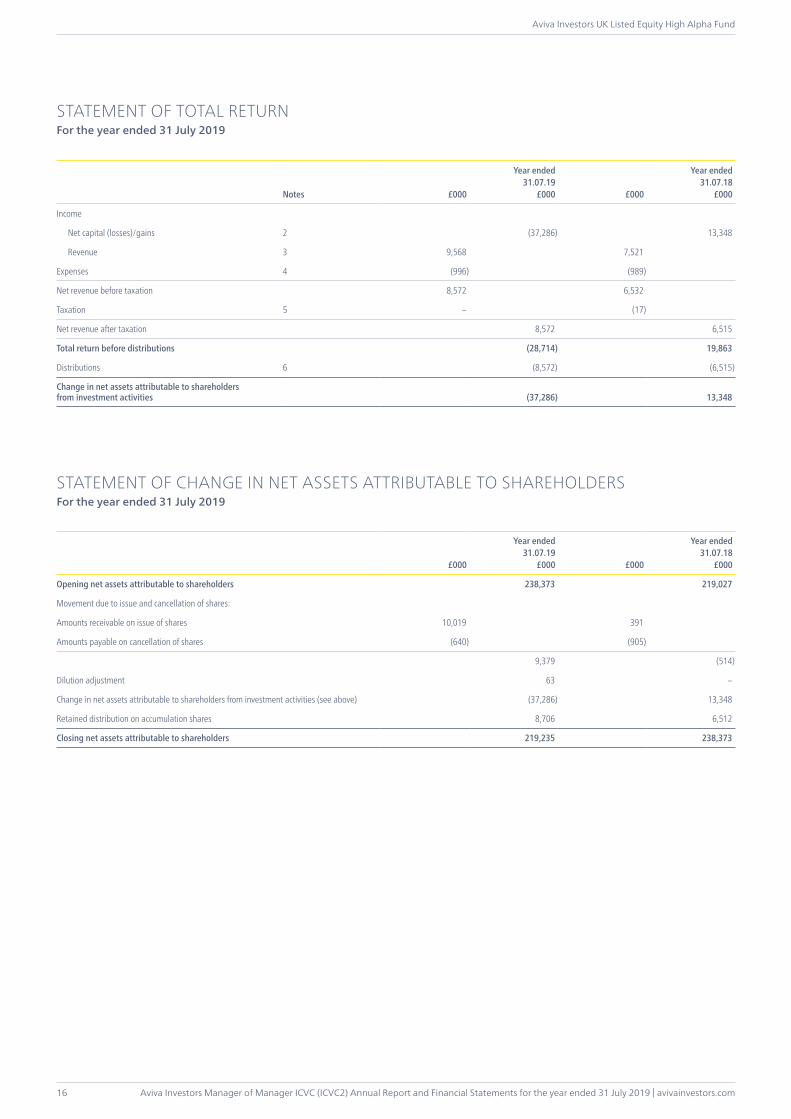
Notes £000
Year ended31.07.19
£000 £000
Year ended31.07.18
£000
Income
Net capital (losses)/gains 2 (37,286) 13,348
Revenue 3 9,568 7,521
Expenses 4 (996) (989)
Net revenue before taxation 8,572 6,532
Taxation 5 – (17)
Net revenue after taxation 8,572 6,515
Total return before distributions (28,714) 19,863
Distributions 6 (8,572) (6,515)
Change in net assets attributable to shareholders from investment activities (37,286) 13,348
STATEMENT OF CHANGE IN NET ASSETS ATTRIBUTABLE TO SHAREHOLDERSFor the year ended 31 July 2019
£000
Year ended31.07.19
£000 £000
Year ended31.07.18
£000
Opening net assets attributable to shareholders 238,373 219,027
Movement due to issue and cancellation of shares:
Amounts receivable on issue of shares 10,019 391
Amounts payable on cancellation of shares (640) (905)
9,379 (514)
Dilution adjustment 63 –
Change in net assets attributable to shareholders from investment activities (see above) (37,286) 13,348
Retained distribution on accumulation shares 8,706 6,512
Closing net assets attributable to shareholders 219,235 238,373
STATEMENT OF TOTAL RETURNFor the year ended 31 July 2019
avivainvestors.com | Aviva Investors Manager of Manager ICVC (ICVC2) Annual Report and Financial Statements for the year ended 31 July 2019
Aviva Investors UK Listed Equity High Alpha Fund
17
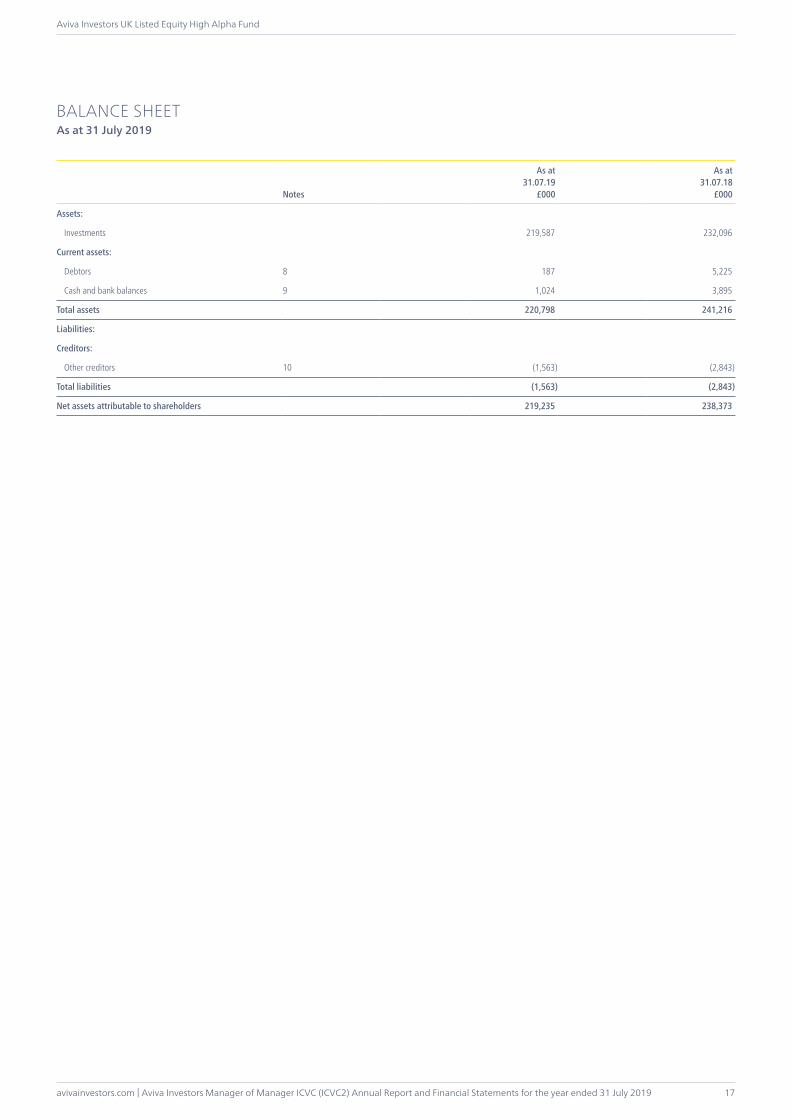
Notes
As at31.07.19
£000
As at31.07.18
£000
Assets:
Investments 219,587 232,096
Current assets:
Debtors 8 187 5,225
Cash and bank balances 9 1,024 3,895
Total assets 220,798 241,216
Liabilities:
Creditors:
Other creditors 10 (1,563) (2,843)
Total liabilities (1,563) (2,843)
Net assets attributable to shareholders 219,235 238,373
BALANCE SHEETAs at 31 July 2019

Aviva Investors Manager of Manager ICVC (ICVC2) Annual Report and Financial Statements for the year ended 31 July 2019 | avivainvestors.com
Aviva Investors UK Listed Equity High Alpha Fund
18
1 Accounting basis and policiesPlease see pages 6 to 8 for accounting basis and policies.
2 Net capital (losses)/gains
Year ended31.07.19
£000
Year ended31.07.18
£000
Net capital (losses)/gains on investment during the year comprise:
Currency gains 29 –
Expenses relating to the purchase and sale of investments – (3)
Non-derivative securities (losses)/gains (37,315) 13,351
Net capital (losses)/gains (37,286) 13,348
3 Revenue
Year ended31.07.19
£000
Year ended31.07.18
£000
Bank and deposit interest 5 6
Interest on debt securities 8 17
Overseas dividends 1,559 518
Property income distributions 221 58
UK dividends 7,768 6,922
Underwriting commission 7 –
Total revenue 9,568 7,521
4 Expenses
Year ended31.07.19
£000
Year ended31.07.18
£000
Payable to the Authorised Corporate Director (“ACD”), associates of the ACD or agents of either of them:
Fund Management Fee/ACD periodic charges* 995 940
Registration fees – 9
995 949
Payable to the Depositary, associates of the Depositary or agents of either of them:
Depositary’s fee – 23
Interest payable 1 –
Safe custody fee – 2
1 25
Other expenses:
Audit fee** – 9
Statement fees – 6
– 15
Total expenses 996 989
* From 4 June 2018 the Fund changed to a single fixed charge known as the Fund Management Fee (FMF). The FMF covers fees and expenses in relation to the operation and administration of the Company and the Fund.** The audit fee was £8,733 (2018: £8,562) net of VAT. With effect from 4 June 2018, the audit fee was no longer accrued for separately and now forms part of the FMF.
NOTES TO THE FINANCIAL STATEMENTS
avivainvestors.com | Aviva Investors Manager of Manager ICVC (ICVC2) Annual Report and Financial Statements for the year ended 31 July 2019
Aviva Investors UK Listed Equity High Alpha Fund
19
NOTES TO THE FINANCIAL STATEMENTS (CONTINUED)
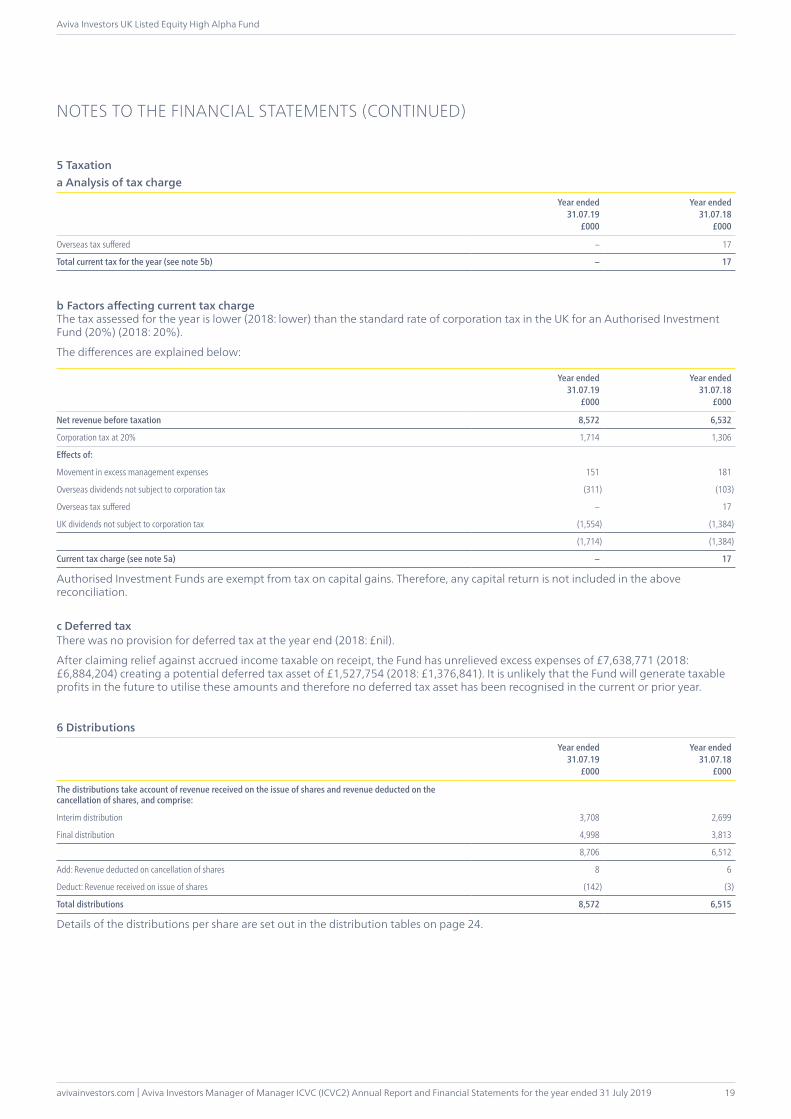
5 Taxationa Analysis of tax charge
Year ended31.07.19
£000
Year ended31.07.18
£000
Overseas tax suffered – 17
Total current tax for the year (see note 5b) – 17
b Factors affecting current tax chargeThe tax assessed for the year is lower (2018: lower) than the standard rate of corporation tax in the UK for an Authorised Investment Fund (20%) (2018: 20%).
The differences are explained below:
Year ended31.07.19
£000
Year ended31.07.18
£000
Net revenue before taxation 8,572 6,532
Corporation tax at 20% 1,714 1,306
Effects of:
Movement in excess management expenses 151 181
Overseas dividends not subject to corporation tax (311) (103)
Overseas tax suffered – 17
UK dividends not subject to corporation tax (1,554) (1,384)
(1,714) (1,384)
Current tax charge (see note 5a) – 17
Authorised Investment Funds are exempt from tax on capital gains. Therefore, any capital return is not included in the above reconciliation.
c Deferred taxThere was no provision for deferred tax at the year end (2018: £nil).
After claiming relief against accrued income taxable on receipt, the Fund has unrelieved excess expenses of £7,638,771 (2018: £6,884,204) creating a potential deferred tax asset of £1,527,754 (2018: £1,376,841). It is unlikely that the Fund will generate taxable profits in the future to utilise these amounts and therefore no deferred tax asset has been recognised in the current or prior year.
6 Distributions
Year ended31.07.19
£000
Year ended31.07.18
£000
The distributions take account of revenue received on the issue of shares and revenue deducted on the cancellation of shares, and comprise:
Interim distribution 3,708 2,699
Final distribution 4,998 3,813
8,706 6,512
Add: Revenue deducted on cancellation of shares 8 6
Deduct: Revenue received on issue of shares (142) (3)
Total distributions 8,572 6,515
Details of the distributions per share are set out in the distribution tables on page 24.
Aviva Investors Manager of Manager ICVC (ICVC2) Annual Report and Financial Statements for the year ended 31 July 2019 | avivainvestors.com
Aviva Investors UK Listed Equity High Alpha Fund
20
NOTES TO THE FINANCIAL STATEMENTS (CONTINUED)
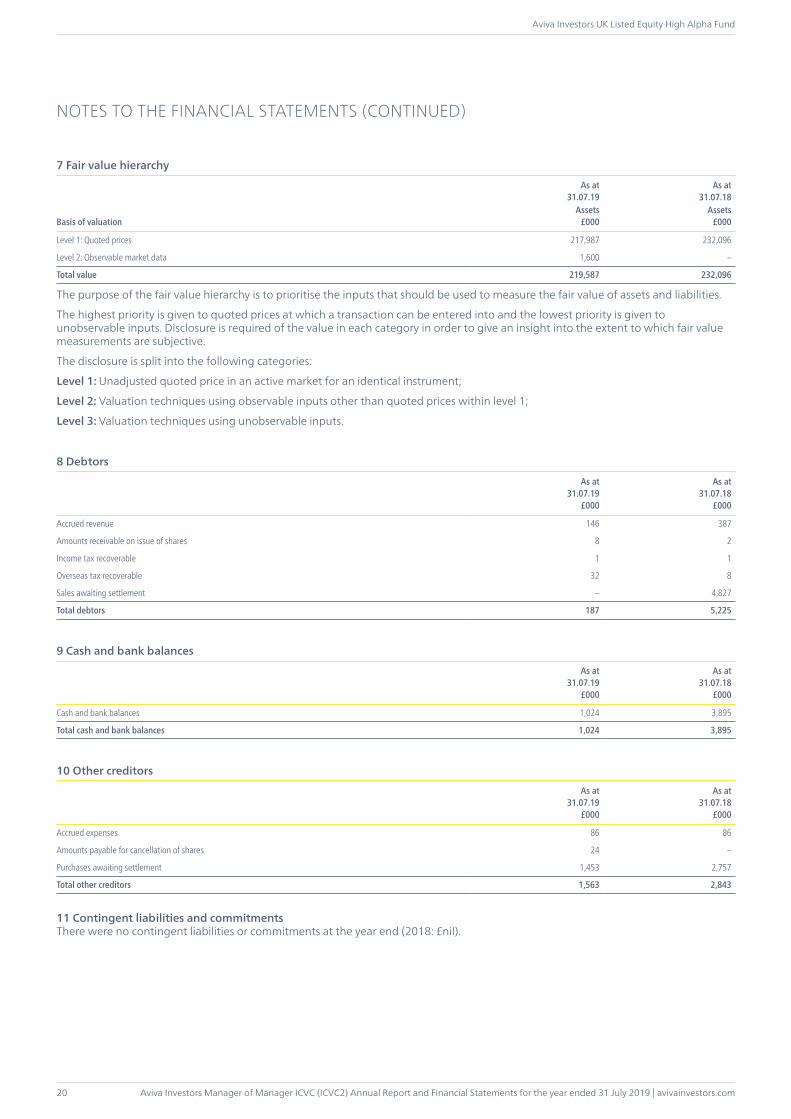
7 Fair value hierarchy
As at31.07.19
As at31.07.18
Basis of valuationAssets
£000Assets
£000
Level 1: Quoted prices 217,987 232,096
Level 2: Observable market data 1,600 –
Total value 219,587 232,096
The purpose of the fair value hierarchy is to prioritise the inputs that should be used to measure the fair value of assets and liabilities.
The highest priority is given to quoted prices at which a transaction can be entered into and the lowest priority is given to unobservable inputs. Disclosure is required of the value in each category in order to give an insight into the extent to which fair value measurements are subjective.
The disclosure is split into the following categories:
Level 1: Unadjusted quoted price in an active market for an identical instrument;
Level 2: Valuation techniques using observable inputs other than quoted prices within level 1;
Level 3: Valuation techniques using unobservable inputs.
8 Debtors
As at31.07.19
£000
As at31.07.18
£000
Accrued revenue 146 387
Amounts receivable on issue of shares 8 2
Income tax recoverable 1 1
Overseas tax recoverable 32 8
Sales awaiting settlement – 4,827
Total debtors 187 5,225
9 Cash and bank balances
As at31.07.19
£000
As at31.07.18
£000
Cash and bank balances 1,024 3,895
Total cash and bank balances 1,024 3,895
10 Other creditors
As at31.07.19
£000
As at31.07.18
£000
Accrued expenses 86 86
Amounts payable for cancellation of shares 24 –
Purchases awaiting settlement 1,453 2,757
Total other creditors 1,563 2,843
11 Contingent liabilities and commitmentsThere were no contingent liabilities or commitments at the year end (2018: £nil).
Aviva Investors UK Listed Equity High Alpha Fund
21avivainvestors.com | Aviva Investors Manager of Manager ICVC (ICVC2) Annual Report and Financial Statements for the year ended 31 July 2017
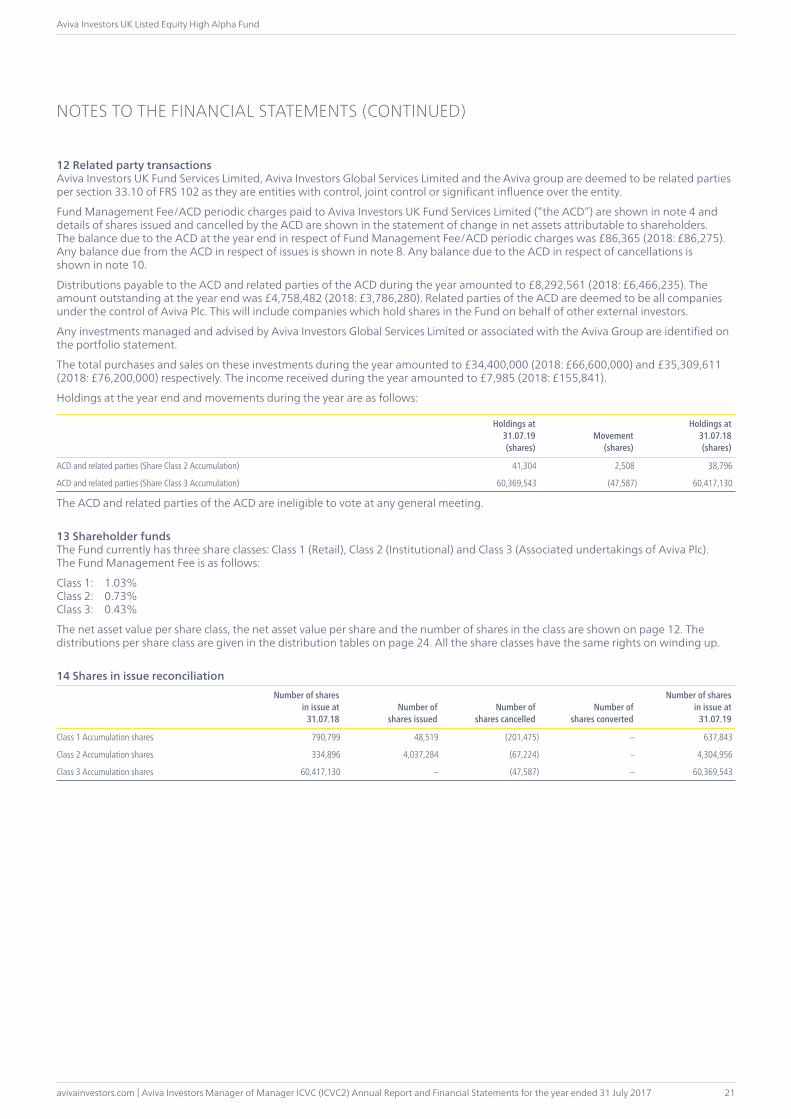
12 Related party transactionsAviva Investors UK Fund Services Limited, Aviva Investors Global Services Limited and the Aviva group are deemed to be related parties per section 33.10 of FRS 102 as they are entities with control, joint control or significant influence over the entity.
Fund Management Fee/ACD periodic charges paid to Aviva Investors UK Fund Services Limited (“the ACD”) are shown in note 4 and details of shares issued and cancelled by the ACD are shown in the statement of change in net assets attributable to shareholders. The balance due to the ACD at the year end in respect of Fund Management Fee/ACD periodic charges was £86,365 (2018: £86,275). Any balance due from the ACD in respect of issues is shown in note 8. Any balance due to the ACD in respect of cancellations is shown in note 10.
Distributions payable to the ACD and related parties of the ACD during the year amounted to £8,292,561 (2018: £6,466,235). The amount outstanding at the year end was £4,758,482 (2018: £3,786,280). Related parties of the ACD are deemed to be all companies under the control of Aviva Plc. This will include companies which hold shares in the Fund on behalf of other external investors.
Any investments managed and advised by Aviva Investors Global Services Limited or associated with the Aviva Group are identified on the portfolio statement.
The total purchases and sales on these investments during the year amounted to £34,400,000 (2018: £66,600,000) and £35,309,611 (2018: £76,200,000) respectively. The income received during the year amounted to £7,985 (2018: £155,841).
Holdings at the year end and movements during the year are as follows:
Holdings at31.07.19(shares)
Movement(shares)
Holdings at31.07.18(shares)
ACD and related parties (Share Class 2 Accumulation) 41,304 2,508 38,796
ACD and related parties (Share Class 3 Accumulation) 60,369,543 (47,587) 60,417,130
The ACD and related parties of the ACD are ineligible to vote at any general meeting.
13 Shareholder fundsThe Fund currently has three share classes: Class 1 (Retail), Class 2 (Institutional) and Class 3 (Associated undertakings of Aviva Plc). The Fund Management Fee is as follows:
Class 1: 1.03%Class 2: 0.73%Class 3: 0.43%
The net asset value per share class, the net asset value per share and the number of shares in the class are shown on page 12. The distributions per share class are given in the distribution tables on page 24. All the share classes have the same rights on winding up.
14 Shares in issue reconciliationNumber of shares
in issue at31.07.18
Number ofshares issued
Number ofshares cancelled
Number ofshares converted
Number of shares in issue at
31.07.19
Class 1 Accumulation shares 790,799 48,519 (201,475) – 637,843
Class 2 Accumulation shares 334,896 4,037,284 (67,224) – 4,304,956
Class 3 Accumulation shares 60,417,130 – (47,587) – 60,369,543
NOTES TO THE FINANCIAL STATEMENTS (CONTINUED)
Aviva Investors Manager of Manager ICVC (ICVC2) Annual Report and Financial Statements for the year ended 31 July 2019 | avivainvestors.com
Aviva Investors UK Listed Equity High Alpha Fund
22
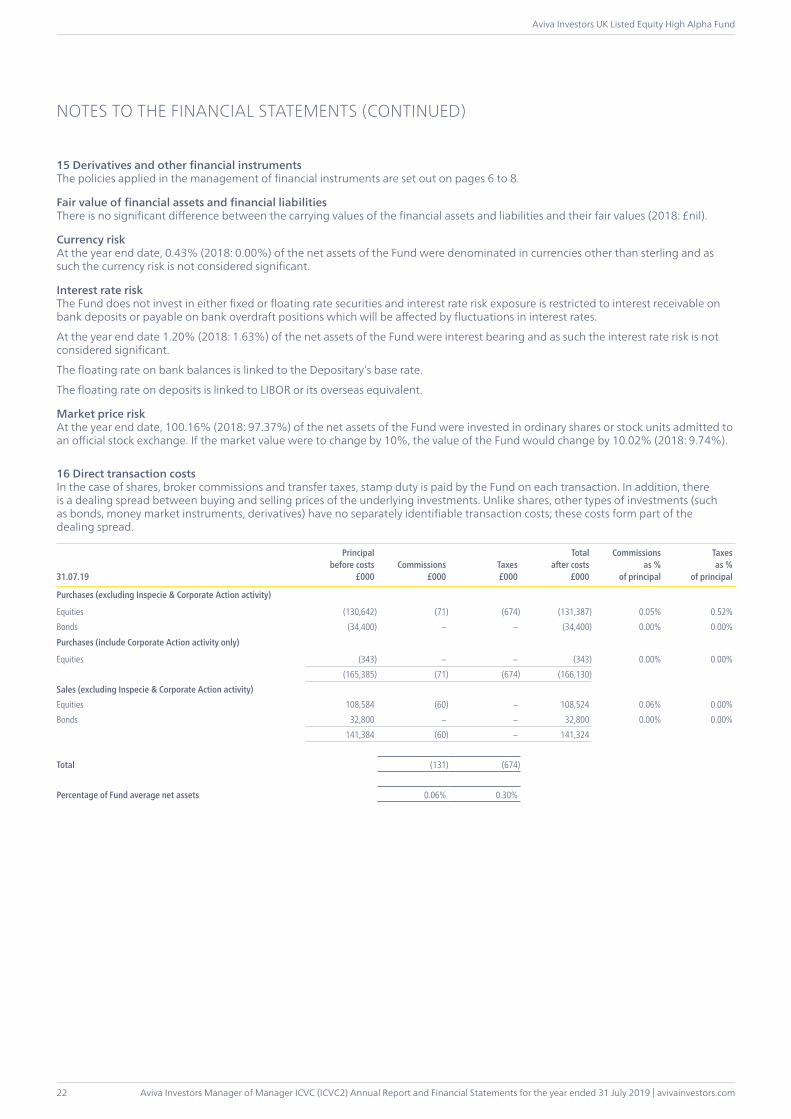
15 Derivatives and other financial instrumentsThe policies applied in the management of financial instruments are set out on pages 6 to 8.
Fair value of financial assets and financial liabilitiesThere is no significant difference between the carrying values of the financial assets and liabilities and their fair values (2018: £nil).
Currency riskAt the year end date, 0.43% (2018: 0.00%) of the net assets of the Fund were denominated in currencies other than sterling and as such the currency risk is not considered significant.
Interest rate riskThe Fund does not invest in either fixed or floating rate securities and interest rate risk exposure is restricted to interest receivable on bank deposits or payable on bank overdraft positions which will be affected by fluctuations in interest rates.
At the year end date 1.20% (2018: 1.63%) of the net assets of the Fund were interest bearing and as such the interest rate risk is not considered significant.
The floating rate on bank balances is linked to the Depositary’s base rate.
The floating rate on deposits is linked to LIBOR or its overseas equivalent.
Market price riskAt the year end date, 100.16% (2018: 97.37%) of the net assets of the Fund were invested in ordinary shares or stock units admitted to an official stock exchange. If the market value were to change by 10%, the value of the Fund would change by 10.02% (2018: 9.74%).
16 Direct transaction costs In the case of shares, broker commissions and transfer taxes, stamp duty is paid by the Fund on each transaction. In addition, there is a dealing spread between buying and selling prices of the underlying investments. Unlike shares, other types of investments (such as bonds, money market instruments, derivatives) have no separately identifiable transaction costs; these costs form part of the dealing spread.
31.07.19
Principalbefore costs
£000Commissions
£000Taxes£000
Totalafter costs
£000
Commissions as %
of principal
Taxes as %
of principal
Purchases (excluding Inspecie & Corporate Action activity)
Equities (130,642) (71) (674) (131,387) 0.05% 0.52%Bonds (34,400) – – (34,400) 0.00% 0.00%
Purchases (include Corporate Action activity only)
Equities (343) – – (343) 0.00% 0.00%(165,385) (71) (674) (166,130)
Sales (excluding Inspecie & Corporate Action activity)Equities 108,584 (60) – 108,524 0.06% 0.00%Bonds 32,800 – – 32,800 0.00% 0.00%
141,384 (60) – 141,324
Total (131) (674)
Percentage of Fund average net assets 0.06% 0.30%
NOTES TO THE FINANCIAL STATEMENTS (CONTINUED)
avivainvestors.com | Aviva Investors Manager of Manager ICVC (ICVC2) Annual Report and Financial Statements for the year ended 31 July 2019
Aviva Investors UK Listed Equity High Alpha Fund
23
NOTES TO THE FINANCIAL STATEMENTS (CONTINUED)
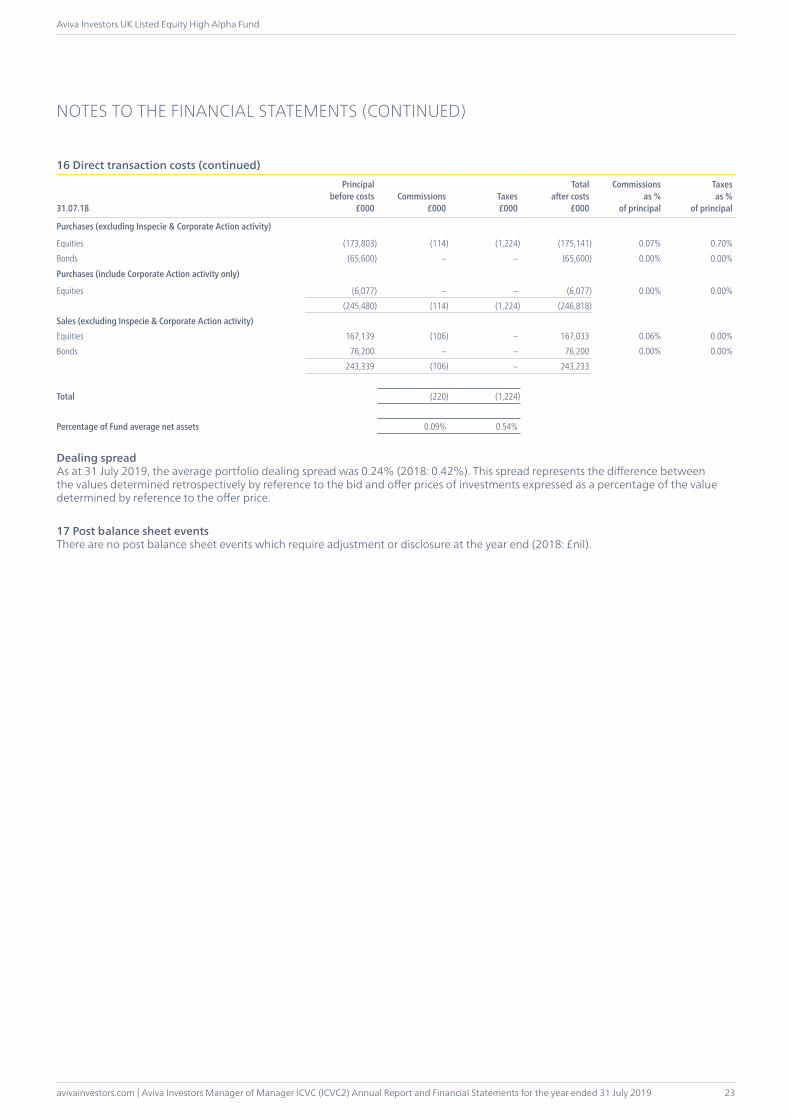
16 Direct transaction costs (continued)
31.07.18
Principalbefore costs
£000Commissions
£000Taxes£000
Totalafter costs
£000
Commissions as %
of principal
Taxes as %
of principal
Purchases (excluding Inspecie & Corporate Action activity)
Equities (173,803) (114) (1,224) (175,141) 0.07% 0.70%Bonds (65,600) – – (65,600) 0.00% 0.00%
Purchases (include Corporate Action activity only)
Equities (6,077) – – (6,077) 0.00% 0.00%(245,480) (114) (1,224) (246,818)
Sales (excluding Inspecie & Corporate Action activity)Equities 167,139 (106) – 167,033 0.06% 0.00%Bonds 76,200 – – 76,200 0.00% 0.00%
243,339 (106) – 243,233
Total (220) (1,224)
Percentage of Fund average net assets 0.09% 0.54%
Dealing spreadAs at 31 July 2019, the average portfolio dealing spread was 0.24% (2018: 0.42%). This spread represents the difference between the values determined retrospectively by reference to the bid and offer prices of investments expressed as a percentage of the value determined by reference to the offer price.
17 Post balance sheet eventsThere are no post balance sheet events which require adjustment or disclosure at the year end (2018: £nil).
Aviva Investors Manager of Manager ICVC (ICVC2) Annual Report and Financial Statements for the year ended 31 July 2019 | avivainvestors.com
Aviva Investors UK Listed Equity High Alpha Fund
24
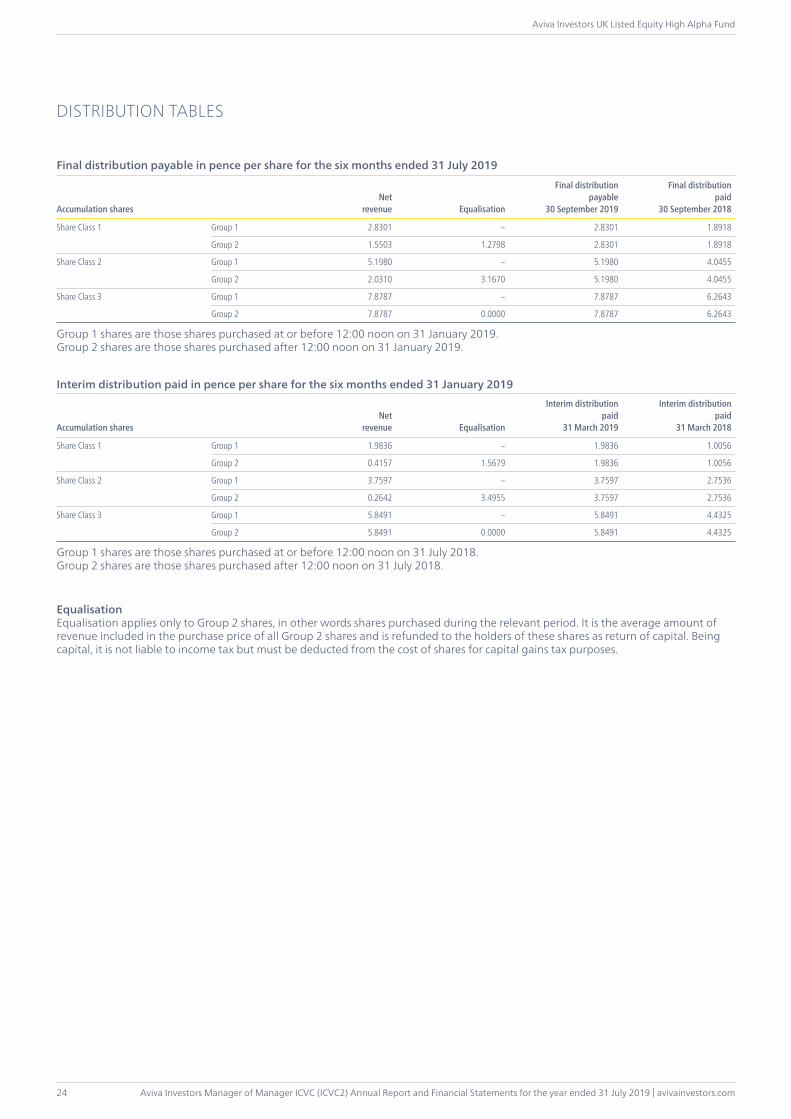
DISTRIBUTION TABLES
Final distribution payable in pence per share for the six months ended 31 July 2019
Accumulation sharesNet
revenue Equalisation
Final distributionpayable
30 September 2019
Final distributionpaid
30 September 2018
Share Class 1 Group 1 2.8301 – 2.8301 1.8918
Group 2 1.5503 1.2798 2.8301 1.8918
Share Class 2 Group 1 5.1980 – 5.1980 4.0455
Group 2 2.0310 3.1670 5.1980 4.0455
Share Class 3 Group 1 7.8787 – 7.8787 6.2643
Group 2 7.8787 0.0000 7.8787 6.2643
Group 1 shares are those shares purchased at or before 12:00 noon on 31 January 2019.Group 2 shares are those shares purchased after 12:00 noon on 31 January 2019.
Interim distribution paid in pence per share for the six months ended 31 January 2019
Accumulation sharesNet
revenue Equalisation
Interim distributionpaid
31 March 2019
Interim distributionpaid
31 March 2018
Share Class 1 Group 1 1.9836 – 1.9836 1.0056
Group 2 0.4157 1.5679 1.9836 1.0056
Share Class 2 Group 1 3.7597 – 3.7597 2.7536
Group 2 0.2642 3.4955 3.7597 2.7536
Share Class 3 Group 1 5.8491 – 5.8491 4.4325
Group 2 5.8491 0.0000 5.8491 4.4325
Group 1 shares are those shares purchased at or before 12:00 noon on 31 July 2018.Group 2 shares are those shares purchased after 12:00 noon on 31 July 2018.
EqualisationEqualisation applies only to Group 2 shares, in other words shares purchased during the relevant period. It is the average amount of revenue included in the purchase price of all Group 2 shares and is refunded to the holders of these shares as return of capital. Being capital, it is not liable to income tax but must be deducted from the cost of shares for capital gains tax purposes.
avivainvestors.com | Aviva Investors Manager of Manager ICVC (ICVC2) Annual Report and Financial Statements for the year ended 31 July 2019
Aviva Investors UK Listed Equity MoM 1 Fund
25
The name of the Fund was changed from the Aviva Investors UK Equity MoM 1 Fund on 7 August 2019.
INVESTMENT OBJECTIVEThe Fund aims to grow your investment over the long term (5 years or more) by investing in shares of UK companies.
INVESTMENT POLICYCore investment: At least 80% of the Fund will be invested in shares of UK companies (incorporated or domiciled in the UK), or non-UK companies which are listed in the UK or have significant trading activities in the UK.
Other investments: The Fund may also invest in other shares, other funds (including funds managed by Aviva Investors companies), cash and deposits.
Strategy: The Fund is actively managed, and the Investment Manager aims to achieve the Fund’s objective by constructing a concentrated portfolio of no more than 30 “exceptional” companies, with a focus on those companies which the Investment Manager believes have truly sustainable business models and/or established brands, which demonstrate the ability to deliver profit and income over the long term.
Performance & Risk Measurement: The Fund’s performance is compared against the FTSE® All-Share Index (the “Index”).
The Fund does not base its investment process upon the Index, so will not hold every company in the Index and may also hold companies that do not form part of it.
The Fund uses a “tracking error” to measure the consistency of the Fund’s returns and the returns of the Index. In general, the lower the tracking error, the more consistent the Fund’s returns are relative to the Index, and vice-versa. The Fund is expected to have an average yearly tracking error of between 2.5% and 7.5% when compared to the Index. In certain conditions the Fund may be outside of this range.
The Index represents the performance of all eligible companies listed on the London Stock Exchange, and 98% of the UK’s market capitalisation (total market value of a company’s outstanding shares)
The Index has been selected as a benchmark for performance and risk measurement because it is representative of the type of companies in which the Fund is likely to invest, and it is therefore an appropriate comparator for the Fund’s performance.
FUND MANAGER’S REPORTPerformanceOver the twelve months ended 31 July 2019 the Fund* returned 17.10% (net of fees). The Funds benchmark, the FTSE® All-Share Index, returned of 1.27% over the same period.
Review The most significant uplift for the biggest gainer in your portfolio came at the very end of July, when the London Stock Exchange (+50% over the year) announced its intention to buy Refinitiv, Thomson Reuters’ financial and risk business. The news was well received, leading to a 24% jump in the LSE’s share price in the days following the announcement. Clearly the market approves of the deal, which has been valued at $27bn (an enterprise value to sales multiple of just over four times) and this initial warm reception seems understandable given the deal’s obvious synergies. Firstly, Refinitiv brings two market-leading, electronic trading venues, FXall and Tradeweb, which benefit from the same network effects as LSE’s existing marketplace businesses and offer the opportunity to increase the group’s exposure to currencies and fixed income. Secondly, the Thomson Reuters Eikon desktop terminal – despite being a distant number 2 behind Bloomberg as a distribution channel – is a powerful platform which delivers Refinitiv’s proprietary datasets to its customers. LSE’s market and index data (e.g. FTSE-Russell) will join this flow, making it an altogether more valuable prospect. Lastly, Refinitiv’s revenues are skewed to North America and emerging markets, making it a complement to LSE’s reliance on the UK. As long term optimists about global wealth creation we like the access that LSE gives us to stock markets, and welcome anything which materially adds to the moat created by its deep pool of liquidity and the subsequent network effect.
After LSE, it was interesting to see that so-called “defensives” were amongst the best performers: Mondelez up 35% (making it the second biggest gainer in the portfolio), Diageo 26%, RELX 20%, Unilever 17%. Why? Firstly, late 2018 saw a big rally in these names, concurrent with a fall of over 20% in the oil price. Lower energy costs free up disposable income for consumers, especially in emerging markets, and many of these names have benefited from their exposure to such regions – Unilever has 60% of sales from emerging markets, while Mondelez and Diageo each have 40%. But perhaps the steady flow of good news from these multinational consumer companies was the more important factor in their strong performance. It was certainly a welcome confirmation that we are not misplaced in our belief in the power of the highest quality global brands even as consumers’ tastes and shopping habits are changing. The likes of Amazon are disrupting distribution channels while social networks are disseminating information at an unprecedented speed and in a radically different manner to the old mass advertising model.
In this environment, only the strongest brands can avoid becoming commoditised. We were pleased to hear that Mondelez’s Cadbury, the world’s biggest chocolate brand, grew c.5% in the UK last year despite being over 100 years old. Diageo’s gin brands Tanqueray and Gordon’s both grew 25% last year, with sales of the former at an all-time high since its launch in 1860. Johnnie Walker grew 6% in the same time period. In the wake of these excellent results we met with CEO Ivan Menezes, who pointed out that Diageo represents just 2% of world’s beverage alcohol volume and 4.7% of world’s beverage alcohol dollars – tiny in comparison to the scale of the opportunity. Unilever’s biggest portfolio brand, Dove, “delivered another year of broad based growth” in 2018, with the brand’s revenues up 84% over the last decade.
AVIVA INVESTORS UK LISTED EQUITY MOM 1 FUND
Aviva Investors Manager of Manager ICVC (ICVC2) Annual Report and Financial Statements for the year ended 31 July 2019 | avivainvestors.com
Aviva Investors UK Listed Equity MoM 1 Fund
26
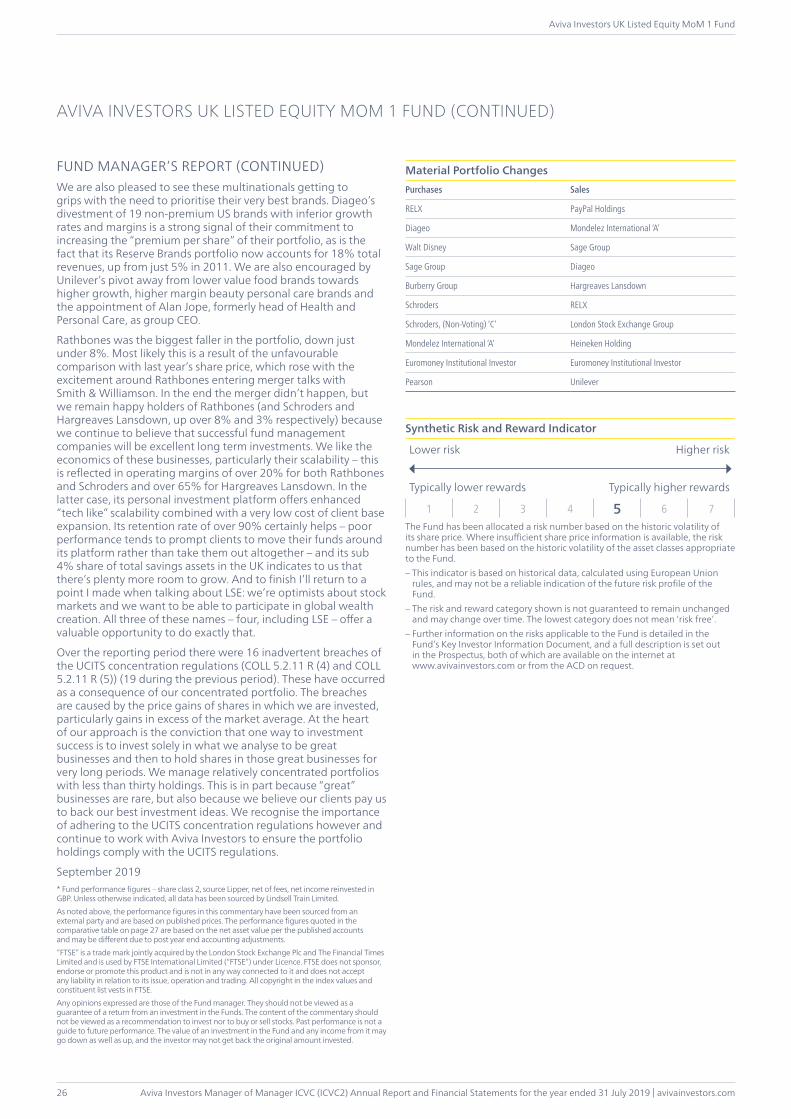
FUND MANAGER’S REPORT (CONTINUED)We are also pleased to see these multinationals getting to grips with the need to prioritise their very best brands. Diageo’s divestment of 19 non-premium US brands with inferior growth rates and margins is a strong signal of their commitment to increasing the “premium per share” of their portfolio, as is the fact that its Reserve Brands portfolio now accounts for 18% total revenues, up from just 5% in 2011. We are also encouraged by Unilever’s pivot away from lower value food brands towards higher growth, higher margin beauty personal care brands and the appointment of Alan Jope, formerly head of Health and Personal Care, as group CEO.
Rathbones was the biggest faller in the portfolio, down just under 8%. Most likely this is a result of the unfavourable comparison with last year’s share price, which rose with the excitement around Rathbones entering merger talks with Smith & Williamson. In the end the merger didn’t happen, but we remain happy holders of Rathbones (and Schroders and Hargreaves Lansdown, up over 8% and 3% respectively) because we continue to believe that successful fund management companies will be excellent long term investments. We like the economics of these businesses, particularly their scalability – this is reflected in operating margins of over 20% for both Rathbones and Schroders and over 65% for Hargreaves Lansdown. In the latter case, its personal investment platform offers enhanced “tech like” scalability combined with a very low cost of client base expansion. Its retention rate of over 90% certainly helps – poor performance tends to prompt clients to move their funds around its platform rather than take them out altogether – and its sub 4% share of total savings assets in the UK indicates to us that there’s plenty more room to grow. And to finish I’ll return to a point I made when talking about LSE: we’re optimists about stock markets and we want to be able to participate in global wealth creation. All three of these names – four, including LSE – offer a valuable opportunity to do exactly that.
Over the reporting period there were 16 inadvertent breaches of the UCITS concentration regulations (COLL 5.2.11 R (4) and COLL 5.2.11 R (5)) (19 during the previous period). These have occurred as a consequence of our concentrated portfolio. The breaches are caused by the price gains of shares in which we are invested, particularly gains in excess of the market average. At the heart of our approach is the conviction that one way to investment success is to invest solely in what we analyse to be great businesses and then to hold shares in those great businesses for very long periods. We manage relatively concentrated portfolios with less than thirty holdings. This is in part because “great” businesses are rare, but also because we believe our clients pay us to back our best investment ideas. We recognise the importance of adhering to the UCITS concentration regulations however and continue to work with Aviva Investors to ensure the portfolio holdings comply with the UCITS regulations.
September 2019* Fund performance figures – share class 2, source Lipper, net of fees, net income reinvested in GBP. Unless otherwise indicated, all data has been sourced by Lindsell Train Limited.As noted above, the performance figures in this commentary have been sourced from an external party and are based on published prices. The performance figures quoted in the comparative table on page 27 are based on the net asset value per the published accounts and may be different due to post year end accounting adjustments. “FTSE” is a trade mark jointly acquired by the London Stock Exchange Plc and The Financial Times Limited and is used by FTSE International Limited (“FTSE”) under Licence. FTSE does not sponsor, endorse or promote this product and is not in any way connected to it and does not accept any liability in relation to its issue, operation and trading. All copyright in the index values and constituent list vests in FTSE. Any opinions expressed are those of the Fund manager. They should not be viewed as a guarantee of a return from an investment in the Funds. The content of the commentary should not be viewed as a recommendation to invest nor to buy or sell stocks. Past performance is not a guide to future performance. The value of an investment in the Fund and any income from it may go down as well as up, and the investor may not get back the original amount invested.
AVIVA INVESTORS UK LISTED EQUITY MOM 1 FUND (CONTINUED)
Material Portfolio ChangesPurchases Sales
RELX PayPal Holdings
Diageo Mondelez International ‘A’
Walt Disney Sage Group
Sage Group Diageo
Burberry Group Hargreaves Lansdown
Schroders RELX
Schroders, (Non-Voting) ‘C’ London Stock Exchange Group
Mondelez International ‘A’ Heineken Holding
Euromoney Institutional Investor Euromoney Institutional Investor
Pearson Unilever
Synthetic Risk and Reward Indicator
Lower risk Higher risk
Typically lower rewards Typically higher rewards
1 2 3 4 5 6 7The Fund has been allocated a risk number based on the historic volatility of its share price. Where insufficient share price information is available, the risk number has been based on the historic volatility of the asset classes appropriate to the Fund.– This indicator is based on historical data, calculated using European Union
rules, and may not be a reliable indication of the future risk profile of the Fund.
– The risk and reward category shown is not guaranteed to remain unchanged and may change over time. The lowest category does not mean ‘risk free’.
– Further information on the risks applicable to the Fund is detailed in the Fund’s Key Investor Information Document, and a full description is set out in the Prospectus, both of which are available on the internet at www.avivainvestors.com or from the ACD on request.
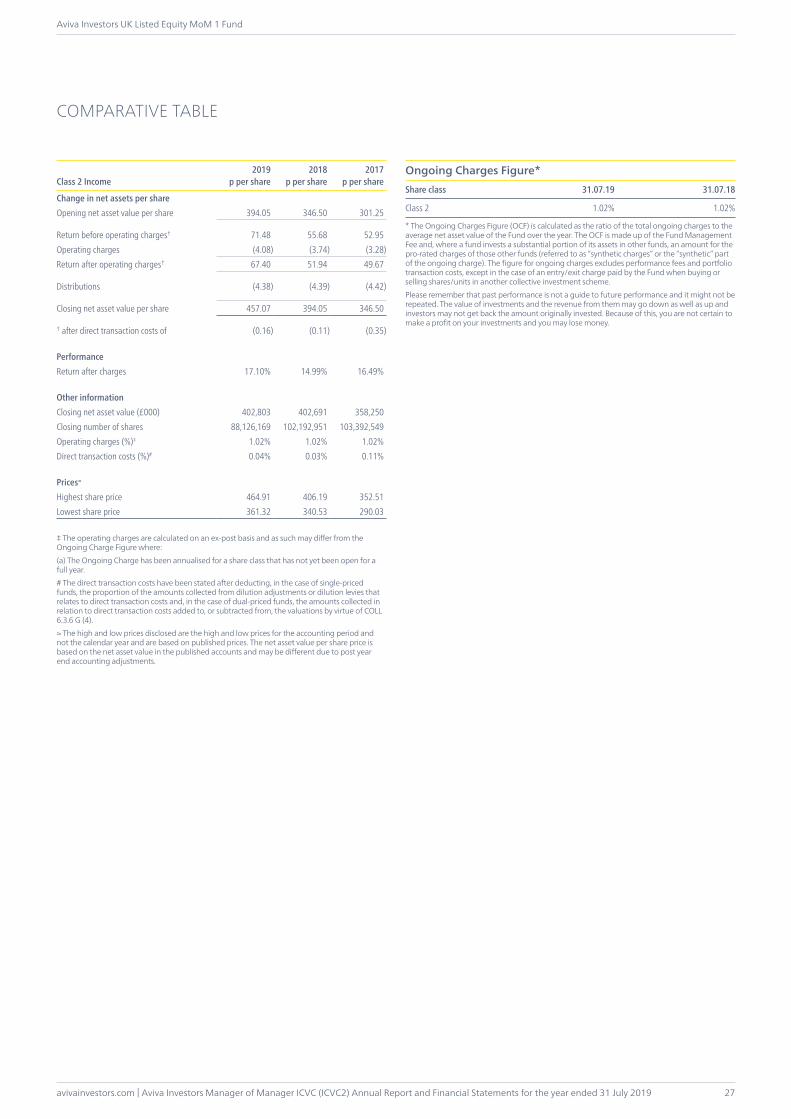
avivainvestors.com | Aviva Investors Manager of Manager ICVC (ICVC2) Annual Report and Financial Statements for the year ended 31 July 2019
Aviva Investors UK Listed Equity MoM 1 Fund
27
COMPARATIVE TABLE
Class 2 Income2019
p per share2018
p per share2017
p per share
Change in net assets per shareOpening net asset value per share 394.05 346.50 301.25
Return before operating charges† 71.48 55.68 52.95Operating charges (4.08) (3.74) (3.28)Return after operating charges† 67.40 51.94 49.67
Distributions (4.38) (4.39) (4.42)
Closing net asset value per share 457.07 394.05 346.50
† after direct transaction costs of (0.16) (0.11) (0.35)
PerformanceReturn after charges 17.10% 14.99% 16.49%
Other informationClosing net asset value (£000) 402,803 402,691 358,250Closing number of shares 88,126,169 102,192,951 103,392,549Operating charges (%)‡ 1.02% 1.02% 1.02%Direct transaction costs (%)# 0.04% 0.03% 0.11%
Prices≈
Highest share price 464.91 406.19 352.51Lowest share price 361.32 340.53 290.03
‡ The operating charges are calculated on an ex-post basis and as such may differ from the Ongoing Charge Figure where:(a) The Ongoing Charge has been annualised for a share class that has not yet been open for a full year.# The direct transaction costs have been stated after deducting, in the case of single-priced funds, the proportion of the amounts collected from dilution adjustments or dilution levies that relates to direct transaction costs and, in the case of dual-priced funds, the amounts collected in relation to direct transaction costs added to, or subtracted from, the valuations by virtue of COLL 6.3.6 G (4).≈ The high and low prices disclosed are the high and low prices for the accounting period and not the calendar year and are based on published prices. The net asset value per share price is based on the net asset value in the published accounts and may be different due to post year end accounting adjustments.
Ongoing Charges Figure*Share class 31.07.19 31.07.18
Class 2 1.02% 1.02%
* The Ongoing Charges Figure (OCF) is calculated as the ratio of the total ongoing charges to the average net asset value of the Fund over the year. The OCF is made up of the Fund Management Fee and, where a fund invests a substantial portion of its assets in other funds, an amount for the pro-rated charges of those other funds (referred to as “synthetic charges” or the “synthetic” part of the ongoing charge). The figure for ongoing charges excludes performance fees and portfolio transaction costs, except in the case of an entry/exit charge paid by the Fund when buying or selling shares/units in another collective investment scheme.Please remember that past performance is not a guide to future performance and it might not be repeated. The value of investments and the revenue from them may go down as well as up and investors may not get back the amount originally invested. Because of this, you are not certain to make a profit on your investments and you may lose money.

Aviva Investors Manager of Manager ICVC (ICVC2) Annual Report and Financial Statements for the year ended 31 July 2019 | avivainvestors.com
Aviva Investors UK Listed Equity MoM 1 Fund
28
PORTFOLIO STATEMENTAs at 31 July 2019
Investment Currency HoldingMarket Value
£000 % of Net Assets
Equities 98.63% (93.65%)
Communication Services 16.51% (16.16%)Entertainment 6.99% (5.12%)Celtic# GBP 144,467 231 0.06Manchester United ‘A’ USD 361,129 5,328 1.33Nintendo JPY 24,222 7,339 1.82Walt Disney USD 128,052 15,228 3.78 28,126 6.99
Media 9.52% (11.04%)Daily Mail & General Trust ‘A’ GBP 1,217,151 9,664 2.40Euromoney Institutional Investor GBP 1,094,127 15,077 3.74Pearson GBP 1,548,608 13,616 3.38 38,357 9.52Communication Services total 66,483 16.51
Consumer Discretionary 7.36% (7.52%)Hotels, Restaurants & Leisure 1.80% (2.75%)Fuller Smith & Turner ‘A’ GBP 179,423 1,929 0.48Young & Co’s Brewery# GBP 18,895 219 0.05Young & Co’s Brewery ‘A’# GBP 313,211 5,105 1.27 7,253 1.80
Textiles, Apparel & Luxury Goods 5.56% (4.77%)Burberry Group GBP 992,469 22,370 5.56 22,370 5.56Consumer Discretionary total 29,623 7.36
Consumer Staples 24.65% (23.22%)Beverages 15.06% (13.74%)AG Barr GBP 1,074,222 7,283 1.81Diageo GBP 1,115,781 38,333 9.51Heineken Holding EUR 179,950 15,057 3.74 60,673 15.06
Food Products 4.74% (4.48%)Mondelez International ‘A’ USD 424,284 19,081 4.74 19,081 4.74
Household Products 0.08% (0.00%)PZ Cussons GBP 143,015 313 0.08 313 0.08
Personal Products 4.77% (5.00%)Unilever GBP 388,180 19,238 4.77 19,238 4.77Consumer Staples total 99,305 24.65
Financials 24.71% (24.23%)Capital Markets 24.71% (24.23%)Hargreaves Lansdown GBP 1,496,721 31,356 7.78London Stock Exchange Group GBP 572,757 37,539 9.32Rathbone Brothers GBP 582,524 12,932 3.21Schroders GBP 523,740 15,733 3.91Schroders, (Non-Voting) ‘C’ GBP 80,406 1,966 0.49 99,526 24.71Financials total 99,526 24.71
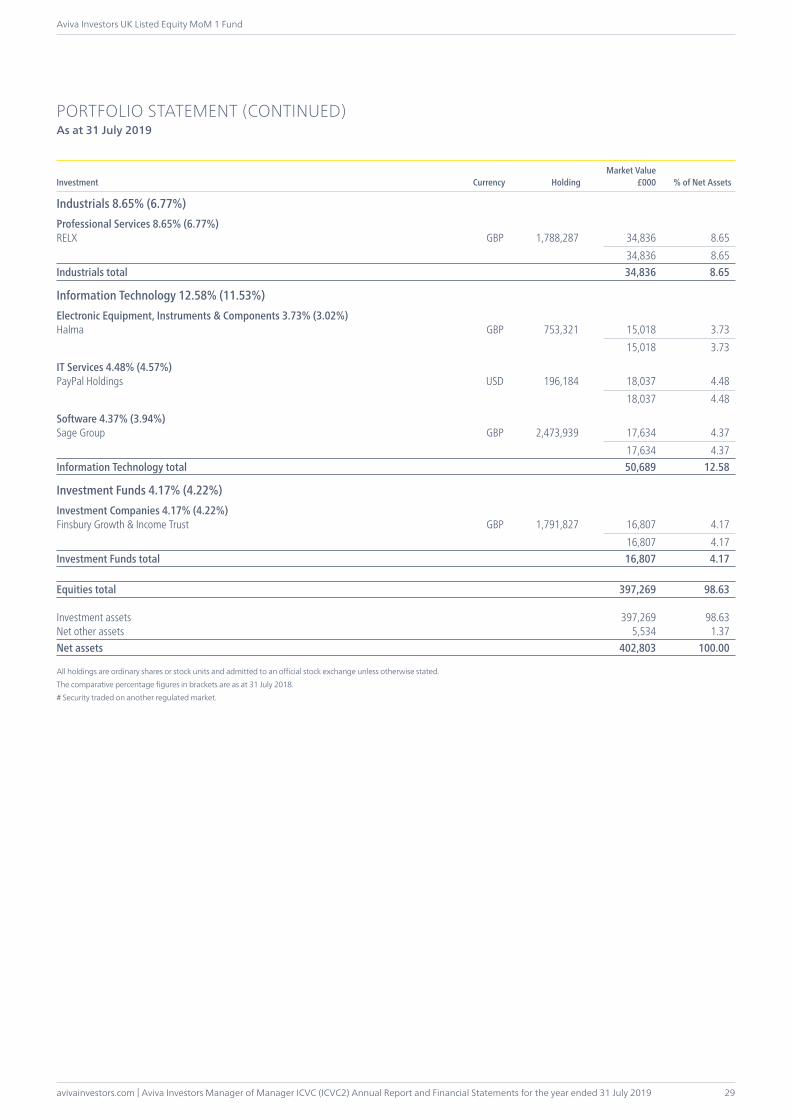
avivainvestors.com | Aviva Investors Manager of Manager ICVC (ICVC2) Annual Report and Financial Statements for the year ended 31 July 2019
Aviva Investors UK Listed Equity MoM 1 Fund
29
PORTFOLIO STATEMENT (CONTINUED)As at 31 July 2019
Investment Currency HoldingMarket Value
£000 % of Net Assets
Industrials 8.65% (6.77%)Professional Services 8.65% (6.77%)RELX GBP 1,788,287 34,836 8.65 34,836 8.65Industrials total 34,836 8.65
Information Technology 12.58% (11.53%)Electronic Equipment, Instruments & Components 3.73% (3.02%)Halma GBP 753,321 15,018 3.73 15,018 3.73
IT Services 4.48% (4.57%)PayPal Holdings USD 196,184 18,037 4.48 18,037 4.48
Software 4.37% (3.94%)Sage Group GBP 2,473,939 17,634 4.37 17,634 4.37Information Technology total 50,689 12.58
Investment Funds 4.17% (4.22%)Investment Companies 4.17% (4.22%)Finsbury Growth & Income Trust GBP 1,791,827 16,807 4.17 16,807 4.17Investment Funds total 16,807 4.17
Equities total 397,269 98.63
Investment assets 397,269 98.63Net other assets 5,534 1.37Net assets 402,803 100.00
All holdings are ordinary shares or stock units and admitted to an official stock exchange unless otherwise stated.The comparative percentage figures in brackets are as at 31 July 2018.# Security traded on another regulated market.
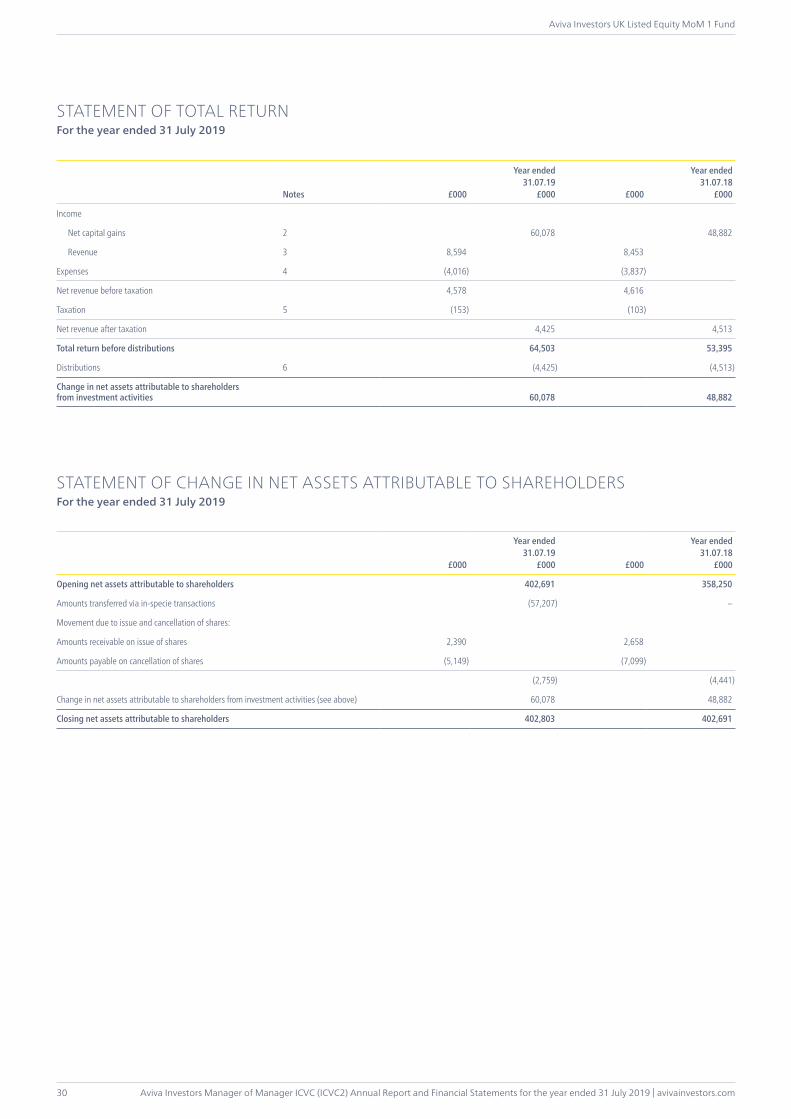
Aviva Investors Manager of Manager ICVC (ICVC2) Annual Report and Financial Statements for the year ended 31 July 2019 | avivainvestors.com
Aviva Investors UK Listed Equity MoM 1 Fund
30
STATEMENT OF TOTAL RETURNFor the year ended 31 July 2019
Notes £000
Year ended31.07.19
£000 £000
Year ended31.07.18
£000
Income
Net capital gains 2 60,078 48,882
Revenue 3 8,594 8,453
Expenses 4 (4,016) (3,837)
Net revenue before taxation 4,578 4,616
Taxation 5 (153) (103)
Net revenue after taxation 4,425 4,513
Total return before distributions 64,503 53,395
Distributions 6 (4,425) (4,513)
Change in net assets attributable to shareholders from investment activities 60,078 48,882
STATEMENT OF CHANGE IN NET ASSETS ATTRIBUTABLE TO SHAREHOLDERSFor the year ended 31 July 2019
£000
Year ended31.07.19
£000 £000
Year ended31.07.18
£000
Opening net assets attributable to shareholders 402,691 358,250
Amounts transferred via in-specie transactions (57,207) –
Movement due to issue and cancellation of shares:
Amounts receivable on issue of shares 2,390 2,658
Amounts payable on cancellation of shares (5,149) (7,099)
(2,759) (4,441)
Change in net assets attributable to shareholders from investment activities (see above) 60,078 48,882
Closing net assets attributable to shareholders 402,803 402,691
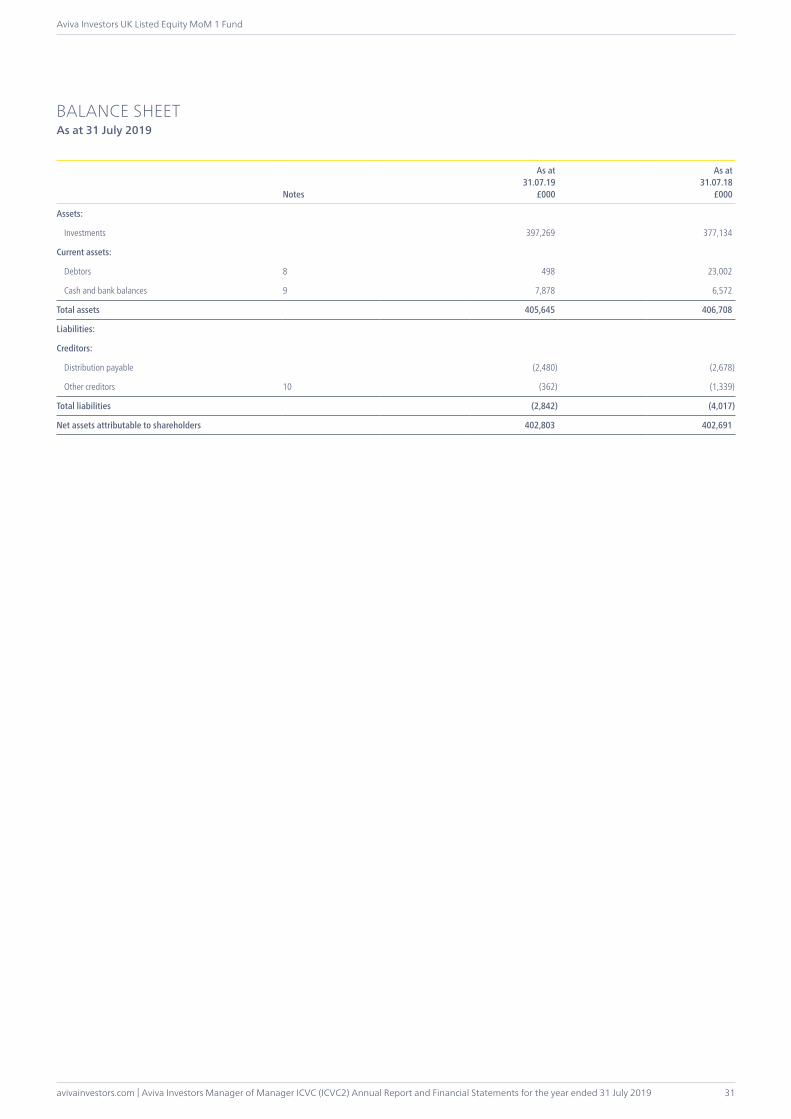
avivainvestors.com | Aviva Investors Manager of Manager ICVC (ICVC2) Annual Report and Financial Statements for the year ended 31 July 2019
Aviva Investors UK Listed Equity MoM 1 Fund
31
BALANCE SHEETAs at 31 July 2019
Notes
As at31.07.19
£000
As at31.07.18
£000
Assets:
Investments 397,269 377,134
Current assets:
Debtors 8 498 23,002
Cash and bank balances 9 7,878 6,572
Total assets 405,645 406,708
Liabilities:
Creditors:
Distribution payable (2,480) (2,678)
Other creditors 10 (362) (1,339)
Total liabilities (2,842) (4,017)
Net assets attributable to shareholders 402,803 402,691

Aviva Investors Manager of Manager ICVC (ICVC2) Annual Report and Financial Statements for the year ended 31 July 2019 | avivainvestors.com
Aviva Investors UK Listed Equity MoM 1 Fund
32
1 Accounting basis and policiesPlease see pages 6 to 8 for accounting basis and policies.
2 Net capital gains
Year ended31.07.19
£000
Year ended31.07.18
£000
Net capital gains on investments during the year comprise:
Compensation items 26 –
Currency gains/(losses) 7 (14)
Expenses relating to the purchase and sale of investments – (2)
Non-derivative securities gains 60,045 48,898
Net capital gains 60,078 48,882
3 Revenue
Year ended31.07.19
£000
Year ended31.07.18
£000
Bank and deposit interest 22 5
Overseas dividends 1,218 864
UK dividends 7,354 7,584
Total revenue 8,594 8,453
4 Expenses
Year ended31.07.19
£000
Year ended31.07.18
£000
Payable to the Authorised Corporate Director (“ACD”), associates of the ACD or agents of either of them:
Fund Management Fee/ACD periodic charges* 4,016 3,775
4,016 3,775
Payable to the Depositary, associates of the Depositary or agents of either of them:
Depositary’s fee – 36
Safe custody fee – 7
– 43
Other expenses:
Audit fee** – 9
Printing & postage expenses – 3
Statement fees – 7
– 19
Total expenses 4,016 3,837
* From 4 June 2018 the Fund changed to a single fixed charge known as the Fund Management Fee (FMF). The FMF covers fees and expenses in relation to the operation and administration of the Company and the Fund.** The audit fee was £8,733 (2018: £8,562) net of VAT. With effect from 4 June 2018, the audit fee was no longer accrued for separately and now forms part of the FMF.
NOTES TO THE FINANCIAL STATEMENTS

avivainvestors.com | Aviva Investors Manager of Manager ICVC (ICVC2) Annual Report and Financial Statements for the year ended 31 July 2019
Aviva Investors UK Listed Equity MoM 1 Fund
33
5 Taxationa Analysis of tax charge
Year ended31.07.19
£000
Year ended31.07.18
£000
Overseas tax suffered 153 103
Total current tax for the year (see note 5b) 153 103
b Factors affecting current tax chargeThe tax assessed for the year is lower (2018: lower) than the standard rate of corporation tax in the UK for an Authorised Investment Fund (20%) (2018: 20%).
The differences are explained below:
Year ended31.07.19
£000
Year ended31.07.18
£000
Net revenue before taxation 4,578 4,616
Corporation tax at 20% 916 923
Effects of:
Movement in excess expenses 799 766
Overseas dividends not subject to corporation tax (244) (173)
Overseas tax suffered 153 103
UK dividends not subject to corporation tax (1,471) (1,516)
(763) (820)
Current tax charge (see note 5a) 153 103
Authorised Investment Funds are exempt from tax on capital gains. Therefore, any capital return is not included in the above reconciliation.
c Deferred taxThere was no provision for deferred tax at the year end (2018: £nil).
After claiming relief against accrued income taxable on receipt, the Fund has unrelieved excess expenses of £24,407,933 (2018: £20,414,125) creating a potential deferred tax asset of £4,881,587 (2018: £4,082,825). It is unlikely that the Fund will generate taxable profits in the future to utilise these amounts and therefore no deferred tax asset has been recognised in the current or prior year.
6 Distributions
Year ended31.07.19
£000
Year ended31.07.18
£000
The distributions take account of revenue received on the issue of shares and revenue deducted on the cancellation of shares, and comprise:
Interim distribution 1,592 1,813
Final distribution 2,480 2,678
4,072 4,491
Add: Revenue deducted on cancellation of shares 363 40
Deduct: Revenue received on issue of shares (10) (18)
Total distributions 4,425 4,513
Details of the distributions per share are set out in the distribution tables on page 38.
NOTES TO THE FINANCIAL STATEMENTS (CONTINUED)
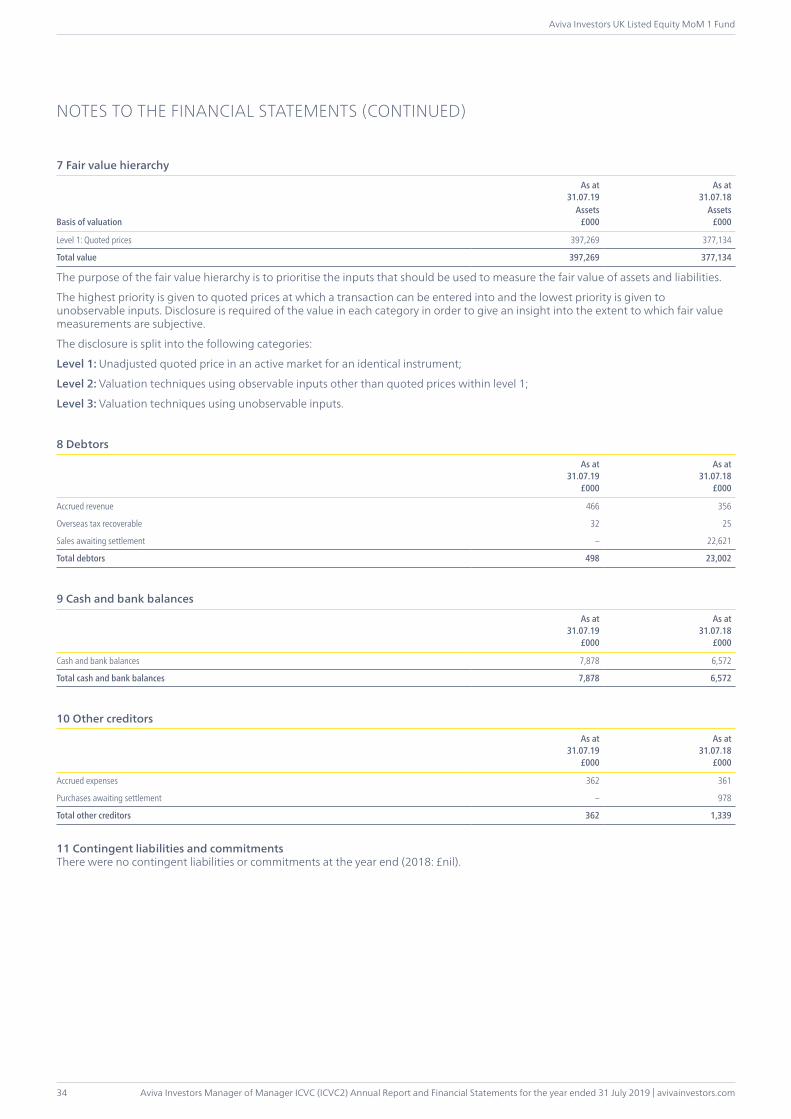
Aviva Investors Manager of Manager ICVC (ICVC2) Annual Report and Financial Statements for the year ended 31 July 2019 | avivainvestors.com
Aviva Investors UK Listed Equity MoM 1 Fund
34
7 Fair value hierarchy
As at31.07.19
As at31.07.18
Basis of valuationAssets
£000Assets
£000
Level 1: Quoted prices 397,269 377,134
Total value 397,269 377,134
The purpose of the fair value hierarchy is to prioritise the inputs that should be used to measure the fair value of assets and liabilities.
The highest priority is given to quoted prices at which a transaction can be entered into and the lowest priority is given to unobservable inputs. Disclosure is required of the value in each category in order to give an insight into the extent to which fair value measurements are subjective.
The disclosure is split into the following categories:
Level 1: Unadjusted quoted price in an active market for an identical instrument;
Level 2: Valuation techniques using observable inputs other than quoted prices within level 1;
Level 3: Valuation techniques using unobservable inputs.
8 Debtors
As at31.07.19
£000
As at31.07.18
£000
Accrued revenue 466 356
Overseas tax recoverable 32 25
Sales awaiting settlement – 22,621
Total debtors 498 23,002
9 Cash and bank balances
As at31.07.19
£000
As at31.07.18
£000
Cash and bank balances 7,878 6,572
Total cash and bank balances 7,878 6,572
10 Other creditors
As at31.07.19
£000
As at31.07.18
£000
Accrued expenses 362 361
Purchases awaiting settlement – 978
Total other creditors 362 1,339
11 Contingent liabilities and commitmentsThere were no contingent liabilities or commitments at the year end (2018: £nil).
NOTES TO THE FINANCIAL STATEMENTS (CONTINUED)
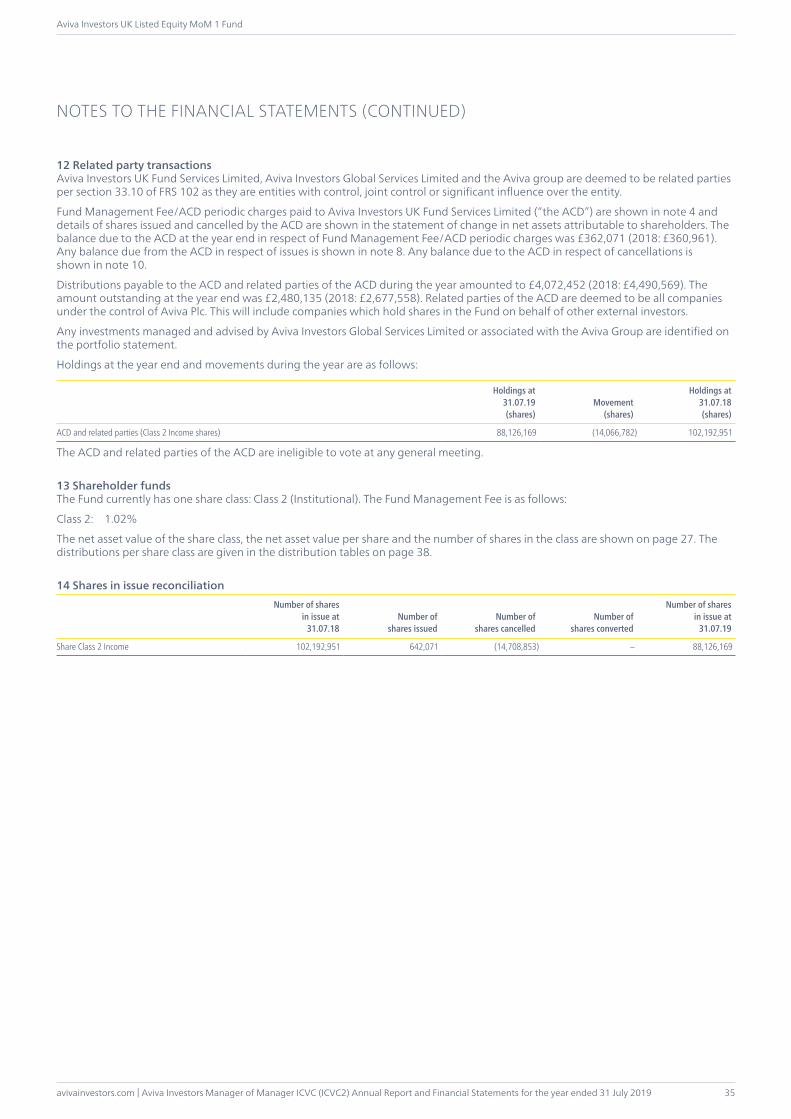
avivainvestors.com | Aviva Investors Manager of Manager ICVC (ICVC2) Annual Report and Financial Statements for the year ended 31 July 2019
Aviva Investors UK Listed Equity MoM 1 Fund
35
12 Related party transactionsAviva Investors UK Fund Services Limited, Aviva Investors Global Services Limited and the Aviva group are deemed to be related parties per section 33.10 of FRS 102 as they are entities with control, joint control or significant influence over the entity.
Fund Management Fee/ACD periodic charges paid to Aviva Investors UK Fund Services Limited (“the ACD”) are shown in note 4 and details of shares issued and cancelled by the ACD are shown in the statement of change in net assets attributable to shareholders. The balance due to the ACD at the year end in respect of Fund Management Fee/ACD periodic charges was £362,071 (2018: £360,961). Any balance due from the ACD in respect of issues is shown in note 8. Any balance due to the ACD in respect of cancellations is shown in note 10.
Distributions payable to the ACD and related parties of the ACD during the year amounted to £4,072,452 (2018: £4,490,569). The amount outstanding at the year end was £2,480,135 (2018: £2,677,558). Related parties of the ACD are deemed to be all companies under the control of Aviva Plc. This will include companies which hold shares in the Fund on behalf of other external investors.
Any investments managed and advised by Aviva Investors Global Services Limited or associated with the Aviva Group are identified on the portfolio statement.
Holdings at the year end and movements during the year are as follows:
Holdings at31.07.19(shares)
Movement(shares)
Holdings at31.07.18(shares)
ACD and related parties (Class 2 Income shares) 88,126,169 (14,066,782) 102,192,951
The ACD and related parties of the ACD are ineligible to vote at any general meeting.
13 Shareholder fundsThe Fund currently has one share class: Class 2 (Institutional). The Fund Management Fee is as follows:
Class 2: 1.02%
The net asset value of the share class, the net asset value per share and the number of shares in the class are shown on page 27. The distributions per share class are given in the distribution tables on page 38.
14 Shares in issue reconciliationNumber of shares
in issue at31.07.18
Number ofshares issued
Number ofshares cancelled
Number ofshares converted
Number of shares in issue at
31.07.19
Share Class 2 Income 102,192,951 642,071 (14,708,853) – 88,126,169
NOTES TO THE FINANCIAL STATEMENTS (CONTINUED)
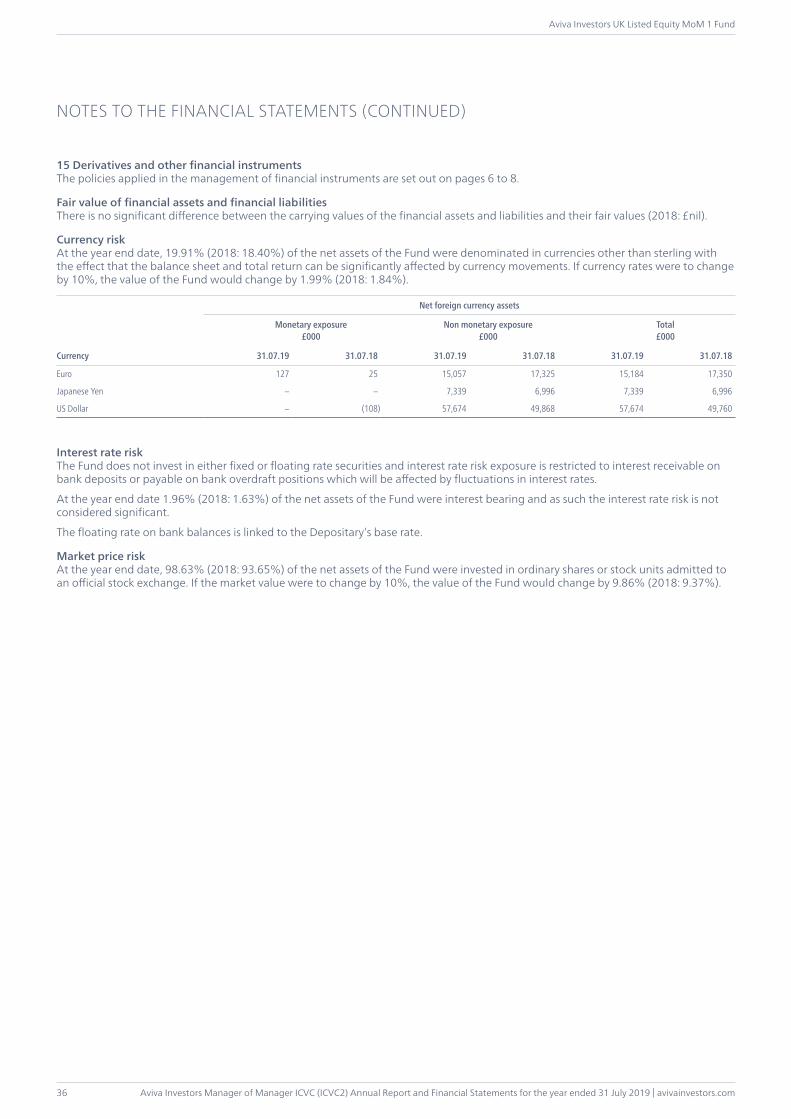
Aviva Investors Manager of Manager ICVC (ICVC2) Annual Report and Financial Statements for the year ended 31 July 2019 | avivainvestors.com
Aviva Investors UK Listed Equity MoM 1 Fund
36
15 Derivatives and other financial instrumentsThe policies applied in the management of financial instruments are set out on pages 6 to 8.
Fair value of financial assets and financial liabilitiesThere is no significant difference between the carrying values of the financial assets and liabilities and their fair values (2018: £nil).
Currency riskAt the year end date, 19.91% (2018: 18.40%) of the net assets of the Fund were denominated in currencies other than sterling with the effect that the balance sheet and total return can be significantly affected by currency movements. If currency rates were to change by 10%, the value of the Fund would change by 1.99% (2018: 1.84%).
Currency
Net foreign currency assets
Monetary exposure£000
Non monetary exposure£000
Total£000
31.07.19 31.07.18 31.07.19 31.07.18 31.07.19 31.07.18
Euro 127 25 15,057 17,325 15,184 17,350
Japanese Yen – – 7,339 6,996 7,339 6,996
US Dollar – (108) 57,674 49,868 57,674 49,760
Interest rate riskThe Fund does not invest in either fixed or floating rate securities and interest rate risk exposure is restricted to interest receivable on bank deposits or payable on bank overdraft positions which will be affected by fluctuations in interest rates.
At the year end date 1.96% (2018: 1.63%) of the net assets of the Fund were interest bearing and as such the interest rate risk is not considered significant.
The floating rate on bank balances is linked to the Depositary’s base rate.
Market price riskAt the year end date, 98.63% (2018: 93.65%) of the net assets of the Fund were invested in ordinary shares or stock units admitted to an official stock exchange. If the market value were to change by 10%, the value of the Fund would change by 9.86% (2018: 9.37%).
NOTES TO THE FINANCIAL STATEMENTS (CONTINUED)
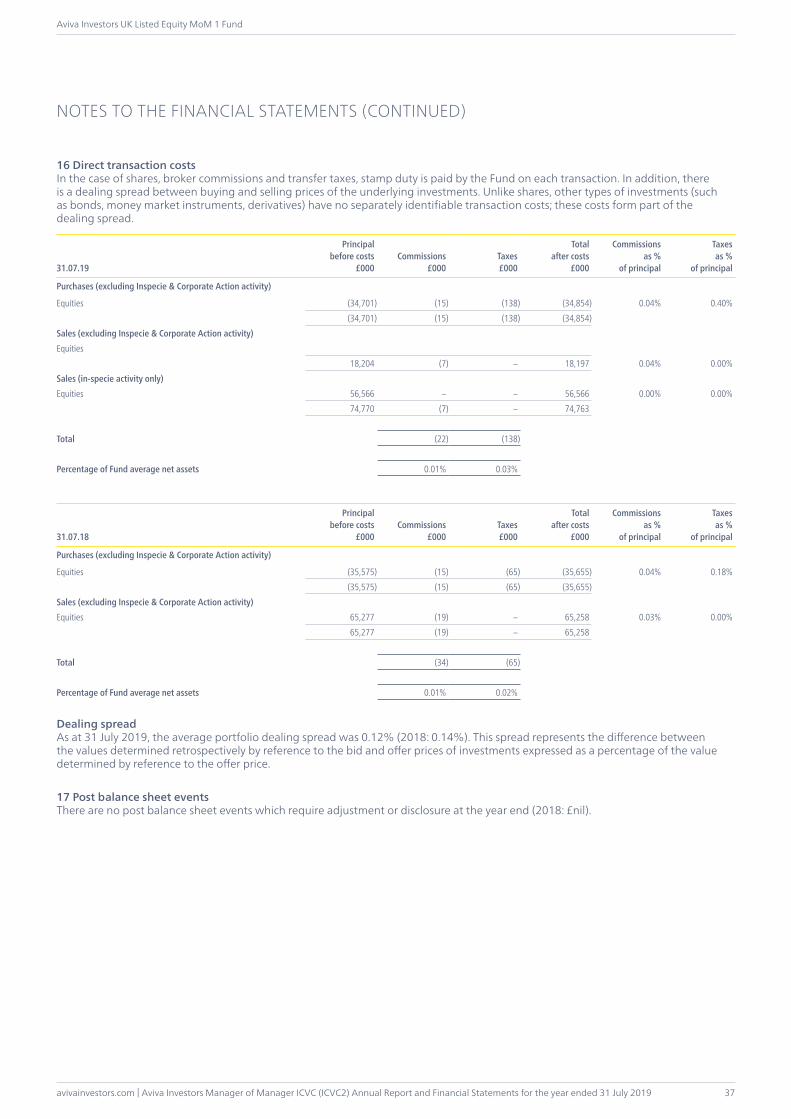
avivainvestors.com | Aviva Investors Manager of Manager ICVC (ICVC2) Annual Report and Financial Statements for the year ended 31 July 2019
Aviva Investors UK Listed Equity MoM 1 Fund
37
16 Direct transaction costs In the case of shares, broker commissions and transfer taxes, stamp duty is paid by the Fund on each transaction. In addition, there is a dealing spread between buying and selling prices of the underlying investments. Unlike shares, other types of investments (such as bonds, money market instruments, derivatives) have no separately identifiable transaction costs; these costs form part of the dealing spread.
31.07.19
Principalbefore costs
£000Commissions
£000Taxes£000
Totalafter costs
£000
Commissions as %
of principal
Taxes as %
of principal
Purchases (excluding Inspecie & Corporate Action activity)
Equities (34,701) (15) (138) (34,854) 0.04% 0.40%(34,701) (15) (138) (34,854)
Sales (excluding Inspecie & Corporate Action activity)Equities
18,204 (7) – 18,197 0.04% 0.00%Sales (in-specie activity only)Equities 56,566 – – 56,566 0.00% 0.00%
74,770 (7) – 74,763
Total (22) (138)
Percentage of Fund average net assets 0.01% 0.03%
31.07.18
Principalbefore costs
£000Commissions
£000Taxes£000
Totalafter costs
£000
Commissions as %
of principal
Taxes as %
of principal
Purchases (excluding Inspecie & Corporate Action activity)
Equities (35,575) (15) (65) (35,655) 0.04% 0.18%(35,575) (15) (65) (35,655)
Sales (excluding Inspecie & Corporate Action activity)Equities 65,277 (19) – 65,258 0.03% 0.00%
65,277 (19) – 65,258
Total (34) (65)
Percentage of Fund average net assets 0.01% 0.02%
Dealing spreadAs at 31 July 2019, the average portfolio dealing spread was 0.12% (2018: 0.14%). This spread represents the difference between the values determined retrospectively by reference to the bid and offer prices of investments expressed as a percentage of the value determined by reference to the offer price.
17 Post balance sheet eventsThere are no post balance sheet events which require adjustment or disclosure at the year end (2018: £nil).
NOTES TO THE FINANCIAL STATEMENTS (CONTINUED)
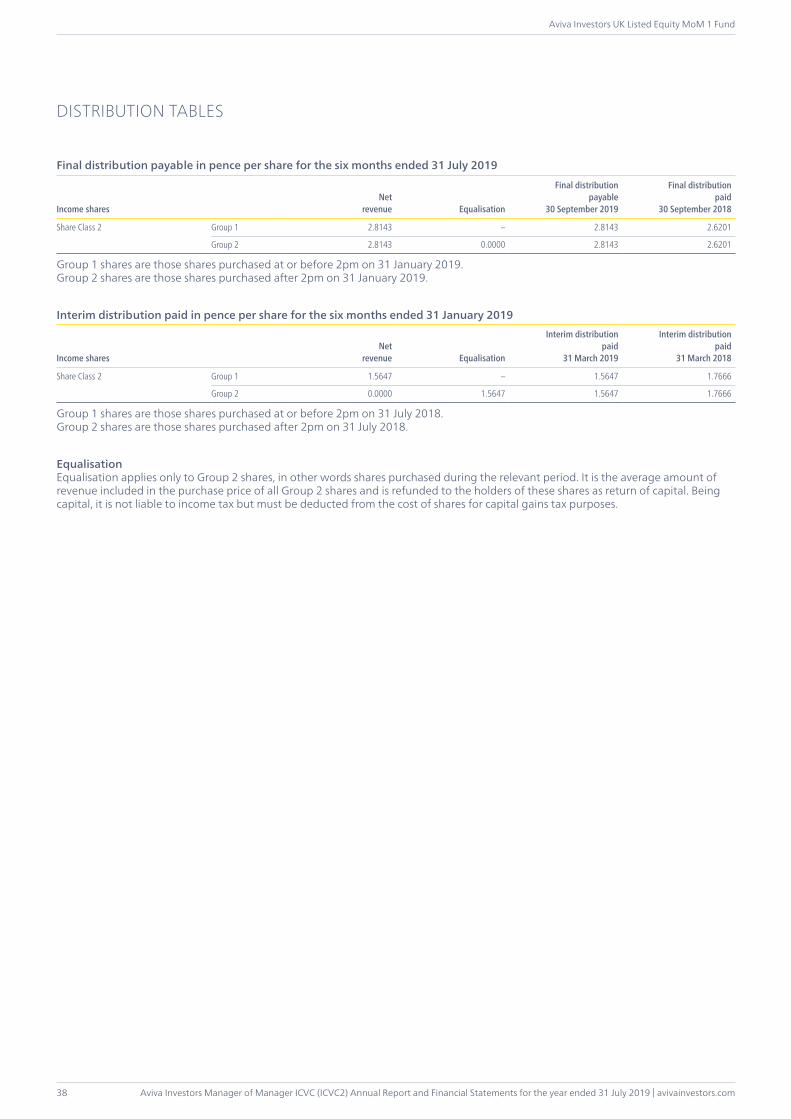
Aviva Investors Manager of Manager ICVC (ICVC2) Annual Report and Financial Statements for the year ended 31 July 2019 | avivainvestors.com
Aviva Investors UK Listed Equity MoM 1 Fund
38
DISTRIBUTION TABLES
Final distribution payable in pence per share for the six months ended 31 July 2019
Income sharesNet
revenue Equalisation
Final distributionpayable
30 September 2019
Final distributionpaid
30 September 2018
Share Class 2 Group 1 2.8143 – 2.8143 2.6201
Group 2 2.8143 0.0000 2.8143 2.6201
Group 1 shares are those shares purchased at or before 2pm on 31 January 2019.Group 2 shares are those shares purchased after 2pm on 31 January 2019.
Interim distribution paid in pence per share for the six months ended 31 January 2019
Income sharesNet
revenue Equalisation
Interim distributionpaid
31 March 2019
Interim distributionpaid
31 March 2018
Share Class 2 Group 1 1.5647 – 1.5647 1.7666
Group 2 0.0000 1.5647 1.5647 1.7666
Group 1 shares are those shares purchased at or before 2pm on 31 July 2018.Group 2 shares are those shares purchased after 2pm on 31 July 2018.
EqualisationEqualisation applies only to Group 2 shares, in other words shares purchased during the relevant period. It is the average amount of revenue included in the purchase price of all Group 2 shares and is refunded to the holders of these shares as return of capital. Being capital, it is not liable to income tax but must be deducted from the cost of shares for capital gains tax purposes.

avivainvestors.com | Aviva Investors Manager of Manager ICVC (ICVC2) Annual Report and Financial Statements for the year ended 31 July 2019
Aviva Investors UK Equity MoM 2 Fund
39
The Fund closed on 18 May 2019, and will be terminated in due course.
The Fund’s investors provided an instruction to redeem their respective investments in the Fund in full. Following this redemption the Fund was left as a shell fund with no shareholders and no assets requiring management. The ACD therefore proposed to terminate the Fund.
INVESTMENT OBJECTIVELong term capital growth by investing primarily in UK equities.
INVESTMENT POLICYThe Fund invested primarily in equity securities listed or traded on Regulated markets in the UK. Limited exposure to other geographic regions may be possible. The Fund might have invested in any of the following financial instruments in order to achieve its investment objective: equities or securities with equity characteristics, unlisted transferable securities, convertibles, preference shares, warrants, money market instruments, collective investment schemes and deposits.
FUND MANAGER’S REPORTPerformanceOver the period 1 August 2018 to 18 May 2019, the Fund returned (2.82)% (net of fees). The Funds benchmark, the FTSE® All-Share index, returned (2.05)% over the same period.
ReviewThe biggest negative contributor was in the healthcare sector. Indivior is a market leader in treating addiction to opioids. Its legacy products are losing their patent protection so finding new products is important – but progress here has been slower than hoped.
Elsewhere, our remaining holding in Tui Travel fell sharply when it reported weaker trading. Our mistake here has been to envisage the prize of Tui changing into a better quality hotel and cruise company and to overlook the challenges that were building for its legacy business in traditional holidays. Royal Mail and William Hill were also disappointing.
Positive contributors included some of our ‘dependables’ – stocks that have been steadily contributing to returns for some time. Over this period, Wolters Kluwer was prominent. Similar to our other substantial position in this area, Relx, Wolters provides data and analytics that help its clients to do their jobs more effectively and profitably. Its services span tax and accounting, healthcare and legal.
Our longstanding position in 3i also made a good return. Its key asset, Action (a Europe-wide chain of discount stores), had a difficult 2018 as some logistical challenges held back its profit growth. These problems now appear to be behind it and rapid growth has resumed. There is much more in 3i’s portfolio – we think of it as a portfolio of growth stocks that are valued below the market. The Fund’s performance was also helped by a bid for Inmarsat, which, despite the 46% rise over the period, cannot be said to have been a successful investment for us.
Additions to the portfolio over the period included Smiths Group and ITV. Smiths Group has high-quality, cash-generative businesses in medical products, detection (airports etc) and seals (oil and gas /refining). We like the idea that, in addition to the respectable dividend, management has been investing to ensure better growth in the future. The case for buying ITV is, perhaps, more controversial. We believe that the idea that all advertising will move to social media or that Netflix will rule the world is showing signs that it may be flawed. ITV still has a lot of value to offer advertisers. It also has its own digital properties that have yet to be tapped. The shares are at five-year lows. Even the slightest sign that it can avoid outright oblivion should lead to better performance.
After holding it for six years and benefitting from a threefold increase on our book cost in that time, we decided to sell our holding in Rentokil. Valuation is the key element in this decision. In sharp contrast, we sold our SAP after a relatively brief holding period and for a modest loss.
In the first half of the period under review, the market environment for equities was very negative. Quantitative easing began to disappear, trade tensions increased and Italy seemed to revel in becoming the EU’s latest delinquent. Above all of that, however, was the fear of higher interest rates in response to the continued strength of the US economy. The trade war, meanwhile, moved from rhetoric to reality. And with international investors continuing to give our shores a wide berth, the UK market remained a domestic affair.
In the opening months of 2019, however, equity markets rallied strongly. Whether this was because the news was not getting worse or due to more positive catalysts is debatable. Perhaps the most tangible change was a strong indication that further rises in US interest rates were off the cards for now. This has looked to be a given in Europe and Japan but in the US the argument had been more finely balanced because of the strength of the economy. Notwithstanding the political impasse, the UK market only slightly lagged the recovery in global equity markets.
September 2019* Fund performance figures – share class 2, source Lipper, net of fees, net income reinvested in GBP. Unless otherwise indicated, all data has been sourced by Artemis.As noted above, the performance figures in this commentary have been sourced from an external party and are based on published prices. The performance figures quoted in the comparative table on page 41 are based on the net asset value per the published accounts and may be different due to post year end accounting adjustments. “FTSE” is a trade mark jointly acquired by the London Stock Exchange Plc and The Financial Times Limited and is used by FTSE International Limited (“FTSE”) under Licence. FTSE does not sponsor, endorse or promote this product and is not in any way connected to it and does not accept any liability in relation to its issue, operation and trading. All copyright in the index values and constituent list vests in FTSE. Any opinions expressed are those of the Fund manager. They should not be viewed as a guarantee of a return from an investment in the Funds. The content of the commentary should not be viewed as a recommendation to invest nor to buy or sell stocks. Past performance is not a guide to future performance. The value of an investment in the Fund and any income from it may go down as well as up, and the investor may not get back the original amount invested.
AVIVA INVESTORS UK EQUITY MOM 2 FUND

Aviva Investors Manager of Manager ICVC (ICVC2) Annual Report and Financial Statements for the year ended 31 July 2019 | avivainvestors.com
Aviva Investors UK Equity MoM 2 Fund
40
Material Portfolio ChangesPurchases Sales
ITV BP
Smiths Group 3i Group
Daily Mail & General Trust ‘A’ GlaxoSmithKline
Ebro Foods RELX
Imperial Brands Royal Dutch Shell ‘B’
Cobham Legal & General Group
Royal Dutch Shell ‘B’ Lloyds Banking Group
BP Informa
3i Group Segro, REIT
Segro, REIT Rio Tinto
Synthetic Risk and Reward IndicatorInvestment risks have been removed as the Fund closed on 18 May 2019.
AVIVA INVESTORS UK EQUITY MOM 2 FUND (CONTINUED)

avivainvestors.com | Aviva Investors Manager of Manager ICVC (ICVC2) Annual Report and Financial Statements for the year ended 31 July 2019
Aviva Investors UK Equity MoM 2 Fund
41
COMPARATIVE TABLE
Class 2 Income2019§
p per share2018
p per share2017
p per share
Change in net assets per shareOpening net asset value per share 110.65 105.22 94.82
Return before operating charges† (106.96) 9.60 14.39Operating charges (0.80) (1.11) (1.05)Return after operating charges† (107.76) 8.49 13.34
Distributions (2.89) (3.06) (2.94)
Closing net asset value per share – 110.65 105.22
† after direct transaction costs of (0.10) (0.15) (0.12)
PerformanceReturn after charges – 8.07% 14.07%
Other informationClosing net asset value (£000) – 139,105 124,189Closing number of shares – 125,715,552 118,028,339Operating charges (%)‡ 1.04% 1.03% 1.04%Direct transaction costs (%)# 0.10% 0.14% 0.12%
Prices≈
Highest share price 110.82 114.26 108.05Lowest share price 93.80 100.91 94.39
‡ The operating charges are calculated on an ex-post basis and as such may differ from the Ongoing Charge Figure where:(a) The Ongoing Charge has been annualised for a share class that has not yet been open for a full year.# The direct transaction costs have been stated after deducting, in the case of single-priced funds, the proportion of the amounts collected from dilution adjustments or dilution levies that relates to direct transaction costs and, in the case of dual-priced funds, the amounts collected in relation to direct transaction costs added to, or subtracted from, the valuations by virtue of COLL 6.3.6 G (4).≈ The high and low prices disclosed are the high and low prices for the accounting period and not the calendar year and are based on published prices. The net asset value per share price is based on the net asset value in the published accounts and may be different due to post year end accounting adjustments.§ Up to 18 May 2019 (date the Fund closed).
Ongoing Charges Figure*Share class 31.07.19 31.07.18
Class 2 1.04% 1.04%
* The Ongoing Charges Figure (OCF) is calculated as the ratio of the total ongoing charges to the average net asset value of the Fund over the year. The OCF is made up of the Fund Management Fee and, where a fund invests a substantial portion of its assets in other funds, an amount for the pro-rated charges of those other funds (referred to as “synthetic charges” or the “synthetic” part of the ongoing charge). The figure for ongoing charges excludes performance fees and portfolio transaction costs, except in the case of an entry/exit charge paid by the Fund when buying or selling shares/units in another collective investment scheme.Please remember that past performance is not a guide to future performance and it might not be repeated. The value of investments and the revenue from them may go down as well as up and investors may not get back the amount originally invested. Because of this, you are not certain to make a profit on your investments and you may lose money.
Portfolio StatementAs the Fund closed on 18 May 2019, there were no investments as at 31 July 2019.

Aviva Investors Manager of Manager ICVC (ICVC2) Annual Report and Financial Statements for the year ended 31 July 2019 | avivainvestors.com
Aviva Investors UK Equity MoM 2 Fund
42
STATEMENT OF TOTAL RETURNFor the year ended 31 July 2019
Notes £000
Year ended31.07.19
£000 £000
Year ended31.07.18
£000
Income
Net capital (losses)/gains 2 (8,074) 6,540
Revenue 3 4,985 5,020
Expenses 4 (1,045) (1,322)
Net revenue before taxation 3,940 3,698
Taxation 5 (34) (72)
Net revenue after taxation 3,906 3,626
Total return before distributions (4,168) 10,166
Distributions 6 (3,875) (3,626)
Change in net assets attributable to shareholders from investment activities (8,043) 6,540
STATEMENT OF CHANGE IN NET ASSETS ATTRIBUTABLE TO SHAREHOLDERSFor the year ended 31 July 2019
£000
Year ended31.07.19
£000 £000
Year ended31.07.18
£000
Opening net assets attributable to shareholders 139,105 124,189
Amounts transferred via in-specie transactions (133,461) –
Movement due to issue and cancellation of shares:
Amounts receivable on issue of shares 8,884 9,927
Amounts payable on cancellation of shares (6,505) (1,590)
2,379 8,337
Dilution adjustment 51 39
Change in net assets attributable to shareholders from investment activities (see above) (8,043) 6,540
Fund closure (31) –
Closing net assets attributable to shareholders – 139,105
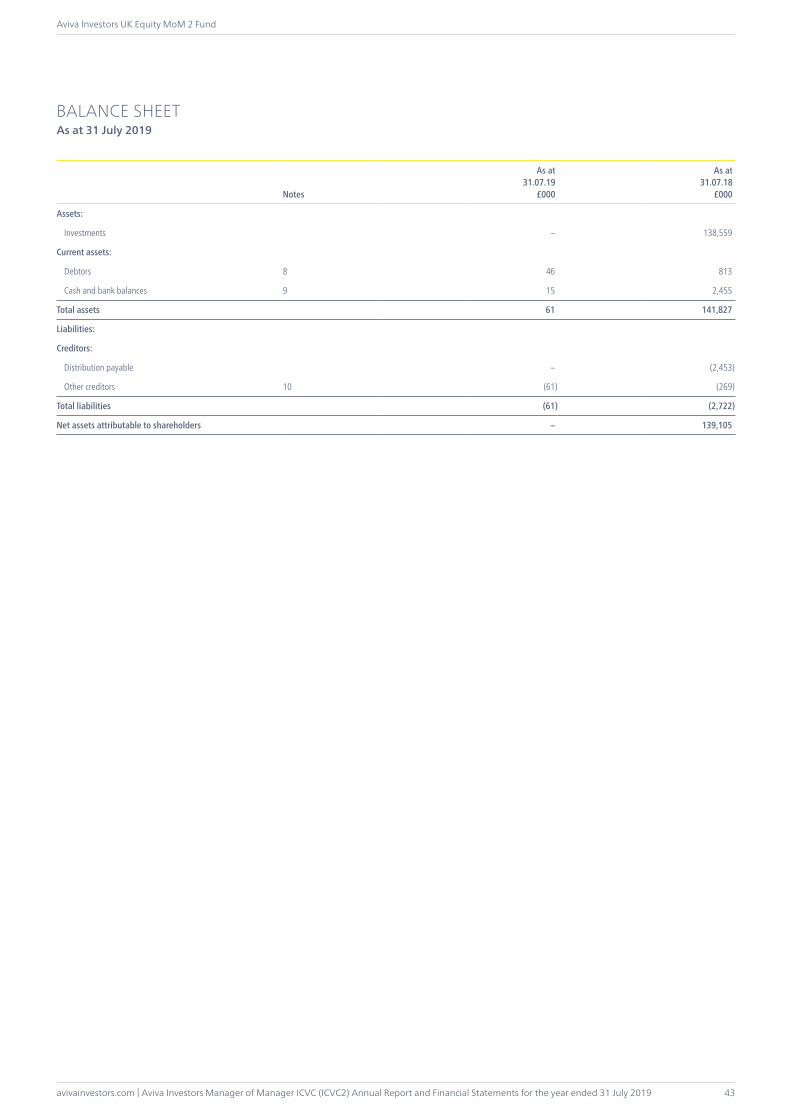
avivainvestors.com | Aviva Investors Manager of Manager ICVC (ICVC2) Annual Report and Financial Statements for the year ended 31 July 2019
Aviva Investors UK Equity MoM 2 Fund
43
BALANCE SHEETAs at 31 July 2019
Notes
As at31.07.19
£000
As at31.07.18
£000
Assets:
Investments – 138,559
Current assets:
Debtors 8 46 813
Cash and bank balances 9 15 2,455
Total assets 61 141,827
Liabilities:
Creditors:
Distribution payable – (2,453)
Other creditors 10 (61) (269)
Total liabilities (61) (2,722)
Net assets attributable to shareholders – 139,105
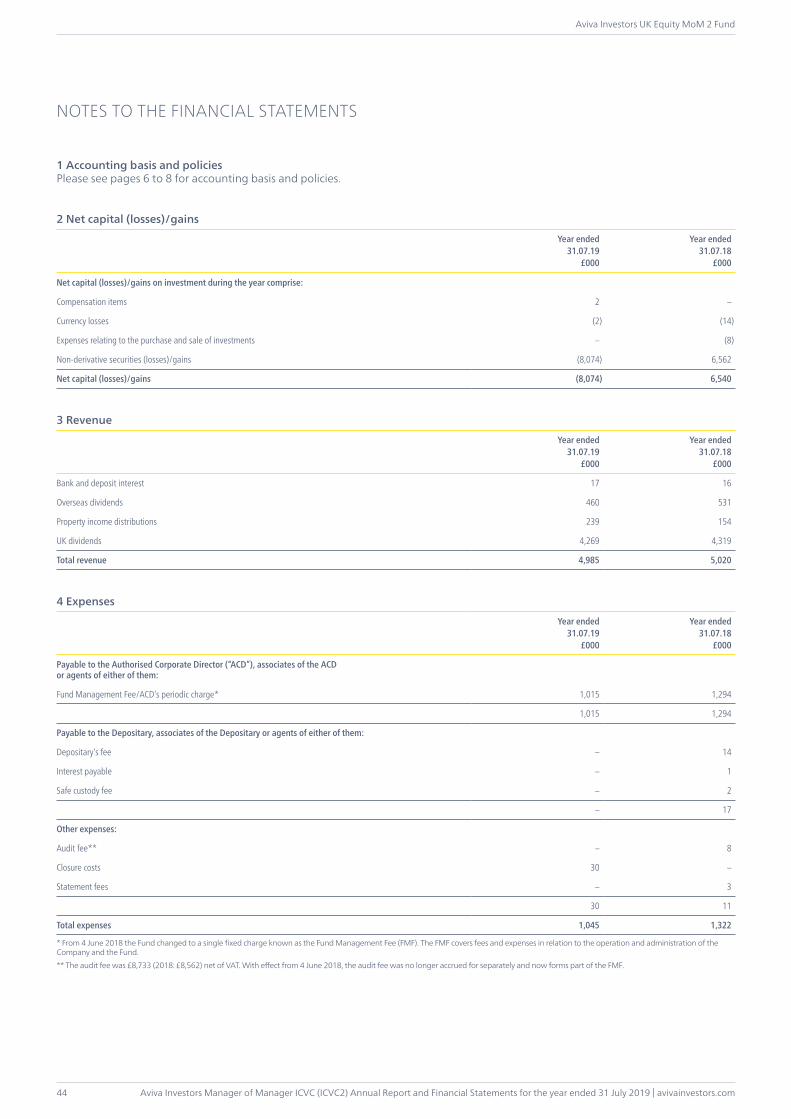
Aviva Investors Manager of Manager ICVC (ICVC2) Annual Report and Financial Statements for the year ended 31 July 2019 | avivainvestors.com
Aviva Investors UK Equity MoM 2 Fund
44
1 Accounting basis and policiesPlease see pages 6 to 8 for accounting basis and policies.
2 Net capital (losses)/gains
Year ended31.07.19
£000
Year ended31.07.18
£000
Net capital (losses)/gains on investment during the year comprise:
Compensation items 2 –
Currency losses (2) (14)
Expenses relating to the purchase and sale of investments – (8)
Non-derivative securities (losses)/gains (8,074) 6,562
Net capital (losses)/gains (8,074) 6,540
3 Revenue
Year ended31.07.19
£000
Year ended31.07.18
£000
Bank and deposit interest 17 16
Overseas dividends 460 531
Property income distributions 239 154
UK dividends 4,269 4,319
Total revenue 4,985 5,020
4 Expenses
Year ended31.07.19
£000
Year ended31.07.18
£000
Payable to the Authorised Corporate Director (“ACD”), associates of the ACD or agents of either of them:
Fund Management Fee/ACD’s periodic charge* 1,015 1,294
1,015 1,294
Payable to the Depositary, associates of the Depositary or agents of either of them:
Depositary’s fee – 14
Interest payable – 1
Safe custody fee – 2
– 17
Other expenses:
Audit fee** – 8
Closure costs 30 –
Statement fees – 3
30 11
Total expenses 1,045 1,322
* From 4 June 2018 the Fund changed to a single fixed charge known as the Fund Management Fee (FMF). The FMF covers fees and expenses in relation to the operation and administration of the Company and the Fund.** The audit fee was £8,733 (2018: £8,562) net of VAT. With effect from 4 June 2018, the audit fee was no longer accrued for separately and now forms part of the FMF.
NOTES TO THE FINANCIAL STATEMENTS

avivainvestors.com | Aviva Investors Manager of Manager ICVC (ICVC2) Annual Report and Financial Statements for the year ended 31 July 2019
Aviva Investors UK Equity MoM 2 Fund
45
5 Taxationa Analysis of tax charge
Year ended31.07.19
£000
Year ended31.07.18
£000
Overseas tax suffered 34 72
Total current tax for the year (see note 5b) 34 72
b Factors affecting current tax charge
The tax assessed for the year is lower (2018: lower) than the standard rate of corporation tax in the UK for an Authorised Investment Fund (20%) (2018: 20%).
The differences are explained below:
Year ended31.07.19
£000
Year ended31.07.18
£000
Net revenue before taxation 3,940 3,698
Corporation tax at 20% 788 740
Effects of:
Movement in excess management expenses 158 230
Overseas dividends not subject to corporation tax (92) (106)
Overseas tax suffered 34 72
UK dividends not subject to corporation tax (854) (864)
(754) (668)
Current tax charge (see note 5a) 34 72
Authorised Investment Funds are exempt from tax on capital gains. Therefore, any capital return is not included in the above reconciliation.
c Deferred tax There was no provision for deferred tax at the year end (2018: £nil).
After claiming relief against accrued income taxable on receipt, the Fund has unrelieved excess expenses of £10,734,968 (2018: £9,945,468) creating a potential deferred tax asset of £2,146,994 (2018: £1,989,094). It is unlikely that the Fund will generate taxable profits in the future to utilise these amounts and therefore no deferred tax asset has been recognised in the current or prior year.
NOTES TO THE FINANCIAL STATEMENTS (CONTINUED)
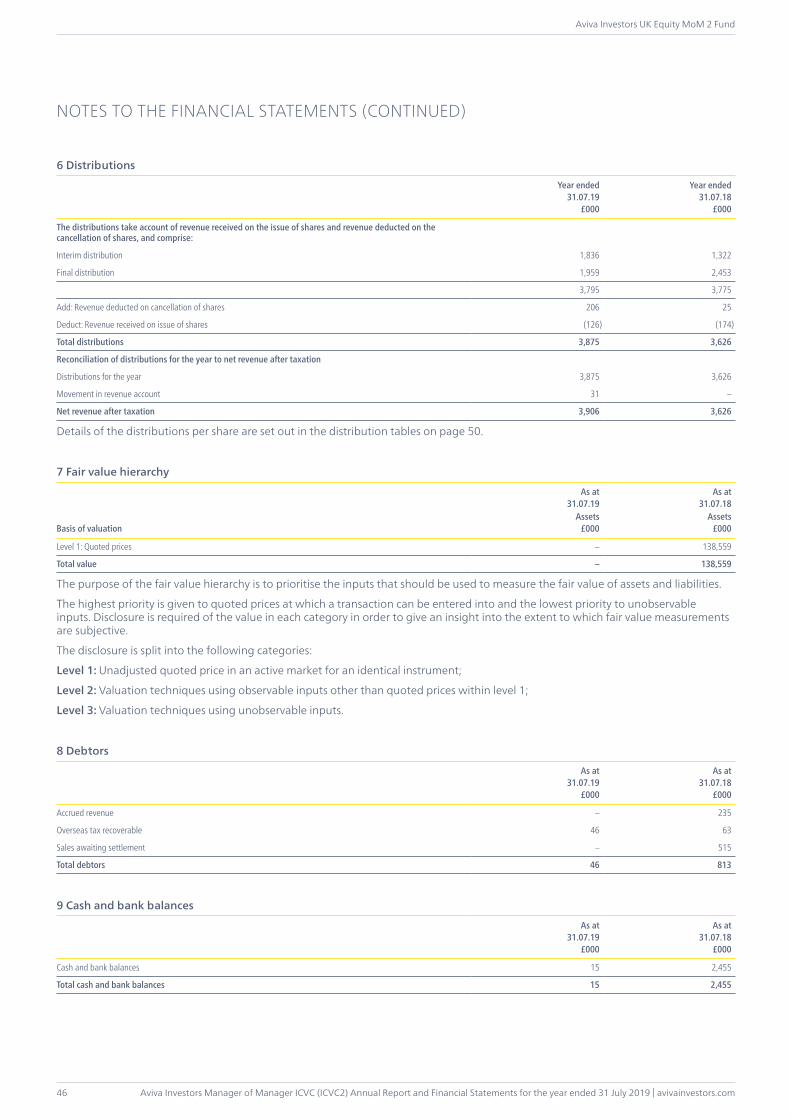
Aviva Investors Manager of Manager ICVC (ICVC2) Annual Report and Financial Statements for the year ended 31 July 2019 | avivainvestors.com
Aviva Investors UK Equity MoM 2 Fund
46
6 Distributions
Year ended31.07.19
£000
Year ended31.07.18
£000
The distributions take account of revenue received on the issue of shares and revenue deducted on the cancellation of shares, and comprise:
Interim distribution 1,836 1,322
Final distribution 1,959 2,453
3,795 3,775
Add: Revenue deducted on cancellation of shares 206 25
Deduct: Revenue received on issue of shares (126) (174)
Total distributions 3,875 3,626
Reconciliation of distributions for the year to net revenue after taxation
Distributions for the year 3,875 3,626
Movement in revenue account 31 –
Net revenue after taxation 3,906 3,626
Details of the distributions per share are set out in the distribution tables on page 50.
7 Fair value hierarchy
As at31.07.19
As at31.07.18
Basis of valuationAssets
£000Assets
£000
Level 1: Quoted prices – 138,559
Total value – 138,559
The purpose of the fair value hierarchy is to prioritise the inputs that should be used to measure the fair value of assets and liabilities.
The highest priority is given to quoted prices at which a transaction can be entered into and the lowest priority to unobservable inputs. Disclosure is required of the value in each category in order to give an insight into the extent to which fair value measurements are subjective.
The disclosure is split into the following categories:
Level 1: Unadjusted quoted price in an active market for an identical instrument;
Level 2: Valuation techniques using observable inputs other than quoted prices within level 1;
Level 3: Valuation techniques using unobservable inputs.
8 Debtors
As at31.07.19
£000
As at31.07.18
£000
Accrued revenue – 235
Overseas tax recoverable 46 63
Sales awaiting settlement – 515
Total debtors 46 813
9 Cash and bank balances
As at31.07.19
£000
As at31.07.18
£000
Cash and bank balances 15 2,455
Total cash and bank balances 15 2,455
NOTES TO THE FINANCIAL STATEMENTS (CONTINUED)

avivainvestors.com | Aviva Investors Manager of Manager ICVC (ICVC2) Annual Report and Financial Statements for the year ended 31 July 2019
Aviva Investors UK Equity MoM 2 Fund
47
10 Other creditors
As at31.07.19
£000
As at31.07.18
£000
Accrued expenses 30 126
Amounts payable to ACD 31 –
Purchases awaiting settlement – 143
Total creditors 61 269
11 Contingent liabilities and commitmentsThere were no contingent liabilities or commitments at the year end (2018: £nil).
12 Related party transactionsAviva Investors UK Fund Services Limited, Aviva Investors Global Services Limited and the Aviva group are deemed to be related parties per section 33.10 of FRS 102 as they are entities with control, joint control or significant influence over the entity.
Fund Management Fee/ACD’s periodic charges paid to Aviva Investors UK Fund Services Limited (“the ACD”) are shown in note 4 and details of shares issued and cancelled by the ACD are shown in the statement of change in net assets attributable to shareholders. The balance due to the ACD at the year end in respect of Fund Management Fee/ACD’s periodic charges was £nil (2018: £125,778). Any balance due from the ACD in respect of issues is shown in note 8. Any balance due to the ACD in respect of cancellations is shown in note 10.
Distributions payable to the ACD and related parties of the ACD during the year amounted to £3,794,897 (2018: £3,774,814). The amount outstanding at the year end was £nil (2018: £2,453,213). Related parties of the ACD are deemed to be all companies under the control of Aviva Plc. This will include companies which hold shares in the Fund on behalf of other external investors.
The Fund closed during the year and sold all investments therefore at the year end there were no holdings in any investments managed and advised by Aviva Investors Global Services Limited or associated with the Aviva Group.
Holdings at the year end and movements during the year are as follows:
Holdings at31.07.19(shares)
Movement(shares)
Holdings at31.07.18(shares)
ACD and related parties (Class 2 Income shares) – (125,715,552) 125,715,552
The ACD and related parties of the ACD are ineligible to vote at any general meeting.
13 Shareholder fundsThe Fund currently has one share class: Class 2 (Institutional). The Fund Management Fee is as follows:
Class 2: 1.04%
The net asset value of the share class, the net asset value per share and the number of shares in the class are shown on page 41. The distributions per share class are given in the distribution tables on page 50.
14 Shares in issue reconciliationNumber of shares
in issue at31.07.18
Number ofshares issued
Number ofshares cancelled
Number ofshares converted
Number of shares in issue at
31.07.19
Share Class 2 Income 125,715,552 9,180,100 (134,895,652) – –
NOTES TO THE FINANCIAL STATEMENTS (CONTINUED)

Aviva Investors Manager of Manager ICVC (ICVC2) Annual Report and Financial Statements for the year ended 31 July 2019 | avivainvestors.com
Aviva Investors UK Equity MoM 2 Fund
48
15 Derivatives and other financial instrumentsThe policies applied in the management of financial instruments are set out on pages 6 to 8.
Fair value of financial assets and financial liabilitiesThere is no significant difference between the carrying values of the financial assets and liabilities and their fair values (2018: £nil).
Currency riskAt the year end date, nil% (2018: 9.34%) of the net assets of the Fund were denominated in currencies other than sterling and as such the currency risk is not considered significant.
Interest rate riskThe Fund does not invest in either fixed or floating rate securities and interest rate risk exposure is restricted to interest receivable on bank deposits or payable on bank overdraft positions which will be affected by fluctuations in interest rates.
At the year end date nil% (2018: 1.76%) of the net assets of the Fund were interest bearing and as such the interest rate risk is not considered significant.
The floating rate on bank balances is linked to the Depositary’s base rate.
Market price riskAt the year end date, nil% (2018: 99.61%) of the net assets of the Fund were invested in ordinary shares or stock units or debt securities admitted to an official stock exchange. If the market value were to change by 10%, the value of the Fund would change by nil% (2018: 9.96%).
16 Direct transaction costs In the case of shares, broker commissions and transfer taxes, stamp duty is paid by the Fund on each transaction. In addition, there is a dealing spread between buying and selling prices of the underlying investments. Unlike shares, other types of investments (such as bonds, money market instruments, derivatives) have no separately identifiable transaction costs; these costs form part of the dealing spread.
31.07.19
Principalbefore costs
£000Commissions
£000Taxes£000
Totalafter costs
£000
Commissions as %
of principal
Taxes as %
of principal
Purchases (excluding Inspecie & Corporate Action activity)
Equities (25,103) (7) (110) (25,220) 0.03% 0.44%(25,103) (7) (110) (25,220)
Sales (excluding Inspecie & Corporate Action activity)Equities 26,405 (9) – 26,396 0.03% 0.00%Sales (include in-specie activity only)Equities 129,306 – – 129,306 0.00% 0.00%
155,711 (9) – 155,702
Total (16) (110)
Percentage of Fund average net assets 0.01% 0.09%
NOTES TO THE FINANCIAL STATEMENTS (CONTINUED)
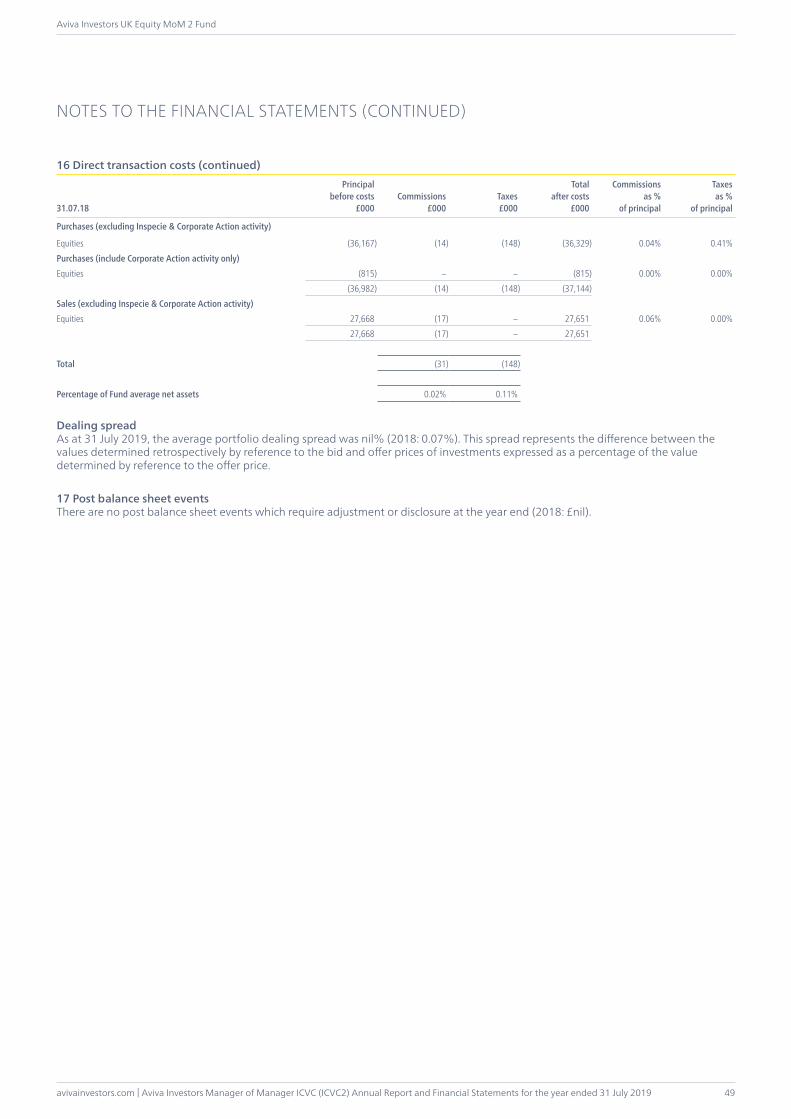
avivainvestors.com | Aviva Investors Manager of Manager ICVC (ICVC2) Annual Report and Financial Statements for the year ended 31 July 2019
Aviva Investors UK Equity MoM 2 Fund
49
16 Direct transaction costs (continued)
31.07.18
Principalbefore costs
£000Commissions
£000Taxes£000
Totalafter costs
£000
Commissions as %
of principal
Taxes as %
of principal
Purchases (excluding Inspecie & Corporate Action activity)
Equities (36,167) (14) (148) (36,329) 0.04% 0.41%Purchases (include Corporate Action activity only)Equities (815) – – (815) 0.00% 0.00%
(36,982) (14) (148) (37,144)Sales (excluding Inspecie & Corporate Action activity)Equities 27,668 (17) – 27,651 0.06% 0.00%
27,668 (17) – 27,651
Total (31) (148)
Percentage of Fund average net assets 0.02% 0.11%
Dealing spreadAs at 31 July 2019, the average portfolio dealing spread was nil% (2018: 0.07%). This spread represents the difference between the values determined retrospectively by reference to the bid and offer prices of investments expressed as a percentage of the value determined by reference to the offer price.
17 Post balance sheet eventsThere are no post balance sheet events which require adjustment or disclosure at the year end (2018: £nil).
NOTES TO THE FINANCIAL STATEMENTS (CONTINUED)

Aviva Investors Manager of Manager ICVC (ICVC2) Annual Report and Financial Statements for the year ended 31 July 2019 | avivainvestors.com
Aviva Investors UK Equity MoM 2 Fund
50
DISTRIBUTION TABLES
Final distribution paid in pence per share for the three months ended 30 April 2019
Income sharesNet
revenue Equalisation
Final distributionpaid
28 June 2019
Final distributionpaid
30 September 2018
Share Class 2 Group 1 1.4942 – 1.4942 1.9514
Group 2 1.4942 – 1.4942 1.9514
Group 1 shares are those shares purchased at or before 2pm on 31 January 2019.Group 2 shares are those shares purchased after 2pm on 31 January 2019.
Interim distribution paid in pence per share for the six months ended 31 January 2019
Income sharesNet
revenue Equalisation
Interim distributionpaid
31 March 2019
Interim distributionpaid
31 March 2018
Share Class 2 Group 1 1.3962 – 1.3962 1.1097
Group 2 0.0129 1.3833 1.3962 1.1097
Group 1 shares are those shares purchased at or before 2pm on 31 July 2018.Group 2 shares are those shares purchased after 2pm on 31 July 2018.
EqualisationEqualisation applies only to Group 2 shares, in other words shares purchased during the relevant period. It is the average amount of revenue included in the purchase price of all Group 2 shares and is refunded to the holders of these shares as return of capital. Being capital, it is not liable to income tax but must be deducted from the cost of shares for capital gains tax purposes.
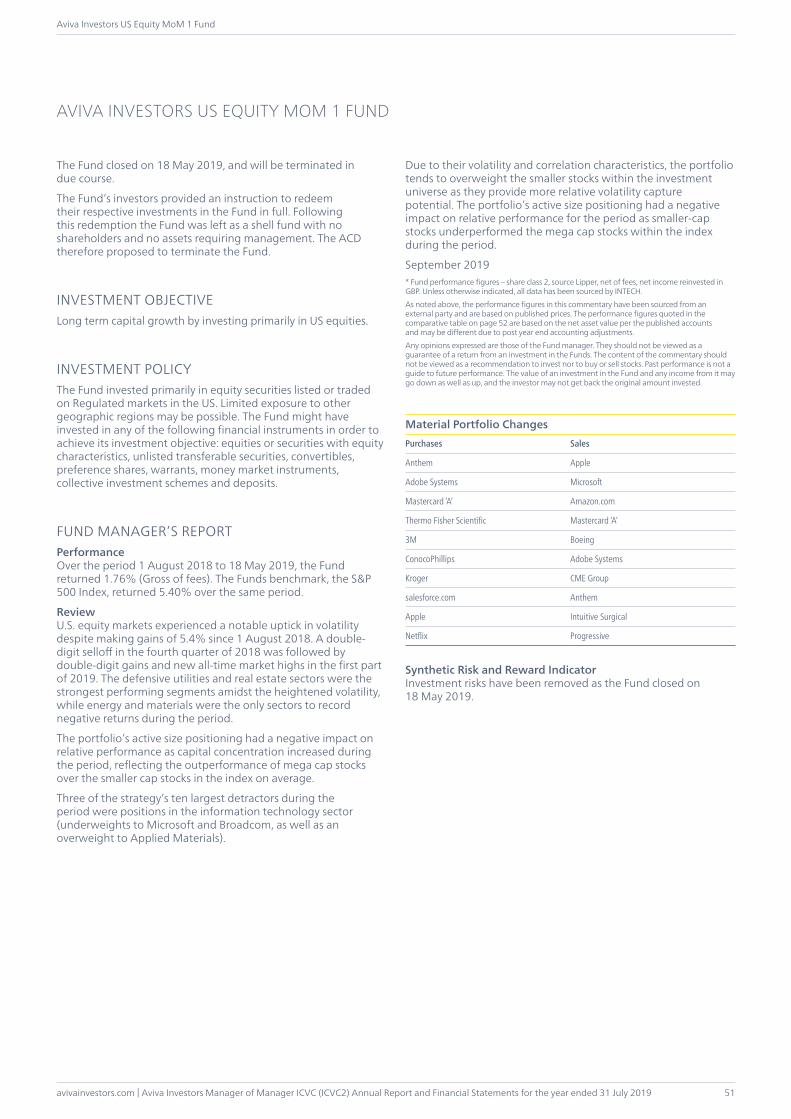
avivainvestors.com | Aviva Investors Manager of Manager ICVC (ICVC2) Annual Report and Financial Statements for the year ended 31 July 2019
Aviva Investors US Equity MoM 1 Fund
51
The Fund closed on 18 May 2019, and will be terminated in due course.
The Fund’s investors provided an instruction to redeem their respective investments in the Fund in full. Following this redemption the Fund was left as a shell fund with no shareholders and no assets requiring management. The ACD therefore proposed to terminate the Fund.
INVESTMENT OBJECTIVELong term capital growth by investing primarily in US equities.
INVESTMENT POLICYThe Fund invested primarily in equity securities listed or traded on Regulated markets in the US. Limited exposure to other geographic regions may be possible. The Fund might have invested in any of the following financial instruments in order to achieve its investment objective: equities or securities with equity characteristics, unlisted transferable securities, convertibles, preference shares, warrants, money market instruments, collective investment schemes and deposits.
FUND MANAGER’S REPORTPerformanceOver the period 1 August 2018 to 18 May 2019, the Fund returned 1.76% (Gross of fees). The Funds benchmark, the S&P 500 Index, returned 5.40% over the same period.
ReviewU.S. equity markets experienced a notable uptick in volatility despite making gains of 5.4% since 1 August 2018. A double-digit selloff in the fourth quarter of 2018 was followed by double-digit gains and new all-time market highs in the first part of 2019. The defensive utilities and real estate sectors were the strongest performing segments amidst the heightened volatility, while energy and materials were the only sectors to record negative returns during the period.
The portfolio’s active size positioning had a negative impact on relative performance as capital concentration increased during the period, reflecting the outperformance of mega cap stocks over the smaller cap stocks in the index on average.
Three of the strategy’s ten largest detractors during the period were positions in the information technology sector (underweights to Microsoft and Broadcom, as well as an overweight to Applied Materials).
Due to their volatility and correlation characteristics, the portfolio tends to overweight the smaller stocks within the investment universe as they provide more relative volatility capture potential. The portfolio’s active size positioning had a negative impact on relative performance for the period as smaller-cap stocks underperformed the mega cap stocks within the index during the period.
September 2019* Fund performance figures – share class 2, source Lipper, net of fees, net income reinvested in GBP. Unless otherwise indicated, all data has been sourced by INTECH. As noted above, the performance figures in this commentary have been sourced from an external party and are based on published prices. The performance figures quoted in the comparative table on page 52 are based on the net asset value per the published accounts and may be different due to post year end accounting adjustments. Any opinions expressed are those of the Fund manager. They should not be viewed as a guarantee of a return from an investment in the Funds. The content of the commentary should not be viewed as a recommendation to invest nor to buy or sell stocks. Past performance is not a guide to future performance. The value of an investment in the Fund and any income from it may go down as well as up, and the investor may not get back the original amount invested.
Material Portfolio ChangesPurchases Sales
Anthem Apple
Adobe Systems Microsoft
Mastercard ‘A’ Amazon.com
Thermo Fisher Scientific Mastercard ‘A’
3M Boeing
ConocoPhillips Adobe Systems
Kroger CME Group
salesforce.com Anthem
Apple Intuitive Surgical
Netflix Progressive
Synthetic Risk and Reward Indicator Investment risks have been removed as the Fund closed on 18 May 2019.
AVIVA INVESTORS US EQUITY MOM 1 FUND
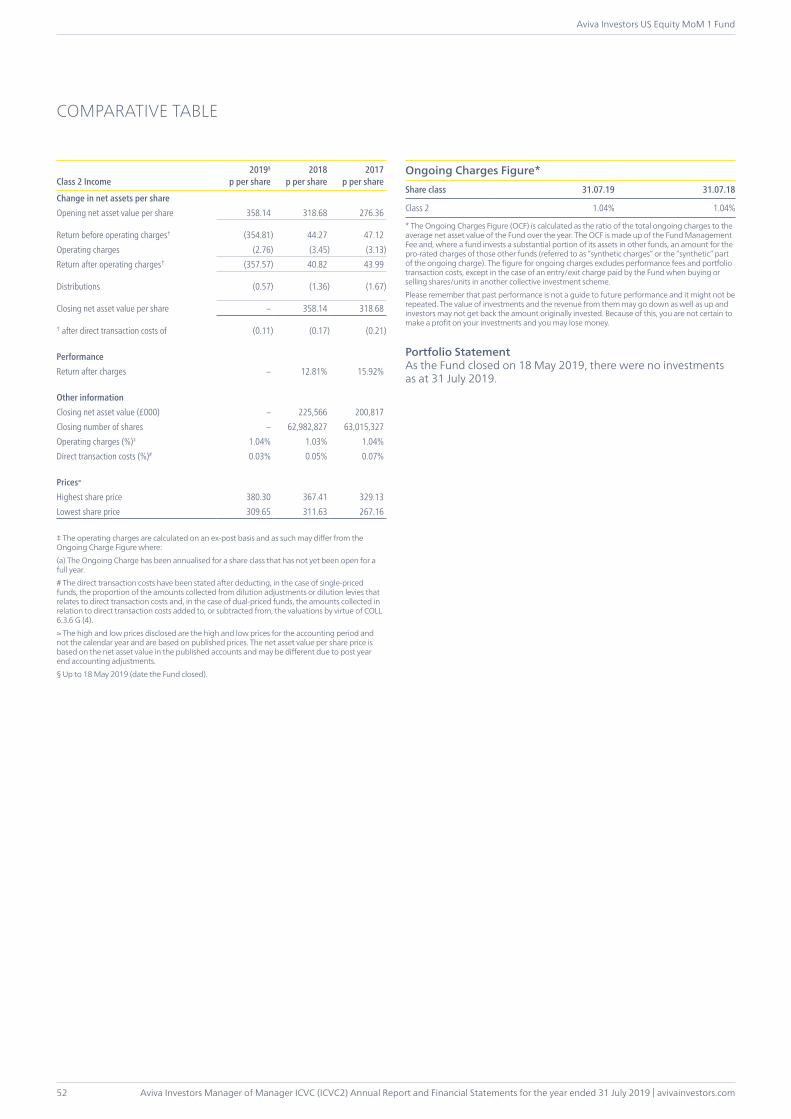
Aviva Investors Manager of Manager ICVC (ICVC2) Annual Report and Financial Statements for the year ended 31 July 2019 | avivainvestors.com
Aviva Investors US Equity MoM 1 Fund
52
COMPARATIVE TABLE
Class 2 Income2019§
p per share2018
p per share2017
p per share
Change in net assets per shareOpening net asset value per share 358.14 318.68 276.36
Return before operating charges† (354.81) 44.27 47.12Operating charges (2.76) (3.45) (3.13)Return after operating charges† (357.57) 40.82 43.99
Distributions (0.57) (1.36) (1.67)
Closing net asset value per share – 358.14 318.68
† after direct transaction costs of (0.11) (0.17) (0.21)
PerformanceReturn after charges – 12.81% 15.92%
Other informationClosing net asset value (£000) – 225,566 200,817Closing number of shares – 62,982,827 63,015,327Operating charges (%)‡ 1.04% 1.03% 1.04%Direct transaction costs (%)# 0.03% 0.05% 0.07%
Prices≈
Highest share price 380.30 367.41 329.13Lowest share price 309.65 311.63 267.16
‡ The operating charges are calculated on an ex-post basis and as such may differ from the Ongoing Charge Figure where:(a) The Ongoing Charge has been annualised for a share class that has not yet been open for a full year.# The direct transaction costs have been stated after deducting, in the case of single-priced funds, the proportion of the amounts collected from dilution adjustments or dilution levies that relates to direct transaction costs and, in the case of dual-priced funds, the amounts collected in relation to direct transaction costs added to, or subtracted from, the valuations by virtue of COLL 6.3.6 G (4).≈ The high and low prices disclosed are the high and low prices for the accounting period and not the calendar year and are based on published prices. The net asset value per share price is based on the net asset value in the published accounts and may be different due to post year end accounting adjustments.§ Up to 18 May 2019 (date the Fund closed).
Ongoing Charges Figure*Share class 31.07.19 31.07.18
Class 2 1.04% 1.04%
* The Ongoing Charges Figure (OCF) is calculated as the ratio of the total ongoing charges to the average net asset value of the Fund over the year. The OCF is made up of the Fund Management Fee and, where a fund invests a substantial portion of its assets in other funds, an amount for the pro-rated charges of those other funds (referred to as “synthetic charges” or the “synthetic” part of the ongoing charge). The figure for ongoing charges excludes performance fees and portfolio transaction costs, except in the case of an entry/exit charge paid by the Fund when buying or selling shares/units in another collective investment scheme.Please remember that past performance is not a guide to future performance and it might not be repeated. The value of investments and the revenue from them may go down as well as up and investors may not get back the amount originally invested. Because of this, you are not certain to make a profit on your investments and you may lose money.
Portfolio StatementAs the Fund closed on 18 May 2019, there were no investments as at 31 July 2019.

avivainvestors.com | Aviva Investors Manager of Manager ICVC (ICVC2) Annual Report and Financial Statements for the year ended 31 July 2019
Aviva Investors US Equity MoM 1 Fund
53
STATEMENT OF TOTAL RETURNFor the year ended 31 July 2019
Notes £000
Year ended31.07.19
£000 £000
Year ended31.07.18
£000
Income
Net capital gains 2 3,425 24,117
Revenue 3 2,527 3,368
Expenses 4 (1,642) (2,084)
Net revenue before taxation 885 1,284
Taxation 5 (565) (469)
Net revenue after taxation 320 815
Total return before distributions 3,745 24,932
Distributions 6 (363) (815)
Change in net assets attributable to shareholders from investment activities 3,382 24,117
STATEMENT OF CHANGE IN NET ASSETS ATTRIBUTABLE TO SHAREHOLDERSFor the year ended 31 July 2019
£000
Year ended31.07.19
£000 £000
Year ended31.07.18
£000
Opening net assets attributable to shareholders 225,566 200,817
Amounts transferred via in-specie transactions (190,659) –
Movement due to issue and cancellation of shares:
Amounts receivable on issue of shares 7,583 22,878
Amounts payable on cancellation of shares (45,873) (22,280)
(38,290) 598
Dilution adjustment 21 34
Change in net assets attributable to shareholders from investment activities (see above) 3,382 24,117
Fund closure (20) –
Closing net assets attributable to shareholders – 225,566
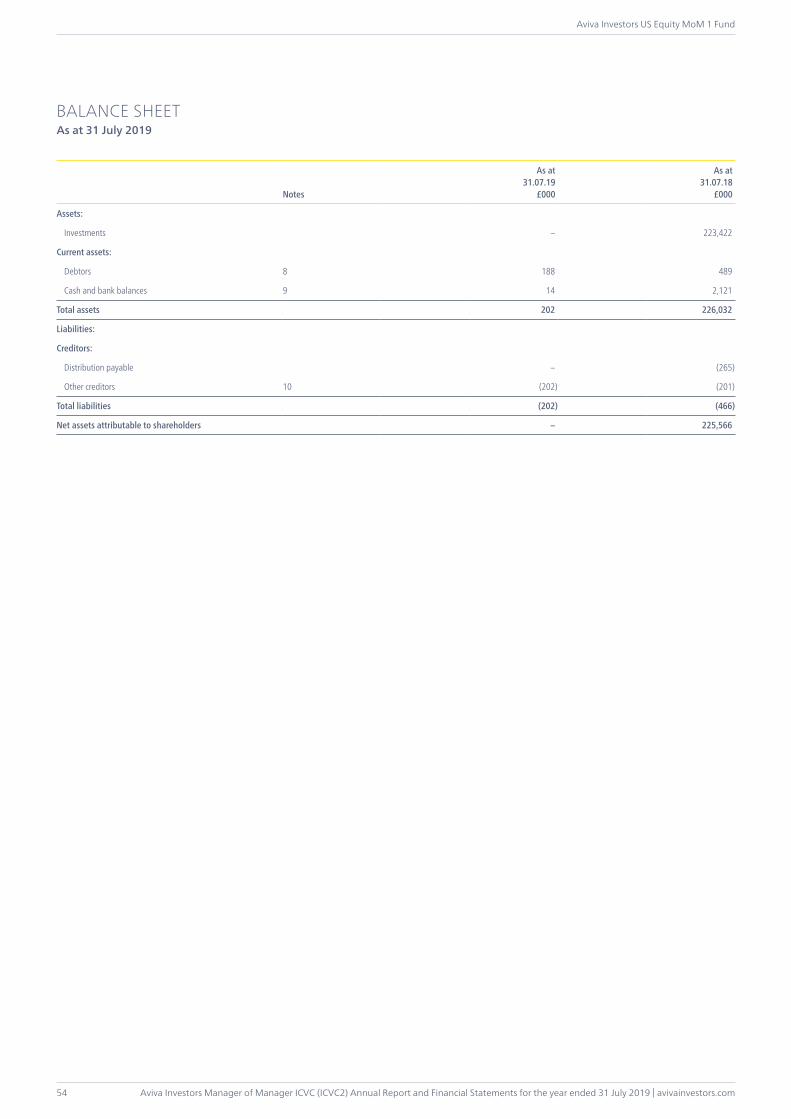
Aviva Investors Manager of Manager ICVC (ICVC2) Annual Report and Financial Statements for the year ended 31 July 2019 | avivainvestors.com
Aviva Investors US Equity MoM 1 Fund
54
BALANCE SHEETAs at 31 July 2019
Notes
As at31.07.19
£000
As at31.07.18
£000
Assets:
Investments – 223,422
Current assets:
Debtors 8 188 489
Cash and bank balances 9 14 2,121
Total assets 202 226,032
Liabilities:
Creditors:
Distribution payable – (265)
Other creditors 10 (202) (201)
Total liabilities (202) (466)
Net assets attributable to shareholders – 225,566

avivainvestors.com | Aviva Investors Manager of Manager ICVC (ICVC2) Annual Report and Financial Statements for the year ended 31 July 2019
Aviva Investors US Equity MoM 1 Fund
55
1 Accounting basis and policiesPlease see pages 6 to 8 for accounting basis and policies.
2 Net capital gains
Year ended31.07.19
£000
Year ended31.07.18
£000
Net capital gains on investments during the year comprise:
Compensation items 4 –
Currency gains/(losses) 147 (92)
Expenses relating to the purchase and sale of investments – (10)
Non-derivative securities gains 3,274 24,219
Net capital gains 3,425 24,117
3 Revenue
Year ended31.07.19
£000
Year ended31.07.18
£000
Bank and deposit interest 15 5
Overseas dividends 2,506 3,360
UK dividends 6 3
Total revenue 2,527 3,368
4 Expenses
Year ended31.07.19
£000
Year ended31.07.18
£000
Payable to the Authorised Corporate Director (“ACD”), associates of the ACD or agents of either of them:
Fund Management Fee/ACD periodic charges* 1,612 2,042
1,612 2,042
Payable to the Depositary, associates of the Depositary or agents of either of them:
Depositary’s fee – 21
Safe custody fee – 6
– 27
Other expenses:
Audit fee** – 9
Closure costs 30 –
Statement fees – 6
30 15
Total expenses 1,642 2,084
* From 4 June 2018 the Fund changed to a single fixed charge known as the Fund Management Fee (FMF). The FMF covers fees and expenses in relation to the operation and administration of the Company and the Fund.** The audit fee was £8,733 (2018: £8,562) net of VAT. With effect from 4 June 2018, the audit fee was no longer accrued for separately and now forms part of the FMF.
NOTES TO THE FINANCIAL STATEMENTS
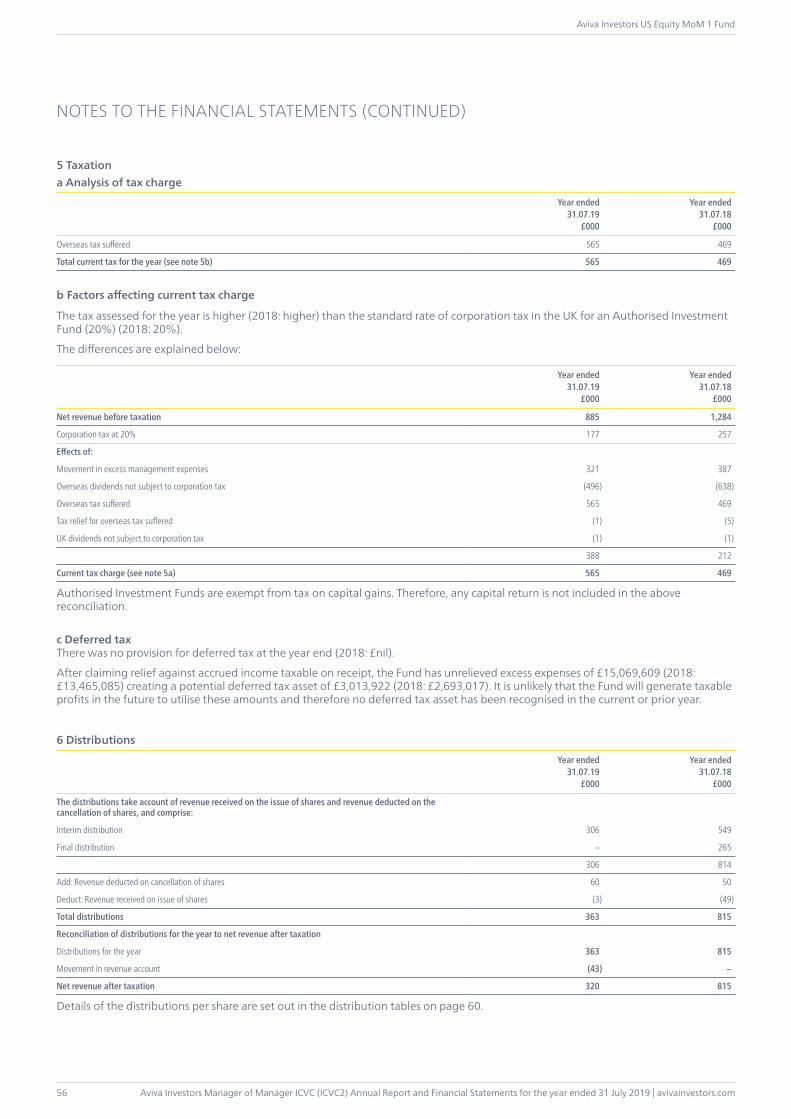
Aviva Investors Manager of Manager ICVC (ICVC2) Annual Report and Financial Statements for the year ended 31 July 2019 | avivainvestors.com
Aviva Investors US Equity MoM 1 Fund
56
5 Taxationa Analysis of tax charge
Year ended31.07.19
£000
Year ended31.07.18
£000
Overseas tax suffered 565 469
Total current tax for the year (see note 5b) 565 469
b Factors affecting current tax charge
The tax assessed for the year is higher (2018: higher) than the standard rate of corporation tax in the UK for an Authorised Investment Fund (20%) (2018: 20%).
The differences are explained below:
Year ended31.07.19
£000
Year ended31.07.18
£000
Net revenue before taxation 885 1,284
Corporation tax at 20% 177 257
Effects of:
Movement in excess management expenses 321 387
Overseas dividends not subject to corporation tax (496) (638)
Overseas tax suffered 565 469
Tax relief for overseas tax suffered (1) (5)
UK dividends not subject to corporation tax (1) (1)
388 212
Current tax charge (see note 5a) 565 469
Authorised Investment Funds are exempt from tax on capital gains. Therefore, any capital return is not included in the above reconciliation.
c Deferred taxThere was no provision for deferred tax at the year end (2018: £nil).
After claiming relief against accrued income taxable on receipt, the Fund has unrelieved excess expenses of £15,069,609 (2018: £13,465,085) creating a potential deferred tax asset of £3,013,922 (2018: £2,693,017). It is unlikely that the Fund will generate taxable profits in the future to utilise these amounts and therefore no deferred tax asset has been recognised in the current or prior year.
6 Distributions
Year ended31.07.19
£000
Year ended31.07.18
£000
The distributions take account of revenue received on the issue of shares and revenue deducted on the cancellation of shares, and comprise:
Interim distribution 306 549
Final distribution – 265
306 814
Add: Revenue deducted on cancellation of shares 60 50
Deduct: Revenue received on issue of shares (3) (49)
Total distributions 363 815
Reconciliation of distributions for the year to net revenue after taxation
Distributions for the year 363 815
Movement in revenue account (43) –
Net revenue after taxation 320 815
Details of the distributions per share are set out in the distribution tables on page 60.
NOTES TO THE FINANCIAL STATEMENTS (CONTINUED)
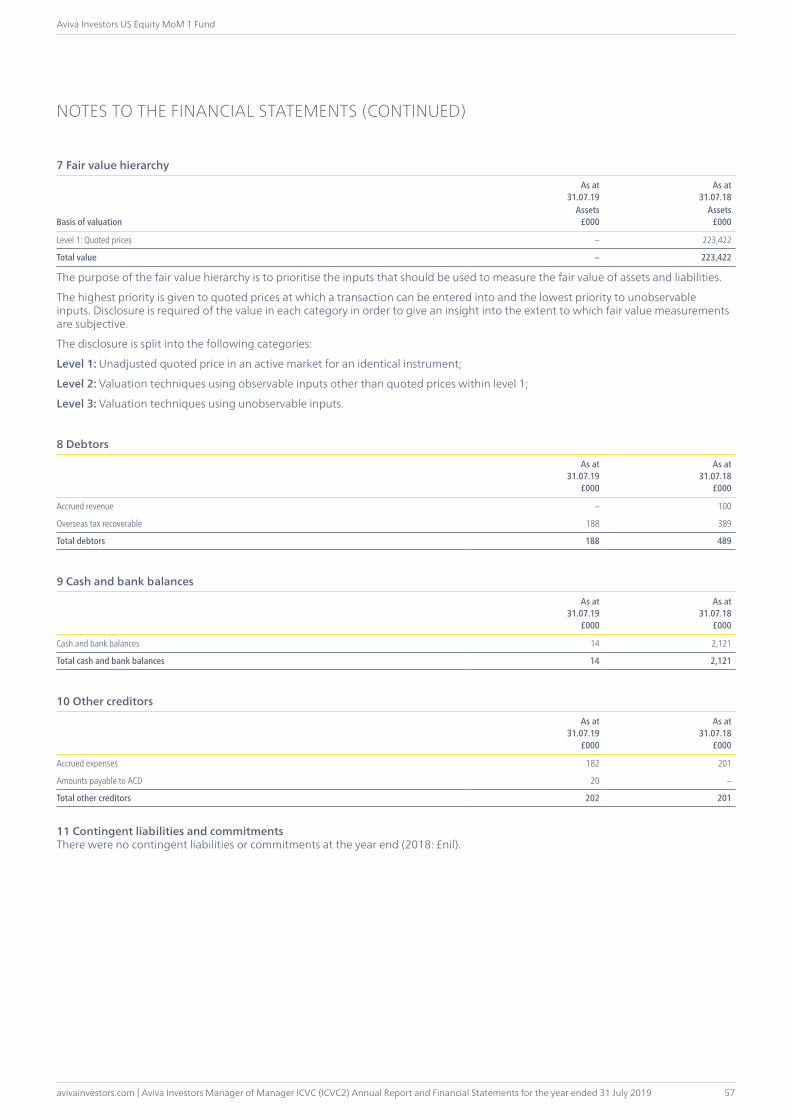
avivainvestors.com | Aviva Investors Manager of Manager ICVC (ICVC2) Annual Report and Financial Statements for the year ended 31 July 2019
Aviva Investors US Equity MoM 1 Fund
57
7 Fair value hierarchy
Basis of valuation
As at31.07.19
As at31.07.18
Assets£000
Assets£000
Level 1: Quoted prices – 223,422
Total value – 223,422
The purpose of the fair value hierarchy is to prioritise the inputs that should be used to measure the fair value of assets and liabilities.
The highest priority is given to quoted prices at which a transaction can be entered into and the lowest priority to unobservable inputs. Disclosure is required of the value in each category in order to give an insight into the extent to which fair value measurements are subjective.
The disclosure is split into the following categories:
Level 1: Unadjusted quoted price in an active market for an identical instrument;
Level 2: Valuation techniques using observable inputs other than quoted prices within level 1;
Level 3: Valuation techniques using unobservable inputs.
8 Debtors
As at31.07.19
£000
As at31.07.18
£000
Accrued revenue – 100
Overseas tax recoverable 188 389
Total debtors 188 489
9 Cash and bank balances
As at31.07.19
£000
As at31.07.18
£000
Cash and bank balances 14 2,121
Total cash and bank balances 14 2,121
10 Other creditors
As at31.07.19
£000
As at31.07.18
£000
Accrued expenses 182 201
Amounts payable to ACD 20 –
Total other creditors 202 201
11 Contingent liabilities and commitmentsThere were no contingent liabilities or commitments at the year end (2018: £nil).
NOTES TO THE FINANCIAL STATEMENTS (CONTINUED)

Aviva Investors Manager of Manager ICVC (ICVC2) Annual Report and Financial Statements for the year ended 31 July 2019 | avivainvestors.com
Aviva Investors US Equity MoM 1 Fund
58
12 Related party transactionsAviva Investors UK Fund Services Limited, Aviva Investors Global Services Limited and the Aviva group are deemed to be related parties per section 33.10 of FRS 102 as they are entities with control, joint control or significant influence over the entity.
Fund Management Fee/ACD periodic charges paid to Aviva Investors UK Fund Services Limited (“the ACD”) are shown in note 4 and details of shares issued and cancelled by the ACD are shown in the statement of change in net assets attributable to shareholders. The balance due to the ACD at the year end in respect of Fund Management Fee/ACD periodic charges was £152,608 (2018: £200,947). Any balance due from the ACD in respect of issues is shown in note 8. Any balance due to the ACD in respect of cancellations is shown in note 10.
Distributions payable to the ACD and related parties of the ACD during the year amounted to £305,726 (2018: £813,852). The amount outstanding at the year end was £nil (2018: £264,906). Related parties of the ACD are deemed to be all companies under the control of Aviva Plc. This will include companies which hold shares in the Fund on behalf of other external investors.
The Fund closed during the year and sold all investments therefore at the year end there were no holdings in any investments managed and advised by Aviva Investors Global Services Limited or associated with the Aviva Group.
Holdings at the year end and movements during the year are as follows:
Holdings at31.07.19(shares)
Movement(shares)
Holdings at31.07.18(shares)
ACD and related parties (Class 2 Income shares) – (62,982,827) 62,982,827
The ACD and related parties of the ACD are ineligible to vote at any general meeting.
13 Shareholder fundsThe Fund currently has one share class: Class 2 (Institutional). The Fund Management Fee is as follows:
Class 2: 1.04%
The net asset value of the share class, the net asset value per share and the number of shares in the class are shown on page 52. The distributions per share class are given in the distribution tables on page 60.
14 Shares in issue reconciliationNumber of shares
in issue at31.07.18
Number ofshares issued
Number ofshares cancelled
Number ofshares converted
Number of shares in issue at
31.07.19
Share Class 2 Income 62,982,827 2,030,690 (65,013,517) – –
15 Derivatives and other financial instrumentsThe policies applied in the management of financial instruments are set out on pages 6 to 8.
Fair value of financial assets and financial liabilitiesThere is no significant difference between the carrying values of the financial assets and liabilities and their fair values (2018: £nil).
Currency riskAt the year end date, nil% (2018: 99.75%) of the net assets of the Fund were denominated in currencies other than sterling with the effect that the balance sheet and total return can be significantly affected by currency movements. If currency rates were to change by 10.00%, the value of the Fund would change by nil% (2018: 9.98%).
Currency
Net foreign currency assets
Monetary exposure£000
Non monetary exposure£000
Total£000
31.07.19 31.07.18 31.07.19 31.07.18 31.07.19 31.07.18
US Dollar 190 1,583 – 223,422 190 225,005
Interest rate riskThe Fund does not invest in either fixed or floating rate securities and interest rate risk exposure is restricted to interest receivable on bank deposits or payable on bank overdraft positions which will be affected by fluctuations in interest rates.
At the year end date nil% (2018: 0.94%) of the net assets of the Fund were interest bearing and as such the interest rate risk is not considered significant.
The floating rate on bank balances is linked to the Depositary’s base rate.
Market price riskAt the year end date, nil% (2018: 99.05%) of the net assets of the Fund were invested in ordinary shares or stock units admitted to an official stock exchange. If the market value were to change by 10%, the value of the Fund would change by nil% (2018: 9.91%).
NOTES TO THE FINANCIAL STATEMENTS (CONTINUED)

avivainvestors.com | Aviva Investors Manager of Manager ICVC (ICVC2) Annual Report and Financial Statements for the year ended 31 July 2019
Aviva Investors US Equity MoM 1 Fund
59
16 Direct transaction costs In the case of shares, broker commissions and transfer taxes, stamp duty is paid by the Fund on each transaction. In addition, there is a dealing spread between buying and selling prices of the underlying investments. Unlike shares, other types of investments (such as bonds, money market instruments, derivatives) have no separately identifiable transaction costs; these costs form part of the dealing spread.
31.07.19
Principalbefore costs
£000Commissions
£000Taxes£000
Totalafter costs
£000
Commissions as %
of principal
Taxes as %
of principal
Purchases (excluding Inspecie & Corporate Action activity)
Equities (102,220) (25) – (102,245) 0.02% 0.00%(102,220) (25) – (102,245)
Sales (excluding Inspecie & Corporate Action activity)Equities 142,764 (31) (2) 142,731 0.02% 0.00%Sales (in-specie activity only)Equities 186,194 – – 186,194 0.00% 0.00%
328,958 (31) (2) 328,925
Total (56) (2)
Percentage of Fund average net assets 0.03% 0.00%
31.07.18
Principalbefore costs
£000Commissions
£000Taxes£000
Totalafter costs
£000
Commissions as %
of principal
Taxes as %
of principal
Purchases (excluding Inspecie & Corporate Action activity)
Equities (136,605) (50) – (136,655) 0.04% 0.00%(136,605) (50) – (136,655)
Sales (excluding Inspecie & Corporate Action activity)Equities 136,498 (51) (3) 136,444 0.04% 0.00%
136,498 (51) (3) 136,444
Total (101) (3)
Percentage of Fund average net assets 0.05% 0.00%
Dealing spreadAs at 31 July 2019, the average portfolio dealing spread was nil% (2018: 0.02%). This spread represents the difference between the values determined retrospectively by reference to the bid and offer prices of investments expressed as a percentage of the value determined by reference to the offer price.
17 Post balance sheet eventsThere are no post balance sheet events which require adjustment or disclosure at the year end (2018: £nil).
NOTES TO THE FINANCIAL STATEMENTS (CONTINUED)

Aviva Investors Manager of Manager ICVC (ICVC2) Annual Report and Financial Statements for the year ended 31 July 2019 | avivainvestors.com
Aviva Investors US Equity MoM 1 Fund
60
DISTRIBUTION TABLES
Final distribution paid in pence per share for the three months ended 30 April 2019
Income sharesNet
revenue Equalisation
Final distributionpaid
28 June 2019
Final distributionpaid
30 September 2018
Share Class 2 Group 1 0.0000 – 0.0000 0.4206
Group 2 0.0000 0.0000 0.0000 0.4206
Group 1 shares are those shares purchased at or before 2pm on 31 January 2019.Group 2 shares are those shares purchased after 2pm on 31 January 2019.
Interim distribution paid in pence per share for the six months ended 31 January 2019
Income sharesNet
revenue Equalisation
Interim distributionpaid
31 March 2019
Interim distributionpaid
31 March 2018
Share Class 2 Group 1 0.5654 – 0.5654 0.9369
Group 2 0.4230 0.1424 0.5654 0.9369
Group 1 shares are those shares purchased at or before 2pm on 31 July 2018.Group 2 shares are those shares purchased after 2pm on 31 July 2018.
EqualisationEqualisation applies only to Group 2 shares, in other words shares purchased during the relevant period. It is the average amount of revenue included in the purchase price of all Group 2 shares and is refunded to the holders of these shares as return of capital. Being capital, it is not liable to income tax but must be deducted from the cost of shares for capital gains tax purposes.

avivainvestors.com | Aviva Investors Manager of Manager ICVC (ICVC2) Annual Report and Financial Statements for the year ended 31 July 2019
Aviva Investors Euro Equity MoM 1 Fund
61
The Fund closed on 18 May 2019, and will be terminated in due course.
INVESTMENT OBJECTIVELong term capital growth by investing primarily in European equities (excluding UK).
INVESTMENT POLICYThe Fund invested primarily in equity securities listed or traded on Regulated markets in Europe (excluding UK). Limited exposure to other geographic regions may be possible. The Fund might have invested in any of the following financial instruments in order to achieve its investment objective: equities or securities with equity characteristics, unlisted transferable securities, convertibles, preference shares, warrants, money market instruments, collective investment schemes and deposits.
FUND MANAGER’S REPORTPerformanceOver the period 1 August 2018 to 18 May 2019, the Fund returned (3.96)% (net of fees). The Funds benchmark, the FTSE® World Europe ex-UK Index, returned (1.75)% over the same period.
ReviewMarket weakness over the period was concentrated in the final quarter of 2018, as global macroeconomic and geopolitical uncertainty led to concerns that the economic cycle had peaked, which in turn affected cyclically-exposed sectors and financials. At the stock level, rising input costs, and in some instances labour costs, caused disappointment, as did poor results for a number of technology companies, mostly in the United States.
The German economy, Europe’s largest, contracted in the third quarter of 2018 for the first time in three years, partially reflecting a number of one-off factors, including new emissions testing standards for autos, which weighed on that sector. News flow elsewhere across the region ebbed and flowed, and the agreement to delay the United Kingdom’s departure from the European Union led to greater regional business uncertainty. The European Central Bank (ECB) reduced its euro zone gross domestic product forecast for the year from 1.7% to 1.1%, in response to trade tensions and slower emerging markets growth.
Global markets recovered strongly at the beginning of 2019, helped by perceived progress on the US-China trade talks, and expectations that major central bank policy would remain supportive. In Europe, technology stocks benefitted from the US-led rise in sector valuation and performance, and the oil & gas sector was buoyed the strength in the oil price. Further impetus was provided by expectations that the US Federal Reserve would cut interest rates during the year, and that the ECB would restart its programme of quantitative easing. Investor sentiment was tempered by period-end as a number of trade and geopolitical issues pushed global bond yields lower, tipping a number of European government 10-year bond yields into negative territory and pushing the gold price to a near six-year high.
Utilities was the best performing sector over the period, while basic materials and financials were major detractors.
Stock selection in the consumer goods sector was the major detractor from portfolio returns; stock selection in the oil & gas and financials sectors also weighed on performance. In contrast, stock selection in basic materials contributed to returns.
In consumer goods, not holding Nestlé was the largest detractor from relative performance over the period. Along with a number of defensive stocks and sectors, Nestlé performed well during periods of market weakness which occurred during the period under review, and particularly during the final quarter of 2018. Another major detractor in this sector was automotive parts supplier Faurecia. In spite of delivering good results, fears about the effect of tariffs on the autos sector and profit warnings from some of its peers gave rise to concerns that Faurecia would be the next to disappoint.
In contrast, a positive contribution in the sector came from Danish brewer Carlsberg, which delivered strong full-year 2019 results. Organic sales growth was the best for 10 years, and was accompanied by a double-digit increase in the dividend, and the announcement of a share buyback programme.
The best performing stock in the portfolio was an overweight in Novartis in the health care sector. The company reported strong results for the third quarter of 2018, which showed growth accelerating and good cost control, while confidence grew in the new chief executive officer and the long-term strategy of the business. In contrast, not owning Roche detracted from sector performance, as the company performed strongly at the end of 2018.
Another strong performer was an overweight in chemicals business DSM, in the basic materials sector. The company reported strong results for the first quarter of 2019, with the nutrition business performing particularly well.
In the financials sector, overweight positions in Société Genéralé, Nordea, Bankia, Credit Suisse and Julius Baer Group detracted from performance. Widespread financial market weakness at the end of 2018 was unhelpful for those banks deriving revenues from market levels, while lower bond yields created margin pressure across the industry.
In consumer services, Irish low-cost airline Ryanair detracted, reflecting strike action by pilots and cabin crew during September, and more recently the adverse effect of Brexit-related uncertainty on passenger demand and fare expectations.
An overweight position in aerospace and defence supplier Safran in the industrials sector contributed to performance, following first half results which exceeded expectations. The gross margin improved despite the integration of Zodiac Aerospace.
In the technology sector, semiconductor equipment business ASML was added to the portfolio at the beginning of 2019, and contributed positively to performance. The company is an attractive cyclical compounder with a monopoly position in lithography.
AVIVA INVESTORS EURO EQUITY MOM 1 FUND
Aviva Investors Manager of Manager ICVC (ICVC2) Annual Report and Financial Statements for the year ended 31 July 2019 | avivainvestors.com
Aviva Investors Euro Equity MoM 1 Fund
62
FUND MANAGER’S REPORT (CONTINUED)OutlookEuropean equity markets have been caught in the middle of a number of opposing forces, namely growing tensions around global trade and increasingly dovish central banks. While some of the headwinds posed to regional growth during the first half of the year have eased, it is difficult to forecast what the significant economic news flow will be during the second half of the year.
Against this backdrop, we believe it is important to take a longer-term perspective and remember that underlying fundamentals will ultimately reflect the health of companies, not short-term macroeconomic sentiment. As bond yields have pushed lower, bond-sensitive sectors in Europe have continued to outperform, despite their already high valuations and questions around their underlying fundamentals. Conversely, there are some stocks and sectors that are pricing in the risk of a potential recession resulting in valuations that are difficult to ignore. These companies could potentially be very attractive over the longer term should such risks fail to materialise.
In this increasingly complex environment, we believe that our active, bottom-up stock selection approach focused on company fundamentals is best suited to uncovering investment opportunities at attractive valuations.
September 2019* Fund performance figures – share class 2, source Lipper, net of fees, net income reinvested in GBP. Unless otherwise indicated, all data has been sourced by Lazard Asset Management. As noted above, the performance figures in this commentary have been sourced from an external party and are based on published prices. The performance figures quoted in the comparative table on page 63 are based on the net asset value per the published accounts and may be different due to post year end accounting adjustments. “FTSE” is a trade mark jointly acquired by the London Stock Exchange Plc and The Financial Times Limited and is used by FTSE International Limited (“FTSE”) under Licence. FTSE does not sponsor, endorse or promote this product and is not in any way connected to it and does not accept any liability in relation to its issue, operation and trading. All copyright in the index values and constituent list vests in FTSE. Any opinions expressed are those of the Fund manager. They should not be viewed as a guarantee of a return from an investment in the Funds. The content of the commentary should not be viewed as a recommendation to invest nor to buy or sell stocks. Past performance is not a guide to future performance. The value of an investment in the Fund and any income from it may go down as well as up, and the investor may not get back the original amount invested.
Material Portfolio ChangesPurchases Sales
Sanofi Novartis
Air Liquide SAP
Koninklijke DSM Anheuser-Busch InBev
UniCredit AXA
ASML Holding Safran
Symrise Vinci
Vonovia Wolters Kluwer
Red Electrica Porsche Automobil Holding Preference
QIAGEN Galp Energia
Knorr-Bremse Orange
Synthetic Risk and Reward Indicator Investment risks have been removed as the Fund closed on 18 May 2019.
AVIVA INVESTORS EURO EQUITY MOM 1 FUND (CONTINUED)
avivainvestors.com | Aviva Investors Manager of Manager ICVC (ICVC2) Annual Report and Financial Statements for the year ended 31 July 2019
Aviva Investors Euro Equity MoM 1 Fund
63
COMPARATIVE TABLE
Class 2 Income2019§
p per share2018
p per share2017
p per share
Change in net assets per shareOpening net asset value per share 242.19 237.05 195.99
Return before operating charges† (239.64) 10.86 46.63Operating charges (1.87) (2.54) (2.29)Return after operating charges† (241.51) 8.32 44.34
Distributions (0.68) (3.18) (3.28)
Closing net asset value per share – 242.19 237.05
† after direct transaction costs of (0.29) (0.46) (0.52)
PerformanceReturn after charges – 3.51% 22.62%
Other informationClosing net asset value (£000) – 167,490 173,785Closing number of shares – 69,157,059 73,313,168Operating charges (%)‡ 1.07% 1.05% 1.06%Direct transaction costs (%)# 0.13% 0.19% 0.24%
Prices≈
Highest share price 243.83 252.18 241.77Lowest share price 202.82 226.23 191.42
‡ The operating charges are calculated on an ex-post basis and as such may differ from the Ongoing Charge Figure where:(a) The Ongoing Charge has been annualised for a share class that has not yet been open for a full year.# The direct transaction costs have been stated after deducting, in the case of single-priced funds, the proportion of the amounts collected from dilution adjustments or dilution levies that relates to direct transaction costs and, in the case of dual-priced funds, the amounts collected in relation to direct transaction costs added to, or subtracted from, the valuations by virtue of COLL 6.3.6 G (4).≈ The high and low prices disclosed are the high and low prices for the accounting period and not the calendar year and are based on published prices. The net asset value per share price is based on the net asset value in the published accounts and may be different due to post year end accounting adjustments.§ Up to 18 May 2019 (date the Fund closed).
Ongoing Charges Figure*Share class 31.07.19 31.07.18
Class 2 1.07% 1.07%
* The Ongoing Charges Figure (OCF) is calculated as the ratio of the total ongoing charges to the average net asset value of the Fund over the year. The OCF is made up of the Fund Management Fee and, where a fund invests a substantial portion of its assets in other funds, an amount for the pro-rated charges of those other funds (referred to as “synthetic charges” or the “synthetic” part of the ongoing charge). The figure for ongoing charges excludes performance fees and portfolio transaction costs, except in the case of an entry/exit charge paid by the Fund when buying or selling shares/units in another collective investment scheme.Please remember that past performance is not a guide to future performance and it might not be repeated. The value of investments and the revenue from them may go down as well as up and investors may not get back the amount originally invested. Because of this, you are not certain to make a profit on your investments and you may lose money.
Portfolio StatementAs the Fund closed on 18 May 2019, there were no investments as at 31 July 2019.

Aviva Investors Manager of Manager ICVC (ICVC2) Annual Report and Financial Statements for the year ended 31 July 2019 | avivainvestors.com
Aviva Investors Euro Equity MoM 1 Fund
64
STATEMENT OF TOTAL RETURNFor the year ended 31 July 2019
Notes £000
Year ended31.07.19
£000 £000
Year ended31.07.18
£000
Income
Net capital (losses)/gains 2 (10,825) 3,586
Revenue 3 2,418 4,587
Expenses 4 (1,228) (1,803)
Net revenue before taxation 1,190 2,784
Taxation 5 (145) (559)
Net revenue after taxation 1,045 2,225
Total return before distributions (9,780) 5,811
Distributions 6 (829) (2,225)
Change in net assets attributable to shareholders from investment activities (10,609) 3,586
STATEMENT OF CHANGE IN NET ASSETS ATTRIBUTABLE TO SHAREHOLDERSFor the year ended 31 July 2019
£000
Year ended31.07.19
£000 £000
Year ended31.07.18
£000
Opening net assets attributable to shareholders 167,490 173,785
Movement due to issue and cancellation of shares:
Amounts receivable on issue of shares – 40
Amounts payable on cancellation of shares (156,784) (9,921)
(156,784) (9,881)
Dilution adjustment 120 –
Change in net assets attributable to shareholders from investment activities (see above) (10,609) 3,586
Fund closure (217) –
Closing net assets attributable to shareholders – 167,490

avivainvestors.com | Aviva Investors Manager of Manager ICVC (ICVC2) Annual Report and Financial Statements for the year ended 31 July 2019
Aviva Investors Euro Equity MoM 1 Fund
65
BALANCE SHEETAs at 31 July 2019
Notes
As at31.07.19
£000
As at31.07.18
£000
Assets:
Investments – 164,718
Current assets:
Debtors 8 270 1,642
Cash and bank balances 9 7 3,474
Total assets 277 169,834
Liabilities:
Creditors:
Distribution payable – (2,196)
Other creditors 10 (277) (148)
Total liabilities (277) (2,344)
Net assets attributable to shareholders – 167,490
Aviva Investors Manager of Manager ICVC (ICVC2) Annual Report and Financial Statements for the year ended 31 July 2019 | avivainvestors.com
Aviva Investors Euro Equity MoM 1 Fund
66
NOTES TO THE FINANCIAL STATEMENTS
1 Accounting basis and policiesPlease see pages 6 to 8 for accounting basis and policies.
2 Net capital (losses)/gains
Year ended31.07.19
£000
Year ended31.07.18
£000
Net capital (losses)/gains on investment during the year comprise:
Compensation items 3 –
Currency losses (319) (143)
Expenses relating to the purchase and sale of investments – (9)
Non-derivative securities (losses)/gains (10,509) 3,738
Net capital (losses)/gains (10,825) 3,586
3 Revenue
Year ended31.07.19
£000
Year ended31.07.18
£000
Bank and deposit interest 21 6
Overseas dividends 2,360 4,581
UK dividends 37 –
Total revenue 2,418 4,587
4 Expenses
Year ended31.07.19
£000
Year ended31.07.18
£000
Payable to the Authorised Corporate Director (“ACD”), associates of the ACD or agents of either of them:
Fund Management Fee/ACD periodic charges* 1,197 1,744
1,197 1,744
Payable to the Depositary, associates of the Depositary or agents of either of them:
Depositary’s fee – 18
Interest payable 1 1
Safe custody fee – 26
1 45
Other expenses:
Audit fee** – 9
Closure costs 30 –
Printing and postage expenses – 1
Statement fee – 4
30 14
Total expenses 1,228 1,803
* From 4 June 2018 the Fund changed to a single fixed charge known as the Fund Management Fee (FMF). The FMF covers fees and expenses in relation to the operation and administration of the Company and the Fund.** The audit fee was £8,733 (2018: £8,562) net of VAT. With effect from 4 June 2018, the audit fee was no longer accrued for separately and now forms part of the FMF.

avivainvestors.com | Aviva Investors Manager of Manager ICVC (ICVC2) Annual Report and Financial Statements for the year ended 31 July 2019
Aviva Investors Euro Equity MoM 1 Fund
67
5 Taxationa Analysis of tax charge
Year ended31.07.19
£000
Year ended31.07.18
£000
Adjustments in respect of prior period – (13)
Overseas tax suffered 145 572
Total current tax for the year (see note 5b) 145 559
b Factors affecting current tax charge
The tax assessed for the year is lower (2018: higher) than the standard rate of corporation tax in the UK for an Authorised Investment Fund (20%) (2018: 20%).
The differences are explained below:
Year ended31.07.19
£000
Year ended31.07.18
£000
Net revenue before taxation 1,190 2,784
Corporation tax at 20% 238 557
Effects of:
Adjustments in respect of prior period – (13)
Movement in excess management expenses 226 343
Overseas dividends not subject to corporation tax (454) (897)
Overseas tax suffered 145 572
Tax relief for overseas tax suffered (3) (3)
UK dividends not subject to corporation tax (7) –
(93) 2
Current tax charge (see note 5a) 145 559
Authorised Investment Funds are exempt from tax on capital gains. Therefore, any capital return is not included in the above reconciliation.
c Deferred taxThere was no provision for deferred tax at the year end (2018: £nil).
After claiming relief against accrued income taxable on receipt, the Fund has unrelieved excess expenses of £9,873,502 (2018: £8,741,993) creating a potential deferred tax asset of £1,974,700 (2018: £1,748,399). It is unlikely that the Fund will generate taxable profits in the future to utilise these amounts and therefore no deferred tax asset has been recognised in the current or prior year.
NOTES TO THE FINANCIAL STATEMENTS (CONTINUED)
Aviva Investors Manager of Manager ICVC (ICVC2) Annual Report and Financial Statements for the year ended 31 July 2019 | avivainvestors.com
Aviva Investors Euro Equity MoM 1 Fund
68
6 Distributions
Year ended31.07.19
£000
Year ended31.07.18
£000
The distributions take account of revenue received on the issue of shares and revenue deducted on the cancellation of shares, and comprise:
Interim distribution – –
Final distribution 414 2,196
414 2,196
Add: Revenue deducted on cancellation of shares 415 30
Deduct: Revenue received on issue of shares – (1)
Total distributions 829 2,225
Reconciliation of distributions for the year to net revenue after taxation
Distributions for the year 829 2,225
Movement in revenue account 216 –
Net revenue after taxation 1,045 2,225
Details of the distributions per share are set out in the distribution tables on page 72.
7 Fair value hierarchy
As at31.07.19
As at31.07.18
Basis of valuationAssets
£000Assets
£000
Level 1: Quoted prices – 164,718
Total value – 164,718
The purpose of the fair value hierarchy is to prioritise the inputs that should be used to measure the fair value of assets and liabilities.
The highest priority is given to quoted prices at which a transaction can be entered into and the lowest priority to unobservable inputs. Disclosure is required of the value in each category in order to give an insight into the extent to which fair value measurements are subjective.
The disclosure is split into the following categories:
Level 1: Unadjusted quoted price in an active market for an identical instrument;
Level 2: Valuation techniques using observable inputs other than quoted prices within level 1;
Level 3: Valuation techniques using unobservable inputs.
8 Debtors
As at31.07.19
£000
As at31.07.18
£000
Overseas tax recoverable 270 300
Sales awaiting settlement – 1,342
Total debtors 270 1,642
9 Cash and bank balances
As at31.07.19
£000
As at31.07.18
£000
Cash and bank balances 7 3,474
Total cash and bank balances 7 3,474
NOTES TO THE FINANCIAL STATEMENTS (CONTINUED)

avivainvestors.com | Aviva Investors Manager of Manager ICVC (ICVC2) Annual Report and Financial Statements for the year ended 31 July 2019
Aviva Investors Euro Equity MoM 1 Fund
69
10 Other creditors
As at31.07.19
£000
As at31.07.18
£000
Accrued expenses 30 148
Amounts payable to ACD 247 –
Total other creditors 277 148
11 Contingent liabilities and commitmentsThere were no contingent liabilities or commitments at the year end (2018: £nil).
12 Related party transactionsAviva Investors UK Fund Services Limited, Aviva Investors Global Services Limited and the Aviva group are deemed to be related parties per section 33.10 of FRS 102 as they are entities with control, joint control or significant influence over the entity.
Fund Management Fee/ACD periodic charges paid to Aviva Investors UK Fund Services Limited (“the ACD”) are shown in note 4 and details of shares issued and cancelled by the ACD are shown in the statement of change in net assets attributable to shareholders. The balance due to the ACD at the year end in respect of Fund Management Fee/ACD periodic charges was £nil (2018: £148,109). Any balance due from the ACD in respect of issues is shown in note 8. Any balance due to the ACD in respect of cancellations is shown in note 10.
Distributions payable to the ACD and related parties of the ACD during the year amounted to £414,447 (2018: £2,196,497). The amount outstanding at the year end was £nil (2018: £2,196,497). Related parties of the ACD are deemed to be all companies under the control of Aviva Plc. This will include companies which hold shares in the Fund on behalf of other external investors.
The Fund closed during the year and sold all investments therefore at the year end there were no holdings in any investments managed and advised by Aviva Investors Global Services Limited or associated with the Aviva Group.
Holdings at the year end and movements during the year are as follows:
Holdings at31.07.19(shares)
Movement(shares)
Holdings at31.07.18(shares)
ACD and related parties – (69,157,059) 69,157,059
The ACD and related parties of the ACD are ineligible to vote at any general meeting.
13 Shareholder fundsThe Fund currently has one share class: Class 2 (Institutional). The Fund Management Fee is as follows:
Class 2: 1.07%
The net asset value of the share class, the net asset value per share and the number of shares in the class are shown on page 63. The distributions per share class are given in the distribution tables on page 72.
14 Shares in issue reconciliationNumber of shares
in issue at31.07.18
Number ofshares issued
Number ofshares cancelled
Number ofshares converted
Number of shares in issue at
31.07.19
Share Class 2 Income 69,157,059 – (69,157,059) – –
NOTES TO THE FINANCIAL STATEMENTS (CONTINUED)
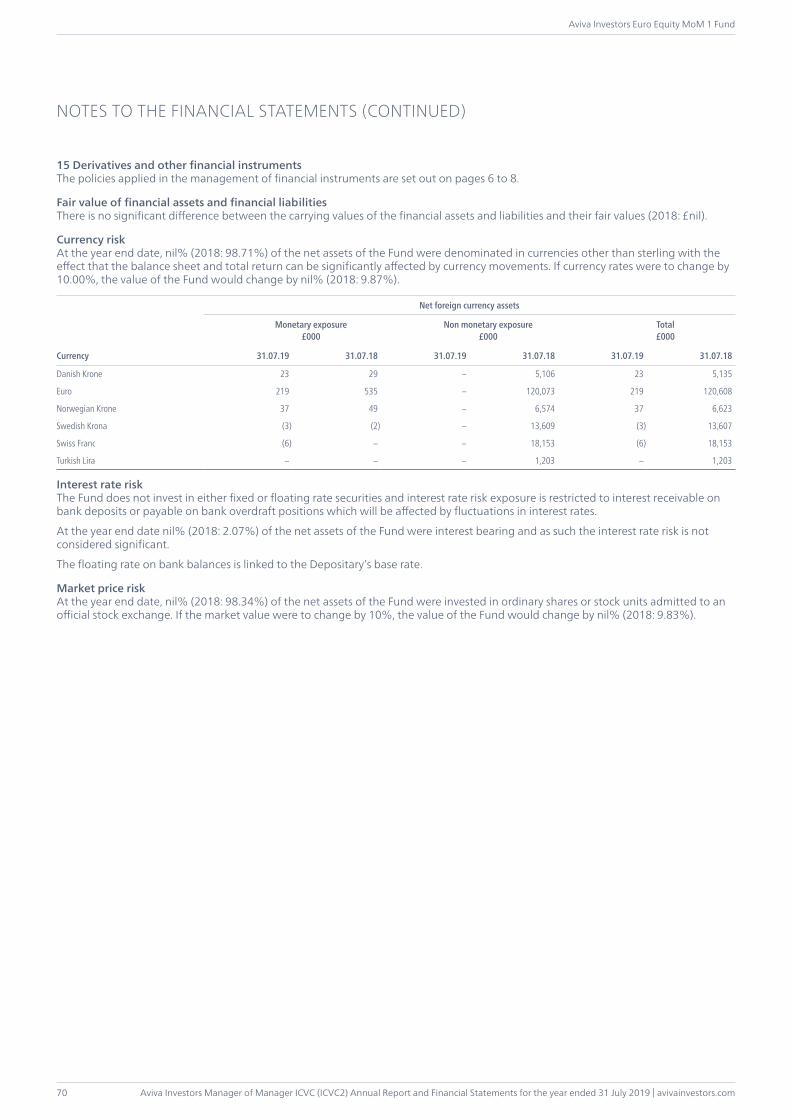
Aviva Investors Manager of Manager ICVC (ICVC2) Annual Report and Financial Statements for the year ended 31 July 2019 | avivainvestors.com
Aviva Investors Euro Equity MoM 1 Fund
70
15 Derivatives and other financial instrumentsThe policies applied in the management of financial instruments are set out on pages 6 to 8.
Fair value of financial assets and financial liabilitiesThere is no significant difference between the carrying values of the financial assets and liabilities and their fair values (2018: £nil).
Currency riskAt the year end date, nil% (2018: 98.71%) of the net assets of the Fund were denominated in currencies other than sterling with the effect that the balance sheet and total return can be significantly affected by currency movements. If currency rates were to change by 10.00%, the value of the Fund would change by nil% (2018: 9.87%).
Currency
Net foreign currency assets
Monetary exposure£000
Non monetary exposure£000
Total£000
31.07.19 31.07.18 31.07.19 31.07.18 31.07.19 31.07.18
Danish Krone 23 29 – 5,106 23 5,135
Euro 219 535 – 120,073 219 120,608
Norwegian Krone 37 49 – 6,574 37 6,623
Swedish Krona (3) (2) – 13,609 (3) 13,607
Swiss Franc (6) – – 18,153 (6) 18,153
Turkish Lira – – – 1,203 – 1,203
Interest rate riskThe Fund does not invest in either fixed or floating rate securities and interest rate risk exposure is restricted to interest receivable on bank deposits or payable on bank overdraft positions which will be affected by fluctuations in interest rates.
At the year end date nil% (2018: 2.07%) of the net assets of the Fund were interest bearing and as such the interest rate risk is not considered significant.
The floating rate on bank balances is linked to the Depositary’s base rate.
Market price riskAt the year end date, nil% (2018: 98.34%) of the net assets of the Fund were invested in ordinary shares or stock units admitted to an official stock exchange. If the market value were to change by 10%, the value of the Fund would change by nil% (2018: 9.83%).
NOTES TO THE FINANCIAL STATEMENTS (CONTINUED)
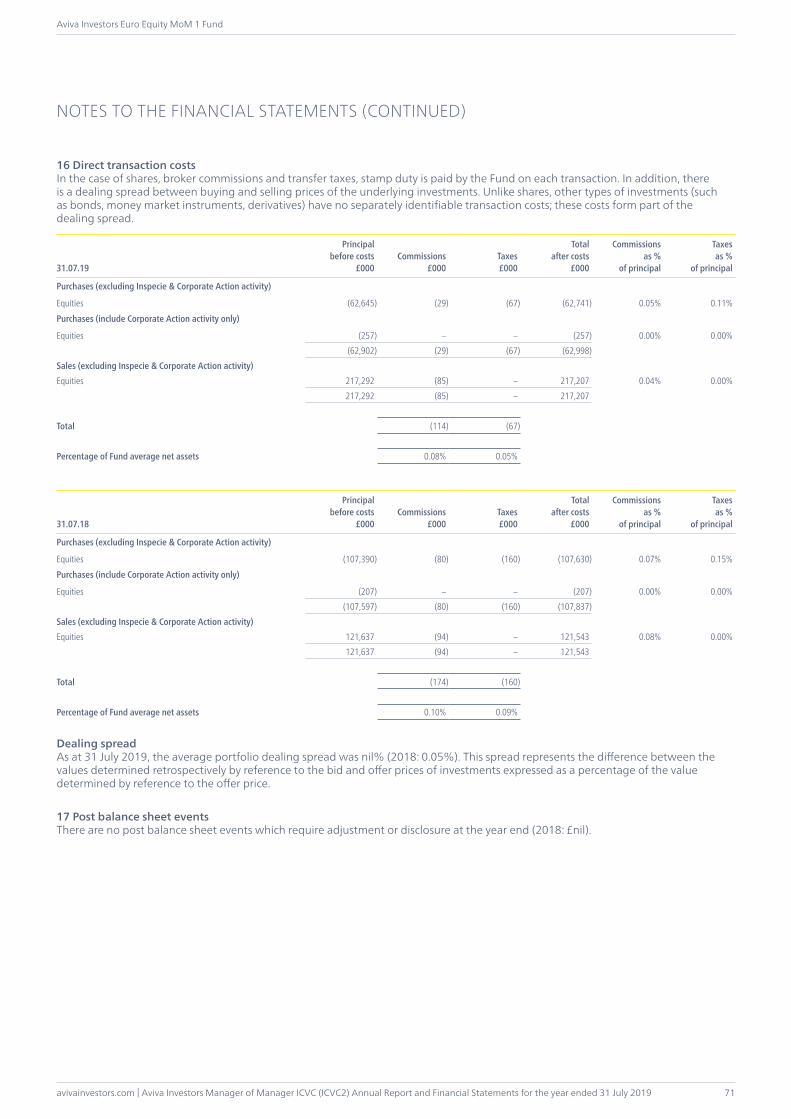
avivainvestors.com | Aviva Investors Manager of Manager ICVC (ICVC2) Annual Report and Financial Statements for the year ended 31 July 2019
Aviva Investors Euro Equity MoM 1 Fund
71
16 Direct transaction costs In the case of shares, broker commissions and transfer taxes, stamp duty is paid by the Fund on each transaction. In addition, there is a dealing spread between buying and selling prices of the underlying investments. Unlike shares, other types of investments (such as bonds, money market instruments, derivatives) have no separately identifiable transaction costs; these costs form part of the dealing spread.
31.07.19
Principalbefore costs
£000Commissions
£000Taxes£000
Totalafter costs
£000
Commissions as %
of principal
Taxes as %
of principal
Purchases (excluding Inspecie & Corporate Action activity)
Equities (62,645) (29) (67) (62,741) 0.05% 0.11%
Purchases (include Corporate Action activity only)
Equities (257) – – (257) 0.00% 0.00%(62,902) (29) (67) (62,998)
Sales (excluding Inspecie & Corporate Action activity)Equities 217,292 (85) – 217,207 0.04% 0.00%
217,292 (85) – 217,207
Total (114) (67)
Percentage of Fund average net assets 0.08% 0.05%
31.07.18
Principalbefore costs
£000Commissions
£000Taxes£000
Totalafter costs
£000
Commissions as %
of principal
Taxes as %
of principal
Purchases (excluding Inspecie & Corporate Action activity)
Equities (107,390) (80) (160) (107,630) 0.07% 0.15%
Purchases (include Corporate Action activity only)
Equities (207) – – (207) 0.00% 0.00%(107,597) (80) (160) (107,837)
Sales (excluding Inspecie & Corporate Action activity)Equities 121,637 (94) – 121,543 0.08% 0.00%
121,637 (94) – 121,543
Total (174) (160)
Percentage of Fund average net assets 0.10% 0.09%
Dealing spreadAs at 31 July 2019, the average portfolio dealing spread was nil% (2018: 0.05%). This spread represents the difference between the values determined retrospectively by reference to the bid and offer prices of investments expressed as a percentage of the value determined by reference to the offer price.
17 Post balance sheet eventsThere are no post balance sheet events which require adjustment or disclosure at the year end (2018: £nil).
NOTES TO THE FINANCIAL STATEMENTS (CONTINUED)

Aviva Investors Manager of Manager ICVC (ICVC2) Annual Report and Financial Statements for the year ended 31 July 2019 | avivainvestors.com
Aviva Investors Euro Equity MoM 1 Fund
72
DISTRIBUTION TABLES
Final distribution paid in pence per share for the three months ended 30 April 2019
Income sharesNet
revenue Equalisation
Final distributionpaid
28 June 2019
Final distributionpaid
30 September 2018
Share Class 2 Group 1 0.6768 – 0.6768 3.1761
Group 2 0.6768 0.0000 0.6768 3.1761
Group 1 shares are those shares purchased at or before 2pm on 31 January 2019.Group 2 shares are those shares purchased after 2pm on 31 January 2019.
Interim distribution paid in pence per share for the six months ended 31 January 2019
Income sharesNet
revenue Equalisation
Interim distributionpaid
31 March 2019
Interim distributionpaid
31 March 2018
Share Class 2 Group 1 0.0000 – 0.0000 0.0000
Group 2 0.0000 0.0000 0.0000 0.0000
Group 1 shares are those shares purchased at or before 2pm on 31 July 2018.Group 2 shares are those shares purchased after 2pm on 31 July 2018.
EqualisationEqualisation applies only to Group 2 shares, in other words shares purchased during the relevant period. It is the average amount of revenue included in the purchase price of all Group 2 shares and is refunded to the holders of these shares as return of capital. Being capital, it is not liable to income tax but must be deducted from the cost of shares for capital gains tax purposes.
avivainvestors.com | Aviva Investors Manager of Manager ICVC (ICVC2) Annual Report and Financial Statements for the year ended 31 July 2019
Aviva Investors Euro Equity MoM 2 Fund
73
The Fund closed on 18 May 2019, and will be terminated in due course.
INVESTMENT OBJECTIVELong term capital growth by investing primarily in European equities (excluding UK).
INVESTMENT POLICYThe Fund invested primarily in equity securities listed or traded on Regulated markets in Europe (excluding UK). Limited exposure to other geographic regions may be possible. The Fund might have invested in any of the following financial instruments in order to achieve its investment objective: equities or securities with equity characteristics, unlisted transferable securities, convertibles, preference shares, warrants, money market instruments, collective investment schemes and deposits.
FUND MANAGER’S REPORTPerformanceOver the period 1 August 2018 to 18 May 2019, the Fund returned (9.8)% (net of fees). The Funds benchmark, the MSCI Europe ex-UK Index, returned (4.0)% over the same period.
ReviewThe most prominent market move during the review period occurred in the fourth quarter of 2018: the biggest quarterly sell-off in European stocks (in sterling terms) since the third quarter of 2011.
One of the reasons behind this was the gradual removal of the very loose monetary policy provided by global central banks. The European Central Bank (ECB) confirmed the conclusion to its quantitative easing programme, while the Federal Reserve had begun shrinking its sizeable balance sheet, as well as raising interest rates.
Equity markets then staged a rally in the first four months of 2019. Two main factors defined the rebound in European markets: US-China trade negotiations and central bank actions. Starting with the former, the two superpowers agreed in December to a truce against further tariffs and talks continued in 2019. The trade war escalation had weighed on sentiment in 2018, so markets were boosted by the indication that there could be a benign resolution.
Central banks, meanwhile, turned increasingly dovish. The Fed stated it would be ‘patient’ with further adjustments to monetary policy as a result of building global economic and financial pressures and muted inflation. The bank’s policy setting committee later scaled back its estimates for future interest rates, to imply zero rate increases in 2019, compared to two forecast rises back in December. It also confirmed it would pause quantitative tightening by the end of September.
The ECB made a small adjustment to its forward guidance. It had previously stated that interest rates would remain at present levels until summer 2019, but in March the Governing Council guided that rates will be on hold until the end of 2019 as inflation remained sluggish in the euro area.
The portfolio’s underperformance of the index mainly accrued in the fourth quartile of 2018. In comparison to the MSCI Europe ex-UK, the portfolio’s sector positions were unfavourable in a strongly risk off environment. However the size bias of the portfolio – given our equally weighted approach to portfolio construction – was a much more significant determinant of relative returns: the MSCI Europe ex-UK Large Cap Index returned (9.9%) in sterling terms during Q4 2018, the MSCI Europe ex-UK Mid Cap Index returned (15.2%) and the MSCI Europe ex-UK Small Cap (16.0%).
By definition an equally weighted portfolio will always have a significant bias to medium and small size companies when compared to a capitalisation weighted index and this feature explains most of the return shortfall. But, stock selection was also a negative contributor to performance. Reviewing the efficacy of our secondary scores it is clear that they were unhelpful during a short period of underperformance – a characteristic of their return profile that we expect to see from time to time.
The portfolio’s strongest contributors included Peab, SimCorp and ASML Holding.
Construction and civil engineering group Peab’s share price rose on the back of a string of strong results. Its February-released fourth quarter results came in ahead of consensus estimates, with pretax profit of Skr839m beating the market forecast of Skr760m resulting in an improved dividend of Skr4.20 compared to Skr4.00 last year.
Although shares in SimCorp were hit hard amid trade war tensions, they recovered strongly from their November lows. Initially, this rally was helped by the announcement that an Asian investment company signed a “very large” eight-year subscription licence agreement. SimCorp stated that a small revenue uplift would be realised in 2018, but the majority will flow through in the second quarter of 2019. The company went on to report 2018 Q4 sales growth of 13% to €129m, while order intake of €61m represented a 23% year-on-year rise. For 2019, it expected revenue growth of between 8% and 13%. The company also announced a new deal to provide systems for Willis Towers Watson’s delegated investments business.
Dutch chipmaker ASML Holding was in the portfolio for only a short time, having been purchased in March 2019. Its first quarter results in April caught the eye, with sales and gross margins coming in ahead of guidance. Management said this was a result of better-than-expected EUV lithography system shipments and DUV lithography systems profitability. ASML maintained its 2019 outlook.
The biggest detractors from performance included Covestro, Siltronic and Ence Energia y Celulosa.
AVIVA INVESTORS EURO EQUITY MOM 2 FUND

Aviva Investors Manager of Manager ICVC (ICVC2) Annual Report and Financial Statements for the year ended 31 July 2019 | avivainvestors.com
Aviva Investors Euro Equity MoM 2 Fund
74
FUND MANAGER’S REPORT (CONTINUED)Premium polymer supplier Covestro described mounting challenges within its 2018 report. Although volumes rose 1.6% and sales increased by 3.4% to €14.6bn, earnings fell by 6.8% to €3.2bn. The company cited increasing competitive pressures as well as one-off factors such as increased logistics costs due to the low level of the river Rhine. Trends worsened in the first quarter of 2019: volumes decreased 1.8% and selling prices suffered a marked drop, taking sales down by 16%. Covestro now expects for 2019 as a whole to be in the low to mid-single-digit percentage range and EBITDA to roughly halve on 2018’s level.
Silicon wafer supplier Siltronic felt the strain from the US-China trade dispute. The company generated 69% of its revenue from Asia in 2018 and would be exposed to tariffs on Chinese exports to the US. It reported a 24% increase in sales to €1.46bn and a more than doubling in pre-tax profit to €498m. However, the company experienced a slow start to 2019. Wafer sales in the first half of the new year were expected to be lower than the second half of 2018, as were earnings.
Biomass power producer Ence Energia Y Cellulosa’s share price declined in March after the Spanish General State Administration moved to nullify a 2016 resolution which granted Ence an extension of the concession of lands for the company’s Pontevedra plant. Ence estimated that the maximum impact of halting activities at this plant would be €185m, though it doesn’t expect this outcome to occur.
September 2019* Fund performance figures – share class 2, source Lipper, net of fees, net income reinvested in GBP. Unless otherwise indicated, all data has been sourced by Liontrust Investment Partners LLP.As noted above, the performance figures in this commentary have been sourced from an external party and are based on published prices. The performance figures quoted in the comparative table on page 75 are based on the net asset value per the published accounts and may be different due to post year end accounting adjustments. Any opinions expressed are those of the Fund manager. They should not be viewed as a guarantee of a return from an investment in the Funds. The content of the commentary should not be viewed as a recommendation to invest nor to buy or sell stocks. Past performance is not a guide to future performance. The value of an investment in the Fund and any income from it may go down as well as up, and the investor may not get back the original amount invested.
Material Portfolio ChangesPurchases Sales
Royal Unibrew SimCorp
Coloplast Amadeus IT Group ‘A’
Novo Nordisk Technogym
ASML Holding Moncler
Neste Peugeot
Kering Partners Group Holding
Recordati Roche Holding
Telenor EDP – Energias de Portugal
adidas Mediobanca Banca di Credito Finanziario
AP Moller – Maersk Swedish Match
Synthetic Risk and Reward Indicator Investment risks have been removed as the Fund closed on 18 May 2019.
AVIVA INVESTORS EURO EQUITY MOM 2 FUND (CONTINUED)
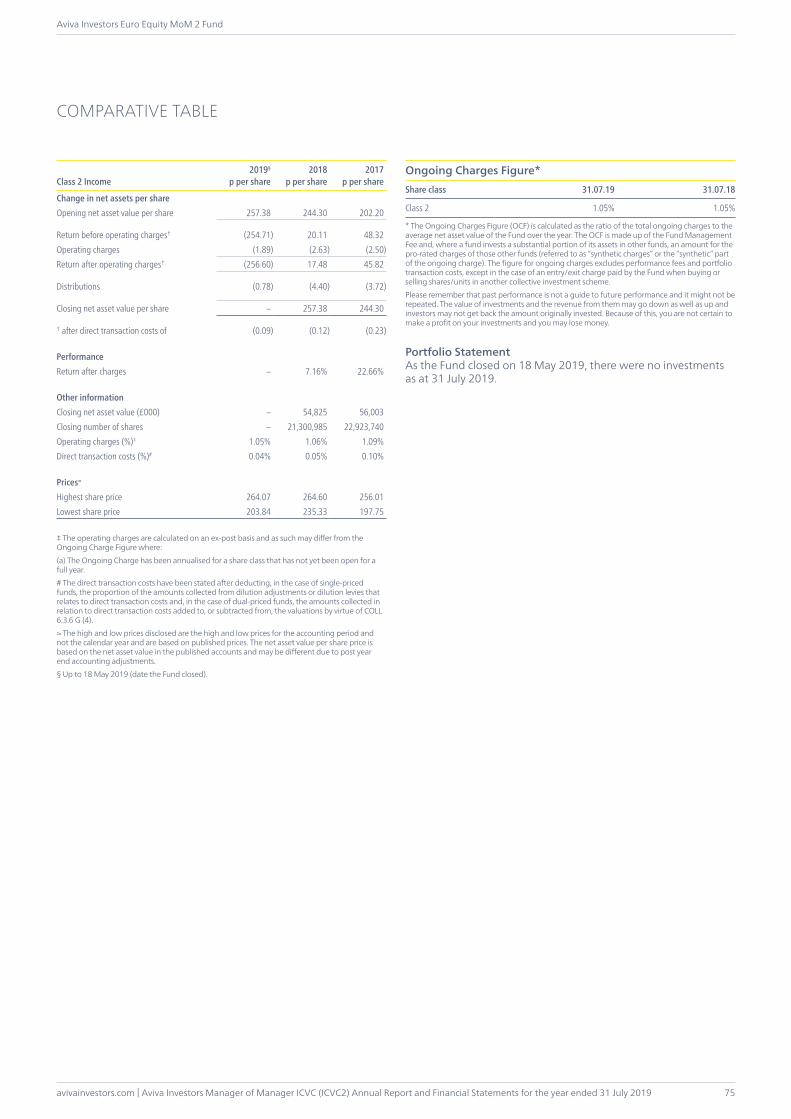
avivainvestors.com | Aviva Investors Manager of Manager ICVC (ICVC2) Annual Report and Financial Statements for the year ended 31 July 2019
Aviva Investors Euro Equity MoM 2 Fund
75
COMPARATIVE TABLE
Class 2 Income2019§
p per share2018
p per share2017
p per share
Change in net assets per shareOpening net asset value per share 257.38 244.30 202.20
Return before operating charges† (254.71) 20.11 48.32Operating charges (1.89) (2.63) (2.50)Return after operating charges† (256.60) 17.48 45.82
Distributions (0.78) (4.40) (3.72)
Closing net asset value per share – 257.38 244.30
† after direct transaction costs of (0.09) (0.12) (0.23)
PerformanceReturn after charges – 7.16% 22.66%
Other informationClosing net asset value (£000) – 54,825 56,003Closing number of shares – 21,300,985 22,923,740Operating charges (%)‡ 1.05% 1.06% 1.09%Direct transaction costs (%)# 0.04% 0.05% 0.10%
Prices≈
Highest share price 264.07 264.60 256.01Lowest share price 203.84 235.33 197.75
‡ The operating charges are calculated on an ex-post basis and as such may differ from the Ongoing Charge Figure where:(a) The Ongoing Charge has been annualised for a share class that has not yet been open for a full year.# The direct transaction costs have been stated after deducting, in the case of single-priced funds, the proportion of the amounts collected from dilution adjustments or dilution levies that relates to direct transaction costs and, in the case of dual-priced funds, the amounts collected in relation to direct transaction costs added to, or subtracted from, the valuations by virtue of COLL 6.3.6 G (4).≈ The high and low prices disclosed are the high and low prices for the accounting period and not the calendar year and are based on published prices. The net asset value per share price is based on the net asset value in the published accounts and may be different due to post year end accounting adjustments.§ Up to 18 May 2019 (date the Fund closed).
Ongoing Charges Figure*Share class 31.07.19 31.07.18
Class 2 1.05% 1.05%
* The Ongoing Charges Figure (OCF) is calculated as the ratio of the total ongoing charges to the average net asset value of the Fund over the year. The OCF is made up of the Fund Management Fee and, where a fund invests a substantial portion of its assets in other funds, an amount for the pro-rated charges of those other funds (referred to as “synthetic charges” or the “synthetic” part of the ongoing charge). The figure for ongoing charges excludes performance fees and portfolio transaction costs, except in the case of an entry/exit charge paid by the Fund when buying or selling shares/units in another collective investment scheme. Please remember that past performance is not a guide to future performance and it might not be repeated. The value of investments and the revenue from them may go down as well as up and investors may not get back the amount originally invested. Because of this, you are not certain to make a profit on your investments and you may lose money.
Portfolio StatementAs the Fund closed on 18 May 2019, there were no investments as at 31 July 2019.
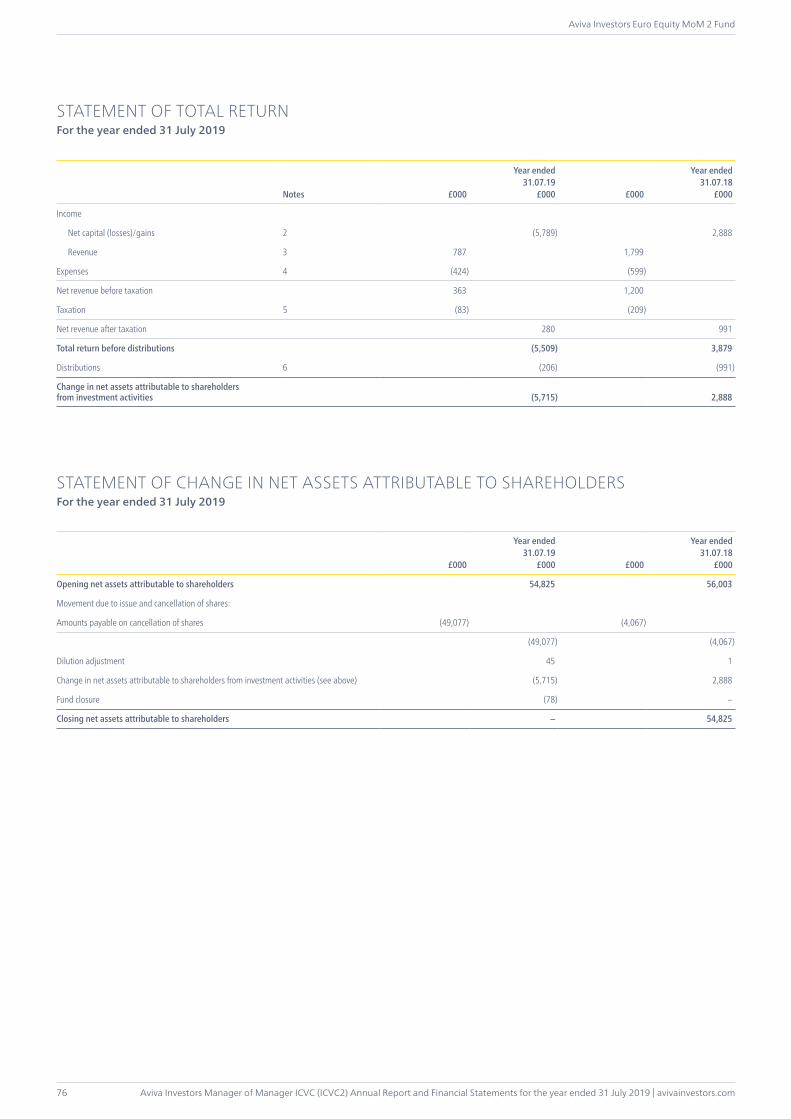
Aviva Investors Manager of Manager ICVC (ICVC2) Annual Report and Financial Statements for the year ended 31 July 2019 | avivainvestors.com
Aviva Investors Euro Equity MoM 2 Fund
76
STATEMENT OF TOTAL RETURNFor the year ended 31 July 2019
Notes £000
Year ended31.07.19
£000 £000
Year ended31.07.18
£000
Income
Net capital (losses)/gains 2 (5,789) 2,888
Revenue 3 787 1,799
Expenses 4 (424) (599)
Net revenue before taxation 363 1,200
Taxation 5 (83) (209)
Net revenue after taxation 280 991
Total return before distributions (5,509) 3,879
Distributions 6 (206) (991)
Change in net assets attributable to shareholders from investment activities (5,715) 2,888
STATEMENT OF CHANGE IN NET ASSETS ATTRIBUTABLE TO SHAREHOLDERSFor the year ended 31 July 2019
£000
Year ended31.07.19
£000 £000
Year ended31.07.18
£000
Opening net assets attributable to shareholders 54,825 56,003
Movement due to issue and cancellation of shares:
Amounts payable on cancellation of shares (49,077) (4,067)
(49,077) (4,067)
Dilution adjustment 45 1
Change in net assets attributable to shareholders from investment activities (see above) (5,715) 2,888
Fund closure (78) –
Closing net assets attributable to shareholders – 54,825

avivainvestors.com | Aviva Investors Manager of Manager ICVC (ICVC2) Annual Report and Financial Statements for the year ended 31 July 2019
Aviva Investors Euro Equity MoM 2 Fund
77
BALANCE SHEETAs at 31 July 2019
Notes
As at31.07.19
£000
As at31.07.18
£000
Assets:
Investments – 54,249
Current assets:
Debtors 8 108 145
Cash and bank balances 9 – 1,413
Total assets 108 55,807
Liabilities:
Creditors:
Distribution payable – (938)
Other creditors 10 (108) (44)
Total liabilities (108) (982)
Net assets attributable to shareholders – 54,825

Aviva Investors Manager of Manager ICVC (ICVC2) Annual Report and Financial Statements for the year ended 31 July 2019 | avivainvestors.com
Aviva Investors Euro Equity MoM 2 Fund
78
1 Accounting basis and policiesPlease see pages 6 to 8 for accounting basis and policies.
2 Net capital (losses)/gains
Year ended31.07.19
£000
Year ended31.07.18
£000
Net capital (losses)/gains on investment during the year comprise:
Compensation items 2 –
Currency losses (132) (22)
Expenses relating to the purchase and sale of investments – (5)
Non-derivative securities (losses)/gains (5,659) 2,915
Net capital (losses)/gains (5,789) 2,888
3 Revenue
Year ended31.07.19
£000
Year ended31.07.18
£000
Bank and deposit interest 6 13
Overseas dividends 781 1,786
Total revenue 787 1,799
4 Expenses
Year ended31.07.19
£000
Year ended31.07.18
£000
Payable to the Authorised Corporate Director (“ACD”), associates of the ACD or agents of either of them:
Fund Management Fee/ACD periodic charges* 393 566
393 566
Payable to the Depositary, associates of the Depositary or agents of either of them:
Depositary’s fee – 7
Interest payable 1 8
Safe custody fee – 6
1 21
Other expenses:
Audit fee** – 9
Closure costs 30 –
Printing & postage expenses – 1
Statement fees – 2
30 12
Total expenses 424 599
* From 4 June 2018 the Fund changed to a single fixed charge known as the Fund Management Fee (FMF). The FMF covers fees and expenses in relation to the operation and administration of the Company and the Fund.** The audit fee was £8,733 (2018: £8,562) net of VAT. With effect from 4 June 2018, the audit fee was no longer accrued for separately and now forms part of the FMF.
NOTES TO THE FINANCIAL STATEMENTS
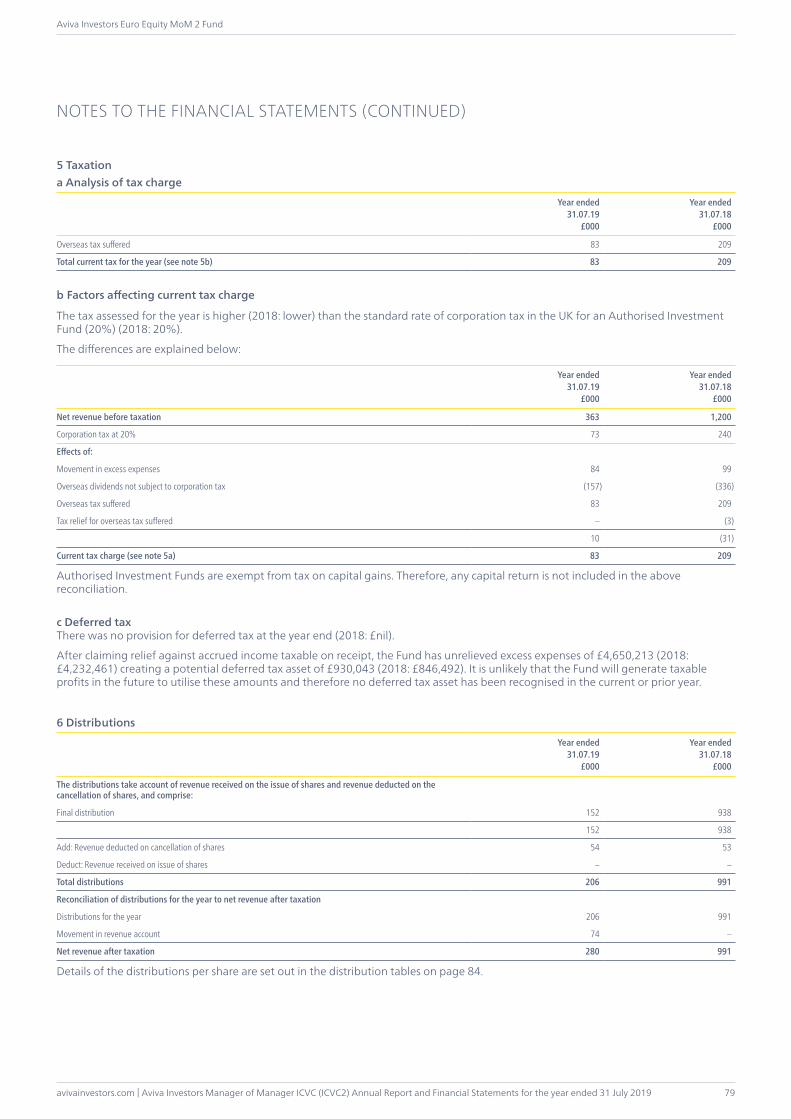
avivainvestors.com | Aviva Investors Manager of Manager ICVC (ICVC2) Annual Report and Financial Statements for the year ended 31 July 2019
Aviva Investors Euro Equity MoM 2 Fund
79
5 Taxationa Analysis of tax charge
Year ended31.07.19
£000
Year ended31.07.18
£000
Overseas tax suffered 83 209
Total current tax for the year (see note 5b) 83 209
b Factors affecting current tax charge
The tax assessed for the year is higher (2018: lower) than the standard rate of corporation tax in the UK for an Authorised Investment Fund (20%) (2018: 20%).
The differences are explained below:
Year ended31.07.19
£000
Year ended31.07.18
£000
Net revenue before taxation 363 1,200
Corporation tax at 20% 73 240
Effects of:
Movement in excess expenses 84 99
Overseas dividends not subject to corporation tax (157) (336)
Overseas tax suffered 83 209
Tax relief for overseas tax suffered – (3)
10 (31)
Current tax charge (see note 5a) 83 209
Authorised Investment Funds are exempt from tax on capital gains. Therefore, any capital return is not included in the above reconciliation.
c Deferred taxThere was no provision for deferred tax at the year end (2018: £nil).
After claiming relief against accrued income taxable on receipt, the Fund has unrelieved excess expenses of £4,650,213 (2018: £4,232,461) creating a potential deferred tax asset of £930,043 (2018: £846,492). It is unlikely that the Fund will generate taxable profits in the future to utilise these amounts and therefore no deferred tax asset has been recognised in the current or prior year.
6 Distributions
Year ended31.07.19
£000
Year ended31.07.18
£000
The distributions take account of revenue received on the issue of shares and revenue deducted on the cancellation of shares, and comprise:
Final distribution 152 938
152 938
Add: Revenue deducted on cancellation of shares 54 53
Deduct: Revenue received on issue of shares – –
Total distributions 206 991
Reconciliation of distributions for the year to net revenue after taxation
Distributions for the year 206 991
Movement in revenue account 74 –
Net revenue after taxation 280 991
Details of the distributions per share are set out in the distribution tables on page 84.
NOTES TO THE FINANCIAL STATEMENTS (CONTINUED)

Aviva Investors Manager of Manager ICVC (ICVC2) Annual Report and Financial Statements for the year ended 31 July 2019 | avivainvestors.com
Aviva Investors Euro Equity MoM 2 Fund
80
7 Fair value hierarchy
Basis of valuation
As at31.07.19
As at 31.07.18
Assets£000
Assets£000
Level 1: Quoted prices – 54,249
Total value – 54,249
The purpose of the fair value hierarchy is to prioritise the inputs that should be used to measure the fair value of assets and liabilities.
The highest priority is given to quoted prices at which a transaction can be entered into and the lowest priority to unobservable inputs. Disclosure is required of the value in each category in order to give an insight into the extent to which fair value measurements are subjective.
The disclosure is split into the following categories:
Level 1: Unadjusted quoted price in an active market for an identical instrument;
Level 2: Valuation techniques using observable inputs other than quoted prices within level 1;
Level 3: Valuation techniques using unobservable inputs.
8 Debtors
As at31.07.19
£000
As at31.07.18
£000
Overseas tax recoverable 108 145
Total debtors 108 145
9 Cash and bank balances
As at31.07.19
£000
As at31.07.18
£000
Cash and bank balances – 1,413
Total cash and bank balances – 1,413
10 Other creditors
As at31.07.19
£000
As at31.07.18
£000
Accrued expenses 30 44
Amounts payable to ACD 78 –
Total other creditors 108 44
11 Contingent liabilities and commitmentsThere were no contingent liabilities or commitments at the year end (2018: £nil).
NOTES TO THE FINANCIAL STATEMENTS (CONTINUED)

avivainvestors.com | Aviva Investors Manager of Manager ICVC (ICVC2) Annual Report and Financial Statements for the year ended 31 July 2019
Aviva Investors Euro Equity MoM 2 Fund
81
12 Related party transactionsAviva Investors UK Fund Services Limited, Aviva Investors Global Services Limited and the Aviva group are deemed to be related parties per section 33.10 of FRS 102 as they are entities with control, joint control or significant influence over the entity.
Fund Management Fee/ACD periodic charges paid to Aviva Investors UK Fund Services Limited (“the ACD”) are shown in note 4 and details of shares issued and cancelled by the ACD are shown in the statement of change in net assets attributable to shareholders. The balance due to the ACD at the year end in respect of Fund Management Fee/ACD periodic charges was £nil (2018: £44,090). Any balance due from the ACD in respect of issues is shown in note 8. Any balance due to the ACD in respect of cancellations is shown in note 10.
Distributions payable to the ACD and related parties of the ACD during the year amounted to £151,943 (2018: £937,733). The amount outstanding at the year end was £nil (2018: £937,733). Related parties of the ACD are deemed to be all companies under the control of Aviva Plc. This will include companies which hold shares in the Fund on behalf of other external investors.
The Fund closed during the year and sold all investments therefore at the year end there were no holdings in any investments managed and advised by Aviva Investors Global Services Limited or associated with the Aviva Group.
Holdings at the year end and movements during the year are as follows:
Holdings at31.07.19(shares)
Movement(shares)
Holdings at31.07.18(shares)
ACD and related parties – (21,300,985) 21,300,985
The ACD and related parties of the ACD are ineligible to vote at any general meeting.
13 Shareholder fundsThe Fund currently has one share class: Class 2 (Institutional). The Fund Management Fee is as follows:
Class 2: 1.05%
The net asset value of the share class, the net asset value per share and the number of shares in the class are shown on page 75. The distributions per share class are given in the distribution tables on page 84.
14 Shares in issue reconciliationNumber of shares
in issue at31.07.18
Number ofshares issued
Number ofshares cancelled
Number ofshares converted
Number of shares in issue at
31.07.19
Share Class 2 Income 21,300,985 – (21,300,985) – –
NOTES TO THE FINANCIAL STATEMENTS (CONTINUED)

Aviva Investors Manager of Manager ICVC (ICVC2) Annual Report and Financial Statements for the year ended 31 July 2019 | avivainvestors.com
Aviva Investors Euro Equity MoM 2 Fund
82
15 Derivatives and other financial instrumentsThe policies applied in the management of financial instruments are set out on pages 6 to 8.
Fair value of financial assets and financial liabilitiesThere is no significant difference between the carrying values of the financial assets and liabilities and their fair values (2018: £nil).
Currency riskAt the year end date, nil% (2018: 99.22%) of the net assets of the Fund were denominated in currencies other than sterling with the effect that the balance sheet and total return can be significantly affected by currency movements. If currency rates were to change by 10.00%, the value of the Fund would change by nil% (2018: 9.92%).
Currency
Net foreign currency assets
Monetary exposure£000
Non monetary exposure£000
Total£000
31.07.19 31.07.18 31.07.19 31.07.18 31.07.19 31.07.18
Danish Krone 21 30 – 2,092 21 2,122
Euro 83 116 – 35,580 83 35,696
Norwegian Krone 4 4 – 1,384 4 1,388
Swedish Krona – – – 10,000 – 10,000
Swiss Franc – – – 5,193 – 5,193
Interest rate riskThe Fund does not invest in either fixed or floating rate securities and interest rate risk exposure is restricted to interest receivable on bank deposits or payable on bank overdraft positions which will be affected by fluctuations in interest rates.
At the year end date nil% (2018: 2.58%) of the net assets of the Fund were interest bearing and as such the interest rate risk is not considered significant.
The floating rate on bank balances is linked to the Depositary’s base rate.
Market price riskAt the year end date, nil% (2018:98.95%) of the net assets of the Fund were invested in ordinary shares or stock units admitted to an official stock exchange. If the market value were to change by 10%, the value of the Fund would change by nil% (2018: 9.90%).
NOTES TO THE FINANCIAL STATEMENTS (CONTINUED)
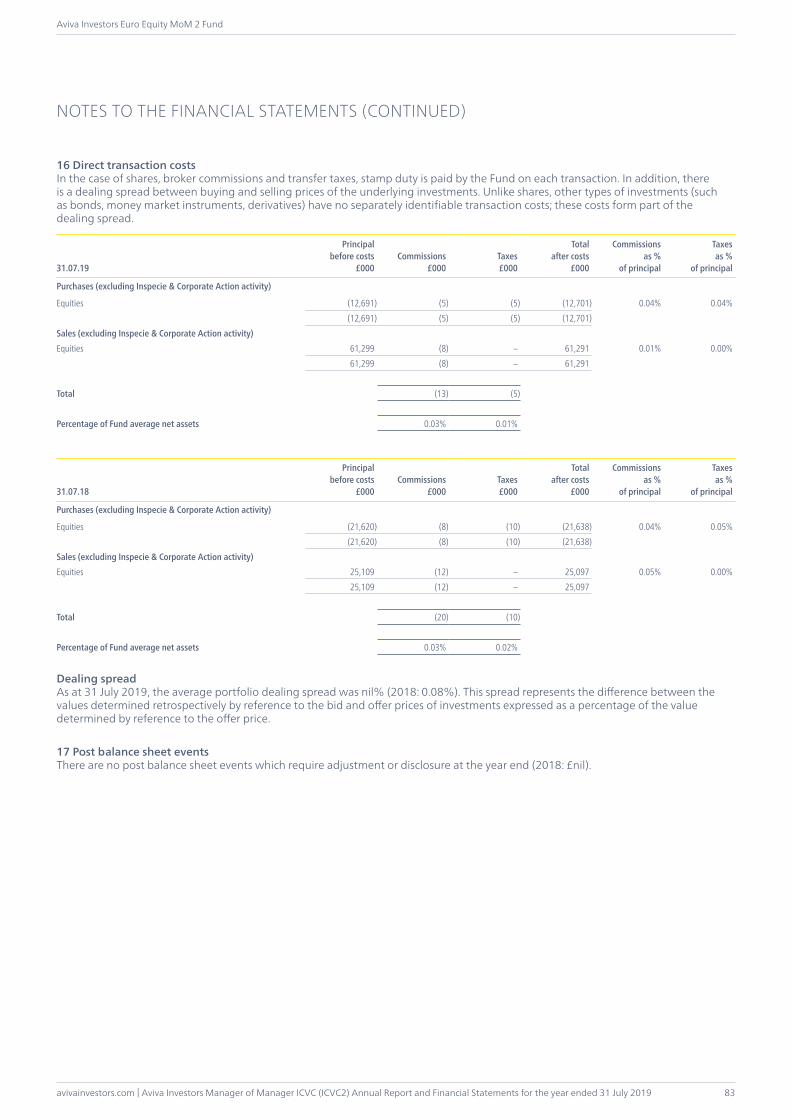
avivainvestors.com | Aviva Investors Manager of Manager ICVC (ICVC2) Annual Report and Financial Statements for the year ended 31 July 2019
Aviva Investors Euro Equity MoM 2 Fund
83
16 Direct transaction costs In the case of shares, broker commissions and transfer taxes, stamp duty is paid by the Fund on each transaction. In addition, there is a dealing spread between buying and selling prices of the underlying investments. Unlike shares, other types of investments (such as bonds, money market instruments, derivatives) have no separately identifiable transaction costs; these costs form part of the dealing spread.
31.07.19
Principalbefore costs
£000Commissions
£000Taxes£000
Totalafter costs
£000
Commissions as %
of principal
Taxes as %
of principal
Purchases (excluding Inspecie & Corporate Action activity)
Equities (12,691) (5) (5) (12,701) 0.04% 0.04%(12,691) (5) (5) (12,701)
Sales (excluding Inspecie & Corporate Action activity)Equities 61,299 (8) – 61,291 0.01% 0.00%
61,299 (8) – 61,291
Total (13) (5)
Percentage of Fund average net assets 0.03% 0.01%
31.07.18
Principalbefore costs
£000Commissions
£000Taxes£000
Totalafter costs
£000
Commissions as %
of principal
Taxes as %
of principal
Purchases (excluding Inspecie & Corporate Action activity)
Equities (21,620) (8) (10) (21,638) 0.04% 0.05%(21,620) (8) (10) (21,638)
Sales (excluding Inspecie & Corporate Action activity)Equities 25,109 (12) – 25,097 0.05% 0.00%
25,109 (12) – 25,097
Total (20) (10)
Percentage of Fund average net assets 0.03% 0.02%
Dealing spreadAs at 31 July 2019, the average portfolio dealing spread was nil% (2018: 0.08%). This spread represents the difference between the values determined retrospectively by reference to the bid and offer prices of investments expressed as a percentage of the value determined by reference to the offer price.
17 Post balance sheet eventsThere are no post balance sheet events which require adjustment or disclosure at the year end (2018: £nil).
NOTES TO THE FINANCIAL STATEMENTS (CONTINUED)

Aviva Investors Manager of Manager ICVC (ICVC2) Annual Report and Financial Statements for the year ended 31 July 2019 | avivainvestors.com
Aviva Investors Euro Equity MoM 2 Fund
84
DISTRIBUTION TABLES
Final distribution paid in pence per share for the three months ended 30 April 2019
Income sharesNet
revenue Equalisation
Final distributionpaid
28 June 2019
Final distributionpaid
30 September 2018
Share Class 2 Group 1 0.7831 – 0.7831 4.4023
Group 2 0.7831 0.0000 0.7831 4.4023
Group 1 shares are those shares purchased at or before 2pm on 31 January 2019.Group 2 shares are those shares purchased after 2pm on 31 January 2019.
Interim distribution paid in pence per share for the six months ended 31 January 2019
Income sharesNet
revenue Equalisation
Interim distributionpaid
31 March 2019
Interim distributionpaid
31 March 2018
Share Class 2 Group 1 0.0000 – 0.0000 0.0000
Group 2 0.0000 0.0000 0.0000 0.0000
Group 1 shares are those shares purchased at or before 2pm on 31 July 2018.Group 2 shares are those shares purchased after 2pm on 31 July 2018.
EqualisationEqualisation applies only to Group 2 shares, in other words shares purchased during the relevant period. It is the average amount of revenue included in the purchase price of all Group 2 shares and is refunded to the holders of these shares as return of capital. Being capital, it is not liable to income tax but must be deducted from the cost of shares for capital gains tax purposes.
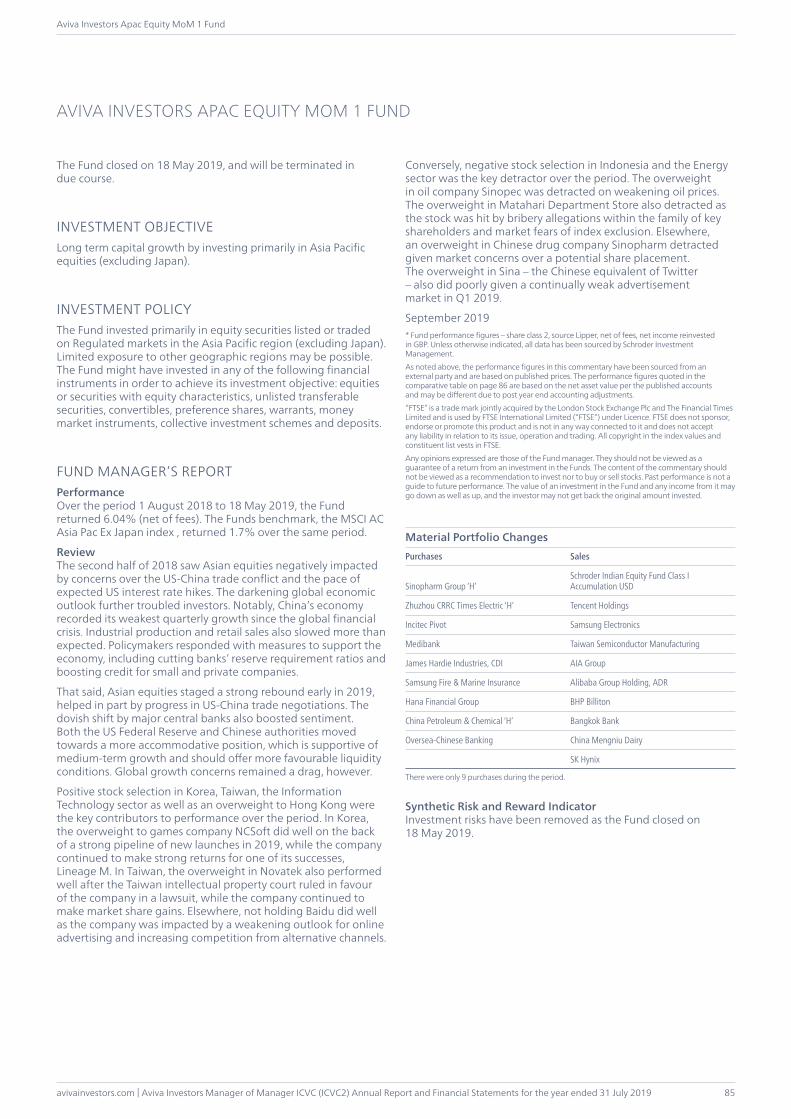
avivainvestors.com | Aviva Investors Manager of Manager ICVC (ICVC2) Annual Report and Financial Statements for the year ended 31 July 2019
Aviva Investors Apac Equity MoM 1 Fund
85
The Fund closed on 18 May 2019, and will be terminated in due course.
INVESTMENT OBJECTIVELong term capital growth by investing primarily in Asia Pacific equities (excluding Japan).
INVESTMENT POLICYThe Fund invested primarily in equity securities listed or traded on Regulated markets in the Asia Pacific region (excluding Japan). Limited exposure to other geographic regions may be possible. The Fund might have invested in any of the following financial instruments in order to achieve its investment objective: equities or securities with equity characteristics, unlisted transferable securities, convertibles, preference shares, warrants, money market instruments, collective investment schemes and deposits.
FUND MANAGER’S REPORTPerformanceOver the period 1 August 2018 to 18 May 2019, the Fund returned 6.04% (net of fees). The Funds benchmark, the MSCI AC Asia Pac Ex Japan index , returned 1.7% over the same period.
ReviewThe second half of 2018 saw Asian equities negatively impacted by concerns over the US-China trade conflict and the pace of expected US interest rate hikes. The darkening global economic outlook further troubled investors. Notably, China’s economy recorded its weakest quarterly growth since the global financial crisis. Industrial production and retail sales also slowed more than expected. Policymakers responded with measures to support the economy, including cutting banks’ reserve requirement ratios and boosting credit for small and private companies.
That said, Asian equities staged a strong rebound early in 2019, helped in part by progress in US-China trade negotiations. The dovish shift by major central banks also boosted sentiment. Both the US Federal Reserve and Chinese authorities moved towards a more accommodative position, which is supportive of medium-term growth and should offer more favourable liquidity conditions. Global growth concerns remained a drag, however.
Positive stock selection in Korea, Taiwan, the Information Technology sector as well as an overweight to Hong Kong were the key contributors to performance over the period. In Korea, the overweight to games company NCSoft did well on the back of a strong pipeline of new launches in 2019, while the company continued to make strong returns for one of its successes, Lineage M. In Taiwan, the overweight in Novatek also performed well after the Taiwan intellectual property court ruled in favour of the company in a lawsuit, while the company continued to make market share gains. Elsewhere, not holding Baidu did well as the company was impacted by a weakening outlook for online advertising and increasing competition from alternative channels.
Conversely, negative stock selection in Indonesia and the Energy sector was the key detractor over the period. The overweight in oil company Sinopec was detracted on weakening oil prices. The overweight in Matahari Department Store also detracted as the stock was hit by bribery allegations within the family of key shareholders and market fears of index exclusion. Elsewhere, an overweight in Chinese drug company Sinopharm detracted given market concerns over a potential share placement. The overweight in Sina – the Chinese equivalent of Twitter – also did poorly given a continually weak advertisement market in Q1 2019.
September 2019* Fund performance figures – share class 2, source Lipper, net of fees, net income reinvested in GBP. Unless otherwise indicated, all data has been sourced by Schroder Investment Management. As noted above, the performance figures in this commentary have been sourced from an external party and are based on published prices. The performance figures quoted in the comparative table on page 86 are based on the net asset value per the published accounts and may be different due to post year end accounting adjustments. “FTSE” is a trade mark jointly acquired by the London Stock Exchange Plc and The Financial Times Limited and is used by FTSE International Limited (“FTSE”) under Licence. FTSE does not sponsor, endorse or promote this product and is not in any way connected to it and does not accept any liability in relation to its issue, operation and trading. All copyright in the index values and constituent list vests in FTSE. Any opinions expressed are those of the Fund manager. They should not be viewed as a guarantee of a return from an investment in the Funds. The content of the commentary should not be viewed as a recommendation to invest nor to buy or sell stocks. Past performance is not a guide to future performance. The value of an investment in the Fund and any income from it may go down as well as up, and the investor may not get back the original amount invested.
Material Portfolio ChangesPurchases Sales
Sinopharm Group ‘H’ Schroder Indian Equity Fund Class I Accumulation USD
Zhuzhou CRRC Times Electric ‘H’ Tencent Holdings
Incitec Pivot Samsung Electronics
Medibank Taiwan Semiconductor Manufacturing
James Hardie Industries, CDI AIA Group
Samsung Fire & Marine Insurance Alibaba Group Holding, ADR
Hana Financial Group BHP Billiton
China Petroleum & Chemical ‘H’ Bangkok Bank
Oversea-Chinese Banking China Mengniu Dairy
SK Hynix
There were only 9 purchases during the period.
Synthetic Risk and Reward IndicatorInvestment risks have been removed as the Fund closed on 18 May 2019.
AVIVA INVESTORS APAC EQUITY MOM 1 FUND

Aviva Investors Manager of Manager ICVC (ICVC2) Annual Report and Financial Statements for the year ended 31 July 2019 | avivainvestors.com
Aviva Investors Apac Equity MoM 1 Fund
86
COMPARATIVE TABLE
Class 2 Income2019§
p per share2018
p per share2017
p per share
Change in net assets per shareOpening net asset value per share 277.79 265.20 214.31
Return before operating charges† (273.82) 19.99 57.89Operating charges (2.75) (3.69) (3.28)Return after operating charges† (276.57) 16.30 54.61
Distributions (1.22) (3.71) (3.72)
Closing net asset value per share – 277.79 265.20
† after direct transaction costs of (0.43) (0.19) (0.17)
PerformanceReturn after charges – 6.15% 25.48%
Other informationClosing net asset value (£000) – 67,003 71,264Closing number of shares – 24,120,133 26,871,824Operating charges (%)‡ 1.36% 1.34% 1.34%Direct transaction costs (%)# 0.16% 0.07% 0.07%
Prices≈
Highest share price 294.73 287.45 271.09Lowest share price 244.65 261.57 211.41
‡ The operating charges are calculated on an ex-post basis and as such may differ from the Ongoing Charge Figure where:(a) The Ongoing Charge has been annualised for a share class that has not yet been open for a full year.# The direct transaction costs have been stated after deducting, in the case of single-priced funds, the proportion of the amounts collected from dilution adjustments or dilution levies that relates to direct transaction costs and, in the case of dual-priced funds, the amounts collected in relation to direct transaction costs added to, or subtracted from, the valuations by virtue of COLL 6.3.6 G (4).≈ The high and low prices disclosed are the high and low prices for the accounting period and not the calendar year and are based on published prices. The net asset value per share price is based on the net asset value in the published accounts and may be different due to post year end accounting adjustments.§ Up to 18 May 2019 (date the Fund closed).
Ongoing Charges Figure*Share class 31.07.19 31.07.18
Class 2 1.36% 1.36%
* The Ongoing Charges Figure (OCF) is calculated as the ratio of the total ongoing charges to the average net asset value of the Fund over the year. The OCF is made up of the Fund Management Fee and, where a fund invests a substantial portion of its assets in other funds, an amount for the pro-rated charges of those other funds (referred to as “synthetic charges” or the “synthetic” part of the ongoing charge). The figure for ongoing charges excludes performance fees and portfolio transaction costs, except in the case of an entry/exit charge paid by the Fund when buying or selling shares/units in another collective investment scheme.Please remember that past performance is not a guide to future performance and it might not be repeated. The value of investments and the revenue from them may go down as well as up and investors may not get back the amount originally invested. Because of this, you are not certain to make a profit on your investments and you may lose money.
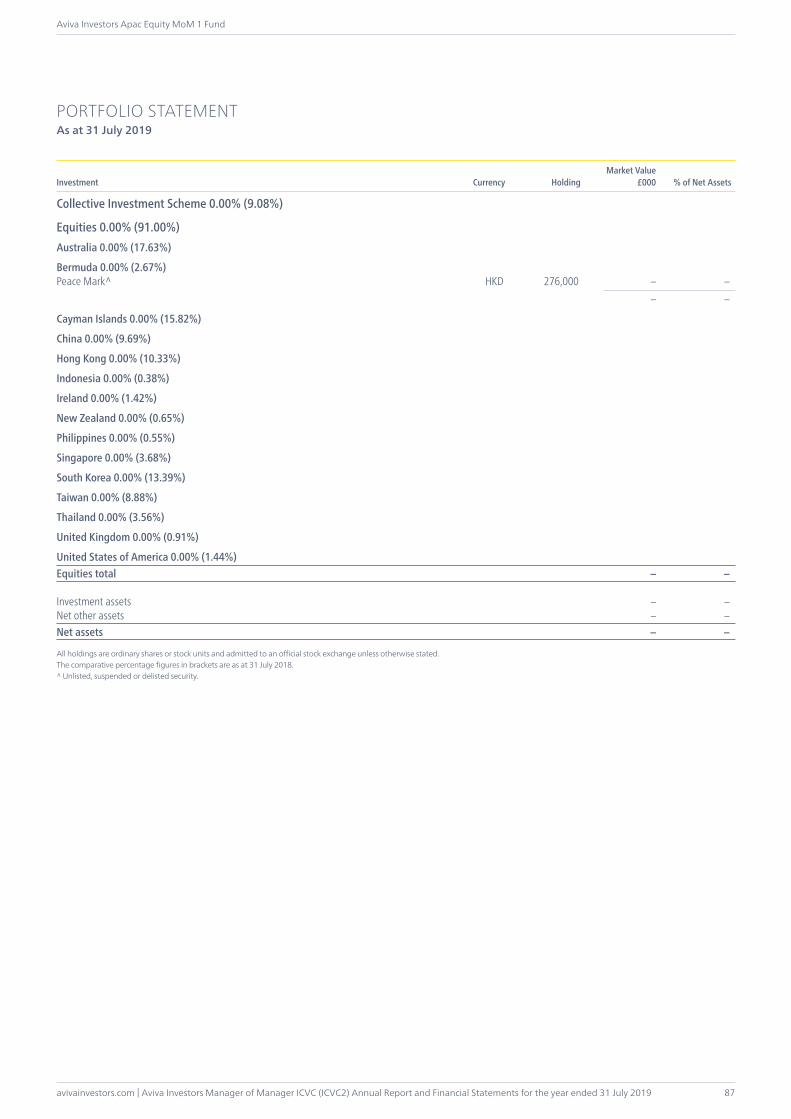
avivainvestors.com | Aviva Investors Manager of Manager ICVC (ICVC2) Annual Report and Financial Statements for the year ended 31 July 2019
Aviva Investors Apac Equity MoM 1 Fund
87
PORTFOLIO STATEMENTAs at 31 July 2019
Investment Currency HoldingMarket Value
£000 % of Net Assets
Collective Investment Scheme 0.00% (9.08%)
Equities 0.00% (91.00%)Australia 0.00% (17.63%)
Bermuda 0.00% (2.67%)Peace Mark^ HKD 276,000 – – – –
Cayman Islands 0.00% (15.82%)
China 0.00% (9.69%)
Hong Kong 0.00% (10.33%)
Indonesia 0.00% (0.38%)
Ireland 0.00% (1.42%)
New Zealand 0.00% (0.65%)
Philippines 0.00% (0.55%)
Singapore 0.00% (3.68%)
South Korea 0.00% (13.39%)
Taiwan 0.00% (8.88%)
Thailand 0.00% (3.56%)
United Kingdom 0.00% (0.91%)
United States of America 0.00% (1.44%)Equities total – –
Investment assets – –Net other assets – –Net assets – –
All holdings are ordinary shares or stock units and admitted to an official stock exchange unless otherwise stated.The comparative percentage figures in brackets are as at 31 July 2018.^ Unlisted, suspended or delisted security.

Aviva Investors Manager of Manager ICVC (ICVC2) Annual Report and Financial Statements for the year ended 31 July 2019 | avivainvestors.com
Aviva Investors Apac Equity MoM 1 Fund
88
STATEMENT OF TOTAL RETURNFor the year ended 31 July 2019
Notes £000
Year ended31.07.19
£000 £000
Year ended31.07.18
£000
Income
Net capital gains 2 488 3,182
Revenue 3 1,046 2,040
Expenses 4 (681) (938)
Net revenue before taxation 365 1,102
Taxation 5 (75) (143)
Net revenue after taxation 290 959
Total return before distributions 778 4,141
Distributions 6 (294) (959)
Change in net assets attributable to shareholders from investment activities 484 3,182
STATEMENT OF CHANGE IN NET ASSETS ATTRIBUTABLE TO SHAREHOLDERSFor the year ended 31 July 2019
£000
Year ended31.07.19
£000 £000
Year ended31.07.18
£000
Opening net assets attributable to shareholders 67,003 71,264
Movement due to issue and cancellation of shares:
Amounts payable on cancellation of shares (67,652) (7,449)
(67,652) (7,449)
Dilution adjustment 175 6
Change in net assets attributable to shareholders from investment activities (see above) 484 3,182
Fund closure (10) –
Closing net assets attributable to shareholders – 67,003

avivainvestors.com | Aviva Investors Manager of Manager ICVC (ICVC2) Annual Report and Financial Statements for the year ended 31 July 2019
Aviva Investors Apac Equity MoM 1 Fund
89
BALANCE SHEETAs at 31 July 2019
Notes
As at31.07.19
£000
As at31.07.18
£000
Assets:
Investments – 67,059
Current assets:
Debtors 8 3 234
Cash and bank balances 9 37 415
Total assets 40 67,708
Liabilities:
Creditors:
Distribution payable – (628)
Other creditors 10 (40) (77)
Total liabilities (40) (705)
Net assets attributable to shareholders – 67,003
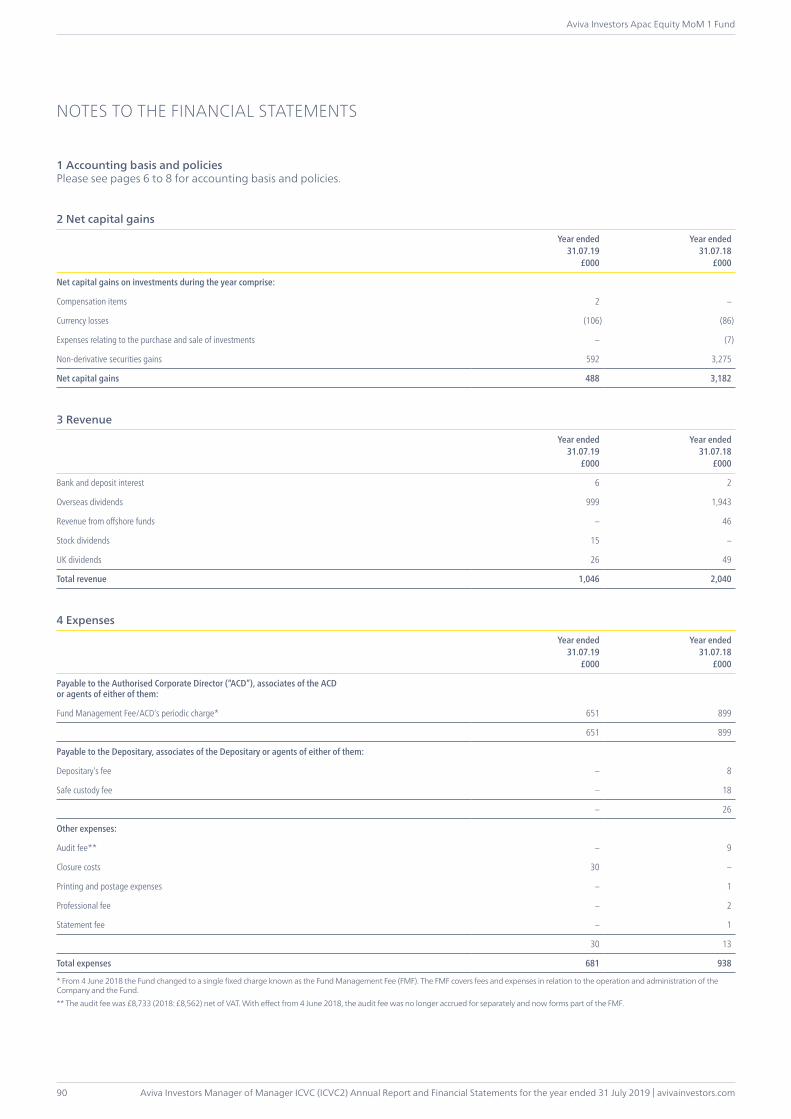
Aviva Investors Manager of Manager ICVC (ICVC2) Annual Report and Financial Statements for the year ended 31 July 2019 | avivainvestors.com
Aviva Investors Apac Equity MoM 1 Fund
90
1 Accounting basis and policiesPlease see pages 6 to 8 for accounting basis and policies.
2 Net capital gains
Year ended31.07.19
£000
Year ended31.07.18
£000
Net capital gains on investments during the year comprise:
Compensation items 2 –
Currency losses (106) (86)
Expenses relating to the purchase and sale of investments – (7)
Non-derivative securities gains 592 3,275
Net capital gains 488 3,182
3 Revenue
Year ended31.07.19
£000
Year ended31.07.18
£000
Bank and deposit interest 6 2
Overseas dividends 999 1,943
Revenue from offshore funds – 46
Stock dividends 15 –
UK dividends 26 49
Total revenue 1,046 2,040
4 Expenses
Year ended31.07.19
£000
Year ended31.07.18
£000
Payable to the Authorised Corporate Director (“ACD”), associates of the ACD or agents of either of them:
Fund Management Fee/ACD’s periodic charge* 651 899
651 899
Payable to the Depositary, associates of the Depositary or agents of either of them:
Depositary’s fee – 8
Safe custody fee – 18
– 26
Other expenses:
Audit fee** – 9
Closure costs 30 –
Printing and postage expenses – 1
Professional fee – 2
Statement fee – 1
30 13
Total expenses 681 938
* From 4 June 2018 the Fund changed to a single fixed charge known as the Fund Management Fee (FMF). The FMF covers fees and expenses in relation to the operation and administration of the Company and the Fund.** The audit fee was £8,733 (2018: £8,562) net of VAT. With effect from 4 June 2018, the audit fee was no longer accrued for separately and now forms part of the FMF.
NOTES TO THE FINANCIAL STATEMENTS
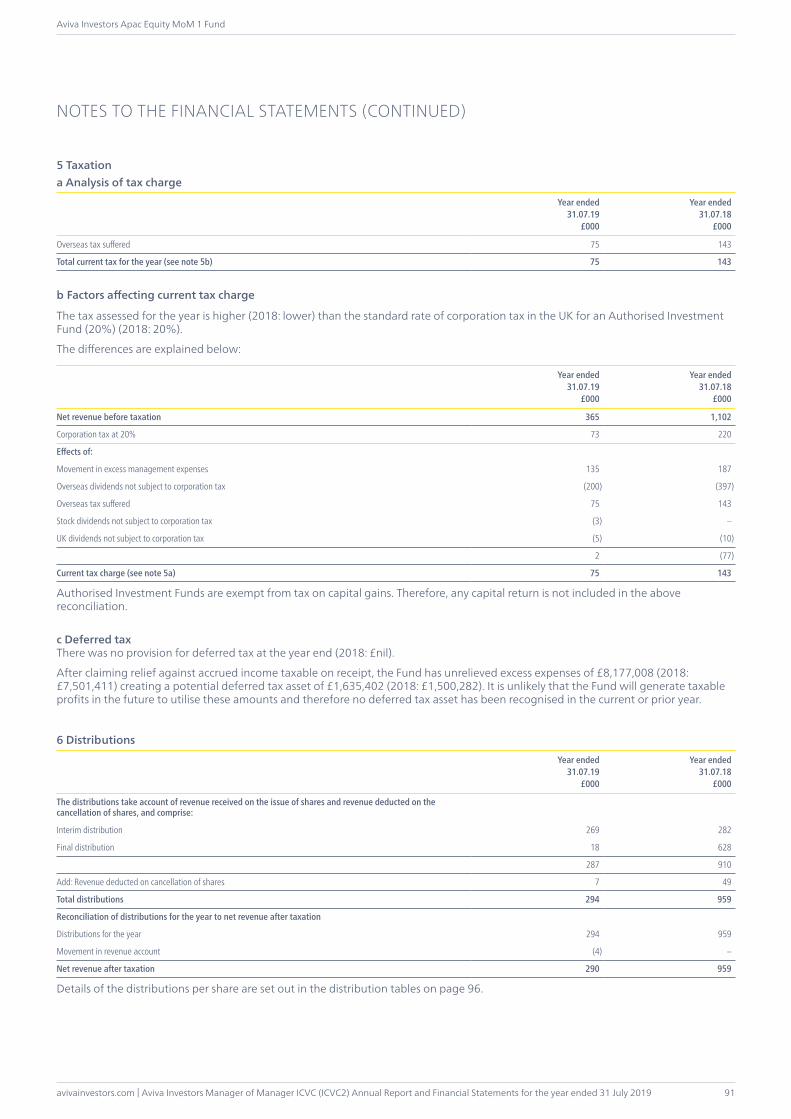
avivainvestors.com | Aviva Investors Manager of Manager ICVC (ICVC2) Annual Report and Financial Statements for the year ended 31 July 2019
Aviva Investors Apac Equity MoM 1 Fund
91
5 Taxationa Analysis of tax charge
Year ended31.07.19
£000
Year ended31.07.18
£000
Overseas tax suffered 75 143
Total current tax for the year (see note 5b) 75 143
b Factors affecting current tax charge
The tax assessed for the year is higher (2018: lower) than the standard rate of corporation tax in the UK for an Authorised Investment Fund (20%) (2018: 20%).
The differences are explained below:
Year ended31.07.19
£000
Year ended31.07.18
£000
Net revenue before taxation 365 1,102
Corporation tax at 20% 73 220
Effects of:
Movement in excess management expenses 135 187
Overseas dividends not subject to corporation tax (200) (397)
Overseas tax suffered 75 143
Stock dividends not subject to corporation tax (3) –
UK dividends not subject to corporation tax (5) (10)
2 (77)
Current tax charge (see note 5a) 75 143
Authorised Investment Funds are exempt from tax on capital gains. Therefore, any capital return is not included in the above reconciliation.
c Deferred taxThere was no provision for deferred tax at the year end (2018: £nil).
After claiming relief against accrued income taxable on receipt, the Fund has unrelieved excess expenses of £8,177,008 (2018: £7,501,411) creating a potential deferred tax asset of £1,635,402 (2018: £1,500,282). It is unlikely that the Fund will generate taxable profits in the future to utilise these amounts and therefore no deferred tax asset has been recognised in the current or prior year.
6 Distributions
Year ended31.07.19
£000
Year ended31.07.18
£000
The distributions take account of revenue received on the issue of shares and revenue deducted on the cancellation of shares, and comprise:
Interim distribution 269 282
Final distribution 18 628
287 910
Add: Revenue deducted on cancellation of shares 7 49
Total distributions 294 959
Reconciliation of distributions for the year to net revenue after taxation
Distributions for the year 294 959
Movement in revenue account (4) –
Net revenue after taxation 290 959
Details of the distributions per share are set out in the distribution tables on page 96.
NOTES TO THE FINANCIAL STATEMENTS (CONTINUED)
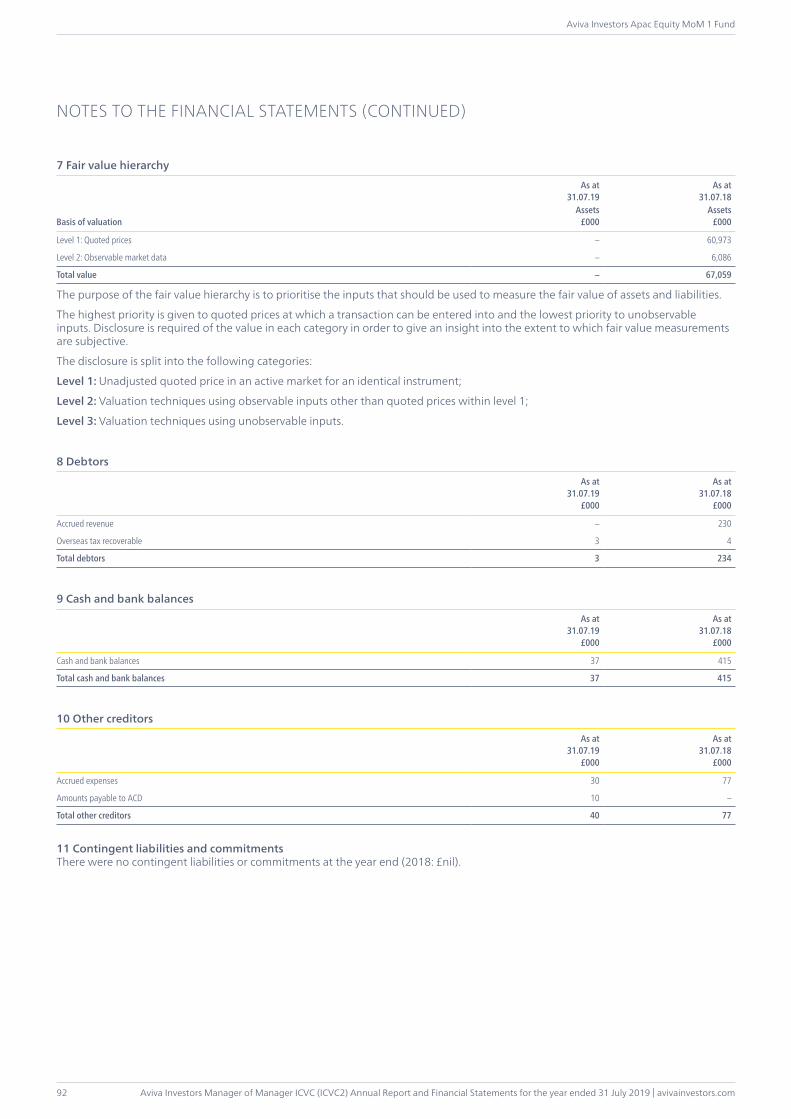
Aviva Investors Manager of Manager ICVC (ICVC2) Annual Report and Financial Statements for the year ended 31 July 2019 | avivainvestors.com
Aviva Investors Apac Equity MoM 1 Fund
92
7 Fair value hierarchy
As at31.07.19
As at31.07.18
Basis of valuationAssets
£000Assets
£000
Level 1: Quoted prices – 60,973
Level 2: Observable market data – 6,086
Total value – 67,059
The purpose of the fair value hierarchy is to prioritise the inputs that should be used to measure the fair value of assets and liabilities.
The highest priority is given to quoted prices at which a transaction can be entered into and the lowest priority to unobservable inputs. Disclosure is required of the value in each category in order to give an insight into the extent to which fair value measurements are subjective.
The disclosure is split into the following categories:
Level 1: Unadjusted quoted price in an active market for an identical instrument;
Level 2: Valuation techniques using observable inputs other than quoted prices within level 1;
Level 3: Valuation techniques using unobservable inputs.
8 Debtors
As at31.07.19
£000
As at31.07.18
£000
Accrued revenue – 230
Overseas tax recoverable 3 4
Total debtors 3 234
9 Cash and bank balances
As at31.07.19
£000
As at31.07.18
£000
Cash and bank balances 37 415
Total cash and bank balances 37 415
10 Other creditors
As at31.07.19
£000
As at31.07.18
£000
Accrued expenses 30 77
Amounts payable to ACD 10 –
Total other creditors 40 77
11 Contingent liabilities and commitmentsThere were no contingent liabilities or commitments at the year end (2018: £nil).
NOTES TO THE FINANCIAL STATEMENTS (CONTINUED)

avivainvestors.com | Aviva Investors Manager of Manager ICVC (ICVC2) Annual Report and Financial Statements for the year ended 31 July 2019
Aviva Investors Apac Equity MoM 1 Fund
93
12 Related party transactionsAviva Investors UK Fund Services Limited, Aviva Investors Global Services Limited and the Aviva group are deemed to be related parties per section 33.10 of FRS 102 as they are entities with control, joint control or significant influence over the entity.
Fund management fee/ACD’s periodic charge paid to Aviva Investors UK Fund Services Limited (“the ACD”) are shown in note 4 and details of shares issued and cancelled by the ACD are shown in the statement of change in net assets attributable to shareholders. The balance due to the ACD at the year end in respect of Fund management fee was £nil (2018: £77,219). Any balance due from the ACD in respect of issues is shown in note 8. Any balance due to the ACD in respect of cancellations is shown in note 10.
Distributions payable to the ACD and related parties of the ACD during the year amounted to £286,598 (2018: £910,320). The amount outstanding at the year end was £nil (2018: £628,161). Related parties of the ACD are deemed to be all companies under the control of Aviva Plc. This will include companies which hold shares in the Fund on behalf of other external investors.
The Fund closed during the year and sold all investments therefore at the year end there were no holdings in any investments managed and advised by Aviva Investors Global Services Limited or associated with the Aviva Group.
Holdings at the year end and movements during the year are as follows:
Holdings at31.07.19(shares)
Movement(shares)
Holdings at31.07.18(shares)
ACD and related parties (Class 2 Income shares) – (24,120,133) 24,120,133
The ACD and related parties of the ACD are ineligible to vote at any general meeting.
13 Shareholder fundsThe Fund currently has one share class: Class 2 (Institutional). The Fund Management Fee is as follows:
Class 2: 1.36%
The net asset value of the share class, the net asset value per share and the number of shares in the class are shown on page 86. The distributions per share class are given in the distribution tables on page 96.
14 Shares in issue reconciliationNumber of shares
in issue at31.07.18
Number ofshares issued
Number ofshares cancelled
Number ofshares converted
Number of shares in issue at
31.07.19
Share Class 2 Income 24,120,133 – (24,120,133) – –
NOTES TO THE FINANCIAL STATEMENTS (CONTINUED)

Aviva Investors Manager of Manager ICVC (ICVC2) Annual Report and Financial Statements for the year ended 31 July 2019 | avivainvestors.com
Aviva Investors Apac Equity MoM 1 Fund
94
15 Derivatives and other financial instrumentsThe policies applied in the management of financial instruments are set out on pages 6 to 8.
Fair value of financial assets and financial liabilitiesThere is no significant difference between the carrying values of the financial assets and liabilities and their fair values (2018: £nil).
Currency riskAt the year end date, nil% (2018: 100.45%) of the net assets of the Fund were denominated in currencies other than sterling with the effect that the balance sheet and total return can be significantly affected by currency movements. If currency rates were to change by 10.00%, the value of the Fund would change by nil% (2018: 10.05%).
Currency
Net foreign currency assets
Monetary exposure£000
Non monetary exposure£000
Total£000
31.07.19 31.07.18 31.07.19 31.07.18 31.07.19 31.07.18
Australian Dollar – – – 13,734 – 13,734
Hong Kong Dollar – 130 – 20,311 – 20,441
Indonesian Rupiah – – – 257 – 257
Korean Won – 28 – 8,971 – 8,999
New Zealand Dollar – – – 434 – 434
Philippine Peso – – – 370 – 370
Singapore Dollar – – – 2,463 – 2,463
Taiwan Dollar – 63 – 5,949 – 6,012
Thailand Baht – – – 2,385 – 2,385
US Dollar 3 22 – 12,185 3 12,207
Interest rate riskThe Fund does not invest in either fixed or floating rate securities and interest rate risk exposure is restricted to interest receivable on bank deposits or payable on bank overdraft positions which will be affected by fluctuations in interest rates.
At the year end date nil% (2018: 0.62%) of the net assets of the Fund were interest bearing and as such the interest rate risk is not considered significant.
The floating rate on bank balances is linked to the Depositary’s base rate.
Market price riskAt the year end date, nil% (2018: 100.08%) of the net assets of the Fund were invested in CIS, ordinary shares or stock units admitted to an official stock exchange. If the market value were to change by 10%, the value of the Fund would change by nil% (2018: 10.01%).
NOTES TO THE FINANCIAL STATEMENTS (CONTINUED)

avivainvestors.com | Aviva Investors Manager of Manager ICVC (ICVC2) Annual Report and Financial Statements for the year ended 31 July 2019
Aviva Investors Apac Equity MoM 1 Fund
95
16 Direct transaction costs In the case of shares, broker commissions and transfer taxes, stamp duty is paid by the Fund on each transaction. In addition, there is a dealing spread between buying and selling prices of the underlying investments. Unlike shares, other types of investments (such as bonds, money market instruments, derivatives) have no separately identifiable transaction costs; these costs form part of the dealing spread.
31.07.19
Principalbefore costs
£000Commissions
£000Taxes£000
Totalafter costs
£000
Commissions as %
of principal
Taxes as %
of principal
Purchases (excluding Inspecie & Corporate Action activity)
Equities (1,309) – (1) (1,310) 0.00% 0.08%(1,309) – (1) (1,310)
Sales (excluding Inspecie & Corporate Action activity)Equities 62,963 (26) (74) 62,863 0.04% 0.12%Funds 6,098 – – 6,098 0.00% 0.00%
69,061 (26) (74) 68,961
Total (26) (75)
Percentage of Fund average net assets 0.04% 0.12%
31.07.18
Principalbefore costs
£000Commissions
£000Taxes£000
Totalafter costs
£000
Commissions as %
of principal
Taxes as %
of principal
Purchases (excluding Inspecie & Corporate Action activity)
Equities (7,974) (5) (3) (7,982) 0.06% 0.04%Funds (6,017) – – (6,017) 0.00% 0.00%
(13,991) (5) (3) (13,999)Sales (excluding Inspecie & Corporate Action activity)Equities 20,248 (16) (29) 20,203 0.08% 0.14%Funds 141 – – 141 0.00% 0.00%
20,389 (16) (29) 20,344
Total (21) (32)
Percentage of Fund average net assets 0.03% 0.04%
Dealing spreadAs at 31 July 2019, the average portfolio dealing spread was nil% (2018: 0.15%). This spread represents the difference between the values determined retrospectively by reference to the bid and offer prices of investments expressed as a percentage of the value determined by reference to the offer price.
17 Post balance sheet eventsThere are no post balance sheet events which require adjustment or disclosure at the year end (2018: £nil).
NOTES TO THE FINANCIAL STATEMENTS (CONTINUED)
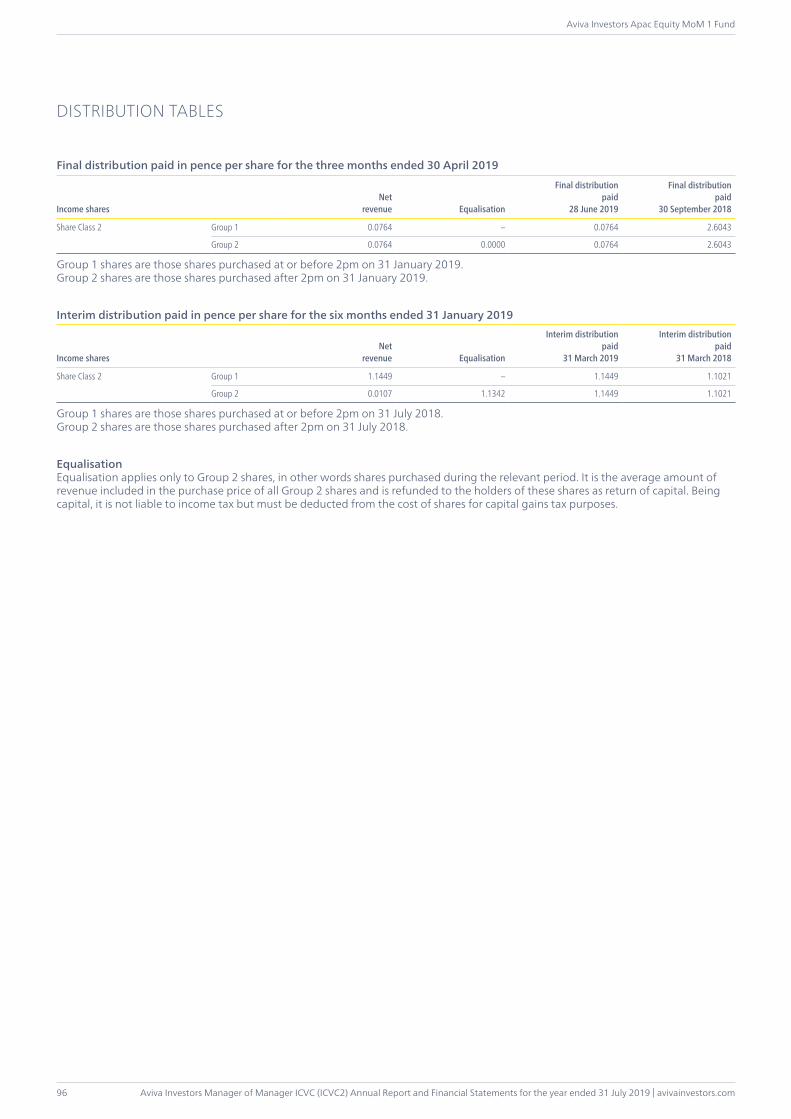
Aviva Investors Manager of Manager ICVC (ICVC2) Annual Report and Financial Statements for the year ended 31 July 2019 | avivainvestors.com
Aviva Investors Apac Equity MoM 1 Fund
96
DISTRIBUTION TABLES
Final distribution paid in pence per share for the three months ended 30 April 2019
Income sharesNet
revenue Equalisation
Final distributionpaid
28 June 2019
Final distributionpaid
30 September 2018
Share Class 2 Group 1 0.0764 – 0.0764 2.6043
Group 2 0.0764 0.0000 0.0764 2.6043
Group 1 shares are those shares purchased at or before 2pm on 31 January 2019.Group 2 shares are those shares purchased after 2pm on 31 January 2019.
Interim distribution paid in pence per share for the six months ended 31 January 2019
Income sharesNet
revenue Equalisation
Interim distributionpaid
31 March 2019
Interim distributionpaid
31 March 2018
Share Class 2 Group 1 1.1449 – 1.1449 1.1021
Group 2 0.0107 1.1342 1.1449 1.1021
Group 1 shares are those shares purchased at or before 2pm on 31 July 2018.Group 2 shares are those shares purchased after 2pm on 31 July 2018.
EqualisationEqualisation applies only to Group 2 shares, in other words shares purchased during the relevant period. It is the average amount of revenue included in the purchase price of all Group 2 shares and is refunded to the holders of these shares as return of capital. Being capital, it is not liable to income tax but must be deducted from the cost of shares for capital gains tax purposes.

avivainvestors.com | Aviva Investors Manager of Manager ICVC (ICVC2) Annual Report and Financial Statements for the year ended 31 July 2019
Aviva Investors Japan Equity MoM 1 Fund
97
INVESTMENT OBJECTIVEThe Fund aims to grow your investment over the long term (5 years or more) by investing in shares of Japanese companies.
INVESTMENT POLICYCore investment: At least 80% of the Fund will be invested in shares of companies which are domiciled or listed in Japan or which have significant trading activities in Japan.
Other investments: The Fund may also invest in other funds and up to 5% in deposits and cash.
Strategy: The Fund is actively managed and will invest in shares that are deemed to offer opportunities for growth.
The process for making these decisions follows detailed analysis based on a wide range of financial metrics and research. The Investment Manager looks to identify companies and sectors which the market has not accurately priced. This strategy aims to grow the Fund over the long term (5 years or more) by benefitting from the price corrections of the chosen shares as they move towards their true value as determined by the manager.
Performance & Risk Measurement: The Fund’s performance is compared against the FTSE® World Japan Index (the “Index”)*.
The Fund does not aim to track the Index, so may not hold every company in the Index and may also hold companies that do not form part of it. The Fund can hold larger positions in companies than they represent within the Index, but any overweight position is capped at 5% of the Fund’s value over and above the index weight of that company.
The Fund uses a “tracking error” to measure the consistency between the Fund’s returns and the returns of the Index. In general, the lower the tracking error, the more consistent the Fund’s returns are relative to the Index , and vice-versa. The Fund is expected to have an average yearly tracking error of between 3% and 9% per annum compared to the Index. In certain conditions the Fund may be outside of this range.
FTSE® World Japan Index is comprised of approximately 500 large and medium sized Japanese companies, as determined by their market capitalisation (total market value of a company’s outstanding shares). The benchmark index has been selected for performance and risk measurement because it is representative of the type of companies in which the Fund is likely to invest, and it is therefore an appropriate comparator for the Fund’s performance.
FUND MANAGER’S REPORTPerformanceOver the twelve months ended 31 July 2019 the Fund* returned (1.75)% (net of fees). The Funds benchmark, the FTSE® World Japan Index, returned of 1.76% over the same period.
ReviewFor the one-year review period ending July 2019, the FT Japan index declined by 7.86% in yen terms. While the Japan equity market suffered a major correction towards the end of 2018 amid persistent concerns about slowing global economic growth, the market rebounded in the first quarter of 2019 and clawed back some of the losses from the sell-off in Q4 2018. However, this positive momentum waned during May as market sentiment was undermined by announcements from US President Trump threatening further tariffs hikes on imports from both China and Mexico. Meanwhile, earnings guidance for the fiscal year ending March 2020 issued by Japanese companies from late April to the middle of May was generally conservative. Although subdued earnings guidance was largely expected, it still weighed heavily on the already weak market sentiment. However, growing expectations of further monetary easing measures by the Federal Reserve and European Central Bank began to revive investor sentiment. Signs of progress on the US-China trade dispute helped to alleviate some of the macroeconomic concerns towards the end of the review period.
Sector allocation detracted from the relative performance by 4bp. The Commodities sector underperformed due to the deterioration in global macroeconomic prospects. Our overweight position in the sector therefore detracted from the relative performance. In contrast, the Electronics sector outperformed despite the weaker demand for smartphones worldwide given the continued growth in data storage and processing demand. Robust capital expenditure by semiconductor producers has sustained the strong earnings outlook for Japanese semiconductor manufacturing equipment companies and their share prices drove the sector returns.
Stock selection had a negative impact of 165bp on the relative performance. Weakening global economic conditions and earnings prospects of Japanese companies led to deteriorating investor sentiment. Therefore, some of the small and medium-cap holdings in the portfolio failed to meet our initial expectations and faced substantial selling pressure, which detracted from the overall relative performance.
In the Automobiles sector, NGK Spark Plug’s share price plummeted as this leading spark plug manufacturer’s recent earnings results failed to meet prior expectations due to weaker automobile demand in Europe and China. Earnings results from Mitsubishi Motors also failed to meet the consensus estimate and detracted from the stock selection effect in this sector. Toyota Motor, on the other hand, issued a relatively favourable earnings announcement and our lack of exposure to the largest automobile company therefore had a negative impact.
Stock selection in the Infrastructure sector also hampered performance. Earnings results of our favoured housing materials holding Nichiha failed to meet expectations due to a weakened domestic housing market. Daiwa House, a large real estate and residential housing developer holding, also weakened despite the attractive valuations on the weakening demand prospects for its businesses. Moreover, after announcing breaches of building standards for residential housing and improper cash management at a Chinese joint venture in spring of 2019, the recovery in the share price performance was capped.
AVIVA INVESTORS JAPAN EQUITY MOM 1 FUND

Aviva Investors Manager of Manager ICVC (ICVC2) Annual Report and Financial Statements for the year ended 31 July 2019 | avivainvestors.com
Aviva Investors Japan Equity MoM 1 Fund
98
AVIVA INVESTORS JAPAN EQUITY MOM 1 FUND (CONTINUED)
FUND MANAGER’S REPORT (CONTINUED)OutlookDespite signs that the global economy appears to be slowing, the acute concerns of a significant downturn that dominated sentiment in late 2018 have eased somewhat with the release of more stable global economic data and signs of resilient corporate earnings. Accommodative monetary policies by authorities worldwide have also helped. However, the underlying mood is still sensitive to the ongoing US-China trade dispute and this is likely to be a persistent theme with market sentiment swayed by headlines about fresh tensions or possible compromises. For example, increased Chinese imports from the US could be reciprocated by suspending tariff hikes on Chinese imports to the US. Such actions could boost market sentiment, at least temporarily. Nevertheless, the possible downsides from the trade conflict are well anticipated by both governments and they understand that substantial weakness in their economies could shift the domestic political balance too. The Chinese government is therefore expected to take measures through fiscal and monetary policies whenever a notable decline in external demand materialises. On the other hand, US economic fundamentals seem solid. US consumption activity and labour market conditions are still robust, while corporate capital expenditure is at a sustainable level. Moreover, the Federal Reserve is adopting a more accommodative monetary policy than before and is taking precautions against potential economic weaknesses. In these circumstances, we see little possibility of a recession in the near term. A substantial downturn in the economic conditions in Japan is also not a serious concern at the moment. While results from the latest election were largely as expected, political stability seems to have been secured in Japan. The Abe government is expected to focus on stabilising domestic demand after the consumption tax hike scheduled for this October. The Bank of Japan maintained its monetary policy stance at the latest policy meeting in July, but the central bank reiterated that it would be prepared to act on potential deviation from its inflation target.
Despite the fact that valuations in broad terms for the Tokyo equity market are not demanding, we do not expect to see any positive market catalysts for the time being. As we saw in July, where semiconductor related stocks buoyed the electronics sector, developments in individual industries could continue to influence the overall market movements. However, we doubt whether these sector trends will be strong enough to shift the overall market significantly from its current range.
September 2019* Fund performance figures – share class 2, source Lipper, net of fees, net income reinvested in GBP. Unless otherwise indicated, all data has been sourced by Nomura Asset Management.As noted above, the performance figures in this commentary have been sourced from an external party and are based on published prices. The performance figures quoted in the comparative table on page 99 are based on the net asset value per the published accounts and may be different due to post year end accounting adjustments. “FTSE” is a trade mark jointly acquired by the London Stock Exchange Plc and The Financial Times Limited and is used by FTSE International Limited (“FTSE”) under Licence. FTSE does not sponsor, endorse or promote this product and is not in any way connected to it and does not accept any liability in relation to its issue, operation and trading. All copyright in the index values and constituent list vests in FTSE. FTSE® World Japan Index is comprised of approximately 500 large and medium sized Japanese companies, as determined by their market capitalisation (total market value of a company’s outstanding shares).The benchmark index has been selected for performance and risk measurement because it is representative of the type of companies in which the Fund is likely to invest, and it is therefore an appropriate comparator for the Fund’s performance.Any opinions expressed are those of the Fund manager. They should not be viewed as a guarantee of a return from an investment in the Funds. The content of the commentary should not be viewed as a recommendation to invest nor to buy or sell stocks. Past performance is not a guide to future performance. The value of an investment in the Fund and any income from it may go down as well as up, and the investor may not get back the original amount invested.
Material Portfolio ChangesPurchases Sales
Honda Motor Fast Retailing
Sony Shionogi
Sumitomo Mitsui Trust Holdings NTT DOCOMO
Marubeni MS&AD Insurance Group Holdings
Electric Power Development MINEBEA MITSUMI
Hoya SMC
Shimano Kao
Nippon Telegraph & Telephone Seven & i Holdings
SMC Otsuka Holdings
Oji Holdings SoftBank Group
Synthetic Risk and Reward Indicator
Lower risk Higher risk
Typically lower rewards Typically higher rewards
1 2 3 4 5 6 7The Fund has been allocated a risk number based on the historic volatility of its share price. Where insufficient share price information is available, the risk number has been based on the historic volatility of the asset classes appropriate to the Fund.– This indicator is based on historical data, calculated using European Union
rules, and may not be a reliable indication of the future risk profile of the Fund.
– The risk and reward category shown is not guaranteed to remain unchanged and may change over time. The lowest category does not mean ‘risk free’.
– The value of investments will be affected by changes in exchange rates.– Further information on the risks applicable to the Fund is detailed in the
Fund’s Key Investor Information Document, and a full description is set out in the Prospectus, both of which are available on the internet at www.avivainvestors.com or from the ACD on request.

avivainvestors.com | Aviva Investors Manager of Manager ICVC (ICVC2) Annual Report and Financial Statements for the year ended 31 July 2019
Aviva Investors Japan Equity MoM 1 Fund
99
COMPARATIVE TABLE
Class 2 Income2019
p per share2018
p per share2017
p per share
Change in net assets per shareOpening net asset value per share 207.42 197.85 171.18
Return before operating charges† 0.63 13.82 30.40Operating charges (2.56) (2.69) (2.48)Return after operating charges† (1.93) 11.13 27.92
Distributions (2.12) (1.56) (1.25)
Closing net asset value per share 203.37 207.42 197.85
† after direct transaction costs of (0.14) (0.12) (0.13)
PerformanceReturn after charges (0.93)% 5.63% 16.31%
Other informationClosing net asset value (£000) 203,798 305,012 315,140Closing number of shares 100,211,424 147,048,857 159,284,578Operating charges (%)‡ 1.31% 1.30% 1.30%Direct transaction costs (%)# 0.07% 0.06% 0.07%
Prices≈
Highest share price 213.05 223.49 200.88Lowest share price 181.41 193.45 165.55
‡ The operating charges are calculated on an ex-post basis and as such may differ from the Ongoing Charge Figure where:(a) The Ongoing Charge has been annualised for a share class that has not yet been open for a full year.# The direct transaction costs have been stated after deducting, in the case of single-priced funds, the proportion of the amounts collected from dilution adjustments or dilution levies that relates to direct transaction costs and, in the case of dual-priced funds, the amounts collected in relation to direct transaction costs added to, or subtracted from, the valuations by virtue of COLL 6.3.6 G (4).≈ The high and low prices disclosed are the high and low prices for the accounting period and not the calendar year and are based on published prices. The net asset value per share price is based on the net asset value in the published accounts and may be different due to post year end accounting adjustments.
Ongoing Charges Figure*Share class 31.07.19 31.07.18
Class 2 1.31% 1.31%
* The Ongoing Charges Figure (OCF) is calculated as the ratio of the total ongoing charges to the average net asset value of the Fund over the year. The OCF is made up of the Fund Management Fee and, where a fund invests a substantial portion of its assets in other funds, an amount for the pro-rated charges of those other funds (referred to as “synthetic charges” or the “synthetic” part of the ongoing charge). The figure for ongoing charges excludes performance fees and portfolio transaction costs, except in the case of an entry/exit charge paid by the Fund when buying or selling shares/units in another collective investment scheme.Please remember that past performance is not a guide to future performance and it might not be repeated. The value of investments and the revenue from them may go down as well as up and investors may not get back the amount originally invested. Because of this, you are not certain to make a profit on your investments and you may lose money.
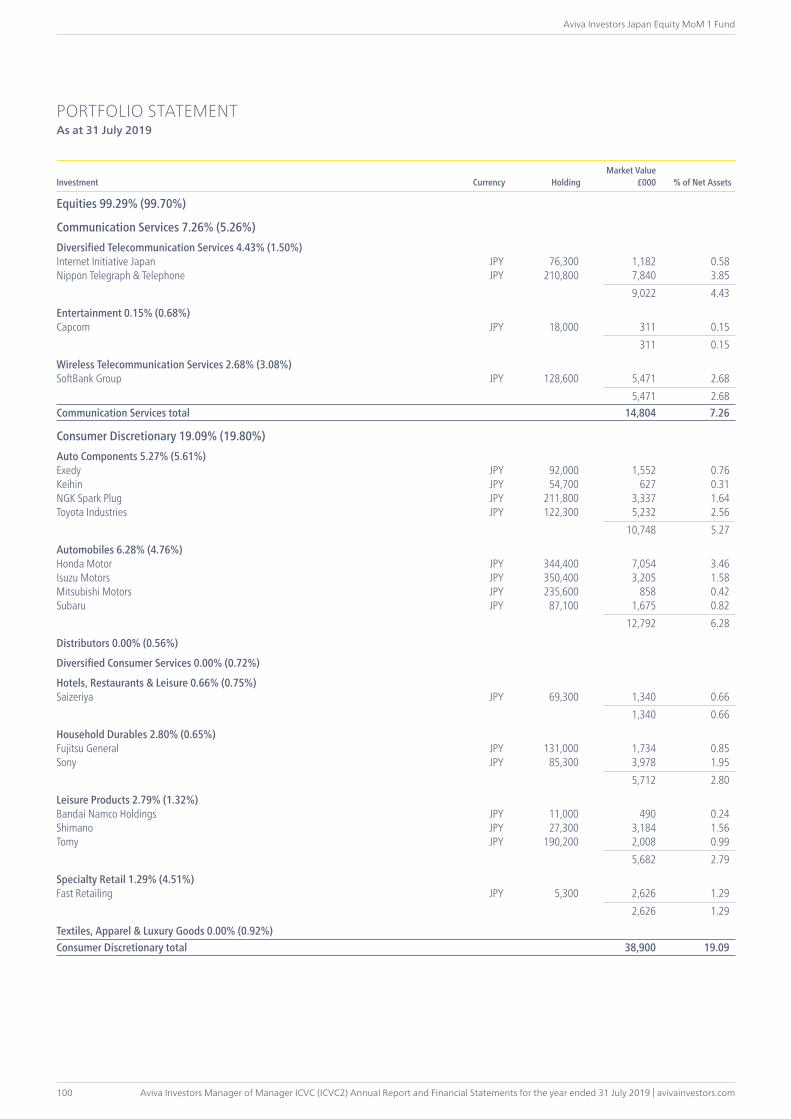
Aviva Investors Manager of Manager ICVC (ICVC2) Annual Report and Financial Statements for the year ended 31 July 2019 | avivainvestors.com
Aviva Investors Japan Equity MoM 1 Fund
100
PORTFOLIO STATEMENTAs at 31 July 2019
Investment Currency HoldingMarket Value
£000 % of Net Assets
Equities 99.29% (99.70%)
Communication Services 7.26% (5.26%)Diversified Telecommunication Services 4.43% (1.50%)Internet Initiative Japan JPY 76,300 1,182 0.58Nippon Telegraph & Telephone JPY 210,800 7,840 3.85 9,022 4.43
Entertainment 0.15% (0.68%)Capcom JPY 18,000 311 0.15 311 0.15
Wireless Telecommunication Services 2.68% (3.08%)SoftBank Group JPY 128,600 5,471 2.68 5,471 2.68Communication Services total 14,804 7.26
Consumer Discretionary 19.09% (19.80%)Auto Components 5.27% (5.61%)Exedy JPY 92,000 1,552 0.76Keihin JPY 54,700 627 0.31NGK Spark Plug JPY 211,800 3,337 1.64Toyota Industries JPY 122,300 5,232 2.56 10,748 5.27
Automobiles 6.28% (4.76%)Honda Motor JPY 344,400 7,054 3.46Isuzu Motors JPY 350,400 3,205 1.58Mitsubishi Motors JPY 235,600 858 0.42Subaru JPY 87,100 1,675 0.82 12,792 6.28
Distributors 0.00% (0.56%)
Diversified Consumer Services 0.00% (0.72%)
Hotels, Restaurants & Leisure 0.66% (0.75%)Saizeriya JPY 69,300 1,340 0.66 1,340 0.66
Household Durables 2.80% (0.65%)Fujitsu General JPY 131,000 1,734 0.85Sony JPY 85,300 3,978 1.95 5,712 2.80
Leisure Products 2.79% (1.32%)Bandai Namco Holdings JPY 11,000 490 0.24Shimano JPY 27,300 3,184 1.56Tomy JPY 190,200 2,008 0.99 5,682 2.79
Specialty Retail 1.29% (4.51%)Fast Retailing JPY 5,300 2,626 1.29 2,626 1.29
Textiles, Apparel & Luxury Goods 0.00% (0.92%)Consumer Discretionary total 38,900 19.09

avivainvestors.com | Aviva Investors Manager of Manager ICVC (ICVC2) Annual Report and Financial Statements for the year ended 31 July 2019
Aviva Investors Japan Equity MoM 1 Fund
101
PORTFOLIO STATEMENT (CONTINUED)As at 31 July 2019
Investment Currency HoldingMarket Value
£000 % of Net Assets
Consumer Staples 6.79% (4.64%)Food & Staples Retailing 1.48% (1.98%)Mitsubishi Shokuhin JPY 67,500 1,398 0.69Seven & i Holdings JPY 57,500 1,620 0.79 3,018 1.48
Food Products 0.00% (0.70%)
Personal Products 4.28% (1.11%)Fancl JPY 74,800 1,554 0.76Kao JPY 66,600 4,012 1.97Shiseido JPY 51,800 3,150 1.55 8,716 4.28
Tobacco 1.03% (0.85%)Japan Tobacco JPY 115,000 2,102 1.03 2,102 1.03Consumer Staples total 13,836 6.79
Energy 1.50% (2.71%)Energy Equipment & Services 0.92% (0.74%)Modec JPY 85,600 1,876 0.92 1,876 0.92
Oil, Gas & Consumable Fuels 0.58% (1.97%)JXTG Holdings JPY 304,700 1,185 0.58 1,185 0.58Energy total 3,061 1.50
Financials 9.05% (12.04%)Banks 4.49% (4.72%)Mitsubishi UFJ Financial Group JPY 156,040 618 0.30Sumitomo Mitsui Financial Group JPY 127,000 3,653 1.79Sumitomo Mitsui Trust Holdings JPY 173,200 4,886 2.40 9,157 4.49
Consumer Finance 1.26% (2.60%)Hitachi Capital JPY 97,800 1,659 0.81Jaccs JPY 55,300 907 0.45 2,566 1.26
Diversified Financial Services 2.17% (1.73%)ORIX JPY 375,400 4,426 2.17 4,426 2.17
Insurance 1.13% (2.99%)MS&AD Insurance Group Holdings JPY 84,800 2,294 1.13 2,294 1.13Financials total 18,443 9.05
Health Care 7.90% (5.61%)Health Care Equipment & Supplies 1.35% (0.00%)Hoya JPY 43,400 2,756 1.35 2,756 1.35
Health Care Providers & Services 0.84% (0.77%)Ship Healthcare Holdings JPY 46,000 1,709 0.84 1,709 0.84
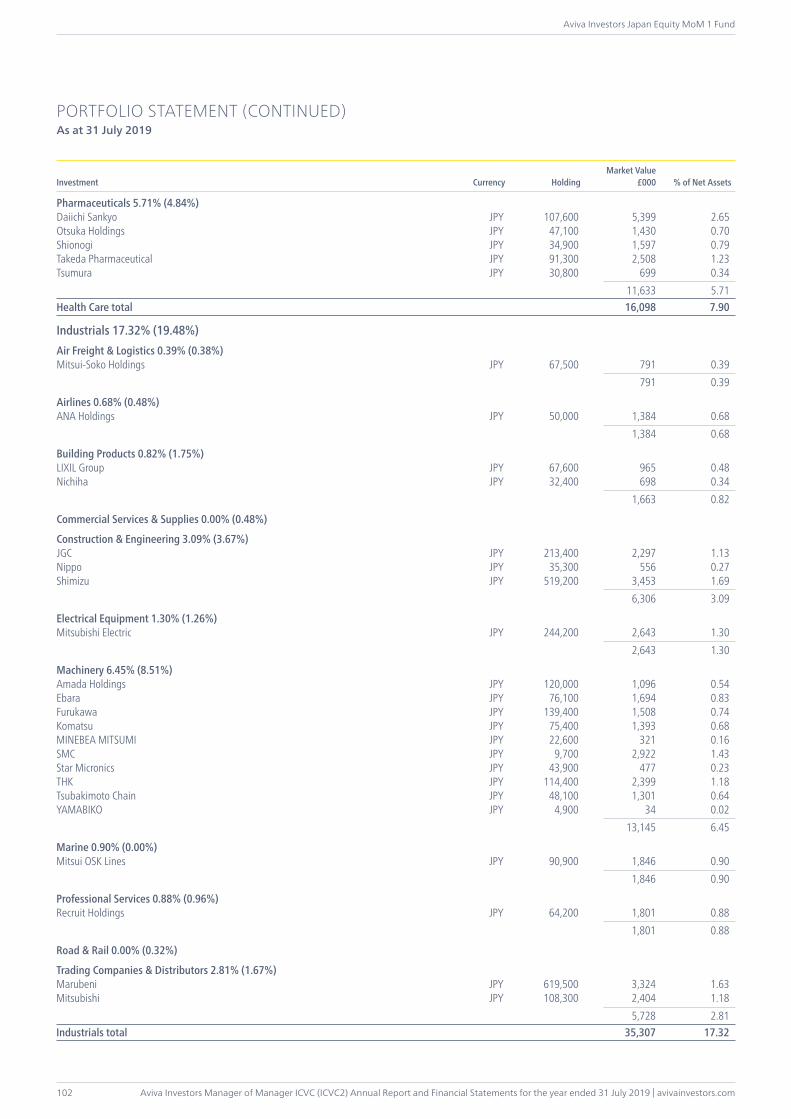
Aviva Investors Manager of Manager ICVC (ICVC2) Annual Report and Financial Statements for the year ended 31 July 2019 | avivainvestors.com
Aviva Investors Japan Equity MoM 1 Fund
102
PORTFOLIO STATEMENT (CONTINUED)As at 31 July 2019
Investment Currency HoldingMarket Value
£000 % of Net Assets
Pharmaceuticals 5.71% (4.84%)Daiichi Sankyo JPY 107,600 5,399 2.65Otsuka Holdings JPY 47,100 1,430 0.70Shionogi JPY 34,900 1,597 0.79Takeda Pharmaceutical JPY 91,300 2,508 1.23Tsumura JPY 30,800 699 0.34 11,633 5.71Health Care total 16,098 7.90
Industrials 17.32% (19.48%)Air Freight & Logistics 0.39% (0.38%)Mitsui-Soko Holdings JPY 67,500 791 0.39 791 0.39
Airlines 0.68% (0.48%)ANA Holdings JPY 50,000 1,384 0.68 1,384 0.68
Building Products 0.82% (1.75%)LIXIL Group JPY 67,600 965 0.48Nichiha JPY 32,400 698 0.34 1,663 0.82
Commercial Services & Supplies 0.00% (0.48%)
Construction & Engineering 3.09% (3.67%)JGC JPY 213,400 2,297 1.13Nippo JPY 35,300 556 0.27Shimizu JPY 519,200 3,453 1.69 6,306 3.09
Electrical Equipment 1.30% (1.26%)Mitsubishi Electric JPY 244,200 2,643 1.30 2,643 1.30
Machinery 6.45% (8.51%)Amada Holdings JPY 120,000 1,096 0.54Ebara JPY 76,100 1,694 0.83Furukawa JPY 139,400 1,508 0.74Komatsu JPY 75,400 1,393 0.68MINEBEA MITSUMI JPY 22,600 321 0.16SMC JPY 9,700 2,922 1.43Star Micronics JPY 43,900 477 0.23THK JPY 114,400 2,399 1.18Tsubakimoto Chain JPY 48,100 1,301 0.64YAMABIKO JPY 4,900 34 0.02 13,145 6.45
Marine 0.90% (0.00%)Mitsui OSK Lines JPY 90,900 1,846 0.90 1,846 0.90
Professional Services 0.88% (0.96%)Recruit Holdings JPY 64,200 1,801 0.88 1,801 0.88
Road & Rail 0.00% (0.32%)
Trading Companies & Distributors 2.81% (1.67%)Marubeni JPY 619,500 3,324 1.63Mitsubishi JPY 108,300 2,404 1.18 5,728 2.81Industrials total 35,307 17.32
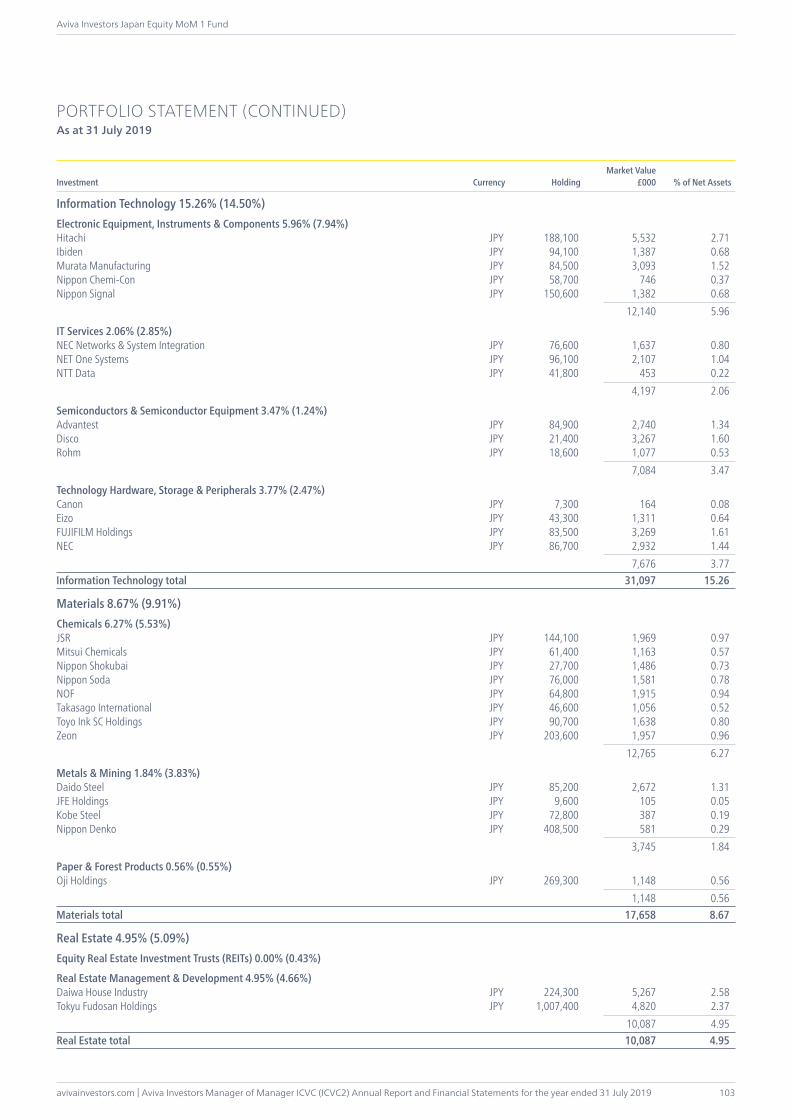
avivainvestors.com | Aviva Investors Manager of Manager ICVC (ICVC2) Annual Report and Financial Statements for the year ended 31 July 2019
Aviva Investors Japan Equity MoM 1 Fund
103
PORTFOLIO STATEMENT (CONTINUED)As at 31 July 2019
Investment Currency HoldingMarket Value
£000 % of Net Assets
Information Technology 15.26% (14.50%)Electronic Equipment, Instruments & Components 5.96% (7.94%)Hitachi JPY 188,100 5,532 2.71Ibiden JPY 94,100 1,387 0.68Murata Manufacturing JPY 84,500 3,093 1.52Nippon Chemi-Con JPY 58,700 746 0.37Nippon Signal JPY 150,600 1,382 0.68 12,140 5.96
IT Services 2.06% (2.85%)NEC Networks & System Integration JPY 76,600 1,637 0.80NET One Systems JPY 96,100 2,107 1.04NTT Data JPY 41,800 453 0.22 4,197 2.06
Semiconductors & Semiconductor Equipment 3.47% (1.24%)Advantest JPY 84,900 2,740 1.34Disco JPY 21,400 3,267 1.60Rohm JPY 18,600 1,077 0.53 7,084 3.47
Technology Hardware, Storage & Peripherals 3.77% (2.47%)Canon JPY 7,300 164 0.08Eizo JPY 43,300 1,311 0.64FUJIFILM Holdings JPY 83,500 3,269 1.61NEC JPY 86,700 2,932 1.44 7,676 3.77Information Technology total 31,097 15.26
Materials 8.67% (9.91%)Chemicals 6.27% (5.53%)JSR JPY 144,100 1,969 0.97Mitsui Chemicals JPY 61,400 1,163 0.57Nippon Shokubai JPY 27,700 1,486 0.73Nippon Soda JPY 76,000 1,581 0.78NOF JPY 64,800 1,915 0.94Takasago International JPY 46,600 1,056 0.52Toyo Ink SC Holdings JPY 90,700 1,638 0.80Zeon JPY 203,600 1,957 0.96 12,765 6.27
Metals & Mining 1.84% (3.83%)Daido Steel JPY 85,200 2,672 1.31JFE Holdings JPY 9,600 105 0.05Kobe Steel JPY 72,800 387 0.19Nippon Denko JPY 408,500 581 0.29 3,745 1.84
Paper & Forest Products 0.56% (0.55%)Oji Holdings JPY 269,300 1,148 0.56 1,148 0.56Materials total 17,658 8.67
Real Estate 4.95% (5.09%)Equity Real Estate Investment Trusts (REITs) 0.00% (0.43%)
Real Estate Management & Development 4.95% (4.66%)Daiwa House Industry JPY 224,300 5,267 2.58Tokyu Fudosan Holdings JPY 1,007,400 4,820 2.37 10,087 4.95Real Estate total 10,087 4.95
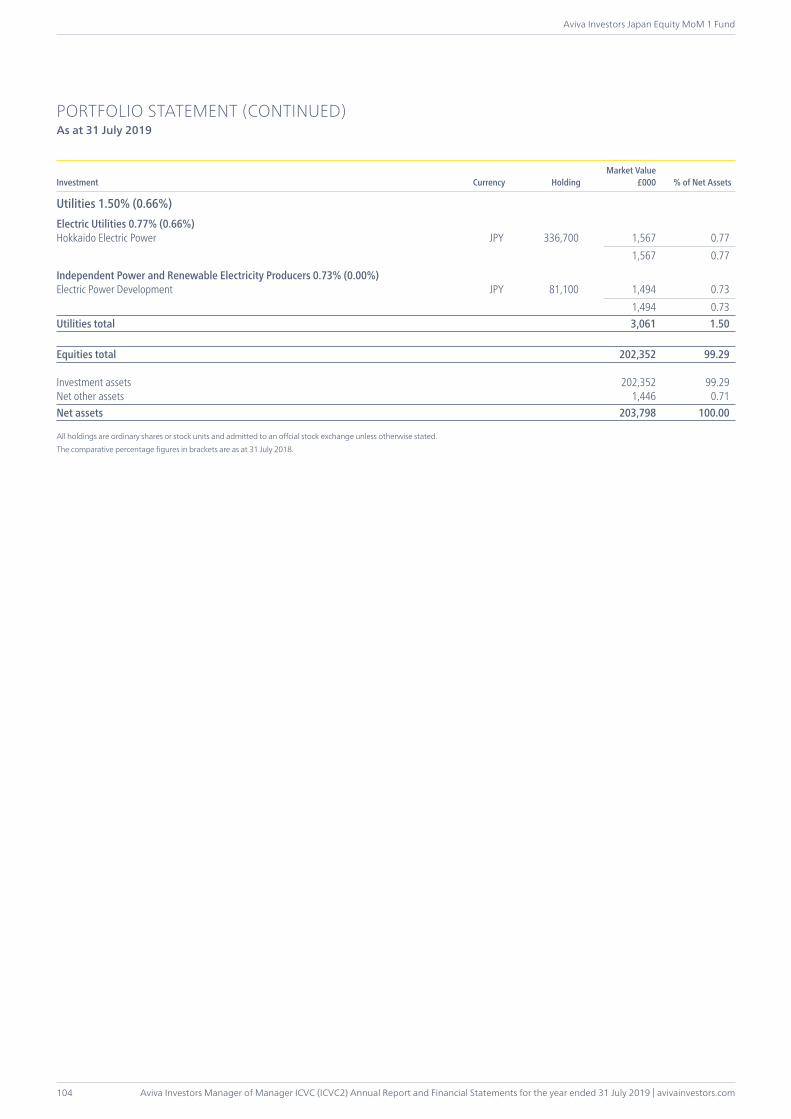
Aviva Investors Manager of Manager ICVC (ICVC2) Annual Report and Financial Statements for the year ended 31 July 2019 | avivainvestors.com
Aviva Investors Japan Equity MoM 1 Fund
104
PORTFOLIO STATEMENT (CONTINUED)As at 31 July 2019
Investment Currency HoldingMarket Value
£000 % of Net Assets
Utilities 1.50% (0.66%)Electric Utilities 0.77% (0.66%)Hokkaido Electric Power JPY 336,700 1,567 0.77 1,567 0.77
Independent Power and Renewable Electricity Producers 0.73% (0.00%)Electric Power Development JPY 81,100 1,494 0.73 1,494 0.73Utilities total 3,061 1.50
Equities total 202,352 99.29
Investment assets 202,352 99.29Net other assets 1,446 0.71Net assets 203,798 100.00
All holdings are ordinary shares or stock units and admitted to an offcial stock exchange unless otherwise stated.The comparative percentage figures in brackets are as at 31 July 2018.
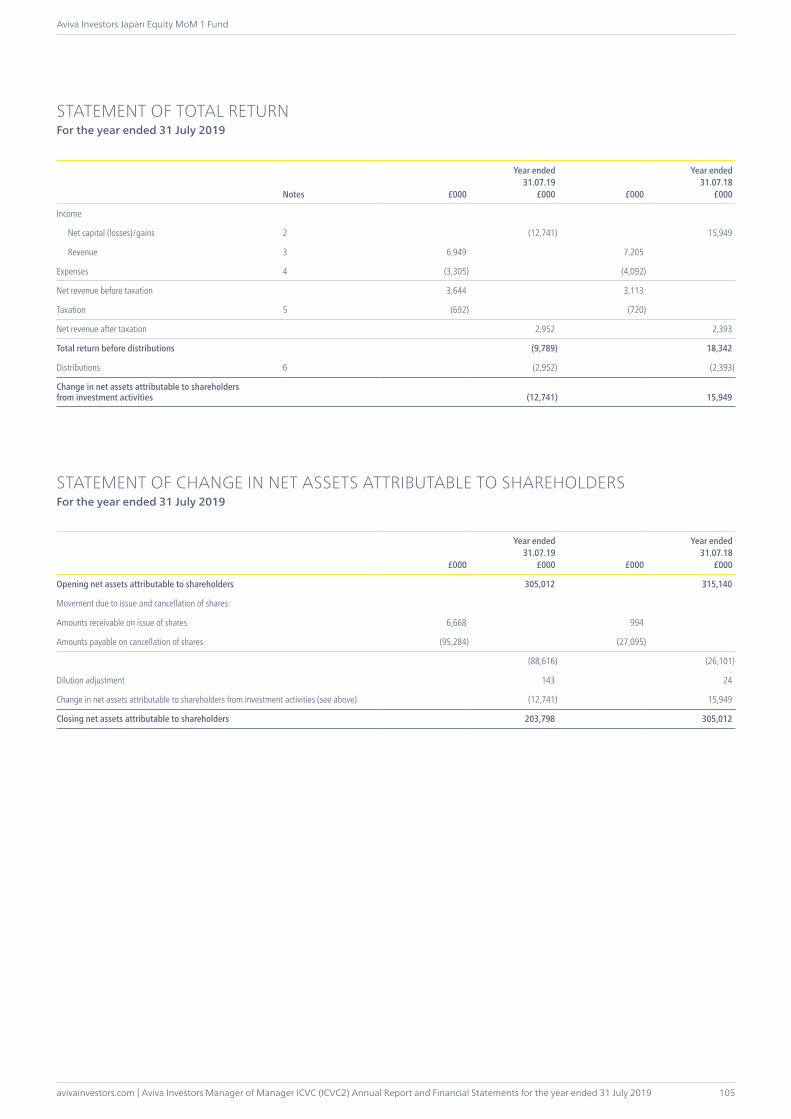
avivainvestors.com | Aviva Investors Manager of Manager ICVC (ICVC2) Annual Report and Financial Statements for the year ended 31 July 2019
Aviva Investors Japan Equity MoM 1 Fund
105
STATEMENT OF TOTAL RETURNFor the year ended 31 July 2019
Notes £000
Year ended31.07.19
£000 £000
Year ended31.07.18
£000
Income
Net capital (losses)/gains 2 (12,741) 15,949
Revenue 3 6,949 7,205
Expenses 4 (3,305) (4,092)
Net revenue before taxation 3,644 3,113
Taxation 5 (692) (720)
Net revenue after taxation 2,952 2,393
Total return before distributions (9,789) 18,342
Distributions 6 (2,952) (2,393)
Change in net assets attributable to shareholders from investment activities (12,741) 15,949
STATEMENT OF CHANGE IN NET ASSETS ATTRIBUTABLE TO SHAREHOLDERSFor the year ended 31 July 2019
£000
Year ended31.07.19
£000 £000
Year ended31.07.18
£000
Opening net assets attributable to shareholders 305,012 315,140
Movement due to issue and cancellation of shares:
Amounts receivable on issue of shares 6,668 994
Amounts payable on cancellation of shares (95,284) (27,095)
(88,616) (26,101)
Dilution adjustment 143 24
Change in net assets attributable to shareholders from investment activities (see above) (12,741) 15,949
Closing net assets attributable to shareholders 203,798 305,012

Aviva Investors Manager of Manager ICVC (ICVC2) Annual Report and Financial Statements for the year ended 31 July 2019 | avivainvestors.com
Aviva Investors Japan Equity MoM 1 Fund
106
BALANCE SHEETAs at 31 July 2019
Notes
As at31.07.19
£000
As at31.07.18
£000
Assets:
Investments 202,352 304,110
Current assets:
Debtors 8 282 385
Cash and bank balances 9 2,697 2,406
Total assets 205,331 306,901
Liabilities:
Creditors:
Distribution payable (1,305) (1,561)
Other creditors 10 (228) (328)
Total liabilities (1,533) (1,889)
Net assets attributable to shareholders 203,798 305,012

avivainvestors.com | Aviva Investors Manager of Manager ICVC (ICVC2) Annual Report and Financial Statements for the year ended 31 July 2019
Aviva Investors Japan Equity MoM 1 Fund
107
1 Accounting basis and policiesPlease see pages 6 to 8 for accounting basis and policies.
2 Net capital (losses)/gains
Year ended31.07.19
£000
Year ended31.07.18
£000
Net capital (losses)/gains on investment during the year comprise:
Compensation items 5 –
Currency (losses)/gains (141) 38
Expenses relating to the purchase and sale of investments – (31)
Non-derivative securities (losses)/gains (12,605) 15,942
Net capital (losses)/gains (12,741) 15,949
3 Revenue
Year ended31.07.19
£000
Year ended31.07.18
£000
Bank and deposit interest 6 2
Overseas dividends 6,943 7,101
Property income distributions – 102
Total revenue 6,949 7,205
4 Expenses
Year ended31.07.19
£000
Year ended31.07.18
£000
Payable to the Authorised Corporate Director (“ACD”), associates of the ACD or agents of either of them:
Fund Management Fee/ACD’s periodic charge* 3,302 4,003
3,302 4,003
Payable to the Depositary, associates of the Depositary or agents of either of them:
Depositary’s fee – 32
Interest payable 3 2
Safe custody fee – 35
3 69
Other expenses:
Audit fee** – 9
Printing & postage expenses – 3
Statement fees – 8
– 20
Total expenses 3,305 4,092
* From 4 June 2018 the Fund changed to a single fixed charge known as the Fund Management Fee (FMF). The FMF covers fees and expenses in relation to the operation and administration of the Company and the Fund.** The audit fee was £8,733 (2018: £8,562) net of VAT. With effect from 4 June 2018, the audit fee was no longer accrued for separately and now forms part of the FMF.
NOTES TO THE FINANCIAL STATEMENTS
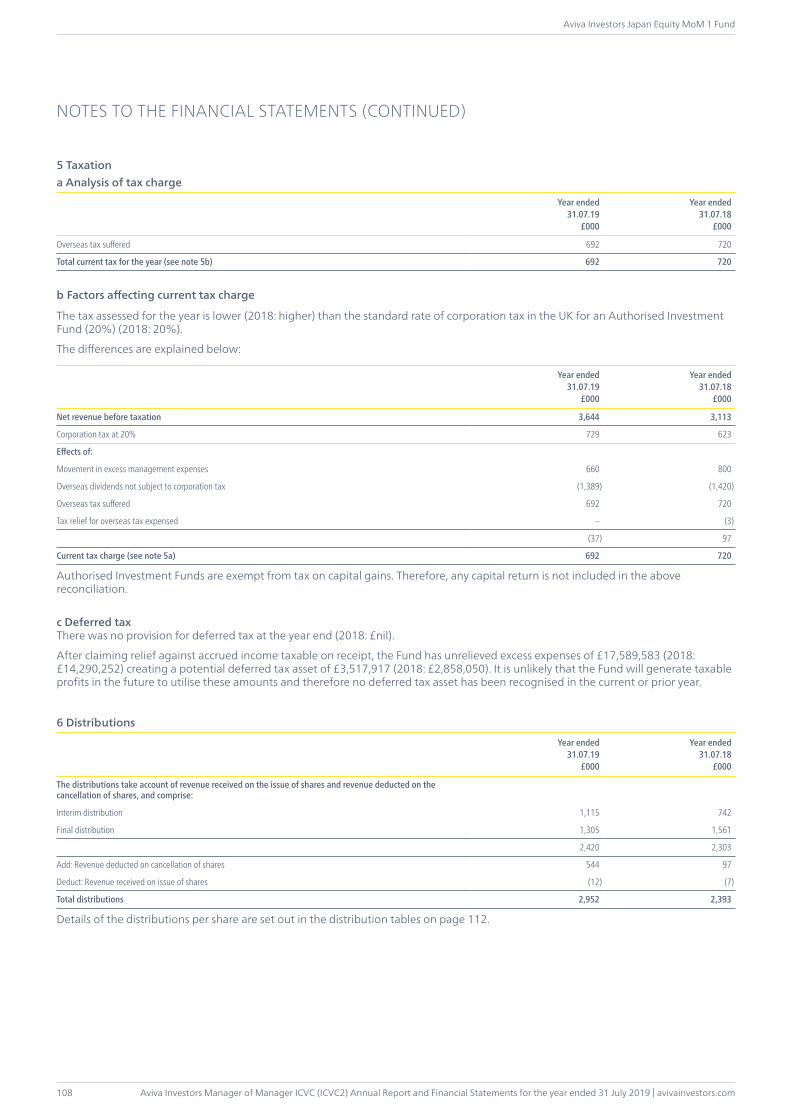
Aviva Investors Manager of Manager ICVC (ICVC2) Annual Report and Financial Statements for the year ended 31 July 2019 | avivainvestors.com
Aviva Investors Japan Equity MoM 1 Fund
108
5 Taxationa Analysis of tax charge
Year ended31.07.19
£000
Year ended31.07.18
£000
Overseas tax suffered 692 720
Total current tax for the year (see note 5b) 692 720
b Factors affecting current tax charge
The tax assessed for the year is lower (2018: higher) than the standard rate of corporation tax in the UK for an Authorised Investment Fund (20%) (2018: 20%).
The differences are explained below:
Year ended31.07.19
£000
Year ended31.07.18
£000
Net revenue before taxation 3,644 3,113
Corporation tax at 20% 729 623
Effects of:
Movement in excess management expenses 660 800
Overseas dividends not subject to corporation tax (1,389) (1,420)
Overseas tax suffered 692 720
Tax relief for overseas tax expensed – (3)
(37) 97
Current tax charge (see note 5a) 692 720
Authorised Investment Funds are exempt from tax on capital gains. Therefore, any capital return is not included in the above reconciliation.
c Deferred taxThere was no provision for deferred tax at the year end (2018: £nil).
After claiming relief against accrued income taxable on receipt, the Fund has unrelieved excess expenses of £17,589,583 (2018: £14,290,252) creating a potential deferred tax asset of £3,517,917 (2018: £2,858,050). It is unlikely that the Fund will generate taxable profits in the future to utilise these amounts and therefore no deferred tax asset has been recognised in the current or prior year.
6 Distributions
Year ended31.07.19
£000
Year ended31.07.18
£000
The distributions take account of revenue received on the issue of shares and revenue deducted on the cancellation of shares, and comprise:
Interim distribution 1,115 742
Final distribution 1,305 1,561
2,420 2,303
Add: Revenue deducted on cancellation of shares 544 97
Deduct: Revenue received on issue of shares (12) (7)
Total distributions 2,952 2,393
Details of the distributions per share are set out in the distribution tables on page 112.
NOTES TO THE FINANCIAL STATEMENTS (CONTINUED)
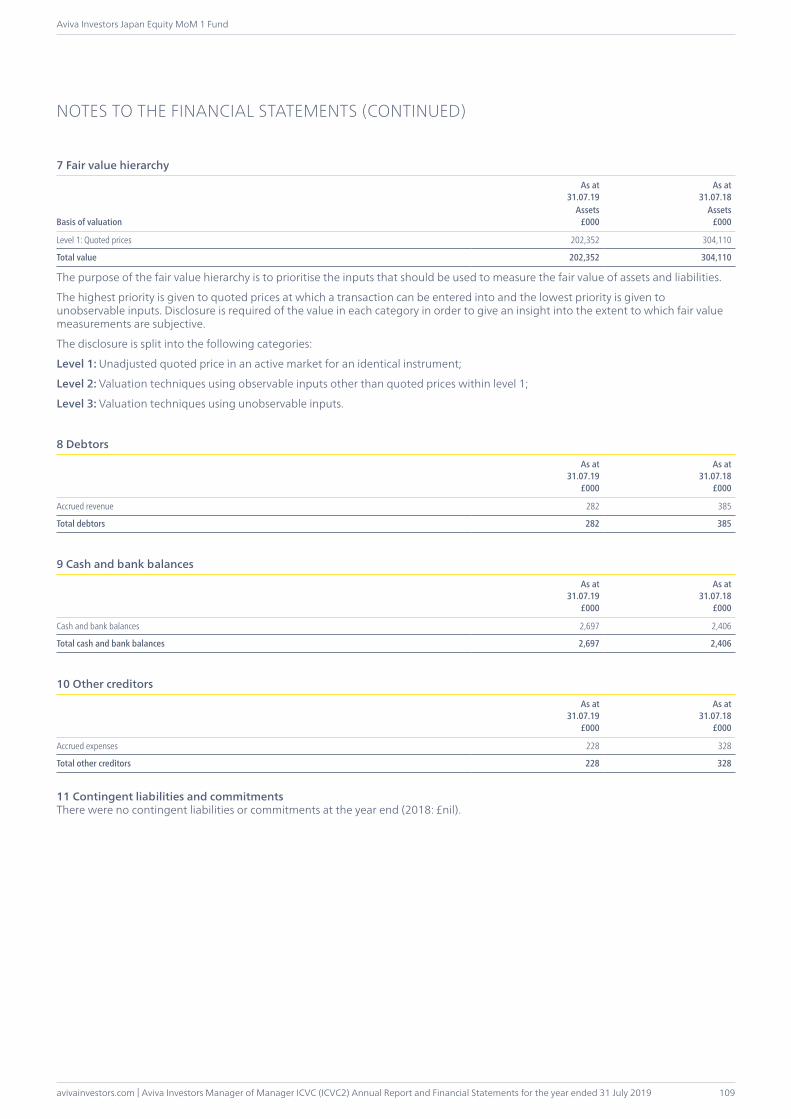
avivainvestors.com | Aviva Investors Manager of Manager ICVC (ICVC2) Annual Report and Financial Statements for the year ended 31 July 2019
Aviva Investors Japan Equity MoM 1 Fund
109
7 Fair value hierarchy
Basis of valuation
As at31.07.19
As at31.07.18
Assets£000
Assets£000
Level 1: Quoted prices 202,352 304,110
Total value 202,352 304,110
The purpose of the fair value hierarchy is to prioritise the inputs that should be used to measure the fair value of assets and liabilities.
The highest priority is given to quoted prices at which a transaction can be entered into and the lowest priority is given to unobservable inputs. Disclosure is required of the value in each category in order to give an insight into the extent to which fair value measurements are subjective.
The disclosure is split into the following categories:
Level 1: Unadjusted quoted price in an active market for an identical instrument;
Level 2: Valuation techniques using observable inputs other than quoted prices within level 1;
Level 3: Valuation techniques using unobservable inputs.
8 Debtors
As at31.07.19
£000
As at31.07.18
£000
Accrued revenue 282 385
Total debtors 282 385
9 Cash and bank balances
As at31.07.19
£000
As at31.07.18
£000
Cash and bank balances 2,697 2,406
Total cash and bank balances 2,697 2,406
10 Other creditors
As at31.07.19
£000
As at31.07.18
£000
Accrued expenses 228 328
Total other creditors 228 328
11 Contingent liabilities and commitmentsThere were no contingent liabilities or commitments at the year end (2018: £nil).
NOTES TO THE FINANCIAL STATEMENTS (CONTINUED)
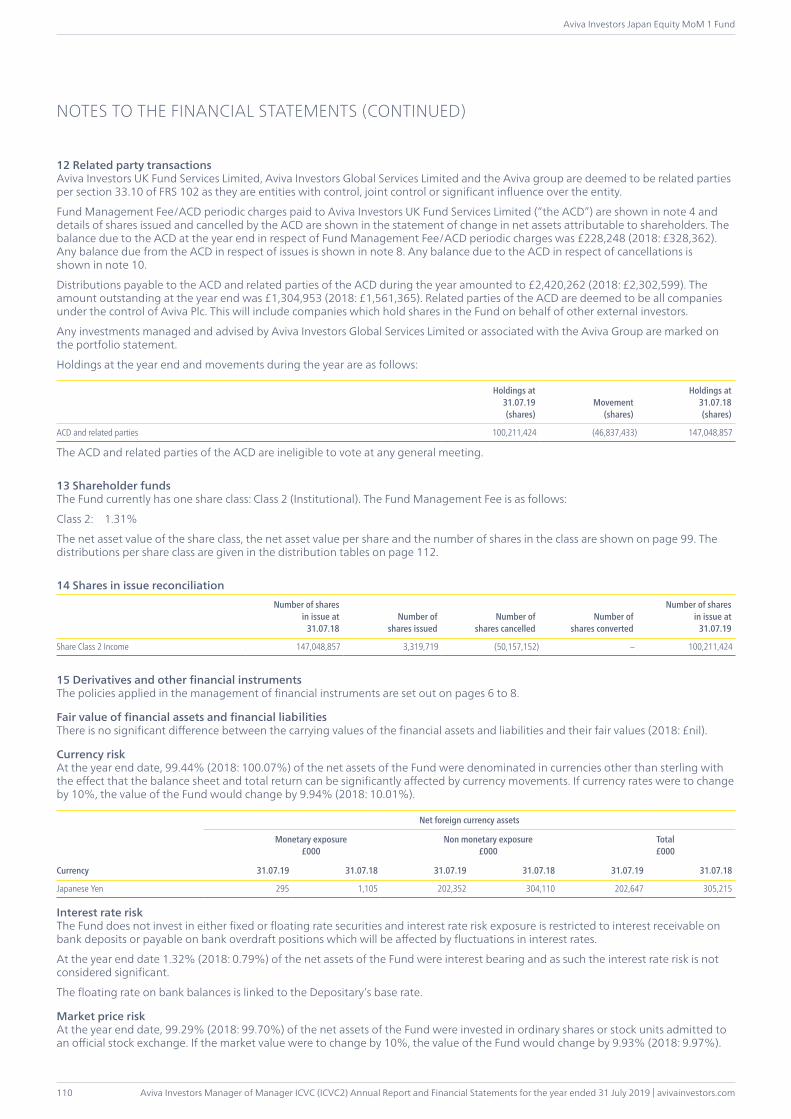
Aviva Investors Manager of Manager ICVC (ICVC2) Annual Report and Financial Statements for the year ended 31 July 2019 | avivainvestors.com
Aviva Investors Japan Equity MoM 1 Fund
110
12 Related party transactionsAviva Investors UK Fund Services Limited, Aviva Investors Global Services Limited and the Aviva group are deemed to be related parties per section 33.10 of FRS 102 as they are entities with control, joint control or significant influence over the entity.
Fund Management Fee/ACD periodic charges paid to Aviva Investors UK Fund Services Limited (“the ACD”) are shown in note 4 and details of shares issued and cancelled by the ACD are shown in the statement of change in net assets attributable to shareholders. The balance due to the ACD at the year end in respect of Fund Management Fee/ACD periodic charges was £228,248 (2018: £328,362). Any balance due from the ACD in respect of issues is shown in note 8. Any balance due to the ACD in respect of cancellations is shown in note 10.
Distributions payable to the ACD and related parties of the ACD during the year amounted to £2,420,262 (2018: £2,302,599). The amount outstanding at the year end was £1,304,953 (2018: £1,561,365). Related parties of the ACD are deemed to be all companies under the control of Aviva Plc. This will include companies which hold shares in the Fund on behalf of other external investors.
Any investments managed and advised by Aviva Investors Global Services Limited or associated with the Aviva Group are marked on the portfolio statement.
Holdings at the year end and movements during the year are as follows:
Holdings at31.07.19(shares)
Movement(shares)
Holdings at31.07.18(shares)
ACD and related parties 100,211,424 (46,837,433) 147,048,857
The ACD and related parties of the ACD are ineligible to vote at any general meeting.
13 Shareholder fundsThe Fund currently has one share class: Class 2 (Institutional). The Fund Management Fee is as follows:
Class 2: 1.31%
The net asset value of the share class, the net asset value per share and the number of shares in the class are shown on page 99. The distributions per share class are given in the distribution tables on page 112.
14 Shares in issue reconciliationNumber of shares
in issue at31.07.18
Number ofshares issued
Number ofshares cancelled
Number ofshares converted
Number of shares in issue at
31.07.19
Share Class 2 Income 147,048,857 3,319,719 (50,157,152) – 100,211,424
15 Derivatives and other financial instrumentsThe policies applied in the management of financial instruments are set out on pages 6 to 8.
Fair value of financial assets and financial liabilitiesThere is no significant difference between the carrying values of the financial assets and liabilities and their fair values (2018: £nil).
Currency riskAt the year end date, 99.44% (2018: 100.07%) of the net assets of the Fund were denominated in currencies other than sterling with the effect that the balance sheet and total return can be significantly affected by currency movements. If currency rates were to change by 10%, the value of the Fund would change by 9.94% (2018: 10.01%).
Currency
Net foreign currency assets
Monetary exposure£000
Non monetary exposure£000
Total£000
31.07.19 31.07.18 31.07.19 31.07.18 31.07.19 31.07.18
Japanese Yen 295 1,105 202,352 304,110 202,647 305,215
Interest rate riskThe Fund does not invest in either fixed or floating rate securities and interest rate risk exposure is restricted to interest receivable on bank deposits or payable on bank overdraft positions which will be affected by fluctuations in interest rates.
At the year end date 1.32% (2018: 0.79%) of the net assets of the Fund were interest bearing and as such the interest rate risk is not considered significant.
The floating rate on bank balances is linked to the Depositary’s base rate.
Market price riskAt the year end date, 99.29% (2018: 99.70%) of the net assets of the Fund were invested in ordinary shares or stock units admitted to an official stock exchange. If the market value were to change by 10%, the value of the Fund would change by 9.93% (2018: 9.97%).
NOTES TO THE FINANCIAL STATEMENTS (CONTINUED)
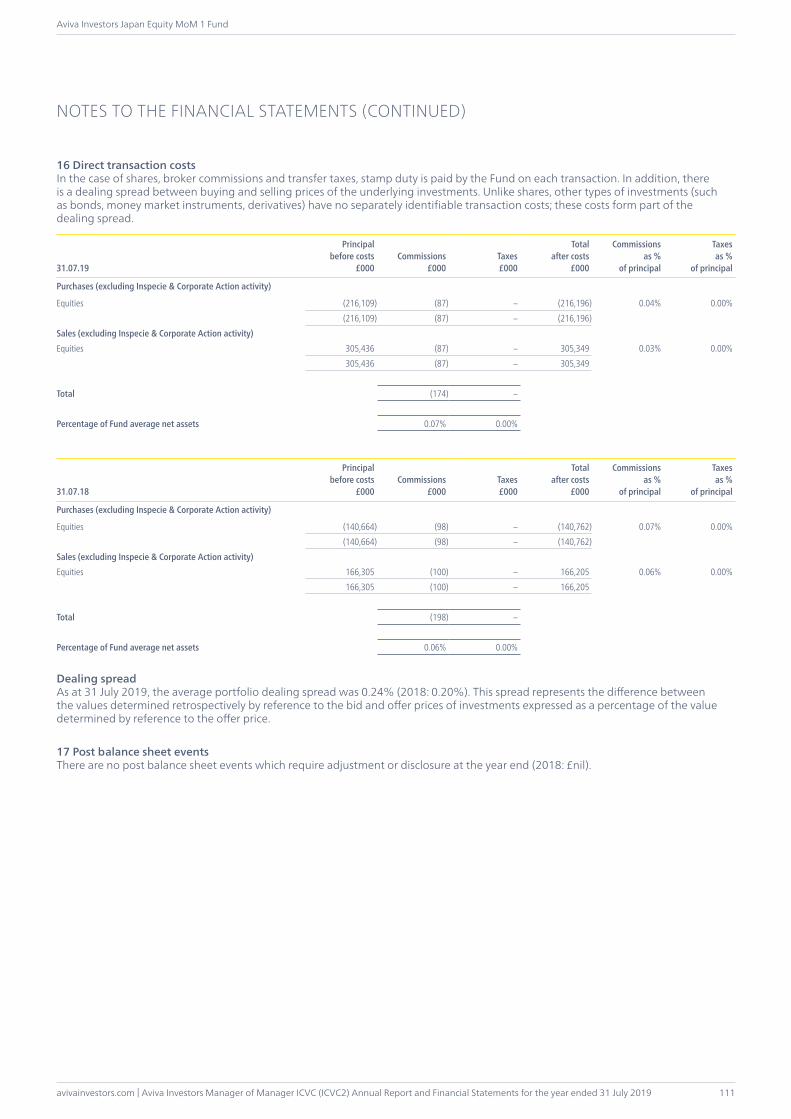
avivainvestors.com | Aviva Investors Manager of Manager ICVC (ICVC2) Annual Report and Financial Statements for the year ended 31 July 2019
Aviva Investors Japan Equity MoM 1 Fund
111
16 Direct transaction costs In the case of shares, broker commissions and transfer taxes, stamp duty is paid by the Fund on each transaction. In addition, there is a dealing spread between buying and selling prices of the underlying investments. Unlike shares, other types of investments (such as bonds, money market instruments, derivatives) have no separately identifiable transaction costs; these costs form part of the dealing spread.
31.07.19
Principalbefore costs
£000Commissions
£000Taxes£000
Totalafter costs
£000
Commissions as %
of principal
Taxes as %
of principal
Purchases (excluding Inspecie & Corporate Action activity)
Equities (216,109) (87) – (216,196) 0.04% 0.00%(216,109) (87) – (216,196)
Sales (excluding Inspecie & Corporate Action activity)Equities 305,436 (87) – 305,349 0.03% 0.00%
305,436 (87) – 305,349
Total (174) –
Percentage of Fund average net assets 0.07% 0.00%
31.07.18
Principalbefore costs
£000Commissions
£000Taxes£000
Totalafter costs
£000
Commissions as %
of principal
Taxes as %
of principal
Purchases (excluding Inspecie & Corporate Action activity)
Equities (140,664) (98) – (140,762) 0.07% 0.00%(140,664) (98) – (140,762)
Sales (excluding Inspecie & Corporate Action activity)Equities 166,305 (100) – 166,205 0.06% 0.00%
166,305 (100) – 166,205
Total (198) –
Percentage of Fund average net assets 0.06% 0.00%
Dealing spreadAs at 31 July 2019, the average portfolio dealing spread was 0.24% (2018: 0.20%). This spread represents the difference between the values determined retrospectively by reference to the bid and offer prices of investments expressed as a percentage of the value determined by reference to the offer price.
17 Post balance sheet eventsThere are no post balance sheet events which require adjustment or disclosure at the year end (2018: £nil).
NOTES TO THE FINANCIAL STATEMENTS (CONTINUED)

Aviva Investors Manager of Manager ICVC (ICVC2) Annual Report and Financial Statements for the year ended 31 July 2019 | avivainvestors.com
Aviva Investors Japan Equity MoM 1 Fund
112
DISTRIBUTION TABLES
Final distribution payable in pence per share for the six months ended 31 July 2019
Income sharesNet
revenue Equalisation
Final distributionpayable
30 September 2019
Final distributionpaid
30 September 2018
Share Class 2 Group 1 1.3022 – 1.3022 1.0618
Group 2 0.0000 1.3022 1.3022 1.0618
Group 1 shares are those shares purchased at or before 2pm on 31 January 2019.Group 2 shares are those shares purchased after 2pm on 31 January 2019.
Interim distribution paid in pence per share for the six months ended 31 January 2019
Income sharesNet
revenue Equalisation
Interim distributionpaid
31 March 2019
Interim distributionpaid
31 March 2018
Share Class 2 Group 1 0.8213 – 0.8213 0.4947
Group 2 0.8213 0.0000 0.8213 0.4947
Group 1 shares are those shares purchased at or before 2pm on 31 July 2018.Group 2 shares are those shares purchased after 2pm on 31 July 2018.
EqualisationEqualisation applies only to Group 2 shares, in other words shares purchased during the relevant period. It is the average amount of revenue included in the purchase price of all Group 2 shares and is refunded to the holders of these shares as return of capital. Being capital, it is not liable to income tax but must be deducted from the cost of shares for capital gains tax purposes.
avivainvestors.com | Aviva Investors Manager of Manager ICVC (ICVC2) Annual Report and Financial Statements for the year ended 31 July 2019
Aviva Investors EM Equity MoM 1 Fund
113
The Fund closed on 18 May 2019, and will be terminated in due course.
INVESTMENT OBJECTIVELong term capital growth by investing primarily in emerging market equities.
INVESTMENT POLICYThe Fund invested primarily in equity securities listed or traded in emerging markets. Limited exposure to other geographic regions may be possible. The Fund might have invested in any of the following financial instruments in order to achieve its investment objective: equities or securities with equity characteristics, unlisted transferable securities, convertibles, preference shares, warrants, money market instruments, collective investment schemes and deposits.
FUND MANAGER’S REPORTPerformanceOver the period 1 August 2018 to 18 May 2019, the Fund returned 0.46% (net of fees). The Funds benchmark, the MSCI Emerging Markets Index, returned 2.09% over the same period.
ReviewEmerging market equities fell over the period from 1 August 2018 to 18 May 2019. Factors that affected investor confidence included fluctuations in sentiment concerning trade relations between the U.S. and China, as well as indications of a slowdown in global growth and increased political uncertainties in Europe. There were also investor uncertainties about the future direction of U.S. monetary policy. The U.S. Federal Reserve (Fed) raised interest rates in the first half of the period, although later there were indications from the Fed of a more “dovish” stance on interest rate policy.
At the sector level, stock selection in the financials space added value. For example, the portfolio’s position in Brazilian bank Itau Unibanco was beneficial. During the period, the company unveiled results that showed an increase in net interest income and an improvement in the picture on provisions.
Security selection in the consumer discretionary sector had a positive impact. Brazilian department store retailer Lojas Renner made a particularly strong contribution. During the period, the company unveiled results that showed an acceleration in same-store sales growth.
On the negative side, the portfolio’s underweight to the energy sector weighed on relative returns; energy was one of the best-performing sectors in emerging markets over the period.
At the country level, the portfolio’s overweight to Brazil was beneficial, as was security selection here. Stock selection in South Korea also boosted relative returns, as did the portfolio’s underweight to this market. On the negative side, stock selection in Russia hampered relative performance.
OutlookWe believe that economic growth across many developing markets could continue to be higher than in the developed world, with some signs that this gap, which narrowed for five years through 2015, is turning wider. We feel that those countries that push forward with reforms could do well, while countries that do not may struggle. In our view, valuations are not as cheap as they were 12 months ago, but they remain at a slight discount relative to their history and to developed market peers. Our view is that we are likely to see a much more uneven world going forward, with less correlation and greater divergence in performance among countries and in stocks within those countries. We will remain focused on quality companies, as we continue to believe that those leading firms will weather the tough environment and may, in fact, improve their competitive positioning.
Near‐term risks include an escalation of trade war rhetoric or a worse‐than‐expected slowdown in China or a breakdown in its financial system or an unexpected bout of risk aversion due to geopolitical events. A stronger-than-expected U.S. dollar could also pose a risk for these markets. However, we believe that investor concerns may be overdone. The extent of the Chinese growth slowdown remains a key question, but we think policymakers have the tools to manage the transition and slowdown that is occurring in China.
Speculation and expectations have shifted from further interest rate hikes from the Fed to possible cuts, and as had been widely expected, U.S. rates were reduced at the end of July. In our view, interest rate cuts by the Fed could be supportive for the emerging market asset class. Regardless, we believe most emerging market countries are in better shape today, with improved current account positions; higher foreign exchange reserves; higher real interest rates; and currencies that, in most cases, are well supported by these macro improvements.
Overall, we think the environment may remain complex, but in our view, this could provide a good opportunity for active investors to take advantage of valuation anomalies. We believe the emerging consumer remains a powerful force and could continue to drive strong growth in a variety of industries and companies, including retail, banking, technology, and the internet. With investors skeptical, valuations attractive, and fundamentals bottoming, we think the environment appears positive for emerging markets equities and ripe for stock picking.
September 2019* Fund performance figures – share class 2, source Lipper Hindight, net of fees, net income reinvested in GBP. Unless otherwise indicated, all data has been sourced by T Rowe Price International.As noted above, the performance figures in this commentary have been sourced from an external party and are based on published prices. The performance figures quoted in the comparative table on page 115 are based on the net asset value per the published accounts and may be different due to post year end accounting adjustments. Any opinions expressed are those of the Fund manager. They should not be viewed as a guarantee of a return from an investment in the Funds. The content of the commentary should not be viewed as a recommendation to invest nor to buy or sell stocks. Past performance is not a guide to future performance. The value of an investment in the Fund and any income from it may go down as well as up, and the investor may not get back the original amount invested.
AVIVA INVESTORS EM EQUITY MOM 1 FUND

Aviva Investors Manager of Manager ICVC (ICVC2) Annual Report and Financial Statements for the year ended 31 July 2019 | avivainvestors.com
Aviva Investors EM Equity MoM 1 Fund
114
AVIVA INVESTORS EM EQUITY MOM 1 FUND (CONTINUED)
Material Portfolio ChangesPurchases Sales
China Resources Beer Holdings Tencent Holdings
First Abu Dhabi Bank Alibaba Group Holding, ADR
Alibaba Group Holding, ADR Taiwan Semiconductor
SK Hynix Samsung Electronics
LG Household & Health Care Itau Unibanco Holding Preference
Samsung Electronics HDFC Bank, ADR
StoneCo ‘A’ Sberbank of Russia, ADR
Tencent Holdings LG Household & Health Care
B3 SA – Brasil Bolsa Balcao Ping An Insurance Group Co. of China ‘H’
Suzano Papel e Celulose Largan Precision
Synthetic Risk and Reward Indicator Investment risks have been removed as the Fund closed on 18 May 2019.

avivainvestors.com | Aviva Investors Manager of Manager ICVC (ICVC2) Annual Report and Financial Statements for the year ended 31 July 2019
Aviva Investors EM Equity MoM 1 Fund
115
COMPARATIVE TABLE
Class 2 Income2019§
p per share2018
p per share2017
p per share
Change in net assets per shareOpening net asset value per share 511.78 472.88 386.67
Return before operating charges† (505.83) 47.70 94.14Operating charges (5.69) (7.01) (6.04)Return after operating charges† (511.52) 40.69 88.10
Distributions (0.26) (1.79) (1.89)
Closing net asset value per share – 511.78 472.88
† after direct transaction costs of (1.07) (0.66) (0.60)
PerformanceReturn after charges – 8.60% 22.78%
Other informationClosing net asset value (£000) – 78,646 113,339Closing number of shares – 15,367,112 23,967,847Operating charges (%)‡ 1.46% 1.38% 1.41%Direct transaction costs (%)# 0.22% 0.13% 0.14%
Prices≈
Highest share price 576.59 535.49 477.59Lowest share price 439.53 470.44 380.39
‡ The operating charges are calculated on an ex-post basis and as such may differ from the Ongoing Charge Figure where:(a) The Ongoing Charge has been annualised for a share class that has not yet been open for a full year.# The direct transaction costs have been stated after deducting, in the case of single-priced funds, the proportion of the amounts collected from dilution adjustments or dilution levies that relates to direct transaction costs and, in the case of dual-priced funds, the amounts collected in relation to direct transaction costs added to, or subtracted from, the valuations by virtue of COLL 6.3.6 G (4).≈ The high and low prices disclosed are the high and low prices for the accounting period and not the calendar year and are based on published prices. The net asset value per share price is based on the net asset value in the published accounts and may be different due to post year end accounting adjustments.§ Up to 18 May 2019 (date the Fund closed).
Ongoing Charges Figure*Share class 31.07.19 31.07.18
Class 2 1.46% 1.46%
* The Ongoing Charges Figure (OCF) is calculated as the ratio of the total ongoing charges to the average net asset value of the Fund over the year. The OCF is made up of the Fund Management Fee and, where a fund invests a substantial portion of its assets in other funds, an amount for the pro-rated charges of those other funds (referred to as “synthetic charges” or the “synthetic” part of the ongoing charge). The figure for ongoing charges excludes performance fees and portfolio transaction costs, except in the case of an entry/exit charge paid by the Fund when buying or selling shares/units in another collective investment scheme.Please remember that past performance is not a guide to future performance and it might not be repeated. The value of investments and the revenue from them may go down as well as up and investors may not get back the amount originally invested. Because of this, you are not certain to make a profit on your investments and you may lose money.
Portfolio StatementAs the Fund closed on 18 May 2019, there were no investments as at 31 July 2019.
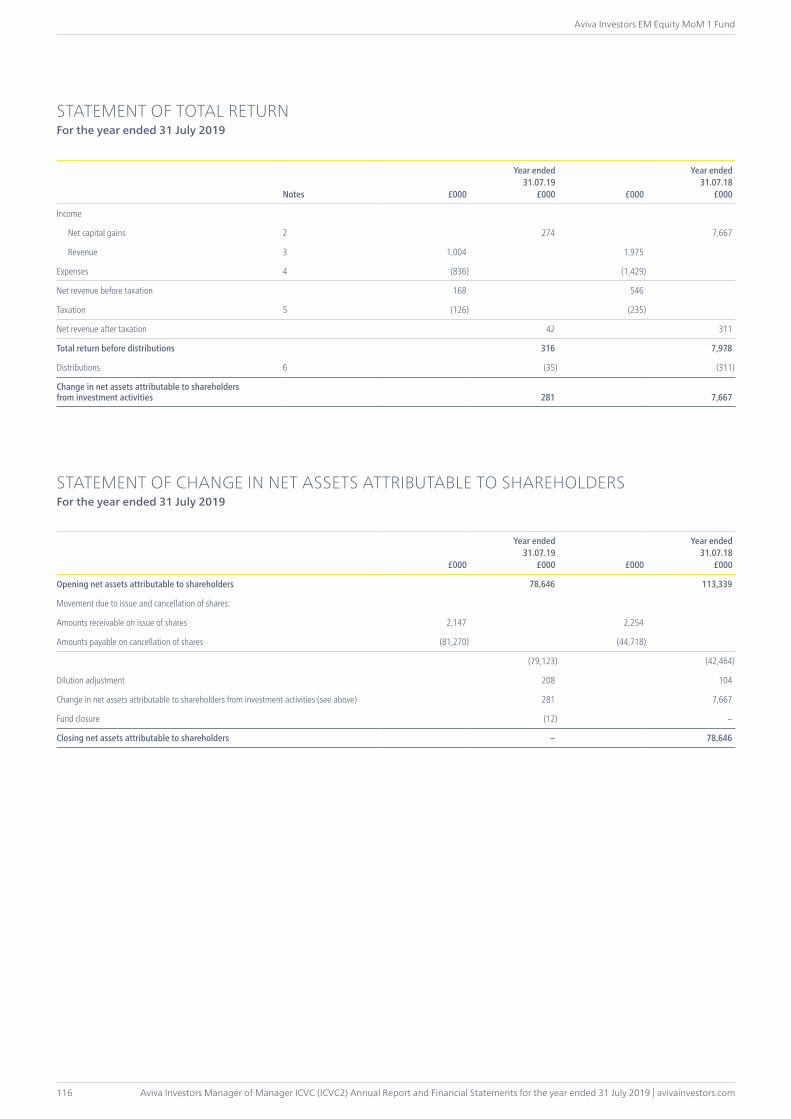
Aviva Investors Manager of Manager ICVC (ICVC2) Annual Report and Financial Statements for the year ended 31 July 2019 | avivainvestors.com
Aviva Investors EM Equity MoM 1 Fund
116
STATEMENT OF TOTAL RETURNFor the year ended 31 July 2019
Notes £000
Year ended31.07.19
£000 £000
Year ended31.07.18
£000
Income
Net capital gains 2 274 7,667
Revenue 3 1,004 1,975
Expenses 4 (836) (1,429)
Net revenue before taxation 168 546
Taxation 5 (126) (235)
Net revenue after taxation 42 311
Total return before distributions 316 7,978
Distributions 6 (35) (311)
Change in net assets attributable to shareholders from investment activities 281 7,667
STATEMENT OF CHANGE IN NET ASSETS ATTRIBUTABLE TO SHAREHOLDERSFor the year ended 31 July 2019
£000
Year ended31.07.19
£000 £000
Year ended31.07.18
£000
Opening net assets attributable to shareholders 78,646 113,339
Movement due to issue and cancellation of shares:
Amounts receivable on issue of shares 2,147 2,254
Amounts payable on cancellation of shares (81,270) (44,718)
(79,123) (42,464)
Dilution adjustment 208 104
Change in net assets attributable to shareholders from investment activities (see above) 281 7,667
Fund closure (12) –
Closing net assets attributable to shareholders – 78,646
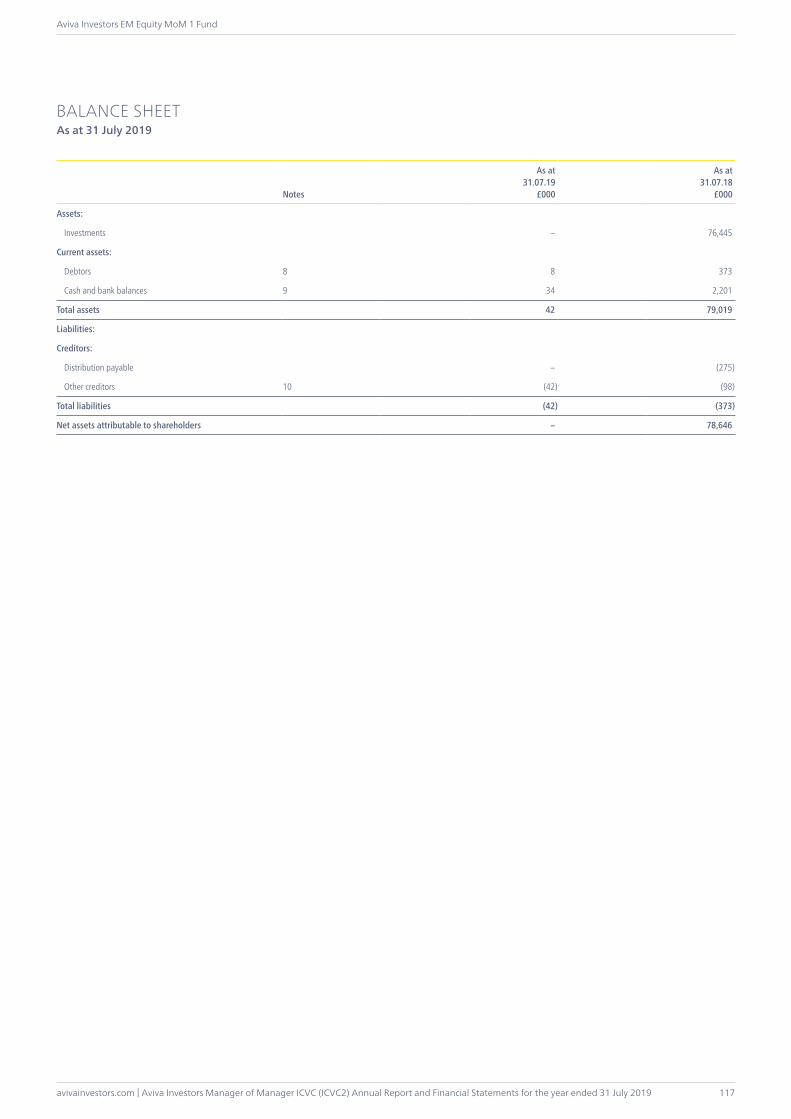
avivainvestors.com | Aviva Investors Manager of Manager ICVC (ICVC2) Annual Report and Financial Statements for the year ended 31 July 2019
Aviva Investors EM Equity MoM 1 Fund
117
BALANCE SHEETAs at 31 July 2019
Notes
As at31.07.19
£000
As at31.07.18
£000
Assets:
Investments – 76,445
Current assets:
Debtors 8 8 373
Cash and bank balances 9 34 2,201
Total assets 42 79,019
Liabilities:
Creditors:
Distribution payable – (275)
Other creditors 10 (42) (98)
Total liabilities (42) (373)
Net assets attributable to shareholders – 78,646
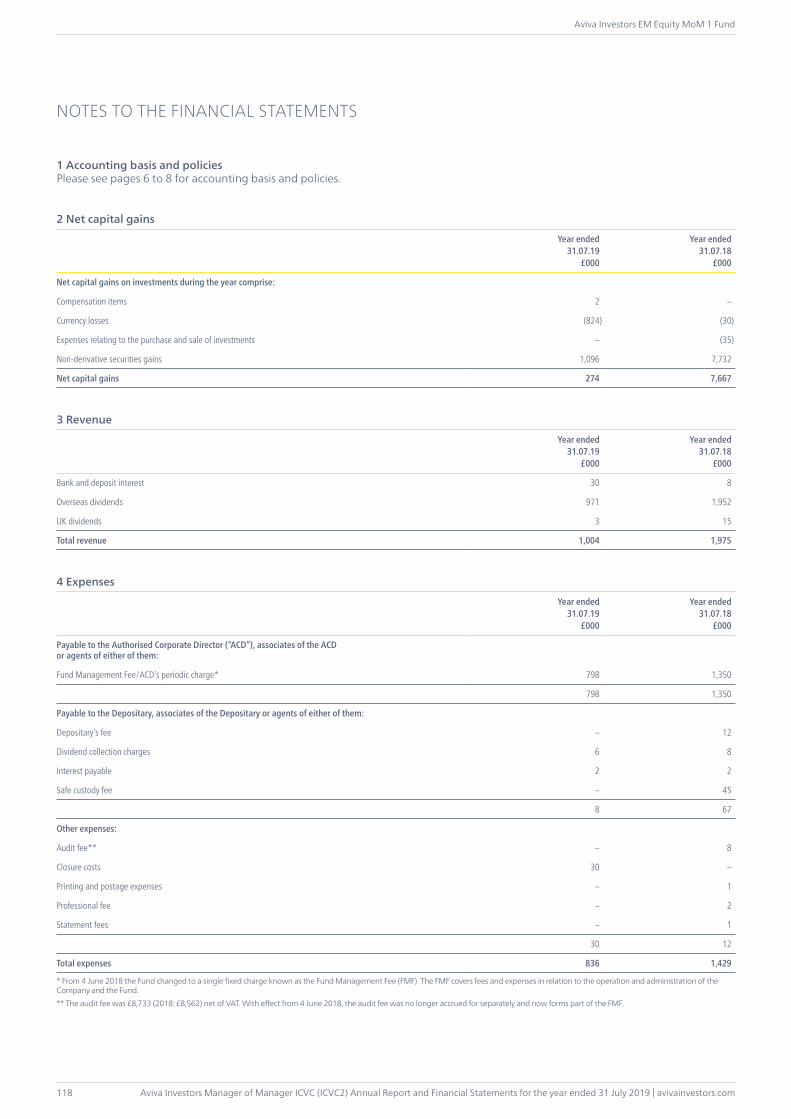
Aviva Investors Manager of Manager ICVC (ICVC2) Annual Report and Financial Statements for the year ended 31 July 2019 | avivainvestors.com
Aviva Investors EM Equity MoM 1 Fund
118
1 Accounting basis and policiesPlease see pages 6 to 8 for accounting basis and policies.
2 Net capital gains
Year ended31.07.19
£000
Year ended31.07.18
£000
Net capital gains on investments during the year comprise:
Compensation items 2 –
Currency losses (824) (30)
Expenses relating to the purchase and sale of investments – (35)
Non-derivative securities gains 1,096 7,732
Net capital gains 274 7,667
3 Revenue
Year ended31.07.19
£000
Year ended31.07.18
£000
Bank and deposit interest 30 8
Overseas dividends 971 1,952
UK dividends 3 15
Total revenue 1,004 1,975
4 Expenses
Year ended31.07.19
£000
Year ended31.07.18
£000
Payable to the Authorised Corporate Director (“ACD”), associates of the ACD or agents of either of them:
Fund Management Fee/ACD’s periodic charge* 798 1,350
798 1,350
Payable to the Depositary, associates of the Depositary or agents of either of them:
Depositary’s fee – 12
Dividend collection charges 6 8
Interest payable 2 2
Safe custody fee – 45
8 67
Other expenses:
Audit fee** – 8
Closure costs 30 –
Printing and postage expenses – 1
Professional fee – 2
Statement fees – 1
30 12
Total expenses 836 1,429
* From 4 June 2018 the Fund changed to a single fixed charge known as the Fund Management Fee (FMF). The FMF covers fees and expenses in relation to the operation and administration of the Company and the Fund.** The audit fee was £8,733 (2018: £8,562) net of VAT. With effect from 4 June 2018, the audit fee was no longer accrued for separately and now forms part of the FMF.
NOTES TO THE FINANCIAL STATEMENTS
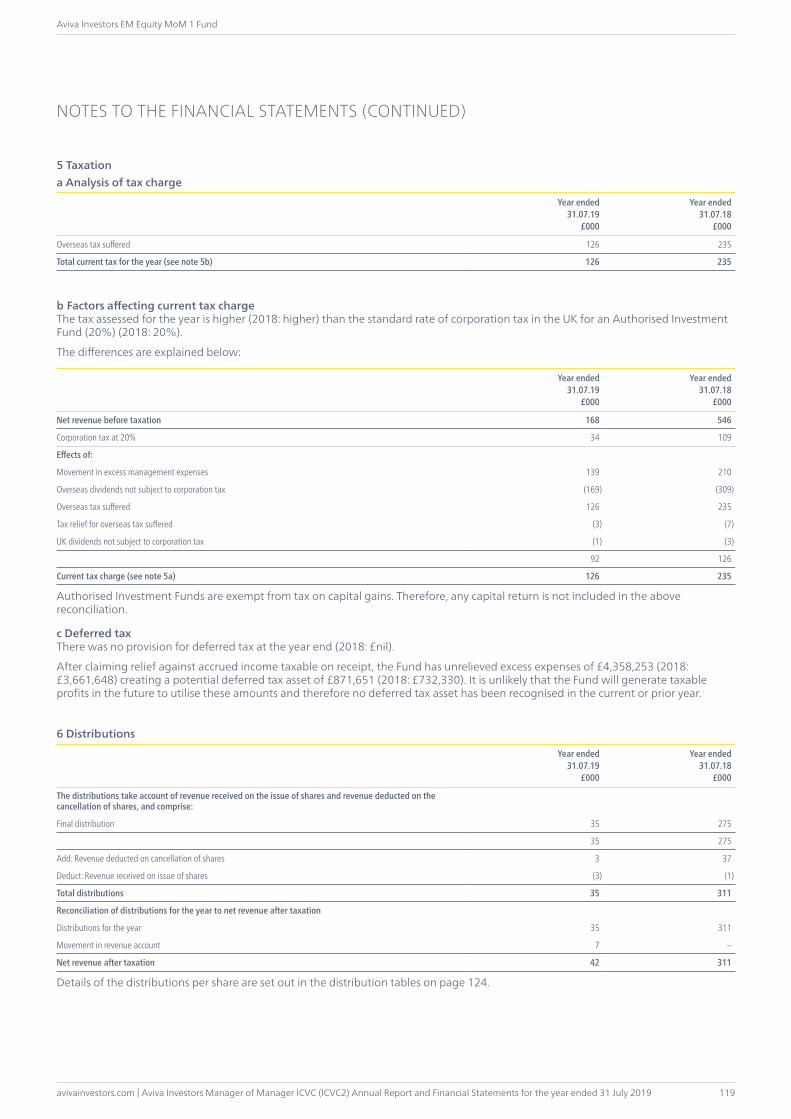
avivainvestors.com | Aviva Investors Manager of Manager ICVC (ICVC2) Annual Report and Financial Statements for the year ended 31 July 2019
Aviva Investors EM Equity MoM 1 Fund
119
5 Taxationa Analysis of tax charge
Year ended31.07.19
£000
Year ended31.07.18
£000
Overseas tax suffered 126 235
Total current tax for the year (see note 5b) 126 235
b Factors affecting current tax chargeThe tax assessed for the year is higher (2018: higher) than the standard rate of corporation tax in the UK for an Authorised Investment Fund (20%) (2018: 20%).
The differences are explained below:
Year ended31.07.19
£000
Year ended31.07.18
£000
Net revenue before taxation 168 546
Corporation tax at 20% 34 109
Effects of:
Movement in excess management expenses 139 210
Overseas dividends not subject to corporation tax (169) (309)
Overseas tax suffered 126 235
Tax relief for overseas tax suffered (3) (7)
UK dividends not subject to corporation tax (1) (3)
92 126
Current tax charge (see note 5a) 126 235
Authorised Investment Funds are exempt from tax on capital gains. Therefore, any capital return is not included in the above reconciliation.
c Deferred taxThere was no provision for deferred tax at the year end (2018: £nil).
After claiming relief against accrued income taxable on receipt, the Fund has unrelieved excess expenses of £4,358,253 (2018: £3,661,648) creating a potential deferred tax asset of £871,651 (2018: £732,330). It is unlikely that the Fund will generate taxable profits in the future to utilise these amounts and therefore no deferred tax asset has been recognised in the current or prior year.
6 Distributions
Year ended31.07.19
£000
Year ended31.07.18
£000
The distributions take account of revenue received on the issue of shares and revenue deducted on the cancellation of shares, and comprise:
Final distribution 35 275
35 275
Add: Revenue deducted on cancellation of shares 3 37
Deduct: Revenue received on issue of shares (3) (1)
Total distributions 35 311
Reconciliation of distributions for the year to net revenue after taxation
Distributions for the year 35 311
Movement in revenue account 7 –
Net revenue after taxation 42 311
Details of the distributions per share are set out in the distribution tables on page 124.
NOTES TO THE FINANCIAL STATEMENTS (CONTINUED)
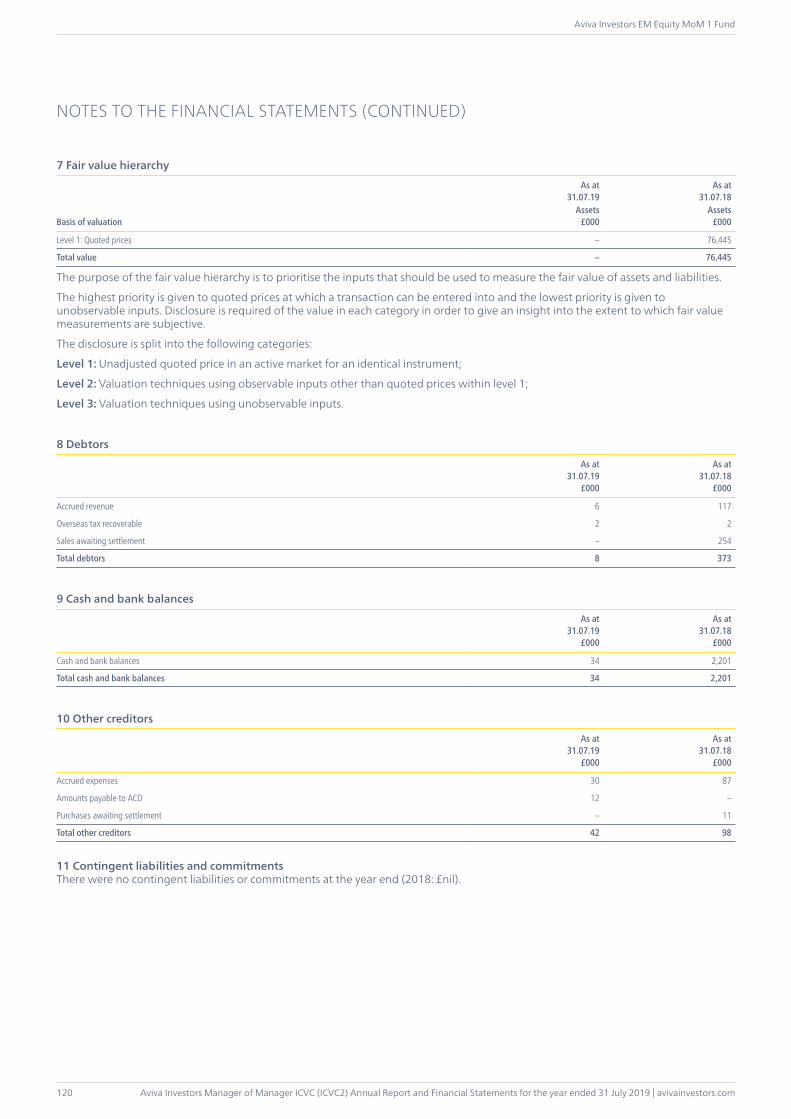
Aviva Investors Manager of Manager ICVC (ICVC2) Annual Report and Financial Statements for the year ended 31 July 2019 | avivainvestors.com
Aviva Investors EM Equity MoM 1 Fund
120
7 Fair value hierarchy
Basis of valuation
As at31.07.19
As at31.07.18
Assets£000
Assets£000
Level 1: Quoted prices – 76,445
Total value – 76,445
The purpose of the fair value hierarchy is to prioritise the inputs that should be used to measure the fair value of assets and liabilities.
The highest priority is given to quoted prices at which a transaction can be entered into and the lowest priority is given to unobservable inputs. Disclosure is required of the value in each category in order to give an insight into the extent to which fair value measurements are subjective.
The disclosure is split into the following categories:
Level 1: Unadjusted quoted price in an active market for an identical instrument;
Level 2: Valuation techniques using observable inputs other than quoted prices within level 1;
Level 3: Valuation techniques using unobservable inputs.
8 Debtors
As at31.07.19
£000
As at31.07.18
£000
Accrued revenue 6 117
Overseas tax recoverable 2 2
Sales awaiting settlement – 254
Total debtors 8 373
9 Cash and bank balances
As at31.07.19
£000
As at31.07.18
£000
Cash and bank balances 34 2,201
Total cash and bank balances 34 2,201
10 Other creditors
As at31.07.19
£000
As at31.07.18
£000
Accrued expenses 30 87
Amounts payable to ACD 12 –
Purchases awaiting settlement – 11
Total other creditors 42 98
11 Contingent liabilities and commitmentsThere were no contingent liabilities or commitments at the year end (2018: £nil).
NOTES TO THE FINANCIAL STATEMENTS (CONTINUED)

avivainvestors.com | Aviva Investors Manager of Manager ICVC (ICVC2) Annual Report and Financial Statements for the year ended 31 July 2019
Aviva Investors EM Equity MoM 1 Fund
121
12 Related party transactionsAviva Investors UK Fund Services Limited, Aviva Investors Global Services Limited and the Aviva group are deemed to be related parties per section 33.10 of FRS 102 as they are entities with control, joint control or significant influence over the entity.
Fund Management Fee/ACD periodic charges paid to Aviva Investors UK Fund Services Limited (“the ACD”) are shown in note 4 and details of shares issued and cancelled by the ACD are shown in the statement of change in net assets attributable to shareholders. The balance due to the ACD at the year end in respect of Fund Management Fee/ACD periodic charges was £nil (2018: £87,281). Any balance due from the ACD in respect of issues is shown in note 8. Any balance due to the ACD in respect of cancellations is shown in note 10.
Distributions payable to the ACD and related parties of the ACD during the year amounted to £35,169 (2018: £274,503). The amount outstanding at the year end was £nil (2018: £274,503). Related parties of the ACD are deemed to be all companies under the control of Aviva Plc. This will include companies which hold shares in the Fund on behalf of other external investors.
The Fund closed during the year and sold all investments therefore at the year end there were no holdings in any investments managed and advised by Aviva Investors Global Services Limited or associated with the Aviva Group.
Holdings at the year end and movements during the year are as follows:
Holdings at31.07.19(shares)
Movement(shares)
Holdings at31.07.18(shares)
ACD and related parties – (15,367,112) 15,367,112
The ACD and related parties of the ACD are ineligible to vote at any general meeting.
13 Shareholder fundsThe Fund currently has one share class: Class 2 (Institutional). The Fund Management Fee is as follows:
Class 2: 1.46%
The net asset value of the share class, the net asset value per share and the number of shares in the class are shown on page 115. The distributions per share class are given in the distribution tables on page 124.
14 Shares in issue reconciliationNumber of shares
in issue at31.07.18
Number ofshares issued
Number ofshares cancelled
Number ofshares converted
Number of shares in issue at
31.07.19
Share Class 2 Income 15,367,112 458,686 (15,825,798) – –
NOTES TO THE FINANCIAL STATEMENTS (CONTINUED)
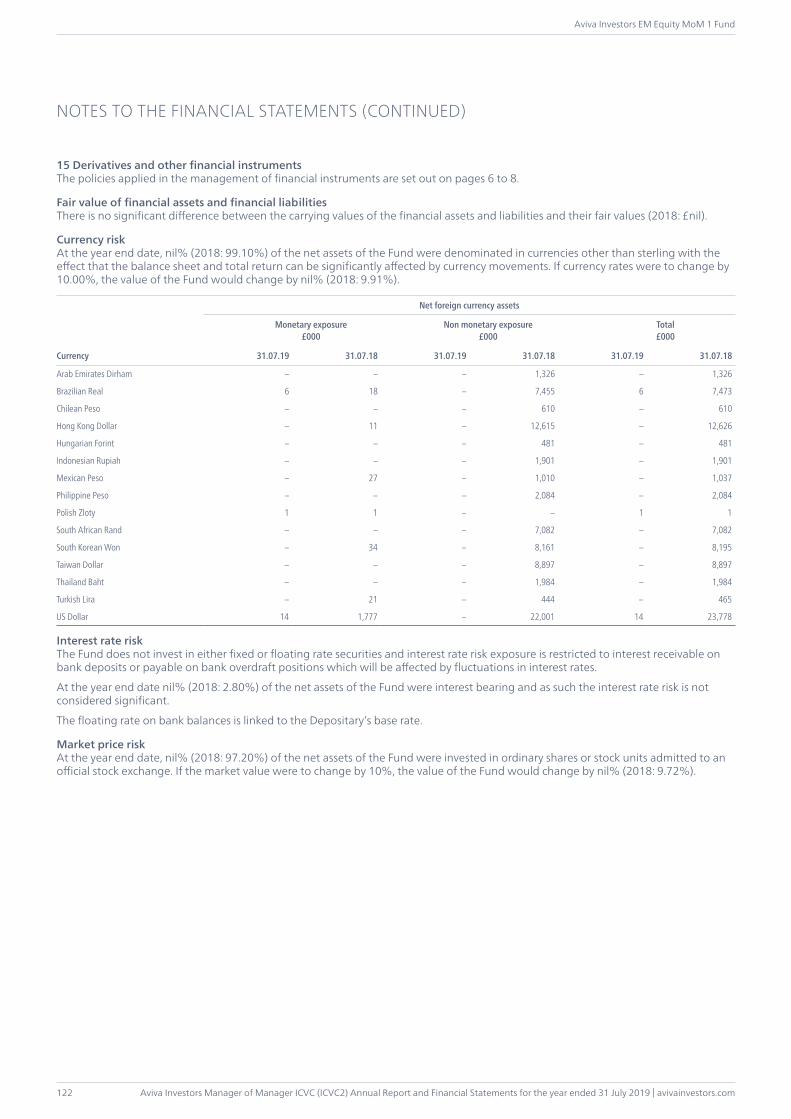
Aviva Investors Manager of Manager ICVC (ICVC2) Annual Report and Financial Statements for the year ended 31 July 2019 | avivainvestors.com
Aviva Investors EM Equity MoM 1 Fund
122
15 Derivatives and other financial instrumentsThe policies applied in the management of financial instruments are set out on pages 6 to 8.
Fair value of financial assets and financial liabilitiesThere is no significant difference between the carrying values of the financial assets and liabilities and their fair values (2018: £nil).
Currency riskAt the year end date, nil% (2018: 99.10%) of the net assets of the Fund were denominated in currencies other than sterling with the effect that the balance sheet and total return can be significantly affected by currency movements. If currency rates were to change by 10.00%, the value of the Fund would change by nil% (2018: 9.91%).
Currency
Net foreign currency assets
Monetary exposure£000
Non monetary exposure£000
Total£000
31.07.19 31.07.18 31.07.19 31.07.18 31.07.19 31.07.18
Arab Emirates Dirham – – – 1,326 – 1,326
Brazilian Real 6 18 – 7,455 6 7,473
Chilean Peso – – – 610 – 610
Hong Kong Dollar – 11 – 12,615 – 12,626
Hungarian Forint – – – 481 – 481
Indonesian Rupiah – – – 1,901 – 1,901
Mexican Peso – 27 – 1,010 – 1,037
Philippine Peso – – – 2,084 – 2,084
Polish Zloty 1 1 – – 1 1
South African Rand – – – 7,082 – 7,082
South Korean Won – 34 – 8,161 – 8,195
Taiwan Dollar – – – 8,897 – 8,897
Thailand Baht – – – 1,984 – 1,984
Turkish Lira – 21 – 444 – 465
US Dollar 14 1,777 – 22,001 14 23,778
Interest rate riskThe Fund does not invest in either fixed or floating rate securities and interest rate risk exposure is restricted to interest receivable on bank deposits or payable on bank overdraft positions which will be affected by fluctuations in interest rates.
At the year end date nil% (2018: 2.80%) of the net assets of the Fund were interest bearing and as such the interest rate risk is not considered significant.
The floating rate on bank balances is linked to the Depositary’s base rate.
Market price riskAt the year end date, nil% (2018: 97.20%) of the net assets of the Fund were invested in ordinary shares or stock units admitted to an official stock exchange. If the market value were to change by 10%, the value of the Fund would change by nil% (2018: 9.72%).
NOTES TO THE FINANCIAL STATEMENTS (CONTINUED)

avivainvestors.com | Aviva Investors Manager of Manager ICVC (ICVC2) Annual Report and Financial Statements for the year ended 31 July 2019
Aviva Investors EM Equity MoM 1 Fund
123
16 Direct transaction costs In the case of shares, broker commissions and transfer taxes, stamp duty is paid by the Fund on each transaction. In addition, there is a dealing spread between buying and selling prices of the underlying investments. Unlike shares, other types of investments (such as bonds, money market instruments, derivatives) have no separately identifiable transaction costs; these costs form part of the dealing spread.
31.07.19
Principalbefore costs
£000Commissions
£000Taxes£000
Totalafter costs
£000
Commissions as %
of principal
Taxes as %
of principal
Purchases (excluding Inspecie & Corporate Action activity)
Equities (7,249) (6) (4) (7,259) 0.08% 0.06%(7,249) (6) (4) (7,259)
Sales (excluding Inspecie & Corporate Action activity)Equities 84,944 (52) (91) 84,801 0.06% 0.11%
84,944 (52) (91) 84,801
Total (58) (95)
Percentage of Fund average net assets 0.08% 0.14%
31.07.18
Principalbefore costs
£000Commissions
£000Taxes£000
Totalafter costs
£000
Commissions as %
of principal
Taxes as %
of principal
Purchases (excluding Inspecie & Corporate Action activity)
Equities (21,473) (18) (12) (21,503) 0.08% 0.06%(21,473) (18) (12) (21,503)
Sales (excluding Inspecie & Corporate Action activity)Equities 63,733 (41) (64) 63,628 0.06% 0.10%
63,733 (41) (64) 63,628
Total (59) (76)
Percentage of Fund average net assets 0.06% 0.07%
Dealing spreadAs at 31 July 2019, the average portfolio dealing spread was nil% (2018: 0.16%). This spread represents the difference between the values determined retrospectively by reference to the bid and offer prices of investments expressed as a percentage of the value determined by reference to the offer price.
17 Post balance sheet eventsThere are no post balance sheet events which require adjustment or disclosure at the year end (2018: £nil).
NOTES TO THE FINANCIAL STATEMENTS (CONTINUED)
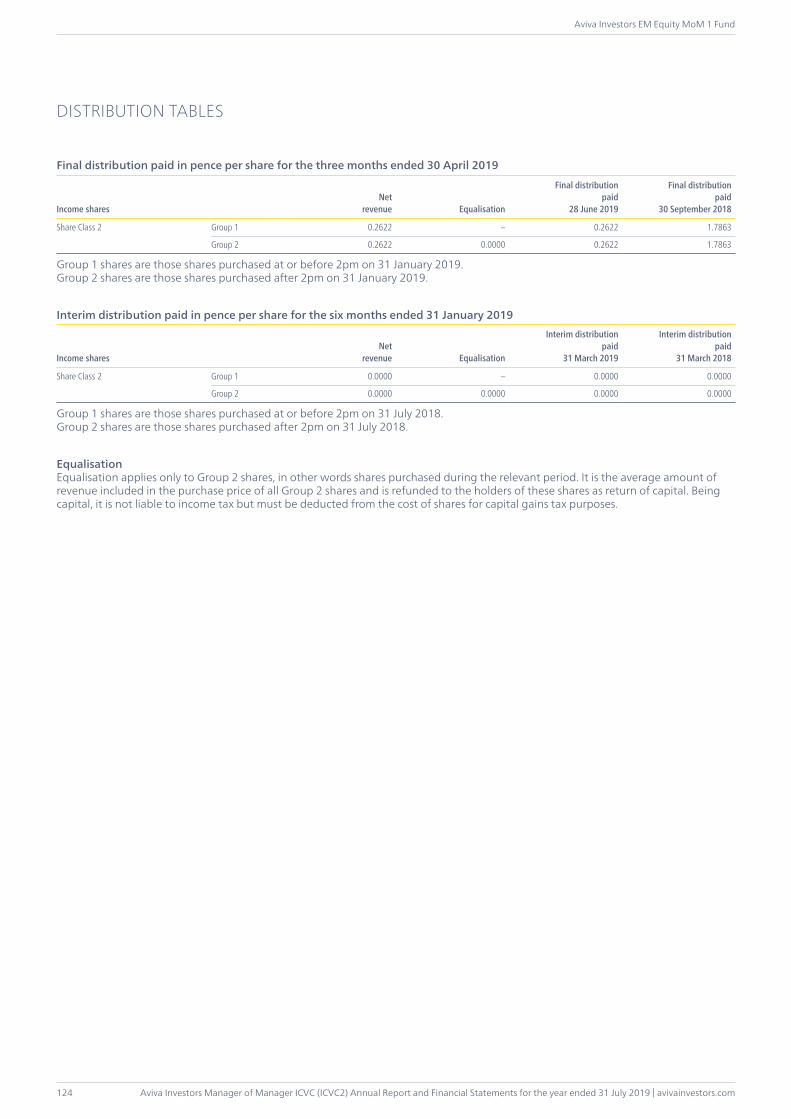
Aviva Investors Manager of Manager ICVC (ICVC2) Annual Report and Financial Statements for the year ended 31 July 2019 | avivainvestors.com
Aviva Investors EM Equity MoM 1 Fund
124
DISTRIBUTION TABLES
Final distribution paid in pence per share for the three months ended 30 April 2019
Income sharesNet
revenue Equalisation
Final distributionpaid
28 June 2019
Final distributionpaid
30 September 2018
Share Class 2 Group 1 0.2622 – 0.2622 1.7863
Group 2 0.2622 0.0000 0.2622 1.7863
Group 1 shares are those shares purchased at or before 2pm on 31 January 2019.Group 2 shares are those shares purchased after 2pm on 31 January 2019.
Interim distribution paid in pence per share for the six months ended 31 January 2019
Income sharesNet
revenue Equalisation
Interim distributionpaid
31 March 2019
Interim distributionpaid
31 March 2018
Share Class 2 Group 1 0.0000 – 0.0000 0.0000
Group 2 0.0000 0.0000 0.0000 0.0000
Group 1 shares are those shares purchased at or before 2pm on 31 July 2018.Group 2 shares are those shares purchased after 2pm on 31 July 2018.
EqualisationEqualisation applies only to Group 2 shares, in other words shares purchased during the relevant period. It is the average amount of revenue included in the purchase price of all Group 2 shares and is refunded to the holders of these shares as return of capital. Being capital, it is not liable to income tax but must be deducted from the cost of shares for capital gains tax purposes.
avivainvestors.com | Aviva Investors Manager of Manager ICVC (ICVC2) Annual Report and Financial Statements for the year ended 31 July 2019
Aviva Investors Sterling Credit MoM 1 Fund
125
The Fund closed on 6 December 2017, and will be terminated in due course.
INVESTMENT OBJECTIVEThe Fund sought to achieve income (with some prospect for long-term capital growth).
INVESTMENT POLICYThe Fund might have invested in any of the following financial instruments in order to achieve its investment objective: Sterling credit, overseas credit, gilts, overseas government bonds, asset backed securities, (including mortgage backed securities), money market instruments, collective investment schemes and deposits. Up to 50% of the value of the scheme property may have been invested in credit which is deemed to be below investment grade. The Fund’s exposure would have been in Sterling or currency hedged back to Sterling. The Sterling exposure would have been within a range of 98% to 102%.
FUND MANAGER’S REPORTPlease note, the Fund was closed on 6 December 2017 and is in the process of being terminated. No fund manager’s report has been included within the annual report and financial statements as no investment activity has taken place during the year under review.
Material Portfolio ChangesThere were no purchases or sales during the period as the Fund closed on 6 December 2017.
Synthetic Risk and Reward IndicatorInvestment risks have been removed as the Fund closed on 6 December 2017.
AVIVA INVESTORS STERLING CREDIT MOM 1 FUND
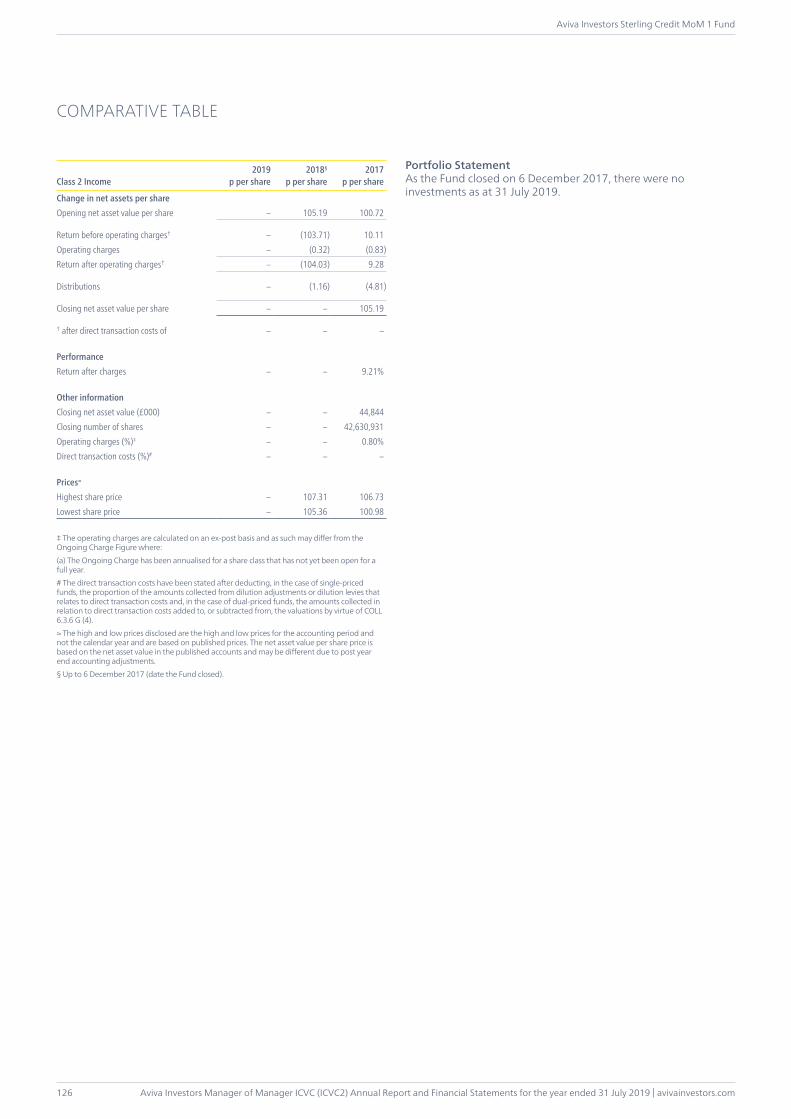
Aviva Investors Manager of Manager ICVC (ICVC2) Annual Report and Financial Statements for the year ended 31 July 2019 | avivainvestors.com
Aviva Investors Sterling Credit MoM 1 Fund
126
COMPARATIVE TABLE
Class 2 Income2019
p per share2018§
p per share2017
p per share
Change in net assets per shareOpening net asset value per share – 105.19 100.72
Return before operating charges† – (103.71) 10.11Operating charges – (0.32) (0.83)Return after operating charges† – (104.03) 9.28
Distributions – (1.16) (4.81)
Closing net asset value per share – – 105.19
† after direct transaction costs of – – –
PerformanceReturn after charges – – 9.21%
Other informationClosing net asset value (£000) – – 44,844Closing number of shares – – 42,630,931Operating charges (%)‡ – – 0.80%Direct transaction costs (%)# – – –
Prices≈
Highest share price – 107.31 106.73Lowest share price – 105.36 100.98
‡ The operating charges are calculated on an ex-post basis and as such may differ from the Ongoing Charge Figure where:(a) The Ongoing Charge has been annualised for a share class that has not yet been open for a full year.# The direct transaction costs have been stated after deducting, in the case of single-priced funds, the proportion of the amounts collected from dilution adjustments or dilution levies that relates to direct transaction costs and, in the case of dual-priced funds, the amounts collected in relation to direct transaction costs added to, or subtracted from, the valuations by virtue of COLL 6.3.6 G (4).≈ The high and low prices disclosed are the high and low prices for the accounting period and not the calendar year and are based on published prices. The net asset value per share price is based on the net asset value in the published accounts and may be different due to post year end accounting adjustments.§ Up to 6 December 2017 (date the Fund closed).
Portfolio StatementAs the Fund closed on 6 December 2017, there were no investments as at 31 July 2019.

avivainvestors.com | Aviva Investors Manager of Manager ICVC (ICVC2) Annual Report and Financial Statements for the year ended 31 July 2019
Aviva Investors Sterling Credit MoM 1 Fund
127
STATEMENT OF TOTAL RETURNFor the year ended 31 July 2019
Notes £000
Year ended31.07.19
£000 £000
Year ended31.07.18
£000
Income
Net capital gains 2 – 230
Revenue 3 – 714
Expenses 4 – (142)
Net revenue before taxation – 572
Taxation 5 – –
Net revenue after taxation – 572
Total return before distributions – 802
Distributions 6 – (642)
Change in net assets attributable to shareholders from investment activities – 160
STATEMENT OF CHANGE IN NET ASSETS ATTRIBUTABLE TO SHAREHOLDERSFor the year ended 31 July 2019
£000
Year ended31.07.19
£000 £000
Year ended31.07.18
£000
Opening net assets attributable to shareholders – 44,844
Movement due to issue and cancellation of shares:
Amounts receivable on issue of shares – 16
Amounts payable on cancellation of shares – (44,952)
– (44,936)
Dilution adjustment – 37
Change in net assets attributable to shareholders from investment activities (see above) – 160
Fund closure – (105)
Closing net assets attributable to shareholders – –
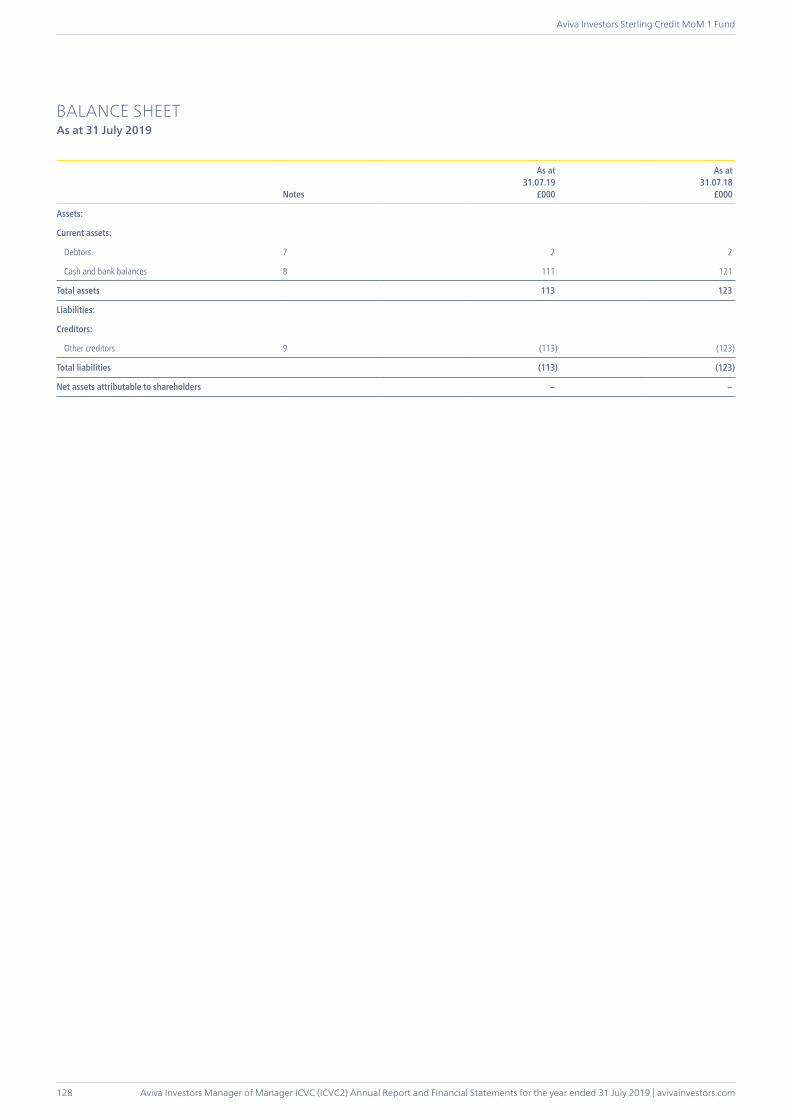
Aviva Investors Manager of Manager ICVC (ICVC2) Annual Report and Financial Statements for the year ended 31 July 2019 | avivainvestors.com
Aviva Investors Sterling Credit MoM 1 Fund
128
BALANCE SHEETAs at 31 July 2019
Notes
As at31.07.19
£000
As at31.07.18
£000
Assets:
Current assets:
Debtors 7 2 2
Cash and bank balances 8 111 121
Total assets 113 123
Liabilities:
Creditors:
Other creditors 9 (113) (123)
Total liabilities (113) (123)
Net assets attributable to shareholders – –

avivainvestors.com | Aviva Investors Manager of Manager ICVC (ICVC2) Annual Report and Financial Statements for the year ended 31 July 2019
Aviva Investors Sterling Credit MoM 1 Fund
129
1 Accounting basis and policiesPlease see pages 6 to 8 for accounting basis and policies.
2 Net capital gains
Year ended31.07.19
£000
Year ended31.07.18
£000
Net capital gains on investments during the year comprise:
Currency gains – 324
Expenses relating to the purchase and sale of investments – (1)
Forward currency contracts losses – (86)
Non-derivative securities losses – (7)
Net capital gains – 230
3 Revenue
Year ended31.07.19
£000
Year ended31.07.18
£000
Bank and deposit interest – 59
Interest on debt securities – 655
Total revenue – 714
4 Expenses
Year ended31.07.19
£000
Year ended31.07.18
£000
Payable to the Authorised Corporate Director (“ACD”), associates of the ACD or agents of either of them:
ACD’s periodic charge – 118
– 118
Payable to the Depositary, associates of the Depositary or agents of either of them:
Depositary’s fee – 3
Interest payable – 2
Safe custody fee – 1
– 6
Other expenses:
Audit fee* – 7
Closure costs 10
Statement fees – 1
– 18
Total expenses – 142
* The audit fee was £8,733 (2018: £8,562) net of VAT.
NOTES TO THE FINANCIAL STATEMENTS
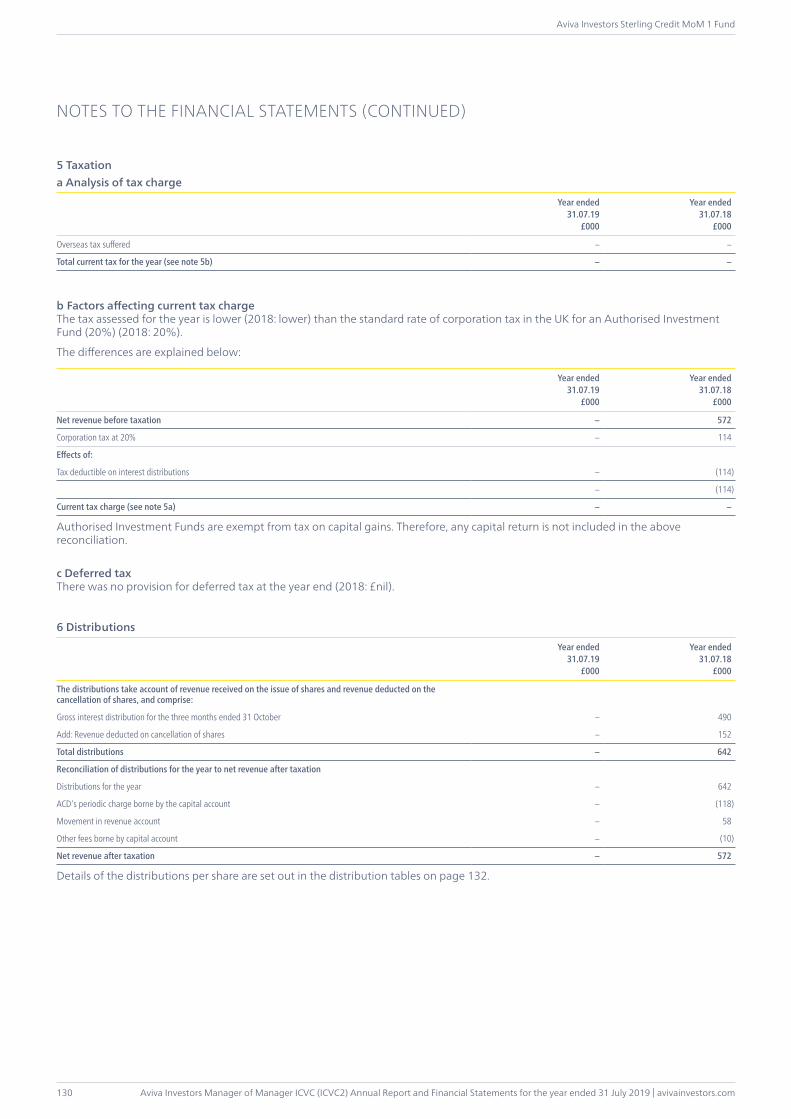
Aviva Investors Manager of Manager ICVC (ICVC2) Annual Report and Financial Statements for the year ended 31 July 2019 | avivainvestors.com
Aviva Investors Sterling Credit MoM 1 Fund
130
5 Taxationa Analysis of tax charge
Year ended31.07.19
£000
Year ended31.07.18
£000
Overseas tax suffered – –
Total current tax for the year (see note 5b) – –
b Factors affecting current tax chargeThe tax assessed for the year is lower (2018: lower) than the standard rate of corporation tax in the UK for an Authorised Investment Fund (20%) (2018: 20%).
The differences are explained below:
Year ended31.07.19
£000
Year ended31.07.18
£000
Net revenue before taxation – 572
Corporation tax at 20% – 114
Effects of:
Tax deductible on interest distributions – (114)
– (114)
Current tax charge (see note 5a) – –
Authorised Investment Funds are exempt from tax on capital gains. Therefore, any capital return is not included in the above reconciliation.
c Deferred taxThere was no provision for deferred tax at the year end (2018: £nil).
6 Distributions
Year ended31.07.19
£000
Year ended31.07.18
£000
The distributions take account of revenue received on the issue of shares and revenue deducted on the cancellation of shares, and comprise:
Gross interest distribution for the three months ended 31 October – 490
Add: Revenue deducted on cancellation of shares – 152
Total distributions – 642
Reconciliation of distributions for the year to net revenue after taxation
Distributions for the year – 642
ACD‘s periodic charge borne by the capital account – (118)
Movement in revenue account – 58
Other fees borne by capital account – (10)
Net revenue after taxation – 572
Details of the distributions per share are set out in the distribution tables on page 132.
NOTES TO THE FINANCIAL STATEMENTS (CONTINUED)
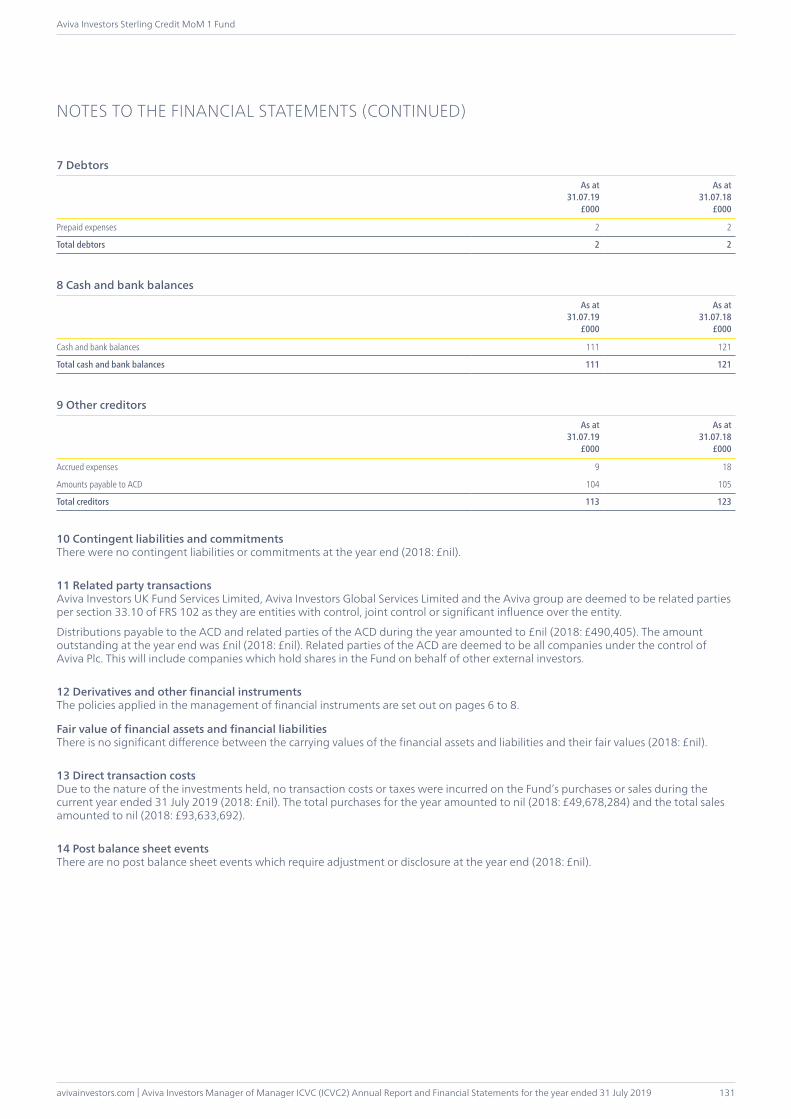
avivainvestors.com | Aviva Investors Manager of Manager ICVC (ICVC2) Annual Report and Financial Statements for the year ended 31 July 2019
Aviva Investors Sterling Credit MoM 1 Fund
131
7 Debtors
As at31.07.19
£000
As at31.07.18
£000
Prepaid expenses 2 2
Total debtors 2 2
8 Cash and bank balances
As at31.07.19
£000
As at31.07.18
£000
Cash and bank balances 111 121
Total cash and bank balances 111 121
9 Other creditors
As at31.07.19
£000
As at31.07.18
£000
Accrued expenses 9 18
Amounts payable to ACD 104 105
Total creditors 113 123
10 Contingent liabilities and commitmentsThere were no contingent liabilities or commitments at the year end (2018: £nil).
11 Related party transactionsAviva Investors UK Fund Services Limited, Aviva Investors Global Services Limited and the Aviva group are deemed to be related parties per section 33.10 of FRS 102 as they are entities with control, joint control or significant influence over the entity.
Distributions payable to the ACD and related parties of the ACD during the year amounted to £nil (2018: £490,405). The amount outstanding at the year end was £nil (2018: £nil). Related parties of the ACD are deemed to be all companies under the control of Aviva Plc. This will include companies which hold shares in the Fund on behalf of other external investors.
12 Derivatives and other financial instrumentsThe policies applied in the management of financial instruments are set out on pages 6 to 8.
Fair value of financial assets and financial liabilitiesThere is no significant difference between the carrying values of the financial assets and liabilities and their fair values (2018: £nil).
13 Direct transaction costs Due to the nature of the investments held, no transaction costs or taxes were incurred on the Fund’s purchases or sales during the current year ended 31 July 2019 (2018: £nil). The total purchases for the year amounted to nil (2018: £49,678,284) and the total sales amounted to nil (2018: £93,633,692).
14 Post balance sheet eventsThere are no post balance sheet events which require adjustment or disclosure at the year end (2018: £nil).
NOTES TO THE FINANCIAL STATEMENTS (CONTINUED)

Aviva Investors Manager of Manager ICVC (ICVC2) Annual Report and Financial Statements for the year ended 31 July 2019 | avivainvestors.com
Aviva Investors Sterling Credit MoM 1 Fund
132
DISTRIBUTION TABLES
As the Fund was closed on 6 December 2017, there were no distributions paid or payable.
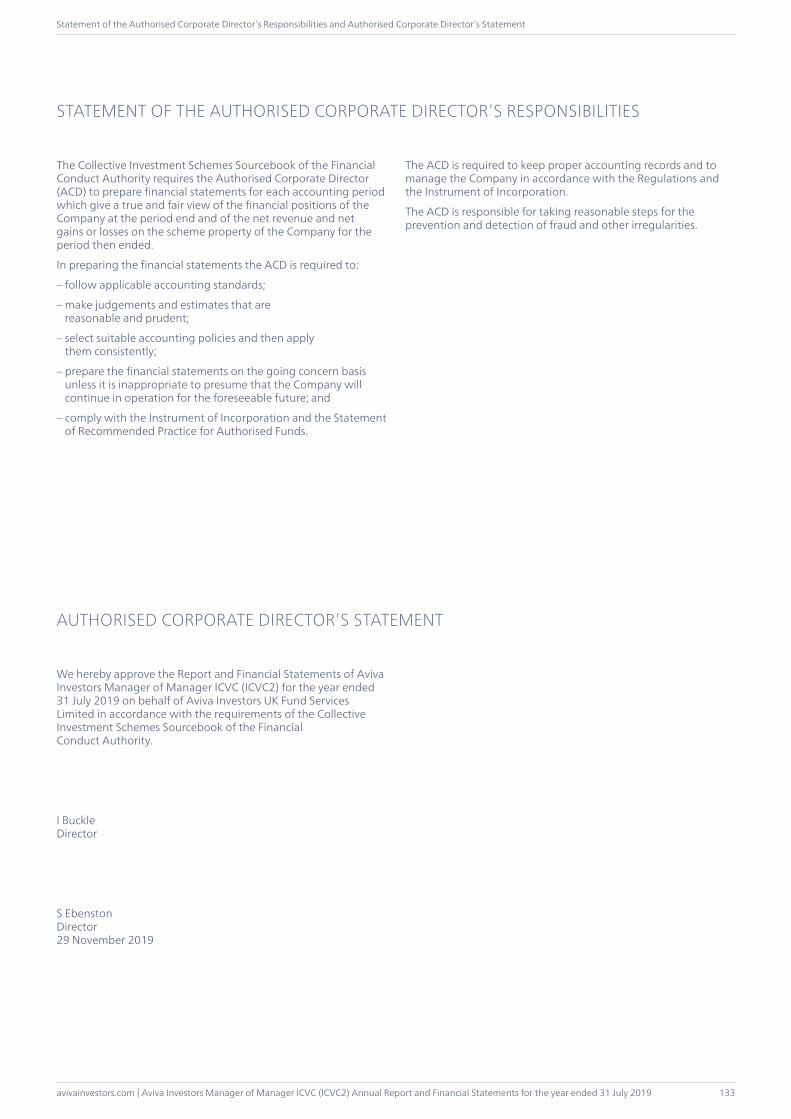
avivainvestors.com | Aviva Investors Manager of Manager ICVC (ICVC2) Annual Report and Financial Statements for the year ended 31 July 2019
Statement of the Authorised Corporate Director’s Responsibilities and Authorised Corporate Director’s Statement
133
The Collective Investment Schemes Sourcebook of the Financial Conduct Authority requires the Authorised Corporate Director (ACD) to prepare financial statements for each accounting period which give a true and fair view of the financial positions of the Company at the period end and of the net revenue and net gains or losses on the scheme property of the Company for the period then ended.
In preparing the financial statements the ACD is required to:
– follow applicable accounting standards;
– make judgements and estimates that are reasonable and prudent;
– select suitable accounting policies and then apply them consistently;
– prepare the financial statements on the going concern basis unless it is inappropriate to presume that the Company will continue in operation for the foreseeable future; and
– comply with the Instrument of Incorporation and the Statement of Recommended Practice for Authorised Funds.
We hereby approve the Report and Financial Statements of Aviva Investors Manager of Manager ICVC (ICVC2) for the year ended 31 July 2019 on behalf of Aviva Investors UK Fund Services Limited in accordance with the requirements of the Collective Investment Schemes Sourcebook of the Financial Conduct Authority.
I BuckleDirector
S EbenstonDirector29 November 2019
STATEMENT OF THE AUTHORISED CORPORATE DIRECTOR’S RESPONSIBILITIES
AUTHORISED CORPORATE DIRECTOR’S STATEMENT
The ACD is required to keep proper accounting records and to manage the Company in accordance with the Regulations and the Instrument of Incorporation.
The ACD is responsible for taking reasonable steps for the prevention and detection of fraud and other irregularities.
Aviva Investors Manager of Manager ICVC (ICVC2) Annual Report and Financial Statements for the year ended 31 July 2019 | avivainvestors.com
Statement of the Depositary’s Responsibilities and Depositary’s Report to the Shareholders
134
The Depositary must ensure that the Company is managed in accordance with the Financial Conduct Authority’s Collective Investment Schemes Sourcebook, the Open-Ended investment Companies Regulations 2001 (SI 2001/1228), as amended, the Financial Services and Markets Act 2000, as amended, (together ‘the regulations’), the Company’s Instrument of Incorporation and Prospectus (together ‘the Scheme documents’) as detailed below.
The Depositary must in the context of its role act honestly, fairly, professionally, independently and in the interests of the Company and its investors.
The Depositary is responsible for the safekeeping of all custodial assets and maintaining a record of all other assets of the Company in accordance with the regulations.
The Depositary must ensure that:
– the Company’s cash flows are properly monitored and that cash of the Company is booked into the cash accounts in accordance with the regulations;
– the sale, issue, repurchase, redemption and cancellation of shares are carried out in accordance with the regulations;
– the value of shares of the Company are calculated in accordance with the regulations;
– any consideration relating to transactions in the Company’s assets is remitted to the Company within the usual time limits;
– the Company’s income is applied in accordance with the regulations; and the instructions of the Authorised Corporate Director (‘the ACD’), which is the UCITS Management Company, are carried out (unless they conflict with the regulations).
The Depositary also has a duty to take reasonable care to ensure that Company is managed in accordance with the regulations and Scheme documents in relation to the investment and borrowing powers applicable to the Company.
Having carried out such procedures as we consider necessary to discharge our responsibilities as depositary of the Company, it is our opinion, based on the information available to us and the explanations provided, that in all material respects the Company, acting through the AFM:
(i) has carried out the issue, sale, redemption and cancellation, and calculation of the price of the Company’s shares and the application of the Company’s income in accordance with the regulations and the Scheme documents of the Company; and
(ii) has observed the investment and borrowing powers and restrictions applicable to the Company.
J.P. Morgan Europe LimitedLondon29 November 2019
STATEMENT OF THE DEPOSITARY’S RESPONSIBILITIES AND DEPOSITARY’S REPORT TO THE SHAREHOLDERS

avivainvestors.com | Aviva Investors Manager of Manager ICVC (ICVC2) Annual Report and Financial Statements for the year ended 31 July 2019
Independent Auditors’ Report to the Shareholders of Aviva Investors Manager of Manager ICVC (ICVC2)
135
REPORT ON THE AUDIT OF THE FINANCIAL STATEMENTS
OPINIONIn our opinion, the financial statements of Aviva Investors Manager of Manager ICVC (ICVC2)’s (the “Company”):
– give a true and fair view of the financial position of the Company and each of the sub-funds as at 31 July 2019 and of the net revenue and the net capital gains/losses on the scheme property of the Company and each of the sub-funds for the year then ended; and
– have been properly prepared in accordance with United Kingdom Generally Accepted Accounting Practice (United Kingdom Accounting Standards, comprising FRS 102 “The Financial Reporting Standard applicable in the UK and Republic of Ireland”, and applicable law), the Statement of Recommended Practice for UK Authorised Funds, the Collective Investment Schemes sourcebook and the Instrument of Incorporation.
Aviva Investors Manager of Manager ICVC (ICVC2) is an Open Ended Investment Company (‘OEIC’) with 10 sub-funds. The financial statements of the company comprise the financial statements of each of the sub-funds. We have audited the financial statements, included within the Annual Report and Financial Statements (the “Annual Report”), which comprise: the balance sheets as at 31 July 2019; the statements of total return, the statements of change in net assets attributable to shareholders for the year then ended; the distribution tables; the accounting policies (within the Policies and Risks section); and the notes to the financial statements.
EMPHASIS OF MATTER – BASIS OF PREPARATIONIn forming our opinion on the financial statements, which is not modified, we draw your attention to accounting policy A (within the Policies and Risks section) which describes the Authorised Corporate Director’s reasons why the financial statements of the Aviva Investors UK Equity MoM 2 Fund, Aviva Investors US Equity MoM 1 Fund, Aviva Investors Euro Equity MoM 1 Fund, Aviva Investors Euro Equity MoM 2 Fund, Aviva Investors Apac Equity MoM 1 Fund, Aviva Investors EM Equity MoM 1 Fund and Aviva Investors Sterling Credit MoM 1 Fund have been prepared on a basis other than going concern.
BASIS FOR OPINIONWe conducted our audit in accordance with International Standards on Auditing (UK) (“ISAs (UK)”) and applicable law. Our responsibilities under ISAs (UK) are further described in the Auditors’ responsibilities for the audit of the financial statements section of our report. We believe that the audit evidence we have obtained is sufficient and appropriate to provide a basis for our opinion.
IndependenceWe remained independent of the Company in accordance with the ethical requirements that are relevant to our audit of the financial statements in the UK, which includes the FRC’s Ethical Standard, and we have fulfilled our other ethical responsibilities in accordance with these requirements.
CONCLUSIONS RELATING TO GOING CONCERNISAs (UK) require us to report to you when:
– the Authorised Corporate Directors’ use of the going concern basis of accounting in the preparation of the financial statements is not appropriate; or
– the Authorised Corporate Director has not disclosed in the financial statements any identified material uncertainties that may cast significant doubt about the Company’s or any of the sub-funds’ ability to continue to adopt the going concern basis of accounting for a period of at least twelve months from the date when the financial statements are authorised for issue.
With the exception of the circumstances described in the Emphasis of Matter – Basis of Preparation paragraph above regarding the Aviva Investors UK Equity MoM 2 Fund, Aviva Investors US Equity MoM 1 Fund, Aviva Investors Euro Equity MoM 1 Fund, Aviva Investors Euro Equity MoM 2 Fund, Aviva Investors Apac Equity MoM 1 Fund, Aviva Investors EM Equity MoM 1 Fund and Aviva Investors Sterling Credit MoM 1 Fund, we have nothing to report in respect of the above matters.
However, because not all future events or conditions can be predicted, this statement is not a guarantee as to the Company’s or any of the sub-funds’ ability to continue as a going concern.
For example, the terms on which the United Kingdom may withdraw from the European Union are not clear and it is difficult to evaluate all of the potential implications on the Company’s or any of the sub-funds’ business and the wider economy.
REPORTING ON OTHER INFORMATION The other information comprises all of the information in the Annual Report other than the financial statements and our auditors’ report thereon. The Authorised Corporate Director is responsible for the other information. Our opinion on the financial statements does not cover the other information and, accordingly, we do not express an audit opinion or, except to the extent otherwise explicitly stated in this report, any form of assurance thereon.
In connection with our audit of the financial statements, our responsibility is to read the other information and, in doing so, consider whether the other information is materially inconsistent with the financial statements or our knowledge obtained in the audit, or otherwise appears to be materially misstated. If we identify an apparent material inconsistency or material misstatement, we are required to perform procedures to conclude whether there is a material misstatement of the financial statements or a material misstatement of the other information. If, based on the work we have performed, we conclude that there is a material misstatement of this other information, we are required to report that fact. We have nothing to report based on these responsibilities.
Authorised Corporate Director’s ReportIn our opinion, the information given in the Report of the Authorised Corporate Director for the financial year for which the financial statements are prepared is consistent with the financial statements.
INDEPENDENT AUDITORS’ REPORT TO THE SHAREHOLDERS OF AVIVA INVESTORS MANAGER OF MANAGER ICVC (ICVC2)

Aviva Investors Manager of Manager ICVC (ICVC2) Annual Report and Financial Statements for the year ended 31 July 2019 | avivainvestors.com
Independent Auditors’ Report to the Shareholders of Aviva Investors Manager of Manager ICVC (ICVC2)
136
INDEPENDENT AUDITORS’ REPORT TO THE SHAREHOLDERS OF AVIVA INVESTORS MANAGER OF MANAGER ICVC (ICVC2) (CONTINUED)
RESPONSIBILITIES FOR THE FINANCIAL STATEMENTS AND THE AUDITResponsibilities of the Authorised Corporate Director for the financial statementsAs explained more fully in the Statement of the Authorised Corporate Director’s Responsibilities set out on page 133, the Authorised Corporate Director is responsible for the preparation of the financial statements in accordance with the applicable framework and for being satisfied that they give a true and fair view. The Authorised Corporate Director is also responsible for such internal control as they determine is necessary to enable the preparation of financial statements that are free from material misstatement, whether due to fraud or error.
In preparing the financial statements, the Authorised Corporate Director is responsible for assessing the Company’s and each of the sub-funds ability to continue as a going concern, disclosing as applicable, matters related to going concern and using the going concern basis of accounting unless the Authorised Corporate Director either intends to wind up or terminate the Company or individual sub-fund, or has no realistic alternative but to do so.
Auditors’ responsibilities for the audit of the financial statementsOur objectives are to obtain reasonable assurance about whether the financial statements as a whole are free from material misstatement, whether due to fraud or error, and to issue an auditors’ report that includes our opinion. Reasonable assurance is a high level of assurance, but is not a guarantee that an audit conducted in accordance with ISAs (UK) will always detect a material misstatement when it exists. Misstatements can arise from fraud or error and are considered material if, individually or in the aggregate, they could reasonably be expected to influence the economic decisions of users taken on the basis of these financial statements.
A further description of our responsibilities for the audit of the financial statements is located on the Financial Reporting Council’s website at: www.frc.org.uk/auditorsresponsibilities. This description forms part of our auditors’ report.
Use of this reportThis report, including the opinions, has been prepared for and only for the Company’s shareholders as a body in accordance with paragraph 4.5.12 of the Collective Investment Schemes sourcebook as required by paragraph 67(2) of the Open-Ended Investment Companies Regulations 2001 and for no other purpose. We do not, in giving these opinions, accept or assume responsibility for any other purpose or to any other person to whom this report is shown or into whose hands it may come save where expressly agreed by our prior consent in writing.
OTHER REQUIRED REPORTING
OPINION ON MATTER REQUIRED BY THE COLLECTIVE INVESTMENT SCHEMES SOURCEBOOKIn our opinion, we have obtained all the information and explanations we consider necessary for the purposes of the audit.
COLLECTIVE INVESTMENT SCHEMES SOURCEBOOK EXCEPTION REPORTINGUnder the Collective Investment Schemes sourcebook we are also required to report to you if, in our opinion:
– proper accounting records have not been kept; or
– the financial statements are not in agreement with the accounting records.
We have no exceptions to report arising from this responsibility.
PricewaterhouseCoopers LLPChartered Accountants and Statutory AuditorsEdinburgh29 November 2019
avivainvestors.com | Aviva Investors Manager of Manager ICVC (ICVC2) Annual Report and Financial Statements for the year ended 31 July 2019
Securities Financing Transactions Regulation Disclosure and General Information
137
None of the Funds in the Company currently undertakes securities financing transactions (as defined in Article 3 of Regulation (EU) 2015/2365) or uses total return swaps.
Investments in Aviva Investors Manager of Manager ICVC (ICVC2) are intended to be medium to long term investments and should not be considered as a short term investment.
Past performance is not a guide to the future.
The value of an investment in the Funds and the revenue from it may go down as well as up, and you may not get back the original amount invested.
Where Funds are invested abroad, the value of your investment may rise and fall purely on account of movement in exchange rates.
Please refer to the Prospectus (which is available from the ACD on request) for a full description of the risks involved when investing in the Funds.
Any future returns and opinions expressed should not be relied upon as indicating any guarantee of return from investment in the Funds.
The performance figure given for each fund is based on midday values for the Aviva Investors UK Listed Equity High Alpha Fund and at 2pm for all other Funds.
The information contained within this document should not be construed as a recommendation to purchase or sell stocks.
Publication of PricesInformation on the prices of Shares will be available by calling 0800 051 2003 or on the internet at www.avivainvestors.com. Calls may be recorded for training or monitoring purposes. Calls are free from UK landlines and mobiles.
SECURITIES FINANCING TRANSACTIONS REGULATION DISCLOSURE AND GENERAL INFORMATION
GENERAL INFORMATION

Aviva Investors UK Fund Services Limited.Registered in England No. 1973412. Authorised and regulated by the Financial Conduct Authority. FCA Registered No. 119310.Registered address: St Helen’s, 1 Undershaft, London, EC3P 3DQ. An Aviva company.
Related Documents