Supply Chain Asia Magazine September/October 2009 MICA(P) 036/02/2009 | SEP/OCT 2009 SUPPLY CHAIN ASIA magazine www.supplychainasia.com Connect • Communicate • Collaborate Awards 2009, The List of Finalists Procurement Tactics for volatile market conditions Air Cargo Beijing ups the ante in the north Asia hub game ISSN 1793 5377 SPEND anagement m sustainable $avings for Maritime Shippers choose ocean over TransSiberian Plus… Exposing the conflicts in service supply chains

Welcome message from author
This document is posted to help you gain knowledge. Please leave a comment to let me know what you think about it! Share it to your friends and learn new things together.
Transcript
Supply Cha
in Asia
Magazine
Septem
ber/O
ctober 2
00
9
Mica(P) 036/02/2009 | SEP/OCT 2009
SupplY Chain aSiam
ag
azin
e
www.supplychainasia.comConnect • Communicate • Collaborate
Awards 2009, The List of Finalists
Procurement Tactics for volatile market conditions
Air Cargo Beijing ups the ante in the north Asia hub game
ISSN 1793 5377
SPendanagementm sustainable$avings
for
Maritime Shippers choose ocean
over TransSiberian
Plus…Exposing the conflicts in
service supply chains

SCAsiaContents
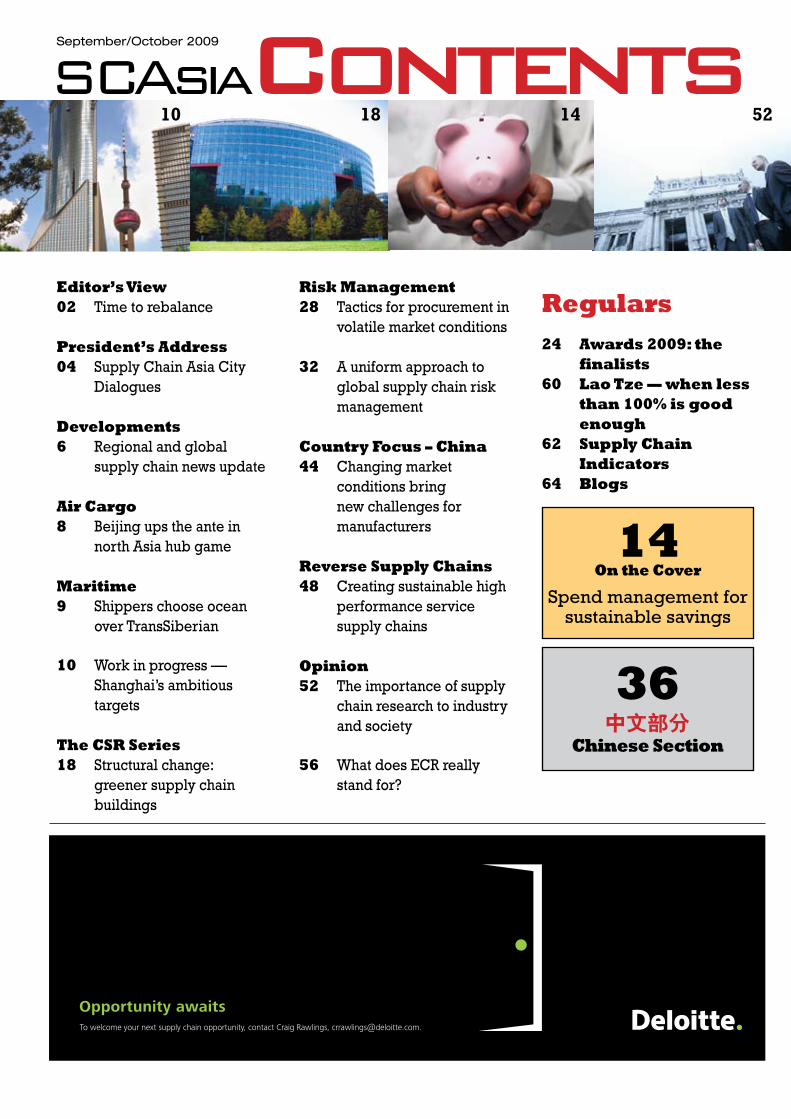
Editor’s View02 Time to rebalance
President’s Address04 Supply Chain Asia City
Dialogues
Developments6 Regional and global
supply chain news update
Air Cargo 8 Beijing ups the ante in
north Asia hub game
Maritime9 Shippers choose ocean
over TransSiberian
10 Work in progress — Shanghai’s ambitious targets
The CSR Series18 Structural change:
greener supply chain buildings
September/October 2009
521810
14On the Cover
Spend management for sustainable savings
36Chinese Section
Risk Management28 Tactics for procurement in
volatile market conditions
32 A uniform approach to global supply chain risk management
Country Focus – China44 Changing market
conditions bring new challenges for manufacturers
Reverse Supply Chains48 Creating sustainable high
performance service supply chains
Opinion52 The importance of supply
chain research to industry and society
56 What does ECR really stand for?
Regulars24 Awards 2009: the
finalists60 Lao Tze — when less
than 100% is good enough
62 Supply Chain Indicators
64 Blogs
14
To welcome your next supply chain opportunity, contact Craig Rawlings, [email protected].
Opportunity awaits
greenDot-Ads-door-190x60-draft3.indd 1 21/8/2009 10:15:50 AM
management team & support team
advisory CounCil members of supply Chain asia
editor’sview
Dr robert Yap (Founding Chairman)Chairman & CEO, YCH Group
Mr paul braDleY (Vice Chairman)Member, Global Advisory Board, Arshiya International
CounCil MeMbers
Mr MahenDra agarwalManaging Director & CEO, GATI
Mr neeraj bhargavaRegional Logistics Procurement Director,
Johnson & Johnson Asia Pacific
Mr vittorio FavatiPresident, Asia Pacific, CEVA Logistics
Mr allen FukaDaRegional Solutions Leader, Asia Pacific,
Supply Chain Management Services, IBM Business Process Delivery
associate proFessor Mark gohDirector, Industry Research,
The Logistics Institute Asia Pacific
Mr harrY lagaDIndependent
Mr richarD lorettoExecutive Director, Fashion and Home Asia Pacific Supply Chain,
AVON
Mr Mark MillarManaging Director, M Power Associates
Mr turloch MooneYManaging Director, SC Asia Publications
Mr peter o’ brienHead, Asia Pacific Supply Chain Practice,
Russell Reynolds Associates
Mr Michael proFFittStrategic Advisor/Consultant, Dubai Logistics City
Mr vivek sooDManaging Director, Global Supply Chain Group
Mr Mark wettasingheVice President, Value Added/Tech Services, DHL
publisherSC ASIA PuBLICATIONS PTE [email protected]
Managing direCtor, editorialTuRLOCH MOONEY
Managing direCtor, CoMMerCialFRANk PAuL
ContributorsPARI ANNAMALAI, RICHARD BRuBAkER, SAM CHAMBERS,
CHEW WAI YEE, OWEN CLEAVER, BARRY ELLIOTT, DR JOHN GATTORNA, PATRICIA GRACE, RYAN HuMPHREY,
PAuL LIM, CRAIG RAWLINGS, JEFFREY RuSSELL, CRYSTAL YAN
design & produCtionDESIGN WORkz
printingREGENT PRINTING (S) PTE LTD
Time to ‘rebalance’
Over the course of this recession we have frequently looked at the potential of using supply chain management to drive positive change in organisations and business models. We have discussed how improved supply chain risk and security management systems, better supplier relations and sourcing and procurement strategies; even complete redesign of organisations and business operations around supply chain functions, can create healthier, higher performing companies and organisations. “Fix your supply chains and you fix the company” was the self-explanatory title of the contribution to our May/June issue from supply chain thought-leader Dr John Gattorna. In this issue – as part of a call for better research and understanding of the contribution of supply chain management and logistics to industry and society – he extends the idea from companies to national economies to regions.
The central and increasingly recognised role of supply chain and logistics systems and processes in the emergence of Asia, in terms of the transformation of its organisations and national economies, and integration of those with each other and with other parts of the global economy, is the rationale behind the set up and existence of Supply Chain Asia Magazine and its parent the Supply Chain Asia Community. As such, as we move through the second half of 2009 we have a sense of optimism, not only because more signs of recovery have been emerging, but because of the probability that this recession has helped to drive home the importance of the discipline of supply chain management and all its constituent parts to the health of organisations and national economies, and to the emergence of Asia. The frequent identification over the past year of supply chain management as a very effective channel to create more sustainable organisastions and economies is one good example.
Another good example comes from the new urgency on the part of the Chinese government to rebalance its economy (perhaps the most significant economic challenge to emerge from the recession on a regional level). As outlined in the Beijing government’s new logistics rejuvenation plan – released as part of the response to the recession – this is a task heavily dependant on getting a good basic logistics system in place throughout the country and ultimately ensuring the creation of efficient supply chain systems and processes to support the domestic economy.
This is a task we will be covering in detail in coming issues of Supply Chain Asia Magazine. In the meantime, we will also be carrying out some rebalancing of our own. Over the coming twelve months, the Supply Chain Asia Dialogues will be rolled out across the region (see President’s Message, overleaf). The goal of the dialogues is to extend the function of informing and supporting the development of the industry to individual Asian cities. At the same time, Supply Chain Asia Magazine will be gradually converted to a subscription-based publication. This is in line with growing demand for supply chain intelligence, analysis and thought-leadership among private companies, universities, government and consultants as the industry gains influence and importance.
We look forward to expanding our role as providers of the highest quality information on the development of the industry in Asia, and to continuing to provide front row seats to watch its emergence.
Turloch Mooney
Editor-in-Chief, Supply Chain Asia MagazineManaging Director, EditorialSC Asia Publications

agilitylogistics.com
WESTERN DIGITAL HAS FREDERICK ANTONY. Facing a surge in worldwide demand for their hard-drives, Western Digital asked Agility’s Frederick Antony to ramp up inventory velocity. With little lead time, he planned and executed a substantial expansion of their Malaysian distribution center that increased capacity, improved pallet position, and added the efficiencies of advanced tracking software. In doubling their output, Frederick showed the high-tech leader that he shares their passion for storage and speed.
WESTERN DIGITAL HAS AGILITY.
Frederick Antony Sr. Logistics Manager
Agility, Malaysia
Pub __________________________________Size: __________________________________Insertion: ______________________________
Agility Western Digital Ad r2
Prepared By Green Street AdsContact: John Espinoza626-644-8094
Supply Chain Asia210mm x 297mm Full Pg TrimAug 20, 2009
AGL-WDIG_ad_SupplyChainAsia.090820.indd 1 8/20/09 12:16:24 PM

supporting organisations
Corporate endorsers
Dear friends and readers,
On September 1 2009, we celebrate the fourth anniversary of Supply Chain Asia. Since the community was founded in 2005, we have been able to experience high growth and support and we want to thank each and every one of you for making this possible. Without you, there would be no Supply Chain Asia as there would be no community to serve.
As a community, our focus was never about the minute details of forming a formal structure comprised of by-laws and constitutions. However, we realised we could not function as an effective framework for the community without bringing like-minded people together to provide direction and support. The Advisory Council and Executive Committee were formed in early 2006 with this sole purpose in mind.
To date, we continue to maintain an informal structure with no formal election or campaigns that would distract us from our work in bringing connectivity and knowledge to community members. While this approach has many benefits, we are also aware of its shortcomings in terms of our ability to maintain a consistent and coordinated structure.
During our last annual EXCO meeting held the day before Supply Chain Asia Forum 2009, the Council and Executive Committee members deliberated over the work we have done for the past four years. It was felt strongly that the capacity to reach out to a wider physical audience through activities in other major cities in Asia would be an excellent complement to our already strong reach in both print and Internet media.
Taking the cue from the results of our discussions, the Council and Executive Committee members residing in each country have decided to take on the responsibility of hosting talks and dialogues in their cities of origins. In the next 12 months, we are targeting to host half-day talks and dialogues in major cities in Asia, including Kuala Lumpur (Malaysia), Surabaya (Indonesia), Mumbai (India), Shanghai (China), Tianjin (China), Taipei (Taiwan), Hong Kong, Sydney (Australia) and Bangkok (Thailand). More news on these dialogues and talks will be posted on our website.
Singapore will remain the host country for the annual Supply Chain Asia Forum and the next event will take place from August 24-27, 2010.
Again, we want to express our heartfelt gratitude for all your support in making Supply Chain Asia a viable entity today. We will continue our small work in bringing knowledge and connectivity through our platform in this magazine, the Internet, and through our talks, dialogues, forums and training initiatives.
Paul LimPresident, Supply Chain Asia
president’sADDReSS
Asosiasi Logistik Indonesia (ALI)
Chartered Institute of Logistics & Transport Singapore (CILT)
China Federation of Logistics & Purchasing (CFLP)
Singapore Economic Development Board (EDB)
Federation of Malaysian Manufacturers (FMM)
Global Logistics Council of Taiwan (GLCT)
International Enterprise Singapore (IE Singapore)
Kainan University of Taiwan (KUT)
Korea International Logistics Council (KILC)
Logistics Association of Australia (LAA)
Logistics and Supply Chain Management Society (LSCMS)
Philippines Institute of Supply Management (PISM)
Supply Chain & Logistics Group of the Middle East (SCLG)
Thai Logistics and Production Society (TLAPS)
list of appointment holders
ExEcutivE committEE mEmbErs
eXeCutiVe teaMFounder/president
Mr Paul Lim, Regional BD Manager, TNT
vice president, international relationsMr Mark Millar, Managing Director, M Power Associates
vice president, training & DevelopmentMr Raymond Heman, Supply Chain Manager,
Eastman Chemicals
vice president, Young professionalsMr Joshua Wu, Supply Chain Manager, INTEL
vice president, Memberships & community DevelopmentMr Ang Tian Teck, Director, StickySpy
aCadeMY board MeMbersMr David Chew, Managing Director, SC Asia Consulting
Mr Raymond Heman, Supply Chain Manager, Eastman Chemicals
Ms Nathalie Ricaud, Director, TAD LogsiticsMr Pari Annamalai, CEO, Planvisage
Mr koh Jin kiat, Regional Operations Director, Reader’s DigestMr Ang Tian Teck, Director, StickySpy
Mr Harry Lagad, IndependentMs Gwendy krijger, Director, ConnectingtheLink
A/P Mark Goh, Director, Industry Research, TLI-APMs Christina Lim, Executive Director, SC Asia Academy
Corporate relationsMr Frank Paul, Managing Director, SC Asia Publications
Mr Darryl Judd, Director, Logistics Recruitment
Young proFessionals adVisorsMr Joshua Wu, Supply Chain Manager, INTEL
Ms Christine Lee, General Manager, FlextronicsMr koh Jin kiat, Regional Operations Director, Reader’s Digest
Mr Ang Tian Teck, Director, StickySpyMr Phil Vaudin, Asst to Chairman, Best Logistics
CountrY representatiVesMr Neil Morrison, Partner, Noble International (Hong kong)
Mr Babhui Lee, Independent (Shenzhen, China)Mr Mark Millar, Managing Director, M Power Associates (Hong kong)
Mr Teoh kok Siang, Site Manager, INTEL (Shanghai, China)Mr Sanjay Goel, Chairman, GTC Inc. (Mumbai, India)
Ms Ayda Sulianti, Vice President, MIF (Surabaya, Indonesia)Mr Nigel Moore, Managing Director, Logistics Recruitment (Dubai)
Mr Sheikh Abdul Hai, Director, Logistics, Abdulla Fouad (Saudi Arabia)Mr Daniel Lu, Consultant, CBS Technology (Malaysia)
Mr Durairaj Veeraiyah, Director, Service Management, BASF (Malaysia)Mr Antonio kent Valderrama, Director, Macrolite Corporation
(Philippines)Mr Pari Annamalai, CEO, Planvisage (Singapore)
Mr Phil Vaudin, Asst to Chairman, Best Logistics (Taiwan)Ms Amanda Rasmussen, Commercial Manager, Maersk Vietnam
(Vietnam)
CoMMittee MeMbersMr Low Mun kong, Independent
Prof Jim Wu, Professor, National Sun Yat Sen university
Young proFessionals eXCopresident
Mr Derrick kim, Asst Manager, British American Tobacco
vice presidentsMr Jacky Soh, Student, Republic Polytechnic
Ms karen Quek, Student, Singapore Management universityMr Marcus Ho, Senior Executive, Lufthansa CargoMr koh Wee Gek, Officer, Singapore Armed Forces
Ms Justina Tay, Student, Temasek PolytechnicMr Aaron Tay, Student, Singapore Management university
Mr Christopher Lo, Student, Singapore Management universityMr khor Yeng Hock, Executive, Panalpina
Mr James Loh, Student, Singapore Management universityMs Natasha koo, Student, university of Melbourne
Supply Chain Asia Magazine (MICA (P) 036/02/2009) is published by SC Asia Publications, a unit of the Supply Chain Asia industry community. All rights reserved. No part of the publication may be reproduced without prior permission from the publisher. For subscription and other enquiries, please visit www.supplychainasia.com

Regional Headquarter:Schaefer Systems International Pte Ltd73, Tuas Avenue 1 Singapore 639512 Phone +65/ 6863 0168Fax +65/ 6863 0288eMail [email protected] www.ssi-schaefer-asia.com
Efficient space utilisation, especially in high-cost cold storage environment is of paramount importance.
SCHAEFER’s mobile racking system is a cost-effective and efficient storage system that can effectively increase pallet capacity by up to 100%! Equipped with the latest technology, with the current EN safety features, the mobile racking system can be customised to specific requirements.
Interested to find out more?
Call us today, or visit us at www.ssi-schaefer-asia.com
“The system maximises both volume capacity and product selectivity, in the space of 2200 m2 at the temperature of -25 ◦C.”
Mr. Kevin LimIntegrated Cold Chain
Logistics Sdn Bhd
Mobile Racking SystemCost-effective, Semi-Automated, Safe
SCA 216x303 bleed Ad_Mobile_Reg.indd 1 8/15/2008 4:42:07 PM
Supply Chain Asia September/October 2009
infrastructure update6 developments
•
•
•
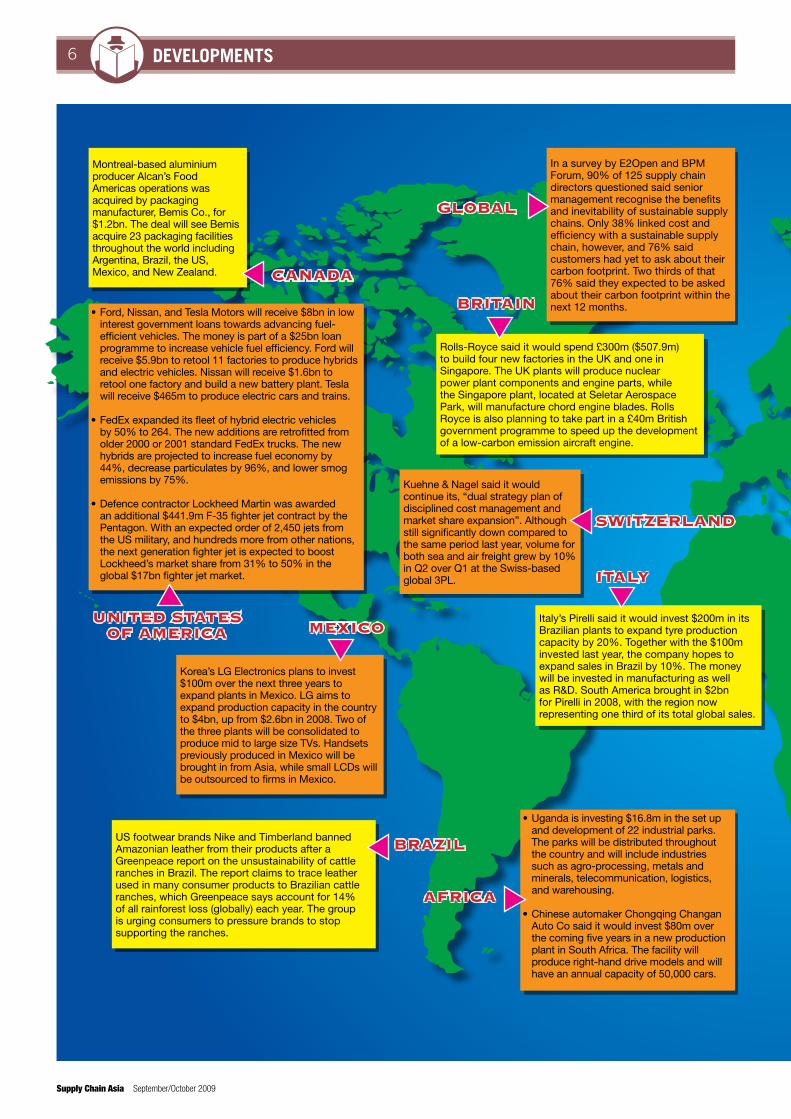
Ford, Nissan, and Tesla Motors will receive $8bn in low interest government loans towards advancing fuel-efficient vehicles. The money is part of a $25bn loan programme to increase vehicle fuel efficiency. Ford will receive $5.9bn to retool 11 factories to produce hybrids and electric vehicles. Nissan will receive $1.6bn to retool one factory and build a new battery plant. Tesla will receive $465m to produce electric cars and trains.
FedEx expanded its fleet of hybrid electric vehicles by 50% to 264. The new additions are retrofitted from older 2000 or 2001 standard FedEx trucks. The new hybrids are projected to increase fuel economy by 44%, decrease particulates by 96%, and lower smog emissions by 75%.
Defence contractor Lockheed Martin was awarded an additional $441.9m F-35 fighter jet contract by the Pentagon. With an expected order of 2,450 jets from the US military, and hundreds more from other nations, the next generation fighter jet is expected to boost Lockheed’s market share from 31% to 50% in the global $17bn fighter jet market.
UNITED STATES OF AMERICA
BRAzIl
MExICO
In a survey by E2Open and BPM Forum, 90% of 125 supply chain directors questioned said senior management recognise the benefits and inevitability of sustainable supply chains. Only 38% linked cost and efficiency with a sustainable supply chain, however, and 76% said customers had yet to ask about their carbon footprint. Two thirds of that 76% said they expected to be asked about their carbon footprint within the next 12 months.
US footwear brands Nike and Timberland banned Amazonian leather from their products after a Greenpeace report on the unsustainability of cattle ranches in Brazil. The report claims to trace leather used in many consumer products to Brazilian cattle ranches, which Greenpeace says account for 14% of all rainforest loss (globally) each year. The group is urging consumers to pressure brands to stop supporting the ranches.
Kuehne & Nagel said it would continue its, “dual strategy plan of disciplined cost management and market share expansion”. Although still significantly down compared to the same period last year, volume for both sea and air freight grew by 10% in Q2 over Q1 at the Swiss-based global 3PL.
Italy’s Pirelli said it would invest $200m in its Brazilian plants to expand tyre production capacity by 20%. Together with the $100m invested last year, the company hopes to expand sales in Brazil by 10%. The money will be invested in manufacturing as well as R&D. South America brought in $2bn for Pirelli in 2008, with the region now representing one third of its total global sales.
ITAly
GlOBAl
Montreal-based aluminium producer Alcan’s Food Americas operations was acquired by packaging manufacturer, Bemis Co., for $1.2bn. The deal will see Bemis acquire 23 packaging facilities throughout the world including Argentina, Brazil, the US, Mexico, and New Zealand.
Korea’s LG Electronics plans to invest $100m over the next three years to expand plants in Mexico. LG aims to expand production capacity in the country to $4bn, up from $2.6bn in 2008. Two of the three plants will be consolidated to produce mid to large size TVs. Handsets previously produced in Mexico will be brought in from Asia, while small LCDs will be outsourced to firms in Mexico.
CANADA
SwITzERlAND
Rolls-Royce said it would spend £300m ($507.9m) to build four new factories in the UK and one in Singapore. The UK plants will produce nuclear power plant components and engine parts, while the Singapore plant, located at Seletar Aerospace Park, will manufacture chord engine blades. Rolls Royce is also planning to take part in a £40m British government programme to speed up the development of a low-carbon emission aircraft engine.
BRITAIN
•
•
Uganda is investing $16.8m in the set up and development of 22 industrial parks. The parks will be distributed throughout the country and will include industries such as agro-processing, metals and minerals, telecommunication, logistics, and warehousing.
Chinese automaker Chongqing Changan Auto Co said it would invest $80m over the coming five years in a new production plant in South Africa. The facility will produce right-hand drive models and will have an annual capacity of 50,000 cars.
AFRICA
September/October 2009 Supply Chain Asia
infrastructure update 7developments
•
•
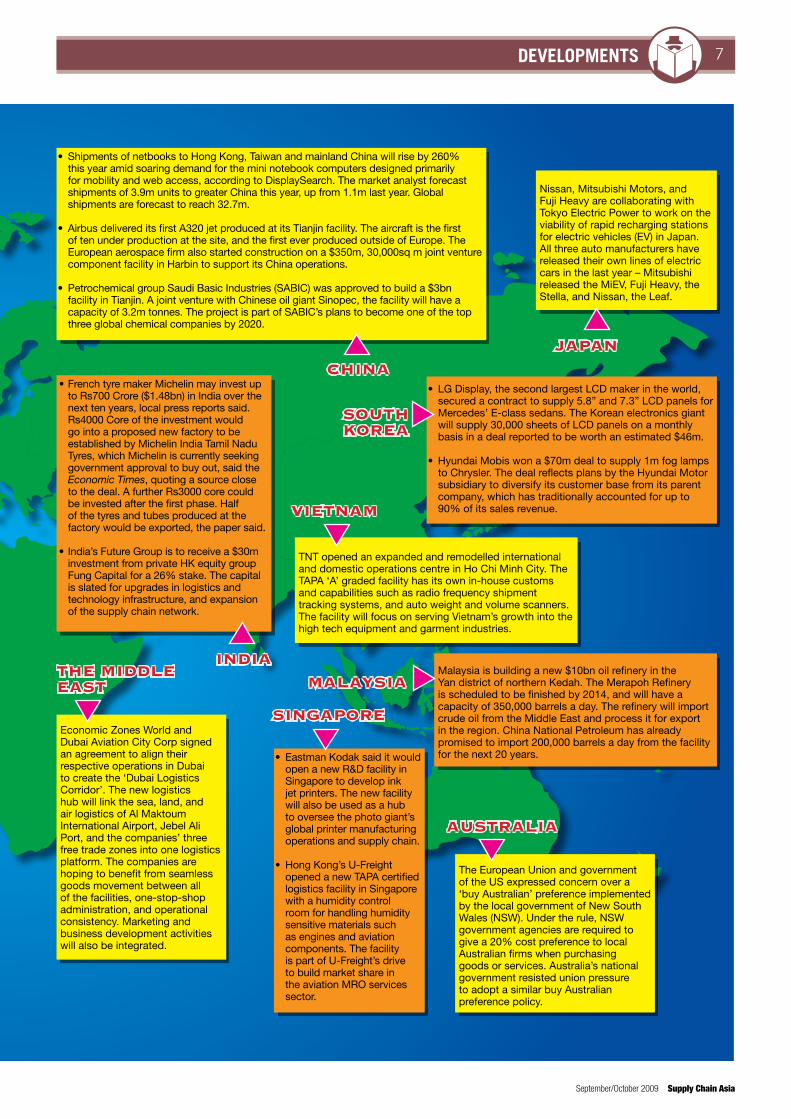
French tyre maker Michelin may invest up to Rs700 Crore ($1.48bn) in India over the next ten years, local press reports said. Rs4000 Core of the investment would go into a proposed new factory to be established by Michelin India Tamil Nadu Tyres, which Michelin is currently seeking government approval to buy out, said the Economic Times, quoting a source close to the deal. A further Rs3000 core could be invested after the first phase. Half of the tyres and tubes produced at the factory would be exported, the paper said.
India’s Future Group is to receive a $30m investment from private HK equity group Fung Capital for a 26% stake. The capital is slated for upgrades in logistics and technology infrastructure, and expansion of the supply chain network.
Nissan, Mitsubishi Motors, and Fuji Heavy are collaborating with Tokyo Electric Power to work on the viability of rapid recharging stations for electric vehicles (EV) in Japan. All three auto manufacturers have released their own lines of electric cars in the last year – Mitsubishi released the MiEV, Fuji Heavy, the Stella, and Nissan, the Leaf.
Malaysia is building a new $10bn oil refinery in the Yan district of northern Kedah. The Merapoh Refinery is scheduled to be finished by 2014, and will have a capacity of 350,000 barrels a day. The refinery will import crude oil from the Middle East and process it for export in the region. China National Petroleum has already promised to import 200,000 barrels a day from the facility for the next 20 years.
VIETNAM
SOUTh KOREA
INDIAThE MIDDlE EAST
AUSTRAlIA
MAlAySIA
JApAN
•
•
Eastman Kodak said it would open a new R&D facility in Singapore to develop ink jet printers. The new facility will also be used as a hub to oversee the photo giant’s global printer manufacturing operations and supply chain.
Hong Kong’s U-Freight opened a new TAPA certified logistics facility in Singapore with a humidity control room for handling humidity sensitive materials such as engines and aviation components. The facility is part of U-Freight’s drive to build market share in the aviation MRO services sector.
•
•
LG Display, the second largest LCD maker in the world, secured a contract to supply 5.8” and 7.3” LCD panels for Mercedes’ E-class sedans. The Korean electronics giant will supply 30,000 sheets of LCD panels on a monthly basis in a deal reported to be worth an estimated $46m.
Hyundai Mobis won a $70m deal to supply 1m fog lamps to Chrysler. The deal reflects plans by the Hyundai Motor subsidiary to diversify its customer base from its parent company, which has traditionally accounted for up to 90% of its sales revenue.
•
•
•
Shipments of netbooks to Hong Kong, Taiwan and mainland China will rise by 260% this year amid soaring demand for the mini notebook computers designed primarily for mobility and web access, according to DisplaySearch. The market analyst forecast shipments of 3.9m units to greater China this year, up from 1.1m last year. Global shipments are forecast to reach 32.7m.
Airbus delivered its first A320 jet produced at its Tianjin facility. The aircraft is the first of ten under production at the site, and the first ever produced outside of Europe. The European aerospace firm also started construction on a $350m, 30,000sq m joint venture component facility in Harbin to support its China operations.
Petrochemical group Saudi Basic Industries (SABIC) was approved to build a $3bn facility in Tianjin. A joint venture with Chinese oil giant Sinopec, the facility will have a capacity of 3.2m tonnes. The project is part of SABIC’s plans to become one of the top three global chemical companies by 2020.
ChINA
TNT opened an expanded and remodelled international and domestic operations centre in Ho Chi Minh City. The TAPA ‘A’ graded facility has its own in-house customs and capabilities such as radio frequency shipment tracking systems, and auto weight and volume scanners. The facility will focus on serving Vietnam’s growth into the high tech equipment and garment industries.
SINGApORE
The European Union and government of the US expressed concern over a ‘buy Australian’ preference implemented by the local government of New South Wales (NSW). Under the rule, NSW government agencies are required to give a 20% cost preference to local Australian firms when purchasing goods or services. Australia’s national government resisted union pressure to adopt a similar buy Australian preference policy.
Economic Zones World and Dubai Aviation City Corp signed an agreement to align their respective operations in Dubai to create the ‘Dubai Logistics Corridor’. The new logistics hub will link the sea, land, and air logistics of Al Maktoum International Airport, Jebel Ali Port, and the companies’ three free trade zones into one logistics platform. The companies are hoping to benefit from seamless goods movement between all of the facilities, one-stop-shop administration, and operational consistency. Marketing and business development activities will also be integrated.
Supply Chain Asia September/October 2009
infrastructure update8 transporters – air cargo
Beijing ups the ante in the north Asia hub gameBeijing is capitalising on the vibrancy of its post-Olympics infrastructure and city spirit with a big push to become a serious northeast Asia air logistics and supply chain hub. In October of this year, the Beijing Airport City Logistics Park (ACLP) will be fully operational at Beijing Capital International Airport — China’s busiest civil airport — marking a huge leap in efficiency and layout of support infrastructure for major air cargo operations in the Chinese capital.
“It’s the first time we’ll have ground handling, customs, quarantine and inspec-tion all located together next to the runway,” said Ellen Hu, vice president of corporate strategy with ACL, the developer and op-erator of the logistics park.
The 3.4m sq m development, built at a cost of RMB4bn ($585m), offers clients new infrastructure, services and the regulatory environment for a range of different business functions, from cargo handling and bonded logistics, to trading, R&D and reverse supply chain operations.
According to ACL, logistics companies currently operating at the old cargo handling area of Beijing Capital Airport are required to move to the new park. DTW, Rockwood and Kerry EAS have already moved into the ACLP, with UPS, DHL, FedEx and TNT
Airport cargo traffic, 2008
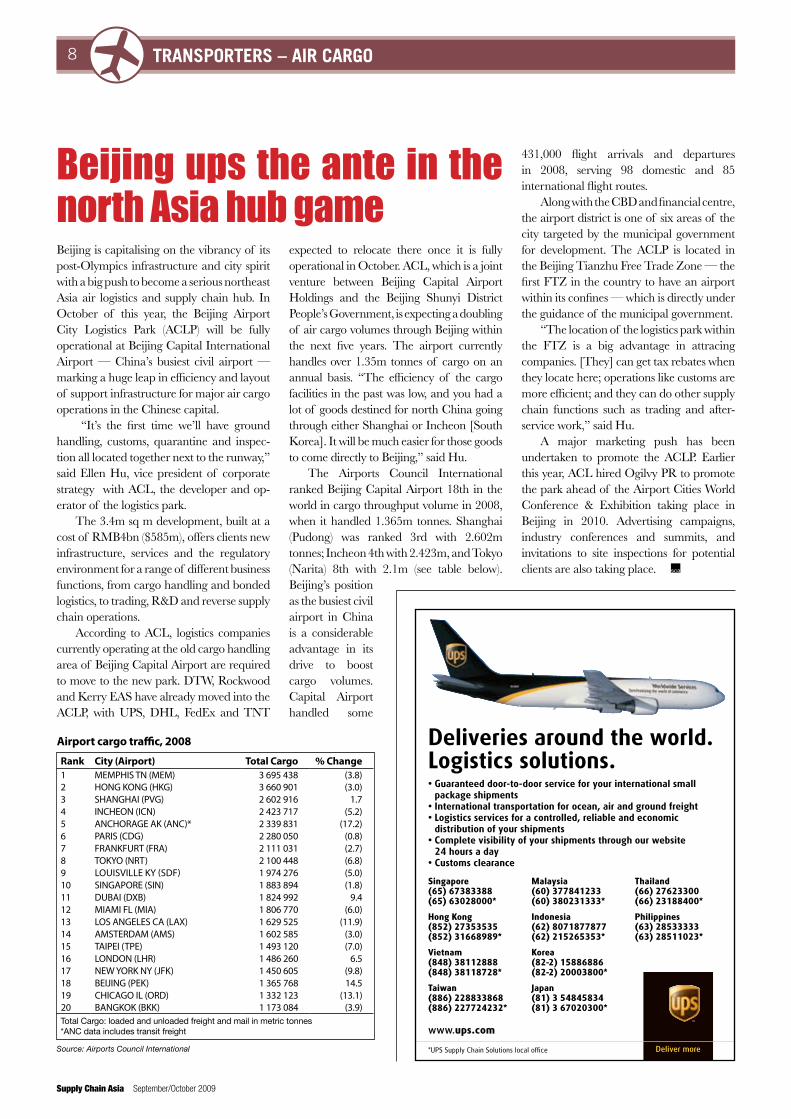
Rank City (Airport) Total Cargo % Change1 MEMPHIS TN (MEM) 3 695 438 (3.8)2 HONG KONG (HKG) 3 660 901 (3.0)3 SHANGHAI (PVG) 2 602 916 1.74 INCHEON (ICN) 2 423 717 (5.2)5 ANCHORAGE AK (ANC)* 2 339 831 (17.2)6 PARIS (CDG) 2 280 050 (0.8)7 FRANKFURT (FRA) 2 111 031 (2.7)8 TOKYO (NRT) 2 100 448 (6.8)9 LOUISVILLE KY (SDF) 1 974 276 (5.0)10 SINGAPORE (SIN) 1 883 894 (1.8)11 DUBAI (DXB) 1 824 992 9.412 MIAMI FL (MIA) 1 806 770 (6.0)13 LOS ANGELES CA (LAX) 1 629 525 (11.9)14 AMSTERDAM (AMS) 1 602 585 (3.0)15 TAIPEI (TPE) 1 493 120 (7.0)16 LONDON (LHR) 1 486 260 6.517 NEW YORK NY (JFK) 1 450 605 (9.8)18 BEIJING (PEK) 1 365 768 14.519 CHICAGO IL (ORD) 1 332 123 (13.1)20 BANGKOK (BKK) 1 173 084 (3.9)Total Cargo: loaded and unloaded freight and mail in metric tonnes*ANC data includes transit freight
431,000 flight arrivals and departures in 2008, serving 98 domestic and 85 international flight routes.
Along with the CBD and financial centre, the airport district is one of six areas of the city targeted by the municipal government for development. The ACLP is located in the Beijing Tianzhu Free Trade Zone — the first FTZ in the country to have an airport within its confines — which is directly under the guidance of the municipal government.
“The location of the logistics park within the FTZ is a big advantage in attracing companies. [They] can get tax rebates when they locate here; operations like customs are more efficient; and they can do other supply chain functions such as trading and after-service work,” said Hu.
A major marketing push has been undertaken to promote the ACLP. Earlier this year, ACL hired Ogilvy PR to promote the park ahead of the Airport Cities World Conference & Exhibition taking place in Beijing in 2010. Advertising campaigns, industry conferences and summits, and invitations to site inspections for potential clients are also taking place.
expected to relocate there once it is fully operational in October. ACL, which is a joint venture between Beijing Capital Airport Holdings and the Beijing Shunyi District People’s Government, is expecting a doubling of air cargo volumes through Beijing within the next five years. The airport currently handles over 1.35m tonnes of cargo on an annual basis. “The efficiency of the cargo facilities in the past was low, and you had a lot of goods destined for north China going through either Shanghai or Incheon [South Korea]. It will be much easier for those goods to come directly to Beijing,” said Hu.
The Airports Council International ranked Beijing Capital Airport 18th in the world in cargo throughput volume in 2008, when it handled 1.365m tonnes. Shanghai (Pudong) was ranked 3rd with 2.602m tonnes; Incheon 4th with 2.423m, and Tokyo (Narita) 8th with 2.1m (see table below).Beijing’s position as the busiest civil airport in China is a considerable advantage in its drive to boost cargo volumes. Capital Airport handled some
Date: 14/7/09 Op: SGRevise: 21/7/09 6th Op: dm Size: 120x85mm AH: NK (5515)
Deliveries around the world. Logistics solutions.• Guaranteed door-to-door service for your international small
package shipments• International transportation for ocean, air and ground freight• Logistics services for a controlled, reliable and economic
distribution of your shipments• Complete visibility of your shipments through our website
24 hours a day• Customs clearance
*UPS Supply Chain Solutions local office
COUNTRY: ASIA
CLASSIFICATION:
COURIER
SERVICES
CLIENT: UPS
DIRECTORY:
SUPPLY CHAIN
ASIA
www.ups.com
Singapore(65) 67383388(65) 63028000*
Hong Kong(852) 27353535(852) 31668989*
Vietnam(848) 38112888(848) 38118728*
Taiwan(886) 228833868(886) 227724232*
Malaysia(60) 377841233(60) 380231333*
Indonesia(62) 8071877877(62) 215265353*
Korea(82-2) 15886886(82-2) 20003800*
Japan(81) 3 54845834(81) 3 67020300*
Thailand(66) 27623300(66) 23188400*
Philippines(63) 28533333(63) 28511023*
UPS Asia 120x85 21/7/09 11:06 Page 1
Source: Airports Council International
9transporters – maritime
September/October 2009 Supply Chain Asia
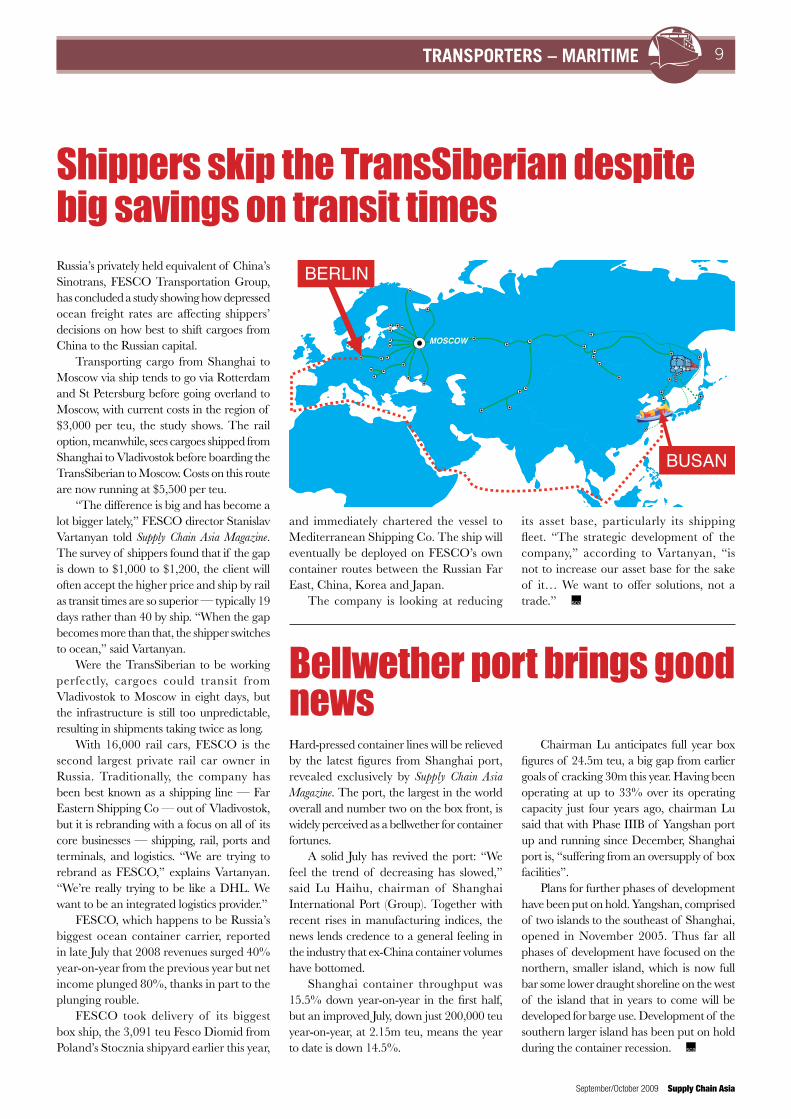
Shippers skip the TransSiberian despite big savings on transit timesRussia’s privately held equivalent of China’s Sinotrans, FESCO Transportation Group, has concluded a study showing how depressed ocean freight rates are affecting shippers’ decisions on how best to shift cargoes from China to the Russian capital.
Transporting cargo from Shanghai to Moscow via ship tends to go via Rotterdam and St Petersburg before going overland to Moscow, with current costs in the region of $3,000 per teu, the study shows. The rail option, meanwhile, sees cargoes shipped from Shanghai to Vladivostok before boarding the TransSiberian to Moscow. Costs on this route are now running at $5,500 per teu.
“The difference is big and has become a lot bigger lately,” FESCO director Stanislav Vartanyan told Supply Chain Asia Magazine. The survey of shippers found that if the gap is down to $1,000 to $1,200, the client will often accept the higher price and ship by rail as transit times are so superior — typically 19 days rather than 40 by ship. “When the gap becomes more than that, the shipper switches to ocean,” said Vartanyan.
Were the TransSiberian to be working perfectly, cargoes could transit from Vladivostok to Moscow in eight days, but the infrastructure is still too unpredictable, resulting in shipments taking twice as long.
With 16,000 rail cars, FESCO is the second largest private rail car owner in Russia. Traditionally, the company has been best known as a shipping line — Far Eastern Shipping Co — out of Vladivostok, but it is rebranding with a focus on all of its core businesses — shipping, rail, ports and terminals, and logistics. “We are trying to rebrand as FESCO,” explains Vartanyan. “We’re really trying to be like a DHL. We want to be an integrated logistics provider.”
FESCO, which happens to be Russia’s biggest ocean container carrier, reported in late July that 2008 revenues surged 40% year-on-year from the previous year but net income plunged 80%, thanks in part to the plunging rouble.
FESCO took delivery of its biggest box ship, the 3,091 teu Fesco Diomid from Poland’s Stocznia shipyard earlier this year,
and immediately chartered the vessel to Mediterranean Shipping Co. The ship will eventually be deployed on FESCO’s own container routes between the Russian Far East, China, Korea and Japan.
The company is looking at reducing
its asset base, particularly its shipping fleet. “The strategic development of the company,” according to Vartanyan, “is not to increase our asset base for the sake of it… We want to offer solutions, not a trade.”
Hard-pressed container lines will be relieved by the latest figures from Shanghai port, revealed exclusively by Supply Chain Asia Magazine. The port, the largest in the world overall and number two on the box front, is widely perceived as a bellwether for container fortunes.
A solid July has revived the port: “We feel the trend of decreasing has slowed,” said Lu Haihu, chairman of Shanghai International Port (Group). Together with recent rises in manufacturing indices, the news lends credence to a general feeling in the industry that ex-China container volumes have bottomed.
Shanghai container throughput was 15.5% down year-on-year in the first half, but an improved July, down just 200,000 teu year-on-year, at 2.15m teu, means the year to date is down 14.5%.
Chairman Lu anticipates full year box figures of 24.5m teu, a big gap from earlier goals of cracking 30m this year. Having been operating at up to 33% over its operating capacity just four years ago, chairman Lu said that with Phase IIIB of Yangshan port up and running since December, Shanghai port is, “suffering from an oversupply of box facilities”.
Plans for further phases of development have been put on hold. Yangshan, comprised of two islands to the southeast of Shanghai, opened in November 2005. Thus far all phases of development have focused on the northern, smaller island, which is now full bar some lower draught shoreline on the west of the island that in years to come will be developed for barge use. Development of the southern larger island has been put on hold during the container recession.
Bellwether port brings good news
BUSAN
BERLIN
MOSCOW
10 transporters – maritime
Supply Chain Asia September/October 2009
Shanghai is already the world’s largest port. Only Singapore, 3,800 km to the south, lies ahead of China’s financial
metropolis in terms of container volumes, and this last hurdle could soon be overcome.
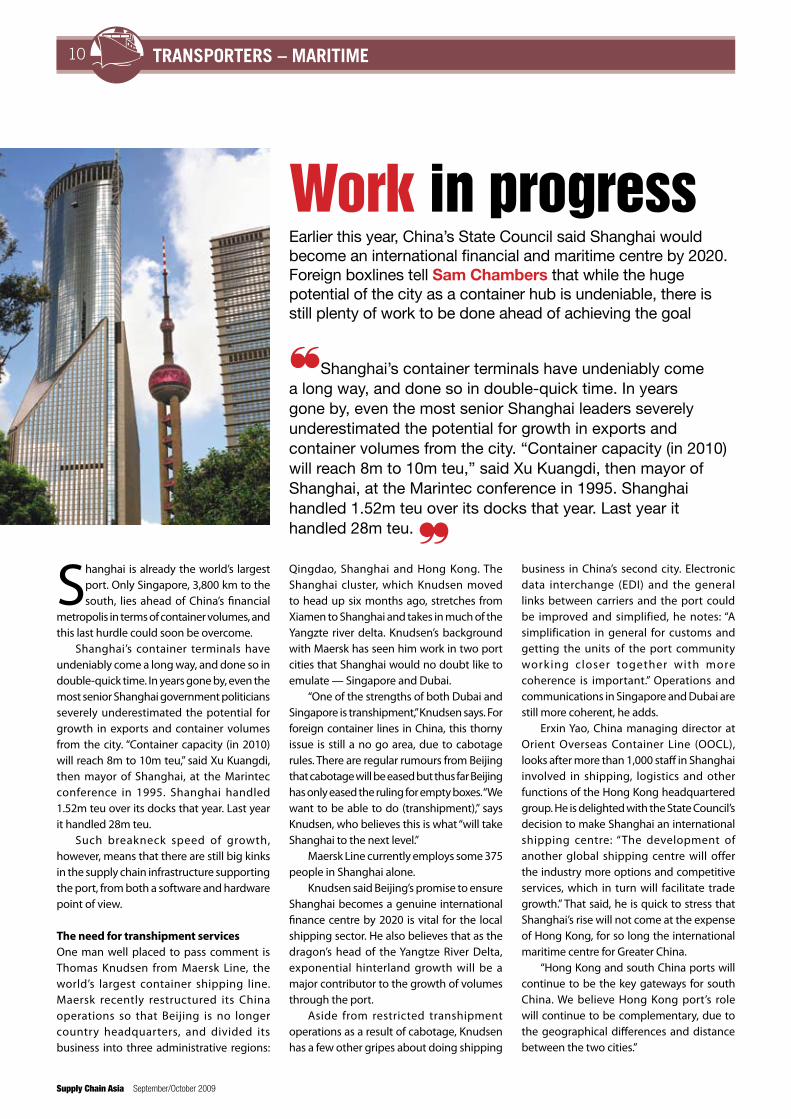
Shanghai’s container terminals have undeniably come a long way, and done so in double-quick time. In years gone by, even the most senior Shanghai government politicians severely underestimated the potential for growth in exports and container volumes from the city. “Container capacity (in 2010) will reach 8m to 10m teu,” said Xu Kuangdi, then mayor of Shanghai, at the Marintec conference in 1995. Shanghai handled 1.52m teu over its docks that year. Last year it handled 28m teu.
Such breakneck speed of growth, however, means that there are still big kinks in the supply chain infrastructure supporting the port, from both a software and hardware point of view.
The need for transhipment servicesOne man well placed to pass comment is Thomas Knudsen from Maersk Line, the world’s largest container shipping line. Maersk recently restructured its China operations so that Beijing is no longer country headquarters, and divided its business into three administrative regions:
Qingdao, Shanghai and Hong Kong. The Shanghai cluster, which Knudsen moved to head up six months ago, stretches from Xiamen to Shanghai and takes in much of the Yangzte river delta. Knudsen’s background with Maersk has seen him work in two port cities that Shanghai would no doubt like to emulate — Singapore and Dubai.
“One of the strengths of both Dubai and Singapore is transhipment,” Knudsen says. For foreign container lines in China, this thorny issue is still a no go area, due to cabotage rules. There are regular rumours from Beijing that cabotage will be eased but thus far Beijing has only eased the ruling for empty boxes. “We want to be able to do (transhipment),” says Knudsen, who believes this is what “will take Shanghai to the next level.”
Maersk Line currently employs some 375 people in Shanghai alone.
Knudsen said Beijing’s promise to ensure Shanghai becomes a genuine international finance centre by 2020 is vital for the local shipping sector. He also believes that as the dragon’s head of the Yangtze River Delta, exponential hinterland growth will be a major contributor to the growth of volumes through the port.
Aside from restricted transhipment operations as a result of cabotage, Knudsen has a few other gripes about doing shipping
business in China’s second city. Electronic data interchange (EDI) and the general links between carriers and the port could be improved and simplified, he notes: “A simplification in general for customs and getting the units of the port community working closer together with more coherence is important.” Operations and communications in Singapore and Dubai are still more coherent, he adds.
Erxin Yao, China managing director at Orient Overseas Container Line (OOCL), looks after more than 1,000 staff in Shanghai involved in shipping, logistics and other functions of the Hong Kong headquartered group. He is delighted with the State Council’s decision to make Shanghai an international shipping centre: “The development of another global shipping centre will offer the industry more options and competitive services, which in turn will facilitate trade growth.” That said, he is quick to stress that Shanghai’s rise will not come at the expense of Hong Kong, for so long the international maritime centre for Greater China.
“Hong Kong and south China ports will continue to be the key gateways for south China. We believe Hong Kong port’s role will continue to be complementary, due to the geographical differences and distance between the two cities.”
❝Shanghai’s container terminals have undeniably come a long way, and done so in double-quick time. In years gone by, even the most senior Shanghai leaders severely underestimated the potential for growth in exports and container volumes from the city. “Container capacity (in 2010) will reach 8m to 10m teu,” said Xu Kuangdi, then mayor of Shanghai, at the Marintec conference in 1995. Shanghai handled 1.52m teu over its docks that year. Last year it handled 28m teu. ❞
Work in progressEarlier this year, China’s State Council said Shanghai would become an international financial and maritime centre by 2020. Foreign boxlines tell Sam Chambers that while the huge potential of the city as a container hub is undeniable, there is still plenty of work to be done ahead of achieving the goal
11transporters – maritime
September/October 2009 Supply Chain Asia
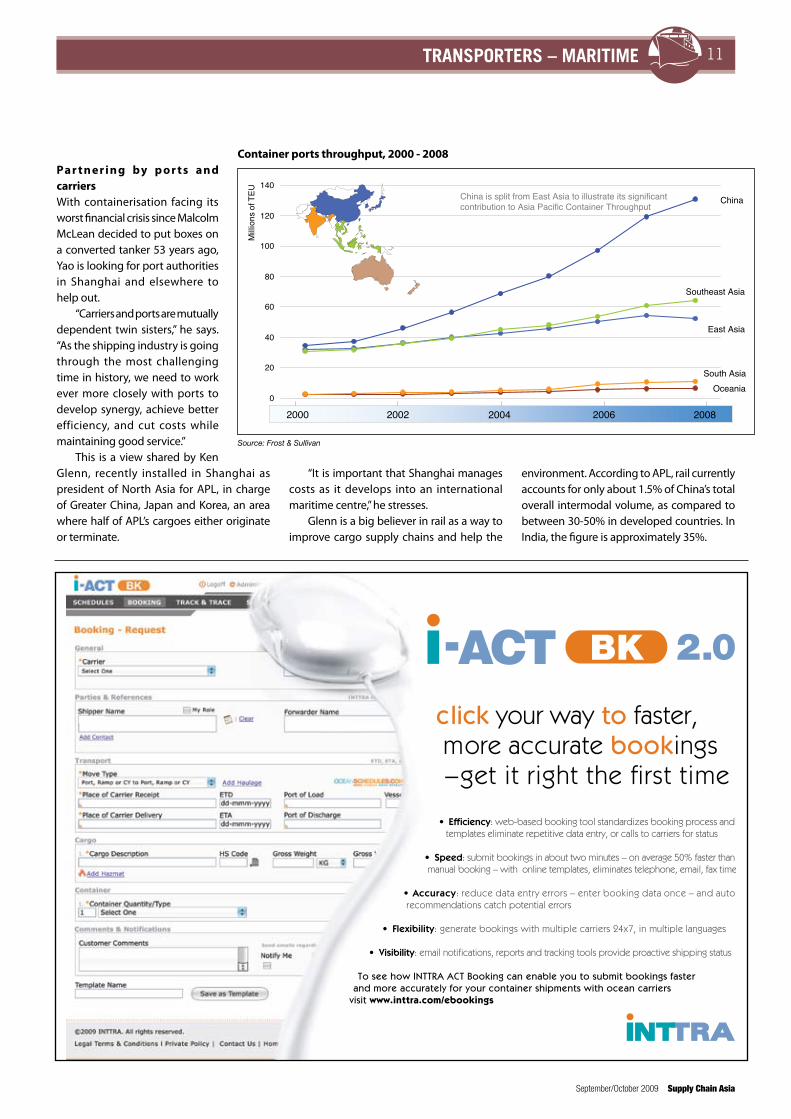
Container Ports: Container Ports Throughput, 2000 - 2008
0
20
40
60
80
100
120
140
Mill
ions
of T
EU
20082006200420022000
China
Southeast Asia
East Asia
South AsiaOceania
China is split from East Asia to illustrate its significant contribution to Asia Pacific Container Throughput
Pa r t n e r i n g by p o r t s a n d carriers With containerisation facing its worst financial crisis since Malcolm McLean decided to put boxes on a converted tanker 53 years ago, Yao is looking for port authorities in Shanghai and elsewhere to help out.
“Carriers and ports are mutually dependent twin sisters,” he says. “As the shipping industry is going through the most challenging time in history, we need to work ever more closely with ports to develop synergy, achieve better efficiency, and cut costs while maintaining good service.”
This is a view shared by Ken Glenn, recently installed in Shanghai as president of North Asia for APL, in charge of Greater China, Japan and Korea, an area where half of APL’s cargoes either originate or terminate.
“It is important that Shanghai manages costs as it develops into an international maritime centre,” he stresses.
Glenn is a big believer in rail as a way to improve cargo supply chains and help the
Container ports throughput, 2000 - 2008
Source: Frost & Sullivan
environment. According to APL, rail currently accounts for only about 1.5% of China’s total overall intermodal volume, as compared to between 30-50% in developed countries. In India, the figure is approximately 35%.
12 transporters – maritime
Supply Chain Asia September/October 2009
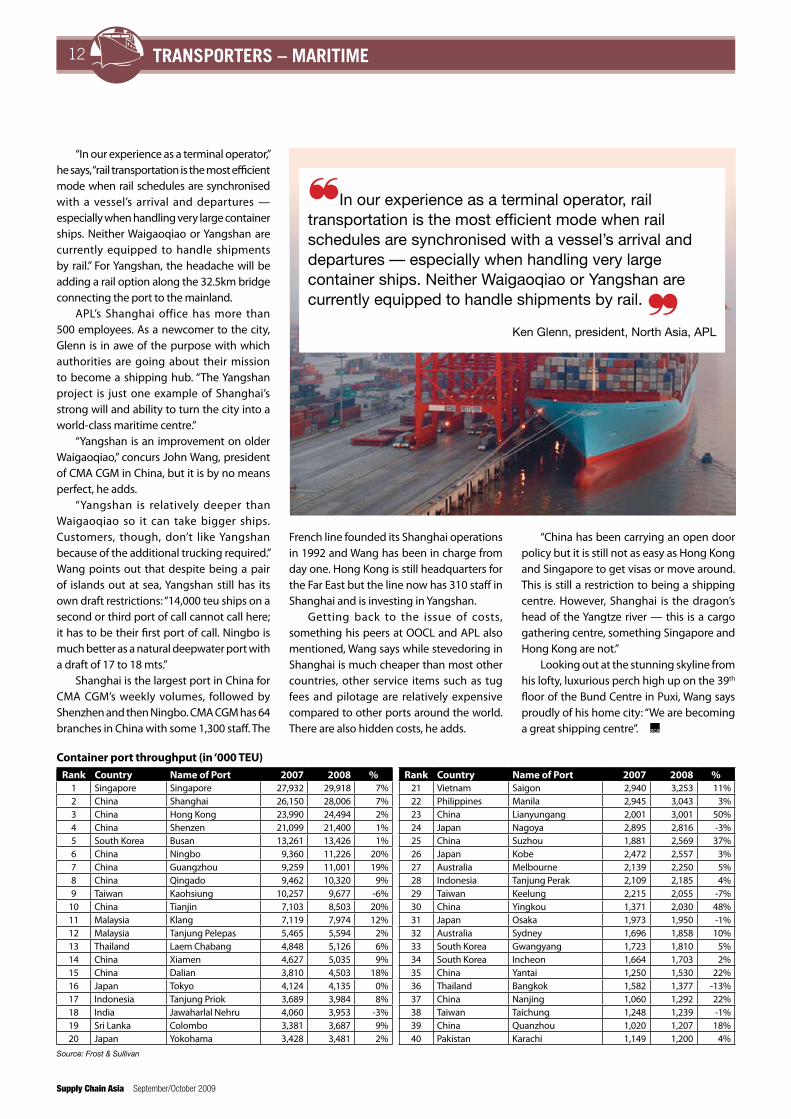
“In our experience as a terminal operator,” he says, “rail transportation is the most efficient mode when rail schedules are synchronised with a vessel’s arrival and departures — especially when handling very large container ships. Neither Waigaoqiao or Yangshan are currently equipped to handle shipments by rail.” For Yangshan, the headache will be adding a rail option along the 32.5km bridge connecting the port to the mainland.
APL’s Shanghai office has more than 500 employees. As a newcomer to the city, Glenn is in awe of the purpose with which authorities are going about their mission to become a shipping hub. “The Yangshan project is just one example of Shanghai’s strong will and ability to turn the city into a world-class maritime centre.”
“Yangshan is an improvement on older Waigaoqiao,” concurs John Wang, president of CMA CGM in China, but it is by no means perfect, he adds.
“Yangshan is relatively deeper than Waigaoqiao so it can take bigger ships. Customers, though, don’t like Yangshan because of the additional trucking required.” Wang points out that despite being a pair of islands out at sea, Yangshan still has its own draft restrictions: “14,000 teu ships on a second or third port of call cannot call here; it has to be their first port of call. Ningbo is much better as a natural deepwater port with a draft of 17 to 18 mts.”
Shanghai is the largest port in China for CMA CGM’s weekly volumes, followed by Shenzhen and then Ningbo. CMA CGM has 64 branches in China with some 1,300 staff. The
French line founded its Shanghai operations in 1992 and Wang has been in charge from day one. Hong Kong is still headquarters for the Far East but the line now has 310 staff in Shanghai and is investing in Yangshan.
Getting back to the issue of costs, something his peers at OOCL and APL also mentioned, Wang says while stevedoring in Shanghai is much cheaper than most other countries, other service items such as tug fees and pilotage are relatively expensive compared to other ports around the world. There are also hidden costs, he adds.
“China has been carrying an open door policy but it is still not as easy as Hong Kong and Singapore to get visas or move around. This is still a restriction to being a shipping centre. However, Shanghai is the dragon’s head of the Yangtze river — this is a cargo gathering centre, something Singapore and Hong Kong are not.”
Looking out at the stunning skyline from his lofty, luxurious perch high up on the 39th floor of the Bund Centre in Puxi, Wang says proudly of his home city: “We are becoming a great shipping centre”.
❝In our experience as a terminal operator, rail transportation is the most efficient mode when rail schedules are synchronised with a vessel’s arrival and departures — especially when handling very large container ships. Neither Waigaoqiao or Yangshan are currently equipped to handle shipments by rail. ❞
Ken Glenn, president, North Asia, APL
Container port throughput (in ‘000 TEU)Rank Country Name of Port 2007 2008 %
21 Vietnam Saigon 2,940 3,253 11%22 Philippines Manila 2,945 3,043 3%23 China Lianyungang 2,001 3,001 50%24 Japan Nagoya 2,895 2,816 -3%25 China Suzhou 1,881 2,569 37%26 Japan Kobe 2,472 2,557 3%27 Australia Melbourne 2,139 2,250 5%28 Indonesia Tanjung Perak 2,109 2,185 4%29 Taiwan Keelung 2,215 2,055 -7%30 China Yingkou 1,371 2,030 48%31 Japan Osaka 1,973 1,950 -1%32 Australia Sydney 1,696 1,858 10%33 South Korea Gwangyang 1,723 1,810 5%34 South Korea Incheon 1,664 1,703 2%35 China Yantai 1,250 1,530 22%36 Thailand Bangkok 1,582 1,377 -13%37 China Nanjing 1,060 1,292 22%38 Taiwan Taichung 1,248 1,239 -1%39 China Quanzhou 1,020 1,207 18%40 Pakistan Karachi 1,149 1,200 4%
Rank Country Name of Port 2007 2008 %1 Singapore Singapore 27,932 29,918 7%2 China Shanghai 26,150 28,006 7%3 China Hong Kong 23,990 24,494 2%4 China Shenzen 21,099 21,400 1%5 South Korea Busan 13,261 13,426 1%6 China Ningbo 9,360 11,226 20%7 China Guangzhou 9,259 11,001 19%8 China Qingado 9,462 10,320 9%9 Taiwan Kaohsiung 10,257 9,677 -6%
10 China Tianjin 7,103 8,503 20%11 Malaysia Klang 7,119 7,974 12%12 Malaysia Tanjung Pelepas 5,465 5,594 2%13 Thailand Laem Chabang 4,848 5,126 6%14 China Xiamen 4,627 5,035 9%15 China Dalian 3,810 4,503 18%16 Japan Tokyo 4,124 4,135 0%17 Indonesia Tanjung Priok 3,689 3,984 8%18 India Jawaharlal Nehru 4,060 3,953 -3%19 Sri Lanka Colombo 3,381 3,687 9%20 Japan Yokohama 3,428 3,481 2%
Source: Frost & Sullivan

www.supplychainasia.comwww.supplychainasia.com
Supply Chain Asia MagazineReaching over 40,000 key industry executives*
A sample of our reader database
DP World Senior VP FedEx Corp Chief EconomistFinancial Times China Correspondent Eastman Chemical Director, Supply Chain Solutions Eastman Kodak Director, Demand and PlanningEmirates Shipping Line President & CEOEmirates SkyCargo Senior VP, CargoEpson CFOFlextronics DirectorFujitsu PC Asia Pacific Head of Supply ChainFord Motor Co Director, Service Parts PurchasingGeneral Motors ODC MDGoodyear Tire Supply Chain/Logistics Drector,Global Sourcing OfficeHong Kong Air Cargo Terminals MDHong Kong Shippers CouncilExecutive DirectorHewlett Packard APJ Manager, Strategic Planning and Modeling Hipro Electronics Executive VPIBM VP, Global LogisticsInha University, South Korea Professor, Maritime & LogisticsIntel APAC/Japan SCS ManagerINTTRA CEOInvest Hong Kong Head of Transportation Jones Lange LaSalle Head of Industrial Practice, ChinaKenwood Electronics Singapore Finance ManagerKorea Trade Center Strategic Research DirectorKuehne + Nagel MDLenovo Executive DirectorLG Electronics Finance ManagerLufthansa Cargo Regional Manager, Asia PacificMaersk CEO, ChinaMattel Global Procurement VP
McKinsey Senior ConsultantMicrosoft Operations Logistics Manager ModusLink Senior VPMotorola Inc Global Lead, Transportation and FulfillmentNestle VPNokia Logistics Director, Asia PacificOracle Corp Senior DirectorPhilips Electronics Director, Air & CourierProLogis VPProctor & Gamble Country ManagerRabobank VPRW Baird Research DirectorSamsung Asia Manager, Supply Chain ManagementSara Lee VP, Operations Shanghai Airport Authority VPShanghai International Port Group ChairmanSinotrans DirectorSony Electronics Divisional MDSony Ericsson Mobile Communications Senior Manager, Asia PacificStarbucks Supply Chain DirectorTaipei Computer Association DirectorToshiba Data Dynamics Finance ControllerTNT SVPUnilever Senior SC Planning ManagerVisteon Global Purchasing DirectorWal-Mart SVP and COOWestern Digital President & CEOXerox CorporationDirector of Supply Chain & LogisticsYCH Group Chairman
Accenture MD, Supply Chain Asia PacificAgility CEO, Asia PacificAir China Cargo PresidentAirbus DirectorAmway Senior Distribution ManagerAramex CEOArshiya InternationalPresidentAudi Executive Director, ChinaAvon Executive Director, StrategyBASF Senior Manager, Supply Chain ConsultingBayer Material Science Logistics Procurement ManagerBenQ VPBHP Billiton VPBooz Allen Hamilton Senior ConsultantCarrefour Country ManagerCarrier UTC Director of LogisticsCathay Pacific Director and GM, CargoCH Robinson MDCoca Cola National Transport ManagerComputer Associates VP, Global Supply Chain & LogisticsCaterpillar VPChina Federation of Logistics & Purchasing PresidentCisco Senior DirectorCompal Electronics VPCon-way DirectorCosco Container Lines MDDaewoo International VPDelphi Automotive Systems Logistics Manager, Asia PacificDeloitte Consulting DirectorDHL CIO/Senior VPDow Chemical Logistics Supply Manager, Asia Pacific
*For full details of distribution, download the magazine Media Kit at www.supplychainasia.com/magazine

Supply Chain Asia September/October 2009
infrastructure update14 supply chain – strateGy
Industr y is facing unprecedented cost challenges. The global economy is suffering from deep recession and
consumers have reduced their spend drastically. Add to this other challenges such as commodity price variability, supplier financial uncertainty and global sourcing risks such as the recent and well-publicised food safety risks. Companies are dealing with an unenviable combination of potentially
Sourcing optimisation for sustainable savings
By Craig Rawlings, director, Supply Chain, Deloitte
Consulting, Southeast Asia
In today’s environment, the challenge is not convincing the supply market to reduce their costs, but ensuring the negotiated savings find their way to the bottom line
declining revenues, continuing rising costs and quality issues.
Against this backdrop, most companies have recognised that external spend is a large component of their cost structure — typically 40-70% and growing with increased outsourcing. Many organisations in Asia are now looking to procurement as the mechanism to both reduce costs and lock in favourable terms as consumer
demand recovers in the medium term. For mainly regional and local organisations new to procurement-driven cost reduction, conducting strategic sourcing initiatives will be a significant challenge given the constraints around organisational structures, availability of procurement spend information, and the skills of procurement practitioners.
Other organisations though, primarily
September/October 2009 Supply Chain Asia
infrastructure update 15supply chain – strateGy
sustainable savings that track to bottom line impacts on cost of goods sold (COGS) or selling, general and administrative (SG&A) expenses. Too often, long term savings are not adopted, and the costs quickly creep back.
The questions businesses are askingWhat causes this phenomenon? Part of the problem stems from the seemingly perfect logic that organisations should take a ‘show-me-the-money’ approach and focus on renegotiating their largest contracts. However, by focusing on what is immediately obvious, organisations have tended not to develop sustainable management processes to truly control costs. Another challenge is that supplier costs are impacted by employees across the organisation, yet external spend reduction has too often become the responsibility of the procurement function which then must ‘market’ its services back to internal customers.
are developing a new discipline of spend management.
Spend management seeks three core objectives:
C o m p r e h e n s i v e : p r o v i d e a comprehensive view, addressing all relevant processes across all the organisation’s external spend categories
Continuous: focus on continuous process improvement and renewable cost savings
Control: provide greater control over spending and risks right across the organisation
Spend management is not structured around initiatives but rather around on-going management processes for spend categories, for which objectives, stakeholders, roles, responsibilities, and new processes are developed. All external spend categories including strategic indirect, operating indirect, direct materials and capital expenditures are in scope.
Furthermore, as organisations grow, complexity increases with multiple systems, increased product lines, business units and geographies, thus making it difficult to manage spend in traditional ways. Take for instance a typical challenge for MNC’s who can be required to manage supplier spend for multiple categories in a large number of countries, dealing with fiercely autonomous business units. The magnitude of the challenge becomes apparent.
However, top organisations increasingly realise they have a significant opportunity to further reduce and control external spend. They are transitioning away from a procurement initiative-based approach and
❝For the past decade and a half, many companies have completed successive waves of initiatives to reduce spend. Strategic sourcing was followed by e-procurement, B2B exchanges and reverse auctions. These companies now face a different challenge. Although most of these initiatives have resulted in large potential costs savings (often called identified savings), executives are frequently thwarted in their ability to transform these opportunities into sustainable savings that track to bottom line impacts on cost of goods sold (COGS) or selling, general and administrative (SG&A) expenses. Too often, long term savings are not adopted, and the costs quickly creep back.
❞ Spend management goes beyond the sourcing/procurement function. Leadership from business units, finance and functions with large spend are aligned around key spend categories. Spend management focuses on a broader set of business issues and incorporates an expansive set of management processes that include ‘levers’ to manage tax, intellectual property, risk, demand, assets, compliance, specifications, and more.
The case for changeLarge organisations usually have numerous initiatives underway to manage external costs. If viewed from a spend management
multinational companies, have already aggressively tackled these costs. For the past decade and a half, many of these companies have completed successive waves of initiatives to reduce spend. Strategic sourcing was followed by e-procurement, B2B exchanges and reverse auctions. These companies now face a different challenge. Although most of these initiatives have resulted in large potential costs savings (often called identified savings), executives are frequently thwarted in their ability to transform these opportunities into
Current approaches versus spend management
Current approach Spend management
Initiative based Management process based
Sourcing and procurement focus Broad business focus
Selected spend categories All spend categories
One cost reduction lever applied across many spend categories
Many or all levers applied across each category
One-time cost savings Continuous cost savings
Focus on projects Focus on controls
Numerous disconnected stakeholders Clear roles and responsibilities
Potential savings Realised savings
Supply Chain Asia September/October 2009
infrastructure update16 supply chain – strateGy
perspective, however, these activities are typically managed in a sub-optimal manner, which manifests itself in one of two ways: incomplete and disconnected.
Most companies take an incomplete and disconnected approach to managing costs. Rather than attacking costs through a coherent category-specific programme, levers are often poorly applied. Far too few stakeholders are aware of or onboard with new strategies, and roles and responsibilities are not defined or understood across the category. There is an absence of ‘ownership’ for the category, and incentives across stakeholders are often misaligned. This is not for a lack of capable people, rather a lack of integrated processes. Business schools and major software solutions have historically focused on budgeting, sourcing and purchase-to-pay as separate processes, and only recently has an integrated ‘spend management’ process emerged.
Initiative focusOften, cost management efforts are driven by a focus on initiatives. It is common for companies to report that “we are implementing sourcing tools”, or “we are standardising our contracts”, or “we are standardising our specifications”. The problem is when the initiative-driven mentality blinds organisations to the unique aspects of the individual categories.
❝Most companies take an incomplete and disconnected approach to managing costs. Rather than attacking costs through a coherent category-specific programme, levers are often poorly applied. Far too few stakeholders are aware of or onboard with new strategies and roles and responsibilities are not defined or understood across the category. There is an absence of ‘ownership’ for the category, and incentives across stakeholders are often misaligned. ❞
As an example, best practices and key requirements for services procurement are subordinated or completely overlooked i n m a ny e - p r o c u r e m e n t p r o j e c t s . Similarly, the requirements for managing advertising spend are completely different for commodity products, yet too often processes are not effectively designed to account for these differences. When initiatives are managed ‘down’, the matrix and objectives are structured for successful project completion rather than the successful management of major spend categories, the result can only be described as, “the sourcing activity was a success, but the category is still out of control.”
This is frequently seen with a sourcing initiative that ends with the announcement of the savings, a declaration of victory, and a new contract that is quickly filed away. The required execution of the strategy, process changes, compliance, and supplier management are only partially deployed, and the realised savings differ dramatically from the announcement.
There is the additional problem of accounting for the savings. Finance, procurement and the operating business units seldom agree on how to calculate and distribute savings. Considerable time is spent second-guessing the true success of initiatives rather than developing a management process for calculating and
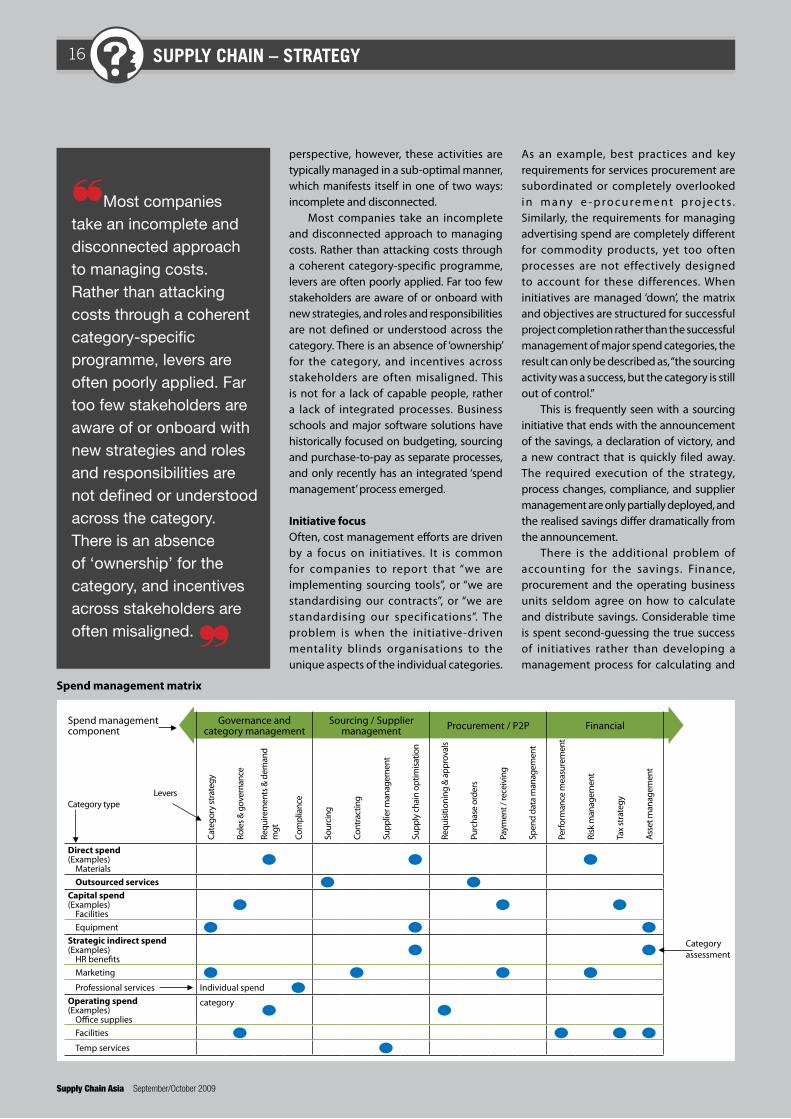
Spend management matrix
Spend managementcomponent
Governance andcategory management
Sourcing / Suppliermanagement Procurement / P2P Financial
LeversCategory type
Cate
gory
stra
tegy
Role
s & g
over
nanc
e
Requ
irem
ents
& d
eman
d m
gt
Com
plia
nce
Sour
cing
Cont
ract
ing
Supp
lier m
anag
emen
t
Supp
ly c
hain
opt
imisa
tion
Requ
isitio
ning
& a
ppro
vals
Purc
hase
ord
ers
Paym
ent /
rece
ivin
g
Spen
d da
ta m
anag
emen
t
Perfo
rman
ce m
easu
rem
ent
Risk
man
agem
ent
Tax
stra
tegy
Asse
t man
agem
ent
Direct spend(Examples)
Materials
Outsourced services Capital spend(Examples)
Facilities
Equipment Strategic indirect spend(Examples)
HR benefits
Marketing Professional services Individual spend
Operating spend(Examples)
Office supplies
category
Facilities Temp services
Categoryassessment
September/October 2009 Supply Chain Asia
infrastructure update 17supply chain – strateGy
assigning performance metrics. To overcome these and other characteristic challenges, a new spend management discipline is needed.
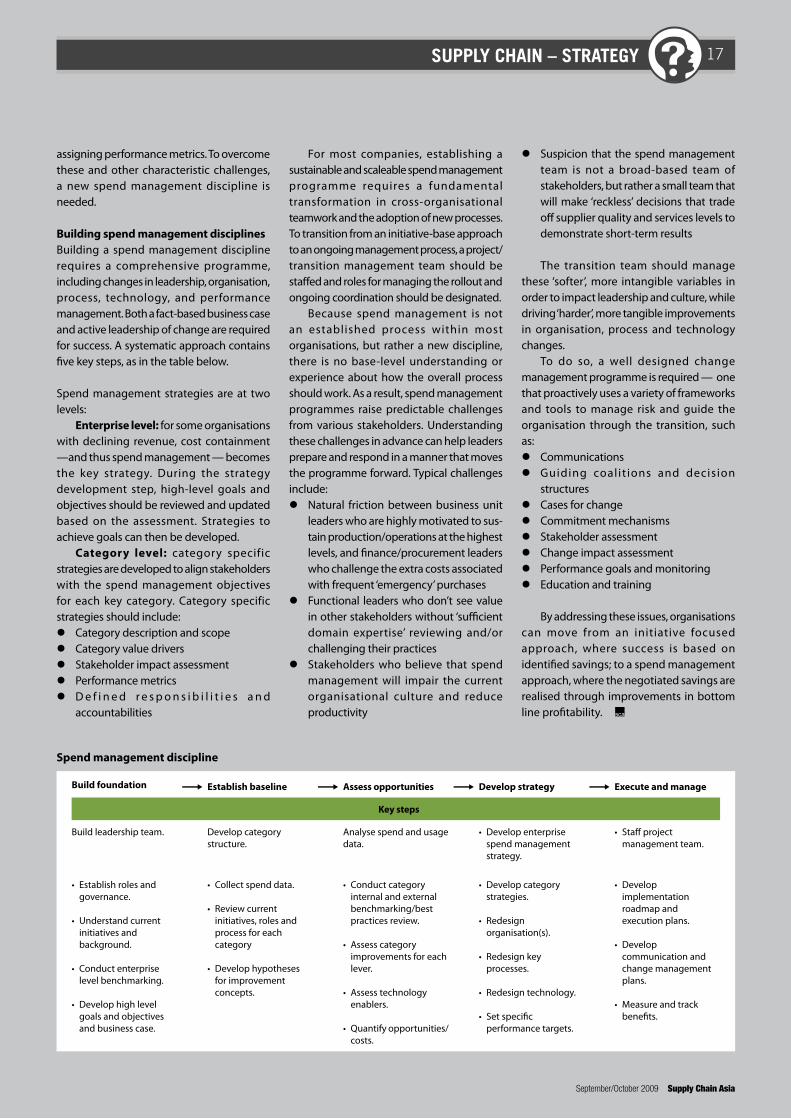
Building spend management disciplinesBuilding a spend management discipline requires a comprehensive programme, including changes in leadership, organisation, process, technology, and performance management. Both a fact-based business case and active leadership of change are required for success. A systematic approach contains five key steps, as in the table below.
Spend management strategies are at two levels:
Enterprise level: for some organisations with declining revenue, cost containment —and thus spend management — becomes the key strategy. During the strategy development step, high-level goals and objectives should be reviewed and updated based on the assessment. Strategies to achieve goals can then be developed.
Category level: category specific strategies are developed to align stakeholders with the spend management objectives for each key category. Category specific strategies should include: Category description and scope Category value drivers Stakeholder impact assessment Performance metrics D e f i n e d r e s p o n s i b i l i t i e s a n d
accountabilities
For most companies, establishing a sustainable and scaleable spend management programme requires a fundamental transformation in cross-organisational teamwork and the adoption of new processes. To transition from an initiative-base approach to an ongoing management process, a project/transition management team should be staffed and roles for managing the rollout and ongoing coordination should be designated.
Because spend management is not an established process within most organisations, but rather a new discipline, there is no base-level understanding or experience about how the overall process should work. As a result, spend management programmes raise predictable challenges from various stakeholders. Understanding these challenges in advance can help leaders prepare and respond in a manner that moves the programme forward. Typical challenges include: Natural friction between business unit
leaders who are highly motivated to sus-tain production/operations at the highest levels, and finance/procurement leaders who challenge the extra costs associated with frequent ‘emergency’ purchases
Functional leaders who don’t see value in other stakeholders without ‘sufficient domain expertise’ reviewing and/or challenging their practices
Stakeholders who believe that spend management will impair the current organisational culture and reduce productivity
Suspicion that the spend management team is not a broad-based team of stakeholders, but rather a small team that will make ‘reckless’ decisions that trade off supplier quality and services levels to demonstrate short-term results
The transition team should manage these ‘softer’, more intangible variables in order to impact leadership and culture, while driving ‘harder’, more tangible improvements in organisation, process and technology changes.
To do so, a well designed change management programme is required — one that proactively uses a variety of frameworks and tools to manage risk and guide the organisation through the transition, such as: Communications Guiding coalit ions and decision
structures Cases for change Commitment mechanisms Stakeholder assessment Change impact assessment Performance goals and monitoring Education and training
By addressing these issues, organisations can move from an initiative focused approach, where success is based on identified savings; to a spend management approach, where the negotiated savings are realised through improvements in bottom line profitability.
Spend management discipline
Build foundation Establish baseline Assess opportunities Develop strategy Execute and manage
Key steps
Build leadership team. Develop category structure.
Analyse spend and usage data.
• Develop enterprise spend management strategy.
• Staff project management team.
•
•
•
•
Establish roles and governance.
Understand current initiatives and background.
Conduct enterprise level benchmarking.
Develop high level goals and objectives and business case.
•
•
•
Collect spend data.
Review current initiatives, roles and process for each category
Develop hypotheses for improvement concepts.
•
•
•
•
Conduct category internal and external benchmarking/best practices review.
Assess category improvements for each lever.
Assess technology enablers.
Quantify opportunities/costs.
•
•
•
•
•
Develop category strategies.
Redesign organisation(s).
Redesign key processes.
Redesign technology.
Set specific performance targets.
•
•
•
Develop implementation roadmap and execution plans.
Develop communication and change management plans.
Measure and track benefits.

infrastructure update18 the csr series
Supply Chain Asia September/October 2009
Energy is at the core of many debates surrounding global warming and efficient economies. Over the past
years, realities about the limitations of fossil fuels to meet global energy needs have reached a wider audience and permeated deeper into individual and corporate consciences. As firms such as GE began to invest in wind turbine technology, Suntech in solar panels, and Vinod Khosla in algae fuels, the investment community began to think technology would bring the solutions.
For many firms struggling to understand their environmental impact and make positive changes, the problem with the energy debate has been that many of the solutions available in the marketplace require investments that are seemingly not market competitive. While more fortunate firms have been able to access clean energy from their energy providers; or managed to convince their board that putting up a solar panel array would increase brand value, many have had to centre efforts to reduce energy consumption or increase efficiency on improving processes or purchasing new equipment. It is few that to date have taken an holistic look at their supply chains to look for efficiency gains.
In such an exercise, physical structures would figure strongly, as buildings are the largest ‘user’ of energy and the largest ‘waster’ of energy as well. If firms take a step back and study their physical supply chain infrastructure and the environments in which they exist, they would come to understand that through a process of designing, constructing, operating, and maintaining buildings with an understanding of how each of these actions impacts the environment, large efficiency and cost gains can be found for both their own businesses and the environment.
Debating the benefitsWhen a firm begins the process of developing more efficient and ultimately more environmentally friendly structures, the first major hurdle to be cleared is budget. Due to higher upfront costs, better designs and materials are often seen as additional ‘icing on the cake’ benefits. The additional costs would not be a problem if those in the boardroom could see the gains more clearly, including gains from things like the positive press that comes from investing in environment friendly structures. But short-term projections and
Structural changeBuildings are the largest users and wasters of energy in supply chains. as part of the Supply Chain Asia Magazine CSR Series, Richard Brubaker demonstrates that by studying physical supply chain structures and the environments in which they exist, companies can make large efficiency and cost gains for both their businesses and the environment
infrastructure update 19the csr series
September/October 2009 Supply Chain Asia
cash flow statements are normally not built to include such gains.
Nevertheless, rising costs of traditional materials and sources of energy over the past two years have resulted in a tidal shift in investment by manufacturers and users in more efficient building designs, processes and materials. Staple building products such as cement, dry wall, and tiling, for instance, are seeing significant advances in efficiency and are being produced from recycled materials. The newer versions of these products offer managers long-term positive returns on investment. At the same time, new energy and process efficiency machinery and technologies that minimise solid wastes, VOC emissions, and sludge, can also now be viable investment options.
Site selectionBeginning with site selection and building design, perhaps one of the biggest drivers of change has been market awareness of LEED and other local building certification programmes that rank buildings using various constraints.
For firms that have the luxury of starting with a blank slate, or are planning a move to a new location, accessibility is one of the first considerations that need to be made. This consideration involves a host of different questions: how close will the building be to suppliers, customers and staff? How close is it to supporting infrastructure (road, rail, seaport and airport); and whether or not the supporting infrastructure is the most
appropriate (export-focused organisations should be near international sea and airports, while organisations focused on selling to the domestic market should be near rail or road networks).
O n c e t h e g e o g r a p h i c location is selected, the process of d e t e r m i n i n g w h e t h e r a n existing site or Greenfield site is most appropriate can begin. While
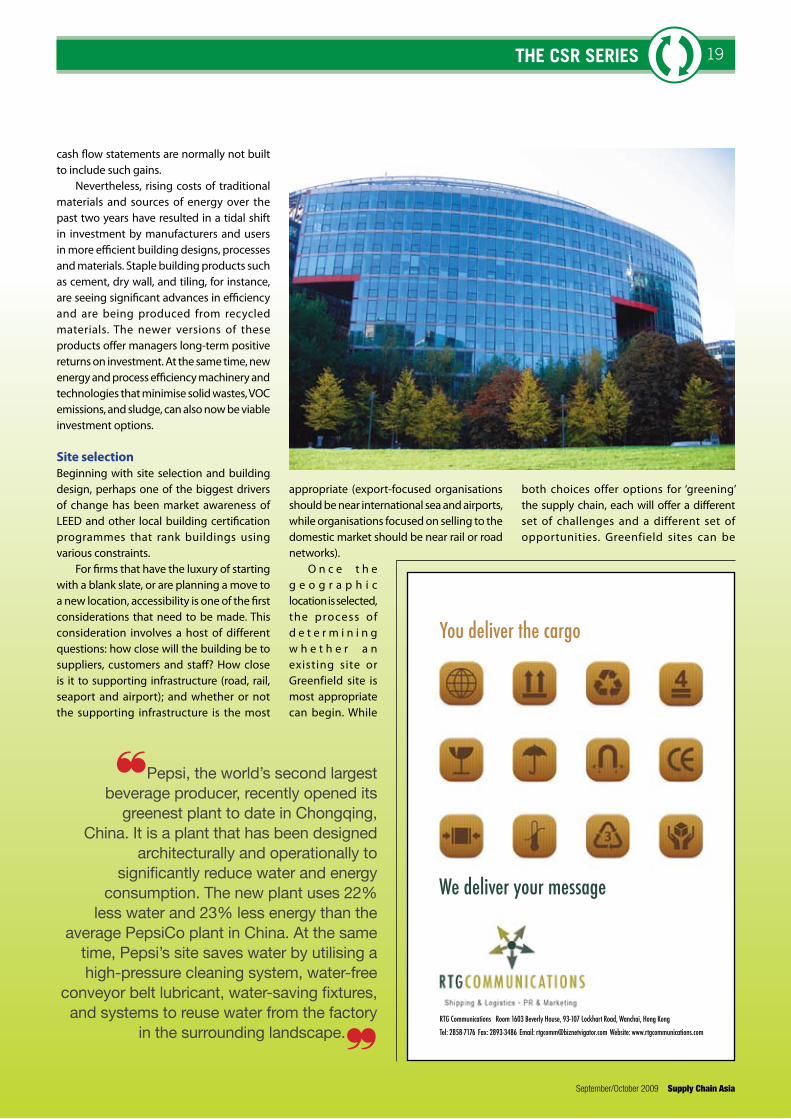
❝Pepsi, the world’s second largest beverage producer, recently opened its
greenest plant to date in chongqing, china. It is a plant that has been designed
architecturally and operationally to significantly reduce water and energy
consumption. the new plant uses 22% less water and 23% less energy than the
average Pepsico plant in china. at the same time, Pepsi’s site saves water by utilising a high-pressure cleaning system, water-free
conveyor belt lubricant, water-saving fixtures, and systems to reuse water from the factory
in the surrounding landscape.
❞
both choices offer options for ‘greening’ the supply chain, each will offer a different set of challenges and a different set of opportunities. Greenfield sites can be
You deliver the cargo
We deliver your message
RTG Communications Room 1603 Beverly House, 93-107 Lockhart Road, Wanchai, Hong Kong
Tel: 2858-7176 Fax: 2893-3486 Email: [email protected] Website: www.rtgcommunications.com

infrastructure update20 the csr series
Supply Chain Asia September/October 2009
designed 100% from scratch and therefore offer a lot more flexibility in terms of design, materials used, and so on; while an existing site may already possess structural hurdles that limit the potential green characteristics of the building. Yet using an existing site also presents the opportunity of conversion, and thereby improvement of the existing stock on the market.
Example: for investors looking to enter China through a Greenfield build, the Tianjin Eco-City is one example of where firms will soon have options. Built on 110 hectares of land, the Eco-City, a partnership with the government of Singapore, will offer manufacturing, commercial, and residential properties with all necessary amenities. The park’s green credentials will include renewable energy options, the latest in water treatment, green spaces, and public transportation (light rail and bus) in a single package.
Building designThrough the process of site selection and design, it is also important for managers to split the ‘sustainability’ of the building into different areas. Solutions that will reduce the energy needs of buildings may include how the building is insulated and passive solar application; while improving the ‘green’ environment can include creating green spaces inside and outside the structure; use of recycling systems, and use of systems that mitigate and use waste and filter waste water.
Laying out the floors to maximise natural light is one of the easiest ways to reduce the energy demand of a building, and through design it is possible to ensure that everyone has access to natural light (i.e. not only the offices of senior managers). This means significantly reduced electricity loads during daylight hours, and a number of studies have shown that layouts with natural light improve productivity.
Allowing managers in each office to personally control their own temperatures will result in inefficiencies and waste, while planning for centralised control does not.
Better floor layout and smart use of open spaces can improve circulation and reduce HVAC loads.
Example: Pepsi, the world’s second largest beverage producer, recently opened their greenest plant to date in Chongqing China. It is a plant that has been designed architecturally
and operationally to significantly reduce water and energy consumption. The new plant uses 22% less water and 23% less energy than the average PepsiCo plant in China. At the same time, Pepsi’s site saves water by utilising a high-pressure cleaning system, water-free conveyor belt lubricant, water-saving fixtures, and systems to reuse water from the factory in the surrounding landscape.
MaterialsDue in large part to the direct visible relationship between costs and product quality, the liveliest debates surrounding the construction of a building will occur as a firm begins to look at materials and equipment. Important because of the direct correlation between product quality and building quality, in the past this process has typically rarely involved environmental considerations outside of what it took to meet a local standard. However, over the past two years, through the introduction of certifications such as LEED as well as market education, lower prices, and incentive programmes, many firms are starting to look at what alternative materials and equipment is available to them.
Starting with capital equipment, investing in efficient HVAC and lighting systems are of prime importance, given the amount
of energy expended by each. Investment in better insulation and double-glazed windows can also go a long way to reduce the amount of energy required to run the building on a day-to-day basis. Passive and active solar systems may offset some of the environmental impact, but even more effective could be the installation of rainwater collection and wastewater treatment systems.
Selection of the right materials is a process that should go well beyond investment in capital equipment. Cement using fly ash can be specified; tiling and carpeting systems can be ordered from producers like Interface, who develop products and services to support firms looking to reduce their environmental footprint while maintaining a high quality look. Installing two flush toilet systems; removing paper towels, and providing an on-site recycling centre, are all ways to reduce the numerous environmental footprints that a building and its occupants create.
Example: Plantronic’s in Suzhou, a few hours west of Shanghai, commissioned a building in 2003 that would become one of China’s LEED buildings. Designed by Bechtel, the building’s design incorporated not only water collection and natural cooling, but also actively incorporated products that could be sourced locally (60%) and remove VOC emissions inside the building.
❝as firms such as GE began to invest in wind turbine technology, Suntech in solar panels, and Vinod Khosla
in algae fuels, the investment community began to think technology would bring the solutions.
❞
infrastructure update 21the csr series
September/October 2009 Supply Chain Asia
Operation and maintenance Once the building is constructed and equipment is installed, managers will need to develop a process that will measure how it is operated and maintained to ensure that reductions are fully achieved and further gains are realised. It is the ongoing, everyday, management of the site: identifying areas where efficiencies can be made; ensuring equipment is running as it should, and looking for further improvements through adjustments; that will bear the full fruits of the investment. In a manufacturing environment, where large amounts of energy and utilities are used, variances in performance and efficiencies can be reduced through an effective management system. Gains in corporate offices can be extended through smart use of centralised air conditioning and education of employees to turn off the lights in unused conference rooms, and so on.
ConclusionsWith all the announcements and discussion surrounding the benefits of solar panels and carbon offsets in the marketplace, it is important to remember that the structures themselves are part of the problem. It is also important to remember that the environmental inefficiencies of buildings can be reduced with minimal improvements.
Firms building new sites have the opportunity to create an efficient structure, with the basic requirement simply being to include environmental awareness in the planning from the very beginning. Firms in existing units have options for capital and process improvements that will result in immediate gains. Investment in HVAC systems, installing sky lights in large spaces, upgrading lighting systems, refurbishing old equipment, and educating staff to interact with their environment in a more responsible way, can all — for a manageable cost — create a more environmentally friendly building and return savings to the bottom line.
While we have seen improvement in the area from a technological perspective, many firms have yet to fully incorporate the environment or sustainability into their physical supply chain structures through efforts such as development of more sustainable sites, better building management practices, improvement of the indoor environment, leverage of new materials, and basic design of buildings with minimal energy and water demand.
Certification programmes
LEED Founded under the US Green Building Council, LEED has become the leading third party certification measuring the environmental impact of buildings. The primary constraints that are measured include: sustainable sites, water efficiency, energy, materials, indoor environment and transportation. Ranked on a scale of 100, audited buildings are given a ranking by
the LEED certification agency, the Green Building Certification Institute, of silver, gold, or platinum.
3 Star (China) A voluntary rating system developed in China, and implemented in 2008, this certification looks at and benchmarks residential and commercial buildings in six categories (land savings and outdoor environment, energy savings, water savings, materials savings, indoor environmental quality, and operations and management). Those who pass the audit are assigned between one and three stars.
WWF Low Carbon Management ProgramWWF is looking to enrol manufacturers into a programme that will track emissions through the supply chain. It wants to work with those manufacturers to reduce emissions and provide a labelling system so that stakeholders (investors, buyers, government, etc) can see where they rank in the areas of: carbon reduction, greenhouse gas management, and distance to best practices in operations.
Example: Inter face Flooring CEO Ray Anderson’s decision to reduce the environmental impact of his firm’s products has become the poster child of what firms can achieve when motivated. And while his initial focus was on how to design products for longer life and reduced waste, he also completely re-designed his manufacturing process and facilities as part of the process.
The company’s Thailand facility, built in 2007, is a testament to this as the process considered all of the above areas to achieve LEED certification. Some 98% of construction waste was diverted from landfill, 20% of materials had recycled content, with 60% of materials sourced locally. Water efficient equipment was installed on the factory floor and in office areas, and low VOC products were used inside to ensure the long-term environmental conditions of the facility.
For additional information, please visit: U.S. Green Building Council - http://www.greenbuildingcouncil.comInhabitat – http://www.inhabitat.com/Greener Buildings – http://greenerbuildings.com/Green Ideas Green Actions (GIGA) – www.giga-china.comEcoasia – www.ecoasia.com
❝laying out the floors to maximise natural light is one of the easiest ways to reduce the energy demand of a building, and through design it is possible to ensure that everyone has access to natural light (i.e. not only the offices of senior managers). this means significantly reduced electricity loads during daylight hours, and a number of studies have shown that layouts with natural light improve productivity.
❞
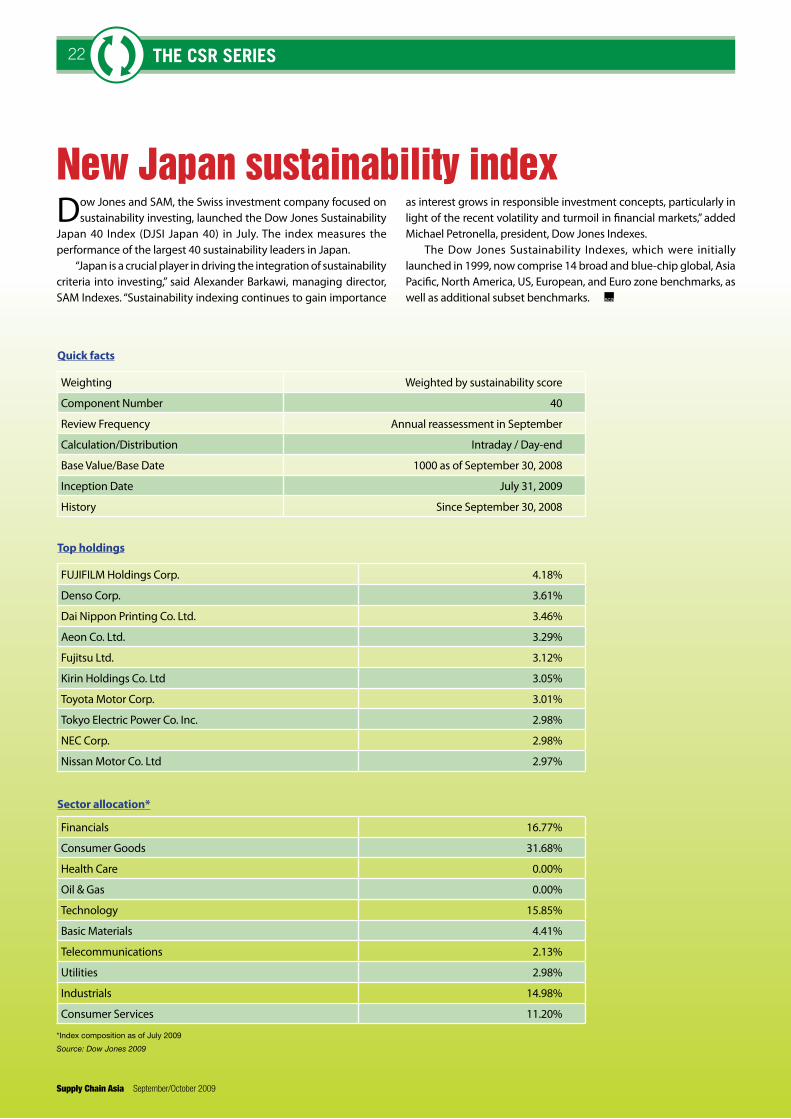
infrastructure update22 the csr series
Supply Chain Asia September/October 2009
Dow Jones and SAM, the Swiss investment company focused on sustainability investing, launched the Dow Jones Sustainability
Japan 40 Index (DJSI Japan 40) in July. The index measures the performance of the largest 40 sustainability leaders in Japan.
“Japan is a crucial player in driving the integration of sustainability criteria into investing,” said Alexander Barkawi, managing director, SAM Indexes. “Sustainability indexing continues to gain importance
as interest grows in responsible investment concepts, particularly in light of the recent volatility and turmoil in financial markets,” added Michael Petronella, president, Dow Jones Indexes.
The Dow Jones Sustainability Indexes, which were initially launched in 1999, now comprise 14 broad and blue-chip global, Asia Pacific, North America, US, European, and Euro zone benchmarks, as well as additional subset benchmarks.
Sector allocation*
Financials 16.77%
Consumer Goods 31.68%
Health Care 0.00%
Oil & Gas 0.00%
Technology 15.85%
Basic Materials 4.41%
Telecommunications 2.13%
Utilities 2.98%
Industrials 14.98%
Consumer Services 11.20%
Top holdings
FUJIFILM Holdings Corp. 4.18%
Denso Corp. 3.61%
Dai Nippon Printing Co. Ltd. 3.46%
Aeon Co. Ltd. 3.29%
Fujitsu Ltd. 3.12%
Kirin Holdings Co. Ltd 3.05%
Toyota Motor Corp. 3.01%
Tokyo Electric Power Co. Inc. 2.98%
NEC Corp. 2.98%
Nissan Motor Co. Ltd 2.97%
Quick facts
Weighting Weighted by sustainability score
Component Number 40
Review Frequency Annual reassessment in September
Calculation/Distribution Intraday / Day-end
Base Value/Base Date 1000 as of September 30, 2008
Inception Date July 31, 2009
History Since September 30, 2008
*Index composition as of July 2009
Source: Dow Jones 2009
New Japan sustainability index

September/October 2009 Supply Chain Asia
transport insurance plus innovationInsurance for:Transport and logistics operatorsPorts and terminalsCargo handling facilitiesShip operators
Contact TT via your broker or at any point in the network
Hong KongTel +852 2832 9301
SingaporeTel +65 6323 6577
ShanghaiTel +86 21 6321 7001
SydneyTel +61 2 9267 3123
LondonTel +44 (0)20 7204 2626
The Logistics Institute - Asia PacificThe premier institute in Asia Pacific nurturing logistics
excellence through research, education and industry outreach.
Our Programs:
• Prestigious Double Master of Science in Logistics & Supply Chain Management (Application for 10th Intake opens in Oct 2009)
• Executive Certificate in Supply Chain Management (3rd Run)
• Industry Research
• THINK Executive Summit, Annual THINK Logistics, Quarterly THINK Solutions Series
Web: //www.tliap.nus.edu.sg • Tel: +65 6516 4842 • Email: [email protected]
A Collaboration BetweenThe Asian Freight
& Supply Chain Awards
Best EducationalCourse Provider
2003-2009
Supply Chain Asia Logistics
wards
Seats & tables available now, contact
Date: November 12, 2009 Venue: Raffles Town Club, Singapore
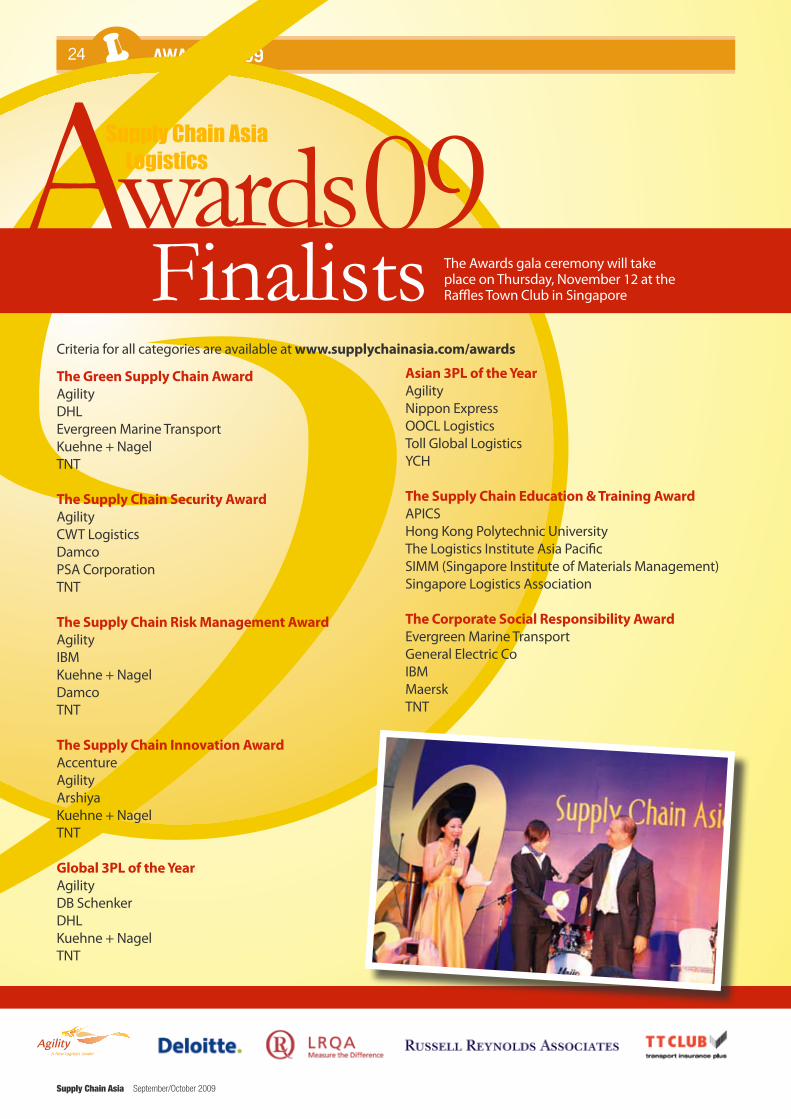
24 AwArds 2009
Supply Chain Asia September/October 2009
24
The Green Supply Chain AwardAgilityDHLEvergreen Marine TransportKuehne + NagelTNT
The Supply Chain Security AwardAgilityCWT LogisticsDamcoPSA CorporationTNT
The Supply Chain Risk Management AwardAgilityIBMKuehne + NagelDamcoTNT The Supply Chain Innovation AwardAccentureAgilityArshiyaKuehne + NagelTNT
Global 3PL of the YearAgilityDB SchenkerDHLKuehne + NagelTNT
Asian 3PL of the Year AgilityNippon ExpressOOCL LogisticsToll Global LogisticsYCH
The Supply Chain Education & Training AwardAPICSHong Kong Polytechnic UniversityThe Logistics Institute Asia PacificSIMM (Singapore Institute of Materials Management)Singapore Logistics Association
The Corporate Social Responsibility AwardEvergreen Marine TransportGeneral Electric CoIBMMaerskTNT
wards Supply Chain Asia Logistics 09A
The Awards gala ceremony will take place on Thursday, November 12 at the Raffles Town Club in Singapore
Criteria for all categories are available at www.supplychainasia.com/awards
Supply Chain Asia September/October 2009
Finalists

26 AwArds 2009
Supply Chain Asia September/October 2009
Container Terminal of the Year Gateway Terminals IndiaMTLPSA CorporationPTPYangshan Container Terminal, Shanghai Air Cargo Terminal of the YearAATHACTLIncheon AirportMASKargo, KLIASATS
Best Supply Chain Consulting PartnerAccentureDeloitteErnst & YoungIBMSAP
wards 09A
Shipping Line of the YearAPLCMA-CGNEvergreen Marine TransportMaerskMSC
Air Cargo Carrier of the YearCathay Pacific CargoEmirates SkyCargoFedExLufthansa CargoSingapore Airlines Cargo
Supply Chain Asia September/October 2009

Supply Chain Asia Logistics
wards
SUPPLY CHAIN ASIA LOGISTICS AWARDS 2009 - BOOKING FORM
Raffles Town ClubSingaporeThursday, November 12, 2009
Complete this form and fax it to us at: +65 6415 7211 (payment should accompany your booking). Alternatively, you can mail your registration form to:
The Program DirectorSUPPLY CHAIN ASIA LOGISTICS AWARDS 2009c/o SC Asia Publications Pte Ltd128, Toa Payoh Lorong One #09-815 Singapore 310128Tel: +65 6415 7178 Fax: +65 6327 4205 Email: [email protected]
Title: ___________________ Name: _______________________________________________________Position: __________________________________ Company: __________________________________ Postal Address: ________________________________________________________________________Country: ________________ State: ______________________Postal Code: _______________________Phone: ________________________________________ Fax: __________________________________Mobile: ______________________________________ Email: __________________________________
Fees & ChargesCharges Number Total
Cost per Table (10 persons) USD$2,300.00
Cost per Seat USD$249.00
TOTAL ChArgES USD$
Methods of PaymentPayment can be made by:1. Cheque or Bank Draft. This should be made payable to “SC Asia Publications Pte Ltd” and made in SiNgAPOrE DOLLArS.
2. Telegraphic Transfer.
To be made in Singapore dollars to the following account:Payee: SC Asia Publications Pte LtdBank: DBS Bank Ltd SingaporeBranch: Parkway ParadeSwiftcode: DBSSSgSgA/c Number : 027-902839-4
3. Credit Card
Card Type: o Visa o Master o Amex
Name __________________________________________________
Card Number ___________________________________________
3 Digit Security Code
Expiry Date ____________________ Signature _________________

infrastructure update28 supply chain – risk management
Supply Chain Asia September/October 2009
The first truly global recession has increased the business world’s interest in risk management—working proactively to identify, resolve and subsequently avoid detrimental events. This shouldn’t imply that risk management is a new concept—companies have always sought to minimise risk. However, the epicentre of most organisations’ risk management programmes has been the finance organisation. Few entities have adopted comprehensive, formal risk management programmes in other parts of the organisation—like procurement.
APAC companies reduce supply chain risk by increasing procurement expertise
The nature of supply chain risk is changing and procurement organisations need to find new ways to analyse, anticipate and respond to volatile market situations, says Jeffrey Russell,
managing partner, Supply Chain Asia Pacific, Accenture
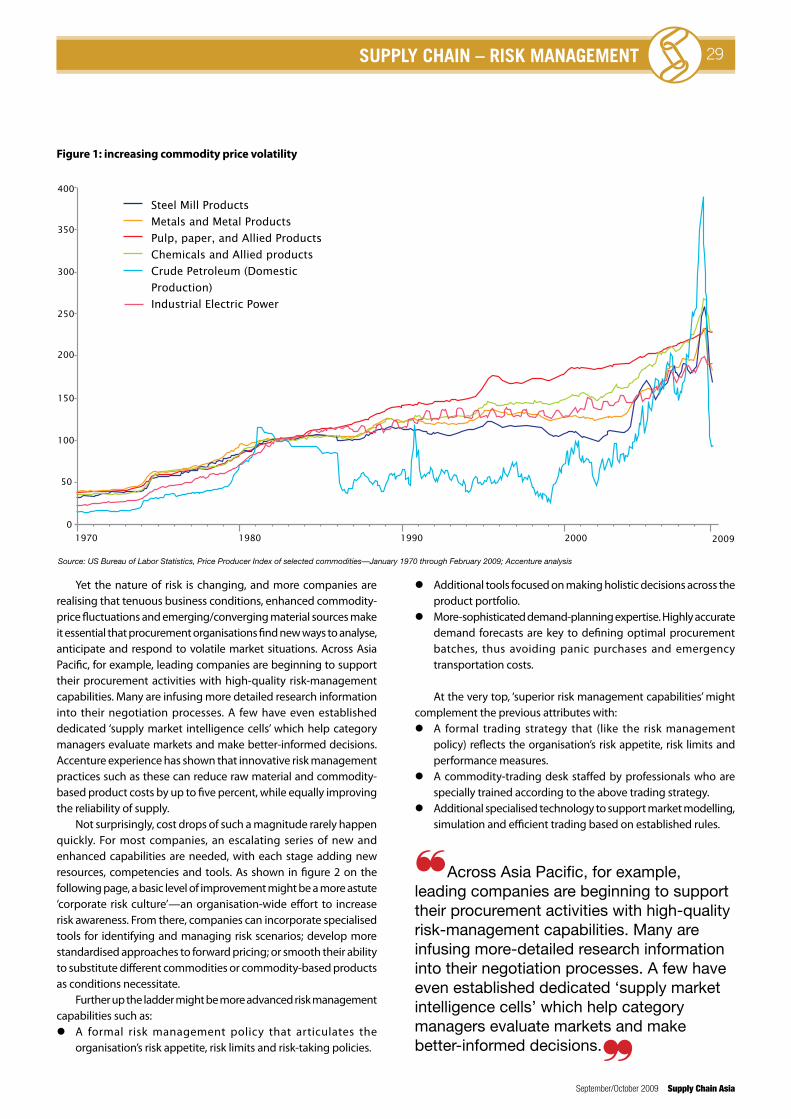
infrastructure update 29supply chain – risk management
September/October 2009 Supply Chain Asia
Yet the nature of risk is changing, and more companies are realising that tenuous business conditions, enhanced commodity-price fluctuations and emerging/converging material sources make it essential that procurement organisations find new ways to analyse, anticipate and respond to volatile market situations. Across Asia Pacific, for example, leading companies are beginning to support their procurement activities with high-quality risk-management capabilities. Many are infusing more detailed research information into their negotiation processes. A few have even established dedicated ‘supply market intelligence cells’ which help category managers evaluate markets and make better-informed decisions. Accenture experience has shown that innovative risk management practices such as these can reduce raw material and commodity-based product costs by up to five percent, while equally improving the reliability of supply.
Not surprisingly, cost drops of such a magnitude rarely happen quickly. For most companies, an escalating series of new and enhanced capabilities are needed, with each stage adding new resources, competencies and tools. As shown in figure 2 on the following page, a basic level of improvement might be a more astute ‘corporate risk culture’—an organisation-wide effort to increase risk awareness. From there, companies can incorporate specialised tools for identifying and managing risk scenarios; develop more standardised approaches to forward pricing; or smooth their ability to substitute different commodities or commodity-based products as conditions necessitate.
Further up the ladder might be more advanced risk management capabilities such as: A formal risk management policy that articulates the
organisation’s risk appetite, risk limits and risk-taking policies.
Figure 1: increasing commodity price volatility
1970 1980 1990 2000 2009
0
50
100
150
200
250
300
350
400
Source: US Bureau of Labor Statistics, Price Producer Index of selected commodities—January 1970 through February 2009; Accenture analysis
Steel Mill Products
Metals and Metal Products
Pulp, paper, and Allied Products
Chemicals and Allied products
Crude Petroleum (Domestic
Production)
Industrial Electric Power
Additional tools focused on making holistic decisions across the product portfolio.
More-sophisticated demand-planning expertise. Highly accurate demand forecasts are key to defining optimal procurement batches, thus avoiding panic purchases and emergency transportation costs.
At the very top, ‘superior risk management capabilities’ might complement the previous attributes with: A formal trading strategy that (like the risk management
policy) reflects the organisation’s risk appetite, risk limits and performance measures.
A commodity-trading desk staffed by professionals who are specially trained according to the above trading strategy.
Additional specialised technology to support market modelling, simulation and efficient trading based on established rules.
❝Across Asia Pacific, for example, leading companies are beginning to support their procurement activities with high-quality risk-management capabilities. Many are infusing more-detailed research information into their negotiation processes. A few have even established dedicated ‘supply market intelligence cells’ which help category managers evaluate markets and make better-informed decisions.❞
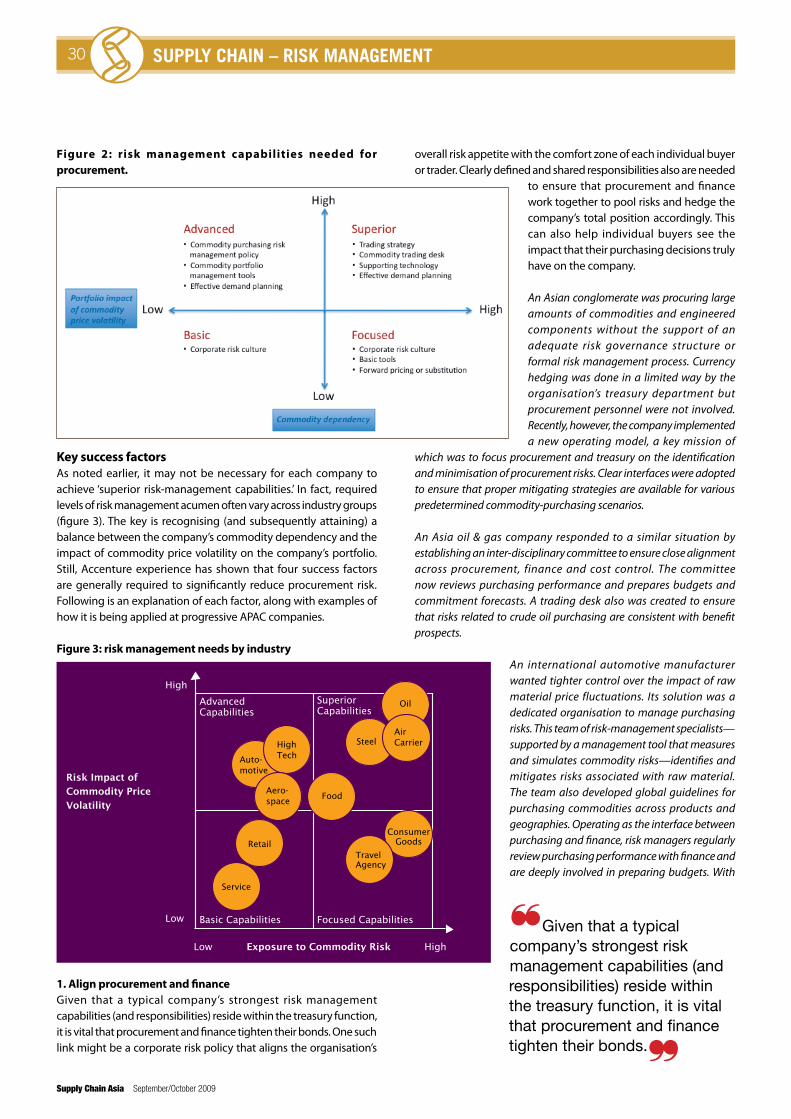
infrastructure update30 supply chain – risk management
Supply Chain Asia September/October 2009
Figure 2: risk management capabilities needed for procurement.
Key success factorsAs noted earlier, it may not be necessary for each company to achieve ‘superior risk-management capabilities.’ In fact, required levels of risk management acumen often vary across industry groups (figure 3). The key is recognising (and subsequently attaining) a balance between the company’s commodity dependency and the impact of commodity price volatility on the company’s portfolio. Still, Accenture experience has shown that four success factors are generally required to significantly reduce procurement risk. Following is an explanation of each factor, along with examples of how it is being applied at progressive APAC companies.
Figure 3: risk management needs by industry
1. Align procurement and financeGiven that a typical company’s strongest risk management capabilities (and responsibilities) reside within the treasury function, it is vital that procurement and finance tighten their bonds. One such link might be a corporate risk policy that aligns the organisation’s
overall risk appetite with the comfort zone of each individual buyer or trader. Clearly defined and shared responsibilities also are needed
to ensure that procurement and finance work together to pool risks and hedge the company’s total position accordingly. This can also help individual buyers see the impact that their purchasing decisions truly have on the company.
An Asian conglomerate was procuring large amounts of commodities and engineered components without the support of an adequate risk governance structure or formal risk management process. Currency hedging was done in a limited way by the organisation’s treasury department but procurement personnel were not involved. Recently, however, the company implemented a new operating model, a key mission of
which was to focus procurement and treasury on the identification and minimisation of procurement risks. Clear interfaces were adopted to ensure that proper mitigating strategies are available for various predetermined commodity-purchasing scenarios.
An Asia oil & gas company responded to a similar situation by establishing an inter-disciplinary committee to ensure close alignment across procurement, finance and cost control. The committee now reviews purchasing performance and prepares budgets and commitment forecasts. A trading desk also was created to ensure that risks related to crude oil purchasing are consistent with benefit prospects.
An international automotive manufacturer wanted tighter control over the impact of raw material price fluctuations. Its solution was a dedicated organisation to manage purchasing risks. This team of risk-management specialists—supported by a management tool that measures and simulates commodity risks—identifies and mitigates risks associated with raw material. The team also developed global guidelines for purchasing commodities across products and geographies. Operating as the interface between purchasing and finance, risk managers regularly review purchasing performance with finance and are deeply involved in preparing budgets. With
High
Low
Low
Basic Capabilities
Advanced Capabilities
Focused Capabilities
Superior Capabilities
High
Service
Retail
Food
Steel
Oil
Air CarrierHigh
TechAuto- motive
Aero- space
Travel Agency
Consumer Goods
Risk Impact of
Commodity Price
Volatility
Exposure to Commodity Risk❝Given that a typical company’s strongest risk management capabilities (and responsibilities) reside within the treasury function, it is vital that procurement and finance tighten their bonds.❞

infrastructure update 31supply chain – risk management
September/October 2009 Supply Chain Asia
these advanced risk management capabilities, the company is set to achieve one to three percent additional savings in raw material costs.
2. Optimise commodity supply and priceLike the previous success factor, the key here is bringing two disciplines together: on the one hand, procurement personnel execute a sourcing strategy that considers price and availability of raw material at the right specifications and ensures a reasonable level of inventory to meet demand. On the other, experts in corporate trading support the procurement organisation by pooling purchases and contracting with market participants on future purchase volumes and prices. This may include setting firm prices or negotiating on options to protect against sudden price increases.
An Asian manufacturer of chemicals and personal care products sought to establish a formal link between raw material supplies and price. To make this happen, it conducted a detailed assessment of commodity exposure relative to value, volume and currency fluctuations, and then developed a simulation model that identifies ‘value at risk.’ This advancement allows the company to more-accurately measure and forecast the impact of raw material fluctuations on the business. Around the same time, the organisation implemented a new inventory replenishment mechanism for optimising raw material planning. Working together, the simulation model and replenishment system provide multiple scenarios with which procurement decision makers can make decisions about raw material quantities and prices.
An Asian HVAC company recently decided that it was over-exposed to commodity volatility risks in steel, copper and aluminum. However, a lack of commodity-hedging capabilities limited its options. A clear roadmap for commodity hedging then was developed, allowing the organisation to define commodity hedging policies and hedging limits, while creating indices for optimising commodity prices.
3. Maximise demand visibility across the supply chainTo mitigate risk—from product development to production to sales—information must be drawn from every point and fully integrated into procurement planning.
An international stainless steel company is building a business intelligence & integrated planning tool to pull commodities information from multiple databases. In addition to maximising data transparency, the new application is expected to help the company: Procure raw material at the lowest cost possible—optimising the
mix of raw material based on current market conditions. Keep raw material inventory levels at as low a level as feasible due to
reliable forecasts and the ability to react quickly to sudden changes in demand.
Optimise the use of scrap metal to achieve a better position on nickel and add to the company’s sustainability practices.
An Asian consumer goods company found itself hamstrung by an overly complex supply chain, complicated further by a long cash conversion cycle and absence of an integrated planning process. Following a detailed study, it was determined that many of the company’s supply chain problems were due to limited visibility in market demand. The organisation responded by creating an integrated supply chain planning network supported by a detailed sales & operations planning (S&OP) processes. Several advanced tools were implemented to ensure effective forecasting and improve raw material procurement planning. This also helped to institutionalise the process of procurement risk management, which includes back-to-back buying and contract-wise profit tracking.
4. Instill effective performance measuresIn a highly volatile market, savings on purchases over the previous year cannot be the sole measure for commodity purchase performance. This lone metric will not reflect successful negotiations when prices are high and is generally misleading when prices are low. A more effective approach is to link the actual purchase price of a commodity to its market price and assess the impact of raw material price fluctuations on the business. These metrics provide the insight a company needs to continually adjust and improve risk models.
A series of Indian infrastructure projects includes airport and public utilities enhancements. A central procurement office was created to manage procurement activities across these myriad initiatives. Market-linked key performance indicators were developed for buyers and a mechanism was created to weigh all procurement decisions against project profitability.
The time is rightMore and more businesses—within and outside APAC—want to manage the impact of raw material price fluctuations on profitability. Dependent on commodities for their own products and services, these companies are bringing risk management capabilities to bear on procurement: capabilities that can also help their purchasing organisation mitigate other concerns, such as currency and availability risks.
Whether by tightly integrating purchasing with finance, establishing teams of risk management specialists to support buyers, or raising the awareness of buyers with focused training, the potential gains are significant: reductions in raw material costs, increased reliability of the entire end-to-end supply chain, and real, sustainable competitive advantage.
❝In a highly volatile market, savings on purchases over the previous year cannot be the sole measure for commodity purchase performance. This lone metric will not reflect successful negotiations when prices are high and is generally misleading when prices are low. A more effective approach is to link the actual purchase price of a commodity to its market price and assess the impact of raw material price fluctuations on the business. These metrics provide the insight a company needs to continually adjust and improve risk models.❞

infrastructure update32 supply chain – risk management
Supply Chain Asia September/October 2009
A uniform approach to global supply chain risk managementAll goods bought and sold move through
supply chains of some description, making the security of goods in transit an issue that affects everyone.
While terrorism is a potential threat, theft is a clear and present menace; it erodes profitability and disrupts supply chains on an ongoing basis.
The cost of theft is a major driver for improved security — in Holland alone, which produces less than 1% of world GDP, annual cargo theft losses have been valued at €300m.
For the food sector, tampering or poisoning of consumable goods represents
a major risk. The US Department of Homeland Security and other government agencies have identified food establishments as a potential ‘target’ for terrorist attacks because this would damage food supply and the economy. Furthermore, it has the potential to cause physical and psychological harm to citizens.
For several industries, in particular pharmaceuticals, security issues include fake branded products and the substitution of goods with counterfeit or inferior quality replacements.
In addition to the fulfilment of key roles in countering terrorism and reducing theft,
Peter Boyce of Lloyd’s Register Quality Assurance (LRQA) examines the key initiatives to improve supply chain security and argues how a new international security management standard, ISO 28000, can provide equivalency and thereby hasten the process and help to improve the reliability of supply chains

infrastructure update 33supply chain – risk management
September/October 2009 Supply Chain Asia
recent supply chain security initiatives are also designed to address security problems relating to the sale of counterfeit goods. Examples of where counterfeit problems can surface include: Re-conditioned aircraft parts could
re-enter the supply chain without appropriate stress and x-ray tests, posing immediate danger to the general public
In August of 2008, Hong Kong customs discovered 2.5m cigarettes in a container that was marked to contain other goods. If these items had not been identified as fake, they could have been sold as original brand goods, resulting in a substantial shortfall in excise income for the Hong Kong Government
A number of international i n i t i a t i v e s h a v e b e e n undertaken to improve supply chain security. These initiatives seek to prevent illegal access to goods in transit and the movement of illegal goods.
Security initiativesImmediately after the 9/11 terrorist attacks in the US, the International Maritime Organisation (IMO) established the International Ship and Port Facility Security (ISPS) Code. This requires ports and all vessels weighing over 500 gross tonnes and sailing international waters to hold a security certificate.
This initiative necessitates a formal security management system, which is risk-based, dynamic, and requires re-certification every three years.
The Customs Trade Partnership Against Terrorism (C-TPAT ) scheme was first introduced in the United States two months after 9/11. C-TPAT member importers are to meet supply chain security requirements prior to the importation of goods to the United States.
In order to achieve C-TPAT status, it is necessary for importers to provide evidence of an effective security management system, which must include an assessment of risks and offer appropriate remedial practices.
Generally, companies holding C-TPAT certification require their business partners to implement the C-TPAT security criteria. To-date more than 10,000 companies have
applied for C-TPAT certification.In contrast to other initiatives, the TAPA
(Transported Asset Protection Association) initiative was created to limit theft. Initiated by a group of manufacturers of high-value goods, the Association sought guarantees from its logistics providers on the security of its members’ goods. To-date, TAPA has produced two standards relating to the security of in-transit storage and warehousing and security during transportation by truck. Further work on security standards during parking and airfreight is in progress.
In order for suppliers to attain TAPA certification, they need to implement a number of organisational and physical security measures and go through a third party audit.
On top of these initiatives, in response to the potential proliferation of the varied national requirements, which would multiply compliance costs and impose significant delays, the WCO has developed the ‘baseline guidelines’ for the implementation of AEO (Authorised Economic Operator) programmes. These guidelines support the WCO Framework of Standards to Secure and Facilitate Global Trade (the SAFE Framework), adopted in 2005, which incorporates the AEO concept. AEO is a certification regime that demonstrates compliance with the supply chain security requirements of the WCO. To-date 157 countries have signed up to the scheme. The AEO regulation encourages companies to increase security and thereby benefit from improved efficiency and reduced costs.
AEO status is of direct benefit to companies, both financially and to their brand reputation. Some WCO proposed
benefits of AEO status include: Fewer physical border controls Easier reporting Reduced risk Priority treatment for goods selected for
examination Lower insurance costs (potentially, or
higher insurance costs without AEO certification)
The driver behind the AEO initiative is the Official Journal of the European Union Commission Regulation (EC) 648/2005 and AEO status became effective January 1 2008. Application for AEO status entails a security and risk assessment following guidelines that are outlined in the SAFE Framework. Applicants are required to demonstrate
a complete understanding of their supply chain. Every risk should be assessed and appropriate action taken to address risks that are deemed to be significant.
AEO application forms make reference to Management Systems Standards such as ISO 9001 (quality), ISO 27001 (information security) and ISO 28000 (supply chain security). Compliance with such standards (particularly ISO 28000) will therefore simplify the application progress.
ISO 28000 supply chain security management standardISO 28000:2007 is a management system standard that has been developed specifically for companies and organisations that manage supply chain operations. Published as a Publicly Available Specification by the International Standards Organisation in 2005, this was replaced in 2007 by the full standard, ISO 28000:2007.
ISO 28000 was developed to facilitate the identification and mitigation of security risks in the supply chain by implementing security processes to reduce the risks of theft, smuggling and tampering, and to provide a response to the threat from attacks by criminals, terrorists or others.
ISO 28000 was the product of the ISO technical committee ISO/TC 8 in collaboration with other technical committee chairs. Fourteen countries participated in its development, together with several
❝In addition to the fulfilment of key roles in countering terrorism and reducing theft,
recent supply chain security initiatives are also designed to address security problems relating
to the sale of counterfeit goods. Counterfeit goods can range from being a nuisance to a very costly problem for companies and governments, to a severe threat to public
health and safety. ❞
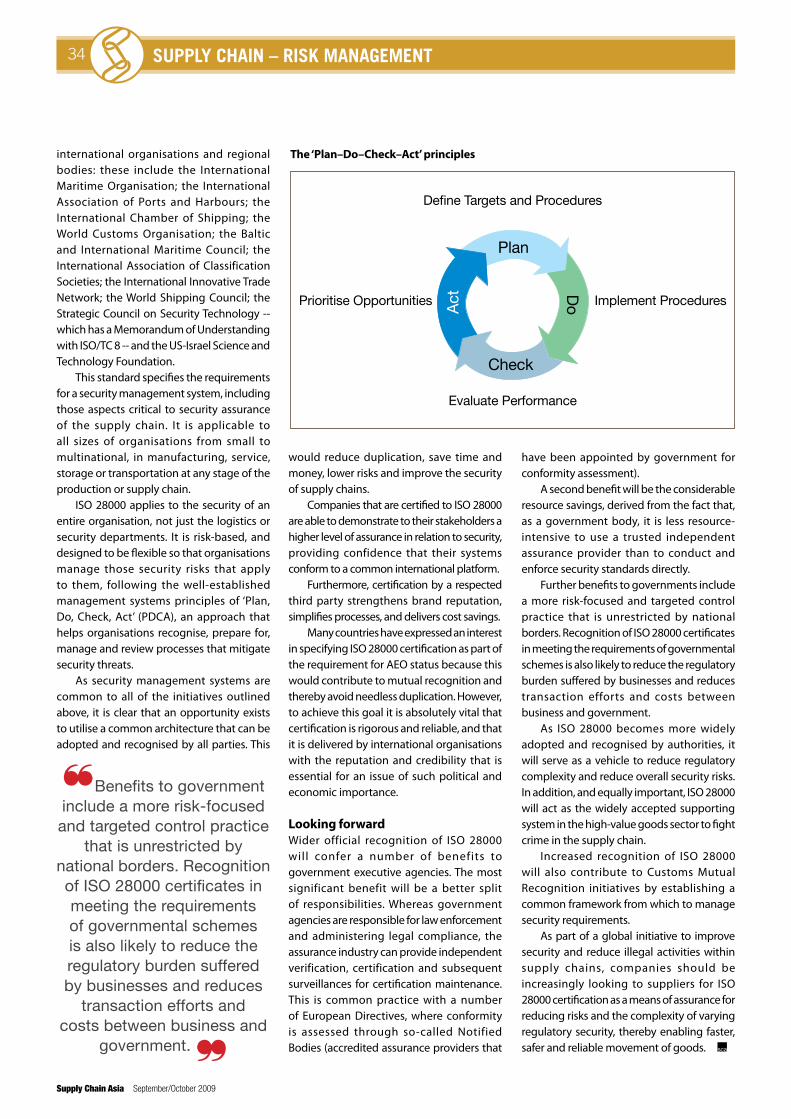
infrastructure update34 supply chain – risk management
Supply Chain Asia September/October 2009
international organisations and regional bodies: these include the International Maritime Organisation; the International Association of Ports and Harbours; the International Chamber of Shipping; the World Customs Organisation; the Baltic and International Maritime Council; the International Association of Classification Societies; the International Innovative Trade Network; the World Shipping Council; the Strategic Council on Security Technology -- which has a Memorandum of Understanding with ISO/TC 8 -- and the US-Israel Science and Technology Foundation.
This standard specifies the requirements for a security management system, including those aspects critical to security assurance of the supply chain. It is applicable to all sizes of organisations from small to multinational, in manufacturing, service, storage or transportation at any stage of the production or supply chain.
ISO 28000 applies to the security of an entire organisation, not just the logistics or security departments. It is risk-based, and designed to be flexible so that organisations manage those security risks that apply to them, following the well-established management systems principles of ‘Plan, Do, Check, Act’ (PDCA), an approach that helps organisations recognise, prepare for, manage and review processes that mitigate security threats.
As security management systems are common to all of the initiatives outlined above, it is clear that an opportunity exists to utilise a common architecture that can be adopted and recognised by all parties. This
would reduce duplication, save time and money, lower risks and improve the security of supply chains.
Companies that are certified to ISO 28000 are able to demonstrate to their stakeholders a higher level of assurance in relation to security, providing confidence that their systems conform to a common international platform.
Furthermore, certification by a respected third party strengthens brand reputation, simplifies processes, and delivers cost savings.
Many countries have expressed an interest in specifying ISO 28000 certification as part of the requirement for AEO status because this would contribute to mutual recognition and thereby avoid needless duplication. However, to achieve this goal it is absolutely vital that certification is rigorous and reliable, and that it is delivered by international organisations with the reputation and credibility that is essential for an issue of such political and economic importance.
Looking forwardWider official recognition of ISO 28000 will confer a number of benefits to government executive agencies. The most significant benefit will be a better split of responsibilities. Whereas government agencies are responsible for law enforcement and administering legal compliance, the assurance industry can provide independent verification, certification and subsequent surveillances for certification maintenance. This is common practice with a number of European Directives, where conformity is assessed through so-called Notified Bodies (accredited assurance providers that
❝Benefits to government include a more risk-focused and targeted control practice
that is unrestricted by national borders. Recognition of ISO 28000 certificates in meeting the requirements of governmental schemes is also likely to reduce the regulatory burden suffered by businesses and reduces
transaction efforts and costs between business and
government. ❞
The ‘Plan–Do–Check–Act’ principles
Prioritise Opportunities Implement Procedures
Define Targets and Procedures
Evaluate Performance
Plan
Do
Check
Act
have been appointed by government for conformity assessment).
A second benefit will be the considerable resource savings, derived from the fact that, as a government body, it is less resource-intensive to use a trusted independent assurance provider than to conduct and enforce security standards directly.
Further benefits to governments include a more risk-focused and targeted control practice that is unrestricted by national borders. Recognition of ISO 28000 certificates in meeting the requirements of governmental schemes is also likely to reduce the regulatory burden suffered by businesses and reduces transaction efforts and costs between business and government.
As ISO 28000 becomes more widely adopted and recognised by authorities, it will serve as a vehicle to reduce regulatory complexity and reduce overall security risks. In addition, and equally important, ISO 28000 will act as the widely accepted supporting system in the high-value goods sector to fight crime in the supply chain.
Increased recognition of ISO 28000 will also contribute to Customs Mutual Recognition initiatives by establishing a common framework from which to manage security requirements.
As part of a global initiative to improve security and reduce illegal activities within supply chains, companies should be increasingly looking to suppliers for ISO 28000 certification as a means of assurance for reducing risks and the complexity of varying regulatory security, thereby enabling faster, safer and reliable movement of goods.

At no time in the history of container shipping have shippers, carriers, 3PLs and terminals faced conditions like they do today. Although some recent signs suggest a stabilizing of the global economy, others point to the possibility of a long term
slump that will permanently change the business landscape. When the 3rd annual TPM Asia Conference convenes on 21 & 22 October, we will know more about where things are headed, and a top lineup of speakers will share their outlook, experience, and advice on how best to navigate today’s treacherous waters.
In this highly unpredictable and unprecedented environment, it has never been more important to hear expert speakers on the economy, logistics, and container shipping speak about where the business and economy are headed as we complete a dismal 2009 and head into an uncertain 2010.
3rd Annual
TPM AsiaConferenceAsia’s Global Container ConferenceInterContinental Shenzhen • Shenzhen, China
Asia's Global Container Conference
To register: contact JoC Conferences at [email protected] or (760) 294-5563To sponsor: contact Anne Morris at [email protected] or (818) 341-3585
To sponsor (Asia): contact Judy Ow Yeong Y.W. at [email protected] or +65-6395-5890
For more information: visit http://joc.com/TPM_Asia
21 & 22 October 2009
09
Produced by: Hosted by:
Media Sponsors: Supported By:
Hong Kong Shippers’ Council
Platinum Sponsors:
CONFIRMED SPEAKERS:
Jing Ulrich, Managing Director & Chairman, China Equities, J.P. Morgan
Eng Aik Meng, President, APL
Bjorn Vang Jensen, Vice President, Global Logistics, Electrolux
James Gagne, CEO, Greater China, Agility
Peter Levesque, Senior Vice President, CEVA Logistics
Ray Burgett, Director, Supply Chain, Pier 1 Imports
Bonnie Reimer, Global Logistics Manager, Mannington
Charles De Trenck, Principal, Transport Trackers
Tom Miller, Managing Editor, China Economic Quarterly
Neil Dekker, Container Analyst and Editor,Container Forecaster, Drewry Shipping Consultants
Rich DiNucci, Director, Secure Freight Initiative,Office of Field Operations, U.S. Customs and Border Protection

infrastructure update36 发展
Supply Chain Asia September/October 2009
意大利
瑞士
在一份由美国亿开协同商务有限公司和企业绩效管理论坛发表的调查中表明,125个供应链管理主管中的90%接受调查时认为,高级管理承认了可持续性供应链的好处和必然性。仅38%的主管将可持续性供应链与成本和效率联系在一起。但是,76%的主管说顾客还没有询问他们的碳足迹,即带来的影响。这批76%的人中,有三分之二表示他们期待在未来的12个月里被客户询问有关碳足迹的问题。
加拿大
•包装生产商碧美斯公司获得了总部位于蒙特利尔的铝制造商加拿大铝业集团的价值12亿美元的美洲食品包装订单。碧美斯为该项合约将要求全球的23个包装工厂工作,包括阿根廷,巴西,美国,墨西哥和新西兰。
美国
•福特,尼桑和特斯拉汽车将获得8千万低息贷款用于开发节能汽车。该笔贷款是一项250亿美元贷款项目的一部分,用于提高汽车燃料的使用率。福特将获得59亿美元为11家工厂更换设备来生产混合动力车以及电动汽车。尼桑将获得16亿美元为一家工厂更换设备,并开设一家新的电池分厂。特斯拉个噢公司将获得4.65亿美元来生产电动汽车和火车。
•联邦快递将其车队中混合动力车的比例扩大到50%,共264辆。新增加的汽车是由旧的2000年或2001年的标准联邦快递卡车翻新的。按计划,新的混合动力车可以提高44%燃料利用,减少96%的微尘以及75%的烟雾排放。
•国防承包商洛克希德·马丁公司获得了由美国国防部授予的额外的一份F-35战斗机合同,价值为4.419亿美元。加上预期中美国军队的2450架喷气式飞机订单,以及更多其它国家的订单,下一代战斗机将会极大的提高洛克希德公司在全球170亿美元市场中的占有率,预计从31%提高到50%。
意大利倍耐力公司称其将投资2亿美元在巴西分厂,用于扩大轮胎生产能力,提高20%。加上去年投资的1亿美元,该公司希望可以将巴西的销售提高10%。该比资金将用于生产以及研发部门。南美地区为倍耐力公司带来20亿美元的收益,该地区销售收入目前占全球销售收入的三分之一。
•乌干达将投资1680万美元用于建立和发展22个工业园区。这些园区分布在全国各地,将包括不同行业如农用工业,金属,矿业,电信,物流以及仓库业。
•中国汽车生产商重庆长安称其将在未来5年内投资8000万美元,用于在南非建立新的生产厂。该工厂将生产右侧驾驶汽车,年生产能力为50,000辆。
非洲
瑞士德讯公司发表说,会继续坚持其“严格控制的成本管理和市场份额扩张的双战略计划”。尽管与去年同期相比,海运和空运量仍旧较低,但是瑞士为基地的第三方物流公司的第二季度与第一季度相比,仍然增长了10%。
巴西 在一份绿色和平组织关于巴西牛饲养场不稳定性的报告申明后,美国鞋类品牌耐克和天伯伦禁用亚马逊河流域的皮革加工其产品。该报告从多种消费产品中使用的皮革材料追踪到巴西牛饲养场,并且绿色和平组织说明全球每年约有14%的热带雨林消失。该组织努力促使消费者给这些品牌施加压力,来阻止这些品牌继续支持饲养场。
墨西哥韩国LG电子计划在未来三年中投资1亿美元在墨西哥新建多处分厂。LG的目的在于将其生产量由2008年的26美元提高到40亿美元。三分之二的分厂将主要生产中到大型电视机。原先在墨西哥生产的手柄将从亚洲输入,而小型LCD显示器则外包给墨西哥的公司。
全球
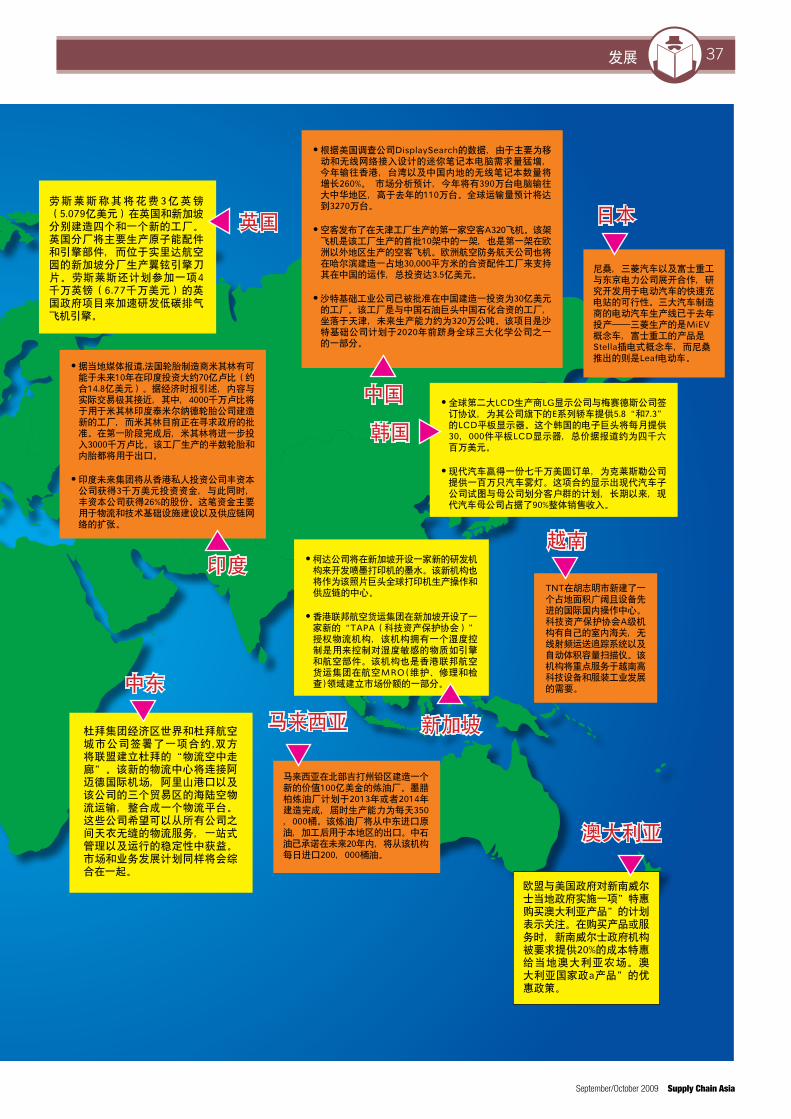
infrastructure update 37发展
September/October 2009 Supply Chain Asia
英国
韩国
印度
中东
澳大利亚
日本
•全球第二大LCD生产商LG显示公司与梅赛德斯公司签订协议,为其公司旗下的E系列轿车提供5.8“和7.3”的LCD平板显示器。这个韩国的电子巨头将每月提供30,000件平板LCD显示器,总价据报道约为四千六百万美元。
•现代汽车赢得一份七千万美圆订单,为克莱斯勒公司
提供一百万只汽车雾灯。这项合约显示出现代汽车子公司试图与母公司划分客户群的计划,长期以来,现代汽车母公司占据了90%整体销售收入。
•据当地媒体报道,法国轮胎制造商米其林有可能于未来10年在印度投资大约70亿卢比(约合14.8亿美元)。据经济时报引述,内容与实际交易极其接近,其中,4000千万卢比将于用于米其林印度泰米尔纳德轮胎公司建造新的工厂,而米其林目前正在寻求政府的批准。在第一阶段完成后,米其林将进一步投入3000千万卢比。该工厂生产的半数轮胎和内胎都将用于出口。
•印度未来集团将从香港私人投资公司丰资本公司获得3千万美元投资资金,与此同时,丰资本公司获得26%的股份。这笔资金主要用于物流和技术基础设施建设以及供应链网络的扩张。
尼桑,三菱汽车以及富士重工与东京电力公司展开合作,研究开发用于电动汽车的快速充电站的可行性。三大汽车制造商的电动汽车生产线已于去年投产——三菱生产的是MiEV概念车,富士重工的产品是Stella插电式概念车,而尼桑推出的则是Leaf电动车。
•根据美国调查公司DisplaySearch的数据,由于主要为移动和无线网络接入设计的迷你笔记本电脑需求量猛增,今年输往香港,台湾以及中国内地的无线笔记本数量将增长260%。 市场分析预计,今年将有390万台电脑输往大中华地区,高于去年的110万台。全球运输量预计将达到3270万台。
•空客发布了在天津工厂生产的第一家空客A320飞机。该架飞机是该工厂生产的首批10架中的一架,也是第一架在欧洲以外地区生产的空客飞机。欧洲航空防务航天公司也将在哈尔滨建造一占地30,000平方米的合资配件工厂来支持其在中国的运作,总投资达3.5亿美元。
•沙特基础工业公司已被批准在中国建造一投资为30亿美元的工厂。该工厂是与中国石油巨头中国石化合资的工厂,坐落于天津,未来生产能力约为320万公吨。该项目是沙特基础公司计划于2020年前跻身全球三大化学公司之一的一部分。
中国
欧盟与美国政府对新南威尔士当地政府实施一项”特惠购买澳大利亚产品”的计划表示关注。在购买产品或服务时,新南威尔士政府机构被要求提供20%的成本特惠给当地澳大利亚农场。澳大利亚国家政a产品”的优惠政策。
劳斯莱斯称其将花费3亿英镑(5.079亿美元)在英国和新加坡分别建造四个和一个新的工厂。英国分厂将主要生产原子能配件和引擎部件,而位于实里达航空园的新加坡分厂生产翼铉引擎刀片。劳斯莱斯还计划参加一项4千万英镑(6.77千万美元)的英国政府项目来加速研发低碳排气飞机引擎。
杜拜集团经济区世界和杜拜航空城市公司签署了一项合约,双方将联盟建立杜拜的“物流空中走廊”。该新的物流中心将连接阿迈德国际机场,阿里山港口以及该公司的三个贸易区的海陆空物流运输,整合成一个物流平台。这些公司希望可以从所有公司之间天衣无缝的物流服务,一站式管理以及运行的稳定性中获益。市场和业务发展计划同样将会综合在一起。
马来西亚在北部吉打州铅区建造一个新的价值100亿美金的炼油厂。墨腊柏炼油厂计划于2013年或者2014年建造完成,届时生产能力为每天350,000桶。该炼油厂将从中东进口原油,加工后用于本地区的出口。中石油已承诺在未来20年内,将从该机构每日进口200,000桶油。
•柯达公司将在新加坡开设一家新的研发机构来开发喷墨打印机的墨水。该新机构也将作为该照片巨头全球打印机生产操作和供应链的中心。
•香港联邦航空货运集团在新加坡开设了一家新的“TAPA(科技资产保护协会)”授权物流机构,该机构拥有一个湿度控制是用来控制对湿度敏感的物质如引擎和航空部件。该机构也是香港联邦航空货运集团在航空MRO(维护、修理和检查)领域建立市场份额的一部分。
越南
TNT在胡志明市新建了一个占地面积广阔且设备先进的国际国内操作中心。科技资产保护协会A级机构有自己的室内海关,无线射频运送追踪系统以及自动体积容量扫描仪。该机构将重点服务于越南高科技设备和服装工业发展的需要。
马来西亚 新加坡
38 CSR 系列
Supply Chain Asia September/October 2009
CSR 系列
39CSR 系列
September/October 2009 Supply Chain Asia
40 CSR 系列
Supply Chain Asia September/October 2009
CSR 系列

For further information, contact Mark Millar, Director, Transport Intelligence Asia Pacifi c
Tel: +852 2838 7632 email: [email protected]
Supply Chain Asia Magazine readers to receive a 20% DISCOUNT on the Transport Intelligence Asia Pacifi c report portfolio!
Major new Asia Pacifi c reports from Transport Intelligence (Ti) provide an outstanding insight into the logistics market in this region, including market sizing, forecasts, trends, trade fl ows and in depth profi les of the key market players.
Buy all 3 Asia Pacifi c reports and SAVE an amazing 20% - but only until November 3rd 2009!
Extensive qualitative analysis and quantitative data, arm the reader with a comprehensive understanding of the logistics market in Asia Pacifi c. The reports examine the signifi cant trends affecting the industry, both from the perspective of transport infrastructure and the logistics companies which serve it.
Transport Intelligence is one of the world’s leading providers of expert research and analysis dedicated to the global logistics industry, providing a range of market leading web-based research tools, reports and consultancy services used by the world’s leading logistics suppliers, consultancies, banks and users of logistics services.
The Transport Intelligence Asia Pacifi c report portfolio Vietnam Logistics 2009
Vietnam Logistics 2009 provides an overview of all the key transport modes (air, sea, road and rail) in this fast growing and important market as well as analysis of the main logistics sectors. This includes market sizes and forecasting for the contract logistics, freight forwarding and international express sectors, with further overviews of road freight, air cargo and shipping.
Asia Pacifi c Transport and Logistics 2008 Packed full of qualitative analysis and market sizing/forecasting data, the report provides an all-round understanding of the Asia Pacifi c market. It examines the signifi cant trends affecting investment, from the perspective of transport infrastructure and the logistics companies which serve it. It includes an overview of the transport infrastructure in the main economies throughout the region.
China Logistics 2008 China Logistics contains detailed analysis of China’s air, road, rail and sea infrastructure as well as market sizings and forecasts for the key logistics segments, including contract logistics, freight forwarding and express. It contains in-depth examination of the trends and developments affecting the air cargo, sea freight, ports, logistics, freight forwarding and express sectors as well as profi les of the key players.
All reports can be purchased online at www.transportintelligence.com – quote MMSCA to receive your 20% discount.
TI013 Supply Chain Asia Insert.i1 1 6/7/09 12:31:55
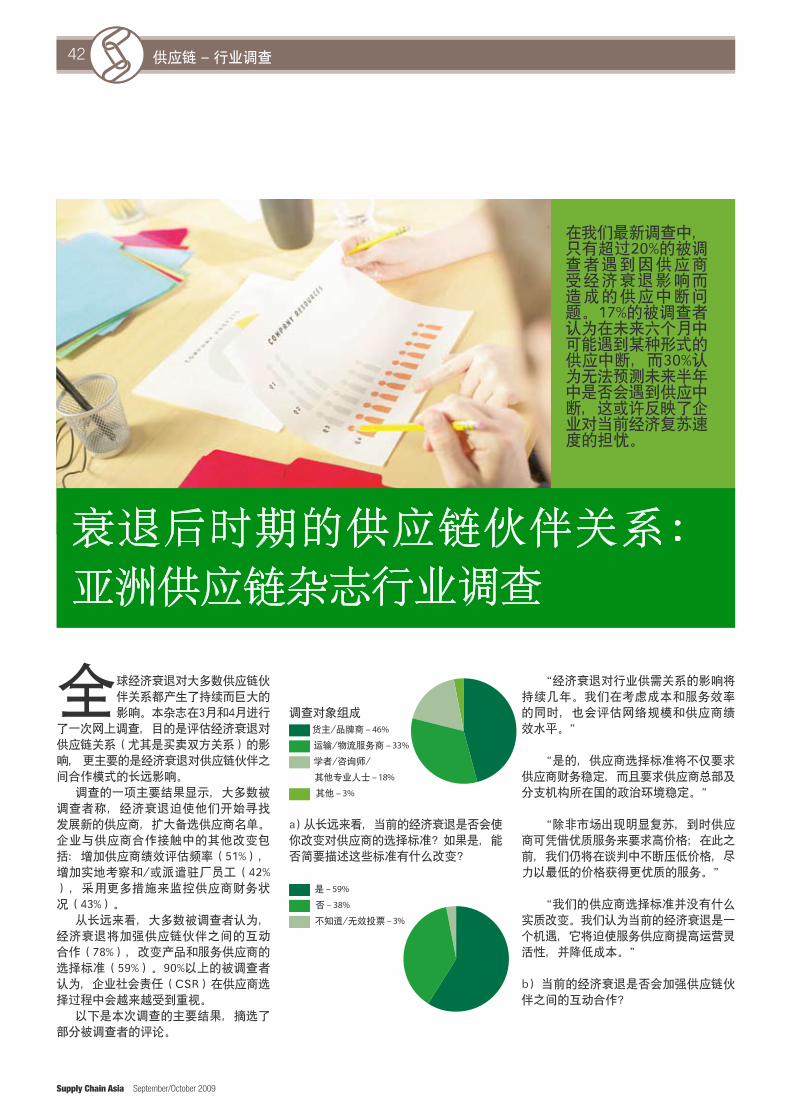
42 供应链 – 行业调查
Supply Chain Asia September/October 2009
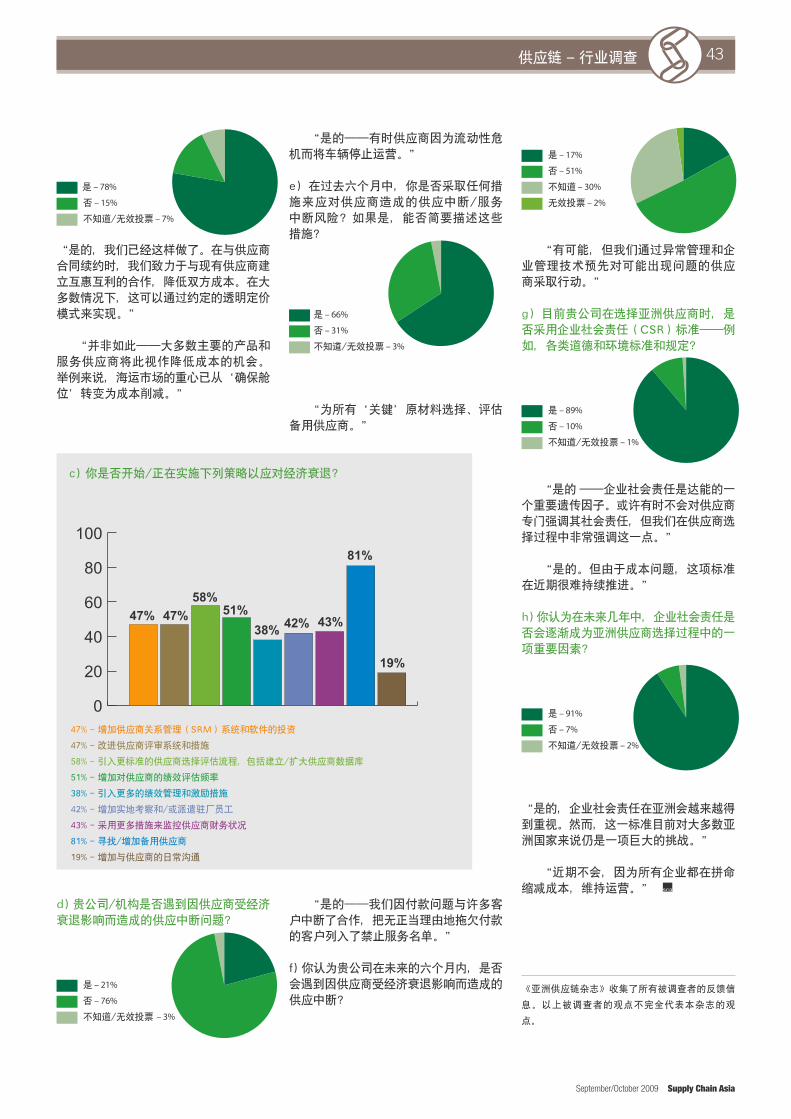
43供应链 – 行业调查
September/October 2009 Supply Chain Asia
0
20
40
60
80
100
47% 47%58%
51%38% 42% 43%
81%
19%

country focus – cHInA44
Supply Chain Asia September/October 2009
All eyes are on China these days as the world waits to see how the rapidly emerging power player will exercise its new clout among world leaders. With its role on the world stage in
flux and pressures from domestic risk and global economic malaise mounting, the health of the world’s manufacturing hub is under close scrutiny. The hyper-growth of the past few years has chilled and China’s export sector, which is responsible for 40% of its GDP, has stalled in the wake of receding demand from its trade partners to the west.
The onslaught of news reports highlighting the sluggish exports, widespread plant closings, quality concerns and rising labour costs, have brand owners questioning risk/reward value in the region. Have we reached the point where the supply chain risks outweigh the benefits in China? Not according to AMR Research: “What we found was that while the level of risks are still rising, most global companies continue to see compelling reasons to invest in sourcing, manufacturing and market expansion in China.”1
For its part, the Chinese government is taking steps to stimulate the local economy, bolster intellectual property protections and stoke export business with tax deductions. But with cost and risk on the
Analysing ‘risk threshold’
in China as market conditions pose new
Despite struggling export volumes, China is well placed to meet its full year growth target for 2009, and several studies have shown that global companies will continue to invest in sourcing and market expansion in the country. But China is changing, and the risks associated with manufacturing and sourcing here are also changing. Ryan Humphrey, director of Professional Services with ModusLink Global Solutions, talks about new market conditions in China, and how they can affect risk/reward tolerance in supply chain networks
rise in the region, companies need to be more strategic to profitably navigate the changing landscape.
Current market conditions compel Asian and multinational brand owners to re-examine the risk/reward tolerance of their supply chain network. As part of this optimisation process, it is important for companies to look at the supply chain holistically, evaluating how current risk dynamics impact their individual ability to pursue the duality of sourcing exports and selling in China.
Risk levers evolve amidst economic uncertaintyWith declining demand from the United States and Europe; rising costs for labour, material and fuel; new laws and regulations; and currency valuation swings — the vast manufacturing constituencies in China are feeling the impact in different ways. Suppliers are facing credit constraints, plants are closing, freight capacity is sitting idle and brand owners are left scrambling to maintain profit margins and service levels.
challenges for manufacturers
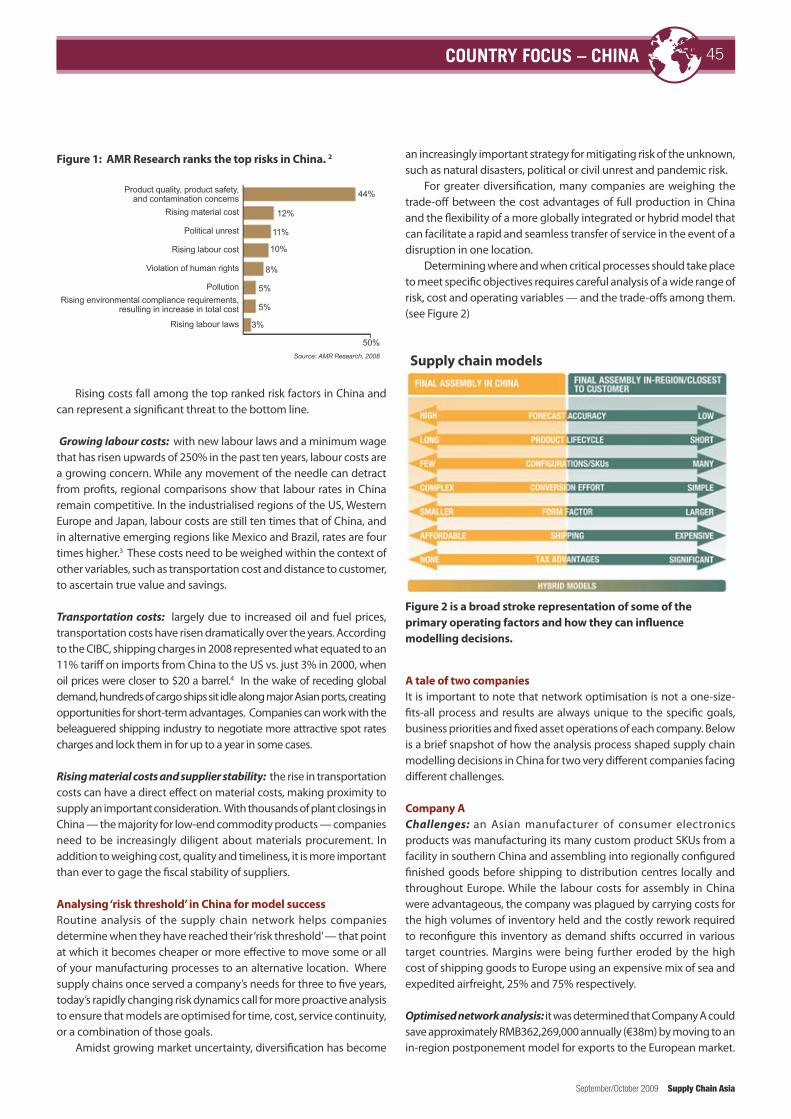
45country focus – cHInA
September/October 2009 Supply Chain Asia
Rising costs fall among the top ranked risk factors in China and can represent a significant threat to the bottom line.
Growing labour costs: with new labour laws and a minimum wage that has risen upwards of 250% in the past ten years, labour costs are a growing concern. While any movement of the needle can detract from profits, regional comparisons show that labour rates in China remain competitive. In the industrialised regions of the US, Western Europe and Japan, labour costs are still ten times that of China, and in alternative emerging regions like Mexico and Brazil, rates are four times higher.3 These costs need to be weighed within the context of other variables, such as transportation cost and distance to customer, to ascertain true value and savings.
Transportation costs: largely due to increased oil and fuel prices, transportation costs have risen dramatically over the years. According to the CIBC, shipping charges in 2008 represented what equated to an 11% tariff on imports from China to the US vs. just 3% in 2000, when oil prices were closer to $20 a barrel.4 In the wake of receding global demand, hundreds of cargo ships sit idle along major Asian ports, creating opportunities for short-term advantages. Companies can work with the beleaguered shipping industry to negotiate more attractive spot rates charges and lock them in for up to a year in some cases.
Rising material costs and supplier stability: the rise in transportation costs can have a direct effect on material costs, making proximity to supply an important consideration. With thousands of plant closings in China — the majority for low-end commodity products — companies need to be increasingly diligent about materials procurement. In addition to weighing cost, quality and timeliness, it is more important than ever to gage the fiscal stability of suppliers.
Analysing ‘risk threshold’ in China for model successRoutine analysis of the supply chain network helps companies determine when they have reached their ‘risk threshold’ — that point at which it becomes cheaper or more effective to move some or all of your manufacturing processes to an alternative location. Where supply chains once served a company’s needs for three to five years, today’s rapidly changing risk dynamics call for more proactive analysis to ensure that models are optimised for time, cost, service continuity, or a combination of those goals.
Amidst growing market uncertainty, diversification has become
Figure 1: AMR Research ranks the top risks in China. 2
Source: AMR Research, 2008
an increasingly important strategy for mitigating risk of the unknown, such as natural disasters, political or civil unrest and pandemic risk.
For greater diversification, many companies are weighing the trade-off between the cost advantages of full production in China and the flexibility of a more globally integrated or hybrid model that can facilitate a rapid and seamless transfer of service in the event of a disruption in one location.
Determining where and when critical processes should take place to meet specific objectives requires careful analysis of a wide range of risk, cost and operating variables — and the trade-offs among them. (see Figure 2)
Figure 2 is a broad stroke representation of some of the primary operating factors and how they can influence modelling decisions.
A tale of two companies It is important to note that network optimisation is not a one-size-fits-all process and results are always unique to the specific goals, business priorities and fixed asset operations of each company. Below is a brief snapshot of how the analysis process shaped supply chain modelling decisions in China for two very different companies facing different challenges.
Company AChallenges: an Asian manufacturer of consumer electronics products was manufacturing its many custom product SKUs from a facility in southern China and assembling into regionally configured finished goods before shipping to distribution centres locally and throughout Europe. While the labour costs for assembly in China were advantageous, the company was plagued by carrying costs for the high volumes of inventory held and the costly rework required to reconfigure this inventory as demand shifts occurred in various target countries. Margins were being further eroded by the high cost of shipping goods to Europe using an expensive mix of sea and expedited airfreight, 25% and 75% respectively.
Optimised network analysis: it was determined that Company A could save approximately RMB362,269,000 annually (€38m) by moving to an in-region postponement model for exports to the European market.
Supply chain models
Product quality, product safety, and contamination concerns
Rising material cost
Political unrest
Rising labour cost
Violation of human rights
PollutionRising environmental compliance requirements,
resulting in increase in total cost
Rising labour laws
44%
12%
11%
10%
8%
5%
5%
3%
50%

country focus – cHInA46
Supply Chain Asia September/October 2009
In the new model, base units would be sent to a centrally located facility where final configuration, packaging and distribution could be executed closer to the customer base and after demand was more certain. The trade-offs were as follows: • Labour costs increased (approximately seven times what they were
in Asia) • An additional hub charge was incurred • Materials costs increased 13% with local sourcing of packaging
and print media• Freight costs were lowered by 80-90% by shipping unfinished form
factors and materials (primarily sea freight, less expediting) • Risk to customer satisfaction and sales loss was all but eradicated
— along with need for costly rework — with ability to rapidly fulfil custom SKUs
• Inventory levels and carrying costs were lowered 95% with less finished goods stored
Company BChallenges: this provider of small household products is based out of the United States and was manufacturing, configuring and distributing product out of Guangdong for export to the United States. As local labour costs increased, the company considered moving to a postponement model for one of its newer products in the hopes that in-region assembly, packaging and distribution would offer some time, cost and service advantages. At the time, there were few product SKUs and configuration was simple.
Optimised network analysis: calculations showed that given the long product lifecycle, SKU simplicity, easy to forecast demand, and an affordable product-to-packaging ratio of 1 to 1.5, the company’s supply chain could tolerate the longer lead times of full assembly in China and transport via sea to the United States. With the low cost of labour in China and strong margins, the company could afford to absorb any costs that arose from expedited air shipment, should
it be necessary, without eroding the profit range sought. For this customer, it was determined that in-region configuration would have increased total supply chain costs annually by 25% without much benefit to the company or customer service levels. Based on this analysis, the decision was made to maintain a model based on full production in China.
Don’t count China outLike elsewhere, China is not immune to the ills of a global economy in crisis and is showing signs of strain. But China is poised to rebound from the downturn with its coveted role as the manufacturing hub to the world intact — and its new place in the world order solidified.
The government is pumping money into its economy to stimulate a return to the double-digit growth of the past few years and help encourage continued private sector investment. A massive $586bn stimulus package, backed by $2trn in cash reserves, is focused on driving infrastructure enhancement and tax deductions to stoke its struggling export business. Exports in May 2009 saw a decline of 26.4% from a year earlier but economists indicate the sector has now stabilised if measured on a monthly, seasonally adjusted basis.5
To build further confidence among western and Japanese trade partners, China has responded to their growing concern over product security and intellectual property rights (IPR) by implementing new laws and programmes that create a legal and cultural environment more inclined to labour and IPR protection. Investment in China is expected to continue as the duality of low-cost export sourcing and domestic selling to its vast latent market of 1.3bn consumers remains a source of attraction for multinational corporations (MNCs).
A February 2009 study commissioned by the American Chamber of Commerce in Shanghai and Booz & Company, explored the influence of the economic crisis on the commitment of MNCs doing business in China and found that, “the global business community increasingly views China as an essential player in an eventual turnaround. As a result, MNCs have strengthened their commitment to China as a key base of operations.” Nearly 50% of respondents in the study expressed an interest in growing their mainland China production capacity over the next couple of years.6
The debate over risk/reward value is no longer centred on whether to utilise a supply chain presence in the region, but how to do it effectively. Many companies realise quickly that they lack the local expertise and infrastructure, not to mention the human, technical and financial resources, required to effectively expand or enhance business in China and other burgeoning markets around the globe. Outsourcing has seen significant growth over the last few years for its ability to deliver capacity, flexibility, timeliness and cost savings and can be seen as a competitive differentiator for brand owners, especially in difficult economic times when demand is so volatile.
About the authorRyan Humphrey is the director of Professional Services for ModusLink Global Solutions a provider of worldwide supply chain business process management services and solutions. Humphrey leads a team of experts that analyse global supply chain networks to identify opportunities for strategic improvement on behalf of ModusLink and its clients.
1. AMR Research, “Supply Chain Risks, Part 2: The China Outlook—Product Quality a Major Concern, But Benefits Still Outweigh the Risk”, Noha Tohamy, Fenella Sirkisoon, July 2008.2. AMR Research, “Supply Chain Risks, Part 2: The China Outlook—Product Quality a Major Concern, But Benefits Still Outweigh the Risk”, Noha Tohamy, Fenella Sirkisoon, July 2008.3. AMR Research, “Supply Chain Risks, Part 2: The China Outlook—Product Quality a Major Concern, But Benefits Still Outweigh the Risk”, Noha Tohamy, Fenella Sirkisoon, July 2008.4. CIBC World Markets, May 27, 2008, http://research.cibcwm.com/economic_public/download/smay08.pdf. 5. Financial Times, “Positive Signs in China, despite trade fall”, Jamil Anderlini in Beijing and Justine Lau in Hong Kong, June 11, 2009, http://www.ft.com/cms/s/0/83a0c0b4-563f-11de-ab7e- 00144feabdc0.html?ftcamp=rss. 6. Press Release, “Multinational Companies Strengthening Commitment to China Despite Economic Challenges, Finds New AmCham Shanghai/Booz & Company Study”, February 2009, www.booz.com/global/home/press/article/44255888
Figure 3 depicts the calculated savings for Company A using in-region configuration model
Company ASupply ChainCost Breakdown
Unit Cost for Existing Model
Unit Cost for In-Region Configuration Model
Air Freight (75%) 80% lower
Sea Frieght (25%) 90% lower
Hub Charge none 5.62470 CNY (new charge)
Materials (Print, Media) --- 13% increase
Assembly Labour --- 670% increase
Inventory Costs (WACC 10%) --- 95% lower
Total Supply Chain Costs (average per Unit based on transport mix)
--- 50% less
Total Savings (based on expected volume) 362,269,000 CNY

reverse supply chains48
Supply Chain Asia September/October 2009
Creating sustainable high performance service supply chains
Patricia Grace and Pari Annamalai explore the conflicts and challenges that are evident in all reverse supply chains today, and present a business model that eliminates existing conflicts, addresses all challenges, and establishes a framework for long-term and sustainable high performance reverse supply chains
“Customer-centric businesses have the philosophy but not the disciplines that move from a product to customer obsession and turn passion into profit”
– Peter Fisk
Progressive outsourcing over the past 20 years has left supply chains (SCs) fragmented. Fragmentation negatively impacts performance. Service SC performance has been severely
affected, and as a result has not kept pace with either brand owner or customer expectation. While brand owners often outsource discrete portions of a reverse SC to disparate parties, ownership for both cost and service levels are retained in-house, operating to a business model with many hidden conflicts.
The origin of these conflicts lies in the way outsourcing strategies are conceived and executed. Post-implementation improvements to overall corporate performance can be significant, providing ‘cover’ for related SC performance degradation in ‘secondary areas’ that can go unobserved for extended periods of time. The following performance indicators are impacted:
• Costofservicerepairparts• Costofbothpartsandproductrepair• Monthlypartspurchases• Serviceinventoryholdingandwrite-offs• TheoverallcostofreverseSCs• Turn-aroundtimes(TAT)forproductandcomponentrepair• Openrepairorders
For the brand owner, this performance degradation results in:
• Increasedcostofquarterlywarrantycoverage• Increasedlong-termwarrantyliabilityonthebalancesheet
For the end-customer, this performance degradation results in:
• Higher(andunexpected)totalcostofownership• LongerTATsforrepair/replacement• Lessdifferentiatedwarrantyofferings
When faced with the realisation that total ‘costs to serve’ have spiralled out of control, brand owners are immediately confronted
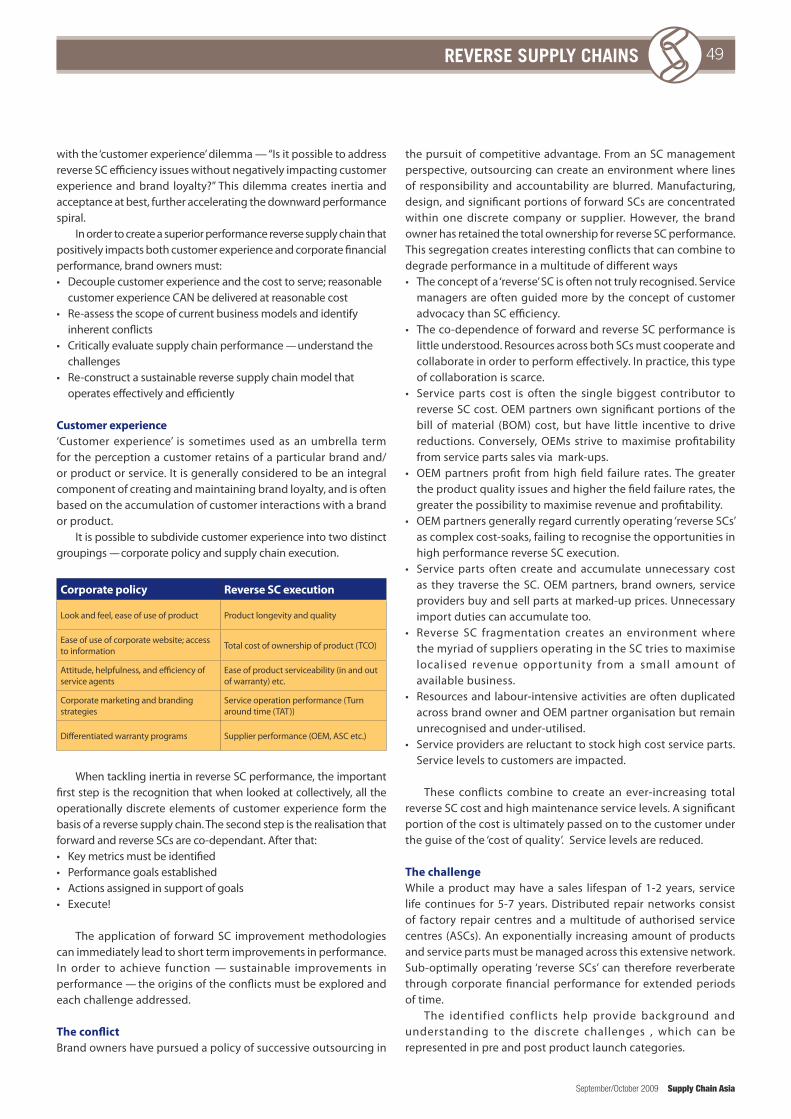
49reverse supply chains
September/October 2009 Supply Chain Asia
withthe‘customerexperience’dilemma—“Isitpossibletoaddressreverse SC efficiency issues without negatively impacting customer experience and brand loyalty?” This dilemma creates inertia and acceptance at best, further accelerating the downward performance spiral.
Inordertocreateasuperiorperformancereversesupplychainthatpositively impacts both customer experience and corporate financial performance, brand owners must:• Decouplecustomerexperienceandthecosttoserve;reasonable
customerexperienceCANbedeliveredatreasonablecost• Re-assessthescopeofcurrentbusinessmodelsandidentify
inherent conflicts• Criticallyevaluatesupplychainperformance––understandthe
challenges • Re-constructasustainablereversesupplychainmodelthat
operates effectively and efficiently
Customer experience‘Customer experience’ is sometimes used as an umbrella term fortheperceptionacustomerretainsofaparticularbrandand/orproductorservice.Itisgenerallyconsideredtobeanintegralcomponent of creating and maintaining brand loyalty, and is often based on the accumulation of customer interactions with a brand or product.
Itispossibletosubdividecustomerexperienceintotwodistinctgroupings––corporatepolicyandsupplychainexecution.
the pursuit of competitive advantage. From an SC management perspective, outsourcing can create an environment where lines of responsibility andaccountability areblurred.Manufacturing,design, and significant portions of forward SCs are concentrated withinonediscrete companyor supplier.However, thebrandowner has retained the total ownership for reverse SC performance. This segregation creates interesting conflicts that can combine to degrade performance in a multitude of different ways• Theconceptofa‘reverse’SCisoftennottrulyrecognised.Service
managers are often guided more by the concept of customer advocacy than SC efficiency.
• Theco-dependenceofforwardandreverseSCperformanceislittleunderstood.ResourcesacrossbothSCsmustcooperateandcollaborateinordertoperformeffectively.Inpractice,thistypeof collaboration is scarce.
• Serviceparts cost is often the singlebiggest contributor toreverseSCcost.OEMpartnersownsignificantportionsofthebill ofmaterial (BOM) cost, buthave little incentive todrivereductions.Conversely,OEMs strive tomaximiseprofitabilityfrom service parts sales via mark-ups.
• OEMpartnersprofit fromhighfield failure rates.Thegreatertheproductqualityissuesandhigherthefieldfailurerates,thegreater the possibility to maximise revenue and profitability.
• OEMpartnersgenerallyregardcurrentlyoperating‘reverseSCs’as complex cost-soaks, failing to recognise the opportunities in high performance reverse SC execution.
• Servicepartsoften create andaccumulateunnecessary costas they traverse theSC.OEMpartners,brandowners, serviceproviders buy and sell parts at marked-up prices. Unnecessary import duties can accumulate too.
• Reverse SC fragmentation creates an environmentwherethe myriad of suppliers operating in the SC tries to maximise localised revenue opportunity from a small amount of available business.
• Resourcesandlabour-intensiveactivitiesareoftenduplicatedacrossbrandownerandOEMpartnerorganisationbutremainunrecognised and under-utilised.
• Serviceprovidersarereluctanttostockhighcostserviceparts.Service levels to customers are impacted.
These conflicts combine to create an ever-increasing total reverseSCcostandhighmaintenanceservicelevels.Asignificantportion of the cost is ultimately passed on to the customer under theguiseofthe‘costofquality’.Servicelevelsarereduced.
The challengeWhile a product may have a sales lifespan of 1-2 years, service life continues for5-7 years.Distributed repairnetworks consistof factory repair centres and a multitude of authorised service centres (ASCs).Anexponentially increasingamountofproductsand service parts must be managed across this extensive network. Sub-optimally operating ‘reverse SCs’ can therefore reverberate through corporate financial performance for extended periods of time.
The identified conflicts help provide background and understanding to the discrete challenges , which can be represented in pre and post product launch categories.
Corporate policy Reverse SC execution
Lookandfeel,easeofuseofproduct Productlongevityandquality
Easeofuseofcorporatewebsite;accessto information Totalcostofownershipofproduct(TCO)
Attitude,helpfulness,andefficiencyofservice agents
Easeofproductserviceability(inandoutof warranty) etc.
Corporate marketing and branding strategies
Service operation performance (Turn aroundtime(TAT))
Differentiatedwarrantyprograms Supplierperformance(OEM,ASCetc.)
When tackling inertia in reverse SC performance, the important first step is the recognition that when looked at collectively, all the operationally discrete elements of customer experience form the basis of a reverse supply chain. The second step is the realisation that forwardandreverseSCsareco-dependant.Afterthat:• Keymetricsmustbeidentified• Performancegoalsestablished• Actionsassignedinsupportofgoals• Execute!
The application of forward SC improvement methodologies can immediately lead to short term improvements in performance. In order to achieve function –– sustainable improvements inperformance––theoriginsoftheconflictsmustbeexploredandeach challenge addressed.
The conflict Brand owners have pursued a policy of successive outsourcing in
reverse supply chains50
Supply Chain Asia September/October 2009
Pre-product launch• Productqualitygoalsmustbesetduring thedesign/awardof
business phase • Designforserviceability(DFS)iskey• CosteffectiveandefficientreverseSCsmustbedesignedaspartof
newproductintroduction(NPI)processes• AllcontractualrelationshipsgoverningtheoperationofreverseSC
must be regularly reviewed and obligations updated• WarrantystrategiesandexistingSCsshouldbechallenged
Post product launch• PoorlyperformingSCMprocessesthatremainunchallengedduring
theNPIphasequicklybecomerealityfornewlyreleasedproducts• Componentwarrantiesareneverclaimed• Servicepartscostsaretoohigh• Servicepartsarepurchasedinplaceofrepair,andviceversa• EarlypartspurchasesremainonthebalancesheetuntilEOL• Accumulatedimportdutiesareunnecessarilyhigh• InventorylevelsintheSCquicklyincrease• Componentrepairstrategiesconsumebothcostandcash,asparts
are transited for repair• ResourcesandprocessesduplicatedacrossbrandownerandOEM
partner remain under utilised• Qualitydatafeedbackloopsarenotinstitutionalisedandnecessary
data is neither ‘pushed’ or ‘pulled’• Theimpactofcall/servicecentreperformance––theoriginofmany
productrepairorders––onservicecostisnotrecognised• SCPerformanceisnotmetricdriven• Supplierresponsibility iseasily‘shirked’as linesofaccountability
and responsibility remain blurred
AfinancialservicemodelthatiscomplexandlittleunderstoodbySCMteamsfurthermagnifieschallenges.Rootcauseprovesdifficultto identify and reverse SC performance stagnates.
The solutionAsproductsbecomemorecommoditised,SCsmoremature,andgreater responsibility for forward SC management transitions goes toOEMpartners, so tooshould responsibility for reverseSCmanagement. This should occur under the guise of a commoditised purchased warranty, built into the product purchase price.
Thecommoditisedwarrantyagreement(CWA)mustensurethefollowing:• TheCWAcostcoversallfutureserviceparts/reverseSCcosts.(e.g.
partsorderedfreeofcharge(FOC))• TheCWcostmustbeagreedbasedonamathematicalmodelthat
projects and monitors all associated costs• Responsibilities of each party, product/component quality
expectations etc, must be defined • OEMpartnerandbrandownermustinitiallyagreehowdeviations
between actual and projected warranty costs are handled• Pertinentqualitydatamustbeagreedandsharedregularly• OEMpartnermustliaisedirectlywithASCsinsupportofallreverse
SC needs (parts orders, reimbursements for labour, scrap approvals, performance monitoring, etc)
• OEMpartnermaintains an install base of all commoditisedwarranties sold, and corresponding end-customer warranties
• OEMpartnertracksstatusofallservicepartsshipped,currentstatus,location and deliver authorisation to scrap
• KeyPerformanceIndicators,andstandardsmustbedefinedaspartof the purchased commoditised warranty and performance trackers and reports agreed.
The CW model effectively transitions all responsibility for reverse SCexecutiontotheOEMpartner,limitingbrandownerresponsibilityto real-time SC performance monitoring in a disciplined and controlled environment.
BenefitsThe CW business model yields the following benefits:• Transformswarrantymanagement into a significant profit
generating business• Lowersthe‘costofquality’footprintandcashspentonmanaging
warranty through: a) attention to detail b) automation, and c) collaboration
• Reduces the‘costofquality’ thatmustbe transitioned to thecustomer, and enables the service level improvement
• EnablestheOEMpartnertotakeresponsibilityforproductquality,andapplytheiruniqueskillsetstoreverseSCperformance
• Createsanenvironmentwhereitisbeneficialtobothbrandownerand contract manufacturer to take on responsibility for product qualityimprovementinitiatives
• CreatesawarenessandvisibilityaroundcustomerserviceandRepairTAT,with responsiblepartiesheldaccountable forperformancethrough metric driven performance
• EmbracesASCsasanintegralpartofthemanagementofthe‘costofquality’
• Providesgreaterprotectionagainstgreymarketandwarrantyfraud• Eliminatesallbrandownerwarrantyliability
Summary and conclusion InthisarticlewehighlightthefactthatreverseSCsperformsub-optimally,leading to high SC cost and reduced service levels. This has resulted from outsourcing strategies that fail to consider the effect on total SC performance. Current business model conflicts, too, are discussed and resultant performance challenges identified.
We suggest that in order to completely eliminate the conflicts and challenges and create sustainable high performance reverse SCs,aCWconceptbeintroduced,requiringOEMpartnerstoprovidecomplete management of reverse SCs in return for a single fee contained within the product purchase price. The benefits discussed include the ability to improve service levels to customers, manage differentiated warranty programmes effectively, and introduce step function reduction in reverse SC costs.
The CW concept is compelling because it creates an environment where both brand owner and contract manufacturer can successfully collaborate to operate superior performance reverse SCs that can:
a) Provide a superior customer experience to the customerb)Maximisethefinancialreturnofbothparties
The concept provides a framework that can deliver tangible business solutions to age-old business challenges that facilitate brand owner andOEMpartnercollaborationinamutuallybeneficialway.
SUPPLY CHAIN ASIA MAGAZINE – SUBSCRIPTION FORMThis order form is for Supply Chain Asia Magazine. To confirm your subscription, you will need to complete this form and fax to (Singapore) +65 6415 7211. Alternatively, you can mail your form to:
THE PUBLISHER SC Asia Publications Pte Ltd 50 Ubi Crescent, #01-08 Ubi TechPark, Singapore 408568 Tel: +65 6415 7178 Fax: +65 6415 7211 Email: [email protected]
Title: Name:
Position: Company:
Postal Address:
Country: State: Postal Code:
Phone: Fax:
Mobile: Email:
ChargesCost per subscription Please Tick
Supply Chain Asia Magazine
6 issues - 1 year (USD$79)
12 issues - 2 years (USD$129)
18 issues - 3 years (USD$179)
Methods of PaymentPayment can be made by:1. Cheque or Bank Draft. This should be made payable in US dollars or Singapore dollars to “SC Asia Publications Pte Ltd” and sent to SC Asia Publications Pte Ltd, 50 Ubi Crescent, #01-08 Ubi TechPark, Singapore 408568.
2. Telegraphic Transfer.
To be made in US dollars or Singapore dollars to the following account:Payee: SC Asia Publications Pte LtdBank: DBS Bank Ltd SingaporeBranch: Parkway ParadeSwiftcode: DBSSSGSGA/c Number : 027-902839-4
3. Credit Card
Card Type: o Visa o Master o Amex
Name __________________________________________________
Card Number ____________________________________________
Security Code _______________ (3 digit for Visa / 4 digit for Amex)
Expiry Date ____________________ Signature _________________
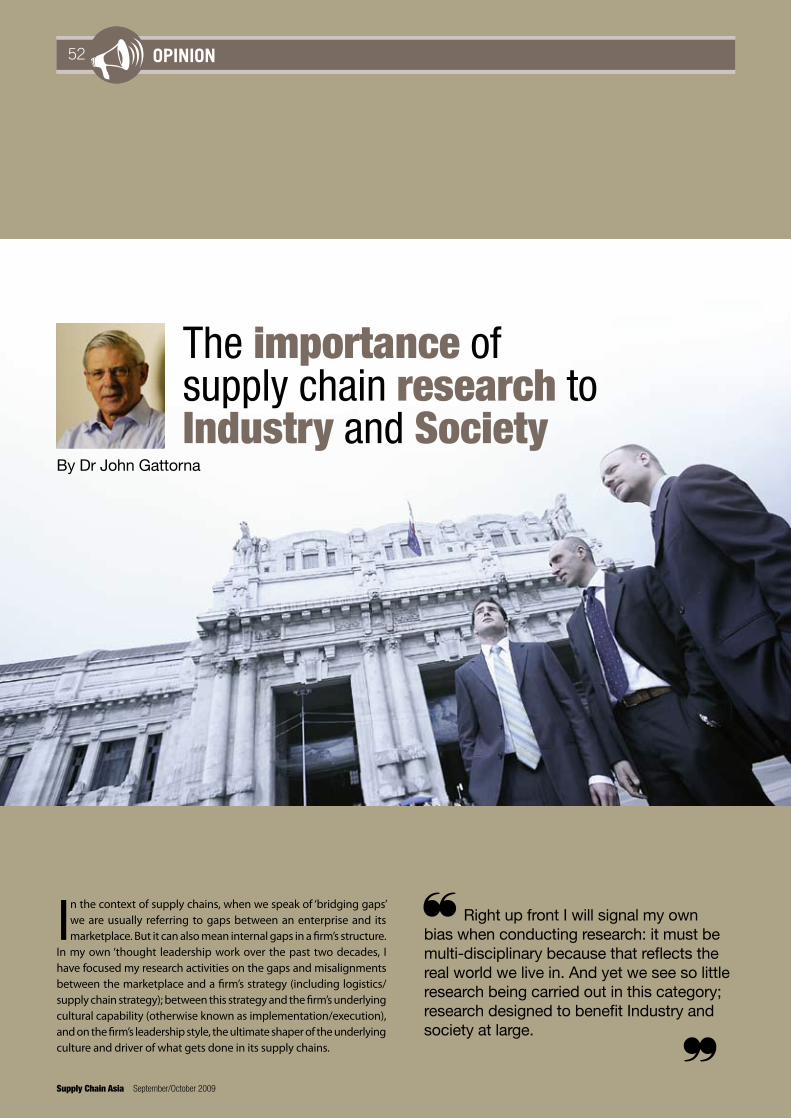
infrastructure update52 opinion
Supply Chain Asia September/October 2009
In the context of supply chains, when we speak of ‘bridging gaps’ we are usually referring to gaps between an enterprise and its marketplace. But it can also mean internal gaps in a firm’s structure.
In my own ‘thought leadership work over the past two decades, I have focused my research activities on the gaps and misalignments between the marketplace and a firm’s strategy (including logistics/supply chain strategy); between this strategy and the firm’s underlying cultural capability (otherwise known as implementation/execution), and on the firm’s leadership style, the ultimate shaper of the underlying culture and driver of what gets done in its supply chains.
The importance of supply chain research to Industry and Society
By Dr John Gattorna
infrastructure update52 opinion
Right up front I will signal my own bias when conducting research: it must be multi-disciplinary because that reflects the real world we live in. And yet we see so little research being carried out in this category; research designed to benefit Industry and society at large.
infrastructure update 53opinion
September/October 2009 Supply Chain Asia
So right up front I will signal my own bias when conducting research: it must be multi-disciplinary, because that reflects the real world we live in. And yet we see so little research being carried out in this category: research designed to benefit Industry and society at large. It is difficult to get a full picture of exactly what supply chain research is being undertaken in universities. Some Indexes exist, but the task to achieve full visibility is not easy. What we normally find are little ‘islands of supply chain research excellence’ in many universities across the region.
So, too, there exist in Asia only a few true research institutes focused on logistics and supply chain research. In Australia, for example, I know of only two: the Institute for Logistics and Supply Chain Management (ILSCM) at Victoria University, Melbourne; and the Institute of Transport and logistics at Sydney University. Perhaps it is time we showed some ‘collaborative spirit’ among universities across the Asia Pacific region, and develop a consortium with the resources to launch a larger Asia Pacific Supply Chain Research Institute, which would include a ‘Collaborative Knowledge Exchange’. Academics talk a lot and write a lot about ‘collaboration’ but don’t practice it much. But the fundamental problem we have in this field of ‘supply chain’ is that despite its pervasiveness to our modern way of life, it is so little understood by consumers at one end (the ultimate beneficiaries), and government at the other (the primary funders).
Going back to the example of Australia, there are 30 or so SRC research grants currently available in the country, but not one of those focuses on the areas of logistics and supply chain management. With logistics representing some 14.5% of GDP, it would be helpful to nail the issue from the outset and come up with the cost and contribution of logistics and supply chain activities to the Australian economy and other national economies in Asia. I can assure you that the final audited figure would be bigger than most people are aware of, and bigger than most people can even imagine. Once the real figures are out in the open, there would certainly be much more interest in research in this vital area of the economy.
University research –– some useful definitionsMany readers will already be well aware of the tension that exists in most universities between ‘academic’ or ‘theoretical’ research, and what I shall term ‘applied’ research. The former is driven by KPIs inside universities that require academics to write a certain number of articles each year in refereed journals; while the latter is more about the creative use of existing knowledge to solve real or perceived problems in industry and commerce.
At this stage, some research definitions are probably in order.1
Pure basic research: this is experimental and theoretical work undertaken to acquire new knowledge without looking for long-term benefits other than the advancement of knowledge.
Strategic basic research: this is experimental and theoretical work undertaken to acquire new knowledge directed into specified broad areas in the expectation of practical discoveries. It provides the broad base of knowledge necessary for the solution of recognised practical problems.
Applied research: this is original work undertaken primarily to acquire new knowledge with a specific application in view. It is undertaken
Perhaps it is time we showed some ‘collaborative spirit’ among universities across the Asia Pacific region, and develop a consortium with the resources to launch a larger Asia Pacific Supply Chain Research Institute, which would include a ‘Collaborative Knowledge Exchange’. Academics talk a lot and write a lot about ‘collaboration’ but don’t practice it much. But the fundamental problem we have in this field of ‘supply chain’ is that despite its pervasiveness to our modern way of life, it is so little understood by consumers at one end (the ultimate beneficiaries), and government at the other (the primary funders).
infrastructure update54 opinion
Supply Chain Asia September/October 2009
either to determine possible uses for the findings of basic research, or to determine new ways of achieving some specific and predetermined objectives.
Beyond these is ‘consulting,’ which is essentially an extension of the applied research definition for very specific commercial purposes, the results of which are mostly kept confidential. Sometimes universities, many of which have commercial arms for consulting and revenue raising purposes, have difficulty with the clash between ‘consulting’ (and the consequent limits placed on dissemination of knowledge), and the three research categories defined above.
Of course, working in research laboratory conditions inside a university is not enough when researching management science subjects such as logistics and supply chain management. Indeed, our true ‘laboratories’ are the institutions that allow researchers in to observe and investigate, and this is why the link between universities and industry is so vital, particularly in these difficult trading times. Without industry ‘laboratories’ we are seriously disadvantaged, and this is obvious from the relatively thin quality of the research that comes out of some universities.
This issue was brought home to me very strongly when I started working with Accenture (then Andersen Consulting) in their global supply chain practice in 1995. I could not help but be awed by the quantity and depth of knowledge that Accenture consultants were privy to compared to their university peers. Accenture recognised what an asset they were accumulating, and was the first consulting house to develop a global Knowledge Exchange (KX) on a Lotus Notes platform. They subsequently went further and developed the Accenture Supply Chain Academy where this knowledge is packaged up and made available for online learning of staff within their considerable base of consulting clients, at a price. It has become a new revenue stream in its own right, but more importantly, a soft marketing tool.
Window of opportunityThe global financial crisis and recession perhaps creates a ‘window of opportunity’ in the area of supply chain and logistics research. As the recession has deepened, both enterprises and consumers have changed their ‘buying behaviours’. In search of cost reduction and service improvement, firms are now directly targeting new business methods and models. In this new environment, careful research is required to better inform where to allocate scarce resources.
At the same time, consumers are pushing governments around the world to recognise that we are now in serious trouble with climate change, and the logistics and supply chain industry are front and centre of this concern when it comes to the carbon footprint left by operations that make and move product from source to consumption. ‘Sustainability’ of these operations is in question, and a significant research effort is required to define the future direction we should take. Associated with this is the emerging concern among consumers about just how products and services are produced and delivered for use, better known as Corporate Social Responsibility (CSR). In his new book2, ‘Hot, Flat, and Crowded’, Thomas Friedman foresees that the way out of the current mess –– where global finances and global climate have collided in almost ‘catastrophe theory’ proportions –– is to invest
in renewable infrastructure rather than try for quick fixes like so many governments are doing.
Here in Australia, we have very few world-scale industries, but the one we do have, resources, is the biggest. Yet here is an industry that uses few if any supply chain best practices. Surely the resources industry, intrinsically rich in funds, is a target for research designed to deliver new and more sustainable practices. We have to get beyond the type of practices witnessed in 2007/08, when the queue of ships waiting for coal outside Port Waratah, Newcastle, reached 73 at one point, stretching for 50km along the coast of New South Wales and costing the industry (and ultimately the consumer) an extra AU$1bn ($836m).
I have a personal theme song at the moment that goes something like this: Fix your supply chains and you fix the company (and the Economy). But to undertake this properly, we have to start with a fact base, and this is where universities must take leadership. It is not good enough to leave the work to consultants because the results of their work are rarely widely disseminated into the wider domain for the good of industry and for the good of society at large.
It is vital that we step up the pace of university-based research into Asian supply chains because there is a virtuous circle involving ‘research-teaching-business application’ that we must embrace so that all stakeholders, including the business community, community at large, and government can benefit. I am aware of some research of this nature that is currently underway, both here and overseas3. Beyond this, there are plans to start a new and concerted effort to build the research effort in the supply chain area in this part of the world. Our future lifestyle may depend on it.
I have a personal theme song at the moment that goes something like this: Fix your supply chains and you fix the company (and the Economy). But to undertake this properly, we have to start with a fact base, and this is where universities must take leadership.
1. “Australia’s research universities and their position in the world”, and address to the Financial Review Higher Education Conference, 10 march, 2009, Sydney, by Michael Gallagher, Executive Director, The Group of Eight (Australian Universities), taken from End Note 6 on page 18 2. Thomas L. Friedman, Hot, Flat and Crowded, Allen Lane an imprint of Penguin Books, London, 20083. Buying preferences for 3PL services (UoW, ARC); Alignment in a European context (Janet Godsell, Cranfield School of management): Insulin supply chains in third world countries (Deborah Ellis doctoral research, MGSM); etc.

Practical Skills
Success
Control
Knowledge
Experience
Confident
Recognition
About Supply Chain Asia Academy
There is an increasing need to bridge the knowledge and skills required in the Supply Chain and Logistics industry today. While academic training provide the foundational platform, it does not support corporate needs for more skilled workers.
The Academy has been set up to bridge this gap. We seek to provide 3 core ofpillars of training to the industry:
1. Skills & knowledge based training that seeks to equip learners with practical skills that can be applied to their immediate work environment. We will be offer-ing 2 levels of training in this area:
• CertificateinLogisticsOperations.Thisisa4-mod-uleprogramthatcanbecompletedin2-4months
• SpecialistDiplomainSupplyChainManagement(Asia). This is a 7-module program that be can completedin4-6months.SpecialistDiplomapro-vides specialized training in Logistics, Freight and Procurement that a candidate can choose from.
2. Professional Development Program is our soft skills training structure that aims to equip our learners with executive skills to succeed in their work environ-ment. Some of the programs that we will be offering include:• [email protected]
program that focuses on equipping learners with core leadership skills to lead an effective team
• Presentation&CommunicationsSkills.• NegotiationSkills• ServiceExcellence• EffectiveSellingSkills• BusinessEtiquetteandSelfEsteem• EffectiveTeamManagement
3. Academic program. We are in the process of work-ing with various international universities to explore providing distant learning degree and master pro-grams here in Asia.
Supply Chain Asia Academy Equipping You for Success
The Academy Unique Training Proposition
The engagement of practitioners as trainers is Supply Chain Asia Academy unique proposition totheindustry.Ourfocusistodispelthemyththat “those who cannot do, teach”. Instead, we passionately believe that those who can do MUSTTEACH.Withthispremise,weapproachvarious seasoned professionals and veterans to contribute certain portion of their time to our teaching curriculum.
Some of the professionals we engaged with will perform full classroom teachings and trainings. Otherswillbeengagedtoparticipateinlunchand dinner talks and allow students’ access to practitioners who have “fought the war” and share actual case studies and war stories, there-by enhancing the overall learning experience.
Our Value Proposition
All learners of our training programs can expect continuous mentorship, career counseling and career development and job placement support from Supply Chain Asia, through
• Industryexperiencedtrainersandcoaches
• Businessrelevancetotheparticipants
• Applicationbasedandinteractiveprograms
• Ongoingfollow-upanddevelopment
E V O L V E E D U C A T E E X C E L http://www.supplychainasia.com/academy

infrastructure update56 opinion
Supply Chain Asia September/October 2009
?really stand for
Barry Elliott on the Ever Changing Requirements of supply chain management
WhatdoesECRWhen we think about the various approaches and
methodologies that really get to the core of supply chain management, Efficient Consumer Response (ECR) is one of
the first that comes to mind.What is ECR all about? Ever Changing Requirements according
to one of our closest SCM colleagues. That is somewhat glib, but on the other hand, isn’t that what supply chain management is really about?
The ECR concept has been widely accepted around the world in consumer product and wholesale/retail industries, mainly for cost reduction throughout the whole supply chain management process, for the benefit of end customers or consumers. ECR encourages collaboration between trading partners, not only for cost reduction, but also to increase efficiency and effectiveness of service levels.
The ECR movement began in the United States in 1992 in the dry grocery sector. Two key players from the beginning have been Wal-Mart and Proctor & Gamble, working together for more efficient replenishment. The key driver behind the initiative was the more sophisticated consumer demand that followed the recession of the early 1990s. ECR then moved to Europe, Australia, and on to Asia in 1997.
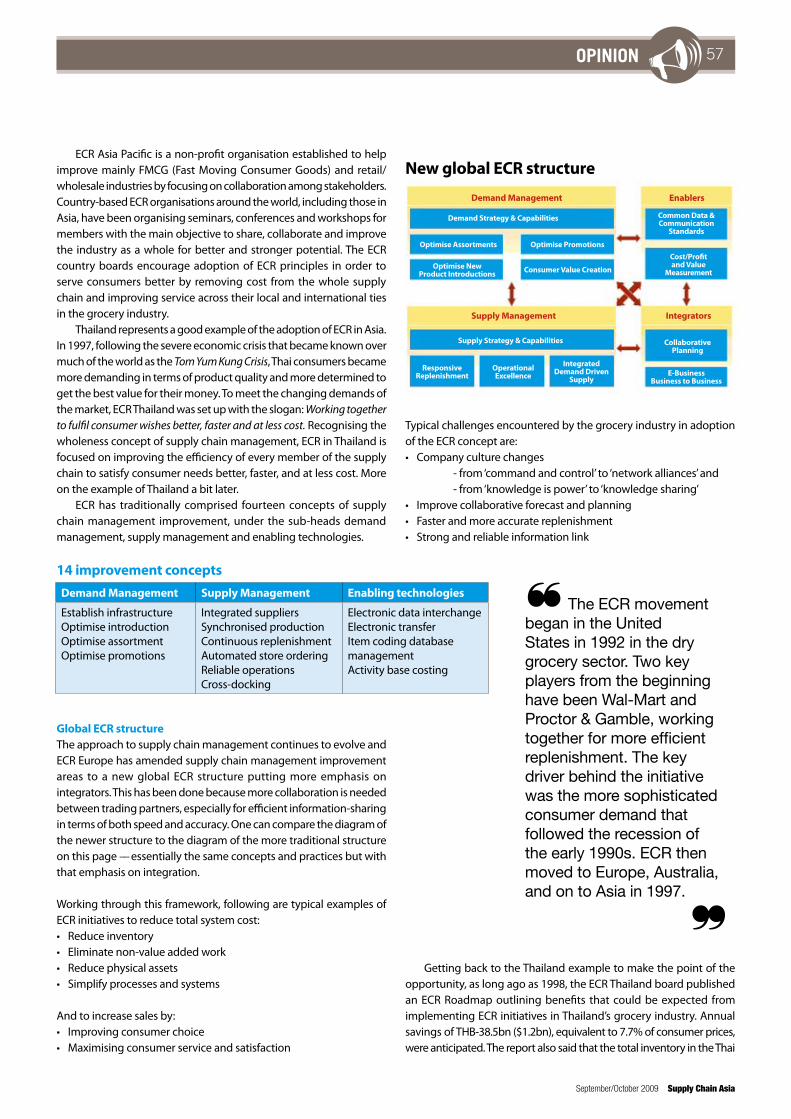
infrastructure update 57opinion
September/October 2009 Supply Chain Asia
ECR Asia Pacific is a non-profit organisation established to help improve mainly FMCG (Fast Moving Consumer Goods) and retail/wholesale industries by focusing on collaboration among stakeholders. Country-based ECR organisations around the world, including those in Asia, have been organising seminars, conferences and workshops for members with the main objective to share, collaborate and improve the industry as a whole for better and stronger potential. The ECR country boards encourage adoption of ECR principles in order to serve consumers better by removing cost from the whole supply chain and improving service across their local and international ties in the grocery industry.
Thailand represents a good example of the adoption of ECR in Asia. In 1997, following the severe economic crisis that became known over much of the world as the Tom Yum Kung Crisis, Thai consumers became more demanding in terms of product quality and more determined to get the best value for their money. To meet the changing demands of the market, ECR Thailand was set up with the slogan: Working together to fulfil consumer wishes better, faster and at less cost. Recognising the wholeness concept of supply chain management, ECR in Thailand is focused on improving the efficiency of every member of the supply chain to satisfy consumer needs better, faster, and at less cost. More on the example of Thailand a bit later.
ECR has traditionally comprised fourteen concepts of supply chain management improvement, under the sub-heads demand management, supply management and enabling technologies.
Typical challenges encountered by the grocery industry in adoption of the ECR concept are:• Companyculturechanges - from ‘command and control’ to ‘network alliances’ and - from ‘knowledge is power’ to ‘knowledge sharing’• Improvecollaborativeforecastandplanning• Fasterandmoreaccuratereplenishment• Strongandreliableinformationlink
Demand Management Supply Management Enabling technologies
Establish infrastructureOptimise introductionOptimise assortmentOptimise promotions
Integrated suppliersSynchronised productionContinuous replenishmentAutomated store orderingReliable operationsCross-docking
Electronic data interchangeElectronic transferItem coding database managementActivity base costing
14 improvement concepts
Global ECR structureThe approach to supply chain management continues to evolve and ECR Europe has amended supply chain management improvement areas to a new global ECR structure putting more emphasis on integrators. This has been done because more collaboration is needed between trading partners, especially for efficient information-sharing in terms of both speed and accuracy. One can compare the diagram of the newer structure to the diagram of the more traditional structure on this page –– essentially the same concepts and practices but with that emphasis on integration.
Working through this framework, following are typical examples of ECR initiatives to reduce total system cost:• Reduceinventory• Eliminatenon-valueaddedwork• Reducephysicalassets• Simplifyprocessesandsystems
And to increase sales by:• Improvingconsumerchoice• Maximisingconsumerserviceandsatisfaction
New global ECR structure
Getting back to the Thailand example to make the point of the opportunity, as long ago as 1998, the ECR Thailand board published an ECR Roadmap outlining benefits that could be expected from implementing ECR initiatives in Thailand’s grocery industry. Annual savings of THB-38.5bn ($1.2bn), equivalent to 7.7% of consumer prices, were anticipated. The report also said that the total inventory in the Thai
The ECR movement began in the United States in 1992 in the dry grocery sector. Two key players from the beginning have been Wal-Mart and Proctor & Gamble, working together for more efficient replenishment. The key driver behind the initiative was the more sophisticated consumer demand that followed the recession of the early 1990s. ECR then moved to Europe, Australia, and on to Asia in 1997.
Demand Management
Supply Management
Demand Strategy & Capabilities
Supply Strategy & Capabilities
Common Data & Communication
Standards
Optimise Assortments
Optimise New Product Introductions
Responsive Replenishment
Integrated Demand Driven
Supply
Collaborative Planning
E-Business Business to Business
Operational Excellence
Optimise Promotions
Consumer Value Creation
Cost/Profit and Value
Measurement
Integrators
Enablers

infrastructure update58 opinion
Supply Chain Asia September/October 2009
grocery supply chain could be reduced by 45% (a value of THB 11.5bn, or 2.3% of consumer spend) while operating costs could bring costs down by a 5.4% or THB-27bn. ECR was also predicted to significantly improve the industry’s growth.
These are not trivial numbers! On the other hand, despite the successes that we will outline here, how much has been realised and how much is still to be claimed?
In order to demonstrate the validity of these projections over the years, the ECR Thailand board has commissioned many projects to demonstrate the effectiveness of ECR improvement initiatives. In the beginning, four working groups were formed to carry out ECR projects approved by the board for implementation. Following are highlights of the achievements.
Demand management• Categorymanagement:establishingcategorymanagementbest
practices• Jointforecasting:developstandardsimpleforecastingprocesses
that can be applied to all retail formats including cash & carry, hypermarket, supermarket and convenience store
• Standardcategorydefinition:samedefinitionforthecategoryinall instances
Supply management• Continuousreplenishment––downstreamandupstream:Vendor
Managed Inventory (VMI)andsynchronisedproduction.Publishbest practice, process, result and benefit for sharing to the industries
• Standardpalletforconsumerproduct
Enabling technology• EncourageusageofbarcodeandEDItoeliminatehumanerrorand
make faster and more efficient processes
Education• Developandorganise trainingprogrammes related toEfficient
Consumer Response initiatives• Newslettersforinformationsharing
Implementation Sharing of ECR concepts and initiatives is easy but, as with all such situations, the difficult part is how to implement those initiatives. Over the years, the ECR board has foreseen this obstacle and, therefore, initiated and supported several pilot projects. Good examples are the three continuous replenishment projects:• AdownstreamVMI(VendorManagedInventory)projectbetween
Procter & Gamble and TOPS/AHOLD• AdownstreamVMIprojectbetweenNestléandBigC/Casino• AnupstreamprojectbetweenStarprintandUnilever.
The projects have been outstanding successes and have more than demonstrated the benefits that can be achieved by applying ECR supply improvements. The highlights have been inventory reductions of up to 62%, lead-time reductions of up to 30%, and reduction in service failure of up to 50%.
In addition, there are a lot of opportunities which will yield substantial other benefits as these improvement projects are rolled out
to a wider set of participants. These other benefits include improved forecast accuracy, less variation in demand, lower inventories in the supplying company, greater asset utilisation as variability decreases and more demand becomes more predictable, improved trading partner relations as service levels improve, and improved consumer loyalty as products become more consistently available.
As a result of these successful projects, the participating companies are rolling out their implementations to include more of their products and more of their trading partners in more countries. They are also sharing their experiences, both obstacles and successes, in training courses and conferences regularly organised by ECR affiliate organisations.
It is very important to note that ECR initiatives are not a ready-made solution for all. Each organisation needs to evaluate its own situation and determine from where they will gain most benefit. Indeed, we are reminded of our experience with the ECR launch in Australia back in the mid 1990s. In the first year, everyone was full of excitement and promise based on the prospective benefits that they would accrue from implementing ECR concepts and practices. By the following year, the big discussion was that of the challenge of collaborating across the supply chain. Lack of trust was the issue. As usual, knowing what to do was the easy part; it was getting people to the point where they wanted to do it was the hard part.
In summary, though, we are big fans of ECR. In fact, in our view, when you consider practical, pan- and cross-industry initiatives, we figure that ECR, as well as the work like that of the Supply Chain Council, are the most outstanding successes in the application of basic supply chain management principles and concepts on a broad scale. And that is the key point: good, basic, pragmatic applications. Norocketscience.
The ECR Thailand board published an ECR Roadmap outlining benefits that could be expected from implementing ECR initiatives in Thailand’s grocery industry. Annual savings of THB38.5bn ($1.2bn), equivalent to 7.7% of consumer prices, were anticipated. The report also said that the total inventory in the Thai grocery supply chain could be reduced by 45% (a value of THB11.5bn, or 2.3% of consumer spend) while operating costs could bring costs down by a 5.4% or THB27bn. ECR was also predicted to significantly improve the industry’s growth.

W
C O N N E C T . C O M M U N I C A T E . C O L L A B O R A T E .
For details, pricing, and registration, please visit www.supplychainasia.com/dialogue
Supply Chain Asia DIALOGUE
Coming toa City near you... Singapore, Mumbai, Hong Kong, Shanghai, Sydney,
Kuala Lumpur, Bangkok, Taipei
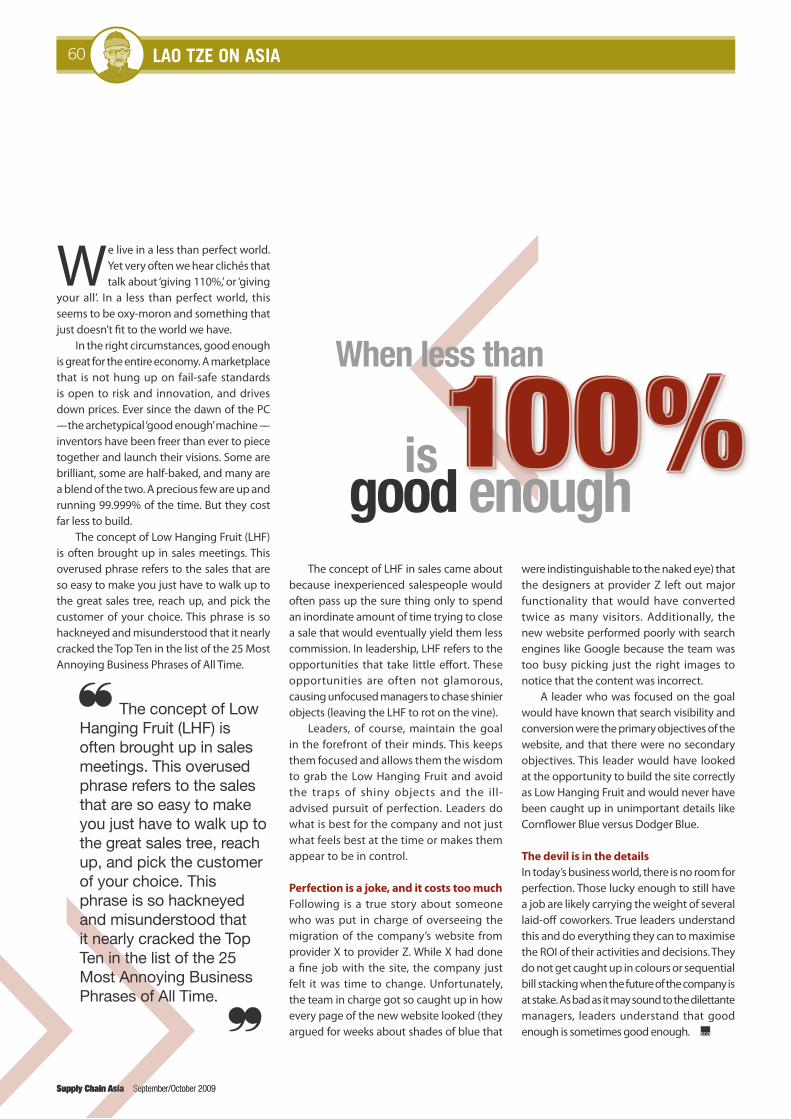
infrastructure update60 lao tze on asia
Supply Chain Asia September/October 2009
We live in a less than perfect world. Yet very often we hear clichés that talk about ‘giving 110%,’ or ‘giving
your all’. In a less than perfect world, this seems to be oxy-moron and something that just doesn’t fit to the world we have.
In the right circumstances, good enough is great for the entire economy. A marketplace that is not hung up on fail-safe standards is open to risk and innovation, and drives down prices. Ever since the dawn of the PC –– the archetypical ‘good enough’ machine –– inventors have been freer than ever to piece together and launch their visions. Some are brilliant, some are half-baked, and many are a blend of the two. A precious few are up and running 99.999% of the time. But they cost far less to build.
The concept of Low Hanging Fruit (LHF) is often brought up in sales meetings. This overused phrase refers to the sales that are so easy to make you just have to walk up to the great sales tree, reach up, and pick the customer of your choice. This phrase is so hackneyed and misunderstood that it nearly cracked the Top Ten in the list of the 25 Most Annoying Business Phrases of All Time.
The concept of LHF in sales came about because inexperienced salespeople would often pass up the sure thing only to spend an inordinate amount of time trying to close a sale that would eventually yield them less commission. In leadership, LHF refers to the opportunities that take little effort. These opportunities are often not glamorous, causing unfocused managers to chase shinier objects (leaving the LHF to rot on the vine).
Leaders, of course, maintain the goal in the forefront of their minds. This keeps them focused and allows them the wisdom to grab the Low Hanging Fruit and avoid the traps of shiny objects and the ill-advised pursuit of perfection. Leaders do what is best for the company and not just what feels best at the time or makes them appear to be in control.
Perfection is a joke, and it costs too muchFollowing is a true story about someone who was put in charge of overseeing the migration of the company’s website from provider X to provider Z. While X had done a fine job with the site, the company just felt it was time to change. Unfortunately, the team in charge got so caught up in how every page of the new website looked (they argued for weeks about shades of blue that
The concept of Low Hanging Fruit (LHF) is often brought up in sales meetings. This overused phrase refers to the sales that are so easy to make you just have to walk up to the great sales tree, reach up, and pick the customer of your choice. This phrase is so hackneyed and misunderstood that it nearly cracked the Top Ten in the list of the 25 Most Annoying Business Phrases of All Time.
When less than
100%isgood enough
were indistinguishable to the naked eye) that the designers at provider Z left out major functionality that would have converted twice as many visitors. Additionally, the new website performed poorly with search engines like Google because the team was too busy picking just the right images to notice that the content was incorrect.
A leader who was focused on the goal would have known that search visibility and conversion were the primary objectives of the website, and that there were no secondary objectives. This leader would have looked at the opportunity to build the site correctly as Low Hanging Fruit and would never have been caught up in unimportant details like Cornflower Blue versus Dodger Blue.
The devil is in the detailsIn today’s business world, there is no room for perfection. Those lucky enough to still have a job are likely carrying the weight of several laid-off coworkers. True leaders understand this and do everything they can to maximise the ROI of their activities and decisions. They do not get caught up in colours or sequential bill stacking when the future of the company is at stake. As bad as it may sound to the dilettante managers, leaders understand that good enough is sometimes good enough.
Supply Chain Asia September/October 2009

Supply Chain Asia Forum 2009 Handbook
S u p p l y C h a i nMarketingF i n a n c e L o g i s t i c s FM CG P lanningFash ionTechnology FoodL i fes t y les IndustriesJobsForumWorkshopsGamesHealthOpportunities
Want to be on our mailing list?Drop us an email
Y O U N G P R O F E S S I O N A L S C O N V E N T I O N
Conventio
n
Conference. Careers. Expo.
Singapore Management University
16-17 October 2009
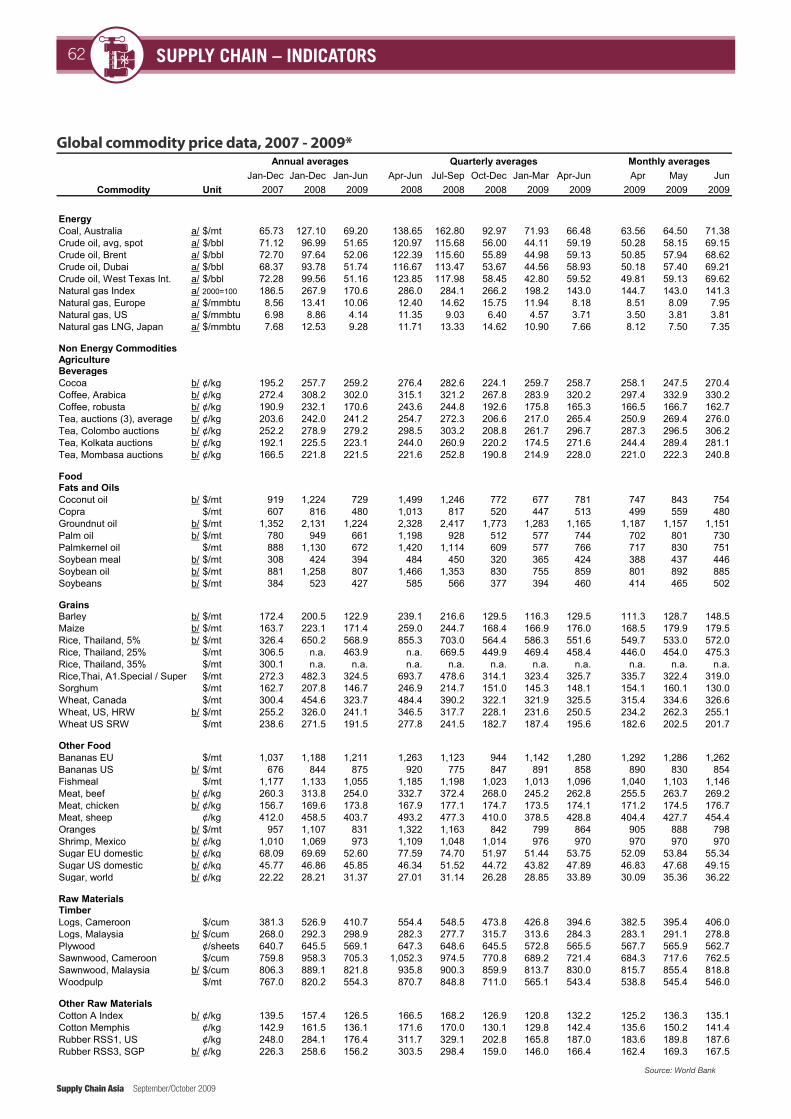
Supply Chain – indiCatorS62
Supply Chain Asia September/October 2009
COMMODITY PRICE DATA Annual averages Quarterly averages Monthly averages
Jan-Dec Jan-Dec Jan-Jun Apr-Jun Jul-Sep Oct-Dec Jan-Mar Apr-Jun Apr May JunCommodity Unit 2007 2008 2009 2008 2008 2008 2009 2009 2009 2009 2009
EnergyCoal, Australia a/ $/mt 65.73 127.10 69.20 138.65 162.80 92.97 71.93 66.48 63.56 64.50 71.38Crude oil, avg, spot a/ $/bbl 71.12 96.99 51.65 120.97 115.68 56.00 44.11 59.19 50.28 58.15 69.15Crude oil, Brent a/ $/bbl 72.70 97.64 52.06 122.39 115.60 55.89 44.98 59.13 50.85 57.94 68.62Crude oil, Dubai a/ $/bbl 68.37 93.78 51.74 116.67 113.47 53.67 44.56 58.93 50.18 57.40 69.21Crude oil, West Texas Int. a/ $/bbl 72.28 99.56 51.16 123.85 117.98 58.45 42.80 59.52 49.81 59.13 69.62Natural gas Index a/ 2000=100 186.5 267.9 170.6 286.0 284.1 266.2 198.2 143.0 144.7 143.0 141.3Natural gas, Europe a/ $/mmbtu 8.56 13.41 10.06 12.40 14.62 15.75 11.94 8.18 8.51 8.09 7.95Natural gas, US a/ $/mmbtu 6.98 8.86 4.14 11.35 9.03 6.40 4.57 3.71 3.50 3.81 3.81Natural gas LNG, Japan a/ $/mmbtu 7.68 12.53 9.28 11.71 13.33 14.62 10.90 7.66 8.12 7.50 7.35
Non Energy CommoditiesAgricultureBeveragesCocoa b/ ¢/kg 195.2 257.7 259.2 276.4 282.6 224.1 259.7 258.7 258.1 247.5 270.4Coffee, Arabica b/ ¢/kg 272.4 308.2 302.0 315.1 321.2 267.8 283.9 320.2 297.4 332.9 330.2Coffee, robusta b/ ¢/kg 190.9 232.1 170.6 243.6 244.8 192.6 175.8 165.3 166.5 166.7 162.7Tea, auctions (3), average b/ ¢/kg 203.6 242.0 241.2 254.7 272.3 206.6 217.0 265.4 250.9 269.4 276.0Tea, Colombo auctions b/ ¢/kg 252.2 278.9 279.2 298.5 303.2 208.8 261.7 296.7 287.3 296.5 306.2Tea, Kolkata auctions b/ ¢/kg 192.1 225.5 223.1 244.0 260.9 220.2 174.5 271.6 244.4 289.4 281.1Tea, Mombasa auctions b/ ¢/kg 166.5 221.8 221.5 221.6 252.8 190.8 214.9 228.0 221.0 222.3 240.8
FoodFats and OilsCoconut oil b/ $/mt 919 1,224 729 1,499 1,246 772 677 781 747 843 754Copra $/mt 607 816 480 1,013 817 520 447 513 499 559 480Groundnut oil b/ $/mt 1,352 2,131 1,224 2,328 2,417 1,773 1,283 1,165 1,187 1,157 1,151Palm oil b/ $/mt 780 949 661 1,198 928 512 577 744 702 801 730Palmkernel oil $/mt 888 1,130 672 1,420 1,114 609 577 766 717 830 751Soybean meal b/ $/mt 308 424 394 484 450 320 365 424 388 437 446Soybean oil b/ $/mt 881 1,258 807 1,466 1,353 830 755 859 801 892 885Soybeans b/ $/mt 384 523 427 585 566 377 394 460 414 465 502
GrainsBarley b/ $/mt 172.4 200.5 122.9 239.1 216.6 129.5 116.3 129.5 111.3 128.7 148.5Maize b/ $/mt 163.7 223.1 171.4 259.0 244.7 168.4 166.9 176.0 168.5 179.9 179.5Rice, Thailand, 5% b/ $/mt 326.4 650.2 568.9 855.3 703.0 564.4 586.3 551.6 549.7 533.0 572.0Rice, Thailand, 25% $/mt 306.5 n.a. 463.9 n.a. 669.5 449.9 469.4 458.4 446.0 454.0 475.3Rice, Thailand, 35% $/mt 300.1 n.a. n.a. n.a. n.a. n.a. n.a. n.a. n.a. n.a. n.a.Rice,Thai, A1.Special / Super $/mt 272.3 482.3 324.5 693.7 478.6 314.1 323.4 325.7 335.7 322.4 319.0Sorghum $/mt 162.7 207.8 146.7 246.9 214.7 151.0 145.3 148.1 154.1 160.1 130.0Wheat, Canada $/mt 300.4 454.6 323.7 484.4 390.2 322.1 321.9 325.5 315.4 334.6 326.6Wheat, US, HRW b/ $/mt 255.2 326.0 241.1 346.5 317.7 228.1 231.6 250.5 234.2 262.3 255.1Wheat US SRW $/mt 238.6 271.5 191.5 277.8 241.5 182.7 187.4 195.6 182.6 202.5 201.7
Other FoodBananas EU $/mt 1,037 1,188 1,211 1,263 1,123 944 1,142 1,280 1,292 1,286 1,262Bananas US b/ $/mt 676 844 875 920 775 847 891 858 890 830 854Fishmeal $/mt 1,177 1,133 1,055 1,185 1,198 1,023 1,013 1,096 1,040 1,103 1,146Meat, beef b/ ¢/kg 260.3 313.8 254.0 332.7 372.4 268.0 245.2 262.8 255.5 263.7 269.2Meat, chicken b/ ¢/kg 156.7 169.6 173.8 167.9 177.1 174.7 173.5 174.1 171.2 174.5 176.7Meat, sheep ¢/kg 412.0 458.5 403.7 493.2 477.3 410.0 378.5 428.8 404.4 427.7 454.4Oranges b/ $/mt 957 1,107 831 1,322 1,163 842 799 864 905 888 798Shrimp, Mexico b/ ¢/kg 1,010 1,069 973 1,109 1,048 1,014 976 970 970 970 970Sugar EU domestic b/ ¢/kg 68.09 69.69 52.60 77.59 74.70 51.97 51.44 53.75 52.09 53.84 55.34Sugar US domestic b/ ¢/kg 45.77 46.86 45.85 46.34 51.52 44.72 43.82 47.89 46.83 47.68 49.15Sugar, world b/ ¢/kg 22.22 28.21 31.37 27.01 31.14 26.28 28.85 33.89 30.09 35.36 36.22
Raw MaterialsTimberLogs, Cameroon $/cum 381.3 526.9 410.7 554.4 548.5 473.8 426.8 394.6 382.5 395.4 406.0Logs, Malaysia b/ $/cum 268.0 292.3 298.9 282.3 277.7 315.7 313.6 284.3 283.1 291.1 278.8Plywood ¢/sheets 640.7 645.5 569.1 647.3 648.6 645.5 572.8 565.5 567.7 565.9 562.7Sawnwood, Cameroon $/cum 759.8 958.3 705.3 1,052.3 974.5 770.8 689.2 721.4 684.3 717.6 762.5Sawnwood, Malaysia b/ $/cum 806.3 889.1 821.8 935.8 900.3 859.9 813.7 830.0 815.7 855.4 818.8Woodpulp $/mt 767.0 820.2 554.3 870.7 848.8 711.0 565.1 543.4 538.8 545.4 546.0
Other Raw MaterialsCotton A Index b/ ¢/kg 139.5 157.4 126.5 166.5 168.2 126.9 120.8 132.2 125.2 136.3 135.1Cotton Memphis ¢/kg 142.9 161.5 136.1 171.6 170.0 130.1 129.8 142.4 135.6 150.2 141.4Rubber RSS1, US ¢/kg 248.0 284.1 176.4 311.7 329.1 202.8 165.8 187.0 183.6 189.8 187.6Rubber RSS3, SGP b/ ¢/kg 226.3 258.6 156.2 303.5 298.4 159.0 146.0 166.4 162.4 169.3 167.5
- 1 -
Global commodity price data, 2007 - 2009*
Source: World Bank
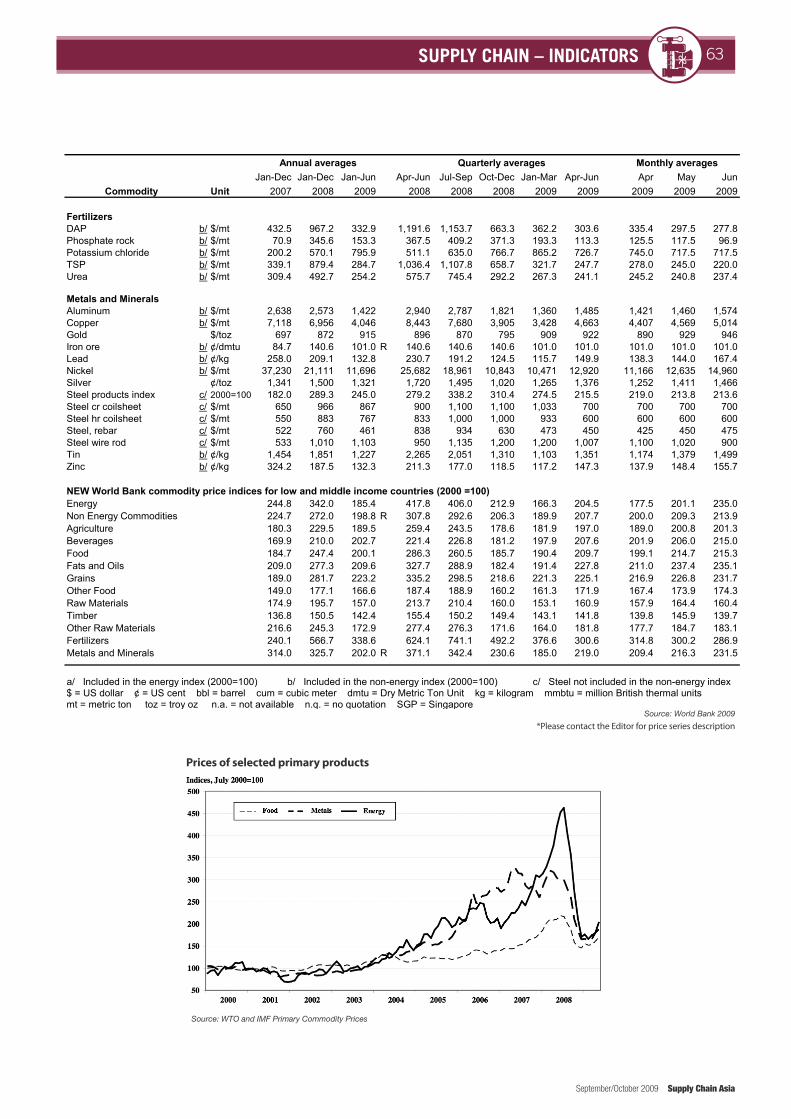
63Supply Chain – indiCatorS
September/October 2009 Supply Chain Asia
COMMODITY PRICE DATA Annual averages Quarterly averages Monthly averages
Jan-Dec Jan-Dec Jan-Jun Apr-Jun Jul-Sep Oct-Dec Jan-Mar Apr-Jun Apr May JunCommodity Unit 2007 2008 2009 2008 2008 2008 2009 2009 2009 2009 2009
FertilizersDAP b/ $/mt 432.5 967.2 332.9 1,191.6 1,153.7 663.3 362.2 303.6 335.4 297.5 277.8Phosphate rock b/ $/mt 70.9 345.6 153.3 367.5 409.2 371.3 193.3 113.3 125.5 117.5 96.9Potassium chloride b/ $/mt 200.2 570.1 795.9 511.1 635.0 766.7 865.2 726.7 745.0 717.5 717.5TSP b/ $/mt 339.1 879.4 284.7 1,036.4 1,107.8 658.7 321.7 247.7 278.0 245.0 220.0Urea b/ $/mt 309.4 492.7 254.2 575.7 745.4 292.2 267.3 241.1 245.2 240.8 237.4
Metals and MineralsAluminum b/ $/mt 2,638 2,573 1,422 2,940 2,787 1,821 1,360 1,485 1,421 1,460 1,574Copper b/ $/mt 7,118 6,956 4,046 8,443 7,680 3,905 3,428 4,663 4,407 4,569 5,014Gold $/toz 697 872 915 896 870 795 909 922 890 929 946Iron ore b/ ¢/dmtu 84.7 140.6 101.0 R 140.6 140.6 140.6 101.0 101.0 101.0 101.0 101.0Lead b/ ¢/kg 258.0 209.1 132.8 230.7 191.2 124.5 115.7 149.9 138.3 144.0 167.4Nickel b/ $/mt 37,230 21,111 11,696 25,682 18,961 10,843 10,471 12,920 11,166 12,635 14,960Silver ¢/toz 1,341 1,500 1,321 1,720 1,495 1,020 1,265 1,376 1,252 1,411 1,466Steel products index c/ 2000=100 182.0 289.3 245.0 279.2 338.2 310.4 274.5 215.5 219.0 213.8 213.6Steel cr coilsheet c/ $/mt 650 966 867 900 1,100 1,100 1,033 700 700 700 700Steel hr coilsheet c/ $/mt 550 883 767 833 1,000 1,000 933 600 600 600 600Steel, rebar c/ $/mt 522 760 461 838 934 630 473 450 425 450 475Steel wire rod c/ $/mt 533 1,010 1,103 950 1,135 1,200 1,200 1,007 1,100 1,020 900Tin b/ ¢/kg 1,454 1,851 1,227 2,265 2,051 1,310 1,103 1,351 1,174 1,379 1,499Zinc b/ ¢/kg 324.2 187.5 132.3 211.3 177.0 118.5 117.2 147.3 137.9 148.4 155.7
NEW World Bank commodity price indices for low and middle income countries (2000 =100)Energy 244.8 342.0 185.4 417.8 406.0 212.9 166.3 204.5 177.5 201.1 235.0Non Energy Commodities 224.7 272.0 198.8 R 307.8 292.6 206.3 189.9 207.7 200.0 209.3 213.9Agriculture 180.3 229.5 189.5 259.4 243.5 178.6 181.9 197.0 189.0 200.8 201.3Beverages 169.9 210.0 202.7 221.4 226.8 181.2 197.9 207.6 201.9 206.0 215.0Food 184.7 247.4 200.1 286.3 260.5 185.7 190.4 209.7 199.1 214.7 215.3Fats and Oils 209.0 277.3 209.6 327.7 288.9 182.4 191.4 227.8 211.0 237.4 235.1Grains 189.0 281.7 223.2 335.2 298.5 218.6 221.3 225.1 216.9 226.8 231.7Other Food 149.0 177.1 166.6 187.4 188.9 160.2 161.3 171.9 167.4 173.9 174.3Raw Materials 174.9 195.7 157.0 213.7 210.4 160.0 153.1 160.9 157.9 164.4 160.4Timber 136.8 150.5 142.4 155.4 150.2 149.4 143.1 141.8 139.8 145.9 139.7Other Raw Materials 216.6 245.3 172.9 277.4 276.3 171.6 164.0 181.8 177.7 184.7 183.1Fertilizers 240.1 566.7 338.6 624.1 741.1 492.2 376.6 300.6 314.8 300.2 286.9Metals and Minerals 314.0 325.7 202.0 R 371.1 342.4 230.6 185.0 219.0 209.4 216.3 231.5
a/ Included in the energy index (2000=100) b/ Included in the non-energy index (2000=100) c/ Steel not included in the non-energy index$ = US dollar ¢ = US cent bbl = barrel cum = cubic meter dmtu = Dry Metric Ton Unit kg = kilogram mmbtu = million British thermal units mt = metric ton toz = troy oz n.a. = not available n.q. = no quotation SGP = Singapore
D e s c r i p t i o n o f P r i c e S e r i e s
Coal (Australian), thermal, f.o.b. piers, Newcastle/Port Kembla, 6,300 kcal/kg (11,340 btu/lb), less than 0.8%, sulfur 13% ash beginning January 2002; previously 6,667 kcal/kg (12,000 btu/lb), less than 1.0% sulfur, 14% ashCrude oil (spot), average spot price of Brent, Dubai and West Texas Intermediate, equally weighedCrude oil (spot), U.K. Brent 38` API, f.o.b. U.K portsCrude oil (spot), Dubai Fateh 32` API, f.o.b. DubaiCrude oil (spot), West Texas Intermediate (WTI) 40` API, f.o.b. Midland TexasNatural Gas Index, composite index weighted by consumption volumes for Europe, US and Japan liquefied natural gas (LNG).Natural Gas (Europe), average import border price including U.K. for 1991 - May, 2000; from June 2000 onwards European import price excluding U.K.Natural Gas (U.S.), spot price at Henry Hub, LouisianaNatural gas LNG (Japan), import price, cif, recent two months' averages are estimates.
Cocoa (ICCO), International Cocoa Organization daily price, average of the first three positions on the terminal markets of New York and London, nearest three future trading months.Coffee (ICO), International Coffee Organization indicator price, other mild Arabicas, average New York and Bremen/Hamburg markets, ex-dockCoffee (ICO), International Coffee Organization indicator price, Robustas, average New York and Le Havre/Marseilles markets, ex-dockTea , average three auctions, arithmetic average of quotations at Kolkata, Colombo and Mombasa/Nairobi.Tea (Colombo auctions), Sri Lankan origin, all tea, arithmetic average of weekly quotes.Tea (Kolkata auctions), leaf, include excise duty, arithmetic average of weekly quotes.Tea (Mombasa/Nairobi auctions), African origin, all tea, arithmetic average of weekly quotes.
Coconut oil (Philippines/Indonesian), bulk, c.i.f. RotterdamCopra (Philippines/Indonesian), bulk, c.i.f. N.W. EuropeGroundnut oil (any origin), c.i.f. RotterdamPalm oil (Malaysian), 5% bulk, c.i.f. N. W. EuropePalmkernel Oil (Malaysian), c.I.f. RotterdamSoybean meal (any origin), Argentine 45/46% extraction, c.i.f. Rotterdam; prior to 1990, US 44%Soybean oil (Dutch), crude, f.o.b. ex-millSoybeans (US), c.i.f. Rotterdam
- 2 -
Source: World Bank 2009
Prices of selected primary products
Source: WTO and IMF Primary Commodity Prices
*Please contact the Editor for price series description
64 blogs
Supply Chain Asia September/October 2009
Supply chain corporate responsibilitiesFrom polluting the environment to creating sweatshops, poorly managed supply chains can tarnish the reputation of any company and do not make good business sense. Many global corporations realise this, which is why they have been so progressive in maintaining supply chains that hold themselves accountable for everything from the labour they employ to the eco-friendliness of the parts they use, and many actually report on their progress and efforts.
Doing its part, IBM has just released its corporate responsibility report for 2008 and it dedicates a big part of it to its supply chain. Here are a few highlights from page 32, Supply chain responsibility: a commitment to collaboration. • During2008,IBMcontinuedtoimplementitsSupplyChainSocial
Responsibility initiative across its global network of suppliers. By the end of 2008, we had completed a cumulative total of 553 initial audits; including expansion into three additional growth market countries (36 initial audits): Argentina, Malaysia and Vietnam.
• In2008,IBMspent$1.5bninsidetheUSand$745minternationallywith first-tier diverse suppliers.
• In2008, IBM’sPELMoperationsworldwideprocessed42,302metrictonsofend-of-lifeproductsandproductwaste.ThesePELMoperations reused or recycled 96.9% of the total amount processed and sent only 0.6% to landfills or to incineration facilities for treatment,versusIBM’scorporategoalofminimisingitscombinedlandfill and incineration rate to no more than 3%.While the surveys that IBM has conducted with its suppliers prove
thatmoreworkneedstobedone,Icouldn’timaginehavingasupplychainthatdidn’ttakeonthischallenge.Having$38bninspendasIBM does gives a company a lot of purchasing power to encourage suppliers to adopt standards and practices that in many established countriesaretakenforgranted.Butagainit’snotjustbecauseIBMwantstobea‘good-doer’,asstatedinthereport,theseeffortswillresult in higher quality goods and services for customers.
AMR’s Top 25 highs and lowsIt’sbecomealmostanannualritual, theAMRTop25SupplyChainreport, similar to the Fortune 500 richest people list. No joking –– what AMR has done with the top 25 over the years has done plenty in getting the supply chain industry the recognition it deserves. Here are some of the highs and lows from my view.
PuttingonmyIBMhat,it’sgreattoseewearestillinthetop5.Thisyearweclimbedaspotto#4.IamparticularlygladtoseethereferencetoIBM’s‘peoplesupplychain’,whichisjustascomplexasahardware supply chain.
One company I am glad to not see in the list this year is Zara, the Spanish clothing retailer. While they are second to none in getting clothes from the catwalk to the shop floor, they suffer in quality and anyone that shops at Zara would back me up here.
Applecontinuestoholdthe#1spot.Istillhavebittermemoriesofall theT-Mobileshops inAustria runningoutof iPhonesonthelaunchday,soI’mnotsurehowyoucanbe‘best-in-class’whenthathappens.
Toyotaisalsocuriousat#10.ThisarticleinMarineLogreported,“Toyota had to rent a boat in Sweden to store 2,500 extra cars from inventory.”
But overall I tip my hat to AMR and look forward to the next top 25in2010.
- SupplyChainRocks
64 blogs
Supply chain bloggerOur pick of the best recent supply chain blogs on the worldwide web*
*opinionsexpressedarethoseofindividualbloggersanddonotnecessarilyrepresenttheopinionsofSupplyChainAsiaMagazine staff or those of the companies mentioned in the blogs

Related Documents