N O T I C E THIS DOCUMENT HAS BEEN REPRODUCED FROM MICROFICHE. ALTHOUGH IT IS RECOGNIZED THAT CERTAIN PORTIONS ARE ILLEGIBLE, IT IS BEING RELEASED IN THE INTEREST OF MAKING AVAILABLE AS MUCH INFORMATION AS POSSIBLE

Welcome message from author
This document is posted to help you gain knowledge. Please leave a comment to let me know what you think about it! Share it to your friends and learn new things together.
Transcript
N O T I C E
THIS DOCUMENT HAS BEEN REPRODUCED FROM MICROFICHE. ALTHOUGH IT IS RECOGNIZED THAT
CERTAIN PORTIONS ARE ILLEGIBLE, IT IS BEING RELEASED IN THE INTEREST OF MAKING AVAILABLE AS MUCH
INFORMATION AS POSSIBLE
NASA Technical Memorandum 82603
Aviation Turbine Fuel Propertiesand Their Trends }.
t(NASA-T[1-8260.3) AVIALION TUkBINE IFUEPROPERTIES ANL 78EIR 7RENL. i B1MZ 2 71 P N81-25232HC A 03/MF A01
CSCL 21D
Uncla:.
G3/26 26512
*r,
Robert FriedmanLewis Research. CenterCleveland, Ohio
ti32gc,DZ)1g^9
.^
1j.
F
ah
Prepared for the1981 West Coast international Meetingsponsored by the Society of Automotive Engineers
1 Seattle, Washington, August 3-6, 1981
q
IF
ROSA
7
ABSTRACTThis paper is an examination of published
Jet A inspection data covering selected prop-
erty distributions, averages, and trends for
the period from 1969 to 1979. Yearly median
values of aromatics, mercaptan sulfur content,
10-percent distillation temperature, smokepoint, and freezing point are changing with
time, approaching their specification limitvalues, particularly in the last three years.A near-specification property is defined as onewithin a stated tolerance band around the spe-
cification limit. On this basis, most fuelsamples have one to three near-specification
properties, the most common being aromatics,smoke point, and freezing point.
t
ORIGINAL PAGE 1bOF POOR QUALn Y
1
*Numbers in parentheses designate References at
the end of the paper.
THE PURPOSE OF THIS PAPER is to determine the
trends in important aviation turbine fuel prop-
erties by a statistical study of actual fuel
inspection data. Historical considerations aretherefore secondary to those of recent measure-ments which can provide projections for antici-
pating trends to the near future. An importantelement in this study is the relationship ofactual fuel properties to their specification-limit requirements. Relaxation of certain avi-ation turbine fuel specification limits has
been recommended as one means of coping withthe refining and market pressures caused by
limited and costly petroleum supplies andshifts in competing fuel product demands (1-5).*
Previous investigators have noted the trendof average aromatics content of Jet A aviation
turbine fuel, in which this property has beenincreasing toward its specification limit(4,6). This shift reflects the changing com-
position of the crude petroleum feedstocks usedin aviation fuel refining. One may expect sim-ilar trends in the average values of other
properties for the same reason and also because
of changing demands for aviation fuel and com-peting refinery products. The refinery productmix is altered, for the most part, by adjustingthe boiling range of the various products.This in turn affects many of the properties.
The sensitivity of aviation fuel refining yield
to variations in key property values is readily
demonstrated by refinery model calculations
(7,8) or through questionnaire surveys (9).In this paper, fuel property values and
their trends are studied through a review of a
recognized, wide-ranging sample population from
actual fuel inspection data. The compilationcovers 676 fuel samples of Jet A aviation tur-
bine fuel reported for the eleven-year periodof 1969 to 1979 from the Department of Energy(and predecessor agencies) fuel inspection re-
ports (10). The fuel sample analyses are re-ported by the manufacturers through a coopera-tive agreement between the American Petroleum
Institute and the Department of Energy (DOE).The DOE regards the reported values as closereflections of average fuel quality produced byUnited States refiners.
DISTRIBUTION OF PROPERTY VALUES
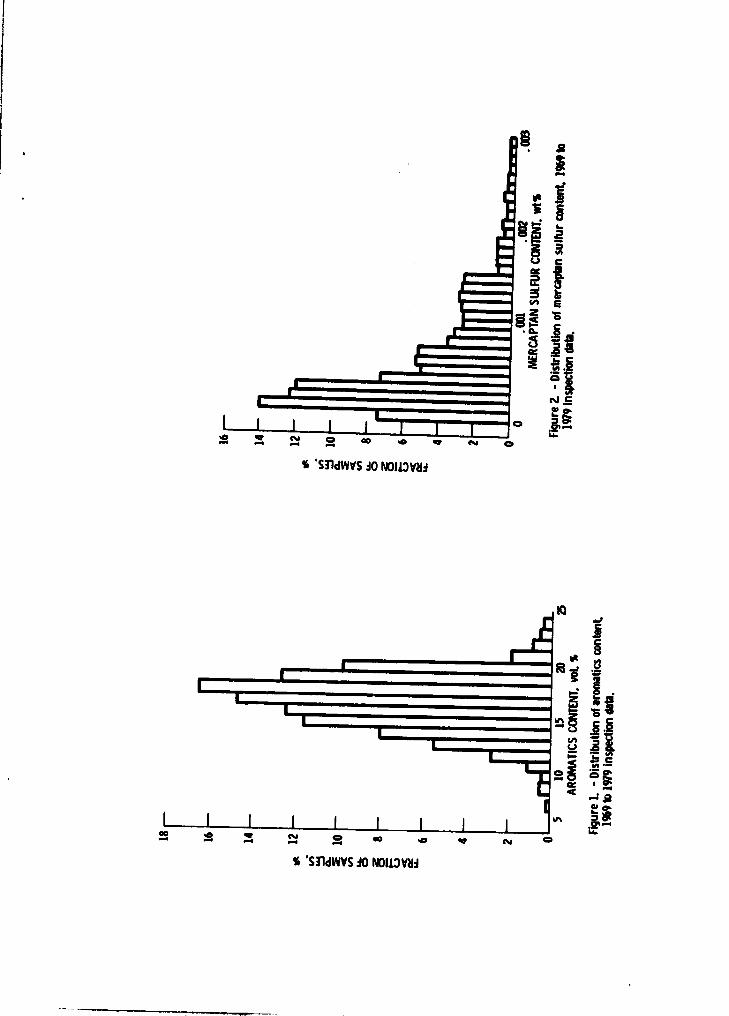
The distribution of aviation turbine fuelproperty values is illustrated by histograms,
or bar graphs, of seven selected properties forJe A for the accumulated inspection Bata from1969 to 1979. The histograms plot tha proba-bility, or fraction of the total sample popula-
tion, for each discrete property range intervalrepresented by bars. The properties illustra-
ted and their definitions Rre:
Fig. 1 - aromatics co-atent: the fraction ofbenzene-ring hydrocarbon compounds,
Fig. 2 - mercaptan sulfur content: thefraction of compounds with hydrogen-sulfur (SH)
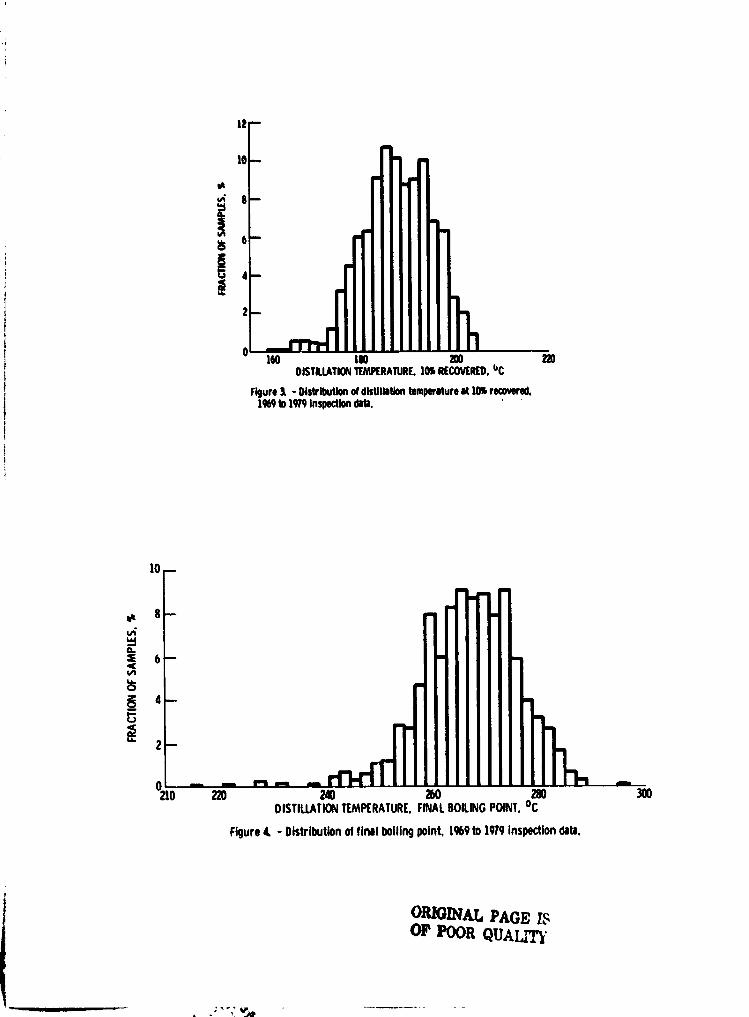
groups,Fig. 3 - distillation temperature, 10 per-
cent recovered: the temperature where this vol-ume fraction of fuel is vaporized in a simplelaboratory still,
Fig. 4 - distillation temperature, finalboiling point: the temperature for completevaporization,
Fig. 5 - flash point: the minimum tempera-
ture for ignition of vapors above a liquid sam-
ple,Fig. 6 - smoke point: the maximum flame
height achieved without smoking in a standard
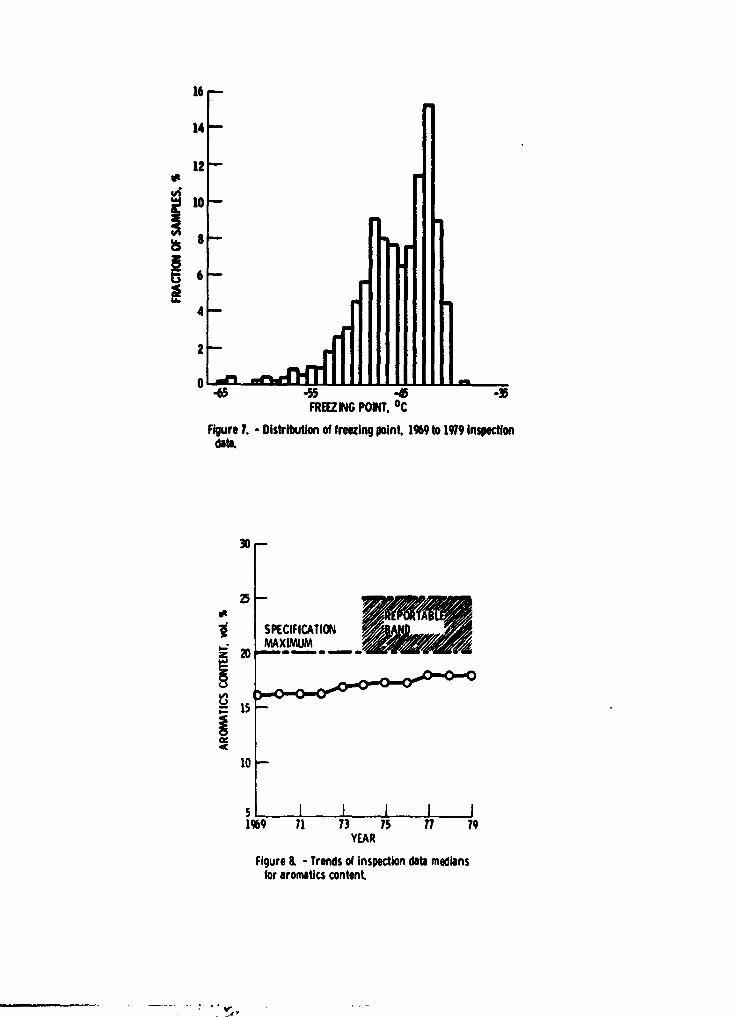
lamp apparatus,Fig. 7 - freezing point: the temperature
(melting point) of disappearance of solid crys-tals.
The distributions for aromatics (Fig. 1)and flash point (Fig. 5) resemble bell-shapednormal, or Gaussian, probabilities. Aromaticsin an aviation fuel are undesirable because ofelastomeric degradation and because aromatics,with low hydrogen contents, have poor combus-tion properties of high flame luminosity andsmokiness. Fig. 1 shows that the distributionof aromatics content is approximately symmetri-
cal, but there is a sharper cutoff of probabil-ities at the high value side, near the specifi-cation limit of 20 percent maximum (25 percentmaximum when reported by the supplier). The
mode, or highest probability value, is at theinterval centered at 17 percent aromatics.
Flash point is an important property as a meas-
ure of the fuel volatility and safety in fuelhandling. Fig. 5 shows that the flash pointdistribution is nearly symmetrical with equal
cutoffs of probabilities at the high and lowextremes. In contrast to the aromatics distri-
bution, the flash point mode of 52° C is well
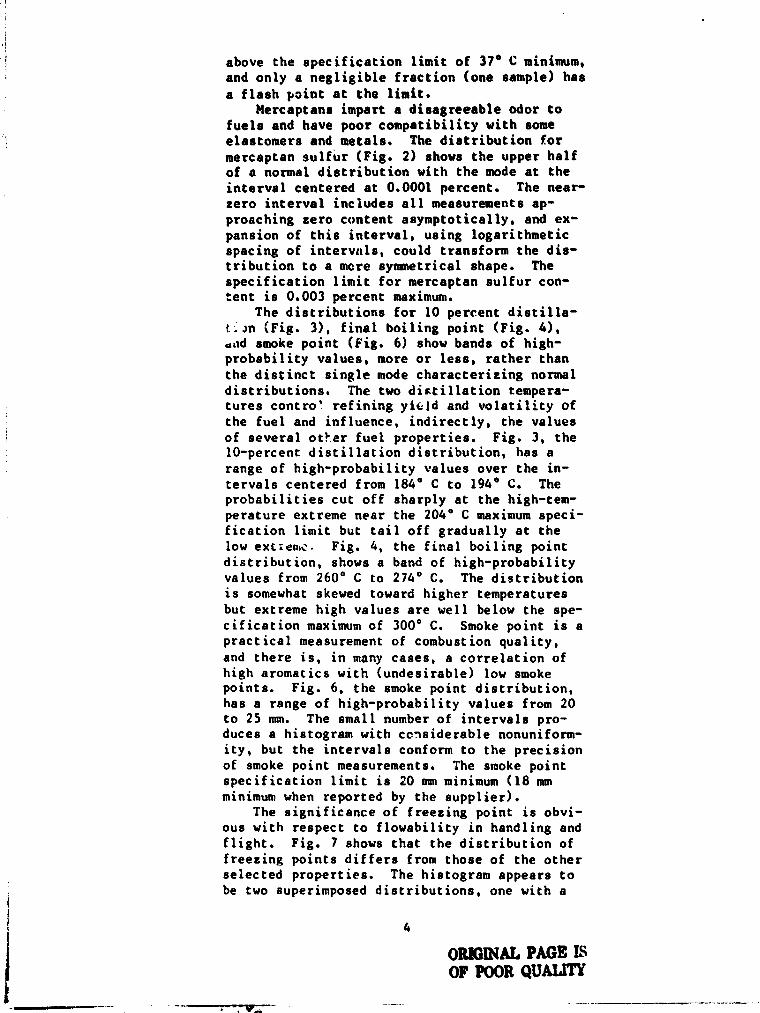
above the specification limit of 37° C minimum,and only a negligible fraction (one sample) has
a flash paint at the limit.Mercaptans impart a disagreeable odor to
fuels and have poor compatibility with someelastomers and metals. The distribution for
mercaptan sulfur (Fig. 2) shows the upper half
' of a normal distribution with the mode at the
interval centered at 0.0001 percent. The near-
zero interval includes all measurements ap-
proaching zero content asymptotically, and ex-pansion of this interval, using logarithmeticspacing of intervals, could transform the dis-tribution to a more symmetrical shape. Thespecification limit for mercaptan sulfur con-sent is 0.003 percent maximum.
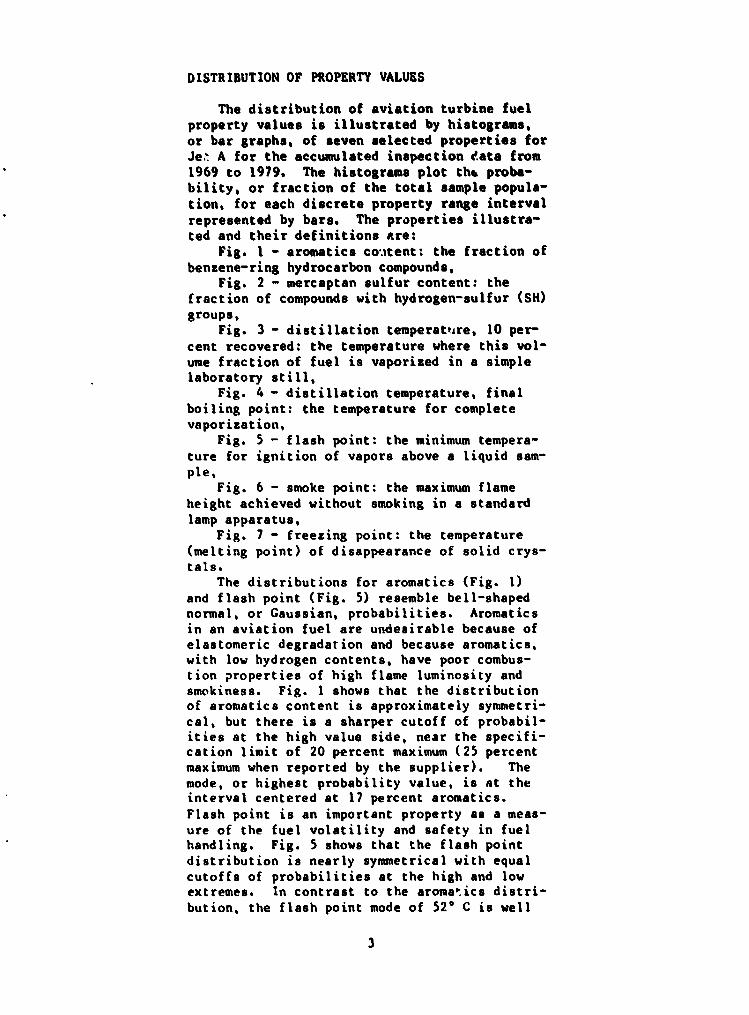
The distributions for 10 percent distills-
t:: in (Fig. 3), final boiling point (Fig. 4),aad smoke point (Fig. 6) show bands of high-probability values, more or less, rather than
the distinct single mode characterizing normal
distributions. The two distillation tempera-tunes contro' refining yield and volatility of
the fuel and influence, indirectly, the values
of several other fuel properties. Fig. 3, the10-percent distillation distribution, has a
range of high-probability values over the in-
tervals centered from 184° C to 194° C. Theprobabilities cut off sharply at the high-tem-perature extreme near the 204° C maximum speci-fication limit but tail off gradually at thelow ext:eac= Fig. 4, the final boiling point
distribution, shows a band of high-probabilityvalues from 260° C to 274° C. The distributionis somewhat skewed toward higher temperatures
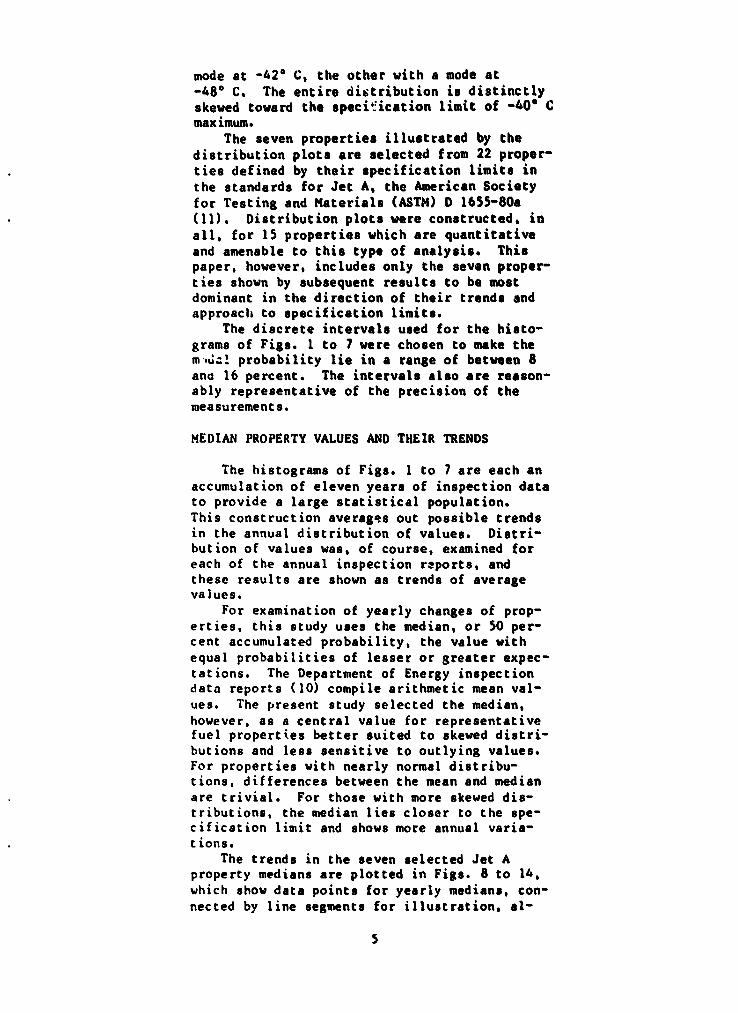
but extreme high values are well below the spe-cification maximum of 300° C. Smoke point is apractical measurement of combustion quality,
and there is, in many cases, a correlation ofhigh aromatics with (undesirable) low smokepoints. Fig. 6, the smoke point distribution,has a range of high-probability values from 20to 25 mm. The small number of intervals pro-duces a histogram with considerable nonuniform-ity, but the intervals conform to the precisionof smoke point measurements. The smoke pointspecification limit is 20 mm minimum (18 mmminimum when reported by the supplier).
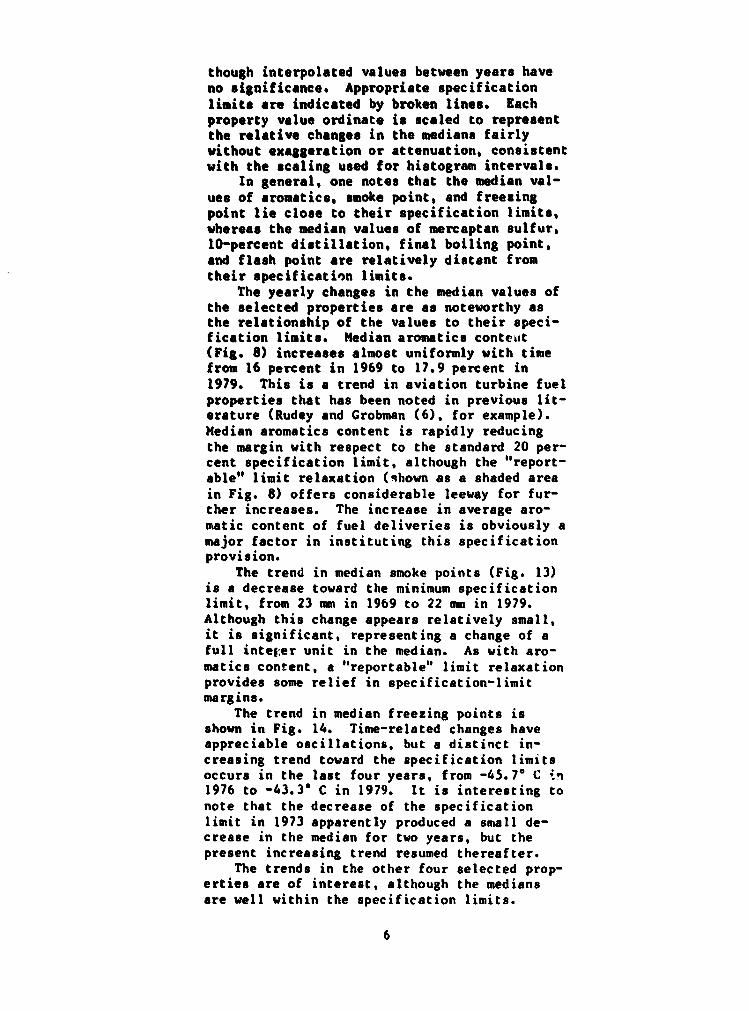
The significance of freezing point is obvi-ous with respect to flowability in handling andflight. Fig. 7 shows that the distribution of
freezing points differs from those of the othero-# selected properties. The histogram appears to
be two superimposed distributions, one with a
4
ORNINAL PAGE ISOF POUR QUALM
mode at -42° C. the other with a mode at
-48° C. The entire distribution is distinctlyskewed toward the specification limit of -40° C
maximum.The seven properties illustrated by the
jdistribution plots are selected from 22 proper-
ties defined by their specification limits in
the standards for Jet A, the American Society
for Testing and Materials (ASTM) D 1655-80a
(11). Distribution plots were constructed. in
all, for 15 properties which are quantitative
I and amenable to this type of analysis. Thispaper, however, includes only the seven proper-
ties shown by subsequent results to be mostdominant in the direction of their trends andapproach to specification limits.
The discrete intervals used for the hiato-
grams of Figs. 1 to 7 were chosen to make them,^,:: probability lie in a range of between 8
and 16 percent. The intervals also are reason-ably representative of the precision of themeasurements.
MEDIAN PROPERTY VALUES AND THEIR TRENDS
The histograms of Figs. 1 to 7 are each an
accumulation of eleven years of inspection datato provide a large statistical population.
This construction averages out possible trendsin the annual distribution of values. Distri-bution of values was, of course, examined foreach of the annual inspection reports, andthese results are shown as trends of averagevalues.
For examination of yearly changes of prop-erties, this study uses the median, or 50 per-
; cent accumulated probability. the value with
equal probabilities of lesser or greater expec-
tations. The Department of Energy inspectiont data reports (10) compile arithmetic mean val-
ues. The present study selected the median,
however. as a central value for representativefuel properties better suited to skewed distri-butions and less sensitive to outlying values.For properties with nearly normal distribu-tions, differences between the mean and median
are trivial. For those with more skewed dis-tributions, the median lies closer to the spe-cification limit and shows more annual varia-tions.
The trends in the seven selected Jet AE property medians are plotted in Figs. 8 to 14.
which show data points for yearly medians, con-
nected by line segments for illustration, al-
5
though interpolated values between years have
no significance. Appropriate specification
limits are indicated by broken lines. Each
property value ordinate is scaled to representthe relative changes in the medians fairlywithout exaggeration or attenuation, consistentwith the scaling used for histogram intervals.
In general, one notes that the median val-
ues of aromatics, smoke point, and freezingpoint lie close to their specification limits,whereas the median values of mercaptan sulfur,10-percent distillation, final boiling point,and flash point are relatively distant from
their specification limits.
The yearly changes in the median values ofthe selected properties are as noteworthy asthe relationship of the values to their speci-fication limits. Median aromatics content(Fig. 8) increases almost uniformly with timefrom 16 percent in 1969 to 17.9 percent in
1979. This is a trend in aviation turbine fuel
properties that has been noted in previous lit-erature (Rudey and Grobman (6), for example).
Median aromatics content is rapidly reducing
the margin with respect to the standard 20 per-cent specification limit, although the "report-able" limit relaxation (shown as a shaded area
in Fig. 8) offers considerable leeway for fur-ther increases. The increase in average aro-
matic content of fuel deliveries is obviously a
major factor in instituting this specificationprovision.
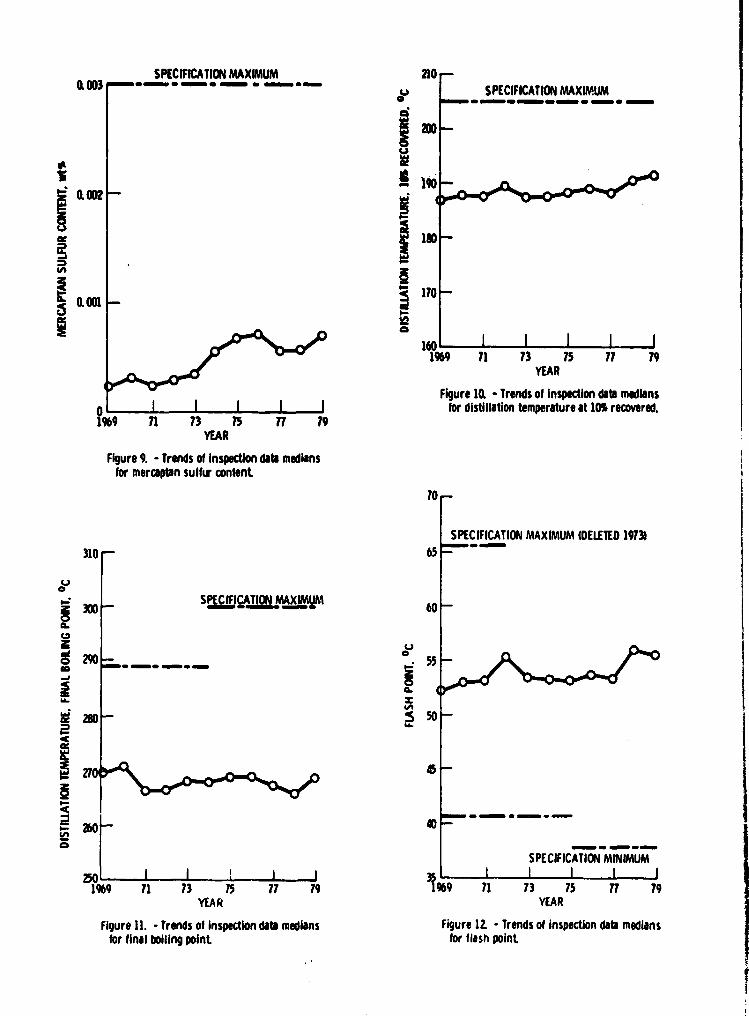
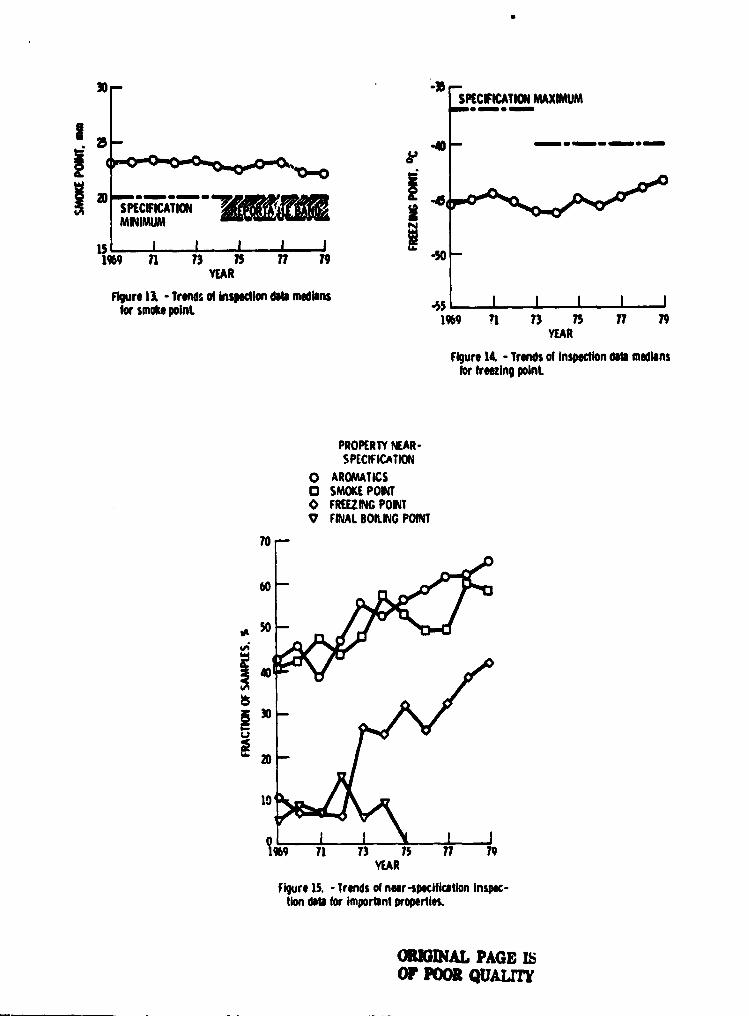
The trend in median smoke points (Fig. 13)is a decrease toward the minimum specificationlimit, from 23 mm in 1969 to 22 mm in 1979.
Although this change appears relatively small,it is significant, representing a change of afull intel;er unit in the median. As with aro-
matics content, a "reportable" limit relaxationprovides some relief in specification-limitmargins.
The trend in median freezing points isshown in Fig. 14. Time-related changes haveappreciable oscillations, but a distinct in-
creasing trend toward the specification limitsoccurs in the last four years, from -45.7° C :n1976 to -43.3° C in 1979. It is interesting to
note that the decrease of the specificationlimit in 1973 apparently produced a small de-crease in the median for two years, but thepresent increasing trend resumed thereafter.
The trends in the other four selected prop-erties are of interest, although the medians
are well within the specification limits.
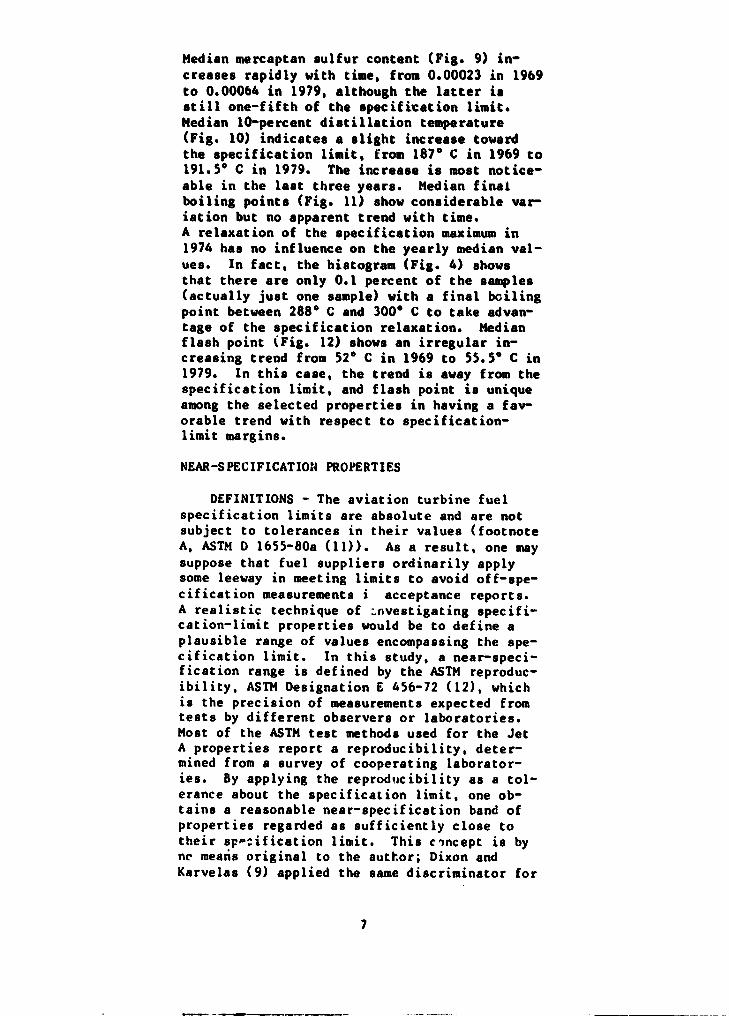
Median mercaptan sulfur content (Fig. 9) in-
creases rapidly with time, from 0.00023 in 1969to 0.00064 in 1979, although the latter isstill one-fifth of the specifi-cation limit.Median 10-percent distillation temperature
(Fig. 10) indicates a slight increase towardthe specification limit, from 187° C in 1969 to191.5° C in 1979. The increase is most notice-able in the last three years. Median finalboiling points (Fig. 11) show considerable var-iation but no apparent trend with time.A relaxation of the specification maximum in1974 has no influence on the yearly median val-ues. In fact, the histogram (Fig. 4) showsthat there are only 0.1 percent of the samples
(actually just one sample) with a final boilingpoint between 288° C and 300° C to take advan-tage of the specification relaxation. Medianflash point (Fig. 12) shows an irregular in-creasing trend from 52° C in 1969 to 55.5° C in1979. In this case, the trend is away from thespecification limit, and flash point is uniqueamong the selected properties in having a fav-
orable trend with respect to specification-limit margins.
NEAR-SPECIFICATIOI4 PROPERTIES
DEFINITIONS - The aviation turbine fuel
specification limits are absolute and are notsubject to tolerances in their values (footnote
A, ASTM D 1655-80a (11)). As a result, one may
suppose that fuel suppliers ordinarily applysome leeway in meeting limits to avoid off-spe-
cification measurements i acceptance reports.
A realistic technique of investigating specifi-cation-limit properties would be to define a
plausible range of values encompassing the spe-cification limit. In this study, a near-speci-fication range is defined by the ASTM reproduc-
ibility, ASTM Designation E 456-72 (12), which
is the precision of measurements expected fromtests by different observers or laboratories.Most of the ASTM test methods used for the JetA properties report a reproducibility, deter-mined from a survey of cooperating laborator-ies. By applying the reproducibility as a tol-erance about the specification limit, one ob-tains a reasonable near-specification band ofproperties regarded as sufficiently close totheir specification limit. This cincept is byno means original to the author; Dixon and
Karvelas (9) applied the same discriminator for
smoke point observations, but they used a
broader tolerance for freezing points.
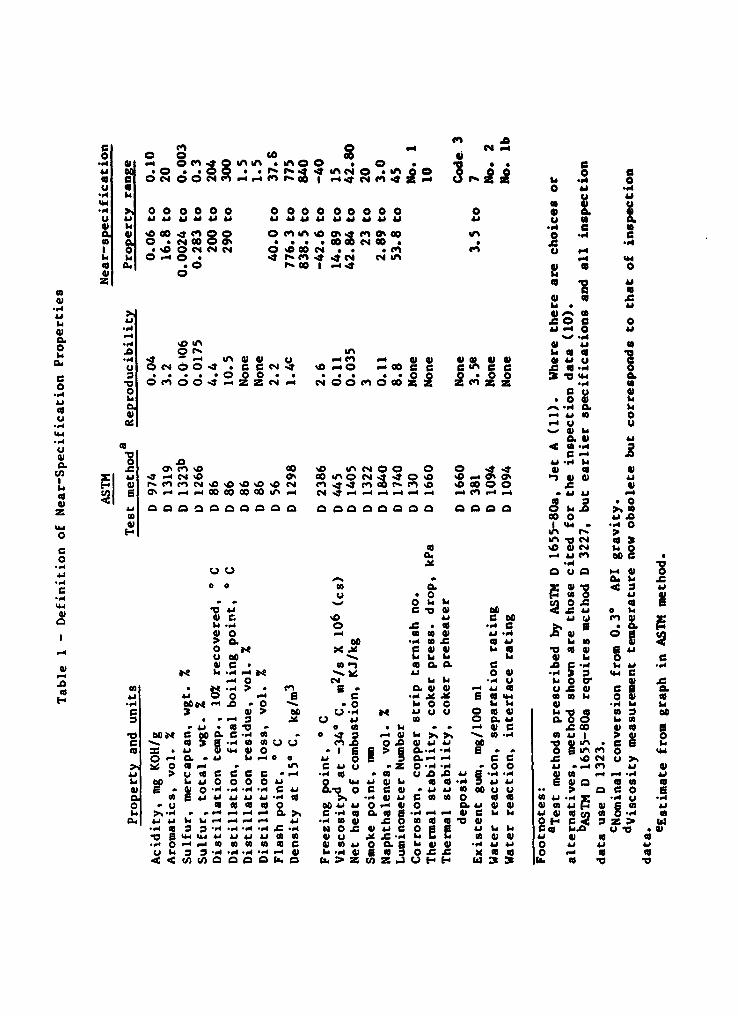
Table 1 is a listing of the near-specifica-
tion property range for the 22 properties thatcomprise the Jet A specification standards.
Each near-specification range is calculated by
addition of the reproducibility, where avail-able, to the acceptable side of the specifica-tion limit. Table 1 also shows the associated"STM test methods for reference. The near-spe-cification definitions in Table 1 are for thecurrent specification limits; the same repro-
ducibility bands at different absolute levelsare applied to earlier specification limits
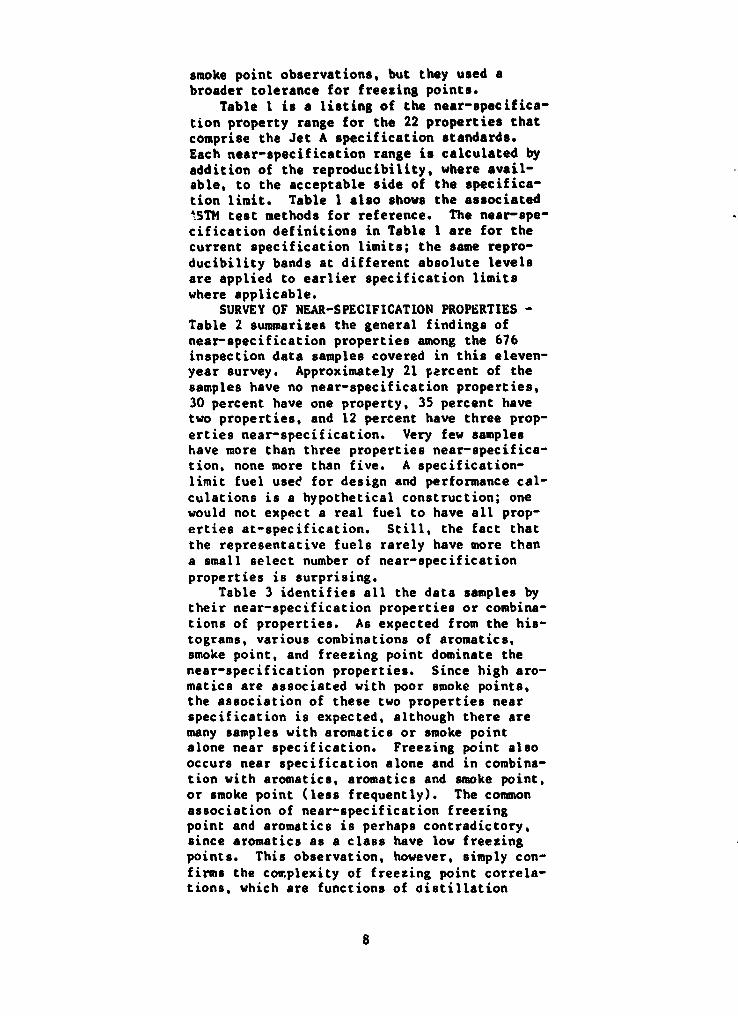
where applicable.SURVEY OF NEAR-SPECIFICATION PROPERTIES -
Table 2 summarizes the general findings of
near-specification properties among the 676inspection data samples covered in this eleven-year survey. Approximately 21 percent of thesamples have no near-specification properties,
30 percent have one property, 35 percent havetwo properties, and 12 percent have three prop-
erties near-specification. Very few sampleshave more than three properties near-specifica-tion. none more than five. A specification-
limit fuel uses for design and performance cal-
culations is a hypothetical construction; onewould not expect a real fuel to have all prop-
erties at-specification. Still, the fact that
the representative fuels rarely have more than
a small select number of near-specification
properties is surprising.Table 3 identifies all the data samples by
their near-specification properties or combina-
tions of properties. As expected from the his-tograms, various combinations of aromatics,smoke point, and freezing point dominate the
near-specification properties. Since high aro-matics are associated with poor smoke points.the association of these two properties nearspecification is expected, although there aremany samples with aromatics or smoke pointalone near specification. Freezing point also
occurs near specification alone and in combina-tion with aromatics, aromatics and smoke point,or smoke point (less frequently). The common
association of near-specification freezingpoint and aromatics is perhaps contradictory,since aromatics as a class have low freezingpoints. This observation, however, simply con-
firms the complexity of freezing point correla-tions, which are functions of aistillation
WO-
range and other factors sa well as fuel compo-sition (13).
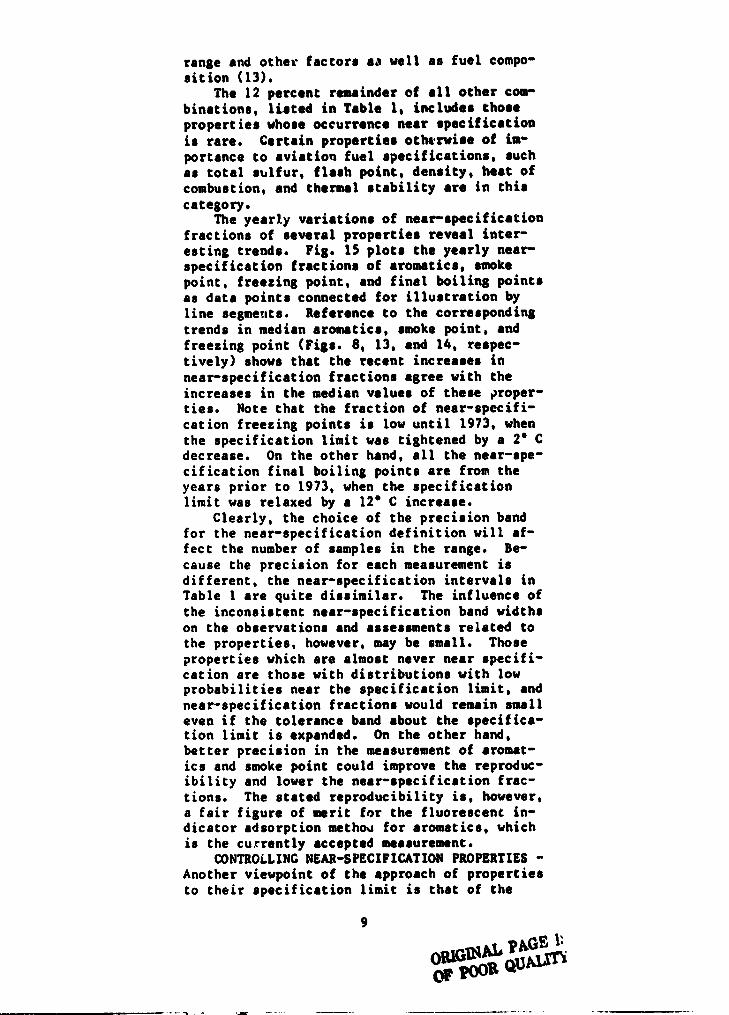
The 12 percent remainder of all other com-binations, listed in Table 1, includes thoseproperties whose occurrence near specificationis rare. Certain properties otherwise of im-portance to aviation fuel specifications, suchas total sulfur, flash point, density, heat ofcombustion, and thermal stability are in thiscategory.
The yearly variations of near-specificationfractions of several properties reveal inter-esting trends. Fig. 15 plots the yearly near-specification fractions of aromatics, smokepoint, freezing point, and final boiling pointsas data points connected for illustration byline segments. Reference to the correspondingtrends in median aromatics, smoke point. andfreezing point (Figs. 8, 13. and 14, respec-tively) shows that the recent increases innear-specification fractions agree with theincreases in the median values of these proper-ties. Note that the fraction of near-specifi-cation freezing points is low until 1973, whenthe specification limit was tightened by a 2° Cdecrease. On the other hand. all the near-spe-cification final boiling points are from theyears prior to 1973, when the specificationlimit was relaxed by a 12° C increase.
Clearly, the choice of the precision bandfor the near-specification definition will af-fect the number of samples in the range. Be-cause the precision for each measurement isdifferent, the near-specification intervals inTable 1 are quite dissimilar. The influence ofthe inconsistent near-specification band widthson the observations and assessments related tothe properties, however, may be small. Thoseproperties which are almost never near specifi-cation are those with distributions with lowprobabilities near the specification limit. andnear-specification fractions would remain smalleven if the tolerance band about the specifica-tion limit is expanded. On the other hand.better precision in the measurement of aromat-ics and smoke point could improve the reproduc-ibility and lower the near-specification frac-tions. The stated reproducibility is. however.a fair figure of merit for the fluorescent in-dicator adsorption methoj for aromatics. whichis the currently accepted measurement.
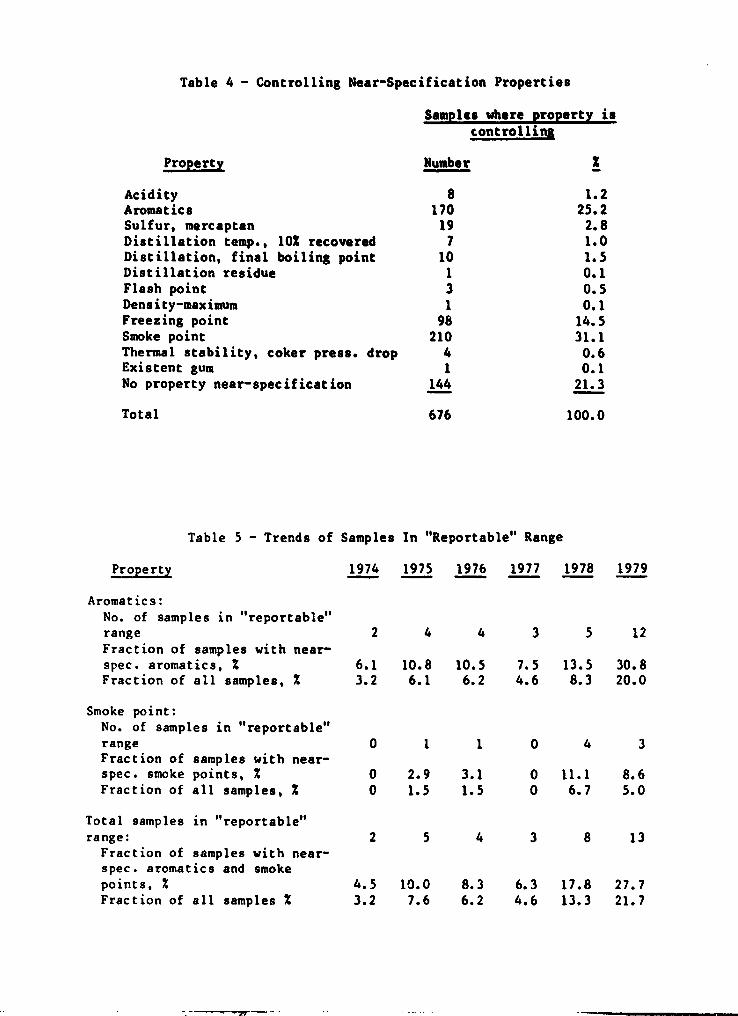
CONTROLLING NEAR-SPECIFICATION PROPERTIES -Another viewpoint of the approach of propertiesto their specification limit is that of the
9
0RIGUW' PAGE
1•QF PoR QUALiTk
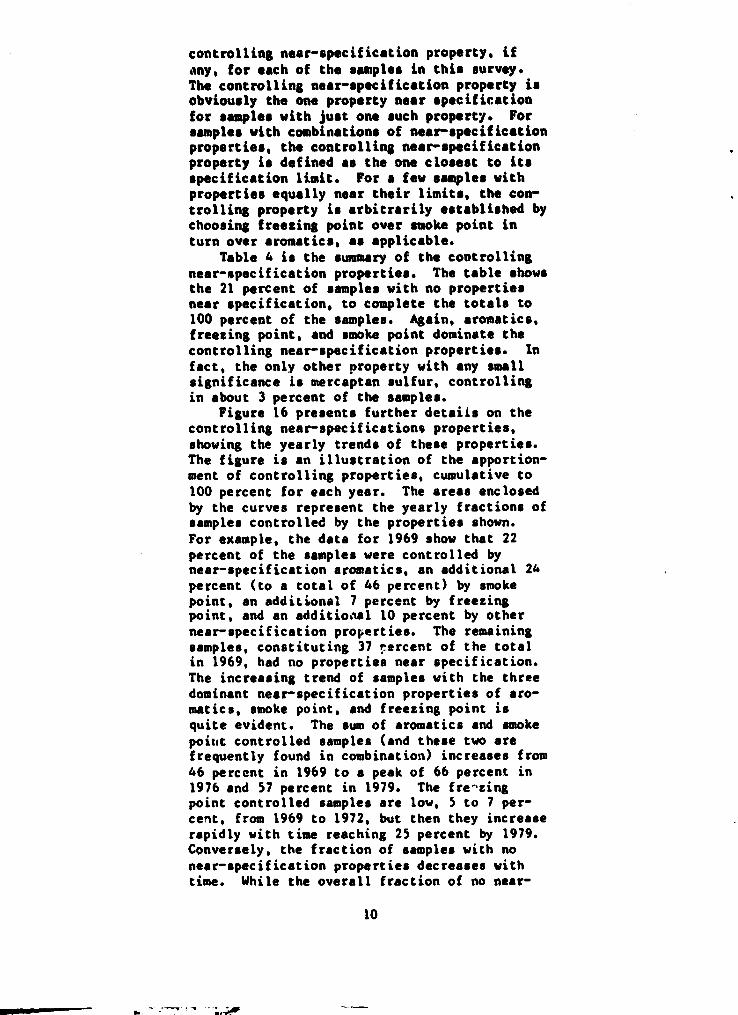
controlling near-specification property, ifany, for each of the samples in this survey.The controlling near-specification property isobviously the one property near specificationfor samples with just one such property. Forsamples with combinations of near-specificationproperties, the controlling near-specificationproperty is defined as the one closest to itsspecification limit. For a few samples withproperties equally near their limits, the con-trolling property is arbitrarily established bychoosing freezing point over smoke point inturn over aromatics, as applicable.
Table 4 is the summary of the controllingnear-specification properties. The table showsthe 21 percent of samples with no propertiesnear specification, to complete the totals to100 percent of the samples. Again, aromatics,freezing point, and smoke point dominate thecontrolling near-specification properties. Infact, the only other property with any smallsignificance is mercaptan sulfur, controllingin about 3 percent of the samples.
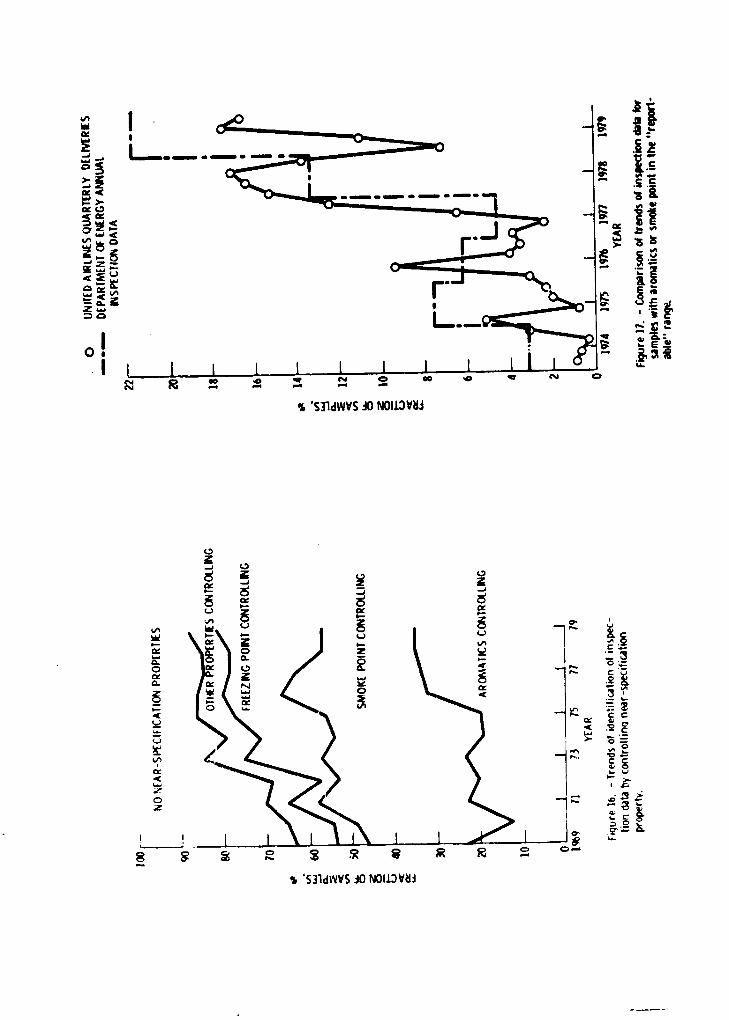
Figure 16 presents further details on thecontrolling near-specifications properties,showing the yearly trends of these properties.The figure is an illustration of the apportion-ment of controlling properties, cumulative to100 percent for each year. The areas enclosedby the curves represent the yearly fractions ofsamples controlled by the properties shown.For example, the data for 1969 show that 22percent of the samples were controlled bynear-specification aromatics, an additional 24percent (to a total of 46 percent) by smokepoint, an additional 7 percent by freezingpoint, and an additional 10 percent by othernear-specification properties. The remainingsamples, constituting 37 rercent of the totalin 1969, had no properties near specification.The increasing trend of samples with the threedominant near-specification properties of aro-matics, smoke point, and freezing point isquite evident. The sum of aromatics and smokepoint controlled samples (and these two arefrequently found in combination) increases from46 percent in 1969 to a peak of 66 percent in1976 and 57 percent in 1979. The fre^zingpoint controlled samples are low, 5 to 7 per-cent, from 1969 to 1972, but then they increaserapidly with time reaching 25 percent by 1979.Conversely, the fraction of samples with nonear-specification properties decreases withtime. While the overall fraction of no near-
10
spe:ification samples is given as 21 percent inTable 4, the yearly fractions change from 37percent in 1969 to 12 percent in 1979.
"REPORTABLE" AROMATICS CONTENT AND SMOKEPOINT - The definitions of near-specificationaromatics content and smoke point ignore theso-called "reportable" specification-limit ex-tensions of these properties. These extensionshave, since 1974, permitted relaxation of thespecification limits to a maximum of 25 percentaromatics, and a minimum of 18 = smoke point,when reported by the supplier within 90 days ofthe date of shipment. (Prior to 1980, notifi-cation had no reporting time limit.)
Table S illustrates the extent of sampleswith properties in the "reportable" category,that is, with aromatics and/or smoke pointsthat would ordinarily be off-specification butarf permissible with the reportable extension.The table lists the number of samples with re-portable-range aromatics, smoke points, andtotal reportable-range (aromatics only, smokeonly, and both in combination). The ratio ofreportable properties is also shown, with re-spect to the corresponding near-specificationsamples and to the total samples. Reportablearomatics have increased greatly in the lastthree years, being noted in 4.6 percent of allsamples in 1977 and 20.0 percent in 1979. Re-portable smoke point shows a much lesser in-crease in the same period.
The near-specification property ranges ofTable 1 are based on the standard limits foraromatics and smoke point, and all the report-able samples are included as near specifica-tion, a fair and consistent representation ofthe data. if the near-specification limitswere shifted to apply the reproducibility bandat the extended, reportable specification lim-its, the near-specification fraction for aroma-tics in 1979 would decrease from 65 percent(Fig. 15) to 8 percent. The same treatment forsmoke point would decrease the near-specifica-
tion smoke point only from 58 percent to 37percent in IM because of the lesser report-able fraction.
^, A
United Airlines ( UAL) maintains a data bankof inspection properties representing some 60to 70 perc vt i. of deliveries to domestic air-lives. Thrt;, A;h the courtesy of the airlinepropulsion department, some of the data werefurnished to the author. Figure 17 is a com-parison of the total "reportable" fuel samplesof UAL and the Department of Energy ( DOE) data
11
otherwise used in this paper. The DOE data are
shown as yearly bar segments. and they are
plotted from the totals shown in the last rowof rata in Table S. The UAL data are quarterly
point6 connected by line segments. and they are
those reported by Campbell (14) with updatingto 1979 from the furnish!d data. The UAL dataoscillate extremely. and the cycles suggest butdo not necessarily correlate with seasonal var-iations. The overall trends of the two datasets agree well, particularly with respect tothe relatively large increase in reportablesamples from 1977 to 1979.
FURTHER DISCUSSION ON THE FREEZING-POINTDISTRIBUTION - The unusual distribution of sam-ple freezing points is noted in an earlier sec-
tiun of this paper (Fig. 7). The concept ofcontrolling near-specification properties sug-gests that the distribution may consist of two
groups of samples with d:.fferent controlling
properties. The group with.. the distributioncentered at -42' C is probably freezing point
controlled. The other group centered at -48°may consist of those samples with other con-trolling properties predoatinantly aromatics orsmoke point, eince aromatics as a class havelow freezing points. A review of the proper-ties of the individual samples appeArs to con-
firm this reasonable hypothesis, but the sample
population is insufficient for a more quantita-tive analysis of the freezing point distribu-
tion.
SUMMARY AND CONCLUSIONS
This paper 'is an examination of publishedinspection data covering 676 samples of Jet A
aviation turbine fuel for the eleven-year per-iod of 1969 to 1979. The study covered the 22properties which comprise the requirements ofthe commercial fuel specifications, but de-
tailed analyses are confined to seven selectedproperties. Data output include presentation
of the distribution of property values. medianvalues, the probability of properties approach-ing their specification limits, and the trendsof all of these with time.
Th• uniqueness of the present study lies inthe examination of a recognized sample of fuel
properties. representing actual fuels in pro-duction and deliver;. This provides the advan-tage of conclusions confirmed by actual proper-
ties. as opposed to those based on hypotheticalcatz4lated or estimated properties. For exam-
12
ple, from plausible reasoning, both Dalton (15)
and Momenthy (16) argue that future aviation
turbine fuel properties need not change to meetdemand or competition requirements. Market and
price incentives are sufficient, in their
views, to shift the refinery output distribu-tion to favor aviation fuel as necessary. The
present review of fuel inspection propertiesshows that, on the contrary, in the real mar-
ketplace adjustments are occurring, and aver-
ages of certain important fuel properties showtrends of movement toward their specificationlimits.
The results and conclusions of this paper
are summarized as follows:1. The distribution of almost all the prop-
erties is reasonably described by a nearly sym-
metrical normal distribution. The distribu-tions for aromatics and smoke point are skewedwith greater probabilities near the specifica-tion-limit extreme. The distributions for dis-tillation temperature and flash point are sym-
metrical with extremes well within the specifi-cation limit. Mercaptan sulfur shows the upper
half of a normal distribution, centered nearzero percent.
2. The distribution of freezing points is
different from those of the other properties,
exhibiting a skewed configuration that suggeststwo superimposed distributions. A predominantportion of the samples has a distribution cen-
tered only 2° C below the specification maximumof -40° C. A secondary distribution, mostlikely influenced by the approach to specifica-
tion limits of properties other than freezingpoint, is centered 8° C below the specificationlimit.
3. The median, or 50-percent probabilityvalue, is selected as the average most repre-sentative of the central tendency, especially
for the skewed distributions. Time-related
plots of median aromatics content, mercaptansulfur, distillation temperature at 10 percent
recovered, freezing point, and smoke point in-dicate trends toward their specification lim-its, particularly in the last few years.
4. Near-specification property values aredefined as those within a range of their speci-fication values corresponding to American Soci-ety of Test ;.ng and Materials reproducibilityprecision for the test method appropriate foreach property. The majority of the samples arenear specification for at least one of three
properties: aromatics, freezing point, and
13
ORIGINAL PAGE ISOF POOR QUALUV
ri: R smoke point. Samples occasionally have near-k`...specification acidity, mercaptan sulfur, 10
percent distillation temperature, and finalboiling point. Properties otherwise of impor-
tance to aviation fuel specifications, such as
total sulfur, flash point, density, heat of
combustion, and thermal stability are rarely ifever near specification.
5. About 21 percent of all the samples for'-_ the overall eleven-year period have no near-
specification properties. This fraction showsa decreasing trend with time, reaching 12 per-cent in 1979.
6. The majority of the samples has one tothree near-specification properties. Only avery small fraction have more than three; none
have more than five. Thus, although designers
must consider a specification-limit fuel forsafety and performance guarantees, such a fuel
is a hypothetical construction. On the otherhand, because of the statistical distributionof property values about their reported aver-
ages, apparent margins between average fuel
properties and their specification limits maynot be available for yield improvements.
7. This paper also characterises the fuelsamples in terns of the controlling near-speci-fication property, defined as the single near-specification property or the most important
one of several. Apportionment of samples bythe controlling near-specification property
confirms the dominance of aromatics, freezingpoint, and smoke point, and the approach ofthese properties toward their specification
limit with time.
REFERENCES
1. A. G. Robertson and R. E. Williams, "JetFuel Specifications: the Need for Change."
Shell Aviation News, No. 435, 1976, pp. 10-13.2. W. G. Dukek and J. P. Longwell, "Alter-
native Hydrocarbon Fuels for Aviation." ExxonAir World, Vol. 29, No. 4, 1977, pp. 92-96.
3. M. W. Shaveson, "Jet Fuel Quality Con-siderations." Shell Aviation News, No. 440,1977, pp. 26-31.
4. J. P. Longwell and J. Grobman, "Alterna-tive Aircraft Fuels." Journal of Engineering
for Power. Volume 101, 1979, pp. 155-161.5. E. G. Barry, F. J. Hills, and L. J.
McCabe, "Diesel Fuel - Availability, Trends and
Performance." SAE Paper 790921, October 1979.
14
w__
6. R. A. Rudey and J. S. Grobman, "Charac-
teristics and Combustion of Future Hydrocarbon
Fuels." NASA TM-78865, 1978.7. F. J. Flores, "Use of Refinery Computer
Model to Predict Jet Fuel Production." NASA
TM-79203, 1979.8. W. G. Dukek and E. R. Wieland, "Effect
of Flash Point Reduction on Jet Fuel Proper-ties." Factors in Using Kerosine Jet Fuel ofReduced Flash Point, ASTM STP 688, W. G. Dukek
and K. H. Strauss, ads.. 1979, pp. 7-21.
9. J. C. Dickson and L. P. Karvelas, "Im-
pact of Fuel Properties on Jet Fuel Availabil-
ity." Air Force Aeropropulsion Lab., WPAFB,
OH, AFAPL-TR-76-7, April 1976.
10. E. M. Shelton, "Aviation Turbine Fuels,
1979." Department of Energy, DOE/BETC/PPS-
80/2, May, 1980.11. "1980 Annual Book of ASTM Standards,
Part 23, Petroleum Products and Lubricants
(I)." ASTM, Philadelphia, 1980.
12. "1980 Annual Book of ASTM Standards,
Part 41, General Test Methods, Nonmetal; Sta-tistical Methods; etc." ASTM, Philadelphia,
1980.13. R. Friedman, "Nigh-Freezing-Point Fuels
Used for Aviation Turbine Engines." ASME Paper
79-GT-141, March 1979.
14. P. P. Campbell, "Current Jet Fuel
Trends." Aircraft Research and Technology forFuture Fuels, NASA CP-2146, 1980, pp. 11-14.
15. C. P. Dalton, "The Availability of Jet
Fuel over the Next Two Decades." Aircraft En-gineering, Vol. 49, No. 12, December 1977, pp.
8-14.
16. A. M. Momenthy, "Aviation Fuels Out-look." Aircraft Research and Technology forFuture Fuels, NASA CP-2146, 1980, pp. 15-24.
15
a+1 A
O O GO $ •"a N .•ay -r p M
• O • an an •BOO • O• h h .SI L}1 N p • aNc4-•a ..r eh h G^ 1 •^ •7 N ty1 .t.p O 8 . .p oO N O O ?. •"+ V h 2 >ZiofM
O O 0 0 0 0 0 0 0 O 00 O O O OY y y Y Y y Y Y Y Y Y y Y Y Y Y YIdGo %0 GO S an s o
O • N Go O^O art W^ a0 0% d M O► 00
• • . • GO 00 N 00 •v^
•• A O N N N O ^D 00 N • • • 0% in
w O -+ O• ^7 h a•1 4 %1 N Nanat O h GO 1 •+ .tO
7Y-•1
sy
6C
sawLr00
6L0+wvAiO
yw
. OW10ya►^v
a0yalu..4
w•.ruas
wIwofalZ
•u ^N OOd v. C CN d0 C; 0 0 0 •O Oc•1 OO .t.+T.2N.rw
01 1Ca
cc
t ON cn ^O 00
I w n M cn N %0 %D %D %D %a N
ON .r —4 -r 00 00 00 00 an ..4
u 0 0 0 0 0 0 0 0 0 0wa1H
u u0 0
LD..^
O t4u 60
,4 O
G 3 > `00a!• y w'v -
3^ s a0+ ^iw aw1 puc.)
p -4 CL . y L.-I0 0y > u C C C C --4
LO x..4.14.14d •• 01 O C •a06 w y u y y y •.A al
CL. y y w M 1••4 .•r .4 .-+ y•.+ 7 7 •....+ •.r ... •.r•p ^ w w y y y u w w..+ 0 -r r. CO w w w CO Cu L. 7 a • .1 • .1 ..^ ..r .r 4fdd cntn0 OOOw 0
^D O -^.i GO C CCop t
0A 0 C:N O O c '^1 0 GO Z Z ^ ^1 z Z
^D Ul% N O O O O -? .*X0000
00000000 O O O O
0C2Ad
• Ov O w w
Ca0+ 4^D 00
•.Ci^ a=iD w 001 •a^i
• LC. wLO• wyaa
on►N L. w •.. u8 •^^^ 8 WawCO w O O 1. L•ci•4 :e u vw °o a:+u o w . w r• 01 C
w•-ro MA OA 0 y ++ O0• I E > a •.+ •..C .+ u - Z O •+ •.+ 0 0•d a0 • w u A A y •-1 •.4o w y y L. a a •.+ y y4. O a^, 14
u C W co O^ 10 100o a+ y O •( a1 o a y d IVa L. L..0
•-Oi W C O •(AA 0 0 V dw Om a1 y C O y w w40 0w•..4 d 11 a 1 O C C • x 0 aw>zanzaut-d1-4 w 33
t a •.0+ OO Y •.Y
u a1•o •^ cr- •-1
u .•
a o
ay ^ 4al a1 ^^ y
so a oy ^••^ O Yv .-1at Y w
L• 0 0 'C
log•a O
• w 0.
• O•-V1 w
01 LOi
-A a M• •• y w O.^. 4)
u
CL as Yd c ^'y •.r wa1 ^ of
O w .D ^ w00 O ++ Dw f` •> 0
b N aD Z^D d N 14 O-r y a•1 00 C'A
O u Op r+ 0
i m p d u
O .0 0
y W r. d8
'4 id 0 y^3 ^7 w 4C►
u CC d C 6wanes oarL • a^A Ld
a O L• tow uao > d
O 6 a 1 O.0%0 N u >%y ...a M yE al O a0 w
ao y •.>. O •.C+ 0
a WA6 u v
916 go v
war
L4aiaOwa
CO..ayaDuwuvaN
W41zwOC0
CwWO
.•rw-.wE~
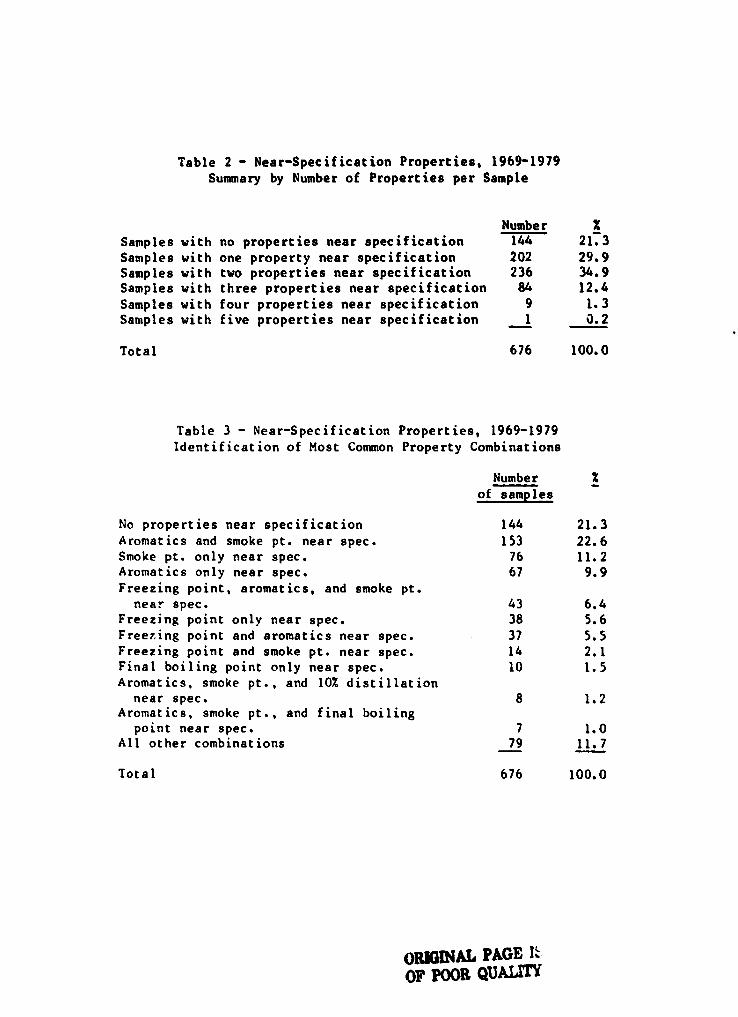
Table 2 - Near-Specification Properties, 1969-1979
Summary by Number of Properties per Sample
i' M
I
Number
Samples with no properties near specification 144
Samples with one property near specification 202
Samples with two properties near specification 236
Samples with three properties near specification 84
Samples with four properties near specification 9Samples with five properties near specification 1
Total 676
X21.329.934.912.4
1.30.2
100.0
Table 3 - Near-Specification Properties, 1969-1979
Identification of Most Common Property Combinations
X
No properties near specification
Aromatics and smoke pt. near spec.Smoke pt. only near spec.Aromatics only near spec.
Freezing point, aromatics, and smoke pt.
near spec.Freezing point only near spec.
Freezing point and aromatics near spec.Freezing point and smoke pt. near spec.
Final boiling point only near spec.Aromatics, smoke pt., and 10% distillation
near spec.Aromatics, smoke pt., and final boiling
point near spec.
Number
of samples
144
1537667
4338
37
1410
8
79
6
ELffy
21.3
22.611.29.9
6.45.6
5.52.1
1.5
1.2
1.011.7
100.0
2 4 4 3 5 12
6.1 10.8 10.5 7.5 13.5 30.83.2 6.1 6.2 4.6 8.3 20.0
0 1 1 0 4 3
0 2.9 3.1 0 11.1 8.60 1.5 1.5 0 6.7 5.0
2 5 4 3 8 13
4.5 10.0 8.3 6.3 17.8 27.73.2 7.6 6.2 4.6 13.3 21.7
Table 4 - Controlling Near-Specification Properties
Samples where property is
controlling
Pr_ operty Number X
Acidity 8 1.2Aromatics 170 25.2Sulfur, mercaptan 19 2.8
Distillation temp., 102 recovered 7 1.0Distillation, final boiling point 10 1.5Distillation residue 1 0.1Flash point 3 0.5Density-maximum 1 0.1Freezing point 98 14.5Smoke point 210 31.1Thermal stability, coker press. drop 4 0.6Existent gum 1 0.1No property near-specification 144 21.3
Total 676 100.0
Table 5 - Trends of Samples In "Reportable" Range
Property 1974 1975 1976 1977 1978 1979
Aromatics:
No. of samples in "reportable"range
Fraction of samples with near-
spec. aromatics, %Fraction of all samples, %
Smoke point:
No. of samples in "reportable"range
Fraction of samples with near-spec. smoke points, %
Fraction of all samples, %
Total samples in "reportable"
range:
Fraction of samples with near-spec. aromatics and smokepoints, %
Fraction of all samples %
Z.
v NS 'S31dWVS J0 N011MA
10.r
'S
is0 0
.^ 8
0
mc
vs1GE
8<
^oae
S
'o
N
.^i .Qr ^ ^O 00 .p v N C
9G 'S3ldWVS J0 N0113M
C'
vi
0
0
10
B
V1
a6
1N^
CgO_ 4
62
0
i
DISTWTION TEMPERATURE. 1076 RECOVERED, bC
Figure I - Distribution of distillation temperature at IDS recovered,1969 to 1919 inspedlon data.
DISTILLATION TEMPERATURE, FINAL BOILING POINT, °C
Figure 4 - Distribution of final tailing point. 1969 to 1979 inspection data,
ORIGINAL PAGE ISOF POOR QUALITY.
7GS^r.e
h 1'-..e 1
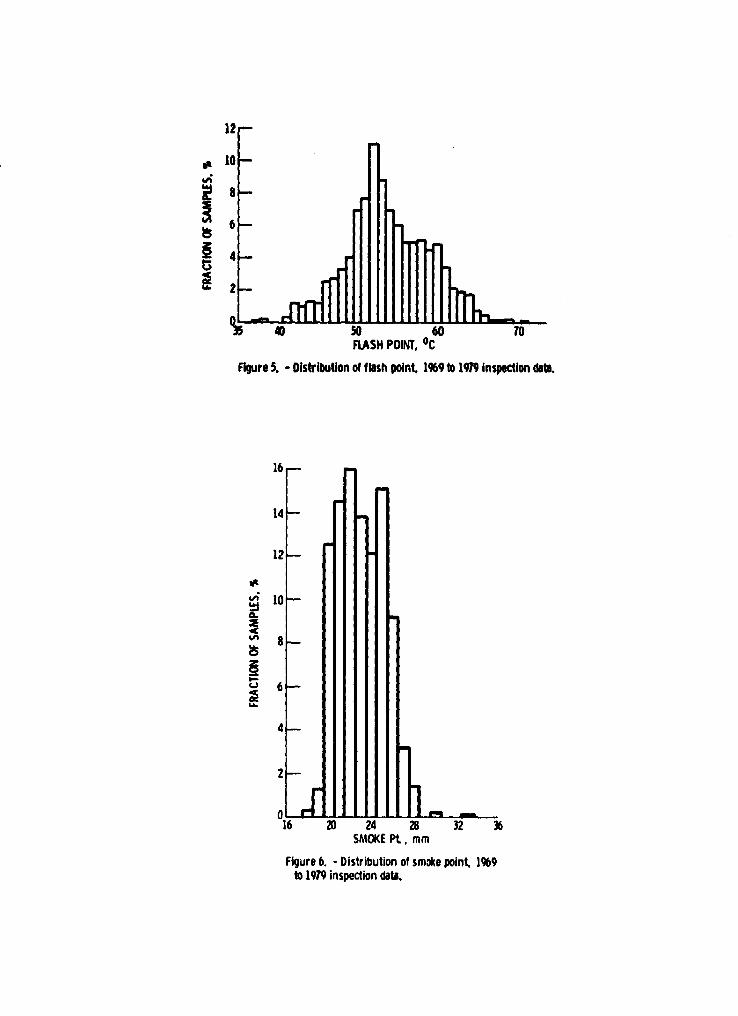
Figure 5, - Distribution of flash point, 1969 to 1979 inspection date.
FLASH POMT, oC
t
i1
t
16
14
12
Wt
1^
10
t
S
6e^
4
2
01
iRt
i
FF
6SMOKE PL, mm
Figure 6. - Distribution of smoke point, 1%9to 1979 inspection data,
16
14
12
10
6
4
0-55 -4 .35
FREEZING POINT. OC
Figure 7. - Distribution of freezing point 1969 to
1979 inspectiondata.
30
SPECIFICATIONMAXIMUM
20
51 1 1 1 1 11969 71 73 75 77 79
YEAR
Figure Trends of inspection data mediansfor aromatics content
SPECIFICATION MAXIMUMa 003
Q 002
N
Q 001
I
210v SPECIFICATION MAXIMUM
V
190
180
170
401601969 71 73 75 77 79
YEAR
Figure 1Q - Trends of inspection data mediansfor distillation temperature at 10% recovered.
969 71 73 75 77 79
YEAR
Figure 9. - Trends of inspection data mediansfor merceptan sulfur content.
70
I SPECIFICATION MAXIMUM !DELETED 19731310
65 P""
v0300
SPP€C^UIITI^Ii MAXIMUM
dc^Z
2ft-.^•
J
2804Cac
270
2600
250 1 I + 1 1
1%9 71 73 75 77 79YEAR
Figure 11. - Trends of inspection data mediansfor final boiling point
60
00 55
9dNS 50
a
s ^ s a^ r err
SPECIFICATION MINIMUM
1969 71 73 75 77 79YEAR
Figure 12 - Trends of inspection data mediansfor flash point
70
60
50
N
30
V
IO
10
01
SPECIFICATIONMINIMUM
151%9 71 73 75 77 79
YEAR
Figure 13. - Trends of inspection dab mediansfor smoke point
SPECIFICATION MAXIMUM
-50
.SSA
1%9 71 73 75 77 79YEAR
Figure 14. - Trends of inspection data mediansfor Ironing point
PROPERTY NEAR-SPECIFICATION
O AROMATICSO SMOKE POINTO FREEZING POINT0 FINAL BOILING POINT
YEAR
figure 15. -Trends of near-specification inspec-tion data for important properties.
OWINAL PAGE ISOr POOR QUALITY
r
hA
^ k
i .i^ F
t
1
N
WOC
J2W ^
WW ^ ^
Z^dW 4 H2 W ^O D
0i
I
v
^ C Oa
1 ^
a d a-
PA
'^c^9o
^ c.4
V N
.cC
WO O
^ V^ r1 ^r ^
I
vjc9
8ir J
U d'
H
d'dOo:a
H
yV.^1
ccLW1OZ
1 1
8 8 a $ R 8 ^ R
K '537dWVS 30 NOII)Vb!
S 'S37dWVS 30 N0110db!
n
Related Documents