This report by Tourism Futures International for Destination New South Wales reviews the operating environment and aviation performance of Sydney and NSW over 2014 and 2015. Key findings International Traffic Performance: Sydney Airport is Australia’s major gateway for international visitors, securing 41% of total international arrivals to Australia in 2014. During 2014, 2.8 million international visitors arrived in Australia via Sydney Airport, up 5.2% on the previous year. Sydney’s top five source markets combined (NZ, China, USA, UK/Ireland and South Korea) accounted for 54% of all visitors; the next five (Japan, Singapore, HK, Canada and Germany) accounted for 17%. China is the major growth market for Sydney Airport with a compound annual growth rate (CAGR) of 17.4% over the five-year period 2009 to 2014. During 2014, China contributed almost half (43%) of the increase in visitor arrivals to Sydney. At 13%, USA is the second greatest contributor to visitor growth, with India and Malaysia each contributing 7%. Of the 44.1 million seats operated to/from Australia on scheduled international passenger services during 2014, Sydney Airport accounted for 39.5% or 17.4 million seats. Seat utilisation at Sydney Airport was 80.2% (including transit passengers). Domestic Traffic Performance: The fourteen major Sydney interstate competitive routes accounted for 40.2% of the total Australian domestic passenger traffic in 2014. In terms of passenger numbers, the fastest growing Sydney interstate routes in 2014 were the lower volume routes where passenger growth is over a low base: Sydney to/from Ayers Rock, Launceston and Hamilton Island. Of the higher passenger volume routes, growth was strongest on the Sydney/Adelaide and Sydney/Gold Coast routes, while passenger numbers on the Sydney/Perth route declined slightly. Overall passenger numbers on the 14 major Sydney interstate routes increased by just 0.8%. The top six Sydney intrastate routes accounted for 69% of all Sydney to/from Regional NSW routes in 2014. The average annual passenger growth over the past five years has been strongest to Tamworth, Armidale, Ballina and Coffs Harbour. By the March quarter 2015 the number of routes connecting Regional NSW to Sydney had fallen to 22. Of the twelve deregulated routes, growth over the past five years has been strongest to Tamworth, Armidale, Ballina and Coffs Harbour. Of the 14 regulated routes, growth over the past five years has been strongest to Moree; eight of these routes have seen declining passenger numbers while three of these routes were not served at all during 2014. Aviation Performance in NSW 2014-15

Welcome message from author
This document is posted to help you gain knowledge. Please leave a comment to let me know what you think about it! Share it to your friends and learn new things together.
Transcript
This report by Tourism Futures International for Destination New South Wales reviews the operating environment and aviation performance of Sydney and NSW over 2014 and 2015.
Key findings
International Traffic Performance:
Sydney Airport is Australia’s major gateway for international visitors, securing 41% of total international arrivals to Australia in 2014.
During 2014, 2.8 million international visitors arrived in Australia via Sydney Airport, up 5.2% on the previous year.
Sydney’s top five source markets combined (NZ, China, USA, UK/Ireland and South Korea) accounted for 54% of all visitors; the next five (Japan, Singapore, HK, Canada and Germany) accounted for 17%.
China is the major growth market for Sydney Airport with a compound annual growth rate (CAGR) of 17.4% over the five-year period 2009 to 2014. During 2014, China contributed almost half (43%) of the increase in visitor arrivals to Sydney. At 13%, USA is the second greatest contributor to visitor growth, with India and Malaysia each contributing 7%.
Of the 44.1 million seats operated to/from Australia on scheduled international passenger services during 2014, Sydney Airport accounted for 39.5% or 17.4 million seats. Seat utilisation at Sydney Airport was 80.2% (including transit passengers).
Domestic Traffic Performance:
The fourteen major Sydney interstate competitive routes accounted for 40.2% of the total Australian domestic passenger traffic in 2014.
In terms of passenger numbers, the fastest growing Sydney interstate routes in 2014 were the lower volume routes where passenger growth is over a low base: Sydney to/from Ayers Rock, Launceston and Hamilton Island. Of the higher passenger volume routes, growth was strongest on the Sydney/Adelaide and Sydney/Gold Coast routes, while passenger numbers on the Sydney/Perth route declined slightly. Overall passenger numbers on the 14 major Sydney interstate routes increased by just 0.8%.
The top six Sydney intrastate routes accounted for 69% of all Sydney to/from Regional NSW routes in 2014. The average annual passenger growth over the past five years has been strongest to Tamworth, Armidale, Ballina and Coffs Harbour.
By the March quarter 2015 the number of routes connecting Regional NSW to Sydney had fallen to 22. Of the twelve deregulated routes, growth over the past five years has been strongest to Tamworth, Armidale, Ballina and Coffs Harbour. Of the 14 regulated routes, growth over the past five years has been strongest to Moree; eight of these routes have seen declining passenger numbers while three of these routes were not served at all during 2014.
Aviation Performance in NSW
2014-15
2
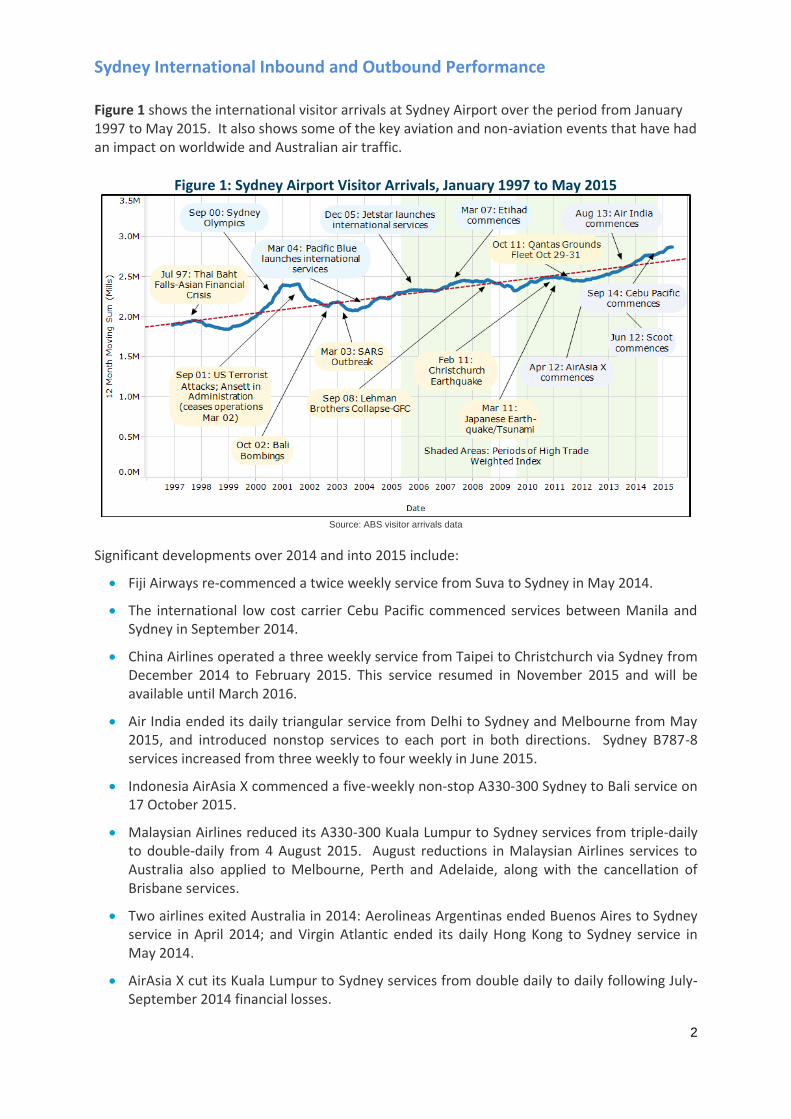
Sydney International Inbound and Outbound Performance Figure 1 shows the international visitor arrivals at Sydney Airport over the period from January 1997 to May 2015. It also shows some of the key aviation and non-aviation events that have had an impact on worldwide and Australian air traffic.
Figure 1: Sydney Airport Visitor Arrivals, January 1997 to May 2015
Source: ABS visitor arrivals data
Significant developments over 2014 and into 2015 include:
Fiji Airways re-commenced a twice weekly service from Suva to Sydney in May 2014.
The international low cost carrier Cebu Pacific commenced services between Manila and Sydney in September 2014.
China Airlines operated a three weekly service from Taipei to Christchurch via Sydney from December 2014 to February 2015. This service resumed in November 2015 and will be available until March 2016.
Air India ended its daily triangular service from Delhi to Sydney and Melbourne from May 2015, and introduced nonstop services to each port in both directions. Sydney B787-8 services increased from three weekly to four weekly in June 2015.
Indonesia AirAsia X commenced a five-weekly non-stop A330-300 Sydney to Bali service on 17 October 2015.
Malaysian Airlines reduced its A330-300 Kuala Lumpur to Sydney services from triple-daily to double-daily from 4 August 2015. August reductions in Malaysian Airlines services to Australia also applied to Melbourne, Perth and Adelaide, along with the cancellation of Brisbane services.
Two airlines exited Australia in 2014: Aerolineas Argentinas ended Buenos Aires to Sydney service in April 2014; and Virgin Atlantic ended its daily Hong Kong to Sydney service in May 2014.
AirAsia X cut its Kuala Lumpur to Sydney services from double daily to daily following July-September 2014 financial losses.
3
ANA plans to commence daily B787-9 services from Tokyo (Haneda) from 11 December 2015.
American Airlines plans to commence a daily B777 Los Angeles service from 19 December 2015; Qantas will reduce its services on the route from 14 to 10 times weekly.
Qantas plans to reduce its Los Angeles services from double daily to ten times weekly from 19 December 2015 (A380 services will remain at daily, while B747 services are reduced). At the same time the airline will commence six times weekly B747 services to San Francisco (last served this route in 2011).
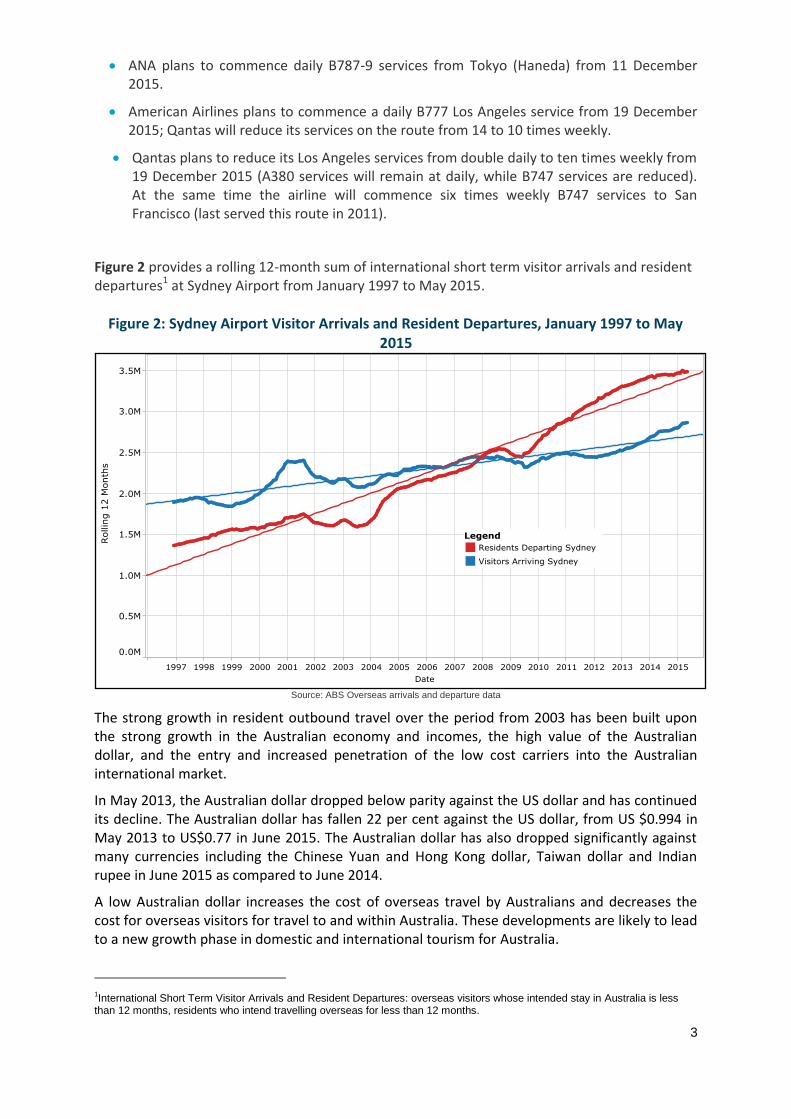
Figure 2 provides a rolling 12-month sum of international short term visitor arrivals and resident departures1 at Sydney Airport from January 1997 to May 2015.
Figure 2: Sydney Airport Visitor Arrivals and Resident Departures, January 1997 to May 2015
Source: ABS Overseas arrivals and departure data
The strong growth in resident outbound travel over the period from 2003 has been built upon the strong growth in the Australian economy and incomes, the high value of the Australian dollar, and the entry and increased penetration of the low cost carriers into the Australian international market.
In May 2013, the Australian dollar dropped below parity against the US dollar and has continued its decline. The Australian dollar has fallen 22 per cent against the US dollar, from US $0.994 in May 2013 to US$0.77 in June 2015. The Australian dollar has also dropped significantly against many currencies including the Chinese Yuan and Hong Kong dollar, Taiwan dollar and Indian rupee in June 2015 as compared to June 2014.
A low Australian dollar increases the cost of overseas travel by Australians and decreases the cost for overseas visitors for travel to and within Australia. These developments are likely to lead to a new growth phase in domestic and international tourism for Australia.
1International Short Term Visitor Arrivals and Resident Departures: overseas visitors whose intended stay in Australia is less
than 12 months, residents who intend travelling overseas for less than 12 months.
4
With the fall in the Australian dollar, outbound travel by Australian residents slowed down from 2013 while visitor arrivals to Australia grew at a faster rate over the same period. Sydney airport resident departure’s compound annual growth rate (CAGR) from 2005 to 2013 was 5.9% vs 1.3% from 2013 to 2014. In contrast, Sydney airport visitor arrivals’ CAGR from 2005 to 2013 was 1.7% vs 5.2% from 2013 to 2014.
On a national level, resident departures’ CAGR from 2005 to 2013 was 8.0% vs 3.9% from 2013 to 2014, while Australian visitor arrivals’ CAGR from 2005 to 2013 was 2.0% vs 7.6% from 2013 to 2014.
The share of visitor arrivals to total passengers of Sydney Airport has grown from 43% in 2012 to 48% in May 2015, a level last seen in 2009. In contrast, the share of resident departures to total passengers of Sydney Airport has fallen from 57% in 2012 to 52% in May 2015.
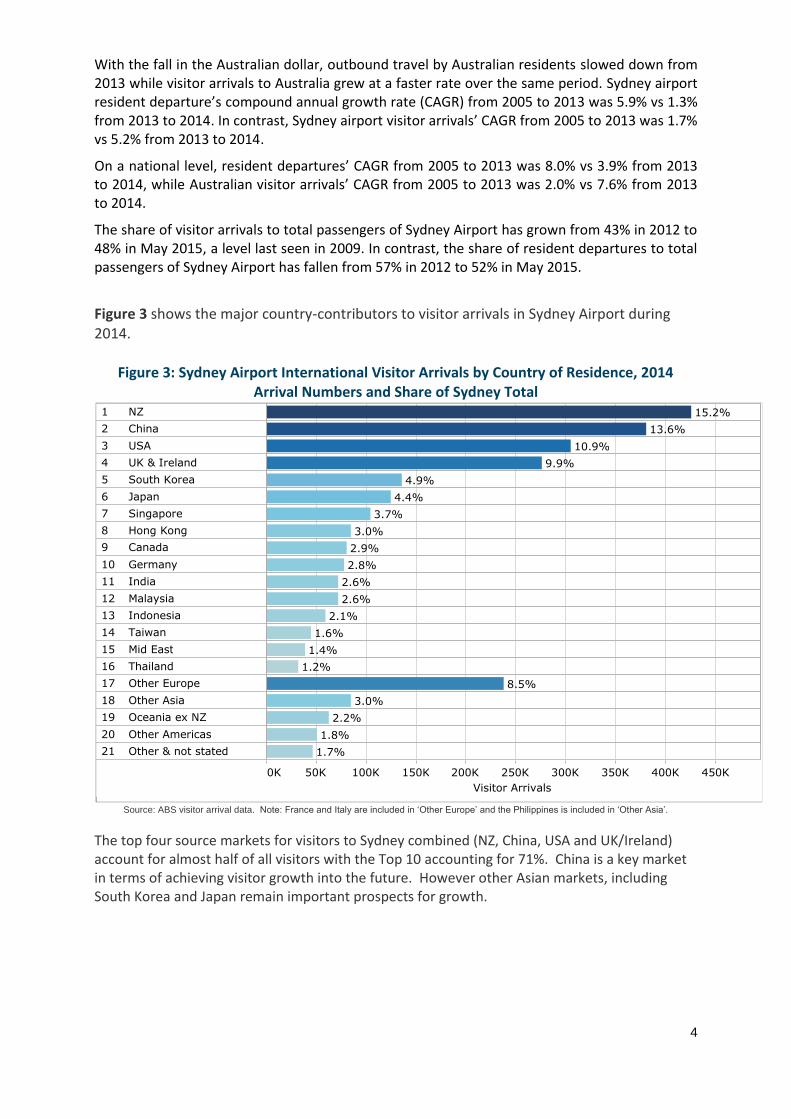
Figure 3 shows the major country-contributors to visitor arrivals in Sydney Airport during 2014.
Figure 3: Sydney Airport International Visitor Arrivals by Country of Residence, 2014 Arrival Numbers and Share of Sydney Total
Source: ABS visitor arrival data. Note: France and Italy are included in ‘Other Europe’ and the Philippines is included in ‘Other Asia’.
The top four source markets for visitors to Sydney combined (NZ, China, USA and UK/Ireland) account for almost half of all visitors with the Top 10 accounting for 71%. China is a key market in terms of achieving visitor growth into the future. However other Asian markets, including South Korea and Japan remain important prospects for growth.
0K 50K 100K 150K 200K 250K 300K 350K 400K 450K Visitor Arrivals
1 NZ
2 China
3 USA
4 UK & Ireland
5 South Korea
6 Japan
7 Singapore
8 Hong Kong
9 Canada
10 Germany
11 India
12 Malaysia
13 Indonesia
14 Taiwan
15 Mid East
16 Thailand
17 Other Europe
18 Other Asia
19 Oceania ex NZ
20 Other Americas
21 Other & not stated
15.2%
13.6%
10.9%
9.9%
4.9%
4.4%
3.7%
3.0%
2.9%
2.8%
2.6%
2.6%
2.1%
1.6%
1.4%
1.2%
8.5%
3.0%
2.2%
1.8%
1.7%
5
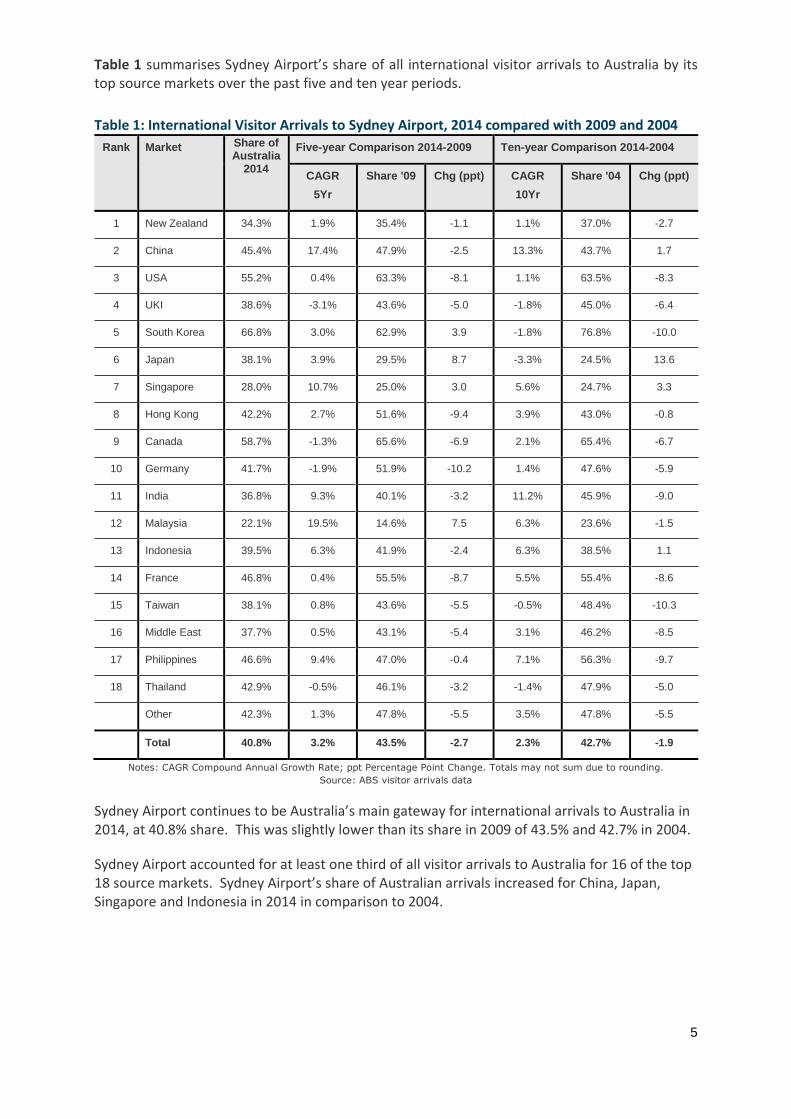
Table 1 summarises Sydney Airport’s share of all international visitor arrivals to Australia by its top source markets over the past five and ten year periods.
Table 1: International Visitor Arrivals to Sydney Airport, 2014 compared with 2009 and 2004
Rank Market Share of Australia
2014
Five-year Comparison 2014-2009 Ten-year Comparison 2014-2004
CAGR
5Yr
Share '09 Chg (ppt) CAGR
10Yr
Share '04 Chg (ppt)
1 New Zealand 34.3% 1.9% 35.4% -1.1 1.1% 37.0% -2.7
2 China 45.4% 17.4% 47.9% -2.5 13.3% 43.7% 1.7
3 USA 55.2% 0.4% 63.3% -8.1 1.1% 63.5% -8.3
4 UKI 38.6% -3.1% 43.6% -5.0 -1.8% 45.0% -6.4
5 South Korea 66.8% 3.0% 62.9% 3.9 -1.8% 76.8% -10.0
6 Japan 38.1% 3.9% 29.5% 8.7 -3.3% 24.5% 13.6
7 Singapore 28.0% 10.7% 25.0% 3.0 5.6% 24.7% 3.3
8 Hong Kong 42.2% 2.7% 51.6% -9.4 3.9% 43.0% -0.8
9 Canada 58.7% -1.3% 65.6% -6.9 2.1% 65.4% -6.7
10 Germany 41.7% -1.9% 51.9% -10.2 1.4% 47.6% -5.9
11 India 36.8% 9.3% 40.1% -3.2 11.2% 45.9% -9.0
12 Malaysia 22.1% 19.5% 14.6% 7.5 6.3% 23.6% -1.5
13 Indonesia 39.5% 6.3% 41.9% -2.4 6.3% 38.5% 1.1
14 France 46.8% 0.4% 55.5% -8.7 5.5% 55.4% -8.6
15 Taiwan 38.1% 0.8% 43.6% -5.5 -0.5% 48.4% -10.3
16 Middle East 37.7% 0.5% 43.1% -5.4 3.1% 46.2% -8.5
17 Philippines 46.6% 9.4% 47.0% -0.4 7.1% 56.3% -9.7
18 Thailand 42.9% -0.5% 46.1% -3.2 -1.4% 47.9% -5.0
Other 42.3% 1.3% 47.8% -5.5 3.5% 47.8% -5.5
Total 40.8% 3.2% 43.5% -2.7 2.3% 42.7% -1.9
Notes: CAGR Compound Annual Growth Rate; ppt Percentage Point Change. Totals may not sum due to rounding.
Source: ABS visitor arrivals data
Sydney Airport continues to be Australia’s main gateway for international arrivals to Australia in 2014, at 40.8% share. This was slightly lower than its share in 2009 of 43.5% and 42.7% in 2004.
Sydney Airport accounted for at least one third of all visitor arrivals to Australia for 16 of the top 18 source markets. Sydney Airport’s share of Australian arrivals increased for China, Japan, Singapore and Indonesia in 2014 in comparison to 2004.
6
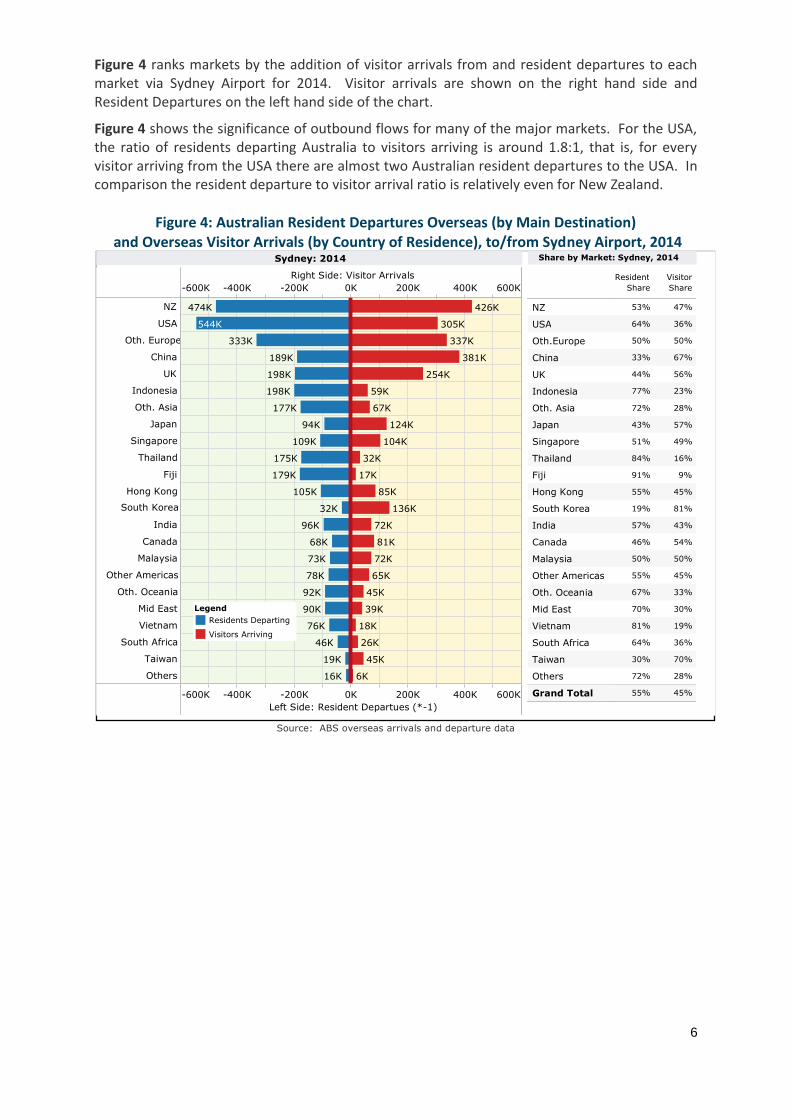
Figure 4 ranks markets by the addition of visitor arrivals from and resident departures to each market via Sydney Airport for 2014. Visitor arrivals are shown on the right hand side and Resident Departures on the left hand side of the chart.
Figure 4 shows the significance of outbound flows for many of the major markets. For the USA, the ratio of residents departing Australia to visitors arriving is around 1.8:1, that is, for every visitor arriving from the USA there are almost two Australian resident departures to the USA. In comparison the resident departure to visitor arrival ratio is relatively even for New Zealand.
Figure 4: Australian Resident Departures Overseas (by Main Destination) and Overseas Visitor Arrivals (by Country of Residence), to/from Sydney Airport, 2014
Source: ABS overseas arrivals and departure data
-600K -400K -200K 0K 200K 400K 600K Right Side: Visitor Arrivals
-600K -400K -200K 0K 200K 400K 600K Left Side: Resident Departues (*-1)
NZ
USA
Oth. Europe
China
UK
Indonesia
Oth. Asia
Japan
Singapore
Thailand
Fiji
Hong Kong
South Korea
India
Canada
Malaysia
Other Americas
Oth. Oceania
Mid East
Vietnam
South Africa
Taiwan
Others
474K
544K
333K
189K
198K
198K
177K
109K
175K
179K
105K
94K
32K
96K
68K
73K
78K
92K
90K
76K
46K
19K
16K
426K
305K
337K
381K
254K
124K
104K
136K
59K
67K
32K
17K
85K
72K
81K
72K
65K
45K
39K
18K
26K
45K
6K
Sydney: 2014
Resident Share
Visitor Share
NZ
USA
Oth.Europe
China
UK
Indonesia
Oth. Asia
Japan
Singapore
Thailand
Fiji
Hong Kong
South Korea
India
Canada
Malaysia
Other Americas
Oth. Oceania
Mid East
Vietnam
South Africa
Taiwan
Others
Grand Total 45%
28%
70%
36%
19%
30%
33%
45%
50%
54%
43%
81%
45%
9%
16%
49%
57%
28%
23%
56%
67%
50%
36%
47%
55%
72%
30%
64%
81%
70%
67%
55%
50%
46%
57%
19%
55%
91%
84%
51%
43%
72%
77%
44%
33%
50%
64%
53%
Share by Market: Sydney, 2014
Legend Residents Departing Visitors Arriving
7
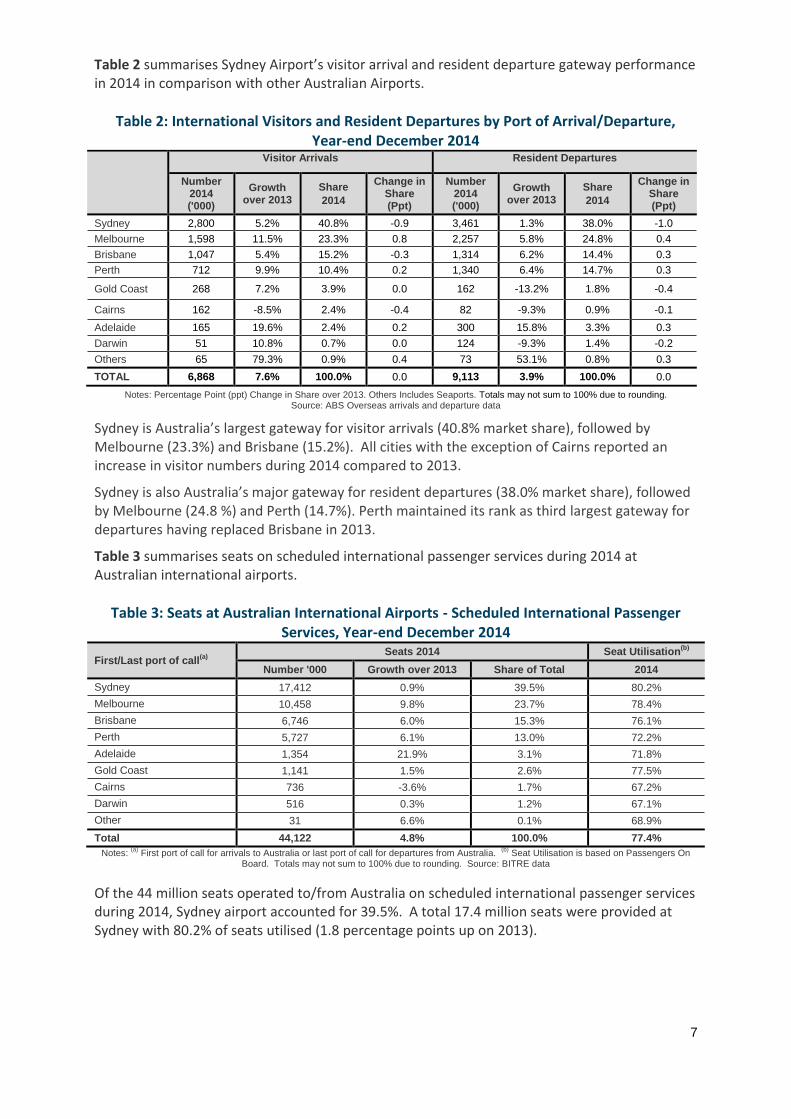
Table 2 summarises Sydney Airport’s visitor arrival and resident departure gateway performance in 2014 in comparison with other Australian Airports.
Table 2: International Visitors and Resident Departures by Port of Arrival/Departure, Year-end December 2014
Visitor Arrivals Resident Departures
Number 2014 ('000)
Growth over 2013
Share
2014
Change in Share (Ppt)
Number 2014 ('000)
Growth over 2013
Share
2014
Change in Share (Ppt)
Sydney 2,800 5.2% 40.8% -0.9 3,461 1.3% 38.0% -1.0
Melbourne 1,598 11.5% 23.3% 0.8 2,257 5.8% 24.8% 0.4
Brisbane 1,047 5.4% 15.2% -0.3 1,314 6.2% 14.4% 0.3
Perth 712 9.9% 10.4% 0.2 1,340 6.4% 14.7% 0.3
Gold Coast 268 7.2% 3.9% 0.0 162 -13.2% 1.8% -0.4
Cairns 162 -8.5% 2.4% -0.4 82 -9.3% 0.9% -0.1
Adelaide 165 19.6% 2.4% 0.2 300 15.8% 3.3% 0.3
Darwin 51 10.8% 0.7% 0.0 124 -9.3% 1.4% -0.2
Others 65 79.3% 0.9% 0.4 73 53.1% 0.8% 0.3
TOTAL 6,868 7.6% 100.0% 0.0 9,113 3.9% 100.0% 0.0
Notes: Percentage Point (ppt) Change in Share over 2013. Others Includes Seaports. Totals may not sum to 100% due to rounding. Source: ABS Overseas arrivals and departure data
Sydney is Australia’s largest gateway for visitor arrivals (40.8% market share), followed by Melbourne (23.3%) and Brisbane (15.2%). All cities with the exception of Cairns reported an increase in visitor numbers during 2014 compared to 2013.
Sydney is also Australia’s major gateway for resident departures (38.0% market share), followed by Melbourne (24.8 %) and Perth (14.7%). Perth maintained its rank as third largest gateway for departures having replaced Brisbane in 2013.
Table 3 summarises seats on scheduled international passenger services during 2014 at Australian international airports.
Table 3: Seats at Australian International Airports - Scheduled International Passenger Services, Year-end December 2014
First/Last port of call(a)
Seats 2014 Seat Utilisation
(b)
Number '000 Growth over 2013 Share of Total 2014
Sydney 17,412 0.9% 39.5% 80.2%
Melbourne 10,458 9.8% 23.7% 78.4%
Brisbane 6,746 6.0% 15.3% 76.1%
Perth 5,727 6.1% 13.0% 72.2%
Adelaide 1,354 21.9% 3.1% 71.8%
Gold Coast 1,141 1.5% 2.6% 77.5%
Cairns 736 -3.6% 1.7% 67.2%
Darwin 516 0.3% 1.2% 67.1%
Other 31 6.6% 0.1% 68.9%
Total 44,122 4.8% 100.0% 77.4%
Notes: (a)
First port of call for arrivals to Australia or last port of call for departures from Australia. (b)
Seat Utilisation is based on Passengers On Board. Totals may not sum to 100% due to rounding. Source: BITRE data
Of the 44 million seats operated to/from Australia on scheduled international passenger services during 2014, Sydney airport accounted for 39.5%. A total 17.4 million seats were provided at Sydney with 80.2% of seats utilised (1.8 percentage points up on 2013).

8
Figure 5 provides the Low Cost Carrier (LCC) share over time for Australia and Sydney and the LCC shares as at April 2015 for each of the major Australian airports. Note the calculations are based on the first port of call for arrivals to Australia or last port of call for departures from Australia as published by the BITRE. They do not include services with multiple Australian stops.
Figure 5: Low Cost Carrier Share of International Seats at Australian Airports
Notes: First port of call for arrivals to Australia or last port of call for departures from Australia; FSA Full Service Airlines; LCCs
Low Cost Carriers; Includes direct services only – for example excludes Osaka-Cairns-Sydney Jetstar services.
Source: BITRE data
The low cost carrier share of total Australian international seats has increased over time, from 4% in 2006 to 12% in 2010 and to 16% in April 2015. Over the same period, the LCC share of Sydney international seats has increased from 2% to 5% to 10%. Sydney gained a fourth low cost carrier in September 2014 with the commencement of Cebu Pacific services from Manila. Jetstar had commenced its first international services from Sydney in 2005, followed by AirAsia X and Scoot in 2012. Tourism Futures International expects the aggregate low cost carrier shares for Australia to continue to increase as the penetration increases for Sydney, Melbourne and Brisbane, in particular.
Adelaide Brisbane Cairns Darwin Gold Coast Melbourne Perth Sydney 0%
20%
40%
60%
80%
100%
% o
f T o t
a l M
a x S e a
t s
89% 97%
48% 43%
23%
82% 70%
90%
11%
52% 57%
77%
18% 30%
10%
LCC Shares Month: Apr 15
Airline Type FSC LCCs
2006 2007 2008 2009 2010 2011 2012 2013 2014 2015 FSC LCCs
Grand Total 100% 16% 84%
100% 16% 84%
100% 14% 86%
100% 13% 87%
100% 12% 88%
100% 12% 88%
100% 11% 89%
100% 8%
92%
100% 7%
93%
100% 4%
96%
National LCC Penetration (CY06 to CY15 Part)
2006 2007 2008 2009 2010 2011 2012 2013 2014 2015 FSC LCCs
Grand Total 100% 10% 90%
100% 9%
91%
100% 8%
92%
100% 7%
93%
100% 5%
95%
100% 5%
95%
100% 4%
96%
100% 5%
95%
100% 6%
94%
100% 2%
98%
Sydney: LCC Penetration City (CY06 to CY15 Part)
9
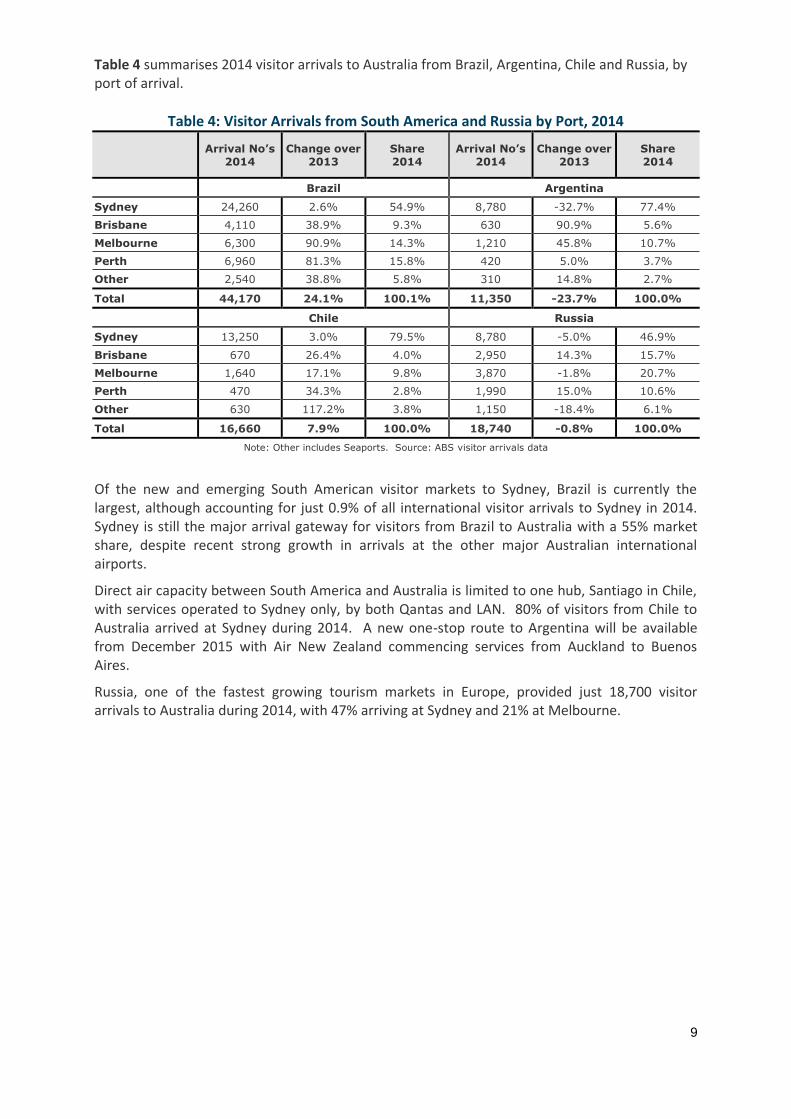
Table 4 summarises 2014 visitor arrivals to Australia from Brazil, Argentina, Chile and Russia, by port of arrival.
Table 4: Visitor Arrivals from South America and Russia by Port, 2014
Arrival No’s
2014
Change over
2013
Share
2014
Arrival No’s
2014
Change over
2013
Share
2014
Brazil Argentina
Sydney 24,260 2.6% 54.9% 8,780 -32.7% 77.4%
Brisbane 4,110 38.9% 9.3% 630 90.9% 5.6%
Melbourne 6,300 90.9% 14.3% 1,210 45.8% 10.7%
Perth 6,960 81.3% 15.8% 420 5.0% 3.7%
Other 2,540 38.8% 5.8% 310 14.8% 2.7%
Total 44,170 24.1% 100.1% 11,350 -23.7% 100.0%
Chile Russia
Sydney 13,250 3.0% 79.5% 8,780 -5.0% 46.9%
Brisbane 670 26.4% 4.0% 2,950 14.3% 15.7%
Melbourne 1,640 17.1% 9.8% 3,870 -1.8% 20.7%
Perth 470 34.3% 2.8% 1,990 15.0% 10.6%
Other 630 117.2% 3.8% 1,150 -18.4% 6.1%
Total 16,660 7.9% 100.0% 18,740 -0.8% 100.0%
Note: Other includes Seaports. Source: ABS visitor arrivals data
Of the new and emerging South American visitor markets to Sydney, Brazil is currently the largest, although accounting for just 0.9% of all international visitor arrivals to Sydney in 2014. Sydney is still the major arrival gateway for visitors from Brazil to Australia with a 55% market share, despite recent strong growth in arrivals at the other major Australian international airports.
Direct air capacity between South America and Australia is limited to one hub, Santiago in Chile, with services operated to Sydney only, by both Qantas and LAN. 80% of visitors from Chile to Australia arrived at Sydney during 2014. A new one-stop route to Argentina will be available from December 2015 with Air New Zealand commencing services from Auckland to Buenos Aires.
Russia, one of the fastest growing tourism markets in Europe, provided just 18,700 visitor arrivals to Australia during 2014, with 47% arriving at Sydney and 21% at Melbourne.
10
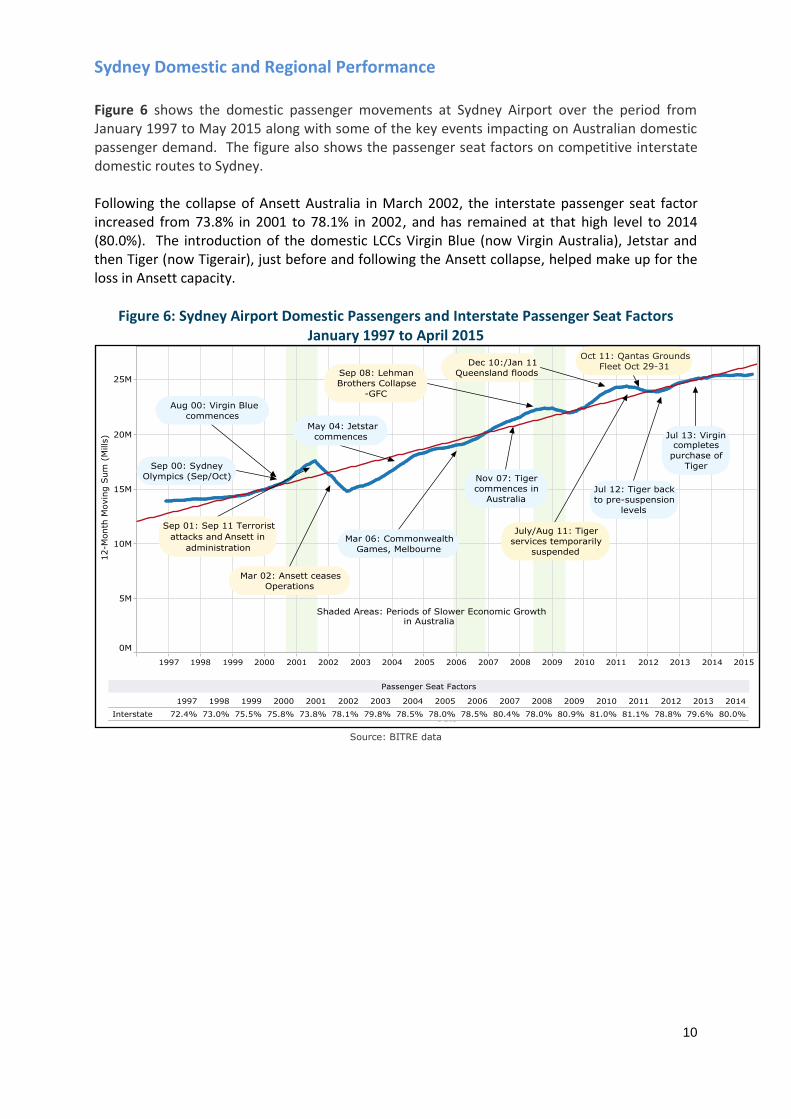
Sydney Domestic and Regional Performance Figure 6 shows the domestic passenger movements at Sydney Airport over the period from January 1997 to May 2015 along with some of the key events impacting on Australian domestic passenger demand. The figure also shows the passenger seat factors on competitive interstate domestic routes to Sydney. Following the collapse of Ansett Australia in March 2002, the interstate passenger seat factor increased from 73.8% in 2001 to 78.1% in 2002, and has remained at that high level to 2014 (80.0%). The introduction of the domestic LCCs Virgin Blue (now Virgin Australia), Jetstar and then Tiger (now Tigerair), just before and following the Ansett collapse, helped make up for the loss in Ansett capacity.
Figure 6: Sydney Airport Domestic Passengers and Interstate Passenger Seat Factors January 1997 to April 2015
Source: BITRE data
11
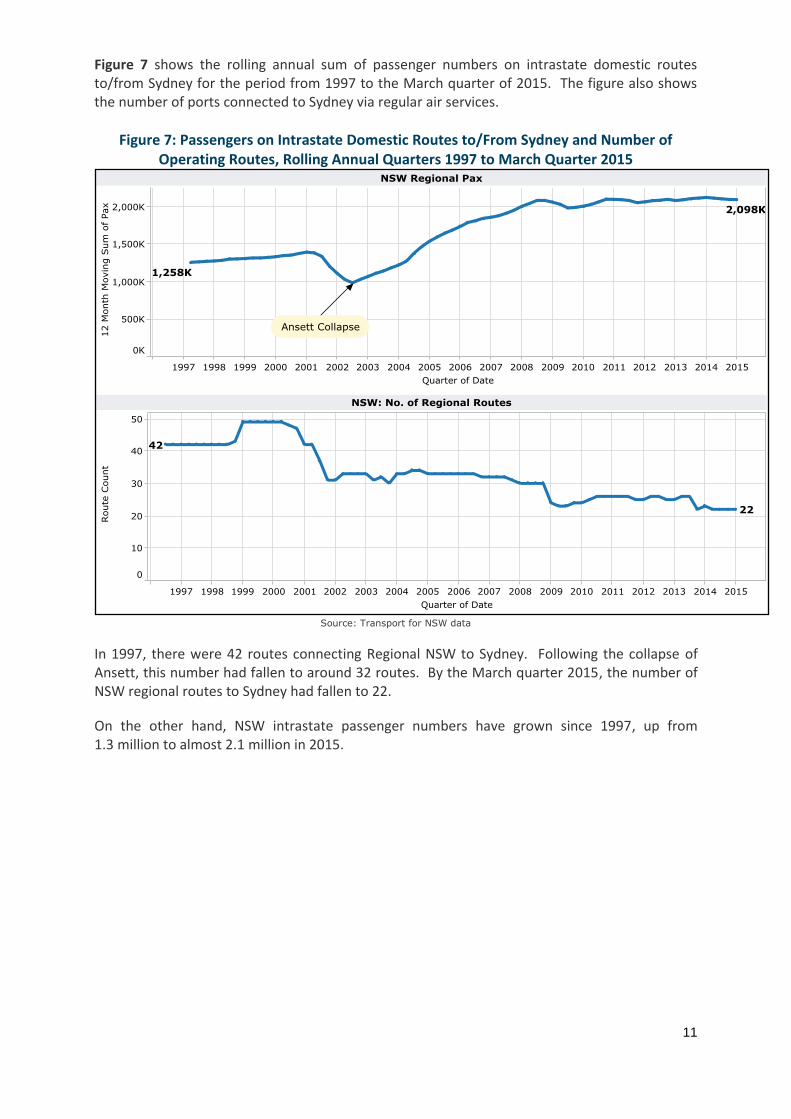
Figure 7 shows the rolling annual sum of passenger numbers on intrastate domestic routes to/from Sydney for the period from 1997 to the March quarter of 2015. The figure also shows the number of ports connected to Sydney via regular air services.
Figure 7: Passengers on Intrastate Domestic Routes to/From Sydney and Number of Operating Routes, Rolling Annual Quarters 1997 to March Quarter 2015
Source: Transport for NSW data
In 1997, there were 42 routes connecting Regional NSW to Sydney. Following the collapse of Ansett, this number had fallen to around 32 routes. By the March quarter 2015, the number of NSW regional routes to Sydney had fallen to 22.
On the other hand, NSW intrastate passenger numbers have grown since 1997, up from 1.3 million to almost 2.1 million in 2015.

12
Table 5 shows passengers and seats on the major Sydney competitive interstate and intrastate routes during 2014.
Table 5: Seats and Passengers on Major Sydney Competitive Interstate and Intrastate Routes, Year-end December 2014
Passengers Seats Pax Load
Factor Sydney to/from: Number
‘000 Change on 2013
Share of Total
Number ‘000
Change on 2013
Share of Total
Interstate Routes
Melbourne 8,317 0.9% 36.0% 10,070 0.1% 34.8% 82.6%
Brisbane 4,448 0.5% 19.3% 5,592 -0.1% 19.3% 79.5%
Gold Coast 2,595 1.4% 11.2% 3,186 0.1% 11.0% 81.5%
Adelaide 1,813 3.5% 7.9% 2,326 6.3% 8.0% 77.9%
Perth 1,799 -0.1% 7.8% 2,267 3.4% 7.8% 79.3%
Cairns 1,001 2.3% 4.3% 1,206 -1.6% 4.2% 83.0%
Canberra 968 -5.8% 4.2% 1,525 -8.6% 5.3% 63.5%
Hobart 536 3.7% 2.3% 659 1.4% 2.3% 81.3%
Sunshine Coast 464 -0.1% 2.0% 563 -1.1% 1.9% 82.5%
Darwin 327 -8.3% 1.4% 455 -2.1% 1.6% 72.0%
Launceston 296 8.5% 1.3% 381 1.9% 1.3% 77.6%
Hamilton Island 210 4.5% 0.9% 268 8.6% 0.9% 78.4%
Townsville 174 -5.0% 0.8% 220 -3.3% 0.8% 78.9%
Ayers Rock 145 9.6% 0.6% 191 10.5% 0.7% 75.7%
Sum Above 23,093 0.8% 100.0% 28,909 0.3% 100.0% 79.9%
Intrastate Routes
Coffs Harbour 344 -6.4% 22.3% 455 -9.1% 20.7% 75.8
Ballina 320 1.4% 20.7% 420 0.5% 19.1% 76.2
Albury 225 -3.9% 14.6% 338 1.6% 15.4% 66.6
Dubbo 197 7.8% 12.7% 302 3.6% 13.7% 65.2
Port Macquarie 188 -1.9% 12.1% 266 -0.4% 12.1% 70.6
Wagga Wagga 186 1.7% 12.0% 278 -0.1% 12.7% 66.7
Armidale (a) 85 n.a. 5.5% 140 n.a. 6.4% 60.8
Sum Above 1,545 4.8% 100.0% 2,199 5.3% 100.0% 70.3
Note: (a) Armidale-Sydney route included from May 2014, prior data not shown. Totals may not sum to 100% due to rounding.
Source: BITRE data
The 14 major Sydney interstate competitive routes accounted for 40% of total Australian domestic passenger traffic in 2014 and for 37% of seats provided across Australia. The top two routes Sydney-Melbourne and Sydney-Brisbane accounted for over half of the passengers carried on the competitive Sydney interstate routes and the top six routes for 86%.
The fastest growing Sydney interstate routes for 2014 were the lower passenger volume routes where growth is over a low base: Sydney to/from Ayers Rock, Launceston and Hamilton Island. Of the higher volume routes, growth was strongest from Sydney to/from Adelaide and the Gold Coast while passenger numbers from Sydney to/from Perth declined slightly. Overall passenger numbers on the 14 major routes increased by just 0.8%.
Seven Sydney regional routes were competitive with at least two airlines operating for most of 2014; up from six routes following the entry of Regional Express to Armidale in March 2014. An eighth competitive route has since been added with Virgin Australia’s new service to Tamworth commencing in May 2015.
Sydney-Dubbo was the fastest growing of the major regional routes in 2014. Two regional airlines have gone into receivership over the past 18 months, Brindabella in December 2013 and Vincent Aviation in June 2014, resulting in the loss of four Sydney regional routes. The Sydney-
13
Mudgee route has since re-gained a service with the entry of Pelican Airlines in June 2015. Pelican has also commenced a Sydney-Newcastle route, in competition with Regional Express.
International and Domestic Outlook
In its most recent World Economic Outlook (April 2015), the International Monetary Fund reported on the underlying forces shaping future economic growth: (1) the legacies of both the financial and the euro area crises which still weigh on spending and growth in many countries, and (2) ageing and weak productivity growth which continue to weigh on potential economic growth.
In addition to these underlying forces, declines in the price of oil and large exchange rate movements have major distributional implications. Overall global growth is expected to remain moderate, at 3.5% in 2015 and 3.8% in each of the following two years, although with uneven prospects across the main countries and regions:
In the advanced economies, growth is expected to increase to about 2.4% across 2015-16, up from 1.8% in 2014. The US economy is forecast to grow most strongly, by around 3.1%, with growth in the euro area positive but varied.
Growth in the emerging market and developing Asian economies is expected to decline slightly from 6.8% in 2014 to 6.6% in 2015 and 6.4% in 2016. In China, growth is expected to average around 6.5% across 2015-16, one percentage point below the expected average for India. The ASEAN-5 region is expected to have an average growth of around 5.2%, up from 4.6% in 2014.
Further concerns have emerged recently about Chinese stock markets and economic growth. China is now a key market influencing the Australian economic outlook.
The Australian economy remains weak with GDP growth below trend, consumption spending low and unemployment edging upwards. Consumer confidence is down and the travel market remains weak. The low interest rates appear to be having a significant impact on Australian housing prices but not on the wider economy.
The fall in the Australian dollar is a positive for the Australian economy as a whole, and for inbound and domestic travel, in particular. A lower dollar should promote growth in the inbound market and reduce the growth in outbound travel. Many Australians could be expected to switch from longer-haul international travel to short-haul international and domestic destinations.
Oil prices now appear likely to remain at a lower level for longer than may have been expected a year ago. This will have a major impact on airline profitability overall and increase the number of viable routes airlines can operate. Already Qantas has indicated a number of new international routes including Sydney to Vancouver (seasonal services from January 2015) and to San Francisco (commencing December 2015)
The lower dollar coincides with the increased penetration of new fuel efficient aircraft types into the Asia Pacific. Delivery of the new medium-size wide-body aircraft types is now accelerating. By end-May 2015, some 255 of the B787-8 aircraft had been delivered (almost half to airlines based in Oceania/Asia), with over 200 still on order. Twenty-seven of the newer B787-9 models have been delivered. Boeing has 482 unfilled orders for the B787-9, including 120 for airlines based in the Oceania/Asia region:
A recovery of the Australian economy over the next 18 months allied with the lower oil prices should increase the scope for route expansion and domestic airline capacity growth in Australia. Interstate routes on the east coast are likely to be the major beneficiaries of this growth.
Related Documents


