HAL Id: tel-02426258 https://pastel.archives-ouvertes.fr/tel-02426258 Submitted on 2 Jan 2020 HAL is a multi-disciplinary open access archive for the deposit and dissemination of sci- entific research documents, whether they are pub- lished or not. The documents may come from teaching and research institutions in France or abroad, or from public or private research centers. L’archive ouverte pluridisciplinaire HAL, est destinée au dépôt et à la diffusion de documents scientifiques de niveau recherche, publiés ou non, émanant des établissements d’enseignement et de recherche français ou étrangers, des laboratoires publics ou privés. Aversive States Affecting Consumer Behavior Elena Fumagalli To cite this version: Elena Fumagalli. Aversive States Affecting Consumer Behavior. Business administration. Université Paris Saclay (COmUE), 2018. English. NNT : 2018SACLH004. tel-02426258

Welcome message from author
This document is posted to help you gain knowledge. Please leave a comment to let me know what you think about it! Share it to your friends and learn new things together.
Transcript
HAL Id: tel-02426258https://pastel.archives-ouvertes.fr/tel-02426258
Submitted on 2 Jan 2020
HAL is a multi-disciplinary open accessarchive for the deposit and dissemination of sci-entific research documents, whether they are pub-lished or not. The documents may come fromteaching and research institutions in France orabroad, or from public or private research centers.
L’archive ouverte pluridisciplinaire HAL, estdestinée au dépôt et à la diffusion de documentsscientifiques de niveau recherche, publiés ou non,émanant des établissements d’enseignement et derecherche français ou étrangers, des laboratoirespublics ou privés.
Aversive States Affecting Consumer BehaviorElena Fumagalli
To cite this version:Elena Fumagalli. Aversive States Affecting Consumer Behavior. Business administration. UniversitéParis Saclay (COmUE), 2018. English. �NNT : 2018SACLH004�. �tel-02426258�
i
THESE DE DOCTORAT DE
L’UNIVERSITE PARIS-SACLAY
PREPAREE A “HEC PARIS”
ECOLE DOCTORALE N° 578
Sciences de l’homme et de la société (SHS)
Spécialité de doctorat : Sciences de gestion
Par
Ms. Elena FUMAGALLI
Aversive States Affecting Consumer Behavior
Thèse présentée et soutenue à Jouy-en-Josas, le 25 Juin 2018 :
Composition du Jury :
Mme. de Valck, Kristine Professeur Associé, HEC Paris, France Président
M. Heath, Timothy B. Professeur, University of South Florida, Rapporteur
Muma College of Business, États-Unis
M. Burroughs, James E. Professeur Associé, University of Virginia, Rapporteur
McIntire School of Commerce, États-Unis
M. Shrum, Larry Joe Professeur, HEC Paris, France Directeur de thèse

ii
L’université Paris-Saclay n’entend donner aucune approbation ou improbation aux opinions
émises dans cette thèse. Ces opinions doivent être considérées comme propres à leur auteur.
iii
Acknowledgments
Per aspera ad astra.
- Marco Tullio Cicerone
When I started my journey as a doctoral student, I was told by many to brace myself
for the difficult and solitary years to come. Now that I am at the end of this journey, I only
partially agree with that warning. Even though developing my skills as an academic was the
hardest thing I have ever had to do, I did not do it alone. Every person that I will mention in
the paragraphs that follow has contributed to my success either by challenging me to push
harder or by simply being there for me when I needed it.
First and foremost, I want to thank my advisor, Professor L. J. Shrum. I would never
have made it without his unconditional help. I want to thank L. J. for always believing in me
and for always pushing me to be the best version of myself. His trust and support mean the
world to me. I doubted myself millions of times, but he never did. I don’t know how many
times I sent him a final draft that was not final, but he always patiently helped me improve
my work. In five long years, we exchanged hundreds of e-mails, and I can’t remember
reading a single message that did not end with words of praise or encouragement. I hope that
in the future, I will be able to advise my students with the same dedication.
I owe a very important debt to Professor Gabriele Troilo, who has been my first
academic advisor at Bocconi University. The very first time I attended an academic
conference was to present our joint work, and since then, my passion for this profession grew
exponentially. Professor Troilo is one of liveliest people I know. His love for art, his
commitment to the social good, and his passion for life deeply influenced me. I hope
someday I can be as active, spirited, and energetic as he is.
I would like to express my gratitude to Professor Luca Visconti. Without him, I would
iv
have never worked with Professor Troilo, and I would have never thought about getting a
doctorate. Professor Luca Visconti has been both an outstanding mentor and a wonderful
friend. Luca is one of the smartest, most generous people I know, and one of the most
talented teachers I ever met. I wish I will be able to support and encourage others as he has
supported and encouraged me.
I would like to express the deepest appreciation to the Ph.D. program director,
Professor Kristine de Valck. Throughout the years she has been an inspiration to me. I hope
that one day I will also become a successful academic, a loving wife and mother, an
extraordinary educator and generous mentor.
I also want to thank Professor Tina Lowrey for welcoming me into her house many
times during the years her husband has been advising me. Even though she had no obligation
to, she also helped me and gave me numerous suggestions throughout my doctoral years. Her
smile and positivity made the difference.
For challenging me to always do my best, I want to thank all the other faculty
members of the marketing department at HEC Paris, Professor Peter Ebbes, Professor
Dominique Rouzies, Professor Anne-Laure Sellier, Professor Marc Vanhuele, Professor
Francesca Sotgiu, Professor Stefan Worm, Professor Daniel Halbheer, Professor Cathy Yang,
Professor Yangjie Gu, Professor Ludovic Stourm, and Professor Valeria Stourm. I deeply
appreciate all the time and effort they spent to teach doctoral specialization courses, to
organize our departmental speaker series, to attend my formal and informal presentations, and
to provide me with valuable feedback throughout the years.
I would like to show my greatest appreciation to the marketing faculty at Texas A&M,
Professor Suresh Ramanathan, Professor Christina Kan, Professor Mark Houston, Professor
Allan Chen, Professor Caleb Warren, Professor Chiraag Mittal, Professor Venkatesh Shankar,
Professor Alina Sorescu, Professor Rajan Varadarajan, Professor Manjit S. Yadav, Professor
v
Jeff Cai, and Professor Paul S. Busch. During my one-year visit they welcomed me like one
of their students, they invited me to participate in all their events, meetings and academic
activities, and they provided me full access to their facilities including the lab who was
managed by the wonderful Wendy Castro, thanks to whom I was able to get familiar with all
the procedures quickly.
I would like to thank Mélanie Romil, Françoise Dauvergne, Caroline Meriaux,
Francine Nnyina, Cristina Pachon, Britta Delhay, and Véronique Perrot. The Ph.D. team and
the HEC staff made my journey easier, and it is important for me to let them know that I
appreciate the effort they put into constantly improving our program and making our lives
easier.
I thank all my friends for their support, their patience, and their time. To all the
friends I met thanks to the Ph.D. program at HEC Paris I will be forever thankful as they
made my doctoral life less lonely and they encouraged me every step of the way. I would like
to express my gratitude to Maria Rouziou, Mehdi Nezami, Cédric Gutierrez Moreno, Sara
Rezaee Vessal, Ali Shantia, Tatiana Sokolova, Yi Li, Ana Babic and her husband Claudio
Rosario, Chiara Bottausci, Ana Scekic, Yin Wang, Elena Plaksenkova, Ebenge Usip, Thomas
Rivera, Victoria Slabik, Nimish Rustagi, Laetitia Mimoun, Ashkan Faramarzi, Fei Gao,
Sukhyun Kim, Alican Mecit, and Claire Linares. To my Parisian friends, Alice Guigui, Pietro
Aime, and Giovanni Battista Mercurio, I am grateful for all the fun dinners and picnics. To
Arthur Romec I owe my deepest gratitude for providing the best office snacks and for his
help in everything related to the French language, including my thesis abstract. Special
thanks also to my dear friends from all around the globe, Marco Vismara, Unnati Narang,
Christine Smith, Paolo Borroni, Meyrav Shoham, Valeria Pérez Serrano, Erick Estrada, Luis
Robles, Michael Gutierrez, and Céline Mounier for all their support and encouragement along
the way. Finally, I would like to thank Annalisa Fraccaro who made my time in Paris so
vi
joyful. From the time I met her, she introduced me to all her friends and she invited me to
every event she would go to. I honestly cannot think of any other friend who made me smile
as much as she did.
I would like to thank my boyfriend, Douglas Solorzano, for making my life exciting
and peaceful at the same time. For the last two years, he made sure that I was always happy.
Whether by dragging me out of the house to get ice cream or stealing my waves while
surfing, he always managed to put a smile on my face. Douglas is one of the most balanced,
positive, and generous people I know, and I am grateful to him for having such a positive
influence in my life.
I thank my entire family for their never-ending love and support. I am grateful to my
grandmother Augusta Balossi, my aunt Elena Galli, and my cousin Alessia Vanini for always
cheering me on and congratulate me for my achievements. I thank my brother, Riccardo
Fumagalli, for always supporting me without being overly dramatic and for taking care of my
family all these years I have been away. No matter where we will end up later in life I will
always be there for him, and I know he will always be there for me. I thank my father, Egidio
Fumagalli, for being a great example of determination and generosity. He is a hardworking
man who built his own business starting from scratch and who did everything to allow me
and my brother to be able to pursue our dreams. I thank my mother, Daniela Galli, for being
my rock. I am convinced that without her words of encouragement I would have never been
able to achieve this. My mom is the smartest, most talented and most educated person I
know. Unfortunately, life events deprived her of the opportunity to pursue a university
degree, and I hope that she sees my academic accomplishment as a way to indirectly fulfilling
that dream. Ultimately, I dedicate this thesis to her.
vii
Résumé de Thèse
L’influence des états aversifs sur le comportement du
consommateur
Le dictionnaire de Cambridge définit aversive comme: a) quelque chose doit être évité
ou craint; b) un stimulus désagréable destiné à induire un changement de comportement.
L'aversion et les stimuli aversifs ont été largement étudiés en psychologie, en particulier dans
le domaine du changement de comportement. Dans les années 1970 et au début des années
1980, les chercheurs étudient comment ils peuvent changer les comportements en associant
un comportement aversif à un comportement qu'ils souhaitent modifier ou en associant un
résultat agréable à un comportement qu'ils souhaitent renforcer (p. théorie du
conditionnement opérant). En me basant sur les preuves recueillies en psychologie et en
psychothérapie, sur le fait que les stimuli aversifs influencent le comportement humain, je me
concentre sur la façon dont les stimuli aversifs changent inconsciemment le comportement
des consommateurs. Passant au domaine du comportement du consommateur, cette thèse
examine les stimuli aversifs qui sont fréquemment rencontrés dans les contextes de
consommation, tels que les émotions désagréables et les résultats indésirables, qui incitent les
consommateurs à réagir. La présente recherche montre que la façon dont les consommateurs
réagissent est la plupart du temps inconsciente et va souvent à l'encontre de ce que les
connaissances communes suggèrent, ce qui rend difficile la prédiction et l'action des
praticiens du marketing à moins d'être découvert par la recherche.
Dans le premier essai, j'examine comment des expériences émotionnelles aversives
peuvent affecter le sens du soi des consommateurs et une consommation compensatoire
rapide. Les professionnels du marketing utilisent souvent des images choquantes pour faire
peur aux consommateurs de se conformer aux messages de leurs publicités, une pratique
viii
communément appelée «shockvertising». Les images de choc provoquent souvent des
sentiments de dégoût physique et moral qui, en psychologie, mais non dans la recherche
auprès des consommateurs, ont été identifiés comme deux émotions distinctes. Sur la base de
la théorie de l'évaluation des émotions, je postule que différentes émotions conduisent à
différentes évaluations cognitives de l'événement émotionnel, ce qui à son tour suscitera des
réponses comportementales différentes. Spécifiquement, je soutiens que le dégoût physique
diminue le sentiment de pouvoir des consommateurs, ce qui les incite à agir de manière auto-
centrée pour le restaurer (par exemple, consommer ostensiblement). En revanche, le dégoût
moral diminue le sentiment d'appartenance des consommateurs, ce qui les incite à agir de
manière prosociale (par exemple, faire un don à la charité) pour le restaurer. Le premier essai
vise ainsi à montrer que même si les deux typologies de dégoût sont aversives, elles induisent
des tendances comportementales de consommation inconscientes qualitativement différentes.
Dans le deuxième essai, j'analyse pourquoi les consommateurs réagissent
négativement à la fin des initiatives inconditionnelles de don d'entreprise à consommateur. La
sagesse commune pourrait suggérer qu'après avoir reçu des cadeaux inconditionnels d'une
entreprise (p. Ex. Cadeaux), les consommateurs manifesteraient un sentiment de gratitude et
seraient plus disposés à rendre la pareille, ou du moins moins disposés à nuire à l'entreprise
donatrice. Cependant, je soutiens que les inférences causales causales (c.-à-d., Pourquoi est-
ce que je reçois ces cadeaux?) Que font les consommateurs lorsque des entreprises font
quelque chose sans fournir d'explication motiveront leurs comportements subséquents.
Lorsque les entreprises fournissent des cadeaux inconditionnels de manière répétée et
régulière, elles incitent les consommateurs à déduire qu'elles sont particulières à l'entreprise
et qu'elles méritent de tels dons. De telles déductions de la valeur client déclenchent des
sentiments de droit du client, ce qui, à son tour, provoque des intentions comportementales
négatives de la part des clients lors de la résiliation de cadeaux. Le deuxième essai tente donc
ix
de déterminer si la cessation d'initiatives inconditionnelles de don d'entreprise à
consommateur peut être considérée comme un stimulus désagréable, plutôt qu'un événement
neutre, qui induit un changement inattendu dans le comportement des clients pour contrer son
aversion.
Enfin, dans le troisième essai, j'aborde la question importante de la solitude croissante
des consommateurs, et de la façon dont la solitude peut changer leur perception de savoir si
les interactions haptiques avec d'autres individus ou objets sont considérées comme aversives
ou plaisantes. La sagesse commune pourrait suggérer que lorsque les individus se sentent
seuls, être touché par une autre personne serait perçu comme une forme agréable de
reconnexion sociale. En conséquence, de nombreux produits et services impliquant le toucher
sont commercialisés aujourd'hui pour guérir ce qui peut être considéré comme une épidémie
de solitude moderne (par exemple, des chaises câlin, des cliniques de câlins). En outre, la
recherche sur le toucher dans divers domaines, y compris le comportement des
consommateurs, a montré qu'elle favorise de nombreux effets positifs tels que l'augmentation
des affects positifs, l'augmentation de la persuasion et de la compliance, l'augmentation de
l'ocytocine. d'inclusion sociale. Par conséquent, il est logique de penser que la plupart des
gens devraient accueillir des expériences haptiques, et que les spécialistes du marketing
devraient s'efforcer de les fournir. Cependant, la littérature sur la solitude fournit des résultats
mitigés, rapportant des cas d'individus isolés cherchant et évitant les reconnexions sociales.
Par conséquent, nous postulons et testons que lorsque les individus ne cherchent pas à se
reconnecter socialement, comme lorsqu'ils sont chroniquement plutôt que solitaires, ils
percevront le contact interpersonnel comme étant aversif plutôt que plaisant et thérapeutique.
Les trois essais contribuent à la littérature sur les émotions, les menaces identitaires et
la consommation compensatoire, à la littérature sur la promotion des ventes et à la littérature
sur la solitude. De plus, les résultats de la recherche éclairent les pratiques de marketing dans
x
les domaines de la publicité, de la promotion des ventes et de l'haptique des consommateurs.
Enfin, cette recherche donne un aperçu du bien-être du consommateur en attirant l'attention
sur les conséquences imprévues des actions des marketers qui cherchent à bénéficier aux
consommateurs, mais qui génèrent plutôt des comportements compensatoires pour faire face
à leur aversion.
ESSAI 1. Quand le dégoût vous met à terre: l'effet de l'exposition au dégoût sur
l'identité des consommateurs et la consommation compensatoire
Les consommateurs font régulièrement face à des images dégoûtantes, que ce soit de
la publicité de produits (produits d'hygiène, par exemple), des messages d'intérêt public
(campagnes antitabac) ou des expériences de consommation (par exemple, des chambres
d'hôtel sales). L'utilisation d'images fortes et choquantes est répandue dans la pratique
publicitaire, mais presque toutes les preuves qui sont prises en compte pour évaluer son
efficacité sont soit anecdotiques, soit liées à attirer l'attention des consommateurs. Pour briser
le fouillis publicitaire, les marketeurs visent à choquer leur public en portant attention à leurs
messages en utilisant des images fortes qui sont en contradiction avec les normes sociétales
(par exemple, shockvertising, Dahl, Frankenberger, & Manchanda, 2003). Cette pratique est
si répandue que les consommateurs se plaignent souvent auprès des autorités de régulation de
l'agressivité des messages publicitaires. Par exemple, en Europe uniquement, selon le rapport
2016 de l'Alliance européenne pour les normes publicitaires (AESA) sur les tendances en
matière de plaintes publicitaires, les plaintes liées au goût et à la décence représentaient 37%
des plaintes déposées en 2016 (24 065 plaintes). De plus, les plaintes relatives au goût et aux
bonnes mœurs ont continué d'augmenter régulièrement depuis 2012, par rapport à d'autres
types de plaintes.
xi
Même si le shockvertising est répandu et de plus en plus utilisé, son efficacité n'a
jamais été démontrée empiriquement dans la littérature marketing, et les chercheurs ont
appelé à l'examen des facteurs modérateurs possibles (Bushman et Lull, 2015; Peters, Ruiter,
2016; & Kok, 2013, Witte et Allen, 2000). Nous pensons que l'une des raisons de l'absence
de conclusion est que l'efficacité a souvent été mesurée en termes d'attractivité et de bruit
social plutôt qu'en termes de comportement suscité (Brown, Bhadury, & Pope, 2010, Sabri,
2012).
De plus, différentes typologies d'éliciteurs choquants étaient souvent considérées
comme homogènes, au lieu d'être classées en fonction de l'émotion spécifique qu'elles
suscitaient (par exemple, le dégoût, l'indignation morale, la peur, Dahl et al., 2003, Morales,
Wu et Fitzsimons, 2012). Finalement, même lorsque des efforts ont été faits pour distinguer
les différentes émotions suscitées et mesurer le comportement réel, le comportement mesuré
était la conformité au message lui-même, laissant d'autres comportements conscients ou
inconscients inexplorés (Dahl et al., 2003, Morales et al. 2012, Scudder & Mills, 2009).
Dans l'ensemble, ces lacunes limitent la compréhension des conséquences que les
images choquantes utilisées dans les messages publicitaires ont sur les consommateurs. Pour
combler cette lacune, nous postulons qu'il est important de : 1) faire la distinction entre les
différentes émotions utilisées dans le choc et, en particulier, entre les éliciteurs de dégoût
physique et moral; et 2) explorer toutes les typologies de tendances comportementales qui
peuvent découler de l'exposition à des images fortes, non seulement la conformité des
messages, mais aussi des réponses comportementales inconscientes déclenchées par
l'aversion de l'image.
La distinction entre différents éliciteurs est particulièrement importante parce que le dégoût
est souvent utilisé pour choquer, et bien que la recherche sur le consommateur ait
généralement considéré le dégoût comme une émotion homogène (Morales et al., 2012)
xii
(Morales et al., 2012). La recherche psychologique l'a longtemps considérée comme une
émotion hétérogène (Olatunji, 2008, Rozin, Haidt et McCauley, 2008). La recherche a
identifié deux types de dégoût: le dégoût physique et le dégoût moral (Lee et Ellsworth, 2013,
Marzillier, 2004). Le dégoût physique est provoqué par des stimuli qui provoquent la peur de
l'incorporation orale (par exemple produits corporels, cafards), tandis que le dégoût moral
apparaît lorsque les individus sont confrontés à des comportements jugés socialement ou
moralement inacceptables (racisme, inceste). Étant donné que les émotions distinctes ont des
effets différents sur les cognitions, les motivations et les comportements, il est probable que
différents types de dégoût produisent aussi des types de réponses comportementales
nettement différents.
De plus, considérer toutes les tendances comportementales que produisent les images
choquantes aidera à clarifier l'impact de la surenchère sur les consommateurs au-delà de la
simple prise de conscience, de la mémorisation et de la conformité. Il est important d'explorer
si les images aversives déclenchent des comportements inconscients et comment cette
aversion menace le sentiment de soi des consommateurs. Il y a de plus en plus de preuves que
les émotions et le sentiment de soi sont intimement liés. Par exemple, la recherche a montré
que ce que nous sommes peut définir les émotions avec lesquelles nous sommes plus ou
moins en accord (Coleman et Williams, 2013, 2015, Morales et Wu, 2012). Si des
événements émotionnels tels que l'exposition à une publicité choquante sont perçus comme
aversifs et menaçants pour notre sens de soi, ils provoqueront des comportements
compensatoires inconscients. Par conséquent, la mesure dans laquelle une publicité aboutira
au comportement souhaité du consommateur dépendra aussi de l'aspect menacé du soi qui
déclenche la réponse.
Pour tester nos hypothèses, nous avons mené une série de huit études utilisant
plusieurs manipulations et mesures. Le plan de conception expérimental était le même pour
xiii
les huit études. Les participants ont été assignés au hasard à revoir une série de stimuli
(images ou vidéos, IV) prétestés pour susciter des sentiments neutres (groupe témoin) ou des
sentiments de dégoût physique ou moral (groupes expérimentaux). Par la suite, ils ont
rapporté ce qu'ils ressentaient en examinant les stimuli (dégoûtés, moralement indignés,
tristes, craintifs, en colère, etc.) ou ils ont répondu à des questions bidon concernant les
stimuli (goût, nouveauté, etc.). Enfin, les participants ont complété une étude ostensiblement
indépendante dans laquelle nous avons mesuré la mesure dans laquelle ils ont compensé leur
besoin d'énergie menacé (via une consommation ostentatoire ou statutaire) et leur
appartenance (via un comportement d'aide).
En analysant nos résultats, nous avons suivi un modèle méta-analytique à effets
aléatoires. Un modèle à effets aléatoires, différent d'un modèle à effets fixes, est le plus
approprié lorsque le but de la méta-analyse est de généraliser les résultats au-delà de
l'ensemble des études analysées, et lorsque les chercheurs supposent qu'il n'y a pas de taille
d'effet unique, mais ces tailles d'effet à étude unique représentent un échantillon aléatoire tiré
d'une distribution des tailles d'effet (Borenstein, Hedges, Higgins et Rothstein, 2010,
Tufanaru, Munn, Stephenson et Aromataris, 2015). Étant donné que nous cherchons à
généraliser nos résultats au-delà des études que nous avons analysées et que nous avons
utilisé plusieurs opérationnalisations de variables indépendantes et dépendantes, nous
analysons nos tailles d'effets au niveau d'un modèle à effets aléatoires.
Nous avons combiné nos études en utilisant une méta-analyse de variance inverse
avec Revman version 5.3, et nous avons calculé la différence moyenne pondérée standardisée
(SMD) entre les groupes expérimentaux et témoins avec son intervalle de confiance à 95%.
Nous avons effectué les analyses pour l'effet de compensation de la menace de puissance de
l'exposition au dégoût physique et pour l'effet de compensation de la menace d'appartenance
de l'exposition au dégoût moral.
xiv
Nos résultats suggèrent que l'exposition au dégoût physique et le dégoût moral
suscitent différents comportements compensatoires. Spécifiquement, nos résultats confirment
que l'exposition au dégoût physique augmente la tendance à s'engager dans des
comportements de compensation de la menace de puissance tandis que l'exposition au dégoût
moral augmente la tendance à s'engager dans des comportements de compensation de la
menace d'appartenance. Notre approche méta-analytique indique également que ces résultats
sont stables à travers une variété de techniques d'élicitation des émotions (images, vidéos,
vignettes écrites) et à travers une variété d'opérationnalisations variables dépendantes à la fois
pour le pouvoir (c.-à-d. produits, échelle de consommation ostentatoire, préférence pour les
logos de marque plus grands) et appartenance (c.-à-d. comportement aidant, probabilité et
montant des dons de bienfaisance) compensation.
ESSAI 2. Trop gâté: cadeaux inconditionnels d'entreprise à consommateur (B2C) et
intentions comportementales négatives
Les cadeaux inconditionnels d'entreprise à consommateur (B2C) sont définis comme
des cadeaux que les entreprises offrent à leurs clients, qu'ils aient ou non déployé des efforts
pour les obtenir (Beltramini, 1992, 2000, Otnes et Beltramini, 1996). En d'autres termes, ce
sont des cadeaux spontanés que les entreprises offrent inconditionnellement à leurs clients,
c'est-à-dire sans critères d'admissibilité préétablis ou demande explicite de réciprocité (p.
«Voici un dessert gratuit avec dîner» contre «obtenez un dessert gratuit si vous commandez
plus de 50 $ » ou « obtenez un dessert gratuit si vous passez trois commandes dans les deux
mois »). Il n'est pas rare que les entreprises offrent des marques d'appréciation à leurs clients
même s'ils ne souscrivent pas à un programme de fidélité spécifique et même s'ils n'ont pas
acheté une certaine quantité de produits ou de services. Un don de ce genre peut être
xv
considéré comme une forme d'échange social, par opposition à un échange économique, et
théoriquement devrait être plus efficace pour susciter des sentiments de gratitude, stimuler la
réciprocité et établir des relations durables (Henderson, Beck, & Palmatier, 2011, Morales,
2005, Palmatier, Jarvis, Bechkoff et Kardes, 2009).
Une étude récente d'Accenture aux États-Unis rapporte que «Recevoir des marques
d'affection» est le troisième facteur, après «Brands protégeant leurs informations
personnelles» et «Brands respectant leur temps», influençant la fidélité à la marque. De plus,
le sondage révèle que 59% des consommateurs américains se sentent fidèles aux marques qui
leur présentent de petites marques d'affection, comme des rabais personnalisés, des cartes-
cadeaux et des offres spéciales pour récompenser leur fidélité (Accenture, 2016). Cependant,
des recherches antérieures ont montré que le traitement spécial du client pourrait également
entraîner des conséquences négatives injustifiées. Les clients gâtés développent un sens
dangereux des droits qui augmente les coûts, diminue les bénéfices et provoque des
comportements contraires à l'éthique (Polyakova, Ordanini, & Estes, 2014, Wetzel,
Hammerschmidt & Zablah, 2014). Malgré ces premières études examinant la relation entre
les efforts relationnels des entreprises et les droits des clients, notre compréhension de la
raison et de la façon dont les droits des clients prennent naissance dans ces contextes
promotionnels reste limitée. Nous nous appuyons sur la théorie de l'attribution (Folkes, 1988,
Kelley, 1967, 1973) pour affirmer et démontrer que, même s'ils sont donnés sans condition,
les clients ont droit à des cadeaux d'entreprise à consommateur lorsqu'ils sont valables et
lorsqu'ils sont fournis régulièrement. base prévisible. Nous trouvons trois conditions limites
qui, avec nos résultats empiriques supplémentaires, nous permettent de fournir des
informations managériales exploitables pour aider les entreprises à empêcher les clients
d'avoir droit à leurs initiatives de dons.
Une autre question qui reste inexplorée par la littérature existante sur les cadeaux
xvi
d'affaires est ce qui se passe lorsque les entreprises mettent fin à des initiatives de dons. En
dépit de l'utilisation accrue des cadeaux, des remises d'anniversaire, de la livraison gratuite et
d'autres formes de cadeaux inconditionnels d'entreprise à consommateur régulièrement
donnés par des entreprises sans minimum d'achat (par exemple, Sephora Free Make Overs,
Krispy Kream Free Donut Day, Ateliers pour enfants à Home Depot), et malgré les
acclamations grandissantes pour de telles actions marketing dans la presse populaire (Alton
2016, Fasig 2015, Ferdman 2015, Hall 2013 et White 2013), aucune recherche n'a examiné ce
qui arrive quand les entreprises décident de cesser de donner gratuitement cadeaux.
Nous pensons que cette question n'est pas anodine car une tendance mondiale à la
cessation de l'escalade promotionnelle et à la redéfinition des budgets promotionnels est en
train d'émerger (Eales, 2016, IEG, 2017). En outre, il est courant pour les entreprises de
mettre fin aux dons et autres efforts promotionnels lorsque l'offre devait être pour une durée
limitée. Contrairement aux programmes de fidélisation pour lesquels les entreprises doivent
utiliser une stratégie de sortie (par exemple, une date pour racheter les points restants) pour
s'assurer que leurs clients ne réagiront pas négativement à sa résiliation (Melnyk & Bijmolt,
2015; pourrait supposer à tort que mettre fin à des cadeaux inconditionnels d'entreprise à
consommateur ne nécessite pas une stratégie formelle de résiliation en raison de la nature
inconditionnelle du cadeau. Lorsque les efforts promotionnels des entreprises sont basés sur
des exigences de programmes de fidélisation que les clients remplissent et leur
communiquent clairement (p. Ex., La collecte de 100 points donne accès à la zone VIP), les
clients ont le sentiment de mériter un traitement spécial en raison de leur loyauté ou actions
énergiques. Il est moins clair de savoir si les clients ont le sentiment que les entreprises leur
offrent des cadeaux inconditionnels sans expliquer le but ou les limites de la promotion. Le
bon sens suggère que les clients qui n'ont rien à faire pour obtenir un avantage ne devraient
pas croire qu'ils le méritent et ne devraient donc pas réagir négativement à la fin de
xvii
l'initiative.
S'il n'est pas testé empiriquement, l'hypothèse selon laquelle aucune stratégie de
résiliation n'est requise peut être extrêmement dangereuse pour les entreprises. Des preuves
anecdotiques suggèrent que la fin des initiatives promotionnelles peut générer une grande
variété de comportements de représailles négatifs des clients. Par exemple, lorsque Subway a
mis fin à son initiative Sub Club, les clients se sont déchaînés contre des employés, ont lancé
une pétition en ligne et se sont plaints sur leurs blogs personnels (Ogles, 2005). Plus
récemment, les changements apportés par Starbucks à son programme de récompenses ont
provoqué l'indignation de ses clients, en particulier ceux de niveau or, qui ont protesté sur
Twitter et annoncé publiquement leurs intentions de passer à la concurrence (Mezzofiore,
2016). Notre étude comble cette lacune et élargit la littérature antérieure en examinant l'effet
de la cessation inconditionnelle d'initiatives de don d'entreprise à consommateur sur les
tendances comportementales négatives des clients envers les entreprises. Nous constatons que
lorsque les clients ont droit aux dons inconditionnels des entreprises et que les entreprises
mettent fin à leurs initiatives de dons, les clients affichent des tendances comportementales
négatives envers l'entreprise qui les a gâtés. Par exemple, nous montrons que les clients qui se
sentent lésés expriment leur volonté de représailles contre l'entreprise en cessant d'acheter le
produit ou le service, en achetant ailleurs, en répandant un bouche-à-oreille négatif et même
en déposant des plaintes directes (Grégoire et Fisher, 2008; Huefner & Hunt, 2000).
Une série de quatre études examine ce qui se passe lorsque les clients ne reçoivent
plus de cadeaux inconditionnels et constate que les clients expriment en effet des intentions
comportementales négatives envers les entreprises. Les deux premières études se concentrent
sur la découverte des antécédents du droit du client dans le contexte de la distribution
inconditionnelle de cadeaux d'entreprise à consommateur. Les études 1 et 2 démontrent que
seuls les clients qui reçoivent régulièrement et à plusieurs reprises des cadeaux
xviii
inconditionnels de valeur développent un sentiment de droit. Dans l'étude 3, nous validons
que la régularité est un antécédent important du droit du client, mais nous démontrons
également que le renforcement de la gratitude des clients peut contrecarrer les intentions
négatives des clients suite à la résiliation inconditionnelle des dons. Enfin, en approfondissant
le processus d'admissibilité des clients, nous montrons dans l'étude 4 que les clients ont droit
à des cadeaux qu'ils ne gagnent pas parce qu'ils en déduisent qu'ils sont précieux pour
l'entreprise. Avec une moderation-of-process design, nous montrons que lorsque les clients
sont explicitement informés par le cabinet que les critères de sélection des destinataires ne
sont pas liés à la valeur du client, ils ne se sentent plus autorisés ou affichent des intentions
comportementales négatives.
ESSAI 3. Tu ne peux pas me toucher: l'effet de la solitude sur la préférence pour les
expériences de consommation haptique
Nous vivons dans une ère de «connectivité» et de «réseautage social» dans laquelle la
personne moyenne passe 135 minutes par jour sur les médias sociaux (GlobalWebIndex
2017). Néanmoins, l'épidémie de solitude moderne et ses conséquences néfastes sur la santé
et le bien-être sont un sujet de plus en plus discuté dans tous les grands médias (Irving 2018,
Klinenberg 2018, Noack 2018). Même si les médias sociaux visent à connecter les gens, il est
possible qu'ils fassent exactement le contraire. D'après les médias, il semble que les pays pour
lesquels l'épidémie de solitude est la plus forte sont ceux qui ont le plus recours aux médias
sociaux, et que le groupe d'âge le plus touché par la solitude est celui des jeunes.
Conformément à cette observation, un nombre croissant d'études examinant les conséquences
négatives de l'utilisation des technologies numériques et des médias sociaux indiquent que la
solitude est fortement corrélée au temps passé sur ces plateformes (Pepper et Harvey, 2018,
xix
Primack et al., 2017). Étant donné que cette tendance technologique et sociétale est peu
susceptible d'être inversée, il est important d'étudier la solitude, son fonctionnement et ses
conséquences en aval pour la consommation.
La solitude est une émotion négative aversive, et de nombreuses études ont montré
que la consommation de certains biens pouvait aider à l'atténuer (Mourey et al., 2017, Troisi
et Gabriel 2011, Zhou et al., 2008). Habituellement, on recherche des produits et des services
qui assurent une sorte de reconnexion sociale (Chen et al., 2017, Lastovicka et Sirianni, 2011,
Wang et al., 2012). Une autre voie possible de reconnexion sociale, qui est au centre de cette
recherche, pourrait être le contact interpersonnel. La recherche montre que le toucher
interpersonnel favorise de nombreux résultats positifs, tels que l'augmentation des affects
positifs, l'augmentation de la persuasion et de l'observance, l'augmentation de l'ocytocine
(«l'hormone câline») et le rappel de l'inclusion sociale (Gallace et Spence 2010). Dans la
présente recherche, nous nous concentrons sur les expériences de consommation haptique en
tant que moyen pour les consommateurs de parvenir à la reconnexion sociale. Haptique est
défini comme quelque chose relatif ou basé sur le sens du toucher, et donc nous nous
concentrons sur toutes les activités de consommation qui favorisent ou ont une composante
de contact interpersonnel (par exemple, obtenir un vêtement sur mesure).
Parallèlement à l'épidémie de solitude, les preuves suggèrent que les gens sont
également confrontés à une crise du toucher, ce qui signifie que les interactions modernes
entre les individus manquent d'une composante de contact interpersonnel (Cocozza 2018).
Cependant, les êtres humains ont un besoin inhérent de toucher interpersonnel et de
connectivité sociale qui commence à l'enfance (Gallace et Spence 2010). Par conséquent,
pour combler ce besoin humain frustré de toucher et de connectivité, des produits et des
services de consommation offrant des expériences haptiques sont de plus en plus offerts sur le
marché. Un exemple de produit est Quoobo, est un robot thérapeutique en forme de coussin
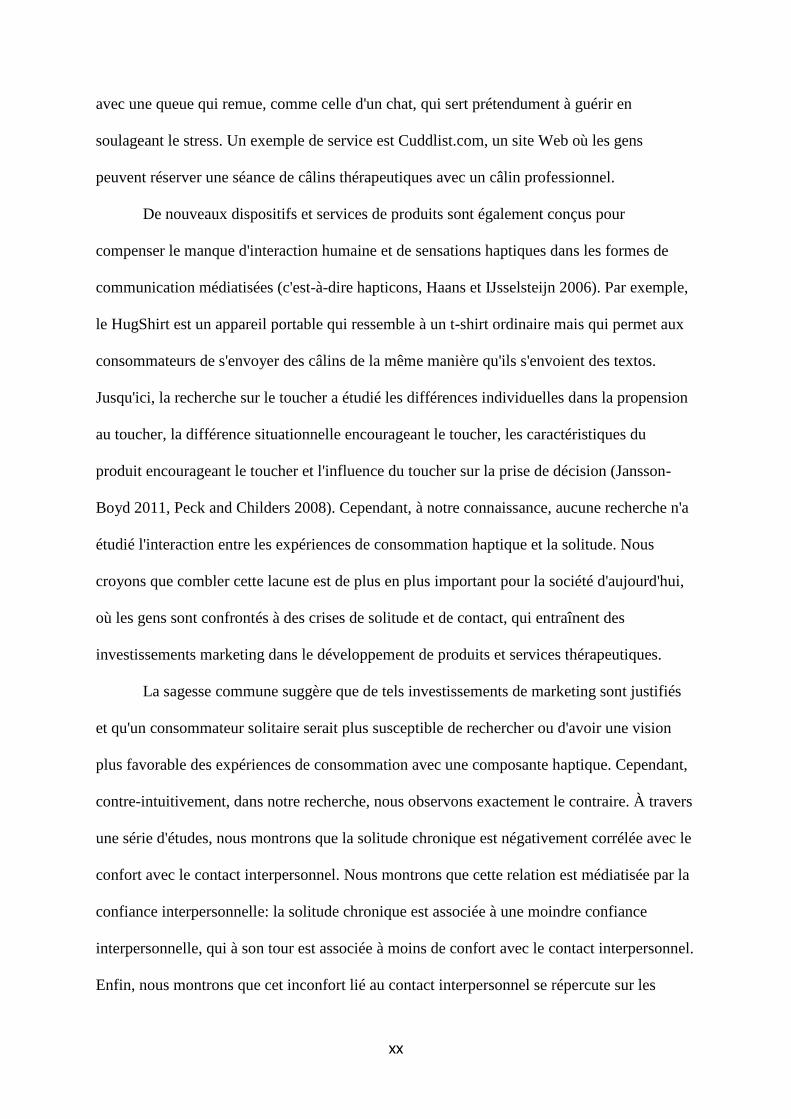
xx
avec une queue qui remue, comme celle d'un chat, qui sert prétendument à guérir en
soulageant le stress. Un exemple de service est Cuddlist.com, un site Web où les gens
peuvent réserver une séance de câlins thérapeutiques avec un câlin professionnel.
De nouveaux dispositifs et services de produits sont également conçus pour
compenser le manque d'interaction humaine et de sensations haptiques dans les formes de
communication médiatisées (c'est-à-dire hapticons, Haans et IJsselsteijn 2006). Par exemple,
le HugShirt est un appareil portable qui ressemble à un t-shirt ordinaire mais qui permet aux
consommateurs de s'envoyer des câlins de la même manière qu'ils s'envoient des textos.
Jusqu'ici, la recherche sur le toucher a étudié les différences individuelles dans la propension
au toucher, la différence situationnelle encourageant le toucher, les caractéristiques du
produit encourageant le toucher et l'influence du toucher sur la prise de décision (Jansson-
Boyd 2011, Peck and Childers 2008). Cependant, à notre connaissance, aucune recherche n'a
étudié l'interaction entre les expériences de consommation haptique et la solitude. Nous
croyons que combler cette lacune est de plus en plus important pour la société d'aujourd'hui,
où les gens sont confrontés à des crises de solitude et de contact, qui entraînent des
investissements marketing dans le développement de produits et services thérapeutiques.
La sagesse commune suggère que de tels investissements de marketing sont justifiés
et qu'un consommateur solitaire serait plus susceptible de rechercher ou d'avoir une vision
plus favorable des expériences de consommation avec une composante haptique. Cependant,
contre-intuitivement, dans notre recherche, nous observons exactement le contraire. À travers
une série d'études, nous montrons que la solitude chronique est négativement corrélée avec le
confort avec le contact interpersonnel. Nous montrons que cette relation est médiatisée par la
confiance interpersonnelle: la solitude chronique est associée à une moindre confiance
interpersonnelle, qui à son tour est associée à moins de confort avec le contact interpersonnel.
Enfin, nous montrons que cet inconfort lié au contact interpersonnel se répercute sur les
xxi
interactions en magasin avec les vendeurs et les autres clients, de sorte que les
consommateurs solitaires chroniques évitent plutôt que de rechercher des situations
impliquant un contact interpersonnel.
Nous montrons que les consommateurs solitaires chroniques évitent les expériences
de consommation haptiques, et qu'ils le font parce qu'ils manquent de confiance
interpersonnelle, ce qui abaisse leur confort avec le toucher interpersonnel plus généralement.
Au cours de trois études, nous avons trouvé des appuis pour deux de nos trois hypothèses, et
nous pouvions reproduire régulièrement nos résultats en utilisant différentes mesures
d'expériences haptiques en magasin. Malheureusement, nous n'avons pas été en mesure de
soutenir notre différence hypothétique entre les consommateurs solitaires chroniquement et
solitaires situationnellement. Nous avons postulé que l'effet négatif de la solitude sur les
attitudes vis-à-vis des expériences de consommation haptiques ne serait valable que pour les
individus solitaires chroniques en raison de leur hypervigilance envers les opportunités de
reconnexion sociale les rendant moins confiants envers les autres. Cependant, dans l'étude 2,
notre manipulation de la solitude n'a pas réussi à manipuler de manière significative les
sentiments d'état de solitude des participants et la seconde hypothèse n'a pas pu être testée.
En plus de tester nos hypothèses principales, nos études: 1) ont exploré des
alternatives qui pourraient concurrencer notre théorisation (c.-à-d., Cognitions de
contamination et prise de risque social); 2) a examiné si notre effet était spécifique aux
expériences de consommation haptique ou étendu à d'autres options de reconnexion sociale
que les activités de consommation pouvaient offrir (c.-à-d., produits anthropomorphiques); et
3) ont cherché à savoir si l'effet était spécifique à une certaine typologie de l'interaction
interpersonnelle haptique (c.-à-d., tactile fonctionnel et imposé). Dans l'ensemble, nous avons
trouvé que l'effet négatif de la solitude chronique sur les attitudes vis-à-vis des expériences
haptiques s'explique par la confiance interpersonnelle et le confort avec le contact
xxii
interpersonnel, et il est peu probable que cela s'explique par d'autres pensées anxieuses.
individuels tels que les cognitions de contamination accrue et la prise de risque social réduit.
De plus, nous avons constaté que notre effet ne s'étend pas aux autres options de
consommation qui pourraient agir comme des substituts indirects de la reconnexion sociale
directe tels que les produits anthropomorphiques. Des recherches antérieures ont montré que
les individus solitaires préfèrent les produits anthropomorphiques et les marques (Chen et al
2017, Mourey et al., 2017), mais ces résultats étaient basés sur des procédures expérimentales
qui manipulaient la solitude de l'état plutôt que de mesurer la solitude chronique. rappel
d'exclusion sociale). Les résultats de ces études précédentes confèrent une crédibilité
supplémentaire à notre hypothèse deux (H2), actuellement non testée, car il semble que les
individus en situation chronique chercheront en effet des options de consommation qui
offrent des opportunités de reconnexion (indirectement ou directement).
Conclusion générale
En conclusion, avec mes trois essais, j'examine comment les consommateurs
réagissent aux stimuli aversifs d'une manière qui n'était pas prévue et comment les
caractéristiques des consommateurs pourraient affecter si un stimulus est réputé aversif.
Comprendre ce qui motive les comportements inconscients dans divers domaines de
consommation a des implications importantes sur la manière dont les marketeurs conçoivent
leurs initiatives et sur le bien-être généralisé des consommateurs.
Le premier essai s'est concentré sur la façon dont les sentiments de dégoût physique et
moral peuvent menacer le sentiment de soi d'un consommateur et le motiver à s'engager dans
une consommation compensatoire. À travers une méta-analyse sur papier, basée sur les
résultats de huit expériences individuelles utilisant plusieurs manipulations et mesures, je
xxiii
montre que le dégoût physique diminue le sentiment de pouvoir des consommateurs, ce qui
les incite à consommer des biens ostensibles afin de restaurer leur sentiment de Puissance. En
revanche, le dégoût moral diminue le sentiment d'appartenance des consommateurs, les
poussant à agir de manière prosociale, afin de restaurer leur sentiment d'appartenance. Les
spécialistes du marketing emploient souvent de telles images pour effrayer les
consommateurs ou pour briser le fouillis publicitaire. mes recherches fournissent un nouvel
aperçu des conséquences comportementales subconscientes spécifiques que comportent ces
images aversives.
Le deuxième essai a exploré comment les consommateurs réagissent lorsque les
entreprises cessent de leur offrir des cadeaux inconditionnels. Généralement, les entreprises
gâtent leurs clients pour susciter leur gratitude, mais mes résultats montrent qu'au-delà de la
première fois qu'ils reçoivent un cadeau, un sentiment de droit (c.-à-d. «Je le mérite»)
s'accumule et surmonte la gratitude. Quatre expériences démontrent que la fin des initiatives
inconditionnelles de don d'entreprise à consommateur fait courir aux entreprises un plus
grand risque de représailles de la part des clients qu'elles ont gâchées. Offrir des cadeaux de
valeur à plusieurs reprises et régulièrement augmente le sens des droits des clients, ce qui
déclenche des intentions comportementales négatives envers l'entreprise lorsque les dons se
terminent (par exemple, boycotter, acheter auprès de concurrents, répartir le WOM négatif).
Au-delà de sa contribution théorique, cette recherche offre des aperçus de gestion sur la façon
de concevoir un programme promotionnel qui peut éviter d'augmenter les droits des clients et
d'empêcher les intentions comportementales négatives des clients lors de la résiliation.
Enfin, le troisième essai examine comment la solitude affecte les préférences des
consommateurs pour les produits et services qui nécessitent ou non le contact interpersonnel
et l'interaction (par exemple, obtenir un massage ou faire des achats en ligne). La sagesse
commune pourrait suggérer que le sentiment de solitude inciterait les individus à chercher à
xxiv
se reconnecter avec les autres, notamment en les touchant ou en les touchant. Cependant, je
montre que les individus solitaires chroniques évitent les interactions interpersonnelles
impliquant le toucher. Parce que la solitude chronique crée une boucle de rétroaction négative
qui renforce la solitude, les participants solitaires signalent des niveaux inférieurs de
confiance interpersonnelle et rapportent se sentir moins à l'aise de toucher et d'être touchés
par les autres. Dans le domaine de la consommation, je montre que cet inconfort se répercute
sur l'interaction en magasin avec les vendeurs et les autres clients. Mes conclusions
fournissent des preuves qu'il existe des cas dans lesquels les investissements des marketeurs
dans l'interaction client et les haptiques peuvent être injustifiés.
xxv
Table of Contents
GENERAL INTRODUCTION ................................................................................................ 30
ESSAY ONE When Disgust Puts You Down: The Effect of Disgust Exposure on Consumers’
Identity and Compensatory Consumption ............................................................................... 33
ABSTRACT ......................................................................................................................... 33
INTRODUCTION ................................................................................................................ 34
THEORETICAL BACKGROUND ..................................................................................... 37
METHOD: SINGLE-PAPER META-ANALYSIS (SPM) ................................................. 44
RESULTS............................................................................................................................. 59
GENERAL DISCUSSION ................................................................................................... 67
REFERENCES ..................................................................................................................... 72
APPENDIX .......................................................................................................................... 81
ESSAY TWO Spoiled Rotten: Unconditional Business-to-Consumer Gift-Giving and
Customer Negative Behavioral Intentions ............................................................................... 93
ABSTRACT ......................................................................................................................... 93
INTRODUCTION ................................................................................................................ 94
THEORETICAL BACKGROUND ..................................................................................... 98
STUDY 1: GIFT REPETITION AND PAST PURCHASE FREQUENCY ..................... 112
STUDY 2: GIFT REGULARITY AND GIFT VALUE .................................................... 120
STUDY 3: GIFT REGULARITY AND GRATITUDE BOOST ...................................... 125
STUDY 4: GIFT REPETITION AND SELECTION CRITERIA..................................... 129
GENERAL DISCUSSION ................................................................................................. 134
REFERENCES ................................................................................................................... 142
APPENDIX ........................................................................................................................ 150
ESSAY THREE Can’t Touch Me: The Effect of Loneliness on Preference for Haptic
Consumption Experiences ..................................................................................................... 154
ABSTRACT ....................................................................................................................... 154
INTRODUCTION .............................................................................................................. 155
THEORETICAL BACKGROUND ................................................................................... 157
STUDY 1: CHRONIC LONELINESS, TRUST AND TOUCH ....................................... 164
STUDY 2: CHRONIC VS STATE LONELINESS ........................................................... 172
STUDY 3: TRUST BOOST MODERATION-OF-PROCESS .......................................... 182
GENERAL DISCUSSION ................................................................................................. 188
REFERENCES ................................................................................................................... 194
APPENDIX ........................................................................................................................ 202
GENERAL CONCLUSION .................................................................................................. 225
xxvi
List of Figures
Essay 1. When Disgust Puts You Down: The Effect of Disgust Exposure on Consumers’
Identity and Compensatory Consumption
Figure 1-1. Issues complained about across Europe from 2012 to 2016. Data Source: EASA
European SRO member statistics............................................................................................. 35
Figure 1-2. Examples of shockvertising eliciting physical and moral disgust in various
consumer categories. ................................................................................................................ 39
Figure 1-3. Conceptual Model. ................................................................................................ 44
Figure 1-4. Forest plot of comparisons between the physical disgust and control conditions
for individual operationalizations of power threat compensation. ........................................... 61
Figure 1-5. Forest plot of comparisons between the moral disgust and control conditions for
individual operationalizations of power threat compensation. ................................................ 61
Figure 1-6. Forest plot of comparisons between the physical disgust and control conditions
for individual operationalizations of the independent variable: emotion elicitation with
Videos, Images or Written Vignettes. ...................................................................................... 62
Figure 1-7. Forest plot of comparisons between the moral disgust and control conditions for
individual operationalizations of the independent variable: emotion elicitation with Videos,
Images or Written Vignettes. ................................................................................................... 62
Figure 1-8. Forest plot of comparisons between the moral disgust and control conditions for
individual operationalizations of belongingness threat compensation.. .................................. 64
Figure 1-9. Forest plot of comparisons between the physical disgust and control conditions
for individual operationalizations of belongingness threat compensation. .............................. 65
Figure 1-10. Forest plot of comparisons between the moral disgust and control conditions for
individual operationalizations of the independent variable: emotion elicitation with Videos,
Images or Written Vignettes. ................................................................................................... 66
Figure 1-11. Forest plot of comparisons between the physical disgust and control conditions
for individual operationalizations of the independent variable: emotion elicitation with
Videos, Images or Written Vignettes. ...................................................................................... 67
Essay 2. Spoiled Rotten: Unconditional Business-to-Consumer Gift-Giving and
Customer Negative Behavioral Intentions
Figure 2-1. Theoretical Framework and Overview of the Studies. ....................................... 112
Figure 2-2. Customer negative behavioral intentions are greater in the every-time large gift
condition: Study 2. ................................................................................................................. 122
Figure 2-3. Customer entitlement is greater in the every-time, large gift condition: Study 2.
................................................................................................................................................ 123
Figure 2-4. Customer negative behavioral intentions are greater in the regular pattern
gratitude boost absent condition: Study 3. ............................................................................. 128
Figure 2-5. Study 4, SPSS PROCESS Model 7. ................................................................... 133
Figure 2-6. Moderation effect of selection criterion on customer entitlement at the two levels
of gift repetition. .................................................................................................................... 134
xxvii
Essay 3. Can’t Touch Me: The Effect of Loneliness on Preference for Haptic
Consumption Experiences
Figure 3-1. Conceptual Model and Hypotheses. ................................................................... 164
Figure 3-2. Serial mediation model of chronic loneliness on in-store people interaction,
PROCESS Model 6. ............................................................................................................... 171
Figure 3-3. Serial mediation model of chronic loneliness on in-store product interaction,
PROCESS Model 6. ............................................................................................................... 171
Figure 3-4. Serial mediation model of chronic loneliness on in-store people interaction,
PROCESS Model 6. ............................................................................................................... 179
Figure 3-5. Serial mediation model of chronic loneliness on in-store product interaction,
PROCESS Model 6. ............................................................................................................... 181
Figure 3-6. Moderated mediation model of chronic loneliness on comfort with in-store haptic
interaction, PROCESS Model 8. ............................................................................................ 187
xxviii
List of Tables
Essay 1. When Disgust Puts You Down: The Effect of Disgust Exposure on Consumers’
Identity and Compensatory Consumption.
Table 1-1. Description of Study Characteristics. ..................................................................... 45
Table 1-2. Summary of Emotion Elicitation Stimuli and Procedures. I. ................................. 49
Table 1-3. Post Hoc Achieved Power and Optimal Sample Size Calculations.. ..................... 56
Essay 2. Spoiled Rotten: Unconditional Business-to-Consumer Gift-Giving and
Customer Negative Behavioral Intentions
Table 2-1. Overview of Related Research. ............................................................................ 100
Essay 3. Can’t Touch Me: The Effect of Loneliness on Preference for Haptic
Consumption Experiences
Table 3-1. Factor Analysis In-store Haptic Features Items, study 1. ..................................... 167
Table 3-2. Measured Variables: Correlations and Descriptive Statistics (N = 199). ............. 169
Table 3-3. Factor Analysis In-store Haptic Features Items, study 2. ..................................... 178
Table 3-4. Measured Variables: Correlations and Descriptive Statistics (N =172). .............. 180
Table 3-5. Summary of Main Findings .................................................................................. 191
xxix
List of Appendixes
Essay 1. When Disgust Puts You Down: The Effect of Disgust Exposure on Consumers’
Identity and Compensatory Consumption.
Appendix A. Examples of physically and morally disgusting advertisement. ........................ 81
Appendix B. IAPS Images Used in Studies 1 to 4. .................................................................. 84
Appendix C. Written Vignettes Pretested for and Used in Study 8 (Main Study Vignettes in
Bold). ....................................................................................................................................... 85
Appendix D. Preference for Larger Brand Logos Dependent Variable ................................... 90
Appendix E. Helping Behavior Scenarios ............................................................................... 91
Essay 2. Spoiled Rotten: Unconditional Business-to-Consumer Gift-Giving and
Customer Negative Behavioral Intentions
Appendix A. Customer Negative Behavioral Intentions Scale. ............................................. 150
Appendix B. Study 3 Scenarios. ............................................................................................ 151
Appendix C. Overview of studies main findings. .................................................................. 153
Essay 3. Can’t Touch Me: The Effect of Loneliness on Preference for Haptic
Consumption Experiences
Appendix A. Main Measures Used Study 1 to 3 ................................................................... 202
Appendix B. Ancillary Measures ........................................................................................... 209
Appendix C. Loneliness manipulation used in Study 2 ......................................................... 212
Appendix D. Trust boost manipulation pretest, Study 3 ........................................................ 213
Appendix E. Comfort with in-store haptic interaction measure pretest, Study 3 .................. 218
30
Capitolo 0 GENERAL INTRODUCTION
The Cambridge Dictionary defines aversive as: a) something is to be avoided or feared;
b) an unpleasant stimulus intended to induce a change in behavior. Aversion and aversive stimuli
have been widely studied in psychology especially in the field of behavioral change. In the 1970s
and early 1980s, researchers investigate how they could change individuals’ behavioral patterns
by associating an aversive outcome with a behavior they wished to modify, or by associating a
pleasant outcome with a behavior they wished to reinforce (i.e., behavioral modification therapy,
operant conditioning theory). Building on the evidence gathered in psychology and
psychotherapy that aversive stimuli influence human behavior, in this dissertation I focus on how
aversive stimuli unconsciously change the behavior of consumers. Moving into the consumer
behavior realm, this dissertation examines aversive stimuli that are commonly encountered in
consumption contexts, such as unpleasant emotions and undesired outcomes, that prompt
consumers to react. The present research shows that the way consumers react is mostly
unconscious and often runs counter to what common knowledge would suggest, which makes it
difficult for marketing practitioners to predict and act upon unless uncovered by research.
In the first essay, I examine how aversive emotional experiences can affect consumers’
sense of self and prompt compensatory consumption. Marketing practitioners often use shocking
images to scare consumers into complying with their advertisements’ messages, a practice
commonly referred to as “shockvertising”. Shockvertising images often elicit feelings of physical
and moral disgust, which in psychology, but not in consumer research, have been identified as
two distinct emotions. Building on appraisal theory of emotions, I posit that different emotions
lead to different cognitive appraisals of the emotional event, which in turn will elicit different
behavioral responses. Specifically, I argue that physical disgust decreases consumers’ sense of
31
power, which prompts them to act in a self-focused way to restore it (e.g., consume
conspicuously). In contrast, moral disgust decreases consumers’ feelings of belongingness,
which prompts them to act prosocially (e.g., donate to charity) to restore it. The first essay thus
aims to show that even if both typologies of disgust are aversive, they elicit qualitatively
different unconscious consumer behavioral tendencies.
In the second essay, I analyze why consumers react negatively to the termination of
unconditional business-to-consumer gift-giving initiatives. Common wisdom might suggest that
after having received unconditional gifts from a firm (e.g., freebies), consumers would exhibit
feelings of gratefulness and they would be more willing to reciprocate, or at least less willing to
harm, the donor firm. However, I argue that the causal attributional inferences (i.e., why am I
receiving these gifts?) consumers make when firms do something without providing an
explanation will motivate their subsequent behaviors. When firms provide valuable
unconditional gifts repeatedly and regularly, they prompt consumers to infer that they are special
to the firm and that they deserve such gifts. Such customer value inferences trigger feelings of
customer entitlement, which in turn causes customer negative behavioral intentions upon gift-
giving termination. The second essay thus tests whether the termination of unconditional
business-to-consumer gift-giving initiatives can be regarded as an unpleasant stimulus, rather
than a neutral event, which induces an unexpected change in customers’ behavior to counteract
its aversiveness.
Finally, in the third essay, I address the important issue of consumers being increasingly
lonely, and of how loneliness might change their perception of whether haptic interactions with
other individuals or objects is considered aversive or pleasant. Common wisdom might suggest
that when individuals feel lonely, being touched by another person would be perceived as a
32
pleasant form of social reconnection. Accordingly, many products and services involving touch
are marketed today to cure what can be considered a modern-day loneliness epidemic (e.g., hug
chairs, cuddle clinics). Moreover, research on touch in various fields, including consumer
behavior, has shown that it fosters many positive outcomes such as increasing positive affect,
increasing persuasion and compliance, increasing oxytocin (i.e., “the cuddle hormone”), and
acting as a salient reminder of social inclusion. Therefore, it is logical to think that most
everyone should welcome haptic experiences, and that marketers should strive to provide them.
However, the loneliness literature provides mixed findings, reporting cases of lonely individuals
either seeking and eschewing social reconnections. Consequently, we posit and test that when
individuals are not seeking social reconnection, such as when they are chronically rather than
situationally lonely, they will perceive interpersonal touch as being aversive rather than pleasant
and therapeutic.
The three essays contribute to the literature on emotion, identity threats, and
compensatory consumption, to the literature on sales promotion, and to the literature on
loneliness. Moreover, the research findings inform marketing practice in the fields of advertising,
sales promotions design, and consumer haptics. Finally, this research provides insights into
consumer welfare by bringing attention to the unforeseen consequences of marketers’ actions
that seek to benefit the consumers but instead generate compensatory behaviors to cope with
their aversiveness.
33
Capitolo 1 ESSAY ONE
When Disgust Puts You Down: The Effect of Disgust
Exposure on Consumers’ Identity and Compensatory
Consumption
ABSTRACT
Consumers frequently encounter disgusting images and disgust has been shown to produce a
variety of behavioral responses when used in the context of advertisements or public service
announcements. Building on theories of emotional appraisal and decision-making, we examine
how physical and moral disgust differentially affect consumers’ identity and compensatory
consumption. An internal meta-analysis of eight studies we conducted shows that feelings of
disgust threaten different aspects of self-identity, which in turn trigger various forms of
compensatory consumption. In particular, we hypothesize and find that physical disgust
decreases consumers’ sense of power, which prompts them to act in a self-focused way to restore
it (e.g., consume conspicuously). In contrast, moral disgust decreases consumers’ feelings of
belongingness, which prompts them to act prosocially (e.g., donate to charity). Marketers often
employ disgusting images to break through the advertising clutter or to scare consumers into
doing something (i.e., shockvertising, fear appeals). Our findings suggest that they should
closely evaluate which disgust stimuli to use and the specific subconscious and behavioral
consequences such images elicit.
Keywords: Disgust, identity needs, emotion, compensatory consumption
34
Fear is danger to your body, but disgust is danger to your soul.
-Diane Ackerman
INTRODUCTION
Consumers routinely face disgusting images, whether from product advertising (e.g.,
hygiene products), public service announcements (e.g., anti-smoking campaigns) or consumption
experiences (e.g., dirty hotel rooms). The use of strong and shocking images is widespread in
advertising practice, but almost all the evidence that is considered when evaluating its
effectiveness is either anecdotal or related to grabbing consumers’ attention. To break through
the advertising clutter, marketers aim at shocking their audience into paying attention to their
messages by using strong images that are at odds with societal norms (i.e., shockvertising; Dahl,
Frankenberger, & Manchanda, 2003). This practice is so widespread that consumers often
complain to the regulator authorities about the offensiveness of advertising messages. For
example, in Europe only, according to the 2016 European Advertising Standards Alliance
(EASA) report on trends in advertising complaints, complaints related to taste and decency
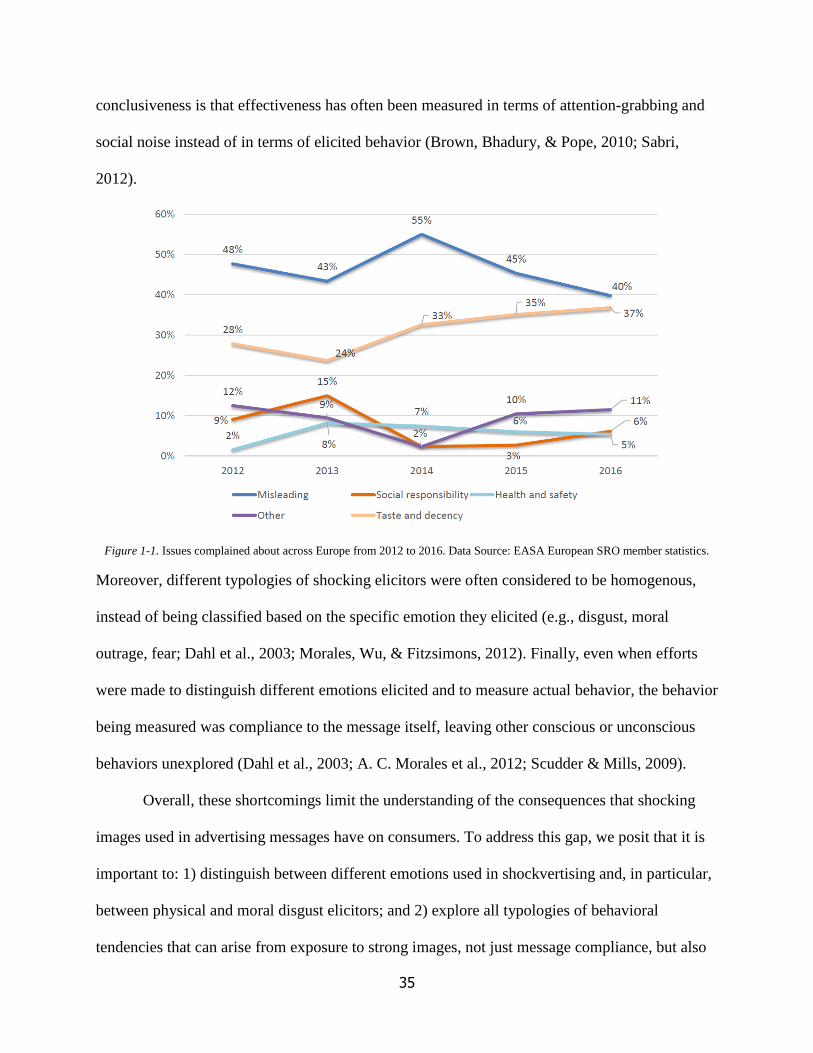
represented of 37% of all complaints filed in 2016 (24,065 complaints)1. Also, as the graph in
Figure 1 shows, taste and decency complaints continued to steadily increase since 2012, as
relative to other types of complaints.
Even if shockvertising is widespread and increasingly used, its effectiveness has never
been conclusively demonstrated empirically in the marketing literature, and scholars have called
for the examination of possible moderating factors (Bushman & Lull, 2015; Huhmann & Limbu,
2016; Peters, Ruiter, & Kok, 2013; Witte & Allen, 2000). We think that one reason for a lack of
1 In 2016, EASA’s network of European self-regulatory organizations (SROs) received and dealt with a total of
65,040 complaints related to 32,797 advertisements. http://www.easa-alliance.org/products-
services/publications/statistics
35
conclusiveness is that effectiveness has often been measured in terms of attention-grabbing and
social noise instead of in terms of elicited behavior (Brown, Bhadury, & Pope, 2010; Sabri,
2012).
Figure 1-1. Issues complained about across Europe from 2012 to 2016. Data Source: EASA European SRO member statistics.
Moreover, different typologies of shocking elicitors were often considered to be homogenous,
instead of being classified based on the specific emotion they elicited (e.g., disgust, moral
outrage, fear; Dahl et al., 2003; Morales, Wu, & Fitzsimons, 2012). Finally, even when efforts
were made to distinguish different emotions elicited and to measure actual behavior, the behavior
being measured was compliance to the message itself, leaving other conscious or unconscious
behaviors unexplored (Dahl et al., 2003; A. C. Morales et al., 2012; Scudder & Mills, 2009).
Overall, these shortcomings limit the understanding of the consequences that shocking
images used in advertising messages have on consumers. To address this gap, we posit that it is
important to: 1) distinguish between different emotions used in shockvertising and, in particular,
between physical and moral disgust elicitors; and 2) explore all typologies of behavioral
tendencies that can arise from exposure to strong images, not just message compliance, but also
36
unconscious behavioral responses that are trigged by image aversiveness.
Distinguishing between different elicitors is particularly important because disgust is
often used to shock, and although consumer research has generally viewed disgust as a
homogeneous emotion (Argo, Dahl, & Morales, 2006; Morales & Fitzsimons, 2007; Morales et
al., 2012), psychological research has long viewed it as a heterogeneous emotion (Olatunji, 2008;
Rozin, Haidt, & McCauley, 2008). Research has identified two typologies of disgust: physical
disgust and moral disgust (Lee & Ellsworth, 2013; Marzillier, 2004). Physical disgust is elicited
by stimuli that bring about fear of oral incorporation (e.g., bodily products, cockroaches),
whereas moral disgust arises when individuals are faced with behaviors that are deemed to be
socially or morally unacceptable (e.g., racism, incest). Given that distinct emotions have
different effects on cognitions, motivations, and behaviors, it is likely that different types of
disgust may produce distinctly different types of behavioral responses as well.
Additionally, considering all behavioral tendencies that shocking images produce will
help clarify the impact that shockvertising has on consumers beyond mere attention-grabbing,
memorability, and compliance. It is important to explore whether aversive images trigger
unconscious behaviors and how this aversiveness threatens consumers’ sense of self. There has
been increasing evidence that emotions and sense of self are interrelated. For example, research
has shown that who we are can define which emotions we are more (or less) attuned to (Coleman
& Williams, 2013, 2015; Morales & Wu, 2012). If emotional events such as being exposed to
shocking advertising are perceived as aversive and threatening to our sense of self, they will
prompt unconscious compensatory behaviors. Therefore, the extent to which an advertisement
will result in the desired consumer behavior will also depend on the threatened aspect of the self
that is triggering the response. Our research tests this proposition and proposes a framework to
37
explain the underlying mechanism. We propose that feelings of disgust may threaten aspects of
self-identity, which in turn trigger various forms of compensatory consumption.
THEORETICAL BACKGROUND
Physical and moral disgust: different emotions, different behaviors
Disgust is a particular emotion that has received significant attention in psychology, but
surprisingly little attention in marketing and consumer research. Generally, disgust is defined as
a feeling of revulsion or strong disapproval aroused by something unpleasant or offensive, and it
is characterized by specific facial expressions (close nostrils, raised upper lip, gaping jaw),
typical withdrawal behaviors (e.g., distancing from object eliciting disgust), and by certain
physiological reactions (e.g., nausea). More specifically, disgust has been defined as “the body
and soul emotion” (Rozin, Haidt, & McCauley, 2005; Rozin et al., 2008). Whereas an
evolutionary account would define it as a basic emotion guarding the body against pathogens and
toxins (e.g. avoidance of rotten foods), a more conceptual one would define it as a complex
emotion that expanded to defend the self from figurative contamination as well (e.g., avoidance
of death thoughts, social deviance).
Although disgust is often thought of as a homogenous construct, research has delineated
different types of disgust. For example, Rozin and colleagues (2005) classify disgust along four
categories: core disgust (e.g., rotten food, bodily products, cockroaches); animal-nature disgust
(e.g., man with exposed intestines, person with poor personal hygiene); interpersonal disgust
(e.g., direct or indirect contact with others that evokes strangeness, disease, misfortune); and
moral disgust (e.g., moral offenses such as racism, murder). These different types of disgust have
been shown to have distinct personality, behavioral, physiological, and clinical correlates
(Olatunji, Haidt, McKay, & David, 2008). For example, in terms of personality traits, only
38
animal-nature and core disgust seem to influence neuroticism whereas all types lead to
behavioral inhibition (i.e., tendency to experience distress and to withdraw from unfamiliar
situations, people, or environments). Additionally, physiological reactions also differ by the type
of disgust elicited. For instance, relative to the other types of disgust, core disgust is more related
to physiological responding on videos depicting vomit, and animal-nature disgust is more related
to physiological responding on videos depicting blood. Finally, sensitivity to one or another type
of disgust correlates with unique clinical symptoms. As an illustration, animal-nature explained
unique variance in blood-injection-injury (BII) phobia, whereas interpersonal disgust predicted
symptoms of contamination-based OCD and fear of animals (Connolly, Olatunji, & Lohr, 2008).
These findings form the basis of our proposition that different types of disgust may produce
qualitatively different responses.
The issue of treating disgust as a homogenous emotion highlighted for consumer behavior
in general, applies also to the usage of different disgust typologies in shockvertising. According
to Dahl and colleagues (2003), there are several typologies of shock appeals that are defined by
the type of elicitor used, namely: 1) disgusting images; 2) sexual references; 3)
profanity/obscenity; 4) vulgarity; 5) impropriety, 6) moral offensiveness; 7) religious taboos.
However, a more appropriate classification, based on the emotional response such elicitors
produce, would be to group “disgusting images” with “vulgarity” as physical disgust elicitors
and to group the remaining ones as moral disgust elicitors. Accordingly, this newly proposed
distinction not only is aligned with the psychology literature findings, but also allows for a better
investigation of the impact of shocking advertising on consumers’ behavior. This ability of better
study the impact of shockvertising derives from the refined conceptualization of elicitors as
similar (i.e., all shocking) but generating distinct emotions (i.e., physical versus moral disgust)
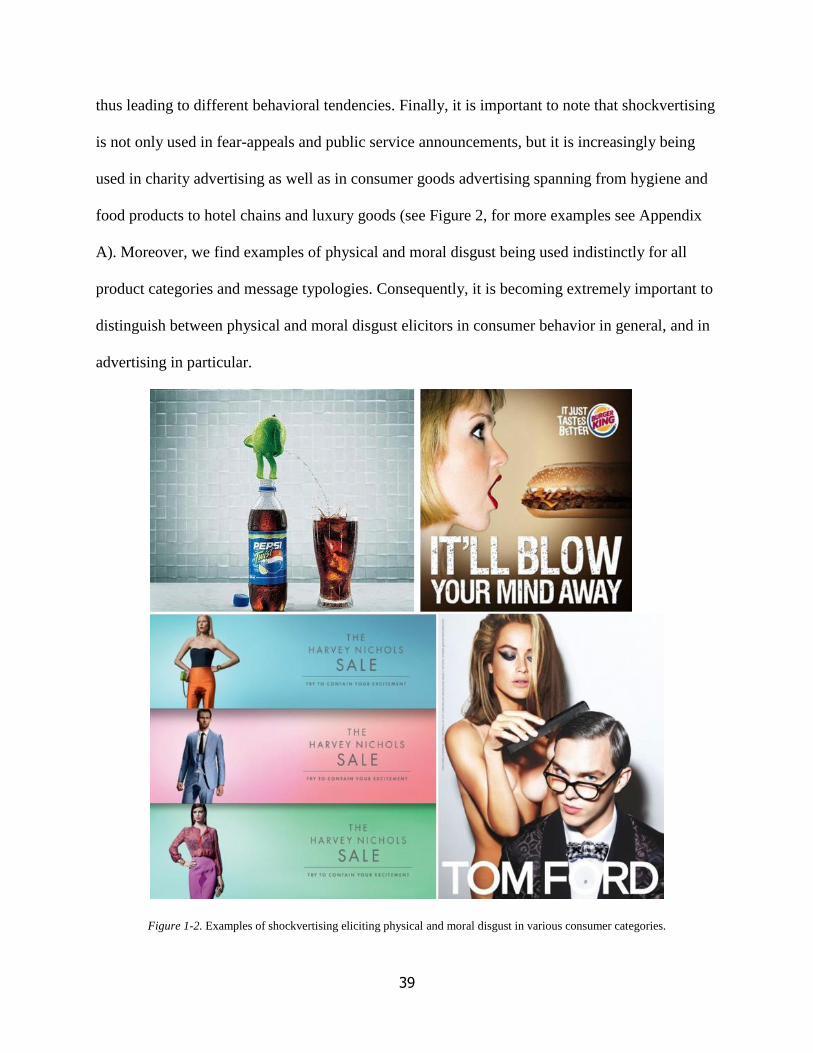
39
thus leading to different behavioral tendencies. Finally, it is important to note that shockvertising
is not only used in fear-appeals and public service announcements, but it is increasingly being
used in charity advertising as well as in consumer goods advertising spanning from hygiene and
food products to hotel chains and luxury goods (see Figure 2, for more examples see Appendix
A). Moreover, we find examples of physical and moral disgust being used indistinctly for all
product categories and message typologies. Consequently, it is becoming extremely important to
distinguish between physical and moral disgust elicitors in consumer behavior in general, and in
advertising in particular.
Figure 1-2. Examples of shockvertising eliciting physical and moral disgust in various consumer categories.
40
Emotions, Self-threats, and Compensatory Consumption
The self is a complex construct. People hold self-views (self-identity) that, despite
situational variations, are relatively stable over time. Moreover, people are motivated to maintain
stable levels of these aspects of self-identity (identity motives; Vignoles, Regalia, Manzi,
Golledge, & Scabini, 2006), which include motives such as self-esteem, belongingness, control,
and a meaningful existence (Williams, 2007). However, at times, certain situations or events can
threaten these motives (e.g., poor performance, rejection by peers, being treated unfairly), and
people generally react by attempting to bolster or repair the aspect of the self that is threatened.
One way in which people may compensate for a particular threat is through consumption (termed
compensatory consumption). For example, when feelings of power are threatened, people may
respond by engaging in conspicuous consumption in an effort to restore their sense of power and
control (Rucker & Galinsky, 2008). Recent research suggests that the responses to such self-
threats depend on which needs are threatened (Lee & Shrum, 2012). For example, when
relational needs are threatened (i.e., self-esteem, belongingness), people compensate by being
more prosocial and affiliative (donate to charities, adjust product preferences to correspond to
peers and partners). In contrast, when efficacy needs are threatened (i.e., power, meaningful
existence), people compensate through conspicuous and status consumption.
Both emotion and self-identity have been widely studied by consumer researchers (Laros
& Steenkamp, 2005; Reed II, Forehand, Puntoni, & Warlop, 2012), but with few exceptions
(Coleman & Williams, 2013, 2015; So et al., 2015), little research has investigated the relations
between them. However, there is reason to think there may be a link. A threat to identity can be
defined as an experience appraised as potentially harmful to the value, meaning, or enactment of
an identity (Lee & Shrum, 2013) and in a similar fashion, situational appraisals can be affected
41
by emotional experiences. In fact, situational appraisals can be shaped by emotional experiences
corresponding to the specific cognitive appraisals that each emotion entails, and in case of
aversive or threatening cognitions, they can signal danger to the sense of self.
The Appraisal-Tendency Framework (ATF; Lerner & Keltner, 2000) posits that emotions
have distinct effects on judgment and decision making, and that specific emotions give rise to
specific cognitive and motivational processes, which account for the effects of each emotion on
the content and depth of subsequent thought. More specifically, emotions differ on cognitive
appraisal dimensions such as certainty, pleasantness, attentional activity, control, anticipated
effort, and responsibility (Smith & Ellsworth, 1985). Appraisal theory also posits that emotions
give rise to implicit cognitive predispositions to appraise future events in line with the central
appraisal patterns that characterize the felt emotion (emotion-to-cognition). For example, those
who experience the emotion of fear may appraise the situation as uncertain (appraisal
dimension), and thus will be less willing to take risks (behavior aligned with appraisal
dimension). Emotion and cognition are inherently integrated, and together they shape the
appraisal of a situation. These appraisals, regardless of their accuracy, influence people’s
appraisals of their ability to cope with events and their consequences (Scherer, 1988, 1999, 2005;
Smith & Lazarus, 1990; Storbeck & Clore, 2007).
Regarding disgust-specific appraisals that serve as basis for our predictions, Lee and
Ellsworth (2013) demonstrated that physical and moral disgust differ on several cognitive
appraisal dimensions, with physical disgust resembling fear (e.g., avoid and comply), and moral
disgust resembling anger (e.g., approach and punish). Drawing on fear’s appraisal structure, we
predict that physical disgust (but not moral disgust) will be associated with situational appraisals
of low power and coping potential (Lerner & Keltner, 2001). In contrast, given the connection of
42
moral disgust with anger, we predict that moral disgust (but not physical disgust) will result in
situational appraisals of low compatibility with moral standards (Roseman, Spindel, & Jose,
1990). The dimensions of coping potential and compatibility with standards are conceptually
related to the self-identity motive of efficacy, which motivates individuals to maintain or
enhance feelings of competence and control, and to the self-identity motive of relatedness, which
drives individuals to maintain or enhance feelings of closeness to others (Vignoles, 2011). In
fact, the appraisal of coping potential is defined as the ability of an individual to cope with an
event, and it is related to various situational elements the individual evaluates (i.e., agent causing
the event, motive of the agent, control, power, adjustment; (Scherer, 1999)). Among those, we
find the one of control that is characterized as the degree to which the individual is able to
control the event and its consequences, and the one of power, which is determined by the degree
to which the individual is able to influence the emotion-eliciting event (Roseman et al., 1990;
Smith & Ellsworth, 1985). According to the Appraisal-Tendency Framework predictions, we
know that fear scores very low on appraisals of power (Lerner & Keltner, 2001; Scherer, 1988).
Thus, we posit that when consumers experience feelings of physical disgust, they will appraise
the situation in a similar way to when they are fearful, which will lead them to experience
appraisals of low coping potential. Those appraisals will in turn threaten their need for power
because people will cognitively assess that they are not in control, and that their coping potential
towards the emotional event is low. Therefore, they will consume products that will help them
restore their need for power, such as conspicuous or status-related products (Rucker & Galinsky,
2008, 2009).
H1. Consumers experiencing physical disgust will engage in power-restoring compensatory
43
consumption.
In contrast, when consumers experience feelings of moral disgust, they will appraise the
situation similarly to when they are angry, which will lead them to experience appraisals of low
compatibility with moral standards. These appraisals, regardless of their accuracy, might lead to
misperceptions that others are offensive, and thus may induce feelings that one does not belong,
negative emotional reactions when one is associated with others, and the desire to distance
oneself from others (Chu, Buchman-Schmitt, Michaels, Ribeiro, & Joiner, 2013). According to
evolutionary theory, the ability and desire to form social connections and to belong are the result
of the processes of natural selection; desire for group membership serves the function of
increasing chances for survival and reproductive suitability (Baumeister & Leary, 1995). When
this need/ability is lacking, such as for those who feel disgusted with others, feelings of
belongingness are diminished (Chu et al., 2013). Therefore, morally disgusted consumers will
behave in a way that will help them restore their belongingness, such as donating to charity or
engaging in helping behavior (Jonas et al., 2002; Lee & Shrum, 2012).
H2. Consumers experiencing moral disgust will engage in belongingness-restoring compensatory
consumption.
A depiction of our conceptual model is presented in Figure 3.
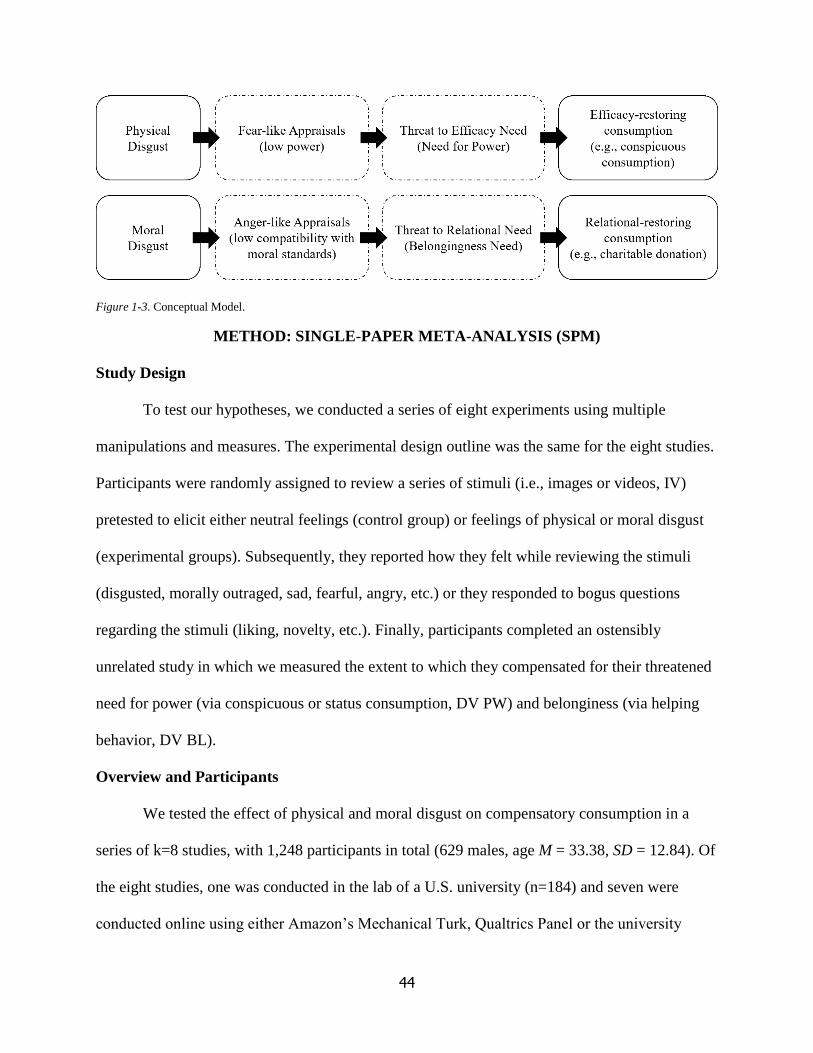
44
Figure 1-3. Conceptual Model.
METHOD: SINGLE-PAPER META-ANALYSIS (SPM)
Study Design
To test our hypotheses, we conducted a series of eight experiments using multiple
manipulations and measures. The experimental design outline was the same for the eight studies.
Participants were randomly assigned to review a series of stimuli (i.e., images or videos, IV)
pretested to elicit either neutral feelings (control group) or feelings of physical or moral disgust
(experimental groups). Subsequently, they reported how they felt while reviewing the stimuli
(disgusted, morally outraged, sad, fearful, angry, etc.) or they responded to bogus questions
regarding the stimuli (liking, novelty, etc.). Finally, participants completed an ostensibly
unrelated study in which we measured the extent to which they compensated for their threatened
need for power (via conspicuous or status consumption, DV PW) and belonginess (via helping
behavior, DV BL).
Overview and Participants
We tested the effect of physical and moral disgust on compensatory consumption in a
series of k=8 studies, with 1,248 participants in total (629 males, age M = 33.38, SD = 12.84). Of
the eight studies, one was conducted in the lab of a U.S. university (n=184) and seven were
conducted online using either Amazon’s Mechanical Turk, Qualtrics Panel or the university
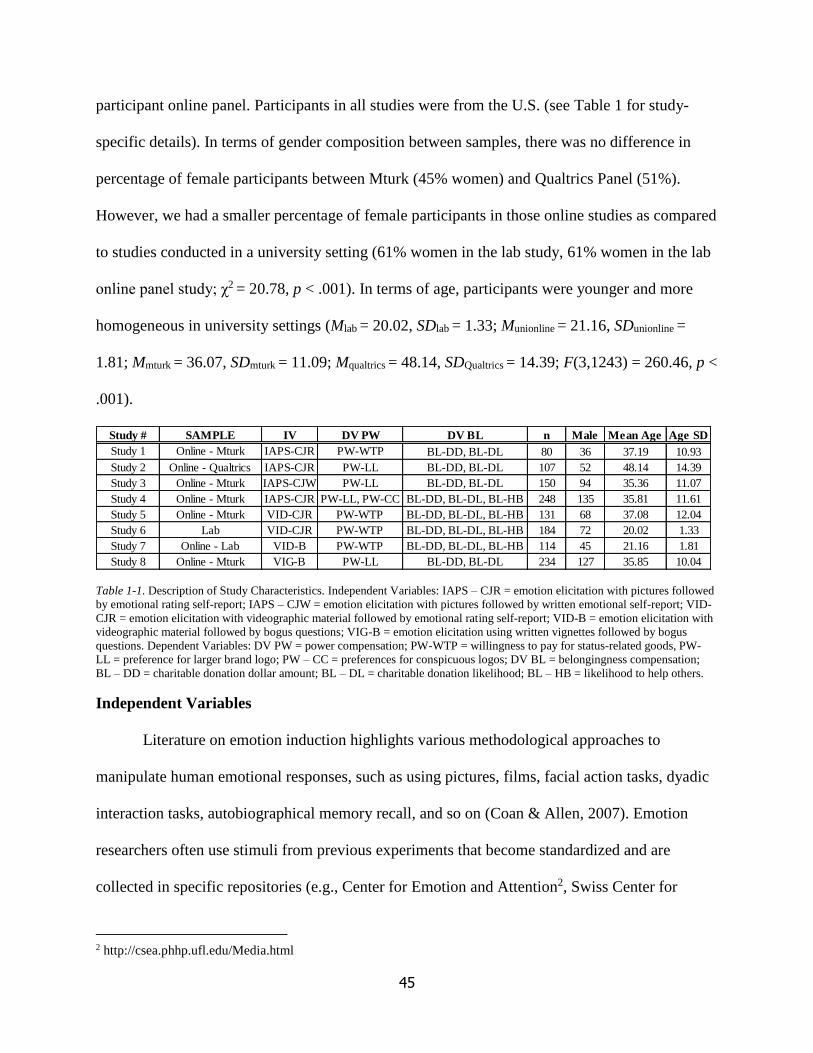
45
participant online panel. Participants in all studies were from the U.S. (see Table 1 for study-
specific details). In terms of gender composition between samples, there was no difference in
percentage of female participants between Mturk (45% women) and Qualtrics Panel (51%).
However, we had a smaller percentage of female participants in those online studies as compared
to studies conducted in a university setting (61% women in the lab study, 61% women in the lab
online panel study; χ2 = 20.78, p < .001). In terms of age, participants were younger and more
homogeneous in university settings (Mlab = 20.02, SDlab = 1.33; Munionline = 21.16, SDunionline =
1.81; Mmturk = 36.07, SDmturk = 11.09; Mqualtrics = 48.14, SDQualtrics = 14.39; F(3,1243) = 260.46, p <
.001).
Table 1-1. Description of Study Characteristics. Independent Variables: IAPS – CJR = emotion elicitation with pictures followed
by emotional rating self-report; IAPS – CJW = emotion elicitation with pictures followed by written emotional self-report; VID-
CJR = emotion elicitation with videographic material followed by emotional rating self-report; VID-B = emotion elicitation with
videographic material followed by bogus questions; VIG-B = emotion elicitation using written vignettes followed by bogus
questions. Dependent Variables: DV PW = power compensation; PW-WTP = willingness to pay for status-related goods, PW-
LL = preference for larger brand logo; PW – CC = preferences for conspicuous logos; DV BL = belongingness compensation;
BL – DD = charitable donation dollar amount; BL – DL = charitable donation likelihood; BL – HB = likelihood to help others.
Independent Variables
Literature on emotion induction highlights various methodological approaches to
manipulate human emotional responses, such as using pictures, films, facial action tasks, dyadic
interaction tasks, autobiographical memory recall, and so on (Coan & Allen, 2007). Emotion
researchers often use stimuli from previous experiments that become standardized and are
collected in specific repositories (e.g., Center for Emotion and Attention2, Swiss Center for
2 http://csea.phhp.ufl.edu/Media.html
Study # SAMPLE IV DV PW DV BL n Male Mean Age Age SD
Study 1 Online - Mturk IAPS-CJR PW-WTP BL-DD, BL-DL 80 36 37.19 10.93
Study 2 Online - Qualtrics IAPS-CJR PW-LL BL-DD, BL-DL 107 52 48.14 14.39
Study 3 Online - Mturk IAPS-CJW PW-LL BL-DD, BL-DL 150 94 35.36 11.07
Study 4 Online - Mturk IAPS-CJR PW-LL, PW-CC BL-DD, BL-DL, BL-HB 248 135 35.81 11.61
Study 5 Online - Mturk VID-CJR PW-WTP BL-DD, BL-DL, BL-HB 131 68 37.08 12.04
Study 6 Lab VID-CJR PW-WTP BL-DD, BL-DL, BL-HB 184 72 20.02 1.33
Study 7 Online - Lab VID-B PW-WTP BL-DD, BL-DL, BL-HB 114 45 21.16 1.81
Study 8 Online - Mturk VIG-B PW-LL BL-DD, BL-DL 234 127 35.85 10.04
46
Affective Sciences3). However, one specific issue that we faced when we wanted to use
standardized elicitation materials from past research repositories is that materials used to elicit
disgust in the past were often meant to elicit only one specific typology, namely physical disgust.
To overcome this problem, we often pre-tested existing materials (i.e., pictures) or we created
our own (i.e., video clips, vignettes) so that we could reliably distinguish between feelings of
physical and moral disgust.
In the present research, we elicited our target emotions using pictures, video clips, and
written vignettes. An important variation that characterizes our manipulations is the extent to
which participants were asked, or not, to reflect on their emotional experience (i.e., producing
cognitive judgments; CJ). In fact, each stimulus was followed by either a cognitive evaluation of
the emotional experience (e.g., “How does the image make you feel?”) or some bogus questions
(e.g., “How informative do you think the content was?”). Previous literature suggests that there is
a difference in brain (i.e., amygdala) activation levels where certain cognitive tasks (e.g., picture
recognition; “have you seen this picture before?”) elicit low activation; making a cognitive
judgment (e.g., rating or categorization; “how does this image make you feel?”) about
the emotional content of the stimuli elicits moderate activation; and simple passive viewing
elicits the most activation (Coan & Allen, 2007; Liberzon et al., 2000). Given that there is no
consensus on which elicitation technique is clearly superior, and given that consumers are likely
to be exposed to a variety of stimuli in real life, we decided to use different approaches
throughout the eight experiments to maximize the ecological validity of our findings. We provide
a general description of each manipulation in the next section.
3 http://www.affective-sciences.org/home/research/materials-and-online-research/research-material/
47
Emotion Elicitation with Pictures
In three studies, we elicited our target emotions using a subset of images from the
International Affective Picture System (IAPS; Lang, Bradley, & Cuthbert, 1999). The IAPS is a
repository of photographs that serve as pre-tested, normative, emotional stimuli and they are
available to researchers upon request. Together with the images, researchers are provided with a
database containing ratings of arousal, valence, and dominance that have been collected for each
individual photograph. According to the pleasure (or valence)–arousal–dominance (PAD or
VAD) model of emotion classification, each emotional experience can be described using three
dimensions: a) valence, defined as how positive/pleasant or negative/displeasing one feels an
experience to be; b) arousal, defined as how energized or soporific one feels; and c) dominance,
described as how controlling and dominant versus controlled or submissive one feels. The IAPS
database contains ratings of these three descriptive dimensions for each individual image so that
researchers can have some normative information about the stimuli they use.
However, given that the IAPS data does not distinguish which specific emotion is being
elicited by which photograph, we first picked a set of images that we deemed disgusting and
neutral only based on the content of the image itself. Afterward, we examined the ratings for
each one, and we identified a subset of images that could be best suited to elicit feelings of
physical disgust and moral disgust (e.g., high arousal, low valence, high dominance) together
with images that could act as controls (e.g., low arousal, medium valence, low dominance).
Finally, we pre-tested 28 images4 that fit our criteria and selected the final ones that we used in
4 We pretested a total of 28 images from the IAPS repository, namely IAPS # 1271, 1274, 2745, 3053, 3064, 3080,
3101, 3103, 3130, 3131, 3160, 3170, 3215, 4621, 7045, 7055, 7059, 7150, 7175, 7705, 9163, 9300, 9321, 9325,
9326, 9414, 9800, 9810. The pre-test was run on Amazon Mturk on a sample of 50 U.S. participants. After viewing
each picture, participants rated on a 7-point scale (1 = not at all, 7 = very much) the extent to which they felt a
specific emotion (i.e., disgusted, angry, fearful, powerful, sad, lonely, morally outraged, nauseated) while viewing it.
We selected the images that best served the purpose of eliciting feelings of physical and moral disgust by calculating
a success index based on standardized scores of emotional intensity and discreteness. Intensity scores are calculated
48
our experiments (see Appendix B). To elicit feelings of physical disgust, we used IAPS #1274,
#9301, and #9321, whereas to elicit feelings of moral disgust, we adopted IAPS #6315, #9163,
#9414, #9800, and #9810. As control stimuli, we employed IAPS #7045, #7055, #7059, #7150,
#7175, and #7705.
Throughout the studies, we varied the subset of images that we used (from a set of three
consecutive pictures with emotionally congruent contents in Study 1 to a single picture in Study
3), we varied the presentation style of the stimuli (consecutive pictures with emotionally
congruent contents or non-consecutive pictures interspersed with neutral ones), and we varied
the task that participants were asked to perform after viewing the stimuli by asking them to
provide a cognitive judgment self-report about their emotional experience by either using a pre-
determined rating scale (IAPS-CJR) or by producing a short written elaboration (IAPS-CJW). In
Study 1, Study 2, and Study 4, as ostensibly part of a study about how people respond to pictures
that represent different life events, participants were shown the target images and rated each on a
7-point scale (1 = not at all, 7 = very much) on the extent to which they felt particular emotions
while viewing them (i.e., grossed out, disgusted, queasy, fearful, angry, mad, furious, morally
outraged, sad, happy, amused, confused). In Study 3, after the stimulus presentation, participants
were asked to briefly describe how the image made them feel. For more information about
specific emotion induction procedures, please refer to Table 2.
as mean report on the target emotions (i.e., disgusted, morally outraged, nauseated) relative to other candidate
images. Discreteness refers to the degree to which participants report feeling the target emotion (i.e., morally
outraged, nauseated) more intensely than all non-target emotions (e.g., angry, sad) and it is calculated percentage of
participants who indicated that they had felt the target emotion at least one point more intensely than other non-
targeted emotions. The success index was computed as the sum of the intensity z-score, derived by normalizing
intensity scores for all comparison images, with each normalized discreteness value relative to all comparison
images.
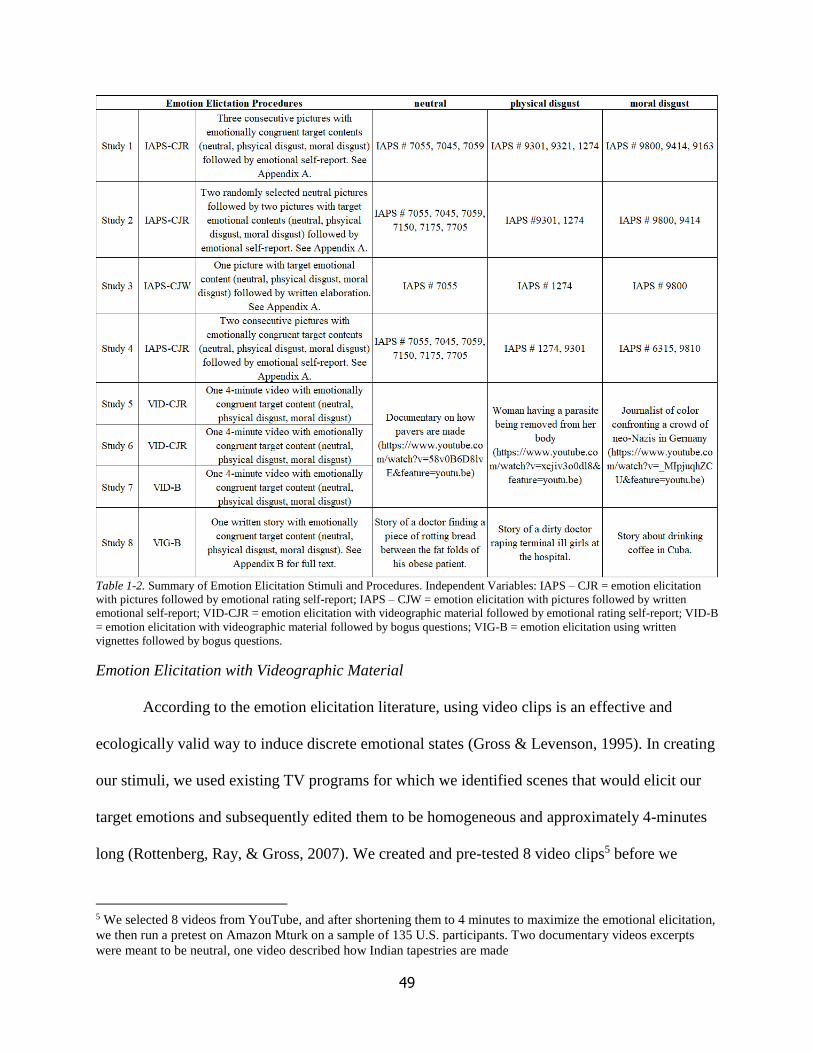
49
Table 1-2. Summary of Emotion Elicitation Stimuli and Procedures. Independent Variables: IAPS – CJR = emotion elicitation
with pictures followed by emotional rating self-report; IAPS – CJW = emotion elicitation with pictures followed by written
emotional self-report; VID-CJR = emotion elicitation with videographic material followed by emotional rating self-report; VID-B
= emotion elicitation with videographic material followed by bogus questions; VIG-B = emotion elicitation using written
vignettes followed by bogus questions.
Emotion Elicitation with Videographic Material
According to the emotion elicitation literature, using video clips is an effective and
ecologically valid way to induce discrete emotional states (Gross & Levenson, 1995). In creating
our stimuli, we used existing TV programs for which we identified scenes that would elicit our
target emotions and subsequently edited them to be homogeneous and approximately 4-minutes
long (Rottenberg, Ray, & Gross, 2007). We created and pre-tested 8 video clips5 before we
5 We selected 8 videos from YouTube, and after shortening them to 4 minutes to maximize the emotional elicitation,
we then run a pretest on Amazon Mturk on a sample of 135 U.S. participants. Two documentary videos excerpts
were meant to be neutral, one video described how Indian tapestries are made
50
selected the final three that we used in our experiments. We used a clip of a TV show on the
story of a woman having a parasite being removed from her body to elicit feelings of physical
disgust6, whereas we used a clip depicting a journalist of color confronting a crowd of neo-Nazis
in Germany7 to elicit feelings of moral disgust. For participants in the control condition, we used
a video clip of a documentary on how pavers are made8. In Study 5 and Study 6, as ostensibly
part of a study about how people respond to scenes they see on TV, participants were shown the
target video clip and rated on a 7-point scale (1 = not at all, 7 = very much) the extent to which
they felt particular emotions while watching it (i.e., grossed out, disgusted, queasy, fearful,
angry, mad, furious, morally outraged, sad, happy, amused, confused). In Study 7, participants
were also told they were taking part in a TV scene evaluation study but, after they watched the
target video clip, they were asked to respond to a series of bogus questions9 that did not require a
cognitive judgment about their emotional experience.
Emotion Elicitation with Written Vignettes
Another common method to elicit disgust, both with and without its moral component, is
(https://www.youtube.com/watch?v=l1mPuvg-jkc&feature=youtu.be) and one video described how pavers are made
(https://www.youtube.com/watch?v=58v0B6D8lvE&feature=youtu.be). Three videos were meant to elicit feelings
of physical disgust, one video was a documentary on food practices that many Westerners would deem “disgusting”
(https://vimeo.com/148216375), another video showed gruesome surgery being performed on a victim of a
motorcycle accident (https://www.youtube.com/watch?v=dET2HF6BSoM&feature=youtu.be), and a third video
told the story of a woman having a parasite being removed from her body
(https://www.youtube.com/watch?v=xcjiv3o0dl8&feature=youtu.be). Three videos were meant to elicit feelings of
moral disgust, one video was about neo-Nazis’ violence in general (https://www.youtube.com/watch?v=hW-
U7jz7WAQ&feature=youtu.be), another video depicted neo-Nazis verbally abusing a journalist of color
(https://www.youtube.com/watch?v=_MIpjuqhZCU&feature=youtu.be) and finally a video telling a story of a child
abuse (https://www.youtube.com/watch?v=pw7Gg8nJXVc&feature=youtu.be). Participants watched one randomly
selected video and rated on a 7-point scale (1 = not at all, 7 = very much) the extent to which they felt a specific
emotion (i.e., disgusted, angry, fearful, powerful, sad, lonely, morally outraged, nauseated) while viewing it. As we
did for the selection of printed images, we selected the videos that best served the purpose of eliciting feelings of
physical and moral disgust by calculating a success index based on standardized scores of emotional intensity and
discreteness. 6 https://www.youtube.com/watch?v=xcjiv3o0dl8&feature=youtu.be 7 https://www.youtube.com/watch?v=_MIpjuqhZCU&feature=youtu.be 8 https://www.youtube.com/watch?v=58v0B6D8lvE&feature=youtu.be 9 Participants were asked the following:1) “have you seen this TV scene before?”; 2) “how informative do you think
the content of the video was?”; 3) “how likely is that you would recommend watching this video to a friend?”.
51
to have participants read short emotion-inducing stories (Antfolk, Karlsson, Bäckström, &
Santtila, 2012; Horberg, Keltner, Oveis, & Cohen, 2009; Jones & Fitness, 2008; Schnall, Haidt,
Clore, & Jordan, 2008). Given that we were not able to find vignettes that specifically
discriminated between physical and moral disgust, we created and pretested nine short stories
based on real-life events we read about in the news/online (See Appendix C).10 We used a story
of a doctor finding a piece of rotting bread between the fat folds of his obese patient to elicit
feelings of physical disgust, whereas we used a story of a dirty doctor raping terminally ill girls
at the hospital to elicit feelings of moral disgust. In the control condition, we had participants
read a story about drinking coffee in Cuba. In Study 8, as ostensibly part of a study about how
people respond to written material, participants were asked to read a randomly selected book
excerpt and then to express their agreement or disagreement with a series of decoy statements
about it: “I would definitely buy this book,” “I find this excerpt to be intriguing,” “The excerpt is
well written,” and “I would be willing to read more about this.”
Dependent Variables
We examined the impact of physical and moral disgust exposure on compensatory
consumption with previously established measures. To investigate consumer compensation to a
power threat we used willingness to pay for status-related products, preference for larger brand
logos, and preference for conspicuous brand logos. To investigate consumer compensation to a
belonginess threat we used willingness to donate to charity in terms of likelihood and dollar
amount, and willingness to engage in helping behavior. We provide a general description of each
1010 We created 9 short stories based on real life disgusting events we read about in the news/online and we run a
pretest in the lab on a sample of 292 U.S. students (see Appendix B). We asked participants to read a randomly
selected story and to rate on a 7-point scale (1 = not at all, 7 = very much) the extent to which they felt a specific
emotion (i.e., disgusted, angry, fearful, powerful, sad, lonely, morally outraged, nauseated) while reading it. As we
did for images and video clips, we selected the stories that best served the purpose of eliciting feelings of physical
and moral disgust by calculating a success index based on standardized scores of emotional intensity and
discreteness.
52
dependent variable operationalization next.
Willingness to Pay for Status-Related Products
In Study 1, 5, 6, and 7, our measured efficacy restoration was participants’ stated
willingness to pay for status-related products (Rucker & Galinsky, 2008). In Study 1, we showed
participants five luxury products (i.e., fountain pen, wristwatch, leather briefcase, tie, fur coat)
and asked them how much they would be willing to pay for them at this moment on a 12-point
scale, from 1 = 10% of the retail price of the item to 12 = 120% of the retail price. In Studies 5, 6
and 7 we showed participants only a subset of those luxury products (i.e., fountain pen,
wristwatch). The items were averaged to form a composite score (αstudy1=.77, αstudy5 =.73, αstudy6
=.51, αstudy7 =.56), with higher values indicating a higher willingness to pay for status-related
goods.
Preference for Larger Brand Logos
In four studies (Studies 2, 3, 4, 8), our key measure of power compensation was the
preference for a larger brand logo on a product that we adapted from Lee and Shrum (2012). We
asked participants to consider a scenario in which Ralph Lauren was ready to launch a newly
designed T-shirt, but before the launch, the company wanted to pilot-test consumer preferences.
Participants were asked to imagine they were going to buy a new polo shirt at that moment. The
operationalization of large versus small logos choice was slightly different throughout the studies
(Appendix D). In Study 2, all participants were shown five images of a Ralph Lauren polo shirt
with logos proportionally increasing in size from the first shirt to the last and they were asked to
express their preferences on four items (choice, appeal, willingness to pay, attractiveness) on a 5-
point scale, with each scale point representing a polo shirt ranging from “polo 1” to “polo 5”. In
studies 3, 4, and 8, participants were then shown two images of a Ralph Lauren polo shirt, one
53
with a prominent, visible logo and one with a small, less conspicuous logo. They expressed their
preferences for the same four items from Study 2, but on a 9-point scale anchored at “1 definitely
polo A” and “9 definitely polo B”. In all studies, the four items were averaged to form a
composite score (αstudy2=.98, αstudy3 =.98, αstudy4=.97, αstudy8 =.98), with higher values indicating a
greater preference for the conspicuous Ralph Lauren logo.
Conspicuous Consumption Scale
In Study 4, we measured preferences for conspicuous consumption using the scale
developed by Rucker and Galinsky, (2009). Specifically, we asked participants to imagine they
were buying a piece of high-end clothing and then to indicate their preferences for conspicuous
brand logos on a 9-point scale comprising four items, anchored by visible/nonvisible, big/small,
noticeable/unnoticeable, and conspicuous/inconspicuous. The four items were averaged to form a
composite score (α=.89), with higher values indicating a greater preference for conspicuous
logos.
Charitable Donation: Likelihood and Amount
In all eight studies, we used charitable donation intentions as a proxy for belonginess
threat compensation. Participants read the following scenario:
Imagine that while you are standing in the checkout lane at a grocery store,
you find the following donation campaign posted around the checkout lane.
"One in seven babies is born prematurely in the US. Prematurity is the leading
cause of newborn death. Join us in the fight to give every baby a healthy start.
Donate Today!" If you were in this situation at this very moment, how likely
would you be to make a donation?
Next, we measured their likelihood to donate by asking them the following: “If you decide to
54
make a donation, how much money would you donate at this very moment?” (1=not at all likely;
9=very likely). Finally, we asked participants to indicate how much money they would have
been willing to donate at that very moment (open-ended, dollar amount).
Helping Behavior
In addition to charitable donation intentions, in Studies 4 to 7, we measured
belongingness compensation as likelihood to help others in need. We adapted six hypothetical
scenarios depicting opportunities to help others from DeWall, Baumeister, Gailliot, and Maner
(2008) and we asked participants to express their likelihood to help on a 9-point scale (1 = not at
all likely, 9 = very likely). The scenarios depicted opportunities to help others in various forms
such as by giving money to a homeless person, donating money to a fund for children with
terminal illnesses, offering a ride to an unknown neighbor whose car had broken down, giving
directions to a lost stranger, allowing a stranger to use one’s cell phone, and giving food to a
homeless person (Appendix E). The scores from the six scenarios were averaged to form a
composite score (αstudy4=.76, αstudy5 =.67, αstudy6 =.52, αstudy7 =.53), with higher values indicating a
greater likelihood to help others.
Meta-Analytic Approach
In the social sciences field there has been increasing consensus about the benefits of using
meta-analytic approaches to enhance replicability, prevent sampling error, and reduce
publication bias (Braver, Thoemmes, & Rosenthal, 2014; Cumming, 2014; Mcshane &
Böckenholt, 2017, 2017; Schmidt & Hunter, 2014). For example, at the single-study level,
sampling error is a random non-estimated event, whereas at the aggregate meta-analysis level, it
can be estimated and corrected for. Additionally, meta-analysis allows researchers to use point
estimates and confidence intervals instead of relying merely on significance testing and statistical
55
power.
A single study can rarely provide a reliable estimate of an effect, and the reliance on the
myth of the “perfect study” has generated more harm than good. The current debate on the perils
of significance testing in the social sciences highlights how pressure to publish increases
scientific bias as researchers engage in selective reporting of significant studies and dismiss
potentially true phenomena based only on a few unsuccessful attempts (Fanelli, 2010; Franco,
Malhotra, & Simonovits, 2014; Gelman & Carlin, 2014; Gelman & Weakliem, 2007). Therefore,
adopting meta-analytic thinking not only for multiple papers, but also within studies that appear
in a single paper could help reduce harmful practices that hinder the cumulation and
advancement of knowledge. Mcshane and Böckenholt (2017) summarize the advantages of
using a single-paper meta-analysis (SPM) methodology: 1) increases statistical power and yields
a more accurate effect estimate by pooling results via weighted averaging; 2) clarifies the nature
of the effect when single studies generate conflicting results; 3) helps quantify the impact of
study-level covariates or the degree of between-study variation (i.e., heterogeneity); 4) reduces
the incidence of Type I and Type II errors; 5) informs theory because of its ability to decompose
experimental effects (e.g., unaccounted-for moderators); 6) enhances replicability; 7) provides a
concise and intuitive graphical summary of results (i.e., forest plot).
In line with these observations and with the current debate on the perils of data-selection
bias in our field, we aimed at providing a conservative estimation based on the full data that we
collected internally within our research project. We believe that our studies are best interpreted
as a data point in a broader data set to be analyzed. A meta-analytical approach is advocated
when researchers want to study a potentially small effect with multiple studies, because a very
large sample size would be required for each single study to be significant. This view is
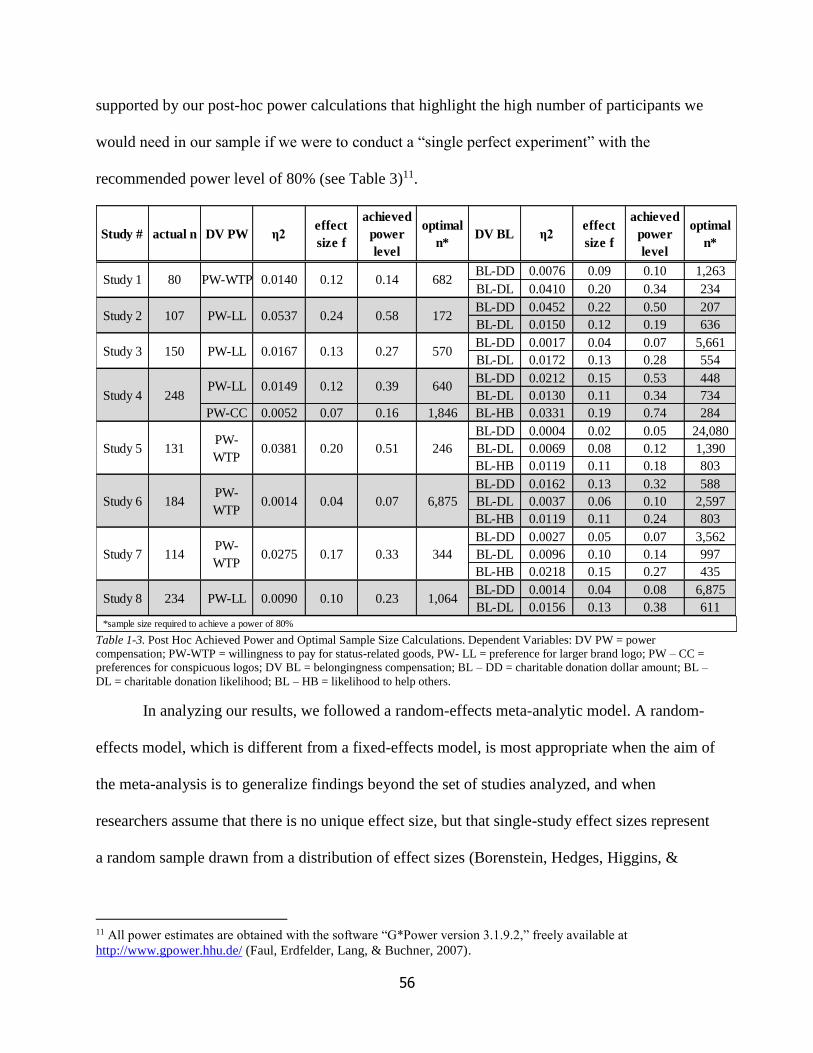
56
supported by our post-hoc power calculations that highlight the high number of participants we
would need in our sample if we were to conduct a “single perfect experiment” with the
recommended power level of 80% (see Table 3)11.
Table 1-3. Post Hoc Achieved Power and Optimal Sample Size Calculations. Dependent Variables: DV PW = power
compensation; PW-WTP = willingness to pay for status-related goods, PW- LL = preference for larger brand logo; PW – CC =
preferences for conspicuous logos; DV BL = belongingness compensation; BL – DD = charitable donation dollar amount; BL –
DL = charitable donation likelihood; BL – HB = likelihood to help others.
In analyzing our results, we followed a random-effects meta-analytic model. A random-
effects model, which is different from a fixed-effects model, is most appropriate when the aim of
the meta-analysis is to generalize findings beyond the set of studies analyzed, and when
researchers assume that there is no unique effect size, but that single-study effect sizes represent
a random sample drawn from a distribution of effect sizes (Borenstein, Hedges, Higgins, &
11 All power estimates are obtained with the software “G*Power version 3.1.9.2,” freely available at
http://www.gpower.hhu.de/ (Faul, Erdfelder, Lang, & Buchner, 2007).
Study # actual n DV PW η2effect
size f
achieved
power
level
optimal
n*DV BL η2
effect
size f
achieved
power
level
optimal
n*
BL-DD 0.0076 0.09 0.10 1,263
BL-DL 0.0410 0.20 0.34 234
BL-DD 0.0452 0.22 0.50 207
BL-DL 0.0150 0.12 0.19 636
BL-DD 0.0017 0.04 0.07 5,661
BL-DL 0.0172 0.13 0.28 554
BL-DD 0.0212 0.15 0.53 448
BL-DL 0.0130 0.11 0.34 734
PW-CC 0.0052 0.07 0.16 1,846 BL-HB 0.0331 0.19 0.74 284
BL-DD 0.0004 0.02 0.05 24,080
BL-DL 0.0069 0.08 0.12 1,390
BL-HB 0.0119 0.11 0.18 803
BL-DD 0.0162 0.13 0.32 588
BL-DL 0.0037 0.06 0.10 2,597
BL-HB 0.0119 0.11 0.24 803
BL-DD 0.0027 0.05 0.07 3,562
BL-DL 0.0096 0.10 0.14 997
BL-HB 0.0218 0.15 0.27 435
BL-DD 0.0014 0.04 0.08 6,875
BL-DL 0.0156 0.13 0.38 611
Study 1 PW-WTP 0.120.0140
0.0537
Study 7
Study 5 131PW-
WTP
0.14 68280
0.24Study 2 PW-LL 0.58 172107
*sample size required to achieve a power of 80%
Study 3 150 PW-LL 0.0167 0.13 0.27 570
0.0381 0.20 0.51 246
0.39 640Study 4 248
PW-LL 0.0149 0.12
114PW-
WTP0.0275 0.17 0.33 344
6,875Study 6 184PW-
WTP0.0014 0.04 0.07
1,064Study 8 234 PW-LL 0.0090 0.10 0.23
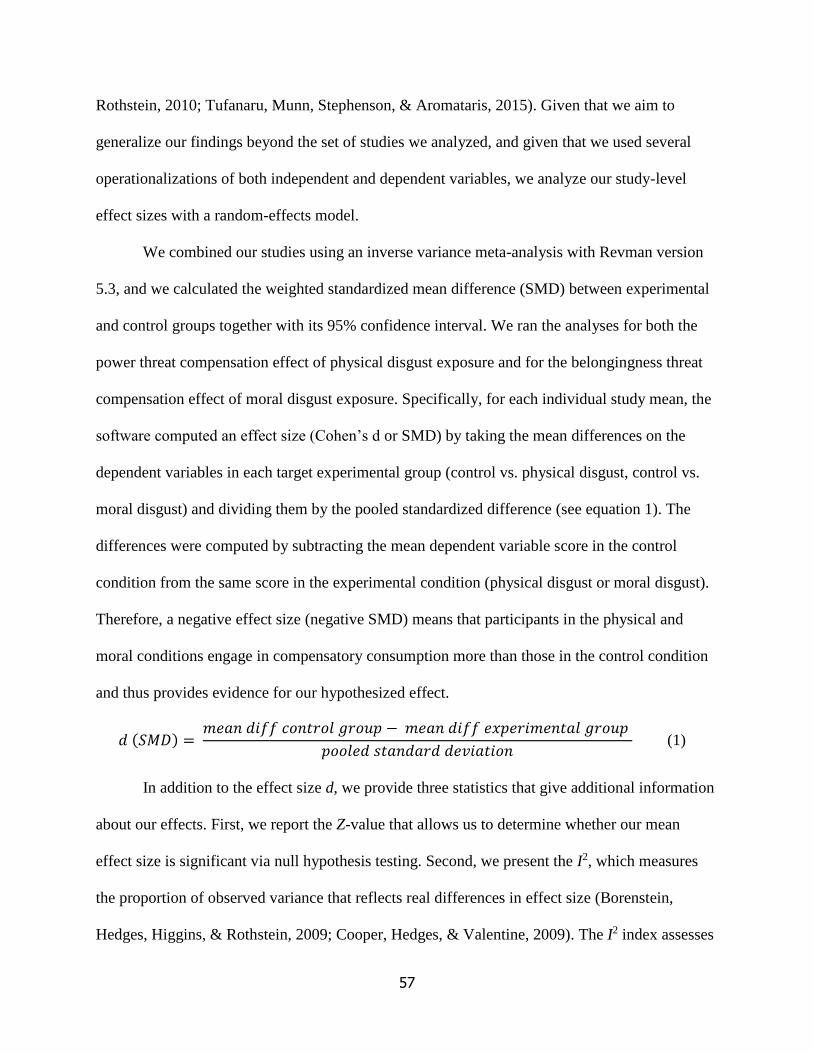
57
Rothstein, 2010; Tufanaru, Munn, Stephenson, & Aromataris, 2015). Given that we aim to
generalize our findings beyond the set of studies we analyzed, and given that we used several
operationalizations of both independent and dependent variables, we analyze our study-level
effect sizes with a random-effects model.
We combined our studies using an inverse variance meta-analysis with Revman version
5.3, and we calculated the weighted standardized mean difference (SMD) between experimental
and control groups together with its 95% confidence interval. We ran the analyses for both the
power threat compensation effect of physical disgust exposure and for the belongingness threat
compensation effect of moral disgust exposure. Specifically, for each individual study mean, the
software computed an effect size (Cohen’s d or SMD) by taking the mean differences on the
dependent variables in each target experimental group (control vs. physical disgust, control vs.
moral disgust) and dividing them by the pooled standardized difference (see equation 1). The
differences were computed by subtracting the mean dependent variable score in the control
condition from the same score in the experimental condition (physical disgust or moral disgust).
Therefore, a negative effect size (negative SMD) means that participants in the physical and
moral conditions engage in compensatory consumption more than those in the control condition
and thus provides evidence for our hypothesized effect.
𝑑 (𝑆𝑀𝐷) = 𝑚𝑒𝑎𝑛 𝑑𝑖𝑓𝑓 𝑐𝑜𝑛𝑡𝑟𝑜𝑙 𝑔𝑟𝑜𝑢𝑝 − 𝑚𝑒𝑎𝑛 𝑑𝑖𝑓𝑓 𝑒𝑥𝑝𝑒𝑟𝑖𝑚𝑒𝑛𝑡𝑎𝑙 𝑔𝑟𝑜𝑢𝑝
𝑝𝑜𝑜𝑙𝑒𝑑 𝑠𝑡𝑎𝑛𝑑𝑎𝑟𝑑 𝑑𝑒𝑣𝑖𝑎𝑡𝑖𝑜𝑛 (1)
In addition to the effect size d, we provide three statistics that give additional information
about our effects. First, we report the Z-value that allows us to determine whether our mean
effect size is significant via null hypothesis testing. Second, we present the I2, which measures
the proportion of observed variance that reflects real differences in effect size (Borenstein,
Hedges, Higgins, & Rothstein, 2009; Cooper, Hedges, & Valentine, 2009). The I2 index assesses
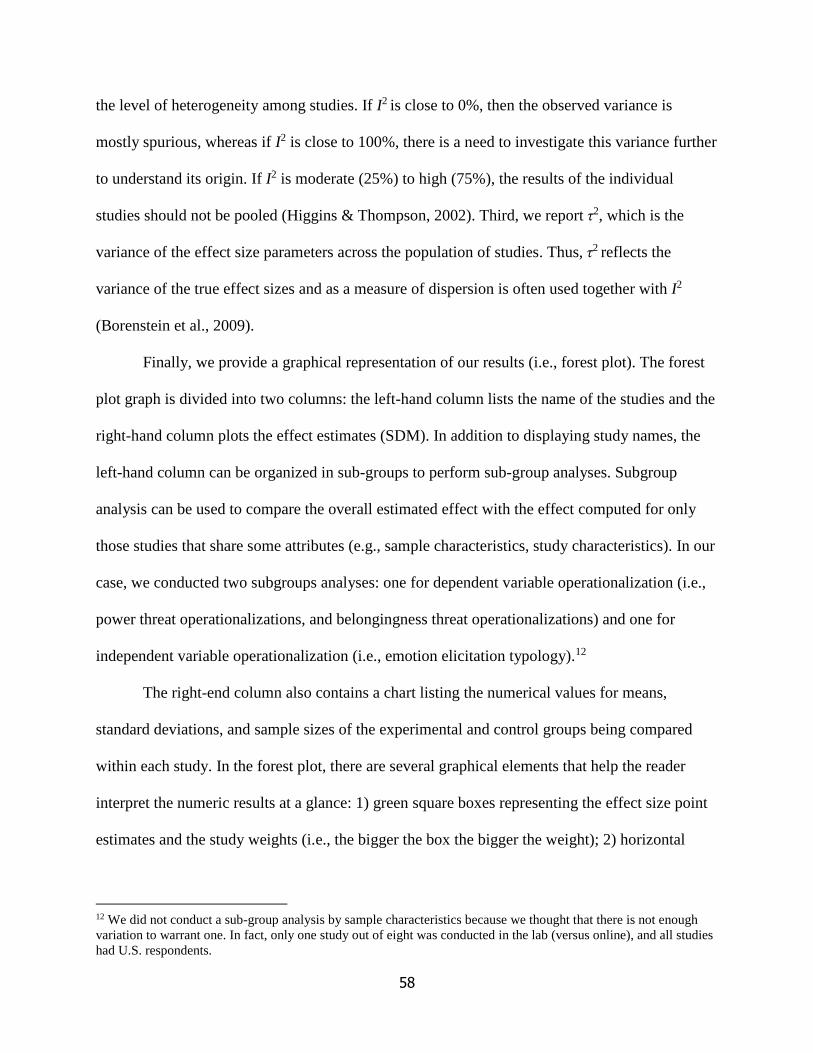
58
the level of heterogeneity among studies. If I2 is close to 0%, then the observed variance is
mostly spurious, whereas if I2 is close to 100%, there is a need to investigate this variance further
to understand its origin. If I2 is moderate (25%) to high (75%), the results of the individual
studies should not be pooled (Higgins & Thompson, 2002). Third, we report τ2, which is the
variance of the effect size parameters across the population of studies. Thus, τ2 reflects the
variance of the true effect sizes and as a measure of dispersion is often used together with I2
(Borenstein et al., 2009).
Finally, we provide a graphical representation of our results (i.e., forest plot). The forest
plot graph is divided into two columns: the left-hand column lists the name of the studies and the
right-hand column plots the effect estimates (SDM). In addition to displaying study names, the
left-hand column can be organized in sub-groups to perform sub-group analyses. Subgroup
analysis can be used to compare the overall estimated effect with the effect computed for only
those studies that share some attributes (e.g., sample characteristics, study characteristics). In our
case, we conducted two subgroups analyses: one for dependent variable operationalization (i.e.,
power threat operationalizations, and belongingness threat operationalizations) and one for
independent variable operationalization (i.e., emotion elicitation typology).12
The right-end column also contains a chart listing the numerical values for means,
standard deviations, and sample sizes of the experimental and control groups being compared
within each study. In the forest plot, there are several graphical elements that help the reader
interpret the numeric results at a glance: 1) green square boxes representing the effect size point
estimates and the study weights (i.e., the bigger the box the bigger the weight); 2) horizontal
12 We did not conduct a sub-group analysis by sample characteristics because we thought that there is not enough
variation to warrant one. In fact, only one study out of eight was conducted in the lab (versus online), and all studies
had U.S. respondents.
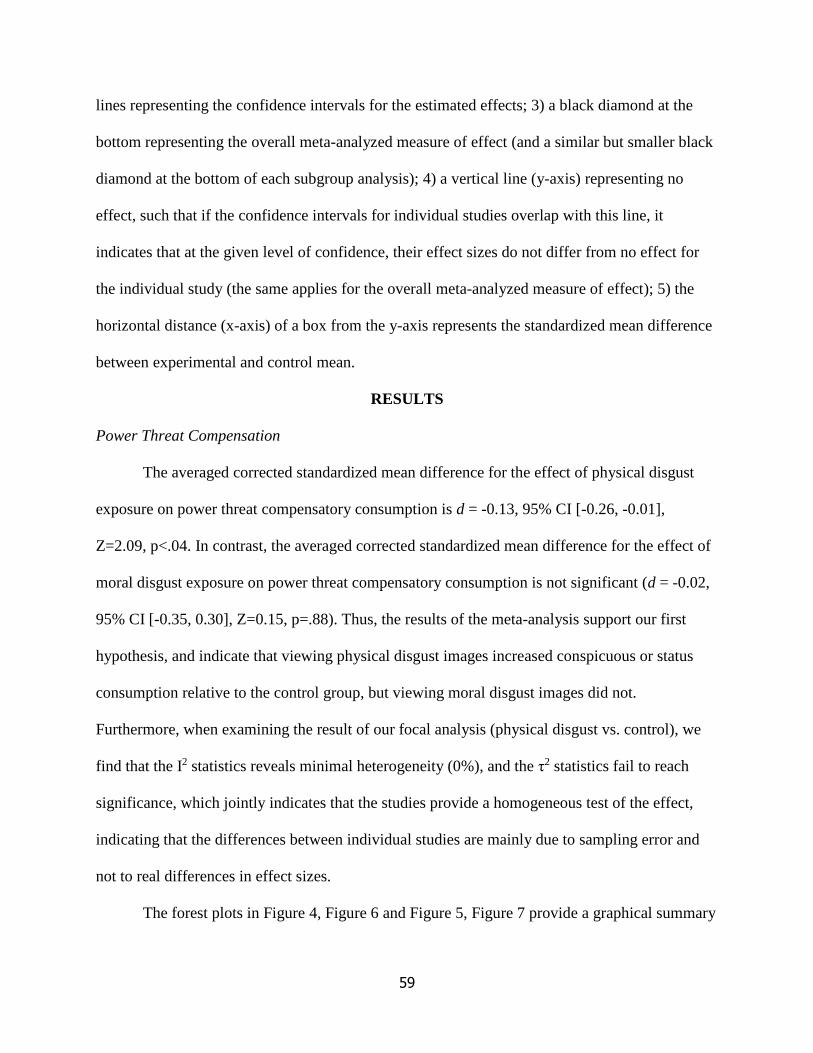
59
lines representing the confidence intervals for the estimated effects; 3) a black diamond at the
bottom representing the overall meta-analyzed measure of effect (and a similar but smaller black
diamond at the bottom of each subgroup analysis); 4) a vertical line (y-axis) representing no
effect, such that if the confidence intervals for individual studies overlap with this line, it
indicates that at the given level of confidence, their effect sizes do not differ from no effect for
the individual study (the same applies for the overall meta-analyzed measure of effect); 5) the
horizontal distance (x-axis) of a box from the y-axis represents the standardized mean difference
between experimental and control mean.
RESULTS
Power Threat Compensation
The averaged corrected standardized mean difference for the effect of physical disgust
exposure on power threat compensatory consumption is d = -0.13, 95% CI [-0.26, -0.01],
Z=2.09, p<.04. In contrast, the averaged corrected standardized mean difference for the effect of
moral disgust exposure on power threat compensatory consumption is not significant (d = -0.02,
95% CI [-0.35, 0.30], Z=0.15, p=.88). Thus, the results of the meta-analysis support our first
hypothesis, and indicate that viewing physical disgust images increased conspicuous or status
consumption relative to the control group, but viewing moral disgust images did not.
Furthermore, when examining the result of our focal analysis (physical disgust vs. control), we
find that the I2 statistics reveals minimal heterogeneity (0%), and the τ2 statistics fail to reach
significance, which jointly indicates that the studies provide a homogeneous test of the effect,
indicating that the differences between individual studies are mainly due to sampling error and
not to real differences in effect sizes.
The forest plots in Figure 4, Figure 6 and Figure 5, Figure 7 provide a graphical summary
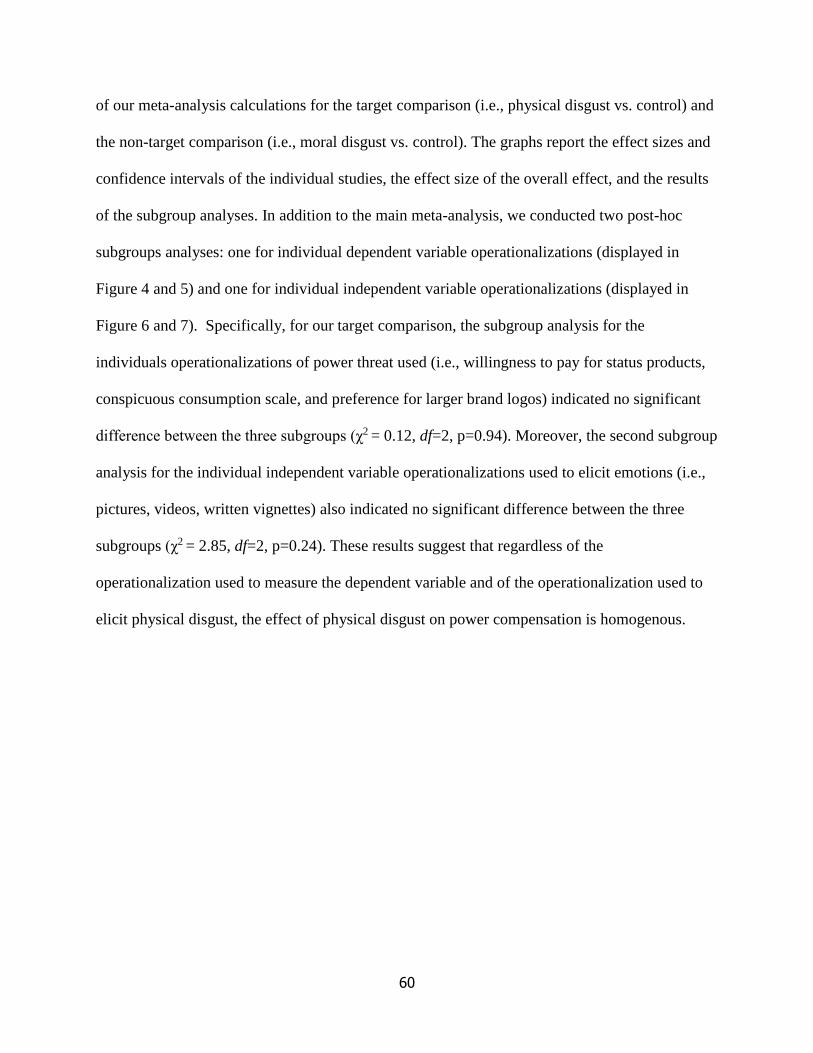
60
of our meta-analysis calculations for the target comparison (i.e., physical disgust vs. control) and
the non-target comparison (i.e., moral disgust vs. control). The graphs report the effect sizes and
confidence intervals of the individual studies, the effect size of the overall effect, and the results
of the subgroup analyses. In addition to the main meta-analysis, we conducted two post-hoc
subgroups analyses: one for individual dependent variable operationalizations (displayed in
Figure 4 and 5) and one for individual independent variable operationalizations (displayed in
Figure 6 and 7). Specifically, for our target comparison, the subgroup analysis for the
individuals operationalizations of power threat used (i.e., willingness to pay for status products,
conspicuous consumption scale, and preference for larger brand logos) indicated no significant
difference between the three subgroups (χ2 = 0.12, df=2, p=0.94). Moreover, the second subgroup
analysis for the individual independent variable operationalizations used to elicit emotions (i.e.,
pictures, videos, written vignettes) also indicated no significant difference between the three
subgroups (χ2 = 2.85, df=2, p=0.24). These results suggest that regardless of the
operationalization used to measure the dependent variable and of the operationalization used to
elicit physical disgust, the effect of physical disgust on power compensation is homogenous.
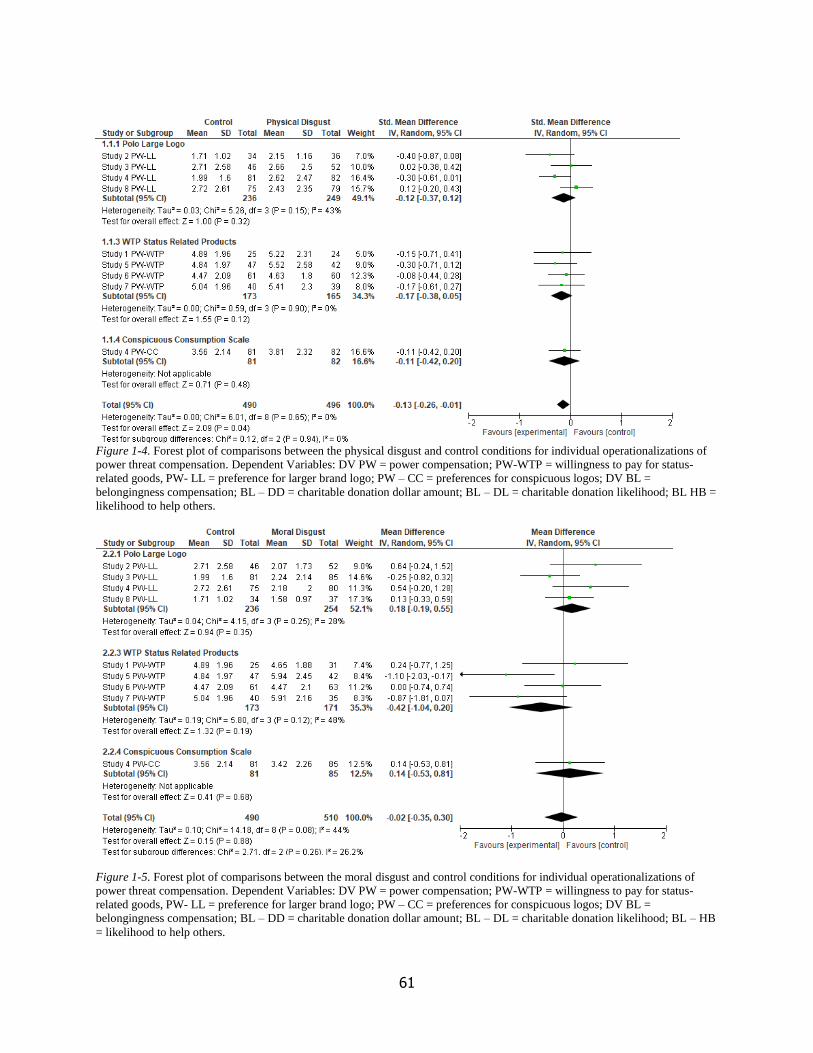
61
Figure 1-4. Forest plot of comparisons between the physical disgust and control conditions for individual operationalizations of
power threat compensation. Dependent Variables: DV PW = power compensation; PW-WTP = willingness to pay for status-
related goods, PW- LL = preference for larger brand logo; PW – CC = preferences for conspicuous logos; DV BL =
belongingness compensation; BL – DD = charitable donation dollar amount; BL – DL = charitable donation likelihood; BL HB =
likelihood to help others.
Figure 1-5. Forest plot of comparisons between the moral disgust and control conditions for individual operationalizations of
power threat compensation. Dependent Variables: DV PW = power compensation; PW-WTP = willingness to pay for status-
related goods, PW- LL = preference for larger brand logo; PW – CC = preferences for conspicuous logos; DV BL =
belongingness compensation; BL – DD = charitable donation dollar amount; BL – DL = charitable donation likelihood; BL – HB
= likelihood to help others.
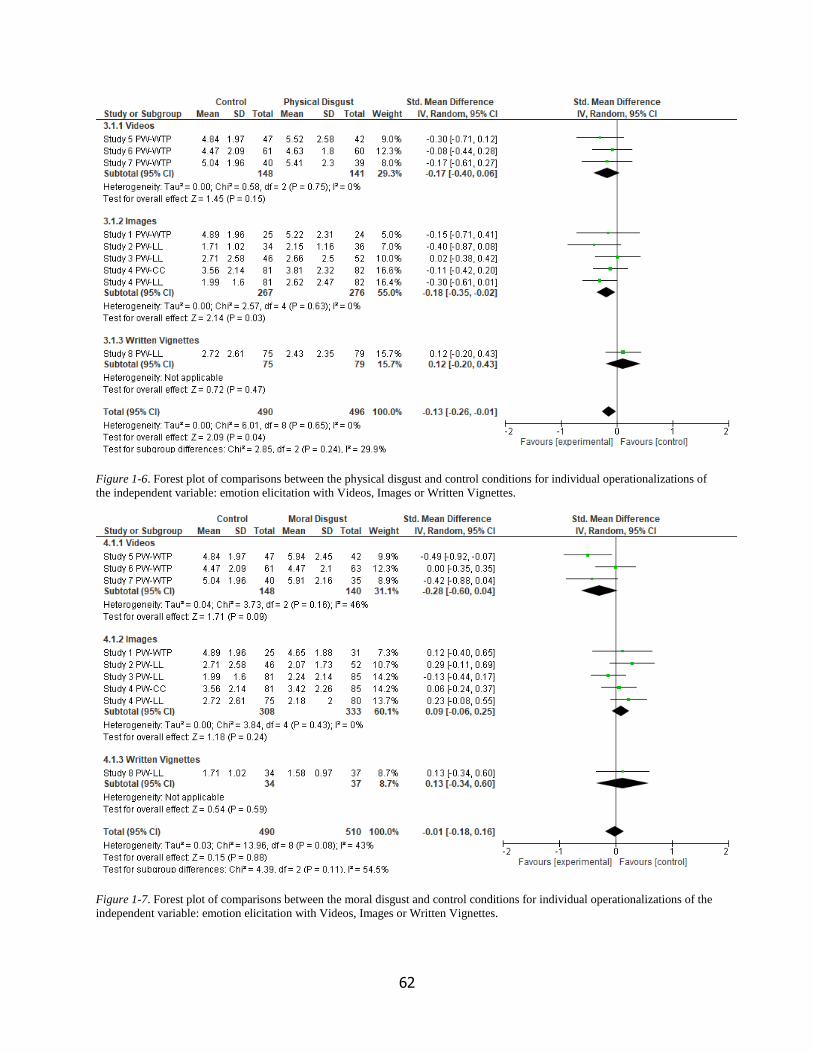
62
Figure 1-6. Forest plot of comparisons between the physical disgust and control conditions for individual operationalizations of
the independent variable: emotion elicitation with Videos, Images or Written Vignettes.
Figure 1-7. Forest plot of comparisons between the moral disgust and control conditions for individual operationalizations of the
independent variable: emotion elicitation with Videos, Images or Written Vignettes.
63
Belongingness Threat Compensation
The averaged corrected standardized mean difference for the effect of moral disgust
exposure on belongingness threat compensatory consumption is d = -0.13, 95% CI [-0.21, -0.04],
Z = 2.94, p=0.003. The forest plot in Figure 8 reports the effect sizes and confidence intervals of
the individual studies, individual dependent variables and overall estimate. The results of our
meta-analysis support our second hypothesis and indicate that viewing moral disgust images
increased charitable or other-focused consumption relative to the control group, but viewing
physical disgust images did not (see Figure 9). In fact, the averaged corrected standardized mean
difference for the effect of physical disgust feelings on belongingness threat compensatory
consumption is not significant (d = 0.03, 95% CI [-0.06, 0.12], Z=0.59, p=.55). Furthermore,
when examining the results of our hypothesis test (Figure 6), we see that the I2 statistic again
reveals minimal heterogeneity (0%), and the τ2 statistics fails to reach significance.
The forest plots in Figure 8, Figure 10, and Figure 9, Figure 11 provide a graphical
summary of our meta-analysis calculations for the target comparison (i.e., moral disgust vs.
control) and the non-target comparison (i.e., physical disgust vs. control) respectively. Again, we
conducted two post-hoc subgroups analyses: one for individual dependent variable
operationalizations (displayed in Figure 8 and 9) and one for individual independent variable
operationalizations (displayed in Figure 10 and 11). For our target comparison, the subgroup
analysis for the individuals operationalizations of belongingness threat used (i.e., helping
behavior, donation amount, donation likelihood) indicated no significant difference between the
three subgroups (χ2 = 0.69, df=2, p=0.71). These results suggest that regardless of the
operationalization used to measure the dependent variable and of the operationalization used to
elicit moral disgust, the effect of moral disgust on belongingness compensation is homogenous.
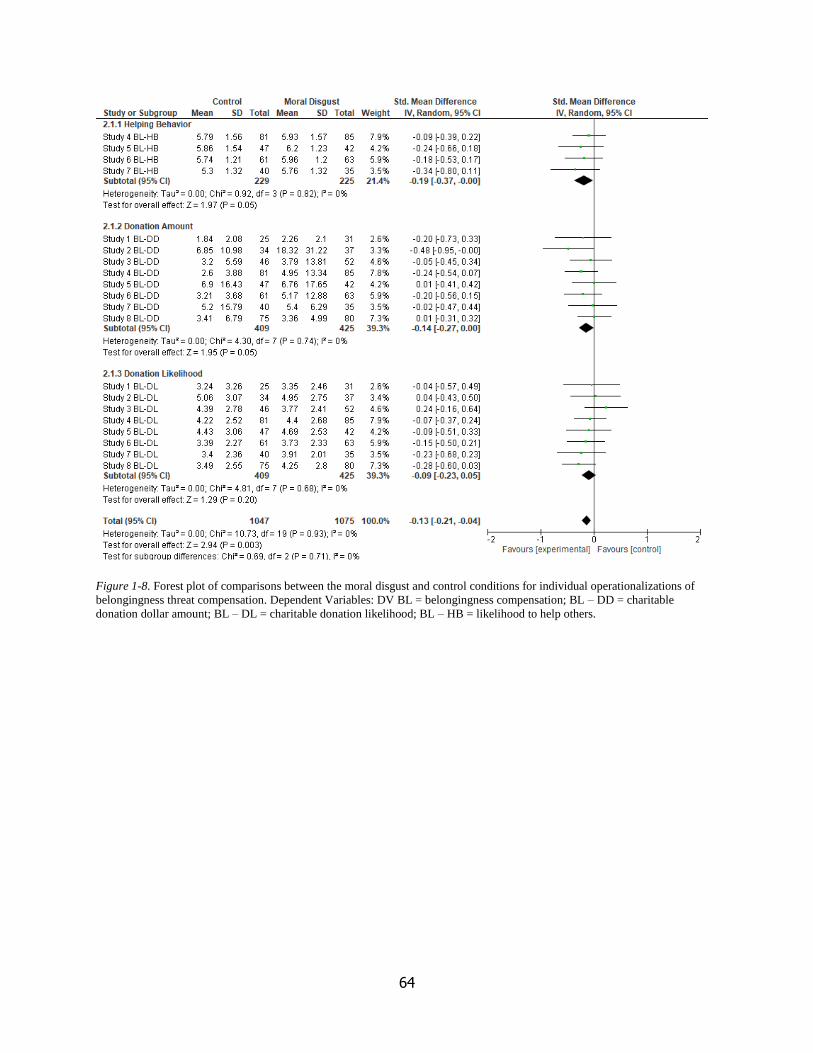
64
Figure 1-8. Forest plot of comparisons between the moral disgust and control conditions for individual operationalizations of
belongingness threat compensation. Dependent Variables: DV BL = belongingness compensation; BL – DD = charitable
donation dollar amount; BL – DL = charitable donation likelihood; BL – HB = likelihood to help others.
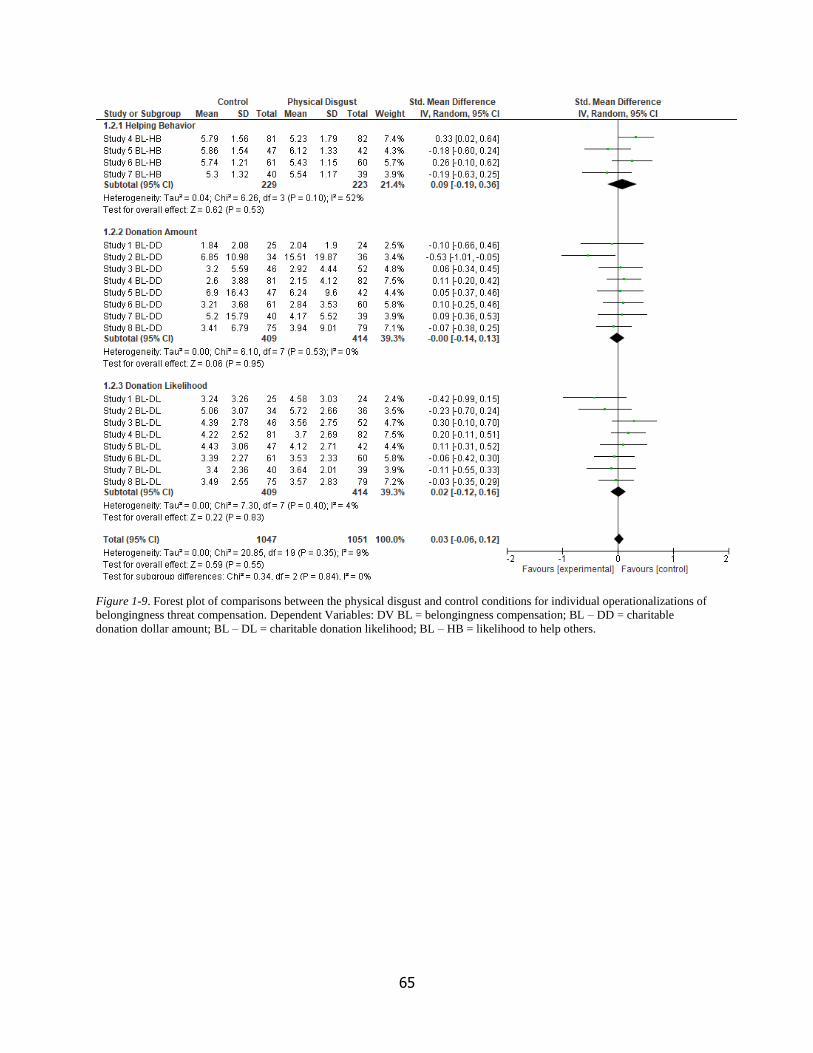
65
Figure 1-9. Forest plot of comparisons between the physical disgust and control conditions for individual operationalizations of
belongingness threat compensation. Dependent Variables: DV BL = belongingness compensation; BL – DD = charitable
donation dollar amount; BL – DL = charitable donation likelihood; BL – HB = likelihood to help others.
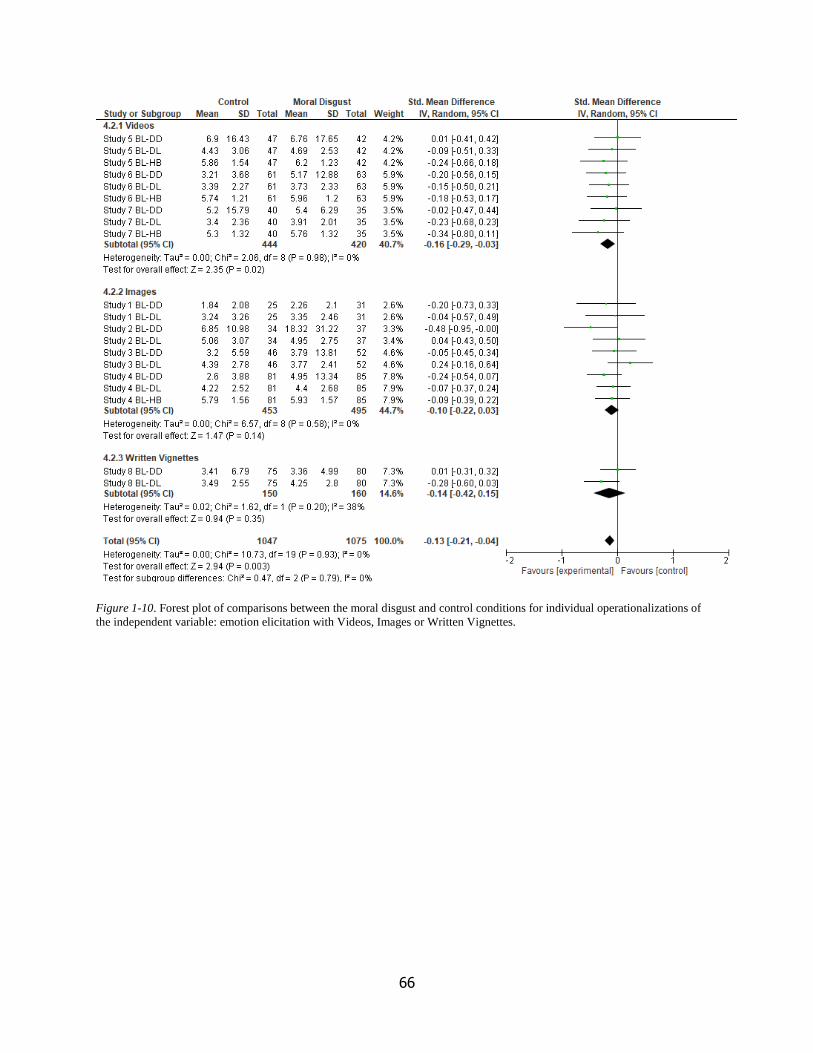
66
Figure 1-10. Forest plot of comparisons between the moral disgust and control conditions for individual operationalizations of
the independent variable: emotion elicitation with Videos, Images or Written Vignettes.
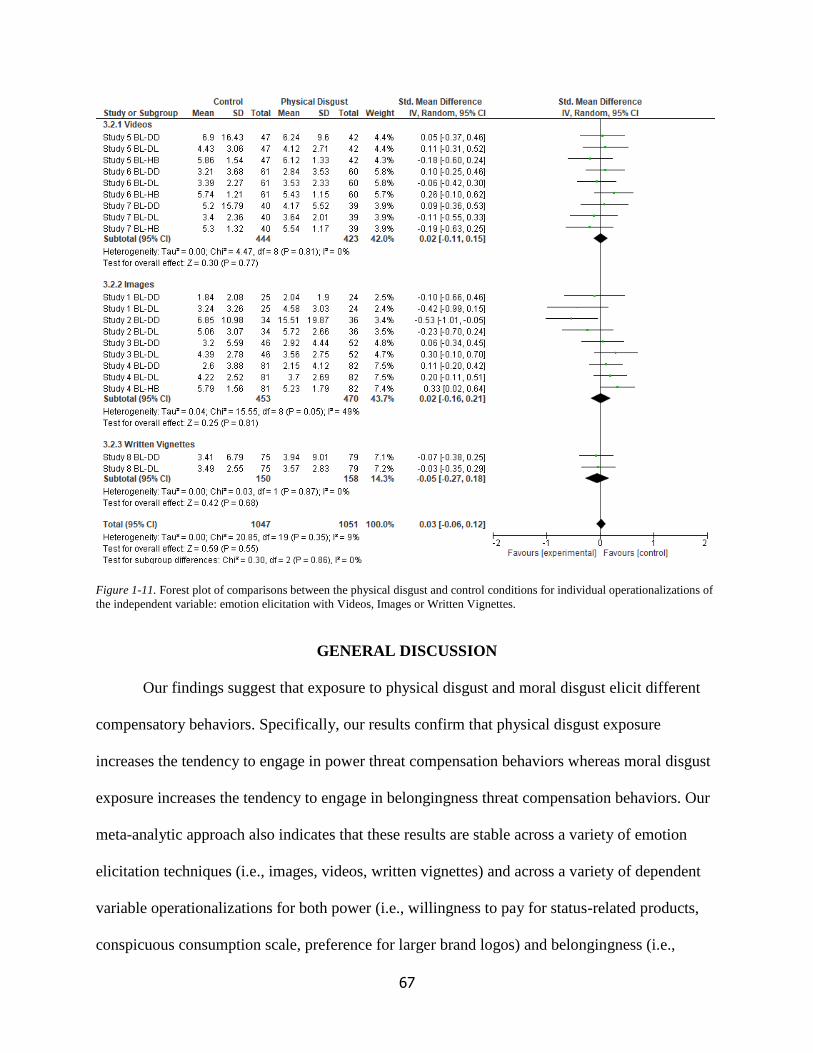
67
Figure 1-11. Forest plot of comparisons between the physical disgust and control conditions for individual operationalizations of
the independent variable: emotion elicitation with Videos, Images or Written Vignettes.
GENERAL DISCUSSION
Our findings suggest that exposure to physical disgust and moral disgust elicit different
compensatory behaviors. Specifically, our results confirm that physical disgust exposure
increases the tendency to engage in power threat compensation behaviors whereas moral disgust
exposure increases the tendency to engage in belongingness threat compensation behaviors. Our
meta-analytic approach also indicates that these results are stable across a variety of emotion
elicitation techniques (i.e., images, videos, written vignettes) and across a variety of dependent
variable operationalizations for both power (i.e., willingness to pay for status-related products,
conspicuous consumption scale, preference for larger brand logos) and belongingness (i.e.,

68
helping behavior, charitable donation likelihood and amount) compensation.
Theoretical Contributions
This research makes several theoretical contributions. First, it adds to research in
consumer behavior by distinguishing between physical and moral disgust elicitors. Although
psychology research highlighted this distinction long ago, consumer behavior researchers have
not explicitly accounted for it in studies examining the effects of disgust in consumption settings
(Argo et al., 2006; Morales & Fitzsimons, 2007; Morales et al., 2012). Furthermore, we show
that this distinction is fundamental and should be taken into consideration when researching the
effects of shockadvertising on consumers’ reaction. Previous research on shockvertising in
general (Bushman & Lull, 2015; Dahl et al., 2003), and on shockvertising of fashion brands or
charity organizations in particular (Andersson, Hedelin, Nilsson, & Welander, 2004; Cockrill &
Parsonage, 2016), failed to account for the different emotional elicitors used and often resorted to
classification of stimuli as shocking or violent without accounting for the specific emotional
content. We provided various real-world examples (Figure 2 and appendix A) to show that
shocking advertisements use physical and moral disgust elicitor indiscriminately, and we
provided empirical evidence that this difference matters.
Second, we explored the behavioral consequences of using shocking images per se and
beyond message compliance. By building our theorizing on the appraisal theory framework of
emotions and on compensatory consumption theory, we were able to examine unconscious
behavioral reactions to physically or morally disgusting images. In particular, we proposed and
tested that moral and physical disgust elicit compensatory consumption behaviors that are
consistent with self-threats in the power and belongingness domain. We believe that this is an
important first step in the examination of how situational appraisals can be shaped by emotional
69
experiences and signal danger to the sense of self.
Managerial Implications
Commonly, marketers employ strong images to scare consumers or to break through the
advertising clutter; this research provides new insights into the specific subconscious
consequences such images entail. Our research would suggest that marketers should carefully
choose the emotional content of their shockvertising attempts. Both charity organizations and
luxury brands sometimes use images that have elements of physical or moral disgust (see
Appendix A). Our research shows that if prosocial behavioral responses are sought (e.g., money
donation, volunteer work), such images should focus on eliciting feelings of moral disgust.
However, if more self-focused responses are sought (e.g., status or conspicuous consumption),
physically disgusting stimuli should be preferred. That said, we are not advocating for a
disproportionate usage of disgusting images in advertising, because there might be other effects
that are not studied within the present research. Our investigation focused on understanding
unconscious behavioral reactions to physically and morally disgusting images, but left
unexplored the issue of whether the use of these stimuli might be detrimental to brand image
(Andersson et al., 2004; Parry, Jones, Stern, & Robinson, 2013).
Limitations and Further Research
There are a number of limitations of this research that provide direction for future
investigation. Although this research makes a significant contribution in showing that exposure
to emotional content in advertising prompts unconscious compensatory behavior responses, we
did not test for the underlying process directly. In future studies, we plan to test the underlying
process by either measuring or manipulating the hypothesized self-threats (power, belonginess).
If bolstering the sense of power or of belonginess eliminates the effect that we found with our
70
meta-analysis, we can provide additional evidence that our conceptual framework holds true.
The use of a meta-analytic approach to analyze our data also allows us to reflect on which
emotion elicitations techniques and which dependent variable operationalizations could
maximize the effect. In fact, when testing our hypotheses, we also ran some subgroup analyses
that could inform our future attempts. For example, when testing for the effect of physical
disgust exposure on power compensatory consumption (hypothesis one), subgroup analyses
indicated that picture elicitation and willingness to pay for status-related products might work
best. On the other hand, when testing for the effect of moral disgust exposure on belongingness
compensatory consumption (hypothesis two), subgroup analyses indicated that video elicitation
and helping behavior scenarios might work best. The difference in the effectiveness of the
emotion elicitation manipulation might be due to the fact that moral disgust is a fairly complex
emotion and that videographic elicitation best conveys the moral violation of norms. In contrast,
physical disgust is a simple primordial emotion and images might elicit it better because they
have an immediate effect. In this case, we could try and shorten the videos so that the physical
disgust elicitation is stronger, or we could add copy to the images to strengthen the effect of the
moral violation. Once we maximize the measurement of our main effect, we plan to examine
whether making the donation behavior conspicuous, or adding a charitable element to a luxury
purchase, will moderate the effect of type of disgust on the behavioral responses.
Finally, beyond our specific research project, future research could explore if certain
cognitive appraisals, associated with emotions other than disgust, could have a positive effect on
the sense of self. For example, if anger is associated with cognitive appraisals of high power and
high coping potential, experiencing this emotion could potentially act as a buffer against threats
to personal power. Alternatively, researchers could focus on the link between appraisals and
71
contextual factors and study unconscious behavioral tendencies other than compensatory
consumption. For example, if anger is associated with behavioral tendencies of action-readiness,
when consumer experience this emotion while shopping, they may be more likely to engage in
impulse buying.
72
REFERENCES
Andersson, S., Hedelin, A., Nilsson, A., & Welander, C. (2004). Violent advertising in fashion
marketing. Journal of Fashion Marketing and Management: An International Journal,
8(1), 96–112. https://doi.org/10.1108/13612020410518727
Antfolk, J., Karlsson, M., Bäckström, A., & Santtila, P. (2012). Disgust elicited by third-party
incest: the roles of biological relatedness, co-residence, and family relationship.
Evolution and Human Behavior, 33(3), 217–223.
https://doi.org/10.1016/j.evolhumbehav.2011.09.005
Argo, J. J., Dahl, D. W., & Morales, A. C. (2006). Consumer Contamination: How Consumers
React to Products Touched by Others. Journal of Marketing, 70(2), 81–94.
https://doi.org/10.1509/jmkg.70.2.81
Baumeister, R. F., & Leary, M. R. (1995). The need to belong: desire for interpersonal
attachments as a fundamental human motivation. Psychological Bulletin, 117(3), 497.
http://dx.doi.org/10.1037/0033-2909.117.3.497
Borenstein, M., Hedges, L. V., Higgins, J. P. T., & Rothstein, H. R. (2009). Introduction to
Meta-Analysis. London, England: John Wiley and Sons.
https://doi.org/10.1002/9780470743386
Borenstein, M., Hedges, L. V., Higgins, J. P. T., & Rothstein, H. R. (2010). A basic introduction
to fixed-effect and random-effects models for meta-analysis. Research Synthesis
Methods, 1(2), 97–111. https://doi.org/10.1002/jrsm.12
Braver, S. L., Thoemmes, F. J., & Rosenthal, R. (2014). Continuously Cumulating Meta-
Analysis and Replicability. Perspectives on Psychological Science, 9(3), 333–342.
https://doi.org/10.1177/1745691614529796
73
Brown, M. R., Bhadury, R. K., & Pope, N. K. L. (2010). The Impact of Comedic Violence on
Viral Advertising Effectiveness. Journal of Advertising, 39(1), 49–66.
https://doi.org/10.2753/JOA0091-3367390104
Bushman, B. J., & Lull, R. B. (2015). Do sex and violence sell? A meta-analytic review of the
effects of sexual and violent media and ad content on memory, attitudes, and buying
intentions. Psychological Bulletin, (5), 1022. http://dx.doi.org/10.1037/bul0000018
Chu, C., Buchman-Schmitt, J. M., Michaels, M. S., Ribeiro, J. D., & Joiner, T. (2013).
Discussing disgust: The role of disgust with life in suicide. International Journal of
Cognitive Therapy, 6(3), 235–247. https://doi.org/10.1521/ijct.2013.6.3.235
Coan, J. A., & Allen, J. J. (Eds.). (2007). Handbook of emotion elicitation and assessment.
Oxford: Oxford university press.
Cockrill, A., & Parsonage, I. (2016). Shocking People Into Action: Does It Still Work? Journal
of Advertising Research, 56(4), 401–413. https://doi.org/10.2501/JAR-2016-045
Coleman, N. V., & Williams, P. (2013). Feeling Like My Self: Emotion Profiles and Social
Identity. Journal of Consumer Research, 40(2), 203–222. https://doi.org/10.1086/669483
Coleman, N. V., & Williams, P. (2015). Looking for my self: Identity-driven attention allocation.
Journal of Consumer Psychology, 25(3), 504–511.
https://doi.org/10.1016/j.jcps.2015.01.001
Connolly, K. M., Olatunji, B. O., & Lohr, J. M. (2008). Evidence for disgust sensitivity
mediating the sex differences found in blood-injection-injury phobia and spider phobia.
Personality and Individual Differences, 44(4), 898–908.
https://doi.org/10.1016/j.paid.2007.10.020
Cooper, H., Hedges, L. V., & Valentine, J. C. (Eds.). (2009). The handbook of research synthesis
74
and meta-analysis. New York, NY, US: Russell Sage Foundation.
Cumming, G. (2014). The New Statistics: Why and How. Psychological Science, 25(1), 7–29.
https://doi.org/10.1177/0956797613504966
Dahl, D. W., Frankenberger, K. D., & Manchanda, R. V. (2003). Does It Pay to Shock?
Reactions to Shocking and Nonshocking Advertising Content among University
Students. Journal of Advertising Research, 43(03), 268–280.
https://doi.org/10.1017/S0021849903030332
DeWall, C. N., Baumeister, R. F., Gailliot, M. T., & Maner, J. K. (2008). Depletion Makes the
Heart Grow Less Helpful: Helping as a Function of Self-Regulatory Energy and Genetic
Relatedness. Personality and Social Psychology Bulletin, 34(12), 1653–1662.
https://doi.org/10.1177/0146167208323981
Fanelli, D. (2010). Do pressures to publish increase scientists’ bias? An empirical support from
US States Data. PloS One, 5(4), e10271. https://doi.org/10.1371/journal.pone.0010271
Faul, F., Erdfelder, E., Lang, A.-G., & Buchner, A. (2007). G*Power 3: A flexible statistical
power analysis program for the social, behavioral, and biomedical sciences. Behavior
Research Methods, 39(2), 175–191. https://doi.org/10.3758/BF03193146
Franco, A., Malhotra, N., & Simonovits, G. (2014). Publication bias in the social sciences:
Unlocking the file drawer. Science, 345(6203), 1502–1505.
https://doi.org/10.1126/science.1255484
Gelman, A., & Carlin, J. (2014). Beyond Power Calculations: Assessing Type S (Sign) and Type
M (Magnitude) Errors. Perspectives on Psychological Science, 9(6), 641–651.
https://doi.org/10.1177/1745691614551642
Gelman, A., & Weakliem, D. (2007). Of beauty, sex and power: statistical challenges in
75
estimating small effects. Unpublished Technical Paper, Statistics Department, Columbia
University, New York.
Gross, J. J., & Levenson, R. W. (1995). Emotion elicitation using films. Cognition & Emotion,
9(1), 87–108. https://doi.org/10.1080/02699939508408966
Higgins, J. P. T., & Thompson, S. G. (2002). Quantifying heterogeneity in a meta-analysis.
Statistics in Medicine, 21(11), 1539–1558. https://doi.org/10.1002/sim.1186
Horberg, E. J., Keltner, D., Oveis, C., & Cohen, A. B. (2009). Disgust and the Moralization of
Purity. Journal of Personality & Social Psychology, 97(6), 963–976.
https://doi.org/10.1037/a0017423
Huhmann, B. A., & Limbu, Y. B. (2016). Influence of gender stereotypes on advertising
offensiveness and attitude toward advertising in general. International Journal of
Advertising, 35(5), 846–863. https://doi.org/10.1080/02650487.2016.1157912
Jonas, E., Schimel, J., Greenberg, J., & Pyszczynski, T. (2002). The Scrooge Effect: Evidence
that Mortality Salience Increases Prosocial Attitudes and Behavior. Personality and
Social Psychology Bulletin, 28(10), 1342–1353.
https://doi.org/10.1177/014616702236834
Jones, A., & Fitness, J. (2008). Moral hypervigilance: the influence of disgust sensitivity in the
moral domain. Emotion, 8(5), 613. https://doi.org/10.1037/a0013435
Lang, P. J., Bradley, M. M., & Cuthbert, B. N. (1999). International affective picture system
(IAPS): Instruction manual and affective ratings. The Center for Research in
Psychophysiology, University of Florida.
Laros, F. J. M., & Steenkamp, J.-B. E. M. (2005). Emotions in consumer behavior: a hierarchical
approach. Journal of Business Research, 58(10), 1437–1445.
76
https://doi.org/10.1016/j.jbusres.2003.09.013
Lee, J., & Shrum, L. J. (2012). Conspicuous Consumption versus Charitable Behavior in
Response to Social Exclusion: A Differential Needs Explanation. Journal of Consumer
Research, 39(3), 530–544. https://doi.org/10.1086/664039
Lee, J., & Shrum, L. J. (2013). Self-Threats and Consumption. In A. A. Ruvio & R. W. Belk
(Eds.), The Routledge Companion to Identity and Consumption (pp. 216–24). New York,
NY, US: Routledge.
Lee, S. W. S., & Ellsworth, P. C. (2013). Maggots and morals: Physical disgust is to fear as
moral disgust is to anger. In J. R. J. Fontaine, K. R. Scherer, & C. Soriano (Eds.),
Components of Emotional Meaning (pp. 271–280). Oxford: Oxford University Press.
Lerner, J. S., & Keltner, D. (2000). Beyond valence: Toward a model of emotion-specific
influences on judgement and choice. Cognition and Emotion, 14(4), 473–493.
https://doi.org/10.1080/026999300402763
Lerner, J. S., & Keltner, D. (2001). Fear, anger, and risk. Journal of Personality and Social
Psychology, 81(1), 146–159. https://doi.org/10.1037/0022-3514.81.1.146
Liberzon, I., Taylor, S. F., Fig, L. M., Decker, L. R., Koeppe, R. A., & Minoshima, S. (2000).
Limbic Activation and Psychophysiologic Responses to Aversive Visual Stimuli:
Interaction with Cognitive Task. Neuropsychopharmacology, 23(5), 508–516.
https://doi.org/10.1016/S0893-133X(00)00157-3
Marzillier, S. L. D., Graham C. (2004). The emotional profiling of disgust-eliciting stimuli:
Evidence for primary and complex disgusts. Cognition & Emotion, 18(3), 313–336.
https://doi.org/10.1080/02699930341000130
Mcshane, B. B., & Böckenholt, U. (2017). Single Paper Meta-analysis: Benefits for Study
77
Summary, Theory-testing, and Replicability. Journal of Consumer Research.
https://doi.org/10.1093/jcr/ucw085
Morales, A. C., & Fitzsimons, G. J. (2007). Product contagion: Changing consumer evaluations
through physical contact with “disgusting” products. Journal of Marketing Research,
44(2), 272–283. https://doi.org/10.1509/jmkr.44.2.272
Morales, A. C., Wu, E. C., & Fitzsimons, G. J. (2012). How disgust enhances the effectiveness
of fear appeals. Journal of Marketing Research, 49(3), 383–393.
https://doi.org/10.1509/jmr.07.0364
Morales, A., & Wu, E. (2012). Disgust and Identity. In R. W. Belk & A. A. Ruvio (Eds.), The
Routledge Companion to Identity and Consumption (pp. 72–79). New York, NY, US:
Routledge. https://doi.org/10.4324/9780203105337.ch7
Olatunji, B. O. (2008). Disgust, scrupulosity and conservative attitudes about sex: Evidence for a
mediational model of homophobia. Journal of Research in Personality, 42(5), 1364–
1369. https://doi.org/10.1016/j.jrp.2008.04.001
Olatunji, B. O., Haidt, J., McKay, D., & David, B. (2008). Core, animal reminder, and
contamination disgust: Three kinds of disgust with distinct personality, behavioral,
physiological, and clinical correlates. Journal of Research in Personality, 42(5), 1243–
1259. https://doi.org/10.1016/j.jrp.2008.03.009
Parry, S., Jones, R., Stern, P., & Robinson, M. (2013). ‘Shockvertising’: An exploratory
investigation into attitudinal variations and emotional reactions to shock advertising.
Journal of Consumer Behaviour, 12(2), 112–121. https://doi.org/10.1002/cb.1430
Peters, G.-J. Y., Ruiter, R. A. C., & Kok, G. (2013). Threatening communication: a critical re-
analysis and a revised meta-analytic test of fear appeal theory. Health Psychology
78
Review, 7(sup1), S8–S31. https://doi.org/10.1080/17437199.2012.703527
Reed II, A., Forehand, M. R., Puntoni, S., & Warlop, L. (2012). Identity-based consumer
behavior. International Journal of Research in Marketing, 29(4), 310–321.
https://doi.org/10.1016/j.ijresmar.2012.08.002
Roseman, I. J., Spindel, M. S., & Jose, P. E. (1990). Appraisals of emotion-eliciting events:
Testing a theory of discrete emotions. Journal of Personality and Social Psychology,
59(5), 899–915. https://doi.org/10.1037/0022-3514.59.5.899
Rottenberg, J., Ray, R. D., & Gross, J. J. (2007). Emotion elicitation using films. In J. A. Coan &
J. J. Allen (Eds.), Handbook of emotion elicitation and assessment (pp. 9–28). Oxford:
Oxford university press.
Rozin, P., Haidt, J., & McCauley, C. R. (2005). Disgust: The Body and Soul Emotion. In T.
Dalgleish & M. J. Power (Eds.), Handbook of Cognition and Emotion (pp. 429–445).
Chichester, UK: John Wiley & Sons, Ltd.
Rozin, P., Haidt, J., & McCauley, C. R. (2008). Disgust. In M. Lewis, J. M. Haviland-Jones, &
L. F. Barrett (Eds.), Handbook of emotions (3rd ed.) (pp. 757–776). New York, NY, US:
Guilford Press.
Rucker, D. D., & Galinsky, A. D. (2008). Desire to Acquire: Powerlessness and Compensatory
Consumption. Journal of Consumer Research, 35(2), 257–267.
https://doi.org/10.1086/588569
Rucker, D. D., & Galinsky, A. D. (2009). Conspicuous consumption versus utilitarian ideals:
How different levels of power shape consumer behavior. Journal of Experimental Social
Psychology, 45(3), 549–555. https://doi.org/10.1016/j.jesp.2009.01.005
Sabri, O. (2012). Taboo advertising : can humor help to attract attention and enhance recall?
79
Journal of Marketing Theory and Practice, 20(4), 407–422.
https://doi.org/10.2753/MTP1069-6679200404
Scherer, K. R. (1988). Criteria for Emotion-Antecedent Appraisal: A Review. In V. Hamilton, G.
H. Bower, & N. H. Frijda (Eds.), Cognitive Perspectives on Emotion and Motivation (pp.
89–126). Springer Netherlands. https://doi.org/10.1007/978-94-009-2792-6_4
Scherer, K. R. (1999). Appraisal theory. In T. Dalgleish & M. J. Power (Eds.), Handbook of
cognition and emotion (pp. 637–663). New York, NY, US: John Wiley & Sons Ltd.
Scherer, K. R. (2005). What are emotions? And how can they be measured? Social Science
Information, 44(4), 695–729. https://doi.org/10.1177/0539018405058216
Schmidt, F. L., & Hunter, J. E. (2014). Methods of Meta-Analysis: Correcting Error and Bias in
Research Findings. Thousand Oaks, Calif: SAGE Publications.
Schnall, S., Haidt, J., Clore, G. L., & Jordan, A. H. (2008). Disgust as Embodied Moral
Judgment. Personality and Social Psychology Bulletin, 34(8), 1096–1109.
https://doi.org/10.1177/0146167208317771
Scudder, J. N., & Mills, C. B. (2009). The credibility of shock advocacy: Animal rights attack
messages. Public Relations Review, 35(2), 162–164.
https://doi.org/10.1016/j.pubrev.2008.09.007
Smith, C. A., & Ellsworth, P. C. (1985). Patterns of cognitive appraisal in emotion. Journal of
Personality and Social Psychology, 48(4), 813. http://psycnet.apa.org/doi/10.1037/0022-
3514.48.4.813
Smith, C. A., & Lazarus, R. S. (1990). Emotion and adaptation. In L. A. Pervin (Ed.), Handbook
of personality: Theory and research (pp. 609–637). New York, NY, US: Guilford Press.
So, J., Achar, C., Han, D., Agrawal, N., Duhachek, A., & Maheswaran, D. (2015). The
80
psychology of appraisal: Specific emotions and decision-making. Journal of Consumer
Psychology, 25(3), 359–371. https://doi.org/10.1016/j.jcps.2015.04.003
Storbeck, J., & Clore, G. L. (2007). On the interdependence of cognition and emotion. Cognition
& Emotion, 21(6), 1212–1237. https://doi.org/10.1080/02699930701438020
Tufanaru, C., Munn, Z., Stephenson, M., & Aromataris, E. (2015). Fixed or random effects meta-
analysis? Common methodological issues in systematic reviews of effectiveness:
International Journal of Evidence-Based Healthcare, 13(3), 196–207.
https://doi.org/10.1097/XEB.0000000000000065
Vignoles, V. L. (2011). Identity Motives. In S. J. Schwartz, K. Luyckx, & V. L. Vignoles (Eds.),
Handbook of Identity Theory and Research (pp. 403–432). New York, NY, US: Springer.
Vignoles, V. L., Regalia, C., Manzi, C., Golledge, J., & Scabini, E. (2006). Beyond self-esteem:
Influence of multiple motives on identity construction. Journal of Personality and Social
Psychology, 90(2), 308–333. https://doi.org/10.1037/0022-3514.90.2.308
Williams, K. D. (2007). Ostracism. Annual Review of Psychology, 58(1), 425–452.
https://doi.org/10.1146/annurev.psych.58.110405.085641
Witte, K., & Allen, M. (2000). A Meta-Analysis of Fear Appeals: Implications for Effective
Public Health Campaigns. Health Education & Behavior, 27(5), 591–615.
https://doi.org/10.1177/109019810002700506
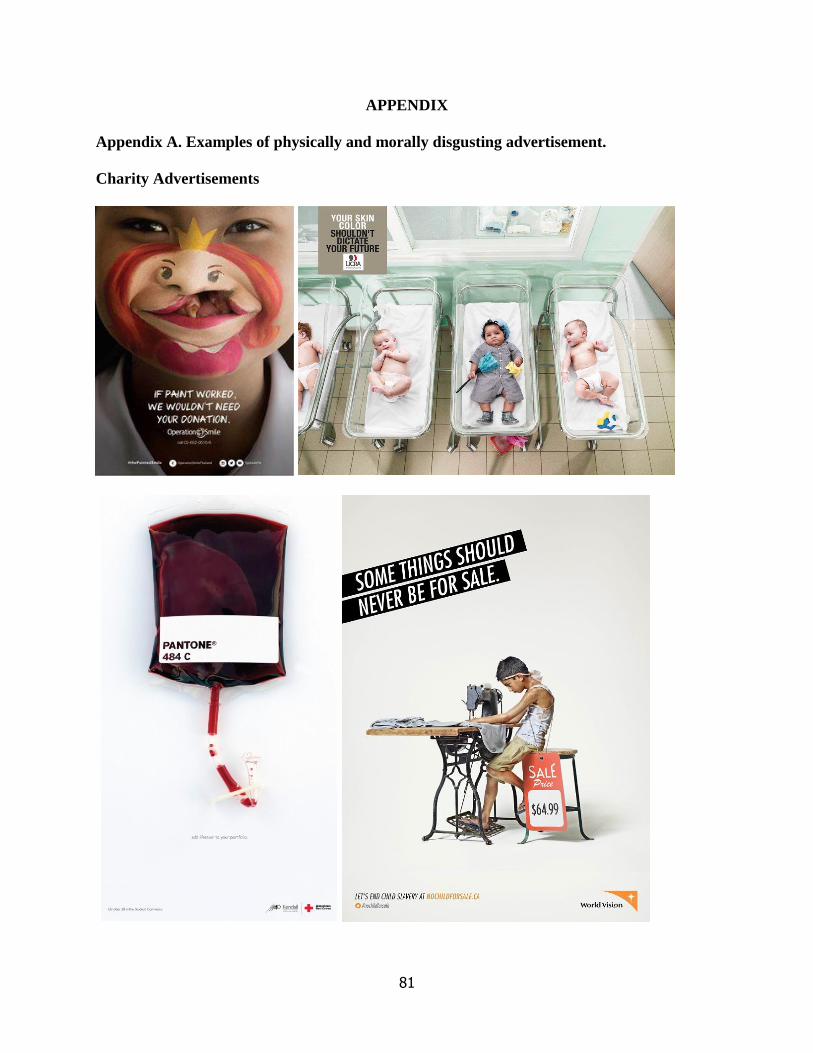
81
APPENDIX
Appendix A. Examples of physically and morally disgusting advertisement.
Charity Advertisements

82
Luxury Products (Cars and Hotels)
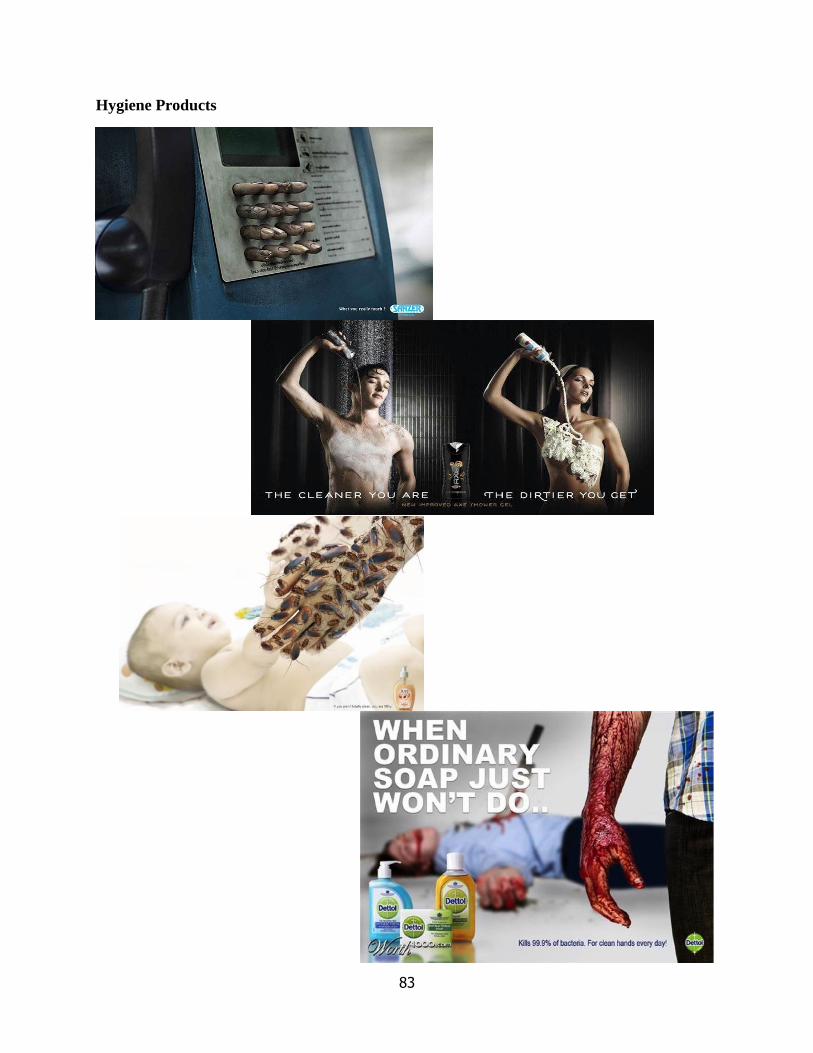
83
Hygiene Products
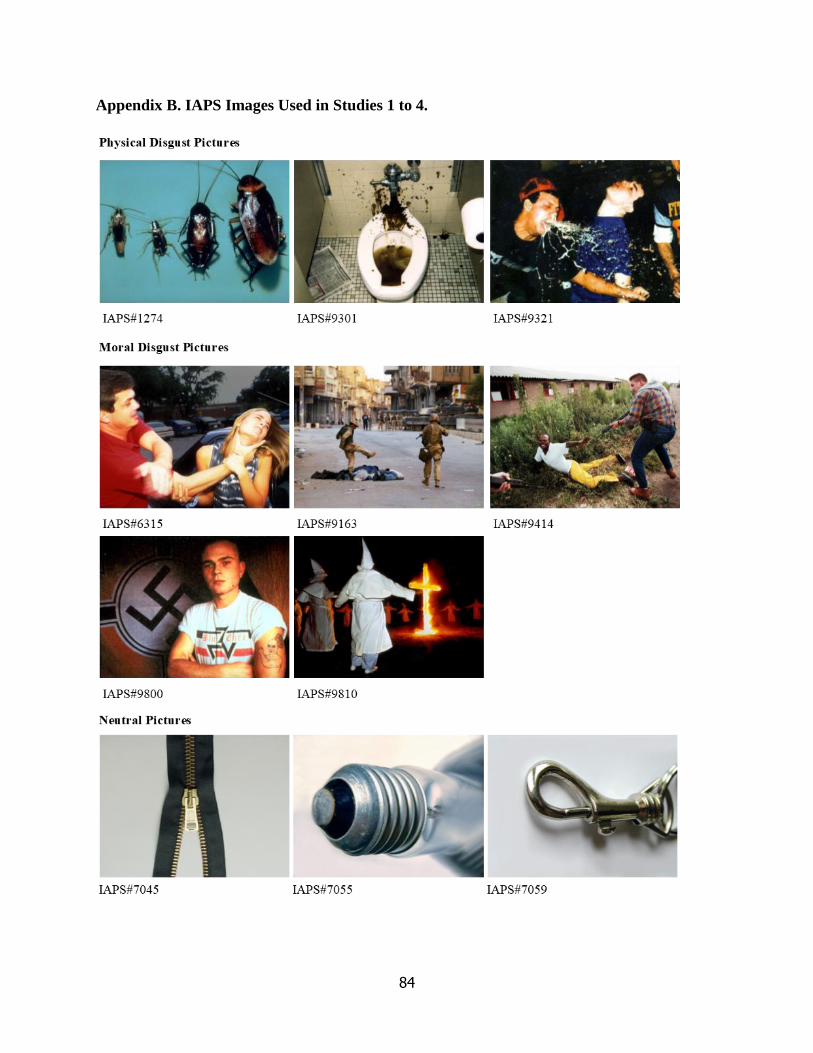
84
Appendix B. IAPS Images Used in Studies 1 to 4.
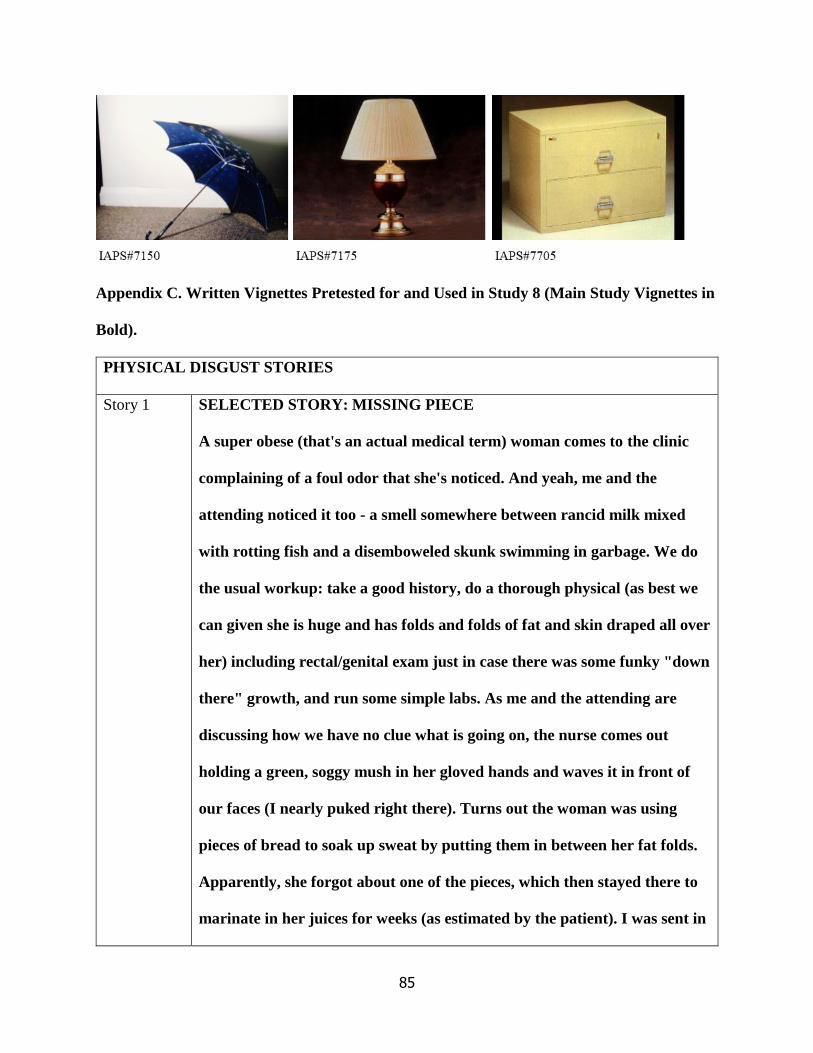
85
Appendix C. Written Vignettes Pretested for and Used in Study 8 (Main Study Vignettes in
Bold).
PHYSICAL DISGUST STORIES
Story 1 SELECTED STORY: MISSING PIECE
A super obese (that's an actual medical term) woman comes to the clinic
complaining of a foul odor that she's noticed. And yeah, me and the
attending noticed it too - a smell somewhere between rancid milk mixed
with rotting fish and a disemboweled skunk swimming in garbage. We do
the usual workup: take a good history, do a thorough physical (as best we
can given she is huge and has folds and folds of fat and skin draped all over
her) including rectal/genital exam just in case there was some funky "down
there" growth, and run some simple labs. As me and the attending are
discussing how we have no clue what is going on, the nurse comes out
holding a green, soggy mush in her gloved hands and waves it in front of
our faces (I nearly puked right there). Turns out the woman was using
pieces of bread to soak up sweat by putting them in between her fat folds.
Apparently, she forgot about one of the pieces, which then stayed there to
marinate in her juices for weeks (as estimated by the patient). I was sent in
86
to see if there were any more hidden pieces; luckily there wasn't, but
having to lift up and search every fat fold was as embarrassing for her as it
was terrible for me.
Story 2 SELECTED STORY: NURSE AID FOR BEGINNERS
I used to be a nurses aid. I once had to put a very obese woman on the bedpan
(she was only mid 40's) and I left. She put her call light on and when I
answered she said she was all done. I turn her on her side to remove the bedpan
only to see that it is empty. My first thought was that she had been mistaken
about having pooped. But then I look and realize that her ass cheeks were so
massive her entire dump couldn't make it the length of her cheeks and had
gotten wedged in between them. I had to dig the entire load out of her as by
hand. It was only about two months into the job and it gave me some serious
second thoughts.
Story 3 SELECTED STORY: HAPPY ENDING
A couple from suburban California were vacationing in Jamaica when their
room was broken into and everything stolen, with the exception of their camera
and their toothbrushes. Considering themselves fortunate to have retained the
camera with their vacation photos, they returned home where they had the film
developed.
Two pictures were unidentifiable — something like an aerial view of two
mounds of dark earth with a pole in between. They later realized, to their
horror, that it was a photo of their toothbrushes up someone's rear end.
MORAL DISGUST STORIES
87
Story 1 SELECTED STORY: DIRTY DOCTOR
Probation officer for violent sex offenders here. I’ve got a few I could add
to this but this one sticks with me as the ‘worst.’ A doctor in the children’s
department at a very popular hospital was raping the pre-teen terminally
ill girls during the night shift. This went on a couple times a month for
years before he was finally caught. One of the girls lived longer than the
doctors expected and complained of ‘pains.’ During an inspection, they
discovered the rape and posted cameras which eventually caught him. He
ended up getting probation because he A: could afford great lawyers who
got him in front of a sympathetic judge; and B: most of his victims were
dead. He’d up the pain meds before the act so that there would be less
resistance. The court never knew the extent of his deviance, but after I
finally got his polygraphs back we learned the full story. He eventually
died in custody after we got him on a violation.
Story 2 SELECTED STORY: AN ODE TO VIOLENCE
All I can think about is that boy’s skull, bashed in, the way his head was caved
in and how it wasn’t like a head at all, just like a broken silly puppet face, about
how when you destroy something, when you brutalise it, it always looks
warped and disfigured and slightly unreal and unhuman and that’s what makes
it easier for you to go on brutalising it, go on fucking it and hurting it and
mashing until you’ve destroyed it completely, proving that destruction is
natural in the human spirit, that nature has devices to enable us to destroy, to
make it easier for us; a way of making righteous people who want to act do
88
things without the fear of consequence, a way of making us less than human, as
we break the laws.
Story 3 SELECTED STORY: SHOE SHINE INCIDENT
I was standing with my father on a train platform in Lao Cai, a city on the
Vietnamese/Chinese border. Next to us, an Australian woman was trying to
negotiate down the price of a shoe-shine with a local boot-black, a boy perhaps
eight years of age. The boy pointed out the obvious: his asking price of 500
đồng (about 3¢ US at the time) was rock bottom, not by his own policy but by
the fact that the Vietnamese government did not print any bill smaller than the
500. That only stymied the Australian for only a moment. “Shine my shoes and
his,” she insisted, indicating at me — a person she had never seen before in her
life, but, by virtue of my white face, apparently more worthy of her largess than
this starving child. I indicated that my shoes — which were plastic sandals of
the sort Americans call “flip-flops” and Australians call “thongs” — could not
be shined, so the woman moved on to the only other Westerner on the platform
and forced this poor kid to clean my father’s suede athletic shoes as well as her
expensive pumps.
CONTROL STORIES
Story 1 SELECTED STORY: DIVINE BLOOMS
The landscape was every vivid color, every one of them as fresh as a new
painting straight from Rome. The brilliant greens banished every dark thought
and the sky lifted the eye in a way that brought the villagers to admire the
89
strands of drifting white cloud. The trees were deep with late spring foliage and
the flowers rioted in the jubilant way that only the most divine of blooms can.
Story 2 SELECTED STORY: HANDSOME MAN
He had the kind of face that stopped you in your tracks. I guess he must get
used to that, the sudden pause in a person's natural expression when they looked
his way followed by overcompensating with a nonchalant gaze and a weak
smile. Of course the blush that accompanied it was a dead give-away. It didn't
help that he was so modest with it, it made the girls fall for him all the more.
Despite all the opportunity that came his way he was a one-woman-man who
prized genuineness and thoughtful conversation above lipstick and high-heels.
He was handsome alright, but inside he was beautiful.
Story 3 SELECTED STORY: COFFEE IN CUBA
Coffee just didn't taste the same anymore, ever since Cuba. He had gone to
get his regular, a large cup of black joe with one packet of sugar, at the
corner coffee shop. He had taken one sip of this so called "coffee" it tasted
more like boiled water with dirt. Coffee in Havana tasted like summer and
all the things that came along with it like: sunshine, cigars, and
Medianoche at midnight at the hottest clubs. Now this dirt water sat in his
hand even more useless now that it was warm, not piping hot which he'd
grown accustomed to. He gave up on this "coffee" tossing the rest of it into
a nearby garbage can.
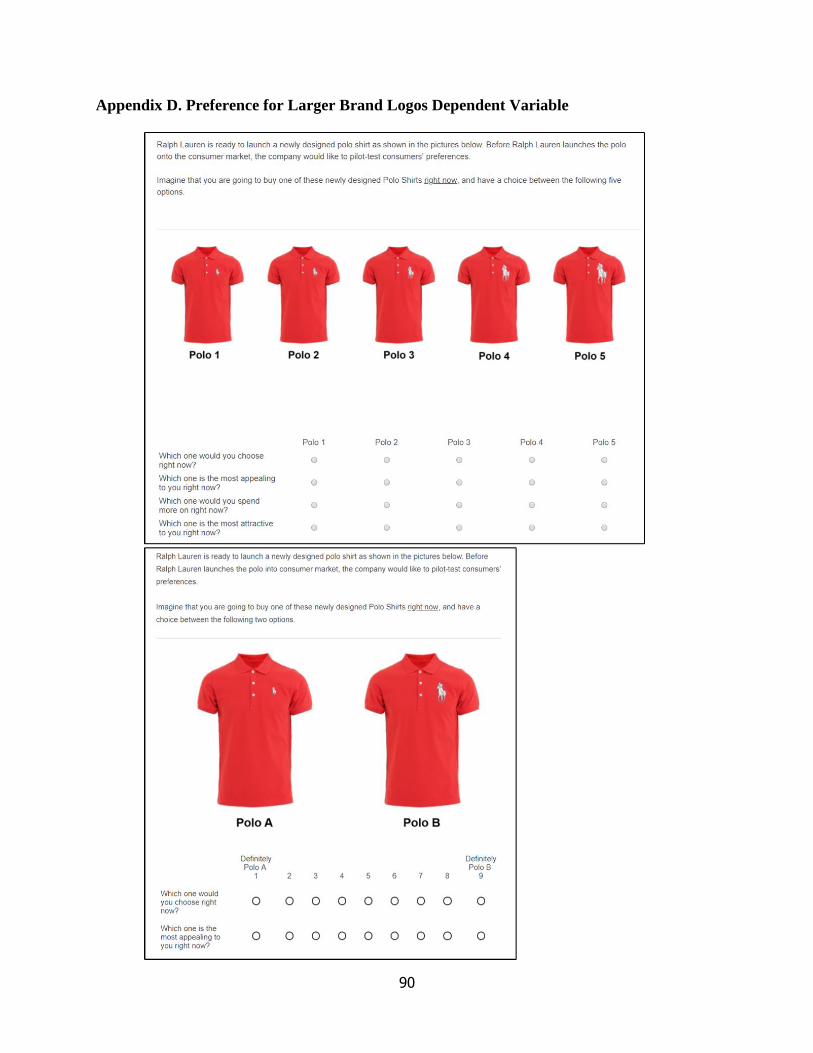
90
Appendix D. Preference for Larger Brand Logos Dependent Variable
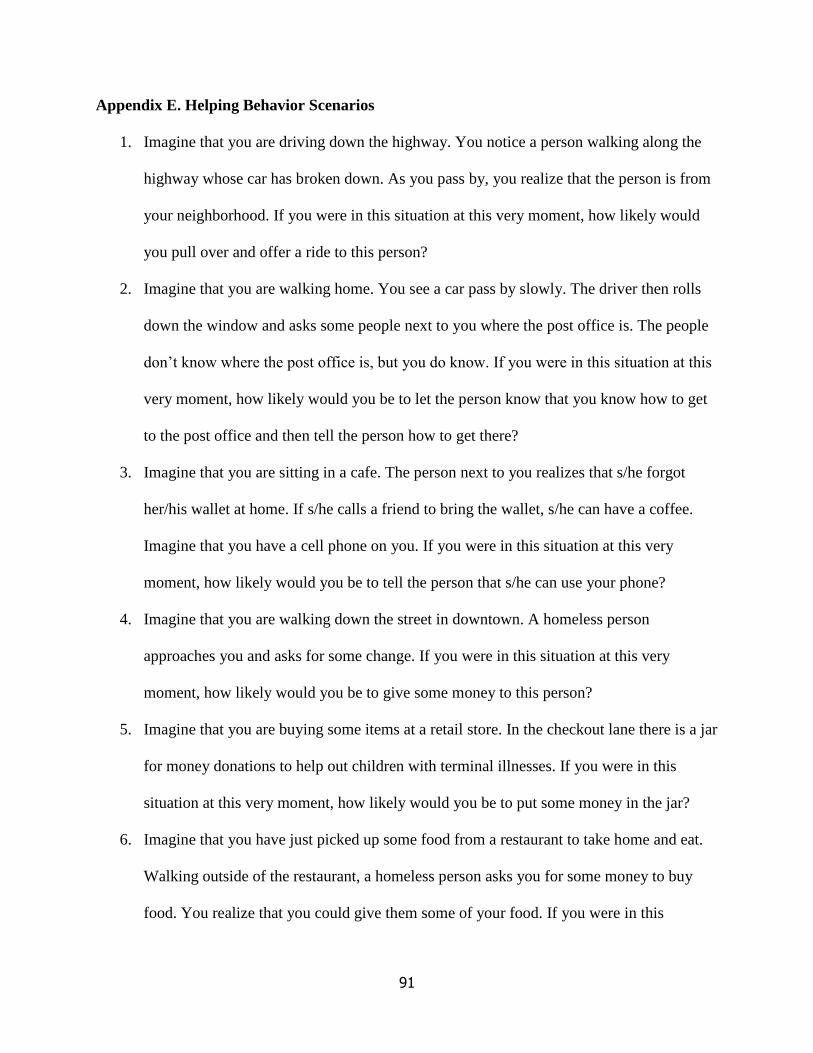
91
Appendix E. Helping Behavior Scenarios
1. Imagine that you are driving down the highway. You notice a person walking along the
highway whose car has broken down. As you pass by, you realize that the person is from
your neighborhood. If you were in this situation at this very moment, how likely would
you pull over and offer a ride to this person?
2. Imagine that you are walking home. You see a car pass by slowly. The driver then rolls
down the window and asks some people next to you where the post office is. The people
don’t know where the post office is, but you do know. If you were in this situation at this
very moment, how likely would you be to let the person know that you know how to get
to the post office and then tell the person how to get there?
3. Imagine that you are sitting in a cafe. The person next to you realizes that s/he forgot
her/his wallet at home. If s/he calls a friend to bring the wallet, s/he can have a coffee.
Imagine that you have a cell phone on you. If you were in this situation at this very
moment, how likely would you be to tell the person that s/he can use your phone?
4. Imagine that you are walking down the street in downtown. A homeless person
approaches you and asks for some change. If you were in this situation at this very
moment, how likely would you be to give some money to this person?
5. Imagine that you are buying some items at a retail store. In the checkout lane there is a jar
for money donations to help out children with terminal illnesses. If you were in this
situation at this very moment, how likely would you be to put some money in the jar?
6. Imagine that you have just picked up some food from a restaurant to take home and eat.
Walking outside of the restaurant, a homeless person asks you for some money to buy
food. You realize that you could give them some of your food. If you were in this

92
situation at this very moment, how likely would you be to offer some of your food to the
person?
93
Capitolo 2 ESSAY TWO
Spoiled Rotten: Unconditional Business-to-Consumer
Gift-Giving and Customer Negative Behavioral Intentions
ABSTRACT
This research examines customers’ negative behavioral intentions towards firms that stop giving
them unconditional gifts. Although it might be argued that this is a simple case of expectation
disconfirmation, building on attribution theory we theorize and empirically demonstrate that a
less obvious mechanism is at play. We find that when firms offer valuable unconditional gifts
repeatedly and regularly, customers develop a sense of entitlement that overshadows their
feelings of gratitude to the firm. Specifically, when business-to-consumer unconditional gift-
giving initiatives are terminated, customers exhibit negative behavioral intentions towards firms
that spoiled them in the past because of their heightened sense of entitlement. Moreover, we
provide evidence that by boosting customers’ gratitude and by changing the framing of the
recipient selection criteria, this effect can be attenuated. We discuss theoretical and practical
implications of this work for the design of business-to-consumer unconditional gifting initiatives.
Keywords: Business-to-consumer gift-giving, business gifts, sales promotions,
customer entitlement, customer gratitude, customer negative behavioral intentions
When loyalty programs are discontinued, I feel as if I lost something. […] I’m feeling frustration
94
here and yet the practical side of me says that I shouldn’t get upset about losing something that
was a “freebie” in the first place.
― Syd Bolton, Brantford Expositor Opinion Column
INTRODUCTION
Unconditional business-to-consumer (B2C) gifts are defined as business gifts that firms
offer to their customers regardless of whether they expended effort to gain them (Beltramini,
1992, 2000; Bodur & Grohmann, 2005; Otnes & Beltramini, 1996). In other words, they are
spontaneous gifts that firms offer to their customers unconditionally, meaning without firms
stating pre-determined eligibility criteria or explicit reciprocation request (e.g., “here is a free
dessert with your dinner” versus “get a free dessert for every order over 50$” or “get a free
dessert if you place three orders within two months”). It is not uncommon for firms to offer
tokens of appreciation to their customers even if they don’t subscribe to a specific loyalty
program and even if they haven’t purchased a certain quantity of products or services. A gift of
this kind can be regarded as a form of social exchange, as opposed to an economic exchange, and
theoretically should be more effective in eliciting feelings of gratitude, stimulating reciprocation,
and forming strong lasting relationships (Henderson, Beck, & Palmatier, 2011; Morales, 2005;
Palmatier, Jarvis, Bechkoff, & Kardes, 2009).
A recent study by Accenture reports that “Receiving tokens of affection” is the number
three factor, after “Brands protecting their personal information” and “Brands respecting their
time,” influencing brand loyalty in the United States. Additionally, the survey highlights that
59% of U.S. consumers feel loyal to brands that present them with small tokens of affection,
such as personalized discounts, gift cards, and special offers to reward their loyalty (Accenture,
2016). However, previous research has shown that customer special treatment might also lead to
95
unwarranted negative consequences. Spoiled customers develop a dangerous sense of entitlement
that increases costs, lowers profits, and prompts unethical behaviors (Polyakova, Ordanini, &
Estes, 2014; Wetzel, Hammerschmidt, & Zablah, 2014). Notwithstanding these first studies
examining the relationship between firms’ relational efforts and customer entitlement, our
understanding of why and how customer entitlement originates in these promotional contexts
remains limited. We build on attribution theory (Folkes, 1988; Kelley, 1967, 1973) to posit and
provide evidence that even if given unconditionally, customers become entitled to business-to-
consumer gifts when they are valuable and when they are provided on a regular and predictable
basis. We find three boundary conditions that, together with our additional empirical results,
allow us to provide actionable managerial insights to help firms prevent customers from
becoming entitled to their gift-giving initiatives.
Another issue that remains unexplored by extant literature on business gifts is what
happens when firms terminate gift-giving initiatives. Despite increased use of freebies, birthday
discounts, free shipping, and other forms of unconditional business-to-consumer gifts regularly
given away by firms with no minimum purchase necessary (e.g., Free Sephora Makeovers,
Krispy Kream Free Donut on National Donut Day, Free Kids Workshops at Home Depot), and
despite the growing acclaim for such marketing actions in the popular press (Alton 2016; Fasig
2015; Ferdman 2015; Hall 2013; White 2013), no research has examined what happens when
firms decide to stop giving free gifts.
We believe this is not a trivial question as a global trend of pausing promotional
escalation and of redefining promotional budgets is emerging (Eales, 2016; IEG, 2017). Also, it
is common for firms to terminate gifting and other promotional efforts when the offer was meant
to be for a limited time. Unlike loyalty-based programs for which firms must use an exit strategy
96
(e.g., a date by which to redeem remaining points) to ensure that their customers will not react
negatively to its termination (Melnyk & Bijmolt, 2015; Rehnen, 2016), firms might wrongfully
assume that terminating unconditional business-to-consumer gift-giving does not require a
formal termination strategy because of the unconditional nature of the gift. When firms’
promotional efforts are based on loyalty programs requirements that customers fulfil and are
clearly communicated to them (e.g., collecting 100 points grants access to the VIP area),
entitlement arises because customers come to feel that they deserve special treatment by virtue of
their loyalty or effortful actions. Less clear is whether customers come to feel entitled when
firms offer them unconditional gifts without explaining the purpose or limits of the promotion.
Common sense would suggest that customers who do not have to do anything to earn a benefit
should not believe that they deserve it, and thus should not react negatively to the initiative
ending.
If not empirically tested, the assumption that no termination strategy is required can be
extremely dangerous for firms. Anecdotal evidence suggests that terminating promotional
initiatives can generate a wide variety of customer negative retaliatory behaviors. For example,
when Subway discontinued its Sub Club initiative, customers raged against employees, started an
online petition, and complained on their personal blogs (Ogles, 2005). More recently, Starbucks’
changes to its reward program caused outrage among its customers, especially gold level ones,
who vocally protested on Twitter and publicly announced their intentions to switch to
competitors (Mezzofiore, 2016). Our study fills this gap and extends prior literature by
investigating the effect of unconditional business-to-consumer gift-giving initiatives termination
on negative customer behavioral tendencies towards firms. We find that when customers become
entitled to firms’ unconditional gifts and firms terminate their gifting initiatives, customers
97
exhibit negative behavioral tendencies towards the firm that spoiled them. For example, we show
that entitled customers who feel wronged express willingness to retaliate against the firm by
ceasing to buy the product or service, buying elsewhere, spreading negative word-of-mouth, and
even submitting direct complaints (Grégoire & Fisher, 2008; Huefner & Hunt, 2000).
A series of four studies examines what happens when customers no longer receive
unconditional gifts and finds that customers indeed express negative behavioral intentions
towards firms. The first two studies focus on uncovering the antecedents of customer entitlement
in the context of unconditional business-to-consumer gift-giving. Studies 1 and 2 demonstrate
that only customers who regularly and repeatedly receive valuable unconditional gifts develop a
sense of entitlement. In Study 3, we validate that regularity is an important antecedent of
customer entitlement, but we also demonstrate that boosting customer gratitude can counteract
negative customer intentions following unconditional gifting termination. Finally, delving deeper
into the process of customer entitlement, in Study 4 we show that customers become entitled to
gifts they do not earn because they infer that they are valuable to the firm. With a moderation-of-
process design, we show that when customers are explicitly told by the firm that the selection
criteria by which gift recipients are chosen is not related to customer value, they no longer feel
entitled or exhibit negative behavioral intentions.
This essay progresses as follows. First, we introduce our conceptual framework and
develop the main hypotheses related to the effect of firms’ unconditional gift-giving termination
on customers negative behavioral intentions. We note here that Table 1 presents the key elements
of prior research linked to our theorizing and the research gaps this essay addresses. Second, we
present four studies that test our hypotheses; an overview of the studies is presented in Figure 1.
Third, we discuss the theoretical and practical implications of our findings. Finally, we discuss
98
the limitations of our research, and suggest areas for future research.
THEORETICAL BACKGROUND
Unconditional business-to-consumer gift-giving
A gift is defined as a benefit that a party (i.e., giver) givers voluntarily to another (i.e.,
recipient) regardless of the type of benefit given and of the giver motives (Sherry, 1983). Gift-
giving research has conceptualized four main functions of a gift: communication, social
exchange, economic exchange and socializer (Belk, 1976, 1979). Traditionally, the marketing
literature has addressed two aspects of gift-giving: the economic exchange and the social
exchange. In particular, research on the economic exchange value of gift-giving focused on
concrete aspects of gift-giving such as type of gift chosen, choice effort, and money value of the
gift (Belk, 1979; Garner & Wagner, 1991). Differently, research on the social exchange value of
gift-giving has investigated the relationships between gift, donors, recipients, and situational
conditions (Belk & Coon, 1993; Sherry, 1983). Finally, regardless of the specific paradigm of
interest, researchers from different disciplines have all theorized that the mechanism underlying
gift-giving exchanges is the social norm of reciprocity (Belk, 1976; Schwartz, 1967; Sherry,
1983). The norm of reciprocity refers to the common social expectation that people will return
benefits for benefits (Gouldner, 1960). Therefore, the reciprocity that the gift recipient owes to
the gift giver is the force behind gift-giving’s continuous perpetration and its function of forming
and maintaining social relationships.
The social relationship building and reciprocity aspects of gift-giving are at the core of
business gifts initiatives. Business gifts are frequently used by firms to please their customers
and to foster reciprocation in the form of increased sales, higher re-purchase intentions, and
overall satisfaction (Beltramini, 1992, 2000). On a more general level, firms offer gifts to their
99
customers to build lasting relationships that form the basis of many positive customer behaviors
such as loyalty (Henderson et al., 2011). In the sales promotion and loyalty programs literature,
researchers have often distinguished between monetary (e.g., discount) and non-monetary (e.g.,
sweepstakes) aspects of free gifts (Chandon, Wansink, & Laurent, 2000; Kwok & Uncles, 2005),
but in the present research we focus on the conditional and unconditional aspects of those
initiatives. In particular, we examine one frequently used sales promotion strategy: unconditional
business-to-consumer gift-giving (Bodur & Grohmann, 2005). As the term suggests, we
concentrate on a customer reward that is independent of customers’ actions, as no explicit
reciprocation request is made by the firm. For example, an unconditional gift would never be
followed by an explicit reciprocation request, such as “the gift certificate is conditional on
placing three orders in the next six months,” but it is more likely to be used to elicit the
reciprocation behaviors that are implicitly associated with the gift itself (e.g., “we appreciate
your business”).
We are interested in this type of gift because they are commonly used in business
practice, but no research has examined their potential to harm firms. Previous research has
shown that offering perks to customers can backfire by promoting negative and opportunistic
customer behaviors. In particular, Wetzel and colleagues (2014) showed that offering prioritized
benefits to customers not only induced gratitude, which increased the firm’s sales and
profitability, but also induced entitlement (e.g., I deserve this), which increased the firms’ service
costs and reduced its profits. When free gifts have been earned through repeated purchases or
participation in loyalty programs tied to explicit reciprocation requests (e.g., “buy one, get one
free”; “gold members get free breakfast”), customer sense of entitlement is easily understood—
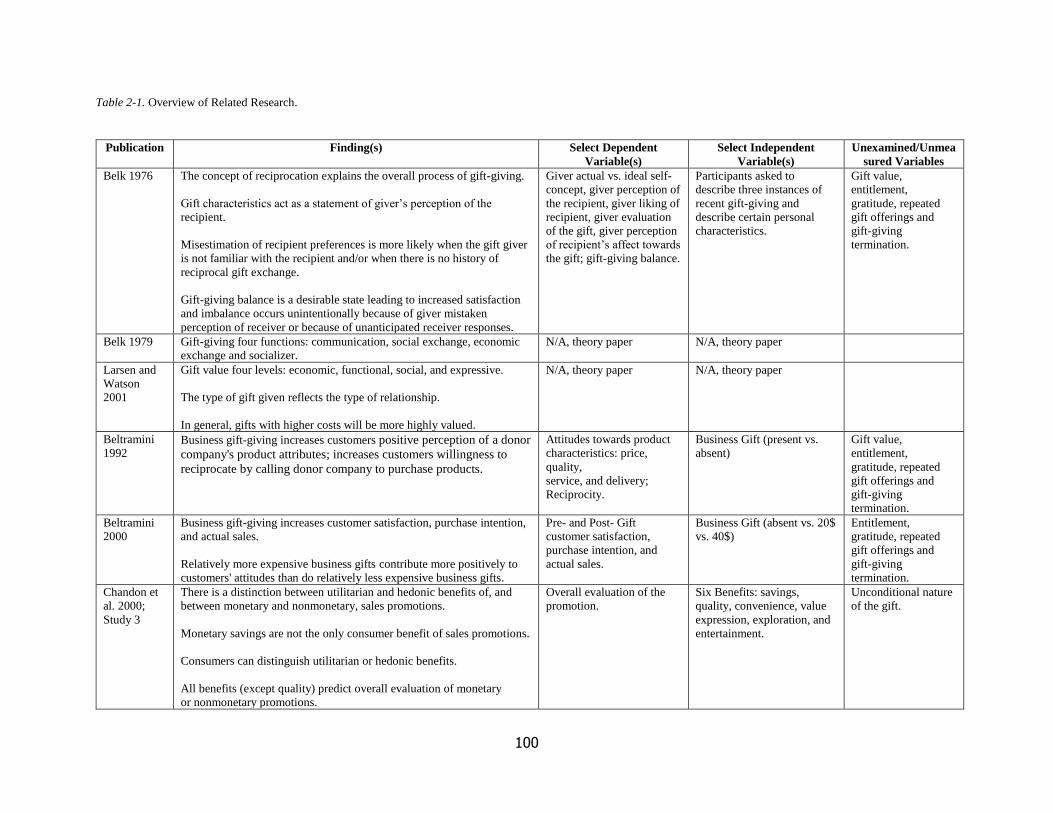
100
Table 2-1. Overview of Related Research.
Publication Finding(s) Select Dependent
Variable(s)
Select Independent
Variable(s)
Unexamined/Unmea
sured Variables
Belk 1976 The concept of reciprocation explains the overall process of gift-giving.
Gift characteristics act as a statement of giver’s perception of the
recipient.
Misestimation of recipient preferences is more likely when the gift giver
is not familiar with the recipient and/or when there is no history of
reciprocal gift exchange.
Gift-giving balance is a desirable state leading to increased satisfaction
and imbalance occurs unintentionally because of giver mistaken
perception of receiver or because of unanticipated receiver responses.
Giver actual vs. ideal self-
concept, giver perception of
the recipient, giver liking of
recipient, giver evaluation
of the gift, giver perception
of recipient’s affect towards
the gift; gift-giving balance.
Participants asked to
describe three instances of
recent gift-giving and
describe certain personal
characteristics.
Gift value,
entitlement,
gratitude, repeated
gift offerings and
gift-giving
termination.
Belk 1979 Gift-giving four functions: communication, social exchange, economic
exchange and socializer.
N/A, theory paper N/A, theory paper
Larsen and
Watson
2001
Gift value four levels: economic, functional, social, and expressive.
The type of gift given reflects the type of relationship.
In general, gifts with higher costs will be more highly valued.
N/A, theory paper N/A, theory paper
Beltramini
1992 Business gift-giving increases customers positive perception of a donor
company's product attributes; increases customers willingness to
reciprocate by calling donor company to purchase products.
Attitudes towards product
characteristics: price,
quality,
service, and delivery;
Reciprocity.
Business Gift (present vs.
absent)
Gift value,
entitlement,
gratitude, repeated
gift offerings and
gift-giving
termination.
Beltramini
2000
Business gift-giving increases customer satisfaction, purchase intention,
and actual sales.
Relatively more expensive business gifts contribute more positively to
customers' attitudes than do relatively less expensive business gifts.
Pre- and Post- Gift
customer satisfaction,
purchase intention, and
actual sales.
Business Gift (absent vs. 20$
vs. 40$)
Entitlement,
gratitude, repeated
gift offerings and
gift-giving
termination.
Chandon et
al. 2000;
Study 3
There is a distinction between utilitarian and hedonic benefits of, and
between monetary and nonmonetary, sales promotions.
Monetary savings are not the only consumer benefit of sales promotions.
Consumers can distinguish utilitarian or hedonic benefits.
All benefits (except quality) predict overall evaluation of monetary
or nonmonetary promotions.
Overall evaluation of the
promotion.
Six Benefits: savings,
quality, convenience, value
expression, exploration, and
entertainment.
Unconditional nature
of the gift.
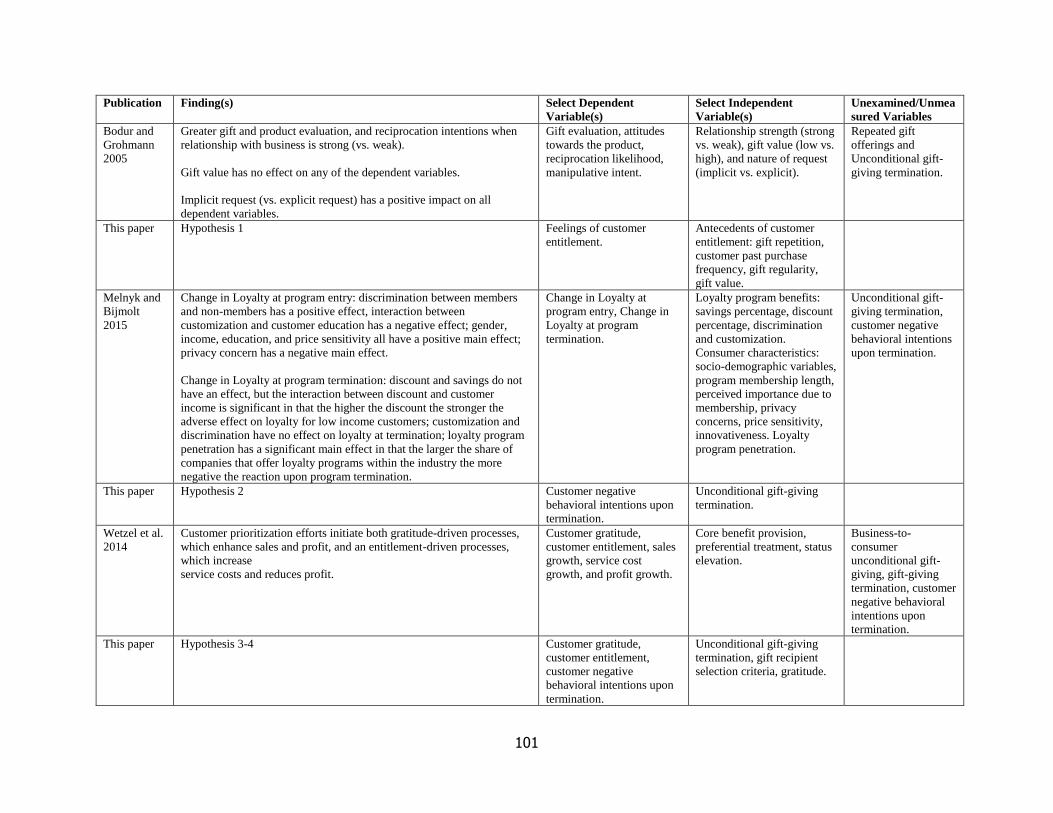
101
Publication Finding(s) Select Dependent
Variable(s) Select Independent
Variable(s) Unexamined/Unmea
sured Variables Bodur and
Grohmann
2005
Greater gift and product evaluation, and reciprocation intentions when
relationship with business is strong (vs. weak).
Gift value has no effect on any of the dependent variables.
Implicit request (vs. explicit request) has a positive impact on all
dependent variables.
Gift evaluation, attitudes
towards the product,
reciprocation likelihood,
manipulative intent.
Relationship strength (strong
vs. weak), gift value (low vs.
high), and nature of request
(implicit vs. explicit).
Repeated gift
offerings and
Unconditional gift-
giving termination.
This paper Hypothesis 1 Feelings of customer
entitlement.
Antecedents of customer
entitlement: gift repetition,
customer past purchase
frequency, gift regularity,
gift value.
Melnyk and
Bijmolt
2015
Change in Loyalty at program entry: discrimination between members
and non-members has a positive effect, interaction between
customization and customer education has a negative effect; gender,
income, education, and price sensitivity all have a positive main effect;
privacy concern has a negative main effect.
Change in Loyalty at program termination: discount and savings do not
have an effect, but the interaction between discount and customer
income is significant in that the higher the discount the stronger the
adverse effect on loyalty for low income customers; customization and
discrimination have no effect on loyalty at termination; loyalty program
penetration has a significant main effect in that the larger the share of
companies that offer loyalty programs within the industry the more
negative the reaction upon program termination.
Change in Loyalty at
program entry, Change in
Loyalty at program
termination.
Loyalty program benefits:
savings percentage, discount
percentage, discrimination
and customization.
Consumer characteristics:
socio-demographic variables,
program membership length,
perceived importance due to
membership, privacy
concerns, price sensitivity,
innovativeness. Loyalty
program penetration.
Unconditional gift-
giving termination,
customer negative
behavioral intentions
upon termination.
This paper Hypothesis 2 Customer negative
behavioral intentions upon
termination.
Unconditional gift-giving
termination.
Wetzel et al.
2014
Customer prioritization efforts initiate both gratitude-driven processes,
which enhance sales and profit, and an entitlement-driven processes,
which increase
service costs and reduces profit.
Customer gratitude,
customer entitlement, sales
growth, service cost
growth, and profit growth.
Core benefit provision,
preferential treatment, status
elevation.
Business-to-
consumer
unconditional gift-
giving, gift-giving
termination, customer
negative behavioral
intentions upon
termination.
This paper Hypothesis 3-4 Customer gratitude,
customer entitlement,
customer negative
behavioral intentions upon
termination.
Unconditional gift-giving
termination, gift recipient
selection criteria, gratitude.
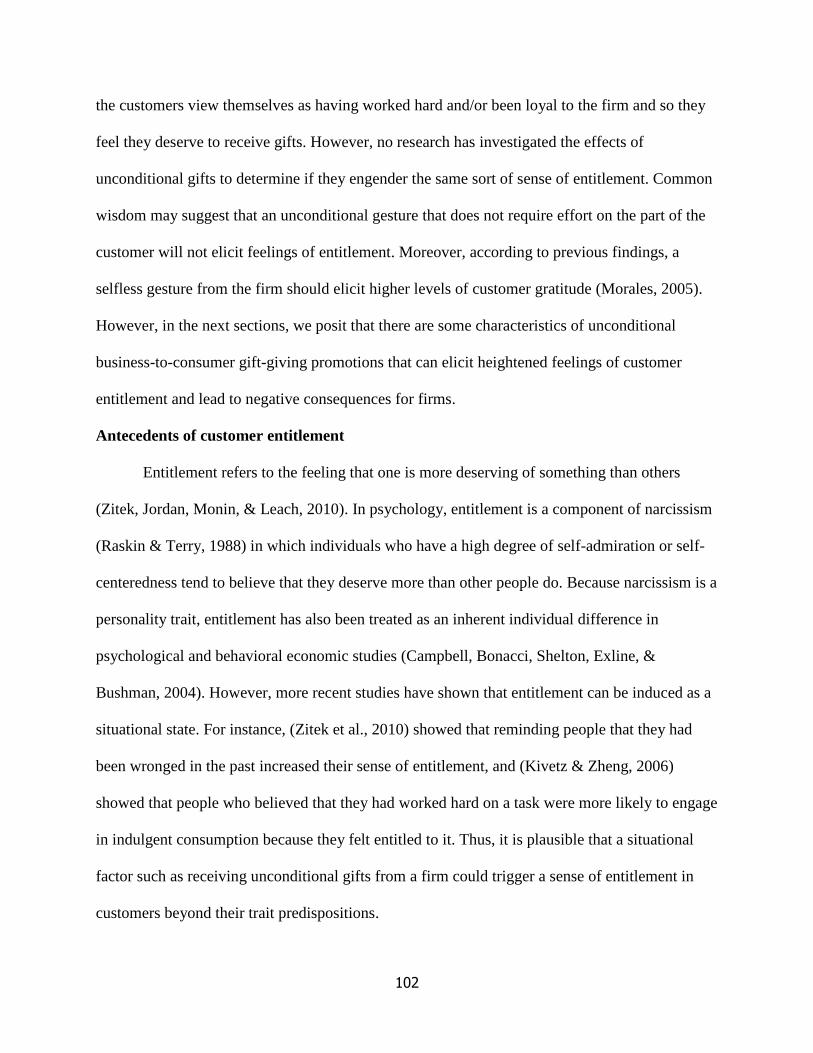
102
the customers view themselves as having worked hard and/or been loyal to the firm and so they
feel they deserve to receive gifts. However, no research has investigated the effects of
unconditional gifts to determine if they engender the same sort of sense of entitlement. Common
wisdom may suggest that an unconditional gesture that does not require effort on the part of the
customer will not elicit feelings of entitlement. Moreover, according to previous findings, a
selfless gesture from the firm should elicit higher levels of customer gratitude (Morales, 2005).
However, in the next sections, we posit that there are some characteristics of unconditional
business-to-consumer gift-giving promotions that can elicit heightened feelings of customer
entitlement and lead to negative consequences for firms.
Antecedents of customer entitlement
Entitlement refers to the feeling that one is more deserving of something than others
(Zitek, Jordan, Monin, & Leach, 2010). In psychology, entitlement is a component of narcissism
(Raskin & Terry, 1988) in which individuals who have a high degree of self-admiration or self-
centeredness tend to believe that they deserve more than other people do. Because narcissism is a
personality trait, entitlement has also been treated as an inherent individual difference in
psychological and behavioral economic studies (Campbell, Bonacci, Shelton, Exline, &
Bushman, 2004). However, more recent studies have shown that entitlement can be induced as a
situational state. For instance, (Zitek et al., 2010) showed that reminding people that they had
been wronged in the past increased their sense of entitlement, and (Kivetz & Zheng, 2006)
showed that people who believed that they had worked hard on a task were more likely to engage
in indulgent consumption because they felt entitled to it. Thus, it is plausible that a situational
factor such as receiving unconditional gifts from a firm could trigger a sense of entitlement in
customers beyond their trait predispositions.
103
In the consumer research literature, consumer entitlement is defined as consumers’
perceptions of being a special customer of the firm (Boyd III and Helms 2005). Building on
attribution theory, we argue that consumers derive such a perception from their past interactions
with the firm as they receive unconditional gifts. Attribution theory posits that people naturally
attempt to infer causes for observed behavior and, in a similar fashion, customers naturally make
inferences about firms’ behavior (Folkes, 1988; Kelley, 1967). The tendency of consumers to
make attributional judgments only manifests when no explicit causal explanation is available
(Kelley, 1973; Weiner, 2000). If the gift that a customer receives is conditional or based on an
explicit reciprocation request, the reason for the gift-giving initiative would not need to be
inferred but it would be explicitly defined by the firm itself. However, in the case of customers
receiving unconditional gifts from firms, there is no explicit cause, and customers will need to
come up with an explanation themselves.
One major tenet of attribution theory is the distinction between event causality being
attributed to the person making the attribution and to the situation in which the attribution is
made, namely dispositional and situational attribution. Research has shown that individuals tend
to attribute positive outcomes to dispositional causes and negative outcomes to situational causes
(Heider, 1982; Kelley, 1967; Shaver, 1975). For example, if a student fails an exam, he will
likely blame it on the difficulty of the test rather than to his level of preparedness. On the other
hand, if a student earns an A on an exam, he will likely attribute it to his intelligence or his effort
in preparing for it. Similarly, when consumers experience a positive outcome (i.e., receiving a
gift), they may make an internal causal attribution and take credit for it. In other words,
consumers interpret positive outcomes in line with an egocentric bias that leads to self-serving
attributions (Weiner, 2000). Therefore, one possible interpretation that customers make is that
104
firms want to show their appreciation for their value. If customer previous interactions with the
firm (e.g., they often receive gifts) gives them a reason to attribute the cause of the gift to
themselves (e.g., I receive them because I am a special customer of the firm) instead of to the
firm (e.g., I receive them because the firm spoils me), they will become entitled (i.e., I deserve to
receive gifts because I am a special customer of the firm). This attribution is strengthened when
customers examine the antecedents for their causal inference.
According to (Kelley, 1973), customer antecedents for causal inferences fall into three
categories: motivations (e.g., esteem needs), information (e.g., action frequency, consistency,
and covariation), and prior beliefs (e.g., preexisting hypotheses, suppositions, and expectations).
The motivation behind customers attribution following unconditional gifts is clearly to enhance
their self-worth because, consistent with previous research findings, positive outcomes are
attributed to the self (i.e., entitlement) and result in positive affect (Kelley, 1973; Weiner, 2000).
The information available to customers when they receive unconditional gifts from a firm relates
either to the modality in which firms provide the gifts (i.e., repetition and regularity) or to the
modality in which customer interacted with firms in the past (i.e., past purchase frequency).
Finally, prior beliefs that customers base their attributions on likely originates from their
suppositions about how business-to-consumer gift-giving works. In the case of business gifts,
customers are more likely to have observed how conditional gift-giving initiatives work because
they provide an explicit causal explanation. Given that conditional gift-giving is provided
following an explicit reciprocation request, which typically covaries with customer value to the
firm (e.g., golden members are offered a gift because they spent more and are more valuable to
the firm), customers will be more prone to associate gift value with customer value.
Specifically, we posit that some aspects of customers previous interactions with the firm,
105
which are common in the context of business-to-consumer gift-giving, will act as antecedents of
customers’ causal inferences and contribute to their sense of entitlement. Firstly, repetition of
gift receipt, meaning that customers receive the unconditional gift more than once, will
strengthen their inference of being valuable to the firm because customers will have multiple
observations over which to notice covariations between cause and effect (Kelley, 1973). In other
words, when customers receive unconditional gifts repeatedly (vs. once), the salience of the
covariation between their valuable contribution to the firm (i.e., continuous business) and the
receipt of the gift will be higher and thus judged as the most probable explanation. Formally,
H1a. Customers receiving unconditional business-to-consumer gifts repeatedly from the firm,
will exhibit higher feelings of entitlement as compared to customer who do not.
Secondly, customers past purchase frequency, meaning how often customers purchased
from the firm in the past, will similarly strengthen their inference of being valuable to the firm
and their sense of entitlement. When customers have purchased frequently from a firm in the past
and they receive a gift, the covariation between having purchased often in the past and receiving
a gift will be also more salient.
H1b. Customers who purchased more from the firm in the past will feel more entitled to
unconditional business-to-consumer gifts as compared to customer who did not.
Thirdly, regularity of gift receipt, meaning that customers receive unconditional gifts
following a regular pattern (e.g., every other order), will strengthen customers’ inferences of
106
being valuable to the firm because regular successions of events are often interpreted as
proceeding from a common cause (White 1992). In the case of regularly delivered unconditional
gifts, customers will infer that they receive gifts because they are valuable to the firm, and gift
regularity will strengthen their attribution of the outcome to that single cause. Contrarily, when
unconditional gifts are delivered following an irregular pattern, such irregularity introduces the
possibility that there are multiple feasible causes behind firm’s gift-giving, and gift irregularity
will weaken customers’ attributions of the outcome to their value as customers. When multiple
causes are easy to imagine, customers’ confidence in their internal attributions of being valuable
to the firm will diminish, thus preventing them from feeling entitled. More formally,
H1c. Customers receiving unconditional business-to-consumer gifts regularly from the firm will
exhibit higher feelings to entitlement as compared to customer who do not.
Finally, gift value will also inform customer value inference and lead to feelings of
entitlement. Customers have preexisting hypotheses about the signaling function of gift value
that informs their attribution-making process. To fulfill its communicative function, the type of
gift given must reflect the nature of the relationship and have a monetary value appropriate to the
level of commitment to the relationship (Larsen & Watson, 2001). The costlier a gift is to the
giver, the greater the importance of the recipient to the giver (Belk, 1979). Accordingly,
customers will attribute gift value to their own value as customers within their relationship with
the firm, and they will become entitled. Thus, we predict that
H1d. Customers receiving valuable unconditional business-to-consumer gifts from the firm will
107
exhibit higher feelings of entitlement as compared to customers who do not.
Summarizing, we argue that the way in which unconditional business-to-consumer gift-
giving initiatives are designed and executed will make it more likely for customer to infer that a
firm gives them gifts because they are valuable customers. If valuable unconditional business-to-
consumer gifts are offered repeatedly and regularly to customers who often purchased from the
firm in the past, customers will fail to attribute firms’ gift-giving to firms’ selfless attempts to
elicit gratefulness and building a lasting relationship. On the contrary, they will attribute firms’
gift-giving to their own merits (i.e., I am a valuable customer), and consequently they will
develop feelings of entitlement even when business gifts are given unconditionally without an
explicit reciprocation request.
Customer negative behavioral intentions
Just as common wisdom suggests that an unconditional gesture will not elicit feelings of
entitlement, it also suggests that terminating unconditional gift-giving should not trigger negative
behavioral intentions. Customers should not feel wronged when they do not receive what was an
unconditional gift because they did nothing to earn it. Moreover, according to the tenets of norm
reciprocity, not only should people help those who helped them, but they should also not harm
those who helped them (Gouldner, 1960). Accordingly, firms might wrongfully assume that they
do not need an exit strategy when terminating unconditional business-to-consumer gift-giving
initiatives.
When firms terminate their unconditional business-to-consumer gift-giving initiatives
without an explicit communication of why they do so, they again prompt customers to consider
the cause of this event. In this case, the outcome that the customer evaluates is not a positive one
108
(i.e., gift receipt), but it is a negative one (i.e., gift absence). Attribution theory suggests that
when individuals form casual attributions for negative events, they tend to blame others in an
attempt to preserve their self-worth (Kelley, 1967, 1973). Moreover, according to a cognition-
emotion process of attribution proposed by Weiner (2000), when consumers evaluate a negative
outcome they feel negative emotions that are general (e.g., I feel disappointed), but they also feel
negative emotions that are specifically targeted at the firm (e.g., I feel angry at them). These
negative emotions arising from the attributional process are the ones that in turn prompt
customers’ negative behaviors towards the firm (e.g., complaint, punish).
We have argued that when business-to-consumer gift-giving initiatives are designed so
that they generate customer entitlement, customers will indeed feel they deserve those gifts by
virtue of being valuable to the firm. Therefore, we now posit that when customers are entitled to
unconditional business-to-consumer gifts, they will feel wronged when they no longer receive
them, and they will express negative behavioral intentions. Formally,
H2. When customers no longer receive unconditional business-to-consumer gifts, entitled
customers will exhibit higher negative behavioral intentions towards the firm as compared to
customers who are not entitled.
Negative behavioral intentions have been widely examined in the literature on service
failure and in the literature on customer satisfaction (Hirschman, 1970; Huefner & Hunt, 2000;
Maute & Forrester, 1993; Oliver, 2010). According to the classic taxonomy given by Hirschman
(1970), when customers perceive a decrease in quality or in benefits provided by a company,
they have at least two ways to tell management: they can exit (i.e., withdraw from the
109
relationship) or they can voice (i.e., express complaints). Building on this first classification,
researchers have described and measured more extreme forms in which customers express their
dissatisfaction (i.e., retaliation). Extreme means of retaliating include vandalism, stealing,
negative word of mouth, and verbal attacks (Huefner & Hunt, 2000), but the desire for retaliation
can be expressed in less extreme ways, such as boycotting the firm (e.g., reducing the frequency
of purchases, spending less per visit, and/or buying from competitors) and complaining directly
or indirectly (Grégoire & Fisher, 2006). To reflect the various classifications of customer
negative behavioral intentions towards the firm that have been given in the literature, we include
both extreme (i.e., retaliation) and moderate (i.e., exit and voice) types of behavioral intentions in
our experiments. For a complete list of negative behavioral intentions used, see Appendix A.
Underlying processes: customer entitlement and customer gratitude
Entitlement is positively correlated with other psychological constructs such as
aggression (Emmons, 1984) and hostility (Raskin & Terry, 1988) and is negatively correlated
with social desirability (Watson, Grisham, Trotter, & Biderman, 1984), and individuals who feel
entitled exhibit behaviors associated with these constructs. For example, they tend to be less
forgiving (Exline, Baumeister, Bushman, Campbell, & Finkel, 2004), more frequently exhibit
selfish behavior, and have a strong tendency to engage in aggressive behavior (Campbell et al.,
2004). Psychological entitlement is also positively correlated with a perception of inequity (King
& Miles, 1994). Generally, when people feel wronged, they also exhibit a greater sense of
entitlement (Zitek et al., 2010). In the context of the customer satisfaction literature, research has
shown that consumers who experience inequity because of product or service failure or because
of an inadequate firm recovery tend to retaliate against the firm to “get even” (Grégoire &
Fisher, 2008; Huefner & Hunt, 2000; Kähr, Nyffenegger, Krohmer, & Hoyer, 2016). Therefore,
110
we propose a mediation mechanism of the effect of unconditional business-to-consumer gifts on
customers’ feelings of entitlement, which in turn will increase customers’ negative behavioral
intentions once the gifting is terminated. Formally,
H3a. Feelings of entitlement positively mediate the impact of unconditional business-to-
consumer gifting termination on negative customer behavioral intentions.
We have argued that unconditional business-to-consumer gift-giving initiatives can lead
to negative consequences because of feelings of entitlement, but research on relationship
marketing suggests that unconditional business-to-consumer gift-giving initiatives also trigger
consumer gratitude (Henderson et al., 2011; Morales, 2005; Palmatier et al., 2009). According to
the norm of reciprocity (Gouldner, 1960), grateful consumers should compensate firms that give
them gifts and should not be willing to harm them. Therefore, we also investigate the ability of
gratitude to mitigate the negative effects of entitlement on customer negative behavioral
intentions. Specifically, we explore how feelings of gratitude might decrease entitled customers’
negative behavioral intentions after unconditional gift-giving termination. We predict that
feelings of gratitude will also mediate the effect of unconditional business-to-consumer gifts
termination on customer negative behavioral intentions, but they will do so the opposite way of
feelings of entitlement. Namely, feelings of gratitude deriving from unconditional business-to-
consumer gifts will decrease customer negative behavioral intentions. Formally,
H3b. Feelings of gratitude negatively mediate the impact of unconditional business-to-consumer
gifting termination on negative customer behavioral intentions.
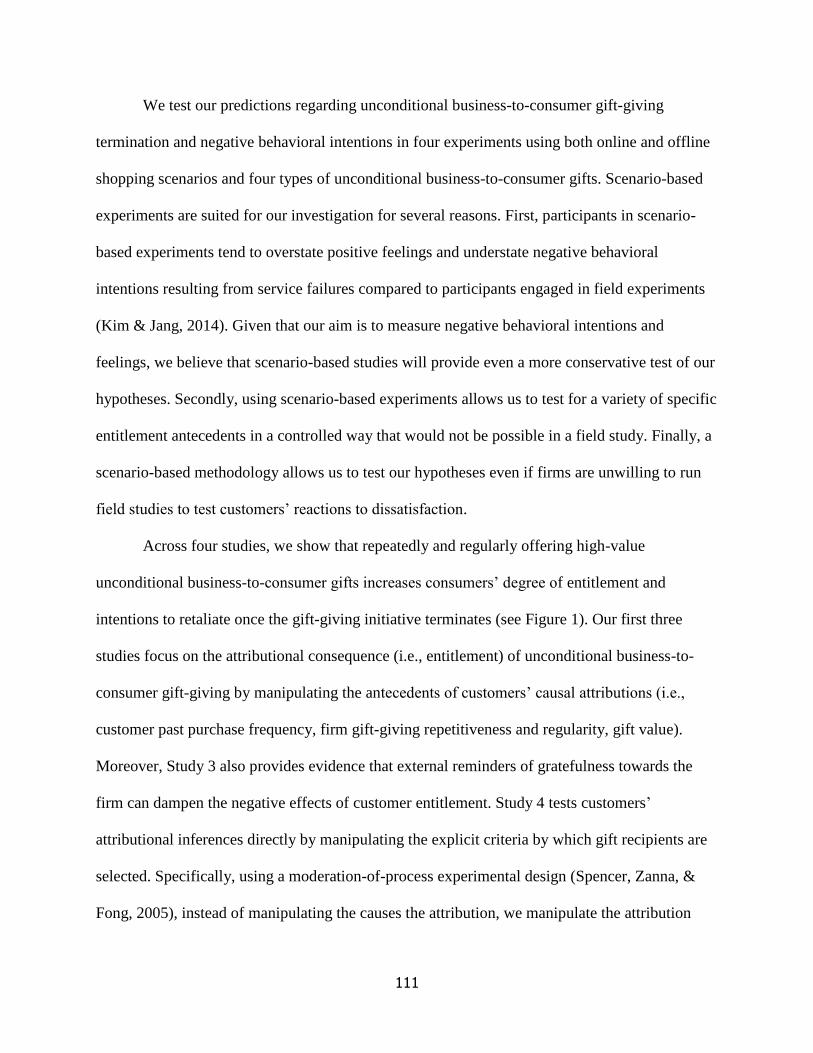
111
We test our predictions regarding unconditional business-to-consumer gift-giving
termination and negative behavioral intentions in four experiments using both online and offline
shopping scenarios and four types of unconditional business-to-consumer gifts. Scenario-based
experiments are suited for our investigation for several reasons. First, participants in scenario-
based experiments tend to overstate positive feelings and understate negative behavioral
intentions resulting from service failures compared to participants engaged in field experiments
(Kim & Jang, 2014). Given that our aim is to measure negative behavioral intentions and
feelings, we believe that scenario-based studies will provide even a more conservative test of our
hypotheses. Secondly, using scenario-based experiments allows us to test for a variety of specific
entitlement antecedents in a controlled way that would not be possible in a field study. Finally, a
scenario-based methodology allows us to test our hypotheses even if firms are unwilling to run
field studies to test customers’ reactions to dissatisfaction.
Across four studies, we show that repeatedly and regularly offering high-value
unconditional business-to-consumer gifts increases consumers’ degree of entitlement and
intentions to retaliate once the gift-giving initiative terminates (see Figure 1). Our first three
studies focus on the attributional consequence (i.e., entitlement) of unconditional business-to-
consumer gift-giving by manipulating the antecedents of customers’ causal attributions (i.e.,
customer past purchase frequency, firm gift-giving repetitiveness and regularity, gift value).
Moreover, Study 3 also provides evidence that external reminders of gratefulness towards the
firm can dampen the negative effects of customer entitlement. Study 4 tests customers’
attributional inferences directly by manipulating the explicit criteria by which gift recipients are
selected. Specifically, using a moderation-of-process experimental design (Spencer, Zanna, &
Fong, 2005), instead of manipulating the causes the attribution, we manipulate the attribution
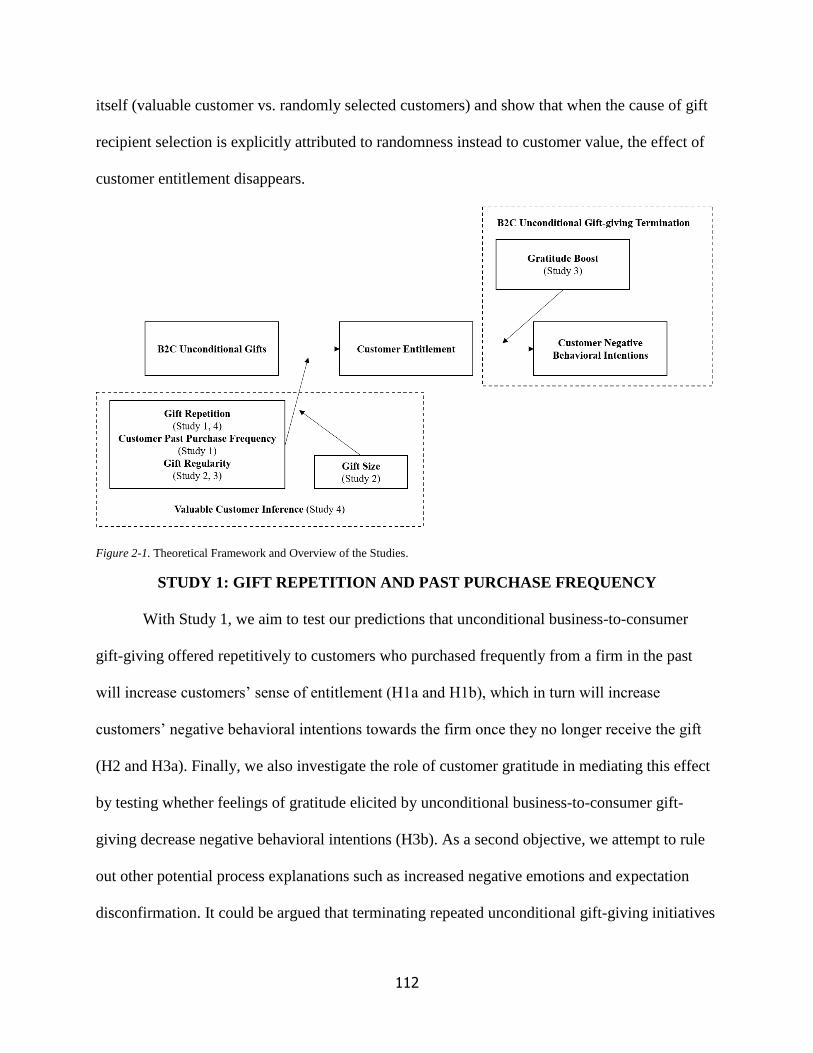
112
itself (valuable customer vs. randomly selected customers) and show that when the cause of gift
recipient selection is explicitly attributed to randomness instead to customer value, the effect of
customer entitlement disappears.
Figure 2-1. Theoretical Framework and Overview of the Studies.
STUDY 1: GIFT REPETITION AND PAST PURCHASE FREQUENCY
With Study 1, we aim to test our predictions that unconditional business-to-consumer
gift-giving offered repetitively to customers who purchased frequently from a firm in the past
will increase customers’ sense of entitlement (H1a and H1b), which in turn will increase
customers’ negative behavioral intentions towards the firm once they no longer receive the gift
(H2 and H3a). Finally, we also investigate the role of customer gratitude in mediating this effect
by testing whether feelings of gratitude elicited by unconditional business-to-consumer gift-
giving decrease negative behavioral intentions (H3b). As a second objective, we attempt to rule
out other potential process explanations such as increased negative emotions and expectation
disconfirmation. It could be argued that terminating repeated unconditional gift-giving initiatives
113
would trigger some degree of negative emotional response that could fully explain customer
negative behavioral intentions (Kähr et al., 2016). Even if we posited that a certain degree of
negative emotions is expected according to the cognition-emotion process of attribution (Weiner,
2000), our goal in this study is to show that negative emotions do not fully explain customer
behavioral intentions. Finally, it could be also argued that, according to expectation
disconfirmation theory (Oliver, 1977), terminating repeated unconditional gift-giving initiatives
would induce customer dissatisfaction and negative behavioral intentions because failing to
receive a gift after multiple instances of gift receipt would conflict with customers’ expectations.
Accordingly, in this study, customer negative emotions and customer expectations are measured
to test whether these constructs can explain the effect.
Design and Stimuli
We employed a 2 (repetition of unconditional gift: every-time gift vs. one-time gift) × 2
(customer past purchase frequency: eight times vs. four times) between-subjects design in an
experiment examining free unconditional shipping following online grocery shopping as an
unconditional business-to-consumer gift.
In the first step of the experiment, participants in the every-time gift (one-time gift) eight
times past purchase frequency (four times past purchase frequency) condition were presented
with the following scenario:
You started buying groceries online because it is convenient, and it saves you
time. Every Sunday for the last 8 weeks (4 weeks) you had been purchasing 80
dollars’ worth of weekly groceries from the same online retailer. For these 8
purchases (4 purchases), the retailer offered you free shipping every time (once).
114
Today is Sunday, and you proceed with your usual weekly order. You move on to
the payment page, and you see you have NOT been offered free shipping with this
order.
Therefore, in the one-time gift condition, participants received unconditional free
shipping once regardless of whether they had purchased four times or eight times from the
retailer in the past. However, in the every-time gift condition, participants who had purchased
four times received free shipping four times, whereas participants who had purchased eight times
received free shipping eight times. Based on our reasoning, for the one-time gift condition, we
expect no difference in entitlement and negative behavioral intentions between those who had
purchased four and eight times in the past (H1a). In contrast, for the every-time gift condition,
we expect participants to feel more entitled and have greater negative behavioral intentions if
they had purchased eight times (vs. four times) in the past (H1b).
After reading the scenario, participants rated their intent to engage in a list of negative
behaviors against the online retailer (see Appendix A) that were selected using two criteria: they
were identified as typical retaliatory behaviors varying in extremity (Grégoire & Fisher, 2008;
Huefner & Hunt, 2000) and they fit our designed scenarios and could best capture plausible
behavioral reactions in the situations described. Participants rated their intent using a 7-point
scale (1 = in extremely unlikely, 7 = extremely likely).
In the next step of the experiment, participants read the same scenario again and indicated
how they would feel if they were in that situation. We measured their sense of entitlement by
asking them to rate on a 7-point scale (1 = strongly disagree, 7 = strongly agree) the extent to
which they agreed with the following statements: “I feel that I deserve free shipping from this
online retailer,” “I feel that I should be treated in a special way by this online retailer,” “I feel
115
that I should be treated better than other customers of this online retailer,” and “I feel that I
should always receive free shipping from this online retailer.” The questions measured the
participants’ general beliefs about whether they were more deserving than others. We chose not
to use existing scales of psychological entitlement (Campbell et al., 2004) and consumer
entitlement (Boyd III and Helms 2005; Butori 2010) because they were developed to measure
entitlement as a personality trait or to measure entitlement in a physical retail setting and could
not accurately measure entitlement as a state in our scenarios. Raskin and Terry (1988) define an
entitled individual as one that “expects special treatment and automatic compliance with his or
her expectations.” Accordingly, our items were developed based on the definition of entitlement,
incorporating the notions of expectation of the unconditional gift, deservingness of the
unconditional gift, and expectation of automatic firm compliance. Finally, we adapted the four
items to each single scenario by changing the target firm and target unconditional gift.
We measured participants’ gratitude by asking them to rate on a 7-point scale (1 =
strongly disagree, 7 = strongly agree) the extent to which they agreed with “I feel
grateful/appreciative/thankful to the online retailer” (Palmatier et al., 2009) and measured their
negative emotions by asking them to rate the extent to which they agreed with “I feel
angry/sad/disappointed.” Moreover, we measured participants expectations by asking them to
rate on a 7-point scale (1= not at all, 7= very much) the extent to which they had expected to
receive free shipping for the current order.
As manipulation checks, we asked participants to rate on a 7-point scale how repetitive
and regular the gift-giving offer was. We further asked them to rate how realistic the scenario
was and how difficult it was to imagine being in that situation to ensure that the scenarios under
the various conditions were equally plausible. Finally, as attention checks, participants were
116
asked at the end of the experiment to recall the number of past purchases and number of times
they received free shipping in the scenario.
Results and Discussion
Two hundred and four Amazon Mechanical Turk (MTurk) panelists participated in the
study in exchange for small monetary compensation. Thirty-three (16.18%) failed one or both
attention check questions and were removed from the sample, leaving 171 respondents for the
analyses (40% male, Mage = 37.23, SD = 12.30).
In terms of perceived realism, participants reported that receiving free shipping eight
times was less realistic than receiving free shipping four times (5.19 vs. 5.53, F(1, 167) = 3.98,
p = .05). However, controlling for this factor did not change the results of the analyses.
Furthermore, there was no difference in difficulty in imagining the scenario among the four
conditions (F(1, 167) = 2.21, p = .14). Due to the lack of effects for these two measures, we do
not report the analyses for them in the subsequent studies.
Manipulation checks. The manipulation checks showed that participants in the every-time
gift condition perceived free shipping as more repetitive (5.98 vs. 1.98, F(1,167) = 435.05,
p < .001) and had a greater expectation of receiving free shipping (6.00 vs. 3.70,
F(1,167) = 68.65, p < .001) than participants in the one-time gift condition, which suggests that
the repetition manipulation was successful. We also found an interaction effect for repetition and
purchase frequency on the perceived regularity of gift receipt (F(1,167) = 4.09, p = .05); the
participants perceived free shipping on eight of eight purchases as more regular than free
shipping on four of four purchases (6.36 vs. 5.77, F(1,167) = 5.21, p = .02). When free shipping
was offered only once, there was no difference in their perceptions of regularity for four and
eight purchases (1.89 vs. 2.05, F(1,167) = .37, p = .55), which suggests that our manipulation of
117
past purchase frequency was successful.
Negative behavioral intentions. We collapsed the negative behavioral intentions items
into a single measure (α = .93). The two-way analysis of variance (ANOVA) on negative
behavioral intentions showed a significant main effect of repetition (F(1, 167) = 13.70, p < .001).
Participants in the every-time gift condition reported greater negative behavioral intentions upon
gift-giving termination (M = 3.38) compared to participants in the one-time gift condition
(M = 2.68). The main effect of past purchase frequency was not significant (F(1, 167) = .07,
p = .80), suggesting that negative behavioral intentions did not increase with past purchase
frequency.
Customer entitlement. We collapsed the four entitlement items into a single measure
(α = .88). The two-way ANOVA on customer entitlement showed that repetition had a
significant effect (F(1, 167) = 3.85, p = .05); participants in the every-time gift condition felt
more entitled (M = 3.87) than participants in the one-time gift condition (M = 3.43). The effect of
past purchase frequency was again not significant (F(1, 167) = .28, p = .60), suggesting that the
degree to which customers felt entitlement did not increase with the number of past purchases.
Customer gratitude. We collapsed the three gratitude items (thankful, grateful, and
appreciative) into a single measure (α = .97). The two-way ANOVA on that measure showed no
significant effect from repetition (F(1, 167) = .25, p = .62) or from number of gifts received (F(1,
167) = .48, p = .49). These findings suggest that participants felt grateful as long as they received
free shipping at least once and that their level of gratitude did not increase with a greater number
of unconditional free shipping being offered.
Negative emotion. The three negative emotions (sadness, anger, and disappointment)
were collapsed into a single measure (α = .81). The two-way ANOVA showed that repetition had
118
an effect on negative emotions (F(1, 167) = 17.25, p < .001); terminating a repetitive free
shipping offer induced greater negative emotion in participants (M = 4.43) than terminating a
one-time offer (M = 3.49). Past purchase frequency had no significant effect on the degree of
negative emotion (F(1, 167) = 1.34, p = .25).
Mediation tests. To determine whether the effect of unconditional gift-giving termination
on customers’ negative behavioral intentions was mediated by customer entitlement, we ran a
mediation test using the SPSS PROCESS module model 4 (Hayes, 2012) with 5,000 bootstraps.
The results showed that entitlement had a significant indirect effect at a 90% confidence interval
(B = .21, SE = .12, CI = [.03, .41]). Since negative emotions, declining gratitude, and
expectations could alternatively account for the effect of entitlement, we ran a second mediation
test in which entitlement, gratitude, expectations, and negative emotions were entered as parallel
mediators. The results of a 5,000-iteration bootstrap showed that entitlement had a significant
indirect effect at a 95% confidence interval (B = .21, SE = .05, CI = [.11, .31]) and so did
negative emotions (B = .21, SE = .06, CI = [.10, .33]) and gratitude (B = -.29, SE = .06, CI = [-
.40, -.18]). Participants’ expectations did not significantly mediate the effect of gifting
termination on negative behavioral intentions (B = .02, SE = .05, CI = [-.08, .12]). These results
suggest that participants’ negative behavioral intentions following a repetitive unconditional free
shipping initiative termination were positively mediated by entitlement and negatively mediated
by gratitude even when accounting for participants’ negative emotions and free shipping
expectations. While we did not make a formal prediction about the mediating effect of negative
emotions on customers negative behavioral intentions, this result is generally consistent with the
H2. Specifically, according to the cognition-emotion process of attribution proposed by Weiner
(2000), customer attributions will generate negative emotions, which in turn will prompt
119
consumer action.
This first study shows that terminating unconditional business-to-consumer gift-giving
that was offered repeatedly to customers induced their negative behavioral intentions against the
online retailer. However, increasing the frequency of gift receipt did not increase customers’
negative behavioral intentions. The same pattern was found for entitlement: any repetition of gift
receipt increased the customers’ sense of entitlement relative to a one-time offer, whereas
different frequencies of past purchase frequency (four versus eight) had no impact. We attribute
this null effect of repetition frequency to the fact that our repetition manipulation was “with
every order,” which implied certainty and gave the participants a high degree of confidence in
their inferences. Therefore, increasing the repetition frequency did not further increase their
confidence.
Another important finding from this study is that unconditional business-to-consumer
gift-giving increases consumer gratitude, which is in line with findings from prior research
(Palmatier et al., 2009). However, gratitude does not accumulate with gift repetition—a one-time
offer was sufficient to trigger gratitude and the degree of gratitude did not increase with
additional offers, even though the offers increased the degree of entitlement. Thus, when
unconditional business-to-consumer gifts are provided more than once and then terminated,
entitlement overrides gratitude and spurs customer negative behavioral intentions.
We further find that negative emotions and expectation disconfirmation arising from
termination of gift-giving do not fully explain customers’ greater intentions to retaliate. We find
that even when accounting for negative emotions, customer expectations, and customer gratitude,
customer entitlement still explains the effect of multiple free gifts on customers’ negative
behavioral intentions.
120
STUDY 2: GIFT REGULARITY AND GIFT VALUE
The second study has three objectives. First, we aim to replicate the findings from the
first study using an offline shopping scenario and a free product as unconditional business-to-
consumer gift to determine whether our effect is generalizable to offline settings and to other
typologies of unconditional gifts. We also posit that customers will feel less entitled to
unconditional gifts when they are not predictably delivered. Therefore, a second objective is to
examine the effect of unconditional business-to-consumer gifts on customer negative behavioral
intentions not only as a function of repetition, but also as a function of regularity (H1b) by using
a scenario in which customers have received unconditional gifts on a regular basis in the past
before the initiative is terminated. Finally, our third objective is to examine the effect of the size
of the monetary value associated with the gift. We expect that a relatively high-value gift will
increase participants’ sense of entitlement more than will a relatively low-value gift (H1d).
Design and Stimuli
We employed a 2 (regularity: every-time vs. sometimes) × 2 (gift value: large vs. small)
between-subjects design. Participants in the every-time (sometimes) and large gift (small gift)
conditions read that they had ordered $30 worth of sushi from the same sushi restaurant eight
times in the past. Out of eight (four) times, they received a free dessert worth $12 ($2). That day,
they placed their usual sushi order but did not receive the free dessert.
We measured the participants’ negative behavioral intentions, sense of entitlement, and
expectations the same way as was done in the first study. As manipulation checks, we asked the
participants to rate how repetitive and regular the free gifts were and how valuable the gift was to
them. As attention checks, the participants had to recall the frequency of receiving the free
dessert and the value of that dessert.
121
Results and Discussion
Two hundred MTurk panelists participated in the study in exchange for a small monetary
reward. Thirty-two (16%) failed at least one attention check question and were removed from the
sample, leaving 168 respondents (42% male, Mage = 36.56, SD = 11.37).
Manipulation checks. A two-way ANOVA on the participants’ perceptions of the
repetitiveness and regularity of receiving the gift showed only a main effect of regularity (all
F(1,164) > 62, all ps < .001). Compared to participants in the sometimes condition, participants
in the every-time condition perceived the unconditional gift as being more repetitive (6.27 vs.
4.51) and more regular (6.40 vs. 4.40). These results suggest that the manipulation of regularity
was successful. The two-way ANOVA on perceived gift size showed an effect only for gift value
(F(1,164) = 95.87, p < .001). Participants in the large-gift condition perceived the gift as more
valuable than did participants in the small-gift value condition (5.12 vs. 3.16), suggesting
successful manipulation of gift value.
Negative behavioral intentions. We again collapsed all customer negative behavioral
intentions items into a single measure (α = .92). The two-way ANOVA on negative behavioral
intentions revealed a significant interaction between gift value and the regularity of the gift as
shown in Figure 2 (F(1,164) = 8.06, p = .005). The only significant effect of regularity on
negative behavioral intentions was in the large gift condition; participants in the every-time
condition were more likely to behave negatively against the restaurant than were participants in
the sometimes condition (2.39 vs. 1.65, F(1,164) = 12.04, p = .001). There was no difference in
negative behavioral intentions between the every-time and sometimes conditions when the gift
value was small (1.79 vs. 1.79, F(1,164) < .001, p = .99).
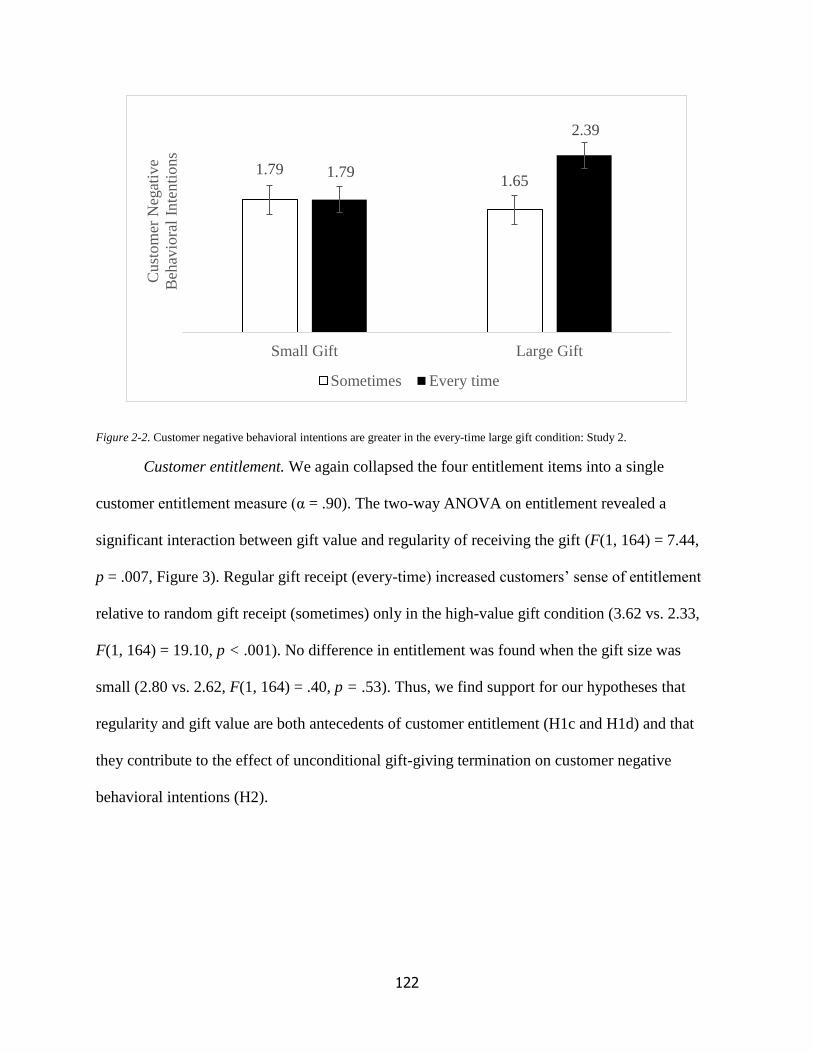
122
Figure 2-2. Customer negative behavioral intentions are greater in the every-time large gift condition: Study 2.
Customer entitlement. We again collapsed the four entitlement items into a single
customer entitlement measure (α = .90). The two-way ANOVA on entitlement revealed a
significant interaction between gift value and regularity of receiving the gift (F(1, 164) = 7.44,
p = .007, Figure 3). Regular gift receipt (every-time) increased customers’ sense of entitlement
relative to random gift receipt (sometimes) only in the high-value gift condition (3.62 vs. 2.33,
F(1, 164) = 19.10, p < .001). No difference in entitlement was found when the gift size was
small (2.80 vs. 2.62, F(1, 164) = .40, p = .53). Thus, we find support for our hypotheses that
regularity and gift value are both antecedents of customer entitlement (H1c and H1d) and that
they contribute to the effect of unconditional gift-giving termination on customer negative
behavioral intentions (H2).
1.791.65
1.79
2.39
Small Gift Large Gift
Cu
sto
mer
Neg
ativ
e
Beh
avio
ral
Inte
nti
ons
Sometimes Every time
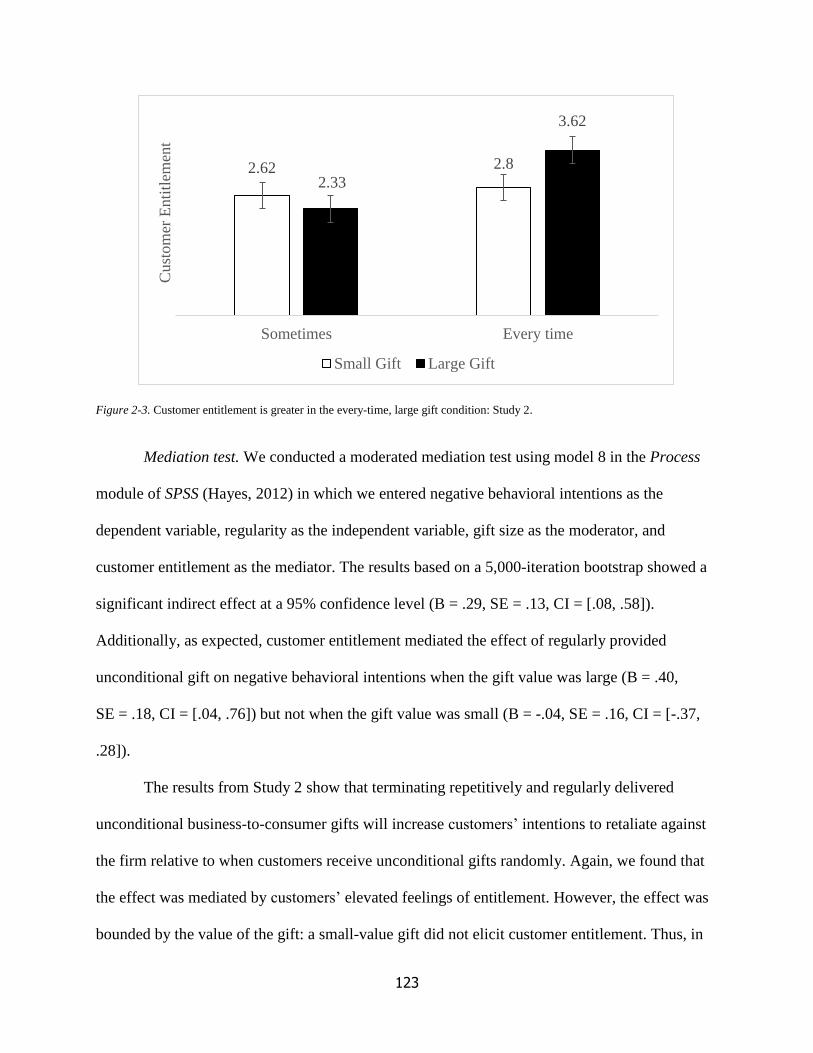
123
Figure 2-3. Customer entitlement is greater in the every-time, large gift condition: Study 2.
Mediation test. We conducted a moderated mediation test using model 8 in the Process
module of SPSS (Hayes, 2012) in which we entered negative behavioral intentions as the
dependent variable, regularity as the independent variable, gift size as the moderator, and
customer entitlement as the mediator. The results based on a 5,000-iteration bootstrap showed a
significant indirect effect at a 95% confidence level (B = .29, SE = .13, CI = [.08, .58]).
Additionally, as expected, customer entitlement mediated the effect of regularly provided
unconditional gift on negative behavioral intentions when the gift value was large (B = .40,
SE = .18, CI = [.04, .76]) but not when the gift value was small (B = -.04, SE = .16, CI = [-.37,
.28]).
The results from Study 2 show that terminating repetitively and regularly delivered
unconditional business-to-consumer gifts will increase customers’ intentions to retaliate against
the firm relative to when customers receive unconditional gifts randomly. Again, we found that
the effect was mediated by customers’ elevated feelings of entitlement. However, the effect was
bounded by the value of the gift: a small-value gift did not elicit customer entitlement. Thus, in
2.62 2.8
2.33
3.62
Sometimes Every time
Cust
om
er E
nti
tlem
ent
Small Gift Large Gift
124
Study 2 we replicated our Study 1 findings in a different unconditional business gift setting, and
we provided support for two additional hypotheses regarding the antecedents of customer
entitlement (H1b and H1d). However, our manipulation of regularity in this study compares high
predictability as receiving the gift always (eight times out of eight purchases) versus low
predictability as receiving the gift half of the time (four times out of eight purchases). Given that
no information was given on whether the gifts were all received with the first four purchases,
with one every other purchase, or with the last four purchases, we did not control for the possible
additional inference that the single participant might have been made based on the pattern he/she
imagined. Additionally, it is possible that with this regularity manipulation we did not control for
the total number of gift received. Participants in the every-time condition could have displayed
heightened entitlement because they received a free dessert eight times while participants in the
sometimes condition received a free dessert only four times. Therefore, to account for this, in
Study 3 we will provide participants with information on the gift-giving pattern with which they
received unconditional gifts in their past interaction with the firm.
Study 1 and 2 jointly reveal that (1) for customer entitlement to follow business-to-
consumer unconditional gift-giving initiatives, large (vs. small) value gifts must be offered
repeatedly (vs. once) and regularly (vs. unpredictably); (2) when business-to-consumer
unconditional gift-giving initiatives are terminated, entitled customers will exhibit negative
behavioral intentions towards the firm; and (3) the effect of business-to-consumer unconditional
gift-giving termination on customer negative behavioral intentions is mediated by entitlement,
gratitude, and negative emotions. The essay focuses on the potential of business-to-consumer
unconditional gift-giving initiatives to backfire. Therefore, Study 3 and Study 4 focus on the
underlying process of this effect by investigating the role of gratitude as counterbalancing force
125
and by testing our attribution hypothesis directly.
STUDY 3: GIFT REGULARITY AND GRATITUDE BOOST
In the third study, we test our predictions in a different consumption context, using
another type of unconditional business-to-consumer gift to further generalize our results.
Moreover, in this next study, we aim at addressing the issues of multiple possible inferred
patterns and of total number of gifts received confounds identified with the manipulation of
regularity used in Study 2. To do so, in Study 3 we manipulate regularity by providing
participants with visual information about the specific pattern in which they are told that they
received the gifts in the past and we keep the total number of gifts fixed. Finally, we explore the
competing influences of gratitude and entitlement on customers behavioral intentions by directly
influencing participants’ feelings of gratitude. In Study 1, we showed that gratitude negatively
mediates the effect of unconditional gift termination on negative behavioral intentions (H3b), but
we also showed that gratitude does not increase with gift repetition. If gift repetition does not
boost gratitude, but gratitude does decrease negative behavioral intentions, we predict that
alternative ways (i.e., not tied to the gift delivery itself) to boost customers’ feelings of gratitude
toward the firm will attenuate negative behavioral intentions upon unconditional gift-giving
termination. Formally,
H4. The impact of business-to-consumer unconditional gift-giving termination on customers
negative behavioral intentions is attenuated when customers receive external reminders that
boost their gratitude.
126
Design and Stimuli
Again, we employed a 2 (regularity: regular pattern vs. random pattern) × 2 (gratitude
boost: present vs. absent) between-subjects design. Participants read that they always bought a
$3 coffee from a coffee shop on their way to work and for the past eight times they did so, four
times they received a free cookie worth $1.5. In the regular pattern condition, they received a
free cookie every other time; in the random pattern condition, they received the four cookies in
no systematic way (see Appendix B for detailed scenarios). All the participants then read that
they went to the coffee shop that day and did not receive a free cookie. In the gratitude boost
present condition, participants read a separate page stating that they met a colleague who often
went to a different coffee shop and that she stated that she never received any free products there
(participants in the gratitude boost absent condition did not read this additional statement).
After reading the scenario, the participants rated their negative behavioral intentions on a
version of the scale used in the first two studies in which we removed items associated with
online behavior that did not apply to this consumption situation (see Appendix A). Next, we
measured participants’ level of entitlement and gratitude using the same questions and scale as in
the previous studies, and we measured the degree to which they expected to receive a free cookie
that day. As manipulation checks, we asked them to rate the repetitiveness and regularity of free
cookies received in the past, and, as attention checks we asked to recall how often they had
received a free cookie and whether they received one that day.
Results and Discussion
Two hundred MTurk panelists participated in this third study in exchange for a small
monetary compensation. Ten participants (5%) failed one or both attention checks and were
removed from the sample, leaving 190 respondents for the analysis (45% male, Mage = 36.53,
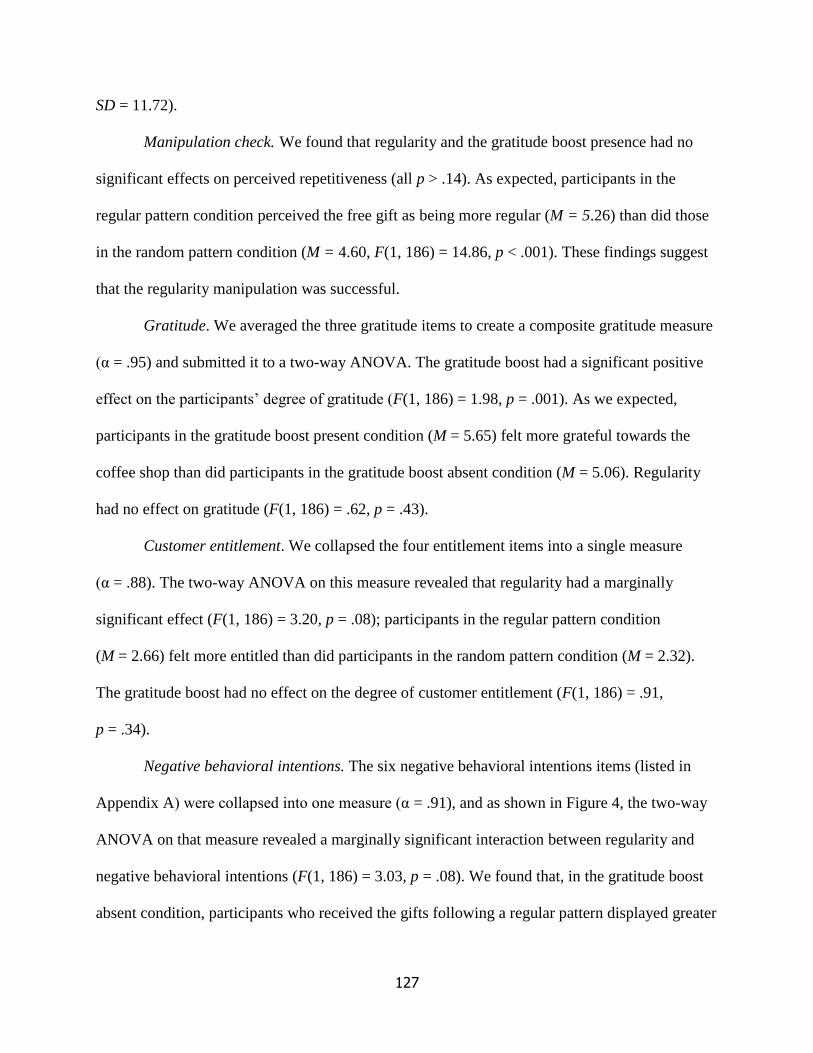
127
SD = 11.72).
Manipulation check. We found that regularity and the gratitude boost presence had no
significant effects on perceived repetitiveness (all p > .14). As expected, participants in the
regular pattern condition perceived the free gift as being more regular (M = 5.26) than did those
in the random pattern condition (M = 4.60, F(1, 186) = 14.86, p < .001). These findings suggest
that the regularity manipulation was successful.
Gratitude. We averaged the three gratitude items to create a composite gratitude measure
(α = .95) and submitted it to a two-way ANOVA. The gratitude boost had a significant positive
effect on the participants’ degree of gratitude (F(1, 186) = 1.98, p = .001). As we expected,
participants in the gratitude boost present condition (M = 5.65) felt more grateful towards the
coffee shop than did participants in the gratitude boost absent condition (M = 5.06). Regularity
had no effect on gratitude (F(1, 186) = .62, p = .43).
Customer entitlement. We collapsed the four entitlement items into a single measure
(α = .88). The two-way ANOVA on this measure revealed that regularity had a marginally
significant effect (F(1, 186) = 3.20, p = .08); participants in the regular pattern condition
(M = 2.66) felt more entitled than did participants in the random pattern condition (M = 2.32).
The gratitude boost had no effect on the degree of customer entitlement (F(1, 186) = .91,
p = .34).
Negative behavioral intentions. The six negative behavioral intentions items (listed in
Appendix A) were collapsed into one measure (α = .91), and as shown in Figure 4, the two-way
ANOVA on that measure revealed a marginally significant interaction between regularity and
negative behavioral intentions (F(1, 186) = 3.03, p = .08). We found that, in the gratitude boost
absent condition, participants who received the gifts following a regular pattern displayed greater
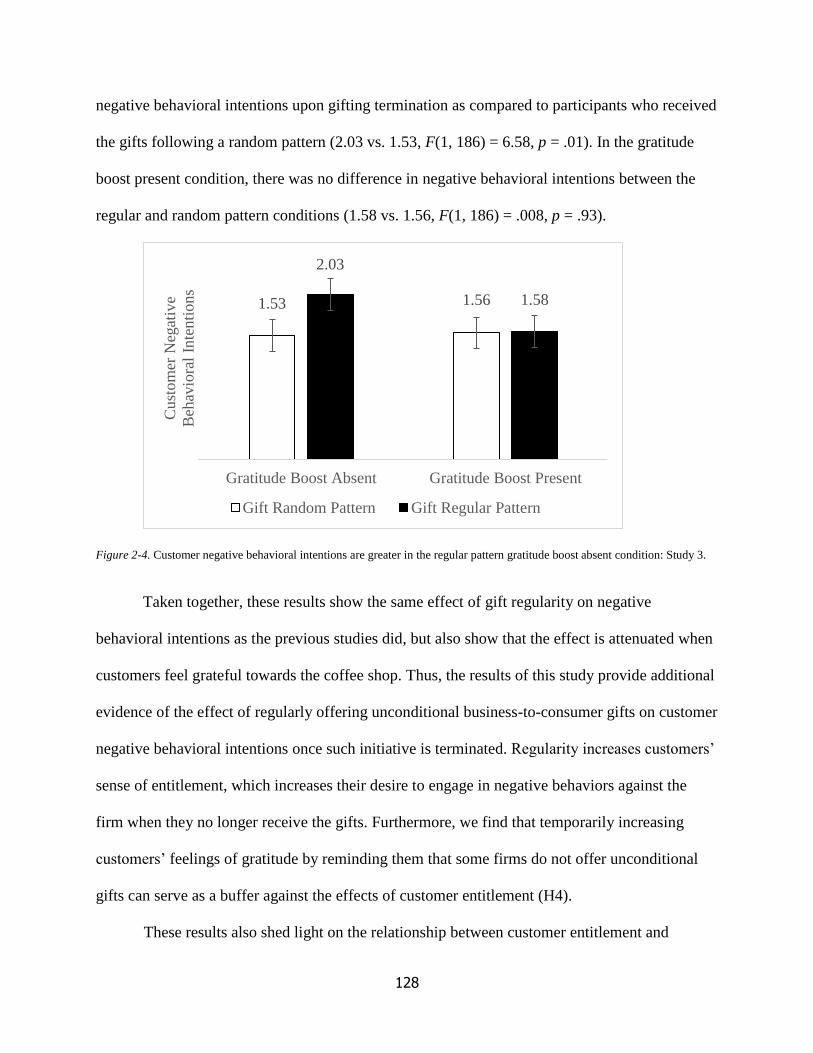
128
negative behavioral intentions upon gifting termination as compared to participants who received
the gifts following a random pattern (2.03 vs. 1.53, F(1, 186) = 6.58, p = .01). In the gratitude
boost present condition, there was no difference in negative behavioral intentions between the
regular and random pattern conditions (1.58 vs. 1.56, F(1, 186) = .008, p = .93).
Figure 2-4. Customer negative behavioral intentions are greater in the regular pattern gratitude boost absent condition: Study 3.
Taken together, these results show the same effect of gift regularity on negative
behavioral intentions as the previous studies did, but also show that the effect is attenuated when
customers feel grateful towards the coffee shop. Thus, the results of this study provide additional
evidence of the effect of regularly offering unconditional business-to-consumer gifts on customer
negative behavioral intentions once such initiative is terminated. Regularity increases customers’
sense of entitlement, which increases their desire to engage in negative behaviors against the
firm when they no longer receive the gifts. Furthermore, we find that temporarily increasing
customers’ feelings of gratitude by reminding them that some firms do not offer unconditional
gifts can serve as a buffer against the effects of customer entitlement (H4).
These results also shed light on the relationship between customer entitlement and
1.53 1.56
2.03
1.58
Gratitude Boost Absent Gratitude Boost Present
Cust
om
er N
egat
ive
Beh
avio
ral
Inte
nti
ons
Gift Random Pattern Gift Regular Pattern
129
gratitude in the context of unconditional business-to-consumer gift-giving. Existing theory has
suggested that customer entitlement and gratitude are independent paths that jointly influence
firms’ financial outcomes (Wetzel et al. 2014). Our study offers empirical evidence that supports
this proposition: increasing customer gratitude does not decrease customer entitlement but does
weaken the effect of customer entitlement on customer negative behavioral intentions,
suggesting that customer entitlement and gratitude are independent influences that have opposing
effects on downstream behavioral outcomes.
STUDY 4: GIFT REPETITION AND SELECTION CRITERIA
In the first three studies, we provided support for our attribution-based causes of
entitlement by manipulating attributional antecedents (i.e., customer past purchase frequency,
gift repetition, gift regularity, and gift value) and measuring the consequences of such causal
inferences (i.e., entitlement). In this next study, we aim to provide direct evidence that customers
will indeed become entitled to unconditional business-to-consumer gifts because they infer that
the reason they receive them is that they are valuable customers. We proposed customer value
inference as the key underlying factor in influencing the effect of unconditional gift-giving on
entitlement, and ultimately, customer negative behavioral intentions. If this is indeed the
underlying factor, the effect we found in the first three studies should also be found when firms
openly state that customer value is their gift recipient selection criterion. On the contrary, the
effect should not be obtained when firms provide an explicit selection criterion that contradicts
and substitutes the customer value inference, such as when firms explicitly state that gifts are
assigned to customers by chance. Formally, we predict that
H5. When gift selection criterion is made explicit and it is not congruent with customers’
130
inferences of being valuable to the firm, customers will not feel entitled and will not exhibit
negative behavioral intentions upon gift-giving termination.
In our fourth study, we test this hypothesis with a moderation-of-process experimental
design (Spencer et al., 2005) in which we manipulate our process variable. Specifically, in
addition to manipulating our independent variable (i.e., gift repetition), we manipulate the
process variable (i.e., gift recipient selection criterion) to find support for our process
explanation. This approach is especially suited to those situations in which the process variable is
hard to measure directly but easy to manipulate. In past research, the validity and reliability of
attribution elicitation measurement has been empirically criticized (Howard, 1987), and in our
case it is easy to manipulate the information customers have to either confirm or shift their causal
inferences. Finally, in addition to testing the valuable customer inference process directly, we
conceptually replicate our previous findings by changing the type of unconditional gift to a
birthday coupon offered by an online retailer. It could be argued that the typologies of
unconditional gifts we used in the first three studies were all tied to having made a purchase, and
that entitlement could have been partially driven by the “partial” unconditionality of the gift. To
address this issue, in the next study we use a type of unconditional gift that could be repeatedly
received without making a purchase (birthday e-mail coupons).
Design and Stimuli
This study also employed a 2 (repetition: every-time gift vs. one-time gift) × 2 (selection
criterion: valuable customer vs. randomly selected customer) between-subjects design.
Participants in the every-time gift (one-time gift), valuable customer (randomly selected
customer) condition read that they had been shopping for clothes online for the past four years
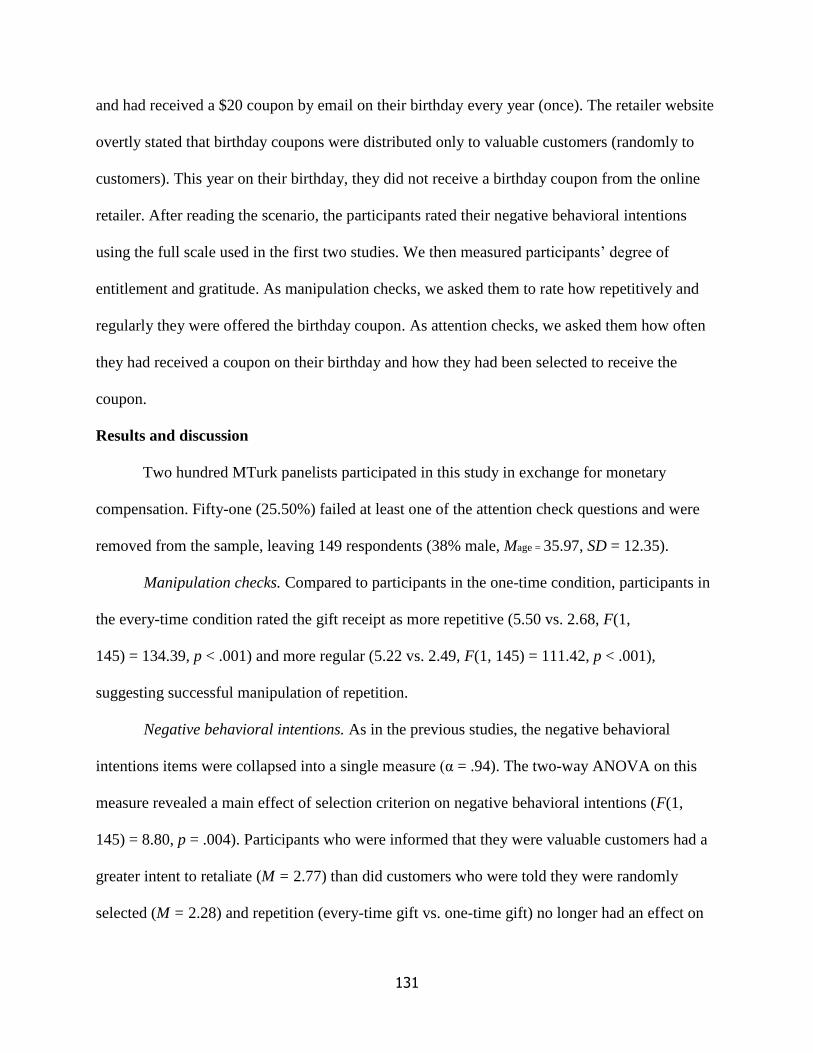
131
and had received a $20 coupon by email on their birthday every year (once). The retailer website
overtly stated that birthday coupons were distributed only to valuable customers (randomly to
customers). This year on their birthday, they did not receive a birthday coupon from the online
retailer. After reading the scenario, the participants rated their negative behavioral intentions
using the full scale used in the first two studies. We then measured participants’ degree of
entitlement and gratitude. As manipulation checks, we asked them to rate how repetitively and
regularly they were offered the birthday coupon. As attention checks, we asked them how often
they had received a coupon on their birthday and how they had been selected to receive the
coupon.
Results and discussion
Two hundred MTurk panelists participated in this study in exchange for monetary
compensation. Fifty-one (25.50%) failed at least one of the attention check questions and were
removed from the sample, leaving 149 respondents (38% male, Mage = 35.97, SD = 12.35).
Manipulation checks. Compared to participants in the one-time condition, participants in
the every-time condition rated the gift receipt as more repetitive (5.50 vs. 2.68, F(1,
145) = 134.39, p < .001) and more regular (5.22 vs. 2.49, F(1, 145) = 111.42, p < .001),
suggesting successful manipulation of repetition.
Negative behavioral intentions. As in the previous studies, the negative behavioral
intentions items were collapsed into a single measure (α = .94). The two-way ANOVA on this
measure revealed a main effect of selection criterion on negative behavioral intentions (F(1,
145) = 8.80, p = .004). Participants who were informed that they were valuable customers had a
greater intent to retaliate (M = 2.77) than did customers who were told they were randomly
selected (M = 2.28) and repetition (every-time gift vs. one-time gift) no longer had an effect on
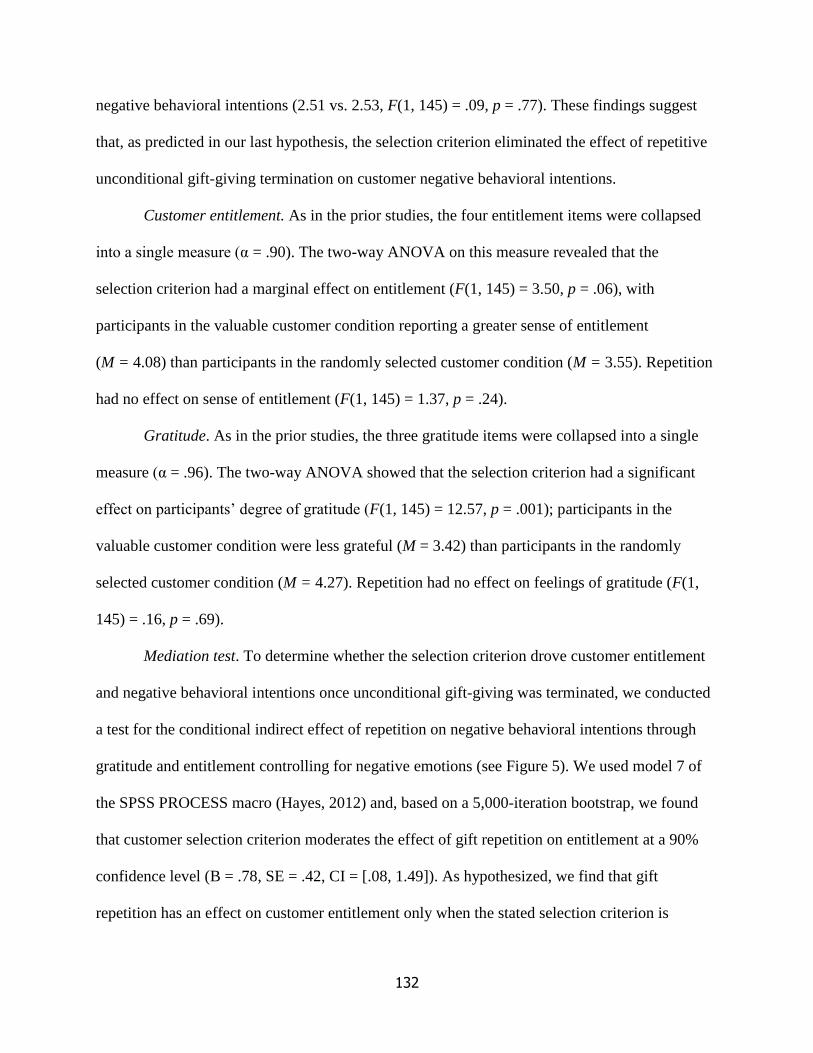
132
negative behavioral intentions (2.51 vs. 2.53, F(1, 145) = .09, p = .77). These findings suggest
that, as predicted in our last hypothesis, the selection criterion eliminated the effect of repetitive
unconditional gift-giving termination on customer negative behavioral intentions.
Customer entitlement. As in the prior studies, the four entitlement items were collapsed
into a single measure (α = .90). The two-way ANOVA on this measure revealed that the
selection criterion had a marginal effect on entitlement (F(1, 145) = 3.50, p = .06), with
participants in the valuable customer condition reporting a greater sense of entitlement
(M = 4.08) than participants in the randomly selected customer condition (M = 3.55). Repetition
had no effect on sense of entitlement (F(1, 145) = 1.37, p = .24).
Gratitude. As in the prior studies, the three gratitude items were collapsed into a single
measure (α = .96). The two-way ANOVA showed that the selection criterion had a significant
effect on participants’ degree of gratitude (F(1, 145) = 12.57, p = .001); participants in the
valuable customer condition were less grateful (M = 3.42) than participants in the randomly
selected customer condition (M = 4.27). Repetition had no effect on feelings of gratitude (F(1,
145) = .16, p = .69).
Mediation test. To determine whether the selection criterion drove customer entitlement
and negative behavioral intentions once unconditional gift-giving was terminated, we conducted
a test for the conditional indirect effect of repetition on negative behavioral intentions through
gratitude and entitlement controlling for negative emotions (see Figure 5). We used model 7 of
the SPSS PROCESS macro (Hayes, 2012) and, based on a 5,000-iteration bootstrap, we found
that customer selection criterion moderates the effect of gift repetition on entitlement at a 90%
confidence level (B = .78, SE = .42, CI = [.08, 1.49]). As hypothesized, we find that gift
repetition has an effect on customer entitlement only when the stated selection criterion is
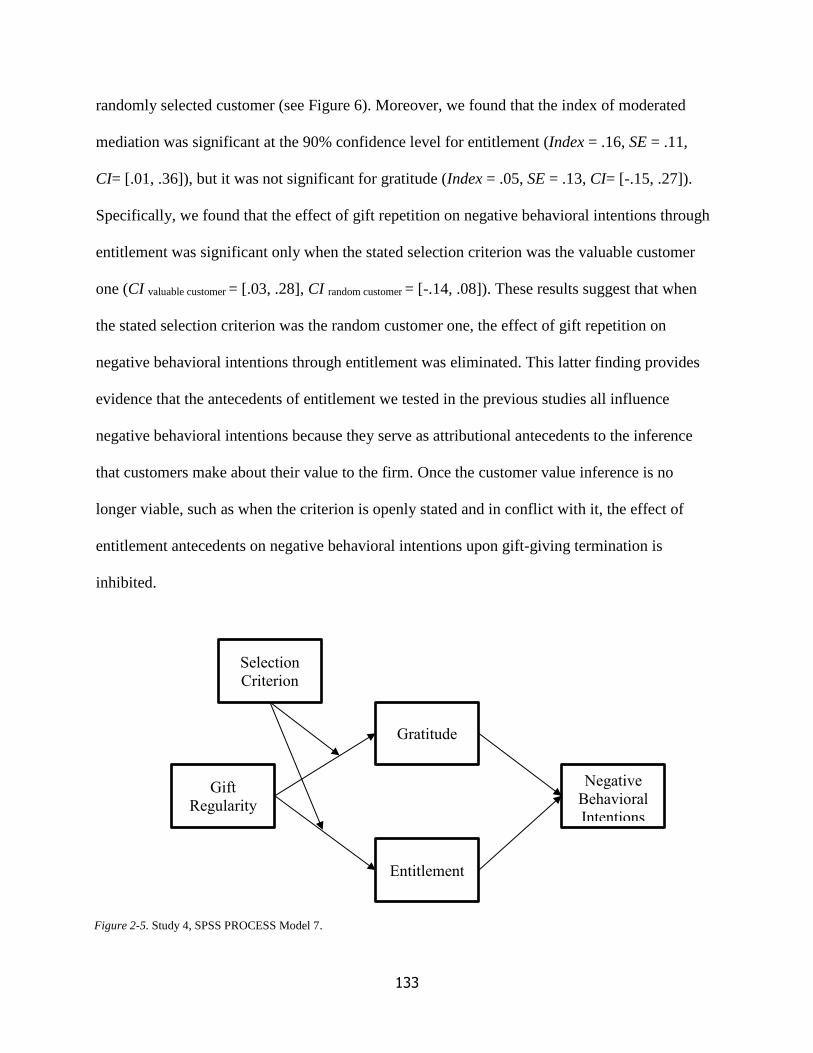
133
randomly selected customer (see Figure 6). Moreover, we found that the index of moderated
mediation was significant at the 90% confidence level for entitlement (Index = .16, SE = .11,
CI= [.01, .36]), but it was not significant for gratitude (Index = .05, SE = .13, CI= [-.15, .27]).
Specifically, we found that the effect of gift repetition on negative behavioral intentions through
entitlement was significant only when the stated selection criterion was the valuable customer
one (CI valuable customer = [.03, .28], CI random customer = [-.14, .08]). These results suggest that when
the stated selection criterion was the random customer one, the effect of gift repetition on
negative behavioral intentions through entitlement was eliminated. This latter finding provides
evidence that the antecedents of entitlement we tested in the previous studies all influence
negative behavioral intentions because they serve as attributional antecedents to the inference
that customers make about their value to the firm. Once the customer value inference is no
longer viable, such as when the criterion is openly stated and in conflict with it, the effect of
entitlement antecedents on negative behavioral intentions upon gift-giving termination is
inhibited.
Gift
Regularity
Gratitude
Negative
Behavioral
Intentions
Selection
Criterion
Entitlement
Figure 2-5. Study 4, SPSS PROCESS Model 7.
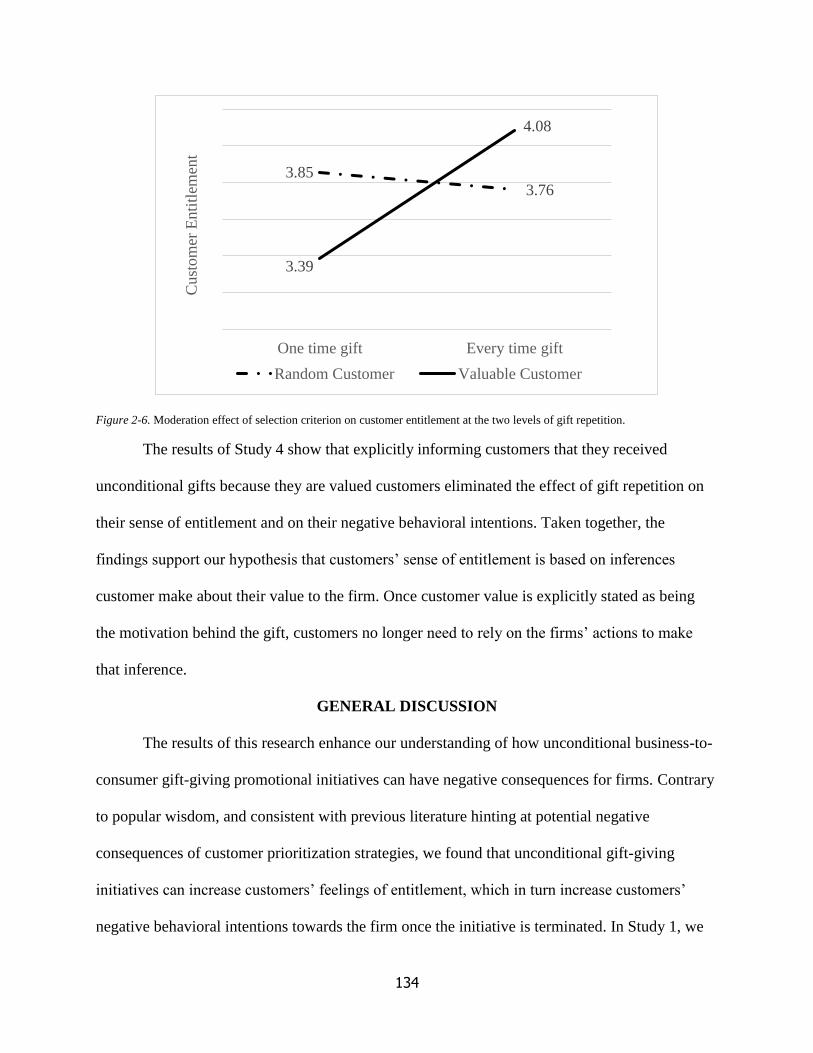
134
Figure 2-6. Moderation effect of selection criterion on customer entitlement at the two levels of gift repetition.
The results of Study 4 show that explicitly informing customers that they received
unconditional gifts because they are valued customers eliminated the effect of gift repetition on
their sense of entitlement and on their negative behavioral intentions. Taken together, the
findings support our hypothesis that customers’ sense of entitlement is based on inferences
customer make about their value to the firm. Once customer value is explicitly stated as being
the motivation behind the gift, customers no longer need to rely on the firms’ actions to make
that inference.
GENERAL DISCUSSION
The results of this research enhance our understanding of how unconditional business-to-
consumer gift-giving promotional initiatives can have negative consequences for firms. Contrary
to popular wisdom, and consistent with previous literature hinting at potential negative
consequences of customer prioritization strategies, we found that unconditional gift-giving
initiatives can increase customers’ feelings of entitlement, which in turn increase customers’
negative behavioral intentions towards the firm once the initiative is terminated. In Study 1, we
3.853.76
3.39
4.08
One time gift Every time gift
Cust
om
er E
nti
tlem
ent
Random Customer Valuable Customer
135
showed that receiving unconditional free shipping from an online retailer led to an increase in
customer feelings of entitlement only when the free shipping was offered repeatedly (vs. once),
but it did not increase as a function of customers’ past purchase frequency. Moreover, we found
that those customers who felt entitled to the unconditional free shipping expressed higher
negative behavioral intentions towards the firm when the gifting stopped as compared to
customers who did not feel entitled to it. Finally, we demonstrated that customer feelings of
entitlement and of gratitude mediated the effect even when we accounted for customer negative
emotions and customer disconfirmed expectations.
Study 2 enhanced the robustness of our findings of unconditional gift-giving termination
on customer negative behavioral intentions by generalizing the effect to another type of
unconditional gift (i.e., free dessert from a restaurant) and added to the empirical examination of
the antecedents of entitlement by examining the influence of gift regularity and gift value. We
showed that customers who received a high-value free dessert regularly in the past displayed
heightened feelings of entitlement and increased negative behavioral intentions towards the
restaurant once they no longer received it. Study 3 revealed that customers who received external
reminders that they should feel grateful towards the firm (gratitude boost) no longer displayed
negative behavioral intentions towards the firm once the regularly provided unconditional gift
was not received.
Taken together, Study 1-3 offered insights regarding which characteristics of business-to-
consumer gift-giving initiatives lead to customer entitlement and regarding the opposing roles of
customer entitlement and gratitude in influencing customer negative behavioral intentions upon
gift-giving termination. Study 4 provided further process evidence by directly testing our
proposition that customers develop a sense of entitlement following a causal inference they make
136
about why they received the gifts. In addition, we further generalized the effect to an
unconditional gift that could be repeatedly received by customers regardless of whether a
purchase was made (birthday e-mail coupons). We found support for our hypothesized
relationship between customers inferring they are valuable to the firm and their sense of
entitlement to the gifts by showing that when customers were told that they have been randomly
selected to receive birthday coupons in the past, the effect of repeatedly receiving the coupons on
entitlement and negative behavioral intentions was eliminated. A summary of our studies and
findings is presented in Appendix C.
Theoretical Implications
Numerous studies have demonstrated that business gifts can be an effective tool for
building and maintaining good customer relationships (Beltramini, 1992, 2000; Bodur &
Grohmann, 2005; Chandon et al., 2000). We show that there are risks associated with
terminating gift-giving initiatives that offer relatively high-value unconditional gifts repetitively
and regularly. In the process of receiving such gifts over time, customers develop feelings of
entitlement and then resent the firm when the gifts cease, leading them to want to engage in
negative behaviors against the firm. These results add to previous research investigating the dark
side of promotional strategies (Jiang, Hoegg, & Dahl, 2013; Kristofferson, Mcferran, Morales, &
Dahl, 2017; Wetzel et al., 2014) and to research investigating customers’ reactions to loyalty
program termination (Melnyk & Bijmolt, 2015; Rehnen, 2016).
To the best of our knowledge, we are the first to investigate the antecedents of customer
entitlement in the context of unconditional business gifts. We answer the question of how and
why customers feel entitled after receiving unconditional gifts. We show that customers, in the
absence of an explicit reciprocation request, infer that they are valuable to the firm. Receiving
137
valuable unconditional gifts repetitively and predictably leads customers to view themselves as
deserving of the gifts. However, when the firm explicitly informs its customers that they are
receiving unconditional gifts because they are valued customers, the customers feel entitled to
the gifts regardless of how often the gifts are provided. Therefore, our results provide direct
evidence that customer entitlement derives from their past experiences with the firm and
inferences they make based on those experiences (Boyd III & Helms, 2005b).
Our findings also provide insight into the relationship between customer entitlement and
customer gratitude, which are both triggered by customer prioritization strategies such as
offering business gifts. Wetzel and colleagues (2014) posited that customer prioritization
strategies represented a double-edged sword for the firm and proposed a dual-process model:
customer prioritization strategies generate customer gratitude, which increases sales, but also
induce customer entitlement, which increases the firm’s service cost. However, the mechanism
of the dual-process model is unclear about whether gratitude and entitlement affect sales and
service costs independently or interdependently, and our results provide evidence that supports
independent effects. In our first study, we found that customer entitlement was a function of gift
repetition, but customer gratitude was not. In our third study, we found that providing
information to boost gratitude did not affect customers’ degree of entitlement. We thus conclude
that entitlement and gratitude work independently rather than influence each other.
Several prior studies have examined customer negative behavioral intentions resulting
from customers’ dissatisfaction with firms (Bougie, Pieters, & Zeelenberg, 2003; Grégoire,
Laufer, & Tripp, 2010; Hirschman, 1970; Huefner & Hunt, 2000; Kähr et al., 2016; Oliver,
1977). However, literature on customer dissatisfaction focused on situations in which customers
dealt with some sort of firms’ misconduct (e.g., product or service failures, poor service failure
138
recovery, unethical behavior). We find that even firms’ relationship building efforts designed to
unconditionally please customers, if terminated with no exit strategy and/or not strategically
designed to be terminated, can cause customer negative behavioral intentions.
Managerial Implications
Reciprocity norms play an important role in sales promotion and loyalty strategies that
managers use. According to the norm of reciprocity, people not only should reciprocate when
receiving gifts, but they should also not harm their benefactors (Gouldner, 1960). Accordingly,
common knowledge might suggest that managers do not need to worry about terminating
unconditional business-to-consumer gift-giving initiatives given that customers are not explicitly
requested to reciprocate the gifts, nor they are expected to exert effort to gain them. However, we
found that even when firms unconditionally spoil their customers with gifts, they cannot escape
the trap of customer entitlement unless they know exactly how to design initiatives that will not
backfire once terminated. Our results provide actionable managerial insights on how to
proactively avoid customer entitlement as well as on how to reactively reduce it when is likely
already developed.
To minimize customer entitlement up front, firms should offer business-to-consumer gifts
(1) that have a relatively small monetary value, (2) only once or (3) on an irregular basis if
offered repetitively. We also found that (4) informing customers that the unconditional gift is
offered to randomly selected customers limits customer entitlement. However, this strategy is
likely not to comport with the firm objective of building a loyal customer base. We have
demonstrated that customers who are directly informed that they are valuable to the firm feel a
greater sense of entitlement, which can be detrimental to the firm when the gifting initiative
139
ends. One way to have customers infer that the gift is truly a randomly provided token of
affection could be to deliver unconditional gifts in a way that truly surprises them.
It is important to remind managers that the negative impact of entitlement goes beyond
negative behavioral intentions upon initiative termination. Previous research has shown that
entitled customers exhibit opportunistic behavior, and are more costly to the firm (Polyakova et
al., 2014; Wetzel et al., 2014), and managers should thus be careful in controlling their
customers’ entitlement in general. To manage existing levels of customer entitlement, firms can
try to bolster customer feelings of gratitude. Even though we showed that entitlement and
gratitude are independent processes, we also showed that boosting gratitude by simply reminding
customers that other firms do not offer unconditional gifts can mitigate the negative
consequences of entitlement. Our findings suggest that managers should find ways to elicit
gratitude in a more controlled way. We showed that providing unconditional gifts repeatedly
does not increase gratitude, but instead increases entitlement through customers’ inference-
making, and thus firms could try to discreetly guide customer inferences to their favor. For
example, they could hint at randomness by saying something like “This birthday coupon is
delivered to you and to other 100 lucky customers today.” Or they could highlight their
generosity “This free cookie is our gift to you today, ask your friends if they received one today
at their coffee shop.”
Anecdotal evidence found in business news coverage suggests that terminating
promotional initiatives can generate a wide variety of customer negative retaliatory behaviors
(Mezzofiore, 2016; Ogles, 2005). To add to this additional evidence, we would like to note that
some of our participants left comments regarding how they identified with the subject in the
scenarios or how they would feel if they were in that situation. For example, one participant from
140
Study 3 said “I feel the scenario was very real to me, I shop a lot on QVC and every year on my
birthday I would get a coupon and then one year I stopped getting it and my shopping amount
was still the same and it made me feel like maybe they really didn't care for my business.” Or as
a participant in Study 1 said “As a customer, I would hope that the grocery store would notify me
before they remove the free shipping. It's disappointing to see a charge that wasn't there with the
other orders. Interesting survey!” Altogether, our findings indicate that promotional initiatives
termination is a real issue that managers should not underestimate.
Limitations and Further Research
Some limitations of the present research provide direction for future investigations. First,
all of our studies dealt with standard business gifts (i.e., free shipping, free product, birthday
coupon), as they are the more common ones used and, given our scenario-based methodology,
they also are the easier ones to identify with as participants surely received them in real life.
However, new technologies and data availability is making it possible for firms to provide highly
relevant gifts tailored to their individual customers and delivered when and where they are most
likely to enjoy them. Thanks to their own sales data or to social listening tools, firms can know
their customers’ preferences and, thanks to mobile beacon technologies, they are able to send
promotions and unconditional gifts when and where it matters. For example, imagine that a
restaurant knows which dessert a customer prefers and sends her a beacon-based proximity
promotional message to let her know she has been gifted one for free. In this case, it would be
interesting to run a field study to test whether the relevance and/or the timing of the
unconditional gifts also generate entitlement or if the surprise effect of receiving the gift works
more towards building gratitude.
Second, research should devote more attention to promotional initiative termination
141
consequences. We found anecdotal evidence of customer dissatisfaction and rage following
programs termination, but only a few empirical studies have addressed the issue of loyalty
program termination (Melnyk & Bijmolt, 2015; Rehnen, 2016). Promotional budgets and
objectives change, so it is not usual for firms to terminate their customer prioritization strategies.
We provided additional evidence that termination can lead to negative customer behavioral
intentions, but we did not examine which strategies could be used for firms to terminate their
initiatives without damage. Research might seek to test whether different information policies
work best at notifying customers.
Third, beyond termination, it is likely that simply modifying promotional activities might
also elicit customer negative behavioral intentions. Therefore, it might be meaningful to explore
how customers will react when they are moved to a lower tier of a loyalty program or when their
benefits from a promotional initiative are curtailed. Our findings suggest that if past interactions
with the firm built up customers’ sense of entitlement, such actions might be perceived as unjust
and trigger customers’ negative reactions.
Fourth, another potential direction for further study is to identify additional ways to
mitigate the effect of entitlement on customers negative behavioral intentions and ways to avoid
entitlement increase in the first place. Studies have shown that customer entitlement can be
induced by situational factors (Kivetz & Zheng, 2006; Zitek et al., 2010); consequently, it should
also be possible to reduce customers’ sense of entitlement through situational factors. Future
studies could explore ways to inhibit situationally triggered entitlement.
142
REFERENCES
Accenture. (2016). Factors which influenced brand loyalty in the United States as of August
2016, by consumer’s age. Retrieved March 31, 2018, from https://www-statista-
com.ezproxy.hec.fr/statistics/676824/brand-loyalty-factors-age-usa/
Alton, L. (2016, April 18). The Value of Free: How Businesses Benefit From Giving Stuff
Away. Retrieved April 30, 2017, from
http://www.cio.com/article/3056770/marketing/the-value-of-free-how-businesses-benefit-
from-giving-stuff-away.html
Belk, R. W. (1976). It’s the thought that counts: A signed digraph analysis of gift-giving. Journal
of Consumer Research, 3(3), 155–162. https://doi.org/10.1086/208662
Belk, R. W. (1979). Gifting-giving behavior: Research in marketing. Greenwich: JAI press.
Belk, R. W., & Coon, G. S. (1993). Gift Giving as Agapic Love: An Alternative to the Exchange
Paradigm Based on Dating Experiences. Journal of Consumer Research, 20(3), 393–417.
https://doi.org/10.1086/209357
Beltramini, R. F. (1992). Exploring the effectiveness of business gifts: A controlled field
experiment. Journal of the Academy of Marketing Science, 20(1), 87–91.
https://doi.org/10.1007/BF02723479
Beltramini, R. F. (2000). Exploring the Effectiveness of Business Gifts: Replication and
Extension. Journal of Advertising, 29(2), 75–78.
https://doi.org/10.1080/00913367.2000.10673610
Bodur, H. O., & Grohmann, B. (2005). Consumer responses to gift receipt in business-to-
consumer contexts. Psychology & Marketing, 22(5), 441–456.
https://doi.org/10.1002/mar.20067
143
Bougie, R., Pieters, R., & Zeelenberg, M. (2003). Angry Customers Don’t Come Back, They Get
Back: The Experience and Behavioral Implications of Anger and Dissatisfaction in
Services. Journal of the Academy of Marketing Science, 31(4), 377–393.
https://doi.org/10.1177/0092070303254412
Boyd III, H. C., & Helms, J. E. (2005a). Consumer Entitlement Theory and Measurement.
Psychology & Marketing, 22(3), 271–286. https://doi.org/10.1002/mar.20058
Boyd III, H. C., & Helms, J. E. (2005b). Consumer entitlement theory and measurement.
Psychology and Marketing, 22(3), 271–286. https://doi.org/10.1002/mar.20058
Butori, R. (2010). Proposition for an Improved Version of the Consumer Entitlement Inventory.
Psychology & Marketing, 27(3), 285–297. https://doi.org/10.1002/mar.20327
Campbell, W. K., Bonacci, A. M., Shelton, J., Exline, J. J., & Bushman, B. J. (2004).
Psychological Entitlement: Interpersonal Consequences and Validation of a Self-Report
Measure. Journal of Personality Assessment, 83(1), 29–45.
https://doi.org/10.1207/s15327752jpa8301_04
Chandon, P., Wansink, B., & Laurent, G. (2000). A benefit congruency framework of sales
promotion effectiveness. Journal of Marketing, 64(4), 65–81.
https://doi.org/10.1509/jmkg.64.4.65.18071
Eales, T. (2016). A pause in promotion escalation [PDF file]. Retrieved from
https://www.iriworldwide.com/nl-NL/insights/Publications/Price-Promotion-in-Western-
Economies-a-Pause-in-Promotion-Escalation-nl
Emmons, R. A. (1984). Factor Analysis and Construct Validity of the Narcissistic Personality
Inventory. Journal of Personality Assessment, 48(3), 291.
http://psycnet.apa.org/doi/10.1207/s15327752jpa4803_11
144
Exline, J. J., Baumeister, R. F., Bushman, B. J., Campbell, W. K., & Finkel, E. J. (2004). Too
Proud to Let Go: Narcissistic Entitlement as a Barrier to Forgiveness. Journal of
Personality and Social Psychology, 87(6), 894. https://doi.org/10.1037/0022-
3514.87.6.894
Fasig, L. B. (2015). Taking the Cake in Loyalty: Going Beyond Birthday Rewards with
Kellogg’s, Hertz, Smashbox. Retrieved from https://www.colloquy.com/loyalty-
strategies/taking-the-cake-in-loyalty-going-beyond-birthday-rewards-with-kellogg-s-
hertz-smashbox/
Ferdman, R. A. (2015). Why Pret A Manger gives away so much free food to customers.
Retrieved April 30, 2017, from
https://www.washingtonpost.com/news/wonk/wp/2015/04/23/the-unusual-unofficial-and-
kind-of-brilliant-way-pret-a-manger-thanks-its-customers/
Folkes, V. S. (1988). Recent Attribution Research in Consumer Behavior: A Review and New
Directions. Journal of Consumer Research, 14(4), 548–565.
http://psycnet.apa.org/doi/10.1086/209135
Garner, T. I., & Wagner, J. (1991). Economic dimensions of household gift giving. Journal of
Consumer Research, 18(3), 368–379. https://doi.org/10.1086/209266
Gouldner, A. W. (1960). The Norm of Reciprocity: A Preliminary Statement. American
Sociological Review, 161–178.
Grégoire, Y., & Fisher, R. J. (2006). The Effects of Relationship Quality on Customer
Retaliation. Marketing Letters, 17(1), 31–46. https://doi.org/10.1007/s11002-006-3796-4
Grégoire, Y., & Fisher, R. J. (2008). Customer betrayal and retaliation: when your best
customers become your worst enemies. Journal of the Academy of Marketing Science,
145
36(2), 247–261.
Grégoire, Y., Laufer, D., & Tripp, T. M. (2010). A Comprehensive Model of Customer Direct
and Indirect Revenge: Understanding the Effects of Perceived Greed and Customer
Power. Journal of the Academy of Marketing Science, 38(6), 738–758.
https://doi.org/10.1007/s11747-009-0186-5
Hall, J. (2013). 5 Gifts that Keep You at the Top of Clients’ Minds. Retrieved April 30, 2017,
from http://www.forbes.com/sites/johnhall/2013/06/10/5-gifts-that-keep-you-at-the-top-
of-clients-minds/
Hayes, A. F. (2012). PROCESS: A Versatile Computational Tool for Observed Variable
Mediation, Moderation, and Conditional Process Modeling [White Paper]. Retrieved
September 25, 2015, from http://www.afhayes.com/ public/process2012.pdf
Heider, F. (1982). The Psychology of Interpersonal Relations. Hillsdale, New Jersey: Lawrence
Erlbaum Associates.
Henderson, C. M., Beck, J. T., & Palmatier, R. W. (2011). Review of the Theoretical
Underpinnings of Loyalty Programs. Journal of Consumer Psychology, 21(3), 256–276.
https://doi.org/10.1016/j.jcps.2011.02.007
Hirschman, A. O. (1970). Exit, voice, and loyalty: Responses to decline in firms, organizations,
and states. Cambridge, Massachusetts: Harvard university press.
Howard, J. A. (1987). The conceptualization and measurement of attributions. Journal of
Experimental Social Psychology, 23(1), 32–58. https://doi.org/10.1016/0022-
1031(87)90024-2
Huefner, J. C., & Hunt, H. K. (2000). Consumer retaliation as a response to dissatisfaction.
Journal of Consumer Satisfaction Dissatisfaction and Complaining Behavior, 13, 61–79.
146
IEG. (2017). Annual growth of advertising, sales promotion and sponsorship spending in North
America from 2010 to 2018. Retrieved March 31, 2018, from https://www-statista-
com.ezproxy.hec.fr/statistics/196872/change-in-advertising-sales-promotion-sponsorship-
since-2008/
Jiang, L., Hoegg, J., & Dahl, D. W. (2013). Consumer Reaction to Unearned Preferential
Treatment. Journal of Consumer Research, 40(3), 412–427.
https://doi.org/10.1086/670765
Kähr, A., Nyffenegger, B., Krohmer, H., & Hoyer, W. D. (2016). When Hostile Consumers
Wreak Havoc on Your Brand: The Phenomenon of Consumer Brand Sabotage. Journal
of Marketing, 80(3), 25–41. https://doi.org/10.1509/jm.15.0006
Kelley, H. H. (1967). Attribution theory in social psychology. In Nebraska symposium on
motivation. University of Nebraska Press. Retrieved from
http://psycnet.apa.org/psycinfo/1968-13540-001
Kelley, H. H. (1973). The processes of causal attribution. American Psychologist, 28(2), 107–
128. https://doi.org/10.1037/h0034225
Kim, J.-H., & Jang, S. (Shawn). (2014). A scenario-based experiment and a field study: A
comparative examination for service failure and recovery. International Journal of
Hospitality Management, 41, 125–132. https://doi.org/10.1016/j.ijhm.2014.05.004
King, W. C., & Miles, E. W. (1994). The Measurement of Equity Sensitivity. Journal of
Occupational and Organizational Psychology, 67(2), 133–142.
https://doi.org/10.1111/j.2044-8325.1994.tb00556.x
Kivetz, R., & Zheng, Y. (2006). Determinants of Justification and Self-control. Journal of
Experimental Psychology: General, 135(4), 572. https://doi.org/10.1037/0096-
147
3445.135.4.572
Kristofferson, K., Mcferran, B., Morales, A. C., & Dahl, D. W. (2017). The Dark Side of
Scarcity Promotions: How Exposure to Limited-Quantity Promotions Can Induce
Aggression. Journal of Consumer Research, 43(5), 683–706.
https://doi.org/10.1093/jcr/ucw056
Kwok, S., & Uncles, M. (2005). Sales promotion effectiveness: the impact of consumer
differences at an ethnic‐group level. Journal of Product & Brand Management, 14(3),
170–186. https://doi.org/10.1108/10610420510601049
Larsen, D., & Watson, J. J. (2001). A Guide Map to the Terrain of Gift Value. Psychology &
Marketing, 18(8), 889–906. https://doi.org/10.1002/mar.1034
Maute, M. F., & Forrester, W. R. (1993). The structure and determinants of consumer complaint
intentions and behavior. Journal of Economic Psychology, 14(2), 219–247.
https://doi.org/10.1016/0167-4870(93)90001-2
Melnyk, V., & Bijmolt, T. (2015). The effects of introducing and terminating loyalty programs.
European Journal of Marketing, 49(3/4), 398–419. https://doi.org/10.1108/EJM-12-
2012-0694
Mezzofiore, G. (2016, February 23). Starbucks customers lash out at new rewards program.
Retrieved March 31, 2018, from http://www.dailymail.co.uk/news/article-3460044/I-m-
no-mathematician-know-m-screwed-Starbucks-customers-lash-new-rewards-program-
takes-longer-free-perks.html
Morales, A. C. (2005). Giving Firms an “E” for Effort: Consumer Responses to High-effort
Firms. Journal of Consumer Research, 31(4), 806–812. https://doi.org/10.1086/426615
Ogles, J. (2005). Fraud Sinks Subway’s Sub Club. Retrieved March 31, 2018, from
148
https://www.wired.com/2005/09/fraud-sinks-subways-sub-club/
Oliver, R. L. (1977). Effect of expectation and disconfirmation on postexposure product
evaluations: An alternative interpretation. Journal of Applied Psychology, 62(4), 480.
http://psycnet.apa.org/doi/10.1037/0021-9010.62.4.480
Oliver, R. L. (2010). Satisfaction: a behavioral perspective on the consumer (2nd ed). Armonk,
N.Y: M.E. Sharpe.
Otnes, C., & Beltramini, R. F. (Eds.). (1996). Gift giving: a research anthology. Bowling Green,
OH, US: Bowling Green State University Popular Press.
Palmatier, R. W., Jarvis, C. B., Bechkoff, J. R., & Kardes, F. R. (2009). The Role of Customer
Gratitude in Relationship Marketing. Journal of Marketing, 73(5), 1–18.
https://doi.org/10.1509/jmkg.73.5.1
Polyakova, A., Ordanini, A., & Estes, Z. (2014). Double-Edged Nature of Free Perks: Consumer
Entitlement and Its Consequences in the Marketplace. NA-Advances in Consumer
Research Volume 42. Retrieved from
http://www.acrwebsite.org/volumes/v42/acr_v42_17867.pdf
Raskin, R., & Terry, H. (1988). A Principal-components Analysis of the Narcissistic Personality
Inventory and Further Evidence of its Construct Validity. Journal of Personality and
Social Psychology, 54(5), 890.
Rehnen, L. M. (2016). Exit strategies of loyalty programs. Journal of Business Market
Management, 9(1), 564–596.
Schwartz, B. (1967). The Social Psychology of the Gift. American Journal of Sociology, 73(1),
1–11. https://doi.org/10.1086/224432
Shaver, K. G. (1975). An Introduction to Attribution Processes. Oxford, England: Winthrop.
149
Sherry, J. F. (1983). Gift Giving in Anthropological Perspective. Journal of Consumer Research,
10(2), 157–168. https://doi.org/10.1086/208956
Spencer, S. J., Zanna, M. P., & Fong, G. T. (2005). Establishing a causal chain: Why
experiments are often more effective than mediational analyses in examining
psychological processes. Journal of Personality and Social Psychology, 89(6), 845–851.
https://doi.org/10.1037/0022-3514.89.6.845
Watson, P. J., Grisham, S. O., Trotter, M. V., & Biderman, M. D. (1984). Narcissism and
Empathy: Validity Evidence for the Narcissistic Personality Inventory. Journal of
Personality Assessment, 48(3), 301–305. https://doi.org/10.1207/s15327752jpa4803_12
Weiner, B. (2000). Attributional Thoughts about Consumer Behavior. Journal of Consumer
Research, 27(3), 382–387. https://doi.org/10.1086/317592
Wetzel, H. A., Hammerschmidt, M., & Zablah, A. R. (2014). Gratitude Versus Entitlement: A
Dual Process Model of the Profitability Implications of Customer Prioritization. Journal
of Marketing, 78(2), 1–19. https://doi.org/10.1509/jm.12.0167
White, M. C. (2013). 5 Ways Companies Win by Giving Stuff Away. Retrieved from
http://business.time.com/2013/06/24/5-ways-companies-win-by-giving-stuff-away/
White, P. A. (1992). Causal powers, causal questions, and the place of regularity information in
causal attribution. British Journal of Psychology, 83(2), 161.
https://doi.org/10.1111/j.2044-8295.1992.tb02433.x
Zitek, E. M., Jordan, A. H., Monin, B., & Leach, F. R. (2010). Victim Entitlement to Behave
Selfishly. Journal of Personality and Social Psychology, 98(2), 245–255.
https://doi.org/10.1037/a0017168
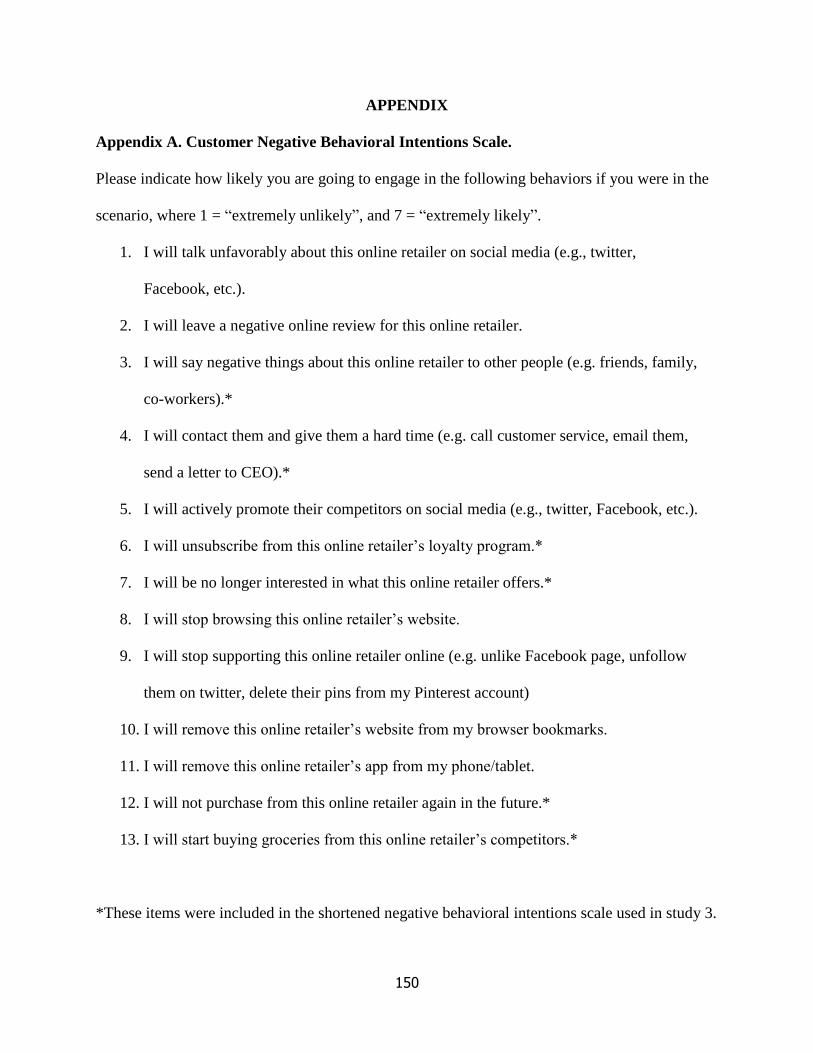
150
APPENDIX
Appendix A. Customer Negative Behavioral Intentions Scale.
Please indicate how likely you are going to engage in the following behaviors if you were in the
scenario, where 1 = “extremely unlikely”, and 7 = “extremely likely”.
1. I will talk unfavorably about this online retailer on social media (e.g., twitter,
Facebook, etc.).
2. I will leave a negative online review for this online retailer.
3. I will say negative things about this online retailer to other people (e.g. friends, family,
co-workers).*
4. I will contact them and give them a hard time (e.g. call customer service, email them,
send a letter to CEO).*
5. I will actively promote their competitors on social media (e.g., twitter, Facebook, etc.).
6. I will unsubscribe from this online retailer’s loyalty program.*
7. I will be no longer interested in what this online retailer offers.*
8. I will stop browsing this online retailer’s website.
9. I will stop supporting this online retailer online (e.g. unlike Facebook page, unfollow
them on twitter, delete their pins from my Pinterest account)
10. I will remove this online retailer’s website from my browser bookmarks.
11. I will remove this online retailer’s app from my phone/tablet.
12. I will not purchase from this online retailer again in the future.*
13. I will start buying groceries from this online retailer’s competitors.*
*These items were included in the shortened negative behavioral intentions scale used in study 3.
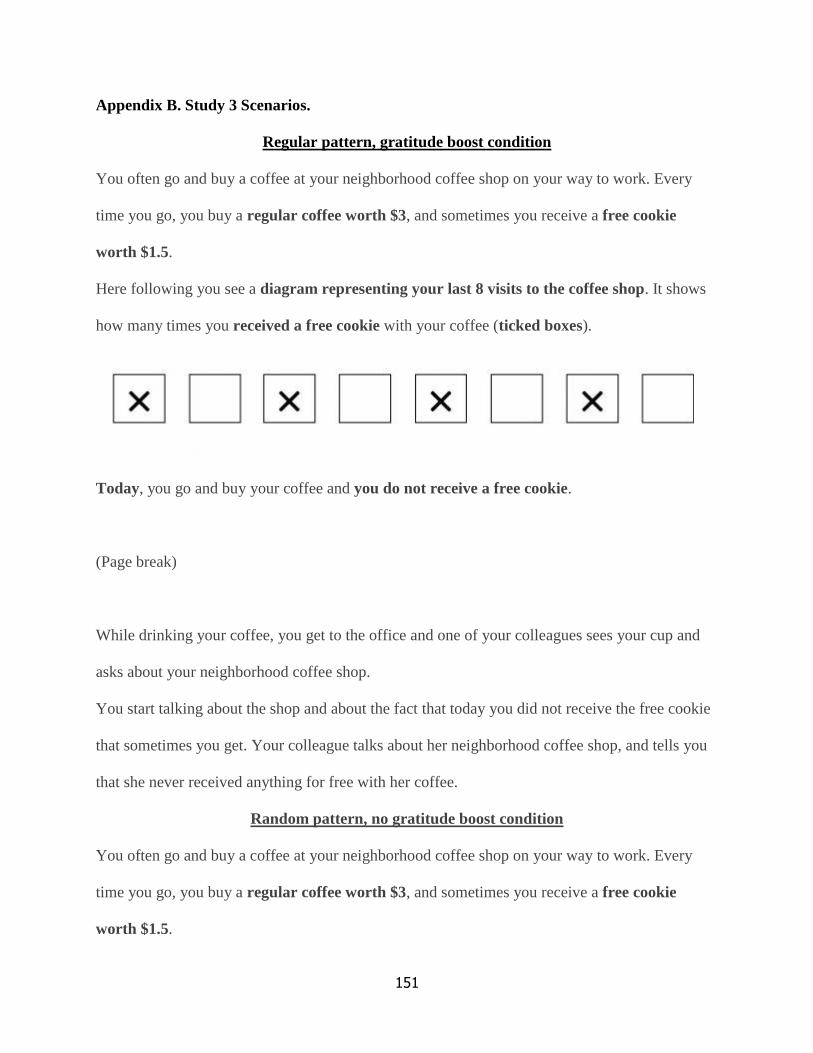
151
Appendix B. Study 3 Scenarios.
Regular pattern, gratitude boost condition
You often go and buy a coffee at your neighborhood coffee shop on your way to work. Every
time you go, you buy a regular coffee worth $3, and sometimes you receive a free cookie
worth $1.5.
Here following you see a diagram representing your last 8 visits to the coffee shop. It shows
how many times you received a free cookie with your coffee (ticked boxes).
Today, you go and buy your coffee and you do not receive a free cookie.
(Page break)
While drinking your coffee, you get to the office and one of your colleagues sees your cup and
asks about your neighborhood coffee shop.
You start talking about the shop and about the fact that today you did not receive the free cookie
that sometimes you get. Your colleague talks about her neighborhood coffee shop, and tells you
that she never received anything for free with her coffee.
Random pattern, no gratitude boost condition
You often go and buy a coffee at your neighborhood coffee shop on your way to work. Every
time you go, you buy a regular coffee worth $3, and sometimes you receive a free cookie
worth $1.5.
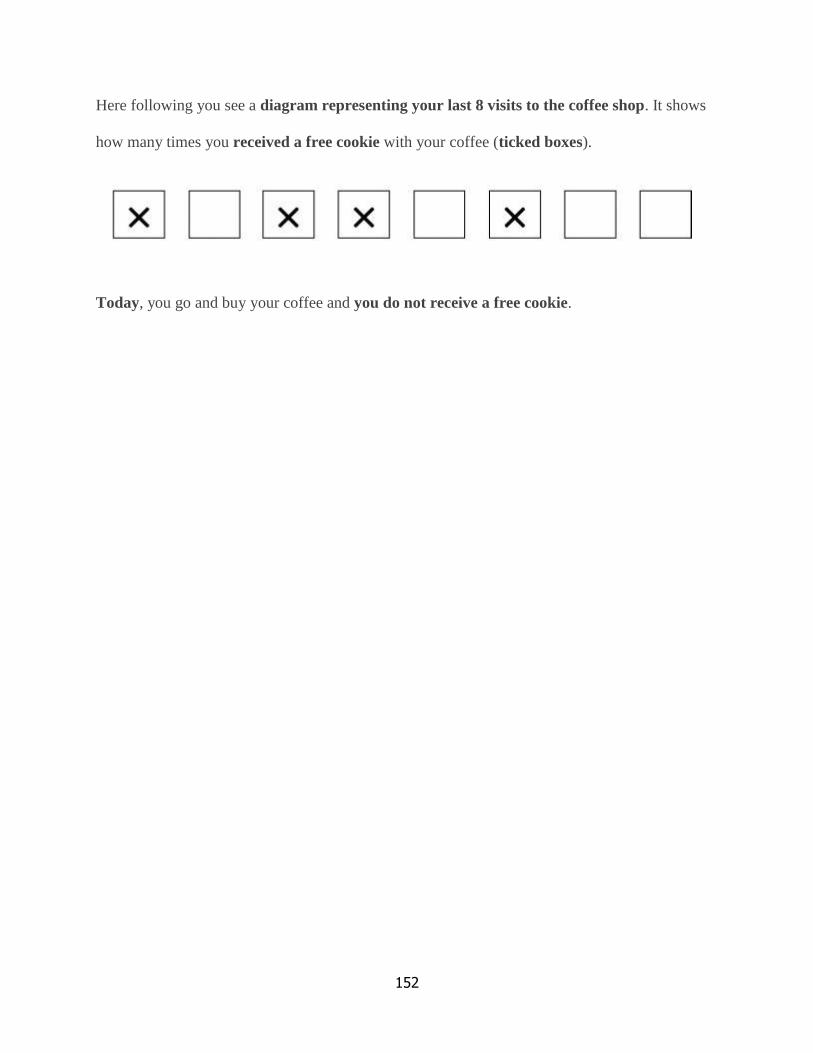
152
Here following you see a diagram representing your last 8 visits to the coffee shop. It shows
how many times you received a free cookie with your coffee (ticked boxes).
Today, you go and buy your coffee and you do not receive a free cookie.
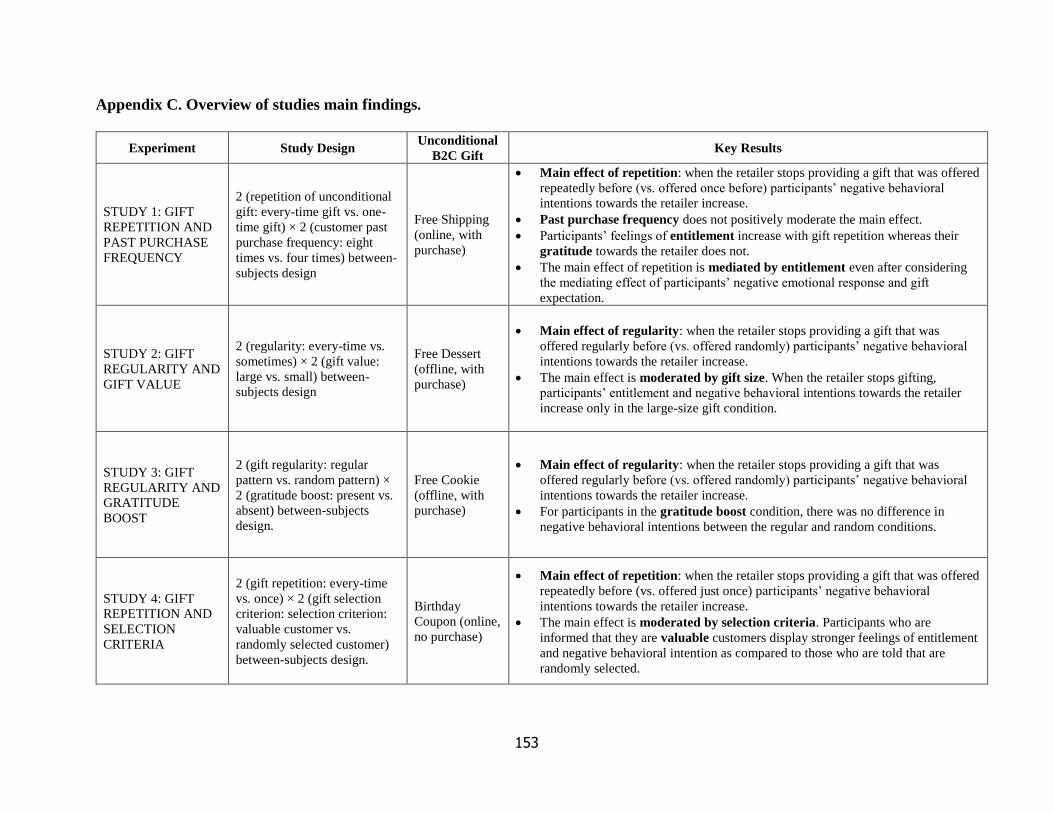
153
Appendix C. Overview of studies main findings.
Experiment Study Design Unconditional
B2C Gift Key Results
STUDY 1: GIFT
REPETITION AND
PAST PURCHASE
FREQUENCY
2 (repetition of unconditional
gift: every-time gift vs. one-
time gift) × 2 (customer past
purchase frequency: eight
times vs. four times) between-
subjects design
Free Shipping
(online, with
purchase)
• Main effect of repetition: when the retailer stops providing a gift that was offered
repeatedly before (vs. offered once before) participants’ negative behavioral
intentions towards the retailer increase.
• Past purchase frequency does not positively moderate the main effect.
• Participants’ feelings of entitlement increase with gift repetition whereas their
gratitude towards the retailer does not.
• The main effect of repetition is mediated by entitlement even after considering
the mediating effect of participants’ negative emotional response and gift
expectation.
STUDY 2: GIFT
REGULARITY AND
GIFT VALUE
2 (regularity: every-time vs.
sometimes) × 2 (gift value:
large vs. small) between-
subjects design
Free Dessert
(offline, with
purchase)
• Main effect of regularity: when the retailer stops providing a gift that was
offered regularly before (vs. offered randomly) participants’ negative behavioral
intentions towards the retailer increase.
• The main effect is moderated by gift size. When the retailer stops gifting,
participants’ entitlement and negative behavioral intentions towards the retailer
increase only in the large-size gift condition.
STUDY 3: GIFT
REGULARITY AND
GRATITUDE
BOOST
2 (gift regularity: regular
pattern vs. random pattern) ×
2 (gratitude boost: present vs.
absent) between-subjects
design.
Free Cookie
(offline, with
purchase)
• Main effect of regularity: when the retailer stops providing a gift that was
offered regularly before (vs. offered randomly) participants’ negative behavioral
intentions towards the retailer increase.
• For participants in the gratitude boost condition, there was no difference in
negative behavioral intentions between the regular and random conditions.
STUDY 4: GIFT
REPETITION AND
SELECTION
CRITERIA
2 (gift repetition: every-time
vs. once) × 2 (gift selection
criterion: selection criterion:
valuable customer vs.
randomly selected customer)
between-subjects design.
Birthday
Coupon (online,
no purchase)
• Main effect of repetition: when the retailer stops providing a gift that was offered
repeatedly before (vs. offered just once) participants’ negative behavioral
intentions towards the retailer increase.
• The main effect is moderated by selection criteria. Participants who are
informed that they are valuable customers display stronger feelings of entitlement
and negative behavioral intention as compared to those who are told that are
randomly selected.
154
Capitolo 3 ESSAY THREE
Can’t Touch Me: The Effect of Loneliness on Preference
for Haptic Consumption Experiences
ABSTRACT
Common wisdom suggests that feeling lonely prompts individuals to seek comfort and
reconnection with others, such as through touching or being touched. In the field of consumer
behavior, new product features and services are being designed to compensate for the lack of
human interaction and haptic sensations in mediated communication and online shopping.
However, the present research shows that chronically lonely individuals shy away from
interpersonal interactions involving touch. Because chronic loneliness creates a negative-
feedback loop that reinforces loneliness, lonely individuals report lower levels of interpersonal
trust and report feeling less comfortable touching and being touched by others. We also provide
evidence that this discomfort spills over to in-store interaction with salespeople and other
customers. Specifically, lonely individuals eschew both accidental and purposeful touch
interactions. Together, these findings provide initial evidence that consumers differ in their
preference for haptic engagement. Recent studies have shown that loneliness is widespread
among millennials and, if most shoppers are characterized by high trait loneliness, marketers’
investments in the field of haptics might be unwarranted.
Keywords: Loneliness, touch, social reconnection, interpersonal trust
155
We are all so much together, but we are all dying of loneliness.
― Albert Schweitzer
INTRODUCTION
We live in an era of “connectedness” and “social networking” in which the average
person spends 135 minutes a day on social media (GlobalWebIndex 2017). Nevertheless, the
modern-day loneliness epidemic and its adverse health and well-being consequences is a topic
increasingly discussed on all major news media outlets (Irving 2018; Klinenberg 2018; Noack
2018). Even though social media outlets aim to connect people, it is possible that instead they are
doing exactly the opposite. From what media report, it seems that the countries for which the
loneliness epidemic is stronger are the ones with the highest social media usage, and the age
group most affected by feelings of loneliness is that of young, tech-savvy individuals. In line
with this observation, an increasing number of studies investigating the adverse consequences of
digital technology and social media usage report that loneliness is highly correlated with time
spent on those platforms (Peper and Harvey 2018; Primack et al. 2017). Given that this
technological and societal trend is unlikely to be reversed, it is important to study loneliness,
how it works, and its downstream consequences for consumption.
Loneliness is an aversive negative emotion, and numerous studies have shown that
consumption of certain goods might help alleviate it (Mourey et al. 2017; Troisi and Gabriel
2011; Zhou et al. 2008). Usually, products and services that provide some sort of social
reconnection are sought (Chen et al. 2017; Lastovicka and Sirianni 2011; Wang et al. 2012).
Another possible avenue to social reconnection, which is the focus of this research, might be
through interpersonal touch. Research shows that interpersonal touch fosters many positive
outcomes, such as increasing positive affect, increasing persuasion and compliance, increasing
156
oxytocin (i.e., “the cuddle hormone”), and acting as a salient reminder of social inclusion
(Gallace and Spence 2010). In the present research, we focus on haptic consumption experiences
as means for consumers to achieve social reconnection. Haptic is defined as something relating
to or based on the sense of touch, and thus we concentrate on all consumption activities that are
conducive to or have a component of interpersonal touch (e.g., getting a clothing item custom-
tailored).
Concurrently with the loneliness epidemic, evidence suggests that people are also facing
a crisis of touch, meaning that modern-day interactions among individuals lack a component of
interpersonal touch (Cocozza 2018). However, human beings have an inherent need for
interpersonal touch and social connectedness that begins at infancy (Gallace and Spence 2010).
Therefore, to make up for this frustrated human need for touch and connectedness, consumer
products and services that offer haptic experiences are increasingly being offered in the
marketplace. A product example is Quoobo,13 is a therapeutic robot shaped as a cushion with a
wagging tail, like that of a cat, which supposedly serves to heal by relieving stress. A service
example is Cuddlist.com14, a website where people can book a therapeutic cuddle session with a
professional cuddler.
New product features and services are also being designed to compensate for the lack of
human interaction and haptic sensations in mediated communication forms (i.e., hapticons;
Haans and IJsselsteijn 2006). For example, the HugShirt15 is a wearable device that looks like a
regular T-shirt but allows consumers to send each other hugs the same way they send each other
text messages. Consumer research on touch so far has investigated individual differences in the
13 http://qoobo.info/?lang=en 14 https://cuddlist.com/ 15 http://cutecircuit.com/the-hug-shirt/
157
propensity to touch, situational difference encouraging touch, product attributes encouraging
touch, and the influence of touch on consumer decision-making (Jansson-Boyd 2011; Peck and
Childers 2008). However, to our knowledge, no research has investigated the interplay between
haptic consumption experiences and loneliness. We believe that addressing this gap is
increasingly important for todays’ society in which people are facing crises of both loneliness
and touch, which are driving marketing investments in developing therapeutic products and
services.
Common wisdom would suggest that such marketing investments are warranted and that
a lonely consumer would be more likely to seek or a have a more favorable view of consumption
experiences with a haptic component. However, counterintuitively, in our research we observe
just the opposite. Across a series of studies, we show that chronic loneliness is negatively
correlated with comfort with interpersonal touch. We show that this relation is mediated by
interpersonal trust: chronic loneliness is associated with less interpersonal trust, which in turn is
associated with less comfort with interpersonal touch. Finally, we show that this discomfort with
interpersonal touch spills over to in-store interactions with salespeople and other customers, such
that chronically lonely consumers avoid rather than seek out situations that involve interpersonal
touch.
THEORETICAL BACKGROUND
Loneliness is defined as an aversive and distressing subjective experience stemming from
the perception that one’s social relationships are deficient (Perlman and Peplau 1981). The
experience of feeling lonely is so aversive and distressing that researchers have linked it to a
variety of negative consequences, such as decreased life satisfaction, eating disorders, alcohol
abuse, poor sleep quality, and cardiovascular diseases, just to name a few (Cacioppo et al. 2000;
158
Cacioppo and Patrick 2008; Hawkley and Cacioppo 2010). Heinrich and Gullone (2006) argue
that loneliness is difficult to observe directly because it is a subjective experience, but they offer
a description of affective, cognitive, and behavioral traits that together constitute a lonely
prototype. Affective features include feelings of despair, depression, impatient boredom, and
self-deprecation; cognitive traits include low self-esteem, misanthropy, and social alienation;
behavioral aspects consist of inhibited sociability and ineffectiveness. Lonely individuals not
only hold negative views about themselves, but they also see others less favorably. Loneliness
leads to feeling unsafe and elicits hypervigilance for social threats in the environment, which
produces negative cognitive biases in interpreting interpersonal encounters. Compared to non-
lonely individuals, lonely individuals have negative social expectations from others, which then
result in self-fulfilling prophecies (e.g., expecting more negative social interactions,
remembering more negative social information), which in turn reinforces their feelings of
loneliness. Hawkley and Cacioppo (2010) refer to this process as a “self-reinforcing loneliness
loop.”
Apart from aversiveness and distress, researchers emphasize another important
component of the definition of loneliness, namely its subjective nature, which differentiates it
from mere social isolation. In fact, individuals constantly assess the discrepancy between the
quality and quantity of the social relationships they desire and of the social relationship they
currently have regardless of whether they are objectively lonely (West et al. 1986). Therefore,
loneliness can be elicited, but is not necessarily a synonym, of social isolation or exclusion. For
this reason, loneliness researchers emphasize another important distinction, that between
transient, situational, and chronic loneliness (Gerson and Perlman 1979; Young 1982). Transient
loneliness refers to feelings that individuals might experience from time to time in their everyday
159
lives, whereas situational loneliness is usually associated with comparatively longer periods of
social isolation, such as when individuals move to another city, leaving their social connections
behind (Shaver et al. 1985). A third, more impactful type of loneliness is chronic loneliness,
which refers to an experience of social disconnection that lasts for years. This distinction
between momentary and chronic feelings of loneliness is important because the negative
consequences of loneliness are correlated with its duration. In other words, chronically lonely
individuals are more likely to display the dysfunctional cognitions, emotions, and behaviors
associated with loneliness than situationally lonely individuals will (Heinrich and Gullone 2006).
The social reconnection hypothesis
Social connections are so essential for human health and well-being that people should be
highly motivated to restore them when lost (Baumeister and Leary 1995). Accordingly, the social
pain we feel when experiencing loneliness should motivate people to seek meaningful social
connections (Cacioppo and Patrick 2008). The social exclusion literature provides a rich store of
examples that supports this motivational impulse to pursue human reconnection. According to a
review by Molden and Maner (2013), there are three main ways in which people attempt to
restore feelings of social connectedness: 1) ingratiating social behaviors (e.g., conformity, Mead
et al. 2011); 2) sensitivity to social cues (e.g., attention to smiling faces; DeWall et al. 2009), and
3) expanded perceptions of social connection (e.g., parasocial relationships with fictional
characters; Derrick et al. 2009). Nonetheless, there are several empirical findings that contradict
this “social reconnection hypothesis,” and indicate that loneliness is likely to produce
qualitatively opposite responses such as social reconnection avoidance and even aggressiveness
(Maner et al. 2007; Park and Maner 2009; Twenge et al. 2001).
These mixed findings linking social exclusion with desire and avoidance for social
160
reconnection prompted a stream of research investigating the specific instances in which
exclusion and loneliness prompt or hinder the motivation for social reconnection (Molden and
Maner 2013). A careful review of the findings reveals that powerful negative emotions stemming
from the experience of exclusion, such as loneliness and anxiety, are responsible for the missing
reconnection attempts, as they increase 1) prevention-focused concerns of safety and security
(Lucas et al. 2010); 2) doubts about the ability of connecting with certain individuals (e.g.,
exclusion perpetrator; Maner et al. 2007); and 3) fears about being negatively evaluated by
others (e.g., social anxiety; Mallott et al. 2009). Social exclusion research and loneliness are
deeply intertwined, as feelings of loneliness often stems as results of rejection. However, it is
important to note that loneliness is a subjective experience, and it becomes a trap only once it is
hardwired in people’s brains. Thus, all the negative emotions, cognitions, and behaviors that
prevent individuals from seeking social reconnection become an issue of serious concern only
when loneliness becomes chronic and creates a self-reinforcing loop (Cacioppo and Patrick
2008; Hawkley and Cacioppo 2010). Based on the arguments outlined above, in the present
research we posit that chronically lonely and situationally lonely individuals will differ in the
likelihood that they will seek social reconnection. Specifically, situationally lonely individuals
will seek interpersonal reconnection, whereas chronically lonely individuals, who are trapped in
their hypersensitivity to negative social cues, will not.
The power of touch
The most basic way in which humans connect and communicate is through touch. In fact,
the first and most fundamental type of interpersonal connection humans experience in life is the
one of the mother’s touch (Harlow 1958). Later in life, touch enhances all other types of visual
and verbal communication. Research shows that up to eight fundamental human emotions can be
161
effectively communicated to others just by touching them on the arm (Hertenstein et al. 2006,
2009). Touch thus provides a strong channel of interpersonal communication and connection
(i.e., social touch; Gallace and Spence 2010). Moreover, touch has been shown to have a wide
variety of positive and even healing properties. In psychotherapy, researchers advocate for the
use of interpersonal touch for therapeutic purposes (Young 2007). Interpersonal touch can reduce
pain, anxiety, depression, and aggressive behavior, as well as promote immune function, lower
heart rate, and decrease blood pressure (Field 2003).
Linking the physiological and social world, research in social neuroscience reveals that
there is a powerful link between the oxytocin hormone, typically produced in interpersonal touch
interactions, and the formation of social bonds. Oxytocin increases the salience of social
approach-related cues and decreases the salience of threat-related ones (Norman et al. 2012).
Following this line of reasoning, we posit that interpersonal touch helps foster interpersonal
connections and can be regarded as an opportunity for lonely individuals to regain the social
connectedness they pursue. Theoretically, lonely individuals should welcome interpersonal touch
interactions and consumptions experiences with a haptic component because they should help
them restore feelings of social connectedness. However, given the negative consequences of the
loneliness self-reinforcing loop that plague chronically lonely individuals, we posit that haptic-
related consumer experiences as form of social reconnection will only be pursued by
situationally lonely individuals. Formally,
H1. Chronically lonely individuals will eschew haptic-related consumer experiences.
H2. Situationally lonely individuals will seek haptic-related consumer experiences.
162
In the consumer behavior domain, interpersonal touch has been shown to increase
compliance with various typologies of requests such as ones for charitable donations,
participation in surveys, and taste of in-store samples (Peck 2010; Peck and Wiggins 2006).
Given the power of touch in eliciting compliance and favorable attitudes towards a target person,
touch has been widely studied in the context of salespeople-customer interactions (Hornik 1992).
For example, research has shown that waitresses get better tips if they briefly touch customers’
hands, referred to as the “Midas effect;” (Crusco and Wetzel 1984), and that customers are more
likely to follow food suggestions when they are touched by the server (Guéguen et al. 2007).
Overall, haptic-related consumption experiences (consumption experiences that include a touch
component, such as getting a haircut) or in-store interactions with salespeople (e.g., gentle stroke
on the customer’s arm), have been shown to increase compliance, produce positive affect and
attitudes towards the target person or salesperson, and increase willingness to purchase products.
However, other research suggests that not all people have the same preferences when it
comes to product touch or interpersonal touch. Regarding product touch, Peck and Childers
(2003) posited that consumers differ in their need to touch products, and developed a need for
touch scale (NFT) to assess consumers’ preferences for haptic engagement with products.
Specifically, some consumers might need to touch products because it is a pleasurable and fun
experience (i.e., autotelic need for touch), and some consumers might need to touch products to
ascertain information about quality (i.e., instrumental need for touch). Regarding interpersonal
touch, Webb and Peck (2015) established that individuals also differ in their comfort with
interpersonal touch (CIT), a developed a scale to measure comfort with receiving and initiating
interpersonal haptic interactions. Therefore, even though haptic interactions in consumption
contexts have been shown to have positive effects for consumers and marketers, not all
163
consumers will necessarily equally welcome or enjoy such haptic interactions. For example,
chronically lonely consumers typically feel unsafe when it comes to social interactions and,
given their hypervigilance for potential social threats and their heightened social anxiety, will
likely feel uncomfortable with interpersonal touch.
One of the many explanations that researchers put forward to explain why interpersonal
touch elicits heightened compliance with the requests of strangers is that touch implies that the
individuals involved trust each other (Rose 1990). In fact, by its very definition, interpersonal
trust is defined as the perception that others have no intention to harm you and they have your
best interest at heart (Rotter 1971). However, as we argued before, chronically lonely individuals
display social negative cognitions and are unlikely to trust others because loneliness causes them
to use defensive perceptions in situations that are actually neutral or benign. Therefore, we posit
that chronically lonely individuals, but not momentarily lonely ones, will refrain from engaging
in haptic-related consumer experiences because they lack generalized trust in others, which in
turn makes them less comfortable with receiving and initiating interpersonal touch. Formally,
H3. Chronically lonely individuals’ lower willingness to engage in haptic-related consumer
experiences is mediated by lower interpersonal trust and by comfort with interpersonal touch
(serially, in that order).
A depiction of our conceptual model is presented in Figure 1.
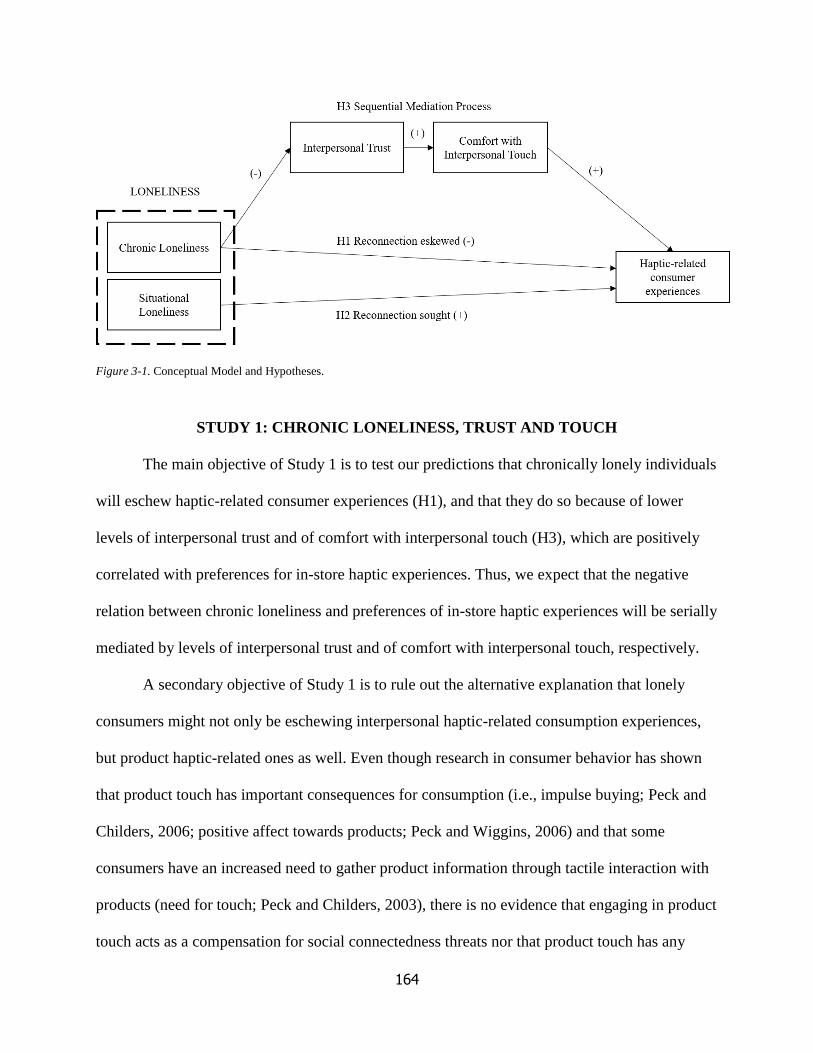
164
Figure 3-1. Conceptual Model and Hypotheses.
STUDY 1: CHRONIC LONELINESS, TRUST AND TOUCH
The main objective of Study 1 is to test our predictions that chronically lonely individuals
will eschew haptic-related consumer experiences (H1), and that they do so because of lower
levels of interpersonal trust and of comfort with interpersonal touch (H3), which are positively
correlated with preferences for in-store haptic experiences. Thus, we expect that the negative
relation between chronic loneliness and preferences of in-store haptic experiences will be serially
mediated by levels of interpersonal trust and of comfort with interpersonal touch, respectively.
A secondary objective of Study 1 is to rule out the alternative explanation that lonely
consumers might not only be eschewing interpersonal haptic-related consumption experiences,
but product haptic-related ones as well. Even though research in consumer behavior has shown
that product touch has important consequences for consumption (i.e., impulse buying; Peck and
Childers, 2006; positive affect towards products; Peck and Wiggins, 2006) and that some
consumers have an increased need to gather product information through tactile interaction with
products (need for touch; Peck and Childers, 2003), there is no evidence that engaging in product
touch acts as a compensation for social connectedness threats nor that product touch has any
165
relationship with interpersonal trust. Thus, we expect that the negative relationship between
chronic loneliness and preference for haptic-related consumption experiences will only hold for
interpersonal touch experiences and not for product touch ones. In fact, according to our
theorizing, the negative relationship is mediated by interpersonal trust (H3) and, consequently,
touching inanimate objects will not be problematic as it is not seen as a social reconnection
opportunity nor it involves trusting someone.
According to the self-reinforcing loneliness loop, chronic lonely individuals tend to have
negative social expectations from interactions with others, and these expectations tend to be
accompanied by generalized feelings of stress and anxiety (Hawkley and Cacioppo 2010).
Therefore, it could be argued that there might be other anxiety-related processes, beyond our
hypothesized lack of interpersonal trust (H3), explaining the link between chronic loneliness and
diminished likelihood to engage in touch. In particular, anxiety related to touching objects might
be explained by individuals’ obsessive-compulsive fear of becoming contaminated (Deacon and
Olatunji 2007) and anxiety related to touching others might be explained by individuals’ low
propensity for social risk taking (Blais and Weber 2006). Accordingly, for exploratory purposes
we add these two ancillary measures in this study: contamination cognitions and social risk
taking.
Method
Participants and procedure. One hundred and ninety-nine participants (57% men;
Mage = 31.93 yrs., SD = 11.61) were recruited from the United Kingdom through Prolific
Academic in exchange for a small monetary compensation. First, as part of a “consumer
personality study,” all participants completed scales related to interpersonal and product touch, a
measure of interpersonal trust, a measure of their contamination cognitions, and a measure of
166
social risk taking, in that order. Next, participants completed an ostensibly unrelated “shopping
experience study” that measured their attitudes toward aspects of their in-store shopping
experiences, and then, as part of a separate “scale development study,” completed a scale that
measured chronic loneliness. Finally, participants were asked to provide basic demographic
information and thanked for their collaboration.
Measures. We measured chronic loneliness with the UCLA chronic loneliness scale
(Russell 1996). We measured comfort with interpersonal touch with the comfort with
interpersonal touch scale (Webb and Peck 2015) and we measured the specific need for product
touch with the need for touch scale (Peck and Childers 2003). To measure participants’ level of
interpersonal trust, we used the generalized trust scale (Yamagishi and Yamagishi 1994). For
complete scale measures, see Appendix A.
To measure attitudes towards haptic-related consumer experiences, we used four items,
two of which measured haptic interpersonal interactions (“I like when a store is designed to
encourage sales personnel to approach customers,” “I like when a store is designed to encourage
customers to interact with each other,”) and two of which measured haptic product interactions
(“I like when a store is designed to encourage customers to touch products,” “I like when a store
is designed to neatly display products in Plexiglas cases,” along a 7-point scale (1 = “strongly
disagree; 7 = “strongly agree”).
To measure fear of contamination and contagion, we used selected items16 of the
contamination cognitions scale (Deacon and Olatunji 2007) and to measure domain-specific risk-
taking, we used the social domain subscale of the domain-specific risk-taking scale (Blais and
Weber 2006). See Appendix B for all items.
16 We used items 1,4,5,8,11, and 13 of the full scale to shorten the overall survey.
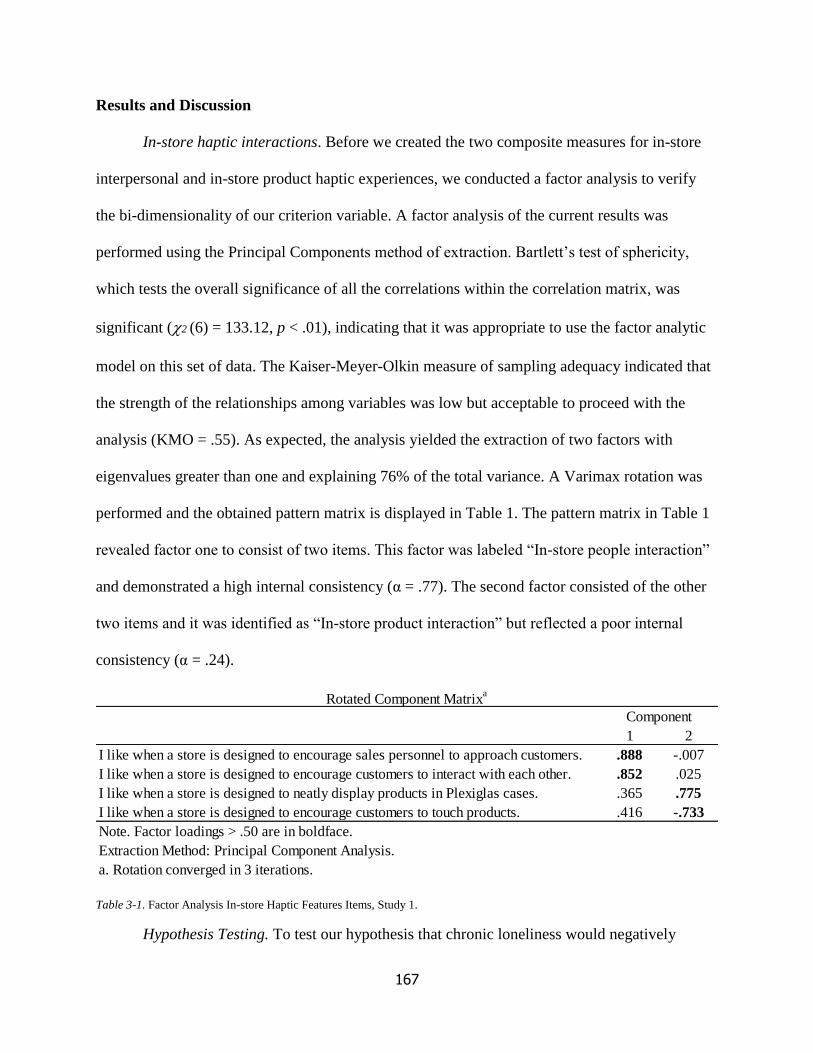
167
Results and Discussion
In-store haptic interactions. Before we created the two composite measures for in-store
interpersonal and in-store product haptic experiences, we conducted a factor analysis to verify
the bi-dimensionality of our criterion variable. A factor analysis of the current results was
performed using the Principal Components method of extraction. Bartlett’s test of sphericity,
which tests the overall significance of all the correlations within the correlation matrix, was
significant (2 (6) = 133.12, p < .01), indicating that it was appropriate to use the factor analytic
model on this set of data. The Kaiser-Meyer-Olkin measure of sampling adequacy indicated that
the strength of the relationships among variables was low but acceptable to proceed with the
analysis (KMO = .55). As expected, the analysis yielded the extraction of two factors with
eigenvalues greater than one and explaining 76% of the total variance. A Varimax rotation was
performed and the obtained pattern matrix is displayed in Table 1. The pattern matrix in Table 1
revealed factor one to consist of two items. This factor was labeled “In-store people interaction”
and demonstrated a high internal consistency (α = .77). The second factor consisted of the other
two items and it was identified as “In-store product interaction” but reflected a poor internal
consistency (α = .24).
Table 3-1. Factor Analysis In-store Haptic Features Items, Study 1.
Hypothesis Testing. To test our hypothesis that chronic loneliness would negatively
1 2
I like when a store is designed to encourage sales personnel to approach customers. .888 -.007
I like when a store is designed to encourage customers to interact with each other. .852 .025
I like when a store is designed to neatly display products in Plexiglas cases. .365 .775
I like when a store is designed to encourage customers to touch products. .416 -.733
Note. Factor loadings > .50 are in boldface.
Rotated Component Matrixa
Component
Extraction Method: Principal Component Analysis.
a. Rotation converged in 3 iterations.
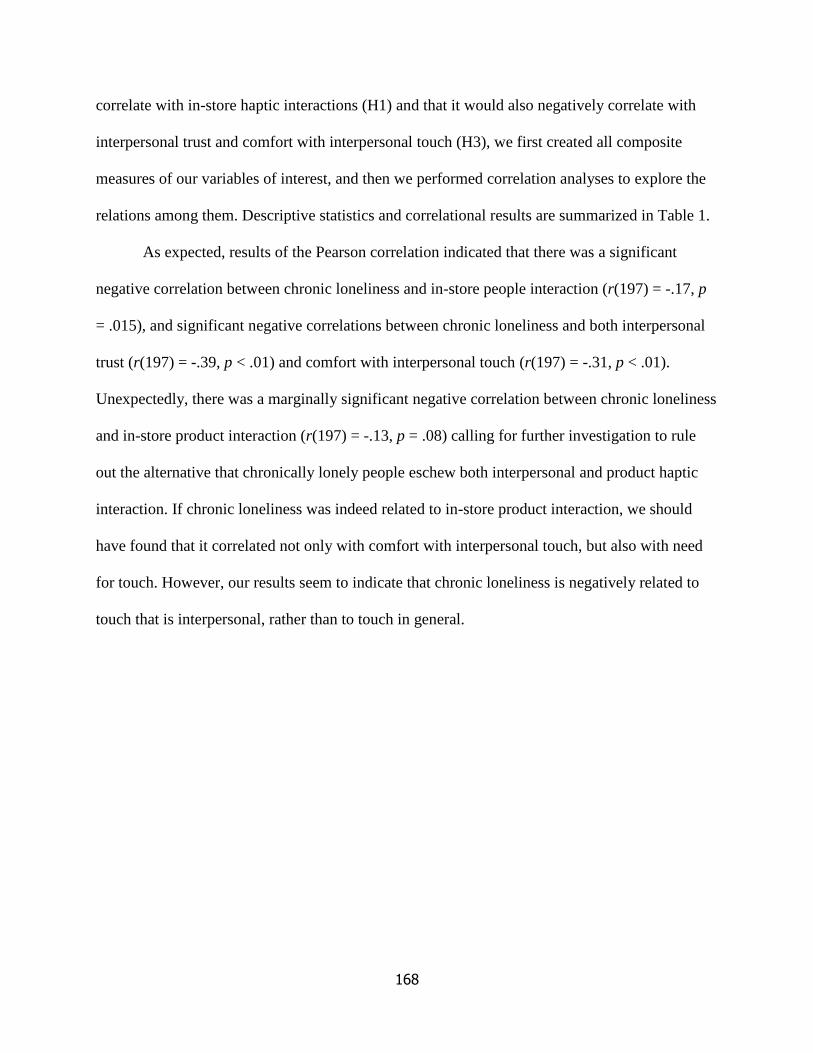
168
correlate with in-store haptic interactions (H1) and that it would also negatively correlate with
interpersonal trust and comfort with interpersonal touch (H3), we first created all composite
measures of our variables of interest, and then we performed correlation analyses to explore the
relations among them. Descriptive statistics and correlational results are summarized in Table 1.
As expected, results of the Pearson correlation indicated that there was a significant
negative correlation between chronic loneliness and in-store people interaction (r(197) = -.17, p
= .015), and significant negative correlations between chronic loneliness and both interpersonal
trust (r(197) = -.39, p < .01) and comfort with interpersonal touch (r(197) = -.31, p < .01).
Unexpectedly, there was a marginally significant negative correlation between chronic loneliness
and in-store product interaction (r(197) = -.13, p = .08) calling for further investigation to rule
out the alternative that chronically lonely people eschew both interpersonal and product haptic
interaction. If chronic loneliness was indeed related to in-store product interaction, we should
have found that it correlated not only with comfort with interpersonal touch, but also with need
for touch. However, our results seem to indicate that chronic loneliness is negatively related to
touch that is interpersonal, rather than to touch in general.
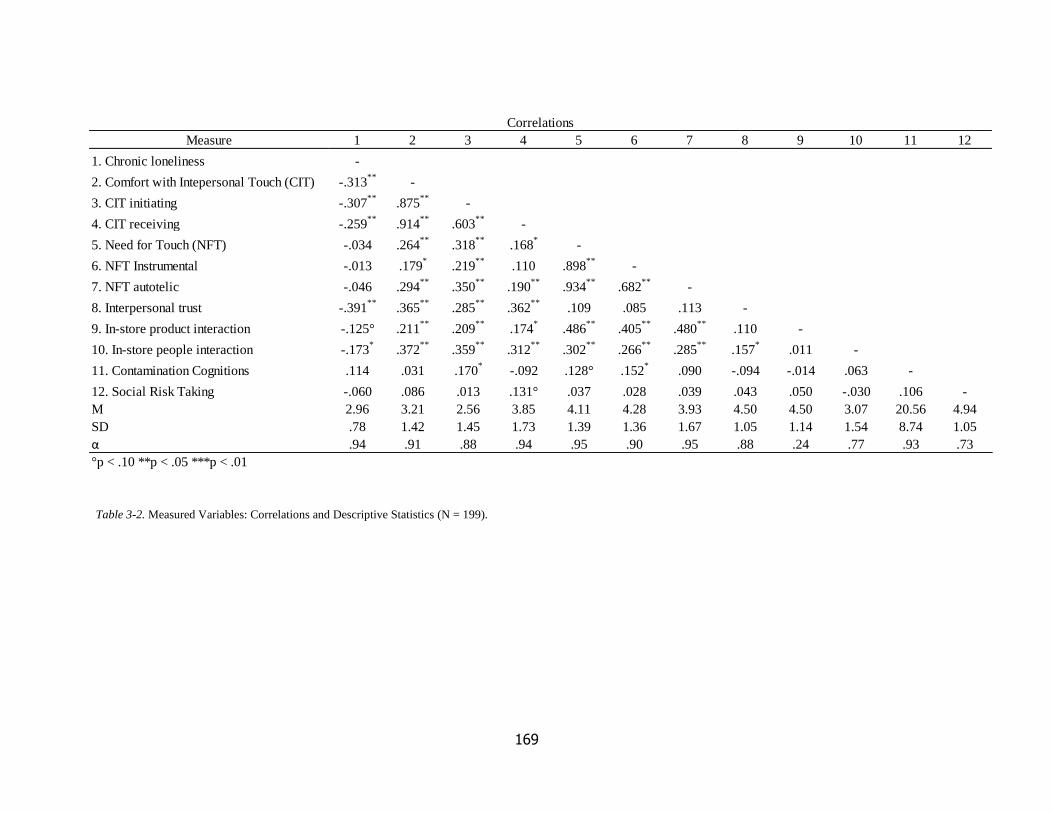
169
Table 3-2. Measured Variables: Correlations and Descriptive Statistics (N = 199).
Measure 1 2 3 4 5 6 7 8 9 10 11 12
1. Chronic loneliness -
2. Comfort with Intepersonal Touch (CIT) -.313**
-
3. CIT initiating -.307**
.875**
-
4. CIT receiving -.259**
.914**
.603**
-
5. Need for Touch (NFT) -.034 .264**
.318**
.168*
-
6. NFT Instrumental -.013 .179*
.219**
.110 .898**
-
7. NFT autotelic -.046 .294**
.350**
.190**
.934**
.682**
-
8. Interpersonal trust -.391**
.365**
.285**
.362**
.109 .085 .113 -
9. In-store product interaction -.125° .211**
.209**
.174*
.486**
.405**
.480**
.110 -
10. In-store people interaction -.173*
.372**
.359**
.312**
.302**
.266**
.285**
.157*
.011 -
11. Contamination Cognitions .114 .031 .170*
-.092 .128° .152*
.090 -.094 -.014 .063 -
12. Social Risk Taking -.060 .086 .013 .131° .037 .028 .039 .043 .050 -.030 .106 -
M 2.96 3.21 2.56 3.85 4.11 4.28 3.93 4.50 4.50 3.07 20.56 4.94
SD .78 1.42 1.45 1.73 1.39 1.36 1.67 1.05 1.14 1.54 8.74 1.05
α .94 .91 .88 .94 .95 .90 .95 .88 .24 .77 .93 .73
°p < .10 **p < .05 ***p < .01
Correlations
170
Based on our third hypothesis, we also predicted that interpersonal trust and comfort
with interpersonal touch would serially mediate the relation between chronic loneliness and
interpersonal in-store haptic preferences. We tested for the hypothesized serial mediation using
PROCESS Model 6 (Hayes 2013), with the expectation that chronic loneliness will affect
interpersonal trust, which in turn will affect comfort with interpersonal touch, which in turn will
affect in-store interpersonal haptic-related preferences. Also, we expected that the negative
relationship between chronic loneliness and in-store haptic-related preferences would not apply
to product haptic-related preferences.
When we tested the model with in-store people interaction as criterion variable, as
expected, the indirect effect of chronic loneliness on in-store haptic interactions through
interpersonal trust and comfort with interpersonal touch (serially, in that order) was significant
(β = -.08, SE = .03, 95% CI [-.16 -.03], based on 5,000 bootstrap samples). Moreover, the total
effect of chronic loneliness on in-store people interaction was significant (β = -.34, t(197) = -
2.46, p = .01) whereas the direct effect was not (β = -.12, t(197) = -.83, p = .41). These results are
consistent with our expectation that chronically lonely participants display negative attitudes
towards people interactions more than non-lonely participants do (H1). Additionally, results
show that interpersonal trust and comfort with interpersonal touch serially mediate the relation
between chronic loneliness and reduced preference for interpersonal haptic-related consumer
experiences (H3, Figure 2).
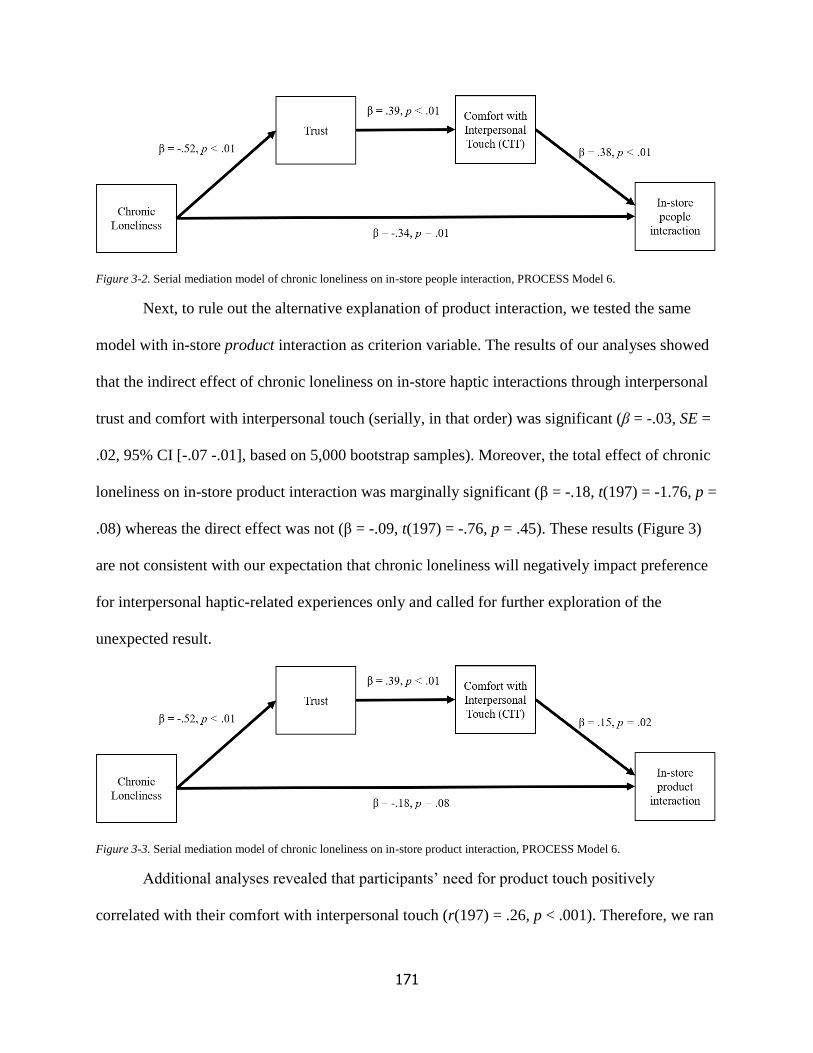
171
Figure 3-2. Serial mediation model of chronic loneliness on in-store people interaction, PROCESS Model 6.
Next, to rule out the alternative explanation of product interaction, we tested the same
model with in-store product interaction as criterion variable. The results of our analyses showed
that the indirect effect of chronic loneliness on in-store haptic interactions through interpersonal
trust and comfort with interpersonal touch (serially, in that order) was significant (β = -.03, SE =
.02, 95% CI [-.07 -.01], based on 5,000 bootstrap samples). Moreover, the total effect of chronic
loneliness on in-store product interaction was marginally significant (β = -.18, t(197) = -1.76, p =
.08) whereas the direct effect was not (β = -.09, t(197) = -.76, p = .45). These results (Figure 3)
are not consistent with our expectation that chronic loneliness will negatively impact preference
for interpersonal haptic-related experiences only and called for further exploration of the
unexpected result.
Figure 3-3. Serial mediation model of chronic loneliness on in-store product interaction, PROCESS Model 6.
Additional analyses revealed that participants’ need for product touch positively
correlated with their comfort with interpersonal touch (r(197) = .26, p < .001). Therefore, we ran
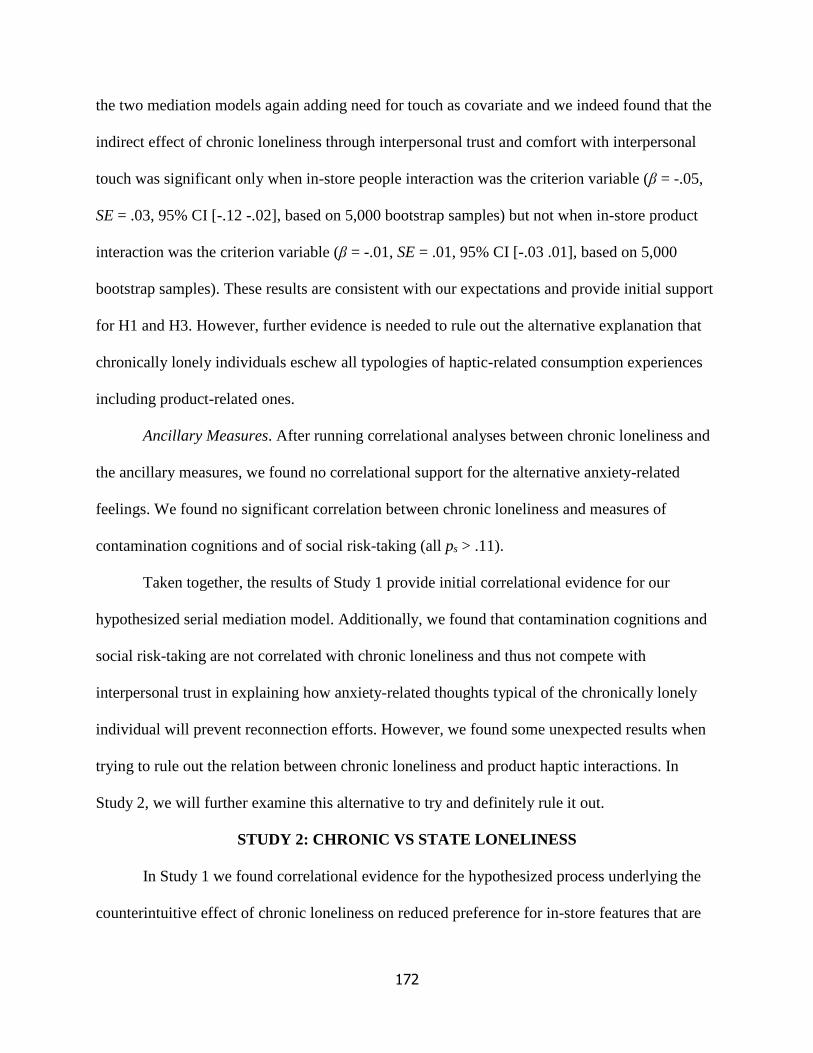
172
the two mediation models again adding need for touch as covariate and we indeed found that the
indirect effect of chronic loneliness through interpersonal trust and comfort with interpersonal
touch was significant only when in-store people interaction was the criterion variable (β = -.05,
SE = .03, 95% CI [-.12 -.02], based on 5,000 bootstrap samples) but not when in-store product
interaction was the criterion variable (β = -.01, SE = .01, 95% CI [-.03 .01], based on 5,000
bootstrap samples). These results are consistent with our expectations and provide initial support
for H1 and H3. However, further evidence is needed to rule out the alternative explanation that
chronically lonely individuals eschew all typologies of haptic-related consumption experiences
including product-related ones.
Ancillary Measures. After running correlational analyses between chronic loneliness and
the ancillary measures, we found no correlational support for the alternative anxiety-related
feelings. We found no significant correlation between chronic loneliness and measures of
contamination cognitions and of social risk-taking (all ps > .11).
Taken together, the results of Study 1 provide initial correlational evidence for our
hypothesized serial mediation model. Additionally, we found that contamination cognitions and
social risk-taking are not correlated with chronic loneliness and thus not compete with
interpersonal trust in explaining how anxiety-related thoughts typical of the chronically lonely
individual will prevent reconnection efforts. However, we found some unexpected results when
trying to rule out the relation between chronic loneliness and product haptic interactions. In
Study 2, we will further examine this alternative to try and definitely rule it out.
STUDY 2: CHRONIC VS STATE LONELINESS
In Study 1 we found correlational evidence for the hypothesized process underlying the
counterintuitive effect of chronic loneliness on reduced preference for in-store features that are
173
conducive of haptic interactions. We designed Study 2 to explore our hypothesized difference in
preference for social reconnection options between participants who are chronically lonely and
participants whose loneliness is situationally induced. We predict that chronically lonely
individuals will eschew social reconnection options, whereas situationally lonely individuals will
actively seek haptic social reconnection options (H2).
Again, as haptic social reconnection options, we measured preference for in-store features
that are conducive of both interpersonal and product haptic interactions as we did in Study 1. We
aim to find additional support to rule out the alternative that chronically lonely individuals will
eschew all touch-related interactions including product-related haptic consumption experiences
that, unlikely interpersonal-related one, do not provide social reconnection opportunities. To do
so, we added new items to the scale used in the previous study in an attempt to measure
interpersonal and touch interactions more reliably and effectively.
Moreover, we measured preference for online versus offline shopping, and preference for
a haptic-related product name to examine whether our hypothesized relation applied to other
haptic versus non-haptic consumption options. If that were the case, we would expect chronic
lonely individuals to prefer online shopping more than offline shopping whereas situationally
lonely individuals to prefer offline shopping more than online shopping. Also, we would expect
situationally lonely individuals to prefer the haptic-related product name more and chronically
lonely individuals to prefer it less.
Finally, for exploratory purposes, in this study we measured an alternative social
reconnection option to determine if the effect is specific to haptic reconnection options or if it
extends to other options that have been previously tested in the literature, such as preference for
anthropomorphic products (Chen et al. 2017; Mourey et al. 2017).
174
Method
Participants and procedure. Two hundred and one participants (57% men; Mage = 30.40
yrs., SD = 7.38) were recruited from the United Kingdom through Prolific Academic in exchange
for a small monetary compensation. They were randomly assigned to a one-factor (state
loneliness: control, high) between-subjects design. Participants first completed a recall task
designed to manipulate their state feelings of loneliness. Participants were then given instructions
for an ostensibly unrelated study about consumers’ personal experiences and emotions in various
contexts. After completing the recall task, participants were asked to complete a study on their
current feelings to indicate how they felt at the very moment. After completing the study on
current feelings, participants completed three consumer preference studies in a counterbalanced
order, namely a “shopping experience study,” “online/offline shopping preferences study,” and
“chocolate company pilot study.” The first consumer study measured participants’ attitudes
regarding several aspects of their shopping experiences in-store. The second consumer study
measured participants’ preference for online/offline shopping experiences. Finally, the third
consumer study asked participants to help a chocolate company choose 1) which of two
prototypes to launch in the market, and 2) which name to give to a new chocolate praline. After
completing the three consumer preferences studies, as part of a “consumer personality study,” all
participants completed scales related to interpersonal and product touch, and interpersonal trust.
Participants also completed a measure of chronic loneliness as part of a “scale development
study.” Finally, they were asked to provide basic demographic information, debriefed, and
thanked for their collaboration.
Loneliness manipulation. Participants assigned to the loneliness condition received the
following instructions:
175
For this task, we are interested in how people describe the
experience of feeling lonely. Think of a time when you felt lonely
and spend a few minutes writing about the experience. Don’t
worry about spelling or grammar; just write down as much detail
about the experience as possible.
Participants in the control condition, in contrast, were given the following instructions:
For this task, we are interested in how you would describe walking
around the grocery store. That is, think of what it is like to walk
around the grocery store and spend a few minutes writing about
the experience. Don’t worry about spelling or grammar; just write
down as much detail about the experience as possible.
After receiving the instructions, they were asked to write about the randomly assigned
experience for two minutes. Manipulation details can be found in Appendix C.
Manipulation check. As part of a study on their current feelings, participants responsed to
five items measuring their feelings of being tired, powerful, lonely, angry, and happy at that very
moment (1 = not at all; 7 = very much). The target manipulation check item was “At this
moment, I feel lonely.”
In-store haptic interaction. Similar to the previous study, to measure attitudes towards in-
store features fostering haptic interaction, participants were asked to rate the extent of their
agreement with 10 statements including the four items from the previous study. Items included “I
like to browse touch screen devices to obtain additional product information” and “I like to chat
with sales personnel to obtain additional product information” For a full list of statements, please
refer to Appendix A.
176
Preference for online vs. offline shopping. In this study, we aimed at exploring whether
chronic or state loneliness had an impact on the preference for technology-mediated haptic-less
shopping experiences online. In particular, we asked participants to indicate, all other things
being equal (price, assortment, availability…), their preference when they have to purchase
something for online/offline shopping on two semantic differential scales anchored at 1 = browse
a website; buy online, and 9 = go to a store; buy offline. In addition, they indicated their
preference for online versus offline shopping on a list of attributes (see Appendix A).
Preference for haptic-related product name. As part of a consumer product preference
study, participants were told that a chocolate brand needed to decide a new name for a praline
described as “A chewy-soft center of premium caramel enrobed in milk chocolate.” Participants
were asked to choose between a haptic-related name “Milk Caramel Embrace” or a non-haptic-
related one “Milk Caramel Vortex.”
Preference for anthropomorphic product. As part of a consumer product preference
study, participants were told that a chocolate brand wanted to launch a high-end chocolate
sculpture product selection for its customers. Participants were shown two prototypes the maître
chocolatiers developed. One prototype is a human-like sculpture (i.e., anthropomorphic product)
and the other prototype is an abstract sculpture (i.e., non-anthropomorphic product). Participants
were asked to express their preferences for the prototypes on four items (choice, appeal,
willingness to pay, attractiveness) on a 9-point scale anchored at “1 definitely prototype A” and
“9 definitely prototype B.” The order of the two prototypes was counterbalanced between-
subject. The stimuli used can be found in Appendix B.
Trait measures. As in the previous study, participants completed the UCLA chronic
loneliness scale (Russell 1996), the need for touch scale (NFT; Peck and Childers 2003), the
177
comfort with interpersonal touch scale (CIT; Webb and Peck 2015), and the generalized trust
scale (Yamagishi and Yamagishi 1994).
Results and discussion
Data exclusion. The open-ended responses to the loneliness manipulation were content-
analyzed to assess whether participants followed instructions in recalling a neutral experience or
an experience of loneliness. Two independent judges blind to the research hypotheses analyzed
the text and decided whether it narrated about a loneliness experience or not. Based on the joint
judges’ decision, twenty-nine participants (14%) failed to follow instructions and were removed
from the sample, leaving 172 respondents for the analyses (56% men; Mage = 30.21 yrs.,
SD = 7.43).
Manipulation check. The one-way ANOVA on the participants’ feelings of loneliness
showed that the manipulation did not have a significant effect (F(1, 170) = 2.72, p = .10).
Compared to participants in the control condition (M = 2.78, SD = 1.64), participants in the
loneliness condition (M = 3.20, SD = 1.67) did not feel lonelier. These results suggest that the
manipulation of loneliness was unsuccessful.
Although the failed manipulation of loneliness potentially contaminates the data, we
nevertheless tested our correlational hypotheses by ignoring the loneliness manipulation. We did
this merely for exploratory purposes to determine if our correlational hypotheses, tested in Study
1, would replicate.
In-store haptic interaction. Before we created the two composite measures for in-store
interpersonal and in-store product haptic experiences, we conducted a factor analysis to verify
the bi-dimensionality of our criterion variable. A factor analysis of the current results was
performed using the Principal Components method of extraction. Bartlett’s test of sphericity,
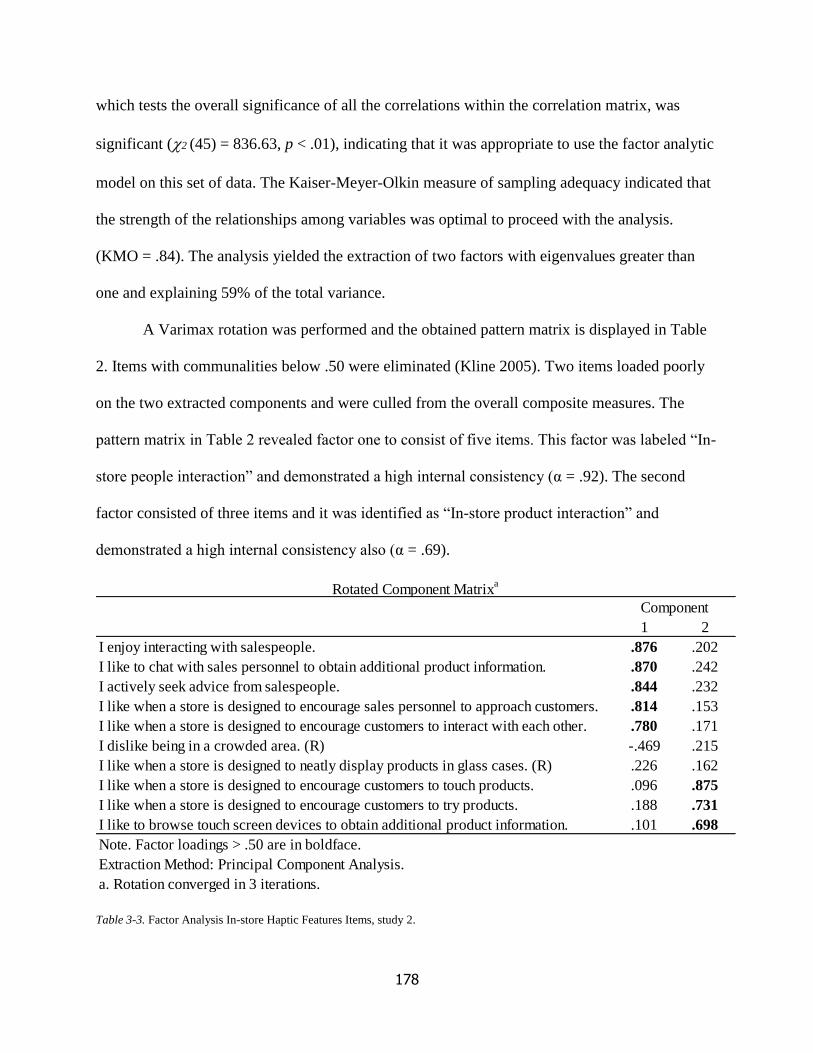
178
which tests the overall significance of all the correlations within the correlation matrix, was
significant (2 (45) = 836.63, p < .01), indicating that it was appropriate to use the factor analytic
model on this set of data. The Kaiser-Meyer-Olkin measure of sampling adequacy indicated that
the strength of the relationships among variables was optimal to proceed with the analysis.
(KMO = .84). The analysis yielded the extraction of two factors with eigenvalues greater than
one and explaining 59% of the total variance.
A Varimax rotation was performed and the obtained pattern matrix is displayed in Table
2. Items with communalities below .50 were eliminated (Kline 2005). Two items loaded poorly
on the two extracted components and were culled from the overall composite measures. The
pattern matrix in Table 2 revealed factor one to consist of five items. This factor was labeled “In-
store people interaction” and demonstrated a high internal consistency (α = .92). The second
factor consisted of three items and it was identified as “In-store product interaction” and
demonstrated a high internal consistency also (α = .69).
Table 3-3. Factor Analysis In-store Haptic Features Items, study 2.
1 2
I enjoy interacting with salespeople. .876 .202
I like to chat with sales personnel to obtain additional product information. .870 .242
I actively seek advice from salespeople. .844 .232
I like when a store is designed to encourage sales personnel to approach customers. .814 .153
I like when a store is designed to encourage customers to interact with each other. .780 .171
I dislike being in a crowded area. (R) -.469 .215
I like when a store is designed to neatly display products in glass cases. (R) .226 .162
I like when a store is designed to encourage customers to touch products. .096 .875
I like when a store is designed to encourage customers to try products. .188 .731
I like to browse touch screen devices to obtain additional product information. .101 .698
a. Rotation converged in 3 iterations.
Component
Extraction Method: Principal Component Analysis.
Note. Factor loadings > .50 are in boldface.
Rotated Component Matrixa
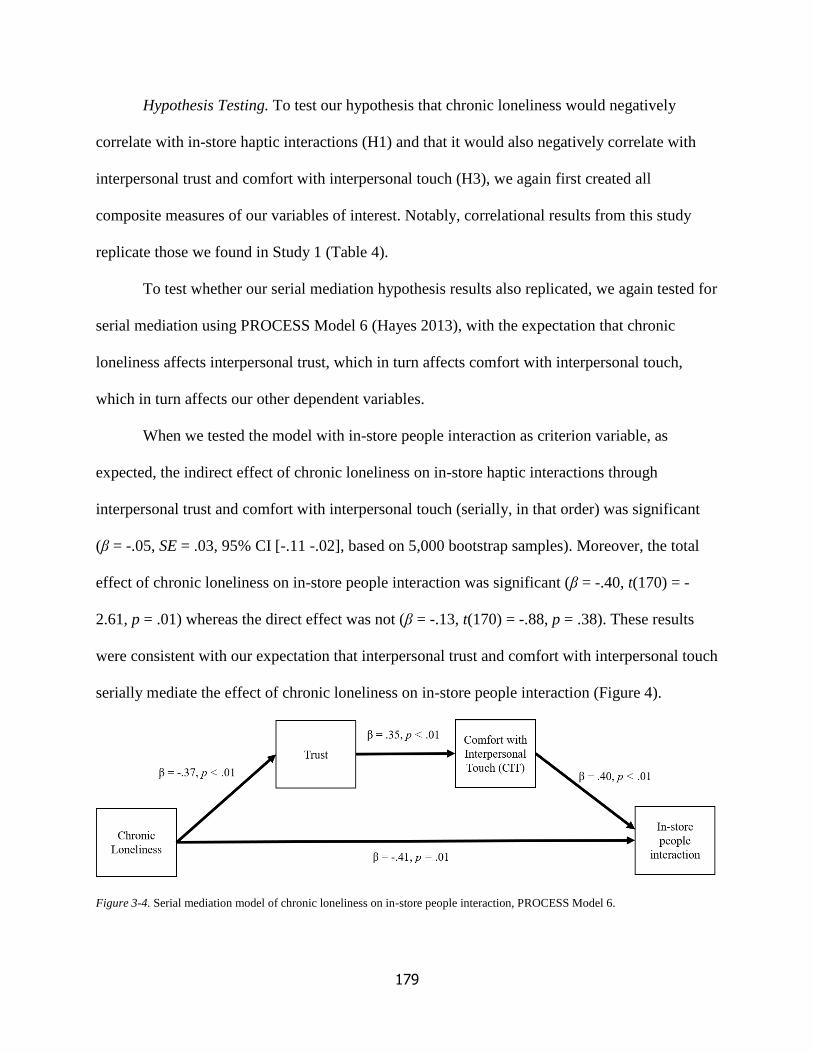
179
Hypothesis Testing. To test our hypothesis that chronic loneliness would negatively
correlate with in-store haptic interactions (H1) and that it would also negatively correlate with
interpersonal trust and comfort with interpersonal touch (H3), we again first created all
composite measures of our variables of interest. Notably, correlational results from this study
replicate those we found in Study 1 (Table 4).
To test whether our serial mediation hypothesis results also replicated, we again tested for
serial mediation using PROCESS Model 6 (Hayes 2013), with the expectation that chronic
loneliness affects interpersonal trust, which in turn affects comfort with interpersonal touch,
which in turn affects our other dependent variables.
When we tested the model with in-store people interaction as criterion variable, as
expected, the indirect effect of chronic loneliness on in-store haptic interactions through
interpersonal trust and comfort with interpersonal touch (serially, in that order) was significant
(β = -.05, SE = .03, 95% CI [-.11 -.02], based on 5,000 bootstrap samples). Moreover, the total
effect of chronic loneliness on in-store people interaction was significant (β = -.40, t(170) = -
2.61, p = .01) whereas the direct effect was not (β = -.13, t(170) = -.88, p = .38). These results
were consistent with our expectation that interpersonal trust and comfort with interpersonal touch
serially mediate the effect of chronic loneliness on in-store people interaction (Figure 4).
Figure 3-4. Serial mediation model of chronic loneliness on in-store people interaction, PROCESS Model 6.
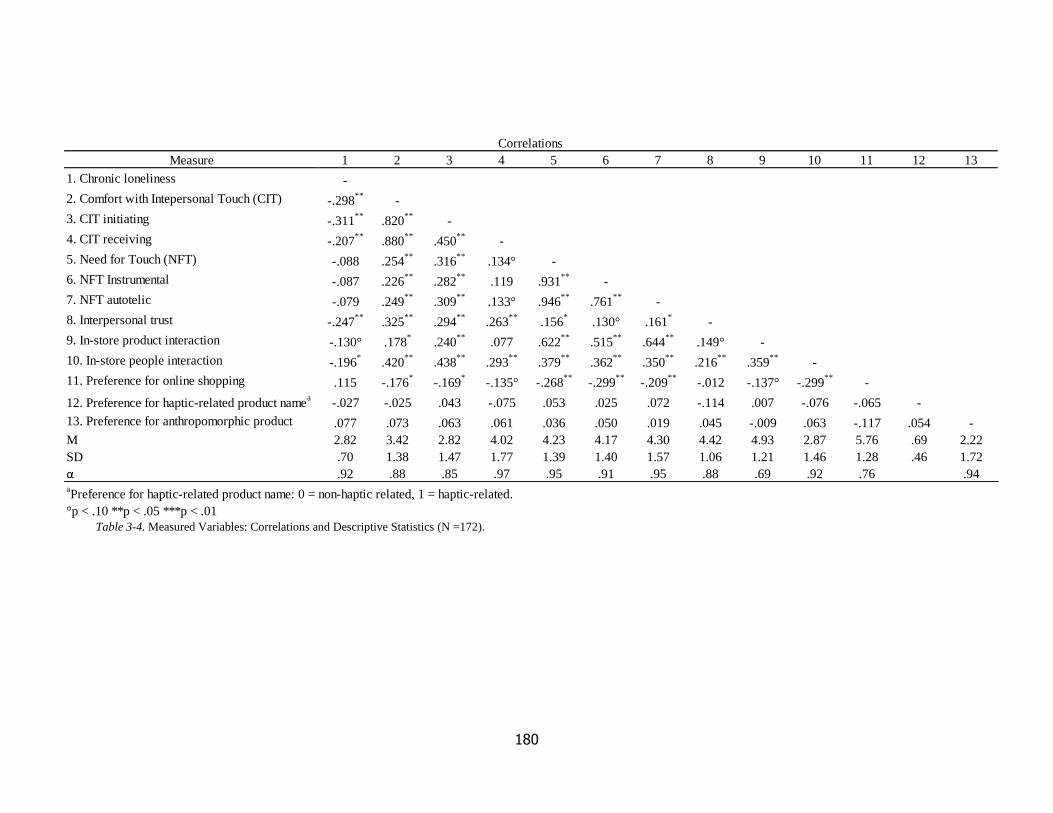
180
Table 3-4. Measured Variables: Correlations and Descriptive Statistics (N =172).
Measure 1 2 3 4 5 6 7 8 9 10 11 12 13
1. Chronic loneliness -
2. Comfort with Intepersonal Touch (CIT) -.298**
-
3. CIT initiating -.311**
.820**
-
4. CIT receiving -.207**
.880**
.450**
-
5. Need for Touch (NFT) -.088 .254**
.316**
.134° -
6. NFT Instrumental -.087 .226**
.282**
.119 .931**
-
7. NFT autotelic -.079 .249**
.309**
.133° .946**
.761**
-
8. Interpersonal trust -.247**
.325**
.294**
.263**
.156*
.130° .161*
-
9. In-store product interaction -.130° .178*
.240**
.077 .622**
.515**
.644**
.149° -
10. In-store people interaction -.196*
.420**
.438**
.293**
.379**
.362**
.350**
.216**
.359**
-
11. Preference for online shopping .115 -.176*
-.169*
-.135° -.268**
-.299**
-.209**
-.012 -.137° -.299**
-
12. Preference for haptic-related product namea
-.027 -.025 .043 -.075 .053 .025 .072 -.114 .007 -.076 -.065 -
13. Preference for anthropomorphic product .077 .073 .063 .061 .036 .050 .019 .045 -.009 .063 -.117 .054 -
M 2.82 3.42 2.82 4.02 4.23 4.17 4.30 4.42 4.93 2.87 5.76 .69 2.22
SD .70 1.38 1.47 1.77 1.39 1.40 1.57 1.06 1.21 1.46 1.28 .46 1.72
α .92 .88 .85 .97 .95 .91 .95 .88 .69 .92 .76 .94aPreference for haptic-related product name: 0 = non-haptic related, 1 = haptic-related.
Correlations
°p < .10 **p < .05 ***p < .01
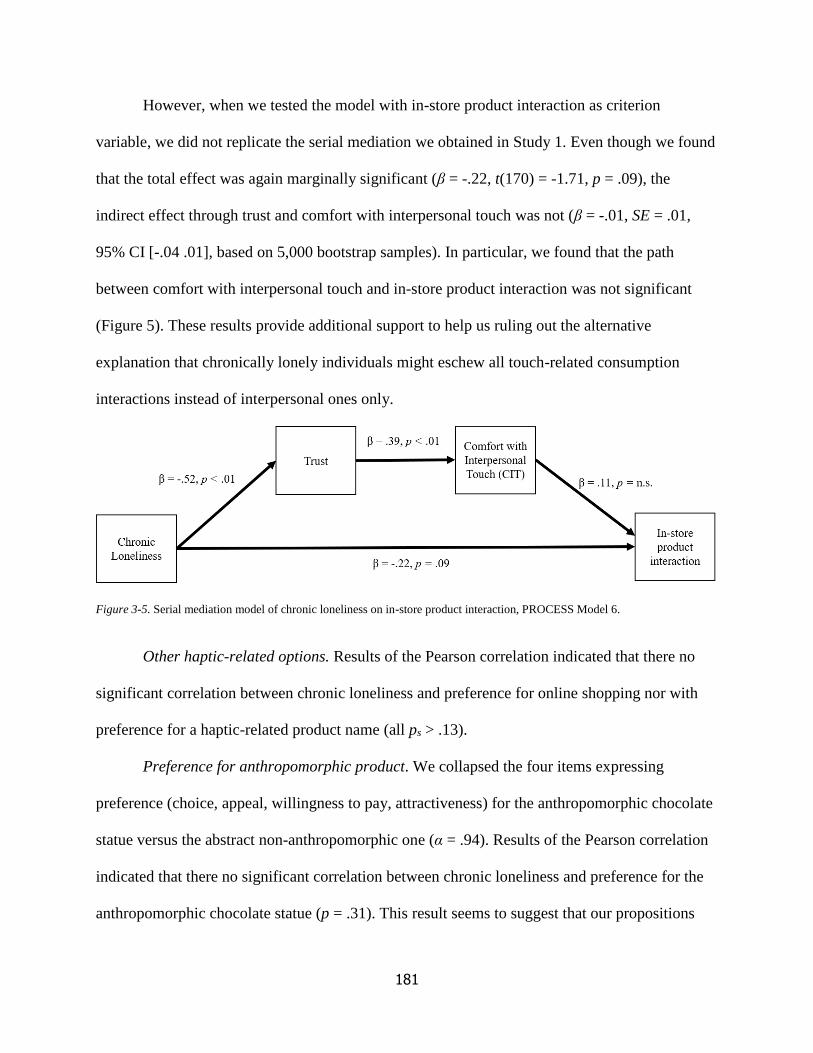
181
However, when we tested the model with in-store product interaction as criterion
variable, we did not replicate the serial mediation we obtained in Study 1. Even though we found
that the total effect was again marginally significant (β = -.22, t(170) = -1.71, p = .09), the
indirect effect through trust and comfort with interpersonal touch was not (β = -.01, SE = .01,
95% CI [-.04 .01], based on 5,000 bootstrap samples). In particular, we found that the path
between comfort with interpersonal touch and in-store product interaction was not significant
(Figure 5). These results provide additional support to help us ruling out the alternative
explanation that chronically lonely individuals might eschew all touch-related consumption
interactions instead of interpersonal ones only.
Figure 3-5. Serial mediation model of chronic loneliness on in-store product interaction, PROCESS Model 6.
Other haptic-related options. Results of the Pearson correlation indicated that there no
significant correlation between chronic loneliness and preference for online shopping nor with
preference for a haptic-related product name (all ps > .13).
Preference for anthropomorphic product. We collapsed the four items expressing
preference (choice, appeal, willingness to pay, attractiveness) for the anthropomorphic chocolate
statue versus the abstract non-anthropomorphic one (α = .94). Results of the Pearson correlation
indicated that there no significant correlation between chronic loneliness and preference for the
anthropomorphic chocolate statue (p = .31). This result seems to suggest that our propositions
182
might hold only for haptic-related consumption activities and unlikely extend to indirect
substitutes of direct social reconnection.
Taken together, the results of Study 2 replicate the results of Study 1 in supporting our
hypothesized negative relation between chronic loneliness and in-store haptic interactions (H1)
as well as our hypothesized serial mediation model (H3). Also, the results helped clarify that
lonely consumers eschew haptic-related consumption experiences that are interpersonal in nature
because of their lack of interpersonal trust with makes them less trustful of individuals, which in
turn affects their comfort with interpersonal touch rather than with product touch.
Unfortunately, given the unsuccessful loneliness manipulation, we were unable to find
support for our hypothesized difference in reconnection tendencies between chronically lonely
and situationally lonely individuals (H2). Following the unsuccessful loneliness manipulation in
Study 2, we ran another study to try and manipulate loneliness. In particular, we tried using a
different manipulation (i.e., bogus feedback on a loneliness evaluation; Wildschut et al. 2006)
and a different sample (i.e., students in a US university lab), but we were again unsuccessful.
STUDY 3: TRUST BOOST MODERATION-OF-PROCESS
In Study 3, we manipulated interpersonal trust and we measured attitudes towards
different typologies of haptic in-store interaction. This study has two primary objectives. First,
by manipulating trust, we provide additional evidence for the process underlying the effect of
chronic loneliness on comfort with interpersonal touch and attitudes towards haptic-related
consumption experiences. In fact, it could be argued that because interpersonal trust is a trait
variable, it could causally precede chronic loneliness. However, if the directionality we
hypothesize is correct, a moderation-of-process design will rule out such an alternative
explanation. Specifically, if interpersonal trust is indeed the first mediator of the serial mediation
183
model we tested in the previous studies, then increasing it should eliminate the effect of
loneliness on comfort with interpersonal touch and attitudes towards haptic-related consumption
experiences.
Second, by examining different typologies of haptic interpersonal interaction that could
happen in-store, we explore whether there is a difference in willingness to socially reconnect
based on the type of interpersonal touch received or initiated. Schroeder and colleagues (2017)
proposed that there is a difference between romantic, functional, and imposed intimacy.
Therefore, another person’s touch can pertain to each of those three categories. For example, a
romantic touch can be that of partners holding hands, a functional touch can be that of airport
security official screening people needing to catch a flight, and an imposed touch can be that of
people being inadvertently touched on public transportation. Accordingly, we created a measure
of in-store haptic interactions that reflected the distinction between functional (e.g., salesperson
taking your measurement) and imposed (e.g., salesperson bumping into you) touch that customer
might receive or initiate while shopping in a store17.
Before conducting this study, we conducted a pretest to confirm that our trust boost
manipulation was effective and to make sure that the in-store haptic interactions scenarios were
interpreted as intended in terms of receiving or initiating touch, and in terms of the touch
interaction being functional or imposed. See Appendixes D and E for details of pretests and
manipulation checks.
Method
Participants and procedure. Two hundred and three participants (21% men; Mage = 35.66
17 We did not use romantic touch in this study because this typology of touch does not fit the examined consumption
setting of in-store haptic interaction between a customer and a salesperson. However, when pretesting our measure,
we made sure that the distinction between the three typologies was clearly understood and discriminated by to avoid
confounds in the main study.
184
yrs., SD = 11.27) were recruited from the United Kingdom through Prolific Academic in
exchange for a small monetary compensation. They were randomly assigned to a one-factor 2-
level (trust boost: absent vs. present) between-subjects design.
First, in a procedure that represented the trust manipulation, participants completed a
verbal aptitude task in which they were asked to read a randomly selected newspaper article and
write a few supporting arguments about its main claim. After they completed the task,
participants were asked to complete a study on general attitudes in which they were asked to
express their opinion on a wide range of topics. After expressing their opinion, participants
completed a shopping experience study in which they were asked to read 16 short scenarios
depicting various aspects of in-store shopping and to indicate how they would feel in each
situation. Subsequently, as part of a consumer personality study, all participants completed the
scales related to interpersonal touch and trust. Finally, participants completed a measure of
chronic loneliness as part of a scale development study, provided basic demographic
information, and were thanked for their collaboration.
Trust boost manipulation. Participants first completed a verbal aptitude task that
manipulated participants’ levels of interpersonal trust. Participants assigned to the trust boost
present condition read a newspaper article titled “People Are More Trustworthy Than We Think”
(see Appendix D) and were asked to write in support of the article’s main argument explaining
its merits and to provide an example of a time in which they trusted another person and they
benefited from it. In contrast, participants assigned to the trust boost absent condition read a
newspaper article titled “Shelf Effacement: How Not to Organize Your Bookshelves” and were
also asked to write in support of the authors’ main argument and to provide an example related to
content of the text.
185
Manipulation check. As part of a study on general attitudes, participants were shown four
generic statements and asked to express how they felt about them at that moment (1 = strongly
disagree; 7 = strongly agree). The three filler items were: “TV is my main form of
entertainment,” “I like to try new things,” and “Overall, I’d say I am pretty happy.” Our target
manipulation check item was “In general, I think people are trustworthy.”
Comfort with in-store haptic interaction. To measure attitudes towards in-store possible
haptic interactions, participants read nine touch-related scenarios and seven filler ones (see
Appendix A), and they were asked to express how they would act and feel in such situations. For
the scenarios depicting instances of functional or imposed in-store touch interactions between
customers and salespersons, participants were asked to rate the likelihood of them initiating and
of them being bothered when receiving such interpersonal touch (1 = not at all likely, 7 = very
much likely). For filler scenarios, participants were asked to rate their likelihood of acting or
feeling a certain way about a variety of non-touch situations that might be encountered while
shopping in a store. Participants were shown target and filler scenarios in a randomized order to
disguise the experimental purpose.
Trait measures. Similar to the previous studies, participants completed the UCLA chronic
loneliness scale (Russell 1996), the comfort with interpersonal touch scale (Webb and Peck
2015), and the generalized trust scale (Yamagishi and Yamagishi 1994).
Results and Discussion
Manipulation check. A one-way ANOVA on the manipulation check item showed that
the manipulation was effective (F(1, 201) = 7.23, p < .01). Compared to participants in the trust
boost absent condition (M = 4.28, SD = 1.30), participants in the trust boost present condition
exhibited higher agreement with the item stating that other people are trustworthy (M = 4.78, SD
186
= 1.33).
Hypothesis Testing. We expected that participants’ chronic loneliness would affect their
comfort with interpersonal touch, which in turn would affect their comfort with in-store haptic
interactions. However, we expected that such mediation effect would be eliminated under the
trust boost present condition, but not under the trust boost absent condition.
First, we recoded participants responses to the in-store haptic interactions scenarios such
that higher scores corresponded to higher propensity to touch salespersons and to lowest
anticipated discomfort when being touched by salespersons. Second, we computed an overall
score for comfort with in-store haptic interaction (α = .73) and we used it as a dependent variable
in testing for moderated mediation using PROCESS Model 8 (Hayes 2013).
Based on a 5,000-iteration bootstrap, we found that trust boost moderates the effect of
chronic loneliness on comfort with interpersonal touch at a 95% confidence level (B = .87,
SE = .28, 95% CI = [.36, 1.42]) and it moderates the effect on chronic loneliness on comfort with
in-store haptic interactions at a 95% confidence level (B = .37, SE = .18, 95% CI = [.01, 0.72]).
As hypothesized, we find that chronic loneliness has an effect on comfort with in-store haptic
interactions only when the trust boost is absent (see Figure 6). Moreover, we found that the index
of moderated mediation was significant at the 95% confidence level (Index = .39, SE = .14,
CI= [.11, .65]) and that the effect of chronic loneliness on comfort with in-store haptic
interactions through comfort with interpersonal touch was significant only when the trust boost
was absent (CI trust boost present = [-.15, .24], CI trust boost absent = [-.52, -.14]). These results indicate
that when participants’ interpersonal trust was boosted, the effect of chronic loneliness on
comfort with in-store haptic interactions was eliminated. These findings suggest that
interpersonal trust is truly the underlying mechanism explaining why chronically lonely
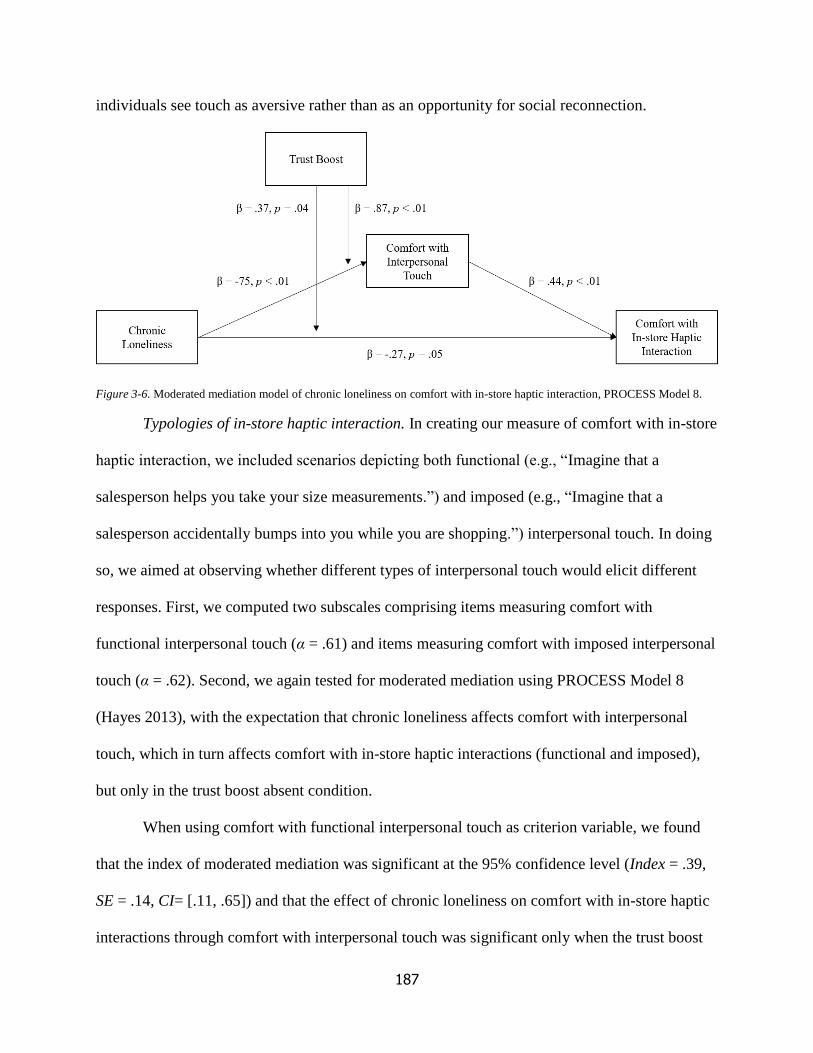
187
individuals see touch as aversive rather than as an opportunity for social reconnection.
Figure 3-6. Moderated mediation model of chronic loneliness on comfort with in-store haptic interaction, PROCESS Model 8.
Typologies of in-store haptic interaction. In creating our measure of comfort with in-store
haptic interaction, we included scenarios depicting both functional (e.g., “Imagine that a
salesperson helps you take your size measurements.”) and imposed (e.g., “Imagine that a
salesperson accidentally bumps into you while you are shopping.”) interpersonal touch. In doing
so, we aimed at observing whether different types of interpersonal touch would elicit different
responses. First, we computed two subscales comprising items measuring comfort with
functional interpersonal touch (α = .61) and items measuring comfort with imposed interpersonal
touch (α = .62). Second, we again tested for moderated mediation using PROCESS Model 8
(Hayes 2013), with the expectation that chronic loneliness affects comfort with interpersonal
touch, which in turn affects comfort with in-store haptic interactions (functional and imposed),
but only in the trust boost absent condition.
When using comfort with functional interpersonal touch as criterion variable, we found
that the index of moderated mediation was significant at the 95% confidence level (Index = .39,
SE = .14, CI= [.11, .65]) and that the effect of chronic loneliness on comfort with in-store haptic
interactions through comfort with interpersonal touch was significant only when the trust boost
188
was absent (CI trust boost present = [-.16, .24], CI trust boost absent = [-.51, -.15]).
When using comfort with imposed interpersonal touch as criterion variable, we found that
the index of moderated mediation was significant at the 95% confidence level (Index = .38,
SE = .15, CI= [.10, .68]) and that the effect of chronic loneliness on comfort with in-store haptic
interactions through comfort with interpersonal touch was significant only when the trust boost
was absent (CI trust boost present = [-.16, .24], CI trust boost absent = [-.55, -.14]).Based on these findings, it
seems that our hypothesized serial mediation (H3) holds for different typologies of interpersonal
in-store haptic interactions regardless of their specific function.
Taken together, the results of Study 3 provide additional support for our hypothesis that
chronically lonely consumers will be less comfortable with in-store haptic interactions regardless
of whether they are functional or imposed (H1). Moreover, by manipulating participants’
interpersonal trust we were able to more stringently test our hypothesis that chronically lonely
consumers will eschew in-store haptic interaction because of their lack of interpersonal trust,
which negatively affects their comfort with interpersonal touch (H3). Specifically, moderated
mediation analyses showed that when participants’ interpersonal trust is boosted experimentally,
the negative effect of chronic loneliness on in-store haptic interactions is eliminated.
GENERAL DISCUSSION
We find that chronically lonely consumers eschew haptic-related consumer experiences,
and that they do so because they lack interpersonal trust, which lowers their comfort with
interpersonal touch more generally. Throughout three studies, we found support for two of our
three hypotheses, and we could consistently replicate our findings using different measures of
haptic in-store experiences. Unfortunately, we were unable to provide support for our
hypothesized difference between chronically and situationally lonely consumers. We posited that
189
the negative effect of loneliness on attitudes towards haptic-related consumer experiences would
only hold for chronically lonely individuals because of their hypervigilance tendencies towards
social reconnection opportunities making them less trustful of others. However, in Study 2 our
loneliness manipulation failed to significantly manipulate participants’ state feelings of
loneliness and second hypothesis could not be tested.
In addition to testing our main hypotheses, our studies: 1) explored some alternatives that
could compete with our theorizing (i.e., contamination cognitions and social risk taking); 2)
examined whether our effect was specific to haptic consumption experiences or extended to
other social reconnection options that consumption activities might offer (i.e., anthropomorphic
products); and 3) investigated whether the effect was specific to a certain typology of haptic
interpersonal interaction (i.e., functional and imposed touch). Overall, we found that the negative
effect of chronic loneliness on attitudes towards haptic-related consumer experiences is
explained by interpersonal trust and comfort with interpersonal touch, and it is unlikely to be
explained by other anxiety-related thoughts that might typical of the chronically lonely
individual such as heightened contamination cognitions and lowered social risk taking.
Moreover, we found that our effect does not extend to other consumption options that might act
as indirect substitutes of direct social reconnection such as anthropomorphic products. Previous
research has shown that lonely individuals do prefer anthropomorphic products and brands (Chen
et al. 2017; Mourey et al. 2017), but those results were based on experimental procedures that
manipulated state loneliness rather than measuring chronic loneliness (e.g., Cyberball, written
recall of social exclusion). The results of these previous studies lend additional credence to our
currently untested hypothesis two (H2) as it seems that situationally chronically individuals will
indeed seek consumption options that offer reconnection opportunities (indirectly or directly).
190
Table 6 provides a summary of the main findings.
Theoretical implications
Our findings add to literature on loneliness by introducing a new theoretical proposition
to try and solve the social reconnection hypothesis conundrum. We posit that chronically lonely
and situationally lonely individuals will differ in their likelihood to seek social reconnection.
Specifically, situationally lonely individuals will seek interpersonal reconnection whereas
chronically lonely individuals, who are trapped in their hypersensitivity to negative social cues,
will not. So far, we could only provide evidence that chronically lonely individuals eschew
haptic-related chances for reconnection in consumption settings. Therefore, we add to the stream
of literature that explores boundary conditions for the reconnection hypothesis and that argues
that not all instances of social pain motivate individuals to attempt to restore feelings of social
connectedness.
Furthermore, we add to the literature on consumer haptics by identifying important
antecedents of comfort with interpersonal touch. Our findings suggest that comfort with
interpersonal touch is influenced by chronic feelings of loneliness. The negative self-reinforcing
loop that characterizes chronic lonely individuals deeply shapes their perception that other
individuals are threatening when it comes to socially interact with them, and we find that these
negative cognitions affect interpersonal trust levels which in turn affect levels of comfort with
receiving and initiating interpersonal touch. Our findings indicate that comfort with interpersonal
trust is unlikely to be an innate personal trait, but rather it is likely shaped by previous
interpersonal interactions.
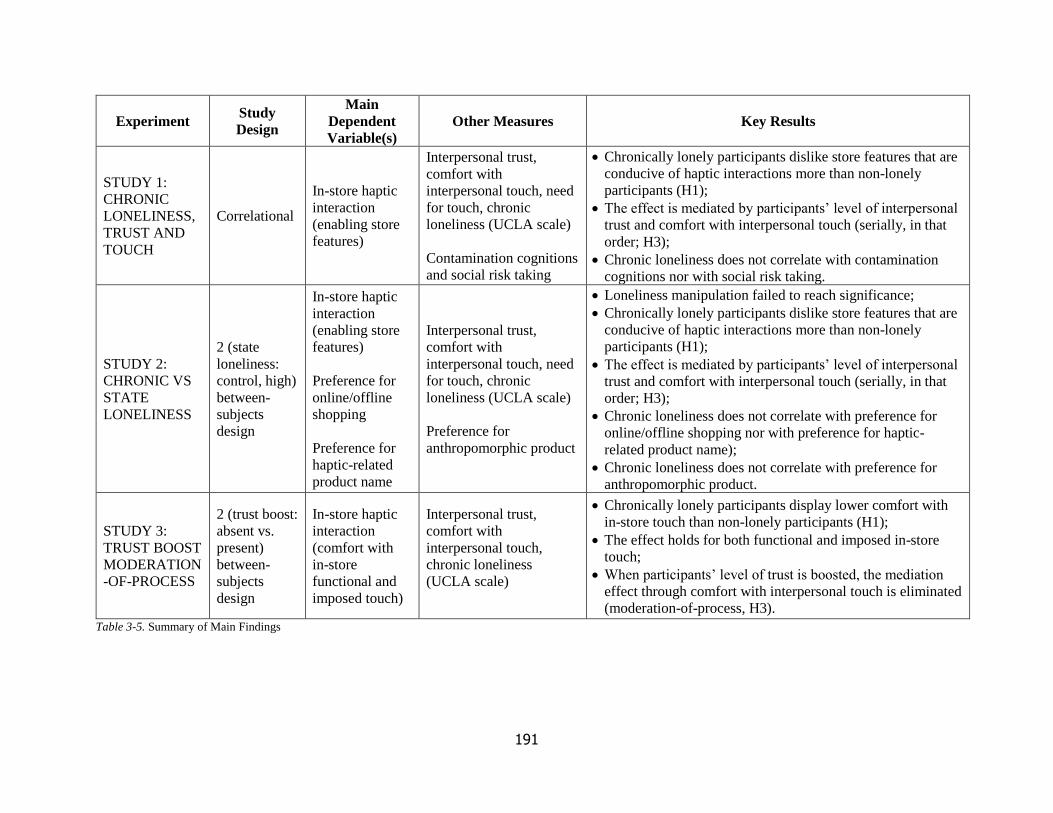
191
Experiment Study
Design
Main
Dependent
Variable(s)
Other Measures Key Results
STUDY 1:
CHRONIC
LONELINESS,
TRUST AND
TOUCH
Correlational
In-store haptic
interaction
(enabling store
features)
Interpersonal trust,
comfort with
interpersonal touch, need
for touch, chronic
loneliness (UCLA scale)
Contamination cognitions
and social risk taking
• Chronically lonely participants dislike store features that are
conducive of haptic interactions more than non-lonely
participants (H1);
• The effect is mediated by participants’ level of interpersonal
trust and comfort with interpersonal touch (serially, in that
order; H3);
• Chronic loneliness does not correlate with contamination
cognitions nor with social risk taking.
STUDY 2:
CHRONIC VS
STATE
LONELINESS
2 (state
loneliness:
control, high)
between-
subjects
design
In-store haptic
interaction
(enabling store
features)
Preference for
online/offline
shopping
Preference for
haptic-related
product name
Interpersonal trust,
comfort with
interpersonal touch, need
for touch, chronic
loneliness (UCLA scale)
Preference for
anthropomorphic product
• Loneliness manipulation failed to reach significance;
• Chronically lonely participants dislike store features that are
conducive of haptic interactions more than non-lonely
participants (H1);
• The effect is mediated by participants’ level of interpersonal
trust and comfort with interpersonal touch (serially, in that
order; H3);
• Chronic loneliness does not correlate with preference for
online/offline shopping nor with preference for haptic-
related product name);
• Chronic loneliness does not correlate with preference for
anthropomorphic product.
STUDY 3:
TRUST BOOST
MODERATION
-OF-PROCESS
2 (trust boost:
absent vs.
present)
between-
subjects
design
In-store haptic
interaction
(comfort with
in-store
functional and
imposed touch)
Interpersonal trust,
comfort with
interpersonal touch,
chronic loneliness
(UCLA scale)
• Chronically lonely participants display lower comfort with
in-store touch than non-lonely participants (H1);
• The effect holds for both functional and imposed in-store
touch;
• When participants’ level of trust is boosted, the mediation
effect through comfort with interpersonal touch is eliminated
(moderation-of-process, H3).
Table 3-5. Summary of Main Findings
192
Managerial implications
Research is advancing on how to incorporate haptic sensations in computer mediated
communications (Haans and IJsselsteijn 2006) and it is not hard to envision marketers trying to
add haptic sensations to online shopping platforms (e.g., enabling customers to feel the softness
of a clothing item) or to add hapticons (i.e., haptic emoticons) to mediated communication
services such as messaging platforms and dating apps (e.g., enabling customers to send hugs
over WhatsApp).
We find that chronically lonely consumers eschew rather than seek haptic-related
consumption experiences. One suggestion for marketers seeking to invest in the field of haptics
would be to carefully consider whether their consumers will find haptic engagement to be
aversive. Recent studies have shown that loneliness is widespread among millennials and, if
most shoppers are characterized by chronic loneliness, marketers’ investments in the field of
haptics might be unwarranted. However, we also found that external reminders that boost
consumers’ trust in others can eliminate the effect. Therefore, one solution would be for
marketers to include those reminders in promotional messages that advertise haptic-related
consumption experiences.
Limitations and further research
The main limitation of the present research is the lack of an effective loneliness
manipulation that prevented us from testing our proposition that momentarily lonely individuals,
as opposed to chronically lonely ones, seek rather than eschew haptic-related consumer
experiences (H2). We are currently working on the next studies to advance the research
presented in this essay, and the main objective is now to find an effective loneliness
manipulation.
193
Also, based on our research, one could argue that given haptic consumption experiences
are aversive for chronic lonely individuals, they should be avoided because they might spill over
in negative evaluation of the consumption experience itself. In the present research, we did not
yet test this spillover effect from reduced willingness to engage in haptic-related consumption
experiences to reduced liking of the consumption experience itself. However, if we were to test
this proposition, we would counterintuitively hypothesize that this will not be the case. In fact,
research has shown that even if interpersonal touch is aversive only for individuals high in social
anxiety as compared to those low in social anxiety, the positive physiological responses to touch
do not differ between individuals with high and low social anxiety (Wilhelm et al. 2001). The
finding that interpersonal touch is aversive only for people high in social anxiety is consistent
with our finding that chronically lonely consumers eschew interpersonal touch and haptic-related
consumer experiences. Nevertheless, it also seems to suggest that if interpersonal touch cannot
be avoided and it is indeed experienced, it might benefit chronic lonely individuals as it does for
everyone else more generally (e.g., increased oxytocin, reduced stress). Further research is
needed to determine whether the aversion towards interpersonal touch spills over into negative
evaluation of haptic-related consumption and to determine whether it perpetrates the self-
reinforcing loneliness loop. A possibility exists that imposed touch therapies and haptic
consumption experiences can help fight the crystallization of loneliness into chronic loneliness.
194
REFERENCES
Baumeister, R. F., & Leary, M. R. (1995). The need to belong: desire for interpersonal
attachments as a fundamental human motivation. Psychological bulletin, 117(3), 497.
doi:http://dx.doi.org/10.1037/0033-2909.117.3.497
Blais, A.-R., & Weber, E. U. (2006). A domain-specific risk-taking (DOSPERT) scale for adult
populations. http://journal.sjdm.org/06005/jdm06005.htm. Accessed 27 April 2017
Cacioppo, J. T., Ernst, J. M., Burleson, M. H., McClintock, M. K., Malarkey, W. B., Hawkley, L.
C., et al. (2000). Lonely traits and concomitant physiological processes: the MacArthur
social neuroscience studies. International Journal of Psychophysiology, 35(2–3), 143–
154. doi:https://doi.org/10.1016/S0167-8760(99)00049-5
Cacioppo, J. T., & Patrick, W. (2008). Loneliness: Human nature and the need for social
connection. New York, NY, US: WW Norton & Company.
Chen, R. P., Wan, E. W., & Levy, E. (2017). The effect of social exclusion on consumer
preference for anthropomorphized brands. Journal of Consumer Psychology, 27(1), 23–
34. doi:https://doi.org/10.1016/j.jcps.2016.05.004
Cocozza, P. (2018, March 7). No hugging: are we living through a crisis of touch? the Guardian.
http://www.theguardian.com/society/2018/mar/07/crisis-touch-hugging-mental-health-
strokes-cuddles. Accessed 17 April 2018
Crusco, A. H., & Wetzel, C. G. (1984). The Midas touch: The effects of interpersonal touch on
restaurant tipping. Personality and Social Psychology Bulletin, 10(4), 512–517.
doi:https://doi.org/10.1177/0146167284104003
Deacon, B., & Olatunji, B. O. (2007). Specificity of disgust sensitivity in the prediction of
behavioral avoidance in contamination fear. Behaviour Research and Therapy, 45(9),
195
2110–2120. doi:10.1016/j.brat.2007.03.008
Derrick, J. L., Gabriel, S., & Hugenberg, K. (2009). Social surrogacy: How favored television
programs provide the experience of belonging. Journal of Experimental Social
Psychology, 45(2), 352–362. doi:10.1016/j.jesp.2008.12.003
DeWall, C. N., Maner, J. K., & Rouby, D. A. (2009). Social exclusion and early-stage
interpersonal perception: Selective attention to signs of acceptance. Journal of
Personality and Social Psychology, 96(4), 729–741. doi:10.1037/a0014634
Field, T. (2003). Touch (2nd Revised ed. edition.). Cambridge, Mass.: A Bradford Book.
Gallace, A., & Spence, C. (2010). The science of interpersonal touch: An overview.
Neuroscience & Biobehavioral Reviews, 34(2), 246–259.
doi:10.1016/j.neubiorev.2008.10.004
Gerson, A. C., & Perlman, D. (1979). Loneliness and expressive communication. Journal of
Abnormal Psychology, 88(3), 258. doi:http://psycnet.apa.org/doi/10.1037/0021-
843X.88.3.258
GlobalWebIndex. (2017). Daily time spent on social networking by internet users worldwide
from 2012 to 2017 (in minutes). Statista. https://www-statista-
com.ezproxy.hec.fr/statistics/433871/daily-social-media-usage-worldwide/. Accessed 17
April 2018
Guéguen, N., Jacob, C., & Boulbry, G. (2007). The effect of touch on compliance with a
restaurant’s employee suggestion. International Journal of Hospitality Management,
26(4), 1019–1023. doi:10.1016/j.ijhm.2006.12.004
Haans, A., & IJsselsteijn, W. (2006). Mediated social touch: a review of current research and
future directions. Virtual Reality, 9(2–3), 149–159. doi:10.1007/s10055-005-0014-2
196
Harlow, H. F. (1958). The nature of love. American psychologist, 13(12), 673.
doi:http://psycnet.apa.org/doi/10.1037/h0047884
Hawkley, L. C., & Cacioppo, J. T. (2010). Loneliness Matters: A Theoretical and Empirical
Review of Consequences and Mechanisms. Annals of behavioral medicine : a publication
of the Society of Behavioral Medicine, 40(2). doi:10.1007/s12160-010-9210-8
Hayes, A. F. (2013). Introduction to mediation, moderation, and conditional process analysis: a
regression-based approach. New York: The Guilford Press.
Heinrich, L. M., & Gullone, E. (2006). The clinical significance of loneliness: A literature
review. Clinical Psychology Review, 26(6), 695–718. doi:10.1016/j.cpr.2006.04.002
Hertenstein, M. J., Holmes, R., McCullough, M., & Keltner, D. (2009). The communication of
emotion via touch. Emotion, 9(4), 566. doi:https://doi.org/10.1037/a0016108
Hertenstein, M. J., Keltner, D., App, B., Bulleit, B. A., & Jaskolka, A. R. (2006). Touch
communicates distinct emotions. Emotion, 6(3), 528. doi:https://doi.org/10.1037/1528-
3542.6.3.528
Hornik, J. (1992). Tactile Stimulation and Consumer Response. Journal of Consumer Research,
19(3), 449. doi:10.1086/209314
Irving, P. (2018, April 18). The Epidemic of Loneliness–and How to Combat It. WSJ.
https://blogs.wsj.com/experts/2018/04/18/the-epidemic-of-loneliness-and-how-to-
combat-it/. Accessed 18 April 2018
Jansson-Boyd, C. (2011). Touch matters: exploring the relationship between consumption and
tactile interaction. Social Semiotics, 21(4), 531–546. doi:10.1080/10350330.2011.591996
Kline, R. B. (2005). Principles and practice of structural equation modeling. New York, NY,
US: Guilford Press.
197
Klinenberg, E. (2018). Opinion | Is Loneliness a Health Epidemic? The New York Times.
https://www.nytimes.com/2018/02/09/opinion/sunday/loneliness-health.html. Accessed
17 April 2018
Lastovicka, J. L., & Sirianni, N. J. (2011). Truly, madly, deeply: Consumers in the throes of
material possession love. Journal of Consumer Research, 38(2), 323–342.
doi:10.1086/658338
Lucas, G. M., Knowles, M. L., Gardner, W. L., Molden, D. C., & Jefferis, V. E. (2010).
Increasing social engagement among lonely individuals: The role of acceptance cues and
promotion motivations. Personality and Social Psychology Bulletin, 36(10), 1346–1359.
doi:https://doi.org/10.1177/0146167210382662
Mallott, M. A., Maner, J. K., DeWall, N., & Schmidt, N. B. (2009). Compensatory deficits
following rejection: the role of social anxiety in disrupting affiliative behavior.
Depression and Anxiety, 26(5), 438–446. doi:https://doi.org/10.1002/da.20555
Maner, J. K., DeWall, C. N., Baumeister, R. F., & Schaller, M. (2007). Does social exclusion
motivate interpersonal reconnection? Resolving the “porcupine problem.” Journal of
Personality and Social Psychology, 92(1), 42–55. doi:10.1037/0022-3514.92.1.42
Mead, N. L., Baumeister, R. F., Stillman, T. F., Rawn, C. D., & Vohs, K. D. (2011). Social
Exclusion Causes People to Spend and Consume Strategically in the Service of
Affiliation. Journal of Consumer Research, 37(5), 902–919. doi:10.1086/656667
Molden, D. C., & Maner, J. K. (2013). How and when exclusion motivates social reconnection.
In C. N. DeWall (Ed.), The Oxford handbook of social exclusion (pp. 121–131). New
York, NY, US: Oxford University Press.
Mourey, J. A., Olson, J. G., & Yoon, C. (2017). Products as Pals: Engaging with
198
Anthropomorphic Products Mitigates the Effects of Social Exclusion. Journal of
Consumer Research. doi:https://doi.org/10.1093/jcr/ucx038
Noack, R. (2018, February 2). Isolation is rising in Europe. Can loneliness ministers help change
that? Washington Post.
https://www.washingtonpost.com/news/worldviews/wp/2018/02/02/isolation-is-rising-in-
europe-can-loneliness-ministers-help-change-that/. Accessed 18 April 2018
Norman, G. J., Hawkley, L. C., Cole, S. W., Berntson, G. G., & Cacioppo, J. T. (2012). Social
neuroscience: The social brain, oxytocin, and health. Social Neuroscience, 7(1), 18–29.
doi:10.1080/17470919.2011.568702
Park, L. E., & Maner, J. K. (2009). Does self-threat promote social connection? The role of self-
esteem and contingencies of self-worth. Journal of Personality and Social Psychology,
96(1), 203–217. doi:10.1037/a0013933
Peck, J. (2010). Does touch matter? Insights from haptic research in marketing. In A. Krishna
(Ed.), Sensory marketing: Research on the sensuality of products (pp. 47–62). New York,
NY, US: Routledge.
Peck, J., & Childers, T. L. (2003). Individual differences in haptic information processing: The
“need for touch” scale. Journal of Consumer Research, 30(3), 430–442.
doi:10.1086/378619
Peck, J., & Childers, T. L. (2006). If I touch it I have to have it: Individual and environmental
influences on impulse purchasing. Journal of Business Research, 59(6), 765–769.
doi:10.1016/j.jbusres.2006.01.014
Peck, J., & Childers, T. L. (2008). Sensory factors and consumer behavior. In C. P. Haugtvedt, P.
M. Herr, & F. R. Kardes (Eds.), Handbook of consumer psychology (Vol. 4, pp. 193–
199
219). New York, NY: Taylor & Francis Group/Lawrence Erlbaum Associates.
Peck, J., & Wiggins, J. (2006). It Just Feels Good: Customers’ Affective Response to Touch and
Its Influence on Persuasion. Journal of Marketing, 70(4), 56–69.
doi:http://psycnet.apa.org/doi/10.1509/jmkg.70.4.56
Peper, E., & Harvey, R. (2018). Digital Addiction: Increased Loneliness, Anxiety, and
Depression. NeuroRegulation, 5(1), 3–8. doi:10.15540/nr.5.1.3
Perlman, D., & Peplau, L. A. (1981). Toward a social psychology of loneliness. In R. Gilmour &
S. Duck (Eds.), Relationships in Disorder (Vol. 3, pp. 31–56). London: Academic Press.
Primack, B. A., Shensa, A., Sidani, J. E., Whaite, E. O., Lin, L. yi, Rosen, D., et al. (2017).
Social Media Use and Perceived Social Isolation Among Young Adults in the U.S.
American Journal of Preventive Medicine, 53(1), 1–8. doi:10.1016/j.amepre.2017.01.010
Rose, S. A. (1990). The sense of touch. Madison, WI: International Universities Press.
Rotter, J. B. (1971). Generalized expectancies for interpersonal trust. American Psychologist,
26(5), 443–452. doi:10.1037/h0031464
Russell, D. W. (1996). UCLA Loneliness Scale (Version 3): Reliability, validity, and factor
structure. Journal of personality assessment, 66(1), 20–40.
doi:https://doi.org/10.1207/s15327752jpa6601_2
Schroeder, J., Fishbach, A., Schein, C., & Gray, K. (2017). Functional intimacy: Needing—But
not wanting—The touch of a stranger. Journal of Personality and Social Psychology,
113(6), 910–924. doi:10.1037/pspi0000104
Shaver, P., Furman, W., & Buhrmester, D. (1985). Transition to college: Network changes,
social skills, and loneliness. In S. Duck & D. Perlman (Eds.), Understanding Personal
Relationships: An Interdisciplinary Approach (pp. 193–219). Thousand Oaks, Calif:
200
Sage.
Troisi, J. D., & Gabriel, S. (2011). Chicken Soup Really Is Good for the Soul “Comfort Food”
Fulfills the Need to Belong. Psychological Science, 22(6), 747–753.
doi:10.1177/0956797611407931
Twenge, J. M., Baumeister, R. F., Tice, D. M., & Stucke, T. S. (2001). If you can’t join them,
beat them: Effects of social exclusion on aggressive behavior. Journal of Personality and
Social Psychology, 81(6), 1058–1069. doi:10.1037//0022-3514.81.6.1058
Wang, J., Zhu, R., & Shiv, B. (2012). The Lonely Consumer: Loner or Conformer? Journal of
Consumer Research, 38(6), 1116–1128. doi:10.1086/661552
Webb, A., & Peck, J. (2015). Individual differences in interpersonal touch: On the development,
validation, and use of the “comfort with interpersonal touch” (CIT) scale. Journal of
Consumer Psychology, 25(1), 60–77. doi:10.1016/j.jcps.2014.07.002
West, D. A., Kellner, R., & Moore-West, M. (1986). The effects of loneliness: A review of the
literature. Comprehensive Psychiatry, 27(4), 351–363. doi:10.1016/0010-
440X(86)90011-8
Wildschut, T., Sedikides, C., Arndt, J., & Routledge, C. (2006). Nostalgia: Content, Triggers,
Functions. Journal of Personality and Social Psychology, 91(5), 975–993.
doi:https://doi.org/10.1111/j.1467-9280.2008.02194.x
Wilhelm, F. H., Kochar, A. S., Roth, W. T., & Gross, J. J. (2001). Social anxiety and response to
touch: incongruence between self-evaluative and physiological reactions. Biological
Psychology, 58(3), 181–202. doi:10.1016/S0301-0511(01)00113-2
Yamagishi, T., & Yamagishi, M. (1994). Trust and commitment in the United States and Japan.
Motivation and emotion, 18(2), 129–166. doi:https://doi.org/10.1007/BF02249397
201
Young, C. (2007). The power of touch in psychotherapy. International Journal of
Psychotherapy, 11(3), 15.
Young, J. E. (1982). Loneliness, depression and cognitive therapy: Theory and application. In L.
A. Peplau & D. Perlman (Eds.), Loneliness: A sourcebook of current theory, research
and therapy (pp. 1–18). New York: Wiley.
Zhou, X., Sedikides, C., Wildschut, T., & Gao, D.-G. (2008). Counteracting loneliness on the
restorative function of nostalgia. Psychological Science, 19(10), 1023–1029.
doi:https://doi.org/10.1111/j.1467-9280.2008.02194.x
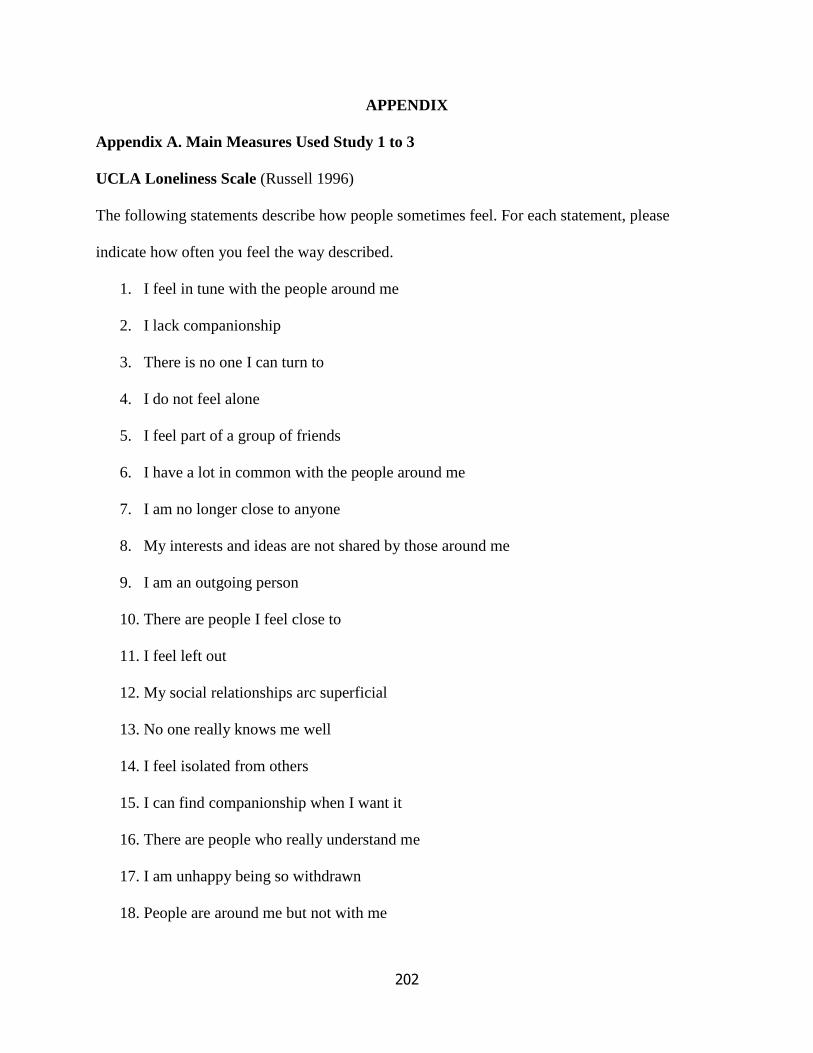
202
APPENDIX
Appendix A. Main Measures Used Study 1 to 3
UCLA Loneliness Scale (Russell 1996)
The following statements describe how people sometimes feel. For each statement, please
indicate how often you feel the way described.
1. I feel in tune with the people around me
2. I lack companionship
3. There is no one I can turn to
4. I do not feel alone
5. I feel part of a group of friends
6. I have a lot in common with the people around me
7. I am no longer close to anyone
8. My interests and ideas are not shared by those around me
9. I am an outgoing person
10. There are people I feel close to
11. I feel left out
12. My social relationships arc superficial
13. No one really knows me well
14. I feel isolated from others
15. I can find companionship when I want it
16. There are people who really understand me
17. I am unhappy being so withdrawn
18. People are around me but not with me
203
19. There are people I can talk to
20. There are people I can turn to
1 = never, 2 = rarely, 3 = sometimes, 4 = often
Items 1, 5, 6, 9, 10, 15, 16, 19, 20 are all reverse scored.
Need for touch scale (Peck and Childers 2003)
1. When walking through stores, I can’t help touching all kinds of products.
2. Touching products can be fun.
3. I place more trust in products that can be touched before purchase.
4. I feel more comfortable purchasing a product after physically examining it.
5. When browsing in stores, it is important for me to handle all kinds of products.
6. If I can’t touch a product in the store, I am reluctant to purchase the product.
7. I like to touch products even if I have no intentions of buying them.
8. I feel more confident making a purchase after touching a product.
9. When browsing in stores, I like to touch lots of products.
10. The only way to make sure a product is worth buying is to actually touch it.
11. There are many products that I would only buy if I could handle them before purchase.
12. I find myself touching all kinds of products in stores.
1 = strongly disagree, 7 = strongly agree
Items 1, 2, 5, 7, 9, 12 measure autotelic need for touch
Items 3, 4, 6, 8, 10, 11 measure instrumental need for touch
Comfort with interpersonal touch scale (Webb and Peck 2015)
1. I consider myself to be a more ‘touchy’ person than most of my friends.
2. I feel more comfortable initiating touch than most people.
204
3. When talking to people, I often touch them on the arm.
4. I don't mind if someone touches my arm.
5. During conversation, I don't mind if people touch me.
6. I typically don't mind receiving touch from another person.
1 = strongly disagree, 7 = strongly agree
Items 1 to 3 measure comfort with initiating touch whereas items 4 to 6 measure comfort with
receiving touch.
Generalized trust scale (Yamagishi and Yamagishi 1994)
1. Most people are basically honest.
2. Most people are trustworthy.
3. Most people are basically good and kind.
4. Most people are trustful of others.
5. I am trustful.
6. Most people will respond in kind when they are trusted by others.
1 = strongly disagree, 7 = strongly agree
In-store haptic interaction, Study 1
SHOPPING EXPERIENCE STUDY
In this next study, we are interested in understanding consumers preferences regarding several
aspects of their shopping experiences in store. There are no right or wrong answers, simply
answer as honestly as you can.
When I shop in a store…
1. I like when a store is designed to encourage sales personnel to approach customers.
2. I like when a store is designed to encourage customers to touch products.
205
3. I like when a store is designed to neatly display products in Plexiglas cases. (R)
4. I like when a store is designed to encourage customers to interact with each other.
In-store haptic interaction, Study 2
SHOPPING EXPERIENCE STUDY
In this next study, we are interested in understanding what consumers like (and don’t like) about
various aspects of in-store shopping. Please read each statement below and indicate your level of
agreement or disagreement.
1. I like when a store is designed to encourage sales personnel to approach customers.
2. I enjoy interacting with salespeople.
3. I like when a store is designed to encourage customers to touch products.
4. I like when a store is designed to encourage customers to try products.
5. I like when a store is designed to neatly display products in glass cases. (R)
6. I actively seek advice from salespeople.
7. I like when a store is designed to encourage customers to interact with each other.
8. I dislike being in a crowded area. (R)
9. I like to browse touch screen devices to obtain additional product information.
10. I like to chat with sales personnel to obtain additional product information.
Online vs. offline shopping preferences, Study 2
In this next study, we are interested understanding what consumers like and don’t like about
online vs. offline shopping. All other things being equal (price, assortment, availability…), when
I have to purchase something I would…
i. 1 = definitely go to a store, 7 = definitely browse a website
ii. 1 = definitely buy it offline, 7 = definitely buy it online
206
Below is a list of shopping attributes. Please rate each one in terms of which you think is better
in terms of the online vs. offline shopping experience.
1. Shopping enjoyment
2. Quickness of shopping
3. Selection
4. Price
5. Product quality ascertainment
6. Personalized advice
7. Product exchange
8. Customer service interaction
1 = shopping offline is much better; 9 = shopping online is much better
Preference for haptic-related product name, Study 2
Chocolatier wants to launch a new chocolate praline: "A chewy-soft center of premium caramel
enrobed in milk chocolate." Based on its description, which one of the two names below would
you choose for this new praline?
A. Milk Caramel Embrace (haptic-related product name)
B. Milk Caramel Vortex (non-haptic-related product name)
In-store haptic interaction, Study 3
SHOPPING EXPERIENCE STUDY
In this study, we are interested in understanding how likely you are to respond to various aspects
of in-store shopping now. We would like you to read several selected short scenarios and to
imagine that each scenario is true. Do your best to pretend that you are actually in the scenario.
Then answer each question as if you were in the scenario at this very moment.
207
Imagine that you are looking for a new item at a department store right now...
1. Imagine that you want to ask some questions about a new item to a salesperson near you.
How likely are you to tap a salesperson on the shoulder to get her/his attention at this
moment? [functional, initiating]
2. Imagine that a salesperson helps you find a product that you need and s/he touches you
on the arm to show it to you because you can’t see it. How likely are you to be bothered
when the salesperson touches you at this moment? (R) [functional, receiving]
3. Imagine that a salesperson drops something and cannot be reached/warned otherwise
(e.g., he/she is wearing headphones). How likely are you to tap the salesperson on the
shoulder at this moment? [functional, initiating]
4. Imagine that a salesperson accidentally bumps into you while you are shopping. How
likely are you to be bothered by it at this moment? (R) [imposed, receiving]
5. Imagine that a salesperson helps you take your size measurements (e.g., tailors a suit,
measures your waist). How likely are you to be bothered by the salesperson touching you
at this moment? (R) [functional, receiving]
6. Imagine that you are passing through an extremely crowded shopping aisle where
salespeople are arranging products on the shelves. How likely are you to gently touch a
salesperson on the back to make them move aside for you to pass at this
moment? [functional, initiating]
7. Imagine that you ask a salesperson of your same sex to help you wear something (e.g.,
zip a dress, knot a tie). How likely are you to feel uncomfortable at this moment? (R)
[functional, receiving]
8. Imagine that a salesperson approaches you to ask if you’re aware of a sale that’s going on
208
right now. As she's/he’s telling you about the sale, she/he touches you on the arm. How
likely are you to feel uncomfortable at this moment? (R) [imposed, receiving]
9. Imagine that you are talking to a salesperson in a store, and he/she says there is the
perfect product for you just around the corner. Once you examine it, you thank the
salesperson for the help, and he/she gives you a pat on the back in return. How likely are
you to feel uncomfortable at this moment? (R) [imposed, receiving]
10. Imagine that you are trying to figure out your way around this new unfamiliar store. How
likely are you to appreciate the fact that relevant isles are clearly marked at this moment?
11. Imagine that you are trying to find a specific product. How likely are to you appreciate
the fact that the retailer has a small assortment to choose from at this moment?
12. Imagine that there is a long cue at checkout. How likely are to use self-service check-out
lanes at this moment?
13. Imagine that you are unsure about a product price. How likely are you to use the retailer's
bar-code scanners to confirm product prices at this moment?
14. Imagine that you are unsure about which product to choose. How likely are you to look
for product reviews on your smartphone at this moment?
15. Imagine that you have been waiting in line at checkout for more than 10 minutes. How
likely are you to be bothered by it at this moment?
16. Imagine that you are unsure about which product to choose. How likely are you to find it
annoying if a salesperson cannot answer one of your product questions at this moment?
1 = not at all likely, 7 = very much likely
Items 1 to 9 refer to functional or imposed in-store touch interactions
Items 10 to 16 refer to non-touch in-store touch interactions (filler items)
209
Appendix B. Ancillary Measures
Contamination Cognitions Scale (CSS; Deacon and Olatunji 2007), Study 1
Below is a list of objects. Please read the description of each object and try to imagine what
would happen if you touched that object and were unable to wash your hands afterward. For each
object listed, answer two questions:
1. What is the likelihood that touching the object would result in your being contaminated?
Answer using the following 0-100 scale:
0 = not at all likely, 50 = moderately likely, 100 = extremely likely
2. If you actually did become contaminated by touching the object, how bad would it be?
Answer using the following 0-100 scale:
0 = not at all bad, 50 = moderately bad, 100 = extremely bad
1. Toilet handle in public restroom*
2. Toilet seat in public restroom
3. Sink faucet in public restroom
4. Public door handles*
5. Public workout equipment*
6. Public telephone receivers
7. Stairway railings
8. Elevator buttons*
9. Animals
10. Raw meat
11. Money*
12. Unwashed produce (e.g., fruits, vegetables)
210
13. Foods that other people have touched*
Note. Only a subset of these objects was used in Study 1 (*)
Domain-specific risk-taking scale (DOSPERT; Blais and Weber 2006), Study 1
For each of the following statements, please indicate the likelihood that you would engage in the
described activity or behavior if you were to find yourself in that situation.
1. Admitting that your tastes are different from those of a friend. (S)*
2. Going camping in the wilderness. (R)
3. Betting a day’s income at the horse races. (F)
4. Investing 10% of your annual income in a moderate growth mutual fund. (F)
5. Drinking heavily at a social function. (H/S)
6. Taking some questionable deductions on your income tax return. (E)
7. Disagreeing with an authority figure on a major issue. (S)*
8. Betting a day’s income at a high-stake poker game. (F)
9. Having an affair with a married man/woman. (E)
10. Passing off somebody else’s work as your own. (E)
11. Going down a ski run that is beyond your ability. (R)
12. Investing 5% of your annual income in a very speculative stock. (F)
13. Going whitewater rafting at high water in the spring. (R)
14. Betting a day’s income on the outcome of a sporting event (F)
15. Engaging in unprotected sex. (H/S)
16. Revealing a friend’s secret to someone else. (E)
17. Driving a car without wearing a seat belt. (H/S)
18. Investing 10% of your annual income in a new business venture. (F)
211
19. Taking a skydiving class. (R)
20. Riding a motorcycle without a helmet. (H/S)
21. Choosing a career that you truly enjoy over a more secure one. (S)*
22. Speaking your mind about an unpopular issue in a meeting at work. (S)*
23. Sunbathing without sunscreen. (H/S)
24. Bungee jumping off a tall bridge. (R)
25. Piloting a small plane. (R)
26. Walking home alone at night in an unsafe area of town. (H/S)
27. Moving to a city far away from your extended family. (S)*
28. Starting a new career in your mid-thirties. (S)*
29. Leaving your young children alone at home while running an errand. (E)
30. Not returning a wallet you found that contains $200. (E)
Note. E = Ethical, F = Financial, H/S = Health/Safety, R = Recreational, and S = Social.
Note. Only a subset of these objects was used in Study 1 corresponding to the social risk-taking
items (*)
Preference for anthropomorphic product, Study 2
CHOCOLATE COMPANY PILOT STUDY
In this study, we are interested in understanding consumer preferences for chocolate products.
Chocolatier is a Belgian chocolate manufacturer that competes with other companies primarily
on the basis of responding to changes in consumer preferences. For this reason, its managers
often pilot-test consumers' preferences for new products they are willing to introduce on the
market. On the next pages, you will be asked to express your preferences for new products and
new products name that the company is willing to produce and adopt.
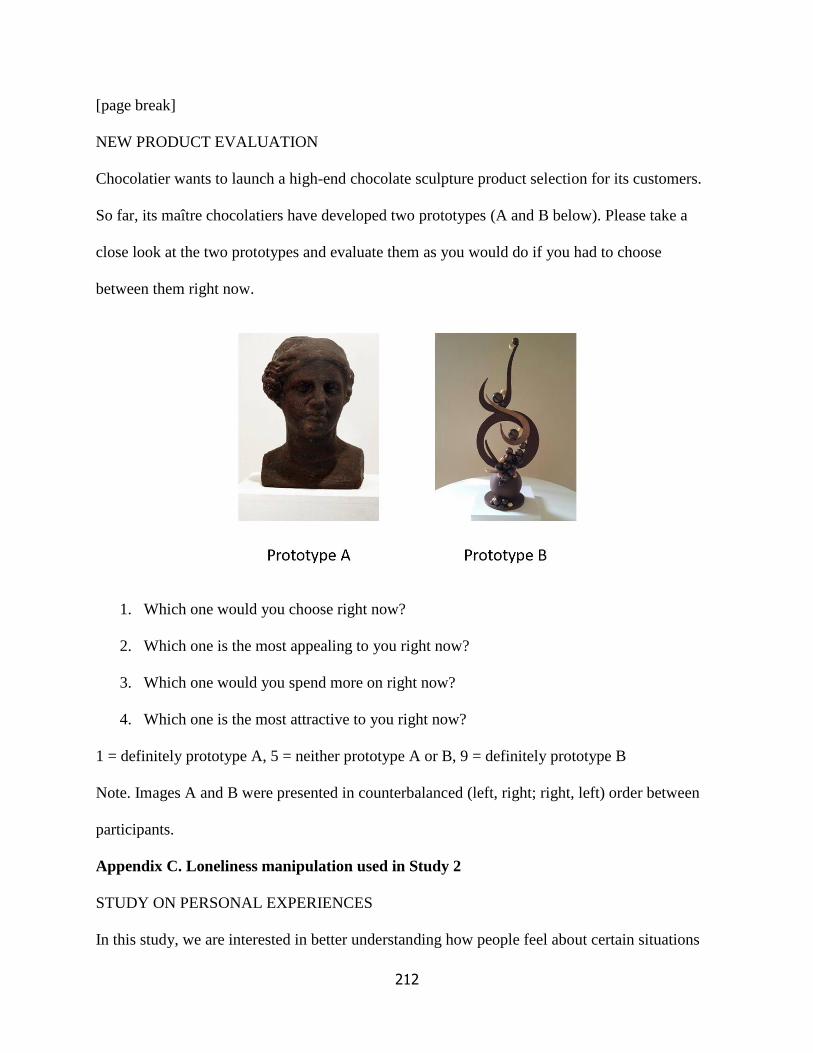
212
[page break]
NEW PRODUCT EVALUATION
Chocolatier wants to launch a high-end chocolate sculpture product selection for its customers.
So far, its maître chocolatiers have developed two prototypes (A and B below). Please take a
close look at the two prototypes and evaluate them as you would do if you had to choose
between them right now.
1. Which one would you choose right now?
2. Which one is the most appealing to you right now?
3. Which one would you spend more on right now?
4. Which one is the most attractive to you right now?
1 = definitely prototype A, 5 = neither prototype A or B, 9 = definitely prototype B
Note. Images A and B were presented in counterbalanced (left, right; right, left) order between
participants.
Appendix C. Loneliness manipulation used in Study 2
STUDY ON PERSONAL EXPERIENCES
In this study, we are interested in better understanding how people feel about certain situations
213
that they encounter in everyday life. To accomplish this, you will be asked to recall and write
about a particular personal experience and the emotions relating to a particular topic. The topic
you receive will be randomly selected from a set. It is very important that you are both accurate
and informative. Thus, please make a strong effort. When you are ready, please click on the
"Continue" button below.
[control group]
For this task, we are interested in how you would describe walking around the grocery store.
That is, think of what it is like to walk around the grocery store and spend a few minutes writing
about the experience. Don’t worry about spelling or grammar; just write down as much detail
about the experience as possible.
[loneliness group]
For this task, we are interested in how people describe the experience of feeling lonely. Think of
a time when you felt lonely and spend a few minutes writing about the experience. Don’t worry
about spelling or grammar; just write down as much detail about the experience as possible.
Appendix D. Trust boost manipulation pretest, Study 3
We pretested two different texts for the trust boost manipulation and we selected the best one
based on the manipulation check results. Note. In the main study (Study 3), we used option A.
VERBAL APTITUDE TASK
Verbal aptitude tasks assess a person's ability to understand word meanings, understand word
relationships and interpret detailed written information. On the following page, you will be asked
to read and comprehend a randomly selected newspaper article as well as to write supporting
arguments about its main claim.
214
[trust boost option A]
Selected article: PEOPLE ARE MORE TRUSTWORTHY THAN WE THINK
How do people come to believe that others are so much less trustworthy than themselves? Much
as we might prefer otherwise, there’s solid evidence that, on average, people are quite cynical.
But is this cynicism justified? Psychological research suggests not. Rather, most of us have what
researchers describe as naïve cynicism, that is cynicism that is misguided.
When thinking about strangers, studies have shown that people think others are more selfishly
motivated than they really are and that others are less helpful than they really are. Researchers at
Columbia University tested people’s estimation of how likely would strangers help them out on a
variety of tasks and they found that participants underestimated how likely would others help
them by as much as 100 percent.
Similarly, in financial games studies that psychologists conducted, people are remarkably
cynical about the trustworthiness of others. In one experiment people honored the trust placed in
them between 80 and 90 percent of the time, but only estimated that others would honor their
trust about 50 percent of the time.
Finally, in another study, researchers asked participants to predict what would happen if they
gave money to a stranger who then had the option to either split the cash with them or keep it.
The givers thought the receivers would share the money around 45 percent of the time, but the
actual number was nearly 80 percent of the time.
For the next three minutes, please write in support of this position. Explain the merits of this
position (i.e., why people are more trustworthy than we think), and give an example of a time in
which you trusted another person and you benefited from it.
215
[trust boost option B]
Selected article: TRUSTING OTHERS IS GOOD
Human beings need to trust. Trust makes it possible to consistently invest interest and enjoyment
in one another. There could be no civilization, enduring health, or mental wellness without trust.
The most ordinary interpersonal, commercial, medical, and legal interactions would be
impossible without some degree of trust.
There are several benefits of trusting that contributes to people's overall happiness and state of
wellbeing, including a decrease in anxiety levels. Trust also enables people to live in the
moment, enjoying the people and situations surrounding them. Research suggests that people
who trust are less likely to lie or to be unhappy and more likely to be sought out as a friend.
Moreover, in a recent study conducted by the British Medical Journal, interpersonal trust has
been found to exert protective effects on health. A growing body of studies has shown that
higher levels of trust are associated with better health, lower mortality, and better wellbeing.
Moreover, lower levels of trust are associated with higher rates of most major causes of death,
including heart disease, cancers, and violent deaths, and have preceded a change from good
health to poor health, along with a decline in happiness.
For the next three minutes, please write in support of this position. Explain the merits of this
position (i.e., why it is the best to trust others), and give an example of a time in which you
trusted another person and you benefited from it.
216
[control group]
Selected article: SHELF EFFACEMENT: HOW NOT TO ORGANISE YOUR
BOOKSHELVES
Talk about spineless: the new trend in home decor is backward-looking – literally. If you’re in
search of a storage solution that won’t mar the boring – sorry “neutral” – look of a beige colour
scheme, simply turn your books spines in, pages out. Back in October, design blog Apartment
Therapy shared one of these backwards bookshelves on its Instagram account, with advice for
emulating the look. (“Books don’t match your decor? Don’t fret … Flip them for a perfectly
coordinated look.”) US morning show Today called it “a beautiful thing to try,” and, naturally,
it’s all over Pinterest. I’m not against incorporating books into a decorating scheme.
Organising them by colour so that shelves resemble a rainbow is cheerful, and I also love the
inventiveness of making a low-cost Christmas “tree” out of books. But those shelving methods
add colour and interest to a person’s life – much like literature – rather than treating books as
nothing more than wallpaper.
For the next three minutes, please write in support of this position. Explain the merits of this
position (i.e., why flipping books to match a neutral home décor is boring) and give an example
of a trending habit that you do not approve of. (Please note that after three minutes you will be
able to click to the next page)
[manipulation check]
STUDY ON GENERAL ATTITUDES
In this study, we are interested in the attitudes and opinions of people on a wide range of topics.
Below is a list of statements. Please read through each item carefully and let us know your
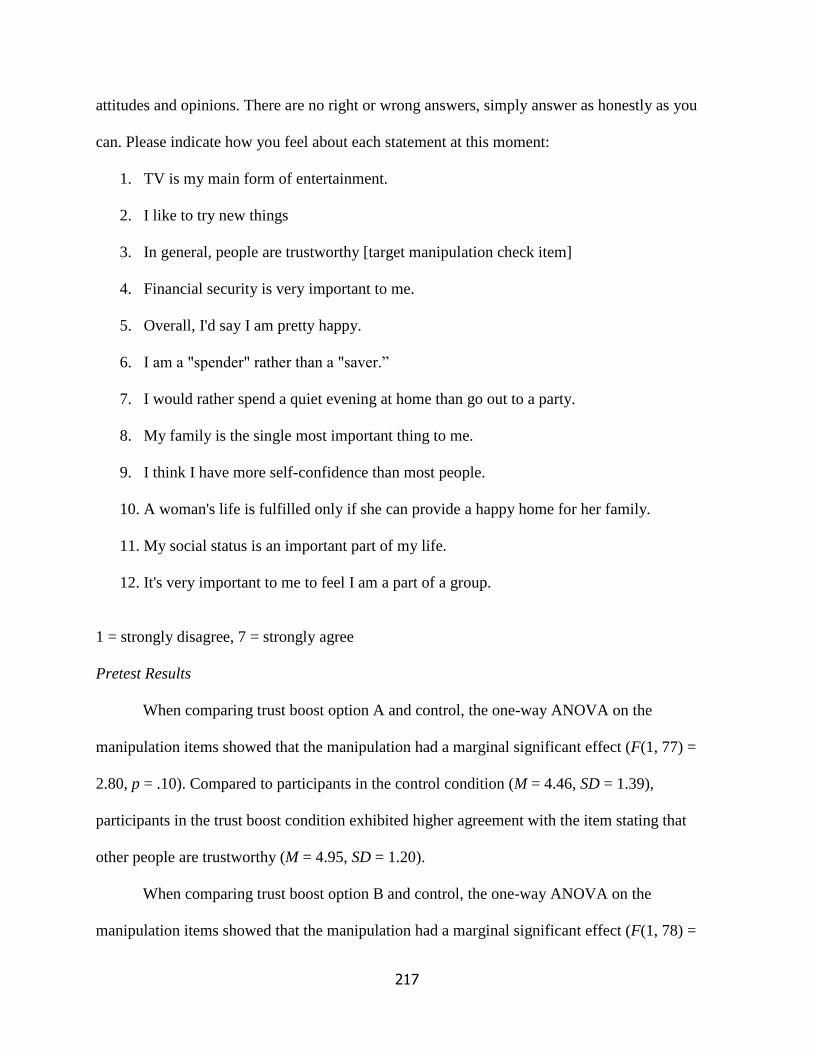
217
attitudes and opinions. There are no right or wrong answers, simply answer as honestly as you
can. Please indicate how you feel about each statement at this moment:
1. TV is my main form of entertainment.
2. I like to try new things
3. In general, people are trustworthy [target manipulation check item]
4. Financial security is very important to me.
5. Overall, I'd say I am pretty happy.
6. I am a "spender" rather than a "saver.”
7. I would rather spend a quiet evening at home than go out to a party.
8. My family is the single most important thing to me.
9. I think I have more self-confidence than most people.
10. A woman's life is fulfilled only if she can provide a happy home for her family.
11. My social status is an important part of my life.
12. It's very important to me to feel I am a part of a group.
1 = strongly disagree, 7 = strongly agree
Pretest Results
When comparing trust boost option A and control, the one-way ANOVA on the
manipulation items showed that the manipulation had a marginal significant effect (F(1, 77) =
2.80, p = .10). Compared to participants in the control condition (M = 4.46, SD = 1.39),
participants in the trust boost condition exhibited higher agreement with the item stating that
other people are trustworthy (M = 4.95, SD = 1.20).
When comparing trust boost option B and control, the one-way ANOVA on the
manipulation items showed that the manipulation had a marginal significant effect (F(1, 78) =
218
.14, p = .71). Compared to participants in the control condition (M = 4.46, SD = 1.39),
participants in the trust boost condition did not exhibit higher agreement with the item stating
that other people are trustworthy (M = 4.59, SD = 1.58).
Based on the above results, we decided to use option A for our main study.
Appendix E. Comfort with in-store haptic interaction measure pretest, Study 3
SHOPPING SCENARIOS STUDY
In this study, we would like you to read several short scenarios depicting situations you might
encounter while shopping in a department store and to answer a few questions about them.
When you are ready, please click on continue.
>>
Consider the following situations in which you are looking for a new item at a department store
right now.
[participants were shown each scenario on a separate page]
1. Imagine that you want to ask some questions about a new item to a salesperson near you.
You tap a salesperson on the shoulder to get her/his attention.
2. Imagine that a salesperson helps you find a product that you need, and s/he touches you
on the arm to show it to you.
3. Imagine that a salesperson drops something and cannot be reached/warned otherwise
(e.g., he/she is wearing headphones) so you tap him/her on the shoulder to do so.
4. Imagine that a salesperson accidentally bumps into you while you are shopping.
5. Imagine that a salesperson helps you take your size measurements (e.g., tailors a suit,
measures your waist).
6. Imagine that you are passing through an extremely crowded shopping aisle where
219
salespeople are arranging products on the shelves. To make them move aside for you to
pass, you gently touch a salesperson on the back.
7. Imagine that you ask a salesperson of your same sex to help you wear something (e.g.,
zip a dress, knot a tie).
8. Imagine that a salesperson approaches you to ask if you’re aware of a sale that’s going on
right now. As he’s telling you about the sale, he touches you on the arm.
9. Imagine that you are talking to a salesperson in a store, and he/she says there is the
perfect product for you just around the corner. Once you examine it, you thank the
salesperson for the help, and he/she gives you a pat on the back in return.
10. Imagine that you are trying to figure out your way around this new unfamiliar store and
that you begin to appreciate the fact that relevant aisles are clearly marked.
11. Imagine that you are trying to find a specific product and that you realize that is good that
the retailer does not have a huge assortment.
12. Imagine that there is a long cue at checkout and you decide to use self-service check-out
lanes.
13. Imagine that you are unsure about a product price and you use the retailer's bar-code
scanners to confirm it.
14. Imagine that you are unsure about which product to choose and you look for product
reviews on your smartphone.
15. Imagine that you have been waiting in line at checkout for more than 10 minutes.
16. Imagine that you are unsure about which product to choose and you are annoyed by the
fact that a salesperson cannot answer one of your product questions.
[participants were shown the following questions regarding each of the above scenarios]
220
The scenario wording is clear.
1 = not at all, 7 = very much
The situation described is realistic.
1 = not at all, 7 = very much
The situation described involves interpersonal touch (i.e., someone touching another person).
1 = Yes, 2 = No
The situation described involves receiving interpersonal touch (i.e., being touched by another
person).
1 = not at all, 7 = very much
The situation described involves initiating interpersonal touch (i.e., touching another person).
1 = not at all, 7 = very much
The situation described involves interpersonal touch that is intimate/relational, meaning that it
serves a relationship closeness goal (e.g., holding someone’s hand to comfort him/her).
1 = not at all, 7 = very much
The situation described involves interpersonal touch that is functional, meaning that it serves a
non-relational goal (e.g., airport security screening to catch a flight).
1 = not at all, 7 = very much
The situation described involves interpersonal touch that is imposed, meaning that it undesired
and/or not personally selected (e.g., being inadvertently touched in crowded public transport).
1=not at all; 7=very much
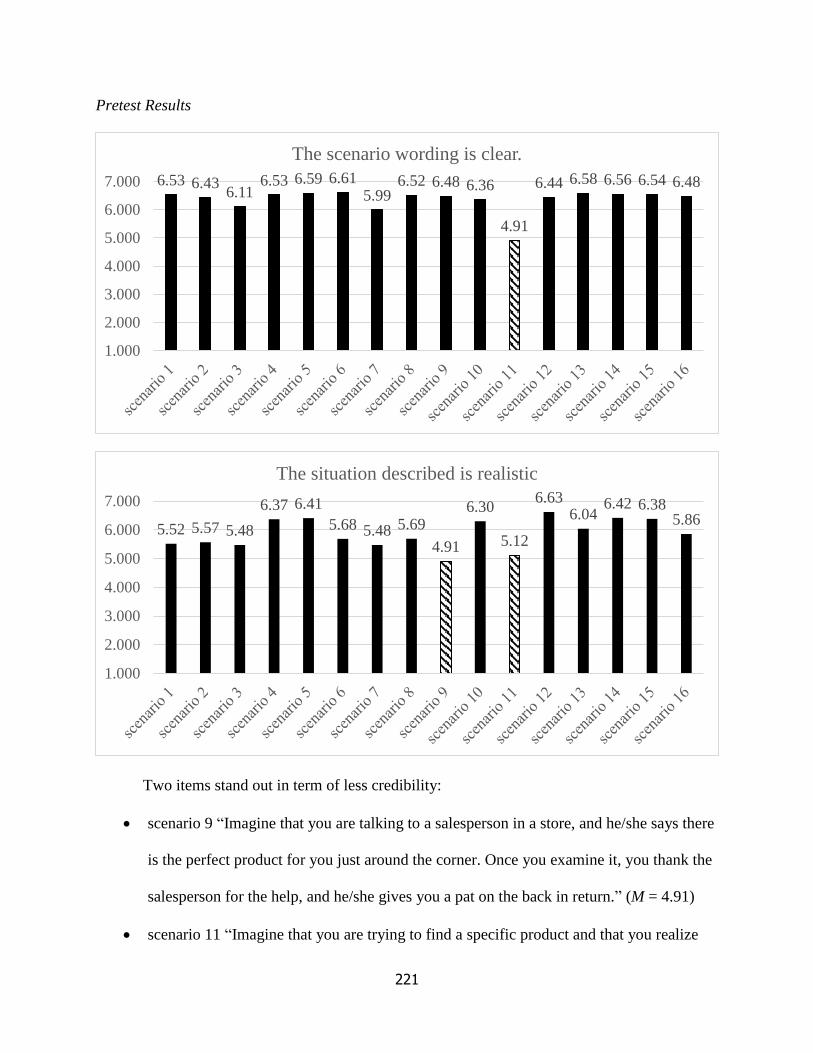
221
Pretest Results
Two items stand out in term of less credibility:
• scenario 9 “Imagine that you are talking to a salesperson in a store, and he/she says there
is the perfect product for you just around the corner. Once you examine it, you thank the
salesperson for the help, and he/she gives you a pat on the back in return.” (M = 4.91)
• scenario 11 “Imagine that you are trying to find a specific product and that you realize
6.53 6.436.11
6.53 6.59 6.615.99
6.52 6.48 6.36
4.91
6.44 6.58 6.56 6.54 6.48
1.000
2.000
3.000
4.000
5.000
6.000
7.000
The scenario wording is clear.
5.52 5.57 5.48
6.37 6.41
5.68 5.48 5.69
4.91
6.30
5.12
6.636.04
6.42 6.385.86
1.000
2.000
3.000
4.000
5.000
6.000
7.000
The situation described is realistic
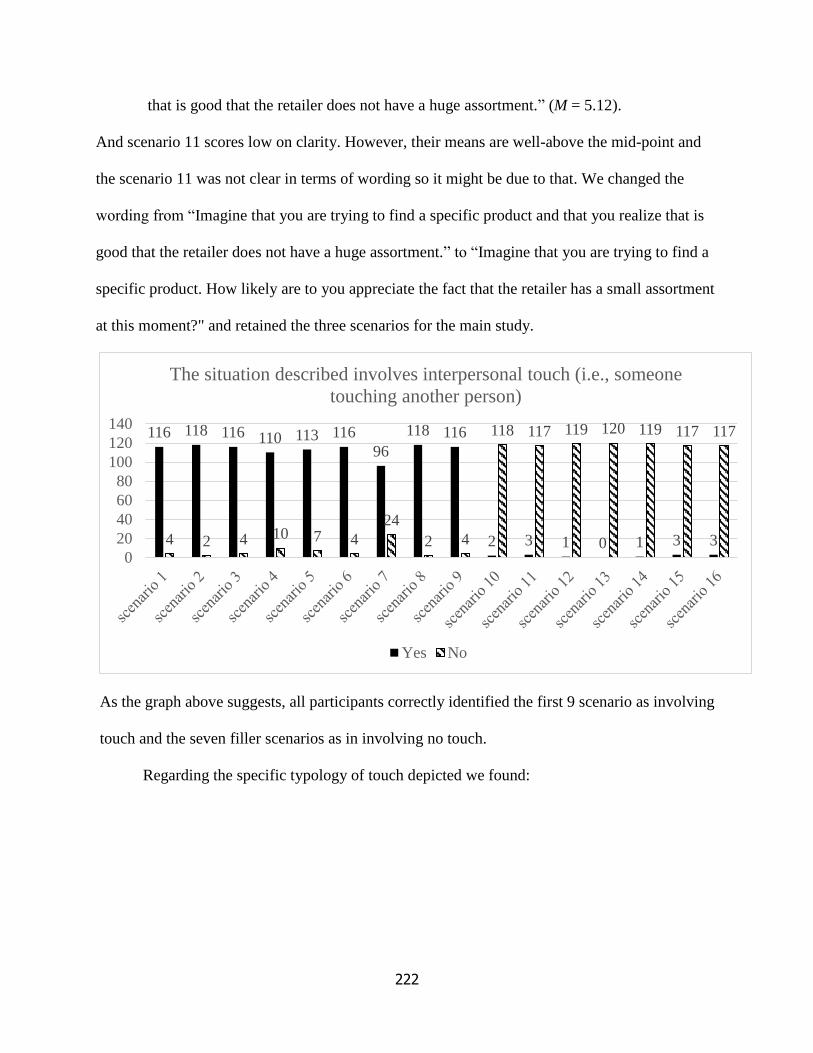
222
that is good that the retailer does not have a huge assortment.” (M = 5.12).
And scenario 11 scores low on clarity. However, their means are well-above the mid-point and
the scenario 11 was not clear in terms of wording so it might be due to that. We changed the
wording from “Imagine that you are trying to find a specific product and that you realize that is
good that the retailer does not have a huge assortment.” to “Imagine that you are trying to find a
specific product. How likely are to you appreciate the fact that the retailer has a small assortment
at this moment?" and retained the three scenarios for the main study.
As the graph above suggests, all participants correctly identified the first 9 scenario as involving
touch and the seven filler scenarios as in involving no touch.
Regarding the specific typology of touch depicted we found:
116 118 116 110 113 116
96
118 116
2 3 1 0 1 3 34 2 4 10 7 4
24
2 4
118 117 119 120 119 117 117
0
20
40
60
80
100
120
140
The situation described involves interpersonal touch (i.e., someone
touching another person)
Yes No
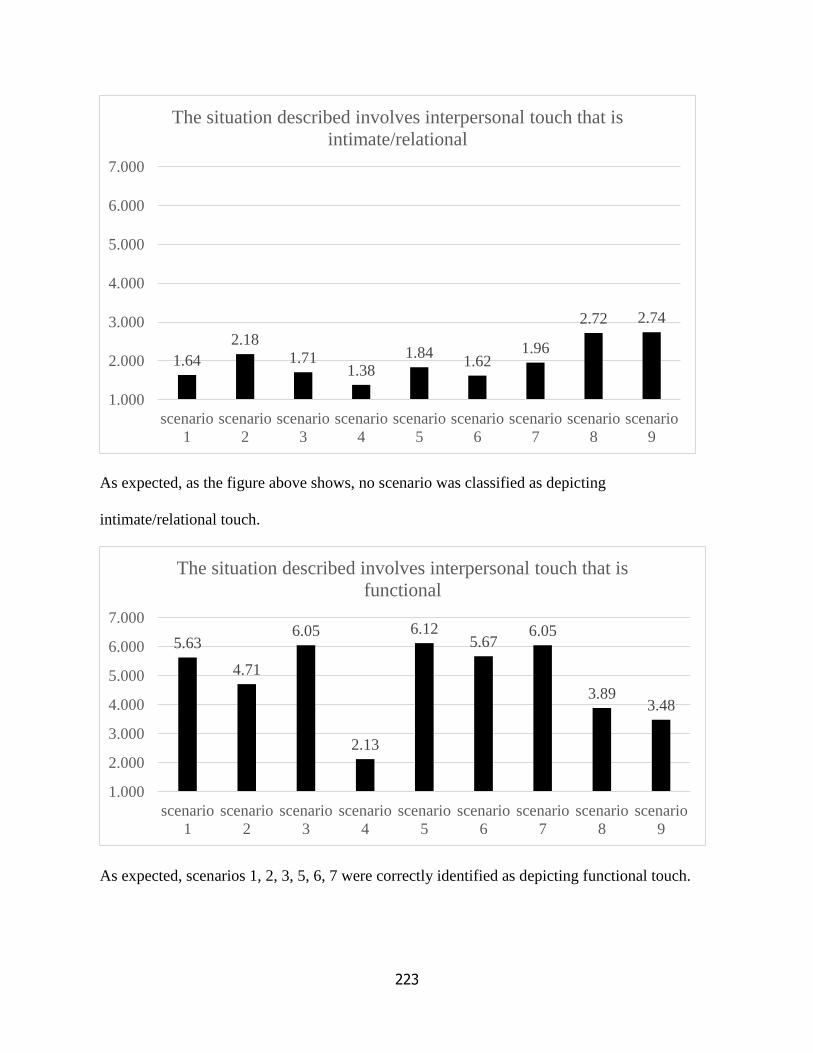
223
As expected, as the figure above shows, no scenario was classified as depicting
intimate/relational touch.
As expected, scenarios 1, 2, 3, 5, 6, 7 were correctly identified as depicting functional touch.
1.64
2.18
1.711.38
1.841.62
1.96
2.72 2.74
1.000
2.000
3.000
4.000
5.000
6.000
7.000
scenario
1
scenario
2
scenario
3
scenario
4
scenario
5
scenario
6
scenario
7
scenario
8
scenario
9
The situation described involves interpersonal touch that is
intimate/relational
5.63
4.71
6.05
2.13
6.125.67
6.05
3.893.48
1.000
2.000
3.000
4.000
5.000
6.000
7.000
scenario
1
scenario
2
scenario
3
scenario
4
scenario
5
scenario
6
scenario
7
scenario
8
scenario
9
The situation described involves interpersonal touch that is
functional
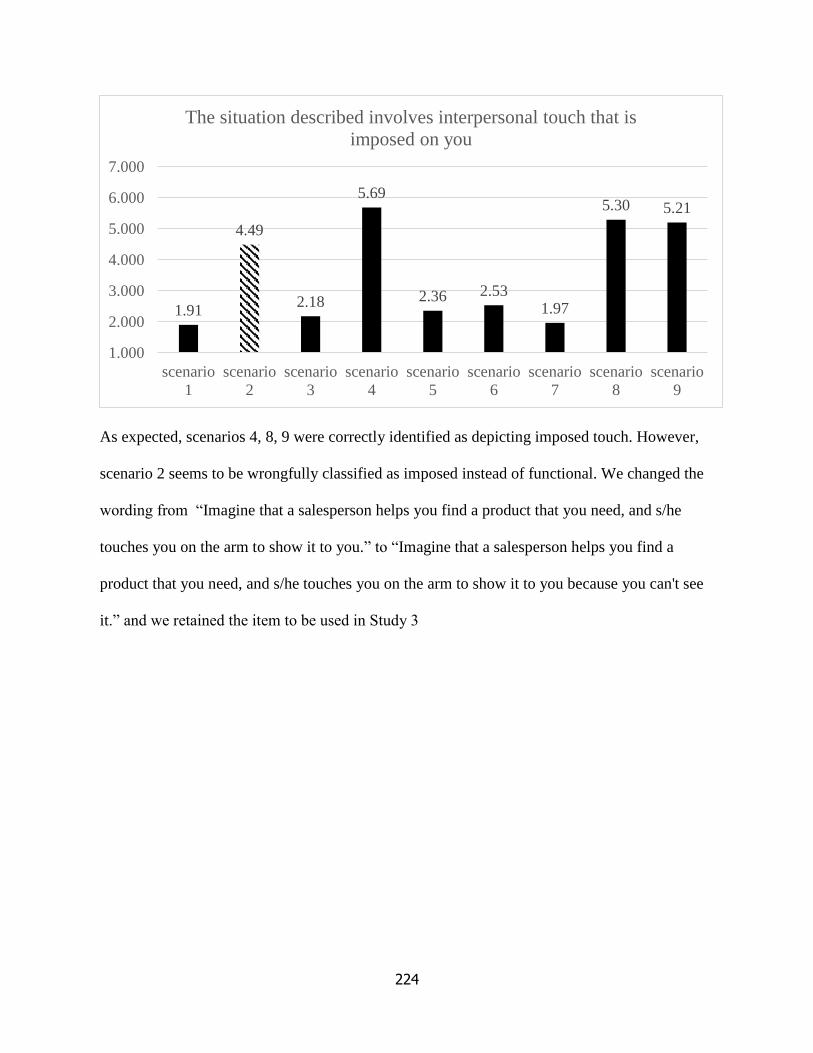
224
As expected, scenarios 4, 8, 9 were correctly identified as depicting imposed touch. However,
scenario 2 seems to be wrongfully classified as imposed instead of functional. We changed the
wording from “Imagine that a salesperson helps you find a product that you need, and s/he
touches you on the arm to show it to you.” to “Imagine that a salesperson helps you find a
product that you need, and s/he touches you on the arm to show it to you because you can't see
it.” and we retained the item to be used in Study 3
1.91
4.49
2.18
5.69
2.36 2.531.97
5.30 5.21
1.000
2.000
3.000
4.000
5.000
6.000
7.000
scenario
1
scenario
2
scenario
3
scenario
4
scenario
5
scenario
6
scenario
7
scenario
8
scenario
9
The situation described involves interpersonal touch that is
imposed on you
225
Capitolo 4 GENERAL CONCLUSION
To conclude, with my three essays, I examine how consumers react to aversive stimuli in
ways that were not foreseen and how consumers’ characteristics might affect whether a stimulus
is deemed aversive. Understanding what motivates unconscious behaviors in various
consumption domains has important implications for how marketers design their initiatives and
for consumers’ generalized well-being.
The first essay focused on how feelings of physical and moral disgust can be threatening
to a consumer’s sense of self and motivate them to engage in compensatory consumption.
Through a single-paper meta-analysis based on the results of eight individual experiments using
multiple manipulations and measures, I show that that physical disgust decreases consumers’
sense of power, which prompts them to consume conspicuous goods in an effort to restore their
feelings of power. In contrast, moral disgust decreases consumers’ sense of belonging, causing
them to act prosocially, in order to restore their sense of belongingness. Marketers often employ
such strong images to scare consumers or to break through the advertising clutter; my research
provides new insight into the specific subconscious behavioral consequences such aversive
images entail.
The second essay explored how consumers react when firms stop offering them
unconditional gifts. Generally, firms spoil their customers to elicit feelings of gratitude, but my
findings show that past the first time they receive a gift, a sense of entitlement (i.e., “I deserve
this”) builds up and overcomes gratefulness. Four experiments demonstrate that ending
unconditional business-to-consumer gift-giving initiatives puts firms at greater risk of retaliation
from the customers they spoiled. Offering valuable gifts repeatedly and regularly increases
customers’ sense of entitlement, which triggers negative behavioral intentions towards the firm
226
when gifting ends (e.g., boycotting, buying from competitors, spread negative WOM). Beyond
its theoretical contribution, this research offers managerial insights on how to design a
promotional program that can avoid elevating customer entitlement and prevent customer
negative behavioral intentions upon termination.
Finally, the third essay examines how loneliness affects consumers’ preferences for
products and services that do or do not require interpersonal touch and interaction (e.g., getting a
massage vs. shopping online). Common wisdom might suggest that feeling lonely would prompt
individuals to seek reconnection with others, namely through touching or being touched.
However, I show that chronically lonely individuals shy away from interpersonal interactions
involving touch. Because chronic loneliness creates a negative-feedback loop that reinforces
loneliness, lonely participants report lower levels of interpersonal trust and report feeling less
comfortable touching and being touched by others. In the consumer domain, I show that this
discomfort spills over to in-store interaction with salespeople and other customers. My findings
provide evidence that there are instances in which marketers’ investments in customer interaction
and haptics might be unwarranted.
227
Titre : L’influence des états aversifs sur le comportement du consommateur
Mots clés : aversion, dégoût, droit des consommateurs, solitude, comportements non
intentionnels
Résumé : Dans cette thèse, j’examine
l’influence d’états aversifs (e.g., émotions
désagréables, issues indésirables) sur les
motivations et les comportements des
consommateurs. Dans le premier essai, j’explore
comment des sentiments de dégoût physique ou
moral peuvent mettre en péril l’estime de soi des
consommateurs et les motiver à se livrer à de la
consommation compensatrice. Dans le deuxième
essai, j’examine pourquoi et à quels moments les
consommateurs font preuve de sentiments
négatifs à l’égard des entreprises qui cessent de
distribuer gratuitement des échantillons ou petits
cadeaux aux consommateurs. Dans le troisième
essai, j’explore comment la solitude affecte les
préférences des consommateurs pour des
produits et services qui peuvent ou non nécessiter
des interactions interpersonnelles
(ex : se faire masser vs. faire des achats en ligne).
Considérés ensemble, ces trois essais contribuent
à la littérature sur l’émotion, les menaces
identitaires, et la consommation compensatrice,
à la littérature sur les promotions commerciales
et à la littérature sur la solitude. De plus, les
résultats ont des implications pour les praticiens
en marketing en ce qui concerne la publicité, le
design des promotions commerciales, et
l’haptique des consommateurs. Finalement, ces
travaux de recherche offrent de nouvelles
perspectives concernant le bien-être des
consommateurs en soulignant les conséquences
inattendues des actions des marketers qui
cherchent à bénéficier aux consommateurs mais
génèrent en réalité des comportements
compensateurs pour faire face à leur aversion.
Title : Aversive States Affecting Consumer Behavior
Keywords : aversiveness, disgust, customer entitlement, loneliness, unconscious behavioral
tendencies
Abstract : In this dissertation, I examine the
influence of aversive states (e.g., unpleasant
emotions, undesired outcomes) on consumers'
motivations and behaviors. In essay 1, I explore
how feelings of physical and moral disgust can
be threatening to consumers’ sense of self and
motivate them to engage in compensatory
consumption. In essay 2, I investigate why and
when consumers exhibit negative behavioral
intentions against firms that terminate
unconditional business-to-consumer gift-giving
initiatives. In essay 3, I explore how loneliness
affects consumers’ preferences for products and
services that do or do not require interpersonal
touch and interaction (e.g., getting a massage vs.
shopping online).
Together, the three essays contribute to the
literature on emotion, identity threats, and
compensatory consumption, to the literature on
sales promotion, and to the literature on
loneliness. Moreover, the research findings
inform marketing practice in the fields of
advertising, sales promotions design, and
consumer haptics. Finally, this research
provides insights into consumer welfare by
bringing attention to the unforeseen
consequences of marketers’ actions that seek to
benefit the consumers but instead generate
compensatory behaviors to cope with their
aversiveness.
Related Documents