Avant Garde Wealth Management Pvt. Ltd. Note: “Portfolio” refers to the weighted average of all client portfolios managed by us over the relevant time period. Any metrics such as returns or portfolio weighting similarly refer to the weighted average of all portfolios. Individual clients portfolios may defer materially from the blended “Portfolio” and clients should refer to their portfolio statements for details on their portfolios Contents Consumer stocks – Quality vs. value conundrum Asset market turmoil – Impact of central bank actions Portfolio positioning – No change Stocks in the portfolio – Some minor changes in position size Portfolio performance – A tough six months Dear investor, While indices such as the Nifty and Sensex continue to oscillate within a narrow range for now, there is increasingly large dispersion of returns from various sectors. Broadly, stocks in the consumer sector, pharmaceuticals, IT, and until recently private banks, continue to perform well while most others languish. In this letter we dig a little deeper into the history of the consumer sector for insights into investment merits at current prices. In the backdrop of the US equity markets hitting new highs we explore implications of the sharp, though ultimately short lived, negative reaction in global asset markets to the comments of the Federal Reserve Chairman about “tapering”. Consumer stocks – Quality vs. value conundrum The data set for this analysis includes an unweighted basket of 25 1 consumer companies. Most of these companies can be classified as consumer staples, while some are consumer discretionary. The common characteristic is that these are high quality businesses with strong brands and pricing power, which translates into the ability to earn high ROE (return on equity). The average ROE of this basket over the last sixteen years is 32%. Due to their disproportionate size, on the most recent figures, Hindustan Unilever and ITC together comprise 57% and 51% of the total PAT (profit after tax) and Market Capitalization of the basket respectively. The graph below shows that the basket currently trades at historically high valuations. Source: Company Financials, Capital Line, BSE 1 Companies included in the basket are Hindustan Unilever, ITC, Marico, Nestle, Godrej Consumer, Dabur, Colgate, Agro Tech Foods, Jubilant Foodworks, Castrol, Titan Industries, Bata, Asian Paints, Kansai Nerolac, Berger Paints, Page Industries, Pidilitie, P&G Hygiene & Home, Gillette, United Breweries, United Spirits, TTK Prestige, Hawkins, GSK Consumer, Britannia. Data series is from April 5, 1996 to July 19, 2013 10 15 20 25 30 35 40 45 50 Apr-96 Apr-97 Apr-98 Apr-99 Apr-00 Apr-01 Apr-02 Apr-03 Apr-04 Apr-05 Apr-06 Apr-07 Apr-08 Apr-09 Apr-10 Apr-11 Apr-12 Apr-13 Consumer Basket - Trailing Twelve Month P/E Median P/E = 29 ?

Avant garde wealth mgmt - Quarterly letter - 1306
Jan 22, 2015
Investor Letter
Welcome message from author
This document is posted to help you gain knowledge. Please leave a comment to let me know what you think about it! Share it to your friends and learn new things together.
Transcript

Avant Garde Wealth Management Pvt. Ltd.
Note: “Portfolio” refers to the weighted average of all client portfolios managed by us over the relevant time period. Any metrics such asreturns or portfolio weighting similarly refer to the weighted average of all portfolios. Individual clients portfolios may defer materiallyfrom the blended “Portfolio” and clients should refer to their portfolio statements for details on their portfolios
ContentsConsumer stocks – Quality vs. value conundrumAsset market turmoil – Impact of central bank actionsPortfolio positioning – No changeStocks in the portfolio – Some minor changes in position sizePortfolio performance – A tough six months
Dear investor,
While indices such as the Nifty and Sensex continue to oscillate within a narrow range for now, thereis increasingly large dispersion of returns from various sectors. Broadly, stocks in the consumersector, pharmaceuticals, IT, and until recently private banks, continue to perform well while mostothers languish. In this letter we dig a little deeper into the history of the consumer sector forinsights into investment merits at current prices. In the backdrop of the US equity markets hittingnew highs we explore implications of the sharp, though ultimately short lived, negative reaction inglobal asset markets to the comments of the Federal Reserve Chairman about “tapering”.
Consumer stocks – Quality vs. value conundrum
The data set for this analysis includes an unweighted basket of 251 consumer companies. Most ofthese companies can be classified as consumer staples, while some are consumer discretionary. Thecommon characteristic is that these are high quality businesses with strong brands and pricingpower, which translates into the ability to earn high ROE (return on equity). The average ROE of thisbasket over the last sixteen years is 32%. Due to their disproportionate size, on the most recentfigures, Hindustan Unilever and ITC together comprise 57% and 51% of the total PAT (profit aftertax) and Market Capitalization of the basket respectively.
The graph below shows that the basket currently trades at historically high valuations.
Source: Company Financials, Capital Line, BSE
1 Companies included in the basket are Hindustan Unilever, ITC, Marico, Nestle, Godrej Consumer, Dabur, Colgate, AgroTech Foods, Jubilant Foodworks, Castrol, Titan Industries, Bata, Asian Paints, Kansai Nerolac, Berger Paints, Page Industries,Pidilitie, P&G Hygiene & Home, Gillette, United Breweries, United Spirits, TTK Prestige, Hawkins, GSK Consumer, Britannia.Data series is from April 5, 1996 to July 19, 2013
10
15
20
25
30
35
40
45
50
Apr-96 Apr-97 Apr-98 Apr-99 Apr-00 Apr-01 Apr-02 Apr-03 Apr-04 Apr-05 Apr-06 Apr-07 Apr-08 Apr-09 Apr-10 Apr-11 Apr-12 Apr-13
Consumer Basket - Trailing Twelve Month P/E
Median P/E = 29
?

Avant Garde Wealth Management Pvt. Ltd.
Note: “Portfolio” refers to the weighted average of all client portfolios managed by us over the relevant time period. Any metrics such asreturns or portfolio weighting similarly refer to the weighted average of all portfolios. Individual clients portfolios may defer materiallyfrom the blended “Portfolio” and clients should refer to their portfolio statements for details on their portfolios
The prevailing bull thesis on consumer stocks is that these are very high quality businesses thatdeliver superior earnings growth over time. Therefore it is appropriate for these stocks to be valuedat very high P/E multiples.
The following graph shows that along with high ROE the basket has also delivered high profit growth.The earnings CAGR (compound annual growth rate) from 1997 to 2013 is 17%. This compares withearnings CAGR of only 9.4% for the Sensex over this period. So the first leg of the bull thesis issupported by historical data.
Source: Company Financials, Capital Line, BSE
The historical P/E peaks in 1999 and 2006 have coincided with periods when earnings growth hasbeen strong at 20%+. Conversely the low valuations in 2002-2005 and in 2008-2009 coincided withperiods of sub-10% earnings growth. This observation is not surprising as P/E multiples are areflection of investor sentiment and generally tend to track earnings momentum. The moreinteresting conclusion flows from the following graph which plots a time series of earnings versusmarket capitalization. The key takeaway is that it is valuation and not earnings growth that is theprimary driver of equity returns.
Source: Company Financials, Capital Line, BSE
Following the P/E multiple peaks at high levels in 1999 and 2006, equity returns were poor in thefollowing years despite continuing earnings growth. After the P/E multiple peaked at 45x in 1999, in
-5%
0%
5%
10%
15%
20%
25%
30%
35%
40%
Apr-97 Apr-98 Apr-99 Apr-00 Apr-01 Apr-02 Apr-03 Apr-04 Apr-05 Apr-06 Apr-07 Apr-08 Apr-09 Apr-10 Apr-11 Apr-12 Apr-13
Consumer Basket - YoY PAT growth and ROE
YoY Profit After Tax growth PAT CAGR ('96-'13) Return on Equity
300
600
1,200
2,400
4,800
9,600
10
20
40
80
160
320
Apr-96 Apr-97 Apr-98 Apr-99 Apr-00 Apr-01 Apr-02 Apr-03 Apr-04 Apr-05 Apr-06 Apr-07 Apr-08 Apr-09 Apr-10 Apr-11 Apr-12 Apr-13
Consumer basket - Earnings vs. Market Cap
PAT (Rs.billion) LHS Market Cap (Rs.billion) RHS
Market cap change = -46%Market cap CAGR = -15.4%
PAT change = 65%PAT CAGR = 14.7%
Market cap change = -17%Market cap CAGR = -4.9%
PAT change = 54%PAT CAGR = 12.6%

Avant Garde Wealth Management Pvt. Ltd.
Note: “Portfolio” refers to the weighted average of all client portfolios managed by us over the relevant time period. Any metrics such asreturns or portfolio weighting similarly refer to the weighted average of all portfolios. Individual clients portfolios may defer materiallyfrom the blended “Portfolio” and clients should refer to their portfolio statements for details on their portfolios
the following 3.7 years market capitalization declined 47% even as earnings grew 65%. A similarpattern followed the 2006 peak in valuation. Conversely, from valuation troughs the increase inmarket capitalization has been far in excess of earnings growth.
The bull thesis on consumer stocks also highlights the relative attractiveness of these stocks. Theargument is that most other sectors are facing significant headwinds and so the positive andrelatively more certain earnings growth trajectory of consumer companies deserves a high valuationrelative to the market. The graph below shows that while relative P/E valuation for the basketversus the market is not yet at the peak reached in 1998-99, it is getting close and is well above themedian value and other interim peaks.
*Includes Sensex data till Dec 31, 1998 and Nifty data from then onSource: Company Financials, Capital Line, BSE
Again, the more interesting conclusion flows from the following graph by juxtaposing relativeearnings with relative market capitalization. Following the four peaks in relative valuation(highlighted by circles in the above graph) the consumer basket has underperformed the index overthe following months or years despite earnings growth being higher than the market.
*Includes Sensex data till Dec 31, 1998 and Nifty data from then onSource: Company Financials, Capital Line, BSE
Given that valuation, both absolute and relative, are now close to historic peak levels, there seemslittle investment merit in the consumer basket in aggregate. This is not the same as saying that stock
0.8
1.3
1.8
2.3
2.8
3.3
Apr-96 Apr-97 Apr-98 Apr-99 Apr-00 Apr-01 Apr-02 Apr-03 Apr-04 Apr-05 Apr-06 Apr-07 Apr-08 Apr-09 Apr-10 Apr-11 Apr-12 Apr-13
Consumer Basket - P/E relative to Index*
Median = 1.5
0.5
1.0
2.0
4.0
0.5
1.0
2.0
4.0
Apr-97 Apr-98 Apr-99 Apr-00 Apr-01 Apr-02 Apr-03 Apr-04 Apr-05 Apr-06 Apr-07 Apr-08 Apr-09 Apr-10 Apr-11 Apr-12 Apr-13
Consumer basket vs. Index* - Relative EPS and Relative Price
EPS of Consumer Basket vs. Index Price of Consumer Basket vs. Index

Avant Garde Wealth Management Pvt. Ltd.
Note: “Portfolio” refers to the weighted average of all client portfolios managed by us over the relevant time period. Any metrics such asreturns or portfolio weighting similarly refer to the weighted average of all portfolios. Individual clients portfolios may defer materiallyfrom the blended “Portfolio” and clients should refer to their portfolio statements for details on their portfolios
prices will start declining from here on. Valuations could keep heading higher before they eventuallyturn down. Paradoxically, higher stock prices are being driven by improving sentiment as reflected inhigher P/E multiples. However, higher prices today merely pull forward future returns, thus makingthe investment case progressively weaker even as sentiment gets progressively stronger. Thisobservation, which follows from simple math, often gets ignored when investors are cheering acertain theme and driving prices skyward.
Asset market turmoil – Impact of central bank actions
Federal Reserve Chairman Ben Bernanke’s speech on June 19 2013, following the two-day FOMC(Federal Open Market Committee) meeting, sent asset markets globally into a tailspin. Consider themoves that took place over the following week. The US dollar appreciated significantly, with therepresentative DXY Index up 2.4%. The S&P500 Index declined 4.8%. The MSCI World Index,representing global equity markets, fell 5%. The US 10-year Treasury bond yield moved up 42 basispoints, a 19% increase. Yields also spiked up across other fixed income categories globally. Gold andSilver fell 6.7% and 10% respectively. Indian equities as represented by the Nifty Index, already down5.8% from their recent peak, fell another 3.5%.
So what exactly did the FOMC minutes and the Chairman say to cause such a reaction? Tosummarize, they essentially said that if the economy improves enough, they may choose to reducethe rate of asset purchases (also referred to as tapering) starting as early as late 2013. The ongoingQE (quantitative easing) program has increased the Federal Reserve’s balance sheet from $0.9trillion in Sep 2008 to $3.5 trillion in July 2013, which is a 4x increase. Based on the current run rateof $85 billion purchases per month the balance sheet will continue to grow at $1 trillion annually.
The graph above illustrates how equity markets have reacted favourably to the Fed’s QE programover the last few years. The recent negative investor reaction to the mere possibility of a reduction
Avant Garde Wealth Management Pvt. Ltd.
Note: “Portfolio” refers to the weighted average of all client portfolios managed by us over the relevant time period. Any metrics such asreturns or portfolio weighting similarly refer to the weighted average of all portfolios. Individual clients portfolios may defer materiallyfrom the blended “Portfolio” and clients should refer to their portfolio statements for details on their portfolios
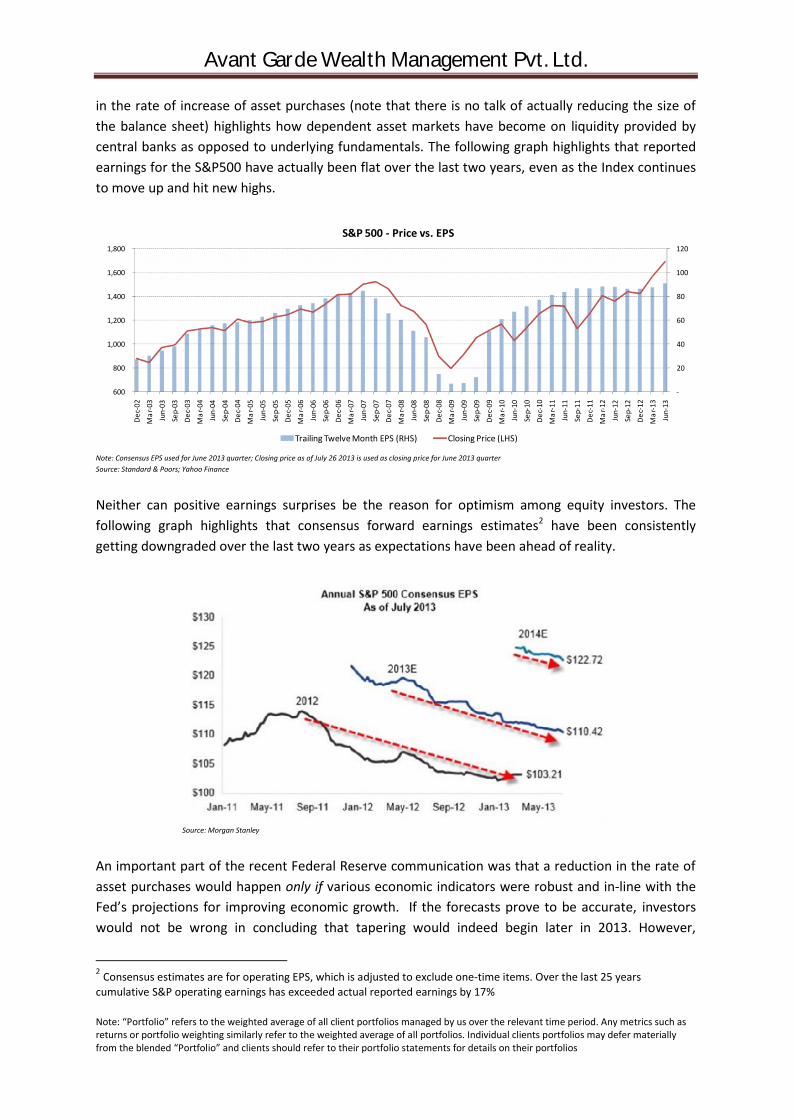
in the rate of increase of asset purchases (note that there is no talk of actually reducing the size ofthe balance sheet) highlights how dependent asset markets have become on liquidity provided bycentral banks as opposed to underlying fundamentals. The following graph highlights that reportedearnings for the S&P500 have actually been flat over the last two years, even as the Index continuesto move up and hit new highs.
Note: Consensus EPS used for June 2013 quarter; Closing price as of July 26 2013 is used as closing price for June 2013 quarterSource: Standard & Poors; Yahoo Finance
Neither can positive earnings surprises be the reason for optimism among equity investors. Thefollowing graph highlights that consensus forward earnings estimates2 have been consistentlygetting downgraded over the last two years as expectations have been ahead of reality.
Source: Morgan Stanley
An important part of the recent Federal Reserve communication was that a reduction in the rate ofasset purchases would happen only if various economic indicators were robust and in-line with theFed’s projections for improving economic growth. If the forecasts prove to be accurate, investorswould not be wrong in concluding that tapering would indeed begin later in 2013. However,
2 Consensus estimates are for operating EPS, which is adjusted to exclude one-time items. Over the last 25 yearscumulative S&P operating earnings has exceeded actual reported earnings by 17%
-
20
40
60
80
100
120
600
800
1,000
1,200
1,400
1,600
1,800
Dec-
02M
ar-0
3Ju
n-03
Sep-
03De
c-03
Mar
-04
Jun-
04Se
p-04
Dec-
04M
ar-0
5Ju
n-05
Sep-
05De
c-05
Mar
-06
Jun-
06Se
p-06
Dec-
06M
ar-0
7Ju
n-07
Sep-
07De
c-07
Mar
-08
Jun-
08Se
p-08
Dec-
08M
ar-0
9Ju
n-09
Sep-
09De
c-09
Mar
-10
Jun-
10Se
p-10
Dec-
10M
ar-1
1Ju
n-11
Sep-
11De
c-11
Mar
-12
Jun-
12Se
p-12
Dec-
12M
ar-1
3Ju
n-13
S&P 500 - Price vs. EPS
Trailing Twelve Month EPS (RHS) Closing Price (LHS)

Avant Garde Wealth Management Pvt. Ltd.
Note: “Portfolio” refers to the weighted average of all client portfolios managed by us over the relevant time period. Any metrics such asreturns or portfolio weighting similarly refer to the weighted average of all portfolios. Individual clients portfolios may defer materiallyfrom the blended “Portfolio” and clients should refer to their portfolio statements for details on their portfolios
historical data highlighted in the graph below shows that economists are very poor at forecastingaccurately.
The Federal Reserve economists have proven to be no exception. In June 2009 they projected 2011GDP growth at 4.2% and the actual figure turned out to be close to 2%. In June 2010 they projected2012 GDP growth at 4% and the actual figure came in sub 2%. So it seems fair to be sceptical whenthe same set of economists forecast a sharply improving economy from 2013 onwards...
...especially when economic indicators continue to drop and remain in a declining trend since 2010.
Source: John Hussman (www.hussmanfunds.com)

Avant Garde Wealth Management Pvt. Ltd.
Note: “Portfolio” refers to the weighted average of all client portfolios managed by us over the relevant time period. Any metrics such asreturns or portfolio weighting similarly refer to the weighted average of all portfolios. Individual clients portfolios may defer materiallyfrom the blended “Portfolio” and clients should refer to their portfolio statements for details on their portfolios
To summarize the discussion till now, the Fed’s balance sheet will continue growing but may grow ata slower rate starting late 2013 if the economy shows sufficient improvement. However, it is not atall clear that economic improvement is imminent and hence tapering may not happen any timesoon. This narrative throws up a critical question. When will the fed actually “normalize” policy andreduce the size of its balance sheet to much lower levels relative to the size of the economy. In aninterview on 60 Minutes in December 2010, Scott Pelley interviewed Fed Chairman Ben Bernankeand asked him whether he would be able to do the right thing at the right time3:
Pelley: Can you act quickly enough to prevent inflation from getting out of control?
Bernanke: We could raise interest rates in 15 minutes if we have to. So, there really is noproblem with raising rates, tightening monetary policy, slowing the economy, reducinginflation, at the appropriate time. Now, that time is not now.
Pelley: You have what degree of confidence in your ability to control this?
Bernanke: One hundred percent.
Leaving aside the fact that the Chairman’s response reflects a startling degree of over confidence,the statement that “we could raise interest rates in 15 minutes if we had to” is extremely misleadingto put it mildly. Consider the graph below courtesy John Hussman4.
Quoting from John’s commentary “...the Fed has now pushed the size of the monetary base to over20 cents per dollar of nominal GDP. We know from a century of data that short-term interest ratesare tightly linked to the monetary base...it should be evident that the Fed would have todramatically reduce its portfolio simply to raise interest rates by a fraction of one percent... The Fed
3 Sourced via Thoughts from the Frontline (June 15 2013) by Mauldin Economics4 Weekly Market Comment (June 17 2013) at www.hussmanfunds.com

Avant Garde Wealth Management Pvt. Ltd.
Note: “Portfolio” refers to the weighted average of all client portfolios managed by us over the relevant time period. Any metrics such asreturns or portfolio weighting similarly refer to the weighted average of all portfolios. Individual clients portfolios may defer materiallyfrom the blended “Portfolio” and clients should refer to their portfolio statements for details on their portfolios
would have to reduce its portfolio by well over half to raise interest rates to 2%. So even if the Fedwas to completely terminate new purchases of Treasury securities, that action would not be expectedto raise short-term interest rates. This underscores the fact that reducing the pace of quantitativeeasing is not the same thing as raising the Fed’s policy rates. But it should also underscore how farthe Fed’s policy has already gone, and how difficult it will be to normalize over time.” (emphasismine).
We have been highlighting for some time that policies of central banks pose significant risks to theoutlook for economic growth and asset markets. Even a hint of a slight reduction in the rate ofliquidity injection causes significant volatility in asset markets. So it is unclear how policy makers willbe able to normalize policy without causing complete upheaval in asset markets and the realeconomy. Even the most avid optimist will concede that monetary policy cannot remain so easyforever, so tightening is only a question of timing. We remain nervous about potential negativeoutcomes despite, or perhaps because of, the supreme confidence of policy makers in their ability toguide the economy and investors through this environment.
Portfolio positioning – No change
As of quarter end June 2013 we were 55% net long (70% long, 15% short), with 30% of the portfolioin cash and equivalents (the short positions are via futures).
We estimate that the long positions in aggregate have about 65% upside to their intrinsic valueunder base assumptions. Even under stress scenarios the aggregate intrinsic value is marginallyhigher than current prices, indicating limited risk of permanent capital loss. For our short positionswe estimate base case intrinsic values 20-30% below current prices and believe that the stocks arecurrently trading at optimistic estimates of intrinsic value.
With a reasonably large cash holding and short positions, the portfolio continues to be positioned tolimit the drawdown in case of a significant correction in equity markets. At the same time we ownsecurities that we believe are undervalued so that we are able to capture the upside from corporateearnings growth over the coming years. While this strategy means that returns may be mediocre ifthe broader equity markets continue to trade in a range, it does help us sleep better at night. Wecontinue to expect that at some point in the not so distant future we will have the opportunity todeploy cash to buy additional securities at attractive prices, such that the portfolio’s prospectivereturn profile is enhanced without increasing risk.
Stocks in the portfolio – Some minor changes in position size
The portfolio composition has not changed much. We increased our position in Noida Toll Bridgeduring the quarter as prices remained far below our estimate of value (refer to March 2012 andMarch 2013 letters for investment rationale). Piramal Enterprises and Gold remain the largestpositions in the portfolio, followed by SunTV and Noida Toll Bridge. The other positions of roughlyequivalent size are Manugraph, Blue Star, and Thangamayil Jewellery. DB Corp remains a relativelysmall position in the portfolio.

Avant Garde Wealth Management Pvt. Ltd.
Note: “Portfolio” refers to the weighted average of all client portfolios managed by us over the relevant time period. Any metrics such asreturns or portfolio weighting similarly refer to the weighted average of all portfolios. Individual clients portfolios may defer materiallyfrom the blended “Portfolio” and clients should refer to their portfolio statements for details on their portfolios
SunTV is a reasonably large bet in the portfolio as the stock is up significantly from our purchaseprice and we have so far not sold any shares. The investment thesis at the time of investment (referto the June 2012 letter) was that the company has a dominant media franchise whose earningspower will not be hurt materially even though the promoter is now on the wrong side of the politicalspectrum. The market seemed to believe otherwise and had pummelled the stock to all time lowvaluations. So far the thesis seems to be playing out with FY12-13 EPS growth of 2% in a relativelyweak economic backdrop, and on track to grow at a faster rate in FY14. The Return on Equityremained high at 27% in FY13 and the trajectory should be higher in the coming years. Despiteproven earnings resilience the stock remains undervalued as the political troubles of the promoterare still in the limelight. At 21x trailing P/E the stock does not reflect the value of the franchise andtrades at a discount to its own history and relative to its peer Zee Entertainment. We remaininvested at current prices as the discount to fair value persists, even though the valuation gap ismuch smaller than when we initially built our position.
Portfolio performance – A tough six months
From inception in June 2011 till June 2013 the portfolio is up 9.1% while our benchmark, the BSE500index, is down 0.3%. This translates into a CAGR of 4.3% for the portfolio vs. -0.2% for thebenchmark.
Note: During this period average cash balance is 47% and average net long position is 43%; Figures up to March 31, 2013 have been audited by KPMG
Portfolio returns are much lower than we would like. Over the past six months the portfolio hasdeclined in-line with the market, which is a disappointing outcome as we normally expect tooutperform during periods of market weakness. Returns were particularly hit by significant pricedeclines in Manugraph, SunTV, Thangamayil, and Gold. Given the increased undervaluation of theseholdings we anticipate that the portfolio will fare relatively better in future periods of marketweakness. We continue to expect to deliver significantly higher annualized returns over a full bull-bear market cycle.
Gaurav JalanJune 27, 2013
-25%
-20%
-15%
-10%
-5%
0%
5%
10%
15%
20%
25%
Cumulative portfolio returns vs. index
NAV (pre-fee) BSE500 Index
Related Documents