Avant Garde Wealth Management Pvt. Ltd. Note: “Portfolio” refers to the weighted average of all client portfolios managed by us over the relevant time period. Any metrics such as returns or portfolio weighting similarly refer to the weighted average of all portfolios. Individual clients portfolios may defer materially from the blended “Portfolio” and clients should refer to their portfolio statements for details on their portfolios Contents Interest rates likely to decline – Does it matter for equity markets? The big picture – Fragility + Complacency Portfolio positioning – Continue to tread cautiously Stocks in the portfolio – Larger bet on gold Portfolio performance – Acceptable Dear investor, The past quarter has been another good one for Indian equity markets, closing out a very positive year with about 30% returns on market indices. These positive returns came in the face of circumspect forecasts by analysts in December 2011 for the year ahead. This is but one example of why forecasting, especially over short time periods, is futile in the equity markets. One consensus forecast at this time is that the RBI is on the verge of cutting interest rates and that this will aid equity returns. We begin this letter by weighing this conclusion against the empirical evidence. Interest rates likely to decline – Does it matter for equity markets? It is a commonly held belief that lower interest rates are good for equity returns and vice versa. Mathematically, changes in equity prices are a function of changes in earnings and changes in the P/E ratio. So we can consider the impact of interest rates on each of these two components separately in order to determine how changes in interest rates correlate with equity returns. The “Fed Model” (referring to the US central bank) is a commonly accepted theory among the investment community. The theory states that lower yields on long dated government bonds correspond with a higher P/E ratio and conversely higher yields correspond with a lower P/E ratio. The underlying logic is simply that a lower discount rate for future earnings implies a higher P/E ratio. Let’s examine the empirical basis of this claim. Source: NSE; Bloomberg The graph above is a scatter plot of the P/E on the CNX500 Index against the prevailing 10 year G-Sec Yield at various points in time. It should be obvious that for Indian markets there has been no 4% 5% 6% 7% 8% 9% 10% 11% 12% 13% 10 15 20 25 30 35 G - Sec 10yr Yield CNX500 Index P/E (Trailing Twelve Months) Stock valuation and Bond Yields (1998-2012)

Avant garde wealth mgmt quarterly letter - 1212
Jul 14, 2015
Welcome message from author
This document is posted to help you gain knowledge. Please leave a comment to let me know what you think about it! Share it to your friends and learn new things together.
Transcript

Avant Garde Wealth Management Pvt. Ltd.
Note: “Portfolio” refers to the weighted average of all client portfolios managed by us over the relevant time period. Any metrics such asreturns or portfolio weighting similarly refer to the weighted average of all portfolios. Individual clients portfolios may defer materiallyfrom the blended “Portfolio” and clients should refer to their portfolio statements for details on their portfolios
ContentsInterest rates likely to decline – Does it matter for equity markets?The big picture – Fragility + ComplacencyPortfolio positioning – Continue to tread cautiouslyStocks in the portfolio – Larger bet on goldPortfolio performance – Acceptable
Dear investor,
The past quarter has been another good one for Indian equity markets, closing out a very positiveyear with about 30% returns on market indices. These positive returns came in the face ofcircumspect forecasts by analysts in December 2011 for the year ahead. This is but one example ofwhy forecasting, especially over short time periods, is futile in the equity markets. One consensusforecast at this time is that the RBI is on the verge of cutting interest rates and that this will aidequity returns. We begin this letter by weighing this conclusion against the empirical evidence.
Interest rates likely to decline – Does it matter for equity markets?
It is a commonly held belief that lower interest rates are good for equity returns and vice versa.Mathematically, changes in equity prices are a function of changes in earnings and changes in theP/E ratio. So we can consider the impact of interest rates on each of these two componentsseparately in order to determine how changes in interest rates correlate with equity returns.
The “Fed Model” (referring to the US central bank) is a commonly accepted theory among theinvestment community. The theory states that lower yields on long dated government bondscorrespond with a higher P/E ratio and conversely higher yields correspond with a lower P/E ratio.The underlying logic is simply that a lower discount rate for future earnings implies a higher P/Eratio. Let’s examine the empirical basis of this claim.
Source: NSE; Bloomberg
The graph above is a scatter plot of the P/E on the CNX500 Index against the prevailing 10 year G-SecYield at various points in time. It should be obvious that for Indian markets there has been no
4%
5%
6%
7%
8%
9%
10%
11%
12%
13%
10 15 20 25 30 35
G-Se
c 10
yr Y
ield
CNX500 Index P/E (Trailing Twelve Months)
Stock valuation and Bond Yields (1998-2012)

Avant Garde Wealth Management Pvt. Ltd.
Note: “Portfolio” refers to the weighted average of all client portfolios managed by us over the relevant time period. Any metrics such asreturns or portfolio weighting similarly refer to the weighted average of all portfolios. Individual clients portfolios may defer materiallyfrom the blended “Portfolio” and clients should refer to their portfolio statements for details on their portfolios
meaningful correlation between interest rates and P/E ratios. In fact, if a trend line is force fitted onthe above data it has an upward slope, implying that historically interest rates have been looselypositively correlated with P/E ratios. This result may seem counter intuitive but there is a logicalexplanation. The discount rate is only one variable that drives the P/E ratio. The other variable is thefuture stream of earnings or cash flows. If lower interest rates correspond with a deterioratingoutlook for future earnings, the P/E ratio may not necessarily go up, and vice versa. Even though the“Fed Model” originated in the US, the suggested inverse relationship between bond yields and P/Eratios only held in the US for a relatively limited period from the early 1980s till the late 1990s, whichsaw a continuous decline in bond yields corresponding with increasing P/E ratios1. However, in thetwelve years since 2000 the decline in bond yields has continued relentlessly while P/E ratios havealso declined substantially.
Common sense suggests that lower interest rates should lead to a lower interest burden forcorporates and also give them an incentive to invest more, thus leading to both higher economicgrowth and higher corporate profits, and in turn higher equity prices. Indeed this has been theargument put forth by various sections of industry, the government and the investment community,who have been calling on the RBI to cut rates for some time now. Since the evidence suggests thatlower interest rates do not correspond with higher P/E ratios, we can consider next how changes inbond yields have correlated with corporate profit growth in the past.
Source: NSE; Bloomberg
For a given point in time, the above graph plots the change in bond yields over the prior six monthsagainst the subsequent two year forward CAGR in corporate earnings2. Again, it should be evidentthat there is no relationship between the change in bond yields and subsequent earnings growth. Asan aside it is interesting to note the asymmetry in the y-axis, where the maximum magnitude ofdecline in interest rates over a six-month period is double the magnitude of the maximum increase.
1 See John Hussman in “Long-Term Evidence on the Fed Model and Forward Operating P/E Ratios (Aug 2007)” for adetailed empirical analysis of the Fed Model at http://www.hussmanfunds.com/wmc/wmc070820.htm2 A two year forward EPS CAGR (using trailing twelve month earnings) is used in order to account for the commonlyrecognized lag effect of monetary policy
-4.0%
-3.0%
-2.0%
-1.0%
0.0%
1.0%
2.0%
-5% 0% 5% 10% 15% 20% 25% 30% 35% 40% 45%
Chan
ge in
G-Se
c 10
yr Y
ield
(pri
or 6
mth
s)
CNX500 EPS growth (2-yr forward CAGR)
Change in Bond Yields and EPS growth (1998-2012)

Avant Garde Wealth Management Pvt. Ltd.
Note: “Portfolio” refers to the weighted average of all client portfolios managed by us over the relevant time period. Any metrics such asreturns or portfolio weighting similarly refer to the weighted average of all portfolios. Individual clients portfolios may defer materiallyfrom the blended “Portfolio” and clients should refer to their portfolio statements for details on their portfolios
This shows that policy makers have been much more aggressive in cutting interest rates that raisingthem.
Analysis of the underlying drivers indicates that falling interest rates have no correlation with futureequity returns. We can also directly evaluate the relationship between changes in bond yields andequity returns. Once again, as the graph below demonstrates, no such correlation exists3.
Source: NSE; Bloomberg
There is a prevailing consensus in most quarters that RBI policy has been hawkish. In their latestpolicy announcement the RBI has indicated that its focus is shifting from inflation control to growth,suggesting that interest rate cuts are likely given the slow economic growth trajectory at present.Before closing an analysis of how a decline in interest rates could impact the equity markets, it isinteresting to consider whether the RBI has been hawkish in the first place.
Source: Bloomberg; RBI
The graph above plots real bond yields4 over the last twelve years, calculated both on the basis ofWPI inflation and CPI inflation5. It shows that real interest rates have been below 2% and mostly
3 Note that the cluster of data points on the bottom right relate to the late 2008 and early 2009 period when bond yieldshad fallen aggressively and equity markets rose substantially in the subsequent year
-4.0%
-3.0%
-2.0%
-1.0%
0.0%
1.0%
2.0%
3.0%
-60% -40% -20% 0% 20% 40% 60% 80% 100% 120% 140%
Chan
ge in
G-Se
c 10
yr Y
ield
(pri
or 6
mot
hs)
CNX500 Index (1-yr forward return)
Change in Bond Yields and Index Returns (1998-2012)
-12%
-10%
-8%
-6%
-4%
-2%
0%
2%
4%
6%
8%
10%
12%
Jan-
01Ap
r-01
Jul-0
1O
ct-0
1Ja
n-02
Apr-
02Ju
l-02
Oct
-02
Jan-
03Ap
r-03
Jul-0
3O
ct-0
3Ja
n-04
Apr-
04Ju
l-04
Oct
-04
Jan-
05Ap
r-05
Jul-0
5O
ct-0
5Ja
n-06
Apr-
06Ju
l-06
Oct
-06
Jan-
07Ap
r-07
Jul-0
7O
ct-0
7Ja
n-08
Apr-
08Ju
l-08
Oct
-08
Jan-
09Ap
r-09
Jul-0
9O
ct-0
9Ja
n-10
Apr-
10Ju
l-10
Oct
-10
Jan-
11Ap
r-11
Jul-1
1O
ct-1
1Ja
n-12
Apr-
12Ju
l-12
Oct
-12
1-yr G-Sec Real Yield (WPI)1-yr G-Sec Real Yield (CPI)
Avant Garde Wealth Management Pvt. Ltd.
Note: “Portfolio” refers to the weighted average of all client portfolios managed by us over the relevant time period. Any metrics such asreturns or portfolio weighting similarly refer to the weighted average of all portfolios. Individual clients portfolios may defer materiallyfrom the blended “Portfolio” and clients should refer to their portfolio statements for details on their portfolios
negative for the better part of the past decade. While the appropriate level of real interest rates forthe Indian economy may be up for debate, it seems clear that real rates have been much too lowduring this period.
Source: RBI
In addition to maintaining low real interest rates, the graph above shows that the RBI has beenmonetizing government debt ever more aggressively, significantly stepping up its purchases from Jan2010 onwards. In the last seven years the stock of government debt on the RBI’s balance sheet hasgrown at a CAGR of 40%, in the process increasing from 5-10% of assets to 25% currently. As a result,over this period the amount of total outstanding central government debt owned by the RBI is upfrom about 6% in 2005 to about 16% currently. Through this monetization the RBI has been fundingthe fiscal deficit to the tune of about 1% of GDP every year over the last three years. So while theperception is that the RBI has been hawkish and maybe kept monetary policy too tight and for toolong, these data points suggest otherwise. If monetary policy has already been loose it isquestionable whether further loosening will help or harm the economy, but that is perhaps a topicof discussion for another letter.
The big picture – Fragility + Complacency
In the past we have highlighted the high and increasing level of debt in the global economy in recentyears, and the fact that this increase in debt seems to be facilitated and supported by rapidlyexpanding central bank balance sheets. The future implications of this dynamic continue to be ofgreat concern to us. This issue is well recognized and discussed by the media and the investmentcommunity. However, for one reason or another it does not seem that these concerns are actuallydiscounted in asset prices.
4 The real yield is calculated by adjusting the nominal 1-yr G-sec yield at a given time by the subsequent actual increase inthe inflation index over the following year. In order to calculate the real yields from Jan 2012 onwards CPI inflation hasbeen assumed to decline to 8.5% by Dec 2013 from ~10.5% currently and WPI inflation has been assumed to decline to 7%by March 2012 and subsequently rise to 7.5% by Dec 20135 From 2008 onwards there has been a meaningful divergence between WPI and CPI, with CPI inflation running well aheadof WPI inflation. For CPI estimates, the CPI (industrial workers) Index has been used till Jan 2011, after which the newcombined CPI Index has been used
0%
1%
2%
3%
4%
5%
6%
7%
0%
5%
10%
15%
20%
25%
30%
35%
Oct
-05
Dec-
05M
ar-0
6M
ay-0
6Ju
l-06
Sep-
06No
v-06
Jan-
07M
ar-0
7M
ay-0
7Ju
l-07
Sep-
07No
v-07
Jan-
08M
ar-0
8M
ay-0
8Ju
l-08
Sep-
08No
v-08
Jan-
09M
ar-0
9M
ay-0
9Ju
l-09
Sep-
09No
v-09
Jan-
10M
ar-1
0M
ay-1
0Ju
l-10
Sep-
10No
v-10
Jan-
11M
ar-1
1M
ay-1
1Ju
l-11
Sep-
11No
v-11
Jan-
12M
ar-1
2M
ay-1
2Ju
l-12
Sep-
12No
v-12
Rupe
e Se
curi
ties
% o
f GD
P
Rupe
e Se
curi
ties
% o
f To
tal
RBI A
sset
s
Rupee Securities % of Total RBI Assets
Rupee Securities % of GDP

Avant Garde Wealth Management Pvt. Ltd.
Note: “Portfolio” refers to the weighted average of all client portfolios managed by us over the relevant time period. Any metrics such asreturns or portfolio weighting similarly refer to the weighted average of all portfolios. Individual clients portfolios may defer materiallyfrom the blended “Portfolio” and clients should refer to their portfolio statements for details on their portfolios
Frag•ile (adjective): (a) easily broken or destroyed (b) constitutionally delicate, lacking in vigour
In the words of fund manager Kyle Bass of Hayman Partners, “the total credit market debt-to-GDPglobally is 350 percent. It's 200 trillion dollars' worth of debt against global GDP of roughly 62trillion”. He also points out that in the past global debt to GDP has only approached 250% whencountries were preparing for war6. And these figures do not include off-balance sheet liabilities suchas social security and unfunded healthcare and pension costs, or unofficial lending (significant incountries like China), which would take the ratios much higher.
Note: Countries included in this analysis are USA, Europe, UK, China, Japan, and SwitzerlandSource: Bloomberg
The significant increase in global debt levels have probably been facilitated by the fact that centralbanks have turned to quantitative easing in a big way and have been buying increasingly largeportions of the debt issuances.
6 Excerpts from a talk given at the University of Virginia Darden School of Business Investing Conference in Nov 2012
10%
15%
20%
25%
30%
35%
Feb-
02
May
-02
Aug-
02
Nov-
02
Feb-
03
May
-03
Aug-
03
Nov-
03
Feb-
04
May
-04
Aug-
04
Nov-
04
Feb-
05
May
-05
Aug-
05
Nov-
05
Feb-
06
May
-06
Aug-
06
Nov-
06
Feb-
07
May
-07
Aug-
07
Nov-
07
Feb-
08
May
-08
Aug-
08
Nov-
08
Feb-
09
May
-09
Aug-
09
Nov-
09
Feb-
10
May
-10
Aug-
10
Nov-
10
Feb-
11
May
-11
Aug-
11
Nov-
11
Feb-
12
May
-12
Aug-
12
Nov-
12
Central Bank Assets % of GDP
Avant Garde Wealth Management Pvt. Ltd.
Note: “Portfolio” refers to the weighted average of all client portfolios managed by us over the relevant time period. Any metrics such asreturns or portfolio weighting similarly refer to the weighted average of all portfolios. Individual clients portfolios may defer materiallyfrom the blended “Portfolio” and clients should refer to their portfolio statements for details on their portfolios
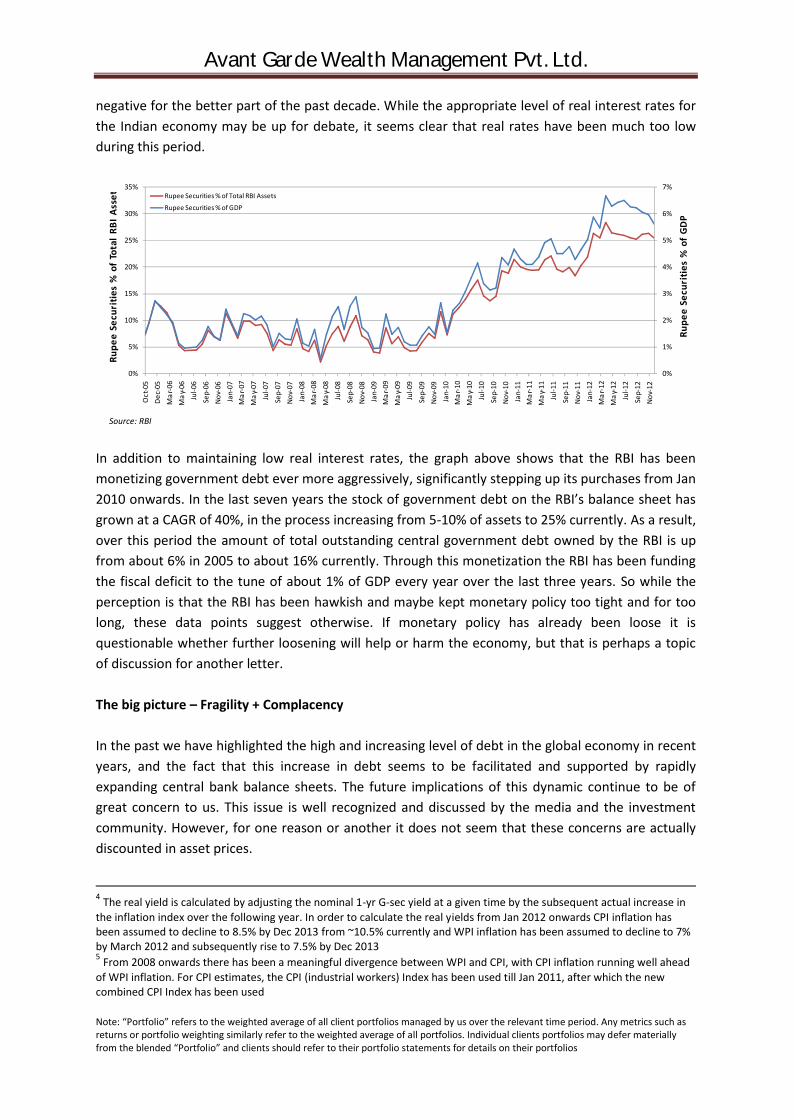
Despite this huge debt funded stimulus, global economic growth is tepid and weakening.
Source: JP Morgan Global Manufacturing and Services PMI; Markit Economics
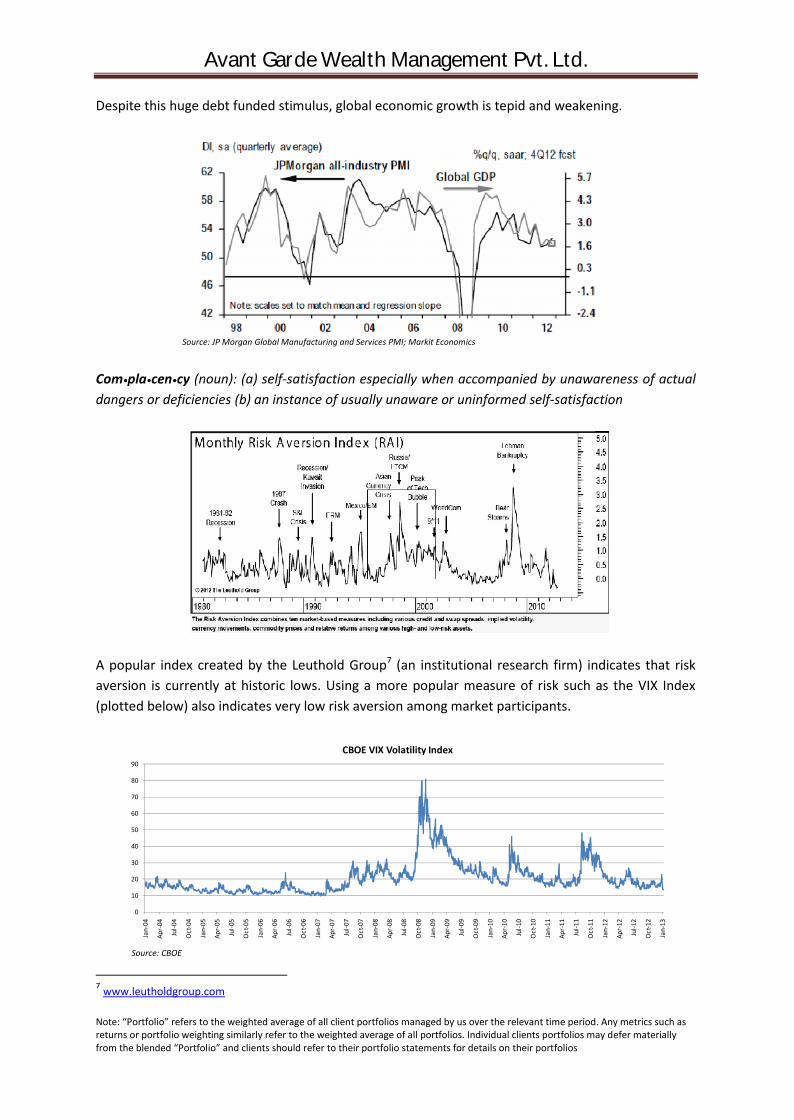
Com•pla•cen•cy (noun): (a) self-satisfaction especially when accompanied by unawareness of actualdangers or deficiencies (b) an instance of usually unaware or uninformed self-satisfaction
A popular index created by the Leuthold Group7 (an institutional research firm) indicates that riskaversion is currently at historic lows. Using a more popular measure of risk such as the VIX Index(plotted below) also indicates very low risk aversion among market participants.
Source: CBOE
7 www.leutholdgroup.com
0
10
20
30
40
50
60
70
80
90
Jan-
04
Apr-
04
Jul-0
4
Oct
-04
Jan-
05
Apr-
05
Jul-0
5
Oct
-05
Jan-
06
Apr-
06
Jul-0
6
Oct
-06
Jan-
07
Apr-
07
Jul-0
7
Oct
-07
Jan-
08
Apr-
08
Jul-0
8
Oct
-08
Jan-
09
Apr-
09
Jul-0
9
Oct
-09
Jan-
10
Apr-
10
Jul-1
0
Oct
-10
Jan-
11
Apr-
11
Jul-1
1
Oct
-11
Jan-
12
Apr-
12
Jul-1
2
Oct
-12
Jan-
13
CBOE VIX Volatility Index

Avant Garde Wealth Management Pvt. Ltd.
Note: “Portfolio” refers to the weighted average of all client portfolios managed by us over the relevant time period. Any metrics such asreturns or portfolio weighting similarly refer to the weighted average of all portfolios. Individual clients portfolios may defer materiallyfrom the blended “Portfolio” and clients should refer to their portfolio statements for details on their portfolios
Howard Marks, Chairman of Oaktree Capital, sums up current investor attitude quite appropriatelyin his memo dated January 7, 2013. He writes “...while few people are thinking bullish today, manyare acting bullish. Their pro-risk behaviour is having its normal dangerous impact on the markets,even in the absence of pro-risk thinking. I’ve become increasingly conscious of this inconsistency inrecent months, and I think it is the most important issue that today’s investors have to confront.”
Portfolio positioning – Continue to tread cautiously
The portfolio continues to reflect our caution when evaluating potential investment opportunities.As a result the cash position remains high. Among value investors there is often a debate about theimportance of macro trends in investment decision making. The majority view is that prudent stockselection is all that matters since macro trends are difficult to understand and therefore should belargely ignored. We differ from this viewpoint. It would be naive to believe that irrespective of theoverall macro environment and level of asset prices, good stock selection will deliver similar results.It is particularly important, and very possible, to identify unsustainable macroeconomic trends asthese can have a significantly disruptive impact on individual companies, industries, and countrieswhen they change direction. While the timing of such changes is indeed very difficult to predict, theoutcome is generally not. In the words of Herbert Stein8 “If something cannot go on forever, it willstop.” As an example, consider what happened to investors in home building stocks in the USAduring the 2008 crisis. Prior to 2008 an intelligent bottom-up focused investor could have picked awell run home building business that had generated high returns on capital over a long twenty yearhistory, and looked cheap on various valuation metrics compared to its own past and its peers.However, by ignoring or overlooking the fact that industry sales had been growing at anunsustainable rate, at the very time of making the investment it was virtually guaranteed that theinvestor would lose money when the trend changed, with only the timing being uncertain.
Despite talk of caution, in our analysis stocks in general continue to price in reasonably optimisticoutcomes for the future. Take the example of the Medium and Heavy Commercial Vehicle industryin India. With sales volumes declining by more than 20% YoY, the industry has been going throughsome tough times to put it mildly. Yet stocks whose profitability is correlated to the industry havegenerally not suffered commensurately and are still well above their historical valuation lows. Thisindicates that investors are willing to look through the down cycle and are predicting better timesahead. This prediction may indeed turn out to be accurate. The conundrum, however, is that byinvesting at current prices there will probably not be much money to be made if the reboundmaterializes. But much money may be lost if the rebound is delayed or the upturn is not as strong asexpected. We prefer to wait for such skewed risk-reward trade-offs to turn in our favour before wecommit your capital.
As of quarter end December 2012 we were 56% net long (71% long, 15% short), with 29% of theportfolio in cash and equivalents (the short positions are via futures).
8 This statement if popularly referred to as “Herbert Stein’s law”. For more visit http://en.wikipedia.org/wiki/Herbert_Stein

Avant Garde Wealth Management Pvt. Ltd.
Note: “Portfolio” refers to the weighted average of all client portfolios managed by us over the relevant time period. Any metrics such asreturns or portfolio weighting similarly refer to the weighted average of all portfolios. Individual clients portfolios may defer materiallyfrom the blended “Portfolio” and clients should refer to their portfolio statements for details on their portfolios
We estimate that the long positions in aggregate have about 50% upside to their intrinsic valueunder base assumptions. Even under stress scenarios the aggregate intrinsic value is only about 10%lower than current prices, indicating limited risk of capital loss. For our short positions we estimateintrinsic values 30-50% below current prices and believe that the stocks are trading at a premium toeven optimistic estimates of intrinsic value.
Stocks in the portfolio – Larger bet on gold
In line with our bullish view on gold, as discussed in our previous letter, we have substantiallyincreased our allocation to the yellow metal. Now Gold and Piramal Enterprises (previously PiramalHealthcare) are the two largest positions in the portfolio. The other large positions of roughlyequivalent size are Blue Star, Noida Toll Bridge, Manugraph, SunTV and Thangamayil Jewellery. Wealso have a relatively smaller allocation to a company called DB Corp, for which the investmentrationale is discussed below.
DB Corp is a regional newspaper company with dominant share in most of its markets. What sets thecompany apart from competitors is it excellent execution. In an industry where barriers to entry arerelatively high the company has expanded into many new markets and successfully challengedincumbents to go on and occupy a leadership position. This has translated into the ability to bothgrow the business rapidly and generate a high Return on Capital. While the challenge of eyeballsmoving from print to online media is present, the transition will probably take a long time in the Tier2 and Tier 3 towns from where the company derives the bulk of its readership. The stock does notlook cheap at TTM P/E of ~24x and TTM P/B of ~4.2x. However, there is very high operating leveragein the business given a relatively inelastic cost base. Revenues are currently depressed withadvertising sales suffering in the past year due to soft economic conditions. As and when economicgrowth recovers earnings and cash flows should rebound substantially. This leads us to conclude thatthis is a high quality business that is somewhat undervalued on normalized earnings, but not acomplete bargain at current price, meriting a small position in the portfolio.
Portfolio performance – Acceptable
From inception in June 2011 till December 2012 the portfolio is up 17.4% while our benchmark, theBSE500 index, is up 5.5%.
Note: During this period average cash balance is 53% and average net long position is 39%; Figures up to March 31, 2012 have been audited by KPMG
-25%-20%-15%-10%
-5%0%5%
10%15%20%25%
Cumulative Returns
NAV (pre-fee) BSE500
5.5%
17.4%

Avant Garde Wealth Management Pvt. Ltd.
Note: “Portfolio” refers to the weighted average of all client portfolios managed by us over the relevant time period. Any metrics such asreturns or portfolio weighting similarly refer to the weighted average of all portfolios. Individual clients portfolios may defer materiallyfrom the blended “Portfolio” and clients should refer to their portfolio statements for details on their portfolios
Our returns so far fall short of what we hope to deliver to you over time, which should be well inexcess of 15% annualized (after deducting our fees). However, the performance needs to beevaluated in context. We have stressed in the past that we do not invest based on forecasts aboutthe future. Instead we prefer to focus on the available information at any given time, which helps usdetermine potential for reward against possible risk, and make our investment decisions accordingly.So far our analysis has necessitated a cautious approach to deploying your capital. This is reflected inthe fact that over the last one and a half years we have on average held about 53% of the portfolioin cash and equivalents and maintained an average net long position of about 39%. Despite thisportfolio make up we have still beaten index returns quite handily. We have also managed to bettercomparable fixed income alternatives, especially on a tax adjusted basis.
When evaluating returns of any investment manager it is critical to evaluate the risk that wasassociated with generating those returns. Risk is present at two levels. First at the level of eachindividual investment, where risk is the probability of a permanent and irrecoverable loss of capitalinvested, either as a result of impairment of intrinsic value or as a result of overestimation ofintrinsic value. Second is at the portfolio level, where risk is the inverse of the probability that theportfolio as a whole has limited losses in instances where individual investments suffer impairmentin value. Understanding such risks ultimately boils down to an evaluation of the investment process,aided by some quantitative measures. What is the thought process behind making a particularinvestment or exiting from it and its share in the portfolio? What is the amount of cash or leveragein the portfolio? How do the various positions in the portfolio come together and how is theportfolio as a whole likely to respond to various future outcomes? So that you may appreciate therisks we are taking with your money in order to deliver returns, we try to outline our thinking to thebest extent possible. We hope that you will agree that we have been true to our stated philosophyof first and foremost ensuring preservation of your capital, even as we strive for high returns.
We remain confident of delivering superior risk adjusted returns to you over market cycles,especially as compared to alternative investment avenues at your disposal. Thank you for yourpatience and confidence!
Gaurav JalanJanuary 17, 2013
Related Documents