i TESE DE DOUTORADO AVALIAÇÃO DE IMPACTO AMBIENTAL E GESTÃO DOS RECURSOS NATUARIAS NO ESTUÁRIO APODI – MOSSORÓ, NORDESTE DO BRASIL Autor: MUKESH SINGH BOORI Orientador: PROF. DR. VENERANDO EUSTÁQUIO AMARO (PPGG – UFRN) Tese N 0 29/PPGG Natal-RN / Brasil, Junho 2011 UNIVERSIDADE FEDERAL DO RIO GRANDE DO NORTE CENTRO DE CIÊNCIAS EXATAS E DA TERRA PROGRAMA DE PÓS-GRADUAÇÃO EM GEODINÂMICA E GEOFÍSICA

Welcome message from author
This document is posted to help you gain knowledge. Please leave a comment to let me know what you think about it! Share it to your friends and learn new things together.
Transcript

i
TESE DE DOUTORADO
AVALIAÇÃO DE IMPACTO AMBIENTAL E GESTÃO DOS RECURSOS NATUARIAS NO ESTUÁRIO APODI –
MOSSORÓ, NORDESTE DO BRASIL
Autor: MUKESH SINGH BOORI
Orientador: PROF. DR. VENERANDO EUSTÁQUIO AMARO
(PPGG – UFRN)
Tese N0 29/PPGG
Natal-RN / Brasil, Junho 2011
UNIVERSIDADE FEDERAL DO RIO GRANDE DO NORTE CENTRO DE CIÊNCIAS EXATAS E DA TERRA
PROGRAMA DE PÓS-GRADUAÇÃO EM GEODINÂMICA E GEOFÍSICA

ii
TESE DE DOUTORADO
AVALIAÇÃO DE IMPACTO AMBIENTAL E GESTÃO DOS RECURSOS NATUARIAS NO ESTUÁRIO APODI –
MOSSORÓ, NORDESTE DO BRASIL
Autor: MUKESH SINGH BOORI
Tese de doutorado apresentada em junho de 2011 ao Programa de Pós-Graduação em Geodinâmica e Geofísica da Universidade Federal do Rio Grande do Norte para obtenção de título de Doutor em Geodinâmica e Geofísica.
Comissão examinadora:
Prof. Dr. Venerando Eustáquio Amaro (UFRN) Prof. Dr. Antonio Conceição Paranhos Filhos (UFMS)
Profa. Dra. Odete Silveira (UFPA) Profa. Dra. Ada Cristina Scudelari (UFRN)
Prof. Dr. Werner Farkatt Tabosa (UFRN-UNP)
Natal-RN / Brasil, Junho 2011
UNIVERSIDADE FEDERAL DO RIO GRANDE DO NORTE CENTRO DE CIÊNCIAS EXATAS E DA TERRA
PROGRAMA DE PÓS-GRADUAÇÃO EM GEODINÂMICA E GEOFÍSICA

iii
“A man who believes in himself and not circumstances is the real winner”
Swami Vivekananda

iv
Agradecimentos
As a young boy, I often thought that finishing my masters studies at the university would be one of the major achievements in my life. Few years later, my vision on life and study changed quite profoundly. Being a Project Scientist in Space Application Centre I had the opportunity of meeting extraordinary scientists from many parts of the world who inspired me to undertake a new journey to explore an unknown world of learning. Moving to Belgium in 2007 and continuously Brazil in mid 2008 was a decision with shared feelings. On the one hand, great moments of my childhood and adolescence remained in the past where my family, friends and the splendor were the essence of my life, but on the other hand, the sensation of knowing new people, places and a totally different environment gave me the strength to undertake new challenges.
I would like to deeply thank various people in Brazil, Belgium and India, who provided me useful and helpful assistance. First of all, I would like to thank to my promoter, Prof. Dr. Venerando Eustáquio Amaro, who gave me the opportunity to conduct research in Brazil. With his experience, his wisdom and great effort to explain things clearly and simply, he helped to make field work fun for me. Throughout my thesis-writing period, he provided encouragement, sound advice, good teaching, good company, and lots of good ideas. Prof. Dr. Venerando Eustáquio Amaro deserves my gratitude not only by his guidance but also by his friendship shown during the time of my Ph.D.
I am especially grateful to Prof. Dr. Zorano Sérgio de Souza and Prof. Dr. Helenice Vital, whose experience and knowledge contributed significantly to improve this thesis. I am also thankful to Prof. Dr. Paulo Roberto Cordeiro de Farias and Prof. Dr. Narendra Srivastava for their valuable guidance. A particular gratitude to the Secretariat of PPGG/UFRN, Nilda for providing the necessary facilities and stuff to carry out the research in Geo-processing Laboratory and most important thankful to CNPq-TWAS for the grant of my scholarship.
Many thanks to my colleagues and friends who study in Federal University of Rio Grande do Norte and specially study in Postgraduate Course in Geodynamics and Geophysics (Geo-processing Laboratory) Anderson, Dalton, Fatima, Poliana, Bruno, Izaac, Marielli, Caio and Vitor, Who created a stimulating and fun environment to work.
I would also like to thank to my colleagues at the department of Physical and Regional Geography at the Katholieke University Leuven, Belgium and particularly Prof. Dr. Anton Van Rompaey, Prof. Dr. Gerard Govers and Prof. Dr. Jean Poesen. I also want to thank to Dr. J.R. Sharma (ISRO), Dr. A.T. Jeyaseelan and Dr. N.K. Sharma (JSAC), Dr. S. Palria (MDSU), Dr. A.S. Baloda (ICAR) and Kiran Jalem (CDM) for their moral support.
I wish to thank my entire extended family for providing a loving environment for me. My grandparents, my brother Mahesh, my sister Sunita and my relatives, all of them were particularly supportive. I especially want to thank to my parents who encouraged me to study a lot. They are very glad with this achievement. In last, I wish to thank Komal my wife and Krish my little lovely son.

v
RESUMO
O objetivo deste estudo é investigar a vulnerabilidade eco-ambiental, suas mudanças e suas causas e elaborar um sistema de gestão para a sua aplicação e para a avaliação de riscos no estuário do rio Apodi-Mossoró, região Nordeste do Brasil. Esta análise está enfocada na interferência nas condições da paisagem, e na sua alteração, dos seguintes fatores: a indústria de petróleo e gás; as indústrias de frutas tropicais; as fazendas de camarão; a indústria de sal marinho; a invasão de áreas sensíveis; demanda por terras; degradação da vegetação; assoreamento de rios; enchentes severas; aumento do nível do mar (SLR); dinâmica costeira; topografia baixa e plana; elevado valor ecológico e turístico da região e o rápido crescimento da urbanização. Dados convencionais e de sensoriamento remoto foram analisadas através das técnicas de modelagem usando os software ArcGIS, ER-Mapper, ENVI e ERDAS Imagine. As imagens digitais foram inicialmente processadas por Análise de Componentes Principais e transformação da fração máxima de ruído, então todas as bandas foram normalizadas para reduzir os erros causados por bandas de diferentes dimensões. Em seguida foram realizadas em Sistema de Informações Geográficas as análises de detecção de alterações, os modelos de elevação digital, os índices geomórficos e as demais variáveis da área de estudo. A combinação colorida de bandas multiespectrais foi empregada para acompanhar mudanças de uso/ocupação do solo e da cobertura vegetal entre os anos de 1986 a 2009. Essa tarefa também abrangeu a análise de vários dados secundários, como dados de campo, dados socioeconômicos, dados ambientais e perspectivas de crescimento. A intenção foi aprimorar a compreensão da vulnerabilidade natural e eco-ambiental e a influência destas na avaliação de riscos, definindo a intensidade, a distribuição e os efeitos sobre os ecossistemas, por meio da identificação de áreas de alta e baixa sensibilidade à inundação devido ao SLR futuro, e as perdas de terras devido à erosão costeira no vale do Apodi-Mossoró, de modo a se estabelecer uma estratégia de uso sustentável da terra. O modelo elaborado integra alguns fatores básicos como a geologia, a geomorfologia, os solos, o uso/cobertura do solo, a cobertura vegetal, a declividade, a topografia e a hidrologia. Os resultados numéricos indicaram que 9,86% do total da área de estudo estão sob vulnerabilidade muito elevada, 29,12% da área em alta vulnerabilidade, 52,90% da área em vulnerabilidade moderada e 2,23% está na categoria de muito baixa vulnerabilidade. As análises indicam a inundação de 216,1km² e 362,8km² de área para variações de 1m e 10m, respectivamente, nos níveis do mar. Os setores mais afetados serão as áreas residenciais, industriais e de recreação, os terrenos agrícolas, e ecossistemas de alta sensibilidade ambiental. Os resultados mostraram que as mudanças na vulnerabilidade eco-ambiental têm um impacto significativo no desenvolvimento sustentável do Estado do RN, uma vez que o indicador é uma função da sensibilidade, da exposição e do estado em relação a um nível de dano. O modelo é apresentado como uma ferramenta para auxiliar na indexação da vulnerabilidade, a fim de otimizar as ações e avaliar as implicações das tomadas de decisões e das políticas quanto à gestão de áreas costeiras e estuarinas. Nesse quadro os aspectos como crescimento populacional, degradação da vegetação, uso/ocupação do solo, grau e tipo de industrialização, SLR e as políticas governamentais para a proteção ambiental foram considerados os principais fatores que afetaram as mudanças eco-ambientais ao longo das três últimas décadas no estuário Apodi-Mossoró.
vi
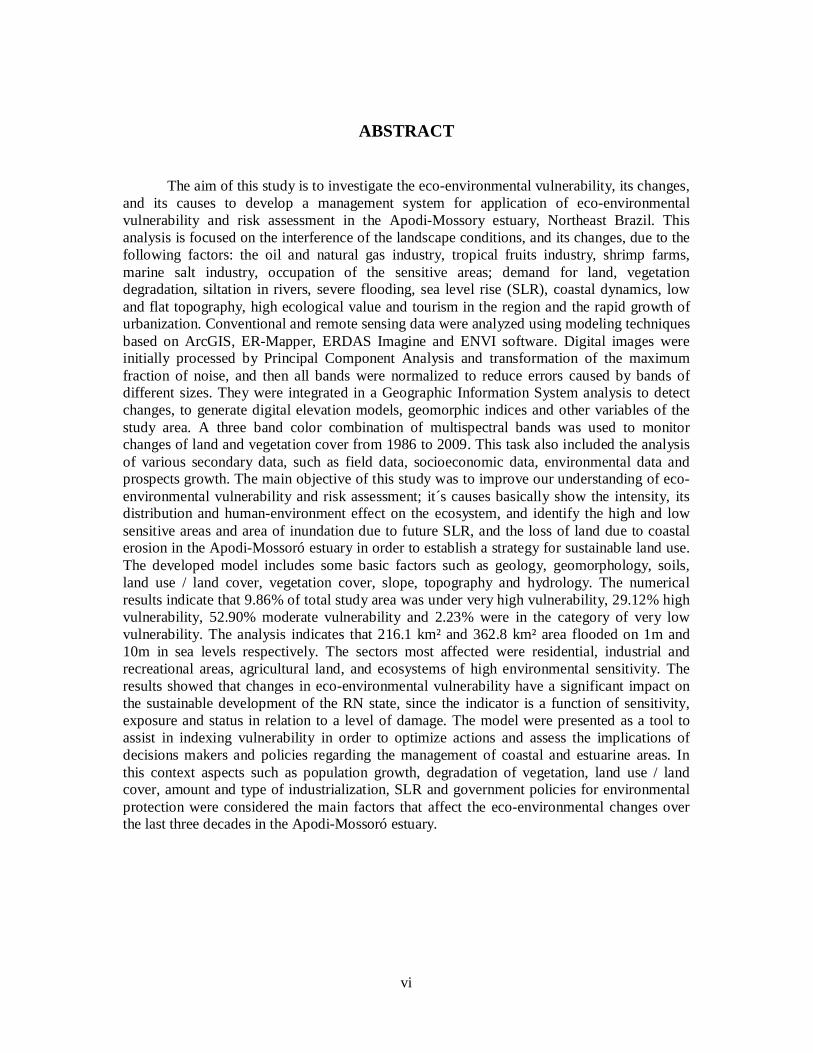
ABSTRACT
The aim of this study is to investigate the eco-environmental vulnerability, its changes, and its causes to develop a management system for application of eco-environmental vulnerability and risk assessment in the Apodi-Mossory estuary, Northeast Brazil. This analysis is focused on the interference of the landscape conditions, and its changes, due to the following factors: the oil and natural gas industry, tropical fruits industry, shrimp farms, marine salt industry, occupation of the sensitive areas; demand for land, vegetation degradation, siltation in rivers, severe flooding, sea level rise (SLR), coastal dynamics, low and flat topography, high ecological value and tourism in the region and the rapid growth of urbanization. Conventional and remote sensing data were analyzed using modeling techniques based on ArcGIS, ER-Mapper, ERDAS Imagine and ENVI software. Digital images were initially processed by Principal Component Analysis and transformation of the maximum fraction of noise, and then all bands were normalized to reduce errors caused by bands of different sizes. They were integrated in a Geographic Information System analysis to detect changes, to generate digital elevation models, geomorphic indices and other variables of the study area. A three band color combination of multispectral bands was used to monitor changes of land and vegetation cover from 1986 to 2009. This task also included the analysis of various secondary data, such as field data, socioeconomic data, environmental data and prospects growth. The main objective of this study was to improve our understanding of eco-environmental vulnerability and risk assessment; it´s causes basically show the intensity, its distribution and human-environment effect on the ecosystem, and identify the high and low sensitive areas and area of inundation due to future SLR, and the loss of land due to coastal erosion in the Apodi-Mossoró estuary in order to establish a strategy for sustainable land use. The developed model includes some basic factors such as geology, geomorphology, soils, land use / land cover, vegetation cover, slope, topography and hydrology. The numerical results indicate that 9.86% of total study area was under very high vulnerability, 29.12% high vulnerability, 52.90% moderate vulnerability and 2.23% were in the category of very low vulnerability. The analysis indicates that 216.1 km² and 362.8 km² area flooded on 1m and 10m in sea levels respectively. The sectors most affected were residential, industrial and recreational areas, agricultural land, and ecosystems of high environmental sensitivity. The results showed that changes in eco-environmental vulnerability have a significant impact on the sustainable development of the RN state, since the indicator is a function of sensitivity, exposure and status in relation to a level of damage. The model were presented as a tool to assist in indexing vulnerability in order to optimize actions and assess the implications of decisions makers and policies regarding the management of coastal and estuarine areas. In this context aspects such as population growth, degradation of vegetation, land use / land cover, amount and type of industrialization, SLR and government policies for environmental protection were considered the main factors that affect the eco-environmental changes over the last three decades in the Apodi-Mossoró estuary.

vii
SUMÁRIO Agradecimentos ........................................................................................................................ iv Resumo ...................................................................................................................................... v Abstract .................................................................................................................................... vi Lista de Figuras ......................................................................................................................... x Lista de Tabela ....................................................................................................................... xii Lista de Siglas ........................................................................................................................ xiii
Capítulo I: O Estuário do Rio Apodi-Mossoró: Uma Região que Experimenta a Rápida Mudança da Vulnerabilidade Eco-Ambiental
1.1 Introdução ............................................................................................................................ 1 1.2 O Conceito de Vulnerabilidade ........................................................................................... 4 1.3 Motivação e Objetivos ......................................................................................................... 6 1.4 Área de Estudo ..................................................................................................................... 8 1.5 Características Fisiográficas ............................................................................................. 10 1.5.1 Cobertura Vegetal .......................................................................................................... 10
1.5.1.1 Vegetação de Caatinga .......................................................................................... 11 1.5.1.2 Vegetação Costeira ................................................................................................. 11
1.5.2 Recursos Hídricos ......................................................................................................... 11 1.5.3 Solo ............................................................................................................................... 12 1.5.4 Aspectos Geomorfológicos ............................................................................................ 13 1.5.5 Aspectos Geológicos ..................................................................................................... 15 1.5.6 Erosão Costeira e a Taxa de Alteração na Linha Costeira............................................... 17 1.5.7 Declividade do Litoral ................................................................................................... 18 1.5.8 Cenários Nível do Mar .................................................................................................. 20 1.5.9 Amplitude Média das Marés .......................................................................................... 20 1.5.10 Altura Média Significativa de Onda ............................................................................ 21
1.5.11 Variação do Nível Médio do Mar ................................................................................ 22 1.5.12 Aspectos de Uso e Cobertura do Solo ........................................................................... 22 1.6 Aspectos Socioeconômicos ................................................................................................. 24 Capítulo II: Alterações Climáticas: Impactos, Vulnerabilidade, Adaptação e
Desenvolvimento Sustentável no Nordeste do Brasil 2.1 Introdução .......................................................................................................................... 27 2.2 Evolução da Abordagem da Vulnerabilidade e Interação à Mudança Climática ........... 28 2.3 Desenvolvimento de Indicadores de Vulnerabilidade ...................................................... 31 2.4 Vulnerabilidades das Comunidades à Adaptação ............................................................ 39 2.5 Mudanças Climáticas e a Adaptação ................................................................................ 41 2.6 Impactos Climáticos e a Vulnerabilidade ......................................................................... 44 2.7 Adaptação às Alterações Climáticas e o Desenvolvimento Sustentável ........................... 48

viii
Capítulo III: Aspectos Metodológicos
3.1 Conjunto de Dados ........................................................................................................... 51 3.2 Processamento de Dados Georreferenciados .................................................................... 52
3.2.1 Pré-processamento ........................................................................................................ 52 3.2.2 Detecção de Mudanças no Terreno ............................................................................... 52
3.2.2.1 Análises Vetorial .................................................................................................... 52 3.2.2.2 Realce Digital de Imagens ..................................................................................... 53
3.3 Análise de Dados ............................................................................................................... 54 3.3.1 Vulnerabilidade Natural ................................................................................................ 57 3.3.2 Vulnerabilidade Eco-Ambiental .................................................................................... 57 3.3.3 Vulnerabilidade Costeira .............................................................................................. 58 3.3.4 Avaliação de Risco Costeiro ......................................................................................... 60
Capítulo IV: Avaliação da Vulnerabilidade Natural e Ecológico-Ambiental
4.1 Introdução ......................................................................................................................... 63 4.2 Primeiro Artigo: Land use change detection for environmental management: using multi- temporal, satellite data in Apodi Valley of northeastern Brazil ............... 64 4.3 Segundo Artigo: Detecting and understanding drivers of natural and eco-environmental vulnerability due to hydro geophysical parameters, ecosystem and land use change through multispectral satellite data sets in Apodi estuarine, Northeast Brazil ...................................................................................... 81 4.4 Conclusão .......................................................................................................................... 97
Capítulo V: Avaliação da Vulnerabilidade Costeira e Análise de Risco
5.1 Introdução ......................................................................................................................... 98 5.2 Terceiro Artigo: Coastal ecological sensitivity and risk assessment: A case study of sea level change in Apodi River (Atlantic Ocean), Northeast Brazil ............ 100 5.3 Quarto Artigo: Coastal risk assessment and adaptation of the impact of sea-level rise, climate change and hazards: A RS and GIS based approach in Apodi- Mossoro estuary, Northeast Brazil .......................................................... 111 5.4 Conclusão ........................................................................................................................ 129 Capítulo VI: Avaliação dos Impactos das Mudanças Climáticas e as Ações de
Mitigação sobre o Ecossistema Estuarino 6.1 Introdução ........................................................................................................................ 131 6.2 Fatores Específicos que Influenciam o Risco .................................................................. 132 6.3 Desenvolvimento Sustentável, Adaptação e Mitigação ................................................... 145 6.4 Conclusões e Necessidades de Investigação ................................................................... 150

ix
Capítulo VII: Considerações Finais
7.1 Conclusões ........................................................................................................................ 152 7.2 Recomendações. ............................................................................................................... 158
Referências Bibliográficas
8 Referências Bibliográficas .................................................................................................. 160

x
Lista de Figuras
Figura 1.1 -
Figura 1.2 -
Localização da área de estudo no Estado do Rio Grande do Norte.
Mapa simplificado de vegetação do estuário Apodi-Mossoró – RN.
08
10
Figura 1.3 - Rede hidrográfica e mapa de infraestrutura, com base altimétrica obtida
do SRTM, da região do Canto do Amaro, no estuário Apodi-Mossoró.
12
Figura 1.4 - Mapa de solos simplificado do estuário Apodi-Mossoró - RN. 13
Figura 1.5 - Mapa simplificado da geomorfologia do estuário Apodi-Mossoró - RN. 14
Figura 1.6 - Mapa simplificado da geologia do estuário Apodi-Mossoró - RN. 16
Figura 1.7 - Erosão costeira e as variações no litoral do estuário Apodi-Mossoró
entre os anos de 2003-2010, baseados em imagens de satélite.
17
Figura 1.8 - Inclinação de trechos do litoral do estuário de Apodi-Mossoró. 19
Figura 1.9 - Mapa simplificado de uso e cobertura do solo no ano de 2009, com base
no CBERS-2B + imagem CCD HRC.
23
Figura1.10 - “Cavalos" de exploração de petróleo no leito arenoso do estuário do rio
Apodi-Mossoró – RN. Foto: V. E. Amaro, Jan/2010.
25
Figura 2.1 - Tradições nas pesquisas sobre o conceito de vulnerabilidade e sua
evolução (Adeger, 2006).
29
Figura 2.2 - ´Mudanças climáticas: processos, características e ameaças’, projetados
por Philippe Rekacewicz, UNEP/GRID–Arendal. Fonte: UNEP/GRID–
Arendal.
42
Figura 6.1 - A situação geral das áreas de baixa altitude no estuário do rio Apodi-
Mossoró. Foto: Ramos Ivanízio.
134
Figura 6.2 - A vegetação como uma barreira a proteção natural no estuário do rio
Apodi-Mossoró, mas que foi alterado pela construção de estrada sem
acompanhamento adequado das condições ambientais.
135
Figura 6.3 - Ação de ondas e correntes de maré na destruição de limites estuarinos,
em épocas de eventos catastróficos, afetando trechos estuarinos com
manguezais já impactados pela construção da estrada entre Grossos-
Tibau, no estuário Apodi-Mossoró. Foto: Telma Vieira.
136
Figura 6.4 - Erosão no estuário Apodi-Mossoró devido às chuvas intensas, sobre

xi
área de ocupação sem estudos ambientais adequados, como por
exemplo, sobre o risco potencial de assoreamento dos rios.
137
Figura 6.5 - Praia de Camapum, em Macau/RN, na foz do estuário Piranhas-Açu em
condições de maré alta, mostrando as dificuldades enfrentadas pelas
obras de engenharia na contenção da erosão costeira, sem os estudos
ambientais adequados, como por exemplo, sobre as forçantes
hidrodinâmicas na região em séries temporais de longo prazo. Foto:
Getúlio Moura.
138
Figura 6.6 - Vista aérea das áreas urbanas das cidades de Grossos (parte inferior da
foto) e Areia Branca (parte superior da foto), na foz do estuário Apodi-
Mossoró, evidenciando a complexidade da ocupação urbana dos
terrenos cercados pela indústria salineira e da carcinicultura e por
trechos com ambientes de alta sensibilidade ambiental (manguezais e
campos de dunas móveis). Esta foto mostra as dificuldades nas soluções
por obras de engenharia na contenção da erosão costeira e avanço do
nível do mar na região, sobretudo sem os estudos ambientais adequados,
como por exemplo, sobre as forçantes hidrodinâmicas na região em
séries temporais de longo prazo. Foto: Getúlio Moura.
139
Figura 6.7 - Configuração do sistema praias-duna no estuário do rio Apodi-Mossoró. 140
Figura 6.8 - Foz rio Apodi-Mossoró - RN. Foto: João Neto em 24/11/2008. 141
Figura 6.9 - Alagamentos nas proximidades da foz do estuário do rio Apodi-
Mossoró.
142
Figura6.10 - Enchente no estuário do rio Apodi-Mossoró e destruição de
infraestrutura essencial (estradas de acesso) por falta de estudos prévios
adequados do ambiente.
143
Figura6.11 - Enchente no estuário do rio Apodi-Mossoró, mostrando o sangradouro
de uma das barragens ao longo dos principais rios.
143
Figura6.12 - Inundações em períodos sazonais propensos a eventos extremos no
estuário do rio Apodi-Mossoró.
145
xii
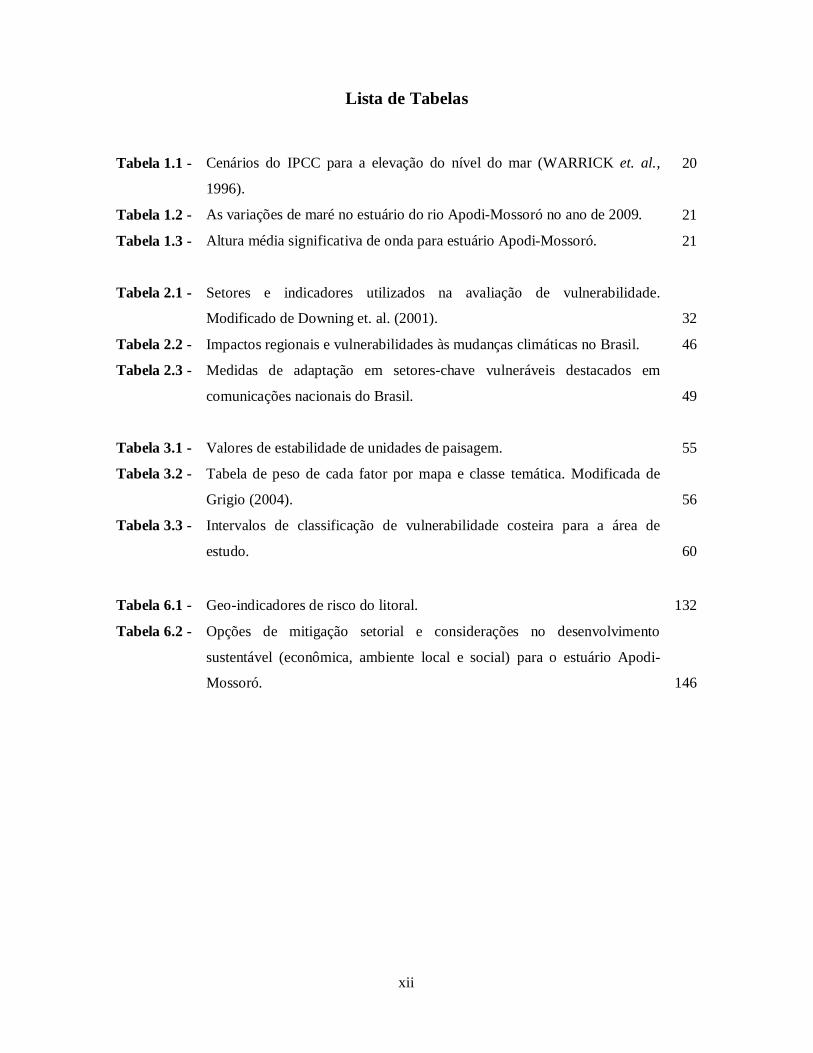
Lista de Tabelas
Tabela 1.1 - Cenários do IPCC para a elevação do nível do mar (WARRICK et. al.,
1996).
20
Tabela 1.2 - As variações de maré no estuário do rio Apodi-Mossoró no ano de 2009. 21
Tabela 1.3 - Altura média significativa de onda para estuário Apodi-Mossoró. 21
Tabela 2.1 - Setores e indicadores utilizados na avaliação de vulnerabilidade.
Modificado de Downing et. al. (2001).
32
Tabela 2.2 - Impactos regionais e vulnerabilidades às mudanças climáticas no Brasil. 46
Tabela 2.3 - Medidas de adaptação em setores-chave vulneráveis destacados em
comunicações nacionais do Brasil.
49
Tabela 3.1 - Valores de estabilidade de unidades de paisagem. 55
Tabela 3.2 - Tabela de peso de cada fator por mapa e classe temática. Modificada de
Grigio (2004).
56
Tabela 3.3 - Intervalos de classificação de vulnerabilidade costeira para a área de
estudo.
60
Tabela 6.1 - Geo-indicadores de risco do litoral. 132
Tabela 6.2 - Opções de mitigação setorial e considerações no desenvolvimento
sustentável (econômica, ambiente local e social) para o estuário Apodi-
Mossoró.
146
xiii
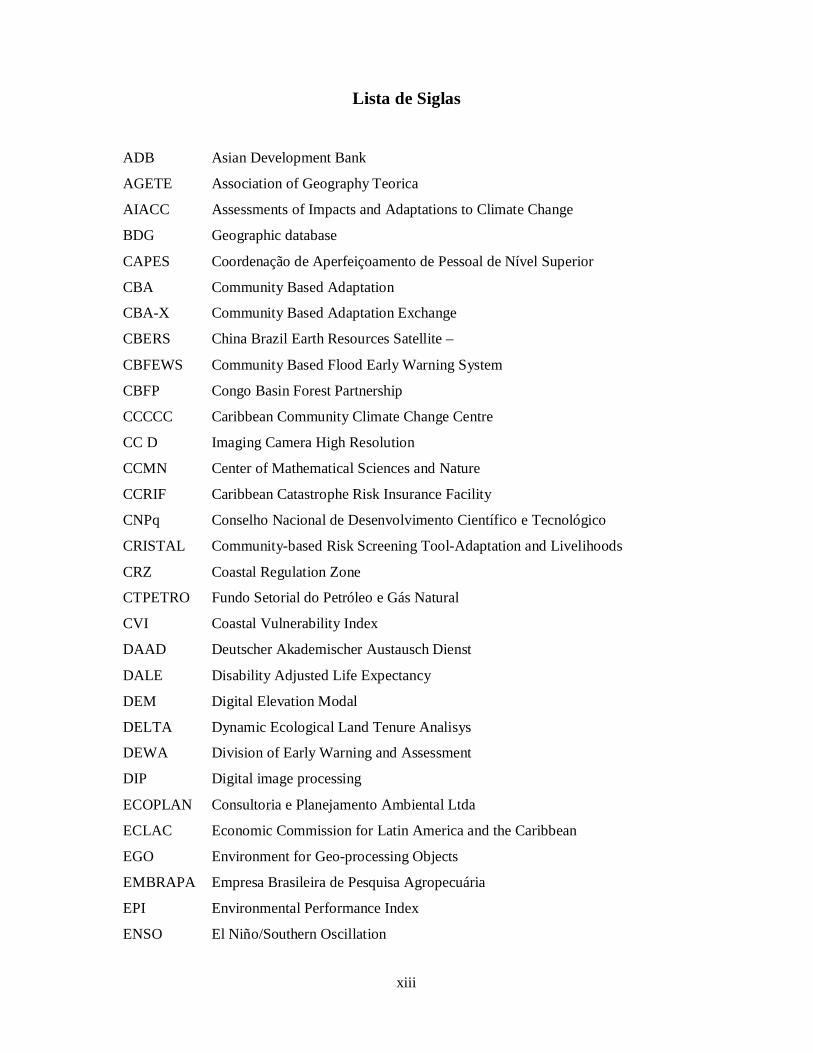
Lista de Siglas
ADB Asian Development Bank
AGETE Association of Geography Teorica
AIACC Assessments of Impacts and Adaptations to Climate Change
BDG Geographic database
CAPES Coordenação de Aperfeiçoamento de Pessoal de Nível Superior
CBA Community Based Adaptation
CBA-X Community Based Adaptation Exchange
CBERS China Brazil Earth Resources Satellite –
CBFEWS Community Based Flood Early Warning System
CBFP Congo Basin Forest Partnership
CCCCC Caribbean Community Climate Change Centre
CC D Imaging Camera High Resolution
CCMN Center of Mathematical Sciences and Nature
CCRIF Caribbean Catastrophe Risk Insurance Facility
CNPq Conselho Nacional de Desenvolvimento Científico e Tecnológico
CRISTAL Community-based Risk Screening Tool-Adaptation and Livelihoods
CRZ Coastal Regulation Zone
CTPETRO Fundo Setorial do Petróleo e Gás Natural
CVI Coastal Vulnerability Index
DAAD Deutscher Akademischer Austausch Dienst
DALE Disability Adjusted Life Expectancy
DEM Digital Elevation Modal
DELTA Dynamic Ecological Land Tenure Analisys
DEWA Division of Early Warning and Assessment
DIP Digital image processing
ECOPLAN Consultoria e Planejamento Ambiental Ltda
ECLAC Economic Commission for Latin America and the Caribbean
EGO Environment for Geo-processing Objects
EMBRAPA Empresa Brasileira de Pesquisa Agropecuária
EPI Environmental Performance Index
ENSO El Niño/Southern Oscillation

xiv
ESI Environmental Sustainability Index
ESRI Environmental Systems Research Institute
EVI Environmental Vulnerability Index
ETM Enhanced Thematic Mapper Plus
FAO Food and Agriculture Organization
FINEP Financiadora de Estudos e Projetos
GCP Ground Control Points
GCOS Global Climate Observing System
GECHS Global Environmental Change and Human Security
GDP Gross Domestic Products
GEOPRO Laboratório de Geoprocessamento / UFRN
GEF Global Environmental facility
GHGs Green House Gases
GPI Genuine Progress Indicator
GPS Global Positioning System
GRAVITY Global Risk and Vulnerability Trends per Year
GRI Global Reporting Initiative
IDEMA Instituto de Desenvolvimento e Meio Ambiente do Rio Grande do Norte
HANPP Human Appropriation of Net Primary Production
HDI Human Development Index
IGBP International Geosphere-Biosphere Program
IHI Index of Human Insecurity
IHDP International Human Dimensions Program on Global Environmental
Change
INC Intergovernmental Negotiating Committee
INCRA Instituto Nacional de Colonização e Reforma Agrária
INECE International Network for Environmental Compliance and Enforcement
IPCC Intergovernmental Panel on Climate Change
ISEW Index of Sustainable Economic Welfare
ITCZ Zona de Convergência Intertropical
LAGEOP Laboratório de Geoprocessamento / UFMG
LCA Linking Climate Adaptation
LDCF Least Developed Countries Fund
LEED Leadership in Energy and Environmental Design
xv
MARPETRO Monitoramento Geoambiental de Áreas Costeiras na Zona Petrolífera de
Macau/RN
MDGs Millennium Development Goals
MEAs Multilateral Environmental Agreements
MLC Maximum Likelihood Classification
MNF Maximum Noise Fraction
NAPAs National Adaptation Programmes of Action
NAPC Noise-Adjusted Principal Components
NE Northeast
OECD Organization for Economic Cooperation and Development
OECS Organization of Eastern Caribbean States
PCA Principal Component Analyses
PIF Pacific Islands Forum
PPGG Programa de Pós-Graduação em Geodinâmica e Geofísica
PRECIS Providing Regional Climates for Impacts Studies
PREVIEW Project for Risk Evaluation, Vulnerability, Information and Early
Warning
RGB Red -- Green - Blue
RGBI Red -- Green - Blue - Intensity
RMS Root mean square error
RN Rio Grande do Norte
SBC Sociedade Brasileira de Cartografia
GIS Geographic Information System
RS Remote Sensing
SCCF Special Climate Change Fund
SGP Small Grants Programme
SIDS Small Island Developing States
SISs Small Island States
SLR Sea Level Rise
SPA Strategic Priority on Adaptation
SPC Secretariat of the Pacific Community
SPREP Pacific Regional Environment Programme
SNA System of National Accounts
SRTM Shuttle Radar Topography Mission

xvi
START System for Analysis, Research and Training
SUDENE Superintendência do Desenvolvimento do Nordeste
UFMG Universidade Federal de Minas Gerais
UFRJ Universidade Federal do Rio de Janeiro
UFRN Universidade Federal do Rio Grande do Norte
UNCSD United Nations Commission on Sustainable Development
UNDP United Nations Development
UNEP United Nations Environment
UNESP Universidade Estadual de São Paulo (State University of São Paulo)
UNFCCC United Nations Framework Convention on Climate Change
UNU–EHS United Nations University Institute for Environment and Human Security
USD United State Dollar
USGS United States Geological Survey
WHO World Health Organization
WPI Water Poverty Index
1
Capítulo I: O Estuário do Rio Apodi-Mossoró: Uma Região que Experimenta a Rápida Mudança da Vulnerabilidade Eco-Ambiental
1.1 Introdução
O estuário do rio Apodi-Mossoró está localizado no litoral norte do Estado do Rio
Grande do Norte (RN), mais especificamente na região centro-oeste da Bacia Potiguar,
envolve os municípios de Mossoró, Areia Branca e Grossos. O rio Apodi é o segundo rio em
extensão do RN, com a foz no Oceano Atlântico entre os municípios de Grossos e Areia
Branca. A área de estudo tem dimensões de cerca de 1.372,79 km².
Trata-se de uma região de alta sensibilidade ambiental sujeita a ampla pressão de
atividades humanas, o que resulta em degradação ambiental, principalmente devido às
condicionantes socioeconômicas predominantes, como a industrialização não-gerenciada;
degradação da vegetação nativa por pastagens; desertificação; alta taxa de exploração de
petróleo e gás natural; ampla utilização de pesticidas nas fazendas de frutas tropicais;
ocupação de áreas inundáveis por fazendas de camarão e pela indústria do sal marinho;
invasão de terras agrícolas por campos de dunas móveis; áreas degradadas nos entornos dos
núcleos urbanos; assoreamento dos rios; inundações frequentes; alta dinâmica costeira com
efeitos de erosão/acresção de linha de costa; elevação do nível do mar (SLR de Sea Level
Rise); topografia baixa; trechos de alto valor ecológico e turístico sob impacto da urbanização
acelerada e da erosão hídrica.
As políticas governamentais, nos diferentes níveis de jurisdição, são fatores principais
para a proteção ecológica-ambiental de ecossistemas e recursos naturais primários (terra, água
e biomassa) sob contínuo aumento da pressão de uso e ocupação do solo. Especialmente em
regiões semi-áridas, com chuvas irregulares, essas constantes alterações no uso do solo, e
consequentemente na vulnerabilidade ambiental, podem resultar em uma deterioração
irreversível do ambiente natural, devido a processos de degradação dos solos.
O RN tem um grande potencial para o desenvolvimento socioeconômico, sendo o
maior produtor nacional de sal marinho (95% da produção nacional) e com fruticultura
irrigada (entre os três estados mais importantes do Nordeste do Brasil, com um rendimento de
2,5 culturas/anoi IDEMA, 2007) e, no cômputo nacional, um dos maiores produtores de
petróleo e gás natural, com enormes reservas em avaliação. A economia do estado está em
fase de expansão, atraindo grandes indústrias, como mostra um parque de cerâmica em uma

2
fase de consolidação, que depende do gás natural já disponível para esse fim, além dos
parques eólicos.
O potencial turístico na área do estuário do rio Apodi-Mossoró, com águas termais, as
salinas, as praias de Grossos e Areia Branca e do rio Apodi, também representa uma
importante fonte de emprego para as cidades da região. No entanto, a rápida urbanização, o
consequente aumento da população, as atividades econômicas e o turismo desorganizado nas
faixas litorâneas têm causado danos ao meio ambiente, degradação de ecossistemas de alta
sensibilidade ambiental (campos de dunas móveis, manguezais, ilhas barreiras, entre outros),
ameaçando a biodiversidade e a paisagem natural.
A legislação ambiental do Brasil (Lei Federal 7.803 de 18/07/1989) define as Áreas de
Preservação Permanente (APP) e considera crime ambiental qualquer intervenção
desautorizada nas APP (Lei Federal 9.605 de 12/02/1998), mas nota-se no RN que tais áreas
foram amplamente devastadas no decorrer das últimas décadas e, atualmente, muitas destas
áreas são ocupadas por atividades industriais. O ecossistema caatinga também começou a ser
ocupado pela atividade do camarão, por salinas e em especial pela indústria do petróleo. O
uso de agrotóxicos em áreas agrícolas de fruticultura tem ampliado a preocupação com o
comprometimento dos aqüíferos, como também pelo uso intensivo de água pela indústria
petrolífera, com o desmatamento indiscriminado, os riscos de derramamentos de petróleo, os
aterros não-geridos de resíduos líquidos e sólidos, sem qualquer cuidado ambiental e o
descarte de resíduos de todas as procedências no rio Apodi, o que provavemente pode ter
contaminado e degradado vastas áreas do meio ambiente estuarino, além de ter incentivado o
processo de desertificação.
Em países como o Brasil, onde a faixa litorânea é muito longa, o mapeamento dos
recursos naturais costeiros por técnicas convencionais é uma tarefa difícil, principalmente
devido à sua grande extensão. O emprego de images de satélites de sensoriamento remoto é
uma das ferramentas mais eficazes que podem ser utilizados para o mapeamento desses
recursos naturais de uma maneira rápida e precisa. Isto é possível devido à natureza repetitiva
e da visão sinóptica dos produtos de sensoriamento remoto, sobretudo dos orbitais ampla
repetitividade. Portanto, a elaboração de mapas temáticos e a avaliação da vulnerabilidade
natural e ambiental costeira através do emprego de imagens de sensoriamento remoto (SR) e
do sistema de informações geográficas (SIG) foi a temática neste trabalho. Esta estratégia
metodológica está fortemente ligada aos valores eco-ambientais e socioeconômicos atribuídos
aos elementos do litoral. As eventuais alterações a estes valores irão auxiliar na seleção e
interpretação das respostas possíveis às condições de mudança, como a SLR, a interferência
3
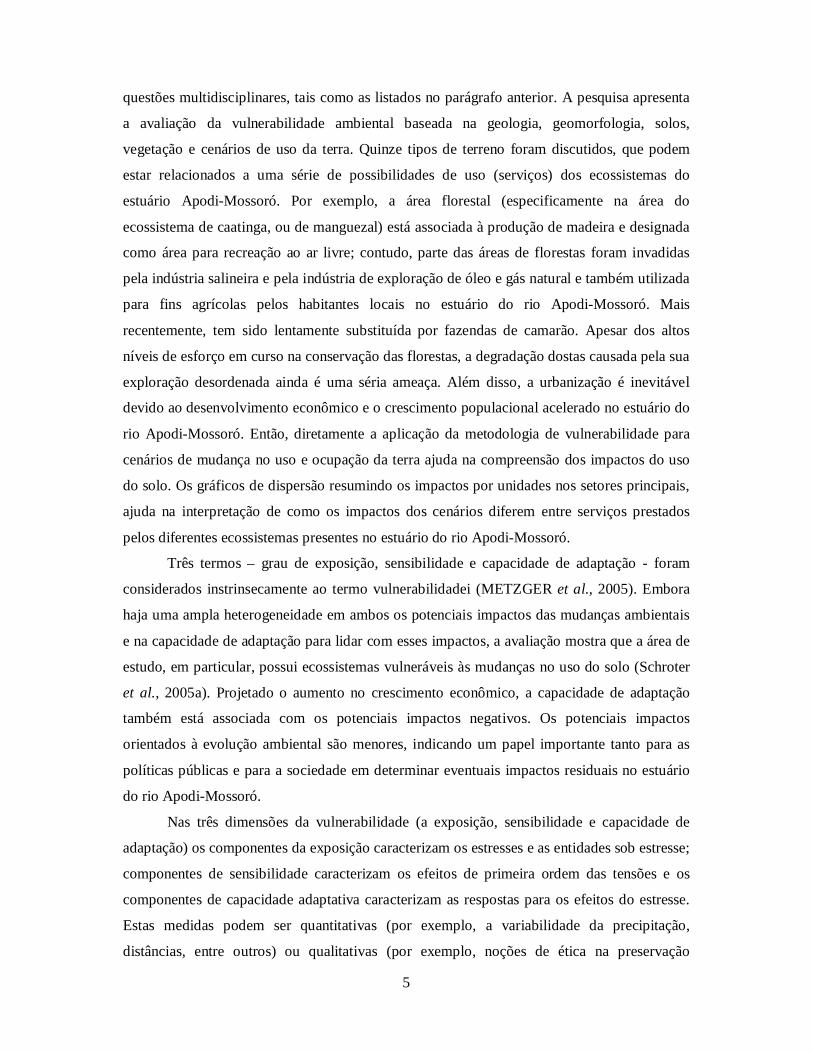
humana e outras mudanças climáticas, como a aceleração dos ventos (CAPOBIANCO et
al.,1999). Os resultados da avaliação da sensibilidade será muito útil no plano de gestão
integrada da zona costeira (SNOUSSI et al., 2008 e AL-JENEID et al., 2008).
Um Índice de Vulnerabilidade Costeira (CVI) foi usado para mapear a sensibilidade
relativa da costa para SLR futuros na área de estudo. Thieler e Hammer (1999) concluíram a
avaliação dos riscos de sensibilidade costeira ao longo de várias costas baseado na obra de
Gornitz (1990). Eles incorporaram seis variáveis físicas costeiras: geomorfologia, a taxa de
mudança litoral, declividade costeira, média de intervalo de maré, média de altura
significativa de onda e SLR. Um dos principais objetivos deste estudo foi desenvolver um
CVI para a erosão costeira e usá-lo para avaliar o impacto ao longo da zona costeira de
influência do rio Apodi-Mossoró, com vista a identificar e quantificar as zonas costeiras mais
vulneráveis do estuário Apodi-Mossoró devido ao SLR e a perda de terras devido à erosão
costeira.
As imagens de SR submetidas às técnicas de PDI, integradas em SIG e validadas por
dados de campo permitiram o acompanhamento/planejamento da distribuição de várias
classes de feições do terreno, o que auxiliaria no suporte ao controle de riscos ambientais e
desastres naturais. Esta pesquisa estimou os recursos naturais da área de estudo e a sua
eficácia no mapeamento de recursos naturais e na gestão adequada para utilização futura das
informações ambientais. O trabalho de investigação implicou na utilização máxima dos
recursos naturais existentes na área de estudo úteis para promover o desenvolvimento
sustentável e, ao mesmo tempo, assegurar a proteção dos frágeis ecossistemas do estuário
Apodi-Mossoró. A capacidade futura dos ecossistemas dependem principalmente de sua
resiliência aos impactos naturais, ambientais e humanos. As análises foram baseadas nos
seguintes fatores básicos.
A) Fatores naturais:
1. Fatores climáticos: índice de seca, precipitação, vento, temperatura, ondas, marés;
2. Fatores topográficos: elevação, inclinação e direção de vertentes;
3. Fatores físicos: geologia, geomorfologia, solos/associação de solos, vegetação, uso
da terra, hidrologia;
B) Fatores ambientais: riscos a erosão, biogeografia e biodiversidade;
C) Fatores humanos: densidade rodoviária, densidade demográfica, socioeconomia.

4
A pesquisa realizou a avaliação do impacto da vulnerabilidade do sistema humano-
ambiente sob tais mudanças ambientais e dá resposta da questões importantes da política
multidisciplinar relevantes no estuário do rio Apodi-Mossoró, conforme a proposta de
Metzger et al. (2005) que questiona: quais são as principais regiões ou setores que são
vulneráveis à mudança ambiental? Como as vulnerabilidades dos vários setores se
comparam? Qual é o cenário futuro menos mais prejudicial para um determinado setor?
1.2 O Conceito de Vulnerabilidade
A linguagem desenvolvida pelo Intergovernmental Panel on Climate Change ou
Painel Intergovernamental sobre Mudanças Climáticas (Sigla IPCC) formam um ponto de
partida para explicar os diferentes elementos da definição de vulnerabilidade aqui empregada.
O IPCC, em seus relatórios, descreve a
Vulnerabilidade como “O grau em que um sistema é suscetível, ou incapaz de lidar com aos efeitos adversos das mudanças climáticas, incluindo a variabilidade climática e os eventos extremos. Vulnerabilidade é uma função do caráter, amplitude e taxa de variação climática à qual um sistema é exposto, sua sensibilidade e sua capacidade de adaptação”. Exposição é definido como “A natureza e o grau das mudanças climáticas significativas ao qual um sistema está exposto”. Sensibilidade é “O grau em que um sistema é afetado, negativamente ou vantajosamente, por estímulos relacionados ao clima. O efeito pode ser direto (por exemplo, uma alteração no rendimento das culturas em resposta a uma alteração na média, intervalo ou variabilidade da temperatura) ou indireta (por exemplo, danos causados por um aumento na freqüência de inundações costeiras devido à elevação do nível do mar)". Capacidade de adaptação é "A capacidade que possui um sistema em se ajustar às alterações climáticas (incluindo mudanças climáticas e eventos extremos) para moderar danos potenciais, para aproveitar oportunidades, ou para lidar com as consequências," (IPCC, 2001).
Assim, nesta primeira seção da Tese, define-se e explica-se os vários elementos
envolvidos no conceito de vulnerabilidade, incluindo a sensibilidade, o grau de exposição, a
resiliência e a capacidade de adaptação, assin o desafio é o “Como?” estes elementos são
combinados para formar mapas de vulnerabilidade. Em seguida, é explicada a derivação dos
fatores básicos, tais como geologia, geomorfologia, solos, vegetação e cenários de uso da
terra (ROUNSEVELL et al., 2005). Finalmente, a avaliação da vulnerabilidade destes
cenários é apresentada, com base em indicadores dos ecossistemas e do uso da terra no
estuário do rio Apodi-Mossoró.
O modelo utiliza uma nova abordagem para a avaliação do ecossistema, integrando os
potenciais impactos em uma avaliação de vulnerabilidade, que podem ajudar a responder
5
questões multidisciplinares, tais como as listados no parágrafo anterior. A pesquisa apresenta
a avaliação da vulnerabilidade ambiental baseada na geologia, geomorfologia, solos,
vegetação e cenários de uso da terra. Quinze tipos de terreno foram discutidos, que podem
estar relacionados a uma série de possibilidades de uso (serviços) dos ecossistemas do
estuário Apodi-Mossoró. Por exemplo, a área florestal (especificamente na área do
ecossistema de caatinga, ou de manguezal) está associada à produção de madeira e designada
como área para recreação ao ar livre; contudo, parte das áreas de florestas foram invadidas
pela indústria salineira e pela indústria de exploração de óleo e gás natural e também utilizada
para fins agrícolas pelos habitantes locais no estuário do rio Apodi-Mossoró. Mais
recentemente, tem sido lentamente substituída por fazendas de camarão. Apesar dos altos
níveis de esforço em curso na conservação das florestas, a degradação dostas causada pela sua
exploração desordenada ainda é uma séria ameaça. Além disso, a urbanização é inevitável
devido ao desenvolvimento econômico e o crescimento populacional acelerado no estuário do
rio Apodi-Mossoró. Então, diretamente a aplicação da metodologia de vulnerabilidade para
cenários de mudança no uso e ocupação da terra ajuda na compreensão dos impactos do uso
do solo. Os gráficos de dispersão resumindo os impactos por unidades nos setores principais,
ajuda na interpretação de como os impactos dos cenários diferem entre serviços prestados
pelos diferentes ecossistemas presentes no estuário do rio Apodi-Mossoró.
Três termos – grau de exposição, sensibilidade e capacidade de adaptação - foram
considerados instrinsecamente ao termo vulnerabilidadei (METZGER et al., 2005). Embora
haja uma ampla heterogeneidade em ambos os potenciais impactos das mudanças ambientais
e na capacidade de adaptação para lidar com esses impactos, a avaliação mostra que a área de
estudo, em particular, possui ecossistemas vulneráveis às mudanças no uso do solo (Schroter
et al., 2005a). Projetado o aumento no crescimento econômico, a capacidade de adaptação
também está associada com os potenciais impactos negativos. Os potenciais impactos
orientados à evolução ambiental são menores, indicando um papel importante tanto para as
políticas públicas e para a sociedade em determinar eventuais impactos residuais no estuário
do rio Apodi-Mossoró.
Nas três dimensões da vulnerabilidade (a exposição, sensibilidade e capacidade de
adaptação) os componentes da exposição caracterizam os estresses e as entidades sob estresse;
componentes de sensibilidade caracterizam os efeitos de primeira ordem das tensões e os
componentes de capacidade adaptativa caracterizam as respostas para os efeitos do estresse.
Estas medidas podem ser quantitativas (por exemplo, a variabilidade da precipitação,
distâncias, entre outros) ou qualitativas (por exemplo, noções de ética na preservação

6
ambiental). Outro ponto de vista ligeiramente diferente, favorecido pela pesquisa quanto aos
riscos e desastres nas comunidades é que a capacidade de adaptação consiste em dois
subcomponentes: a capacidade de enfrentamento a resiliência. A capacidade de resposta é a
capacidade de pessoas e lugares para suportar o dano; a resiliência é a capacidade de se
recuperar após a exposição ao evento danoso, mesmo que as pessoas e lugares sofram danos
consideráveis. Em ambos os casos, os indivíduos e as comunidades podem tomar medidas
para aumentar suas habilidades para enfrentar e se recuperar, novamente dependendo dos
aspectos físico, social, econômica, e até mesmo espiritual, entre outros recursos a que tenham
acesso no âmbito do estuário do rio Apodi-Mossoró.
Outra questão básica para a avaliação é o modelo de ponderação empregado (ou seja,
atribuir pesos para cada fator) de acordo com os seus efeitos relativos dos fatores
considerados na vulnerabilidade eco-ambiental, em uma dada camada temática. O processo de
hierarquia analítica é uma teoria que lida com complexos problemas tecnológicos,
econômicos e sócio-políticos (SAATY; VARGAS, 1991). É um método adequado para
determinar os pesos atribuídos a cada fator. O grau de adesão em diferentes níveis de índices
foi integrado de acordo com o peso total e o grau de adesão para as diferentes camadas
sistemáticas foram utilizados para calcular a vulnerabilidade natural e ambiental da área de
estudo. A aplicação das ponderações subjetivas, por um lado, dá alguma indicação de como a
importância relativa dos diferentes fatores podem variar com o contexto a que estiverem
relacionados e também pode mostrar o quão sensível estão as avaliações e a percepção da
comunidade de especialistas quanto a vulnerabilidade eco-ambientais para o estuário Apodi-
Mossoró.
1.3 Motivação e Objetivos
O objetivo deste trabalho foi a análise e caracterização dos recursos naturais em
formas de uso e ocupação do solo, associada à avaliação do impacto ambiental da dinâmica
costeira no estuário do rio Apodi-Mossoró, durante as últimas três décadas, tempo que
permitiu identificar e avaliar áreas de risco e setores de impacto ambiental decorrente da
ocupação antrópica, especialmente das atividades industriais. Os dados de SR, técnicas de
PDI e metodologias analíticas de SIG foram aplicadas ao domínio temporal e espacial para
identificar os problemas e perspectivas da gestão dos recursos naturais e ambientais da zona
litorânea e para subsidiar um plano específico para o desenvolvimento sustentável,
conservação e manejo dos recursos naturais na área de estudo. A distribuição da

7
vulnerabilidade natural e eco-ambiental e sua mudança dinâmica foram analisados e
discutidos. A intenção da pesquisa foi detectar os padrões espaciais e temporais da
vulnerabilidade natural e eco-ambientais devido ao uso e cobertura da terra, à sensibilidade
ambiental dos ecossistemas, as mudanças no nível do mar e as alterações socioeconómicas do
estuário Apodi-Mossoró para obter um conhecimento mais profundo quanto aos mecanismos
dessas alterações e, em seguida reclassificar a vulnerabilidade e avaliar os riscos ambientais.
Outros objetivos específicos agregados à pesquisa incluiram:
1. Elaborar um banco de dados espaço-temporal das unidades geoambientais,
geomorfologia, geologia, solo, declividade, vegetação, corpos d'água superficiais e
sistema de drenagem, entre outros, do estuário do rio Apodi-Mossoró, por meio do uso
de dados de sensoriamento remoto ópticos de resoluções moderadas e altas (dados
LANDSAT, SPOT, CBERS e IKONOS), de caráter multitemporais; e do conjunto de
dados de radar (imagens SRTM e RADARSAT);
2. Estudar a evolução morfológica do estuário do rio Apodi-Mossoró, durante um
período de tempo com vistas à análise da variação espacial da erosão e deposição por
análise de Modelos Digitais de Elevação (DEM), construído a partir de dados de radar;
3. Elaborar uma base de dados não-espaciais, como dados demográficos, dados de
ocupação e dados relacionados com as instalações em geral, incluindo aspectos
energéticos, disponíveis na área de estudo;
4. Desenvolver um ambiente SIG que permita a análise de dados e a elaboração de mapas
de vulnerabilidade natural, eco-ambientais e de risco;
5. Avaliar as mudanças na área de estudo entre os anos de 1986 a 2009;
6. Desenvolver um sistema de suporte às decisões sobre a gestão ambiental, diagnóstico
e controle de riscos ambientais no estuário do rio Apodi-Mossoró.
Assim, pode-se afirmar de forma sucinta que o objeto principal deste trabalho foi
analisar e interpretar os mapas temáticos e identificar as vulnerabilidades natural e eco-
ambiental com vistas à avaliação de riscos no estuário do rio Apodi-Mossoró, para apoiar
ações de monitoramento e gestão ambiental dessas áreas.

8
1.4 Área de Estudo
A área de estudo está localizada na porção noroeste do RN, ao longo do baixo curso
do rio Apodi-Mossoró. Este rio origina-se nas proximidades da cidade de Apodi na região
semi-árida do Nordeste do Brasil, e flui para NE em direção a Mossoró, Areia Branca e
Grossos, todos municípios do RN, e deságua diretamente no Oceano Atlântico (Figura 1.1).
As coordenadas geográficas da área de estudo estão limitadas pela latitude 04°55'46,77" to
05°13'39"S e longitude 37°01'30,79" a 37°22'42,42"E.
Figura 1.1 – Localização da área de estudo no Estado do Rio Grande do Norte.
9
O clima da região é semi-árido e do tipo tropical seco na faixa litorânea (Köppen
1948), com temperatura média anual de cerca de 27,5°C. Novembro é a estação mais quente,
com temperaturas máximas superiores a 40°C. A amplitude térmica diária é geralmente entre
8-10°C, com variações anuais em torno de 5°C.
A precipitação média é de 700-900mm/ano e na maior parte concentrada nos meses de
fevereiro-abril (RADAMBRASIL, 1981), mas é acompanhado de elevada evapotranspiração
potencial com valores acima de 2.000mm/ano. Tais mudanças climáticas podeser explicadas
pelo movimento da Zona de Convergência Intertropical (ZCIT), onde os períodos de seca
estão relacionados ao seu afastamento da costa, causando a falta de chuvas e na área os ventos
fortes, enquanto os períodos de chuva estão relacionados ao seu deslocamento para o sul, e
relativos ventos leves. A umidade relativa média do ar é da ordem de 68,7% e pode variar
durante o ano em até 20%, sendo a menor em setembro com 59,9% e maior em abril com
78,1% (IDEMA, 1999; MAFRA, 2002).
Toda a região Nordeste do Brasil é caracterizada pela alta incidência de energia solar,
com regime térmico uniforme caracterizado por temperaturas elevadas e pequenas variações
durante o ano. Isto é devido a fatores geográficos da região, como a baixa latitude,
proximidade do mar e do relevo suave a ondulado. A insolação no estuário Apodi-Mossoró é
a maior do Brasil, alcançando em média 2,900 horas/ano, equivalente a 8 horas de sol diárias.
A variação média mensal relatada no ano foi de um mínimo de 6,3 horas/dia até um máximo
de 9,5 horas/dia, medida na Estação Meteorológica de Macau-RN.
A velocidade e direção dos ventos influenciam diretamente os processos costeiros e é
a geração de ondas. Trata-se um agente determinante na dinâmica de transporte dos
sedimentos nas praias. A velocidade média dos ventos descrita na área de estudo é de 5 m/s
em abril e 9m/s no período de agosto a outubro, mas pode atingir até 18 m/s durante o mês de
agosto (CHAVES; VITAL, 2001).
As principais atividades econômicas da região são a produção industrial de óleo e gás
natural, de camarão, de sal marinho, da pesca (também artesanal), da agricultura (sobretudo a
fruticultura) e do turismo. Ocorre ainda um aumento na urbanização ao longo da costa soba
influência do estuário do rio Apodi-Mossoró. Além destes, o litoral é reconhecido pelos
ecossistemas litorâneos, com manguezais, caatinga e longas praias arenosas (AMARO;
ARAÚJO, 2008). Todos esses fatores de alta sensibilidade na costa e estuário do rio Apodi-
Mossoró aumentam sua sensibilidade ambiental em cenários futuros de SLR.

10
1.5 Características Fisiográficas
No caso de características fisiográficas, o Brasil pode ser considerado como um "país-
continente", devido à uma variedade de climas, vegetação, relevo, hidrografia, entre outros.
Tais fatores são relevantes na geração da vulnerabilidade eco-ambiental e mapas de risco
ambiental no estuário do rio Apodi-Mossoró.
1.5.1 Cobertura Vegetal
O mapeamento da vegetação foi realizado com vetorização via tela de computador
(head up), usando imagens processadas do satélite CBERS-2B para o ano de 2009, e
comparados a mapas de vegetação de levantamentos pretéritos, como aquele feito por Amaro
(2002). Além das área ocupadas por agricultura industrial e/ou de subsistência, dois principais
tipos de cobertura vegetal foram definidas na área de estudo: vegetação de caatinga e
vegetação costeira (Figura 1.2).
Figura 1.2 - Mapa simplificado da cobertura vegetal presente no estuário Apodi-Mossoró-RN.
11
1.5.1.1 Vegetação de Caatinga
Três tipos podem ser distintos: (i) Caatinga arbustiva densa e baixa - representa a
vegetação da caatinga, com predominância de indivíduos de árvore pequena e com presença
de arbustos, sem áreas descobertas de vegetação; (ii) Caatinga arbustiva fechada -
corresponde à vegetação com predomínio de arbustos e indivíduos arbóreos, com vegetação
compacta e sem lacunas, e (iii) Caatinga arbustiva aberta - caracterizada pela ausência de
indivíduos de espécies arbóreas e como as demais espécies arbustivas, por vezes com
clareiras.
1.5.1.2 Vegetação Costeira
Dois tipos podem ser distintos: (i) Vegetação de manguezal - ecossistema costeiro
dominado por plantas tropicais e animais típicos, em solo da planície de maré, adaptadas
periodicamente à inundação pelas marés, o que causa uma ampla flutuação dos teores de
salinidade; (ii) Vegetação halófila – ocorre sobretudo na faixa litorânea, como vegetação que
suporta alta salinidade, devido ao clima semi-árido que provoca uma grande evaporação e
penetração da água do mar nas áreas de baixa topografia e marginais aos cursos d'água, como
por exemplo o pirrixiu e o breda, às vezes associada com a árvore de palma de carnaúba
(KUHLMANN, 1977).
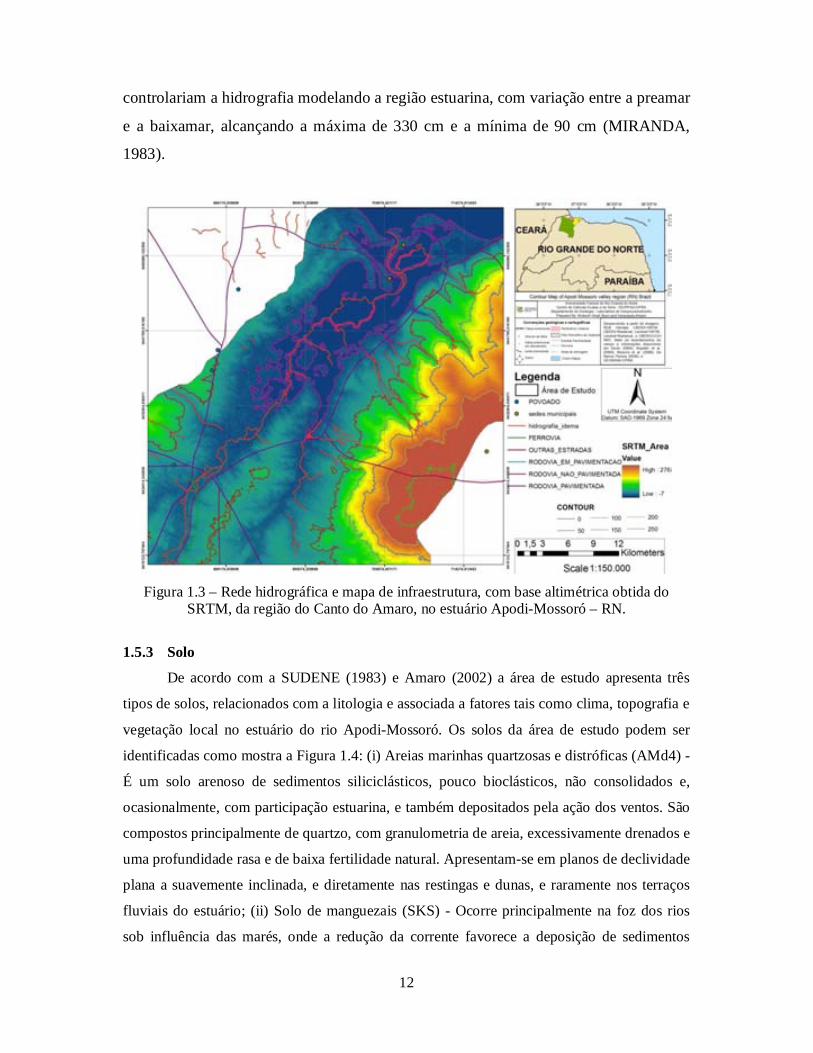
1.5.2 Recursos Hídricos
A Figura 1.3 mostra o mapa hidrográfico da região do Canto do Amaro, principal área
onshore de ocupação das atividades petrolíferas na região estuarina, já estruturados em SIG,
que apresenta as principais drenagens e corpos d'água no estuário do rio Apodi-Mossoró e
também toda a infraestrutura da região, tais como estradas, caminhos, propriedades, entre
outras facilidades, juntamente com todos as localidades. Para a elaboração deste mapa foi
utilizado como base o mapa planialtimétrico da SUDENE, os dados altimétricos obtidos da
SRTM (Shuttle Radar Topography Mission) e as imagens CBERS 2B, para a atualização e
mapeamento das contornos e dos detalhes de drenagens e demais limites.
Segundo Amaro (2002), o estuário Apodi-Mossoró está inserido na segunda
maior bacia hidrográfica do litoral norte potiguar, onde os principais rios desse
estuário recebem contribuições do continente por meio de drenagens ativas apenas
durante o período chuvoso e com vazões reduzidas. No baixo curso do rio Apodi-
Mossoró, o canal fluvial passa a ter influência integral da ação das marés, que então
12
controlariam a hidrografia modelando a região estuarina, com variação entre a preamar
e a baixamar, alcançando a máxima de 330 cm e a mínima de 90 cm (MIRANDA,
1983).
Figura 1.3 – Rede hidrográfica e mapa de infraestrutura, com base altimétrica obtida do
SRTM, da região do Canto do Amaro, no estuário Apodi-Mossoró – RN.
1.5.3 Solo
De acordo com a SUDENE (1983) e Amaro (2002) a área de estudo apresenta três
tipos de solos, relacionados com a litologia e associada a fatores tais como clima, topografia e
vegetação local no estuário do rio Apodi-Mossoró. Os solos da área de estudo podem ser
identificadas como mostra a Figura 1.4: (i) Areias marinhas quartzosas e distróficas (AMd4) -
É um solo arenoso de sedimentos siliciclásticos, pouco bioclásticos, não consolidados e,
ocasionalmente, com participação estuarina, e também depositados pela ação dos ventos. São
compostos principalmente de quartzo, com granulometria de areia, excessivamente drenados e
uma profundidade rasa e de baixa fertilidade natural. Apresentam-se em planos de declividade
plana a suavemente inclinada, e diretamente nas restingas e dunas, e raramente nos terraços
fluviais do estuário; (ii) Solo de manguezais (SKS) - Ocorre principalmente na foz dos rios
sob influência das marés, onde a redução da corrente favorece a deposição de sedimentos

13
finos misturados com resíduos de material orgânico e às vezes areia. Os solos são pouco
desenvolvidos, muito mal drenados, com alto teor de sal da água do mar e que não suportam o
uso para fins agrícolas. Isso mostra a capacidade do solo para preservar a fauna e a flora, rica
em matéria orgânica (Figura 1.4); (iii) Solo vermelho-amarelo podzólico (LVPe1) -
Caracterizado por uma fertilidade média, com alta, textura média e fortemente drenados.
Ocorrem em relevo pouco planos, mas pode ser muito utilizada para a agricultura desde que
sanado o problema da falta de água, causada pelo longo período de estiagem e da alta taxa de
evaporação. Apesar de ser pouco cultivado, podem produzir de milho, feijão e mandioca, de
modo que a aptidão agrícola da maior parte da região é dominada por essas culturas, mas são
apropriados especialmente para culturas de ciclo longo (como algodão arbóreo, sisal, caju e
coco). Para o sul apresenta uma capacidade limitada regulada por pastagens.
Figura 1.4 - Mapa de solos simplificado do estuário Apodi-Mossoró – RN.
1.5.4 Aspecto Geomorfológico
O mapa geomorfológico foi elaborado a partir da releitura de dados sobre o Mapa
Geomorfológico do Rio Grande do Norte do Projeto RADAMBRASIL (1981), revistos nos
dados do IDEMA (1999) e Amaro (2002) e então atualizadas sobre as imagens do LANDSAT
7-ETM + e CBERS 2B. A seguir foram apresentadas sucintamente as principais unidades
14
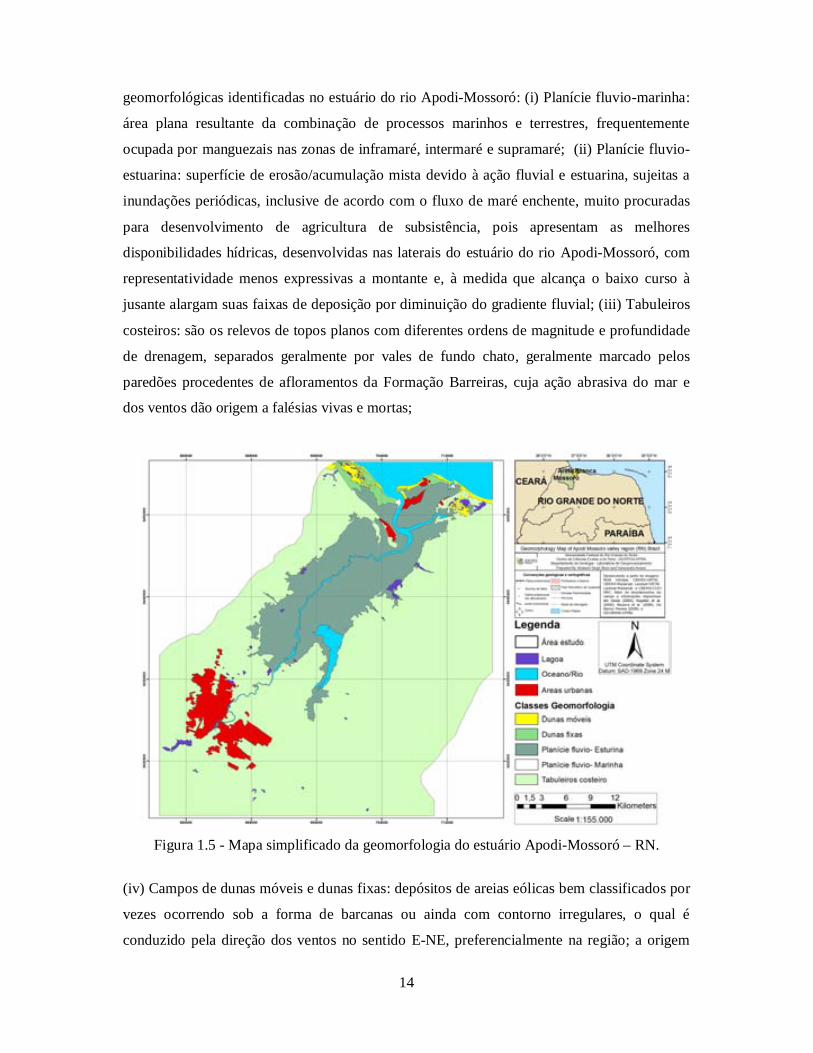
geomorfológicas identificadas no estuário do rio Apodi-Mossoró: (i) Planície fluvio-marinha:
área plana resultante da combinação de processos marinhos e terrestres, frequentemente
ocupada por manguezais nas zonas de inframaré, intermaré e supramaré; (ii) Planície fluvio-
estuarina: superfície de erosão/acumulação mista devido à ação fluvial e estuarina, sujeitas a
inundações periódicas, inclusive de acordo com o fluxo de maré enchente, muito procuradas
para desenvolvimento de agricultura de subsistência, pois apresentam as melhores
disponibilidades hídricas, desenvolvidas nas laterais do estuário do rio Apodi-Mossoró, com
representatividade menos expressivas a montante e, à medida que alcança o baixo curso à
jusante alargam suas faixas de deposição por diminuição do gradiente fluvial; (iii) Tabuleiros
costeiros: são os relevos de topos planos com diferentes ordens de magnitude e profundidade
de drenagem, separados geralmente por vales de fundo chato, geralmente marcado pelos
paredões procedentes de afloramentos da Formação Barreiras, cuja ação abrasiva do mar e
dos ventos dão origem a falésias vivas e mortas;
Figura 1.5 - Mapa simplificado da geomorfologia do estuário Apodi-Mossoró – RN.
(iv) Campos de dunas móveis e dunas fixas: depósitos de areias eólicas bem classificados por
vezes ocorrendo sob a forma de barcanas ou ainda com contorno irregulares, o qual é
conduzido pela direção dos ventos no sentido E-NE, preferencialmente na região; a origem

15
dos campos de dunas está relacionado às condições climáticas, as mudanças no nível do mar e
rebaixamento tectônico do litoral (SILVEIRA, 2002; AMARO, 2002). As dunas são fixadas
pela vegetação, provavelmente desenvolvida a partir de regressões marinhas que coincidem
com períodos de clima árido e semi-árido, deixando áreas expostas de areia, que foram
remobilizados pelo vento em direção ao continente, formando assim os campos de dunas
direcionais. As dunas fixas encontram-se geralmente cobertas pelas dunas móveis. O
surgimento de condições mais úmidas favoreceu o desenvolvimento e a estabilização de
vegetação em dunas, como mostra a Figura 1.5 para os campos de dunas fixas; (v) Depósitos
de praias: são formadas por sedimentos arenosos, bioclásticos (restos de conchas) e raramente
cascalhos, transportados pelas ondas e correntes marinhas; na região, sazonalmente ocorrem
modificações em suas feições, devido aos processos costeiros de deposição/erosão de
sedimentos arenosos.
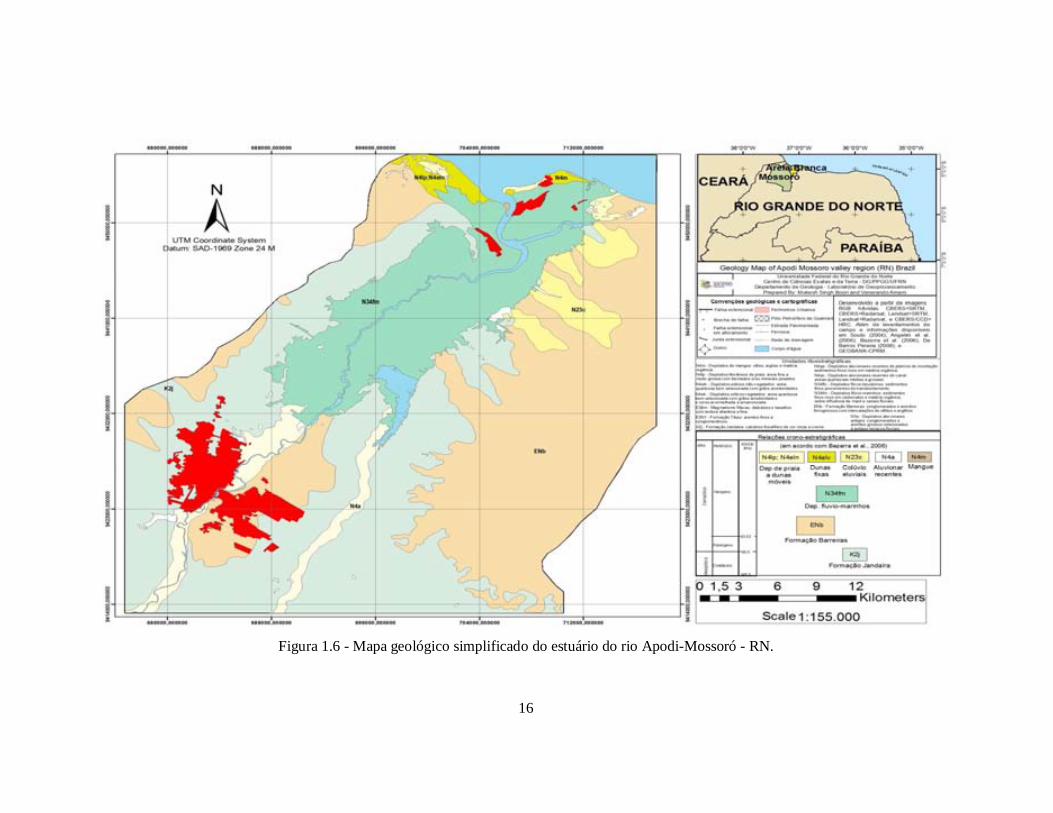
1.5.5 Aspecto Geológico
O mapa geológico simplificado da Figura 1.6 foi preparado a partir de compilação de dados
sobre o Mapa Geológico do Rio Grande do Norte (1:500.000), da análise e interpretação
visual de imagens LANDSAT 7-ETM+ e CBERS-2B para a área de estudo. O mapa apresenta
seis unidades geológicas principais, quais sejam: (i) Formação Jandaíra (K2j) – formada por
calcarenitos bioclásticos e argilitos cinza claro a amarelados, com níveis de evaporitos, possui
contato inferior concordante com a Formação Açu; (ii) Grupo Barreiras (ENb) composto por
arenitos médios e/ou conglomerados, com intercalações de siltitos e argilitos,
predominantemente associada a sistemas fluviais; (iii) Depósitos Aluviais (N4a) – composto
por areias e cascalhos, com arenitos e pelitos intercalados relacionados a sistemas fluviais
atuais; estes depósitos estão distribuídos nas margens e canais de drenagem, e consistem
principalmente de sedimentos areno-argilosos, variando em cores e podendo conter alguma
matéria orgânica, (iv) Depósitos de Planícies e Canais de Maré (N4m) são pelitos arenosos,
carbonosos ou areno-carbonosos, (v) Depósitos Praiais (N34fm) são compostos por areia fina
e grossa, com níveis de conglomerados, associadas às praias atuais e aos campos de dunas
móveis, por vezes com cimento de carbonato, e relacionados às seqüências de rochas da praia;
(vi) Paleocascalheiras (N23c) que são conglomerados com seixos de quartzo, sílex e
fragmentos líticos, matriz de areia e concentrações de argilas vermelhas.
16
Figura 1.6 - Mapa geológico simplificado do estuário do rio Apodi-Mossoró - RN.

17
1.5.6 Erosão Costeira e a Taxa de Alteração na Linha Costeira
No cálculo da erosão costeira/taxa de deposição ao longo da linha de costa da
área de estudo foram empregados os dados do LANDSAT 5-TM, LANDSAT 7-ETM+,
SPOT-4 HRVIR, IKONOS, CBERS-2B e SRTM entre os anos de 2003 a 2010, que
foram analisados utilizando o software ER Mapper. As camadas vetoriais foram
sobrepostas usando software ArcGIS (BURROUGH; MC DONNEL, 1998) e o mapa
final foi obtido, como mostra a Figura 1.7. Durante este período em análise de dados de
sensoriamento remoto, alguns dos locais mostraram significativa erosão e a foz dos rios
apresentaram uma tendência de deslocamento em direção ao sudeste. A largura mínima
da praia foi de 2m, enquanto que a largura máxima foi 301.36m.
Figura 1.7 - Erosão costeira e as variações no litoral do estuário Apodi-Mossoró entre os
anos de 2003-2010, baseados em imagens de satélite.
A taxa de alteração na linha de costa foi baseada na série de mudanças nos
valores de largura da praia. Ao sobrepor os dados de sensoriamento remoto no mapa
base, a área de acreção e erosão foi calculada e, em seguida, a erosão máxima e a taxa
de acreção máxima foram estimadas em -313,39m/ano e 80,06 m/ano, respectivamente.
Linhas de praia com taxas de erosão/sedimentação entre -5,38m/ano e 5,38m/ano são
classificadas como de ranking médio. Com incrementos de ± 5, e com taxas de acreção
18
ou erosão cada vez mais elevadas são classificadas como de vulnerabilidades maiores
ou menores. Ao longo da faixa costeira do estuário do Apodi-Mossoró, as ondas
aproximam-se com crista paralela à linha de costa e, portanto, produzindo um
movimento de offshore-onshore dos sedimentos. Durante as marés de sizígia e ventos
fortes, devido à atividade intensa das ondas, uma grande quantidade de sedimentos são
movidos para a região offshore, o que em outros períodos de ondas menos intensas
quase a mesma quantidade de sedimentos serão trazidos de volta à costa e, portanto, a
praia tende a permanecer em equilíbrio dinâmico. No entanto, alguns trechos da praia
são sujeitas ao ataque mais severo das ondas e, assim, a erosão nestes locais será mais
intensa e os trechos identificados como áreas críticas de erosão (DWARAKISH;
NATESAN, 2002; AMARO; ARAÚJO, 2008). Devido a esta razão, a erosão na
líquidos é mais do que a deposição na líquida, que serve de base para a presente análise.
1.5.7 Declividade do Litoral
A determinação da declividade do litoral identifica a vulnerabilidade relativa à
inundação e a potencial rapidez de retiro da costa por causa das baixas declividades da
regiões costeiras, que recuam mais rapidamente do que regiões mais íngremes
(PENDLETON et al,. 2003). A declividade do litoral foi calculada para uma distância
de cerca de 360m perpendicular à linha da costa (-1m a 67,5m no lado do mar e 67,5m a
360m para o lado da terra). Os detalhes da batimetria foram obtidos a partir de cartas
batimétricas. A Figura 1,8 representa a encosta do litoral da área de estudo em
diferentes estações. Uma inclinação maior do que 0,6% é atribuído baixa
vulnerabilidade e menos de 0,3% é atribuído alta vulnerabilidade. A inclinação do perfil
1 é de 0,24%, no perfil 2 e no perfil 3 é de 0,14%, e a inclinação no perfil 4 é de 0,74%
(Figura 1.8). A inclinação da área de estudo é de 0,32% o que mostra uma alta
vulnerabilidade a inundação das áreas costeiras. Estes valores também são corrigidos
com base na fisiografia e com os detalhes de contorno obtidos a partir de dados SRTM.

19
(A) (B)
(C) (D)
Figura 1.8 - Inclinação de trechos do litoral do estuário de Apodi-Mossoró.
20
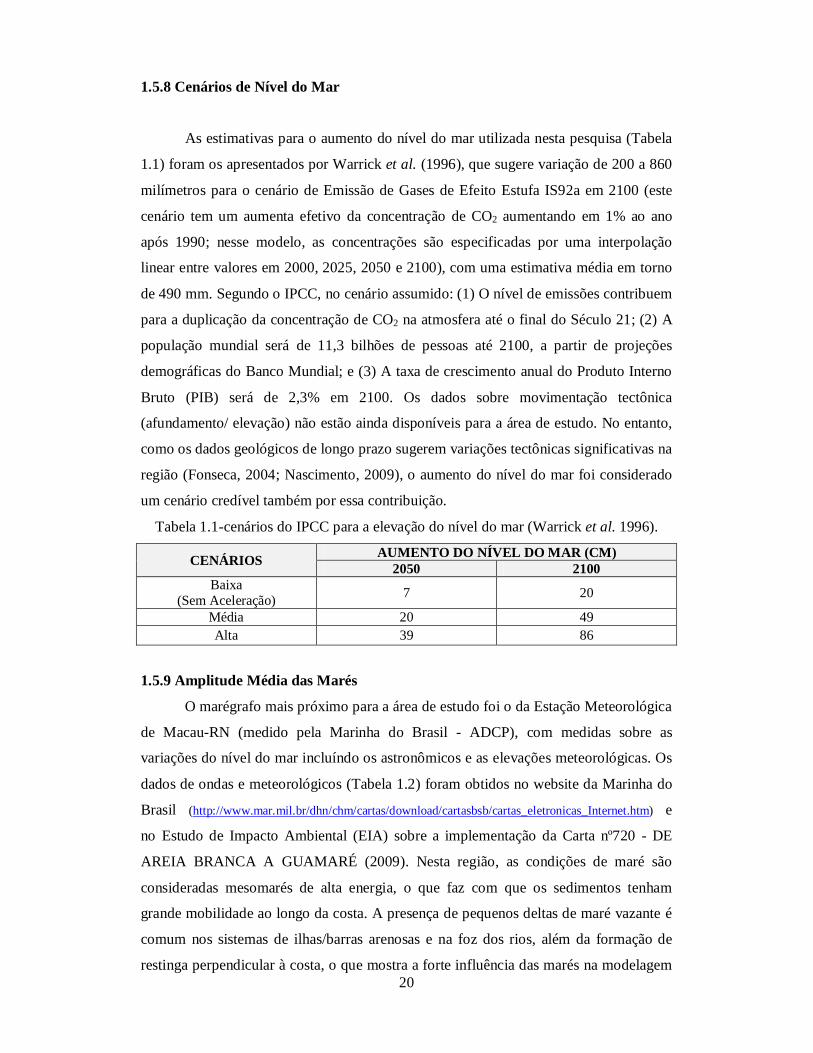
1.5.8 Cenários de Nível do Mar
As estimativas para o aumento do nível do mar utilizada nesta pesquisa (Tabela
1.1) foram os apresentados por Warrick et al. (1996), que sugere variação de 200 a 860
milímetros para o cenário de Emissão de Gases de Efeito Estufa IS92a em 2100 (este
cenário tem um aumenta efetivo da concentração de CO2 aumentando em 1% ao ano
após 1990; nesse modelo, as concentrações são especificadas por uma interpolação
linear entre valores em 2000, 2025, 2050 e 2100), com uma estimativa média em torno
de 490 mm. Segundo o IPCC, no cenário assumido: (1) O nível de emissões contribuem
para a duplicação da concentração de CO2 na atmosfera até o final do Século 21; (2) A
população mundial será de 11,3 bilhões de pessoas até 2100, a partir de projeções
demográficas do Banco Mundial; e (3) A taxa de crescimento anual do Produto Interno
Bruto (PIB) será de 2,3% em 2100. Os dados sobre movimentação tectônica
(afundamento/ elevação) não estão ainda disponíveis para a área de estudo. No entanto,
como os dados geológicos de longo prazo sugerem variações tectônicas significativas na
região (Fonseca, 2004; Nascimento, 2009), o aumento do nível do mar foi considerado
um cenário credível também por essa contribuição.
Tabela 1.1-cenários do IPCC para a elevação do nível do mar (Warrick et al. 1996).
CENÁRIOS AUMENTO DO NÍVEL DO MAR (CM) 2050 2100
Baixa (Sem Aceleração) 7 20
Média 20 49 Alta 39 86
1.5.9 Amplitude Média das Marés
O marégrafo mais próximo para a área de estudo foi o da Estação Meteorológica
de Macau-RN (medido pela Marinha do Brasil - ADCP), com medidas sobre as
variações do nível do mar incluíndo os astronômicos e as elevações meteorológicas. Os
dados de ondas e meteorológicos (Tabela 1.2) foram obtidos no website da Marinha do
Brasil (http://www.mar.mil.br/dhn/chm/cartas/download/cartasbsb/cartas_eletronicas_Internet.htm) e
no Estudo de Impacto Ambiental (EIA) sobre a implementação da Carta nº720 - DE
AREIA BRANCA A GUAMARÉ (2009). Nesta região, as condições de maré são
consideradas mesomarés de alta energia, o que faz com que os sedimentos tenham
grande mobilidade ao longo da costa. A presença de pequenos deltas de maré vazante é
comum nos sistemas de ilhas/barras arenosas e na foz dos rios, além da formação de
restinga perpendicular à costa, o que mostra a forte influência das marés na modelagem
21
da morfologia local. As marés ao longo da costa do estuário do rio Apodi-Mossoró são
do tipo mista, com componentes semidiurna dominante A variação relativa das marés
(Relative Tide Range – RTR) observada para as praias da região ocorre entre 1,5 <RTR
<13,5, ou seja, classificadas como do tipo mistas, dominada por ondas e marés (VITAL
et al., 2010).
Tabela 1.2 - As variações de maré no estuário do rio Apodi-Mossoró no ano de 2009. Mês Jan. Feb. Mar. Abril Maio Junho Jullho Agosto Set. Out. Nov. Dez.
Maré 1,859 1,864 1,854 1,861 1,862 1,864 1,861 1,862 1,858 1,858 1,861 1,857 Maré Média 1,860
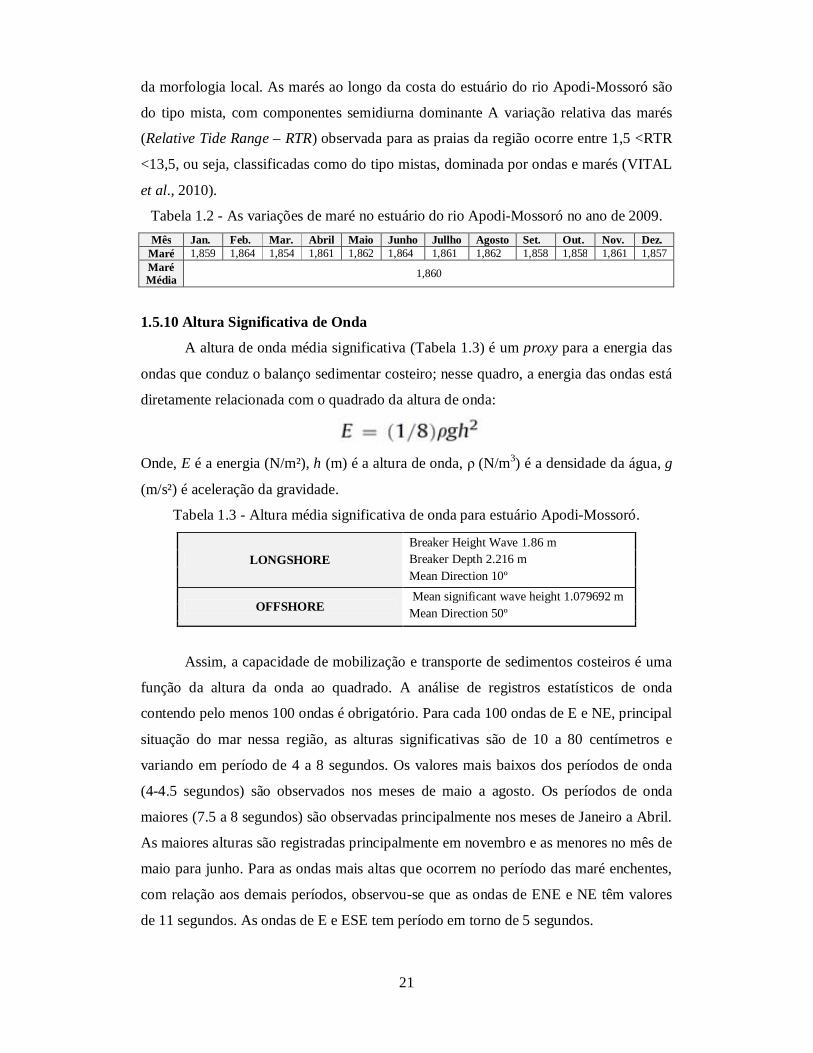
1.5.10 Altura Significativa de Onda
A altura de onda média significativa (Tabela 1.3) é um proxy para a energia das
ondas que conduz o balanço sedimentar costeiro; nesse quadro, a energia das ondas está
diretamente relacionada com o quadrado da altura de onda:
Onde, E é a energia (N/m²), h (m) é a altura de onda, ρ (N/m3) é a densidade da água, g
(m/s²) é aceleração da gravidade.
Tabela 1.3 - Altura média significativa de onda para estuário Apodi-Mossoró.
LONGSHORE Breaker Height Wave 1.86 m Breaker Depth 2.216 m Mean Direction 10º
OFFSHORE Mean significant wave height 1.079692 m Mean Direction 50º
Assim, a capacidade de mobilização e transporte de sedimentos costeiros é uma
função da altura da onda ao quadrado. A análise de registros estatísticos de onda
contendo pelo menos 100 ondas é obrigatório. Para cada 100 ondas de E e NE, principal
situação do mar nessa região, as alturas significativas são de 10 a 80 centímetros e
variando em período de 4 a 8 segundos. Os valores mais baixos dos períodos de onda
(4-4.5 segundos) são observados nos meses de maio a agosto. Os períodos de onda
maiores (7.5 a 8 segundos) são observadas principalmente nos meses de Janeiro a Abril.
As maiores alturas são registradas principalmente em novembro e as menores no mês de
maio para junho. Para as ondas mais altas que ocorrem no período das maré enchentes,
com relação aos demais períodos, observou-se que as ondas de ENE e NE têm valores
de 11 segundos. As ondas de E e ESE tem período em torno de 5 segundos.

22
1.5.11 Variação do Nível Médio do Mar
A subida do nível do mar promoveria como resultado direto mudanças
correspondentes à zona de ação das ondas no perfil de praia. Isso se refletiria em uma
recessão do litoral, maior nas encostas mais suaves. Bruun (1962) apresentou uma teoria
que estima a recessão nas margens para um aumento constante do nível do mar. De
acordo com esta estimativa, cada milímetro de elevação do nível do mar deve resultar
em um recuo do litoral em cerca de 1m.
Na área de estudo, ocorre a Corrente Norte do Brasil fluindo aproximadamente
paralelo ao talude continental e atingindo velocidades de cerca de 30-40cm/s. Pela ação
das forçantes hidrodinâmica, esta corrente está sobreposta por ondas e marés
componentes (KNOPPERS, 1948). As correntes costeiras fluem de leste a oeste. As
ondas (20-105cm/s) são as forças dominantes no transporte de sedimentos, devido à
intensidade e obliqüidade dos ventos alísios de SE-NE. As correntes costeiras dirigidas
por ventos intensos e constantes aumentam a taxa de transporte de sedimentos, enquanto
que as marés têm uma capacidade menor de transporte devido à relativamente baixa
intensidade das correntes de maré (50-60 cm/s). Isso pode ser bem melhor observado na
região pela presença de esporões paralelos à costa, além de alguns pequenos
perpendiculares à costa (SILVEIRA et al., 2001). Ao considerar os relatórios com
sugestões de aumento do nível global do mar de 1,8-2,0 milímetros/ano (IPCC) e
também de estudos anteriores, um aumento do nível do mar é considerado de baixa
repercussão para a área de estudo, com uma maioria de áreas de vulnerabilidade baixa a
média para essa situação.
1.5.12 Aspectos de Uso e Cobertura do Solo
É considerada, desde o princípio, a base temática fundamental para a definição e
mapeamento de outros planos de informação referentes aos mapas de vulnerabilidade.
Os dados para mapeamentos das classes de uso e ocupação do solo foram levantados a
partir de imagens de satélite LANDSAT 7-ETM+ e CBERS-2B do ano de 2009. Para a
esta caracterização de uso foram adotados os procedimentos contidos nas normas
técnicas para o Mapeamento dos Recursos Naturais Através de Sensoriamento Remoto
(INCRA, 1995) e do Manual Técnico de Uso da Terra (IBGE, 2009). As categorias de
uso da terra, ou classes de uso do solo, em unidades simples foram interpretados e
definidas nas imagens de satélites orbitais disponíveis e dados pretéritos básicos que
foram interpretadas e digitalizadas na escala 1:10.000 no software ArcGIS. Identificado

23
as classes de uso e ocupação no estuário foram definidas as seguintes classes: as zonas
úmidas, as zonas industriais, os campos de exploração de petróleo, as área urbanas, as
áreas de vegetação, as áreas de fazendas de camarão, a área de agricultura, as dunas
fixas e móveis, os manguezais, as área de salinas, as áreas de solo exposto, as áreas
ocupadas por praias e as áreas de corpos d´água (rio e mar) .
Figura 1.9 - Mapa simplificado de uso e cobertura do solo no ano de 2009, com base no CBERS-2B e de imagens CCD-HRC.
Para a apresentação dessas áreas no mapa simplificado da Figura 1.9, pode ser
observado que, apesar da exploração de petróleo e camarão serem relevantes
componentes econômicos na região, as áreas ocupadas por essas classes dão 16,41% da
superfície total do estuário do rio Apodi-Mossoró, e as áreas de salinas atingindo 9,98%
da área total. A vegetação da caatinga ocupa 52,76% da área total, sendo por vezes
substituído pela expansão das atividades agrícolas em áreas rurais, a expansão da área
urbana e/ou assentamentos, com 3,88% da área total e a expansão da área industrial
(0,24%).
O mapa de uso e cobertura do solo reflete a ação histórica do homem na região,
onde tem lugar uma rápida expansão da agropecuária, da produção de sal e,
especialmente nas últimas três décadas, da exploração de petróleo, da carcinicultura e

24
do crescimento da área urbana. Os manguezais e a vegetação de caatinga, que já ocupou
grande parte do estuário do rio Apodi-Mossoró e, agora, têm sido praticamente
erradicada para a implantação das atividades antropogênicas, de um lado e de outro do
vale. Nos últimos anos, as áreas de salinas tem sido substituídas por fazendas de
camarão, devido à demanda do mercado.
1.6 Aspectos Socioeconômicos
A área de estudo abrange os municípios de Mossoró, Areia Branca e Grossos
que possuem os seguintes dados socioeconômicos baseados nas informações de Amaro
(2002) e do censo do IBGE (2009). O município de Mossoró é praticamente
eqüidistante cerca de 270 km de Natal (capital do RN) ou de Fortaleza (capital do CE).
Esta cidade possui um total de 244.287 habitantes, com 118.046 homens e 126.241
mulheres, distribuídos em área municipal de 2.110.207 km2, resultando em uma
densidade de 114,5 hab/km2, abaixo da densidade média do estado que é 1.153,0
hab/km2. Há um predomínio da população urbana, com cerca de 93,10% do total
municipal. O Município de Areia Branca apresenta um total de 25.394 habitantes, com
12.454 homens e 12.940 mulheres. A população é espalhada sobre uma área municipal
de 357.580 km2 resultando em densidade de 65,7 hab/km2. No Município de Grossos a
população é estimada em 9.886 habitantes distribuidos em área de 126 km², o que
perfaz uma densidade de 70,9 hab/km2.
O PIB da região foi estimado em 2.127.077 mil (reais), dos quais 8.6%
corresponderam às atividades baseadas na agricultura e pecuária, 32,0% e 59,3% para o
comércio o setor de serviços. O PIB per capita foi de 9.257,00 dólares americanos, a
maior renda per capita do RN.
Embora a taxa de alfabetização, como média para o RN, ser considerada de
forma razoável, o grau de instrução das pessoas responsáveis permanentes pelos lares é
baixa, onde o contingente sem instrução ou com até três anos de estudo chega a 40,7%
em Mossoró. Num contexto mais amplo, o rendimento nominal mensal dos
responsáveis pelo domicílio é baixo, mesmo que relativamente bom em comparação
com outros municípios do RN, e este é um reflexo do baixo nível de escolaridade. Na
cidade de Mossoró 12,8% não têm renda e 54,1% recebem até 2 salários mínimos.
Questões relacionadas ao abastecimento de água e destino dos resíduos mostram que os
três municípios recebem fornecimento principalmente da rede pública e tem a maioria
dos resíduos sólidos urbanos destinados a aterros sanitários.
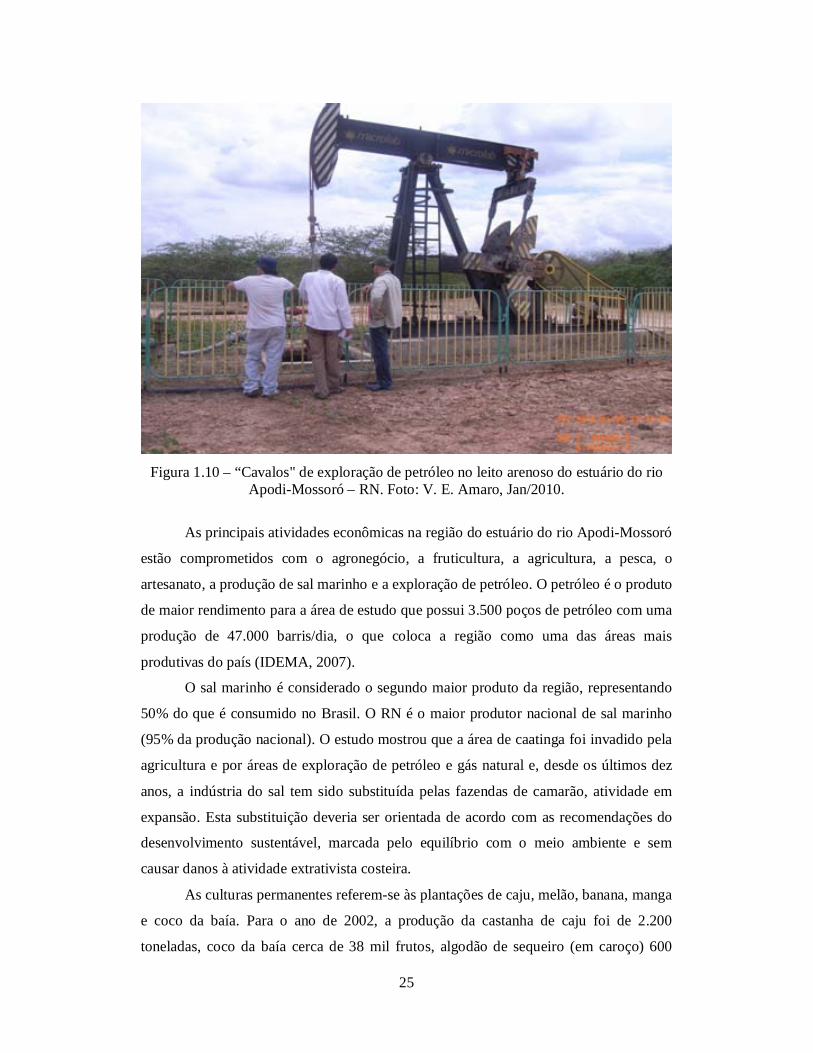
25
Figura 1.10 – “Cavalos" de exploração de petróleo no leito arenoso do estuário do rio
Apodi-Mossoró – RN. Foto: V. E. Amaro, Jan/2010.
As principais atividades econômicas na região do estuário do rio Apodi-Mossoró
estão comprometidos com o agronegócio, a fruticultura, a agricultura, a pesca, o
artesanato, a produção de sal marinho e a exploração de petróleo. O petróleo é o produto
de maior rendimento para a área de estudo que possui 3.500 poços de petróleo com uma
produção de 47.000 barris/dia, o que coloca a região como uma das áreas mais
produtivas do país (IDEMA, 2007).
O sal marinho é considerado o segundo maior produto da região, representando
50% do que é consumido no Brasil. O RN é o maior produtor nacional de sal marinho
(95% da produção nacional). O estudo mostrou que a área de caatinga foi invadido pela
agricultura e por áreas de exploração de petróleo e gás natural e, desde os últimos dez
anos, a indústria do sal tem sido substituída pelas fazendas de camarão, atividade em
expansão. Esta substituição deveria ser orientada de acordo com as recomendações do
desenvolvimento sustentável, marcada pelo equilíbrio com o meio ambiente e sem
causar danos à atividade extrativista costeira.
As culturas permanentes referem-se às plantações de caju, melão, banana, manga
e coco da baía. Para o ano de 2002, a produção da castanha de caju foi de 2.200
toneladas, coco da baía cerca de 38 mil frutos, algodão de sequeiro (em caroço) 600
26
toneladas, banana com 105 toneladas, feijão com 1.900 toneladas, manga com 1.920
toneladas, melancia 7.500 toneladas, melão com 62,500 toneladas e milho (em grãos)
com 4,500 toneladas (IBGE, 2009). Feijão e milho são as culturas predominantes em
lavouras temporárias, produzindo cerca de 94 e 88 toneladas, respectivamente. O RN é
responsável por 90% do melão brasileiro que é exportado.
O ecossistema manguezal é explorado para a produção de mel natural e para a
coleta de ostras, caranguejos, camarões, mariscos e crustáceos, além de oportunidades
recreativas, científicas e educacionais. A presença de enfeites artesanais criadas com
areia colorida em pequenas garrafas, como também objetos decorativos feitos de
conchas e outros materiais reciclados são comuns e conhecidos como procedentes do
estuário do rio Apodi-Mossoró.

27
Capítulo II: Mudanças Climáticas: Impactos, Vulnerabilidade, Adaptação, e Desenvolvimento Sustentável no Estuário Apodi-Mossoró
2.1 Introdução
Este Capítulo destaca as preocupações e necessidades da adaptação aos efeitos
das mudanças climáticas no estuário Apodi-Mossoró, além da vulnerabilidade desta área
às mudanças climáticas futuras; a necessidade de planos atuais de adaptação, estratégias
e ações; e as opções futuras para as adaptações.
No decorrer das próximas décadas é previsto que milhares de pessoas em todo o
Nordeste do Brasil irão enfrentar escassez nos recursos naturais, água, alimentos, riscos
de subida no nível do mar e de saúde como resultado de mudanças climáticas. Uma ação
de gestão intensiva é necessária para permitir ao estuário Apodi-Mossoró se adaptar aos
efeitos dessas mudanças climáticas que, prova vemente já se manifestam agora.
Todo o Nordeste do Brasil precisa de apoio à adaptação no contexto do Plano
Nacional para o Desenvolvimento Sustentável, como mais capacitação, transferência de
tecnologia e recursos financeiros aos municípios. Um planejamento sistemático é
também necessário para reduzir o risco de desastres e aumentar a resiliência de
comunidades contra o aumento de eventos extremos como secas e enchentes.
Este Capítulo revisa as pesquisas sobre a vulnerabilidade às mudanças no meio
ambiente e os desafios atuais na integração com os domínios de resiliência e adaptação.
De forma objetiva, a Vulnerabilidade é o estado de suscetibilidade a danos de
exposição ao estresse associado com mudanças ambientais e a ausência na capacidade
de se adaptar. Tradições anteriores incluem nessa teoria de vulnerabilidade o Direito e
as Teorias de Risco. Cada uma destas áreas contribuiu para formulações atuais da
vulnerabilidade às mudanças de meio ambiente como uma característica dos sistemas
sócio-ecológicos.
Um dos desafios principais nas pesquisas de vulnerabilidade está em
desenvolver medidas robustas e acreditáveis para incorporar regulamentação de
pesquisa nos mecanismos de medição da vulnerabilidade e promover a ação e a
resiliência adaptativa. Estes desafios são comuns ao domínio de vulnerabilidade,
adaptação e resiliência e formam terreno comum para a concientização e integração.
A intenção desta pesquisa é revisar parte da literatura que trata da abordagem
analítica da vulnerabilidade às mudanças climáticas, para propor sinergias entre
28
pesquisas de vulnerabilidade e resiliência dos sistemas sócio-ecológicos no estuário
Apodi-Mossoró. O conceito de vulnerabilidade foi uma ferramenta analítica poderosa
para descrever os estados de susceptibilidade ao dano, a impotência de ambos os
sistemas, físicos e sociais, e para guiar a análise das ações para redução de risco. Este
estudo argumenta que, seguindo décadas de avaliação na vulnerabilidade de uma região,
muitas pesquisas enfatizam estresses múltiplos envolvidos nos processos (por exemplo,
a erosão costeira).
Elementos de desastres e teorias de risco têm contribuído com o uso atual do
conceito de vulnerabilidade na análise dos sistemas sócio-ecológicos e nas pesquisas de
meios para o desenvolvimento sustentável. As pesquisas quanto a esses meios ainda
estão firmemente enraizadas nos sistemas sociais ao invés de estarem integrados aos
riscos através de sistemas sócio-ecológicos. Todas estas tradições e abordagens podem
ser encontradas nas aplicativas de vulnerabilidade no contexto de mudança climática no
estuário Apodi-Mossoró. As partes restantes do Capítulo examinam o desenvolvimento
metodológico e os desafios nas pesquisas de dimensões humanas, particularmente na
medida de vulnerabilidade, lidando com percepções de risco, baseada na geologia,
geomorfologia, solo, vegetação, nível do mar, maré, mudanças nas linhas de costa,
erosão/acreção e problemas de gestão na área de estudo. Assim, este Capítulo demonstra
que estas dificuldades são comuns nos campos de vulnerabilidade, adaptação e
resiliência e assim aponta o estuário Apodi-Mossoró como um terreno comum para o
aprendizado. Finalmente, procura indicar as opções de adaptação para as ameaças
colocadas pela mudança climática no Nordeste do Brasil, para mudança climática
futura, além de 2012.
2.2 Evolução da Abordagem da Vulnerabilidade e Interação à Mudança Climática
Várias tradições e disciplinas, de Economia à Antropologia, até a Psicologia e a
Engenharia e as Geociências, utilizam o termo Vulnerabilidade. É somente na área de
relações humano-ambiente em que vulnerabilidade tem um significado comum.
Geografia Humana e Ecologia Humana têm teorizada a vulnerabilidade à mudança do
meio ambiente. Ambas as disciplinas contribuíram ao entendimento atual dos sistemas
sócio-ecológicos, enquanto novas percepções relacionadas com o Direito mantiveram a
análise de vulnerabilidade em teorias de mudança social e na tomada de decisões. Por
exemplo, a terra que era útil para agricultura e preservação em florestas, no caso do

29
estuário Apodi-Mossoró, é atualmente usada pelas indústrias de petróleo e salinas, e que
nos últimos dez anos, esta lentamente sendo substituída com criações de camarão,
mostrando uma direção de produção dirigida pela demanda do mercado, que vai ser um
fator de risco no futuro. O aumento no número e densidade da população em áreas
urbanas costeiras é outro problema freqüente no Nordeste do Brasil.
Portanto, nota-se que vulnerabilidade às mudanças do meio ambiente não
existem de forma isolada, sobretudo da economia política dominante no uso de recursos
terrestres. A vulnerabilidade é dirigida pela ação humana inadvertida ou
deliberadamente, o que reforça o auto-interesse e a distribuição de poder político, além
de ter interação com os sistemas físicos e ecológicos. A vulnerabilidade é
freqüentemente conceituada como sendo constituída de componentes que incluem
exposição e sensibilidade às perturbações ou estresses externos, além de considerar a
capacidade de adaptação, exposição a natureza e ao grau do estresse ambiental a que o
sistema está sujeito. As características desses estresses incluem a magnitude, a
freqüência, a duração e a extensão de risco (BURTON et al., 1993).
Figura 2.1 – Tradições nas pesquisas sobre o conceito de vulnerabilidade e sua evolução
(Adeger, 2006).
Os conflitos entre a escassez de alimentos e os riscos naturais não são fatores
independentes um do outro e isso está claro no estuário Apodi-Mossoró. Enquanto a
escassez de alimentos pode ser provocada por eventos climáticos extremos, como secas

30
ou enchentes, as pesquisas no domínio da vulnerabilidade mostram de modo crescente
que doenças e guerras são causadas pela escassez e a insegurança de alimentos (SEN,
1981; SWIFT, 1989; BOHLE et al., 1994; BLAIKIE et al., 1994). Isso mostra que, na
maioria dos trabalhos anteriores, as explicações sobre vulnerabilidade foram baseadas
no Direito e focaram quase exclusivamente o domínio social e o bem-estar como
variáveis importantes, enquanto deveriam estar também associadas ao risco ambiental,
com a resposta humana relacionada a perspectivas geográficas, em adição de parâmetros
sociais.
Burton et al. (1978, 1993) sintetizou décadas de pesquisa no manejo de
enchentes, riscos geológicos e grandes riscos tecnológicos, assimilando aprendizados
nas percepções de risco individual e na ação coletiva. Estes autores demonstraram que
quase todo tipo de risco natural e toda grande mudança social e política tem grande
variações e impactos nos distintos grupos da sociedade. Para muitos riscos naturais, as
vulnerabilidades da população humana são baseadas no local de moradia e no uso de
recursos naturais.
Na Figura 2.1 as pesquisas indicam que as duas tradições em pesquisa de risco
têm atingindo sucesso por Blaikie et al. (1994) no seu modelo de risco integrando
“Pressão e Liberação” (Pressure and Release). Eles propuseram que os riscos físicos ou
biológicos representem uma pressão e que mais pressões vêm da progressão de
vulnerabilidade cumulativa, de causas enraizadas como a geografia local e a
diferenciação social. Esta análise capturou a essência de vulnerabilidade na tradição de
riscos físicos, embora também identificando as causas próximas e fundamentais da
vulnerabilidade no modelo de ecologia humana. A análise também foi compreensiva na
busca da explicação para riscos físicos e biológicos. Os impactos associadas ao risco
geológico freqüentemente ocorrem sem aviso prévio efetivo e com alta velocidade.
Neste trabalho de pesquisa foram utilizados geoindicadores e definimos
diferentes tipos de vulnerabilidade, tais como Vulnerabilidade Natural, Vulnerabilidade
Ambiental e Vulnerabilidade Costeira ao risco de SLR na tentativa de definição do risco
atual no estuário Apodi-Mossoró devido à mudança climática global e seus efeitos no
ambiente. Os seguintes fatores foram usados para este estudo: aumento no nível do mar,
erosão, inundação, aspectos geológicos, geomorfológicos, solo, vegetação, uso de terra
e dados socioeconômicos.
A exposição física de uma comunidade aos riscos está mais bem determinada
pela consideração da probabilidade do evento e a dimensão da comunidade que vai ser

31
afetada. Os impactos diretos e imediatos de muitos desastres podem ser sentidos por
várias comunidades, mas na análise de vários tipos de riscos falta a dimensão espacial.
Por exemplo, considerando os padrões espaciais da destruição por desastres naturais, no
estuário Apodi-Mossoró os seguintes fatores devem ser considerados: enchentes,
desmoronamentos, ondas fortes, secas, incêndios e desastres de transporte.
2.3 Desenvolvimento de Indicadores de Vulnerabilidade
Um dos principais poblemas na elaboração dos mapas de vulnerabilidade, de
qualquer natureza (natural, ambiental, costeira, entre outros), centra-se no
estabelecimento adequado de indicadores dessa vulnerabilidade. A maoria dos
indicadores não é integralmente aceita pela comunidade científica, sobretudo em função
da origem dos dados ou do curto prazo em que os dados foram coletados. Quanto aos
aspectos de interação em questões de meio ambiente e das mudanças futuras, a
complexidade ainda é maior, uma vez que é necessária a interação multidisiplinar entre
informações físicas e sociais, fato ainda pouco compreendido, e por isso muito
criticado, pela comunidade de Geociências, infelizmente. Também, muitos são os
exemplos de uso de indicadores na avaliação de segurança humana e do meio ambiente.
Alguns conjuntos de indicadores foram desenvolvidos para examinar processos
altamente complexos, como o impacto de condições socioeconômicas no manejo de
zonas costeiras (Bowen & Riley, 2003). Estes autores relacionaram indicadores
antropogênicos, ou socioeconômicos, ao gerenciamento costeiro e concluíram que a
análise e o estabelecimento de programas baseados em indicadores no estudo das
mudanças na costa e nos sistemas de bacias hidrográficas têm aumentado devido às
pressões e impactos socioeconômicos nessas estes regiões. Descrevem indicadores
como sendo “parte de um processo para minimizar o numero de variáveis individuais e
dados pontuais, enquanto em nível suficiente do entendimento crítico”. Trata-se do uso
dos indicadores de mensuração de impactos desassociados das variáveis que
caracterizam as mudanças ambientais. Alguns indicadores foram desenvolvidos para
expressar o bem-estar humano, o econômico ou o estado de desenvolvimento, enquanto
outros especificamente atendem a vulnerabilidade no nível geral.
O Programa de Meio Ambiente das Nações Unidas (UNEP), a Divisão de
Advertência Antecipado e Avaliação (DEWA) e o GRID-Genebra estão desenvolvendo
um índice de risco de desastres sob seu projeto de Tendências de Risco Global e
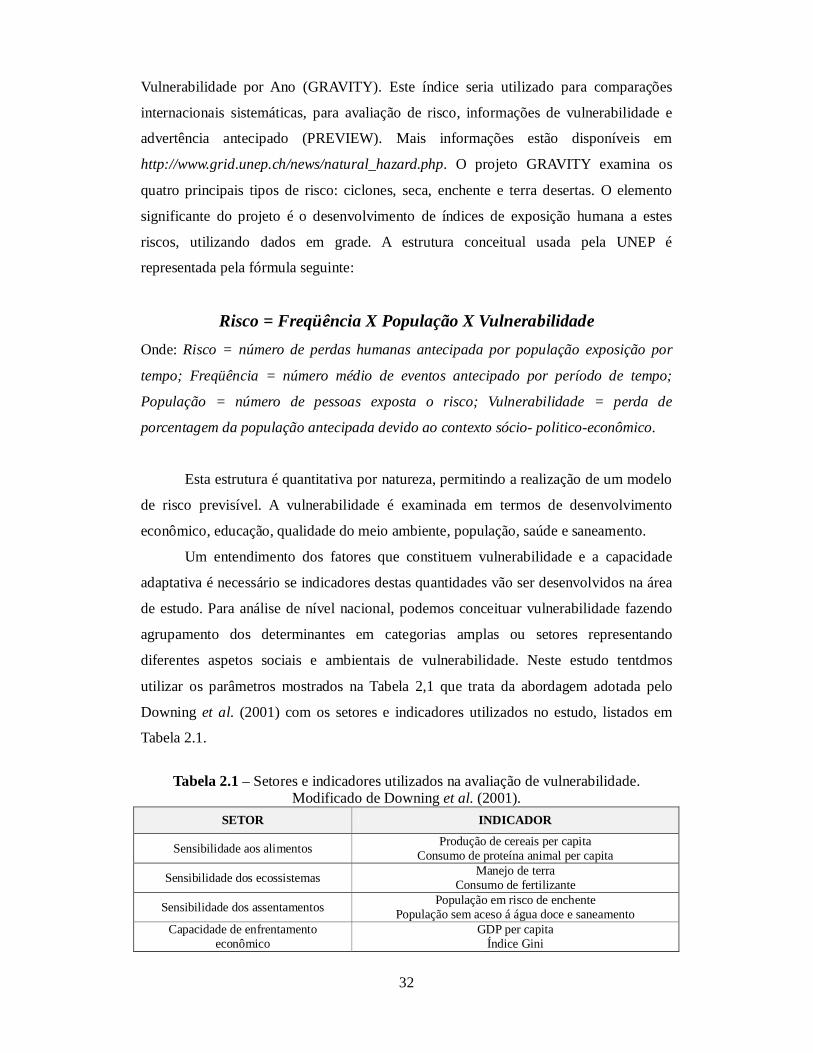
32
Vulnerabilidade por Ano (GRAVITY). Este índice seria utilizado para comparações
internacionais sistemáticas, para avaliação de risco, informações de vulnerabilidade e
advertência antecipado (PREVIEW). Mais informações estão disponíveis em
http://www.grid.unep.ch/news/natural_hazard.php. O projeto GRAVITY examina os
quatro principais tipos de risco: ciclones, seca, enchente e terra desertas. O elemento
significante do projeto é o desenvolvimento de índices de exposição humana a estes
riscos, utilizando dados em grade. A estrutura conceitual usada pela UNEP é
representada pela fórmula seguinte:
Risco = Freqüência X População X Vulnerabilidade Onde: Risco = número de perdas humanas antecipada por população exposição por
tempo; Freqüência = número médio de eventos antecipado por período de tempo;
População = número de pessoas exposta o risco; Vulnerabilidade = perda de
porcentagem da população antecipada devido ao contexto sócio- politico-econômico.
Esta estrutura é quantitativa por natureza, permitindo a realização de um modelo
de risco previsível. A vulnerabilidade é examinada em termos de desenvolvimento
econômico, educação, qualidade do meio ambiente, população, saúde e saneamento.
Um entendimento dos fatores que constituem vulnerabilidade e a capacidade
adaptativa é necessário se indicadores destas quantidades vão ser desenvolvidos na área
de estudo. Para análise de nível nacional, podemos conceituar vulnerabilidade fazendo
agrupamento dos determinantes em categorias amplas ou setores representando
diferentes aspetos sociais e ambientais de vulnerabilidade. Neste estudo tentdmos
utilizar os parâmetros mostrados na Tabela 2,1 que trata da abordagem adotada pelo
Downing et al. (2001) com os setores e indicadores utilizados no estudo, listados em
Tabela 2.1.
Tabela 2.1 – Setores e indicadores utilizados na avaliação de vulnerabilidade.
Modificado de Downing et al. (2001). SETOR INDICADOR
Sensibilidade aos alimentos Produção de cereais per capita Consumo de proteína animal per capita
Sensibilidade dos ecossistemas Manejo de terra Consumo de fertilizante
Sensibilidade dos assentamentos População em risco de enchente População sem aceso á água doce e saneamento
Capacidade de enfrentamento econômico
GDP per capita Índice Gini

33
Capacidade de enfrentamento dos recursos humanos
Razão de dependência Fertilidade
Alfabetização Expectativa de vida
Capacidade de enfrentamento ambiental Densidade de população Emisões de SO2 por área
Terreno sem manejo
Se uma sistema está regularmente sujeito a danos pelos riscos periódicos ou se a
severidade e/ou freqüência dos riscos é antecipada, esforços podem ser feitos para
tornar o sistema mais resistente pela antecipação de eventos futuros (prognósticos). Tal
processo constitui a adaptação antecipatória, com a intenção de aumentar a capacidade
de enfrentamento de um sistema ao longo do tempo, e podem ser realizado por
indivíduos e/ou grupos em escala local. As manifestações potencialmente mais
prejudiciais das mudanças climáticas, pelo menos no curto ou médio prazo, são as
mudanças na freqüência e severidade dos riscos recorrentes, tais como secas e
enchentes, como é o caso do estuário do Apodi-Mossoró. A vulnerabilidade à mudança
climática dependerá, portanto, da sua capacidade de adaptar ao longo do tempo, de
modo a aumentar a sua capacidade de lidar com tais eventos; a natureza da relação entre
vulnerabilidade e capacidade de adaptação (e entre a capacidade de adaptação e
capacidade de enfrentamento) depende fundamentalmente da escala do tempo e da
vulnerabilidade às mudanças climáticas, como descritas acima, essencialmente, e à
vulnerabilidade aos riscos climáticos recorrentes integrados ao longo do tempo. A
vulnerabilidade atual para um risco recorrente dependerá na extensão em que
populações e sistemas estão expostos aos impactos diretos e físicos deste risco
recorrente e a extensão em que podem absorver e recuperar-se destes impactos. Estes
impactos diretos podem afetar indivíduos, comunidades, infraestruturas, ecossistemas e
outros aspetos do ambiente físico. A resiliência individual à seca e escassez de
alimentos subseqüentes, por exemplo, será comprometida com problemas de saúde, que
por sua vez está diretamente associada à pobreza e à desigualdade. A resiliência dos
sistemas agriculturais às secas está determinada pelo grau em que as medidas de
enfrentamento existentes, tais como irrigação e medidas para diminuir gastos de água,
estão em vigor. A resiliência dos assentamentos dependerá na sua localização e
construção, enquanto que a dos ecossistemas vai depender do grau em que eles
vivenciam, com as múltiplas pressões como a poluição, fragmentação e exploração
insustentável no estuário Apodi-Mossoró.
A capacidade de adaptação de uma comunidade é medida quanto ao grau em que
um sistema irá “automaticamente” se adaptar, e será uma função dos seguintes itens:

34
i. Reconhecimento da necessidade para adaptação;
ii. Acreditar que a adaptação é possível e desejável;
iii. Vontade de realizar adaptação;
iv. Disponibilidade dos recursos necessários para a instalação das
estratégias de adaptação;
v. Capacidade para implantar recursos de maneira apropriada;
vi. Restrições externas ou obstáculos à instalação das estratégias
adaptativas.
Para a construção de indicadores de vulnerabilidade às mudanças climáticas é
necessário considerar a vulnerabilidade aos riscos discretos e recorrentes, em
combinação com a capacidade de adaptação, de forma a lidar com o aumento na sua
freqüência e severidade. O melhor guia para a vulnerabilidade nos eventos discretos no
futuro próximo é provavelmente a própria vulnerabilidade atual para tais eventos, além
do reconhecimento do comportamento dos eventos no passado. Assim, a
vulnerabilidade a riscos climáticos recorrentes podem, portanto, ser vistos como um
componente da vulnerabilidade às mudanças climáticas avaliadas durante um período
prolongado de tempo.
Os indicadores aos qual a vulnerabilidade devido às mudanças climáticas e
desastres naturais no estuário do Apodi-Mossoró, seguindo a discussão acima, são
agrupamentos chaves dos fatores representando a vulnerabilidade às mudanças
climáticas. As listas dos proxies sugeridas para cada agrupamento foram apresentadas
baseadas na natureza dos fatores e nos processos para a avaliação dos dados no estuário
do Apodi-Mossoró. Alguns deles:
(i) Bem-estar econômico – Embora a vulnerabilidade não esteja simplesmente
correlacionada com pobreza, comunidades pobres freqüentemente enfrentam maiores
níveis de risco que outras populações (UNITED NATIONS, 2001; WISNER, 2001).
Pessoas pobres têm mais chance de morar em lugares de risco, como num declive de
morro instável e planícies de inundação. Os pobres, que em muitos casos podem ter
migrado das zonas rurais freqüentemente moram em favelas com pouco ou nenhum
saneamento básico ou acesso á água doce. A falta de saneamento junto com
superlotação aumenta o risco das populações urbanas para os efeitos secundários de
saúde diante das enchentes e outros riscos, pelo aumento na possibilidade de doenças
transmitidas pela água. Assentamentos construídos rapidamente estão fisicamente mais
vulneráveis aos impactos imediatos de chuvas extremas, aumentando o risco de

35
ferimento nos habitantes. Embora os assentamentos possam ser mais baratos para
reconstruir que as áreas residências mais permanentes, as pessoas que moram nas
estruturas mais frágeis terão mais dificuldades de garantias no pós-desastre. Os meios
de subsistência dos pobres são, portanto, mais vulneráveis aos desastres associados ao
clima e outros risco. No entanto, vulnerabilidade relacionada à pobreza não pode ser
representada por uma única variável como o PIB (NDIKUMANA; BOYCE, 2003). Um
país com o PIB relativamente alto ainda pode conter grupos de população muito pobres
que são vulneráveis aos riscos climáticos por causa das razões descritas acima.
Nutrição é também muito importante. Má nutrição associada com falta de saúde
geral aumenta a susceptibilidade às enfermidades (por exemplo, epidemias seguindo
períodos de enchentes) uma conseqüência dum sistema imunológico enfraquecido.
Pessoas desnutridas são menos capazes de enfrentar escassez de alimentos (por
exemplo, associada com seca). Outros proxies relacionados à produção agrícola e custos
da alimentação também estão disponíveis. Porém, a produção não é, necessariamente,
igual disponibilidade. Produção agrícola às vezes é dirigida às exportações, e países
com setores de agricultura pequenos geralmente importam alimentos. De fato, como
agricultura é um setor climaticamente sensível, baixa produção doméstica
provavelmente reduziria a vulnerabilidade às mudanças climáticas, assumindo que o
país pode utilizar importação para ter alimentos suficientes para sua população. O bem-
estar econômico pode ser representado pelas seguintes proxies:
PIB per capita;
Índice de Gini;
Dívida nacional em percentagem do PIB.
(ii) Educação – Educação está associada com pobreza e marginalização – os menos
educados e menos especializados membros da sociedade são mais vulnerávly os riscos
climáticos em termos de meios de subsistência e localização geográfica. Eles também
têm menos voz na área política e por conseqüência seu bem-estar pode ser de baixa
prioridade na perspectiva do governo. Educação fornece a base para um entendimento
científico do mundo físico e assim forma a fundamantação de entendimento da natureza,
dos riscos e das respostas apropriadas em relação aos riscos. Não se deve descartar o
conhecimento indígena e a experiência tradicioanl do ambiente que é, em muitos casos,
tão útil quanto o entendimento científico, uma vez que as informações escritas
geralmente não são disponíveis para a população mais vulnerável.

36
A capacidade de adaptação às mudanças climáticas de maneira antecipada
depende fortemente da disponibilidade de informação relacionada às mudanças
climáticas e da capacidade dos responsáveis pela adaptação na compreensão dessa
informação. A categoria de educação (EDU) pode ser representada com o seguinte:
Despesas de educação (% despesas do governo ou % do PIB)
Taxa de alfabetismo (% da população acima de 15 anos)
(iii) Infraestrutura físico - A qualidade e a situação de assentamentos, infraestrutura
comercial urbana e elementos de sistemas de transporte determinará a vulnerabilidade
de uma comunidade aos impactos imediatos dos eventos tais como chuvas extremas e
inundação de costas e áreas baixas. Qualidade e densidade de estradas e outras vias de
transporte (por exemplo, rios) determinará a capacidade das populações rurais a terem
acesso às comodidades em tempos de crise e também influenciaria a viabilidade e
eficácia nos programas de distribuição de ajuda em resposta às desastres como secas,
enchentes e escassez de alimentos. O isolamento de comunidades rurais dependerá na
natureza e densidade das redes de transporte. A qualidade de infraestrutura de
saneamento e a disponibilidade de água potável também são indicativas da
infraestrutura física (e também são fortemente relacionadas ao estado de saúde). A
categoria de infraestrutura física pode ser representada com a seguinte:
Estradas na área de terreno habitado (km);
Populações sem acesso a saneamento (%);
População rural sem acesso á água doce (%).
(iv) Instituições, governo, conflito e “capital social”– A maneira em que a sociedade
em geral age coletivamente na confrontação e redução de riscos é um fator complexo,
mas extremamente importante na determinação de vulnerabilidade no estuário do
Apodi-Mossoró. A capacidade de agir coletivamente é freqüentemente descrito em
termos de “capital social”, um termo com muitas definições e interpretações. Seguindo
Lochner et. al. (1999), capital social “Consiste das características de organização
social tais como redes de associações secundárias, níveis de confiança pessoal e
normas de ajuda mútua e reciprocidade – que age como recursos para indivíduos e
facilita ação coletiva”. Paldam e Svendsen (2000) definiram capital social mais
sucintamente como “a densidade de confiança” que “determina com que facilidade as
pessoas trabalhem junto”. Desta maneira, influenciaria a vulnerabilidade através de
mecanismos como assistência mútua, ação coletiva e partilhamento de risco (Adger,
1999; Adger et. al., 2003). No Nordeste do Brasil instituições do Estado desempenham

37
um papel importante na determinação de vulnerabilidade. Nos estudos de
vulnerabilidade, a aplicação dos dados representando o grau de democratização,
portanto, deve ser tratado com cuidado. Mesmo assim, se decidiamos utilizar estes
proxies, alguns conjuntos de dados estão disponíveis, como o Freedom House Dataset,
embora Neumayer et. al. (2002) sugira cautela sobre o uso destes dados para
comparações de longo prazo devido à maneira em que são construídos. Dado as
considerações acima, podemos representar fatores relacionados so governo pelas
seguintes proxies:
Refugiados internos (% da população);
Controle de corrupção;
Eficácia de governo;
Estabilidade política;
Qualidade regulatória;
Estado de direito.
(v) Fatores geográficos e demográficos– Fatores geográficos são extremamente
importantes na determinação de exposição de pessoas aos impactos físicos e de riscos
climáticos no estuário do Apodi-Mossoró. Por exemplo, áreas baixas têm mais chance
de enfrentar enchentes como resultado de eventos de chuva extrema do que regiões de
elevação mais alta, e áreas na costa estão sujeitas a uma variedade de riscos (erosão de
ondas/correntes, tempestades) que são ausentes nas regiões do interior. De forma ideal
seria o reconhecimento dos dados sobre os números de pessoas morando em diferentes
tipos de ambiente em uma região, por exemplo, nos planície de inundação e nos áreas
baixas costeiros no estuário do Apodi-Mossoró. Porém, esses dados não estão sempre
disponíveis e então proxies devem ser usados. Nicholls e Small (2002) definem a zonas
costeiras como as áreas que englobam uma ampla diversidade de habitats terrestres e
marinhos desde rios, estuários, zonas úmidas, recifes de coral, bancos de pesca e águas
da plataforma e a inclinação talude continental, por vezes áreas de alta produtividade;
trata-de uma área onde os bens de ecossistema e serviços estão concentrados; e uma
área que tem sido um centro de atividade humana há milênios. Portanto, essa zona
representa a área em que populações seriam mais sujeitas às conseqüências direito ou
indireto dos riscos costeiros devido a mudanças no estado físico e ecológico dos
ecossistemas marinho e costeiro. Como os riscos costeiros são de maior preocupação
em relação as mudanças climáticas, é apropriado incluir medidas relacionadas à
exposição aos riscos costeiros na lista de proxies geográficas. A densidade de população

38
também influenciaria a vulnerabilidade no estuário do Apodi-Mossoró. Altas densidades
de população são associadas com um maior risco de doenças como conseqüência de
certos desastres naturais. Os fatores demográficos e geográficos descrito acima podem
ser representados pelos seguintes elementos:
Linha de costa (km ou escala de área do terreno);
População até 100 km da linha da costa (%);
Densidade da população.
(vi) Dependência da agricultura – Um dos principais riscos associado com
variabilidade e mudanças climáticas são os períodos de secas, e as populações
dependentes da agricultura e sob ameaças constantes de seca são particularmente uma
das principais características do estuário do Apodi-Mossoró. Como agricultura é a
atividade econômica mais sensíve ao clima é apropriado incluir uma medida da
dependência do país na agricultura na lista de proxies. Dependência na agricultura pode
levar a forma de cultivo de pequena escala ou exportações agrícolas que contribuem
significativamente ao PIB. Os seguintes proxies são úteis na representação de
dependência na agricultura (AG):
Empregados agrícolas (% da população total);
População rural (% do total);
Exportações agrícolas (% do PIB).
(vii) Recursos e ecossistemas naturais – A capacidade de se adaptar às mudanças
climáticas dependerá bastante na disponibilidade de recursos naturais, particularmente
dos recursos de água potável. O aumenta na temperatura média resultaria num aumento
da evapotranspiração, e aumentario a demanda para irrigação em algumas partes da
região do estuário Apodi-Mossoró, uma das áreas com maior insolação no Brasil. A
disponibilidade de água será determinada pela combinação de água de precipitação,
aqüíferos que foram carregadas pelas chuvas. Estes dois fatores são particularmente
importantes em regiões áridas e semiáridas, como o estuário do Apodi-Mossoró. Outro
recurso importante é a disponibilidade de terras para expansão das atividades humanas e
da agricultura. Terrenos atualmente improdutivos poderão ser convertidos em uso
agrícola no futuro através da aplicação de tecnologias aos problemas como infertilidade
de solo e escassez de água na área de estudo. Portanto, é do interesse de sociedades ao
longo prazo a preservar ecossistemas existentes e buscar adaptar-se às mudanças
climáticas no estuário do Apodi-Mossoró. Estresse e destruição dos ecossistemas podem
aumentar a vulnerabilidade física das áreas costeiras e estuarinas (através de processos
39
como enchentes e erosão), tais como reduzindo a potencialidade de recursos de
alimentos alternativas e meios de subsistência como parte do processo de adaptação.
Desmatamento, fragmentação de ecossistemas e poluição podem aumentar a
vulnerabilidade ecológica. Fatores relacionados às recursos e ecossistemas naturais
podem ser representados com as proxies seguintes:
Área de terreno protegido;
Cobertura florestal (%);
Recursos de água por pessoa;
Carga de águas subterrâneas por pessoa;
Área de terreno sem população (%);
Taxa de mudança florestal (% por ano);
(viii) Capacidade técnica – A categoria final representa a capacidade do país de
explorar ciência e tecnologia a fim de facilitar a adaptação que envolverá a avaliação da
vulnerabilidade na escala de trabalho. Algumas destas avaliações provavelmente são
altamente técnicas, particularmente avaliações de futuros riscos potenciais. O
desenvolvimento de estratégias de adaptação às mudanças climáticas requer perícia
numa variedade de áreas incluindo geologia ambiental, climatologia, meteorologia,
geomorfologia, hidrologia, ciências agrícolas, engenharia geotécnica e as ciências
socias. A adaptação dependerá uma parte na capacidade de se realizar estudos
quantitativos e qualitativos dos processos que determinam vulnerabilidade.
Investimento em educação universitária e pesquisas e desenvolvimento representará
uma base boa para atender os aspetos técnicos, científicos, sociais e políticos na
adaptação às mudanças climáticas. A capacidade técnica pode ser representada com as
seguintes proxies:
Investimento em educação (% PIB);
Cientistas por milhão de população;
Nível universitário.
2.4 Vulnerabilidades das Comunidades à Adaptação
Os habitantes de comunidades menores são muito mais vulneráveis aos desastres
do que os habitantes das cidades grandes. Pobreza e vitimização de desastre são
claramente ligadas pos quem estuda a vulnerabilidade social das populações em
expansão em países com menor desenvolvimento (BLAIKIE et al., 1994).
Ironicamente, em muitas megacidades como Dhaka e Bangladesh, os pobres urbanos

40
são normalmente migrantes das áreas rurais, ocupando os locais fisicamente vulneráveis
(RASHID, 2000). Ao contrário, os grandes centros urbanos abrigam indivíduos com
mais educação formal e treinamento lidando com os desastres e a mitigação de risco
pré-evento. De fato, na America Latina os planejamentos de manejo de desastres e
programas de treinamento são orientados aos maiores desastres urbanos e “são
totalmente inadequados para lidar com as características bem diferentes de desastres
em regiões periféricas” (MASKREY, 1993). O aumento na população do estuário do
Apodi-Mossoró coloca pressão em vários recursos naturais como o aumento no
desmatamento, nas áreas de pastagens e áreas de cultivo, na erosão de solo e na
construção de estradas e prédios, todos os fatores de risco ao aumento nas enchentes e
de movimentos de massa. Por exemplo, desmatamentos na bacia hidrográfica aumentam
a sedimentação nas drenagens, contribuindo para as enchentes. Similarmente, enchentes
durante a última década talvez pudessem ser parcialmente atribuídas às atividades
humanas (SAVENIJE, 1996). A construção de estradas de acesso a partes da região de
estudo previamente subdesenvolvidas resultou no aumento na população urbana e o
desmatamento, causando “regiões periféricas e populações cada vez mais vulnerável aos
efeitos de risco” (MASKERY, 1993).
Tendo em vista a vulnerabilidade das populações rurais e, o investimento
tecnológico na agricultura faria um papel importante na redução da vulnerabilidade a
curto e longo prazo no estuário Apodi-Mossoró. O esperado crescimento agrícola
aumentaria o rendimento permanente e melhoraria a capacidade das famílias lidarem
com os impactos ambientais. Além disso, dependendo do como o crescimento é
estimulado talvez também reduzisse os riscos subjacentes à atividade agrícola. H é
prazo curto, o crescimento agrícola pode reduzir a vulnerabilidade com aumento nos
rendimentos dos fazendeiros, fornecendo emprego no trabalho agrícola e diminuindo o
custo de alimentos (CHAUDHURI, 2003; TIMMER, 1988). No médio prazo o
crescimento agrícola tem importantes efeitos indiretos através de ligações que
estimulam o setor não agrícola (STERN, 1996; TIMMER, 1988). Como setor, a
agricultura é importante, pois é freqüentemente integrada ao crescimento nacional em
países sem recursos minerais (WFP, 2002). Embora o crescimento agrícola e importante
para reduzir a vulnerabilidade e apoiando o processo de crescimento em geral, seu papel
vai variar através de diferentes países baseada na estrutura econômica geral e
potencialdade para agricultura (DIAO et. al., 2006). O potencial agrícola é medido

41
utilizando dados de risco de chuvas e a duração do período de crescimento enfrentada
pela população rural.
O êxodo da população de distritos rurais para cidades maiores na mesma região
ou para cidades num outro lugar, freqüentemente reflete as ações dos refugiados
ambientais e indivíduos buscando melhor oportunidades de emprego. Os refugiados
ambientais freqüentemente deixam terras destruídas pela seca, tal como aconteceu no
Brasil no século passado e nas últimas décadas ainda ocorre na África (WARRICK,
1983; GLANTZ, 1987). Os grandes desastres tecnológicos, como a contaminação
radioativa em regiões da Ucrânia durante o vazamento do reator nuclear de Chernobyl,
resultou em despovoamento de longo prazo em áreas rurais e cidades pequenas,
próximo ao reator.
2.5 Mudanças Climáticas e Adaptação
Os grandes impactos e ameaças ao aquecimento global são conhecidas (Figura
2.2). O aumento na temperatura do mar causa expansão termal dos oceanos e em
combinação com a água derretida do gelo em terra estão causando a subida do nível do
mar (SLR). O nível do mar subiu 0,17 metros durante o Século XX. Para 2100, é
esperado que o nível do mar suba entre 0,18 e 0,59 metros, apesar de existirem algumas
incertezas nesta estimativa (BINDOFF et. al., 2007). O derretimento das calotas de gelo
e o influxo de água doce do derretimento de glaciares têm o potencial de influenciar os
padrões globais de circulação do mar. Como o estuário Apodi-Mossoró fica localizado
numa área costeira no Atlântico, a selevação do nível do mar devido mudanças
climáticas tem efeito direto na região de estudo.
O desmatamento por corte seguido de queima vegetal reduziu a quantidade de
vapor de água voltando para a atmosfera pelo processo de evapotranspiração (Silva et
al.,1998). O fenômeno das mudanças climáticas inclui processos naturais e humanos
que dependem de múltiplos fatores e é um cenário quase irreversível (Nimer, 1988). As
mudanças climáticas resultam essencialmente na ação humana sobre os ecossistemas
que degradam muito rápido, mas se recuperam muito lentamente e perdem a
biodiversidade. As mudanças climáticas influem significativamente nos processos de
desertificação pelo seu impacto na vegetação, no solo e no ciclo hidrológico (Pimenta et
al., 1998). Atualmente, um dos maiores problemas na possibilidade de mudança do
clima global com conseqüências imprevisíveis nos recursos naturais, está especialmente

42
na qualidade e quantidade de água potável (OMM, 1992). Entre os efeitos diretos da
mudança climática estão às alterações na temperatura, precipitação e velocidade de
vento (SCHWALM; EK, 2001). Recentemente, a projeção dos cenários climáticos
futuros também encorajou várias investigações sobre o uso de séries temporais de
temperatura e precipitação na análise de variabilidade de clima (ELAGIB; ABDU,
1997; ARNELL, 2004).
Como resultado do aquecimento global, o tipo, a freqüência e a intensidade dos
eventos extremos são esperadas que se alterem e sejam mais freqüentes, como as
enchentes, as secas e as fortes precipitações, mesmo que as elevaçoes da temperatura
média sejam pequenas.
Figure 2.2 –´Mudanças climáticas: processos, características e ameaças`, projetado por
Philippe Rekacewicz, UNEP/GRID–Arendal. Fonte: UNEP/GRID–Arendal; http://maps.grida.no/go/graphic/climate_change_processes_characteristics_and_threats.
As mudanças climáticas vão ter amplos efeitos ambientais nos setores
socioeconômicos no estuário Apodi-Mossoró, incluindo recursos d´água, agricultura,
alimentos/nutrição, saúde humana, ecossistemas terrestres, biodiversidade e zonas
costeiras. Mudanças no padrão de precipitação que provavelmente levará a casos
severos de escassez d´água e/ou enchentes, além de erosão do solo. O aumento de

43
temperatura causará mudanças nos estações de chuva e afetará o setor agrícola, com
efeitos na segurança de alimentos e mudanças na distribuição de doenças como malária
e dengue. A elevação na temperatura potencialmente vai aumentar severamente as taxas
de extinção de espécies (até 30 por cento com elevação de 2°C na temperatura). A
elevação do nível do mar significa maior risco de inundação e danos costeiros por
ondas, particularmentenas áreas estuarinas e áreas costeiras baixas.
A adaptação é um processo em que sociedades precisam se lançar para se
capacitarem para um futuro incerto. Adaptando às mudanças climáticas inclui assumir
medidas certas para reduzir os efeitos negativos ou aproveitar os positivos, fazendo os
ajustamentos e as mudanças apropriadas. No estuário Apodi-Mossoró são muitas as
opções e oportunidades para adaptação. Estes variam desde opções tecnológicas, como
mais defesas marítimas, até mudanças no comportamento individual, por exemplo,
reduzindo uso de água potável em tempos de seca e usando estratégias contra insetos
vetores de doenças. Outras estratégias incluem sistemas de alerta precoce para eventos
extremos, melhor manejo de água, melhor manejo de risco, opções variadas de seguro e
conservação de biodiversidade.
As secas, que periodicamente tem efeito no estuário Apodi-Mossoró, são
fenômenos que causam grande impacto social, econômico e ambiental. A população
desta região não vive satisfatoriamente com a instabilidade do clima, fazendo o
sofrimento da seca um grande problema na política do governo. As maiores
conseqüências estão relacionadas à baixa produção de cultivos e recursos de água nos
centros urbanos e comunidades rurais. Portanto, um estudo integrado e apropriado
deveria incluir os entendimentos físicos dos efeitos de clima no equilíbrio de água e nas
colheitas de cultivos, uma análise de uso de água, da economia agrícola e dos impactos
sociais no estuário Apodi-Mossoró.
No Nordeste do Brasil, um dos marcantes impactos sociais da seca é a
emigração da população de áreas rurais para os centros urbanos e destinos urbanos fora
da região (GAISER et al., 2003). A atmosfera do Nordeste do Brasil apresenta
condições médias de estabilidade que inibem o processo convectivo em grande escala,
causada pelo ramo descendente da célula de circulação Walker. O anticiclone Atlântico
Sul permanente induz uma situação média de estabilidade atmosférica. Um mecanismo
possível para o acontecimento de seca severa é o estabelecimento da circulação térmica
local que tem seu ramo ascendente em 10°N e o ramo descendente no Nordeste do
Brasil e região oceânica adjacente (MOURA; SHUKLA, 1981). Alguns estudos
44
mostram que as anomalias na temperatura na superfície do mar nos oceanos Pacífico e
Atlântico estão associadas com as secas no nordeste do Brasil (MOURA; SHUKLA,
1981; ROUCOU et. al., 1996). Essas pesquisas apresentam uma avaliação integrada dos
impactos regionais das mudanças climáticas nos recursos naturais e sua utilidade,
baseada em pesquisa integrada no estuário Apodi-Mossoró, que seria um processo
integrado, incorporado clima, recursos naturais (água, solo), tecnologias, ecologia,
economia e sociedade (LOUCKS, 2000). As pesquisas descrevem as dependências
básicas no sistema humano-ambiental.
Uma base de observação sistemática e serviços de previsão segura são essenciais
para monitorar o clima na região Nordeste do Brasil. A detecção de mudanças climáticas
e a melhoria no entendimento de dinâmicas de sistema climático e sua variabilidade
natural podem favorecer a elaboração de modelos climáticas e, portanto, o planejamento
de opções mitigadoras para o estuário Apodi-Mossoró. Por exemplo, o monitoramento
de tendências no comportamento da temperatura da superfície do mar, na elevação do
nível do mar e aos fenômenos do El Niño/La Niña são fundamentais para avaliar seus
impactos no aumento em intensidade dos períodos de chuvas e secas, ou seja,
determinando os efeitos na redução ou aumento de precipitação que leva aos períodos
de enchentes e secas na região Nordeste do Brasil e sua zona costeira (FERNADEZ;
MUEHE, 2006). Contudo, ressalta-se que não são somente dados climáticos são
necessárias para avaliações efetivas de vulnerabilidade e adaptação às mudanças
climáticas no estuário Apodi-Mossoró. Igualmente importantes, e em falta atualmente, é
a necessidade de dados socioeconômicos corretos e atualizados. Estes dados são um
complemento importante às avaliações existentes, particularmente porque a pobreza foi
reconhecida como um grande fator de vulnerabilidade.
2.6 Impactos Climáticos e a Vulnerabilidade
O Brasil possui muito da diversidade biológica mundial, além de uma grande
variedade de ecossistemas, regiões climáticas, variadas topografias e padrões de uso e
ocupação do solo. Particularmente vulneráveis as mudanças climáticas no Brasil estão
os elementos como: a água, a agricultura, o setor sanitário, a região Amazônica (e setor
da cordilheira andina amazônica) e regiões vulneráveis a eventos climáticos extremos,
como o fenômeno El Niño/La Niña (UNFCCC, 2006 d). Os impactos da mudança
climática nessa região, e seus potenciais de adaptação, estão destacados na Tabela 2.2. A
45
região do estuário Apodi-Mossoró, e toda a região Nordeste do Brasil, já têm
experimentado relevantes mudanças relacionadas ao clima, em especial aqueles
associados com o fenômeno El Niño/Oscilação Sul (ENSO), como evidenciaram
Nascimento (2009) e Souto (2009) em relação às mudanças no balanço sedimentar do
sistema de ilhas barreiras, praias arenosas e campos de dunas na região setentrional do
RN, na foz do estuário do rio Piranhas-Açu. Contudo, a alteração morfológica e o
balanço sedimentar nessa e em outras regiões necessitam de sequências de observações
de mais longo prazo na constatação detalhada da influência direta do efeito E1 Niño na
configuração geomorfológica da costa do Nordeste do Brasil (Fernandez & Muehe,
2006). As informações mais relevantes estão relacionadas às alterações climáticas que
firmemente modificam o padrão de ventos e a precipitação que alteram o padrão normal
morfodinâmico das praias na região.
O fenômeno El Niño/Oscilação Sul (ENSO) atua na escala global envolvendo o
acoplamento entre o sistema oceânico e a atmosfera que ocorre na zona
equatorial/tropical do Pacífico Sul. A componente oceânica se denomina El Niño que
reflete um aumento anômalo das temperaturas superficiais da massa d´água do Pacífico
oriental, entre o equador e os trópicos. A componente atmosférica é denominada
Oscilação Sul (o SO, de ENSO), que funciona como um balanço entre a massa
atmosférica de grande escala, envolvendo trocas de ar entre os hemisférios leste e oeste,
centradas nas latitudes tropicais e subtropicais, com os centros de atuação localizados na
Indonésia e no Pacífico Tropical Sul (SOUZA et al., 1998; FERNANDEZ; MUEHE,
2006). O ENSO possui duas fases distintas: (i) a fase quente, que corresponde ao efeito
E1 Niño e que é a ocorrência de temperaturas mais altas na superfície do Pacífico centro
leste tropical; (ii) e a fase fria chamada La Niña, marcada por anomalias negativas da
temperatura superficial do oceano Pacífico centro leste.
No Nordeste do Brasil alguns autores assinalaram a influência do Padrão Dipolo
(PD) nas alterações dos índices pluviométricos no sertão do Nordeste brasileiro
decorrentes do ENSO (NOBRE; SUKLA, 1996; SOUZA, 1997). Trata-se no PD de
outro componente que se estabelece no sistema oceano-atmosfera e que ocorre,
sobretudo nos meses de outono no Hemisfério Sul (SOUZA, 1997), com anomalias
simultâneas da temperatura superficial do oceano Atlântico equatorial, ao longo da zona
equatorial, se manifestando por sinais opostos da temperatura superficial oceânica nos
dois lados (norte e sul) do Atlântico equatorial. Do mesmo modo que no ENSO, o PD
possui duas fases: (i) a fase positiva, com valores mais elevados na zona norte equatorial do
oceano Atlântico, ocasionando uma migração da ZCIT para norte, e (ii) a fase negativa do
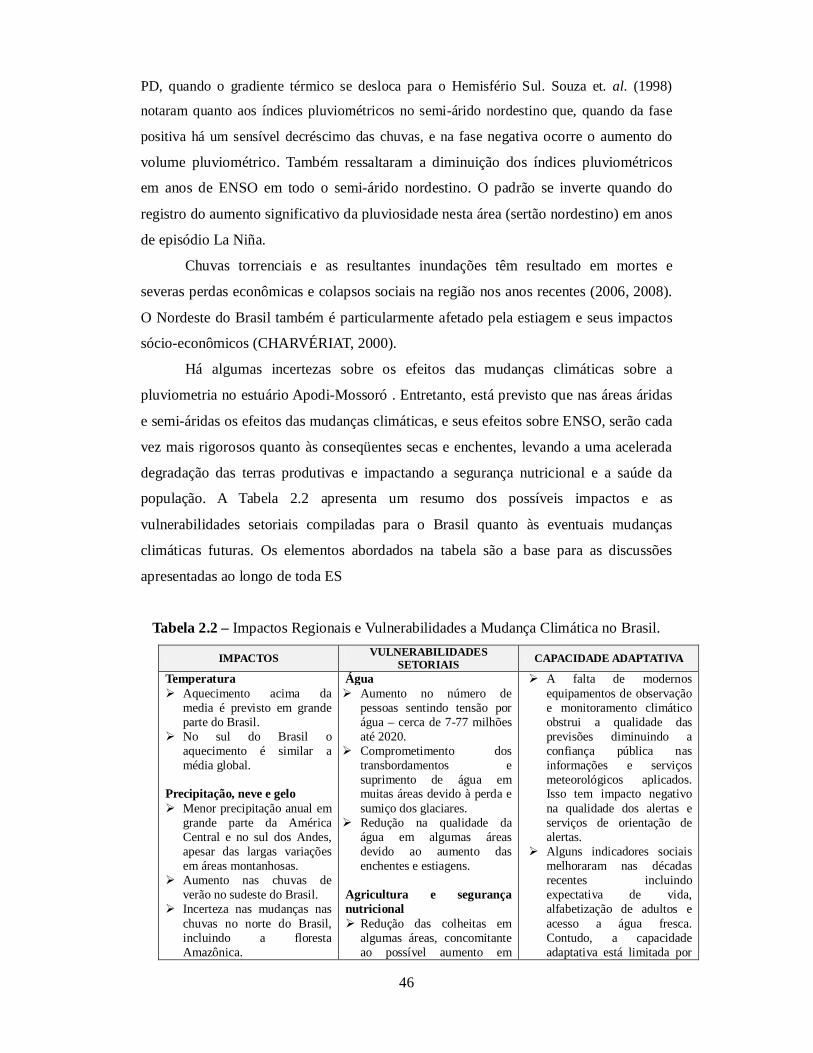
46
PD, quando o gradiente térmico se desloca para o Hemisfério Sul. Souza et. al. (1998)
notaram quanto aos índices pluviométricos no semi-árido nordestino que, quando da fase
positiva há um sensível decréscimo das chuvas, e na fase negativa ocorre o aumento do
volume pluviométrico. Também ressaltaram a diminuição dos índices pluviométricos
em anos de ENSO em todo o semi-árido nordestino. O padrão se inverte quando do
registro do aumento significativo da pluviosidade nesta área (sertão nordestino) em anos
de episódio La Niña.
Chuvas torrenciais e as resultantes inundações têm resultado em mortes e
severas perdas econômicas e colapsos sociais na região nos anos recentes (2006, 2008).
O Nordeste do Brasil também é particularmente afetado pela estiagem e seus impactos
sócio-econômicos (CHARVÉRIAT, 2000).
Há algumas incertezas sobre os efeitos das mudanças climáticas sobre a
pluviometria no estuário Apodi-Mossoró . Entretanto, está previsto que nas áreas áridas
e semi-áridas os efeitos das mudanças climáticas, e seus efeitos sobre ENSO, serão cada
vez mais rigorosos quanto às conseqüentes secas e enchentes, levando a uma acelerada
degradação das terras produtivas e impactando a segurança nutricional e a saúde da
população. A Tabela 2.2 apresenta um resumo dos possíveis impactos e as
vulnerabilidades setoriais compiladas para o Brasil quanto às eventuais mudanças
climáticas futuras. Os elementos abordados na tabela são a base para as discussões
apresentadas ao longo de toda ES
Tabela 2.2 – Impactos Regionais e Vulnerabilidades a Mudança Climática no Brasil.
IMPACTOS VULNERABILIDADES SETORIAIS CAPACIDADE ADAPTATIVA
Temperatura Aquecimento acima da
media é previsto em grande parte do Brasil.
No sul do Brasil o aquecimento é similar a média global.
Precipitação, neve e gelo Menor precipitação anual em
grande parte da América Central e no sul dos Andes, apesar das largas variações em áreas montanhosas.
Aumento nas chuvas de verão no sudeste do Brasil.
Incerteza nas mudanças nas chuvas no norte do Brasil, incluindo a floresta Amazônica.
Água Aumento no número de
pessoas sentindo tensão por água – cerca de 7-77 milhões até 2020.
Comprometimento dos transbordamentos e suprimento de água em muitas áreas devido à perda e sumiço dos glaciares.
Redução na qualidade da água em algumas áreas devido ao aumento das enchentes e estiagens.
Agricultura e segurança nutricional Redução das colheitas em
algumas áreas, concomitante ao possível aumento em
A falta de modernos equipamentos de observação e monitoramento climático obstrui a qualidade das previsões diminuindo a confiança pública nas informações e serviços meteorológicos aplicados. Isso tem impacto negativo na qualidade dos alertas e serviços de orientação de alertas.
Alguns indicadores sociais melhoraram nas décadas recentes incluindo expectativa de vida, alfabetização de adultos e acesso a água fresca. Contudo, a capacidade adaptativa está limitada por
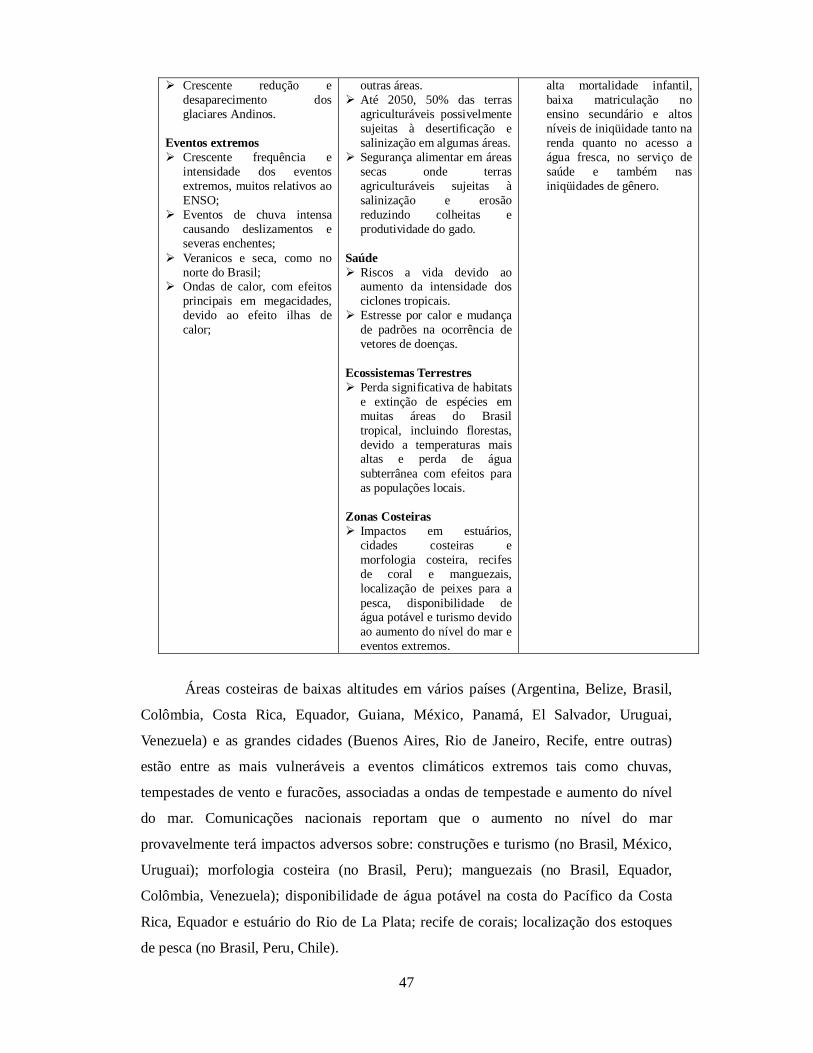
47
Crescente redução e desaparecimento dos glaciares Andinos.
Eventos extremos Crescente frequência e
intensidade dos eventos extremos, muitos relativos ao ENSO;
Eventos de chuva intensa causando deslizamentos e severas enchentes;
Veranicos e seca, como no norte do Brasil;
Ondas de calor, com efeitos principais em megacidades, devido ao efeito ilhas de calor;
outras áreas. Até 2050, 50% das terras
agriculturáveis possivelmente sujeitas à desertificação e salinização em algumas áreas.
Segurança alimentar em áreas secas onde terras agriculturáveis sujeitas à salinização e erosão reduzindo colheitas e produtividade do gado.
Saúde Riscos a vida devido ao
aumento da intensidade dos ciclones tropicais.
Estresse por calor e mudança de padrões na ocorrência de vetores de doenças.
Ecossistemas Terrestres Perda significativa de habitats
e extinção de espécies em muitas áreas do Brasil tropical, incluindo florestas, devido a temperaturas mais altas e perda de água subterrânea com efeitos para as populações locais.
Zonas Costeiras Impactos em estuários,
cidades costeiras e morfologia costeira, recifes de coral e manguezais, localização de peixes para a pesca, disponibilidade de água potável e turismo devido ao aumento do nível do mar e eventos extremos.
alta mortalidade infantil, baixa matriculação no ensino secundário e altos níveis de iniqüidade tanto na renda quanto no acesso a água fresca, no serviço de saúde e também nas iniqüidades de gênero.
Áreas costeiras de baixas altitudes em vários países (Argentina, Belize, Brasil,
Colômbia, Costa Rica, Equador, Guiana, México, Panamá, El Salvador, Uruguai,
Venezuela) e as grandes cidades (Buenos Aires, Rio de Janeiro, Recife, entre outras)
estão entre as mais vulneráveis a eventos climáticos extremos tais como chuvas,
tempestades de vento e furacões, associadas a ondas de tempestade e aumento do nível
do mar. Comunicações nacionais reportam que o aumento no nível do mar
provavelmente terá impactos adversos sobre: construções e turismo (no Brasil, México,
Uruguai); morfologia costeira (no Brasil, Peru); manguezais (no Brasil, Equador,
Colômbia, Venezuela); disponibilidade de água potável na costa do Pacífico da Costa
Rica, Equador e estuário do Rio de La Plata; recife de corais; localização dos estoques
de pesca (no Brasil, Peru, Chile).

48
Os manguezais localizados nas áreas costeiras baixas são particularmente
vulneráveis ao aumento do nível do mar, aumento da temperatura média e freqüência e
intensidade de ondas, especialmente no Brasil, México, América Central e regiões
continentais do Caribe (MAGRIN et. al., 2007) e poderiam desaparecer (MEDINA et.
al., 2001; MCLEOD; SALM, 2006). Os estoques de peixe também são afetados pelo
aquecimento das águas do mar resultando em consequências negativas para o Nordeste
do Brasil. A salinização da água potável poderia tornar-se um problema cada vez mais
sério nas áreas costeiras do Nordeste do Brasil devido ao aumento do nível do mar.
2.7 Adaptação às Mudanças Climáticas e o Desenvolvimento Sustentável
A adaptação às mudanças climáticas no estuário Apodi-Mossoró é vital e
prioritária. Apesar de algumas incertezas acerca da extensão dos impactos, em muitos
setores há informação suficiente e conhecimento disponível para algumas estratégias e
planos de adaptação. Contudo, as limitações incluem a capacidade humana e os recursos
financeiros. Pesquisas prévias destacaram que as abordagens adaptativas mais efetivas
para o estuário Apodi-Mossoró são aquelas que se dirigem a uma série de estresses e
fatores ambientais. Estratégias e programas que provavelmente terão sucesso precisam
conectar esforços coordenados e orientados para a diminuição da pobreza, capacitação
da segurança nutricional e disponibilidade de água combatem a degradação do solo e
redução da perda de diversidade biológica e de ecossistemas. O desenvolvimento
sustentável é um enquadramento necessário para a adaptação integrativa no
desenvolvimento de políticas de redução de problemas de adaptação.
A ausência de recursos financeiros disponíveis em várias formas, bem como
dificuldades de acesso aos fundos que estão disponíveis, representam uma grande
barreira para a adaptação e o desenvolvimento sustentável, especialmente para a ação na
comunidade local. Reconhece-se que pesquisa e treinamento humano para capacitar a
adaptação e o desenvolvimento sustentável são necessários no estuário Apodi-Mossoró
de modo a subsidiar o entendimento dos impactos da mudança climática e a
vulnerabilidades para, assim, facilitar melhores decisões políticas e a gestão. Em suas
comunicações sobre as mudanças climáticas, o Governo do Brasil ofereceu informação
sobre suas vulnerabilidades às mudanças climáticas para vários setores. As principais
opções e respostas de adaptação setorial destacadas por região para a adaptação a
mudança climática nesses diferentes setores estão providos na Tabela 2.3.

49
Tabela 2.3 - Medidas de adaptação em setores-chave vulneráveis destacados em comunicações nacionais do Brasil
SETORES VULNERÁVEIS ADAPTAÇÃO REATIVA ADAPTAÇÃO ANTECIPATÓRIA
Recursos Hídricos
Proteção das águas subterrâneas Melhoria da Gestão e
manutenção de sistemas atuais de fornecimento hídricos
Proteção de áreas de captação de água.
Melhoria do fornecimento de água
Colheita e dessalinização de águas subterrâneas e da chuva
Melhoria no uso de água reciclada Conservação de áreas de captação da
água Melhoria no sistema de gestão da
água Reforma das políticas hídricas
incluindo precificação e políticas de irrigação
Desenvolvimento de controles de enchente e monitoramento de estiagens
Agricultura e Segurança Nutricional
Controle da erosão Construção de diques para
irrigação Mudanças no uso e aplicação de
fertilizantes Introdução de novas plantações Manutenção da fertilidade do
solo Mudança nos períodos de
plantação e colheita Alternância de diferentes cultivos Programas educacionais e
expandidos sobre conservação e gestão do solo e da água.
Desenvolvimento de plantações tolerantes/resistentes (a seca, sal, insetos/pestes)
Pesquisa e desenvolvimento Gestão da água e do solo Diversificação e intensificação das
plantações de alimentos Medidas políticas, taxas
incentives/subsidies, mercado livre Desenvolvimento de sistemas de
alerta antecipado
Saúde Humana
Reforma da gestão da saúde pública
Melhoria das condições de moradia e vida
Melhoria das respostas em emergências
Desenvolvimento de sistemas de alerta antecipado
Melhoria e/ou aperfeiçoamento da vigilância e monitoramento de doenças/vetores
Melhoria da qualidade ambiental Mudanças no design urbano e das
casas
Ecossistemas Terrestres
Melhoria da gestão dos sistemas incluindo controle do desflorestamento, reflorestamento e florestamento.
Promoção da agrofloresta para aumentar bens e serviços florestais
Desenvolvimento/melhoria dos planos de gestão de incêndios em florestas
Melhoria do depósito de carbono nas florestas
Criação de parques/reservas, áreas de proteção e corredores de biodiversidade
Identificação/desenvolvimento de espécies resistentes a mudança climática
Melhoria das taxas de vulnerabilidade dos ecossistemas
Monitoramento de e species Desenvolvimento e manutenção de
bancos de sementes Inclusão de fatores socioeconômicos
em políticas de gestão
Zonas costeiras e ecossistemas
marinhos
Proteção da infraestrutura econômica
Atenção pública para melhorar a proteção aos ecossistemas marinhos e costeiros
Construção de barreiras marinhas e reforços nas praias
Proteção e conservação de recifes de coral, manguezais, ervas
Gestão integrado da zona costeira Melhoria do planejamento e
zoneamento costeiro Desenvolvimento da legislação para
a proteção costeira Pesquisa e monitoração das costas e
ecossistemas costeiros
50
marinhas e da vegetação litorânea
Um movimento significativo no processo das mudanças climáticas seria
capacitar as comunidades do estuário Apodi-Mossoró a identificar suas prioridades
imediatas de opções adaptativas, identificando suas necessidades urgentes e imediatas
de adaptação. Algumas adaptações prioritárias incluem:
Melhoria das previsões para a agricultura, eventos extremos e gestão de
desastres;
Melhoria na gestão hídrica através do entendimento dos fluxos de água e
qualidade de água, melhoria da captação e armazenamento da água da chuva e
diversificação das técnicas de irrigação;
Melhoria na segurança alimentar através da diversificação das plantações,
desenvolvimento e introdução de plantações resistentes a seca, enchentes e salinização,
melhoria das técnicas de alimentação e cultura pecuária e pesqueira, desenvolvimento
de bancos de sementes locais e melhoria da preservação de alimentos locais;
Melhoria do solo e da gestão do uso do solo através do controle de erosão e
medidas de conservação do solo, agrofloresta e técnicas de reflorestamento, gestão de
incêndios e busca de fontes alternativas de energia para a madeira e o carvão, bem como
melhoria no planejamento das cidades;
Gestão da zona costeira incluindo monitoramento dos corais e restauração e
melhoria das defesas costeiras através do florestamento, reflorestamento, restrição de
áreas e barreiras de vegetação;
Melhoria dos cuidados médicos como parte dos programas emergenciais
comunitários de contingência, melhoria da educação para a saúde, melhoria no acesso
primário aos cuidados de saúde e melhoria nos programas de vigilância e limpeza de
habitats;
Construção de capacidades para integrar a mudança climática em planos de
desenvolvimento setorial, envolvendo comunidades locais em atividades de adaptação,
aumento da conciência pública e educação sobre mudança climática;
Promoção do turismo sustentável e do desenvolvimento sustentável.
51
Capítulo III: Aspectos Metodológicos
3.1 Conjunto de Dados
Qualquer estudo de processos costeiros e mudanças no uso da terra envolve a
análise de ambos os convencionais e dados de sensoriamento remoto. Os dados de
sensoriamento remoto digitais apresentam diversas vantagens devido à sua cobertura
repetitiva e visão sinóptica de grandes áreas, por vezes inacessíveis, de forma rápida e
econômica. No presente estudo, para tirar vantagem dupla, foram utilizados dados de
sensoriamento remoto convencionais (fotografias aéreas verticais e de pequeno formato)
e digitais. Contudo, a base de mapeamento temático foi obtida apenas com os produtos
digitais dos satélites orbitais, sendo as outras apenas indicadoras e balizadoras da
análise e interpretação de dados.
Os principais produtos de sensoriamento remoto digitais utilizados foram
imagens orbitais do LANDSAT 5-TM, LANDSAT 7-ETM +, SPOT 4-HRVIR,
IKONOS, CBERS-2B e dados SRTM. Para os dados secundários foram utilizadas as
folhas topográficas do IBGE SB-24-XB-IV, SB-24-XDI, XDI-SB-24-1-2 e MI-897-2.
O processamento digital de imagem (PDI) foi realizada utilizando o software ER
Mapper 7.1, que envolveu a geocodificação usando o fuso de projeção cartográfica
UTM 24S, Datum SAD-69 com o erro (Root Mean Square, RMS) inferior a 0,5. Os
mapas de unidades temáticas (geologia, geomorfologia, solos, uso do solo e vegetação)
foram preparadas na escala de 1:150.000, a partir da interpretação de imagens de satélite
usando o software Arc GIS 9.3 e indicações de campo. Todos os dados secundários
foram coletados no IDEMA, no IBGE e no Departamento de Metrologia do RN. Um
GPS Trimble de mão, com precisão de 5 metros, foi usado nos mapeamentos em campo
na área de estudo, com vista à preparação dos mapas temáticos. Finalmente, os dados
SRTM com 90m de resolução foram usados na obtenção do Modelo de Elevação Digital
(DEM) útil, sobretudo, para estabelecer os mapas de inundação da área de estudo. Esses
conjuntos de dados foram utilizados no estudo do impacto da SLR no uso do solo e na
erosão costeira.

52
3.2 Processamento de Dados Georreferenciados
3.2.1 Pré-processamento
O trabalho de campo foi realizado a fim de validar os resultados de
sensoriamento remoto, melhorar a precisão do registro da imagem e discriminar as
unidades temáticas no local de estudo. No terreno foram estabelecidos cerca de 75
pontos de controle (Ground Control Points, GCP) baseados em GPS de navegação
modelo Garmin com 12 canais e com precisão de 5m em relação aos pontos de controle
do mapa derivado.
Os pontos de controle nos terrenos foram bem distribuídos na área de estudo e
foram selecionados com base nos locais exatos que poderiam ser identificados nas
imagens digitais. Após o georreferenciamento o registro de todas as imagens digitais,
para todos os anos de análise, utilizando de software ERMAPPER, do Laboratório de
Geoprocessamento da UFRN. No registro dados de sensoriamento remoto foriam
empregada a convolução cúbica, baseado num polinômio de segunda ordem que é um
método de transformação avançada para registro de uma cena completa, que determina
os valores dos pixels, avaliando o bloco de 16 pixels que cercam cada pixel saída
(LILLESAND; KIEFER, 2004; WELCH et al., 1985). Embora a convolução cúbica seja
mais complicado, tem alta precisão e fornece uma imagem ligeiramente mais nítida,
tornando o método adequado a ser usado para a discriminação entre classes da paisagem
e em áreas marinhas (MATHER, 1999).
3.2.2 Detecção de Mudanças no Terreno
Duas estratégias foram adotadas na estimativa das classes da paisagem e da
vulnerabilidade eco-ambiental do estuário do rio Apodi-Mossoró e suas variações ao
longo do tempo: (a) Análise e integração de dados vetoriais e, (b) Abordagens de PDI
para aprimoramento visual da análise e interpretação de imagens digitais de
sensoriamento remoto orbital.
3.2.2.1 Análise Vetorial
Embora existam vários métodos que podem ser aplicados para tratar a paisagem
a partir de dados de imagens de satélite (incluindo a análise visual da paisagem, as
técnicas de classificação, a técnica de thresholding, entre outras), cada abordagem
apresenta algumas dificuldades na aplicação prática. Aqui, o mapeamento temático foi

53
realizado a análise e interpretação visual, acompanhada do uso do controle de campo, de
imagens aéreas verticais e de pequeno formato, com vetorização direta via tela de
computador (head up) sobre as imagens de satélite digitais processadas em PDI. Os
dados de saída foram armazenados como mapas vetoriais de análise da paisagem, para
cada ano de acordo com o imageamento, numa base SIG no software Arc GIS 9.3.
3.2.2.2 Realce Digital de Imagens
O melhoramento de imagens digitais por técnicas de PDI é utilizada para
ampliar a capacidade de interpretação visual do intérprete, aumentando a distinção
aparente entre as características das unidades temáticas, aprimorando e otimizando as
capacidades complementares da mente humana com o uso do computador (SHALABY;
TATEISHI, 2007). Como PDI foram empregadas uma variedade de técnicas de
melhoramento de imagens nos softwares ERDAS e ERMAPPER 7.1.
Razão de Bandas
A razão de bandas é considerada um meio relativamente rápido de identificar
áreas de mudança na paisagem (HOWARTH; WICKMORE, 1981; HOWARTH;
BOASSON, 1983), pois as imagens resultantes reforçam diferenças espectrais entre as
classes e suprimem os efeitos topográficos de sombreamento (SABINS, 1987; amaro,
1998; DEWIDAR, 2000). Neste trabalho foram utilizados razão de bandas para as
imagens utilizadas do LANDSAT e do CBERS para melhor identificação das diferentes
classes temáticas de vegetação, solo, geologia, uso e ocupação do solo. Algumas razões
de bandas de imagens LANDSAT que se usou neste trabalho foram RGB4/7-3/5-2/1 e
RGB1-2-NDVI.
Análise de Componentes Principais (PCA)
A PCA foi usada para compactar os dados multibandas das imagens através do
cálculo de um novo sistema de coordenadas em que o primeiro eixo novo (a primeira
princil componente) maximiza a variância dos dados ao longo desse eixo. A segunda
principal componente (PC2) é ortogonal à primeira e tem a segunda maior variância, e
assim por diante. Os dados são, portanto, decorrelacionados e verificou-se que a maior
parte da variância das imagens ficou limitada às três primeiras principais componente.
Uma das características importantes do método de PCA é que produz imagens
totalmente decorrelacionados e, assim, elimina a redundância nos conjuntos de dados
original (EKLUNDH; SINGH, 1993). Importante frisar que a PCA não reduz a
quantidade de informação, pois cada agrupamento PC explica o montante máximo da

54
variância nos dados (PICCHIOTTI et. al., 1997; RICHARDS, 1993; AMARO, 1998;
Dewidar, 2004) para aumentar a capacidade de discriminação espectral entre os
materiais terrestres. Este procedimento aumentou a capacidade de discriminação
espectral entre algumas unidades de uso e cobertura do solo na área de estudo, por meio
das combinações RGB PC1-PC2-PC3 e RGB PC1-PC3-PC4 dos satélites LANDSAT e
CBERS.
O método Maximum Noise Fraction (MNF), introduzida por Green et al. (1988)
e Lee et al. (1990), conhecido como a Transformação da Principal Componente de
Ruído Ajustado (NAPC), também foi aplicada às imagens da área de estudo. Esta
técnica é uma modificação da APC convencionais para ampliar o isolamento do ruído
das imagens que podem ocorrer em apenas uma ou em algumas das bandas originais.
Classificação Supervisionada
As áreas de treinamento supervisionado foram usadas nas imagens, a fim de
identificar as numerosas classes espectrais a serem definidas, antes que representassem
adequadamente as classes temáticas do terreno (LILLESAND; KIEFER, 2004). Todas
as áreas de treinamento supervisionado foram localizados em regiões de tipo de
cobertura homogênea, em subáreas diferentes que ao final foram agrupadas de forma
independente e as classes espectrais foram então analisados para determinar sua
correspondência com a verdade de campo. Alguns agrupamentos representando tipos de
cobertura semelhantes foram então combinadas. A classificação supervisionada de risco
máximo utilizada por Salem (1995), usada como técnica estatística para elevar a
precisão em imagens complexas, foi empregada nas imagens da área de estudo para a
detecção de classes de cobertura do solo, como subsequente uso da classificação por
máxima verossimilhança aplicada ao conjunto completo da imagem para refino
espectral final.
3.3 Análise dos Dados
A linguagem desenvolvida pelo IPCC constituiu um ponto de partida para
explicar os diferentes elementos envolvidos na avaliação do conceito de vulnerabilidade
utilizada nesse trabalho. Nesta seção define-se e explica-se os vários elementos
envolvidos no conceito de vulnerabilidade, incluindo a sensibilidade de exposição e
capacidade de adaptação dos elementos do terreno, e como estes elementos são
combinados para formar mapas de vulnerabilidade natural e eco-ambiental. Em seguida,

55
foi explicado a derivação dos fatores básicos, tais como geologia, geomorfologia, solos,
vegetação e cenários de uso da terra (ROUNSEVELL et al., 2005). Finalmente, a
avaliação da vulnerabilidade destes cenários é apresentada, com base em indicadores de
uso dos ecossistemas terrestres (estuarinos e costeiros).
A questão básica para a avaliação de um modelo de vulnerabilidade para
determinado local consiste em atribuir pesos para cada fator (classe ou camada
temática), de acordo com os seus efeitos relativos considerados na vulnerabilidade
natural e eco-ambiental. O processo de hierarquia analítica, uma teoria que lida com
complexos problemas tecnológicos, econômicos e sócio-políticos (SAATY; VARGAS,
1991), foi o método adequado para determinar o peso atribuído a cada fator. O grau de
adesão em diferentes níveis dos diversos índices foi integrado com o peso total e o grau
de adesão para as diferentes camadas temáticas foram usados para calcular a
vulnerabilidade natural e eco-ambiental da área de estudo. A aplicação das ponderações
subjetivas, por um lado, pode proporcionar alguma indicação da importância relativa
dos diferentes fatores que podem variar com o contexto local, e também pode permitir
uma análise do quão sensível são as avaliações de vulnerabilidade eco-ambientais,
segundo a percepção de especialistas.
Tabela 3.1 - Valores de estabilidade de unidades de paisagem.
UNIDADE PEDOGÊNESE / RELAÇÃO MORFOGÊNESE VALOR Estável Prevalece pedogênese 1.0 Intermediária Equilíbrio entre pedogênese e morfogênese 2.0
Instável Prevalece a morfogênese 3.0 Os mapas de unidades geoambientais (temas: geologia, geomorfologia, solos e
vegetação) foram preparadas na escala de 1:150.000, a partir da interpretação de
imagens de satélite e averiguações em campo. Os pesos foram aplicados para as
diferentes unidades de paisagem, com base no conceito de estabilidade de cada unidade
segundo a hierarquia analítica (Saaty & Vargas 1991) mas considerando o conceito de
Ecodinâmica de Tricart (1977) e Barbosa (1997), onde a estabilidade relativa a
morfogênese e à pedogênese é classificada de acordo com a Tabela 3.1. Os pesos de
uma unidade de paisagem indicam a importância de um fator em relação aos outros
(SILVA et al., 2001; GRIGIO, 2003).. Técnicas de análise espacial foram utilizadas
para integrar os mapas temáticos. As associações de cada camada temáticas foram
baseadas na sensibilidade ou a sua eficácia na área de estudo (GRIGIO et al., 2004).
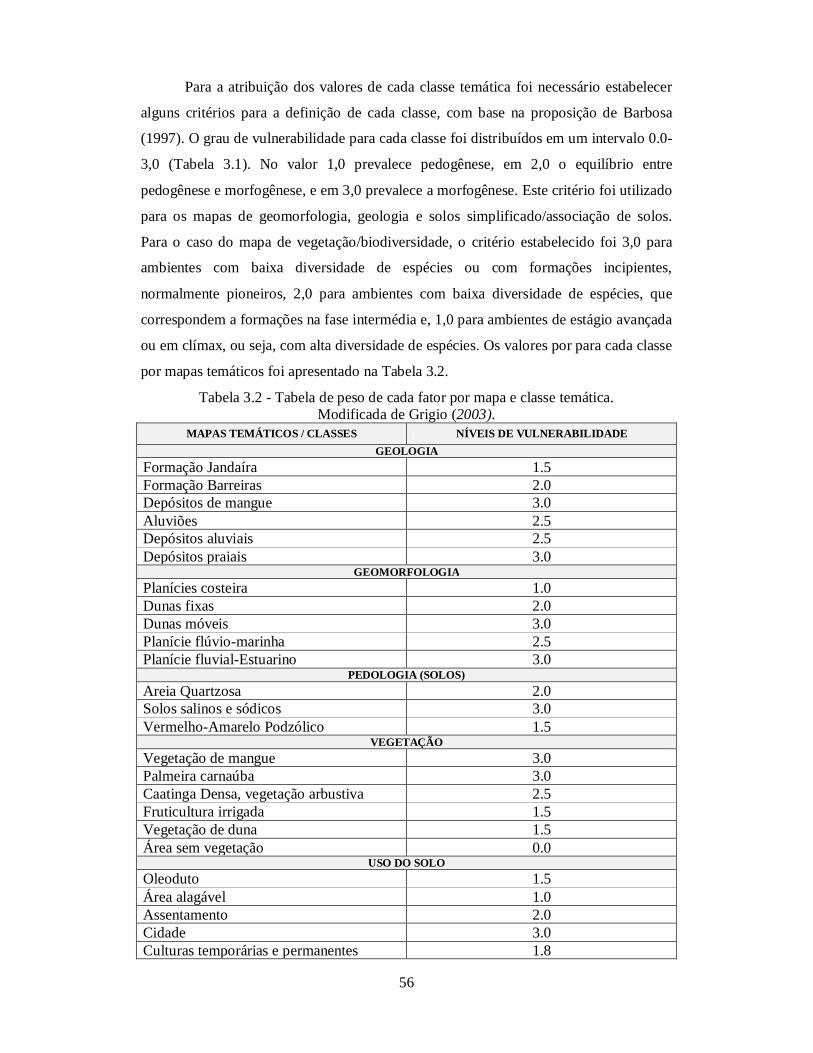
56
Para a atribuição dos valores de cada classe temática foi necessário estabelecer
alguns critérios para a definição de cada classe, com base na proposição de Barbosa
(1997). O grau de vulnerabilidade para cada classe foi distribuídos em um intervalo 0.0-
3,0 (Tabela 3.1). No valor 1,0 prevalece pedogênese, em 2,0 o equilíbrio entre
pedogênese e morfogênese, e em 3,0 prevalece a morfogênese. Este critério foi utilizado
para os mapas de geomorfologia, geologia e solos simplificado/associação de solos.
Para o caso do mapa de vegetação/biodiversidade, o critério estabelecido foi 3,0 para
ambientes com baixa diversidade de espécies ou com formações incipientes,
normalmente pioneiros, 2,0 para ambientes com baixa diversidade de espécies, que
correspondem a formações na fase intermédia e, 1,0 para ambientes de estágio avançada
ou em clímax, ou seja, com alta diversidade de espécies. Os valores por para cada classe
por mapas temáticos foi apresentado na Tabela 3.2.
Tabela 3.2 - Tabela de peso de cada fator por mapa e classe temática. Modificada de Grigio (2003).
MAPAS TEMÁTICOS / CLASSES NÍVEIS DE VULNERABILIDADE GEOLOGIA
Formação Jandaíra 1.5 Formação Barreiras 2.0 Depósitos de mangue 3.0 Aluviões 2.5 Depósitos aluviais 2.5 Depósitos praiais 3.0
GEOMORFOLOGIA Planícies costeira 1.0 Dunas fixas 2.0 Dunas móveis 3.0 Planície flúvio-marinha 2.5 Planície fluvial-Estuarino 3.0
PEDOLOGIA (SOLOS) Areia Quartzosa 2.0 Solos salinos e sódicos 3.0 Vermelho-Amarelo Podzólico 1.5
VEGETAÇÃO Vegetação de mangue 3.0 Palmeira carnaúba 3.0 Caatinga Densa, vegetação arbustiva 2.5 Fruticultura irrigada 1.5 Vegetação de duna 1.5 Área sem vegetação 0.0
USO DO SOLO Oleoduto 1.5 Área alagável 1.0 Assentamento 2.0 Cidade 3.0 Culturas temporárias e permanentes 1.8
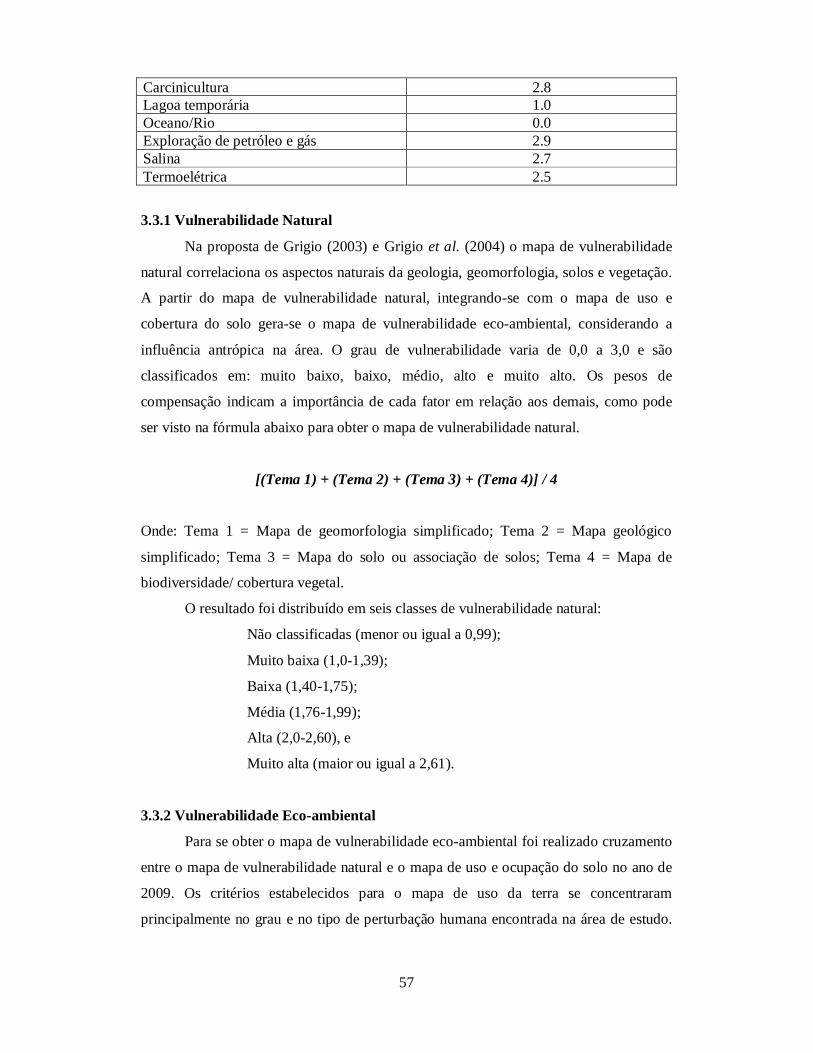
57
Carcinicultura 2.8 Lagoa temporária 1.0 Oceano/Rio 0.0 Exploração de petróleo e gás 2.9 Salina 2.7 Termoelétrica 2.5
3.3.1 Vulnerabilidade Natural
Na proposta de Grigio (2003) e Grigio et al. (2004) o mapa de vulnerabilidade
natural correlaciona os aspectos naturais da geologia, geomorfologia, solos e vegetação.
A partir do mapa de vulnerabilidade natural, integrando-se com o mapa de uso e
cobertura do solo gera-se o mapa de vulnerabilidade eco-ambiental, considerando a
influência antrópica na área. O grau de vulnerabilidade varia de 0,0 a 3,0 e são
classificados em: muito baixo, baixo, médio, alto e muito alto. Os pesos de
compensação indicam a importância de cada fator em relação aos demais, como pode
ser visto na fórmula abaixo para obter o mapa de vulnerabilidade natural.
[(Tema 1) + (Tema 2) + (Tema 3) + (Tema 4)] / 4
Onde: Tema 1 = Mapa de geomorfologia simplificado; Tema 2 = Mapa geológico
simplificado; Tema 3 = Mapa do solo ou associação de solos; Tema 4 = Mapa de
biodiversidade/ cobertura vegetal.
O resultado foi distribuído em seis classes de vulnerabilidade natural:
Não classificadas (menor ou igual a 0,99);
Muito baixa (1,0-1,39);
Baixa (1,40-1,75);
Média (1,76-1,99);
Alta (2,0-2,60), e
Muito alta (maior ou igual a 2,61).
3.3.2 Vulnerabilidade Eco-ambiental
Para se obter o mapa de vulnerabilidade eco-ambiental foi realizado cruzamento
entre o mapa de vulnerabilidade natural e o mapa de uso e ocupação do solo no ano de
2009. Os critérios estabelecidos para o mapa de uso da terra se concentraram
principalmente no grau e no tipo de perturbação humana encontrada na área de estudo.

58
Nesse caso, foi adotado a mesma escala aplicada anteriormente por Grigio (2003) como
mostra a Tabela 3.1, seguindo os preceitos descritos anteriormente.
0,2 X [Tema 1] + 0,1 X [Tema 2] + 0,1 X [Tema 3] + 0,1 X [Tema 4] + 0,5 X [Tema 5]
Onde: Tema 1 = Mapa de geomorfologia simplificado; Tema 2 = Mapa geológico
simplificado; Tema 3 = Mapa do solo ou associação de solos; Tema 4 = Mapa de
biodiversidade/ cobertura vegetal; Tema 5 = Mapa de uso e cobertura do solo.
No caso do mapa de vulnerabilidade eco-ambiental os resultados foram
divididos em seis classes:
Não-classificada (menor ou igual a 0,99);
Muito baixa (1,0-1,39);
Baixa (1,4-1,50);
Média (1,51-1,99);
Alta (2,0-2,59), e
Muito alta (maior ou igual a 2,60).
3.3.3 Vulnerabilidade Costeira
O Índice de Vulnerabilidade Costeira (IVC) analisa seis variáveis que devem ser
relacionadas de forma quantificável à vulnerabilidade relativa da costa às mudanças
físicas devido ao aumento do nível do mar (SLR) em cenários futuros, conforme
proposto por Gornitz (1990); Gornitz et al. (1994); Thieler e Hammer-Klose (1999).
Este método produz dados numéricos que não podem ser equiparados diretamente com
os efeitos físicos específicos em locais específicos. Contudo, destaca-se na análise de
áreas onde os diversos efeitos da elevação do nível do mar são um fator preocupante,
por questões socioeconômico-ambientais, como é o caso de áreas estuarinas e costeiras
e ampla ocupação como na área de estudo, e serve como indicador na gestão e nas
tomadas de decisões sobre o quadro futuro das mudanças climáticas globais. Nesses
casos estão em foco a perda de terra/praia, por vezes agriculturáveis ou de importância
econômica destacada pela atividade de uso instalada, devido à erosão costeira e
inundações, dois dos impactos físicos considerados nesse estudo. As seis variáveis
empregadas no IVC são classificadas em dois grupos: (1) Variáveis ecológicas; (2)
Variáveis geofísicas.

59
As variáveis ecológicas consistem em: geomorfologia; taxa de mudança
histórica nas margens/linhas de praia; declividade costeira. Estas variáveis representam
a resistência relativa da costa à erosão, à erosão de longo prazo e à tendência de acreção,
além de sua susceptibilidade à inundação, respectivamente. As variáveis relativas aos
processos geofísicos incluem: a amplitude significativa de maré, a altura de onda, e o
SLR global, todos fatores que contribuem para os riscos de inundação de uma
determinada seção da linha de costa, em escalas de tempo de horas a séculos. Estas seis
variáveis incluem tanto as informações qualitativas e quantitativas. Os valores das
variáveis reais foram atribuídos na classificação de vulnerabilidade, baseada em faixas
de valores, enquanto a variável geomorfologia não numérica está classificada
qualitativamente de acordo com a resistência relativa de um dado trecho do relevo à
erosão.
O índice de vulnerabilidade costeira (IVC / CVI) foi calculada como a raiz
quadrada do produto das variáveis de classificação, dividido pelo número total de
variáveis:
Onde, a = Geomorfologia; b = Taxa de variação da costa por erosão/acreção (m/ano); c
= Declividade costeira (%); d = Amplitude média da marés (m); e = Altura média
significativa de onda (m), f = SLR global (mm/ano).
Na área de estudo, foram estabelecidos vinte locais para amostragem dessas
variáveis ao longo da costa e no vale do estuário do rio Apodi e, portanto, o índice de
vulnerabilidade costeira (IVC) foi calculado para essas estações. Ao redor do vale do rio
foram selecionados locais com vegetação natural, com atividade industrial e área
urbana; ao longo da costa foram estabelecidos locais considerados como de praias mais
desertas, com apenas pequenas edifícações (casas de veraneio), sem grandes instalações
elétrica e as menos frequentadas por turistas, apenas por pescadores. Trata-se de praias
abertas, desprotegidas, sem obstáculos naturais ou artificiais, o que as torna vulneráveis
aos efeitos das marés e ondas, causando um recuo do litoral. Albino (1999) enfatizou
que a intensidade erosiva e/ou de recuo de uma praia depende de sua tipologia e do seu
uso e ocupação. Em alguns locais os campos de dunas estão sendo constantemente
alimentados por dunas frontais, que estão no início do pós-praia, que são formadas
principalmente por sedimentos provenientes da praia ou estuário subemtidas a
constância dos ventos. A inclinação média do estuário não excede 3m. Mesmo na
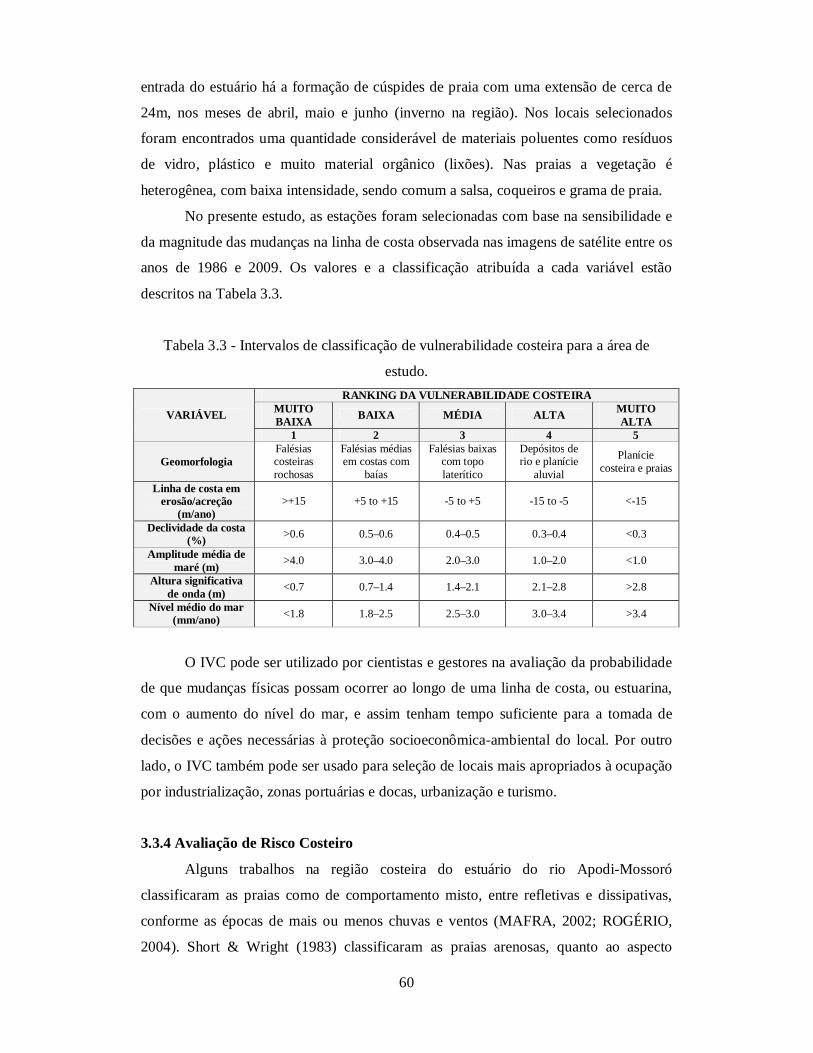
60
entrada do estuário há a formação de cúspides de praia com uma extensão de cerca de
24m, nos meses de abril, maio e junho (inverno na região). Nos locais selecionados
foram encontrados uma quantidade considerável de materiais poluentes como resíduos
de vidro, plástico e muito material orgânico (lixões). Nas praias a vegetação é
heterogênea, com baixa intensidade, sendo comum a salsa, coqueiros e grama de praia.
No presente estudo, as estações foram selecionadas com base na sensibilidade e
da magnitude das mudanças na linha de costa observada nas imagens de satélite entre os
anos de 1986 e 2009. Os valores e a classificação atribuída a cada variável estão
descritos na Tabela 3.3.
Tabela 3.3 - Intervalos de classificação de vulnerabilidade costeira para a área de
estudo.
VARIÁVEL
RANKING DA VULNERABILIDADE COSTEIRA MUITO BAIXA BAIXA MÉDIA ALTA MUITO
ALTA 1 2 3 4 5
Geomorfologia Falésias costeiras rochosas
Falésias médias em costas com
baías
Falésias baixas com topo laterítico
Depósitos de rio e planície
aluvial
Planície costeira e praias
Linha de costa em erosão/acreção
(m/ano) >+15 +5 to +15 -5 to +5 -15 to -5 <-15
Declividade da costa (%) >0.6 0.5–0.6 0.4–0.5 0.3–0.4 <0.3
Amplitude média de maré (m) >4.0 3.0–4.0 2.0–3.0 1.0–2.0 <1.0
Altura significativa de onda (m) <0.7 0.7–1.4 1.4–2.1 2.1–2.8 >2.8
Nível médio do mar (mm/ano) <1.8 1.8–2.5 2.5–3.0 3.0–3.4 >3.4
O IVC pode ser utilizado por cientistas e gestores na avaliação da probabilidade
de que mudanças físicas possam ocorrer ao longo de uma linha de costa, ou estuarina,
com o aumento do nível do mar, e assim tenham tempo suficiente para a tomada de
decisões e ações necessárias à proteção socioeconômica-ambiental do local. Por outro
lado, o IVC também pode ser usado para seleção de locais mais apropriados à ocupação
por industrialização, zonas portuárias e docas, urbanização e turismo.
3.3.4 Avaliação de Risco Costeiro
Alguns trabalhos na região costeira do estuário do rio Apodi-Mossoró
classificaram as praias como de comportamento misto, entre refletivas e dissipativas,
conforme as épocas de mais ou menos chuvas e ventos (MAFRA, 2002; ROGÉRIO,
2004). Short & Wright (1983) classificaram as praias arenosas, quanto ao aspecto

61
morfológico e hidrodinâmico, em seis tipos: dissipativo, reflectivo e em quatro tipos
mistos (ou intermediários) aos dois, onde os extremos dissipativo e refletivo,
respectivamente, caracterizam as praias mais expostas e as mais protegidas. A proteção
de uma praia, ou seja, a barreira aos eventos de energia intensa devido à presença de
obstáculos, e a disponibilidade de sedimentos, indicam uma praia de baixa
vulnerabilidade à erosão por condições climáticas e, portanto, de baixa variabilidade
temporal (WRIGHT; SHORT, 1987). Tais tipos de praias definem também o máximo
de refletividade e, segundo Brunn (1962), as praias refletivas são menos vulneráveis a
uma elevação do nível do mar que os outros tipos de praias arenosas devido à altura
relativamente alta do perfil praial.
A resposta do litoral para o aumento do nível do mar é geralmente estimada pela
Regra de Bruun, que afirma que o recuo da linha de costa depende da inclinação média
do perfil de praia. Medições detalhadas de acordo com a Regra Bruun (1962) foram
feitas utilizando os mapas topográficos e geomorfológicos (escala 1:25.000) e cálculos
ao longo da costa nas vinte e duas estações de controle e amostragem, incluídas as vinte
do item anterios. A equação de Bruun é bastante simples em sua forma:
R = SGL / (b + h)
Onde: R = É o recuo devido à subida do nível do mar; S = Está acima do nível do mar
presente; G = É a proporção de material erodido que permanece no perfil ativo, definido
como o inverso de um excesso de preencher as proporções; L = É a largura do perfil
ativo; b = É a altura típica da terra, muitas vezes, controladas pelas dunas; e, h = É a
profundidade de fechamento, que define o limite do mar do perfil.
Para estimar a erosão costeira foram usadas as imagens do LANDSAT 5 TM e 7
ETM + desde 2003 até 2010, que define as variações da linha de costa, onde a erosão
média da costa foi calculada em 5,38m/ano. Quanto aos cenários de nível do mar foram
utilizados os dados do IPCC para 2050 e 2100, de acordo com a Warrick et al., 1996. A
largura dos perfis ativos foi de 205m. Para elevação foram utilizados os dados SRTM, e
para as profundidades foram relacionados ao dado de 2,35m acima da água baixa
(Marinha do Brasil - ADCP). Os cálculos foram realizados em 22 segmentos do litoral
que foram definidos, principalmente, pela largura do perfil ativo que variou pouco ao
longo da costa da área de estudo. Os valores mínimo e máximo de perda da terra foram
apresentados em m3 e em percentagem da área total estudada do estuário do rio Apodi-
Mossoró.

62
Com base nas medições e observações de campo, as posições do litoral foram
retraçadas nos mapas topográficos. As observações de campo foram utilizadas para
comparar as alterações possíveis do litoral obtido pela Regra de Bruun, comparadas ao
mapa com o estado atual. Duas posições diferentes do litoral foram selecionadas e,
mantidas as condições meteorológicas normais, ambas foram submetidas aos
inventários de perda de solos e danos temporários.

63
Capítulo IV: Avaliação da Vulnerabilidade Natural e Eco-Ambiental
4.1 Introdução
Este Capítulo teve o objetivo de ampliar a compreensão sobre as condições de
vulnerabilidade natural e eco-ambiental da área de estudo, com vistas às alterações
ambientais passadas. Basicamente, os resultados mostraram a intensidade, a distribuição
e os efeitos ao meio ambiente, ou seja, aos ecossistemas naturais do estuário do rio
Apodi-Mossoró, diante das ações antropogênicas. As técnicas empregadas, já
conhecidas para outras áreas do RN, se detiveram em identificar, avaliar e classificar a
vulnerabilidade natural e eco-ambiental e as alterações ambientais no estuário utilizando
uma abordagem combinada do padrão da paisagem e sensibilidade do ecossistema. De
fato, o desenvolvimento contínuo dos conceitos de vulnerabilidade e os empregos de
seus métodos já produziram algumas ferramentas para ajudar a superar problemas
comuns, tais como agir em contexto de grandes incertezas, tendo em conta a dinâmica e
a escala espacial de um sistema sócio-ecológico, ou sob pontos de vista das diferentes
ciências para combinações baseado nas abordagens do impacto humano sobre o meio
ambiente. Com base nesta avaliação, esta pesquisa propõe perspectivas concretas e as
possibilidades de beneficiar as semelhanças existentes na construção e aplicação de
instrumentos de avaliação.
Neste Capítulo, foram propostos dois artigos científicos, já publicados, contendo
o método de avaliação das vulnerabilidades dos sistemas sócio-ecológicos que estão
interligados a múltiplos intervenientes. Sabe-se, contudo, que esse fato também permite
múltiplas avaliações da vulnerabilidade nos mesmos locais. Cinco camadas temáticas
foram usadas - geologia, geomorfologia, solos, vegetação e uso do solo - para definir a
vulnerabilidade natural e as mudanças ambientais.
Este esforço de avaliação da vulnerabilidade, sob tais mudanças ambientais, traz
à luz questões importantes da política multidisciplinar (METZGER et. al., 2005), tais
como: Quais são as principais regiões ou setores que são vulneráveis à mudanças
climáticas? Como as vulnerabilidades entre duas regiões se comparam? Qual é o cenário
menos, e o mais, prejudicial para uma determinada região ou setor?

64
4.2 Artigo Primeiro
BOORI, Mukesh Singh; AMARO, Venerando Eustáquio Amaro. Land use change
detection for environmental management: using multi-temporal, satellite data in
Apodi Valley of northeastern Brazil. Applied GIS International Journal, v. 6, n.
2, p. 1-15, 2010. ISSN 1832-5505.
Applied GIS a free, international, refereed e-journal
(ISSN: 1832-5505)
URL:
http://www.appliedgis.net
MANAGING EDITORS:
Ray Wyatt – [email protected]
Jim Peterson – [email protected]
Volume 6, Number 2
October, 2010
CONTENTS:
All papers published during 2010 are part of Volume 6.
Each paper constitutes one Number.
Hence this paper should be cited as:
Boori, M.S. & Amaro, V.E. (2010) – Land use change detection for environmental management: using multi-temporal satellite data in the Apodi Valley of northeastern Brazil,
Applied GIS, 6(2), 1-15

Boori, M.S. & Amaro, V.E. (2010) – Land use change detection for environmental management: using multi-temporal, satellite data in the Apodi Valley of northeastern Brazil, Applied GIS, 6(2), 1-15
1
Land use change detection for environmental management:
using multi-temporal, satellite data in the Apodi Valley of northeastern Brazil
Mukesh Singh Boori1
Venerando Eustáquio Amaro
Geo-processing Laboratory, Geodynamic & Geophysics Division, Department of Geology, Center of Exact Sciences and Earth,
Federal University of Rio Grande do Norte, Natal–RN,
Brazil
Abstract: In this study maximum-likelihood, supervised
classification along with post-classification change detection was applied to satellite images for 1986, 1989, 1996, 2001, and 2009, in order to map land-cover changes within the Apodi Valley region of northeastern Brazil. The supervised classification was carried out on the six reflective bands and ground truthed. The classification results were then further refined using ancillary data, visual interpretation and expert knowledge of the area along with GIS. Post-classification change detection then generated a change image in the form of cross-tabulations. Fifteen land cover classes existed within the area, and reclamation processes during the 1990‟s changed them substantially, with conflicting changes being caused primarily by lack of both stability and consistency in the government‟s land use policies. The result was extensive vegetation degradation and water logging in parts of the study area.
Keywords: Land cover classification; multi-temporal; change
detection; remote sensing; GIS
1. Introduction
Changes in the earth‟s surface can be related to the natural dynamics of human activities and they can occur either suddenly or gradually (Coppin et.al., 2004). Timely and accurate change detection of the earth‟s surface features provides a better understanding of the interactions between human and natural phenomena to better manage and use resources (Lu et.al., 2004). Over the last 25 years northeast Brazil has been subjected to a series of major disturbances, both natural and manmade - drought, civil disturbances leading to migration, large population increases and globalization. Each of these has had implications for land use requirements, with subsequent impacts on natural vegetation cover, biodiversity,
Boori, M.S. & Amaro, V.E. (2010) – Land use change detection for environmental management: using multi-temporal, satellite data in the Apodi Valley of northeastern Brazil, Applied GIS, 6(2), 1-15
2
socio-economic stability and food security. The modification of the vegetation cover, especially clearing, can have a long-term impact on sustainable food production, freshwater and forest resources, the climate and, last but not least, human welfare (Foley et al., 2005). It is important, therefore, that the changes occurring in land cover are reliably documented at periodic intervals.
Encroachment of urban settlements upon agricultural land may pose dire consequences, such as land degradation and desertification (Shalaby et.al., 2004). The ever increasing population produces growing pressure on areas that are already inhabited and causes a decrease in area per capita (Suliman, 1991). Food scarcity and continual loss of agricultural land are issues of global concern (Aboel Ghar et.al., 2004). The government of Brazil adopted policies aimed at self-sufficiency in food production, such as extension of cultivated land and maximization of production on the existing agricultural land. The principal purpose was, and still is to overcome Brazil‟s overwhelmingly unfavorable population to agricultural land ratio (Springborg, 1979).
Accurate and up-to-date information on land cover change is necessary for understanding and assessing the environmental consequences of such changes (Giri et.al., 2005), and although remote sensing is capable of capturing such changes, extracting the change information from satellite data requires effective and automated change-detection techniques (Roy et.al., 2002).
The objectives of this study were to:
1. provide a recent perspective of different land-cover types 2. monitor 1986-2009 land-cover changes using supervised classification, and 3. describe problems and make brief suggestions for improved management of
natural resources.
2. Study area
The study area is located along the Apodi River valley in the northwestern portion of the state of Rio Grande do Norte. The Apodi River rises near Apodi city in the semiarid region of northeastern Brazil, flows northeastwards through the Mossoro, Areia Branca and Grossos districts and discharges directly into the Atlantic Ocean (Figure 1). Geographic coordinates range from a latitude 04°55'46".77 to 05°13'39".41 south and from longitude 37°01'30".79 to 37°22'42".42 east. The area has a semi arid tropical type of climate, with a mean annual temperature of around 28°C. The average rainfall of 700-900 mm/y mostly falls in February to April inclusive, often at high intensity, and is accompanied by very high potential evaporation in excess of 2,000 millimeters per year.
Initially, forested areas were encroached upon by the oil- and natural gas-exploration industry and also used for agriculture purposes by the local peoples. More recently it has been encroached upon by the salt industry and over the last ten years it has been slowly replaced by shrimp farms due to market demand. Despite the high levels of current effort in forest conservation, degradation of forests caused by its unsound exploitation is still a serious threat. Also, urbanization is inevitable due to economic development and rapid population growth.

Boori, M.S. & Amaro, V.E. (2010) – Land use change detection for environmental management: using multi-temporal, satellite data in the Apodi Valley of northeastern Brazil, Applied GIS, 6(2), 1-15
3
Figure 1 - Study area location, in the state of Rio Grande do Norte, northeastern Brazil.
Northeast Brazil covers an area of about 1.5 million square kilometers. The semi arid part of this region corresponds to approximately 60% of the total area of northeastern Brazil. This extensive area is inhabited by more than 30 million people and the economy is mainly based on subsistence-style, rain-fed crop production and industrialization – oil, natural gas, shrimp and salt. Overpopulation causes serious socio-economical problems, such as an undermining of rising living standards, high unemployment and crime.
Accordingly, new policies must aim to reduce the pressure on old and highly productive agricultural and forest land, decrease population density in the inhabited areas and decrease pollution by establishing industrial areas outside the valley region. It follows that determining both the trend in, and the rate of land-cover conversion are necessary if the development planner needs to establish rational, land-use policies. Here the temporal dynamics of remote-sensing data can play an important role in monitoring and analyzing land-cover changes.
3. Methods
There are many techniques available for detecting and recording differences, such as image differencing, ratios and correlation (Singh, 1989; Stow et.al., 1996; Yuan et.al., 1999). However, the simple detection of change is rarely sufficient in itself: information is generally required about the initial and final land-cover and land uses - „„from-to‟‟ analysis as described by Khorram et al. (1999).
Furthermore, detection of image differences may be confused with problems in penology and cropping, and such problems may be exacerbated by limited image availability, poor quality in temperate zones and difficulties in calibrating poor images. Post-classification comparisons of derived, thematic maps go beyond simple change detection because they attempt to quantify the different types of change. Their degree of success depends upon the

Boori, M.S. & Amaro, V.E. (2010) – Land use change detection for environmental management: using multi-temporal, satellite data in the Apodi Valley of northeastern Brazil, Applied GIS, 6(2), 1-15
4
reliability of the maps that have been made by image classification. Broadly speaking, both large-scale changes such as widespread logging and major urban development, and small-scale changes like shrimp farming, might be mapped reasonably easily.
3.1 Data sets
Any study of land use changes will involve the analysis of both conventional and remotely sensed data. Conventional data is more accurate and site specific, but its collection is time consuming, expensive, manpower hungry and difficult to extrapolate over a larger area. Remotely sensed data, on the other hand, has several advantages due to its repetitive and synoptic coverage of large and inaccessible areas in a quick and economical fashion. In the present study both conventional and remotely sensed data were used.
The main remote sensing products used were orbital images of Landsat TM, ETM+, Spot 4-HRVIR, IKONOS and CBERS 2B satellite data. For secondary data we used SB-24-XB-IV, SB-24-XDI, XDI-SB-24-1-2 and MI-897-2 topographic sheets. Digital image processing was performed using the ER Mapper 7.1 software, which involved geo-coding using the UTM cartographic projection zone 24S-Datum SAD-69 with the Root Mean Square (RMS) error being less than 1.0 meters. A Trimble hand-held GPS with an accuracy of 10 meters was used to map and collect the coordinates of important land use features during pre- and post-classification field visits to the study area in order to prepare land-use and land-cover maps.
3.1.1 Image classification
Land cover classes are typically mapped from digital remotely sensed data using some sort of supervised, digital image classification (Campbell, 1987; Thomas et.al., 1987). The overall objective of the image classification procedure is to automatically categorize all pixels in an image into land-cover classes or themes, and the maximum likelihood classifier quantitatively evaluates both the variance and covariance of the category‟s spectral response patterns whenever it classifies an unknown pixel. This is why it is considered to be one of the most accurate classifiers - it is based on statistical parameters. Supervised classification was performed here using ground checkpoints and digital topographic maps.
The area was classified into fifteen main classes:
1. Wetland - land whose soil is saturated with moisture either permanently or seasonally, so such areas are covered either partially or completely by shallow pools of water.
2. Agriculture - areas cultivated with annual crops, vegetables, or fruit 3. Forest (CAATINGA) - small trees and shrub vegetation area except for savanna
vegetation. 4. Exposed soil - land areas of exposed soil surface influenced by human impacts
and/or natural causes, containing sparse vegetation with very low plant cover due to overgrazing and woodcutting
5. Fixed dunes - vegetation has developed on dunes so that it forms a more or less complete cover of the substrate
6. Industry – shrimp, salt and other economic activities 7. Pond - permanent or temporary water body 8. Mangroves - small trees and shrubs grow near the saline coast line and river 9. Mobile dunes - dunes without vegetation 10. Ocean & river - the Apodi River and its mouth to the Atlantic Ocean 11. Petroleum - oil and natural gas 12. Salt - transitional areas between land and water, occurring along the intertidal shore
of estuaries and sounds where salinity ranges from near ocean strength to near fresh in the river area
13. Shrimp - aquaculture sites that cultivate marine shrimp or prawns for human consumption.

Boori, M.S. & Amaro, V.E. (2010) – Land use change detection for environmental management: using multi-temporal, satellite data in the Apodi Valley of northeastern Brazil, Applied GIS, 6(2), 1-15
5
14. Stabilized pond - permanent water bodies for industrial purposes 15. Urban - includes construction activities along the coastal dunes (summer resorts) as
well as sporadic houses of the Bedouins within the local villages and some governmental buildings in the main cities of Mossoro, Areia Branca and Grossos
3.1.2 Land use change-detection maps
Following the classification of imagery from each individual year, a multi-date, post-classification comparison, change-detection algorithm was used to determine changes during four intervals - 1986–1989, 1989–1996, 1996–2001, and 2001–2009. This is perhaps the most common approach to change detection (Jensen, 2004) and it has been successfully used by Yang (2002) to monitor land use trends in the Atlanta, Georgia area. The post-classification approach provides „„from–to‟‟ change information which facilitates easy calculation and mapping of the kinds of landscape transformations that have occurred, as shown in Figure 2. Figure 3 then charts the spatial breakdown of all the land-cover classes that are used in Figure 2.

Boori, M.S. & Amaro, V.E. (2010) – Land use change detection for environmental management: using multi-temporal, satellite data in the Apodi Valley of northeastern Brazil, Applied GIS, 6(2), 1-15
6
1986 1989
1996 2001
2009
Figure 2 - Thematic maps representing the spatial distribution of different land-cover classes, on different dates, with in the Apodi Valley region of northeast Brazil
Legend
LULC_2008
<all other values>
Classe
Agricultural Activity
CAATINGA
Exposed Soil
Fixed Dunes
Industrial Area
Mangroves
Mobile Dunes
Ocean/River
Petroleum Field
Pond
Salt area
Shrimp farms
Stabilized Pond
Urban Area
Wetland

Boori, M.S. & Amaro, V.E. (2010) – Land use change detection for environmental management: using multi-temporal, satellite data in the Apodi Valley of northeastern Brazil, Applied GIS, 6(2), 1-15
7
1986 1989
1996 2001
2009
Figure 3 - The spatial breakdown of the different land-cover classes, on different dates, in the Apodi Valley region of northeast Brazil

Boori, M.S. & Amaro, V.E. (2010) – Land use change detection for environmental management: using multi-temporal, satellite data in the Apodi Valley of northeastern Brazil, Applied GIS, 6(2), 1-15
8
Accuracy assessment was then carried out at 85 points, 65 from the field data and 20 from existing topographic maps and the land cover map. Specification of these 85 points used a stratified, random method so that all of the different land-cover classes would be represented. In order to increase the accuracy of the land-cover mapping of the two images, ancillary data as well as the result of visual interpretation was integrated with the classification results using GIS. The aim of this was to improve the classification accuracy of the classified image.
4. Results and discussion
Classification maps were generated for all of the five years shown in Figure 2 and the individual class area and change statistics are summarized in Table 1. In 1986 the urban area covered 18.74 km² (1.36%), but by 2009 it had increased to approximately 53.50 km² (3.88%). The agricultural area initially increased from 243.20 km² (17.05%) in 1986 to 244.62 km² (19.58%) by 1996, but it then decreased to 189.51 km² (13.8%) by 2009. The forested area decreased from 1986 (692.93.20 km² and 50.46%) to 616.46 km² and 45.40%) by 2001, but due to government interference and protection rules it then increased to 724.29 m² (52.76%) by 2009.
The wetland area was 151.83 km² (11.05%) in 1986, but now it is only 48.52 km² (3.51%). Although the extent of wetlands may change from year to year due to varying precipitation and temperature, and although variation is also likely due to classification errors, because of the high classification accuracy for water small fluctuations in water are believed to be related to varying lake levels.
Class name 1986 1989 1996 2001 2009
(km²) (%) (km²) (%) (km²) (%) (km²) (%) (km²) (%)
Agriculture 234.2 17.1 192.6 14.0 244.6 19.6 242.3 17.8 189.5 13.8
Forest 692.9 50.5 677.3 49.4 623.9 49.9 616.5 45.4 724.3 52.8
Exposed soil 6.8 0.5 25.0 1.8 17.0 1.4 41.1 3.0 28.9 2.1
Fixed dunes 21.9 1.6 18.9 1.4 14.4 1.2 14.4 1.1 11.9 0.9
Industry --- --- --- --- 0.6 0.0 0.8 0.1 3.3 0.2
Mangroves 3.3 0.2 2.5 0.2 7.2 0.6 6.1 0.4 0.8 0.1
Mobile dunes 9.1 0.7 12.2 0.9 10.8 0.9 10.6 0.8 11.0 0.8
Ocean & river 53.3 3.9 53.6 3.9 49.4 4.0 48.6 3.6 67.0 4.9
Petroleum 1.11 0.1 34.0 2.5 41.1 3.3 42.3 3.1 77.9 5.7
Ponds 30.5 2.2 23.93 1.7 17.8 1.4 19.7 1.5 8.9 0.7
Salt area 149.2 10.9 126.3 9.2 134.6 10.8 135.8 10.0 137.0 10.0
Shrimp farm --- --- --- --- --- --- --- --- 10.5 0.8
Stabilized pond --- --- --- --- --- --- --- --- 0.2 0.0
Urban area 18.7 1.4 22.9 1.7 29.9 2.4 31.3 2.3 53.3 3.9
Wetland 151.8 11.1 182.7 13.3 58.2 4.7 148.2 10.9 48.2 3.5
Total 1372.8 100 1372.8 100 1372.8 100 1372.8 100 1372.8 100
Table 1 - Summary of satellite classification statistics for 1986, 1989, 1996, 2001 and 2009
Industry first appeared in 1996 with approximately 0.6 km² (0.04%), and it then continuously increased to reach 3.3 km² (0.2%) by 2009. The biggest change occurred in the petroleum area; it was 1.1 km² (0.1%) in 1886, it is now 77.9 km² (5.7%) and it is still continuously increasing. The salt area is approximately stable but, due to market demand, it has been slowly replaced by shrimp farms since 2001. Fixed dunes have continuously decreased and mobile dunes have continuously increased, which is an indication of climate change in the area.
To further evaluate the results of land-cover conversions, matrices of land-cover changes for the four intervals were created, and these are shown in Table 2. In this table unchanged pixels are located along the major diagonal of the matrix. Conversion values were sorted by area and listed in alphabetic order.

Boori, M.S. & Amaro, V.E. (2010) – Land use change detection for environmental management: using multi-temporal, satellite data in the Apodi Valley of northeastern Brazil, Applied GIS, 6(2), 1-15
9
1986 - 1989 (kms2) to -> from:
Ag
ric
ult
ure
Fo
res
t
Ex
po
se
d s
oil
Fix
ed
du
ne
s
Ind
us
tria
l
Ma
ng
rove
s
Mo
bil
e d
un
es
Oc
ea
n &
riv
er
Pe
tro
leu
m
Po
nd
s
Sa
lt
Sh
rim
p f
arm
Sta
bil
ize
d
Urb
an
We
tla
nd
Agriculture 139.4 65.4 7.7 1.6 .. .. .. .. 12.3 0.3 .. .. .. 2.1 5.8
Forest 48.4 588.9 9.6 1.3 .. .. .. 0.5 2.. 1.1 0.5 ... .. 2.4 19.3
Exposed soil 0.7 2.3 3.4 .. .. .. .. 0.4 0.1 .. .. .. .. .. ..
Fixed dunes 0.2 0.3 .. 12.5 .. 0.6 2.2 0.1 .. 0.8 1.2 .. .. 0.6 3.7
Industrial .. .. .. .. .. .. .. .. .. .. .. .. .. .. ..
Mangroves .. .. .. .. .. 1.0 .. 0.8 .. .. 0.9 .. .. .. 0.7
Mobile dunes .. 0.5 .. 1.5 .. .. 6.1 0.6 .. 0.3 0.5 .. .. .. ..
Ocean & river 0.1 0.4 0.9 .. .. 0.6 0.5 43.2 .. .. 2.2 .. .. 0.3 4.4
Petroleum .. 0.4 .. .. .. .. .. .. 0.3 0.9 .. .. .. .. ..
Ponds 0.3 2.1 0.1 0.3 .. .. 0.1 .. 0.3 14.5 1.2 .. .. .. 11.6
Salt .. 0.5 .. 0.8 .. 0.2 3.5 3.9 .. 0.7 114.4 .. .. 0.7 22.5
Shrimp farm .. .. .. .. .. .. .. .. .. .. .. .. .. .. ..
Stabilized .. .. .. .. .. .. .. .. .. .. .. .. .. .. ..
Urban 1.1 0.6 .. .. .. .. .. 0.1 .. .. 0.4 .. .. 16.0 0.7
Wetland 2.1 16.7 4.7 0.9 .. 0.2 .. 2.4 0.6 6.8 5.5 .. .. 0.7 111.8
1989 - 1996 (kms2) to -> from:
Ag
ric
ult
ure
Fo
res
t
Ex
po
se
d s
oil
Fix
ed
du
ne
s
Ind
us
tria
l
Ma
ng
rove
s
Mo
bil
e d
un
es
Oc
ea
n &
riv
er
Pe
tro
leu
m
Po
nd
s
Sa
lt
Sh
rim
p f
arm
Sta
bil
ize
d
Urb
an
We
tla
nd
Agriculture 136.6 47.4 1.1 .. 0.1 0.1 .. .. 0.5 0.3 .. .. .. 3.9 2.7
Forest 94.7 522.7 10.9 0.9 .. .. 0.4 .. 15.3 1.6 0.3 ... .. 4.5 26.5
Exposed soil 6.5 10.6 2.3 .. .. .. .. 0.1 0.4 0.1 .. .. .. .. 4.9
Fixed dunes 0.9 3.6 .. 9.6 .. 0.9 1.4 .. .. 1.1 0.8 .. .. 0.3 0.3
Industrial .. .. .. .. .. .. .. .. .. .. .. .. .. .. ..
Mangroves .. .. .. 0.1 .. 1.5 .. 0.5 .. .. .. .. .. .. 0.5
Mobile dunes .. 0.1 .. 1.7 .. .. 7.9 1.1 .. .. 1.0 .. .. .. 0.4
Ocean & river 0.2 0.3 .. 0.1 .. 0.9 0.4 40.5 .. 0.2 2.4 .. .. 0.1 7.7
Petroleum 0.8 8.2 .. .. .. .. .. .. 23.9 0.4 .. .. .. .. 0.1
Ponds .. 1.9 .. 0.5 .. .. 0.4 0.2 0.5 9.3 3.3 .. .. .. 7.7
Salt .. 1.3 .. 0.6 .. 1.6 .. 2.9 .. 0.1 111.0 .. .. 0.4 7.3
Shrimp farm .. .. .. .. .. .. .. .. .. .. .. .. .. .. ..
Stabilized .. .. .. .. .. .. .. .. .. .. .. .. .. .. ..
Urban 0.3 0.3 .. 0.2 .. .. .. 0.3 .. .. 0.1 .. .. 20.2 1.5
Wetland 5.4 28.7 2.2 0.6 .. 2.5 0.2 2.9 0.3 4.5 15.6 .. .. 0.3 117.6

Boori, M.S. & Amaro, V.E. (2010) – Land use change detection for environmental management: using multi-temporal, satellite data in the Apodi Valley of northeastern Brazil, Applied GIS, 6(2), 1-15
10
1996 - 2001 (kms2) to -> from:
Ag
ric
ult
ure
Fo
res
t
Ex
po
se
d s
oil
Fix
ed
du
ne
s
Ind
us
tria
l
Ma
ng
rove
s
Mo
bil
e d
un
es
Oc
ea
n &
riv
er
Pe
tro
leu
m
Po
nd
s
Sa
lt
Sh
rim
p f
arm
Sta
bil
ize
d
Urb
an
We
tla
nd
Agriculture 202.4 29.7 8.3 .. .. 0.1 .. .. 1.1 0.1 .. .. .. 0.7 0.7
Forest 31.4 559.7 9.9 0.8 0.2 .. .. 0.1 7.2 1.5 0.7 ... .. 1.0 8.0
Exposed soil 2.4 1.0 13.0 .. .. .. .. .. .. .. .. .. .. .. ..
Fixed dunes .. 0.7 .. 11.6 .. .. 0.9 .. .. 0.1 0.7 .. .. 0.2 0.2
Industrial .. .. .. .. 0.6 .. .. .. .. .. .. .. .. .. ..
Mangroves 0.8 0.9 .. 0.1 .. 4.1 .. 0.8 .. 0.1 0.6 .. .. .. 0.3
Mobile dunes .. .. .. 1.1 .. .. 8.8 0.3 .. 0.1 0.1 .. .. .. 0.2
Ocean & river 0.1 0.1 .. 0.1 .. 0.3 0.4 42.7 .. .. 1.4 .. .. 0.2 2.6
Petroleum 0.5 5.6 .. .. .. .. .. .. 33.5 0.2 .. .. .. .. 0.1
Ponds 0.1 1.0 .. 0.1 .. .. 0.1 .. 0.2 14.9 0.2 .. .. .. 0.9
Salt .. 0.7 .. 0.5 .. 1.0 0.3 0.7 .. 0.1 128.6 .. .. 0.2 1.7
Shrimp farm .. .. .. .. .. .. .. .. .. .. .. .. .. .. ..
Stabilized .. .. .. .. .. .. .. .. .. .. .. .. .. .. ..
Urban 0.2 0.6 .. 0.1 .. .. .. .. .. .. 0.1 .. .. 27.9 0.7
Wetland 4.1 17.2 9.8 0.1 .. 0.4 0.1 2.9 0.1 2.2 3.6 .. .. 1.1 132.9
2001 - 2009 (kms2) to -> from:
Ag
ric
ult
ure
Fo
res
t
Ex
po
se
d s
oil
Fix
ed
du
ne
s
Ind
us
tria
l
Ma
ng
rove
s
Mo
bil
e d
un
es
Oc
ea
n &
riv
er
Pe
tro
leu
m
Po
nd
s
Sa
lt
Sh
rim
p f
arm
Sta
bil
ize
d
Urb
an
We
tla
nd
Agriculture 92.0 129.3 3.1 0.5 .. .. 0.3 0.2 8.0 1.2 1.1 .. .. 3.7 1.7
Forest 91.2 444.7 6.6 0.6 2.2 0.1 0.5 1.8 36.7 3.0 6.7 0.1 .. 14.7 9.2
Exposed soil 1.5 33.3 0.5 .. 0.6 .. .. 0.3 1.0 0.1 .. .. .. 2.0 1.7
Fixed dunes .. 1.9 0.2 3.7 .. .. 2.4 2.6 0.1 0.2 2.9 .. .. 0.2 0.1
Industrial 0.1 0.5 0.1 .. 0.2 .. .. .. .. .. .. .. .. .. ..
Mangroves .. 1.1 .. 0.1 .. 0.1 1.1 1.6 .. 0.2 1.8 .. .. .. ..
Mobile dunes 0.1 1.4 0.1 1.7 .. .. 2.3 4.0 .. 1.0 .. .. .. .. ..
Ocean & river 0.1 1.7 0.3 0.1 .. 0.4 0.2 36.4 .. .. 5.9 0.3 0.1 1.1 0.4
Petroleum 1.3 12.1 0.1 .. .. .. .. 0.5 28.0 0.1 0.2 .. .. .. 0.4
Ponds 0.2 3.9 0.5 0.9 .. .. 0.8 6.3 0.9 0.2 2.8 0.5 .. 0.1 2.8
Salt 0.2 8.2 0.5 4.1 .. 0.3 1.9 7.3 .. 0.2 94.2 .. .. 2.5 16.5
Shrimp farm .. .. .. .. .. .. .. .. .. .. .. .. .. .. ..
Stabilized .. .. .. .. .. .. .. .. .. .. .. .. .. .. ..
Urban .. 5.4 0.1 .. .. .. 0.3 0.6 .. .. 1.5 .. .. 23.3 ..
Wetland 1.7 74.1 16.5 0.3 0.2 .. 1.3 3.4 1.5 2.7 18.2 9.1 0.1 5.1 14.4
Table 2 - Matrices of land-cover changes (km²) from 1986 to 2009
The results indicate that increases in the urban area mainly came from the conversion of agricultural and forest land in the 1986–1996 period and then again in the 2001-2009 interval. More exactly, in the 1986-1989 period 2.1 km² of agriculture and 2.4 km² of forest converted to urban, and during the 1989-1996 interval this doubled to 3.9 km² of agriculture
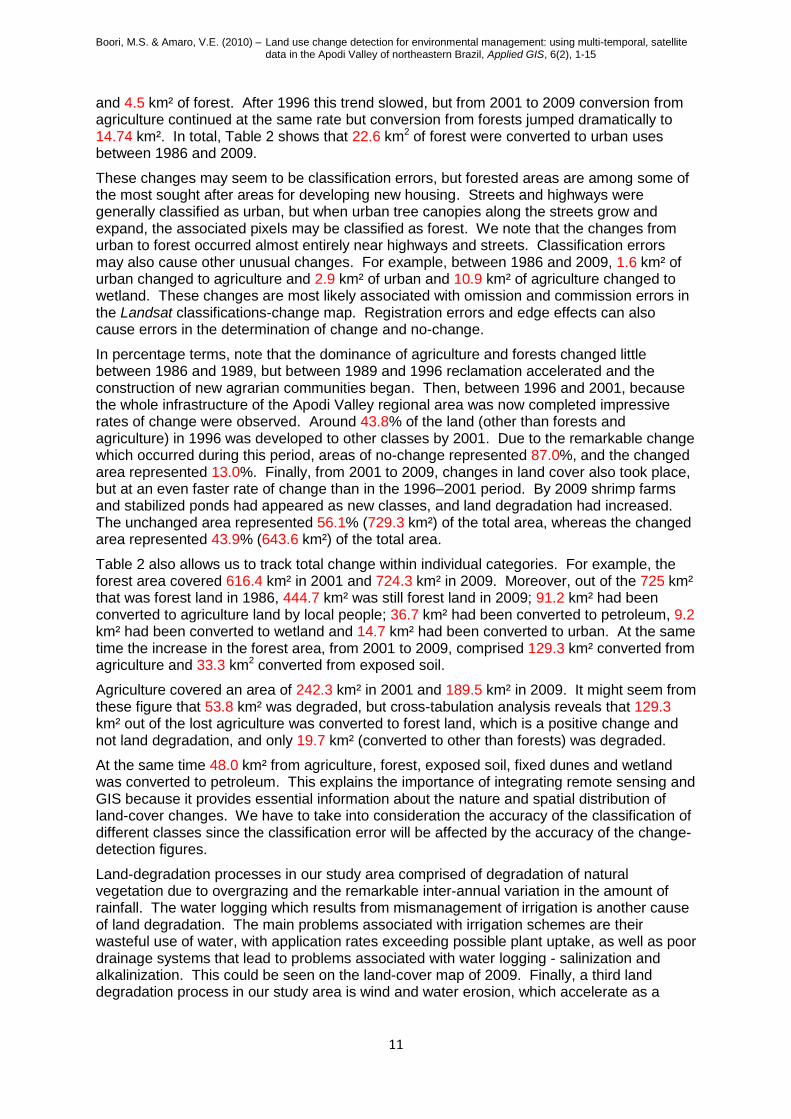
Boori, M.S. & Amaro, V.E. (2010) – Land use change detection for environmental management: using multi-temporal, satellite data in the Apodi Valley of northeastern Brazil, Applied GIS, 6(2), 1-15
11
and 4.5 km² of forest. After 1996 this trend slowed, but from 2001 to 2009 conversion from agriculture continued at the same rate but conversion from forests jumped dramatically to 14.74 km². In total, Table 2 shows that 22.6 km2 of forest were converted to urban uses between 1986 and 2009.
These changes may seem to be classification errors, but forested areas are among some of the most sought after areas for developing new housing. Streets and highways were generally classified as urban, but when urban tree canopies along the streets grow and expand, the associated pixels may be classified as forest. We note that the changes from urban to forest occurred almost entirely near highways and streets. Classification errors may also cause other unusual changes. For example, between 1986 and 2009, 1.6 km² of urban changed to agriculture and 2.9 km² of urban and 10.9 km² of agriculture changed to wetland. These changes are most likely associated with omission and commission errors in the Landsat classifications-change map. Registration errors and edge effects can also cause errors in the determination of change and no-change.
In percentage terms, note that the dominance of agriculture and forests changed little between 1986 and 1989, but between 1989 and 1996 reclamation accelerated and the construction of new agrarian communities began. Then, between 1996 and 2001, because the whole infrastructure of the Apodi Valley regional area was now completed impressive rates of change were observed. Around 43.8% of the land (other than forests and agriculture) in 1996 was developed to other classes by 2001. Due to the remarkable change which occurred during this period, areas of no-change represented 87.0%, and the changed area represented 13.0%. Finally, from 2001 to 2009, changes in land cover also took place, but at an even faster rate of change than in the 1996–2001 period. By 2009 shrimp farms and stabilized ponds had appeared as new classes, and land degradation had increased. The unchanged area represented 56.1% (729.3 km²) of the total area, whereas the changed area represented 43.9% (643.6 km²) of the total area.
Table 2 also allows us to track total change within individual categories. For example, the forest area covered 616.4 km² in 2001 and 724.3 km² in 2009. Moreover, out of the 725 km² that was forest land in 1986, 444.7 km² was still forest land in 2009; 91.2 km² had been converted to agriculture land by local people; 36.7 km² had been converted to petroleum, 9.2 km² had been converted to wetland and 14.7 km² had been converted to urban. At the same time the increase in the forest area, from 2001 to 2009, comprised 129.3 km² converted from agriculture and 33.3 km2 converted from exposed soil.
Agriculture covered an area of 242.3 km² in 2001 and 189.5 km² in 2009. It might seem from these figure that 53.8 km² was degraded, but cross-tabulation analysis reveals that 129.3 km² out of the lost agriculture was converted to forest land, which is a positive change and not land degradation, and only 19.7 km² (converted to other than forests) was degraded.
At the same time 48.0 km² from agriculture, forest, exposed soil, fixed dunes and wetland was converted to petroleum. This explains the importance of integrating remote sensing and GIS because it provides essential information about the nature and spatial distribution of land-cover changes. We have to take into consideration the accuracy of the classification of different classes since the classification error will be affected by the accuracy of the change- detection figures.
Land-degradation processes in our study area comprised of degradation of natural vegetation due to overgrazing and the remarkable inter-annual variation in the amount of rainfall. The water logging which results from mismanagement of irrigation is another cause of land degradation. The main problems associated with irrigation schemes are their wasteful use of water, with application rates exceeding possible plant uptake, as well as poor drainage systems that lead to problems associated with water logging - salinization and alkalinization. This could be seen on the land-cover map of 2009. Finally, a third land degradation process in our study area is wind and water erosion, which accelerate as a

Boori, M.S. & Amaro, V.E. (2010) – Land use change detection for environmental management: using multi-temporal, satellite data in the Apodi Valley of northeastern Brazil, Applied GIS, 6(2), 1-15
12
result of the loss of vegetation cover. Also, wind and water erosion have led to the removal of the relatively fertile topsoil and this could result in desertification.
4.1 Major problems in the Apodi Valley region’s eco-environment
The land use change-detection maps demonstrate the great fragility of the natural area and how it is threatened by the intense action of coastal processes and economic activities. Moreover, analysis of mapped geological and geomorphological units indicates that the region is strongly impacted by salt ponds and shrimp farms‟ disorderly occupation of tidal flats, estuaries and mangrove areas. Growth of human activities has ensured that the mangrove ecosystem in this region is in much lower proportions than in adjacent estuarine systems. Also, oil and natural gas exploration in the region have created instability of natural resources. In summary, most of the 5 million residents in the upper basin are farmers or workers, agricultural and industrial activity is intensive and it is so concentrated along rivers and streams non-point pollution of the water is a growing problem.
Given the excessive consumption of natural resources and the gradual increase in population, some prominent eco-environmental problems obviously need to be solved urgently. Among them, deforestation and forest degradation are a major environmental and ecological issue, with a substantial amount of forest having been lost due to conversion of forests to farmlands (salt, shrimp and agricultural), high grading, industrialization and harmful logging practices. The forested areas were first encroached upon by oil and natural gas exploration along with agriculture for local people, they were then further encroached upon by the salt industry, and over the last ten years they have been slowly replaced by shrimp farming due to market demand. Despite much current effort in terms of forest conservation, the continuing degradation of forests due to unsound exploitation is still a serious threat. Also, soil erosion has seriously affected sustainable development, with degraded land increasing at a rate of 1000 km² per year. Deforestation is the chief cause of soil erosion, and the adverse geology and climatic conditions intensify erosion.
Moreover, the Apodi valley region is one of the main unmanaged regions of Brazil with economic decline and poor environmental awareness. Population increases over the years has brought a demand for food, fuel and timber which exceeds local production levels. This leads to a fundamental imbalance between humans and their environment. Inappropriate land use has generated a huge area of farmland, considerable vegetation destruction and substantial soil losses which collectively add up to gross deterioration of the environment.
4.2 Suggestions for local eco-environmental management
An important goal of environmental assessment is to provide assistance to policy makers and practitioners of environmental protection, so here we suggest that to protect and maintain the ecological environment a population-control policy might be needed. Also, some regulations like “convert slope farmland into forest or pasture” along with laws like an “Environmental Protection Act”, a “Land Act”, a “Forestry Act” and a “Grassland Act” could be established and implemented. Areas of higher ecological sensitivity should be protected as a first priority and for moderately sensitive areas integrated, small watershed management should purposefully focus on sustainable utilization of natural resources to sustainably protect water and soil. In addition, authorities should develop a form of ecologically sensitive agriculture and industry that combines traditional and modern practices and they need to strive for coordinated development of both the environment and the economy.
In the areas immediately surrounding the Apodi River, the importance of environmental protection needs to be emphasized because of its significant geographical position. In addition to increasing vegetation coverage, enhancing the capacity for soil and water preservation and strengthening the controls on non-point source pollution, the establishment of special, ecologically functional reserves, such as the national river wetland nature reserve,
Boori, M.S. & Amaro, V.E. (2010) – Land use change detection for environmental management: using multi-temporal, satellite data in the Apodi Valley of northeastern Brazil, Applied GIS, 6(2), 1-15
13
is a matter of priority. Human migration due to the water and industrial projects should also be noted. Ecological protection measures must be adopted to prevent soil erosion, control pollution, and protect water, air and soil quality during emigrant movements and settlement within the Apodi Valley region.
The Apodi River has been highly threatened by land desertification. In areas where some water is available for irrigation, therefore, trees and shrubs acting as fences for small plots or grass belts should be planted. Such vegetation decreases the wind velocity near the base of dunes and so prevents much of the sand from moving. It can also protect farmland, conserve water, preserve soils and provide fuel wood. Moreover, in some regions where it is difficult to restore degraded land because of an arid climate and low rainfall, it is crucial to reduce and limit livestock numbers to prevent further degradation from overgrazing. However, just strengthening environmental protection can only be a temporary measure, because alleviation of socio-economic and environmental ignorance is also necessary. Public environmental awareness, as well as scientific understanding, needs to be boosted.
Generally speaking, proper protection of the Apodi Valley region‟s ecological environment would be significant not only for the protection of water resources, the ecological system and biodiversity within northeast Brazil, but also for social progress, economic development, living standards improvement, national prosperity of water-source areas and general regional health.
5. Conclusion
Over the last 25 years unprecedented land cover and land use changes have occurred within the Apodi Valley region. The area has undergone very severe land-cover change as a result of development projects of the agricultural, industrial and tourist kinds. The main drivers of such changes have been both human and natural. A high rate of population increase, economic development and globalization on one side, and natural hazards such as floods, landslides, drought and climate change on the other have continuously and are still eroding northeast Brazil‟s natural ecosystems and resources.
The reduction of natural vegetation like forest, wood and shrub lands has had environmental as well as socio-economic impacts. The decrease in natural vegetation is not only leading to loss of habitat, biodiversity and stored carbon, but also to loss of pastures, sources of fuel wood and bush meat. Furthermore, a positive feedback mechanism has led to an increase in the risk of natural hazards like floods and landslides.
From a socio-economic point of view this means not only a loss of ecosystem services, but also a decline of livelihoods and cultural values, not to mention a subsequent reduction of income from tourism. A consequence of this is to make protected areas some of the few remaining zones where fuel wood, rich pastures and game resources are left, and so they attract more and more illegal activities.
As shown by our study, land-cover change is mainly driven by the expansion of industry. The increase of agricultural areas, if poorly managed, has impacts above those previously mentioned - changes in the soil water cycle, nutrient depletion and an increased risk of soil erosion and land degradation, even though the expansion of croplands leads to a growth in agricultural outputs like food and fibers to positively impact on the country‟s economy and human well being. Yet the land left available for future agricultural expansion is decreasing, and with population increases the agricultural zone itself is more crowded. This will only exacerbate potential friction between agriculturalists and pastoralists.
As well as the huge increase in agricultural land there has also been a considerable increase in urban settlements, with the area of natural vegetation decreasing considerably, and the main causes of land degradation have been removal of vegetation and water logging. Such changes require rapid adjustments to land management in order to avoid crises in food
Boori, M.S. & Amaro, V.E. (2010) – Land use change detection for environmental management: using multi-temporal, satellite data in the Apodi Valley of northeastern Brazil, Applied GIS, 6(2), 1-15
14
security and conflicts over dwindling access to natural resources, which are becoming more in evidence.
Indeed, the concept of “environmental refugees” is receiving more attention both within the media and the scientific literature. This problem needs to be seriously studied, through a multi-dimensional approach that includes socio-economic considerations, in order to preserve the newly reclaimed land and increase food production. Further studies are required, therefore, to provide information not just on the magnitude of these changes, but also, unlike this study, to spatially localize potential trouble spots so that action can be taken.
References
Aboel Ghar, M., Shalaby, A. & Tateishi, R. (2004) - Agricultural land monitoring in the Egyptian Nile Delta using Landsat data, The International Journal of Environmental Studies, 61(6), 651–657
Campbell, J.B. (2002) - Introduction to remote sensing (3rd ed.), New York, Guilford Press
Coppin, P. et.al. (2004) - Digital change detection methods in ecosystem monitoring: a review, International Journal of Remote Sensing, 25(9), 1565– 1596
Foley, J.A. et.al. (2005) - Global consequences of land use changes, Science, 309, 570–574
Giri, C., Zhu, Z. & Reed, B. (2005) - A comparative analysis of the Global Land Cover 2000 and MODIS land cover data sets, Remote Sensing of Environment, 94, 123–132
Jensen, J.R. (2004). Digital change detection and introductory digital image processing: A remote sensing perspective, New Jersey, Prentice-Hall
Khorram, S. et.al. (1999) - Accuracy Assessment of Remote Sensing-Derived Land Cover Change Detection, Monograph, ASPRS, Bethesda, Maryland, 64
Lins, K.S. & Kleckner, R.L. (1996) - Land cover mapping: An overview and history of the concepts, in Scott, J.M., Tear, T.H. & Davis, F. (eds.) - Gap analysis: a landscape approach to biodiversity planning, Bethesda, MD, American Society for Photogrammetry and Remote Sensing, 57–65
Lu, D., Mausel, P., Brondizio, E. & Moran, E. (2004) - Change detection techniques, International Journal of Remote Sensing, 25(12), 2365–2407
Roy, D.P., Lewis, P.E. & Justice, C.O. (2002) - Burned area mapping using multi-temporal moderate spatial resolution data - a bi-directional reflectance model-based expectation approach, Remote Sensing of Environment, 83, 263–286
Shalaby, A., Aboel Ghar, M. & Tateishi, R. (2004) - Desertification impact assessment in Egypt using low resolution satellite data and GIS, The International Journal of Environmental Studies, 61(4), 375–384
Singh, A. (1989) - Digital change detection techniques using remotely sensed data, International Journal of Remote Sensing, 10, 989–1003
Springborg, R. (1979) - Patrimonialism and policy making in Egypt: Nasser and Sadat and the tenure policy for reclaimed lands, Middle Eastern Studies, 15(1), 49–69
Stow, D.A., Chen, D.M. & Parrott, R. (1996) - Enhancement, identification and quantification of land cover change, in Morain, S.A. & Lopez Barose, S.V. (eds.) - Raster imagery in geographical information systems, Santa Fe, One Word, 307–312
Suliman, M. K. (1991) - Universities and development of the desert land in the ARE, Proceedings of the second annual university conference, Cairo, 2–5 November
Thomas, I.L., Benning, V.M. & Ching, N.P. (1987) - Classification of remotely sensed images, Bristol, Adam Hilger
Yang, X. (2002) - Satellite monitoring of urban spatial growth in the Atlanta metropolitan area, Photogrammetric Engineering and Remote Sensing, 68(7), 725–734
Yuan, D., Elvidge, C.D. & Lunetta, R.S. (1999) - Survey of multi-spectral methods for land cover change analysis, in Lunetta, R.S. & Elvidge, C.D. (eds.) - Remote sensing

Boori, M.S. & Amaro, V.E. (2010) – Land use change detection for environmental management: using multi-temporal, satellite data in the Apodi Valley of northeastern Brazil, Applied GIS, 6(2), 1-15
15
change detection: environmental monitoring methods and applications, London, Taylor & Francis, 21–39
---------------------------------------------------------------------------------------------------------------------------

81
4.3 Segundo artigo
BOORI, Mukesh Singh; AMARO, Venerando Eustáquio. Detecting and understanding
drivers of natural and eco-environmental vulnerability due to hydro geophysical parameters,
ecosystem and land use change through multispectral satellite data sets in Apodi estuarine,
Northeast Brazil. International Journal of Environmental Sciences (IJES), v. 1, n. 4, p.
543–557, 2010. ISSN 0976-4402.

INTERNATIONAL JOURNAL OF ENVIRONMENTAL SCIENCES Volume 1, No 4, 2010
© Copyright 2010 All rights reserved Integrated Publishing services
Research article ISSN 0976 – 4402
543
Detecting and understanding drivers of natural and eco-environmental vulnerability due to hydro geophysical parameters, ecosystem and land use
change through multispectral satellite data sets in Apodi estuarine, Northeast Brazil
Mukesh Singh Boori, Venerando Eustáquio Amaro Geo-processing Laboratory, Dept. of Geology (Geodynamic & Geophysics division), Center of
Exact Sciences and Earth, Federal University of Rio Grande do Norte, Natal –RN, Brazil. [email protected], [email protected]
ABSTRACT
The Apodi estuarine located in the north coast of Rio Grande do Norte State; it is a typical and key valley region with apparent upland ecosystem vulnerability and sensitivity. In order to analyze natural and eco-environmental vulnerability, remote sensing (RS) and geographical information system (GIS) technologies are adopted and an environmental numerical model is developed using DIP techniques. The objective of this study was to improve our understanding of natural and eco-environmental vulnerability; it´s causes basically show the intensity, its distribution and human-environment effect on the ecosystem in the Apodi estuarine, so that a strategy of sustainable land use could be established. The model contains some basic factors like geology, geomorphology, soil, vegetation and land use/cover. According to the numerical results, the vulnerability is classified into six levels, unrated/ potential, very low, low, medium, high, and very high levels, by means of the cluster principle. Vulnerability maps have the aim to show the intensity, and its distribution in the study area, of the susceptibility of the environment. The results show that the natural vulnerability in the study area was at medium and high level, and eco-environmental vulnerability is quite more sensitive in maximum part of the study area. However, the ecosystem quality had become worse over the thirty years in some regions. In the study area, population growth, encroachment, industrialization, vegetation degradation, and governmental policies for eco-environmental protection were found to be the major factors that caused the environmental changes over the thirty years.
Keywords: Natural and eco-environmental vulnerability, Remote sensing, GIS
1. Introduction
The study region is located in an area of high environmental sensitivity zone; subject to great pressure of human activities, resulting is an environmental degradation mainly due to its most economic activities. In Apodi estuarine unmanaged industrialization, vegetation degradation, grassland degeneration, sandy desertification, high rate oil and natural gas exploration; utilization of harmful pesticides in tropical fruit farms; unmanaged shrimp and marine salt industry; encroachment of agricultural land; land reclamation; silt deposition in river; severe flooding; costal dynamics, rapid growth of urbanization, water erosion and government policies for eco-environmental protection are main factors led to an increased pressure on ecosystem and primary natural resources: soil, water and biomass. Especially in semi-arid regions with erratic rainfall,

INTERNATIONAL JOURNAL OF ENVIRONMENTAL SCIENCES Volume 1, No 4, 2010
© Copyright 2010 All rights reserved Integrated Publishing services
Research article ISSN 0976 – 4402
544
these land use changes and vulnerability may result in an irreversible deterioration of the natural environment due to processes of land degradation. The future capability of ecosystems is mainly dependent on natural, environmental and human impacts, to provide good services and these impacts are determined by the following basic factors A) Natural factors:
1. Climatic factors: drought index, rain fall, wind, temperature, 2. Topographic factors: slope, elevation, 3. Physical factors: geology, geomorphology, soil, vegetation, land use/cover, hydrology,
B) Environmental factors: hazards, water-soil erosion, atmospheric composition, biogeography and biodiversity
C) Human factors: road density, population density, socio-economic characteristics, Research shows the impact assessments of vulnerability of the human–environment system under such environmental changes and gives the answer of important multidisciplinary policy relevant questions such as: which are the main regions or sectors that are vulnerable to environmental change? How do the vulnerabilities of two regions compare? Which scenario is the least, or most, harmful for a given region or sector? The model uses a new approach to ecosystem assessment by integrating the potential impacts in a vulnerability assessment, which can help answer multidisciplinary questions, such as those listed above. Research presents the vulnerability assessment of the geology, geomorphology, soil, vegetation and land use scenarios. Fifteen land use types, discussed in detail, can be related to a range of ecosystem services. For instance, forest area is associated with wood production and designated land with outdoor recreation but forest area encroached by the oil and natural gas exploration and also for agriculture purpose by the local peoples then it´s again encroached by the salt industry and now since last ten years it´s slowly replaced by the shrimp farms due to market demand. So directly applying the vulnerability methodology to the land use change scenarios helps in understanding land use change impacts across the Apodi estuarine, Northeast Brazil. Scatter plots summarizing impacts per principal unit zone, help in interpreting how the impacts of the scenarios differ between ecosystem services and the environments. We used three terms (exposure, sensitivity and adaptive capacity) inside the vulnerability. While there is considerable heterogeneity in both the potential impacts of environmental changes, and the adaptive capacity to cope with these impacts, this assessment shows that study area in particular will be vulnerable to hydro geophysical parameters, ecosystem and land use change. Projected economic growth increases adaptive capacity, but is also associated with the most negative potential impacts. The potential impacts of more environmentally oriented developments are smaller, indicating an important role for both policy and society in determining eventual residual impacts.
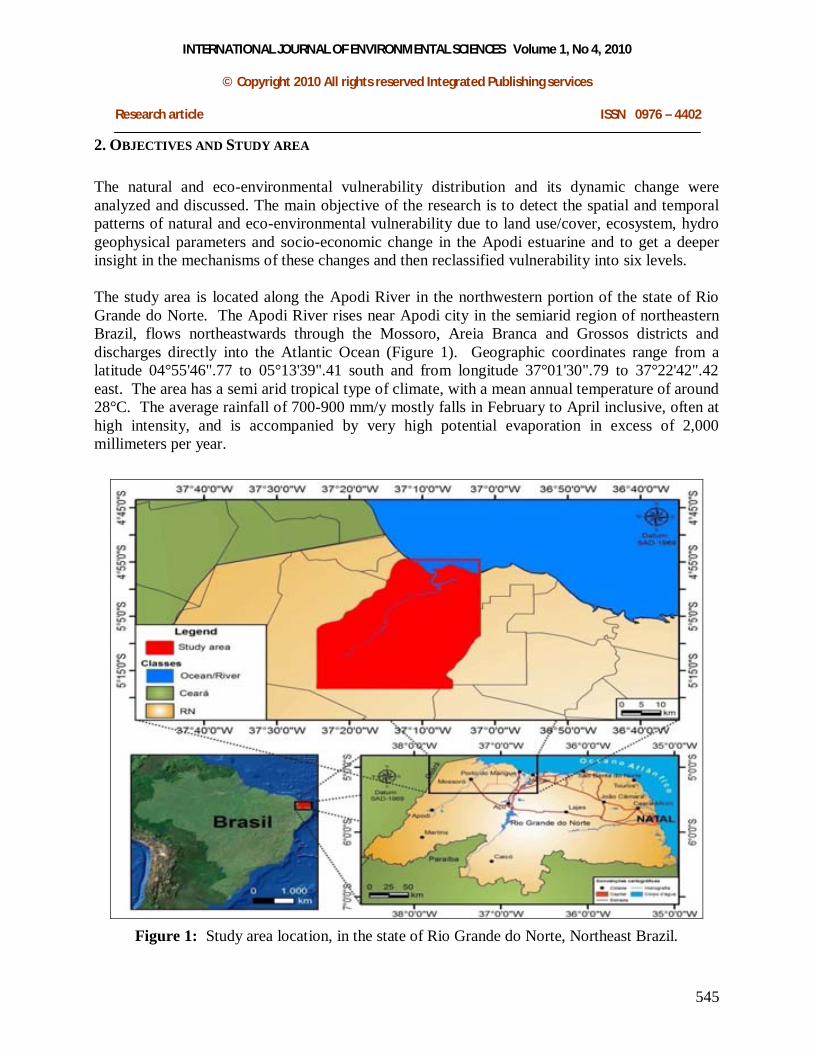
INTERNATIONAL JOURNAL OF ENVIRONMENTAL SCIENCES Volume 1, No 4, 2010
© Copyright 2010 All rights reserved Integrated Publishing services
Research article ISSN 0976 – 4402
545
2. OBJECTIVES AND STUDY AREA The natural and eco-environmental vulnerability distribution and its dynamic change were analyzed and discussed. The main objective of the research is to detect the spatial and temporal patterns of natural and eco-environmental vulnerability due to land use/cover, ecosystem, hydro geophysical parameters and socio-economic change in the Apodi estuarine and to get a deeper insight in the mechanisms of these changes and then reclassified vulnerability into six levels. The study area is located along the Apodi River in the northwestern portion of the state of Rio Grande do Norte. The Apodi River rises near Apodi city in the semiarid region of northeastern Brazil, flows northeastwards through the Mossoro, Areia Branca and Grossos districts and discharges directly into the Atlantic Ocean (Figure 1). Geographic coordinates range from a latitude 04°55'46".77 to 05°13'39".41 south and from longitude 37°01'30".79 to 37°22'42".42 east. The area has a semi arid tropical type of climate, with a mean annual temperature of around 28°C. The average rainfall of 700-900 mm/y mostly falls in February to April inclusive, often at high intensity, and is accompanied by very high potential evaporation in excess of 2,000 millimeters per year.
Figure 1: Study area location, in the state of Rio Grande do Norte, Northeast Brazil.
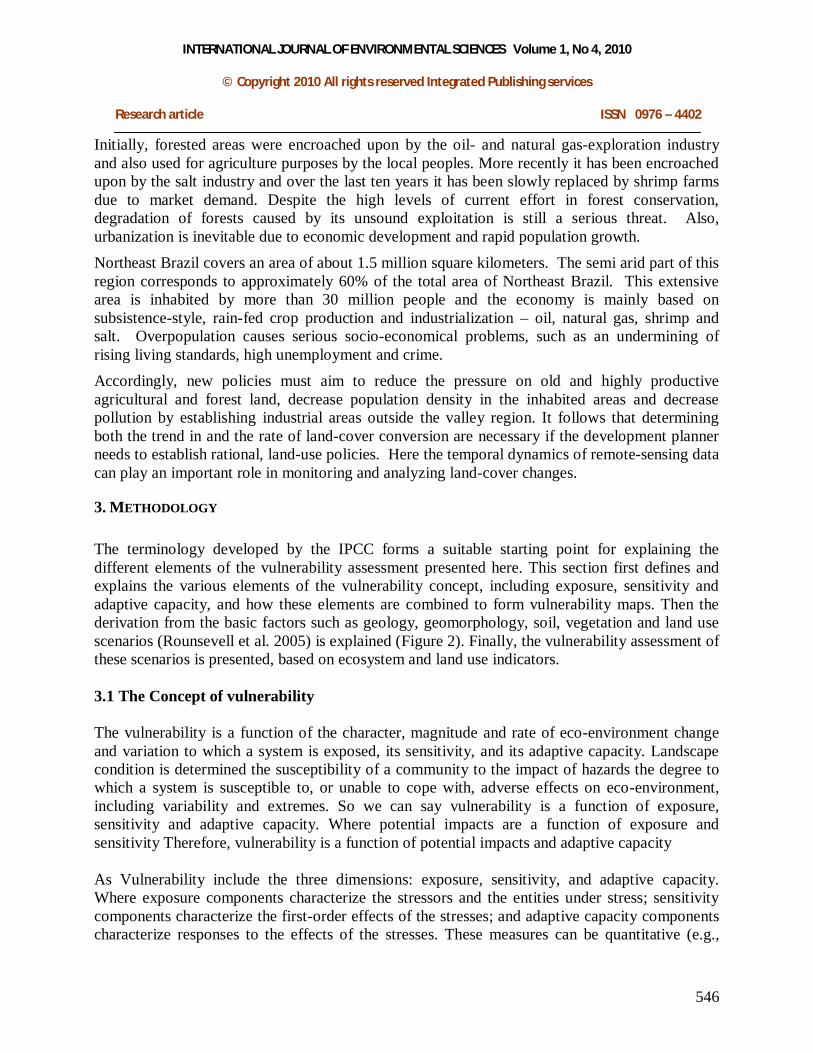
INTERNATIONAL JOURNAL OF ENVIRONMENTAL SCIENCES Volume 1, No 4, 2010
© Copyright 2010 All rights reserved Integrated Publishing services
Research article ISSN 0976 – 4402
546
Initially, forested areas were encroached upon by the oil- and natural gas-exploration industry and also used for agriculture purposes by the local peoples. More recently it has been encroached upon by the salt industry and over the last ten years it has been slowly replaced by shrimp farms due to market demand. Despite the high levels of current effort in forest conservation, degradation of forests caused by its unsound exploitation is still a serious threat. Also, urbanization is inevitable due to economic development and rapid population growth. Northeast Brazil covers an area of about 1.5 million square kilometers. The semi arid part of this region corresponds to approximately 60% of the total area of Northeast Brazil. This extensive area is inhabited by more than 30 million people and the economy is mainly based on subsistence-style, rain-fed crop production and industrialization – oil, natural gas, shrimp and salt. Overpopulation causes serious socio-economical problems, such as an undermining of rising living standards, high unemployment and crime. Accordingly, new policies must aim to reduce the pressure on old and highly productive agricultural and forest land, decrease population density in the inhabited areas and decrease pollution by establishing industrial areas outside the valley region. It follows that determining both the trend in and the rate of land-cover conversion are necessary if the development planner needs to establish rational, land-use policies. Here the temporal dynamics of remote-sensing data can play an important role in monitoring and analyzing land-cover changes.
3. METHODOLOGY The terminology developed by the IPCC forms a suitable starting point for explaining the different elements of the vulnerability assessment presented here. This section first defines and explains the various elements of the vulnerability concept, including exposure, sensitivity and adaptive capacity, and how these elements are combined to form vulnerability maps. Then the derivation from the basic factors such as geology, geomorphology, soil, vegetation and land use scenarios (Rounsevell et al. 2005) is explained (Figure 2). Finally, the vulnerability assessment of these scenarios is presented, based on ecosystem and land use indicators. 3.1 The Concept of vulnerability
The vulnerability is a function of the character, magnitude and rate of eco-environment change and variation to which a system is exposed, its sensitivity, and its adaptive capacity. Landscape condition is determined the susceptibility of a community to the impact of hazards the degree to which a system is susceptible to, or unable to cope with, adverse effects on eco-environment, including variability and extremes. So we can say vulnerability is a function of exposure, sensitivity and adaptive capacity. Where potential impacts are a function of exposure and sensitivity Therefore, vulnerability is a function of potential impacts and adaptive capacity As Vulnerability include the three dimensions: exposure, sensitivity, and adaptive capacity. Where exposure components characterize the stressors and the entities under stress; sensitivity components characterize the first-order effects of the stresses; and adaptive capacity components characterize responses to the effects of the stresses. These measures can be quantitative (e.g.,
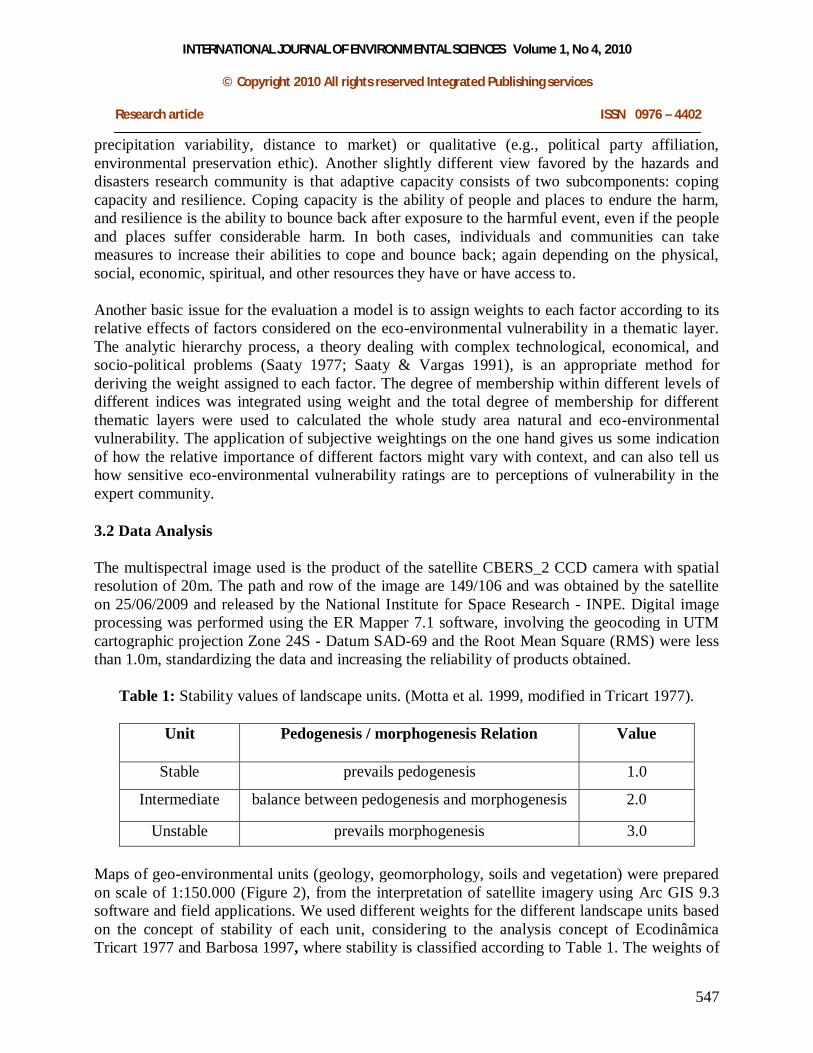
INTERNATIONAL JOURNAL OF ENVIRONMENTAL SCIENCES Volume 1, No 4, 2010
© Copyright 2010 All rights reserved Integrated Publishing services
Research article ISSN 0976 – 4402
547
precipitation variability, distance to market) or qualitative (e.g., political party affiliation, environmental preservation ethic). Another slightly different view favored by the hazards and disasters research community is that adaptive capacity consists of two subcomponents: coping capacity and resilience. Coping capacity is the ability of people and places to endure the harm, and resilience is the ability to bounce back after exposure to the harmful event, even if the people and places suffer considerable harm. In both cases, individuals and communities can take measures to increase their abilities to cope and bounce back; again depending on the physical, social, economic, spiritual, and other resources they have or have access to. Another basic issue for the evaluation a model is to assign weights to each factor according to its relative effects of factors considered on the eco-environmental vulnerability in a thematic layer. The analytic hierarchy process, a theory dealing with complex technological, economical, and socio-political problems (Saaty 1977; Saaty & Vargas 1991), is an appropriate method for deriving the weight assigned to each factor. The degree of membership within different levels of different indices was integrated using weight and the total degree of membership for different thematic layers were used to calculated the whole study area natural and eco-environmental vulnerability. The application of subjective weightings on the one hand gives us some indication of how the relative importance of different factors might vary with context, and can also tell us how sensitive eco-environmental vulnerability ratings are to perceptions of vulnerability in the expert community.
3.2 Data Analysis
The multispectral image used is the product of the satellite CBERS_2 CCD camera with spatial resolution of 20m. The path and row of the image are 149/106 and was obtained by the satellite on 25/06/2009 and released by the National Institute for Space Research - INPE. Digital image processing was performed using the ER Mapper 7.1 software, involving the geocoding in UTM cartographic projection Zone 24S - Datum SAD-69 and the Root Mean Square (RMS) were less than 1.0m, standardizing the data and increasing the reliability of products obtained.
Table 1: Stability values of landscape units. (Motta et al. 1999, modified in Tricart 1977).
Unit Pedogenesis / morphogenesis Relation Value
Stable prevails pedogenesis 1.0
Intermediate balance between pedogenesis and morphogenesis 2.0
Unstable prevails morphogenesis 3.0
Maps of geo-environmental units (geology, geomorphology, soils and vegetation) were prepared on scale of 1:150.000 (Figure 2), from the interpretation of satellite imagery using Arc GIS 9.3 software and field applications. We used different weights for the different landscape units based on the concept of stability of each unit, considering to the analysis concept of Ecodinâmica Tricart 1977 and Barbosa 1997, where stability is classified according to Table 1. The weights of

INTERNATIONAL JOURNAL OF ENVIRONMENTAL SCIENCES Volume 1, No 4, 2010
© Copyright 2010 All rights reserved Integrated Publishing services
Research article ISSN 0976 – 4402
548
a landscape unit indicate the importance of any factor in relation to others (Xavier - Da-Silva et. al. 2001). Spatial analysis techniques were used to integrate the thematic maps (Figure 2). The memberships of each thematic layer were based on the sensitivity or its effectiveness in the study area (Grigio et. al. 2004 & 2005).
Table 2: Weight table to each factor in a thematic layer. Thematic maps/classes Vulnerability grade levels
Geology Jandaíra formation 1.5 Barriers formation 2.0 Mangrove Deposits 3.0 Eluvial deposits 2.5 Alluvial deposits 2.5 Seaside Beach Deposits 3.0
Geomorphology Coast Plains 1.0 Fixed dunes 2.0 Mobile Dunes 3.0 Fluvial-Marine Plain 2.5 Fluvial-Estuarine Plain 3.0
Pedology (Soil) Quartz Sand 2.0 Saline and sodic soils 3.0 Red-Yellow Podzolic soil 1.5
Vegetation Mangrove vegetation 3.0 Carnauba palm tree 3.0 Shrub vegetation of the Caatinga Dense 2.5 Irrigated Fruit Crops 1.5 Dune Vegetation 1.5 Area without vegetation 0.0
Land cover Pipeline 1.5 wetland 1.0 Settlement 2.0 City 3.0 Temporary and permanent culture 1.8 Production of marine shrimp 2.8 Temporary pond 1.0 Ocean/River 0.0 Oil and gas exploration well 2.9 Salina 2.7 Thermoelectric 2.5

INTERNATIONAL JOURNAL OF ENVIRONMENTAL SCIENCES Volume 1, No 4, 2010
© Copyright 2010 All rights reserved Integrated Publishing services
Research article ISSN 0976 – 4402
549
For the allocation of the values of each theme class was required establish some criteria for the definition of each class, which were used by Barbosa and Crepani et al. (1996). The degree of vulnerability to each prescribed class was distributed in a range from 0.0 to 3.0 (Table 1). The value 1.0 prevails pedogenesis, in 2.0 a balance between pedogenesis and morphogenesis, and 3.0 prevails morphogenesis. This criterion was used for maps of geomorphology, geology and simplified soil/ soil system. For case of vegetation/ biodiversity map, the criterion was established: 3.0 environments with very low species diversity/incipient formations, usually pioneers, 2.0 for environments with low diversity of species, corresponding to formations in the intermediate stage, and finally, to 1.0 in stage environments advanced-climax, that is, with high species diversity. For the water surface tide channel was given a degree of vulnerability of 1.0 for geomorphology, geology and simplified soil/soil system maps (Table 2). For vegetation/biodiversity maps and land use and land cover, was awarded the 3.0 degree of vulnerability (Table 2). To develop a natural vulnerability map (Figure 3), we correlated the natural aspects of geology, geomorphology, soils and vegetation (Figure 2). Than natural vulnerability map has been integrated with the land use and land cover map to generate the environmental vulnerability map (Figure 6), considering the anthropogenic influence in the area. The degree of vulnerability varies from 0 to 3 and is ranked Unrated, very low, low, medium, high and very high. The weights of compensation indicate the importance of any factor in relation to others, as can be seen in the formula below for natural vulnerability map.
[(Theme 1) + (Theme 2) + (Theme 3) + (Theme 4)] /4
Where: theme 1 geomorphology map, theme 2 simplified geological map, theme 3 soil/soil system map, and theme 4 vegetation/biodiversity map. The result mean was distributed in six natural vulnerability classes: Unrated/potential (less than or equal to 0.99); Very low (from 1.0 to 1.39); Low (1.40 to 1.75); Medium (from 1.76 to 1.99); High (from 2.0 to 2.60), and Very high (greater than or equal to 2.61). To obtain the environmental vulnerability map was carried out crossing between the map of natural vulnerability and the statement of use and occupation of soil in the year 2009 (Figure 5). The criteria established for the land use map were focused on main degree and type of human disturbance found in the study area. For beam we adopted the same scale applied previously, Ex, from 1 to 3, with range of 0.1 (Table 1). We gave weights of each factor according to their sensitivity (Barbosa & Crepani et al. 1996) (Table 2) and then membership according to following formula to generate environmental vulnerability map.
0.2 X [Theme 1] + 0.1 X [Theme 2] + 0.1 X [Theme 3] + 0.1 X [Theme 4] + 0.5 X [Theme 5]
Where: theme 1 geomorphology map, theme 2 simplified geological map, theme 3 soil/soil system map, theme 4 vegetation/biodiversity map, and theme 5 land use /land cover map. In the case of the environmental vulnerability map, after the crossing, calculated the average weighted of the vulnerability of each class, and divided into six environmental vulnerability classes:

INTERNATIONAL JOURNAL OF ENVIRONMENTAL SCIENCES Volume 1, No 4, 2010
© Copyright 2010 All rights reserved Integrated Publishing services
Research article ISSN 0976 – 4402
550
Unrated (less than or equal to 0.99); Very low (from 1.0 to 1.39); Low (1.4 to 1.50); Medium (from 1.51 to 1.99); High (from 2.0 to 2.59), and Very high (greater than or equal to 2.60).
(A) (B)
(C) (D)
Figure 2: (A) Simplified Geomorphology map; (B) Geology map; (C) Simplified Soil map; (D)
Vegetation; (E) Land use, based on CBERS 2B/ CCD + HRC image.

INTERNATIONAL JOURNAL OF ENVIRONMENTAL SCIENCES Volume 1, No 4, 2010
© Copyright 2010 All rights reserved Integrated Publishing services
Research article ISSN 0976 – 4402
551
3.3 Land use scenarios in vulnerability assessment Natural and environmental vulnerability is most easily associated with types of land use and ecosystem like food production can be directly related to agricultural land use, shrimp farm, salt and fruit industry in the study area, fiber or timber production to forestry and cropland, and energy production to the area used for bio-energy crops and oil and natural gas exploration, costal and industrial area. In the land use change scenarios, reductions in agricultural land are an effect of intensification of production in optimal regions. Hence, total food or energy production or exploration availability will not decrease. Nevertheless, decreasing regional production does have consequences for consumers, because regional products are associated with variation as well as traditional foods or other productions. Furthermore, regionally produced food or energy is frequently associated with high quality and safety standards. A more limited choice of productions, mass-produced in optimal locations will be seen as negative impacts by parts of society. The actual ecosystem service provision, in crop yield, timber or energy increment, greatly depends on biophysical growing conditions. However, as discussed in previous Section, in order to compare ecosystem services across the study area, differences caused by inherently different environments were removed using the stratification. Therefore, for the vulnerability concept used here, the land use types form appropriate indicators for ecosystem service provision.
4. RESULTS AND DISCUSSION Natural and eco-environmental vulnerability maps is an effective relationship between hydro geophysical parameters, ecosystem, land use and vulnerability and making comparisons between ecosystem, service sectors, scenarios and regions to tackle questions such as: Which regions are most vulnerable to change? How do the vulnerabilities of two regions compare? Which sectors are the most vulnerable in a certain region? Which scenario is the least harmful for a sector? How, where, why and in which direction vulnerability goes?
4.1 Natural vulnerability Fig. 3 shows the natural vulnerability in the study area. The total area of the study is 1372.79 Km². The values found in the natural vulnerability map reflect the susceptibility of the environment because the stability conditions of morpho-pedogenesis of the area. The area of natural vulnerability corresponds to very high and high in river plains, tropical fruit agriculture part, oil and natural gas exploration fields, mangrove, dune fields, beach and urban area. An area of 597.65 km², accounting for 43.49% of the total area of the Apodi valley region, belongs to the high vulnerable zone, and 4.94% to the very high vulnerable zone in the Valley. This means that near to half (665.63 km², 48.43%) of the total area of the Apodi valley region was very vulnerable and show a high sensitive zone, so police makers must be calculate it for future land use scenario/polices. The medium and the low vulnerable zone accounted for 44.98% (618.03 km²) and 1.0% (13.75 km²) and is present in caating forest, agriculture land, salt and shrimp farm respectively, whereas the very low and unrated vulnerable zone has only a small proportion of 5.60% (77.06 km²) (Fig. 4). The profile of the Apodi Valley region natural vulnerability showed an asymmetry normal distribution but the center of the profile lean to the ‘high’ level (Fig. 3).
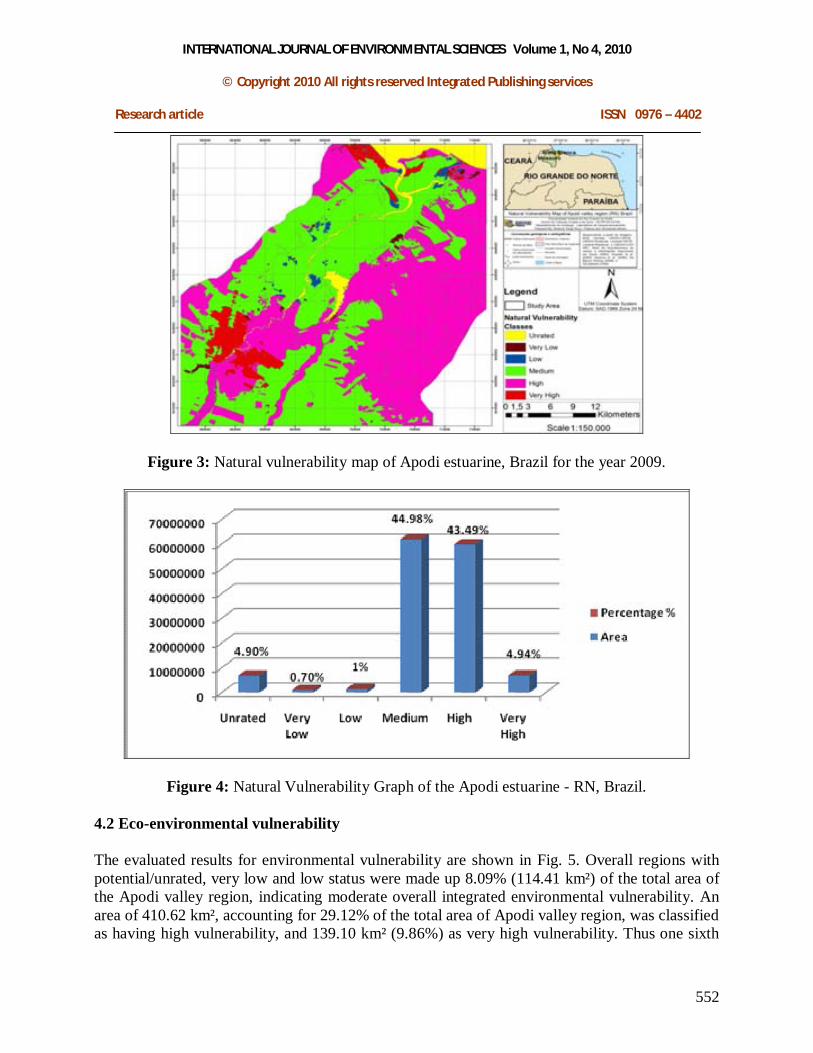
INTERNATIONAL JOURNAL OF ENVIRONMENTAL SCIENCES Volume 1, No 4, 2010
© Copyright 2010 All rights reserved Integrated Publishing services
Research article ISSN 0976 – 4402
552
Figure 3: Natural vulnerability map of Apodi estuarine, Brazil for the year 2009.
Figure 4: Natural Vulnerability Graph of the Apodi estuarine - RN, Brazil. 4.2 Eco-environmental vulnerability The evaluated results for environmental vulnerability are shown in Fig. 5. Overall regions with potential/unrated, very low and low status were made up 8.09% (114.41 km²) of the total area of the Apodi valley region, indicating moderate overall integrated environmental vulnerability. An area of 410.62 km², accounting for 29.12% of the total area of Apodi valley region, was classified as having high vulnerability, and 139.10 km² (9.86%) as very high vulnerability. Thus one sixth

INTERNATIONAL JOURNAL OF ENVIRONMENTAL SCIENCES Volume 1, No 4, 2010
© Copyright 2010 All rights reserved Integrated Publishing services
Research article ISSN 0976 – 4402
553
of the total area of the Apodi valley region was very vulnerable. The medium vulnerable area made up 52.90% (745.96 km²), and low vulnerability area was 2.23% (31.58 km²), whilst the area of very low vulnerability and potential vulnerability accounted for 1.07% (15.20 km²) and 4.79% (67.61 km²), respectively. In general, the environmental vulnerability of the Apodi valley region exhibited an asymmetrical normal distribution centered on a ‘high’ vulnerability level.
Figure 5: Environmental Vulnerability Graph of the Apodi estuarine - RN, Brazil.
Figure 6: Eco-environmental Vulnerability map of Apodi estuarine 2009, RN- Brazil.

INTERNATIONAL JOURNAL OF ENVIRONMENTAL SCIENCES Volume 1, No 4, 2010
© Copyright 2010 All rights reserved Integrated Publishing services
Research article ISSN 0976 – 4402
554
From the map of integrated environmental vulnerability (Fig. 6), the areas with potential, very low and low environmental vulnerability were located in three regions: caating forest, ocean/river and fixed vegetation area. In the mid part of the Apodi valley region low levels of environmental vulnerability were due to the higher vegetation condition and lower intensity of human activities. However, blocks with high or very high environmental vulnerability were visible within these areas, due to urbanization, industrial activities (shrimp farms, salt industry, oil and natural gas exploration), and steep slopes resulting in less forest protection, serious soil erosion and high rate exploration of natural resources. It was notable that the environmental vulnerability in the areas immediately surrounding Apodi River or costal area was most frequently potential to low, with only a few areas with high or very high vulnerability. Whilst better vegetation conditions and lower levels of anthropogenic interference were again factors underlying this pattern, the relatively low hypsography and the microclimate around the river were also important in providing better water heat conditions. Three regions with very high vulnerability were located in Apodi estuarine are urban area/city, centre part of valley and costal area special beach area. These areas were urban, industrial and most socio-economic activity sites with high densities of buildings and limited vegetation cover, bad geological conditions or high exploration of natural resources, which increased the environmental vulnerability. Areas with higher vulnerability were generally distributed in the north to centre and east part. Most areas with medium vulnerability, where eco-environment and human activity intensity were moderate, were located in the Basin of Apodi River and the southern part of the Valley. These are marine salt pond and agricultural areas with the main land use type being paddy fields and dry land, along with some grassland and woodland. The environment of these areas was affected mostly by human activity.
4.3 Major problems of the Apodi estuarine eco-environment Vulnerability maps demonstrate the great fragility of natural area, supported by the intense action of coastal processes and economic activities in the region. The analysis of geological and geomorphological units mapped to indicate that the region is strongly influenced by the disorderly occupation of tidal flats, river-estuarine, mangrove areas by the salt ponds and shrimp. The mangrove ecosystem in this region is in much lower proportions compared with those observed in other adjacent estuarine systems; this can be explained by the degradation of mangrove due to the growth of human activities in the vicinity of the estuarine system. The activities of oil and natural gas exploration in the region create instability of natural resources. In the Apodi estuarine region, most of the 5 million residents in the upper basin are farmers/ workers, and agricultural or industrial activities are intensive and concentrated along the river and streams, resulting in non-point pollution of the water. In addition, with the excessive consumption of natural resources and the gradual increase in population, some prominent eco-environmental problems need to be solved urgently. Among them, deforestation and forest degradation are the major environmental and ecological issues in the Apodi estuarine. A substantial amount of forest has been lost due to the conversion

INTERNATIONAL JOURNAL OF ENVIRONMENTAL SCIENCES Volume 1, No 4, 2010
© Copyright 2010 All rights reserved Integrated Publishing services
Research article ISSN 0976 – 4402
555
of forest to farmlands (salt, shrimp or agriculture), high grading, industrializations and other logging practices. In Apodi estuarine, forest area were first time encroached by oil and natural gas exploration industry and also for agriculture purpose by the local peoples. It’s again encroached by the salt industry and now since last ten years it’s slowly replaced by the shrimp farm due to market demand. Despite the high levels of current effort in forest conservation, degradation of forests caused by unsound exploitation is still a serious threat. In addition, soil erosion has also seriously affected the sustainable development of the eco-environment in Apodi estuarine. Currently, this area is increasing at a rate of 1000 km²/year. Deforestation is the chief cause of soil erosion in the Apodi estuarine, and the adverse geology and climatic conditions intensify erosion. Moreover, the Apodi estuarine is one of the main unmanaged regions of Brazil with economic decline and poor environmental awareness. Over the years, with population increase, demand for food, fuel and timber has exceeded local production levels, leading to an imbalance between humans and their environment. Inappropriate land use has generated a huge area of sloped farmland, vegetation destruction, and soil loss, leading to gross deterioration of the environment. 4.3 Suggestion for local eco-environmental management An important goal of environmental assessment is to provide assistance to policy makers and practitioners in environmental protection. To protect and maintain the ecological environment in those areas, a population-control policy might be needed, and some regulations such as “convert slope farmland into forest or pasture” and laws (e.g. ‘Environmental Protection Act’, ‘Land Act’, ‘Forestry Act’, ‘Grassland Act’, etc.) could be established and implemented. Areas of higher ecological vulnerability should be protected over all others, for moderately vulnerable areas, integrated small watershed management should purposefully focus on sustainable utilization of natural resources, water and soil and sustainable protection of the eco-environment. In addition, it should develop ecological agriculture and industry combining traditional and modern practices to realize the coordinated development of both the environment and economy. In the areas immediately surrounding the Apodi River, the importance of environmental protection should also be emphasized because of its significant geographical position. In addition to increasing vegetation coverage, enhancing the capacity for soil and water preservation and strengthening controls on non-point pollution, the establishment of special ecologically functional reserves, such as the river national wetland nature reserve, is a matter of priority. Human migration due to the water and industry project itself must also be noted. Ecological protection measures must be adopted to prevent soil erosion, prevent and control pollution, and to protect water, air and soil quality during emigrant movement and settlement within the Apodi estuarine. Apodi estuarine has been highly threatened by land desertification. In areas, where some water is available for irrigation, trees and shrubs as fences or small plots, or grass belts should be planted to reduce the rate of desertification and regain lost land. This vegetation decreases the wind
INTERNATIONAL JOURNAL OF ENVIRONMENTAL SCIENCES Volume 1, No 4, 2010
© Copyright 2010 All rights reserved Integrated Publishing services
Research article ISSN 0976 – 4402
556
velocity near the base of the dune and prevents much of the sand from moving. It can also protect farmland, conserve water and soils, and provide fuel wood. In some regions, it is difficult to restore the degraded land due to the arid climate and low rain. In these areas, it is crucial to reduce and limit the number of livestock to prevent further degradation from overgrazing. However, strengthening environmental protection alone without alleviating socio-economic and environmental ignorance can only be a temporary measure. Therefore, it is necessary to address the problems of socio-economic and raise public environmental awareness as well as scientific understanding. Generally speaking, proper protection of the ecological environment of the Apodi estuarine would be significant not only for the protection of water resources, the ecological system and biodiversity in northeast Brazil, but also for social progress, economic development and improvement in standards of living, national prosperity of the water source areas and the region at large. 5. Conclusions
The application of these techniques in the study area shows the influence of human activities on potential environmental risks in coastal and estuarine area, supporting the decision making regarding the deployment of environmental protection and benefiting investors with improved productivity and safety in the study area. Vulnerability assessment provides a means of adding value due to ecosystem and land use change scenarios in terms of in between producer, taxpayers, service provider and users. This is the type of information for example that can be of interest to policy makers and society at large, and can help influence future development pathways. By extension, more detailed land use scenarios provide the opportunity to explore more detailed indicators of vulnerability provided the scenarios are constructed to a consistent framework. Scenarios are useful for exploring uncertainties in vulnerability assessment on a regional basis, e.g. some regions show equal vulnerability to all scenarios, whilst other regions show different responses. This is an indicator for where we can be more, or less, uncertain about the future. Furthermore, it helps in indicating how society and policy can have an important role to play in future development pathways. 6. References
1. Anthony, G. Y. and Li, X. Sustainable land development model for rapid growth areas using GIS. International Journal of Geographical Information Science. 12(2): pp 169-189, 1998.
2. Araripe, P.T.; Feijó, F.J. Bacia Potiguar. Boletim de Geociências da Petrobras, Rio de Janeiro, v.8, n.1, pp. 127-141, 1994.
3. Barbosa, C. C. F. Álgebra de mapas e suas aplicações em Sensoriamento Remoto e Geoprocessamento. 1997. 111 f. Dissertação (Mestrado em Sensoriamento Remoto) – Instituto Nacional de Pesquisas Espaciais-INPE, São José dos Campos, 1997.

INTERNATIONAL JOURNAL OF ENVIRONMENTAL SCIENCES Volume 1, No 4, 2010
© Copyright 2010 All rights reserved Integrated Publishing services
Research article ISSN 0976 – 4402
557
4. Chuvieco, E. Measuring changes in landscape pattern from satellite images: Short-term effects on spatial diversity. International Journal of Remote Sensing. 20(12): pp 331-2 346, 1999.
5. Crepani, E.; Medeiros, J.S.; Azevedo, L.G.; Duarte, V.; Hernandez, P. & Florenzano, T. Curso de Sensoriamento Remoto Aplicado ao Zoneamento Ecológico-Econômico. São José dos Campos: INPE, 1996.
6. DNPM, 1998,: Mapa Geológico do Estado do Rio Grande do Norte (DNPM - Sede/DNPM – 4º Distrito/ UFRN/PETROBRÁS/CPRM). 1998.
7. Ecodinâmica Tricart Revista Brasileira de Geomorfologia - Ano 8, nº 2 (2007), 1977. 8. Grigio, A. M.; Castro, A. F. de; Souto, M. V. S.; Amaro, V. E.; Vital, H. and Diodato, M.
A., Use of remote sensing and geographical information system in the determination of the natural and environmental vulnerability of the Guamaré municipal district – Rio Grande do Norte – northeast of Brazil. Journal of Coastal Research, SI 39, pg – pg. Itajaí, SC – Brazil, 2004. ISSN 0749-0208.
9. Honnay, O., Piessens, K. and Landuyt, W. V. Satellite based land use and landscape complexity indices as predictors for regional plant species diversity. Landscape and Urban Planning. 63: pp 241- 250, 2003.
10. IDEMA, Informativo Municipal: Areia Branca. Secretaria de Planejamento e Finanças, Instituto de Desenvolvimento Econômico e Meio Ambiente-IDEMA,p.1-16, 1999.
11. IPCC, Climate Change 2001: The Scientific Basis. Contribution of Working Group I to the third assessment report of the Intergovernmental PanelonClimate Change (IPCC) Cambridge University Press, Cambridge, 2000c.
12. Liu, J. Y. and Buheaosier. A study on spatial-temporal feature of modern land use change in China: Using remote sensing techniques. Quaternary Sciences (in Chinese). 20(3): pp 229-239, 2000.
13. Rounsevell,M.D.A., Ewert, F., Reginster, I., Leemans, R., Carter, T.R., Future scenarios of European agricultural land use. II. Projecting changes in cropland and grassland. Agric. Ecosyst. Environ. 107, pp 117–135, 2005.
14. Saaty, T.L., Vargas, L.G., 1991,: Prediction, Projection and Forecasting. Kluwer Academic Publishers, Dordrecht.
15. Xavier-Da-Silva, J. et al. Índices de geodiversidade: aplicações de SGI em estudos de biodiversidade. In: Garay, I.; Dias, B. F. S. (Orgs.). Conservação da biodiversidade em ecossistemas tropicais: avanços conceituais e revisão novas metodologias de avaliação e monitoramento. Rio de Janeiro, Vozes, pp 299-316, 2001.

97
4.4 Conclusão
Os parâmetro hídricos, geofísicos e as variações no uso do solo foram e serão de grande
influência no ecossistema do estuário Apodi-Mossoró. A vulnerabilidade às variações no uso do
solo deve ser analisada para cada diferente porção da área de estudo, ao longo do estuário até a
foz. Embora a projeção de mudanças no uso do solo seja negativo para um setor, outros setores
podem vir a se beneficiar. Portanto, há diferenças no impacto potencial para as diferentes porções
da área de estudo, com as distinções mais notáveis causadas por diferenças no uso do solo
orientado ao desenvolvimento econômico. Essas diferenças são mais profundas em áreas onde a
exploração socioeconômica, tais como a ocupação do solo por áreas agrícola, áreas industriais e
pela urbanização. Embora a capacidade de lidar com os futuros aumentos dos impactos negativos
com o crescimento do desenvolvimento econômico da região Nordeste do Brasil. O estuário
Apodi-Mossoró pode ser planejado para ter uma capacidade adaptativa consideravelmente maior
do que outras regiões, mas no momento apresenta profundas dificuldades de adaptação às
eventuais mudanças nas condições ambientais. A partir daí, pode-se concluir que as áreas
vegetadas e os setores com ocupação industrial serão as mais vulneráveis às alterações, como
mostram as projeções do uso do solo. A análise integrada de informações demonstra que os
padrões de índices podem auxiliar na análise da vulnerabilidade dos ecossistemas, mas ainda
necessitarão de que outras variáveis ambientais sejam consideradas.
No entanto, o que mais preocupa são as diferenças entre os potenciais impactos e a
capacidade de adaptação da região, como mostram os índices de vulnerabilidade do estuário
Apodi-Mossoró fortemente influenciada pelas vias de desenvolvimento que se tem dado até o
momento. A sociedade e os agentes políticos, portanto, desempenham um papel importante na
condução de nova gestão da ocupação do solo na área, diante de eventuais impactos ambinetais
futuros, tendo em vista os impactos residuais relatados.

98
Capítulo V: Avaliação da Vulnerabilidade Costeira e Análise de Risco
5.1 Introdução
As pesquisas na zona costeira do RN revelam que a zona costeira de baixa altitude tem
sido gravemente e cada vez mais afetada por alterações climáticas, inundações, processos de
erosão, ao menos nos últimos 50 anos, que afetam a vida e as atividades socioeconômicas
implantadas na região (pesca, turismo, carcinicultura, salinas e exploração de óleo). Diversos
autores relacionam esta situação com a mudanças climática global e as evidências de aumento
relativo do nível do mar. Em resposta a estes impactos, algumas medidas de defesa costeira e
estratégias de adaptação foram aplicadas na região, mas com sucesso limitado.
Portanto, este capítulo apresenta os resultados das atividades de pesquisa, organizadas em
dois artigos científicos, que trata dessas questões da vulnerabilidade costeira e do risco ambiental
às mudanças globais e regiqnais, com foco no subsídio à programas de Gestão Integrada da Zona
Costeira do RN, por meio da identificação, avaliaçao e classificação de vulnerabilidade da zona
costeira aos riscos de inundação e erosão, decorrentes de mudançãs climáticas globais. Isto foi
conseguido por meio do Índice de Vulnerabilidade Costeira (IVC). O IVC conta com seis
diferentes variáveis descrevendo as condições naturais e socioeconômicas que determinam a
situação de risco no estuário Apodi-Mossoró. No ArcGIS essas variáveis foram classificadas,
ponderadas e combinadas para produzir os índices para a avaliação de risco. O IVC foi
estabelecido em três classes de vulnerabilidade baixa, média e alta, quanto às zonas de risco
devido à subida do nível do mar. Os principais resultados deste estudo foram apresentados em
mapas. Pretende-se que o IVC forneça uma ferramenta confiável e de fácil aplicação para:
(a) A medição e descrição da suscetibilidade costeira a perigos potenciais e existentes no
estuário Apodi-Mossoró;
(b) A distribuição espacial das áreas de risco que, se seguidas as estratégias do IPCC, podem
ser planejadas para adaptação aos impactos ambientais com medidas mitigatórias.

99
As pressões climáticas e antrópicas desordenadas causam desequilíbrio parcial ou total do
sistema estuarino e costeiro, sendo os primeiros efeitos observados nas alterações das condições
do solo, dos recursos hídricos, nos ecossistemas de alta sensibilidade e nas condições de uso do
solo. Este desequilíbrio resulta numa série de impactos, já perceptíveis na área de estudo
(inundações, poluição, degradação do solo, mudanças de uso do solo e migrações da população,
entre outros) que alteram os processos naturais, a proteção dos recursos naturais e as atividades
socioeconômicas. As avaliações de vulnerabilidade e impactos também fornecerm um ponto de
partida para a determinação de medidas corretivas eficazes para diminuir os impactos e para
restabelecer as condições originais, logo que possível, apoiando as políticas de planejamento
ambiental. Isto significa que qualquer redução total ou parcial das causas do desequilíbrio ou
adaptação às novas condições são necessárias respostas de adaptação.
A pesquisa analisa criticamente os níveis de confiança para os resultados obtidos e as
possibilidades de atualização das variáveis ou a inclusão novos cenários futuros de acordo com as
mudanças temporais, naturais e/ou socioeconômicas, no estuário do rio Apodi-Mossoró.

100
5.2 Terceiro Artigo
BOORI, Mukesh Singh; AMARO, Venerando Eustáquio; VITAL, Helenice. Coastal
ecological sensitivity and risk assessment: A case study of sea level change in Apodi River
(Atlantic Ocean), Northeast Brazil. International Journal of Environmental and Earth
Sciences, v. 1, n. 3, p. 127–136, 2010. ISSN 2010-4030.

International Journal of Environmental and Earth Sciences 1:3 2010
127
Coastal ecological sensitivity and risk assessment: A case study of sea level change in Apodi River (Atlantic Ocean), Northeast Brazil
Mukesh Singh Boori1, Venerando Eustáquio Amaro2, Helenice Vital3
Abstract— The present study has been carried out with a view to calculate the coastal vulnerability index (CVI) to know the high and low sensitive areas and area of inundation due to future SLR. Both conventional and remotely sensed data were used and analyzed through the modelling technique. Out of the total study area, 21.48% is high risk, 73.60% medium, and 4.92% in the low vulnerable category, due to costal components. Results of the inundation analysis indicate that 216.1 km² and 362.81 km² of the land area will be submerged by flooding at 1m and 10m inundation levels. The most severely affected sectors are expected to be the residential, industrial and recreational areas. As this coast is planned for future coastal developmental activities, measures such as industrializations, building regulation, urban growth planning and agriculture, development of an integrated coastal zone management, strict enforcement of the Coastal Regulation Zone (CRZ) Act, monitoring of impacts and further research in this regard are recommended for the study area.
Keywords— Coastal planning, Land use, Satellite data, Vulnerability.
I. INTRODUCTION nation should have adequate information on its natural resources as well as many interrelated aspects of its
activities for decision making. Coastal landforms and wetlands are a few of such resources which have acquired importance as they influence various developmental activities along the coastal regions. Coastal region is an important resource as they are avenues for agricultural practice, ground water exploitation, coastal townships, recreational zones, silica sand and heavy mineral exploration, etc.
Mukesh Singh Boori is with the Geo-processing Laboratory, Dept. of Geology (Geodynamic & Geophysics division), Center of Exact Sciences and Earth, Federal University of Rio Grande do Norte, Natal –RN, Brazil. (Corresponding author Ph./Fax: 558491046743; 558432153831; e-mail: [email protected]). Venerando Eustáquio Amaro is with the Geo-processing Laboratory, Dept. of Geology (Geodynamic & Geophysics division), Federal University of Rio Grande do Norte, Natal –RN, Brazil. (e-mail: [email protected]).
Helenice Vital is with the Dept. of Geology (Geodynamic & Geophysics division), Federal University of Rio Grande do Norte, Natal –RN, Brazil (e-mail: [email protected]).
The coastal environment is undeniably one of the most affected by the agents of topography and landscape modeling. This is mainly its geographical location. Which is change due to wind, wave, tidal, marine currents, etc., besides these natural factors; there are many human factors, which is responsible for changes in the natural course of coastal dynamics. The set of these factors, natural and man-made, provide mixed results. The most obvious outcome of sea level rise (SLR) due to storms, tsunami or even global sea level change is the permanent inundation of coastal areas and it will have a serious impact upon the natural environment and socio-economic conditions in the coastal zone. Over time, inundation changes the position of the coastline and drowns natural habitat and coastal structures. Inundation can also exacerbate coastal erosion by transporting submerged sediments offshore, and extending the effects of coastal flooding by allowing storm waves to act further. Wave heights also increase when concentrated on head lands or when travelling into bays having wide entrances that become progressively narrower. Geographic features of near shore and coastal land of an area can alter the inundation pattern of tsunami waves. During the tsunami, the maximum vertical height to which water is observed with reference to sea level (spring tide or mean sea level) is referred to as run-up. The maximum horizontal distance that is reached by a tsunami is referred to as inundation. SLR would directly result in a corresponding higher shift to the zone of wave action on the beach. This would be reflected in a shoreline recession which will be larger on milder slopes.
Although there is great diversity in the textural composition of the beaches and, consequently, the lines back - these are generally made by mud, sand gravel and blocks of rock - for the most vulnerable to coastal dynamics are generally the sandy of natural unprotected beaches [1]. Where in These beaches the sediments are more easily reworked and depositional and retrains prorated to other sites, since it does not present great resistance to the erosions processes. The Coast of Apodi River is composed by sandy beaches, sometime which is protection of natural beach rocks.
In countries like Brazil, where the coastline is very long, mapping of these natural resources of coastal region by conventional techniques is a difficult task mainly due to their
A
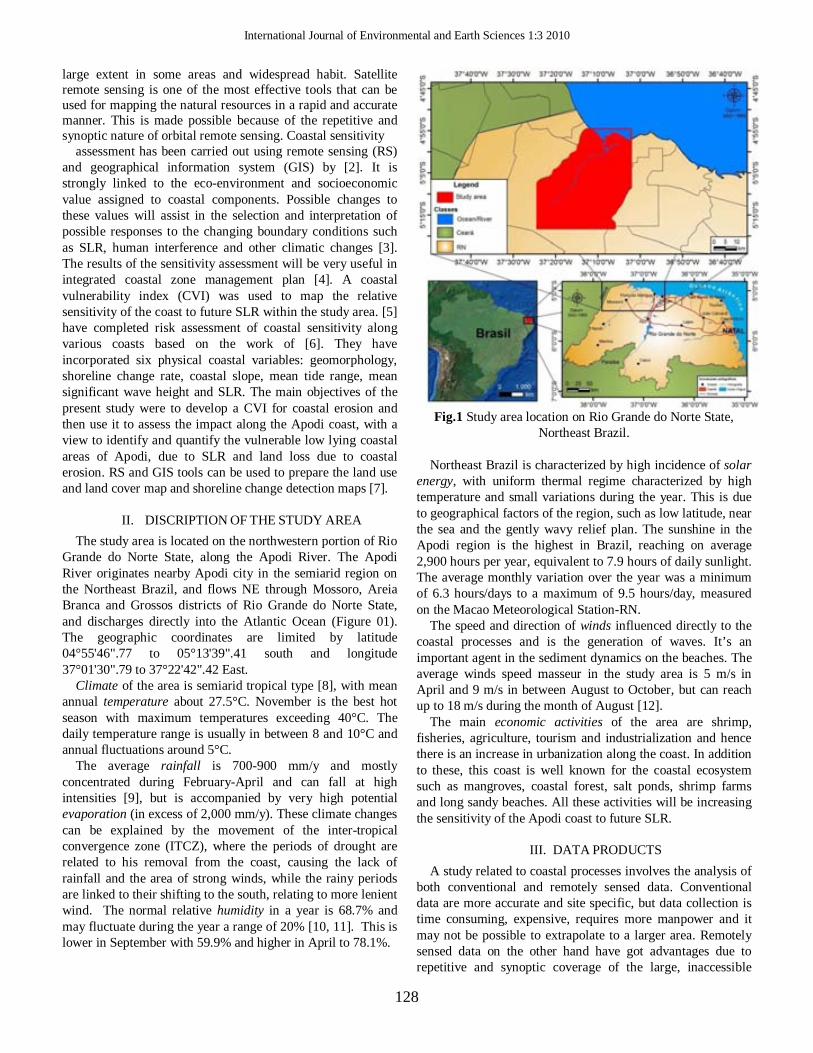
International Journal of Environmental and Earth Sciences 1:3 2010
128
large extent in some areas and widespread habit. Satellite remote sensing is one of the most effective tools that can be used for mapping the natural resources in a rapid and accurate manner. This is made possible because of the repetitive and synoptic nature of orbital remote sensing. Coastal sensitivity
assessment has been carried out using remote sensing (RS) and geographical information system (GIS) by [2]. It is strongly linked to the eco-environment and socioeconomic value assigned to coastal components. Possible changes to these values will assist in the selection and interpretation of possible responses to the changing boundary conditions such as SLR, human interference and other climatic changes [3]. The results of the sensitivity assessment will be very useful in integrated coastal zone management plan [4]. A coastal vulnerability index (CVI) was used to map the relative sensitivity of the coast to future SLR within the study area. [5] have completed risk assessment of coastal sensitivity along various coasts based on the work of [6]. They have incorporated six physical coastal variables: geomorphology, shoreline change rate, coastal slope, mean tide range, mean significant wave height and SLR. The main objectives of the present study were to develop a CVI for coastal erosion and then use it to assess the impact along the Apodi coast, with a view to identify and quantify the vulnerable low lying coastal areas of Apodi, due to SLR and land loss due to coastal erosion. RS and GIS tools can be used to prepare the land use and land cover map and shoreline change detection maps [7].
II. DISCRIPTION OF THE STUDY AREA The study area is located on the northwestern portion of Rio
Grande do Norte State, along the Apodi River. The Apodi River originates nearby Apodi city in the semiarid region on the Northeast Brazil, and flows NE through Mossoro, Areia Branca and Grossos districts of Rio Grande do Norte State, and discharges directly into the Atlantic Ocean (Figure 01). The geographic coordinates are limited by latitude 04°55'46".77 to 05°13'39".41 south and longitude 37°01'30".79 to 37°22'42".42 East.
Climate of the area is semiarid tropical type [8], with mean annual temperature about 27.5°C. November is the best hot season with maximum temperatures exceeding 40°C. The daily temperature range is usually in between 8 and 10°C and annual fluctuations around 5°C.
The average rainfall is 700-900 mm/y and mostly concentrated during February-April and can fall at high intensities [9], but is accompanied by very high potential evaporation (in excess of 2,000 mm/y). These climate changes can be explained by the movement of the inter-tropical convergence zone (ITCZ), where the periods of drought are related to his removal from the coast, causing the lack of rainfall and the area of strong winds, while the rainy periods are linked to their shifting to the south, relating to more lenient wind. The normal relative humidity in a year is 68.7% and may fluctuate during the year a range of 20% [10, 11]. This is lower in September with 59.9% and higher in April to 78.1%.
Fig.1 Study area location on Rio Grande do Norte State,
Northeast Brazil.
Northeast Brazil is characterized by high incidence of solar energy, with uniform thermal regime characterized by high temperature and small variations during the year. This is due to geographical factors of the region, such as low latitude, near the sea and the gently wavy relief plan. The sunshine in the Apodi region is the highest in Brazil, reaching on average 2,900 hours per year, equivalent to 7.9 hours of daily sunlight. The average monthly variation over the year was a minimum of 6.3 hours/days to a maximum of 9.5 hours/day, measured on the Macao Meteorological Station-RN.
The speed and direction of winds influenced directly to the coastal processes and is the generation of waves. It’s an important agent in the sediment dynamics on the beaches. The average winds speed masseur in the study area is 5 m/s in April and 9 m/s in between August to October, but can reach up to 18 m/s during the month of August [12].
The main economic activities of the area are shrimp, fisheries, agriculture, tourism and industrialization and hence there is an increase in urbanization along the coast. In addition to these, this coast is well known for the coastal ecosystem such as mangroves, coastal forest, salt ponds, shrimp farms and long sandy beaches. All these activities will be increasing the sensitivity of the Apodi coast to future SLR.
III. DATA PRODUCTS A study related to coastal processes involves the analysis of
both conventional and remotely sensed data. Conventional data are more accurate and site specific, but data collection is time consuming, expensive, requires more manpower and it may not be possible to extrapolate to a larger area. Remotely sensed data on the other hand have got advantages due to repetitive and synoptic coverage of the large, inaccessible

International Journal of Environmental and Earth Sciences 1:3 2010
129
areas quickly and economically. In the present study, to take the dual advantages, both conventional and remotely sensed data were used.
The main remote sensing products used in this research work were: orbital images of Landsat TM, ETM+, Spot 4-HRVIR, IKONOS, CBERS 2B and SRTM data. Topographic sheet were used in this research work were SB-24-XB-IV, SB-24-XDI, XDI-SB-24-1-2 MI-897-2. Digital image processing was performed using the ER Mapper 7.1 software, involving the geocoding in UTM cartographic projection Zone 24S - Datum SAD-69 and the Root Mean Square (RMS) were less than 1.0, standardizing the data and increasing the reliability of products obtained. Maps of geo-environmental units (geology, geomorphology, soils and vegetation) were prepared on scale of 1:150.000, from the interpretation of satellite imagery using Arc GIS 9.3 software and field applications. All secondary data collected from [10, 13] IDEMA, IBGE and metrological department of RN, Brazil.
Trimble hand held GPS of accuracy 10m was used to map the shoreline and to collect the coordinates of important land use/cover features in the study area during the pre and post classification field visits while preparing the land use/cover map. Finally Shuttle Radar Topography Mission (SRTM) data of approximately 90m resolution were downloaded from the website and used to prepare the digital elevation map (DEM) and then the inundation map of the study area. All these data sets were utilized to study the impact of SLR on land loss, land use/cover, and coastal erosion (Table 1).
IV. METHODOLOGY Mainly we were focused on 20 sample sites (A) along the
coast and (B) all around the Apodi River. Around the river locations are vegetation, industrial and urban area and along the coast locations are considered as one of the more deserted beaches with only small buildings (summer homes) without major electrical installations and less frequented by tourists, only a few fishermen. It is a very open beach, without natural or artificial obstacles, which makes it unprotected against the effect of tides, causing a likely retreat to the shoreline. Beach dunes are being constantly fed by the frontal dunes, which are at the beginning of the post-beach, which are formed mainly by sediment coming from estuary. The slope of estuary average does not exceed 2. Even in the estuary is the formation of beach cusps with a length of about 24m, only in April, May and June (winter). We can find a considerable amount of polluting materials such as glass, plastic, organic waste and from others. The vegetation is heterogeneous with low intensity, being common to salsa, coconut trees and the beach grass.
The CVI allows the six variables to be related in a quantifiable manner that expresses the relative vulnerability of the coast to physical changes due to future sea level rise. This method yields numerical data that cannot be equated directly with particular physical effects. It does, however, highlight areas where the various effects of sea level rise may be the greatest and it is the same as that used by [6, 5]. Land/beach loss due to coastal erosion and coastal inundation are the two
types of physical impacts considered in the present study. The six variables are classified into two groups:
1. Ecological variables, 2. Geo-physical variables.
The eco-geophysical variables include (a) historic shoreline change, (b) geomorphology, (c) coastal slope, (d) mean tidal range, (e) mean significant wave height and (f) global SLR. Once each section of the coastline is assigned a vulnerability value for each specific data variable, the CVI was calculated as the square root of the product of the ranked variables divided by the total number of variables.
(1) where, a geomorphology, b shoreline change rate (m/yr), c
coastal slope (%), d mean tidal range (m), e mean significant wave height (m), f global SLR (mm/yr).
The ecological variables consist of geomorphology, historic shoreline change rate, and coastal slope; they account for a shoreline’s relative resistance to erosion, long-term erosion/accretion trend, and its susceptibility to flooding, respectively. The geo-physical process variables include significant tidal range, wave height, and global SLR, all of which contribute to inundation hazards of a particular section of the coastline over time scales from hours to centuries. These six variables include both qualitative and quantitative information. Actual variable values are assigned a vulnerability ranking based on value ranges, whereas the non-numerical geomorphology variable is ranked qualitatively according to the relative resistance of a given landform to erosion.
In the present study, ranking was assigned for these variables along twenty stations in the study area and thus CVI was calculated for these stations. The stations were selected based on sensitivity and the magnitude of the changes in shoreline from 1986 to 2009. The CVI can be used by scientists and engineers to evaluate the likelihood that physical change may occur along a shoreline as the sea level rises and to take necessary actions. The CVI may also be used to judge suitable sites of industrialization, development of ports and harbours, urbanization or tourism. The values and ranking assigned for each variable are described in the following paragraphs.
A. Geomorphology The local morphology is the result of semi-arid climate,
predominantly activated in the most of northeastern Brazil. The study area show a significant influence of river-sea quaternary plains, where the direct action of coastal processes (tides, wind, waves, and currents) and anthropogenic modeling is an important agent. The geomorphology variable expresses the relative erodibility of different landform types (Figure 2A). The ranking is on a linear scale from 1 to 5 in order of increasing vulnerability due to SLR [6]. The value of 1

International Journal of Environmental and Earth Sciences 1:3 2010
130
represents the lowest risk (rocky cliffed coast) and 5 represents the highest risk (coastal plain, beach, mud flats) as far as coastal erosion is considered. In the present study, a detailed geomorphology map has been prepared by using toposheets of 1: 50,000 scale (Table 1).
B. Shoreline Change Rate The results obtained in the analysis of the profiles are fully
related climatic variations between summer and winter. Approximately 70% of the world’s sandy beaches have been identified as eroding [14]. Though beaches along the Apodi coast are maintaining dynamic equilibrium, there will be temporary sea erosion during the monsoon, due to high wave activity [15]. In the winter months was the formation of the front dune, which increased in profile. In the summer months, the winds were very strong up to reach approximately 31.3 km/h, so that these dunes were remobilized front line of the
profile, reflecting the migration may be the same for SW, and/or to the power cords of the volume over the months, ex. they approached the month of July (end of winter), the volume gradually increased in the sediment large mobile dunes that are behind the profile. Training and remobilization front dunes can be explained as follows: For the winter months, with the increase of rain, the dunes are partly saturated in water and consequently more compressed, and difficult to mobility by the action of the winds. Already during the summer months, with the decrease of rains, the dunes become dry and therefore more mobile, and with help from strong winds, tend to migrate.
Table 1
Ranges of vulnerability ranking for the study area. Sl. no. Variable Ranking of coastal vulnerability
Very low Low Mediam High Very high 1 2 3 4 5
1 Geomorphology Rocky cliffed coasts
Medium cliffs, Indented coasts
Low cliffs, lateritic plain
River deposits, alluvial plain
Coastal plain, beach, mud
flats 2 Shoreline erosion/
accretion (m/yr) >+15 +5 to +15 -5 to +5 -15 to -5 <-15
3 Coastal slope (%) >0.6 0.5–0.6 0.4–0.5 0.3–0.4 <0.3 4 Mean tide range (m) >4.0 3.0–4.0 2.0–3.0 1.0–2.0 <1.0 5 Mean significant wave
height (m) <0.7 0.7–1.4 1.4–2.1 2.1–2.8 >2.8
6 Mean sea level rise (mm/yr)
<1.8 1.8–2.5 2.5–3.0 3.0–3.4 >3.4
To calculate the shoreline erosion/accretion rate along the Apodi coast, TM, ETM+, Spot 4-HRVIR, IKONOS, CBERS 2B and SRTM data of 1986 to 2009 were analyzed using the ERDAS Imagine software. The vector layers of 1986 and 2009 were overlaid using Arc GIS software [16] and the final map was obtained (Figure 2B). During this period of RS data analysis, some of the sites showed significant erosion and the river mouths showed a tendency of shifting towards the southeast. The minimum width of beach was 3m under accretion and erosion, whereas the maximum beach width was 100m under accretion and 96m for erosion. The ranking of the shoreline change rate is based on the range of change in beach width values. By superimposing the RS data on the base map, the area of accretion and erosion was calculated and then the maximum erosion and maximum accretion rate were estimated as -17.00 m/yr and +17.67 m/yr respectively. Shorelines with erosion/accretion rates between -5 m/yr and +5 m/yr are ranked medium. With ± 5 increments, increasingly higher erosion or accretion rates are ranked as correspondingly higher or lower vulnerability. Along
the Apodi coast waves approach the coast with their crest parallel to the coast and hence there will be an offshore–onshore movement of the sediments. During the monsoon season, due to severe wave activity, a large quantity of sediment will be moved to the offshore region; once the wave activity is reduced during the non-monsoon period, almost the same quantity of sediment will be brought back to the coast, by the waves, and hence, the beach is in dynamic equilibrium. However some stretches of the beach are subjected to severe wave attack and hence erosion at these places will be more and they are identified as critical erosion areas (CEAs) [15]. Because of this reason the net erosion is more than the net deposition, which forms the basis for the present analysis.
C. Coastal Slope Determination of the regional coastal slope identifies
the relative vulnerability of inundation and the potential rapidity of shoreline retreat because low-sloping coastal regions are thought to retreat faster than steeper regions

International Journal of Environmental and Earth Sciences 1:3 2010
131
[17]. The regional coastal slope was calculated for a distance of 360m
perpendicular to the shoreline (-1m to 67.5m on the sea side and 67.5m to 360m towards the land side). The bathymetry details were obtained from naval hydrographic charts and contours using toposheets. Fig. 2C represents the coastal slope of the study area at different stations. A slope greater than 0.6% is assigned low vulnerability and less than 0.3% is assigned high vulnerability. In profile 1 slop is 0.24%, on 2 and 3 is 0.14 and profile 4 slope is 0.74 so mean slop of the study area is 0.32% (Fig. 2a-d) which show the high vulnerability in the study area. These values are also fixed based on the physiography, contour details from SRTM data and generated DEM.
D. Mean Tidal Range The nearest tide gauge to the study area was at Macao
Meteorological Station-RN (measured by the Brazilian navy - ADCP), which had measurements available for the current study; data on sea-level variations included astronomical as well as meteorological elevations. Data on swells, waves and storm surges were obtained from DE AREIA BRANCA A GUAMARÉ (http://www.mar.mil.br/dhn/chm/cartas/download/cartasbsb/cartas_eletronicas_Internet.htm) and from the Environmental Impact Assessment (EIA) report on the implementation of the Chart nº 720 - DE AREIA BRANCA A GUAMARÉ (2009). The general situation in this area is high-energy conditions of tides, causing the continuous mobility sediments along the bottom to the near of coast. The presence of small deltas of tide over the island barrier systems and mouth of river, as well as the formation of spits perpendicular to the coast, shows the strong influence of tides.
Tides along the Apodi coast are of the mixed type with semi diurnal components dominating. Semi diurnal tides would mean two high waters and two low waters in a day. The tidal variation - RTR observed is among 1.5 <RTR <13.5 [18], thus being classified in the group of back mixed, dominated by waves and tides. Tidal range is ranked such that micro tidal coasts are at high risk; macro tidal coasts are at low risk and meso tidal in between. The reasoning is based primarily on the potential influence of storms on coastal evolution, and their impact relative to the tide range. For example, on a tidal coastline, there is only 50% chance of a storm occurring at high tide. Thus, for a region with a 4m tide range, a storm having a 3m surge height is still up to 1m below the elevation of high tide for half a tidal cycle. A micro tidal coastline, on the other hand, is essentially always ‘‘near’’ high tide and therefore always at the greatest risk of inundation from storms. The values used to estimate the potential land loss by inundation were used between 1m to 10m for minimum and maximum inundation levels, respectively.
E. Mean Significant Wave Height The mean significant wave height used for the calculation of CVI is a proxy for wave energy which drives the coastal sediment budget; wave energy is directly related to the square of wave height:
(2)
Where, E energy density (N/m²), h wave height (m), ρ water density (N/m3), g acceleration due to gravity (m/s²).
Thus, the ability to mobilize and transport coastal sediments is a function of the wave height squared. For, statistical analysis wave records containing at least 100 waves are required. For every 100 waves, the waves of E and NE, as the main state of sea in this region, which show significant heights from 10 to 80 cm and varying period 4 to 8 seconds. Lower values of wave periods (4 to 4.5 seconds) are observed in the May-August months. The best wave periods (7.5 to 8 seconds) are observed predominantly in the January to April months. The greatest heights are recorded predominantly in November and the lowest in the May to June months. The waves more high during periods of tide floods, With respect to the other periods, it was observed that the ENE and NE waves have highest values of 11 seconds. The waves from east and ESE period are around 5 seconds. Therefore as per the data available for the study area, these waves are considered medium vulnerable.
F. Mean Sea Leave Rise A sea level rise would directly result in a corresponding higher shift to the zone of wave action on the beach. This would be reflected in a shoreline recession which will be larger on milder slopes. [19] has presented a theory which estimates the shoreline recession for a given rise in sea level. According to this estimate, every millimeter rise of sea level on the coast must result in a shoreline retreat of about 1m. The North Brazilian Current flowing approximately parallel to the fall of the platform, reaching speeds is about 30-40 cm/s, overlapped by waves and tides components [20]. Drifting coastal currents flowing from east to west in the northern coast of Rio Grande do Norte. Waves (20-105 cm/s) are the forces dominant in net sediment transport along the coast of Rio Grande do Norte due to the obliquity of the intense winds. Coastal currents directed by winds and increase the rate of sediment transport, while the tides have a lower transport capacity due to relatively lower intensities of currents in the tide (5-60 cm/s). This can be well observed in the region by the
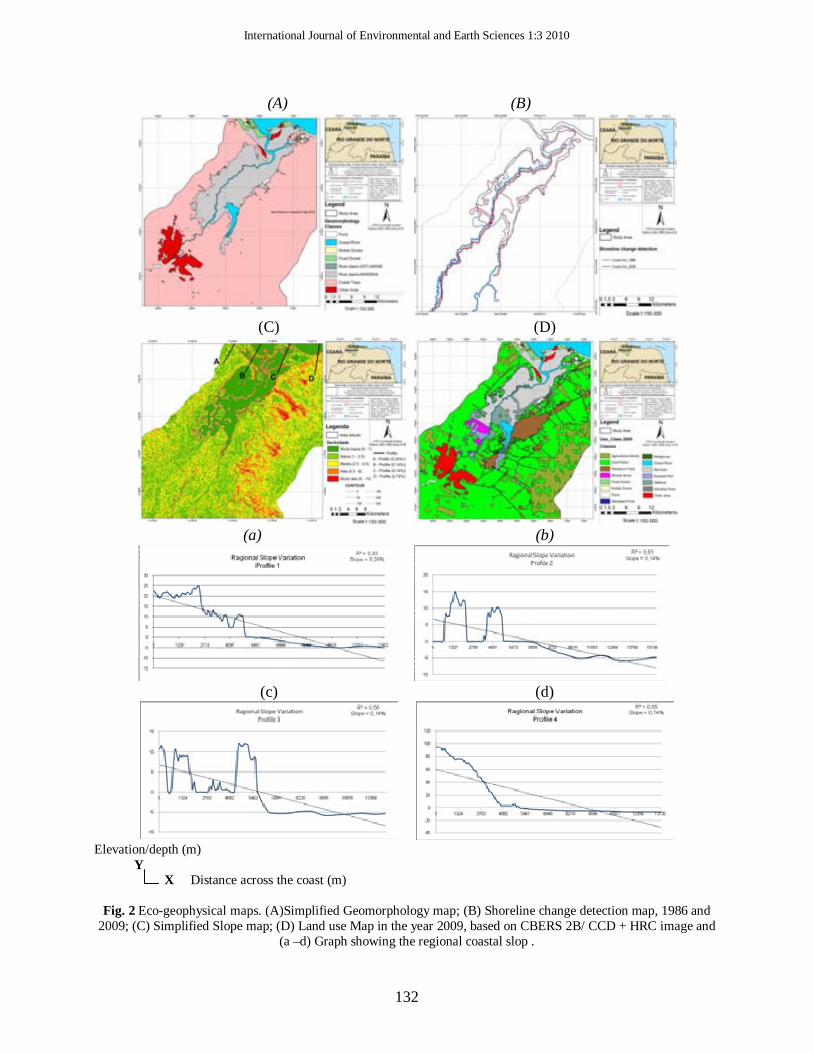
International Journal of Environmental and Earth Sciences 1:3 2010
132
(A) (B)
(C)
(D)
(a) (b)
(c)
(d)
Elevation/depth (m) Y X Distance across the coast (m)
Fig. 2 Eco-geophysical maps. (A)Simplified Geomorphology map; (B) Shoreline change detection map, 1986 and 2009; (C) Simplified Slope map; (D) Land use Map in the year 2009, based on CBERS 2B/ CCD + HRC image and
(a –d) Graph showing the regional coastal slop .
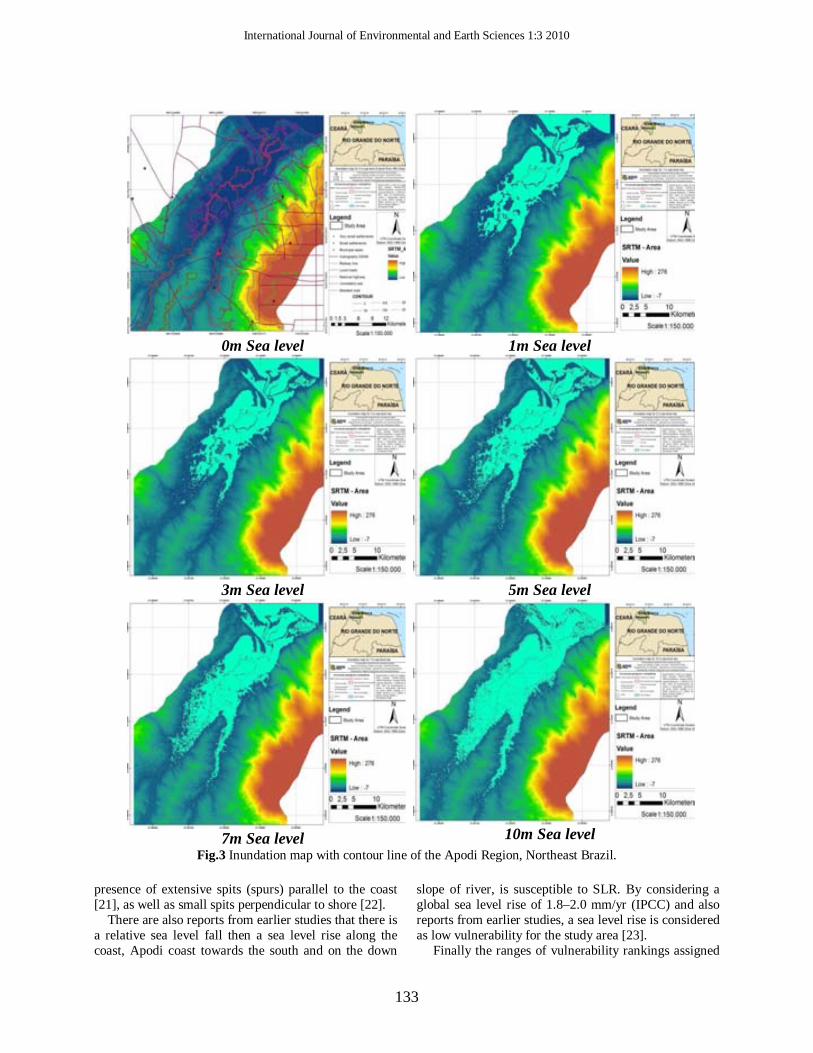
International Journal of Environmental and Earth Sciences 1:3 2010
133
0m Sea level 1m Sea level
3m Sea level 5m Sea level
7m Sea level 10m Sea level Fig.3 Inundation map with contour line of the Apodi Region, Northeast Brazil.
presence of extensive spits (spurs) parallel to the coast [21], as well as small spits perpendicular to shore [22].
There are also reports from earlier studies that there is a relative sea level fall then a sea level rise along the coast, Apodi coast towards the south and on the down
slope of river, is susceptible to SLR. By considering a global sea level rise of 1.8–2.0 mm/yr (IPCC) and also reports from earlier studies, a sea level rise is considered as low vulnerability for the study area [23].
Finally the ranges of vulnerability rankings assigned

International Journal of Environmental and Earth Sciences 1:3 2010
134
for all the six variables are furnished in Table 1. In addition to the estimation of the above parameters, the land use/land cover map for the river mouth areas and DEM for the complete study area have been prepared, for the inundation analysis and to know the submergence of different land use/cover features due to future SLR.
G. Land Use/Cover Map The Apodi River is the second river in extension of
Rio Grande do Norte State, with mouth in the Atlantic Ocean between the municipalities of Grossos and Areia Branca (Fig. 2D). The length of the sand spit at some places is more than 3km, and they are highly vulnerable to sea erosion and these areas are also highly populated in addition to several salt industry, shrimp and fish processing industries. Because of this reason river mouths in the study area were selected for the land use/cover map preparation. TM, ETM+, Spot 4HRVIR, IKONOS, CBERS 2B data of 1986 to 2009 were analyzed up to the level-II classification by adopting the maximum likelihood algorithm of the supervised classification technique [24] for the preparation of the land use/cover map. The classified output Apodi river mouth is shown in Fig. 2D, which is required for the inundation analysis.
H. Inundation Map [19] has presented a theory which estimates the
shoreline recession for a given sea level rise. According to this estimate, every millimeter rise of sea level on the coast must result in a shoreline retreat of about 1m. Factors such as near shore topography, location and orientation of the coastal segment, tidal range, morphology of the coast etc are responsible for the resistance of the coast to the rise in water level. The intensity and magnitude of the water level rise are also an important factor governing the magnitude of inundation of the area. By keeping the SLR and tsunami in mind, an inundation map was prepared for the study area using the virtual GIS module of ERDAS Imagine software for six run-up values i.e., 0m, 1m, 3m, 5m, 7m and 10m with reference to the mean sea level, by taking the digital elevation model (DEM) as a base map. This DEM was prepared using Shuttle Radar Topography Mission (SRTM) data, which are available as 3 arc sec (approx. 90 m resolution) DEMs. The inundation module available in ERDAS Imagine was used to generate different scenarios of sea level rise. The six run-up values used to prepare the inundation maps are shown in Fig. 3. This map is useful in determining the extent of vulnerability of the area to SLR as well as storm and tsunami waves.
Once, the calculations of each parameter were completed, they were assigned a relative risk value
based on the potential magnitude of its contribution to physical changes on the coast as the sea level rises, and CVI was computed using Eq. (1). Detailed discussion about land loss, erosion of beach due to SLR is provided in next Section.
V. RESULT AND DISCUSSTION After assigning the risk value based on each specific
data variable to each section of the coastline, the CVI has been calculated using Eq. (1). The calculated CVI value for the coastal stretch ranges from 0.0 to 3. The CVI scores are divided into Low (less than 0.95); Medium (from 0.96 to 1.35); and High (from 1.36 to 1.70), by means of the cluster principle and visual inspection of the data. Locations along the coastal stretch are under the very high vulnerability category. Places such as river plains, salt pond, and agriculture land fall under the high category whereas forest area has low vulnerability. Fig. 5B shows the percentage length of the coastal stretch that has high, medium, and low vulnerability. The total area of the study is 1372 Km², out of which 21.48% of the mapped shoreline is classified as being at high risk due to future SLR, mobile dunes and industrializations. The percentage of medium risk is 73.60%, and the 4.92% of the shoreline is under the low risk category.
From this it is very clear that the Apodi coast is highly vulnerable for future SLR, and the different land use/cover features under the direct risk of flooding include coastal villages and city, agricultural land, wetland, salt pans, aquaculture ponds, link roads, beaches and coastal dunes.
This implies that the population living presently in these areas would be displaced. Fig. 04 shows the vulnerable areas along the study area for the SLR determined using coastal vulnerability indices. The area of submergence for different sea level rises in the form of a bar chart is shown in Fig. 5A.
The area of submergence for 1m rise in water level is up to 216.1km² and subsequently for 3m, 5m, 7m and 10m rise in water level are 231.2km², 256.4km², 295.7km², and 362.81km² respectively. The low lying areas of the study area are highly vulnerable for submergence in case of a tsunami or a rise in sea level. From the land use/cover map, it is clear that the maximum area is covered by Industrial, agriculture lands and other categories, which include aquaculture ponds in the low lying area, and they will get affected first by future SLR. The inundation maps can be overlaid on land use/land cover maps to find out the extent of submergence of different land use/cover areas. It is necessary to incorporate the elevation levels for new/expanded settlement areas under the town planning

International Journal of Environmental and Earth Sciences 1:3 2010
135
acts so that human life and property are saved from natural hazards/vulnerabilities. The run-up levels can be used as guidance to determine safe locations of settlements from the shoreline. Based on the vulnerability assessment study, it is clear that three issues are of great concern to the authorities and decision makers: coastal land loss, ecosystem disturbance and erosion and degradation of shoreline.
Fig. 4 Costal eco-environmental vulnerability map of
Apodi Region, Northeast Brazil.
Coastal Regulation Zone (CRZ), as part of the Environmental Protection Act to protect the coast from eroding and to preserve its natural resources and would be adopted. Accordingly coastal stretches of seas, bays, estuaries, creeks, rivers and backwaters which are influenced by tidal action in the landward direction up to 500 m from the high tide line (HTL) were considered as coastal regulation zones [25]. The low lying nature of the Apodi coastal zone coupled with significant land reclamation investments and extensive industrial, commercial, and residential activity emphasizes that ecological and socio-economical systems are currently facing tremendous pressure due to rapid urbanization, industrialization, and economic development. SLR phenomena are going to accelerate degradation of the coastal and marine resources and could lead to serious displacement of people, commercial and industrial activities. Hence, strict enforcement of the CRZ Act is needed in order to protect the coastal ecosystem and to reduce degradation.
The options available for the protection of the Apodi coast from future SLR could be dune afforestation, mangrove restoration and management, periodic beach nourishment and building seawalls and groins. The construction of seawalls is costly and hence it would be used only for some settlements at high risk of inundation. The performance of properly constructed
and maintained seawalls along the coast is satisfactory [15]. The integrated coastal zone management plan, though active in Brazil, is still not fully functional. It must emphasize more on building regulation, urban growth planning, development of institutional capacity, involvement of local community, increasing public awareness and should be based on long-term sustainable developmental programmes.
Fig. 5 (A) Representation of the inundation area and (B)
Costal eco-environmental vulnerability.
The dunes of the coast are being put under pressure by way of human interference. Strict legislation should be put forward to restrict growth of housing complexes in the dune areas. Over exploitation of ground water in the dune areas should be avoided as this leads to sea water intrusion and subsequent conversion of the dunes into saline-rich bodies of soil. Since a few dunes nearer the coastline are of shifting nature, it is suggested that these are stabilized by practicing mixed and social forestry. Depending on their stability and soil texture, certain dunes can be flattened and the area used for agriculture including coconut groves. While agriculture is being practiced, care should be taken to avoid soil erosion.
Dunes in some regions may be the cause of the regular occurrence of floods in the inland areas. This is because these dunes act as barriers for the flood waters
International Journal of Environmental and Earth Sciences 1:3 2010
136
reaching the sea. Therefore, construction of channels across the dunes may help ease the frequent flood situations. In last more detailed mapping (on 1:50 000/25 000 scale) using temporal satellite data is suggested for more effective micro level landuse planning along the Apodi coast.
VI. CONCLUSION The present study was carried out with a view to
identify vulnerable areas due to future sea level rise (SLR) along the Apodi coast through the analysis of conventional and remotely sensed data, and the conclusions of the same are as follows. The coastal vulnerability index (CVI) provides insight into the relative potential of coastal damage due to future SLR. The maps presented here can be viewed in at least two ways: (i) to identify areas where physical changes are most likely to occur as sea level rises; and (ii) as a planning tool for managing and protecting resources in the study area. The rate of erosion was - 5.38m/yr during 2003–2009; and 21.48% is at high risk, 73.60% medium and 4.92% in low vulnerable category, due to future SLR. Based on the inundation study, it was found that 216.1 km² and 362.81 km² of the land area will be submerged by flooding at 1 m and 10 m inundation levels respectively. The most severely affected sectors are expected to be the residential and recreational areas, agricultural lands and the natural ecosystem. These are to be protected through strict enforcement of the Coastal Regulation Zone (CRZ) Act and any further coastal developmental activities and protection work along the Apodi coast should be based upon an integrated coastal zone management (ICZM) approach for long-term sustainable development.
REFERENCES [1] Klein, A.H.F.; Trucollo, E.; Diehl, F.L.; Vintem, G. Praias
arenosas. In: Serafim, C.F.S. (Coord.) O mar no espaço geográfico brasileiro. Brasília: Ministério da Educação, Brasil, 2005. cap.7. p.221-226.
[2] Al-Jeneid S, Bahnassy M, Nasr S, El-Raey M. Vulnerability assessment and adaptation to the impacts of sea level rise on the kingdom of Bahrain. Mitigation and Adaptation Strategies for Global Change 2008;13:87–104.
[3] Michele Capobianco, Huib De Vriend, Robert Nicholls J, Stive JF. Coastal area impact and vulnerability assessment: the point of view of a morphodynamic modeller. Journal of Coastal Research 1999;15(3):701–16.
[4] Snoussi M, Ouchani T, Niazi S. Vulnerability assessment of the impact of sea level rise and flooding on the Moroccan coast: the case of the Mediterranean eastern zone. Estuarine, Coastal and Shelf Science 2008;77:206–13.
[5] Thieler ER, Hammer-Klose ES National assessment of coastal vulnerability to sea level rise, U.S. Atlantic coast. U.S. geological survey open-file report 99- 593; 1999.
[6] Gornitz V. Vulnerability of the east coast, USA to future sea level rise. Journal of Coastal Research 1990;1(9):201–37.
[7] Bishi BS, Kothyari BP. Land cover change analysis of Garur Ganga watershed using GIS/remote sensing technique. Journal of the Indian Society of Remote Sensing 2001;29(3):137–41.
[8] Koppen, W. 1948. Climatologia: Um Estúdio de los Climasde la Tierra. Versión de Pedro R. Henrichs. México, Fondo de Cultura Econômica, 478
[9] Radambrasil, 1981. Levantamento de Recursos Naturais Geologia/Geomorfologia/ Pedologia/Vegetação/Uso Potencial da Terra. Rio de Janeiro/RJ: Ministério das Minas e Energia, v. 23 – Folhas SB. 24/25 – Jaguaribe/Natal, 740p.
[10] IDEMA, 1999. Informativo Municipal: Areia Branca. Secretaria de Planejamento e Finanças,Instituto de Desenvolvimento Econômico e Meio Ambiente-IDEMA,p.1-16.
[11] MAFRA, L. C. A. 2002. Caracterização Geológica e Geomorfológica do Município de Porto do Mangue / RN, com Vista à Elaboração do Mapa de Sensibilidade Ambiental ao Derramamento do Óleo. Natal - UFRN/DG – Relatório de Graduação.
[12] Chaves M.S. & Vital H. 2001. Impactos ambientais na zona costeira do Campo PetrolíferoMacau-5, Macau-RN. In: Congresso Brasileiro de P&D em Petróleo e Gás, 1, UFRN –SBQ Regional RN, Natal, Anais, p. 222
[13] IBGE - Instituto Brasileiro de Geografia e Estatística. Disponível em: <http://www.ibge.gov.br/home/>. Acesso em 22/03/2007.
[14] Bird Eric CF. Coasts: an introduction to coastal geomorphology. UK: Basil Blackwell Publisher Limited; 1984.
[15] Dwarakish GS. Usha Natesan. Coastal Structures Vs Shoreline Configuration. NITK Research Bulletin 2002;11(3):25–33.
[16] Burrough PA, Mc Donnel RA. Principles of geographical information systems. New York: Oxford University Press; 1998.
[17] Pendleton Elizabeth A, Hammar-Klose Erika S, Thieler E Robert, Williams S Jeffress. Coastal vulnerability assessment of Gulf Islands national seashore (GUIS) to sea-level rise. U.S. geological survey open-file report 03-108; 2003. Available onlineat<http://pubs.usgs.gov/of/2003/of03-08/images/pdf/Gulf_ Islands_www.pdf> [accessed 27 Apr 2007].
[18] Vital H., Samia F. and Moab P. G. 2010. Response of the Apodi-Mossoro estuary-incised valley system (NE Brazil) to sea-level fluctuations. Brazilian journal of Oceanography, 58 (special issue PGGM): 13-24, 2010.
[19] Bruun P. Sea level rise as a cause of shore erosion. Journal of the Waterways and Harbors Division 1962;88(1):117–30.
[20] KNOPPERS, B.; EKAU, W. & FIGUEIREDO, A.G. 1999. The coast and Shelf of east and northeast Brazil and material transport. Geo-Mar. Lett. 19 (3): 171-178.
[21] SILVEIRA, I.M.; VITAL, H.; AMARO, V.E., 2001. Vulnerabilidade e Sensibilidade da Região Costeira de Guamaré-RN. 17° Simpósio de Geologia do Nordeste, Atas, p.41.
[22] SILVA, J. X. & FILHO, L.M.C. 1993. Sistema de Informação: uma proposta metodológica. In: Análise Ambiental: Estratégias e ações. Rio Claro, CEAD -UNESP, p.329-346.
[23] Subramanya KR. Active intraplate deformation in south India. Tectonophysics 1995;262:231–41.
[24] Lillesand Thomas M, Kiefer Ralph W, Chipman Jonathan W. Remote sensing and image interpretation. New York: John Wiley and Sons Publications; 2004.
[25] Rajawat AS, Gupta Mukesh, Pradhan Yaswant, Thomaskutty AV, Nayak SR. Coastal processes along the Indian coast – case studies based on synergistic use of IRS-PA OCM and IRS-1C/1D data. Indian Journal of Marine Sciences 2005;34(4):459–72.

111
5.3 Quarto artigo
BOORI, Mukesh Singh; AMARO, Venerando Eustáquio; TARGINO, Anderson. Coastal risk
assessment and adaptation of the impact of sea-level rise, climate change and hazards: A RS
and GIS based approach in Apodi-Mossoró estuary, Northeast Brazil. International Journal
of Geographical Information Science (IJGIS), 2011. ISSN 1365-8816. Accepted.

112
Coastal risk assessment and adaptation of the impact of sea-level rise, climate change and hazards: A RS and GIS based approach in Apodi-Mossoro
estuary, Northeast Brazil.
Mukesh Boori, Venerando Amaro, Anderson Targino Post-graduation Program in Geodynamic and Geophysics, Center of Exact Sciences and Earth,
Federal University of Rio Grande do Norte, Natal –RN, Brazil. [email protected], [email protected], [email protected]
Abstract
The Northeast Brazil is physically and socio-economically vulnerable to accelerated sea-level rise, due to its low topography and its high ecological and touristic value. The main threats in Apodi-Mossoró estuary that could be connected with sea-level rise and climate change are the flooding of coastal areas, erosion of sandy beaches and the destruction of harbor constructions and hazards. Assessment of the potential land loss by inundation has been based on empirical approaches using a minimum inundation level of 1m and a maximum inundation level of 10m. The sócio-economic impacts have been based on two possible alternative futures: first a worst situation measured by the economic condition in the maximum inundation level and second; a best situation measured by combining the sustainability on first scenario with the minimum inundation level. Inundation analysis, based on GIS and a modelling approach to erosion, has identified on 22 locations and the socioeconomic sectors that are most at risk to accelerated sea-level rise, climate change and hazards. Results indicate that 15.74% (216.10km2) and 26.43% (362.81km2) of the area will be lost by flooding at minimum and maximum inundation levels, respectively. The most severely impacted sectors are expected to be the residential and recreational areas, agricultural land and the natural ecosystem. Shoreline erosion is -5.38m/yr since 2003 to 2010 and it`s affect 21.48% the total area in the Apodi-Mossoró estuary which is very high vulnerable area. Potential strategies to ameliorate the impact of global climate change through sea level rise and coastal hazards include: wetland preservation; beach nourishment at tourist resorts; and the afforestation of dunes. As this coast is planned to become one of the most developed tourist resorts in RN state by 2012, measures such as building regulation, urban growth planning and development of an Integrated Coastal Zone Management Plan, are recommended for the region.
Keywords: Climate change, sea level rise, hazards, adaptation, RS & GIS.
1. Introduction The Northeast Brazilian coast faces the Atlantic Ocean from the equatorial to the southern temperate regions. Nowadays, it is recognized that climate change and sea level rise will impact seriously upon the natural environment and human society in the coastal zone. This zone of variable width reaches an extension of approximately 8,000 km and shows a considerable diversity of coastal morphology, exposures and ecosystems. At present, 63% of Brazilian states share the coastal area where almost a quarter of the country’s total population is concentrated. This zone forms one of the main socioeconomic areas of the country with more than 50% of the population inhabiting the coastal cities, as well as incorporating 90% of the industry. Furthermore, beaches and coastal resorts constitute a large percentage of the gross domestic product (GDP). However, due to diverse human pressures, many coastal areas are already experiencing acute environmental problems, such as coastal erosion, pollution, degradation of dunes, and saline intrusion of coastal aquifers and rivers. Accelerated sea level rise will intensify

113
the stress on these areas, causing flooding of coastal lowlands, erosion of sandy beaches, and destruction of coastal wetlands. Therefore, sea-level rise has to be one of the main impacts of climate change on Northeast Brazil (Vital et al. 2010).
The sea-level rise (SLR) due to the thermal expansion and melting of glaciers, ice caps and ice sheets is a topical issue on a global as well as on a regional scale (Zerbini et al. 1996; Nicholls & Mimura 1998; Peltier 1999; Mimura 1999). Sea-level rise (SLR) and natural disasters are both key problems that is taken into consideration in climate change impacts related to Northeast Brazil (Figure 1). In particular, low-lying areas, which are strongly affected by flooding or by active processes of shoreline erosion and sedimentation, pose the most serious consequences for local communities and tourists and the destruction of harbour constructions. Functions and values of the coastal system have been degraded and public safety and economy have been impacted. These problems could be accentuated due to rapidly increasing population pressures, which often lead to inconsiderate or poorly planned development in natural hazard-prone areas and potential scenarios of climate change/relative sea level rise.
The description of many coastal areas as highly hazards prone zones by scientists has led to an increasing attention of the coastal risks and attempts to understand and mitigate them on the side of government and administrations. The concept of Integrated Coastal Zone Management (ICZM) is considered a good approach for this purpose, because it can combine the control of sócio-economic development patterns, natural hazards prevention, and natural resource conservation at the same time. According to Kay and Alder (1999), most of the wide range of administrative, social and technical instruments used in an ICZM program could be analyzed through a simplified organizational framework.
The coastal zone of the Rio Grande do Norte State, Northeast Brazil represents such a system affected by natural hazards and risks, especially by flooding and erosion, in a context of climate change/sea level rise scenarios, which can lead to loss of land, severe property damage and alteration of its ecological characteristics. Therefore, this work aims to describe natural hazards impacts, in order to identify, assess of risk of the coastal zone based on remote sensing and GIS technology. The main objectives of this contribution are: (1) to determine areas at risk from flooding and erosion; (2) to assess the most vulnerable sectors at risk; (3) to estimate the influence of global climate warming on sea-level rise and coastal landscapes; (4) to determine areas at risk and rates of potential damage; and (5) to identify the most reasonable options available to mitigate these risks to the coast. 2. Study area The study area is located on the northwestern portion of Rio Grande do Norte State, along the Apodi River. The Apodi River originates nearby Apodi city in the semiarid region on the Northeast Brazil and flows NE through Mossoró, Areia Branca and Grossos districts of Rio Grande do Norte State, and discharges directly into the Atlantic Ocean (Figure 1). The geographic coordinates are limited by latitude 04°55'46".77 to 05°13'39".41 south and longitude 37°01'30".79 to 37°22'42".42 East.
Climate of the area is semiarid tropical type (Koppen 1948), with mean annual temperature about 27.5°C. November is the best hot season with maximum temperatures exceeding 40°C. The daily temperature range is usually in between 8 and 10°C and annual fluctuations around 5°C.
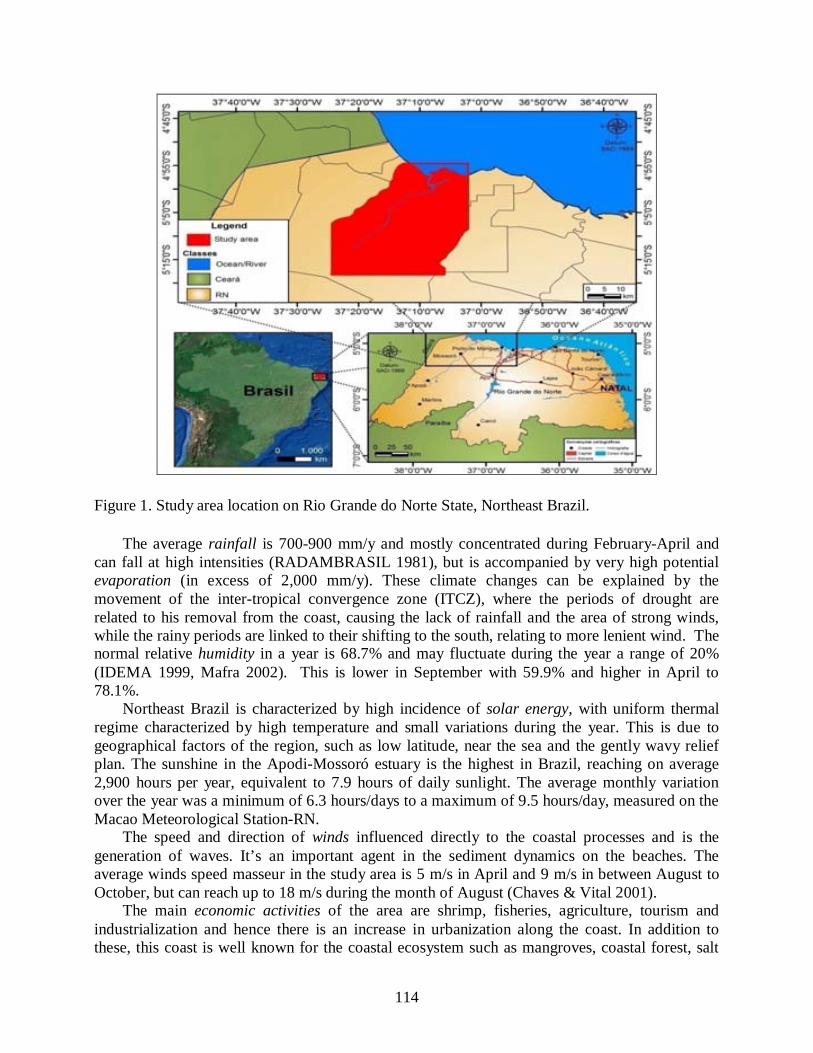
114
Figure 1. Study area location on Rio Grande do Norte State, Northeast Brazil.
The average rainfall is 700-900 mm/y and mostly concentrated during February-April and can fall at high intensities (RADAMBRASIL 1981), but is accompanied by very high potential evaporation (in excess of 2,000 mm/y). These climate changes can be explained by the movement of the inter-tropical convergence zone (ITCZ), where the periods of drought are related to his removal from the coast, causing the lack of rainfall and the area of strong winds, while the rainy periods are linked to their shifting to the south, relating to more lenient wind. The normal relative humidity in a year is 68.7% and may fluctuate during the year a range of 20% (IDEMA 1999, Mafra 2002). This is lower in September with 59.9% and higher in April to 78.1%.
Northeast Brazil is characterized by high incidence of solar energy, with uniform thermal regime characterized by high temperature and small variations during the year. This is due to geographical factors of the region, such as low latitude, near the sea and the gently wavy relief plan. The sunshine in the Apodi-Mossoró estuary is the highest in Brazil, reaching on average 2,900 hours per year, equivalent to 7.9 hours of daily sunlight. The average monthly variation over the year was a minimum of 6.3 hours/days to a maximum of 9.5 hours/day, measured on the Macao Meteorological Station-RN.
The speed and direction of winds influenced directly to the coastal processes and is the generation of waves. It’s an important agent in the sediment dynamics on the beaches. The average winds speed masseur in the study area is 5 m/s in April and 9 m/s in between August to October, but can reach up to 18 m/s during the month of August (Chaves & Vital 2001).
The main economic activities of the area are shrimp, fisheries, agriculture, tourism and industrialization and hence there is an increase in urbanization along the coast. In addition to these, this coast is well known for the coastal ecosystem such as mangroves, coastal forest, salt
115
ponds, shrimp farms and long sandy beaches. All these activities will be increasing the sensitivity of the Apodi coast to future SLR. 3. Methodology The shoreline response to sea level rise is often estimated using the Bruun Rule, which states that a typical concave-upward beach profile erodes sand from the beachfront and deposits it offshore, so as to maintain constant water depth. Shoreline retreat depends on the average slope of the shore profile. Detailed measurements according to the Bruun Rule (Bruun 1962; Hands 1983, Pilkey et.al. 1993) were made using large-scale (1:25,000) topographic and geomorphic maps and calculations along the coastline at 22 sample site. The Bruun Rule equation is quite simple in its form: R = SGL / (b + h)
where R is the retreat due to sea-level rise, S is above present sea level, G is the proportion of eroded material which remains in the active profile, defined as the inverse of an over fill ratio, L is the active profile width, b is the typical land height, often controlled by the dunes/berm, and h is the depth of closure which defines the sea ward limit of the profile.
To estimate shoreline erosion we used LANDSAT TM and ETM+ data since 2003 to 2010 and define all year’s coastal line variations, the calculated shoreline erosion was -5.38m/yr. In sea level scenario we used IPCC data for 2050 and 2100, according to the table 1. The active profile width is 205m (Geo-processing Lab., UFRN). For elevation height we used SRTM data and depths of closure were related to the datum was 2.35m above low water (Brazilian Navy - ADCP). Calculations were performed on 22 coastline segments that were defined mainly by the width of the active profile which varied slightly along the coast of the study area. Minimum and maximum values of land loss were presented in m3 and as a percentage of the total sand area.
Based on the measurements, calculations, and field observations, new coastline positions were drawn on the topographic maps. Field observations were used to compare possible coastline changes obtained by the Bruun Rule or by map measurements with the current state, and to make corrections where necessary. Two different coastline positions were drawn, depending on either normal weather conditions or potential storm surges. Both zones were subjected to inventories of land loss and temporary damages. 3.1 Sea level scenarios The estimates for future sea-level rise used in this research (Table 1) were those presented by Warrick et al. (1996); they ranged from 200 to 860 mm for the IS92a green house gas emission scenario in 2100, with a best estimate of 490 mm. According to the IPCC, this scenario assumed: (1) a level of emissions that would contribute to a doubling of carbon dioxide concentration in the atmosphere by the end of the 21st century; (2) a world population of 11.3 billion people by 2100, from population projections by the World Bank; and (3) an annual growth rate in gross national product (GNP) of 2.3% by 2100. Data on land movements (subsidence/uplift) were not available for the study area. However, as the long-term geological data suggested in significant tectonic variations, the rise in global sea levels were considered a credible scenario.

116
Table 1. IPCC scenarios for sea-level rise (Warrick et al., 1996).
Scenarios Sea-level rise (cm) 2050 2100
Low (no acceleration) 7 20 Best 20 49 High 39 86
3.2 Coastal topography and land use
Figure 2. Land use/ land cover map of the Apodi-Mossoró estuary 2009.
An initial requirement for the analysis of flooding impacts was the development of spatial datasets. A 1m spatial resolution digital elevation model (DEM) with error within 224 mm (1σ) in elevation was constructed using LANDSAT TM, ETM+, SPOT 4-HRVIR, CBERS-2B and IKONOS satellite multispectral dataset with 4m spatial resolution and stereo-pairs of aerial photographs taken in 2010. Our 2010 elevation Data were based on a static GPS survey, which had sub-centimeter positional accuracy in three dimensions. At the airfield, these data were consistent with the DEM data and a database of ground control points (GCPs) measured by a ground positioning system. This was undertaken using the Arc GIS software. The horizontal resolution of the DEM was 2m, which accurately represented narrow features such as roads and dunes; the vertical accuracy was 0.5m. The GIS environment was used to classify and map the typology of land threatened by inundation. The length of the sand spit/discharge at some places is more than 2km, and they are highly vulnerable to sea erosion and these areas are also highly

117
populated in addition to several salt industry, shrimp and fish processing industries. Satellite data from 1986 to 2009 were analyzed up to the level-II classification by adopting the maximum likelihood algorithm in the supervised classification technique (Lillesand, Kiefer, Chipman 2004) for the preparation of the land use/cover map and find fifteen major land-use classes. The classified output Apodi river mouth is shown in Figure 2, which is required for the inundation analysis. 3.3 Inundation level scenarios The nearest tide gauge to the study area was at Macao Meteorological Station-RN (measured by the Brazilian navy - ADCP), which had measurements available for the current study area; data on sea-level variations included astronomical as well as meteorological elevations. Data on swells, waves and storm surges were obtained from DE AREIA BRANCA A GUAMARÉ (http://www.mar.mil.br/dhn/chm/cartas/download/cartasbsb/cartas_eletronicas_Internet.htm) and from the Environmental Impact Assessment (EIA) report on the implementation of the Chart nº 720 - DE AREIA BRANCA A GUAMARÉ (2009). The general situation in this area is high-energy conditions of tides, causing the continuous mobility sediments along the bottom to the near of coast. The presence of small deltas of tide over the island barrier systems and mouth of river, as well as the formation of sandy shoals perpendicular to the coast, shows the strong influence of tides.
Tides along the Apodi coast are of the mixed type. The tidal variation - RTR observed is among 1.5 <RTR <13.5 (Vital et al. 2010), thus being classified in the group of back mixed, dominated by waves and tides. Tidal range is ranked such that micro tidal coasts are at high risk; macro tidal coasts are at low risk and meso tidal in between.
The reasoning is based primarily on the potential influence of storms on coastal evolution and their impact relative to the tide range. For example, on a tidal coastline, there is only 50% chance of a storm occurring at high tide. Thus, for a region with a 4m tide range, a storm having a 3m surge height is still up to 1m below the elevation of high tide for half a tidal cycle. A micro tidal coastline, on the other hand, is essentially always ‘‘near’’ high tide and therefore always at the greatest risk of inundation from storms. The values used to estimate the potential land loss by inundation were used between 1m to 10m for minimum and maximum inundation levels, respectively. 3.4 Coastal erosion To calculate the shoreline erosion/accretion rate along the Apodi coast, TM, ETM+, SPOT 4-HRVIR, IKONOS, CBERS-2B and SRTM data of 1986 to 2009 were analyzed using the ERDAS Imagine software. The vector layers from 2003 to 2010 were overlaid using Arc GIS software (Burrough & Mc Donnel 1998) and the final map was obtained (Figure 3). During this period of remote Sensing data analysis, some of the sites showed significant erosion and the river mouths showed a tendency of shifting towards the southeast. The minimum width of beach was 2m under accretion and erosion, whereas the maximum beach width was 301.36m under accretion and 146.14m for erosion. The ranking of the shoreline change rate is based on the range of change in beach width values. By superimposing the remote sensing data on the base map, the area of accretion and erosion was calculated and then the maximum erosion and maximum accretion rate were estimated as -313.39 m/yr and +80.06 m/yr respectively. Shorelines with erosion/accretion rates between -5.38 m/yr and +5.38 m/yr are ranked medium. With ± 5

118
increments, increasingly higher erosion or accretion rates are ranked as correspondingly higher or lower vulnerability. Along the Apodi coast waves approach the coast with their crest parallel to the coast and hence there will be an offshore–onshore movement of the sediments. During the monsoon season, due to severe wave activity, a large quantity of sediment will be moved to the offshore region; once the wave activity is reduced during the non-monsoon period, almost the same quantity of sediment will be brought back to the coast, by the waves, and hence, the beach is in dynamic equilibrium. However some stretches of the beach are subjected to severe wave attack and hence erosion at these places will be more and they are identified as critical erosion areas (CEAs) (Dwarakish & Usha Natesan 2002). Because of this reason the net erosion is more than the net deposition, which forms the basis for the present analysis.
Figure 3. Coastline erosion and variation in Apodi coast from 2003 to 2010.
3.5. Sócio-economic impacts Having determined the land loss due to erosion and inundation, the impacts of this loss were evaluated for the major sócio-economic sectors (urban and tourist areas, agricultural and forest land) and for the natural ecosystems at risk; this was undertaken by overlaying maps for both inundation scenarios and land use. However, these images did not represent the possible future for the region, because they were based on the current sócio-economic status; the impacts of scenarios for predicted inundation should be linked with equivalent scenarios for sócio-economic change. The latter were not easy to predict, as they depended on the nature of future development and the way the authorities might manage the coastal environment.
Due to the lack of information on sócio-economic change in Apodi-Mossoró estuary, two plausible alternative futures were considered for this study:

119
Economic development: coastal zone of the study area will continue to be the location and concentration of economic and tourist activity. Political efforts are consolidated through policy drive to exploit natural resources, develop infrastructure and practices driven by profit goals. This scenario imposes a high level of stress upon the environment and natural resources. Science and technology aim at improving efficiency and emphasizing profitability.
Sustainability: demographic trends (population growth and urbanization rate) are favorable. There is multi-stakeholder participation, broad alliance between public and private sector, science/knowledge community, and a development of the capacity to implement policy. Pressures on the ecosystems, such as the wetland, are reduced through careful and appropriate land use planning. More land is protected by local and national regulatory and governance mechanisms.
These qualitative storylines are of course subjective and need to be further developed and
quantified so as to provide the inputs to an integrated assessment (IA), as defined by the IPCC (2001). Indeed, the IA would be the best tool to produce policy-relevant guidance to the stakeholders (Shackley & Deanwood 2003; Holman et al., 2005). 4. Results The DEM presented in Figure 4 shows that low-lying land is more extensive at the north and centre of the valley. The areas lower than 2m above mean sea level (MSL), which are at risk of inundation under the minimum inundation level, are dunes, forest, wetland, shrimp and salt industry and urban area basically whole Areia Branca and Grossos city. 4.1 Risk assessment The main results of land loss due to inundation are presented in Figure 4. The most significant changes would occur on the mouth of the Apodi River, Areia Branca and Grossos city and over the north and northeastern part of the study area, where there is low-lying land and the natural coastal defenses, such as dunes, have been destroyed. At the minimum inundation level (1m in Figura 4), 15.74% (216.10km2) of the total area (Table 2) would be flooded including: urban areas; natural vegetation and agricultural land; industrial area and beaches and marshes. The area of submergence for 3m rise in water level is up to 231.22km² (16.84%) and subsequently for 5m, and 7m rise in water level are 256.40km² (18.68%) and 295.70km² (21.54%) respectively (table 2). The low lying areas of the study area are highly vulnerable for submergence in case of a tsunami or a rise in sea level. From the land use/cover map, it is clear that the maximum area is covered by industrial, agriculture lands and other categories, which include aquaculture ponds in the low lying area, and they will get affected first by future SLR.

120
0m Sea level
1m Sea level
3m Sea level
5m Sea level
7m Sea level
10m Sea level
Figure 4. Land area vulnerable to inundation in the Apodi-Mossoró estuary, Northeast Brazil.
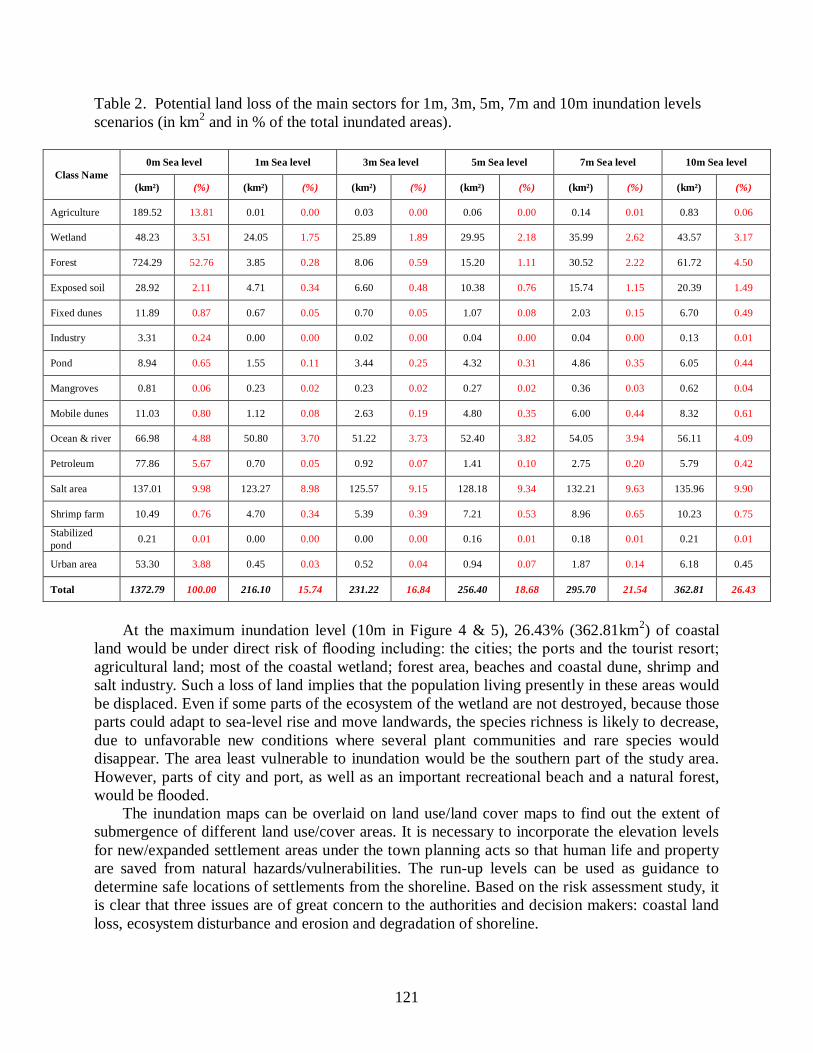
121
Table 2. Potential land loss of the main sectors for 1m, 3m, 5m, 7m and 10m inundation levels scenarios (in km2 and in % of the total inundated areas).
Class Name 0m Sea level 1m Sea level 3m Sea level 5m Sea level 7m Sea level 10m Sea level
(km²) (%) (km²) (%) (km²) (%) (km²) (%) (km²) (%) (km²) (%)
Agriculture 189.52 13.81 0.01 0.00 0.03 0.00 0.06 0.00 0.14 0.01 0.83 0.06
Wetland 48.23 3.51 24.05 1.75 25.89 1.89 29.95 2.18 35.99 2.62 43.57 3.17
Forest 724.29 52.76 3.85 0.28 8.06 0.59 15.20 1.11 30.52 2.22 61.72 4.50
Exposed soil 28.92 2.11 4.71 0.34 6.60 0.48 10.38 0.76 15.74 1.15 20.39 1.49
Fixed dunes 11.89 0.87 0.67 0.05 0.70 0.05 1.07 0.08 2.03 0.15 6.70 0.49
Industry 3.31 0.24 0.00 0.00 0.02 0.00 0.04 0.00 0.04 0.00 0.13 0.01
Pond 8.94 0.65 1.55 0.11 3.44 0.25 4.32 0.31 4.86 0.35 6.05 0.44
Mangroves 0.81 0.06 0.23 0.02 0.23 0.02 0.27 0.02 0.36 0.03 0.62 0.04
Mobile dunes 11.03 0.80 1.12 0.08 2.63 0.19 4.80 0.35 6.00 0.44 8.32 0.61
Ocean & river 66.98 4.88 50.80 3.70 51.22 3.73 52.40 3.82 54.05 3.94 56.11 4.09
Petroleum 77.86 5.67 0.70 0.05 0.92 0.07 1.41 0.10 2.75 0.20 5.79 0.42
Salt area 137.01 9.98 123.27 8.98 125.57 9.15 128.18 9.34 132.21 9.63 135.96 9.90
Shrimp farm 10.49 0.76 4.70 0.34 5.39 0.39 7.21 0.53 8.96 0.65 10.23 0.75
Stabilized pond 0.21 0.01 0.00 0.00 0.00 0.00 0.16 0.01 0.18 0.01 0.21 0.01
Urban area 53.30 3.88 0.45 0.03 0.52 0.04 0.94 0.07 1.87 0.14 6.18 0.45
Total 1372.79 100.00 216.10 15.74 231.22 16.84 256.40 18.68 295.70 21.54 362.81 26.43
At the maximum inundation level (10m in Figure 4 & 5), 26.43% (362.81km2) of coastal
land would be under direct risk of flooding including: the cities; the ports and the tourist resort; agricultural land; most of the coastal wetland; forest area, beaches and coastal dune, shrimp and salt industry. Such a loss of land implies that the population living presently in these areas would be displaced. Even if some parts of the ecosystem of the wetland are not destroyed, because those parts could adapt to sea-level rise and move landwards, the species richness is likely to decrease, due to unfavorable new conditions where several plant communities and rare species would disappear. The area least vulnerable to inundation would be the southern part of the study area. However, parts of city and port, as well as an important recreational beach and a natural forest, would be flooded.
The inundation maps can be overlaid on land use/land cover maps to find out the extent of submergence of different land use/cover areas. It is necessary to incorporate the elevation levels for new/expanded settlement areas under the town planning acts so that human life and property are saved from natural hazards/vulnerabilities. The run-up levels can be used as guidance to determine safe locations of settlements from the shoreline. Based on the risk assessment study, it is clear that three issues are of great concern to the authorities and decision makers: coastal land loss, ecosystem disturbance and erosion and degradation of shoreline.
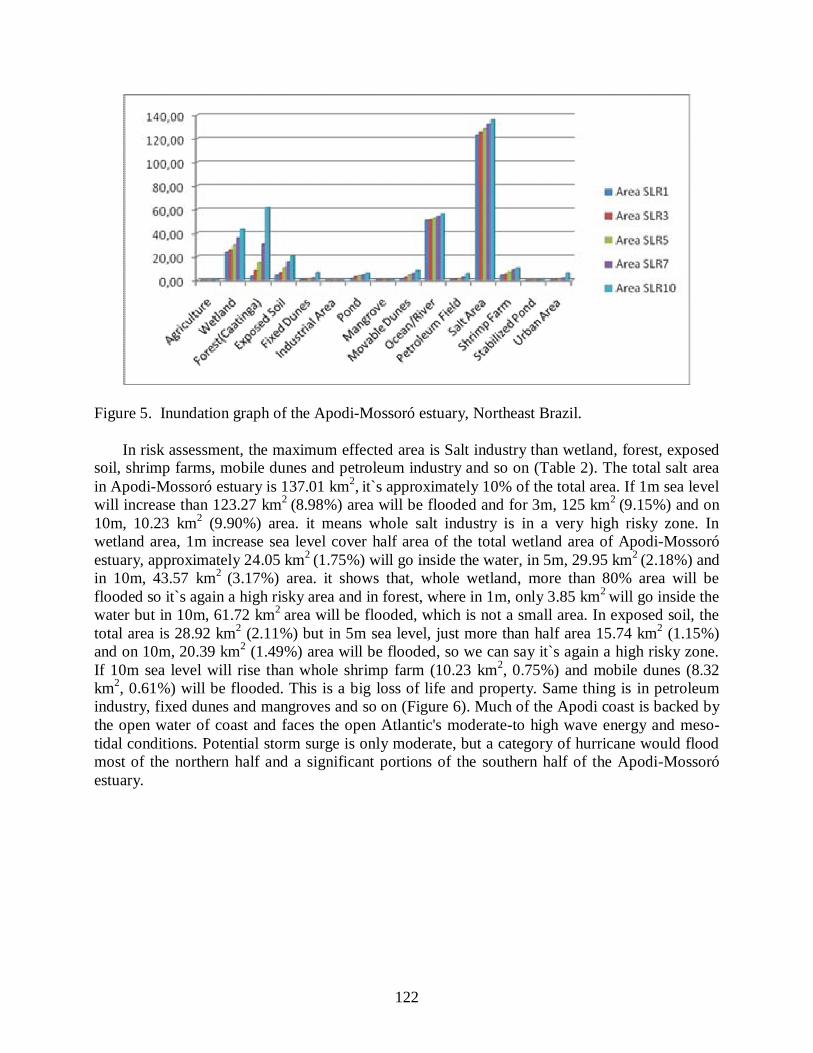
122
Figure 5. Inundation graph of the Apodi-Mossoró estuary, Northeast Brazil.
In risk assessment, the maximum effected area is Salt industry than wetland, forest, exposed
soil, shrimp farms, mobile dunes and petroleum industry and so on (Table 2). The total salt area in Apodi-Mossoró estuary is 137.01 km2, it`s approximately 10% of the total area. If 1m sea level will increase than 123.27 km2 (8.98%) area will be flooded and for 3m, 125 km2 (9.15%) and on 10m, 10.23 km2 (9.90%) area. it means whole salt industry is in a very high risky zone. In wetland area, 1m increase sea level cover half area of the total wetland area of Apodi-Mossoró estuary, approximately 24.05 km2 (1.75%) will go inside the water, in 5m, 29.95 km2 (2.18%) and in 10m, 43.57 km2 (3.17%) area. it shows that, whole wetland, more than 80% area will be flooded so it`s again a high risky area and in forest, where in 1m, only 3.85 km2 will go inside the water but in 10m, 61.72 km2 area will be flooded, which is not a small area. In exposed soil, the total area is 28.92 km2 (2.11%) but in 5m sea level, just more than half area 15.74 km2 (1.15%) and on 10m, 20.39 km2 (1.49%) area will be flooded, so we can say it`s again a high risky zone. If 10m sea level will rise than whole shrimp farm (10.23 km2, 0.75%) and mobile dunes (8.32 km2, 0.61%) will be flooded. This is a big loss of life and property. Same thing is in petroleum industry, fixed dunes and mangroves and so on (Figure 6). Much of the Apodi coast is backed by the open water of coast and faces the open Atlantic's moderate-to high wave energy and meso-tidal conditions. Potential storm surge is only moderate, but a category of hurricane would flood most of the northern half and a significant portions of the southern half of the Apodi-Mossoró estuary.

123
Figure 6. Risk map for Apodi-Mossoró estuary, Northeast Brazil. Zones are relative risk for property damage from a 1m to 10m sea level rise and hazards. Such maps can be generated relatively quickly and inexpensively from geo-indicators evaluation.
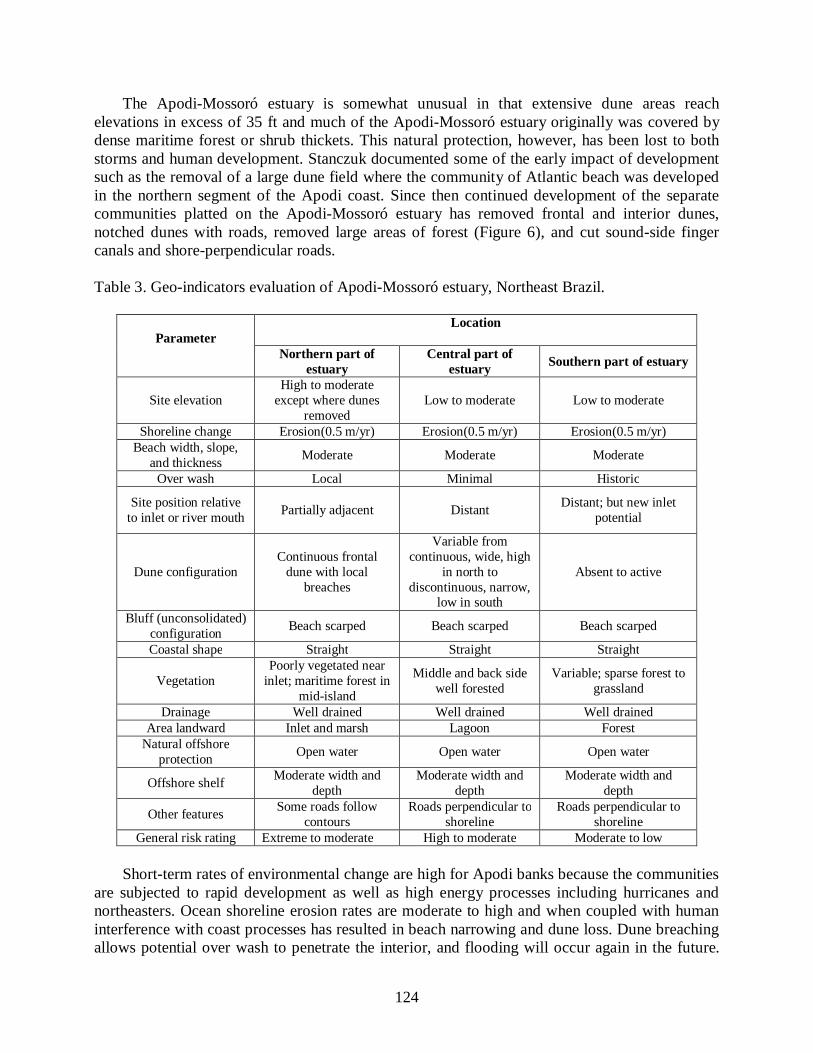
124
The Apodi-Mossoró estuary is somewhat unusual in that extensive dune areas reach elevations in excess of 35 ft and much of the Apodi-Mossoró estuary originally was covered by dense maritime forest or shrub thickets. This natural protection, however, has been lost to both storms and human development. Stanczuk documented some of the early impact of development such as the removal of a large dune field where the community of Atlantic beach was developed in the northern segment of the Apodi coast. Since then continued development of the separate communities platted on the Apodi-Mossoró estuary has removed frontal and interior dunes, notched dunes with roads, removed large areas of forest (Figure 6), and cut sound-side finger canals and shore-perpendicular roads.
Table 3. Geo-indicators evaluation of Apodi-Mossoró estuary, Northeast Brazil.
Parameter
Location
Northern part of estuary
Central part of estuary Southern part of estuary
Site elevation High to moderate
except where dunes removed
Low to moderate Low to moderate
Shoreline change Erosion(0.5 m/yr) Erosion(0.5 m/yr) Erosion(0.5 m/yr) Beach width, slope,
and thickness Moderate Moderate Moderate
Over wash Local Minimal Historic
Site position relative to inlet or river mouth Partially adjacent
Distant
Distant; but new inlet potential
Dune configuration Continuous frontal
dune with local breaches
Variable from continuous, wide, high
in north to discontinuous, narrow,
low in south
Absent to active
Bluff (unconsolidated) configuration Beach scarped Beach scarped Beach scarped
Coastal shape Straight Straight Straight
Vegetation Poorly vegetated near
inlet; maritime forest in mid-island
Middle and back side well forested
Variable; sparse forest to grassland
Drainage Well drained Well drained Well drained Area landward Inlet and marsh Lagoon Forest
Natural offshore protection Open water Open water Open water
Offshore shelf Moderate width and depth
Moderate width and depth
Moderate width and depth
Other features Some roads follow contours
Roads perpendicular to shoreline
Roads perpendicular to shoreline
General risk rating Extreme to moderate High to moderate Moderate to low
Short-term rates of environmental change are high for Apodi banks because the communities are subjected to rapid development as well as high energy processes including hurricanes and northeasters. Ocean shoreline erosion rates are moderate to high and when coupled with human interference with coast processes has resulted in beach narrowing and dune loss. Dune breaching allows potential over wash to penetrate the interior, and flooding will occur again in the future.
125
Locally, the potential for inlet migration or new inlet formation is high. The entire Apodi-Mossoró estuary of Apodi banks needs continuous monitoring of risk potential as well as evaluation of site specific changes (Table 3). Geo-indicators provide a method for such monitoring, and a basis for mitigation.
General risk maps were produced for Apodi estuary based on elevation and forest cover (for example, Figure 6). Such maps may be derived quickly from satellite image, topographic maps, and landuse models for elevations and flood zones, and air photos or field observation for vegetation type and cover. For more specific evaluation, Table 2 & 3 illustrates the application of geo-indicators to Apodi-Mossoró estuary as applied to Apodi-Mossoró estuary, Northeast Brazil. The same parameters can be applied at a specific site to rank the risk and identify specific parameters to modify for mitigation.
Figure 6 illustrates Apodi-Mossoró estuary in its entirety with examples of the problems revealed by geo-indicators, and suggestions for corresponding mitigation. As Figure 6 implies, mitigation actions may range from regional to site-specific. For example, a road cut through a dune could result in a high probability of over wash or inlet formation if on a narrow part of the study area. Plugging the dune gap and reorienting the road would be a simple mitigation procedure to reduce the risk potential at this site or island segment. Building both frontal and interior dunes, restoring native vegetation, inlling finger canals, and nourishing beaches are neighborhood or community-scale approaches to restoring natural stabilization. More conventional approaches such as retrofitting, elevating, or relocating buildings is required for development in moderate-to-high-hazard zones (Figure 6).
4.2 Socio-economic impacts In economic development aspects, continuing development will increase the flood risk and the impacts from inundation. Salt marshes, shrimp farms and beaches will decline or be lost, because they are unable to maintain elevation relative to sea-level rise, or to migrate landwards. Combining this sócio-economic scenario with the maximum inundation level generates a future which is likely to be the worst-case situation.
Under sustainability scenario, integrated coastal zone management (ICZM) and appropriate planning, including avoiding development in the flood plain around the wetland and on the dunes, will minimize the flood risk. Managed realignment will lead to a large expansion in salt marshes, shrimp farms and related intertidal habitats, which has additional benefits for flood-control (Dwarakish & Usha Natesan 2002). In combination with the minimum inundation level, these scenarios correspond to the best-case situation for the region. 5. Response strategies and adaptation To prevent coastal land loss, some options which could be applied in Apodi-Mossoró estuary are the construction of seawalls and beach nourishment. These are well known techniques and have been extensively discussed in the context of sea-level rise (Nicholls et al. 1995). It is obvious that the cities at risk, such as Areia Branca and Grossos would need to be protected by seawalls and dikes. Most of the harbours need upgrading. To ensure effective protection, the seawalls must be much longer than the protected coastline length. Despite the high cost, seawall construction is one option to prevent sócio-economic damage in the cities, including relocation of the population. The most useful option to preserve unique and valuable natural ecosystems would be the hardening of headlands to avoid coastline straightening. This method can be applied in the
126
areas where we have nothing to lose on the shores of bays behind the headlands. Hardening of headlands will result in much stronger erosion of bays. In the areas where this option is not applicable losses of unique ecosystems seem to be inevitable.
In view of the severe losses due to sea-level rise, together with the extensive expansion in the development of the region, response strategies identifying the most appropriate adaptation options must be developed. Regarding the coastal wetland, even if important autonomous adaptations could occur, mainly under the sustainability scenario, the response to sea-level rise will also require planned adaptation (Klein & Nicholls 1998). The most useful option to preserve this valuable ecosystem is to continue the efforts of rehabilitation and management initiated in the framework of the new coastal wetland projects, and to declare this wetland as a protected area. Indeed, if the wetland evolves under natural conditions, without any concrete structures, its potential for migration on to adjacent low-lying uplands, allows it to grow with the sea. GIS information bases represent the first phase of a planned adaptation process.
On the short-term scale, the best option available for the adaptation of the city coast to rising sea level could be periodic beach nourishment, associated with breakwaters and dune afforestation, which would protect tourist resorts at risk from erosion and inundation. Building of seawalls is a high cost option; it would be used only for some settlements at direct risk of inundation. It is well known that such hard structures have adverse environmental impacts.
In the medium term, an ICZM plan must be adopted to include building regulation, urban growth planning, development of institutional capacity, and increasing public awareness (Snoussi & Tabet Aoul 2000). This plan should actively involve the local communities and the stake-holders. As such, engagement with climate change and implementation of policy response will be more effective (Shackley & Deanwood 2003). The ICZM plan should also deal with impacts from both climatic and non-climatic change, ensuring that coastal development will not increase the vulnerability of the region.
Finally, the sandy beaches of Apodi-Mossoró estuary need to be protected by beach nourishment, as the coastal area in Northeast Brazil are usually located at a distance from the shoreline today; there are only a few areas where retreat would be the most reasonable adaptation option. 6. Conclusion As a result of the present analysis, it can be concluded that a sea-level rise of 1m would result in considerable changes in coastal ecosystems and would lead to significant economic hazards. In particular, different regions of Northeast Brazil would suffer from different reasons. Increasing erosion and changes in the sedimentation would cause serious disturbance for sandy beaches and dunes, particularly in north and central part of Apodi-Mossoró estuary. In addition, vanishing sandy beaches will have a negative impact on recreation. Even, the direct destruction of the coast will not be so strong. Although seashore plant and animal communities would migrate in land, the interaction of changing water level and land use would result in the decrease of species richness.
The economic hazards will be the highest in the urban areas, particularly in Mossoró, Areia Branca and Grossos city, where roads, houses and other constructions are often very close to the present shoreline. These results draw attention towards the importance of upgrading awareness of decision-makers and planners to the potential future impacts of sea-level rise on this region. However, to be more complete, this study should include other assessments. In particular, it is recommended that:

127
(1) The impact of sea-level rise on freshwater resources, including the saltwater intrusion and water logging problems should be considered;
(2) Vulnerability assessments should include detailed socioeconomic impacts, together with evaluation of the costs of these impacts and those of the adaptation measures; and
(3) Response strategies should be based upon an ICZM approach for long-term sustainable development.
(4) Further authors should take into account that coastal structures produce very negative effects such as armouring, coastal “squeeze”, long term erosion of beaches and areas in front of structures, low coastal scenery evaluation and problems to bathers security.
References Bruun, P., 1962. Sea-level rise as a cause of shore erosion. Journal of Waterways and
Harbors Division, ASCE, New York 88, 117e130. Burrough P.A., Mc Donnel R.A. 1998. Principles of geographical information systems. New
York: Oxford University Press. Chaves M.S. & Vital H., 2001. Impactos ambientais na zona costeira do Campo
PetrolíferoMacau-5, Macau-RN. In: Congresso Brasileiro de P&D em Petróleo e Gás, 1, UFRN –SBQ Regional RN, Natal, Anais, p. 222
Dwarakish G.S. & Natesan, U., 2002. Coastal Structures Vs Shoreline Configuration. NITK Research Bulletin 2002;11(3):25–33.
Hands, E.B., 1983. The Great Lakes as a test model for profile responses to sea level changes. In: Komar, P.D. (Ed.), Handbook of Coastal Processes and Erosion. CRC Press, Boca Raton, FL, pp. 167–189.
Holman, I.P., Rounsevell, M.D.A., Shackley, S., Harrison, P.A., Nicholls, R.J., Berry, P.M., Audsley, E., 2005. A regional, multisectoral and integrated assessment of the impacts of climate and sócio- economic change in the UK. Part I. Methodology. Climate Change 71, 9e41.
IDEMA, 1999. Informativo Municipal: Areia Branca. Secretaria de Planejamento e Finanças,Instituto de Desenvolvimento Econômico e Meio Ambiente-IDEMA,p.1-16.
IPCC. 2007. Fourth Assessment Report. Intergovernmental Panel on Climate Change Secretariat. Genebra, Switzerland. http://www.ipcc.ch/
Kay, R. & Alder, J., 1999. Coastal Planning and Management. E & FN Spon, London: 375 p.
Klein, R.J.T., Nicholls, R.J., 1998. Coastal zones. In: Feenstra, J.F., Burton, I., Smith, J.B., Tol, R.S.J. (Eds.), Handbook on Methods for Climate Change Impact Assessment and Adaptation Strategies. UNEP/Institute for Environmental Studies, Nairobi/Amsterdam, 35 pp.
Koppen, W. 1948. Climatologia: Um Estúdio de los Climasde la Tierra. Versión de Pedro R. Henrichs. México, Fondo de Cultura Econômica, 478
Lillesand Thomas M, Kiefer Ralph W, Chipman Jonathan W. 2004. Remote sensing and image interpretation. New York: John Wiley and Sons Publications.
Mafra, L. C. A. 2002. Caracterização Geológica e Geomorfológica do Município de Porto do Mangue / RN, com Vista à Elaboração do Mapa de Sensibilidade Ambiental ao Derramamento do Óleo. Natal - UFRN/DG – Relatório de Graduação.
Mimura, N., 1999. Vulnerability of island countries in the South Pacific to sea level rise and climate change. Climatic Research 21, 137– 143.
128
Nicholls, R.J., Mimura, N., 1998. Regional issues raised by sealevel rise and their policy implications. Climatic Research 11, 5 –18.
Nicholls, R.J., Leatherman, S.P., Dennis, K.C., Volonte, C.R., 1995. Impacts and responses to sea-level rise: qualitative and quantitative assessments. In: Nicholls, R.J., Leatherman, S.P. (Eds.), Journal of Coastal Research, Special Issue, vol. 14. The Coastal Education and Research Foundation (CERF), Fort Lauderdale, FL, pp. 26– 43.
Peltier, W.R., 1999. Global sea level rise and glacial isostatic adjustment. Global and Planetary Change 20, 93– 123.
Pilkey, O.H.; Young, R.S.; Riggs, S.R.; Smith, A.W.S.; Wu, H., and Pilkey, W.D., 1993. The concept of shoreface profile of equilibrium, a critical review. Journal of Coastal Research, 9(1), 255-278.
Radambrasil, 1981. Levantamento de Recursos Naturais Geologia/Geomorfologia/ Pedologia/Vegetação/Uso Potencial da Terra. Rio de Janeiro/RJ: Ministério das Minas e Energia, v. 23 – Folhas SB. 24/25 – Jaguaribe/Natal, 740p.
Shackley, S., Deanwood, R., 2003. Constructing social futures for climatechange impacts and response studies: building qualitative and quantitative scenarios with participation of stakeholders. Climate Research 24, 71e90.
Snoussi, M., Tabet Aoul, E.H., 2000. Integrated coastal zone management programme, northwest African region case. Ocean & Coastal Management 43, 1033e1045.
Stanczuk DT. E!ects of development on barrier island evolution, Bogue Banks, North Carolina. Unpublished Master's Thesis, Duke University, Durham, NC, 1975:126 pp.
Vital H., Samia F. and Moab P. G. 2010. Response of the Apodi-Mossoró estuary- incised valley system (NE Brazil) to sea-level fluctuations. Brazilian journal of Oceanography, 58 (special issue PGGM): 13-24.
Warrick, R.A., Le Provost, C., Meier, M.F., Oerlemans, J., Woodworth, P.L., 1996. Changes in sea level. In: Houghton, J.T., Meira Filho, L.G., Callander, B.A., Harris, N., Kattenberg, A., Maskell, K. (Eds.), Climate Change 1995. The Science of Climate Change. Cambridge University Press, Cambridge, UK, pp. 365e405.
Zerbini, S., Plag, H.-P., Baker, T., Becker, M., Billiris, H., Bu¨rki, B., Kahle, H.-G., Marson, I., Pezzoli, L., Richter, B., Romagnoli, C., Sztobryn, M., Tomasi, P., Tsimplis, M., Veis, G., Veronne, G., 1996. Sea level in the Mediterranean: a first step towards separating crustal movements and absolute sea-level variations. Global and Planetary Change 14, 1 – 48.

129
5.4 Conclusão
Os resultados obtidos nestes estudos demonstraram elevado grau de precisão quanto às
observações e as descrições feitas para o estuário Apodi-Mossoró e deveria se constituir numa
base de informações para o apoio aos programas de Gerenciamento Integrado da Zona Costeira
para o RN. No entanto, as conclusões aqui apresentadas devem ser cuidadosamente consideradas
sempre lembrando que se trata de um modelo de realidade e não da própria realidade. A validade
dos resultados obtidos através deste método é limitada: à área de estudo (alterando a área
analisada, os valores das variáveis podem ser notavelmente ampliados e/ou reduzidos); o grau de
compreensão dos sistemas integrados escolhidos para a região (ou seja, do conjunto integrado de
fenômenos interdependentes que se estruturaram para executar uma função); à caracterização das
variáveis escolhidas e da sua importância relativa, refletidas nas ponderações; aos erros inerentes
das técnicas de Geoprocessamento (relacionada com a idade dos dados, densidade de observação,
os sistemas de classificação adtoados, precisão de posições espaciais e interpolação de pontos ou
de dados lineares em limites de polígonos, que podem não ter exatamente as mesmas dimensões).
Naturalmente, não é possível garantir a identificação e a ponderação exata de todos os processos
ou parâmetros que determinam as vulnerabilidades costeira e o risco ambiental em se tratando
dos fenômenos globais de alterações climáticas. Como descrito, algumas variáveis-chave que são
desejáveis para a determinação da vulnerabilidade e do risco não estiveram disponíveis para a
área de estudo no momento da realização da pesquisa.
Contudo, os dados mostraram para a área de estudo que há setores/fatores no estuário que
necessitam de atenção urgente das autoridades, são aqueles: (i) as áreas de altimetria baixas, isto
é, áreas em extensão às planícies de maré, estuarinas e zona de inundação, (ii) a falta de dados
climáticos e hidrográficos de alta resolução (por exemplo, registros local das marés) e longo
prazo; (iii) as altas taxas de erosão incremental (por exemplo, aquelas instaladas a médio e longo
prazo que já atuam na retirada do litoral). No entanto, ainda permanece difícil de se contar que
hajam informações confiáveis sobre essas variáveis disponíveis no futuro próximo impondo aos
modelos, portanto, algumas limitações para uma avaliação de vulnerabilidade estritamente
quantitativa. É importante ressaltar que o método proposto também permite flexibilidade para a
utilização de uma vasta gama de dados como aqueles analisados e sugeridos no Capítulo 2,
portanto, outros indicadores podem ser adicionado ao métodos, à medida que as informações se
tornam mais e melhor disponíveis.
130
Como discutido desde o princípio desta Tese de Doutorado, a vulnerabilidade é definida
por uma combinação de variáveis sociais, físicos e ambientais que podem mudar ao longo do
tempo, em escalas de observação mais curtas ou mais longas. Portanto, a atual vulnerabilidade
(expresso em valores de IVC) não deve ser considerada como constante, pois as variáveis tendem
a mudar no tempo. Alterações nas causas sociais da vulnerabilidade frequentemente acontecem
muito mais rapidamente (por exemplo, em algumas décadas) que muitas mudanças ambientais.
Outros estudos possíveis, se destinam a avaliar e prever as alterações na morfologia costeira
(sistema de ilhas barreiras, praias e dunas) e nos ecossistemas de manguezal em escalas temporais
de décadas a um século. É por isso que modificações futuras seria de esperar no Nordeste do
Brasil, a curto e longo prazo, na distribuição espacial de riscos naturais e um resultante aumento
na magnitude da vulnerabilidade costeira, considerando os cenários de mudanças climáticas e de
desenvolvimento socioeconômico futuros. Assim, uma atualização da primeira análise,
apresentada aqui, deve ser feito periodicamente (por exemplo, a cada 10 anos).
Mesmo se considerando as deficiências dos resultados, a ausência de algumas variáveis
essenciais e as incertezas das mudanças climáticas e dos cenários socioeconômicos ficou
demonstrado a importância da avaliação da vulnerabilidade desta zona costeira e estuarina a
perigos naturais diante das alterações climáticas globais, possível com a elaboração do IVC.
Nessa abordagem, tais investigações são perspectivas básicas para a elaboração do
Gerenciamento Integrado da Zona Costeira, ou seja, a consideração sobre os aspectos de
vulnerabilidade e risco ambiental são elementos fundamentais na elaboração e implementação de
diretrizes de gestão costeira e para o desenvolvimento de políticas de alívio de desastres
eventuais. Em países como o Brasil, algumas respostas aos impactos de desastres naturais, tanto
técnicas quanto institucionais, podem demorar décadas para serem tomadas de modo eficaz.
Contudo, sabe-se que é crucial, em região de desenvolvimento acelerado como a zona costeira do
Nordeste do Brasil, a elaboração de opções de adaptação e o início da implementação das
atividades de mitigação, mesmo diante de algumas lacunas de informação e de conhecimento
sobre os sistemas operantes.
131
Capítulo VI: Avaliação dos Impactos das Mudanças Climáticas e as Ações de
Mitigação sobre o Ecossistema Estuarino
6.1 Introdução
No estuário Apodi-Mossoró várias decisões podem ser tomadas para avaliar as atividades
de adaptação às alterações climáticas e a mitigação dos impactos. O conjunto de decisões incluem
a análise de custo-benefício, a análise de custo-efetividade e a abordagem do exercício da
política. A análise de decisão, que poderá ser particularmente atraente para as avaliações de
adaptação setorial e regional, pode ser realizada com critérios únicos ou múltiplos para fornecer
as bases conceituais para a gestão dos riscos tecnológicos, sociais ou ambientais, que fazem parte
da avaliação de risco (IPCC, 2002). Algumas das possibilidades incluem:
O controle do desmatamento de áreas do estuário decorrente da invasão da
industrialização sobre os ecossistemas frágeis à conservação da diversidade biológica, o combate
à desertificação e à seca. Uma questão-chave é o grau em que os indicadores podem ser
adaptados e implementados para avaliar as implicações de adaptação e mitigação dessas
atividades na área de estudo.
A coerência com que os critérios e indicadores reconhecidos internacionalmente para
a gestão sustentável das florestas e agricultura, podem ser aplicados à área de estudo. Estes
critérios e indicadores que devem ser adaptados e desenvolvidos para proporcionar uma melhor
orientação em nível local, com relação às práticas de manejo agrícola e florestal em diferentes
regiões do nordeste do Brasil. Estes critérios e indicadores são geralmente:
1) Conservação da diversidade biológica,
2) Manutenção da saúde dos ecossistemas;
3) A manutenção das florestas terrenos agrícolas e da contribuição para os ciclos globais
de carbono,
4) Manejo integrado do solo e da água;
5) Manutenção e melhoria, a longo prazo, dos vários benefícios socioeconômicos devido
às florestas e terras agrícolas para atender às necessidades da sociedade.

132
6.2 Fatores Específicos que Influenciam o Risco
Os fatores específicos locais são os indicadores primários sobre os perigos de danos
materiais (por exemplo, erosão, inundações e seca). O tipo de linha de costa em vigor em
qualquer área em particular é uma função do tipo de rocha ou sedimento, a ser depositado ou
formações erodidas pelas ondas, o sentido dominante das ondas, altura das ondas, a magnitude
das marés e a influência antropogênica na área de estudo.
No estuário Apodi-Mossoró os geo-indicadores podem ser divididos em grupos, incluindo
os parâmetros gerais (altitude, vegetação), os parâmetros de linha de costa (taxa de erosão, da
largura de praia, declive e espessura configuração de dunas, presença e tipos de engenharia
costeira), os parâmetros de entrada (distância da boca de entrada do rio), formação e potencial de
migração dos sedimentos, os parâmetros interior (configuração de dunas interiores, drenagem,
solos), entre outras características (Tabela 6.1).
Tabela 6.1 - Geo-indicadores de risco do litoral.
GEO-INDICADORES
CATEGORIA DE RISCO DE DANOS PARA O ESTUÁRIO APODI-MOSSORÓ EM MATERIAIS INCONSOLIDADOS ERODÍVEIS
ALTO RISCO RISCO MODERADO BAIXO RISCO Parâmetros Gerais
Elevação <3 m 3-6 m > 6 m
Vegetação Estéril, esparsos;
derrubado; espécies não-nativas
Arbustos bem estabelecidos
e gramíneas; nenhum derrubado
Arborizadas; vegetação madura, sem evidências de erosão na vegetação
Parâmetros da Linha de Costa
Condições Offshore Plataforma grande e
larga; rasa; alta energia das ondas
Plataforma de largura moderada; restingas
Protecção natural (recifes, barras)
Taxa de erosão Severa Estável Acreção
Largura, declividade e espessura de praia
Estreitas e íngremes; fina com lama exposta,
turfa, ou em tocos, fornecimento de areia
pobres
Moderada a estreita largura da praia seca;
potencial de interrupção do fornecimento de areia
Larga e plana, com berma bem
desenvolvida, a oferta de areia boa
Configuração de Dunas Não há dunas Baixa, ou dunas
descontínuos Altas, de largura,
contínua Sobre-lavagem Freqüentes Ocasionais Não ocorre Estruturas de engenharia
Numerosos; paredões; quebra-mares offshore Na praia Não há estrutura
Parâmetros de Entrada Local em relação à foz
do rio Muito perto À vista Muito distante
Entrada potencial Ilha estreita, baixa, com água aberta no
lado da terra; entrada
Moderado largura e elevação de água se abre no lado da terra; canais
Ilha larga; águas abertas pouco aquém, ou amplo
pântano, sem canais
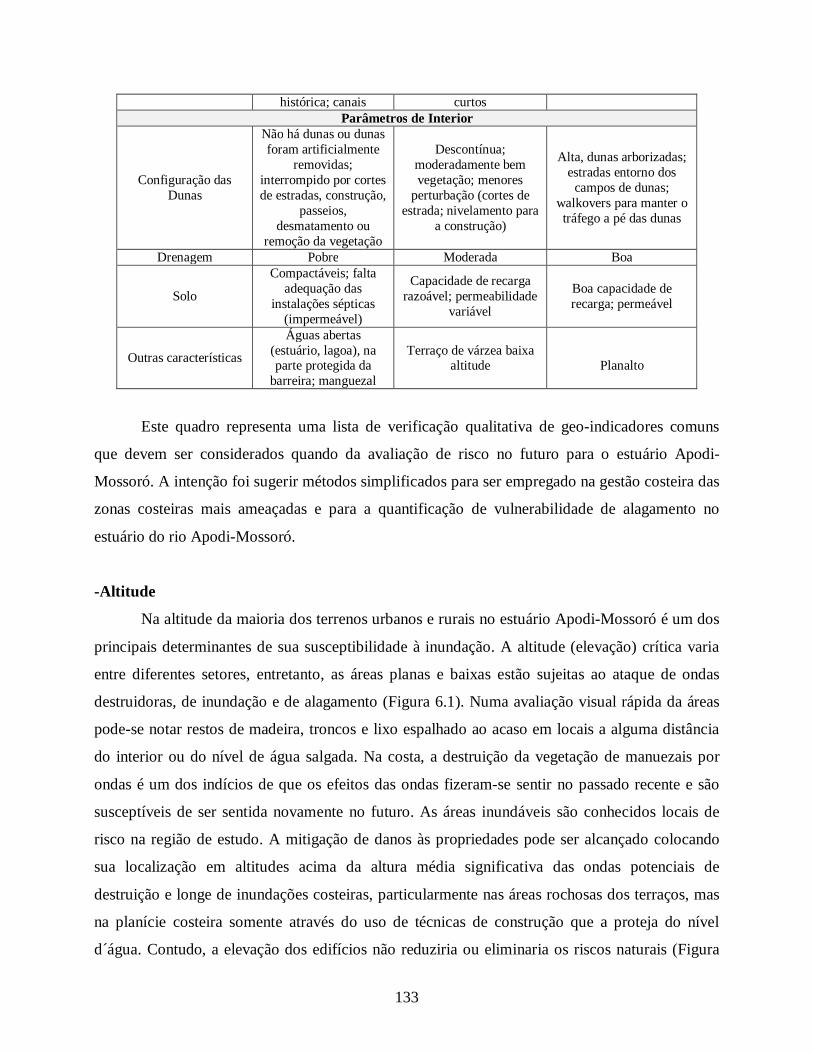
133
Este quadro representa uma lista de verificação qualitativa de geo-indicadores comuns
que devem ser considerados quando da avaliação de risco no futuro para o estuário Apodi-
Mossoró. A intenção foi sugerir métodos simplificados para ser empregado na gestão costeira das
zonas costeiras mais ameaçadas e para a quantificação de vulnerabilidade de alagamento no
estuário do rio Apodi-Mossoró.
-Altitude
Na altitude da maioria dos terrenos urbanos e rurais no estuário Apodi-Mossoró é um dos
principais determinantes de sua susceptibilidade à inundação. A altitude (elevação) crítica varia
entre diferentes setores, entretanto, as áreas planas e baixas estão sujeitas ao ataque de ondas
destruidoras, de inundação e de alagamento (Figura 6.1). Numa avaliação visual rápida da áreas
pode-se notar restos de madeira, troncos e lixo espalhado ao acaso em locais a alguma distância
do interior ou do nível de água salgada. Na costa, a destruição da vegetação de manuezais por
ondas é um dos indícios de que os efeitos das ondas fizeram-se sentir no passado recente e são
susceptíveis de ser sentida novamente no futuro. As áreas inundáveis são conhecidos locais de
risco na região de estudo. A mitigação de danos às propriedades pode ser alcançado colocando
sua localização em altitudes acima da altura média significativa das ondas potenciais de
destruição e longe de inundações costeiras, particularmente nas áreas rochosas dos terraços, mas
na planície costeira somente através do uso de técnicas de construção que a proteja do nível
d´água. Contudo, a elevação dos edifícios não reduziria ou eliminaria os riscos naturais (Figura
histórica; canais curtos Parâmetros de Interior
Configuração das Dunas
Não há dunas ou dunas foram artificialmente
removidas; interrompido por cortes de estradas, construção,
passeios, desmatamento ou
remoção da vegetação
Descontínua; moderadamente bem vegetação; menores
perturbação (cortes de estrada; nivelamento para
a construção)
Alta, dunas arborizadas; estradas entorno dos
campos de dunas; walkovers para manter o tráfego a pé das dunas
Drenagem Pobre Moderada Boa
Solo
Compactáveis; falta adequação das
instalações sépticas (impermeável)
Capacidade de recarga razoável; permeabilidade
variável
Boa capacidade de recarga; permeável
Outras características
Águas abertas (estuário, lagoa), na parte protegida da
barreira; manguezal
Terraço de várzea baixa altitude
Planalto

134
6.1). O resultado apresentado pelos mapas de vulnerabilidade e de risco costeiro desta pesquisa
seria útil à política futura de seleção de locais protegidos desses desastres ambientais.
Figura 6.1 - A situação geral das áreas de baixa altitude no estuário do rio Apodi-Mossoró.
Foto: Ramos Ivanízio.
- Vegetação
Em geral, uma densa cobertura vegetal em encostas é um bom indicador de estabilidade e
potencial baixo de risco, exceto em áreas tropicais. Quanto à cobertura vegetal da região de
estudo, sobretudo próximo ao litoral, pode ser considerado um incômodo quando ela obstrui a
vista para o mar; no entanto, a vegetação natural é um trunfo e deve ser conservada. O mesmo
para a presença de grama, arbustos e árvores altas de pós-praia. Este fato para o estuário Apodi-
Mossoró sugere baixo potencial à erosão e à intrusão de água salgada.
O mesmo no caso de manguezais ao longo das costas baixas (Figura 6.2). Manguezais
desenvolvem-se apenas nas planícies de maré e/ou estuarinas, setores de muito baixa altitude,
onde a vegetação floresce tolerante à alta salidade. No entanto, esta vegetação também indica o
passado da presença de áreas alagáveis. Os manguezais protegem a costa e são a proteção contra
ondas e vento (YOUNG et al., 1993). Ainda no estuário Apodi-Mossoró algumas áreas costeiras

135
mostram trechos por vezes em acreção, e a retirada natural ou artificial dos manguezais colocarão
o trecho rapidamente em instabilidade. A remoção de manguezais é garantia de erosão costeira. A
vegetação também é um defletor importante do escoamento superficial, uma excelente armadilha
para os sedimentos, todos fatores de redução do potencial de risco a erosão. A cobertura vegetal
nas partes protegidas das ilhas barreiras e ao longo do estuário, lagunas e nas encostas de
remansos exercem o mesmo papel de proteção na área de estudo. Quando interferências
antropogências são efetivadas sem os estudos adequados dos aspectos ambientais, os desastres
em períodos de eventos catastróficos são comuns (Figura 6.2).
A mitigação mais apropriada para a área de estudo seria melhor alcançada por meio de
regulamentações que impediriam (ou limitariam) a remoção da vegetação nativa. Também
indicariam a (re) vegetação dos campos de dunas móveis e o pós-praia com ervas naturais
sugerindo técnicas eficazes para as com dições meteorológicas da região, com vista a
restabeleceram a proteção ao risco de erosão nas baía e praias (BUSH et al., 1996).
Figura 6.2 - A vegetação como uma barreira a proteção natural no estuário do rio Apodi-
Mossoró, mas que foi alterado pela construção de estrada sem acompanhamento adequado das condições ambientais.
- Exposição às Ondas
Na área costeira, de água aberta, a linha de costa está em contato direto com as ondas
fortes. As propriedades em frente a linha de prais ou de outros corpos d´água restritos (por

136
exemplo, baías protegidas, lagoas, estuários) estão em risco de ações das forçantes
hidrodinâmicas (ondas e correntes de marés), o que pode causar grandes perdas econômicas em
épocas de fortes chuvas (enchentes) como no caso da linha de costa dos municípios de Grossos e
Apodi (Figura 6.3).
Figura 6.3 – Ação de ondas e correntes de maré na destruição de limites estuarinos, em épocas de eventos catastróficos, afetando trechos estuarinos com manguezais já impactados pela construção
da estrada entre Grossos-Tibau, no estuário Apodi-Mossoró. Foto: Telma Vieira.
No entanto, as massas de água, tais como lagoas, lagunas, enseadas, estuários, rios e
planícies aluviais associados, sobre a parte terrestre do estuário Apodi-Mossoró, geralmente
indicam potencial de erosão, inundações, ondas e ação de maré alta na formação de entrada de
possíveis novos canais. A presença de barreiras naturais como recifes de coral ou beachrocks
submersos (ou parcialmente em condições de baixa mar), blocos submersos e bancos de areia e
deltas de maré, podem modificar a exposição da linha de costa e assim produzir o amortecimento
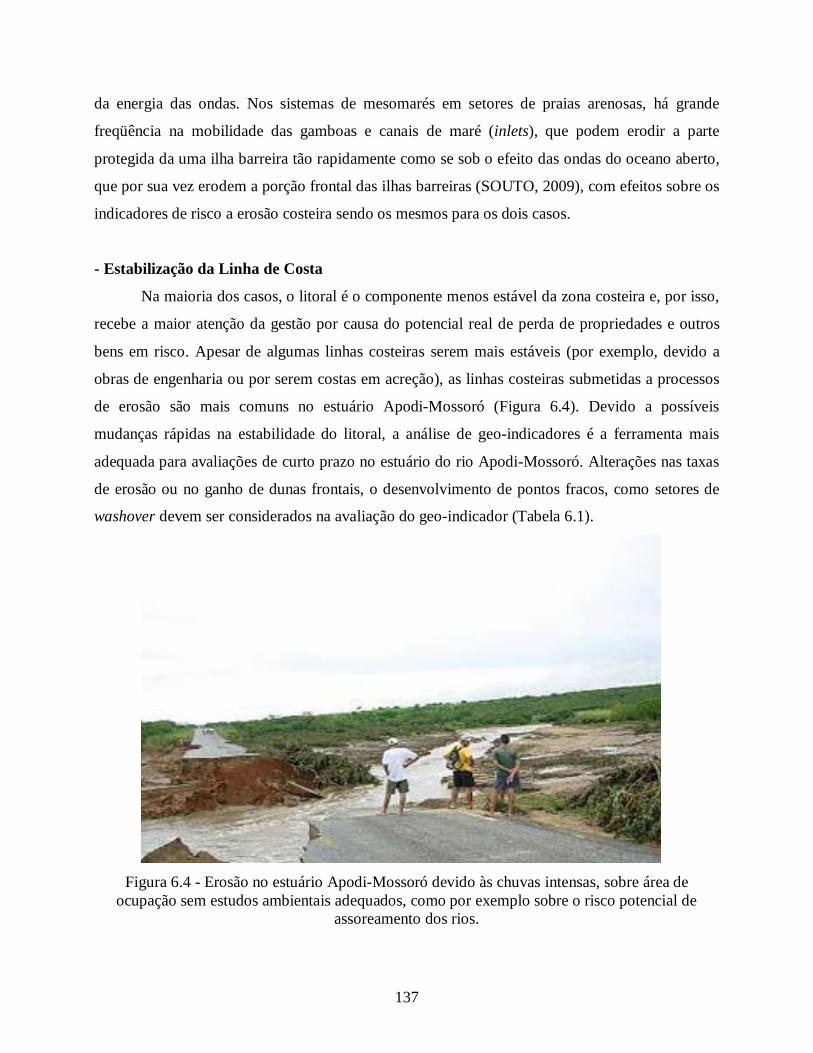
137
da energia das ondas. Nos sistemas de mesomarés em setores de praias arenosas, há grande
freqüência na mobilidade das gamboas e canais de maré (inlets), que podem erodir a parte
protegida da uma ilha barreira tão rapidamente como se sob o efeito das ondas do oceano aberto,
que por sua vez erodem a porção frontal das ilhas barreiras (SOUTO, 2009), com efeitos sobre os
indicadores de risco a erosão costeira sendo os mesmos para os dois casos.
- Estabilização da Linha de Costa
Na maioria dos casos, o litoral é o componente menos estável da zona costeira e, por isso,
recebe a maior atenção da gestão por causa do potencial real de perda de propriedades e outros
bens em risco. Apesar de algumas linhas costeiras serem mais estáveis (por exemplo, devido a
obras de engenharia ou por serem costas em acreção), as linhas costeiras submetidas a processos
de erosão são mais comuns no estuário Apodi-Mossoró (Figura 6.4). Devido a possíveis
mudanças rápidas na estabilidade do litoral, a análise de geo-indicadores é a ferramenta mais
adequada para avaliações de curto prazo no estuário do rio Apodi-Mossoró. Alterações nas taxas
de erosão ou no ganho de dunas frontais, o desenvolvimento de pontos fracos, como setores de
washover devem ser considerados na avaliação do geo-indicador (Tabela 6.1).
Figura 6.4 - Erosão no estuário Apodi-Mossoró devido às chuvas intensas, sobre área de
ocupação sem estudos ambientais adequados, como por exemplo sobre o risco potencial de assoreamento dos rios.

138
Os projetos de engenharia na linha de costa também podem ser indicadores de
instabilidade costeira. Geralmente, as estruturas de engenharia costeira visam travar a erosão
costeira ou proteger os prédios. Tais esforços na zona costeira são concentrados na praia, mas
nem sempre com sucesso, como na praia de Camapum no estuário do Piranhas-Açu, outro
estuário no RN com características semelhantes ao estuário Apodi-Mossoró (Figura 6.5). A
presença de estruturas rígidas de engenharia ou projetos soft, como proteção de dunas e
engordamento artificial da praia, deve ser uma indicação clara diante das questões de
desenvolvimento sustentável em áreas altamente sensíveis como a foz do rio Apodi-Mossoró,
diantes do avanço do nível do mar e demais problemas ambientais relacionados às mudanças
climáticas globais, uma vez que a ocupação urbana está totalmente restrita à pouca área
disponível nas imediações do setor que atualmente é ocupado. Trata-se de uma importante
indicador, diante da eventual possibilidade de deslocamento completo das áreas urbanas em
cenários extremos futuros naquele local.
Figura 6.5 – Praia de Camapum, Macau/RN, Rio Piranhas / Assú em condições de maré alta,
mostrando as dificuldade enfrentadas pelas obras de engenharia na contenção da erosão costeira, sem os estudos ambientais adequados, como por exemplo sobre as forçantes hidrodinâmicas na
região em séries temporais de longo prazo. Foto: Getúlio Moura.
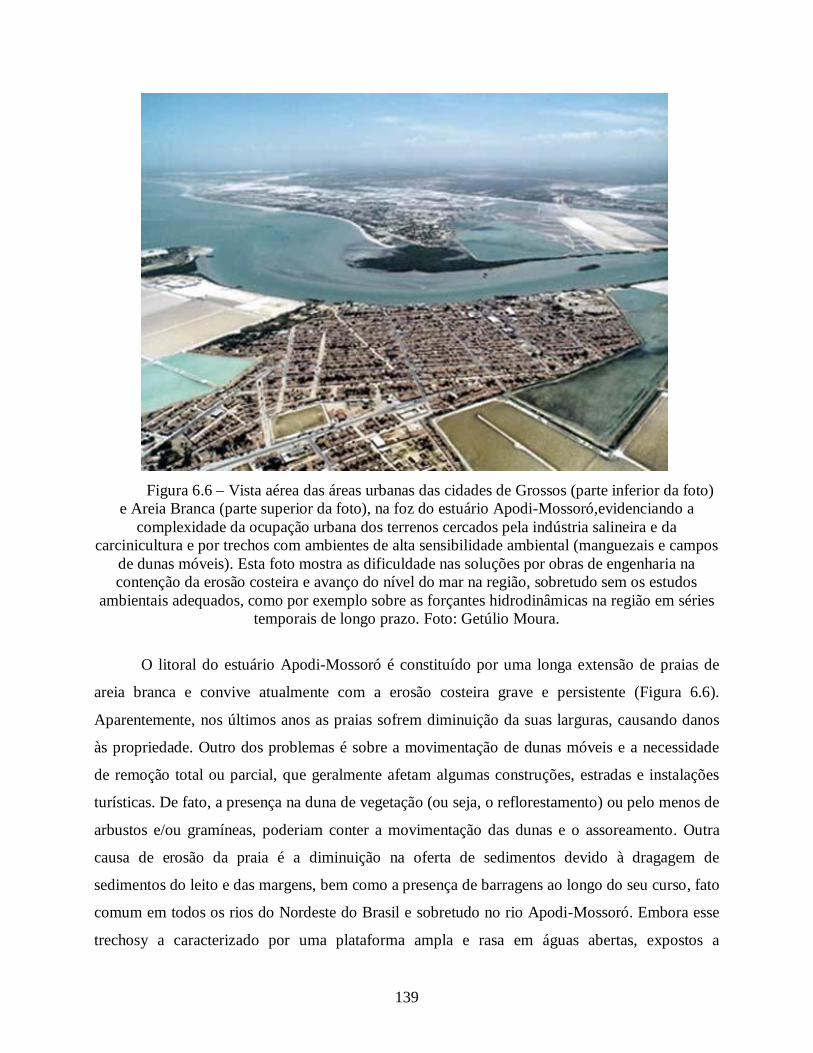
139
Figura 6.6 – Vista aérea das áreas urbanas das cidades de Grossos (parte inferior da foto)
e Areia Branca (parte superior da foto), na foz do estuário Apodi-Mossoró,evidenciando a complexidade da ocupação urbana dos terrenos cercados pela indústria salineira e da
carcinicultura e por trechos com ambientes de alta sensibilidade ambiental (manguezais e campos de dunas móveis). Esta foto mostra as dificuldade nas soluções por obras de engenharia na contenção da erosão costeira e avanço do nível do mar na região, sobretudo sem os estudos
ambientais adequados, como por exemplo sobre as forçantes hidrodinâmicas na região em séries temporais de longo prazo. Foto: Getúlio Moura.
O litoral do estuário Apodi-Mossoró é constituído por uma longa extensão de praias de
areia branca e convive atualmente com a erosão costeira grave e persistente (Figura 6.6).
Aparentemente, nos últimos anos as praias sofrem diminuição da suas larguras, causando danos
às propriedade. Outro dos problemas é sobre a movimentação de dunas móveis e a necessidade
de remoção total ou parcial, que geralmente afetam algumas construções, estradas e instalações
turísticas. De fato, a presença na duna de vegetação (ou seja, o reflorestamento) ou pelo menos de
arbustos e/ou gramíneas, poderiam conter a movimentação das dunas e o assoreamento. Outra
causa de erosão da praia é a diminuição na oferta de sedimentos devido à dragagem de
sedimentos do leito e das margens, bem como a presença de barragens ao longo do seu curso, fato
comum em todos os rios do Nordeste do Brasil e sobretudo no rio Apodi-Mossoró. Embora esse
trechosy a caracterizado por uma plataforma ampla e rasa em águas abertas, expostos a
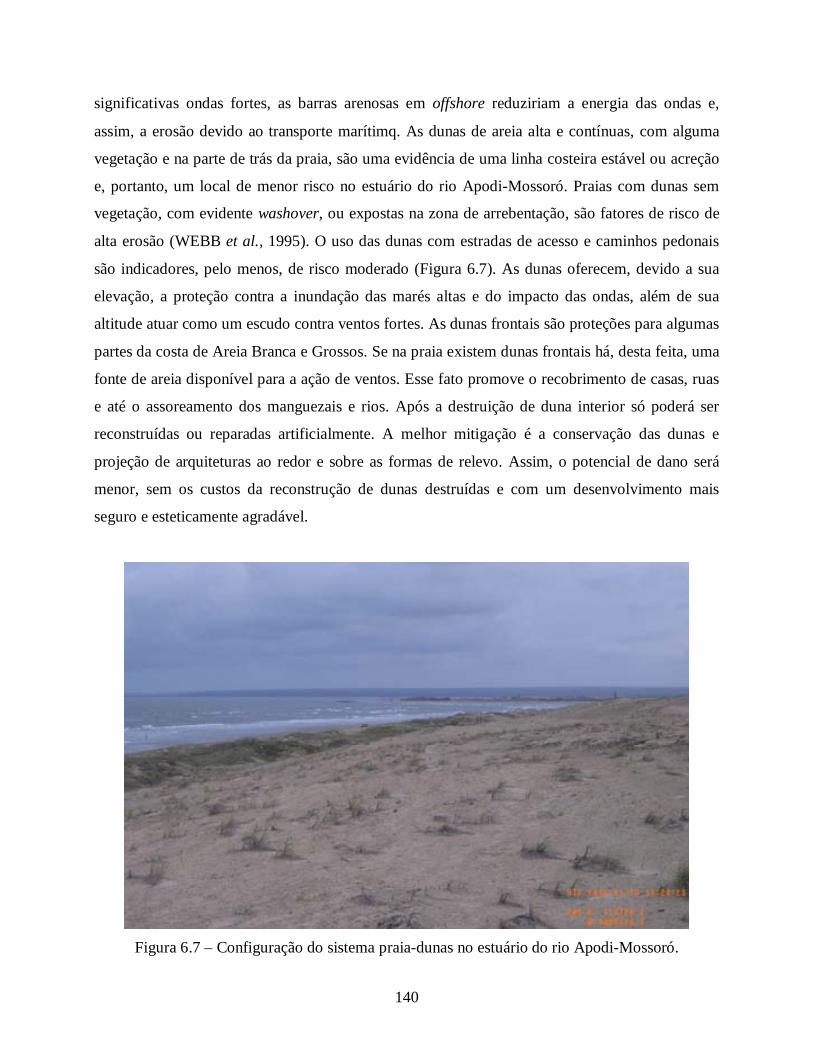
140
significativas ondas fortes, as barras arenosas em offshore reduziriam a energia das ondas e,
assim, a erosão devido ao transporte marítimq. As dunas de areia alta e contínuas, com alguma
vegetação e na parte de trás da praia, são uma evidência de uma linha costeira estável ou acreção
e, portanto, um local de menor risco no estuário do rio Apodi-Mossoró. Praias com dunas sem
vegetação, com evidente washover, ou expostas na zona de arrebentação, são fatores de risco de
alta erosão (WEBB et al., 1995). O uso das dunas com estradas de acesso e caminhos pedonais
são indicadores, pelo menos, de risco moderado (Figura 6.7). As dunas oferecem, devido a sua
elevação, a proteção contra a inundação das marés altas e do impacto das ondas, além de sua
altitude atuar como um escudo contra ventos fortes. As dunas frontais são proteções para algumas
partes da costa de Areia Branca e Grossos. Se na praia existem dunas frontais há, desta feita, uma
fonte de areia disponível para a ação de ventos. Esse fato promove o recobrimento de casas, ruas
e até o assoreamento dos manguezais e rios. Após a destruição de duna interior só poderá ser
reconstruídas ou reparadas artificialmente. A melhor mitigação é a conservação das dunas e
projeção de arquiteturas ao redor e sobre as formas de relevo. Assim, o potencial de dano será
menor, sem os custos da reconstrução de dunas destruídas e com um desenvolvimento mais
seguro e esteticamente agradável.
Figura 6.7 – Configuração do sistema praia-dunas no estuário do rio Apodi-Mossoró.

141
- Entradas (Inlets) e foz de rio
O complexo de praias-dunas no estuário Apodi-Mossoró formam uma foz com fluxo
continental de baixas velocidades, controlados pelo regime de correntes de marés vazantes e
enchentes, em terrenos planos e baixos, com barras e praias arenosas e baías, sob influência das
ondas de mar aberto, o que condiciona um sistema dinâmico de sedimentação em ambos os lados
do relevo (Figura 6.8). Trata-se de um belo local paisagístico, mas com a totalidade dos terrenos
em locais de baixa altitude onde o mar aberto provavelmente atua com washovers, inundações
frequentes e erosões/acreções nos diferentes setores. A mudança para características mais
“acrecionárias”, sobretudo na linha de praia, seriam úteis para a manutenção do ambiente, mas
com monitoramento das direções de transporte de sedimentos predominante ao longo da costa e
detalhes sobre a fonte local de sedimentos (MORELOCK et. al., 1985). Por estar a foz do rio e o
mar compondo um sistema de ilhas barreiras, as condições atuais das ondas são muito dinâmicos,
e por isso são instáveis e migratórias. As linhas de praia nestas áreas, quase sem exceção, são
zonas de alto risco no que diz respeito aos riscos costeiros.
Figura 6.8 - Foz rio Apodi-Mossoró - RN. Foto: João Neto em 24/11/2008.

142
- Drenagens e tipos de solos
Os solos são fatores determinantes de uma boa drenagem e é um dos muitos indicadores
que sugerem menor potencial de risco no estuário Apodi-Mossoró. A drenagem é uma função do
tipo de solo e solo arenoso e sugerem uma boa drenagem, no entanto, os problemas estão nas
camadas argilosas subjacentes à superfície no litoral Apodi-Mossoró. Trata-se de argilas das
porções protegidas das ilhas barreiras ou antigos paleomangues quee bloqueiam a percolação das
águas e o aumento do escoamento superficia causando danos como ravinamento e erosão
vigorosa, além de alagamentos (Figura 6.9).
Figura 6.9 - Alagamentos nas proximidades da foz do estuário do rio Apodi-Mossoró.
- Enchentes do Rio
Devido às condições particularmente baixas da região próxima à foz do rio Apodi, as
inundações ocorrem com freqüência (tempo de recorrência inferior a 10 anos) com altos prejuízos
econômicos como conseqüência de chuvas intensas (Figura 6.10). O rápido aumento do nível das
águas e as enchentes tem uma série de implicações socioeconômico-ambiental para o ambiente
costeiro e estuarino (Figura 6.11). A mitigação seria uma boa drenagem da área alagada que

143
ajudaria a diminuir o risco nas áreas urbanizadas do estuário Apodi-Mossoró (ROSSI; VILLANI,
1994).
Figura 6.10 – Enchente no estuário do rio Apodi-Mossoró e destruição de infraestrutura essencial
(estradas de acesso) por falta de estudos prévios adequados do ambiente.
Figura 6.11 – Enchente no estuário do rio Apodi-Mossoró, mostrando o sangradouro de uma das
barragens ao longo dos princípais rios.
144
- Ondas
Um dos riscos dos mais conhecidos, não só por aqueles que vivem ao longo da costa, está
relacionado ao poder destrutivo das ondas altas, geralmente produzidos por ondas de inverno.
Essas ocorrências causam danos graves e por vezes ao estuário do rio Apodi-Mossoró. A
exposição da costa das cidades costeiras na região (Areia Branca e Grossos) às ondas é bastante
homogêneas, mesmo se algumas diferenças surgem quanto à refração de ondas, que é comum na
região devido ao padrão de ventos e a geometria do litoral, como evidencia a presença de várias
ilhas barreiras e a topografia submarina. A instalação de quebra-ondas é uma opção, mas podem
mudar rapidamente o quadro de balanço sedimentar costeiro, dependendo das condições locais
(por exemplo, declividade de nearshore), e por esse motivo devem ser avaliadas com estudos
costeiros de parâmetros físico-oceanográficos e consequente modelagem numérica antes de
qualquer instalação.
- Estruturas antropogênicas
Estes são considerados como um perigo principal, sobretudo as estruturas que se
integraram às características da costa do Apodi-Mossoró ao longo do tempo e, portanto, capazes
de gerar efeitos sobre a dinâmica costeira. As estruturas antropogênicas estão distribuídos em
toda a área de estudo, nas unidades geomorfológicas de baixa altimetria e de maior risco. Trata-se
de edifícios, tanques (salinas e carcinicultura), bases de exploração de óleo e as infraestruturas
ligadas a essas, como estradas, pontes e outros serviços instalados no estuário e nas proximidades
do litoral. Em algumas áreas, o impacto vem da engenharia de estruturas próximas ao litoral
destinadas a defender a costa contra a erosão. Essas estruturas podem aumentar o perigo no litoral
adjacente desprotegido. Também o aumento do tráfego marítimo no porto e as melhorias
contínuas que tem sido feitas para a infraestrutura portuárias para águas mais profundas de
amarração e ancoragem de navios de grande porte. Construções foram erguidas em áreas de
dunas e destruíram a vegetação, e consequentemente, canais foram abertos para distribuição de
água/energia e outras obras implantadas contra a subsidência e a erosão costeira, como a
montagem de estruturas como muros de contenção, esporões e quebra-mares, que infelizmente
não tem sido tão eficientes em casos de eventos extremos na região de estudo, que provocam
danos com secas ou enchentes (Figura 6.12).
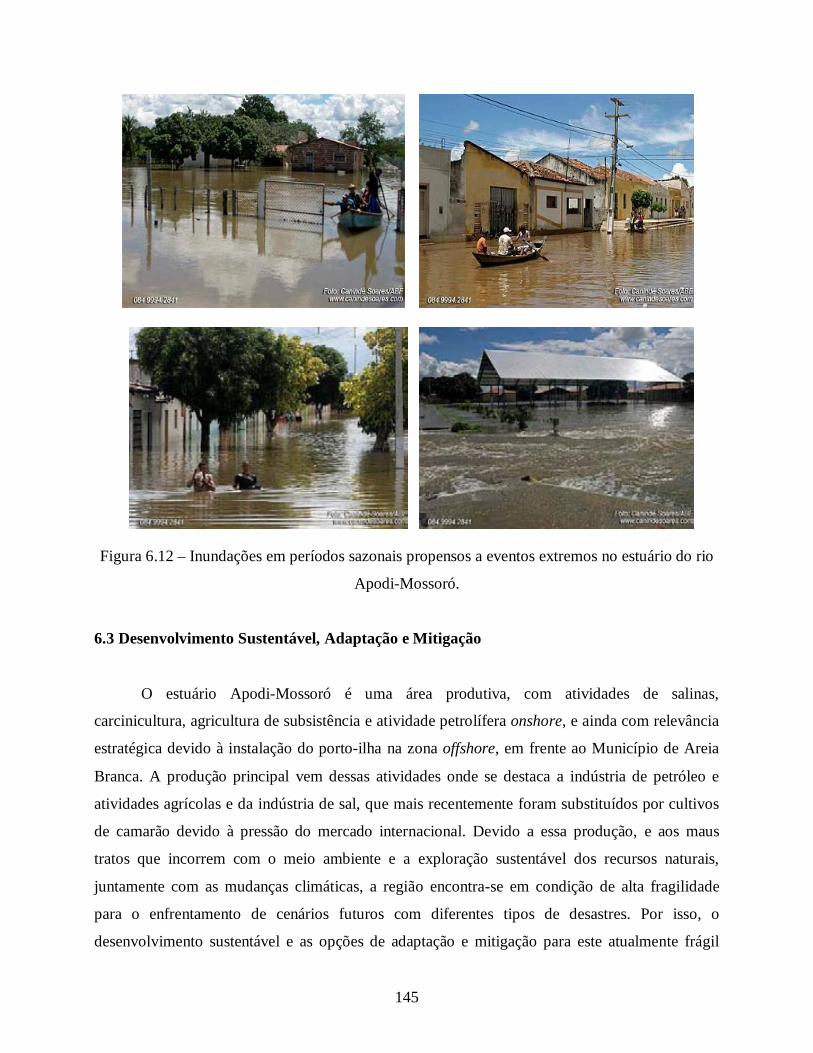
145
Figura 6.12 – Inundações em períodos sazonais propensos a eventos extremos no estuário do rio
Apodi-Mossoró.
6.3 Desenvolvimento Sustentável, Adaptação e Mitigação
O estuário Apodi-Mossoró é uma área produtiva, com atividades de salinas,
carcinicultura, agricultura de subsistência e atividade petrolífera onshore, e ainda com relevância
estratégica devido à instalação do porto-ilha na zona offshore, em frente ao Município de Areia
Branca. A produção principal vem dessas atividades onde se destaca a indústria de petróleo e
atividades agrícolas e da indústria de sal, que mais recentemente foram substituídos por cultivos
de camarão devido à pressão do mercado internacional. Devido a essa produção, e aos maus
tratos que incorrem com o meio ambiente e a exploração sustentável dos recursos naturais,
juntamente com as mudanças climáticas, a região encontra-se em condição de alta fragilidade
para o enfrentamento de cenários futuros com diferentes tipos de desastres. Por isso, o
desenvolvimento sustentável e as opções de adaptação e mitigação para este atualmente frágil

146
sistema deve ser a tônica das ações de gestão pública, para que a região continue produtiva no
futuro, além de reduzir os riscos para vida e propriedades (BOORI; AMARO, 2010). O
relacionamento entre desenvolvimento econômico e mudanças climáticas é de uma importância
particular no desenvolvimento de alguns setores do estuário Apodi-Mossoró, devido a sua
localização e diante dos quadros de dificuldades climáticas Portanto, a ênfase é a noção de
“tornar o desenvolvimento mais sustentável”. O desenvolvimento sustentável reconhece que
existem várias maneiras em que sociedades equilibrem o ambiente econômico e social, incluindo
fatores de risco decorrentes das mudanças climáticas. A Tabela 6.2 mostra opções de mitigação
estabelecida em setores e considerando os seguintes fatores no desenvolvimento sustentável:
econômico, ambiente local e social. Também admite a possibilidade de conflito e compromissos
entre medidas que melhorem um dos aspectos do desenvolvimento sustentável, enquanto
danificaria outro (MUNASINGHE; SWART, 2000).
Table 6.2 – Opções de mitigação setorial e considerações no desenvolvimento sustentável (econômica, ambiente local e social) para o estuário Apodi-Mossoró.
OPÇÕES DE MITIGAÇÃO SETORIAL
SINERGIAS POTENCIAS DE DESENVOLVIMENTO
SUSTENTÁVEL E CONDIÇÕES PARA IMPLEMENTAÇÃO
DESENVOLVIMENTO SUSTENTÁVEL E
COMPROMISSOS POTENCIAIS
Fornecimento de Energia e Uso:
Melhoria na eficiência de energia em todos os setores (prédios, transportação, indústria e fornecimento de energia:
- Quase sempre beneficiente aos custos, reduz ou elimina emissões locais de polução e os impactos conseqüentes, melhora conforto interno e reduz o nível de barulho interno, cria oportunidades para negócios e empregos e melhora segurança de energia - Programas governamentais e industriais podem ajudar a superar a falta de informação - Programas podem ser implementados em todos os níveis do governo e da indústria - Importante assegurar que as necessidades de famílias de baixa renda são levadas em consideração e que os processos e conseqüências na implementação das opções de mitigação são neutros em relação os gêneros
- Polução de ar interno e impacto na saúde com melhoria na eficiência térmica de fornos em áreas rurais;
Troca de combustível e outras opções no setor de transporte e construção
- O custo de redução de CO2 talvez seja compensado por um aumento nos benefícios de saúde - Promoção de transporte público e transporte não motorizado têm benefícios sociais grandes e consistentes
- Motores a diesel são geralmente mais eficientes com combustível que motores de gasolina e, portanto tem menos emissões de CO2, mas aumenta emissões de partículas - Outras medidas: ônibus híbrido diesel-elétrico e renovação de frota
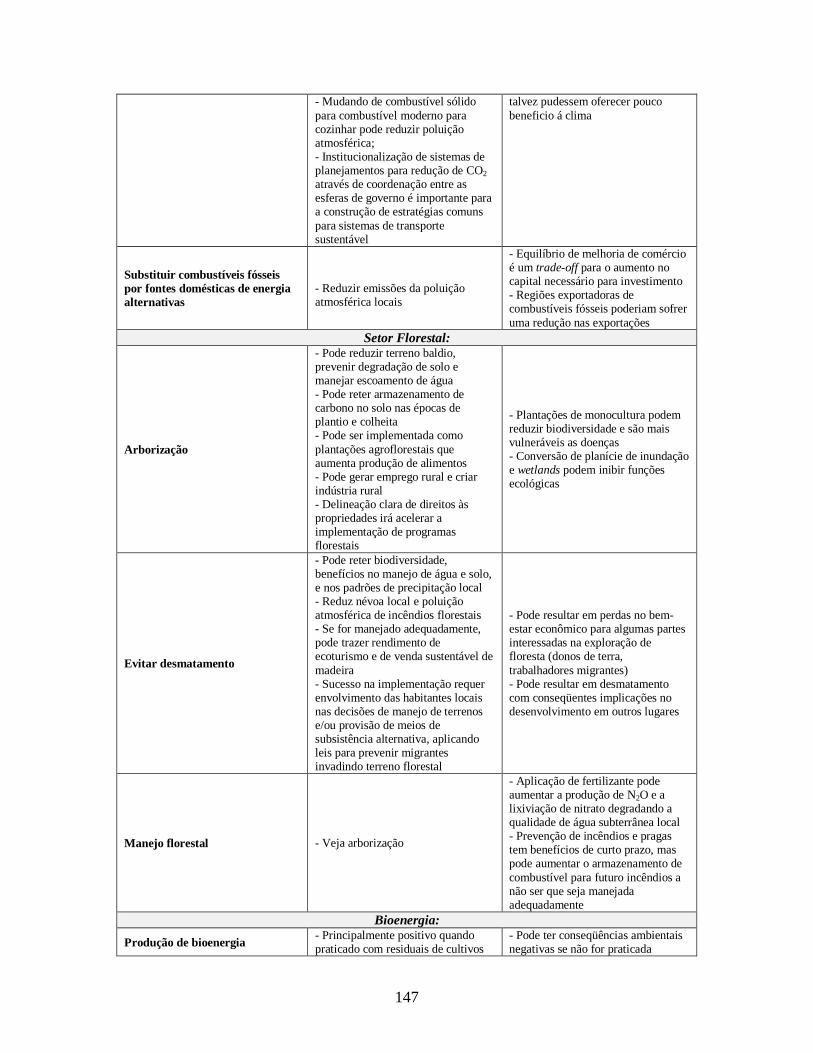
147
- Mudando de combustível sólido para combustível moderno para cozinhar pode reduzir poluição atmosférica; - Institucionalização de sistemas de planejamentos para redução de CO2 através de coordenação entre as esferas de governo é importante para a construção de estratégias comuns para sistemas de transporte sustentável
talvez pudessem oferecer pouco beneficio á clima
Substituir combustíveis fósseis por fontes domésticas de energia alternativas
- Reduzir emissões da poluição atmosférica locais
- Equilíbrio de melhoria de comércio é um trade-off para o aumento no capital necessário para investimento - Regiões exportadoras de combustíveis fósseis poderiam sofrer uma redução nas exportações
Setor Florestal:
Arborização
- Pode reduzir terreno baldio, prevenir degradação de solo e manejar escoamento de água - Pode reter armazenamento de carbono no solo nas épocas de plantio e colheita - Pode ser implementada como plantações agroflorestais que aumenta produção de alimentos - Pode gerar emprego rural e criar indústria rural - Delineação clara de direitos às propriedades irá acelerar a implementação de programas florestais
- Plantações de monocultura podem reduzir biodiversidade e são mais vulneráveis as doenças - Conversão de planície de inundação e wetlands podem inibir funções ecológicas
Evitar desmatamento
- Pode reter biodiversidade, benefícios no manejo de água e solo, e nos padrões de precipitação local - Reduz névoa local e poluição atmosférica de incêndios florestais - Se for manejado adequadamente, pode trazer rendimento de ecoturismo e de venda sustentável de madeira - Sucesso na implementação requer envolvimento das habitantes locais nas decisões de manejo de terrenos e/ou provisão de meios de subsistência alternativa, aplicando leis para prevenir migrantes invadindo terreno florestal
- Pode resultar em perdas no bem-estar econômico para algumas partes interessadas na exploração de floresta (donos de terra, trabalhadores migrantes) - Pode resultar em desmatamento com conseqüentes implicações no desenvolvimento em outros lugares
Manejo florestal - Veja arborização
- Aplicação de fertilizante pode aumentar a produção de N2O e a lixiviação de nitrato degradando a qualidade de água subterrânea local - Prevenção de incêndios e pragas tem benefícios de curto prazo, mas pode aumentar o armazenamento de combustível para futuro incêndios a não ser que seja manejada adequadamente
Bioenergia: Produção de bioenergia - Principalmente positivo quando
praticado com residuais de cultivos - Pode ter conseqüências ambientais negativas se não for praticada
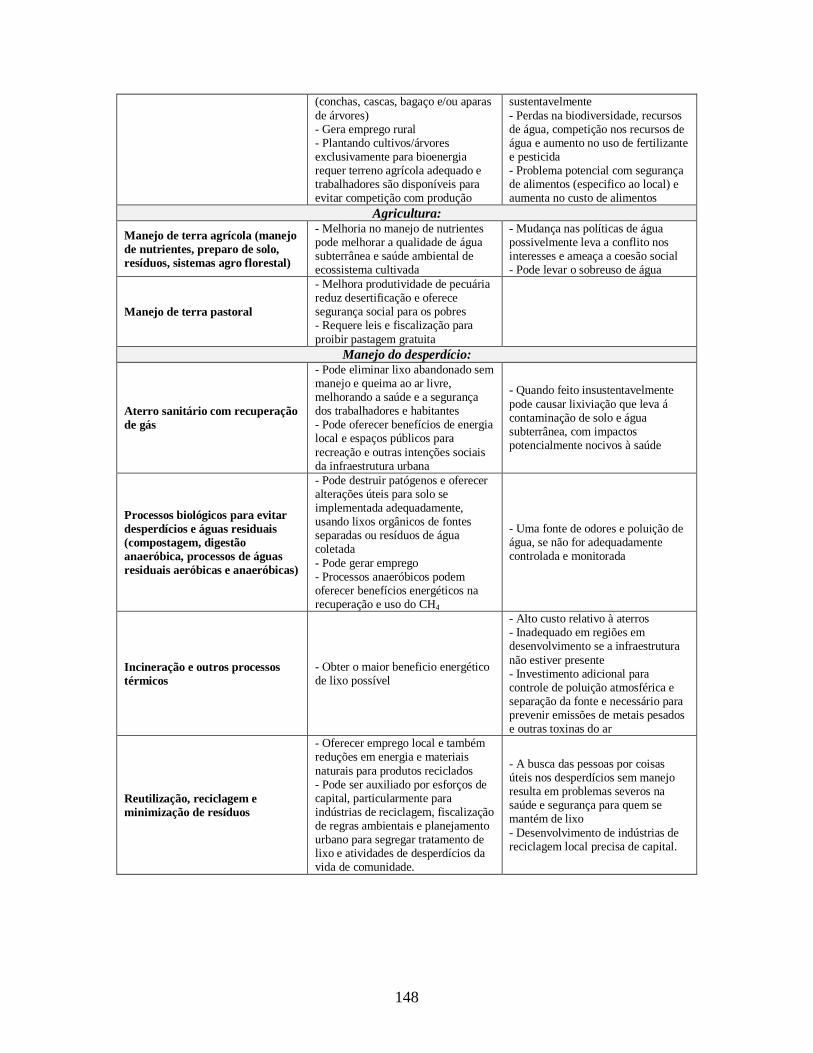
148
(conchas, cascas, bagaço e/ou aparas de árvores) - Gera emprego rural - Plantando cultivos/árvores exclusivamente para bioenergia requer terreno agrícola adequado e trabalhadores são disponíveis para evitar competição com produção
sustentavelmente - Perdas na biodiversidade, recursos de água, competição nos recursos de água e aumento no uso de fertilizante e pesticida - Problema potencial com segurança de alimentos (especifico ao local) e aumenta no custo de alimentos
Agricultura: Manejo de terra agrícola (manejo de nutrientes, preparo de solo, resíduos, sistemas agro florestal)
- Melhoria no manejo de nutrientes pode melhorar a qualidade de água subterrânea e saúde ambiental de ecossistema cultivada
- Mudança nas políticas de água possivelmente leva a conflito nos interesses e ameaça a coesão social - Pode levar o sobreuso de água
Manejo de terra pastoral
- Melhora produtividade de pecuária reduz desertificação e oferece segurança social para os pobres - Requere leis e fiscalização para proibir pastagem gratuita
Manejo do desperdício:
Aterro sanitário com recuperação de gás
- Pode eliminar lixo abandonado sem manejo e queima ao ar livre, melhorando a saúde e a segurança dos trabalhadores e habitantes - Pode oferecer benefícios de energia local e espaços públicos para recreação e outras intenções sociais da infraestrutura urbana
- Quando feito insustentavelmente pode causar lixiviação que leva á contaminação de solo e água subterrânea, com impactos potencialmente nocivos à saúde
Processos biológicos para evitar desperdícios e águas residuais (compostagem, digestão anaeróbica, processos de águas residuais aeróbicas e anaeróbicas)
- Pode destruir patógenos e oferecer alterações úteis para solo se implementada adequadamente, usando lixos orgânicos de fontes separadas ou resíduos de água coletada - Pode gerar emprego - Processos anaeróbicos podem oferecer benefícios energéticos na recuperação e uso do CH4
- Uma fonte de odores e poluição de água, se não for adequadamente controlada e monitorada
Incineração e outros processos térmicos
- Obter o maior beneficio energético de lixo possível
- Alto custo relativo à aterros - Inadequado em regiões em desenvolvimento se a infraestrutura não estiver presente - Investimento adicional para controle de poluição atmosférica e separação da fonte e necessário para prevenir emissões de metais pesados e outras toxinas do ar
Reutilização, reciclagem e minimização de resíduos
- Oferecer emprego local e também reduções em energia e materiais naturais para produtos reciclados - Pode ser auxiliado por esforços de capital, particularmente para indústrias de reciclagem, fiscalização de regras ambientais e planejamento urbano para segregar tratamento de lixo e atividades de desperdícios da vida de comunidade.
- A busca das pessoas por coisas úteis nos desperdícios sem manejo resulta em problemas severos na saúde e segurança para quem se mantém de lixo - Desenvolvimento de indústrias de reciclagem local precisa de capital.

149
Existe uma crescente ênfase na literatura relacionando os dois aspectos: as mudanças
climáticas e o desenvolvimento sustentável. O relacionamento nem sempre pode ser mutuamente
benéfico. Na maioria dos casos, mitigação pode ter benefícios auxiliares ou co-benefícios que
contribuem aos outros objetivos no desenvolvimento sustentável (clima em primeiro lugar).
Apesar de estar ainda no começo, existe um crescimento no uso de indicadores para
manejar e medir o desenvolvimento sustentável no nível macro e no setorial, que pode ser
aplicado ao estuário Apodi-Mossoró. No nível setorial, o progresso em direção ao
desenvolvimento sustentável começou a ser medido pela indústria e pelo governo, usando, por
exemplo, a Certificação Verde, as ferramentas de monitoramento e os registros de emissões. Uma
revisão dos indicadores ilustra, contudo, que poucos macro-indicadores incluem medidas de
progresso com respeito às mudanças climáticas nos estudos. A tomada de decisões sobre
desenvolvimento sustentável e a mitigação às mudanças climáticas não é mais de única intenção
dos governos. Existe um aumento no reconhecimento de um conceito mais inclusivo, que inclui
as contribuições em níveis variados de governo, do setor privado, dos atores não governamentais
e da sociedade civil. O setor privado faz um papel central na administração ecológica e de
sustentabilidade. Ao longo dos últimos 25 anos, houve um aumento progressivo no número de
empresas tomando medidas para atender problemas de sustentabilidade no nível da empresa ou
industrial, e até mesmo de repercussão nacional e global, em se considerando a ampliação dos
mercados e a globalização. O setor privado teve a capacidade de exercer um papel mais
importante sobre o desenvolvimento sustentável no futuro, porque tal mudança provavelmente
vai beneficiar seus ganhos. As organizaçces da sociais ou grupos de cidadãos têm sido os grandes
demandantes de desenvolvimento sustentável e são os atores críticos na implementação das
políticas de desenvolvimento sustentável. Além de executar projetos de desenvolvimento
sustentável, estes atores podem empurrar a reforma política através de sensibilização, do Direito e
mesmo da agitação. Também podem alavancar as ações políticas pelo preenchimento de lacunas
nos serviços políticos, incluindo as áreas de inovação, monitoramento e pesquisa. As parcerias
público-privado trabalham mais efetivamente quando investidores, governos locais e grupos de
cidadãos estão dispostos à trabalhar junto e executar novas tecnologias, e produzem arenas para
discutir estes tecnologias que são localmente inclusivos.

150
6.4 Conclusões e Necessidades de Investigação
No estuário Apodi-Mossoró existe um crescimento na degradação ambiental (por
exemplo, mudanças na disponibilidade de água, perdas de terreno agrícolas e inundação de áreas
costeiras, estuarinas e das planícies) devido às alterações no clima, às mudanças climáticas e às
práticas inapropriadas no uso e ocupação do solo que agravam os problemas socioeconômicos e,
por vezes, encorajam a migração de populações rurais e costeiras.
Algumas conclusões gerais emergem dos estudos empreendidos no estuário Apodi-
Mossoró sobre como as mudanças nos caminhos do desenvolvimento no nível setorial pode
efetivamente diminuir as emissões e os fatores geradores das mudanças climáticas que aqui foram
revisados.
Existe um entendimento crescente das possibilidades para escolha das opções de
mitigação e sua execução no estuário Apodi-Mossoró que não tenham conflitos com outras
dimensões do desenvolvimento sustentável. Os benefícios no desenvolvimento sustentável nas
opções de mitigação variam de acordo com os setores e as regiões, mas acompanham as seguintes
características:
Geralmente, opções de mitigação que melhoram produtividade no uso de recursos,
sendo energia, água ou solo, mostram benefícios positivos através das dimensões do
desenvolvimento sustentável.
Políticas relacionadas ao clima tais como aquelas que abordam eficiências de energia,
são frequentemente benéficas economicamente, melhoram a segurança energética e reduzem as
emissões poluidoras nos locais. Muitas opções de mitigação no fornecimento de energia também
podem ser projetadas para atingir outros benefícios de desenvolvimento sustentável, tal como
evasão de deslocamento de populações locais, geração de emprego e racionalização de
assentamentos humanos.
Reduzindo o desmatamento pode-se alcançar benefícios significativos na conservação
de biodiversidade, solo e água, mas talvez resulte em perdas no bem-estar de alguns atores
interessados. A projeção apropriada de plantações florestais e bioenergéticas pode levar à
recuperação de terrenos degradados, ao manejo de lixiviação de água, à retenção de carbono no
solo e ao benefício de economias, mas pode aumentar a competição entre o uso da terra para
agricultura e a preservação da biodiversidade.

151
Existem possibilidades para reforçar o desenvolvimento sustentável através ações
mitigadoras na maioria dos setores, mais particularmente no manejo de desperdícios, nos setores
de transporte e construção, notavelmente através de uma diminuída no uso energético e na
redução da poluição.
As lacunas e deficiências reveladas nesta pesquisa sugerem que algumas áreas são
prioridade para trabalhos futuros como subsídio aos tomadores de decisões (IPCC, 1997). Essas
necessidades incluem:
(i) Melhoria na compilação de dados de linha básica, tanto climáticos como
socioeconômicos. Essencialmente úteis na construção de cenários futuros, especialmente quanto
à precipitação, eventos extremos, efeitos de aerossol de sulfato e mudanças na escala regional.
(ii) Melhoria no entendimento dos efeitos ecológicos e fisiológicos do aumento nas
concentrações de CO2, levando em consideração as espécies competitivas e migratórias, solo e
nutrientes, aclimatação, e particionamento entre rendimento de cultivos, raízes, folhas e caules.
(iii) Elaboração de modelos dinâmicos de clima, processos biosféricos e outros fatores
socioeconômicos, levando em consideração o tempo de ocorrências das mudanças globais na área
de estudo.
(iv) Avaliações de impactos através de uma variedade de cenários e suposições para
permitir a avaliação de risco, particularmente nas regiões onde recursos para pesquisa e avaliação
estavam documentados de forma inadequada.
(v) Análise das opções de adaptação, incluindo a necessidade para desenvolvimento de
novas tecnologias e oportunidades para adaptar tecnologias existentes.
Futuras pesquisas vão continuar a examinar as implicações da mitigação dos efeitos
nocivos das mudanças climáticas para desenvolvimento sustentável no Nordeste do Brasil. Em
aumentando o entendimento, portanto, uma análise séria é necessária para setores chaves e onde
menos informações estão disponíveis. Tais sinergias requerem mais atenção incluindo a água, o
manejo do solo, o manejo florestal, entre outros (IPCC, 2011).

152
Capítulo VII: Considerações Finais
7.1 Conclusões
Pelo menos, durante as últimas três décadas, tem ocorrido várias mudanças no uso e
ocupação do solo, sem precedentes, no estuário Apodi-Mossoró. Os principais condutores de tais
mudanças são, provenientes de intervenções naturais e antropogênicas. A área sofreu ainda
mudanças drásticas na cobertura e uso do solo, como resultado do desenvolvimento de projetos
de atividades urbana, agrícola, industrial e turística. A região enfrenta uma alta taxa de
crescimento populacional e um amplo desenvolvimento socioeconômico que, diante dos riscos
naturais, como inundações, deslizamentos de terra, períodos de estiagem (seca) e ainda alterações
climáticas que vêm ocorrendo de forma contínua, vem impactando os ecossistemas e os recursos
naturais.
A redução da vegetação natural (floresta de carnaúba, manguezais e caatinga densa) tem
causado impactos tanto de ordem ambiental como socioeconômico, que não se reflete somente na
perda de habitat, biodiversidade e potencial de carbono armazenado, mas também na perda de
recursos não renováveis, nas fontes de alimento, entre outros. Além disso, num mecanismo de
feedback positivo tem levado a um aumento do risco de desastres naturais como inundações e
deslizamentos de terra, como o assoreamento dos rios e o ravinamento das encontas.
Do ponto de vista socioeconômico, isto significa não só uma perda de recursos ambientais
naturais, mas também um declínio nas condições de vida e nos valores culturais, sem mencionar
uma consequente redução da renda com o turismo. Isto faz com que algumas das poucas zonas
remanescentes protegidas no estuário do rio Apodi-Mossoró, sejam menosprezadas pela
fiscalização ambiental, atraindo a ação de atividades ilegais (retirada de lenha, destruição de
manguezais, entre outras).
Como demonstrado nesse estudo, as variações no uso e cobertura do solo é impulsionada
principalmente pela expansão industrial. Embora a expansão de culturas agrícolas leve a um
crescimento de produtos que refletem num impacto positivo na economia do país, o aumento de
áreas agrícolas, se mal gerido, causa impactos negativos, tais como: mudanças no regime hídrico
do solo, redução de nutrientes e um aumento do risco de erosão (por exemplo, ravinamento) e
degradação dos solos. Na medida que o solo disponível para expansão agrícola futura está

153
diminuindo, e a população aumenta, o estuário do rio Apodi-Mossoró torna-se cada vez
vulnerável e sob alto risco ambiental.
Assim como acontece com o aumento das áreas agrícolas, também tem ocorrido um
considerável aumento nas áreas urbanas. Dessa forma, a área de vegetação natural vem
diminuindo consideravelmente, sendo uma das principais causas da degradação do solo e
alagamento no estuário Apodi-Mossoró e na erosão das áreas costeiras. Tais mudanças exigem
adaptações rápidas com políticas mais efetivas na gestão de solos, a fim de evitar crises na
segurança alimentar e os conflitos futuros devido à redução do acesso aos recursos naturais, que
estão cada vez mais em evidência. Esse problema precisa ser seriamente estudado através de uma
abordagem multidimensional, como o aplicado nesse estudo, que inclui aspectos
socioeconômicos e naturais, a fim de se preservar o solo, recuperar setores prejudicados e, assim,
promover o desenvlvimento sustentável da região. Assim, mais estudos são necessários para
fornecer informações não apenas sobre a magnitude das mudanças ambinetais, mas também, no
monitoramento de áreas definidas nesse estudo como de alto risco e dos pontos potenciais de
conflito.
A aplicação de técnicas de Geoprocessamento na área de estudo mostrou a interrelação
das atividades humanas com os potenciais riscos ambientais em zonas costeiras e estuarinas, fator
essencial nas tomadas de decisão quanto a implantação de programas de proteção ambiental. A
avaliação das vulnerabilidades forneceram um maneira de agregar valor ao ecossistema e
cenários de mudança do uso e cobertura do solo e também diante de mudanças globais. Este é o
tipo de informação, por exemplo, que pode ser de interesse para os políticos tomadores de
decisão e sociedade em geral, podendo ajudar a influenciar o futuro das vias de desenvolvimento
no estuário do rio Apodi-Mossoró. Em adição, cenários de utilização mais detalhadas do uso do
solo oferecem a oportunidade de explorar os indicadores de vulnerabilidade mais
detalhadamente, construídos com uma estrutura consistente.
A elaboração de cenários futuros e prognósticos são úteis para explorar as incertezas na
avaliação de vulnerabilidade em uma base regional. Por exemplo, algumas regiões apresentam
vulnerabilidade igual em todos os cenários, enquanto outras regiões apresentam respostas
diferentes. Este é um indicador para onde caminhar diante das incertezas sobre o futuro.
Em termos de Vulnerabilidade Natural uma área de 597,65 km², representando 43,49% da
área total do estuário Apodi-Mossoró, pertence à zona de alta vulnerabilidade, e 4,94% para a

154
zona de muito alta vulnerabilidade no estuário. Isso significa que aproximadamente metade
(665,63 km², 48,43%) da área total do estuário Apodi-Mossoró é de alta vulnerabilidade e
representa uma zona de alta sensibilidade ambiental. As zonas de baixa e média vulnerabilidade
representaram 1,0% (13,75 km²) e 44,98% (618,03 km²) e estão presentes no ecossistema
caatinga, nas terras agrícolas, nas salina e na áreas de criação de camarão, respectivamente.
Enquanto que a zona de muito baixa vulnerabilidade a não-classificada tem apenas uma pequena
proporção de 5,60% (77,06 km²) do estuário do rio Apodi-Mossoró.
Em termos de Vulnerabilidade Eco-ambiental da área de estudo um total de 410,62 km²,
representando 29,12% do total da área foi classificada como de alta vulnerabilidade e, 139,10
km² (9,86%) como vulnerabilidade muito alta. Assim, um sexto do total da área do estuário do rio
Apodi-Mossoró é classificada como sendo muito vulnerável. A área de média vulnerabilidade foi
composta por 52,90% (745,96 km²) e a área de baixa vulnerabilidade foi de 2,23% (31,58 km²),
enquanto a área de vulnerabilidade muito baixa e vulnerabilidade potencial representaram 1,07%
(15,20 km²) e 4,79% (67,61 km²) , respectivamente.
O presente estudo foi realizado com o objetivo de identificar áreas vulneráveis devido ao
futuro aumento do nível do mar (SLR) através de análise convencionais e dados de
sensoriamento remoto. O índice de vulnerabilidade costeira (IVC) fornece um conhecimento
sobre o potencial relativo de danos costeiras devido ao SLR futuro. Os mapas aqui apresentados
podem ser vistos pelo menos duas maneiras: (i) Para identificar áreas onde as mudanças físicas
são mais prováveis de ocorrer com o aumento do nível do mar e, (ii) Como uma ferramenta de
planejamento para a gestão e proteção dos recursos na área de estudo. Com base no estudo de
inundação e de avaliação de risco, verificou-se que 216,1 km2 (15,74%), 231,22 km² (16,84%),
256,40 km² (18,68%), 295,70 km² (21,54%) e 362,81 km² (26,43%) da área ou é área de
risco/zona de risco ou será submersa pelas inundações nos níveis de 1m, 3m, 5m, 7m e 10m,
respectivamente. Em termos de avaliação de risco, a máxima área afetada é a indústria salineira
seguida de outras áreas baixas inundáveis e úmidas, áreas de solo exposto, carciniculturas, dunas
móveis, indústria do petróleo. A taxa de erosão foi de - 5,38 m/ano entre 2003-2009 e, 21,48%
(294,92 km2) de alto risco, 73,60% (1010,92 km2) de médio e 4,92% (67,55 km2) na categoria de
baixa vulnerabilidade, devido ao riscos e SLR futuro.
A área salineira corresponde a um total 137,01 km2, aproximadamente 10% da área total
do estuário. Se o nível do mar aumentar em 1m, 123,27 km2 (8,98%) da área será inundada; 3m,
155
125 km2 (9,15%) e 10m, 10,23 km2 (9,90%) da área. isso significa que toda indústria salineira
está concentrada em uma zona de risco muito elevado. Na área baixas e úmidas, se o nível do mar
aumentar em 1m, cobre metade de seus total, cerca de 24,05 km2 (1,75%), em 5m 29,95 km2
(2,18%) e em 10m 43,57 km2 (3,17%) da área. Isso mostra que, toda a área baixa e inundável,
muitoprocurada para agricultura de subsistência, mais de 80% da área será inundada, sendo
novamente uma área de risco elevado. Para a área de florestas se o nível do mar se elevar em 1m,
apenas 3,85 km2 sofrerá inundação, porém se for em 10m, 61,72 km2 da área será inundada. Para
o solo exposto, com área total de 28,92 km2 (2,11%), em 5m de elevação do nível do mar, pouco
mais de metade da área 15,74 km2 (1,15%) será alagada e em 10m, 20,39 km2 (1,49%). Assim,
podemos dizer ser novamente uma zona de alto risco. Se o nível do mar vai subir em 10m, toda
área de fazendas de camarão (10,23 km2, 0,75%) e de dunas móveis (8,32 km2, 0,61%) serão
inundadas. O mesmo acontece com a indústria de petróleo, dunas fixas e manguezais, e assim por
diante.
Os setores mais afetados, em termos de risco de inundação, serão as áreas residenciais e
recreativas, terrenos agrícolas, indústria instaladas em áreas baixas e planas, e os ecossistemas
costeiros e estuarinos naturais (por exemplo os manguezais). Estas áreas devem ser protegidas
através de planejamento rigoroso e/ou leis de zoneamento ecológico-econômico que regulamente
o uso das zonas estuarinas e costeiras (tendo como modelo as Coastal Regulation Zone, CRZ).
Quaisquer outras atividades de desenvolvimento econômico a ser implantado nas zonas costeiras
e estuarinas devem ser baseadas num plano de Gestão Integrada da Zona Costeira (GIZC) para
uma abordagem de desenvolvimento sustentável a longo prazo.
Como resultado da presente análise, pode-se concluir que um aumento do nível do mar de
1.0 m resultaria em mudanças consideráveis nos ecossistemas costeiros e estuarinos na área de
estudo, acarretando sérios riscos econômicos. O aumento da erosão e das mudanças na
sedimentação iriam causar graves perturbações nos rios e no sistema praias-dunas,
principalmente na parte norte do estuário Apodi-Mossoró onde estão instaladas as principais
áreas residenciais, e nos trechos do estuário ocupados pelas indústrias. Além disso, o
desaparecimento de praias teria um impacto negativo sobre a recreação, mesmo que a destruição
direta da costa não ocorra a curto prazo (decadal). Embora a vegetação litorânea e as
comunidades faunísticas reajam como migrações em terra, a interação entre as mudanças do nível
do mar e uso e cobertura do solo resultaria na diminuição da riqueza de espécies.

156
As áreas de baixa altitude sofrerão rápida erosão, por serem mais laváveis e propensas às
inundações. Embora o exemplo do estuário Apodi-Mossoró tenha sido apoiado por fotografias
aéreas de pequeno formatos, imagens de satélite multitemporais e mapas topográficos
georreferenciados, o método com geoindicadores é especialmente importante na região submetida
a condições de mesomarés e ventos alísios constantes, mas há um déficit por recursos mais
sofisticados para o acompanhamento do litoral a longo prazo.
Alguns aspectos relacionados ao risco e vulnerabilidade no estuário do rio Apodi-Mossoró:
1. A quantificação do nível de risco é um aspecto essencial à preparação e
planejamento da mitigação do estuário Apodi-Mossoró para uma melhor gestão dos recursos
naturais existentes, que serão utilizados no futuro.
2. No estuário Apodi-Mossoró, o termo risco refere-se às perdas esperadas de um
elemento geográfico específico, em um determinado período de tempo presente e futuro.
3. A probabilidade da ocorrência de fatores extremos de riscos naturais, que possam
causar um desastre, pode ser estimada pela extrapolação estatística dos dados nos níveis normais
de ocorrência no estuário. A precisão de tais estimativas depende da quantidade e integridade dos
dados e do período de tempo no qual foram coletados. Os registros históricos podem ser uma
valiosa fonte de informação sobre o estuário Apodi-Mossoró.
4. A frequência e intensidade da recorrência da maioria dos desastres naturais varia
de lugar para lugar; portanto, o mapeamento de riscos pode ser usado para indicar as variações
dessas ocorrências no estuário. Para alguns, notadamente os riscos geológicos, o mapeamento
local detalhado (microzoneamento) pode ser usado para estabelecer as variações locais e apoiar
decisões de planejamento do uso do solo. Contudo, até o presente apenas o mapeamento regional
de áreas geográficas de risco foi possível no estuário Apodi-Mossoró.
5. A avaliação da vulnerabilidade envolve primeiramente a identificação de todos os
elementos que podem estar envolvidos em um determinado risco. Quanto ao aspecto
socioecnômico, somente o reconhecimento local com um inventário e dados censitários
detalhados deveriam ser utilizados para concluir sobre elementos em risco, mas isso não foi
possível nessa pesquisa.
6. Muitos aspectos de vulnerabilidade não podem ser quantificados e estes não
devem ser negligenciados, pois os trabalhos de mitigação devem estar mais focados na redução
da vulnerabilidade do estuário.

157
Um conjunto adequado de ações de mitigação consiste em múltiplas ações mitigadoras
para cada setor de risco específico no estuário Apodi-Mossoró.
Prevenção: Ações regulamentadoras do governo que influenciam a maneira de
como o solo é usado e desenvolvido. Exemplos incluem o planejamento e zoneamento ecológico-
econômico, códigos de construção, programas de melhoria de qualidade, a preservação do espaço
e os regulamentos da gestão da água pluviais. Ações que envolvem a modificação de
infraestrutura dos edifícios existentes para protegê-los de um perigo ou a eliminação da área de
risco no estuário. Exemplos incluem a aquisição, a elevação, os deslocamentos, retrações
estruturais, impermeabilização contra inundações, obras de proteção contra ondas fortes.
Educação e Conscientização Pública: Ações informativas e educacionais para os
cidadãos, autoridades e os proprietários sobre potenciais riscos e potenciais formas de mitigá-los.
Tais ações incluem projetos de extensão, centros de informação de risco e programas de educação
de adultos em idade escolar.
Proteção dos Recursos Naturais: Ações que, além de minimizar as perdas de risco
também preserve ou restaure as funções dos sistemas naturais do estuário. Essas ações incluem o
controle da erosão e do assoreamento por sedimentos, a restauração dos cursos d’água, manejo de
bacias hidrográficas, gestão florestal e restauração e preservação das zonas úmidas.
Projetos Estruturais: Ações que envolvam a construção de estruturas do tipo hard
ou soft para reduzir o impacto de riscos. Essas estruturas incluem controles de águas pluviais (por
exemplo, bueiros), barragens, diques e muros de proteção, também açõe como engordamento de
praia, reflorestamento de manguezais e dunas móveis.
Esta pesquisa forneceu informações básicas sobre os impactos, vulnerabilidade e
adaptações no estuário Apodi-Mossoró e, se doravante se destina a servir como base para novas
discussões. Além dos dados descritos e tratados aqui, os seguintes problemas também podem ser
considerados:
1. Algumas das estratégias locais de enfrentamento são ultrapassadas e/ou
inadequadas?
2. Como o equilíbrio pode ser alcançado entre as tecnologias modernas e estratégias
tradicionais com relação às adaptações das alterações climáticas no estuário do rio Apodi-
Mossoró?
158
3. O mecanismo mais adequado para a enfrentamento de risco é o mais adequado? O
que precisa ser feito primeiro para que regimes seguros possam serem bem sucedidos?
4. Como os projetos de adaptações futuras podem ser coordenados para que seja
assegurado que os setores mais vulneráveis, áreas ou comunidades, não sejam negligenciados?
5. Como as alterações climáticas impactarão a questão da migração e o deslocamento
no estuário Apodi-Mossoró?
6. Como as redes e as organizações existentes podem ser melhor utilizadas para
melhorar a cooperação em atividades de adaptação?
7.2 Recomendações
Na área de estudo, os riscos econômicos serão maiores nas áreas urbanas, principalmente
nas cidades de Mossoró, Areia Branca e Grossos, onde a infraestrutura mais relevante está
diretamente relacionada ao litoral e ao estuário do rio Apodi-Mossoró. Estes resultados chamam a
atenção para a importância da atualização e concientização dos tomadores de decisão para os
possíveis impactos e riscos futuros oriundos do aumento do nível do mar na região. No entanto,
para ser mais completo, este estudo deve incluir outras avaliações. Em especial, recomenda-se
que:
A. Devem ser considerados o impacto da elevação do nível do mar sobre os recursos
de água doce, incluindo a invasão da cunha salina nos mananciais de água potável, a salinização
do solo agriculturável e os problemas de alagamento no estuário do rio Apodi-Mossoró;
B. Avaliações de vulnerabilidade deve incluir impactos e riscos socioeconômicos
detalhados, referidos a levantamentos cadastrais atualizados sobre os diversos fatores abordados
nesse trabalho, juntamente com a avaliação dos custos desses impactos e das medidas de
adaptação no estuário do rio Apodi-Mossoró;
C. Estratégias de resposta devem ser baseadas em uma abordagem da GIZC para um
desenvolvimento sustentável a longo prazo no estuário do rio Apodi-Mossoró.
D. Algumas distribuições incorretas nos valores de danos de riscos de inundações
podem ser evitadas através do uso de informações multitemporais, em séries de longa duração e
detalhadas para a análise de mapas e cálculos, prestando mais atenção ao desenvolvimento das
áreas agriculturáveis.

159
E. No futuro, seria interessante um detalhamento na natureza de riscos específicos de
vulnerabilidade. É possível reconhecer pelo menos duas abordagens distintas:
Risco centrado: considerando os indicadores mais relevantes de vulnerabilidade
para o risco, o que mostra a influência potencialmente danosa sobre o sistema de análise e define
como “um evento físico potencialmente prejudicial, fenômeno ou atividade humana que pode
causar a perda de vidas ou danos materiais, a desorganização social e econômica ou a degradação
ambiental”.
Região centrada: em primeiro lugar, considerando os riscos e, em seguida, a
vulnerabilidade ao risco específico de uma determinada região. Trata do potencial de um
ecossistema para modular sua resposta às alterações ao longo do tempo e do espaço, onde esse
potencial é determinado pelas características de um ecossistema que inclui vários níveis de
organização. É uma estimativa da incapacidade de um ecossistema de tolerar fatores de estresse
ao longo do tempo e do espaço. É uma combinação de vulnerabilidade da comunidade com a
possibilidade de alterações do habitat.

160
Referências Bibliográficas
ADGER, W.N. Social Vulnerability to Climate Change and Extremes in Coastal Vietnam. World Development, v. 27, n. 2, p. 249-269, 1999. ______; KHAN, S. R.; BROOKS, N. Measuring and enhancing adaptive capacity, Adaptation Policy Framework: A Guide for Policies to Facilitate Adaptation to Climate Change, UNDP, 2003. ______. Vulnerability. Goblal Environmental Change, v. 16, p. 268-281, 2006. ALBINO, J. Processos de sedimentação atual e morfodinâmica das Praias de Bicanga a Povoação, ES. 1999. Tese (Doutorado em Geologia Sedimentar) - Programa de Pós-Graduação em Geologia Sedimentar. Instituto de Geociências USP, 1999. ALEXANDER, D. Confronting Catastrophe. Oxford: Oxford University Press, 2000. AL-JENEID, S.; et. al. Vulnerability assessment and adaptation to the impacts of sea level rise on the kingdom of Bahrain. Mitigation and Adaptation Strategies for Global Change, v. 13, p. 87–104, 2008.
AMARO, V. E. Análise Conjunta de Dados Geológicos, Geofísico e de Sensoriamento Remoto do Setor Extremo Nordeste da Província Borborema, Nordeste do Brasil, com Ênfase nas Zonas de Cisalhamento Dúcteis Neoproterozóicas. 1998. 397 f. Tese (Doutorado) - Instituto de Geociências, Universidade de São Paulo, São Paulo, 1998. ______ (Org.). Diagnóstico e Vulnerabilidade Ambiental dos Estuários do Litoral Norte e seus Entornos. Instituto de Desenvolvimento Econômico e Meio Ambiente - IDEMA. Projeto de Zoneamento Ecológico-Econômico dos Estuários do Estado do Rio Grande do Norte e dos seus Entornos, SUGERCO/IDEMA, Natal/RN. Relatório Final, 2002. ______; ARAÚJO, A. B. Multitemporal Morphodynamic Analysis of the Northern Coastal Region of Northeast Brazil Between Grossos and Tibau CitieS, Rio Grande do Norte State. Journal of Integrated Coastal Management, v. 8, n. 2, p. 77-100, 2008. ARNELL, N. W. Climate change and global water resources: SRES emissions and sócio-economic scenarios. Global Environmental Change, v. 14, p. 31–52, 2004. BALLING JR. R. C.; BRAZEL, S. W. The impact of rapid urbanization on pan evaporation in Phoenix, Arizona. Journal of Climatology, v. 7, p. 593–597, 1987. BARBOSA, C. C. F. Álgebra de mapas e suas aplicações em Sensoriamento Remoto e Geoprocessamento. 1997. 111 f. Dissertação (Mestrado em Sensoriamento Remoto) – Instituto Nacional de Pesquisas Espaciais-INPE, São José dos Campos, 1997.
161
BARNETT, A.; BLAIKIE, P. AIDS as a long wave disaster. In: VARLEY, A. (Ed.), Disasters, Development, and Environment. Wiley, Chichester, p. 139–162, 1994. BARRETT, C. B.; REARDON, T.; WEBB, P. Nonfarm Income Diversification and Household Livelihood Strategies in Rural Africa: Concepts, Dynamics, and Policy Implications. Food Policy, v. 26, n. 4, p. 315-331, 2001. BINDOFF, N. L. et. al. Observations: Oceanic Climate Change and Sea Level. In: Solomon S, et. al. (eds). Climate Change 2007: The Physical Science Basis. Contribution of Working Group I to the Fourth Assessment Report of the Intergovernmental Panel on Climate Change. Cambridge, United Kingdom / New York, NY: Cambridge University Press., 2007. BLAIKIE, P. et. al. At Risk: Natural Hazards, People’s Vulnerability and Disasters. London: Routledge, 1994. BOHLE, H.G.; DOWNING, T.E.; WATTS, M.J. Climate change and social vulnerability: toward a sociology and geography of food insecurity. Global Environmental Change, v. 4, p. 37–48, 1994. BOORI, M. S.; AMARO, V. E. Detecting and understanding drivers of natural and eco-environmental vulnerability due to hydro geophysical parameters, ecosystem and land use change through multispectral satellite data sets in Apodi estuarine. Northeast Brazil. International Journal of Environmental Sciences (IJES), v. 1, n. 4, p. 543 – 557, 2010. ISSN 0976-4402. BOWEN, R. E.; RILEY, C. Sócio-economic indicators and integrated coastal manangement. Ocean and Coastal Management, v. 46, p. 299-312, 2003. BRUUN, P. Sea level rise as a cause of shore erosion. Journal of the Waterways and Harbors Division, v. 88, n. 1, p. 117–30, 1962. BURROUGH, P. A.; MC DONNEL, R. A. Principles of geographical information systems. New York: Oxford University Press, 1998. BURTON, I.; KATES, R.W.; WHITE, G. F. The Environment as Hazard. New York: Guilford, 1978. ______; ______; ______. The Environment as Hazard. 2. ed. New York: Guilford, 1993. BUSH, D. M.; PILKEY, O. H.; NEAL, W. J. Living by the Rules of the Sea. Durham, NC: Duke University Press, 1996. 179 p. CHARVÉRIAT, C. Natural disasters in Latin America and the Caribbean: an overview of risk. Inter-American Development Bank, Research department – Working Paper #434, 2000. CHAUDHURI, S. “Assessing Vulnerability to Poverty: Concepts, Empirical Methods and Illustrative Examples.” Mimeo. Department of Economics, Columbia University, 2003.

162
CHAVES, M. S.; VITAL, H. Impactos ambientais na zona costeira do Campo Petrolífero Macau-5, Macau-RN. In: CONGRESSO BRASILEIRO DE P&D EM PETRÓLEO E GÁS, 1., 2001, Natal. Anais… Natal: UFRN –SBQ Regional RN, 2001. p. 222. CAPOBIANCO, M. et. al. Coastal area impact and vulnerability assessment: the point of view of a morphodynamic modeller. Journal of Coastal Research, v. 15, n. 3, p. 701–16, 1999. COHEN, S.; IANETZ, A.; STANHILL, G. Evaporative climate change at Bet Dagan, Israel, 1964–1998. Agricultural and Forest Meteorology, v.111, p. 83–91, 2002. DAVIS, J. R. “The Rural Non-Farm Economy, Livelihoods and their Diversification: Issues and Options.” Report I, Natural Resource Institute, 2003. DECLERIS, M. The law of sustainable development – General principles. European Commission, 2000. DEWIDAR, K. H. M. Landfilling detection of Hurghada, North Red Sea, Egypt, by using Thematic Mapper. International Journal of Remote Sensing, v. 23, p. 939–948, 2004. DIAO, X. et. al. “The Role of Agriculture in Development: Implications for Sub-Saharan Africa.” Development Strategy and Governance Discussion Paper No. 29. International Food Policy Research Institute, 2006. DOWNING, T. E. et. al. Vulnerability Indices: Climate Change Impacts and Adaptation. Nairobi: UNEP, 2001. (Policy Series) DWARAKISH, G. S.; NATESAN, U. Coastal Structures Vs Shoreline Configuration. NITK Research Bulletin, v. 11, n. 3, p. 25–33, 2002. ECODINÂMICA Tricart Revista Brasileira de Geomorfologia - Ano 8, nº 2 (2007), 1977. EKLUNDH, L.; SINGH, A. A comparative analysis of standardized and unstandardized principal components analysis in remote sensing. International Journal of Remote Sensing, v. 14, p. 1359–1370, 1993.
ELAGIB, N. A.; ABDU, A. S. A. Climate variabilityand aridityin Bahrain. Journal of Arid Environments, v. 36, p. 405–419, 1997. ELLIS, F.; FREEMAN, H. A. Rural Livelihoods and Poverty Reduction Strategies in Four African Countries. Journal of Development Studies, v. 40, n. 4, p. 1-30, 2004. EL-SABH, M. I. World conference on natural disaster reduction: A ‘safer world for the 21st century’. Natural Hazards, v. 9, n. 3, p. 333–352, 1994.
163
FARRINGTON, J.; SLATER, R.; HOLMES, R. “The Search for Synergies between Social Protection and Livelihood Promotion: The Agriculture Case”, Working Paper 232. Overseas Development Institute, 2004. FARRINGTON, J. “Recognising and Tackling Risk and Vulnerability Constraints to Pro-Poor Agricultural Growth”, background paper for OECD POVNET Agriculture TaskTeam, Paris, 2005. FERNANDEZ, G. B.; MUEHE, D. Algumas Considerações Sobre o Efeito do Fenômeno El Niño Sobre Feições Costeiras ao Longo da Costa Brasileira. Geografia, v. 15, p. 115-128, 2006. FIORILLO, F.; WILSON, R. C. Rainfall induced debris flows in pyroclastic deposits, Campania (Southern Italy). Engineering Geology, v. 75, p. 263–289, 2004. FONSECA, M. A. P. Políticas públicas, espaço e turismo. Uma análise sobre a incidência espacial do ‘Programa de desenvolvimento do turismo no Rio Grande do Norte. 2004. 232 f. Tese (Doutorado em Geografia) - Universidade Federal do Rio de Janeiro, Programa de Pós Graduação em Geografia, Rio de Janeiro, 2004. Gaiser, T. et. al. (Eds.) Global Change and Regional Impacts. Water Availability and Vulnerability of Ecosystems and Society in the Semi-arid Northeast of Brazil. Springer- Verlag, 2003b. GLANTZ, M. H. Drought and economic development in sub- Saharan Africa. In: GLANTZ, M. H. (Ed.). Drought and Hunger in Africa. Cambridge: Cambridge University Press, 1987. p. 37–58. GORNITZ, V. Vulnerability of the east coast, USA to future sea level rise. Journal of Coastal Research, v. 1, n. 9, p. 201–37, 1990. GORNITZ, V.M. et. al. The development of a coastal vulnerability assessment database,vulnerability to sea-level rise in the U.S. southeast. Journal of Coastal Research, n. 12, p. 327-338, 1994. GREEN, S.; BOISSOLES, J.; BOULET, C. Accurate collision-induced line-coupling parameters for the fundamental band of CO in He: Close coupling and coupled states scattering calculations. J. Quant. Spectrosc. Radiat. Transfer, v. 39, p. 33-42,1988. doi:10.1016/0022-4073(88)90017-9. GRIGIO, A.M. et. al. Use of remote sensing and geographical information system in the determination of the natural and environmental vulnerability of the Guamaré municipal district – Rio Grande do Norte – northeast of Brazil. Journal of Coastal Research, Itajaí, SC – Brazil, n. 39, 2004. ISSN 0749-0208. HOWARTH, P. J.; BOASSON, E. LANDSAT digital enhancement for change detection in urban environment. Remote Sensing of Environment, v. 13, p. 149–160, 1983.
164
______; WICKMORE, G. M. Change detection in the Peace-Athabasca delta using digital LANDSAT data. Remote Sensing of Environment, v. 11, p. 9–25, 1981. HUTCHINSON, J.N. A pattern in the incidence of major coastal mudslides. Earth Surface Processes and Landforms, v. 8, p. 391–397, 1983. IBGE - Instituto Brasileiro de Geografia e Estatística. Disponível em: http://www.ibge.gov.br/home/. Acesso em: 22 mar. 2007. IBGE - Instituto Brasileiro de Geografia e Estatística. Disponível em: http://www.ibge.gov.br/home/. Acesso em: 2 nov. 2009. IDEMA -Instituto de Desenvolvimento Econômico e Meio Ambiente. Informativo Municipal: Areia Branca. Secretaria de Planejamento e Finanças, Instituto de Desenvolvimento Econômico e Meio Ambiente-IDEMA, p.1-16, 1999. IDEMA / CESE. Instituto de Desenvolvimento Econômico e Meio Ambiente - IDEMA / Centro de Estudos Socioeconômicos - CESE. Dados Básicos: IBGE, Censos Demográficos - 1991/2000 2004. Disponível em http://www.idema.rn.gov.br. Acesso em: 03 out. 2007. INCRA. Relatório de Atividades INCRA, 1994 Brasília – Janeiro de 1995. INTERNATIONAL Monetary Fund “Mali: Selected Issues and Statistical Annex.” IMF Country Report No. 02/1, 2002. IPCC special Report of Working Group II, THE REGIONAL IMPACTSOF CLIMATE CHANGE: AN ASSESSMENT OF VULNERABILITY Published for the Intergovernmental Panel on Climate Change, ISBN: 92-9169-110-0, 1997. ______. Climate Change 2001: Impacts, Adaptation, and Vulnerability. Contribution of Working Group II to the third assessment report of the Intergovernmental Panel on Climate Change (IPCC) Cambridge University Press, Cambridge. ______. chair, Dr. Robert T. Watson, and administered by the IPCC working group II (2002): Climate change and biodiversity, ISBN: 92-9169-104-7, 2002. ______. Fourth Assessment Report. Intergovernmental Panel on Climate Change Secretariat. Genebra, Switzerland, 2007. Disponível em: http://www.ipcc.ch/. Acesso em: 12 out. 2007. ______. WG III: Sustainable development and mitigation, 2011. JANSEN, H. G. P.; SIEGEL, P.; PICHÓN, F. “Identifying the Drivers of Sustainable Rural Growth and Poverty Reduction in Honduras.” Development Strategy and Governance Division Discussion Paper No. 19, Washington DC: International Food Policy Research Institute, 2005. KABUTA, S. H.; LAANE, R. W. P. M. Ecological performance indicators in the North Sea: development and application. Ocean and Coastal Management, v. 46, p. 277-297, 2003.

165
KIPKORIR, E. C. Analysis of rainfall climate on the Njemps flats, Baringo District, Kenya. Journal of Arid Environments, v. 50, p. 445–458, 2002. KOPPEN, W. Climatologia: Un Estúdio de los Climas de la Tierra. Versión de Pedro R. Henrichs. México: Fondo de Cultura Econômica, 1948. 478 p. KOSACK, S. Effective aid: How democracy allows development aid to improve the quality of life. World Development, v. 31, n. 1, p. 1-22, 2003. KUHLMANN, E.; Vegetação. In: IBGE. Geografia do Brasil: Região Nordeste. Rio de janeiro: IBGE, 1977. V.2, p. 85-110. LEE, J. B.; WOODYATT, A. S.; BERMAN, M. “Enhancement of high spectral resolution remote-sensing data by a noise-adjusted principal components transform.” IEEE Transactions on Geoscience and Remote Sensing, v. 28, n. 3, p. 295-304, 1990. LILLESAND, T. M.; KIEFER, R. W. Remote sensing and image interpretation. 5. ed. Nova Jersey, EUA: John Wiley & Sons, Inc., 2004. 763 p. LOCHNER, K.; KAWACHI, I.; KENNEDY, B.P. Social capital: a guide to its measurement. Health and Place, v. 5, p. 259-270, 1999. LOUCKS, D. P. Sustainable water resources management. Water International, v. 25, n. 1, p. 3-10, 2000. MAFRA, L. C. A. Caracterização Geológica e Geomorfológica do Município de Porto do Mangue / RN, com Vista à Elaboração do Mapa de Sensibilidade Ambiental ao Derramamento do Óleo. 2002. Relatório (Graduação em Geologia) – Universidade Federal do Rio Grande do Norte, Centro de Ciências Exatas e da Terra, Departamento de Geologia, Natal, RN, 2002. MAGRIN, G. et. al. Latin America. In: PARRY, M. L. et. al. (eds). Climate Change 2007: Impacts, Adaptation and Vulnerability. Contribution of Working Group II to the Fourth Assessment Report of the Intergovernmental Panel on Climate Change. Cambridge, UK: Cambridge University Press., 2007. p. 581– 615. MATHER, P. M. Computer processing of remotely-sensing images, an introduction . 2. ed. Chichester: John Wiley and Sons, 1999. p. 1–75 MASKREY, A. Vulnerability accumulation in peripheral regions of Latin America: the challenge for disaster prevention and management. In: MERRIMAN, P. A., BROWITT, C. W. A. (Eds.). Natural Disasters: Protecting Vulnerable Communities. London: Thomas Telford, 1993. p. 461–472. MCLEOD, E.; SALM, R.V. Managing Mangroves for Resilience to Climate Change. Gland, Switzerland: The World Conservation Union (IUCN), 2006. 64 p.

166
MEDINA, E. et. al. Natural and man-induced changes in a tidal channel mangrove system under tropical semiarid climate at the entrance of the Maracaibo Lake (Western Venezuela). Wetlands Ecology and Management , v. 9, p. 233 – 243, 2001. MEEHL, G. A. et. al. Global Climate Projections. In: SOLOMON, S. et. al. (eds). Climate Change 2007: The Physical Science Basis. Contribution of Working Group I to the Fourth Assessment Report of the Intergovernmental Panel on Climate Change. Cambridge, United Kingdom / New York, NY: Cambridge University Press., 2007. MESSERLI, B. et. al. From nature-dominated to human-dominated environmental changes. International Geographical Union Bulletin, v. 50, n. 1, p. 23–38, 2000. METZGER, M. J.; LEEMANS, R.; SCHROTER, D. A multidisciplinary multi-scale framework for assessing vulnerability to global change. International journal of applied earth observation and geoinformation, v.7, p. 253-267, 2005. MILES, L.; GRAINGER, A.; PHILLIPS, O. The impact of global climate change on tropical forest biodiversity in Amazonia. Global Ecology and Biogeography, 2004. DOI: 10. 1111/j. 1466-822X. 2004. 00105. X. MIZUTANI, T., NAKANO, T. The impact of natural disasters on the population of Japan. In: CLARKE, J. I. et. al. (Eds.). Population and Disaster. Institute of British Geographers Special Publication 22. Basil Blackwell: Oxford, 1989. p. 24–33. MOSSLER, M. Environmental hazard analysis and small island states: rethinking academic approaches. Geographische Zeitschrift , v. 84, n. 2, p. 86–93, 1996. MORELOCK, J. et. al. Net shore-drift on the north coast of Puerto Rico. Shore and Beach, v. 53, n. 4, p.16-21, 1985. MOURA, A. D.; SHUKLA, J. On the dynamics of droughts in North-East Brazil: observations, theoryand numerical experiments with a general circulation model. Journal Atmospheric Science, v. 38, p. 2653–2675, 1981. MUNASINGHE, M.; SWART, R. (eds.) Climate change and its linkages with development, equity and sustainability. Genebra: Intergovernmental Panel on Climate Change, 2000. NASCIMENTO, M.C. A erosão costeira e sua influencia sobre a atividade petrolífera: alternativas sustentáveis na mitigação de impactos ambientais. 2009. 222 f. Dissertação ( Mestrado em Geodinâmica e Geofísica) – Universidade federal do Rio Grande do Norte, Programa de Pos-Graduaçao em Geodinamica e Geofisica, Natal, RN, 2009. NDIKUMANA, L.; BOYCE, J. K. Public debts and private assets: Explaining capital flight from sub-Saharan African Countries. World Development, v. 31, n. 1, p. 107-130, 2003.

167
NEF Up in Smoke? Latin America and the Caribbean. The threat from climate change to the environment and human development. The third report from the Working Group on Climate Change and Development. Published by the new economics foundation, 2006. Disponivel em: http://www.neweconomics.org/gen/uploads/15erpvfzxbbipu552pnoo1f128082006213002.pdf. Acesso em: 03 out. 2007. NEUMAYER, E.; GATES, S.; GLEDITSCH, N. P. Environmental Commitment, Democracy and Inequality, A Background Paper to World Development Report 2003, 2002. NICHOLLS, R. J.; SMALL, C. Improved estimates of coastal populations and exposure to hazards released. EOS, v. 83, n. 28, p. 301-305, 2002. NIMER, E. Desertifica: realidade ou mito. Revista Brasileira de Geografia, v. 50, n. 1, p. 1–39, 1988. NOBRE, C.A. et. al. Impact of climate change scenarios for 2100 on the biomes of South America. First International CLIVAR Conference. Baltimore, USA. 21-25 June 2004. Disponível em: http://www.clivar2004.org. Acesso em: 25 nov. 2009. NOBRE, P.; SUKLA, J. Variations of sea surface temperature, wind stress and rainfall over the Tropical Atlantic and South America. J. Climate, v. 10, n. 4, p. 2464-2479, 1996. OMM Cambios climaticos, medio ambiente ydesarrollo. Opiniones de dirigentes del mundo, 1992. PALDAM, M.; SVENDSEN, G.T. An essay on social capital: looking for the fire behind the smoke. European Journal of Political Economy, v. 16, p. 339-366, 2000. PEDUZZI, P. Insight on common/key indicators for Global Vulnerability Mapping. Presentation at Expert Meeting on Vulnerability and Risk Analysis and Indexing, Genebra, 11-12 September 2000. Disponivel em: http://www.grid.unep.ch/activities/earlywarning/preview/appl/reports/vul_risk.pdf. Acesso em: 15 set. 2008. PELLING, M.; UITTO, J.I. Small island developing states: natural disaster vulnerability and global change. Environmental Hazards, v. 3, p. 49–62, 2001. PENDLETON, E.A. et. al. Coastal vulnerability assessment of Gulf Islands national seashore (GUIS) to sea-level rise. U.S. geological survey open-file report 03-108; 2003. Disponível em: http://pubs.usgs.gov/of/2003/of03-108/images/pdf/Gulf_ Islands_www.pdf. Acesso em: 14 out. 2007. PICCHIOTTI, A.; CASACCHIA, R.; SALVATORI, R. Multitemporal principal component analysis of spectral and spatial features of the Venice Lagoon. International Journal of Remote Sensing, v. 18, n. 1, p. 183–196, 1997.

168
PIMENTA, M.T.; SANTOS, M.J.; RODRIGUES, R. A Susceptibilidade "a Desertifica@ao. Revista Florestal, v. 11, n. 1, p. 27–33, 1988. QUAMMEN, M. L.; ONUF, C. P. Laguna Madre –seagrass changes continue decades after salinity reduction. Estuaries, v. 16, p. 302 – 310, 1993. QUARANTELLI, E.L. Disaster response: generic or agent-specific. In: KREIMER, A., MUNASINGHE, M. (Eds.). Managing Natural Disasters and the Environment. Washington: The World Bank, 1991. p. 97–105. RADAMBRASIL. Levantamento de Recursos Naturais Geologia/Geomorfologia/ Pedologia/Vegetação/Uso Potencial da Terra. Rio de Janeiro/RJ: Ministério das Minas e Energia, v. 23 – Folhas SB. 24/25 – Jaguaribe/Natal, 740p., 1981. RASHID, S. F. The urban poor in Dhaka City: their struggles and coping strategies during the floods of 1998. Disasters, v. 24, n. 3, p. 240–253, 2000. RICE, J. Environmental health indicators. Ocean and Coastal Management, v. 46, p. 235-259, 2003. RICHARDS, J. A. Remote sensing digital image analysis: An introduction. Berlin: Spring-Verlag, 1993. ROGÉRIO, A. P. C. Caracterização Geológica e Geomorfológica do Município de Areia Branca/RN, com Vistas à Elaboração de Mapa de Sensibilidade ao Derramamento de Óleo. 2004. 113 f. Monografia (Graduação em Geologia) – Universidade federal do Rio Grande do Norte, Centro de Ciências Exatas e da Terra, Departamento de Geologia, Natal, RN, 2004. ROSSI, F.; VILLANI, P. Valutazione delle piene in Campania. G.N. D.I.C. Previsione e prevenzione degli eventi idrologici estremi e loro controllo Linea1. Consiglio Nazionale delle Ricerche, 1994. 310p. ROUCOU, P. et. al. Vertical motion, changes related to north-east Brazil rainfall variability: a GCM simulation. International Journal of Climatology, v.16, p. 879–891, 1996. ROUNSEVELL, M.D.A. et. al. Future scenarios of European agricultural land use. II. Projecting changes in cropland and grassland. Agric. Ecosyst. Environ. v. 107, p. 117–135, 2005. SAATY, T. L.; VARGAS, L. G. Prediction, Projection and Forecasting. Dordrecht: Kluwer Academic Publishers, 1991. SABINS, F. F. Remote sensing principles and interpretation. New York: W.H. Freeman, 1987. SALEM, B. B.; EL-CIBAHY, A.; EL-RAEY, M. Detection of land cover classes in agro ecosystems of northern Egypt by remote sensing. International Journal of Remote Sensing, v. 16, n. 14, p. 2518–2594, 1995.

169
SANDERSON, D. Cities, disasters and livelihoods. Environment & Urbanization, v. 12, n. 2, p. 93–102, 2000. SAVENIJE, H. H. G. Recent extreme floods in Europe and the USA: challenges for the future. Physics and Chemistry of the Earth, v. 20, n. 5–6, p. 433–437, 1996. SCHOLZE, M. et. al. A climate change risk analysis for world ecosystems. Proceedings of the National Academy of Sciences, v. 103, n. 35, p. 13116 –13120, 2005. SCHROTER, D. et. al. Ecosystem Service Supply and Human Vulnerability to Global Changein Europe. Science, v. 310, p. 1333–1337, 2005a. SCHWALM, C. R.; EK, A.R. Climate change and site: relevant mechanisms and modeling techniques. Forest Ecologyand Management, v. 150, p. 241–257, 2001. SEN, A. K. Poverty and Famines: An Essay on Entitlement and Deprivation. Clarendon: Oxford, 1981. SHALABY, A.; TATEISHI, R. Remote Sensing and GIS for mapping and monitoring land cover and land-use changes in the Northwestern coastal zone of Egypt. Applied Geography, v. 27, p. 28–41, 2007. SHORT, A. D.; WRIGHT, L. D. (1983). Physical variability of sandy beaches. In: MCLACHLAN, A. ; ERASMUS, T. (Eds.). ‘Sandy Beaches as Ecosystems’. Developments in Hydrobiology No. 19. pp. 133–45. (Dr W. Junk Publishers, The Hague/Boston/Lancaster.) SILVA, J. X.; FILHO, L. M. C. Sistema de Informação: uma proposta metodológica. In: _____. Análise Ambiental:Estratégias e ações. Rio Claro: CEAD -UNESP, 1993. p.329-346. SILVA, V. P. R.; CORREIA, A. A.; COELHO, M. S. Analise de tendencia das series de precipitaao pluvial do Nordeste do Brasil. Revista Brasileira de Engenharia Agrıcola e Ambiental, v. 2, n. 1, p. 111–114, 1998. SILVEIRA, I. M.; VITAL, H.; AMARO, V. E., Vulnerabilidade e Sensibilidade da Região Costeira de Guamaré-RN. In: SIMPÓSIO DE GEOLOGIA DO NORDESTE, 17., 2001, Recife. Atas... Recife: SBG/NE, 2001. p.41. SILVA, J. X.; CARVALHO-FILHO, L. M.; SILVA, J. X. Índices de geodiversidade: aplicações de SGI em estudos de biodiversidade. In: GARAY, I.; DIAS, B. F. S. (Orgs.). Conservação da biodiversidade em ecossistemas tropicais: avanços conceituais e revisão novas metodologias de avaliação e monitoramento . Rio de Janeiro: Vozes, 2001. p. 299-316. ______. Estudo evolutivo das condições ambientais da região costeira do município de Guamaré – RN. 2002. 172 f. Dissertação (Mestrado em Geodinâmica e Geofísica) Universidade Federal do Rio Grande do Norte, Pós-Graduação em Geodinâmica e Geofísica, Natal, RN, 2002.

170
SIQUEIRA, M. F.; PETERSON, A.T. Consequences of global climate change for geographic distributions of cerrado tree species. Biota Neotropica, v. 3, n. (2), 2003. Disponível em: http://www.biotaneotropica.org.br/v3n2/pt/download?article+BN00803022003+it . Acesso em: 12 ago. 2009. SNOUSSI, M.; OUCHANI, T.; NIAZI, S. Vulnerability assessment of the impact of sea level rise and flooding on the Moroccan coast: the case of the Mediterranean eastern zone. Estuarine, Coastal and Shelf Science, v. 77, p. 206–13, 2008. SOUTO, M. V. S. Analise da Evoluçao costeira do litoral setentrional do estado do Rio Grande do Norte, Regiao sob influencia da industria petrolífera. 2009. 177 f. Tese (Doutorado em Geodinâmica e Geofísica) – Universidade Federal do Rio Grande do Norte, Programa de Pós-Graduação em Geodinâmica e Geofísica, Natal, RN, 2009. SOUZA, E. B. Um estudo observacional sobre o Padrão Dipolo de anomalias de Temperatura superficial do Mar no oceano Atlântico Tropical. 1997. Dissertação (Mestrado em Meteorologia) - Instituto de Pesquisas Espaciais (INPE), 1997. SOUZA, E.B. et. al. Desvios percentuais da precipitação na estação chuvosa do semi-árido nordestino durante os anos de E1 Nino e La Nina no Pacifico Tropical e fases do Padrão Dipolo no Atlântico Tropical. In: CONGRESSO BRASILEIRO DE METEOROLOGIA. Anais em CD ROM, 1998. STABINSKI, L. et. al. Reframing HIV and AIDS. British Medical Journal, v. 327, p. 1101–1103, 2003. STEINBERG, T. The secret history of natural disaster. Environmental Hazards, v. 3, p. 31-35, 2001. STERN, N. “Growth Theories, Old and New, and the Role of Agriculture in Economic Development”. Economic and Development Paper 136. Food and Agriculture Organisation of the United Nations: Rome, Italy, 1996. SUDENE. Folha Areia Brancal. Articulacao SB-24-X-B-IV. Secretaria de Planejamento da Republica, SUDENE – Diretoria de Geodesia e Cartografia, Superintendencia de Cartografia. Carta do Brazil – Escala 1: 100.000, 1983. SUNAMURA, T. Processes of sea cliff and platform erosion. In: KOMAR, P. D. (Ed.). CRC Handbook of Coastal Processes and Erosion. Boca Raton: CRC Press, 1983. p. 233–265 SWIFT, J. Why are rural people vulnerable to famine. IDS Bulletin, v. 20, n. 2, p. 8–15, 1989. TAINTER, S. P. Bluff slumping and stability: a consumer's guide. Michigan Sea Grant, Ann Arbor, MI, publication MICHU-SG-82-902, 65, 1982. THIELER, E. R.; HAMMER-KLOSE, E. S. National assessment of coastal vulnerability to sea level rise, U.S. Atlantic coast. U.S. geological survey open-file report, p. 99- 593, 1999.

171
THOMAS, C. D. et. al. Extinction risk from climate change. Nature. v. 427, n. 8, 2004. TIMMER, P. “The Agricultural Transformation”. In: CHENERY, H.; SRINIVASAN, T.N. [eds], Handbook of Development Economics. North-Holland, 1988. v. 1. UNEP. Global outlook for ice and snow. United Nations Environment Programme, 2007. Disponível em: http://www.unep.org/geo/geo_ice/. Acesso em: 13 ago. 2009. UNFCCC. Report on the Latin American Regional Workshop on Adaptation. FCCC/SBI/2006/19. UN Office at Genebra. Switzerland. 10 pp., 2006d. Disponível em: http://unfccc.int/resource/docs/2006/sbi/eng/19.pdf. Acesso em: 18 nov. 2008. UNITED Nations. Cities in a Globalising World: Global Report on Human Settlements 2001. United Nations Centre for Human Settlements (HABITAT), Earthscan, London, 2001. VITAL, H.; SAMIA, F.; MOAB, P. G. Response of the Apodi-Mossoró estuary-incised valley system (NE Brazil) to sea-level fluctuations. Brazilian journal of Oceanography, n. 58 (special issue PGGM), p. 13-24, 2010. VOGEL, S. J. “Structural Changes in Agriculture: Production Linkages and Agricultural Demand-Led Industrialization.” Oxford Economic Papers, v. 46, n. 1, p. 136-156, 1994. WACKERNAGEL, M.; REES, W.E. Our ecological footprint: reducing human impact on the earth. Gabriola Island, BC / Philadelphia: New Society Publishers, 1996. PA. ISBN 086571312X, 1996. WARRICK, R. A. Drought in the US Great Plains: shifting social consequences? In: HEWITT, K. (Ed.). Interpretations of Calamity. Boston: Allen & Unwin Inc., 1983. pp. 67–82 ______. et. al. Changes in sea level. In: HOUGHTON, J. T. et. al. (Eds.), Climate Change 1995. The Science of Climate Change. Cambridge, UK: Cambridge University Press, 1996. p. 365e405. WEBB, C. A.; BUSH, D. M.; YOUNG, R. S. Property damage mitigation lessons from Hurricane Opal: The Florida panhandle coast, October 4, 1995. Journal of Coastal Research, v. 13, n. 1, p. 246-52, 1995. WELCH, R.; JORDAN, T. R.; EHLERS, M. Comparative evaluations of the geodetic accuracy and cartographic potential of LANDSAT-4 and LANDSAT-5, 1985. WISNER, B. The political economy of hazards: more limits to growth?. Environmental Hazards, v. 20, p. 59-61, 2001. WFP -World Food Program. “Reducing Poverty and Hunger: The Critical Role of Financing for Food, Agriculture, and Rural Development” Paper prepared for the International Conference on Financing for Development. Monterrey, Mexico, 18-22 March, 2002.
172
WRATHALL, J. E. The hazard of forest fires in southern France. Disasters, v. 9, n. 2, p. 104–114, 1985. Wright, L.D. et. al. The morphodynamic effects of incident wave groupiness and tide range on an energetic beach. Mar. Geol., p. 74, 1–20, 1987. WWF. Climate Change Impacts in the Amazon – Review of scientific literature, World Wide Fund for Nature, Presentation at the 8th UN Conference of the Parties to the Biodiversity Convention, 2006. YOHE, G.; TOL, R.S.J. Indicators for social and economic coping capacity: moving toward a working definition of adaptive capacity. Global Environmental Change, v. 12, p. 25–40, 2002. YOUNG, R. S.; THIELER, E. R.; PILKEY, O. H. Opinion: geologic and oceanographic factors mitigating the storm surge and flood damage of Hurricane Andrew in south Florida. Geology, v. 21, n. 2, p. 99, 1993.
Related Documents