Available online at www.centmapress.org Proceedings in System Dynamics and Innovation in Food Networks 2016 190 DOI 2016: pfsd.2016.1622 Consumers’ Acceptance and Attitude towards Bioactive Enriched Foods Adrienn Hegyi, Zsófia Kertész, Tünde Kuti, András Sebők Campden BRI Magyarország Nonprofit Kft., 1096 Budapest, Haller u. 2. Hungary [email protected] , [email protected] ), [email protected] , [email protected] Corresponding author: [email protected] ABSTRACT The aim of our research was to explore the consumers’ attitude towards healthy diet and food consumption and measure the acceptance of these types of products on the product portfolio developed in PATHWAY-27 projects. The benefit of the experiment was to have a better understanding on HTAS based questionnaire with using real prototypes of bioactive enriched foods with potential health claims. The results showed clearly, that unusual appearance and flavour have negative effect on the opinion of the product and the positive health effect also increases the acceptance of the products. Keywords: HTAS; functional foods; sensory test; bioactive enriched foods 1 Introduction Non-communicable diseases (NCDs) have shown high prevalence in the last decades. Four main types of non- communicable diseases are cardiovascular diseases (like heart attacks and stroke), cancers, chronic respiratory diseases (such as chronic obstructed pulmonary disease and asthma) and diabetes. These diseases are responsible for the death of 38 million people each year. Cardiovascular diseases account for most NCD deaths, or 17.5 million people annually, followed by cancers (8.2 million), respiratory diseases (4 million), and diabetes (1.5 million) (WHO, 2015). World Health Organization determined the main forces which drive these diseases, and unhealthy diet, lifestyle and physical inactivity is among them. Dietary recommendations and nutrition education campaigns have tried to increase the awareness toward the relationship between health and the content of diet. Because of that changes in consumers’ food choices have been detected, today food not just satisfies hunger and provides the necessary nutrients for individuals but also helps in prevention of nutrient-related diseases and contributes to the improvement of well-being. The changes in consumer trends influences the new product development. Food and drink industry constantly tries to satisfy the consumers’ demand. The most important factor in determining food choice is taste. Consumers seek appetising and delicious food products. The healthy content of each product in most cases is generally found to be second to taste (Steptoe & Pollard, 1995; Contetno, et al. 2006). Furthermore, foods touted for their healthful properties are perceived as poor tasting. Taste is enhanced by ingredients that are

Welcome message from author
This document is posted to help you gain knowledge. Please leave a comment to let me know what you think about it! Share it to your friends and learn new things together.
Transcript

Available online at www.centmapress.org
Proceedings in System Dynamics and Innovation in Food Networks 2016
190 DOI 2016: pfsd.2016.1622
Consumers’ Acceptance and Attitude towards Bioactive Enriched Foods Adrienn Hegyi, Zsófia Kertész, Tünde Kuti, András Sebők Campden BRI Magyarország Nonprofit Kft., 1096 Budapest, Haller u. 2. Hungary
[email protected], [email protected]), [email protected], [email protected]
Corresponding author: [email protected]
ABSTRACT
The aim of our research was to explore the consumers’ attitude towards healthy diet and food consumption
and measure the acceptance of these types of products on the product portfolio developed in PATHWAY-27
projects. The benefit of the experiment was to have a better understanding on HTAS based questionnaire with
using real prototypes of bioactive enriched foods with potential health claims. The results showed clearly, that
unusual appearance and flavour have negative effect on the opinion of the product and the positive health
effect also increases the acceptance of the products.
Keywords: HTAS; functional foods; sensory test; bioactive enriched foods
1 Introduction
Non-communicable diseases (NCDs) have shown high prevalence in the last decades. Four main types of non-
communicable diseases are cardiovascular diseases (like heart attacks and stroke), cancers, chronic respiratory
diseases (such as chronic obstructed pulmonary disease and asthma) and diabetes.
These diseases are responsible for the death of 38 million people each year. Cardiovascular diseases account
for most NCD deaths, or 17.5 million people annually, followed by cancers (8.2 million), respiratory diseases (4
million), and diabetes (1.5 million) (WHO, 2015).
World Health Organization determined the main forces which drive these diseases, and unhealthy diet, lifestyle
and physical inactivity is among them. Dietary recommendations and nutrition education campaigns have tried
to increase the awareness toward the relationship between health and the content of diet.
Because of that changes in consumers’ food choices have been detected, today food not just satisfies hunger
and provides the necessary nutrients for individuals but also helps in prevention of nutrient-related diseases
and contributes to the improvement of well-being.
The changes in consumer trends influences the new product development. Food and drink industry constantly
tries to satisfy the consumers’ demand. The most important factor in determining food choice is taste.
Consumers seek appetising and delicious food products. The healthy content of each product in most cases is
generally found to be second to taste (Steptoe & Pollard, 1995; Contetno, et al. 2006). Furthermore, foods
touted for their healthful properties are perceived as poor tasting. Taste is enhanced by ingredients that are

Hegyi et al. / Proceedings in System Dynamics and Innovation in Food Networks 2016, 190-208
191 DOI 2016: pfsd.2016.1622
over consumed by most consumers – sweeteners, salt and fat. Consumers may even have expectations that
unhealthy food (i.e. food high in fat, sweeteners and salt) tastes better (Thunström & Nordström, 2012).
In the framework of PATHWAY-27 EU funded project, bioactive enriched foods (BEFs) were developed.
Bioactive compounds used for the enrichments caused unusual sensorial characteristics in all developed
products.
Aim of our research was to estimate the value of the sacrifice the consumers willing to make in order to
consume healthy products.
2 Methods 2.1 Tested products
In PATHWAY-27, six products were developed. Bakery matrix includes biscuit and bun, the dairy products were
combined dessert and milk shake and egg-based products were pancake and omelette. All products were
presented in 5 variation. Three bioactive components and their combinations were used as enrichments,
namely beta-glucan (BG), anthocyanin (AC) and docosahexaenoic acid (DHA) (Table 1).
Table 1: Products presented during the tasting session
Matrix type Product Enrichments*
Bakery products Biscuits 5 enrichments (BG; AC; DHA; BG+DHA; AC+DHA)
Buns 5 enrichments (BG; AC; DHA; BG+DHA; AC+DHA)
Dairy products Combined dessert 5 enrichments (BG; AC; DHA; BG+DHA; AC+DHA)
Milk shake 5 enrichments (BG; AC; DHA; BG+DHA; AC+DHA)
Egg-based products Pancake 5 enrichments (BG; AC; DHA; BG+DHA; AC+DHA)
Omelette 5 enrichments (BG; AC; DHA; BG+DHA; AC+DHA)
*beta-glucan (BG), anthocyanin (AC) and docosahexaenoic acid (DHA)
2.2 Sensory assessment
For the sensory profiling, a trained sensory panel was used. Assessors were selected and recruited, trained in
compliance to ISO standards. Continuous panel performance and monitoring techniques were also in place to
ensure all assessors maintain a high level of competence. The samples were evaluated by using descriptive
profiling. Assessors were trained to recognise different quality levels of the key attributes. 8 assessors assessed
the blind coded samples in 2 replicates according to the experimental design (Williams Latin square) in
randomized order to minimize the possible carry over effects. For each attribute, each assessor scored the
product on a 0-9 category scale. The test was carried out in a sensory laboratory. Each assessor was required to
undertake the tests in an individual booth. The panel used filtered water as palate cleansers between the
samples.
2.3 On-line survey
The Health and Taste Attitude Scales (HTAS) based questionnaire consisted of four parts (Roininen et al., 2001).
First part contained socio-demographic questions (e.g. age, sex etc.). This part is not explained in this article.
Second part included questions related to attitude, behaviour of the consumers towards health and diet.
Questions related to attitude towards functional foods were in the third part of the questionnaire. In the fourth
part, photos were presented to the consumers to evaluate the appearance of the experimental samples
developed in PATHWAY-27. A 9-point hedonic scale was used to measure the liking. 360 consumers filled the
on-line survey developed by Compusens-at hand©
2.4 Tasting sessions
.
Hegyi et al. / Proceedings in System Dynamics and Innovation in Food Networks 2016, 190-208
192 DOI 2016: pfsd.2016.1622
The 3 different product matrixes (bakery, dairy, egg) were evaluated by different 120-120 participants, who
were consumers of the product type and willing to try out new foods and drinks. Participants received full
briefing about the test procedure and the type of the products.
The samples were presented individually, according to the experimental design (Williams Latin Squares). The
same codes were used for all respondents. The milk shake and the combined dessert were served in pre-coded
white coloured plastic cup, the bakery and egg products on pre-coded plastic plate. Mineral water was
provided for the respondents as palate cleanser between each sample.
The questionnaire contained questions on overall attributes of appearance, aroma, flavour and texture. These
questions had a 9-point hedonic scale, where top of the scale (9 point) indicates the highest liking and bottom
of the scale means the disliking. Beside the main attributes, the extended list contained specific attributes as
colours (e.g. yellow, purple), aromas (e.g. cereal, baked dough, vanilla), flavours (e.g. sweet, sour, egg),
aftertaste or textures (e.g. thickness, softness or crispness) to score. These attributes were scored on a JAR
(just about right)-scale, which is a 5-point scale where
• the middle point means ‘just about right’
• the left part of the scale means that the attribute is evaluated as too low, and
• the right side of the scale indicates that the intensity of the attribute is too high.
In addition they were asked to indicate how much they liked the product in overall, even considering the
healthiness of the product, and how they are likely to buy the products.
2.5 Methods of evaluation
The hedonic data were analysed by using analysis of variance (ANOVA) to determine if there were significant
differences between the samples with respect to preference. A two way (respondent, sample) ANOVA was
performed. Following ANOVA, a Tukey multiple comparison test was undertaken to establish which samples
were different at the 5% level of significance. Samples marked with the same letters are not significantly
different from each other.
Analysis of Variance
In order to identify respondents, who had similar attribute utility patterns, cluster analyses were used. These
were determined by performing Ward’s Hierarchical cluster analysis and observing the agglomeration
schedule.
Cluster analysis
XL-STAT and FIZZ statistical softwares were used for evaluation of the data.
Software
3 Results 3.1 Results of the on-line survey
3.1.1 Result of the Cluster analysis
Cluster analysis was performed on the questions included in the second part of the questionnaire. Those
questions were aiming the attitude and the behaviour of the consumers towards health and diet. After
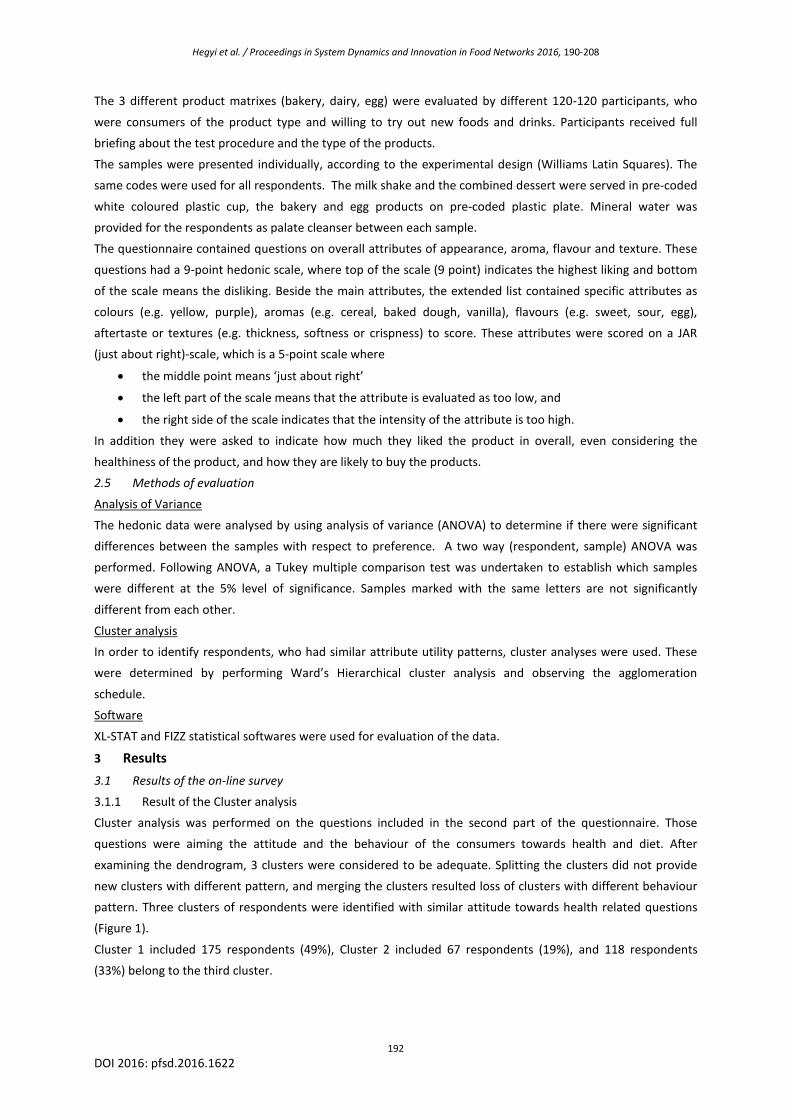
examining the dendrogram, 3 clusters were considered to be adequate. Splitting the clusters did not provide
new clusters with different pattern, and merging the clusters resulted loss of clusters with different behaviour
pattern. Three clusters of respondents were identified with similar attitude towards health related questions
(Figure 1).
Cluster 1 included 175 respondents (49%), Cluster 2 included 67 respondents (19%), and 118 respondents
(33%) belong to the third cluster.
Hegyi et al. / Proceedings in System Dynamics and Innovation in Food Networks 2016, 190-208
193 DOI 2016: pfsd.2016.1622
Figure 1: Dendogram of the cluster analysis
All consumers consider themselves as health conscious, but the level of that which tell them apart.
Respondents in Cluster 1 can be described as ‘extreme health conscious consumers’. Their health is a centre
point of their life, always examine their status and visit regularly their doctors. Notwithstanding, they do not
consider very important the composition of their food: higher vitamin and mineral content, additives and
artificial flavourings had slight impact on their food choices.
Cluster 2 included consumers who pay attention to their health and diet, however they strive for delicious food
consumption. Furthermore, they are more particular about the composition of the food. They prefer meals
with high vitamin, mineral content and low cholesterol/fat level and try to avoid additives in their food.
Cluster 3 is a transition between Cluster 1 and 2. These consumers are also health conscious, they try to follow
healthy diets, and although they priority the composition of the food, the enjoyment of food also has an impact
on their food choices. They prefer if their food contains high quantity of vitamins and minerals, and organically
grown vegetables just as Cluster 2. They try to avoid consuming processed food and food with additives.
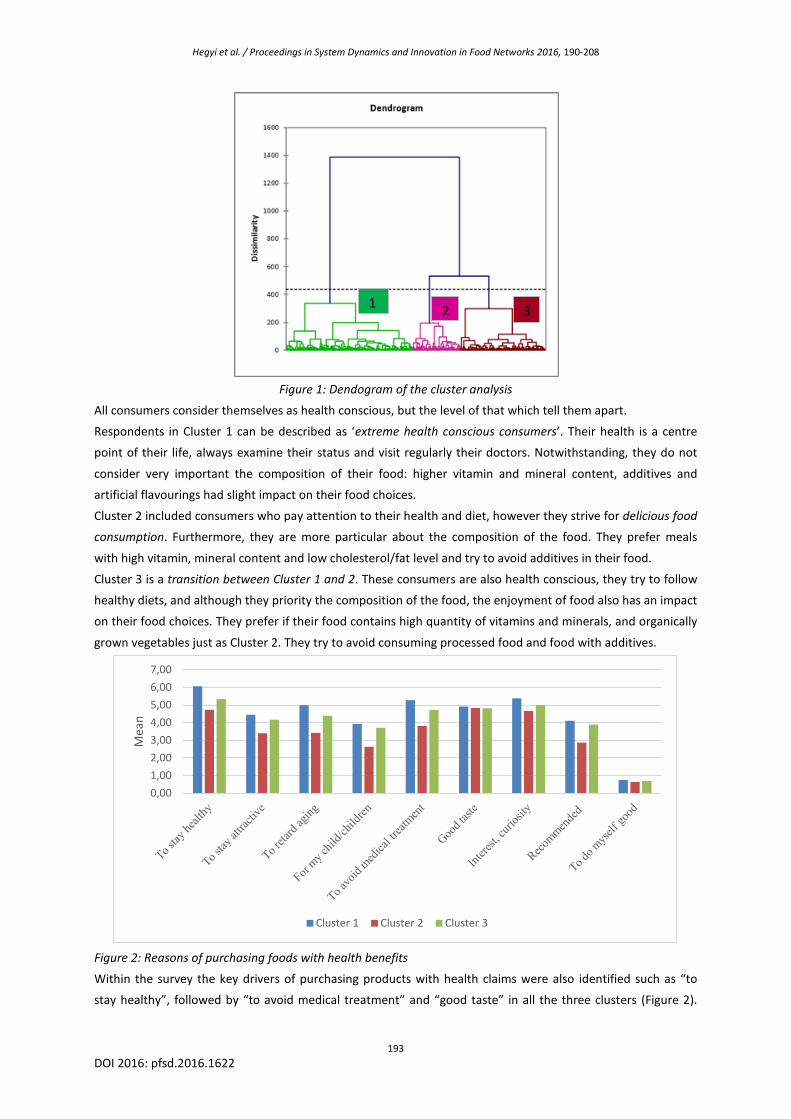
Figure 2: Reasons of purchasing foods with health benefits
Within the survey the key drivers of purchasing products with health claims were also identified such as “to
stay healthy”, followed by “to avoid medical treatment” and “good taste” in all the three clusters (Figure 2).
0,00 1,00 2,00 3,00 4,00 5,00 6,00 7,00
Mea
n
Cluster 1 Cluster 2 Cluster 3
1 2 3

Hegyi et al. / Proceedings in System Dynamics and Innovation in Food Networks 2016, 190-208
194 DOI 2016: pfsd.2016.1622
This suggests that food with health claims has not only to be “functional”, i.e. have an effect on the health and
well-being of consumers, it has also to be “food” in that consumers expect it to taste good. The main results
matched the conclusions reported in several studies such as Mintel in UK, 2013; by JRC SCIENTIFIC AND
TECHNICAL REPORTS, 2008. At the JRC study the reasons for not buying “functional” food were investigated
and showed a very heterogeneous picture in the examined four EU countries (Spain, Germany, UK, Poland),
including general concerns about novel food, bad taste, preference for organic food, focus on the present
rather than on the future, absence of illness, fear of side effects, aversion towards artificial additives, distrust of
effectiveness and price.
3.1.2 Results of the tasting sessions – Acceptance of the BEF products
The aim of the tasting session was to evaluate the consumers’ acceptance towards the developed BEFs. In
order to have a clear picture about the food products developed in the project different approaches were used,
such as products were shown on images, were tasted by consumers and sensory assessors, etc. The type of
enrichment influenced the acceptance of the products. Using penalty analysis, we identified those attributes
which had high impact on the overall liking of the tested products, but this is not part of this article.
3.1.2.1 Sensory assessment
Buns
The buns could be divided into two groups regarding their colours of crust and crumb. The samples enriched
with AC had a brown and lilac in colour crust and crumb. Buns with DHA and BG had yellow in colour crust and
crumb.
The samples had moderate cereal, baked dough and anise aromas. Buns enriched with DHA had slightly
stronger cereal and baked dough aroma than the other buns. Sample with AC had the most intense anise
aroma from all samples. Off-note, fish aroma or other aromas were not mentioned.
The samples had cereal, sweet and anise flavours with slight bitter aftertaste. Regarding anise flavour the same
trend appeared than aroma: buns with AC had the most intense anise flavour. Off-flavour, fish flavour or other
flavours were not mentioned. The samples with DHA had significantly crustier crust and less easy to chew and
soft textures.
Biscuits
All biscuit samples were uneven sized and baked unevenly which influence the colour of the samples. The
samples enriched with AC were lilac and brown in colour biscuits, while DHA and BG containing biscuits were
yellow and brown in colour samples.
All sample had moderate cereal and sweet biscuit aromas, biscuits with BG had significantly stronger sweet
biscuit aroma than the other samples. All DHA containing biscuit had slight fish aroma, and samples with AC
had weak anise aroma. Off-note or other aromas were not mentioned.
All sample had sweet and baked dough flavours. Biscuits enriched with AC and BG had the most intense sweet
and baked dough flavours. The weak anise flavour was mentioned regarding biscuits with AC mostly. Off-
flavour or other flavours were not mentioned. Biscuits enriched with AC and BG were very hard to chew and
crispy and had less residue in the mouth.
Pancakes
Pancakes with AC were deep lilac in colour with slight brown tone while samples enriched in DHA or BG (or
their combination) were yellow in colour pancakes with slight brown tone.
The pancakes had sweet, egg aromas, from all samples BG enriched versions were the sweetest pancake
samples. All three pancakes with DHA had fishy tone and pancakes enriched in AC had burnt aroma as well.

Hegyi et al. / Proceedings in System Dynamics and Innovation in Food Networks 2016, 190-208
195 DOI 2016: pfsd.2016.1622
All pancakes had sweet, egg and slight salty flavours. Samples with DHA also had fishy flavours. Pancake
enriched in BG had the strongest sweet flavour. Pancake with BG and DHA+BG had spongier texture than the
other samples.
Omelette
As the chilled products, frozen omelettes also can be grouped by their colour: Samples with AC was blue in
colour with slight brown and grey tone while the other three omelettes was yellow in colour. The most intense
yellow colour was belong to the omelette enriched in DHA. All sample had slight brown tone from the
preparing and they were also slight grey in colour. Omelette enriched in AC was slightly wrinkled.
All omelettes had mild egg aroma. Omelette enriched in DHA had significantly stronger egg aroma compare to
the others. Some fishy note was also mentioned during tasting of samples enriched in DHA. Omelette with BG
had sweet and baked egg aroma as well.
Samples had egg and salty flavours. Omelettes with AC and DHA+AC had the most intense salty flavour, while
samples enriched in DHA had the strongest egg flavour. Fishy note was also perceived in case of omelette with
DHA. Omelettes with AC was significantly drier and less dense compared to the others. The densest textured
samples were omelettes enriched in DHA and DHA+BG.
Combined desserts
As powders AC was intense lilac in colour, and DHA had the most intense yellow colour as powder, DHA+AC
together was grey in colour powder. After preparing, the samples with AC were lilac in colour, the other three
sample was yellow and grey in colour combined desserts. Except from AC, all products contained lumps as
powders and as ready to consume products as well. The dessert with DHA was the less homogenous sample.
All powder had the aroma which refer to the origin of the bioactive component: AC had slight grape aroma;
DHA had fish aroma; BG had grain aroma. In cases of the combined powders, the fish aroma was also
perceived. After preparing, the aroma of Mont Blanc dessert dominated over the powders’ aroma. The samples
had vanilla and caramel aromas. The very weak fish aroma of the DHA enriched samples were also perceived,
while the AC enriched desserts lost their grape aromas.
All BEFs had sweet, vanilla and caramel flavours from the Mont Blanc dessert. Main difference between the
samples were the floury flavour, samples with BG had the most intense floury flavour and weak vanilla and
sweet flavour. Desserts enriched with DHA had weak fish flavour.
Combined desserts enriched with BG left a very sticky mouth feel, and they had the grainiest texture. Same as
the appearance enriching desserts with DHA resulted products with small-sized lumps.
Milkshake
The main difference between the samples was the intensity of the colours as powders and as ready to consume
products. While the milk shakes enriched with AC were lilac in colour, the samples containing DHA and BG were
yellow in colour. Adding beta-glucan to the samples resulted slight greyish appearance. The milk shakes with
DHA were the less homogenous samples, small sized lumps appeared in the powders and the prepared milk
shakes as well.
All powder sample had vanilla aroma, however in cases of samples enriched with DHA and DHA+AC, fish aroma
was also perceived. The ready to consume milk shake samples also can be described as products with vanilla
aroma, but weak fish aroma was only perceived in DHA+AC enriched versions.
The samples had moderate intense vanilla and sweet flavours. Milk shake with AC and DHA had the most
intense sweet and vanilla flavours from all samples while, these products had the least intense floury flavour.
Adding BG to the samples resulted significantly higher intensity of floury flavour. Fish flavour was perceived in
DHA enriched milk shakes. Milk shakes enriched with BG left a very sticky mouth feel, and they had the

Hegyi et al. / Proceedings in System Dynamics and Innovation in Food Networks 2016, 190-208
196 DOI 2016: pfsd.2016.1622
grainiest texture. Same as the appearance the enriching milk shakes with DHA resulted products with small-
sized lumps.
3.1.2.2 Consumer acceptance
Adding anthocyanin to the products, resulted an unusual, extraneous lilac in colour appearance. Both bakery
and egg-based products with not conventional appearance obtained significantly lower scores than the other
products. In case of the diary category, lilac appearance did not affect negatively the opinion of the consumers
as they expected berry flavour from lilac products.
DHA can cause fishy aroma and flavour in foods, but it was detected minimally by the consumers. All six
products with DHA kept its usual appearance which resulted that DHA enriched products received significantly
higher scores than the other products.
Beta-glucan has high water absorption capacity which cause that products with beta-glucan had compact and
thick texture. It caused slight grey tone in some product but it was not evaluated negatively, however, milk
shakes and combined desserts with BG had very thick and floury texture which had a negative effect on the
acceptance of the products.
Following the European trends, taste (with a connection to aroma and texture) influences mainly the food
choice of the consumers (FoodDrinkEurope, 2015). Our results also proved that the overall liking of all products
corresponded with liking of aroma, flavour or texture, but also highlighted the importance of the appearance.
The results also showed that the possible health promoting effect of the products increased the acceptance of
the products (Appendix).
3.1.3.3. Consumer acceptance of experimental product photos
The last part of the on-line questionnaire included photos of the experimental samples. The participants were
asked to evaluate the photos of the products. When we compared the overall liking of the products with the
opinion of the photos the same liking trends were shown. Products with familiar and usual appearance had
higher liking scores. The overall liking scores usually higher than the scores of the photos. Especially, in case of
BG enriched version of milk shake and combined dessert. The very thick appearance and the greyish tone of
the product was off-putting for most participants. Same can be observed in case of pancakes and omelettes
with AC. The strange lilac appearance caused that the consumers evaluated negatively the photos.
Bakery products
Regarding the buns, samples with more conventional appearance (yellow, light brown in colour with grey tone)
had higher score than the samples enriched in AC. Bun enriched in BG got the highest score.
In case of the biscuits, sample with BG and DHA had the most desirable appearance, while biscuit with AC got
the lowest scores. Consumers better accepted biscuits with slight unusual appearance: biscuits with AC+DHA
had almost the same score than version enriched in BG which had a more traditional look (Figure 3).

Hegyi et al. / Proceedings in System Dynamics and Innovation in Food Networks 2016, 190-208
197 DOI 2016: pfsd.2016.1622
Figure 3: Acceptance of the photos presented bakery products
Egg based products
Difference in the evaluation of the egg products were more noticeable.
Both egg products enriched in BG and DHA, having a more appealing and conventional appearance, got
significantly higher scores than those enriched with AC (Figure 4).
Figure 4: Acceptance of the photos presented egg products
Dairy products
Regarding the dairy products, version enriched in DHA had higher score than the other products, probably
because these enrichments were bright yellow in colour, which match perfectly for a vanilla flavoured dessert
or a milk shake (Figure 5).
4,8 4,2
5,5 4,6
5,6 5,5 6,3
5,3 5,7 5,2
0,000 1,000 2,000 3,000 4,000 5,000 6,000 7,000
Biscuit AC
Bun AC
Biscuit AC+DHA
Bun AC+DHA
Biscuit BG
Bun BG
Biscuit BG+DHA
Bun BG+DHA
Biscuit DHA
Bun DHA
2,8 3,0 3,3 3,6
6,6
5,2
6,3
4,6
6,4
5,4
0,000
1,000
2,000
3,000
4,000
5,000
6,000
7,000

Hegyi et al. / Proceedings in System Dynamics and Innovation in Food Networks 2016, 190-208
198 DOI 2016: pfsd.2016.1622
Figure 5: Acceptance of the photos presented dairy products
The possibility of the three different clusters evaluated the presented photos differently was also examined.
Figure 6 shows that consumers in cluster 2 had a slight different opinion on the photos. They gave lower
acceptance scores than other cluster members and in some cases it caused significant differences (e.g. Bun-AC;
milk shake AC; milk shake AC+DHA; combined dessert AC+DHA; milk shake BG+DHA and omelette DHA).
Comments of the consumers highlighted that the samples enriched in AC had extraneous colour which not
match to a vanilla flavoured product. Related to milk shake enriched in BG and DHA, we can state that the main
reason of the lower scores was the thick appearance. Regarding the omelette with DHA, the sample was slight
paler than the consumers in cluster 2 expected and it had a more pancake-like appearance.
Figure 6: Compare the opinion of the clusters on the presented photos
3.1.3.4. Further analysis
Some additional analyses were done in order to find any possible correlation or relationship at least between
the results of on-line survey and the consumer tasting session.
3.1.2.3 Consumers’ clusters vs. overall acceptance of products
Possible influence of consumers’ clusters on overall acceptance of the products was evaluated, based on
3,5 4,0
3,7 4,2
4,6
5,9
4,4
5,8 5,6 6,2
0,000
1,000
2,000
3,000
4,000
5,000
6,000
7,000
0
1
2
3
4
5
6
7
Dependent variables
Summary (LS means) - Class
1 3 2
Hegyi et al. / Proceedings in System Dynamics and Innovation in Food Networks 2016, 190-208
199 DOI 2016: pfsd.2016.1622
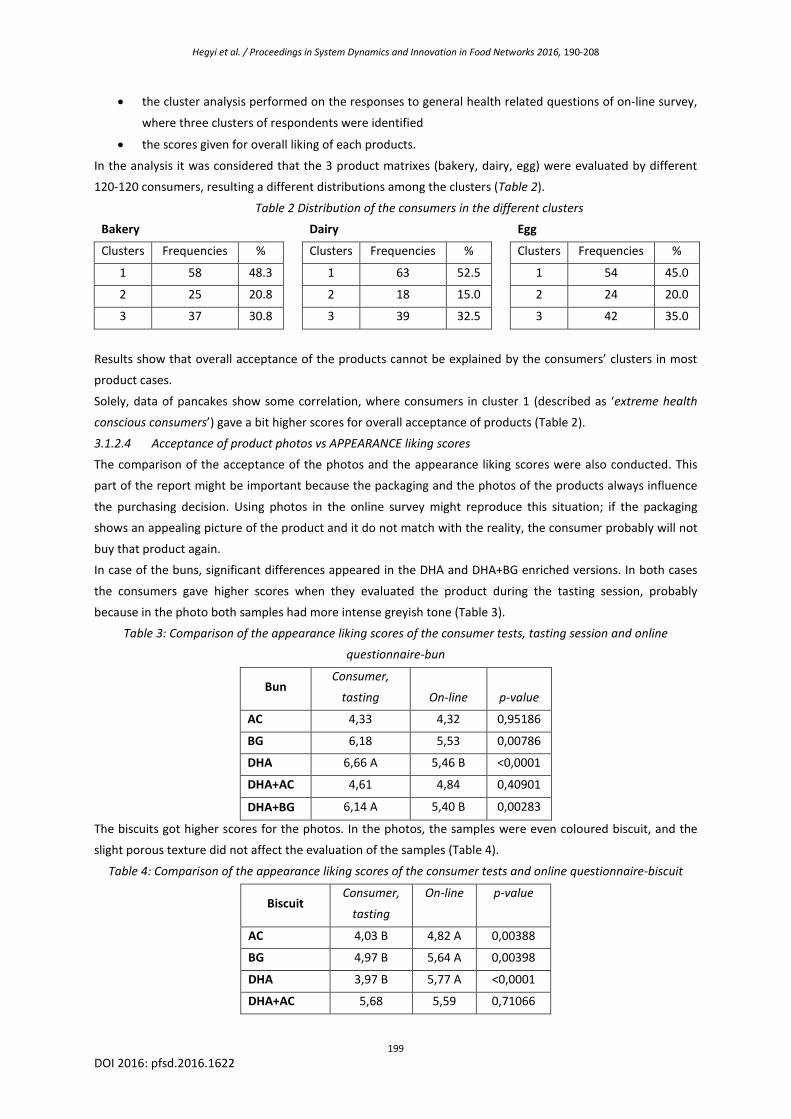
• the cluster analysis performed on the responses to general health related questions of on-line survey,
where three clusters of respondents were identified
• the scores given for overall liking of each products.
In the analysis it was considered that the 3 product matrixes (bakery, dairy, egg) were evaluated by different
120-120 consumers, resulting a different distributions among the clusters (Table 2).
Table 2 Distribution of the consumers in the different clusters
Bakery
Dairy
Egg
Clusters Frequencies %
Clusters Frequencies %
Clusters Frequencies %
1 58 48.3
1 63 52.5
1 54 45.0
2 25 20.8
2 18 15.0
2 24 20.0
3 37 30.8
3 39 32.5
3 42 35.0
Results show that overall acceptance of the products cannot be explained by the consumers’ clusters in most
product cases.
Solely, data of pancakes show some correlation, where consumers in cluster 1 (described as ‘extreme health
conscious consumers’) gave a bit higher scores for overall acceptance of products (Table 2).
3.1.2.4 Acceptance of product photos vs APPEARANCE liking scores
The comparison of the acceptance of the photos and the appearance liking scores were also conducted. This
part of the report might be important because the packaging and the photos of the products always influence
the purchasing decision. Using photos in the online survey might reproduce this situation; if the packaging
shows an appealing picture of the product and it do not match with the reality, the consumer probably will not
buy that product again.
In case of the buns, significant differences appeared in the DHA and DHA+BG enriched versions. In both cases
the consumers gave higher scores when they evaluated the product during the tasting session, probably
because in the photo both samples had more intense greyish tone (Table 3).
Table 3: Comparison of the appearance liking scores of the consumer tests, tasting session and online
questionnaire-bun
Bun Consumer,
tasting On-line p-value
AC 4,33 4,32 0,95186
BG 6,18 5,53 0,00786
DHA 6,66 A 5,46 B <0,0001
DHA+AC 4,61 4,84 0,40901
DHA+BG 6,14 A 5,40 B 0,00283
The biscuits got higher scores for the photos. In the photos, the samples were even coloured biscuit, and the
slight porous texture did not affect the evaluation of the samples (Table 4).
Table 4: Comparison of the appearance liking scores of the consumer tests and online questionnaire-biscuit
Biscuit Consumer,
tasting
On-line p-value
AC 4,03 B 4,82 A 0,00388
BG 4,97 B 5,64 A 0,00398
DHA 3,97 B 5,77 A <0,0001
DHA+AC 5,68 5,59 0,71066

Hegyi et al. / Proceedings in System Dynamics and Innovation in Food Networks 2016, 190-208
200 DOI 2016: pfsd.2016.1622
DHA+BG 5,28 B 6,34 A <0,0001
Both diary product enriched in BG got significantly higher scores for their appearance based on their photos. In
these cases, the thick texture of the samples might influence the consumers during the tasting session. On the
contrary, the AC enriched versions got lower points on the online session (Table 5).
Table 5: Comparison of the appearance liking scores of the consumer tests and online questionnaire- dairy
products
Milk shake Consumer, tasting On-line p-value
AC 4,54 4,05 0,08711
BG 4,33 B 6,12 A <0,0001
DHA 6,52 6,36 0,49497
DHA+AC 4,24 4,08 0,61017
DHA+BG 4,72 B 5,90 A <0,0001
Combined
dessert
Consumer, tasting On-line p-value
AC 4,32 A 3,40 B 0,00165
BG 3,66 B 4,84 A <0,0001
DHA 5,84 5,80 0,86000
DHA+AC 4,07 3,54 0,06936
DHA+BG 3,56 B 4,76 A <0,0001
Pancake enriched in DHA and DHA+BG got significantly higher scores during the tasting session that might be
explained by the interaction among different attributes that might have influenced the liking scores of the
appearance (Table 6).
Table 6: Comparison of the appearance liking scores of the consumer tests and online questionnaire- pancake
In case of the omelettes, in the photos the greyish tone did not appear, all omelettes enriched in DHA, BG or
their combination were very vivid yellow in colour, which match perfectly for an omelette (Table 7).
Table 7: Comparison of the appearance liking scores of the consumer tests and online questionnaire- omelette
Omelette Consumer,
tasting On-line p-value
AC 2,91 3,08 0,52130
BG 5,56 B 6,58 A <0,0001
DHA 6,90 6,67 0,22183
DHA+AC 2,93 B 3,53 A 0,02819
DHA+BG 5,57 B 6,41 A 0,00029
Pancake Consumer,
tasting
On-line p-value
AC 3,25 3,20 0,84894
BG 5,48 5,13 0,21759
DHA 6,50 A 5,42 B <0,0001
DHA+AC 3,18 3,70 0,05550
DHA+BG 5,96 A 4,53 B <0,0001

Hegyi et al. / Proceedings in System Dynamics and Innovation in Food Networks 2016, 190-208
201 DOI 2016: pfsd.2016.1622

Hegyi et al. / Proceedings in System Dynamics and Innovation in Food Networks 2016, 190-208
202 DOI 2016: pfsd.2016.1622
4 Conclusion
Consumer acceptance test was organized with an involvement of 360 Hungarian consumer in order to
determine their opinion on health diet and functional foods. Furthermore, to test the acceptance of food
prototypes developed in PATHWAY-27.
HTAS based questionnaire was used to evaluate the attitude towards health. All participants evaluated
themselves as health conscious. By a cluster analysis we were able to separate the respondents in three
clusters by their level of attention towards healthy diet and lifestyle.
• cluster 1 consumers try very hard to follow a healthy lifestyle and diet, they are able to sacrifice the
good taste of the food for that goal. However, the composition of food is not that important for them.
• cluster 2 members also examine their health and try to follow balanced diet, but they also think that
food should be a pleasure.
• cluster 3 consumers had some common opinion with both clusters. For them the content of the meal
and the enjoyment of food had also a great impact on their purchasing decision.
The evaluation of the presented photos and the results of the tasting session also resulted that consumer
prefer products with familiar, usual appearance. In general it can be stated that the products received
moderate liking scores and differences between caused by the different enrichments. DHA enriched products
were the most popular as the sensorial attributes of the product were similar to products which are purchased
every day. While lilac in colour pancakes, omelettes and buns were evaluated negatively by their unusual
appearance.
It also appears that the overall linking of products corresponding the acceptance of aroma and taste attributes.
This explains that AC and AC+DHA enriched dairy products got slightly higher liking scores. However, these
products were lilac in colour, they had sweet vanilla aroma and flavour with a liquid texture. Consumers
reported that they expected berry flavour because of the colour of the products so it was not off-putting for
them.
Many products with health claim is some kind of fortified products, which means that some of their sensory
attributes might differ significantly from the usual products. That makes necessary to determine the
acceptance border of the consumers as they are willing to make sacrifices to eat healthier meals and the
possible health promoting effect of a food is influence their acceptance positively, but taste is still one of the
most important factor which influence their food choice.
The benefit of the experiment was to have a better understanding on HTAS based questionnaire with using real
prototypes food matrix with potential health claims in laboratory condition. As the next tasks of PATHWAY-27,
the products are involved in human intervention studies when the consumers can test the product in real-use
conditions as they consume the test products at their home. The experience from consumer survey and further
tests give practical input to the guideline for the industry developed in the project.
5 Acknowledgements
The research leading to these results has received funding from the European Union Seventh Framework
Programme (FP7/2007-2013) under grant agreement n°311876: PATHWAY-27. The authors thank to AINIA and
DPL for providing the bakery samples. Thanks also due to Adexgo Kft. for the egg-based and dairy products.

Hegyi et al. / Proceedings in System Dynamics and Innovation in Food Networks 2016, 190-208
203 DOI 2016: pfsd.2016.1622
6 References
Contetno, I., Williams, S., M. J., & Franklin, A. (2006). Understanding the food choice process of adolescents in
the context of family and friends. Journal of Adolescent Health,, 38, 5, 575-82.
FoodDrinkEurope. (2015). European Food and Drink Industry 2014-2015. Retrieved from
www.fooddrinkeurope.eu:
http://www.fooddrinkeurope.eu/uploads/publications_documents/Data_and_Trends_2014-
20152.pdf
JRC SCIENTIFIC AND TECHNICAL REPORTS. (2008). Functional Foods in the European. Retrieved from
http://ftp.jrc.es/EURdoc/JRC43851.pdf
Roininen , K., Tuorila , H., Zandstra , E., de Graaf , C., Vehkalahti , K., Stubenitsky, K., & Mela , D. (2001).
Differences in health and taste attitudes and reported behaviour among Finnish, Dutch and British
consumers: a cross-national validation of the Health and Taste Attitude Scales (HTAS). Appeatite,
37(1):33-45.
Steptoe, A., & Pollard, ,. T. (1995). Development of a measure of the motives underlying the selection of food:
The food choice questionnaire. Appetite, 25, 267–284.
Thunström, L., & Nordström, J. (2012). The Importance of Taste for Food Demand and the Experienced Taste
Effect of Healthy Labels. http://www.hur.nu/wp-content/uploads/2014/07/2012-The-importance-of-
taste-for-food-demand-and-the-expected-taste-effect-of-healthy-HUIwp68.pdf, (accessed 2016.01.28).
WHO. (2015, Updated January 2015 accessed 2016.01.28.). Noncommunicable diseases Fact sheet. Retrieved
from World Health Organization : http://www.who.int/mediacentre/factsheets/fs355/en/
7 Appendix
Table 8: ANOVA summary table- Biscuits
Attribute Biscuit
DHA BG Biscuit DHA
Biscuit AC
Biscuit DHA AC
Biscuit BG
Probe
Appearance appearance 5.28 AB 1 5.67 A 4.03 C 3.98 C 4.97 B <0.0001 *** purple colour 1.88 C 2 1.94 C 3.52 A 2.88 B 1.93 C <0.0001 *** yellow 2.59 A 2 2.61 A 2.02 B 2.01 B 2.60 A <0.0001 *** brown 2.34 AB 2 2.20 AB 2.14 B 2.46 A 2.34 AB 0.0107 *
Aroma aroma 4.78 A 1 5.00 A 5.08 A 4.11 B 5.30 A <0.0001 ***
cereal 2.64 2 2.79 2.68 2.74 2.63 0,4071 sweet 2.32 BC 2 2.58 A 2.56 AB 2.23 C 2.42 ABC 0.0008 ***
Flavour flavour 4.53 BC 1 5.42 A 5.08 AB 4.77 BC 4.43 C <0.0001 *** sweet 2.18 C 2 2.76 A 2.58 AB 2.50 B 2.12 C <0.0001 *** cereal 2.60 AB 2 2.78 A 2.76 A 2.71 AB 2.45 B 0.0077 ** bitter aftertaste 3.10 A 2 3.17 A 2.99 A 3.19 A 2.94 A 0.0456 *
Texture texture 4.48 C 1 5.91 A 4.49 C 5.20 B 4.02 C <0.0001 *** crispness 3.67 B 2 2.78 C 4.22 A 3.03 C 4.16 A <0.0001 ***
Overall overall 4.72 B 1 5.77 A 4.75 B 4.89 B 4.46 B <0.0001 *** health 5.54 B 1 6.48 A 5.58 B 5.62 B 5.37 B <0.0001 *** consume 2.84 BC 3 3.46 A 2.91 BC 2.97 B 2.63 C <0.0001 ***
* significant at 5 %
Hegyi et al. / Proceedings in System Dynamics and Innovation in Food Networks 2016, 190-208
204 DOI 2016: pfsd.2016.1622
** significant at 1 % *** significant at 0,1 % 1 1-9 point-scale 2 1-5 point JAR scale 3
1-5 point buying intent scale
Hegyi et al. / Proceedings in System Dynamics and Innovation in Food Networks 2016, 190-208
205 DOI 2016: pfsd.2016.1622
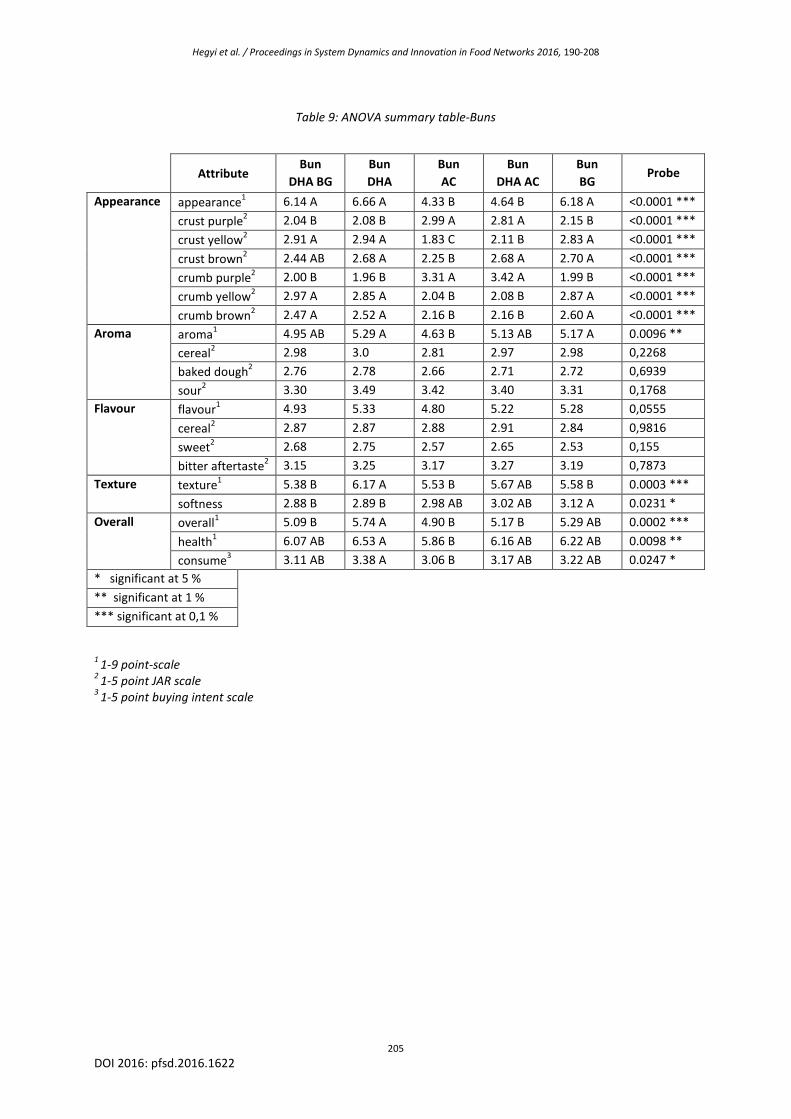
Table 9: ANOVA summary table-Buns
1 1-9 point-scale 2 1-5 point JAR scale 3
1-5 point buying intent scale
Attribute Bun
DHA BG Bun DHA
Bun AC
Bun DHA AC
Bun BG
Probe
Appearance appearance 6.14 A 1 6.66 A 4.33 B 4.64 B 6.18 A <0.0001 *** crust purple 2.04 B 2 2.08 B 2.99 A 2.81 A 2.15 B <0.0001 *** crust yellow 2.91 A 2 2.94 A 1.83 C 2.11 B 2.83 A <0.0001 *** crust brown 2.44 AB 2 2.68 A 2.25 B 2.68 A 2.70 A <0.0001 *** crumb purple 2.00 B 2 1.96 B 3.31 A 3.42 A 1.99 B <0.0001 *** crumb yellow 2.97 A 2 2.85 A 2.04 B 2.08 B 2.87 A <0.0001 *** crumb brown 2.47 A 2 2.52 A 2.16 B 2.16 B 2.60 A <0.0001 ***
Aroma aroma 4.95 AB 1 5.29 A 4.63 B 5.13 AB 5.17 A 0.0096 ** cereal 2.98 2 3.0 2.81 2.97 2.98 0,2268 baked dough 2.76 2 2.78 2.66 2.71 2.72 0,6939 sour 3.30 2 3.49 3.42 3.40 3.31 0,1768
Flavour flavour 4.93 1 5.33 4.80 5.22 5.28 0,0555 cereal 2.87 2 2.87 2.88 2.91 2.84 0,9816 sweet 2.68 2 2.75 2.57 2.65 2.53 0,155 bitter aftertaste 3.15 2 3.25 3.17 3.27 3.19 0,7873
Texture texture 5.38 B 1 6.17 A 5.53 B 5.67 AB 5.58 B 0.0003 *** softness 2.88 B 2.89 B 2.98 AB 3.02 AB 3.12 A 0.0231 *
Overall overall 5.09 B 1 5.74 A 4.90 B 5.17 B 5.29 AB 0.0002 *** health 6.07 AB 1 6.53 A 5.86 B 6.16 AB 6.22 AB 0.0098 ** consume 3.11 AB 3 3.38 A 3.06 B 3.17 AB 3.22 AB 0.0247 *
* significant at 5 % ** significant at 1 % *** significant at 0,1 %
Hegyi et al. / Proceedings in System Dynamics and Innovation in Food Networks 2016, 190-208
206 DOI 2016: pfsd.2016.1622
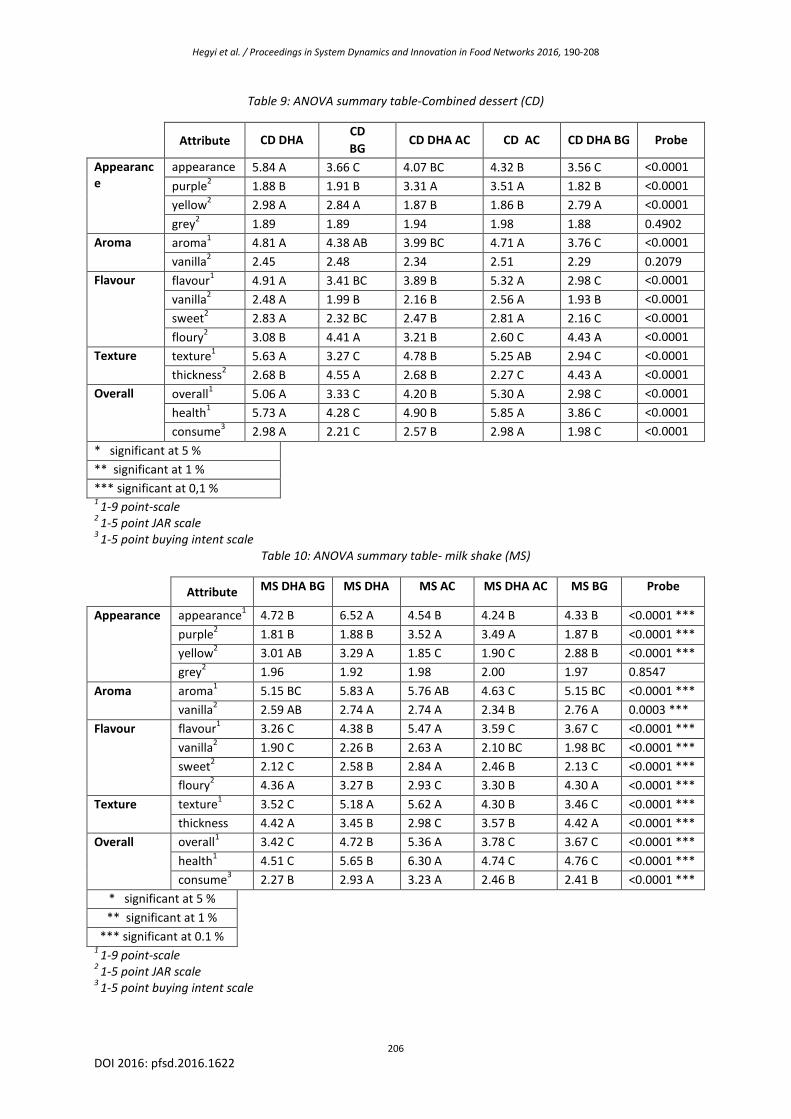
Table 9: ANOVA summary table-Combined dessert (CD)
Attribute CD DHA CD BG
CD DHA AC CD AC CD DHA BG Probe
Appearance
appearance 5.84 A 1
3.66 C 4.07 BC 4.32 B 3.56 C <0.0001 purple 1.88 B 2 1.91 B 3.31 A 3.51 A 1.82 B <0.0001 yellow 2.98 A 2 2.84 A 1.87 B 1.86 B 2.79 A <0.0001 grey 1.89 2 1.89 1.94 1.98 1.88 0.4902
Aroma aroma 4.81 A 1 4.38 AB 3.99 BC 4.71 A 3.76 C <0.0001 vanilla 2.45 2 2.48 2.34 2.51 2.29 0.2079
Flavour flavour 4.91 A 1 3.41 BC 3.89 B 5.32 A 2.98 C <0.0001 vanilla 2.48 A 2 1.99 B 2.16 B 2.56 A 1.93 B <0.0001 sweet 2.83 A 2 2.32 BC 2.47 B 2.81 A 2.16 C <0.0001 floury 3.08 B 2 4.41 A 3.21 B 2.60 C 4.43 A <0.0001 Texture texture 5.63 A 1 3.27 C 4.78 B 5.25 AB 2.94 C <0.0001 thickness 2.68 B 2 4.55 A 2.68 B 2.27 C 4.43 A <0.0001 Overall overall 5.06 A 1 3.33 C 4.20 B 5.30 A 2.98 C <0.0001 health 5.73 A 1 4.28 C 4.90 B 5.85 A 3.86 C <0.0001 consume 2.98 A 3 2.21 C 2.57 B 2.98 A 1.98 C <0.0001 * significant at 5 %
** significant at 1 % *** significant at 0,1 % 1 1-9 point-scale 2 1-5 point JAR scale 3
Table 10: ANOVA summary table- milk shake (MS) 1-5 point buying intent scale
Attribute MS DHA BG MS DHA MS AC MS DHA AC MS BG Probe
Appearance appearance 4.72 B 1 6.52 A 4.54 B 4.24 B 4.33 B <0.0001 *** purple 1.81 B 2 1.88 B 3.52 A 3.49 A 1.87 B <0.0001 *** yellow 3.01 AB 2 3.29 A 1.85 C 1.90 C 2.88 B <0.0001 *** grey 1.96 2 1.92 1.98 2.00 1.97 0.8547
Aroma aroma 5.15 BC 1 5.83 A 5.76 AB 4.63 C 5.15 BC <0.0001 *** vanilla 2.59 AB 2 2.74 A 2.74 A 2.34 B 2.76 A 0.0003 ***
Flavour flavour 3.26 C 1 4.38 B 5.47 A 3.59 C 3.67 C <0.0001 *** vanilla 1.90 C 2 2.26 B 2.63 A 2.10 BC 1.98 BC <0.0001 *** sweet 2.12 C 2 2.58 B 2.84 A 2.46 B 2.13 C <0.0001 *** floury 4.36 A 2 3.27 B 2.93 C 3.30 B 4.30 A <0.0001 ***
Texture texture 3.52 C 1 5.18 A 5.62 A 4.30 B 3.46 C <0.0001 *** thickness 4.42 A 3.45 B 2.98 C 3.57 B 4.42 A <0.0001 ***
Overall overall 3.42 C 1 4.72 B 5.36 A 3.78 C 3.67 C <0.0001 *** health 4.51 C 1 5.65 B 6.30 A 4.74 C 4.76 C <0.0001 *** consume 2.27 B 3 2.93 A 3.23 A 2.46 B 2.41 B <0.0001 ***
* significant at 5 % ** significant at 1 %
*** significant at 0.1 % 1 1-9 point-scale 2 1-5 point JAR scale 3
1-5 point buying intent scale
Hegyi et al. / Proceedings in System Dynamics and Innovation in Food Networks 2016, 190-208
207 DOI 2016: pfsd.2016.1622
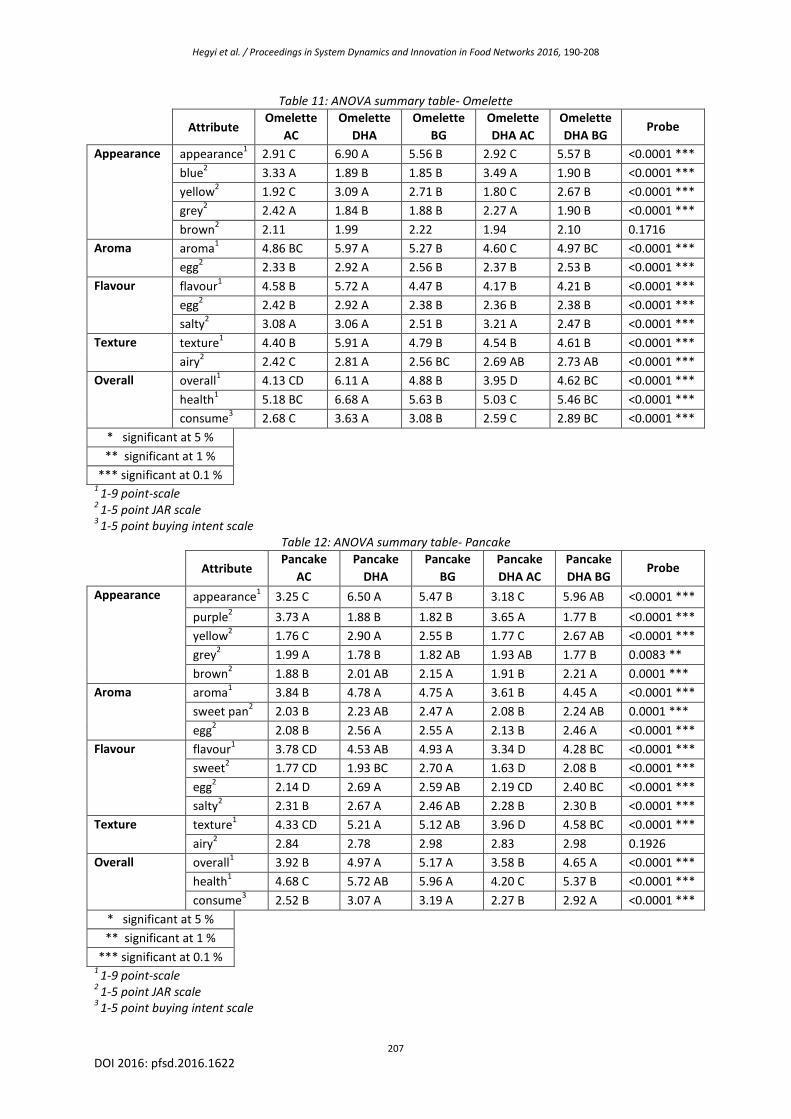
Table 11: ANOVA summary table- Omelette
Attribute Omelette
AC Omelette
DHA Omelette
BG Omelette DHA AC
Omelette DHA BG
Probe
Appearance appearance 2.91 C 1 6.90 A 5.56 B 2.92 C 5.57 B <0.0001 *** blue 3.33 A 2 1.89 B 1.85 B 3.49 A 1.90 B <0.0001 *** yellow 1.92 C 2 3.09 A 2.71 B 1.80 C 2.67 B <0.0001 *** grey 2.42 A 2 1.84 B 1.88 B 2.27 A 1.90 B <0.0001 *** brown 2.11 2 1.99 2.22 1.94 2.10 0.1716
Aroma aroma 4.86 BC 1 5.97 A 5.27 B 4.60 C 4.97 BC <0.0001 *** egg 2.33 B 2 2.92 A 2.56 B 2.37 B 2.53 B <0.0001 ***
Flavour flavour 4.58 B 1 5.72 A 4.47 B 4.17 B 4.21 B <0.0001 *** egg 2.42 B 2 2.92 A 2.38 B 2.36 B 2.38 B <0.0001 *** salty 3.08 A 2 3.06 A 2.51 B 3.21 A 2.47 B <0.0001 ***
Texture texture 4.40 B 1 5.91 A 4.79 B 4.54 B 4.61 B <0.0001 *** airy 2.42 C 2 2.81 A 2.56 BC 2.69 AB 2.73 AB <0.0001 ***
Overall overall 4.13 CD 1 6.11 A 4.88 B 3.95 D 4.62 BC <0.0001 *** health 5.18 BC 1 6.68 A 5.63 B 5.03 C 5.46 BC <0.0001 *** consume 2.68 C 3 3.63 A 3.08 B 2.59 C 2.89 BC <0.0001 ***
* significant at 5 % ** significant at 1 %
*** significant at 0.1 % 1 1-9 point-scale 2 1-5 point JAR scale 3
Table 12: ANOVA summary table- Pancake 1-5 point buying intent scale
Attribute Pancake
AC Pancake
DHA Pancake
BG Pancake DHA AC
Pancake DHA BG
Probe
Appearance appearance 3.25 C 1 6.50 A 5.47 B 3.18 C 5.96 AB <0.0001 *** purple 3.73 A 2 1.88 B 1.82 B 3.65 A 1.77 B <0.0001 *** yellow 1.76 C 2 2.90 A 2.55 B 1.77 C 2.67 AB <0.0001 *** grey 1.99 A 2 1.78 B 1.82 AB 1.93 AB 1.77 B 0.0083 ** brown 1.88 B 2 2.01 AB 2.15 A 1.91 B 2.21 A 0.0001 ***
Aroma aroma 3.84 B 1 4.78 A 4.75 A 3.61 B 4.45 A <0.0001 *** sweet pan 2.03 B 2 2.23 AB 2.47 A 2.08 B 2.24 AB 0.0001 *** egg 2.08 B 2 2.56 A 2.55 A 2.13 B 2.46 A <0.0001 ***
Flavour flavour 3.78 CD 1 4.53 AB 4.93 A 3.34 D 4.28 BC <0.0001 *** sweet 1.77 CD 2 1.93 BC 2.70 A 1.63 D 2.08 B <0.0001 *** egg 2.14 D 2 2.69 A 2.59 AB 2.19 CD 2.40 BC <0.0001 *** salty 2.31 B 2 2.67 A 2.46 AB 2.28 B 2.30 B <0.0001 ***
Texture texture 4.33 CD 1 5.21 A 5.12 AB 3.96 D 4.58 BC <0.0001 *** airy 2.84 2 2.78 2.98 2.83 2.98 0.1926
Overall overall 3.92 B 1 4.97 A 5.17 A 3.58 B 4.65 A <0.0001 *** health 4.68 C 1 5.72 AB 5.96 A 4.20 C 5.37 B <0.0001 *** consume 2.52 B 3 3.07 A 3.19 A 2.27 B 2.92 A <0.0001 ***
* significant at 5 % ** significant at 1 %
*** significant at 0.1 % 1 1-9 point-scale 2 1-5 point JAR scale 3 1-5 point buying intent scale

Hegyi et al. / Proceedings in System Dynamics and Innovation in Food Networks 2016, 190-208
208 DOI 2016: pfsd.2016.1622
8 Short vitae of the authors
dr. Adrienn Hegyi graduated as food engineer. Manager of sensory and consumer department and the
marketing activities of the Campden BRI Hungary. She participates in the work of the European Sensory
Network. She graduated on the Postgraduate Sensory Science Course at the University of Nottingham. She
obtained a PhD in marketing at the Szt. István University Gödöllő, Hungary.
Zsófia Kertész graduated with M.Sc. level as a biochemical engineer from Technical University of Budapest in
2014, specialized in food quality control. Trained in sensory and consumer test evaluation. Experience in
technology transfer and in knowledge transfer. Works at Campden BRI Hungary Ltd. as a development
engineer.
Tünde Kuti, experienced in consumer studies and sensory evaluation, in design of experiments, statistical
evaluation and interpretation of results, carbon foot printing, and sustainability.
dr. András Sebők, general manager of Campden BRI Hungary, Chairman of the R+D expert group of
FoodDrinkEurope, Vice-Chairman of cooperation of the national food technology platforms of ETP, 40 years’
experience in food industry R+D, particularly in food processing, food transparency, knowledge transfer,
training, capacity building and project management.
Related Documents