1 Mitra S, et al. BMJ Global Health 2021;6:e007296. doi:10.1136/bmjgh-2021-007296 Availability of population-level data sources for tracking the incidence of deaths and injuries from road traffic crashes in low-income and middle- income countries Sudeshna Mitra, 1 Kazuyuki Neki , 1 Leah Watetu Mbugua, 1 Hialy Gutierrez, 2 Leen Bakdash, 2 Mercer Winer, 2 Ramshankar Balasubramaniyan, 2 Jaeda Roberts , 2 Theo Vos, 3 Erin Hamilton, 3 Mohsen Naghavi , 3 James E Harrison, 4 R F Soames Job, 1 Kavi Bhalla 2 Original research To cite: Mitra S, Neki K, Mbugua LW, et al. Availability of population-level data sources for tracking the incidence of deaths and injuries from road traffic crashes in low- income and middle-income countries. BMJ Global Health 2021;6:e007296. doi:10.1136/ bmjgh-2021-007296 Handling editor Seema Biswas ► Additional supplemental material is published online only. To view, please visit the journal online (http://dx.doi.org/10. 1136/bmjgh-2021-007296). Received 27 August 2021 Accepted 17 October 2021 For numbered affiliations see end of article. Correspondence to Dr Kavi Bhalla; [email protected] © Author(s) (or their employer(s)) 2021. Re-use permitted under CC BY-NC. No commercial re-use. See rights and permissions. Published by BMJ. ABSTRACT Introduction Tracking progress towards Sustainable Development Goal (SDG) 3·6 of reducing traffic deaths and serious injuries poses a measurement challenge in most low-income and middle-income countries (LMICs) due to large discrepancies between reported official statistics and estimates from global health measurement studies. We assess the extent to which national population censuses and health surveys can fill the information gaps. Methods We reviewed questionnaires for nationally representative surveys and censuses conducted since 2000 in LMICs. We identified sources that provide estimates of household ownership of vehicles, incidence of traffic deaths and non-fatal injuries, and prevalence of disability. Results We identified 802 data sources from 132 LMICs. Sub-Saharan African countries accounted for 43% of all measurements. The number of measurements since 2000 was high, with 97% of the current global LMIC population having at least one measurement for vehicle ownership, 77% for deaths, 90% for non-fatal injuries and 50% for disability due to traffic injuries. Recent data (since 2010) on traffic injuries were available from far fewer countries (deaths: 21 countries; non-fatal injuries: 62 and disability: 12). However, there were many more countries with recent data on less-specific questions about unintentional or all injuries (deaths: 41 countries, non-fatal: 87, disability: 32). Conclusion Traffic injuries are substantially underreported in official statistics of most LMICs. National surveys and censuses provide a viable alternative information source, but despite a large increase in their use to monitor SDGs, traffic injury measurements have not increased. We show that relatively small modifications and additions to questions in forthcoming surveys can provide countries with a way to benchmark their existing surveillance systems and result in a substantial increase in data for tracking road traffic injuries globally. INTRODUCTION In recent decades, road traffic injuries have emerged as a leading threat to population health in low-income and middle-income countries (LMICs), which suffer over 90% of the global road crash deaths. 1 2 In 2019, traffic Key questions What is already known? ► Sustainable Development Goal 3.6 aims to ‘by 2030, halve the number of global deaths and injuries from road traffic accidents’. ► However, there are large inconsistencies between modelled estimates of road traffic deaths and inju- ries produced by the Global Burden of Disease (GBD) study, WHO’s Global Health Estimates (GHE), and official statistics from most low-income and middle- income countries (LMICs). ► GHE and GBD estimates rely primarily on vital reg- istration data and verbal autopsies but these data sources are of poor quality or do not exist in many LMICs, especially those in sub-Saharan Africa, North Africa and Middle East, South Asia and South-East Asia. What are the new findings? ► National health surveys and censuses in LMICs often include questions that allow a direct estimation of the incidence of road traffic deaths and non-fatal in- juries, the prevalence of permanent disabilities, and household ownership of bicycles and motor vehicles. ► Such information sources exist commonly in sub- Saharan Africa, where traditional data sources se- verely under-report traffic injuries. ► In many cases, the questions included in surveys and censuses are poorly framed, partly because they were not included for the purpose of estimating incidence and prevalence of traffic injuries. on February 27, 2022 by guest. Protected by copyright. http://gh.bmj.com/ BMJ Glob Health: first published as 10.1136/bmjgh-2021-007296 on 15 November 2021. Downloaded from

Welcome message from author
This document is posted to help you gain knowledge. Please leave a comment to let me know what you think about it! Share it to your friends and learn new things together.
Transcript

1Mitra S, et al. BMJ Global Health 2021;6:e007296. doi:10.1136/bmjgh-2021-007296
Availability of population- level data sources for tracking the incidence of deaths and injuries from road traffic crashes in low- income and middle- income countries
Sudeshna Mitra,1 Kazuyuki Neki ,1 Leah Watetu Mbugua,1 Hialy Gutierrez,2 Leen Bakdash,2 Mercer Winer,2 Ramshankar Balasubramaniyan,2 Jaeda Roberts ,2 Theo Vos,3 Erin Hamilton,3 Mohsen Naghavi ,3 James E Harrison,4 R F Soames Job,1 Kavi Bhalla 2
Original research
To cite: Mitra S, Neki K, Mbugua LW, et al. Availability of population- level data sources for tracking the incidence of deaths and injuries from road traffic crashes in low- income and middle- income countries. BMJ Global Health 2021;6:e007296. doi:10.1136/bmjgh-2021-007296
Handling editor Seema Biswas
► Additional supplemental material is published online only. To view, please visit the journal online (http:// dx. doi. org/ 10. 1136/ bmjgh- 2021- 007296).
Received 27 August 2021Accepted 17 October 2021
For numbered affiliations see end of article.
Correspondence toDr Kavi Bhalla; kavibhalla@ gmail. com
© Author(s) (or their employer(s)) 2021. Re- use permitted under CC BY- NC. No commercial re- use. See rights and permissions. Published by BMJ.
ABSTRACTIntroduction Tracking progress towards Sustainable Development Goal (SDG) 3·6 of reducing traffic deaths and serious injuries poses a measurement challenge in most low- income and middle- income countries (LMICs) due to large discrepancies between reported official statistics and estimates from global health measurement studies. We assess the extent to which national population censuses and health surveys can fill the information gaps.Methods We reviewed questionnaires for nationally representative surveys and censuses conducted since 2000 in LMICs. We identified sources that provide estimates of household ownership of vehicles, incidence of traffic deaths and non- fatal injuries, and prevalence of disability.Results We identified 802 data sources from 132 LMICs. Sub- Saharan African countries accounted for 43% of all measurements. The number of measurements since 2000 was high, with 97% of the current global LMIC population having at least one measurement for vehicle ownership, 77% for deaths, 90% for non- fatal injuries and 50% for disability due to traffic injuries. Recent data (since 2010) on traffic injuries were available from far fewer countries (deaths: 21 countries; non- fatal injuries: 62 and disability: 12). However, there were many more countries with recent data on less- specific questions about unintentional or all injuries (deaths: 41 countries, non- fatal: 87, disability: 32).Conclusion Traffic injuries are substantially underreported in official statistics of most LMICs. National surveys and censuses provide a viable alternative information source, but despite a large increase in their use to monitor SDGs, traffic injury measurements have not increased. We show that relatively small modifications and additions to questions in forthcoming surveys can provide countries with a way to benchmark their existing surveillance systems and result in a substantial increase in data for tracking road traffic injuries globally.
INTRODUCTIONIn recent decades, road traffic injuries have emerged as a leading threat to population health in low- income and middle- income countries (LMICs), which suffer over 90% of the global road crash deaths.1 2 In 2019, traffic
Key questions
What is already known? ► Sustainable Development Goal 3.6 aims to ‘by 2030, halve the number of global deaths and injuries from road traffic accidents’.
► However, there are large inconsistencies between modelled estimates of road traffic deaths and inju-ries produced by the Global Burden of Disease (GBD) study, WHO’s Global Health Estimates (GHE), and official statistics from most low- income and middle- income countries (LMICs).
► GHE and GBD estimates rely primarily on vital reg-istration data and verbal autopsies but these data sources are of poor quality or do not exist in many LMICs, especially those in sub- Saharan Africa, North Africa and Middle East, South Asia and South- East Asia.
What are the new findings? ► National health surveys and censuses in LMICs often include questions that allow a direct estimation of the incidence of road traffic deaths and non- fatal in-juries, the prevalence of permanent disabilities, and household ownership of bicycles and motor vehicles.
► Such information sources exist commonly in sub- Saharan Africa, where traditional data sources se-verely under- report traffic injuries.
► In many cases, the questions included in surveys and censuses are poorly framed, partly because they were not included for the purpose of estimating incidence and prevalence of traffic injuries.
on February 27, 2022 by guest. P
rotected by copyright.http://gh.bm
j.com/
BM
J Glob H
ealth: first published as 10.1136/bmjgh-2021-007296 on 15 N
ovember 2021. D
ownloaded from
2 Mitra S, et al. BMJ Global Health 2021;6:e007296. doi:10.1136/bmjgh-2021-007296
BMJ Global Health
crashes killed an estimated 1·2 million people globally and were the seventh- leading cause of population health loss.2 The global traffic death toll has remained stable at a high level since the year 2000 and now exceeds deaths from HIV/AIDS, tuberculosis and malaria, all of which saw large declines (50%, 38% and 34%, respectively) during this period.1 Funding has been inadequate and progress in reducing traffic injuries has been slow despite substantial global advocacy. The World Report on Road Traffic Injury Prevention, jointly issued by the World Bank and the WHO,3 in 2004 was followed by a series of eight resolutions by the United Nations (UN) General Assembly and the World Health Assembly and three global ministerial conferences calling on LMICs (LMICs) to increase investments in safety interventions.4 The 2012 UN resolution proclaimed the period 2011–2020 to be the global Decade of Action for Road Safety. However, despite extensive global advocacy, progress towards making the investments and the regulatory changes necessary for running effective national road safety programmes has been slow. The third Global Ministe-rial Conference in February 2020 renewed these efforts by adopting the Stockholm Declaration5 and proposed updating the Sustainable Development Goal (SDG) 3.6 to reducing road traffic deaths and serious injuries by 50% by 2030. This was followed by a UN resolution that ratified the Stockholm Declaration, declared the period 2021–2030 to be the Second Decade of Action for Road Safety, and established a renewed target of a 50% reduc-tion in road crash deaths and injuries by 2030.6
Road safety remains low on the policy agendas of many LMICs at least partly because countries may be underes-timating the scale of the problem. Comparison of official statistics with estimates developed from health- related data sources suggest that official statistics from low- income countries miss 84%, and middle- income coun-tries miss 51%, of road traffic deaths.7 8 In John Kingdon’s influential description of the policy process,9 problems often rise to policy attention because of a focusing event (such as a mass casualty crash) or because of change in a
systematic indicator (such as the traffic death toll). Thus, evidence that the problem is bigger than acknowledged is a tool that can be used by civil society, interest groups and the media to push road safety onto the national policy action agenda.
There are two major global health measurement proj-ects that generate estimates of national traffic injuries and provide evidence to challenge official statistics. These are (1) WHO’s Global Health Estimates (GHE), which are presented as WHO’s modelled estimates in the Global Status Reports on Road Safety (GSRRS)1 and (2) the Insti-tute of Health Metrics and Evaluation’s (IHME) Global Burden of Disease (GBD)2 study. These projects construct estimates of road traffic deaths using statistical models that rely on a variety of cause- of- death data sources (espe-cially vital registers and verbal autopsies) and covariates (eg, development indicators, vehicle fleet). GBD and GHE estimates of road traffic deaths are reasonably consistent with each other and official statistics in regions with high- quality vital registration data, which includes most countries in the Americas, Europe and Australasia (see online supplemental figure A1). However, in coun-tries without high quality vital registers (which includes most countries in sub- Saharan Africa, North Africa and Middle East, South Asia and Southeast Asia), the differ-ences in GBD and GHE methods lead to large discrep-ancies in estimates. Although GBD and GHE estimates are invariably higher than official statistics in these regions, they are often not consistent with each other. For instance, WHO’s estimates of road traffic deaths in the Western sub- Saharan African region, are more than twice GBD estimates. In these regions, a debate about the scale of the traffic injury problem can help spur policy action. However, when country actors are confronted with discrepancies between official statistics and GHE, they often brush aside the modelled estimates, pointing to the discrepancies between GBD and GHE and/or that the estimates are not based on epidemiological data sources from their country. Thus, increasing the use of local data sources on road traffic injuries in IHME and WHO’s statis-tical models will likely increase the perceived legitimacy of the estimates while also narrowing the discrepancies between GBD and GHE estimates.
In other health domains, such as maternal health,10 and water, sanitation and hygiene,11 the measurement needs for the Millennium Development Goals (MDGs), and now the SDGs, were met by increased reliance on national population censuses and household surveys, including Demographic and Health Surveys (DHS), Multiple Indicator Cluster Surveys (MICS) and World Health Surveys (WHS), among others. This led to a large increase in the number of surveys conducted in LMICs, and especially in the regions like sub- Saharan Africa that have the weakest health data systems.12 13 Although these censuses and surveys occasionally include questions that can be used to estimate road traffic deaths and non- fatal injuries, they are not used as data sources in GBD and GSRRS estimates.
Key questions
What do the new findings imply? ► Household surveys and censuses can provide important information about the burden of road traffic injuries until countries have estab-lished surveillance infrastructure capable of fulfilling the informa-tion needs of road safety programmes.
► In countries where such questions are already included in nation-al surveys and censuses, relatively small modifications to existing questions can greatly enhance their utility for estimating the nation-al burden of road traffic injuries.
► Other countries should consider deploying a standardised set of questions on traffic injuries in forthcoming data collection activities.
► Inclusion of data from surveys and household censuses in cross- national statistical models that estimate the burden of road traffic injuries can help reduce the large uncertainty that is common in estimates for many LMICs.
on February 27, 2022 by guest. P
rotected by copyright.http://gh.bm
j.com/
BM
J Glob H
ealth: first published as 10.1136/bmjgh-2021-007296 on 15 N
ovember 2021. D
ownloaded from

Mitra S, et al. BMJ Global Health 2021;6:e007296. doi:10.1136/bmjgh-2021-007296 3
BMJ Global Health
Our study sought to assess the availability of questions relevant to estimating road traffic deaths and injuries in nationally representative household surveys and popula-tion censuses in LMICs. In addition, we sought to iden-tify opportunities to strengthen such measurements in future data collection.
METHODSWe searched for nationally representative household surveys and population censuses in LMICs (as defined by the World Bank country- income classification) that included questions that allow estimation of the (1) incidence of road traffic deaths, (2) incidence of non- fatal road traffic injuries, (3) prevalence of permanent disability due to road traffic injuries and (4) household ownership of bicycles, motorcycles, cars, and other vehi-cles. We included the latter because they are important covariates of road traffic injuries and, hence, important for improving estimates in countries where epidemio-logical measurements on road traffic injuries are sparse or unavailable. For (1)–(3), we also identified sources for data on the unintentional injuries (typically identi-fied as ‘accidents’) or all injuries without specification of cause. We included these because traffic injuries are the leading cause of unintentional injuries (70% of all unintentional injury deaths), and total injuries (28% of total injury deaths),1 suggesting that improving the accu-racy of unintentional and total injury measurement can substantially reduce the uncertainty in traffic injury esti-mates. Furthermore, these surveys also represent a meas-urement opportunity. Relatively small changes to their questions in future rounds of these surveys could enable direct measurement of road traffic injuries.
Our main data source for survey instruments was the International Household Survey Network (IHSN) repos-itory,14 which is the most comprehensive collection of metadata and documents (including questionnaires) on household surveys conducted in LMICs. IHSN includes information about most health surveys conducted by national governments and international development agencies, such as the DHS,15 MICS16 and the Living Stan-dards Measurement Surveys.17 For questionnaires that were not in IHSN, we searched other major data reposi-tories, such as the MEASURE Evaluation18 and the Global Health Data Exchange (GHDx) websites,19 and national statistical websites. Our main data source for national population and housing census instruments was the Integrated Public Use Microdata Series.20 For countries with no questionnaires in these collections, we searched in the UN Statistical Division’s Census data collection,21 GHDx19 and national statistical websites. We restricted attention to nationally representative surveys since the year 2000 and excluded surveys that were sub- national or household surveys with a sample size of less than 2000. We included surveys and censuses that were restricted to a particular age–sex group (eg, women 15–49 years), with the exception that we did not include surveys (such as
some DHS) that focused only on mortality in the under- 5 population (which accounts for only about 3% of road traffic deaths globally.2
For data sources with relevant information, we docu-mented the country name, name of data source, year of data collection, sample size, the specific questions asked about mortality and morbidity, the recall period, type of care received, duration of impairment, and whether the question was restricted to any specific populations (eg, women 15–49 years). Online supplemental appendix oprovides these details for all data sources identified.
To illustrate the value that such data sources can bring to estimates of national road traffic deaths, we sought and analysed mortality data sources from one country, Tanzania. Our review identified three relevant mortality data sources in the country: (1) The 2012 Census, which included a question about the age, sex and cause (which included ‘Road Accident’ as an option) of household deaths during the last year; (2) a nationally representative verbal autopsy survey (Sample Vital Registration with Verbal Autopsy study; SAVVY) and (3) the National Panel Survey, which included questions on cause of death (including ‘Traffic Accident’ as an option). We were unable to acquire the SAVVY dataset but extracted estimates from a published study.22 We excluded the National Panel Survey from further analysis because of the small sample (3357 households; 5 traffic deaths). These data sources have not been used for GBD or GSRSS esti-mates of road traffic deaths in Tanzania.
We reviewed the data sources used by GBD and GHE for estimating road traffic injuries. Online supplemental appendix provides a full listing of the sources. Briefly, the modelling strategies used for GBD2 and GHE/GSRRS1 esti-mates vary substantially in their ability to include different types of data sources. For estimating mortality, good quality vital registration data at the national level is the only source of local data on road traffic injuries used by GHE. As a result, GHE estimates of road traffic deaths in 77 LMICs are derived from a regression model using transport sector covariates and no local injury data. In contrast, GBD’s models allow inclusion of vital registration data that is of lower quality than GHE (ie, lower completeness and coverage, and higher proportions of deaths coded to partially specified causes) and verbal autopsies. Notably, GBD’s models also allow inclusion of data sources that are representative at the subnational level. Consequently, GBD includes at least some vital registration or verbal autopsy data from all but 14 countries. For non- fatal injuries, GHE (and GSRRS) do not report estimates of the incidence of non- fatal injuries. While GBD includes data on non- fatal injuries from national and subnationally representative population surveys (106 surveys from 66 countries), only 3 were conducted in the last decade.
Patient and public involvement statementPatients and/or the public were not involved in the design, or conduct, or reporting, or dissemination plans of this research.
on February 27, 2022 by guest. P
rotected by copyright.http://gh.bm
j.com/
BM
J Glob H
ealth: first published as 10.1136/bmjgh-2021-007296 on 15 N
ovember 2021. D
ownloaded from
4 Mitra S, et al. BMJ Global Health 2021;6:e007296. doi:10.1136/bmjgh-2021-007296
BMJ Global Health
RESULTSWe identified 802 nationally representative surveys and population censuses conducted in 127 LMICs that met our inclusion criteria. Population coverage of data sources was highest for vehicle ownership (table 1). Of the current global LMIC population, 97% had at least one measurement since 2000 of household ownership of bicycles, motorcycles and cars. Population coverage of vehicle ownership was the highest (>99%) for sub- Saharan Africa, South Asia and East Asia and Pacific. Coverage was lowest for Europe and Central Asia, where data sources were available for only about half the LMIC population in the region.
Over three- quarters (77%) of the global LMIC popu-lation had at least one survey or census since 2000 that asked about causes of death with traffic crashes as an option, ranging from a low of 20% for Middle East and North Africa to a high of 100% for South Asia. Population coverage was slightly higher for information on deaths due to unintentional or all injuries (85% global LMIC population, range: 28% in Europe and Central Asia to 100% in South Asia).
Population coverage for non- fatal injuries was higher than for deaths. 90% of the global LMIC population had at least one survey or census since 2000 that asked about involvement of respondents or household members in a road traffic crash, ranging from a low of 48% in Europe and Central Asia to a high of 100% in South Asia. As with mortality, population coverage was slightly higher for information on unintentional or all injuries.
Finally, population coverage of sources since 2000 that measured permanent disability due to road traffic inju-ries was the lowest at 50% of global LMIC population (low: 0% of Latin America and Caribbean; high: 75% of South Asia). For unintentional or all injuries, population coverage was 58% of global LMIC population (low: 6% of Europe and Central Asia; high: 78% of South Asia).
While the number of data sources that include infor-mation on vehicle ownership has increased over time, sources for measuring the incidence and prevalence of injuries have remained relatively stable (figure 1). The 2003 WHS account for the bulk of the data sources in the 2000–2005 period for vehicles (61% of data sources), mortality (90%) and non- fatal injuries (90%). The rela-tively low value for number of sources in the most recent time period shown is likely because some recent surveys have not yet been archived yet in the online data reposi-tories that were included in our review.
Figures 2–5 restrict attention to recent data sources, that is, since 2010. (Similar figures for data sources since 2000 are provided in onine supplemental appendix). Most LMICs have multiple data sources on vehicle owner-ship since 2010 (figure 2). About half of these sources are from sub- Saharan African countries (bicycles: 54%, motorcycles: 50%, cars: 48%), including three coun-tries (Kenya, Rwanda, Tanzania) that had more than 10 measurements each since 2010. LMICs in South Asia also tended to have several measurements of vehicle
ownership since 2010 (Afghanistan: six, Nepal: nine, Pakistan: six). LMICs in other regions tended to have fewer measurements but usually more than one.
There were only 21 countries with data sources since 2010 that included questions on road traffic deaths (figure 3). Among these, India and China have collected cause- of- death data as part of sample registration systems using verbal autopsy for more than 20 years. One- third (seven) of the countries were from sub- Saharan Africa, five were from East Asia and Pacific, four from South Asia, three from Latin America and Caribbean, and two from Middle East and North Africa. In contrast, there were 41 countries (with 74 data sources) on mortality due to the less- specific causes (unintentional or all injury), of which 20 countries (41 data sources) were from sub- Saharan Africa.
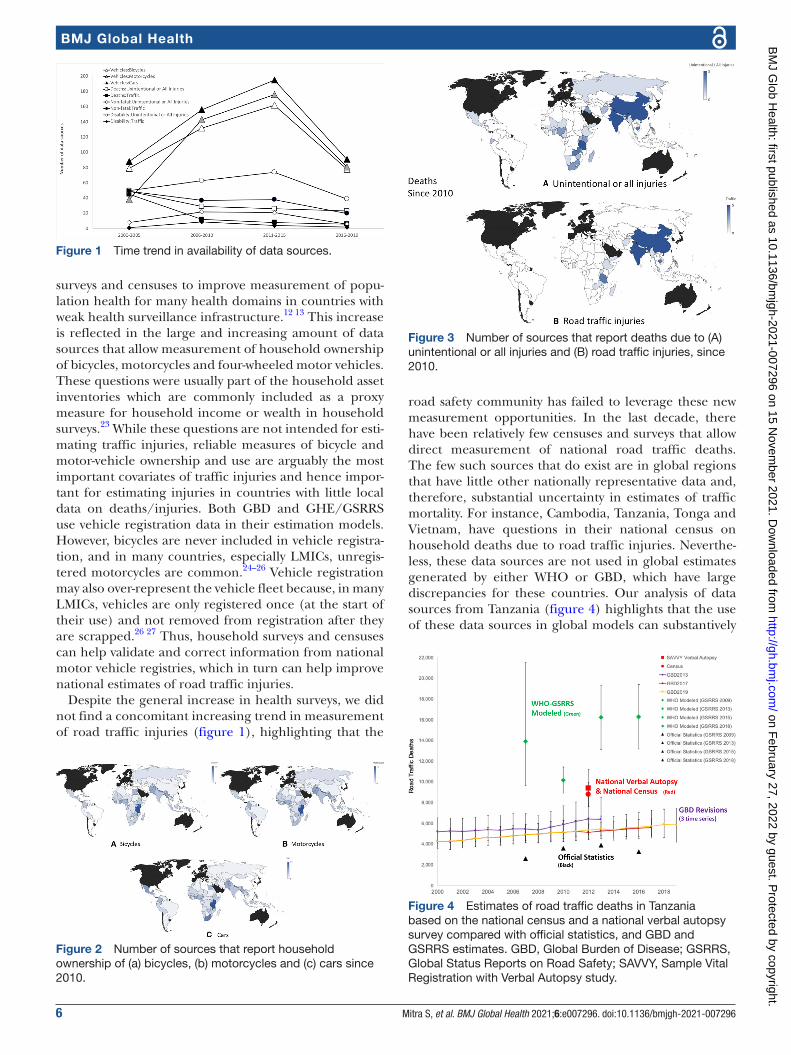
Figure 4 provides an illustrative example of the value of such information for resolving discrepancies in esti-mates of road traffic deaths in one country, Tanzania. In 2016, official statistics were based on traffic police which reported 3256 deaths. In contrast, GBD- 2019 estimated 5824 deaths (95th Uncertainty Interval: 4612–7414), and WHO estimated a figure that was almost three times higher, 16 252 (95th CI: 13 130 to 19 374) deaths with non- overlapping uncertainty intervals. The national population census and the nationally representative verbal autopsy (SAVVY), both conducted in 2012, show estimates that are consistent with each other and are approximately midway between GBD or WHO estimates, and about twice the official statistics.
We found 75 data sources since 2010 from 62 countries that included questions on non- fatal injuries sustained by household members in road traffic crashes (figure 5). Of these, 21 data sources (18 countries) were from East Asia and Pacific, 19 (16 countries) were from Latin America and Caribbean, and 16 (13 countries) from sub- Saharan Africa. There were almost twice as many, 144 data sources (87 countries), with information on the less- specific category of unintentional or all injury. Of these, 62 data sources (32 countries) were from sub- Saharan Africa.
Finally, we found only 14 data sources (12 countries) since 2010 that included questions about the prevalence of permanent disabilities due to traffic injuries, of which three each were from sub- Saharan Africa, East Asia and Pacific, and Europe and Central Asia, two were from the Middle East and North Africa, and one was from Latin America and Caribbean (online supplemental figure A7). As with sources for incidence of deaths and non- fatal injuries, there were many more sources (38 data sources, 32 countries) with questions on the prevalence of disabil-ities due to the less- specific unintentional or all injury category. Of these, 15 data sources (12 countries) were from sub- Saharan Africa.
DISCUSSIONVarious factors, notably including the need to track SDGs, have resulted in a large increase in the use of household
on February 27, 2022 by guest. P
rotected by copyright.http://gh.bm
j.com/
BM
J Glob H
ealth: first published as 10.1136/bmjgh-2021-007296 on 15 N
ovember 2021. D
ownloaded from

Mitra S, et al. BMJ Global Health 2021;6:e007296. doi:10.1136/bmjgh-2021-007296 5
BMJ Global Health
Tab
le 1
P
erce
ntag
e of
pop
ulat
ion
in L
MIC
s w
ith a
t le
ast
one
mea
sure
men
t si
nce
2000
by
Wor
ld B
ank
regi
on a
nd c
ount
ry in
com
e gr
oup
Po
pul
atio
n(in
201
9)
Vehi
cle
ow
ners
hip
Dea
ths
No
n- fa
tal
Dis
abili
ty
Bic
ycle
, %M
oto
rcyc
le, %
Car
, %In
jury
/acc
iden
t,
%Tr
affi
c, %
Inju
ry/a
ccid
ent,
%
Traf
fic,
%In
jury
/acc
iden
t,
%Tr
affi
c, %
Eas
t A
sia
and
Pac
ific
Low
25 7
16 6
440
00
00
00
00
Low
er m
idd
le54
8 54
7 39
210
010
010
052
5010
098
43
Up
per
mid
dle
1 77
3 21
3 09
010
010
010
085
8585
8580
80
Tota
l2
347
477
126
9999
9977
7688
8861
61
Eur
ope
and
Cen
tral
A
sia
Low
-
Low
er m
idd
le10
2 97
8 64
610
010
010
047
4793
870
0
Up
per
mid
dle
322
773
474
9293
9380
8087
8247
47
Tota
l42
5 75
2 12
094
9494
7272
8983
3535
Latin
Am
eric
a an
d
Car
ibb
ean
Low
11 8
24 8
3510
010
010
010
00
100
100
100
0
Low
er m
idd
le50
449
534
100
100
100
5234
100
100
230
Up
per
mid
dle
556
291
832
8891
9977
7792
9233
23
Tota
l61
8 56
6 20
290
9299
7572
9393
3420
Mid
dle
Eas
t an
d
Nor
th A
fric
aLo
w-
Low
er m
idd
le20
8 60
9 12
193
9310
043
4210
010
072
8
Up
per
mid
dle
192
013
433
4486
9223
052
520
0
Tota
l40
0 62
2 55
469
9096
3322
7777
384
Sou
th A
sia
Low
62 7
46 2
9010
010
010
010
010
010
010
052
0
Low
er m
idd
le1
804
274
175
100
100
100
100
100
9898
7877
Up
per
mid
dle
1 73
0 71
310
026
100
7474
100
100
00
Tota
l1
868
751
178
100
100
100
100
100
9898
7774
Sub
- Sah
aran
Afr
ica
Low
571
386
919
100
100
100
8571
9370
4831
Low
er m
idd
le47
6 80
9 07
810
010
010
087
2677
3217
7
Up
per
mid
dle
63 9
08 0
6898
9898
9393
9393
8686
Tota
l1
112
104
065
100
100
100
8753
8655
3724
Glo
bal
6 34
7 52
1 12
597
9899
8275
9085
5751
LMIC
s, lo
w- i
ncom
e an
d m
idd
le- i
ncom
e co
untr
ies.
on February 27, 2022 by guest. P
rotected by copyright.http://gh.bm
j.com/
BM
J Glob H
ealth: first published as 10.1136/bmjgh-2021-007296 on 15 N
ovember 2021. D
ownloaded from
6 Mitra S, et al. BMJ Global Health 2021;6:e007296. doi:10.1136/bmjgh-2021-007296
BMJ Global Health
surveys and censuses to improve measurement of popu-lation health for many health domains in countries with weak health surveillance infrastructure.12 13 This increase is reflected in the large and increasing amount of data sources that allow measurement of household ownership of bicycles, motorcycles and four- wheeled motor vehicles. These questions were usually part of the household asset inventories which are commonly included as a proxy measure for household income or wealth in household surveys.23 While these questions are not intended for esti-mating traffic injuries, reliable measures of bicycle and motor- vehicle ownership and use are arguably the most important covariates of traffic injuries and hence impor-tant for estimating injuries in countries with little local data on deaths/injuries. Both GBD and GHE/GSRRS use vehicle registration data in their estimation models. However, bicycles are never included in vehicle registra-tion, and in many countries, especially LMICs, unregis-tered motorcycles are common.24–26 Vehicle registration may also over- represent the vehicle fleet because, in many LMICs, vehicles are only registered once (at the start of their use) and not removed from registration after they are scrapped.26 27 Thus, household surveys and censuses can help validate and correct information from national motor vehicle registries, which in turn can help improve national estimates of road traffic injuries.
Despite the general increase in health surveys, we did not find a concomitant increasing trend in measurement of road traffic injuries (figure 1), highlighting that the
road safety community has failed to leverage these new measurement opportunities. In the last decade, there have been relatively few censuses and surveys that allow direct measurement of national road traffic deaths. The few such sources that do exist are in global regions that have little other nationally representative data and, therefore, substantial uncertainty in estimates of traffic mortality. For instance, Cambodia, Tanzania, Tonga and Vietnam, have questions in their national census on household deaths due to road traffic injuries. Neverthe-less, these data sources are not used in global estimates generated by either WHO or GBD, which have large discrepancies for these countries. Our analysis of data sources from Tanzania (figure 4) highlights that the use of these data sources in global models can substantively
Figure 1 Time trend in availability of data sources.
Figure 2 Number of sources that report household ownership of (a) bicycles, (b) motorcycles and (c) cars since 2010.
Figure 3 Number of sources that report deaths due to (A) unintentional or all injuries and (B) road traffic injuries, since 2010.
Figure 4 Estimates of road traffic deaths in Tanzania based on the national census and a national verbal autopsy survey compared with official statistics, and GBD and GSRRS estimates. GBD, Global Burden of Disease; GSRRS, Global Status Reports on Road Safety; SAVVY, Sample Vital Registration with Verbal Autopsy study.
on February 27, 2022 by guest. P
rotected by copyright.http://gh.bm
j.com/
BM
J Glob H
ealth: first published as 10.1136/bmjgh-2021-007296 on 15 N
ovember 2021. D
ownloaded from

Mitra S, et al. BMJ Global Health 2021;6:e007296. doi:10.1136/bmjgh-2021-007296 7
BMJ Global Health
reduce these discrepancies. These data sources are also not used in national road safety dialogue. We conducted a PubMed and Google Scholar search for papers on road traffic injuries in Tanzania. We identified 12 publications since 2012, none of which mentioned these two data sources.
While data sources that measure road traffic deaths were rare, there were many sources for the less- specific category of deaths due to unintentional or all injuries. This was also true for data sources for incidence of non- fatal injuries and prevalence of disabilities. There is relatively little policy interest in measuring these cate-gories, and the data are also not used by WHO or GBD in disease modelling. In the case of deaths, these ques-tions are usually included in censuses and surveys to measure maternal mortality,10 where injury deaths need to be excluded. For non- fatal injuries, such questions were typically in surveys that aimed to measure health-care utilisation. Relatively minor modifications to these non- specific questions (eg, by including an additional follow- up question to include traffic injuries or by modi-fying the response options) could make them important sources for estimates of the incidence of deaths and non- fatal injury and permanent disability due to road traffic injuries.
The marginal costs of modifications to censuses and surveys that will already be conducted is small in compar-ison to the value of the additional measurements on traffic injuries. However, our analysis also shows that an opportunistic approach will not be sufficient to enable tracking of progress towards SDG 3.6. That would require systematic identification of forthcoming censuses and surveys in LMICs and working to include carefully crafted and globally standardised injury modules that allow both the magnitude and trend in road traffic deaths and severe injuries to be measured. These modules need to be tested and validated to address known issues with survey- based measurements, such as differential item functioning,
memory decay (including for prominent memories) and telescoping.28–31 Well- designed surveys can reduce bias by using large samples, questions that restrict reporting to recent events and reporting of currently owned/used vehicles only. Injury modules also need to be calibrated so that they measure injuries using a common definition of severity.32 We need household survey instruments that are calibrated to measure severe injuries based on, for instance, the duration of treatment or the impact on daily activities.
Finally, it is important to appreciate that while survey- based measurements can help provide a benchmark for countries to assess the completeness of their existing surveillance systems, surveys and even health facility- based surveillance cannot replace police records because they do not provide the timely and detailed informa-tion that is needed to meet the information require-ments of running an evidence- based national road safety programme. For instance, police records from the crash scene are the only source that can provide information on crash configurations, crash locations, roadway condi-tions, use of protective devices (eg, helmets and seat belts), and other risk factors that are amenable to inter-ventions. Strengthening police- based surveillance will require large investments from countries (the US spends US$43 million annually on their crash data systems),33 as well as support from international actors in developing country capacity, and regional and global road safety observatories for harmonised collection of data on road traffic injuries and improved sharing of data among rele-vant stakeholders.33–35
Author affiliations1World Bank Global Road Safety Facility, Washington, District of Columbia, USA2Department of Public Health Sciences, University of Chicago, Chicago, Illinois, USA3Institute for Health Metrics and Evaluation, Seattle, Washington, USA4Research Center for Injury Studies, Flinders University, Adelaide, South Australia, Australia
Contributors SM and KB contributed to the study design and jointly led all aspects of the study. JR and SM initiated the research into the issue. KN, LWM, HG, LB, MW, RB and JR searched for data sources and reviewed questionnaires. SM and KB wrote the first draft of the article. All authors contributed to discussion and interpretation of the results and to the writing of the manuscript. KB is the guarantor of this paper responsible for the overall content of the manuscript. All authors have read and approved the final manuscript.
Funding This investigation was conducted by researchers from the University of Chicago and the World Bank Global Road Safety Facility and supported by funding from UKAID (Award/Grant Number: 7197082).
Map disclaimer The inclusion of any map (including the depiction of any boundaries therein), or of any geographic or locational reference, does not imply the expression of any opinion whatsoever on the part of BMJ concerning the legal status of any country, territory, jurisdiction or area or of its authorities. Any such expression remains solely that of the relevant source and is not endorsed by BMJ. Maps are provided without any warranty of any kind, either express or implied.
Competing interests None declared.
Patient consent for publication Not applicable.
Provenance and peer review Not commissioned; externally peer reviewed.
Data availability statement Data are available on reasonable request.
Supplemental material This content has been supplied by the author(s). It has not been vetted by BMJ Publishing Group Limited (BMJ) and may not have been
Figure 5 Number of sources that report non- fatal (a) unintentional or all injuries and (b) road traffic injuries, since 2010.
on February 27, 2022 by guest. P
rotected by copyright.http://gh.bm
j.com/
BM
J Glob H
ealth: first published as 10.1136/bmjgh-2021-007296 on 15 N
ovember 2021. D
ownloaded from

8 Mitra S, et al. BMJ Global Health 2021;6:e007296. doi:10.1136/bmjgh-2021-007296
BMJ Global Health
peer- reviewed. Any opinions or recommendations discussed are solely those of the author(s) and are not endorsed by BMJ. BMJ disclaims all liability and responsibility arising from any reliance placed on the content. Where the content includes any translated material, BMJ does not warrant the accuracy and reliability of the translations (including but not limited to local regulations, clinical guidelines, terminology, drug names and drug dosages), and is not responsible for any error and/or omissions arising from translation and adaptation or otherwise.
Open access This is an open access article distributed in accordance with the Creative Commons Attribution Non Commercial (CC BY- NC 4.0) license, which permits others to distribute, remix, adapt, build upon this work non- commercially, and license their derivative works on different terms, provided the original work is properly cited, appropriate credit is given, any changes made indicated, and the use is non- commercial. See: http:// creativecommons. org/ licenses/ by- nc/ 4. 0/.
ORCID iDsKazuyuki Neki http:// orcid. org/ 0000- 0003- 4781- 0978Jaeda Roberts http:// orcid. org/ 0000- 0002- 9241- 466XMohsen Naghavi http:// orcid. org/ 0000- 0002- 6209- 1513Kavi Bhalla http:// orcid. org/ 0000- 0002- 6679- 7820
REFERENCES 1 World Health Organization. Global status report on road safety 2018.
Geneva: World Health Organization, 2018. 2 Vos T, Lim SS, Abbafati C, et al. Global burden of 369 diseases and
injuries in 204 countries and territories, 1990- 2019: a systematic analysis for the global burden of disease study 2019. Lancet 2020;396:1204–22.
3 World Health Organization. World report on road traffic injury prevention. Geneva, Switzerland: World Health Organization, 2004.
4 World Health Organization. Resolutions and UN Secretary- General’s reports. Available: https://www. who. int/ roadsafety/ about/ resolutions/ download/ en/ [Accessed 21 Mar 2021].
5 Third Global Ministerial Conference on Road Safety. Stockholm declaration: achieving global goals 2030, 2020. Available: https://www. roadsafetysweden. com/ about- the- conference/ stockholm- declaration/ [Accessed 20 Mar 2021].
6 United Nations General Assembly. Improving global road safety. New York: United Nations, 2020.
7 Bhalla K, Shotten M, Cohen A. Transport for health: the global burden of disease due to injuries and air pollution from motorized road transport. Washington, DC: World Bank Global Road Safety Facility, and Institute for Health Metrics and Evaluation, 2014. http://www. heal thme tric sand eval uation. org/ gbd/ publications/ policy- report/ transport- health- global- burden- disease- motorized- road- transport
8 Soames Job RF, Wambulwa WM. Features of low- income and middle- income countries making road safety more challenging. JRS 2020;31:79–84.
9 Agendas KJW. Alternatives, and public policies. Essex, England: Pearson Education Limited, Harlow, 2013.
10 Hill K, Johnson P, Singh K, et al. Using census data to measure maternal mortality: a review of recent experience. Demogr Res 2018;39:337–64.
11 Khan SM, Bain RES, Lunze K, et al. Optimizing household survey methods to monitor the sustainable development goals targets 6.1 and 6.2 on drinking water, sanitation and hygiene: a mixed- methods field- test in Belize. PLoS One 2017;12:e0189089.
12 Demombynes G, Sandefur J. Costing a data revolution. SSRN Journal 2014.
13 Independent Expert Advisory Group. A world that counts - Mobilising the data revolution for sustainable development. United
Nations Secretary- General’s Independent Expert Advisory Group Secretariat, 2014. Available: https://www. undatarevolution. org
14 Homepage - IHSN. Independent expert Advisory group Secretariat. Available: www. ihsn. org [Accessed 20 Mar 2021].
15 Homepage - DHS. The DHS Program - Quality information to plan, monitor and improve population, health, and nutrition programs. Available: www. dhsprogram. com [Accessed 20 Mar 2021].
16 UNICEF. Surveys - UNICEF MICS. UNICEF Data: Monitoring the situation of children and women. Available: mics. unicef. org [Accessed 20 Mar 2021].
17 World Bank. Living standards measurement study. world bank. Available: https://www. worldbank. org/ en/ programs/ lsms [Accessed 20 Mar 2021].
18 University of North Carolina at Chapel Hill. Measure evaluation. Available: www. measureevaluation. org [Accessed 20 Mar 2021].
19 Institute for Health Metrics and Evaluation. Global Health Data Exchange | GHDx. Global Health Data Exchange - Discover the World’s Health Data. Available: http:// ghdx. healthdata. org [Accessed 20 Mar 2021].
20 Minnesota Population Center, IPUMS International. Harmonized international census data for social science and health research. Available: international. ipums. org/ international/ [Accessed 20 Mar 2021].
21 United Nations Statistical Division. Population Censuses’ Datasets, 1995. Available: https:// unstats. un. org/ unsd/ demographic- social/ products/ dyb/ dybcensusdata. cshtml [Accessed 20 Mar 2021].
22 Levira F, Newton CR, Masanja H, et al. Mortality of neurological disorders in Tanzania: analysis of baseline data from sample vital registration with verbal autopsy (SAVVY). Glob Health Action 2019;12:1596378.
23 Finlay JE, Brewster MB, Canning D. Estimating household permanent income from ownership of physical assets, 2012.
24 Malawi Freedom Network. Police impound unregistered motorcycles in lilongwe. Malawi freedom network. Available: https:// malawifreedomnetwork. com/ police- impound- unregistered- motorcycles- in- lilongwe/ [Accessed 20 Mar 2021].
25 Salau G. Unregistered motorbikes worsening Lagos’ security challenges. The Guardian Nigeria, 2020. Available: https:// guardian. ng/ sunday- magazine/ unregistered- motorbikes- worsening- lagos- security- challenges/
26 Job R, Lancelot E, Gauthier G. Federative Republic of Brazil: national road safety capacity review. Washington D.C.: World Bank Global Road Safety Facility, 2015.
27 Goel R, Mohan D, Guttikunda SK, et al. Assessment of motor vehicle use characteristics in three Indian cities. Transp Res D Transp Environ 2016;44:254–65.
28 Abdalla S, Abdelgadir N, Shahraz S. Respondents’ recall of injury events: an investigation of recall bias in cross- sectional injury data from the Sudan Household Health Survey 2010, 2014: 1–9.
29 Wright DB. Recall of the Hillsborough disaster over time: Systematic biases of ‘flashbulb’ memories. Appl Cogn Psychol 1993;7:129–38.
30 Ricker TJ, Vergauwe E, Cowan N. Decay theory of immediate memory: from brown (1958) to today (2014). Q J Exp Psychol 2016;69:1969–95.
31 Hardt O, Nader K, Nadel L. Decay happens: the role of active forgetting in memory. Trends Cogn Sci 2013;17:111–20.
32 Segui- Gomez M, MacKenzie EJ. Measuring the public health impact of injuries. Epidemiol Rev 2003;25:3–19.
33 Bhalla K. Monitoring India's progress on road safety will require investment in data systems. Lancet Public Health 2020;5:e82.
34 Usami DS, Persia L, Meta E, et al. Improving road safety knowledge in Africa through crowdsourcing: the African road safety Observatory. Transportation Research Procedia 2020;45:418–25.
35 Raffo V, Bose D, Shotten M. Measuring road safety performance through regional observatory in Latin America. World Bank Transport Notes 2014;TRN- 48:8.
on February 27, 2022 by guest. P
rotected by copyright.http://gh.bm
j.com/
BM
J Glob H
ealth: first published as 10.1136/bmjgh-2021-007296 on 15 N
ovember 2021. D
ownloaded from
Related Documents