AUTOTROPHIC DENITRIFICATION OF GROUNDWATER IN A GRANULAR SULFUR-PACKED UP-FLOW REACTOR by SHIH-HUI PAN Presented to the Faculty of the Graduate School of The University of Texas at Arlington in Partial Fulfillment of the Requirements for the Degree of DOCTOR OF PHILOSOPHY THE UNIVERSITY OF TEXAS AT ARLINGTON May 2007

Welcome message from author
This document is posted to help you gain knowledge. Please leave a comment to let me know what you think about it! Share it to your friends and learn new things together.
Transcript
AUTOTROPHIC DENITRIFICATION OF GROUNDWATER
IN A GRANULAR SULFUR-PACKED
UP-FLOW REACTOR
by
SHIH-HUI PAN
Presented to the Faculty of the Graduate School of
The University of Texas at Arlington in Partial Fulfillment
of the Requirements
for the Degree of
DOCTOR OF PHILOSOPHY
THE UNIVERSITY OF TEXAS AT ARLINGTON
May 2007

Copyright © by Shih-Hui Pan 2007
All Rights Reserved
iii
ACKNOWLEDGEMENTS
I wish to express my sincere thanks and appreciation to my supervising
professor, Dr. Syed R. Qasim, for his continual help and guidance. This dissertation
could not have taken place without the knowledge that I have gained from him
throughout the entire period of my Ph.D. program. Special gratitude is also extended to
all of the faculty members who have contributed to the completion of this dissertation,
as well as Dr. Ernest Crosby, Dr. Thomas Chrzanowski, Dr. Max Spindler, and Dr.
Chien-Pai Han for serving on my committee.
I would like to thank Dr. Ardekani Siamak for providing me partial funding on
the experimental reactor. I also want to thank Rodney Duke for his help in constructing
my experimental reactor. I would like to dedicate this dissertation to the memory of my
late father, Kung Pan, for his continual support while I was studying full time in my
Ph.D. program. Without him, I could not have come this far. I could never thank my
father enough for everything he has provided to me. Finally, I would also like to thank
my wife, Shwu-Ing Liao, and my son, Chuan-Jer Pan, for their patience, understanding
and encouragement, and for having faith in me.
April 10, 2007

iv
ABSTRACT
AUTOTROPHIC DENITRIFICATION OF GROUNDWATER
IN A GRANULAR SULFUR-PACKED
UP-FLOW REACTOR
Publication No. ______
Shih-Hui Pan, Ph.D.
The University of Texas at Arlington, 2007
Supervising Professor: Syed R. Qasim
Autotrophic denitrification is an effective treatment technique for nitrate
removal from groundwater. Six basic elements are required for the growth of
autotrophic denitrifiers: (1) electron donor, (2) electron acceptor, (3) active bacteria, (4)
anoxic/anaerobic environment, (5) micronutrients, and (6) optimum pH and
temperature. In this research, granular sulfur is an electron donor; nitrate is an electron
acceptor; anoxic and anaerobic environment was maintained in the reactor, and
micronutrients were added; pH was controlled between 6 and 9, and temperature was
maintained at the room temperature (20 + 2 oC). Batch reactor and continuous up-flow
reactor experiments were carried out to investigate the denitrification rate, and reaction
v
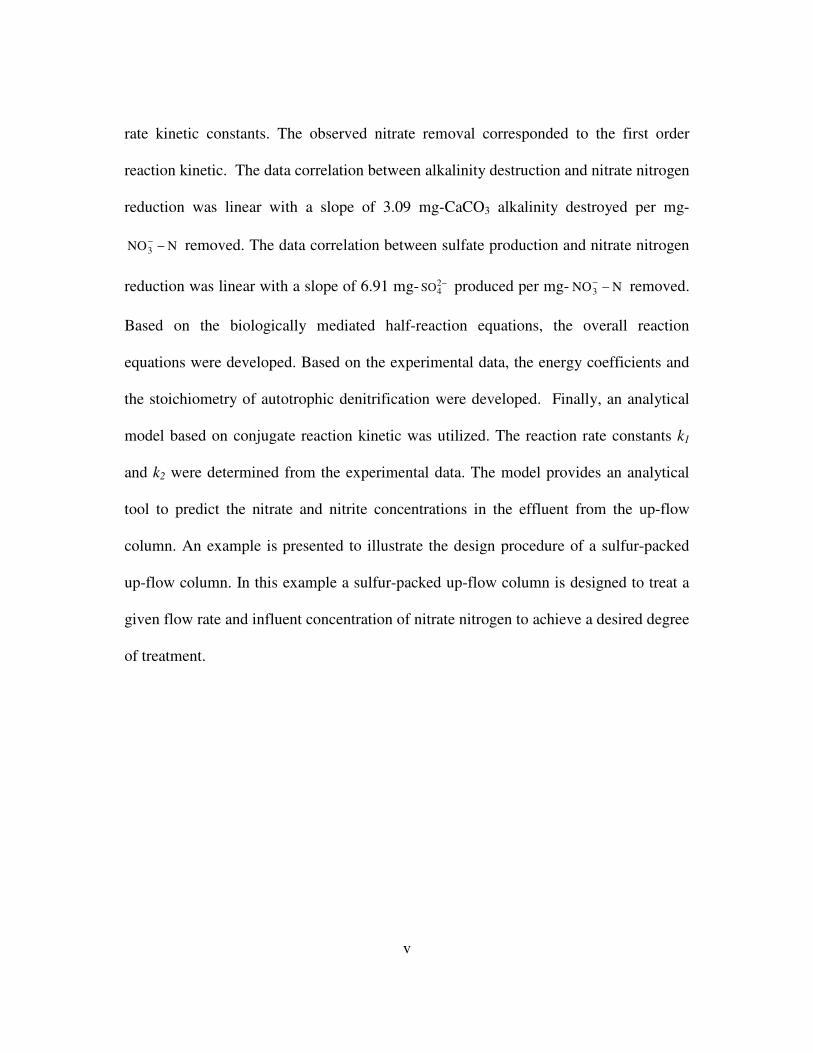
rate kinetic constants. The observed nitrate removal corresponded to the first order
reaction kinetic. The data correlation between alkalinity destruction and nitrate nitrogen
reduction was linear with a slope of 3.09 mg-CaCO3 alkalinity destroyed per mg-
NNO3 −− removed. The data correlation between sulfate production and nitrate nitrogen
reduction was linear with a slope of 6.91 mg- −24SO produced per mg- NNO3 −
− removed.
Based on the biologically mediated half-reaction equations, the overall reaction
equations were developed. Based on the experimental data, the energy coefficients and
the stoichiometry of autotrophic denitrification were developed. Finally, an analytical
model based on conjugate reaction kinetic was utilized. The reaction rate constants k1
and k2 were determined from the experimental data. The model provides an analytical
tool to predict the nitrate and nitrite concentrations in the effluent from the up-flow
column. An example is presented to illustrate the design procedure of a sulfur-packed
up-flow column. In this example a sulfur-packed up-flow column is designed to treat a
given flow rate and influent concentration of nitrate nitrogen to achieve a desired degree
of treatment.
vi
TABLE OF CONTENTS
ACKNOWLEDGEMENTS....................................................................................... iii
ABSTRACT .............................................................................................................. iv LIST OF ILLUSTRATIONS..................................................................................... xi LIST OF TABLES..................................................................................................... xiii
Chapter
1. INTRODUCTION ......................................................................................... 1
1.1 Background.............................................................................................. 1
1.2 Purpose of the Study ............................................................................... 3
1.3 Research Objectives................................................................................. 3
1.4 Research Scope........................................................................................ 3
1.4.1 Batch Reactor Study................................................................. 4
1.4.2 Continuous Granular Sufur-Packed Up-Flow Column Study .. 4
1.5 Research Organization............................................................................. 4
2. LITERATURE REVIEW .............................................................................. 6
2.1 Introduction.............................................................................................. 6
2.2 Microbiology and Stoichiometry of Biological Denitrification .............. 7
2.2.1 Nutritional Requirements for Growth....................................... 10
2.2.2 Natural Substrates ..................................................................... 13
vii
2.2.3 Inhibitors................................................................................... 14
2.2.4 Energy Requirement and Bacterial Growth.............................. 15
2.3 Conventional Methods of Nitrate Removal from Drinking WaterSupplies................................................................................................... 15
2.4 Overview of Biological Denitrification ................................................... 16
2.4.1 Denitrification in Surface Water.............................................. 16
2.4.2 Denitrification in Groundwater................................................. 17
2.4.3 Denitrification in Above Ground Reactor ................................ 18
2.4.3.1 Heterotrophic Denitrification ...................................... 18
2.4.3.2 Autotrophic Denitrification ......................................... 19
3. MATERIAL AND METHODS ..................................................................... 25
3.1 Description of Batch and Continuous Flow Reactor ............................... 25
3.1.1 Batch Reactor............................................................................ 25
3.1.2 Continuous Up-Flow Reactor ................................................... 26
3.2 Sulfur Media............................................................................................ 31
3.3 Reactor Operation ................................................................................... 31
3.3.1 Seed Cultivation in the Batch Reactor...................................... 31
3.3.2 Operation of Batch Reactor ...................................................... 32
3.3.3 Operation of Continuous Up-Flow Reactor.............................. 32
3.3.3.1 Start-up Phase.............................................................. 33
3.3.3.2 Reactor Operation........................................................ 33
3.3.4 Sampling, and Sample Preparation........................................... 34
3.3.5 Applied Hydraulic and Substrate Loadings.............................. 35
viii
4. RESULTS....................................................................................................... 40
4.1 Batch Reactor Study ............................................................................... 40
4.2 Continuous Up-Flow Reactor Study........................................................ 41
4.2.1 Start-up Phase ........................................................................... 44
4.2.2 Operation Phase ........................................................................ 44
4.2.2.1 Results at Hydraulic Loading of 0.06 m3/m2.hr. ......... 45
4.2.2.2 Results at Hydraulic Loading of 0.08 m3/m2.hr. ......... 49
4.2.2.3 Results at Hydraulic Loading of 0.10 m3/m2.hr. ......... 54
5. DISCUSSION................................................................................................ 58
5.1 Batch Reactor Study ............................................................................... 58
5.1.1 Reactor Base Line Data ............................................................ 58
5.1.2 Alkalinity Destruction, −24SO Production, and Gas Generation 58
5.1.3 Statistical Analyses of Alkalinity Destruction, −24SO
Production, and Gas Generation with Respect toNNO3 −
− Consumption ........................................................... 62
5.1.4 Theoretical Volume of Nitrogen Gas Generation underExperimental Condition ........................................................... 64
5.2 Continuous Up-Flow Reactor Study........................................................ 65
5.2.1 Alkalinity Destruction and Sulfate Production......................... 66
5.2.1.1 Alkalinity Destruction.................................................. 66
5.2.1.2 Sulfate Production........................................................ 68
5.2.2 Statistical Analyses of Alkalinity Destruction, and −24SO
Production, with Respect to NNO3 −− Consumption .............. 68
ix
5.2.3 Stoichiometry of Autotrophic Denitrification .......................... 70
5.2.3.1 Half Reaction Equations .............................................. 71
5.2.3.2 Overall Reaction Equations.......................................... 72
5.2.3.3 Application of Experimental Data to DetermineOverall Stoichiometric Equation Coefficients ............. 74
5.2.4 Initial Alkalinity Destruction and Sulfate ProductionDue to DO Removal................................................................. 77
5.2.4.1 Initial Alkalinity Destruction ....................................... 77
5.2.4.2 Initial Sulfate Production ............................................. 79
5.2.5 Data Modeling of Sulfur-Packed Continuous Up-FlowReactor ..................................................................................... 80
5.2.5.1 Determination of Nitrate Reaction Rate Constant k1 ... 83
5.2.5.2 Determination of Nitrite Reaction Rate Constant k2 .... 83
5.2.5.3 Sensitivity Analysis of the Model ................................ 88
5.2.6 Design Example........................................................................ 93
6. CONCLUSIONS AND RECOMMENDATIONS........................................ 96
6.1 Conclusions.............................................................................................. 96
6.2 Recommendations.................................................................................... 99
Appendixes
A. STOICHIOMETRIC RELATIONSHIP OF BIOLOGICALDENITRIFICATION ................................................................................... 101
B. USEFUL HALF-REACTIONS INVOLVED IN BIOLOGICALSYSTEMS .................................................................................................... 104
C. PHYSICAL CHARACTERISTICS OF SULFUR MEDIA USED IN THISRESEARCH PROGRAM ............................................................................ 109
x
D. ANALYTICAL METHODS ....................................................................... 112
E. RAW EXPERIMENTAL DATA OF BATCH REACTOR STUDY........... 115
F. RAW EXPERIMENTAL DATA OF SULFUR-PACKED CONTINUOUSUP-FLOW REACTOR STUDY.................................................................... 119
G. DETERMINATION OF REACTION RATE CONSTANT k1 USINGFUJIMOTO METHOD ................................................................................. 138
REFERENCES .......................................................................................................... 141
BIOGRAPHICAL INFORMATION......................................................................... 148

xi
LIST OF ILLUSTRATIONS
Figure Page
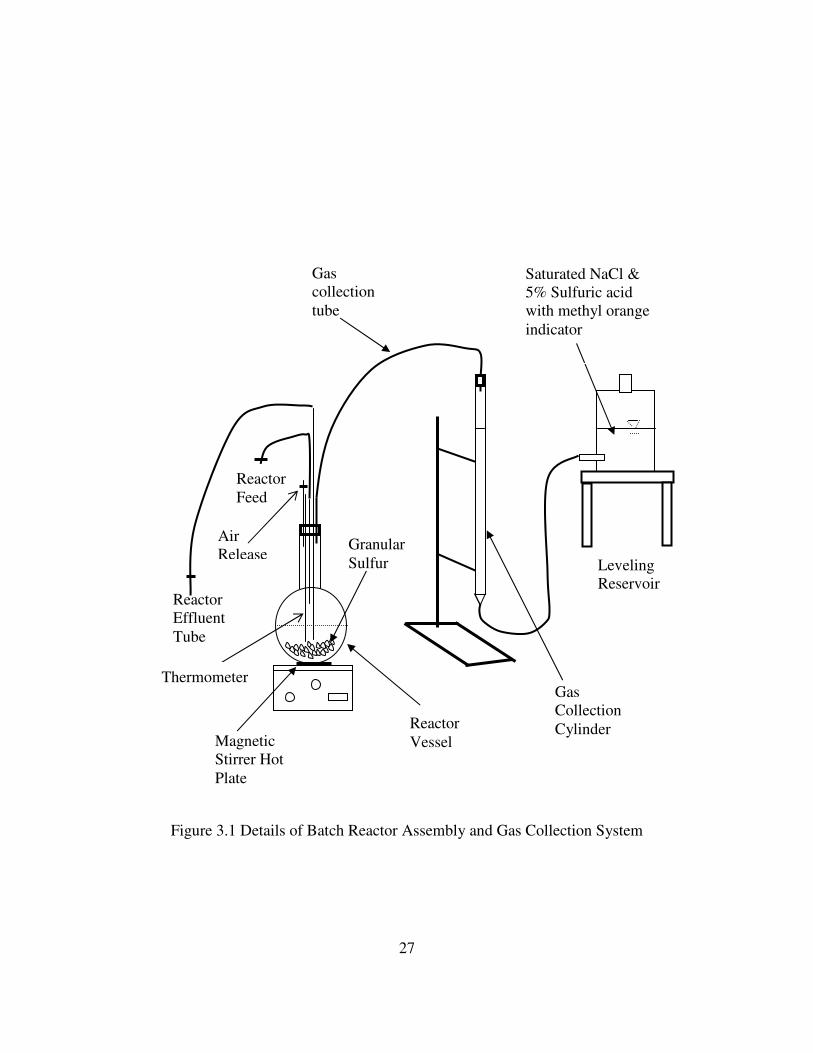
3.1 Details of Batch Reactor Assembly and Gas Collection System................. 27
3.2 Photograph of Batch Reactor Assembly and Gas Collection System.......... 28
3.3 Assembly of Sulfur-Packed Continuous Up-Flow Reactor ......................... 29
3.4 Photograph of Sulfur-Packed Continuous Up-Flow Reactor....................... 30
4.1 Graphical Presentation of Effluent Concentrations (a) NNO3 −− , and
NNO2 −− Concentrations with Respect to HRT, and (b) Alkalinity and
Sulfate Concentrations with Respect to HRT at Hydraulic Loading of0.06 m3/m2.hr................................................................................................ 48
4.2 Graphical Presentation of Effluent Concentrations (a) NNO3 −− , and
NNO2 −− Concentrations with Respect to THRT, and (b) Alkalinity and
Sulfate Concentrations with Respect to THRT at Hydraulic Loading of0.08 m3/m2.hr................................................................................................ 53
4.3 Graphical Presentation of Effluent Concentrations (a) NNO3 −− , and
NNO2 −− Concentrations with Respect to THRT, and (b) Alkalinity and
Sulfate Concentrations with Respect to THRT at Hydraulic Loading of0.10 m3/m2.hr................................................................................................ 57
5.1 Relationship between Alkalinity Destruction andNitrate Nitrogen Reduction .......................................................................... 67
5.2 Relationship between Sulfate Production andNitrate Nitrogen Reduction .......................................................................... 69
5.3 Relationship between C/Co and THRT at Hydraulic Loading of0.06 m3/m2.hr................................................................................................ 84

xii
5.4 Relationship between C/Co and THRT at Hydraulic Loading of0.08 m3/m2.hr................................................................................................ 85
5.5 Relationship between C/Co and THRT at Hydraulic Loading of0.10 m3/m2.hr................................................................................................ 86
5.6 Relationship between Average C/Co and THRT at Three CombinedHydraulic Loadings ......................................................................................... 87
5.7 Comparison of Average C/Co from Experimental Result and CalculatedC/Co from Derived k1 and k2 ........................................................................... 89
5.8 Sensitivity Analysis and Concentration Profiles (a) k1 Constant at 1.41/hr(best fit value) and k2 = 4.73/hr (50% higher than best fit k2 = 3.15/hr),and (b) k1 Constant at 1.41/hr (best fit value) and k2 = 1.58/hr(50% lower than best fit k2 = 3.15/hr) ............................................................ 91
5.9 Sensitivity Analysis and Concentration Profiles (a) k2 Constant at 3.15/hr(best fit value) and k1 = 2.11/hr (50% higher than best fit k1 = 1.41/hr),and (b) k2 Constant at 3.15/hr (best fit value) and k1 = 0.71/hr(50% lower than best fit k2 = 1.41/hr)........................................................... 92
xiii
LIST OF TABLES
Table Page
2.1 Summary of Stoichiometric Relationship for HeterotrophicDenitrification .............................................................................................. 11
2.2 Summary of Stoichiometric Relationship for AutotrophicDenitrification .............................................................................................. 12
3.1 The Density, Void Ratio, and Specific Surface Area of the Media ............. 31
3.2 Composition of Micro Nutrients for Continuous Up-Flow Reactor ............ 34
3.3 Hydraulic Loadings and NNO3 −− Concentrations in the Feed During
Operation Phase............................................................................................ 34
3.4 Summary of THRT at Each Sampling Port at Three Hydraulic Loadings... 36
3.5 Summary of NNO3 −− Loadings at Each Sampling Port at Three
Hydraulic Loadings (Influent NNO3 −− = 20 mg/L) .................................. 36
3.6 Summary of NNO3 −− Loadings at Each Sampling Port at Three
Hydraulic Loadings (Influent NNO3 −− = 40 mg/L) .................................. 37
3.7 Summary of NNO3 −− Loadings at Each Sampling Port at Three
Hydraulic Loadings (Influent NNO3 −− = 50 mg/L) .................................. 37
3.8 Summary of NNO3 −− Loadings at Each Sampling Port at Three
Hydraulic Loadings (Influent NNO3 −− = 60 mg/L) .................................. 38
3.9 Summary of NNO3 −− Loadings at Each Sampling Port at Three
Hydraulic Loadings (Influent NNO3 −− = 70 mg/L) .................................. 38
xiv
3.10 Summary of NNO3 −− Loadings at Each Sampling Port at Three
Hydraulic Loadings (Influent NNO3 −− = 90 mg/L) .................................. 39
4.1 Characteristics of Batch Reactor Feed ......................................................... 42
4.2 Batch Reactor Daily Effluent Quality Data and Gas Generation................. 43
4.3 Average Concentrations of Measured Parameters in the Influent andEffluent from Each Port at Hydraulic Loading of 0.06 m3/m2.hr and
Influent Target NNO3 −− Concentrations of 20, 50, 70, and 90 mg/L........ 46
4.4 Average Concentrations of Measured Parameters in the Influent andEffluent from Each Port at Hydraulic Loading of 0.08 m3/m2.hr and
Influent Target NNO3 −− Concentrations of 20, 40, 50, 60, and 70 mg/L.. 50
4.5 Average Concentrations of Measured Parameters in the Influent andEffluent from Each Port at Hydraulic Loading of 0.10 m3/m2.hr and
Influent Target NNO3 −− Concentrations of 20, 40, 60, and 70 mg/L........ 55
5.1 Calculated Volume and Concentrations in the Reactor after Addition ofRaw Feed ...................................................................................................... 60
5.2 Calculated Alkalinity Destruction, Sulfate Production, NNO3 −−
Consumption, and Gas Generation .............................................................. 61
5.3 Summary of Statistical Output for Linear Regression of Alkalinity
Destruction, −24SO Production, and Gas Generation with Respect to
NNO3 −− Consumption (Batch Reactor) ..................................................... 63
5.4 Summary of Statistical Output for Linear Regression of Alkalinity
Destruction and −24SO Production with Respect to NNO3 −
−
Consumption (Continuous Flow Reactor) .................................................... 68
1
CHAPTER 1
INTRODUCTION
1.1 Background
High concentration of nitrate in drinking water is associated with serious health
risks. It causes methemoglobinemia or “blue-baby syndrome” in infants. Nitrate is
reduced to nitrite in saliva or in the gastrointestinal tract. Nitrite oxidizes the
hemoglobin to methemoglobin causing a loss in oxygen carrying capacity of the blood.
Methemoglobinemia occurs mainly in infants (Challis, 1973). Under abnormal
conditions, some circumstantial evidences have shown that ingestion of nitrate may
cause gastric cancer due to the formation of nitrite (Mirvish, 1991).
Research on nitrate removal technologies from municipal water supplies is
increasing because of nitrate contamination. Power and Schepers (1989) indicated that
in North America, 90 percent of the rural population and 50 percent of the total
population depend on groundwater as their water supply source. The major sources of
groundwater contamination from nitrate are due to excessive application of agricultural
fertilizers and the septic tanks effluent (Exner and Spaulding, 1990). A 1985 survey of
American Water Works Association (AWWA) indicated that about 23 percent of
violations of Primary Drinking Water Standards in the United States are due to
excessive nitrate levels (Bouwer and Crowe, 1988). A 1995 survey of AWWA showed
2
that 20 percent of shallow private wells in the farming areas of the United States violate
the federal drinking water standard and one percent of public water supply wells exceed
the Maximum Contaminant Level (MCL) due to excessive nitrate concentration.
Bouchard et al. (1992) indicated that the nitrate-N concentration exceeded the 10 mg/L
MCL level in more than 20 percent of the wells sampled in Iowa. Davidson and
Ridgeway (1995) reported that over 250,000 acre-feet of the groundwater basin in
Orange County, California contains nitrate nitrogen concentrations exceeding the MCL.
A proven and an economically effective method for nitrate removal is biological
denitrification. It is carried out by heterotrophic or autotrophic organisms. Heterotrophic
denitrification is the most common method used in wastewater treatment. An external
carbon source is needed to denitrify the drinking water source. In drinking water,
carbon is undesired as it is a precursor for trihalomethane formation, and excessive
amounts may increase the microbial growth in the distribution system resulting in taste
and odor problems, and accelerated pipe corrosion (Gantzer, 1995). Because of these
problems, the autotrophic denitrification is considered a better alternative for nitrate
removal. The benefits of autotrophic denitrification over heterotrophic denitrification
are: (1) does not need organic carbon as a carbon and energy source, (2) uses inorganic
carbon dioxide as a carbon source, and (3) uses inorganic mineral as an energy source.
Under an anaerobic condition, autotrophic organisms oxidize inorganic minerals while
reducing nitrate to nitrogen gas.

3
1.2 Purpose of the Study
Many researchers have studied autotrophic denitrification using different
sources of electron donors. The inorganic electron donors include: So, S2O32-, S2-, H2,
HS-, NO2-, and Fe+2 (Batchelor, 1978b; Kurt et al. 1987; Hiscock et al. 1991). Granular
sulfur is chosen in this investigation as an electron donor because it is stable and
insoluble, a low cost mineral, and is easy to handle. Only few researchers have studied
the feasibility of using granular sulfur as an electron donor. There is a need to determine
the performance of autotrophic denitrifican using granular sulfur as an electron donor.
Effective design and operation of such a system requires an understanding of basic
principles governing substrate utilization, alkalinity destruction, sulfate production, and
denitrification theory and design.
1.3 Research Objectives
The objectives of this research are: (1) to develop the performance criteria of
autotrophic denitrifiers in a granular sulfur-packed up-flow reactor, (2) to develop
stoichiometry of autotrophic denitrification, and (3) to develop a model to express the
nitrate and nitrite concentrations in the finished water as a function of influent nitrate
concentration, and true hydraulic retention time.
1.4 Research Scope
The research objectives were achieved by conducting experimental studies
using a batch reactor, and a continuous up-flow sulfur-packed column. The scope of this
research is summarized below:
4
1.4.1 Batch Reactor Study
Batch reactor study was conducted to develop the preliminary information
needed to design and operate a continuous up-flow sulfur-packed reactor. The batch
reactor study was used to:
� Develop autotrophic denitrifying culture for use in the continuous up-
flow reactor.
� Develop the preliminary information on relationships of alkalinity
destruction, sulfate production, and gas production with respect to
nitrate nitrogen removal.
1.4.2 Continuous Granular Sulfur-Packed Up-flow Column Study
The sulfur-packed up-flow column study was utilized to
� Develop the ratios of alkalinity destruction per unit of nitrate nitrogen
removal, and sulfate production per unit of nitrate nitrogen removal.
� Develop biological kinetic constants, half reaction energy coefficients,
and stoichiometry.
� Develop an analytical model to predict the effluent concentrations of
nitrate and nitrite as a function of influent nitrate concentration and true
hydraulic retention time.
1.5 Research Organization
The research work presented in this report is organized to enhance the
readability. The literature review provides the state-of-the-art survey of the published
material on autotrophic denitrification. The experimental work and results of the batch

5
reactor and continuous flow reactor study are presented separately followed by the
discussion, conclusions and recommendations.
The major findings are reported in the main body of this report. The supporting
material and bulk data are arranged in seven Appendixes.
6
CHAPTER 2
LITERATURE REVIEW
2.1 Introduction
Municipal and industrial discharges and extensive use of fertilizers in
agriculture has resulted in nitrate contamination in the surface and groundwater
resources. Because of the adverse health effects associated with nitrate in drinking
water, the U.S. Environmental Protection Agency (EPA) has set a 10 mg/L NNO3 −−
under Primary Drinking Water Standards (Pontius, 1993). The feasible methods for
removing nitrate from water supply are: ion exchange, reverse osmosis, electrodialysis,
catalytic denitrification, and biological denitrification. Of these methods, the biological
denitrification is the most cost effective method (Kapoor, 1997). Currently, ion
exchange is the most commonly used method for removing nitrate from small water
supply system in the United States (Clifford and Liu, 1993). Conventional ion exchange
is economically not feasible for large applications because ion exchange technology
removes all anions and produces brine rich in nitrate, chloride, and sulfate. The
production of concentrated waste brines creates serious wastewater disposal problems.
The biological treatment of nitrate is preferred over physicochemical methods
because of selective removal capability and formation of harmless end products.
Biological denitrification has two benefits: (1) the nitrate is destroyed rather than

7
merely concentrated, and (2) it does not produce large quantities of waste products such
as regeneration brines (Delanghe et al., 1994a).
2.2 Microbiology and Stoichiometry of Biological Denitrification
Biological nitrate reduction is an oxidation-reduction process through microbial
metabolic activity. Microorganisms obtain energy through oxidizing electron donors
(either organic or inorganic) and releasing electrons. Nitrate is an electron acceptor and
will be reduced upon receiving the electrons. There are two types of biological nitrate
reduction. One is assimilative nitrate reduction, where nitrate is reduced to ammonia for
use as a nitrogen source for growth, and the other is dissimilative nitrate reduction,
where nitrate is used as an electron acceptor and is reduced to N2 in energy generation.
Brock et al. (1994) reported five biological denitrification properties. These are: (1)
under most conditions, the end product of dissimilative nitrate reduction is N2 or N2O,
(2) the first product of nitrate reduction is nitrite and nitrate reductase is the enzyme to
catalyze the reaction, (3) nitrite reductase is responsible for the next step to reduce
nitrite into nitrogen gas, (4) in general, assimilative nitrate reductases are ammonia
repressed, whereas dissimilative nitrate reductases are repressed by O2 and synthesized
under anoxic conditions, and (5) the process of denitrification is strictly an
anaerobic/anoxic process, whereas assimilative nitrate reduction can occur quite well
under fully aerobic conditions.
Cizinska et al. (1992) reported that biological nitrate reduction is currently the
predominant method for nitrate removal from wastewater. Four basic elements are
required for denitrification to occur. These are electron donor, electron acceptor, active
8
bacteria, and anoxic condition. Biological denitrification is accomplished either by
heterotrophic denitrification or by autotrophic denitrification. Heterotrophic process is
conducted by microorganisms which require an organic substrate for carbon source.
Autotrophic process is conducted by microorganisms which require inorganic carbon
for carbon source. In both processes the microorganisms obtain energy via reduction of
nitrate and oxidation of suitable substrate.
Many bacteria can reduce nitrogen oxides into harmless nitrogen gas in the
anoxic environment. The most common heterotrophic denitrifiers are various species of
Pseudomonas and Bacillus (Brezonik, 1977). Davies (1973) isolated denitrifican
bacteria from settled wastewater, using methane as a sole carbon source and nitrate as
the terminal electron acceptor. The identified genera included Alcaligence,
Achromobacter, Bacillus, Methanomonas, and Pseudomonas.
The autotrophic organisms oxidize inorganic mineral and release the electrons
to reduce nitrate; nitrogen gas is released. Many researchers have shown that
Thiobacillus denitrificans (T. denitrificans) and T. thioparus can effectively remove
nitrate from water by using a reduced sulfur compound as the electron donor and nitrate
as the electron acceptor (Gayle et al, 1989). The typical reduced sulfur compounds are
sulfides and elemental sulfur (S2-, S2O32-, and So). The determinative bacteriology of
Bergey’s Manual indicated that T. denitrifican is the responsible microorganism for
autotrophic denitrification. This bacterium can reduce nitrate into nitrogen gas while
oxidizing elemental sulfur (Bergey et al, 1974). Other major autotrophic bacteria are
Micrococcus denitrificans and Paracoccus denitrificans which oxidize H2 using nitrate

9
as the terminal electron acceptor (Kurt et al., 1987). Paracoccus denitrificans and
Thiobacillus denitrificans can denitrify using hydrogen and reduced-sulfur compound,
respectively. However, both can also grow heterotrophically if an organic carbon source
is present (Waki et al, 1980; Kurt et al. 1987; Claus and Kutzner, 1985b). The
advantage of autotrophic growth is that there is no need for organic substrate for energy
and cell synthesis. Some aerobic autotrophic bacteria can completely oxidize the
inorganic sulfur for their energy source. Thiobacillus thiooxidans is a good example. A
comprehensive research on the respiration process of T. denitrifican using thiosulfate as
the electron donor has been presented by Justin and Kelly (1978a).
Lubchenoko (1996) reported six physiological properties of autotrophic
denitrifying bacteria. These are: (1) growth is in purely mineral medium but in the
presence of an inorganic substance such as sulfur that can be oxidized, (2) the vital
activity of microorganisms is closely related to the presence of oxidizable inorganic
substance, (3) oxidation of inorganic substance is the sole source of energy, (4) organic
substance is not needed as a source of carbon and energy, (5) autotrophic organisms are
unable to decompose organic substances; the presence of organic matters slows down
the development of autotrophic organisms, and (6) carbon dioxide is the sole source of
carbon.
The morphological and physiological properties of Thiobacillus denitrifican are
clearly described in the Systematic Bacteriology of Bergy’s Manual (1986). The
properties are described as follows: Thiobacillus denitrifican is colorless sulfur bacteria,
which can be found in any place where reduced sulfur compounds are present. The

10
presence of colorless sulfur bacteria can be observed through the naked eye by the
appearance of copious white deposits of sulfur, streamers, veils, or films. Thiobacillus is
a chemolithoautrotrophic microorganism (obligate or facultative) growing below 55 oC,
gram-native, rod-shaped, motile with polar flagella, or nonmotile. No intracellular
sulfur is visible under the light microscope, but these may contain finely dispersed
sulfur, visible under the electron microscope after staining with silver salts. Many T.
denitrifican may deposit sulfur in the colonies after prolonged incubation in the
presence of sulfide, making the colonies (yellowish) white and opaque.
Many stoichiometric relationships for heterotrophic and autotrophic
denitrification have been proposed by several investigators. The stoichiometric
constants and relationships are summarized in Tables 2.1 and 2.2. The general equations
are presented in Appendix A.
2.2.1 Nutritional Requirements for Growth
Nutrients are necessary for cell growth and development. The nutrients include
C, H, O, N, P, and S that are needed in large amounts. Minerals such as K, Na, Mg, Ca,
and Fe are needed in small amount. Some metals such as Mn, Zn, Cu, Co, and Mo are
also required in trace amount for biological cell synthesis (Champ et al., 1979). Most
groundwater contains adequate concentrations of the necessary minerals and trace
metals to support biosynthesis. Gaudy and Gaudy (1980) indicated that a
microorganism could not reproduce if an essential element is totally unavailable.

11
Table 2.1 Summary of Stoichiometric Relationship for Heterotrophic Denitrification
ElectronAcceptor
ElectronDonor
CarbonSource
Product AlkalinityStatus
References
1 −3NO
(nitrate)
1.08 CH3OH(methanol)
Same aselectrondonor
0.47 N2
0.76 CO2
2.44 H2O0.065C5H7O2N
1 H+
consumedMcCarty(1969)
12 −3NO 5 C2H5OH
(ethanol)Same aselectrondonor
6 N2
10 CO2
9 H2O
12 −OH
produced
Richard etal.(1980)
8 −3NO 5CH3COOH
(acetate)Same aselectrondonor
4 N2
10 CO2
6 H2O
8 −OH
produced
Frick andRichard(1985)
8 −3NO 5 CH4
(methane)Same aselectrondonor
4 N2
5 CO2
14 H2O
8 H+
consumedBarrensteinet al.(1986)
6 −3NO 5 CH3OH
(methanol)Same aselectrondonor
3 N2
5 CO2
7 H2O
6 −OH
produced
Sherrard(1988)
2 −3NO 5 CO
(carbonmono oxide)
Same aselectrondonor
1 N2
5 CO2
1 H2O
2 H+
consumedFrunzke andMeyer(1990)
6 −3NO 5 CH3OH
(methanol)Same aselectrondonor
3 N2
5 CO2
7 H2O
6 −OH
produced
Metcalf andEddy(2003)
10 −3NO C10H19O3N
(wastewater)Same aselectrondonor
5N2
10CO2
3H2ONH3
10 −OH Metcalf andEddy(2003)
8 −3NO 5CH3COOH
(acetate)Same aselectrondonor
4N2
10CO2
6H2O
8 −OH Metcalf andEddy(2003)
Note: See Appendix A for additional details

12
Table 2.2 Summary of Stoichiometric Relationship for Autotrophic Denitrification
ElectronAcceptor
ElectronDonor
CarbonSource
Products AlkalinityStatus
References
1 −3NO
(0.08NH4+
used asnitrogensource)
1.1 0S(elementalsulfur)
0.4 CO2 0.5 N2
1.1 −24SO
0.08 C5H7O2N
1.28 H+
producedBatchelor(1978c)
8 −3NO 5 −2
32OS
(thiosulfate)
* 4 N2
10 −24SO
2 H+
producedZumft andCardenas(1979)
8 −3NO 5 −2
32OS
(thiosulfate)
* 4 N2
10 −24SO
2 H+
producedSchedel andTruper(1980)
3 O2 2 0S(elementalsulfur)
* 2 H2−2
4SO - Kelly(1982)
8 −3NO 5 −2
32OS
(thiosulfate)
* 4 N2
10 −24SO
2 H+
producedClaus andKutzner(1985)
8 −3NO 5 −2S
(sulfide)* 4 N2
5 −24SO
4 H2O
8 H+
consumedBarrensteinet al.(1986)
2 −3NO 5 H2
(hydrogengas)
* 1 N2
4 H2O2 −OH
produced
Kurt et al.(1987)
* Carbon was not incorporated in the balanced equation. See Appendix A for additional details
13
Temperature and pH are also a factor, and can affect the growth. Carbon,
oxygen, nitrogen, and hydrogen account for 90 percent of the cell mass. Phosphorus is
required for cell mass to generate ATP. The trace elements in general, as well as
potassium, calcium, and magnesium, serve as inorganic co-factors for specific enzymes
as well as organic co-factors. For cultivation and isolation of Thiobacillus denitrifican,
ammonium is required for nitrogen source. (Baalsrud and Baalsrud 1954). However,
Claus and Kutzner (1985b) reported that there was no need of ammonium for the
nitrogen source. They concluded that the organisms are capable of assimilatory as well
as of dissimilatory nitrate reduction.
2.2.2 Natural Substrates
The natural substrates for thiobacillus are the soluble sulfides and other reduced
sulfur compounds such as sulfur and thiosulfate (Kelly, 1982). The obligate
chemolithotrophs reduce sulfur compounds as the only energy source, and assimilate
carbon dioxide as the major carbon source. Some organic compounds can also be
utilized by these organisms but only to a limited extent and in a restricted pattern. The
facultative chemolithotrophs have a versatile physiology. They can grow
autotrophically, heterotrophically, and mixotrophically (Kurt et al., 1987)
Simultaneous presence of reduced sulfur compounds and oxygen or nitrate is
required for the growth of sulfur oxidizers. Many sulfur oxidizers often grow in a
narrow range with the coexistence in the presence of sulfide and oxygen or nitrate. It is
possible that autotrophic denitrification in aquifers can occur in the presence of
inorganic species such as Mn+2, Fe+2, and −HS (Hiscock et al., 1991). Elemental sulfur
14
being of low cost and ease of handling is probably the most promising element for
general use.
2.2.3 Inhibitors
Nitrate reductase is strongly inhibited by the presence of oxygen (Gayle et al.,
1989). Hiscock et al. (1991) indicated that in autotrophic denitrification, oxygen is an
important inhibitor in the energy metabolism of cells. Rittmann and Huck (1989)
reported that oxygen concentrations ranging from 0.1 to 0.2 mg/L have inhibitory effect
on denitrification. Skerman and MacRae (1957) demonstrated that nitrate reduction was
not observed at an oxygen concentration above 0.2 mg/L. In the competition between
oxygen and nitrate for an electron donor, nitrate can take over oxygen only in the
presence of enzymes that are required for nitrate respiration. According to Claus and
Kutzner (1985b), sulfate in excess of 5000 mg/L can inhibit denitrification. Nitrite
inhibition was also noted when its concentration was over 200 mg/L. The optimal
temperature was 30 oC and pH was 7.5 to 8.0. In the study of physiology of thiobacillus
denitrifcan, Baalsrud (1954) reported that the optimum pH was between 6.2 and 7.0.
Gauntlett and Craft (1979) indicated that denitrification is closely related to pH with an
optimum in the range 7.0 - 8.0. At a low temperature, denitrification decreases
markedly but is measurable between 0 and 5 oC. Meyers (1972) indicated that sulfide
would depress gaseous nitrogen production but stimulated the reduction of nitrate to
ammonium.

15
2.2.4 Energy Requirement and Bacterial Growth
Sawyer and McCarty (1978) indicated that autotrophic organisms oxidize
inorganic materials for energy. Energy is released by oxidation of inorganic electron
donor. The released energy is utilized to reduce carbon dioxide to form celluar organics.
Thus, a portion of the energy provided by the electron donor is used to maintain life
requirements and the other portion is used for cell synthesis. Half reactions in the cell
synthesis, electron acceptor, and electron donor are available (Sawyer and McCarty,
1978). The stoichometic coefficients of the half reaction are written based on one unit
of electron transfer. In the combination of half reactions to form the overall reaction
two coefficients are used. One is fs, which is the proportion of energy used for cell
synthesis. The other is fe, which is the proportion of energy used to maintain life
requirement. The sum of fs and fe is one. A system of the half equations is provided in
Appendix B.
2.3 Conventional Methods of Nitrate Removal from Drinking Water Supplies
Ion exchange, biological denitrification, and reverse osmosis have been applied
in full-scale facility for nitrate removal. Ion exchange is currently the most common
method of nitrate removal from drinking water in the United States (Clifford and Liu,
1993). Kapoor and Viraraghavan (1997) indicated that ion exchange provides an
attractive alternative for small and average-size facilities. It was considered suitable for
groundwater that was relatively free of dissolved organic matter.
In Europe, where larger scale nitrate removal must be accomplished,
heterotrophic biological denitrification is utilized by adding methanol, ethanol, or acetic
16
acid, as the carbon source. Phosphorus and other nutrients may be added (Gayle et al.,
1989). Reverse osmosis, distillation, and electrodialysis processes also remove
dissolved solids but do not selectively target nitrate. These processes are generally
considered too costly for routine nitrate removal from drinking water. Biological
denitrification is preferred over physicochemical processes because of the selective
removal capability and the formation of harmless end products. Autotrophic
denitrification is preferred over heterotrophic denitrification because it does not need
organic carbon source.
2.4 Overview of Biological Denitrification
Many researchers have extensively studied denitrification under different
environmental conditions. In a review of natural and artificial denitrifiation of
groundwater, Hiscock et al. (1991) indicated that natural denitrification does occur in
many aquifers, however, natural process cannot remove large quantities of nitrate that
may often be present in many aquifers. After comparing various ground and
underground techniques for denitrification, these investigators concluded that artificial
denitrification applied in above ground installations offered the most desirable nitrate
removal and process control capabilities.
2.4.1 Denitrification in Surface Water
In lakes during summer stratification, nitrate and nitrite concentrations are
typically highest at the mid-depth due to denitrification in the bottom waters and algae
assimilation in the surface waters. A comprehensive review on the fate of nitrate in
natural surface waters has been presented by Brezonik (1977). Given anoxic condition

17
and the presence of nitrate, the primary factor affecting the rate of denitrification is the
concentration of electron donor.
2.4.2 Denitrification in Groundwater
In-situ, the denitrification of groundwater is usually electron donor limited
(Smith et al., 1994). Most common electron donor in groundwater is dissolved organic
carbon (DOC). Thurman (1985) reported that in a survey of one hundred groundwaters
in the United States, the median DOC was 0.7 mg/L. Barcelona (1984) measured an
average total organic carbon (TOC) level of 2.95 mg/L in shallow sand and gravel
aquifer in northern Illinolis. It is now well established that denitrification rate in the
natural aquifers was increased by adding suitable electron donors (Smith et al., 1994,
Dahab, 1991).
Champ et al. (1979) reported that oxidation-reduction potential (ORP) can be
used as a verification of denitrification occurrence. The ORP would decline from a
highly oxidized state to a reduced state. However, Howard (1985) reported that
sometimes apparent lowering in nitrate concentration from above 10 to less than 2 mg/L
in the direction of decreasing ORP was not attributable to denitrification; rather, it was
primarily due to mixing of waters of different origins.
Currently, in-situ denitrification in a groundwater system has been proved
feasible, but the reaction rates and prediction techniques are not fully known. To
encourage in-situ biological degradation of wastewater, Korom (1992) reported adding
NO3- in the groundwater that was contaminated with hazardous organic compounds. In
a study of in-situ re-mediation, Reddy (1982) found that the rate of denitrification was
18
independent of the soil type, and was proportional to the concentration of −3NO and
available organic carbon. Smith and Duff (1988) indicated that available carbon would
not be a limiting factor to denitrify small amounts of −3NO in an aquifer. Enhanced
nitrate removal was found by adding formate or hydrogen as the electron donor, to a
slurried core sample obtained from an active zone of denitrification.
2.4.3 Denitrification in Above Ground Reactor
2.4.3.1 Heterotrophic Denitrification
Richard et al. (1980) conducted a study of denitrification of groundwater in
France. The study used a pilot-scale fluidized bed reactor with ethanol as the substrate.
The reactor was 6 m high, 250 mm in diameter, and operated without effluent recycle.
The results showed that the maximum specific nitrate utilization rate was 250 mg −3NO
per gram of volatile suspended solids per hour. Denitrification rates were greater at
lower flow velocities. The optimum up-flow velocity was 20 m/hr for bed expansion
and denitrification. The specific denitrification rate at this flow rate was 83 mg −3NO
per hour per gram of volatile suspended solids in the reactor.
Frick and Richard (1985) reported that a 50 m3/hr denitrification facility using
acetic acid as the carbon source and phosphate as the nutrient was able to remove nitrate
concentration from 80 mg/L as −3NO in the influent to 30 mg/L as −
3NO in the effluent.
The process applied an up-flow fixed-bed reactor, flocculation, carbon filtration and
chlorination. The nitrite concentration in the finished water was less than 0.1 mg/L.

19
Frank and Dott (1985) reported the performance of a pilot-scale bio-reactor
packed with polystyrene beads, and using methanol or ethanol as an energy source. The
results showed that the reactor was able to reduce nitrate concentration from 55 mg/L as
−3NO in the influent to 3 mg/L as −
3NO in the effluent. Most of the bacteria were
verified as genus Pseudomonas.
Hoek and Klapwijk (1988b) conducted a hybrid ion-exchange/biological-
denitrification study. This process used ion exchange to remove nitrate from
groundwater. The concentrated brine consisted of 700 mg/L of NNO3 −− , which was
then removed by a biological denitrification unit. The concentrated brine, after
denitrification, was recycled and used as a regenerant. However, the brine needed to be
replaced every six days due to the sulfate accumulation. This process achieved 80
percent reduction of brine-disposal compared to conventional once through regeneration
system.
2.4.3.2 Autotrophic Denitrification
In a study of the physiology and kinetics of autotrophic denitrification by
Thiobacillus denitrifican using thiosulfate as the electron donor, Claus and Kutzner
(1985b) reported that the optimum growth condition was 30 oC and pH 7.5 - 8.0.
maximum specific growth rate (µmax) = 0.11/h, half-velocity constant (Ks) = 0.2 mg
−3NO /L, maximum substrate utilization rate (k) = 0.78 g- −
3NO /g-VSS.h, yield
coefficients ( −3NO
Y ) = 0.129 g-VSS/g- −3NO , ( −2
32OSY ) = 0.085 g-VSS/g- −2
32OS . The

20
denitrification gas was almost pure N2. The concentrations of N2O and NO produced in
the reactor were below 1 ppm.
Kurt et al. (1987) studied the biodegradation kinetics of autotrophic hydrogen-
oxidizing denitrifying bacteria using a bench-scale fluidized bed reactor. The results
showed that a residence time of 4.5 hours was required for complete denitrification of
25 mg/L NNO3 −− . The optimum pH was approximately 7.5. The pH increased as a
result of denitrification reaction. If the pH was allowed to approach 9.0, nitrite
accumulated and the process failed.
In Germany, the performance of a commercial-scale biological-denitrification
plant using hydrogen as an electron donor was evaluated (Gross and Treuter, 1986). The
reactor was operated at a temperature of 10.5 oC. The organisms growth rate varied
from 0.1 to 0.3 per day. The sludge production on a dry-weight basis was approximately
0.2 kg per kg nitrate nitrogen removed. A residence time of one to two hours was
required to remove 11.3 mg/L NNO3 −− . The denitrification rate varied with the mass
and activity of the biomass.
In a slurry batch reactor test, Batchelor (1978b), reported that the observed yield
coefficients were 0.089 mg organic-N per mg of NNO3 −− removed, 2.35 mg SSO2
4 −−
per mg of NNO3 −− removed, and 0.113 meq alkalinity destroyed per mg of NNO3 −
−
removed. Sikora and Keeney (1976), successfully used elemental sulfur and
Thiobacillus denitrifican to denitrify septic tank effluent. Bisogni and Driscoll (1977)
conducted a research for autotrophic denitrification with Thiobacillus denitrifican using
21
sulfide and thiosulfate as electron donors. The yield coefficient was reported as 0.704
mg of VSS per mg of nitrate utilized when sulfide was used as the electron donor.
When thiosulfate was used as the electron donor, the yield coefficient was 0.703 mg of
VSS per mg of nitrate utilized.
Claus and Kutzner (1985b) successfully isolated Thiobacillus denitrificans using
thiosulfate as an energy source and nitrate as an electron acceptor and nitrogen source.
Later on, an upflow packed-bed reactor with lava-stone media was employed to treat
wastewater with high nitrate concentration. In this investigation, thiosulfate was used as
an electron donor. The results showed that 95 percent denitrification was achieved at the
nitrate loading of 25 kg/m3.d.
Batchelor and Lawrence (1978b), and Davidson and Ridgeway (1995)
conducted research on autotrophic denitrification using powdered slurry of sulfur as an
electron donor for Thiobacillus denitrifican. The results were promising. Lampe and
Zhang (1997), and Flere(1997) studied the autotrophic denitrification of groundwater
re-mediation using elemental sulfur and limestone granules. The results showed high
nitrate removal efficiency but biofouling of the media caused decreased removal
deficiency. It was suggested that backwashing of the bed at 40 to 60 days duration
would reduce the biofouling.
Frumai et al. (1996) operated two laboratory-scale biological filters using
thiosulfate as the electron donor. The objective was to investigate the effects of
alkalinity and pH on the removal of nitrate and nitrite. The reactor was filled with
granular anthracite media and was inoculated with activated sludge from a municipal

22
sewage treatment plant. The flow velocity was controlled at 4 m/day, which was in the
range of typical slow sand filtration rate. The results showed high nitrite accumulation
with below pH of 7.4. The alkalinity level in excess of 150 mg/L as CaCO3 was used to
maintain acceptable removal efficiency. Overath et al. (1986) conducted a study on
autotrophic denitrification using packed tower filled with elemental sulfur and activated
carbon. The reactor was 3-m long and 100 mm in diameter. The reactor was operated
with a flow rate of 30 L/hr. The reactor was able to remove nitrate from 35 mg/L in the
influent to almost 0 mg/L in the effluent.
Blecon et al. (1983) conducted studies on denitrification in a packed tower filled
with elemental sulfur and various ratios of limestone. The results showed that the
efficiency increased as the particle size of sulfur decreased. The lowest ratio of
limestone to granular sulfur gave the best results for water with a high-alkalinity (305
mg/L −3HCO ). Lewandowski et al. (1987) conducted denitrification studies using
calcium alginate beads suspended in a completely mixed batch reactor. Nitrogen gas
was used to provide reactor mixing. Nitrate was reduced from 27 mg/L to 6 mg/L in
seven hours. The nitrogen removal rate was 1.6 mg N/L.hr and increased to 4.8 mg
N/L.hr. Nitrite accumulated initially but later was reduced to below 2 mg/L as
NNO2 −− .
Hashimoto et al. (1989) conducted a study of enrichment of sulfur denitrifying
bacteria, and its acclimation to elemental sulfur on a batch reactor. The enrichment of
denitrifiers was established through various sources such as activated sludge and bottom
mud of polluted river. NaHCO3 was used to provide carbon source and pH adjustment.
23
−232OS and 0S were used as the electron donor. A pure single isolate was obtained from
repeated plating cultures and was identified as T. denitrificans. The isolated strain
showed the following characteristics: (1) short-rod shape, (2) motile, (3) gram-negative,
(4) strict autotrophic, (5) facultative anaerobe, and (6) oxidized elemental sulfur, but its
oxidation rate was slower than that of −232OS . The denitrifier acclimated to −2
32OS was
successfully acclimated to elemental sulfur by the gradual and stepwise replacement of
−232OS to elemental sulfur. The ratio of alkalinity destruction to nitrate nitrogen
removal was 2.49 when thiosulfate was used as an electron donor, and 4.39 when
elemental sulfur was used as an electron donor. The ratio of TOC increase to nitrate
nitrogen removal was 0.371 when thiosulfate was used as a substrate, and 0.361 when
elemental sulfur was used as a substrate. The denitrification rate followed the zero order
kinetics. The specific denitrification rates of enriched microorganism were 9.4 mg
NNO3 −− /mg-TOC.d in case of −2
32OS and 2.5 mg NNO3 −− /mg TOC.d in case of So
respectively.
Flere (1997) evaluated the performance of sulfur and limestone autotrophic
denitrification (SLAD) in a packed-bed up-flow system. The size of sulfur media was
between 2.38 mm and 4.76 mm. Limestone was mixed with sulfur at a ratio of one
sulfur to three limestone by volume. The porosity of biofilm reactor determined by
tracer studies was 36 percent. The results showed that an optimum denitrification rate of
384 g NNO3 −− /m3.d was found. The maximum removal efficiency of 95 percent was
24
found at a loading rate of 200 g NNO3 −− /m3.day. Nitrite concentration in the effluent
rose rapidly when the loading rate increased above 600 g NNO3 −− /m3.day. Biofouling
occurred after 6 months of operation with synthetic groundwater, and after 1.3 to 2
months of operation with real groundwater. In both cases the influent nitrate
concentrations was 30 mg/L as NNO3 −− . It was suggested by the investigators that
backwashing every one to two months was a necessity for a lime stone autotrophic
denitrification column system.
Hoek et al. (1992a) conducted a study on the optimization of the sulfur-
limestone filtration process for nitrate removal from groundwater. The experiments
consisted of four unit operations and processes in series: (1) vacuum deaeration, (2)
biological autotrophic nitrate removal, (3) aeration, and (4) passage through soil as post-
treatment. The nitrate loading was 960 g NNO3 −− /m3.d. The sulfur to limestone ratios
of 1:2, 1:1, and 2:1 essentially gave the same results with respect to nitrate removal
capacities. Based on the theoretical sulfur to limestone consumption rates, he suggested
a ratio of 1: 2 to simplify the maintenance of the reactor. The accumulated biomass was
responsible for the increased effluent nitrate concentration. Backwashing was a
necessity to remove the accumulated biomass. In an evaluation of the performance of a
35 m3/hr demonstration plant, the plant was operated at a volumetric nitrate loading rate
of 552 g −3NO /m3.d. Sulfide production was reported at higher column heights.
Maximum sulfide concentrations was 22 mg/L as −2S (Hoek et al., 1992b).
25
CHAPTER 3
MATERIAL AND METHODS
The experimental program on autotrophic denitrification was carried out in a
batch reactor, and in a continuous up-flow reactor. The batch reactor assembly consisted
of an anaerobic reaction vessel, gas collection cylinder and leveling reservoir. The
results of the batch reactor study were utilized to develop the basic relationships that
were utilized to design and operate the continuous flow reactor. The continuous up-flow
reactor had three components: influent storage tank, dissolved oxygen (DO) removal
trap that was removed later, and the up-flow reactor. The reactors’ description is
presented below.
3.1 Description of Batch and Continuous Flow Reactor
3.1.1 Batch Reactor
The batch reactor assembly consisted of a 6-liter distillation flask with a flat
bottom. It was installed over a magnetic-stirrer hot plate. The stopper on the top of the
flask had four holes to provide for the following fittings: (a) a thermometer to measure
the liquid temperature; (b) a 6-mm (one-quarter-inch) glass tube connected with a
rubber tube for feeding the reactor; (c) a 6-mm glass tube connected with a rubber tube
for withdrawal of the reactor fluid; and (d) a 6-mm glass tube connected with a rubber
tube for withdrawal of the generated gas.

26
The gas collection system consisted of a graduated gas collection tube 6 cm in
diameter and 68.6 cm long. It was connected with a leveling reservoir for maintaining
the desired liquid level in the gas collection tube, and for facilitating withdrawal and
feeding of the reactor.
The gas collection tube had a two-holed stopper on the top. A tube was
connected to allow free flow of gas from the reactor into the collection tube. The other
hole contained a tube to vent the gas as needed. The lower end of the gas collection tube
was conical and was connected to the leveling reservoir. The gas collection tube was
half filled with a saturated sodium chloride solution containing 5 percent sulfuric acid
and methyl orange for color. This solution prevented the CO2 gas from dissolving into
the liquid. A complete batch reactor assembly is shown in Figures 3.1 and 3.2.
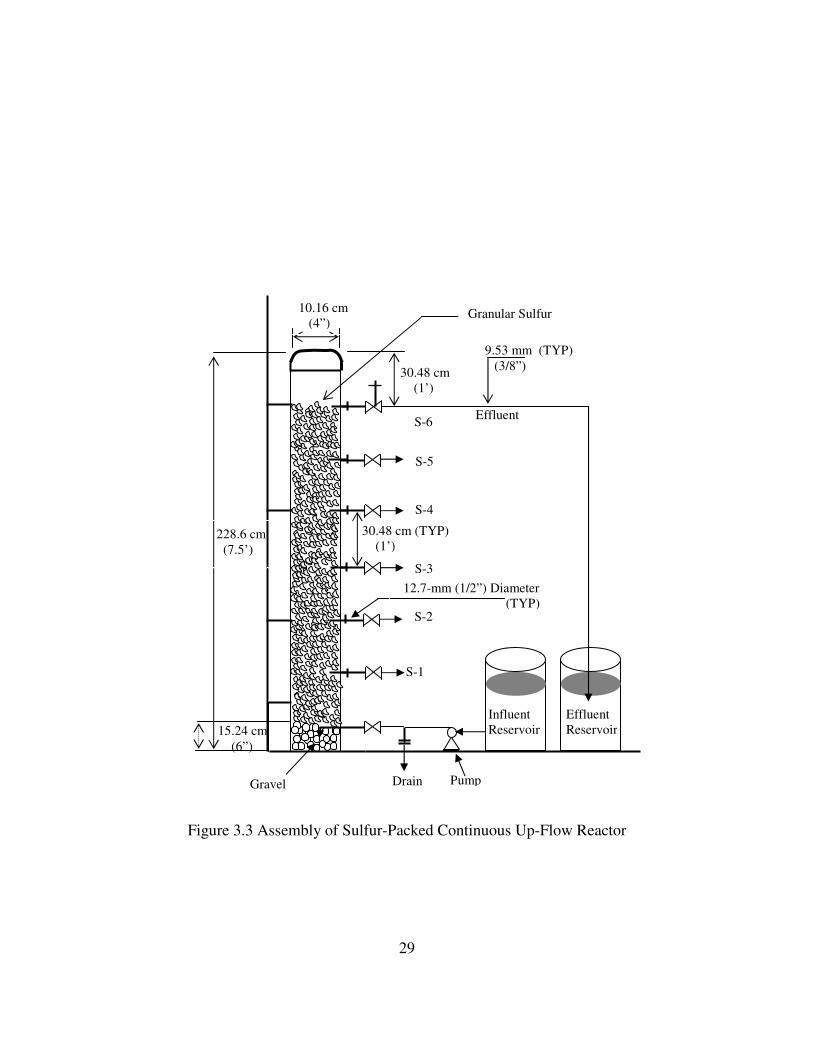
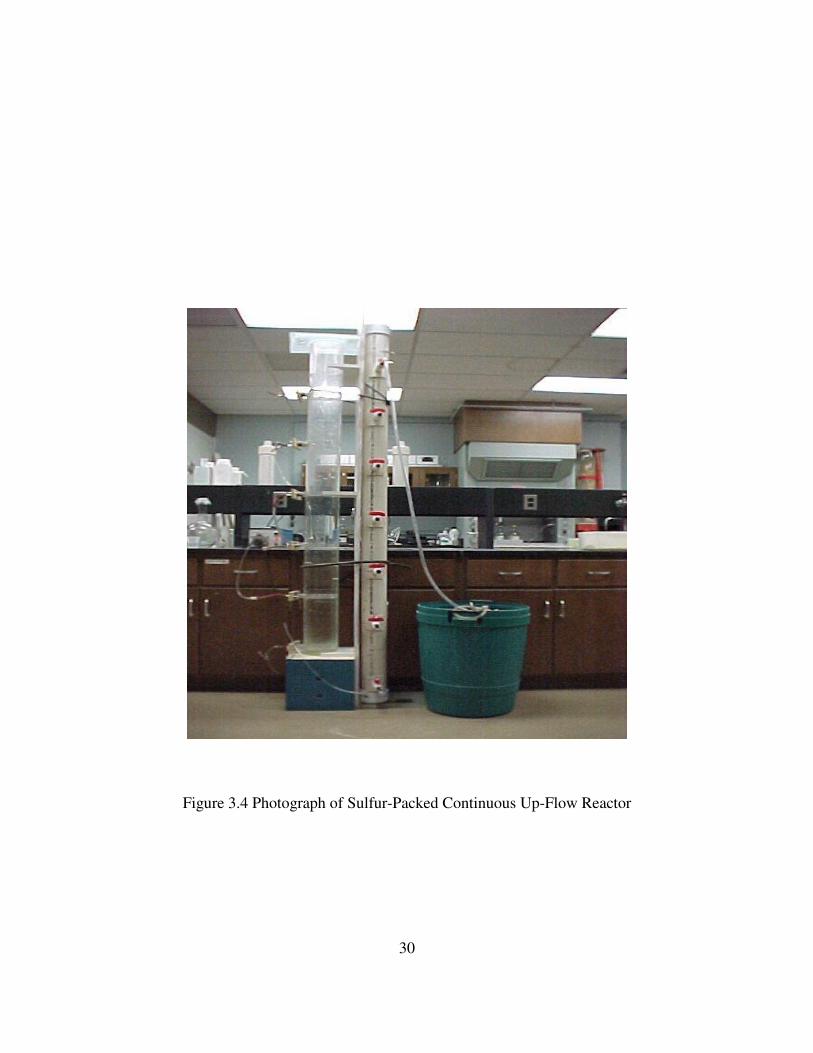
3.1.2 Continuous Up-Flow Reactor
The continuous up-flow reactor assembly consisted of one main reactor. This
reactor was made of a cylindrical PVC pipe, 10.16 cm (4 inch) in diameter and 228.6
cm (7.5 feet) in length. For a watertight seal, the top and bottom of the column were
sealed with PVC caps. At the base of the reactor, a 15.24-cm (6-inch) gravel layer was
placed. The gravel size was 0.635 cm (1/4 inch) in diameter. Six sampling ports were
provided at a spacing of 30.48 cm (one foot) center-to-center. The details of the reactor
are shown in Figures 3.3 and 3.4.
27
Figure 3.1 Details of Batch Reactor Assembly and Gas Collection System
ReactorEffluentTube
ReactorFeed
Thermometer
AirRelease
Saturated NaCl &5% Sulfuric acidwith methyl orangeindicator
Gascollectiontube
GranularSulfur
ReactorVessel
GasCollectionCylinder
LevelingReservoir
MagneticStirrer HotPlate

28
Figure 3.2 Photograph of Batch Reactor Assembly and Gas Collection System
29
Figure 3.3 Assembly of Sulfur-Packed Continuous Up-Flow Reactor
Drain
9.53 mm (TYP)(3/8”)
12.7-mm (1/2”) Diameter(TYP)
15.24 cm(6”)
10.16 cm(4”)
30.48 cm(1’)
228.6 cm(7.5’)
EffluentS-6
S-5
S-4
S-3
S-1
InfluentReservoir
S-2
30.48 cm (TYP)(1’)
Gravel
Granular Sulfur
EffluentReservoir
Pump
30
Figure 3.4 Photograph of Sulfur-Packed Continuous Up-Flow Reactor
31
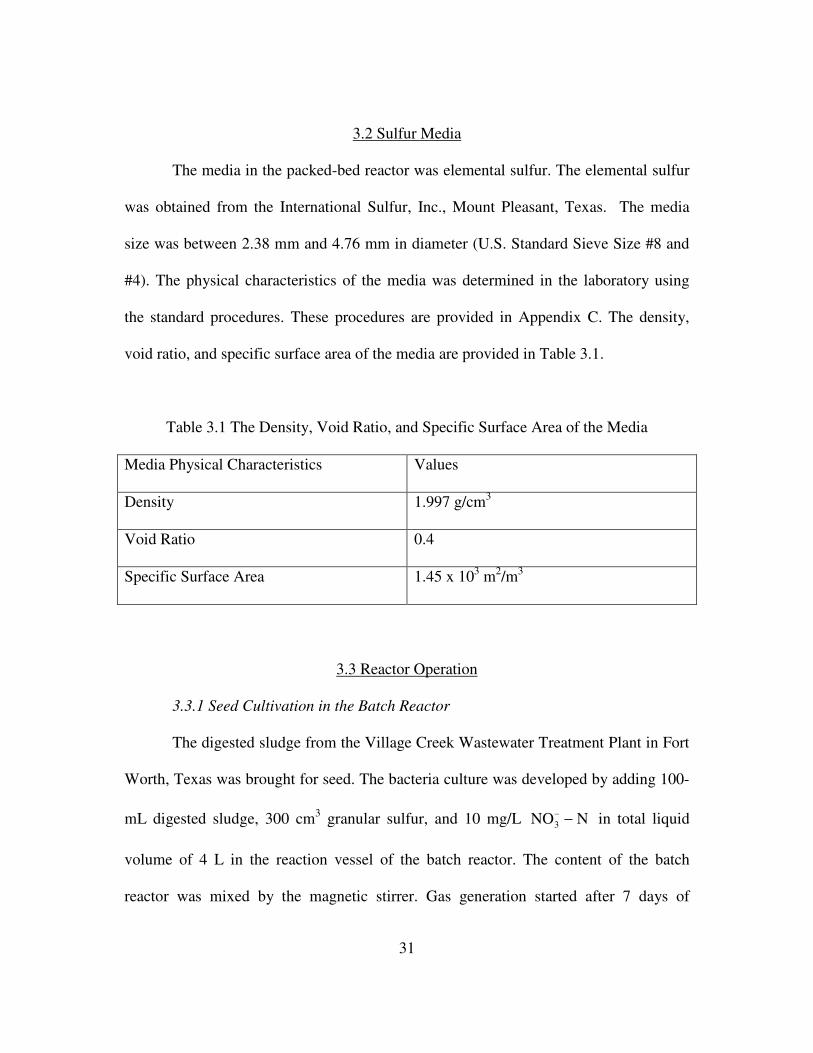
3.2 Sulfur Media
The media in the packed-bed reactor was elemental sulfur. The elemental sulfur
was obtained from the International Sulfur, Inc., Mount Pleasant, Texas. The media
size was between 2.38 mm and 4.76 mm in diameter (U.S. Standard Sieve Size #8 and
#4). The physical characteristics of the media was determined in the laboratory using
the standard procedures. These procedures are provided in Appendix C. The density,
void ratio, and specific surface area of the media are provided in Table 3.1.
Table 3.1 The Density, Void Ratio, and Specific Surface Area of the Media
Media Physical Characteristics Values
Density 1.997 g/cm3
Void Ratio 0.4
Specific Surface Area 1.45 x 10³ m2/m3
3.3 Reactor Operation
3.3.1 Seed Cultivation in the Batch Reactor
The digested sludge from the Village Creek Wastewater Treatment Plant in Fort
Worth, Texas was brought for seed. The bacteria culture was developed by adding 100-
mL digested sludge, 300 cm3 granular sulfur, and 10 mg/L NNO3 −− in total liquid
volume of 4 L in the reaction vessel of the batch reactor. The content of the batch
reactor was mixed by the magnetic stirrer. Gas generation started after 7 days of
32
continuous mixing. The normal operation of the batch reactor started by sample
withdrawal, reactor feeding, and gas volume measurement.
3.3.2 Operation of Batch Reactor
The batch reactor operation was on a fill and draw basis. Each day
approximately 600 mL of reactor content was removed for analyses and equal volume
of fresh feed was added. The sample analyses included measurement of pH,
concentrations of total alkalinity, NNO3 −− , and −2
4SO of the feed and the withdrawn
liquid. Additionally, temperature and gas production each day were recorded. The
volume of gas after measurement each day was released, and the level in the gas vessel
was reset.
Addition of sodium bicarbonate (NaHCO3) was necessary in the feed to
maintain proper alkalinity and pH in the system. The alkalinity addition was 5.0 mg/L
alkalinity as CaCO3 per mg/L of nitrate nitrogen added in the reactor. The samples
withdrawn were filtered through a 0.45 µm glass fiber paper prior to laboratory
analysis. The laboratory data was used to calculate total gas production, sulfate
production, and alkalinity destruction for each mg/L of NNO3 −− removed from the
feed.
3.3.3 Operation of Continuous Up-Flow Reactor
The continuous flow reactor was started using a standard procedure. After the
denitrification was established in the reactor, the operation mode began. The start up
and operational mode are presented below.
33
3.3.3.1 Start-up Phase
The start up phase of the continuous flow reactor included reactor seeding.
Approximately 600 mL of seed from the batch reactor was added into the packed-bed
reactor. The remaining volume of the column was filled with feed solution consisting of
20 mg/L of nitrate nitrogen. After one day of media soaking, the internal re-circulation
was started. The alkalinity and nitrate concentration in the reactor content was checked
daily. After several days of recirculation the nitrate concentration in the recirculating
liquid started to drop. At that time the continuous feeding was started. A peristaltic
pump (Cole-Parmer Instrument Co.) was used to continuously pump the feed from the
bottom of the reactor. Initially the nitrate removal was inconsistent. Tap water was
used to prepare the feed. It was speculated that the chlorine residuals in the tap water
may have caused the interference. Therefore, the tap water was aerated for three days
for dechlorination before preparing the feed. Also sodium bicarbonate and
micronutrients were added in the feed. The composition of the micronutrient solution is
provided in Table 3.2. After these improvements were made, the nitrate removal
stabilized and remained such until the end of this research.
3.3.3.2 Reactor Operation
The continuous flow reactor was operated at three hydraulic loadings. At each
hydraulic loading, four different NNO3 −− concentrations in the feed were tested. These
concentrations were 20, 40, 60, and 70 mg/L NNO3 −− and hydraulic loadings were
0.06, 0.08, and 0.10 m3/m2.hr. The reactor was operated for at least 7 days at each

34
nitrate nitrogen concentration in the feed. The reactor operation matrix is provided in
Table 3.3.
Table 3.2 Composition of Micro Nutrients for Continuous Up-Flow Reactor
Constituent Concentration in the feedNaHCO3 Based on alkalinity ratio of 5 mg/L as
CaCO3 per mg/L of NNO3 −− , NaHCO3
was added in the feedK2HPO4 0.2 mg/L as PNH4Cl 1 mg/L as NMgCl2.6H2O 1 mg/L as MgCl2.6H2OFeCl3.6H2O 1 mg/L as FeCl3.6H2OMnSO4.H2O 1 mg/L as MnSO4.H2OpH 8.3~8.6Note: This composition is a modification of the formula provided by Batchelor (1978)
Table 3.3 Hydraulic Loadings and NNO3 −− Concentrations in the Feed During
Operation Phase
Hydraulic Loading,m3/m2.hr
NNO3 −− Concentration in the Feed,
mg/L0.06 20 50 70 90 -
0.08 20 40 50 60 70
0.10 20 40 60 70 -
3.3.4 Sampling, and Sample Preparation
The influent sample was collected from the influent feed tank. The effluent
samples were collected from six effluent ports. The routine measurements and analyses
35
included temperature, pH, total alkalinity, NNO3 −− , NNO2 −
− , and −24SO . The
influent DO was checked on routine basis. The temperature, pH and total alkalinity
measurements were made immediately. The samples were filtered through 0.45 µm
membrane filter. Effluents were made to complete all analytical measurements on the
day of sampling. The samples were stored in the environmental chamber at 5oC to
complete the analysis at a later time. The maximum storage time was two days. All
stored samples were allowed to warm up to the room temperature before conducting the
analytical tests. The details of the analytical procedures are provided in Appendix D.
3.3.5 Applied Hydraulic and Substrate Loadings
The continuous up-flow reactor was operated under variable NNO3 −− as well
as hydraulic loadings. As a result, each sample withdrawn from different ports had
different detention time and NNO3 −− loading. The applied hydraulic loadings and
corresponding true hydraulic retention time (THRT) at each sampling port are
summarized in Table 3.4. The NNO3 −− loading at different sampling ports were
calculated from the hydraulic loading and the hydraulic retention time. The calculated
NNO3 −− loadings at each port resulting from different NNO3 −
− concentration in the
feed and hydraulic loadings are summarized in Tables 3.5-3.10.

36
Table 3.4 Summary of THRT at Each Sampling Port at Three Hydraulic Loadings
Sampling Port
1 2 3 4 5 6HydraulicSurface
Loading, Qv True Hydraulic Retention Time (THRT), hrs
0.06m3/m2.hr
2.0a 4.1 6.1 8.1 10.2 12.2
0.08m3/m2.hr
1.5 3.1 4.6 6.1 7.6 9.1
0.10m3/m2.hr
1.2 2.4 3.7 4.9 6.1 7.3a
vQ
eh
(Q/A)
eh
Q
ehA
Note
×=
×=
××=
××=
×=
=×
RateFlow
RatioVoidHeightColumnArea
RateFlow
RatioVoidVolumeTHRT
(THRT).timeretentionhydraulic“true”thetorefersit
mentioned,is(HRT)timeretentionhydraulicthewheneverresearch,thisThroughout
:
hr03.2.hr/mm0.06
0.4m0.304823
Table 3.5 Summary of NNO3 −− Loadings at Each Sampling Port at Three Hydraulic
Loadings (Influent NNO3 −− = 20 mg/L)
Sampling Port
1 2 3 4 5 6HydraulicSurface
Loading, Qv NNO3 −− Loading, g/m3.d
0.06m3/m2.hr
236a 118 79 59 47 39
0.08m3/m2.hr
315 157 105 79 63 52
0.10m3/m2.hr
394 197 131 98 79 66a
.dg/m236.2hr/d)(240.4)m/(0.3048)g/m20.hr/mm(0.06
LoadingN-NO
3323
-3
=×××××
=××
=××
×=
×=
eh
CQ
eh
CQ/A
ehA
CQ
V
CQ v
37
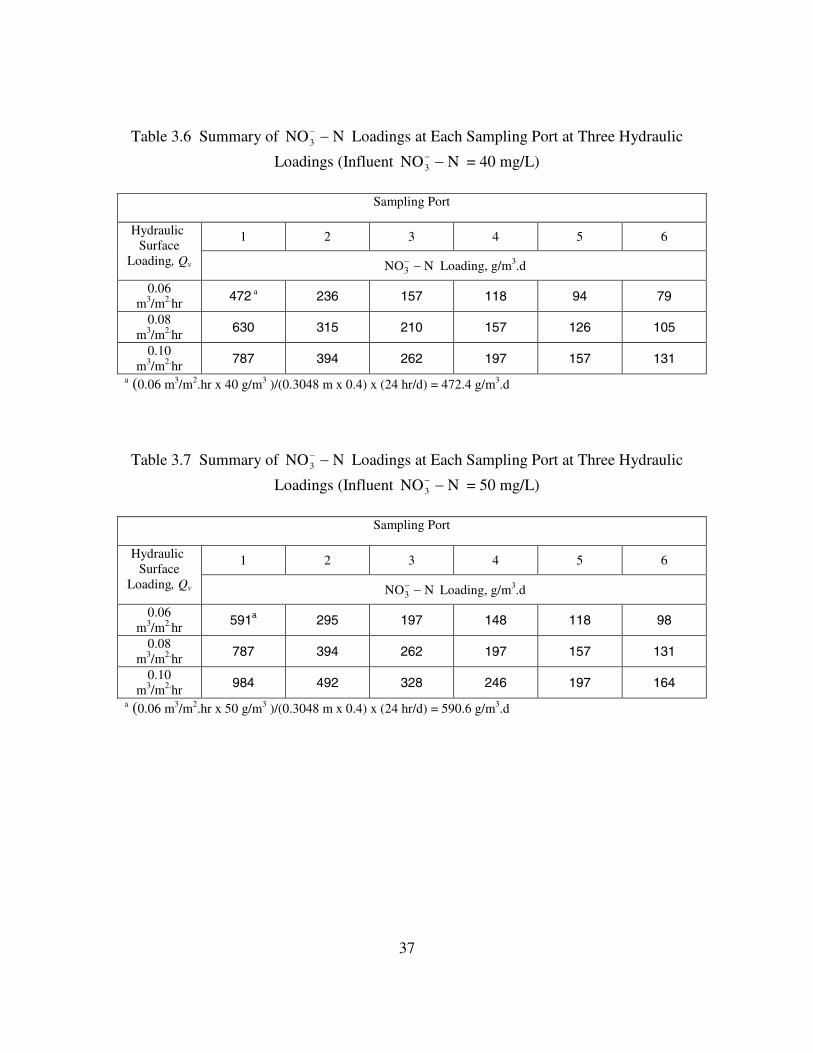
Table 3.6 Summary of NNO3 −− Loadings at Each Sampling Port at Three Hydraulic
Loadings (Influent NNO3 −− = 40 mg/L)
Sampling Port
1 2 3 4 5 6HydraulicSurface
Loading, Qv NNO3 −− Loading, g/m3.d
0.06m3/m2.hr 472 a 236 157 118 94 79
0.08m3/m2.hr 630 315 210 157 126 105
0.10m3/m2.hr 787 394 262 197 157 131
a (0.06 m3/m2.hr x 40 g/m3 )/(0.3048 m x 0.4) x (24 hr/d) = 472.4 g/m3.d
Table 3.7 Summary of NNO3 −− Loadings at Each Sampling Port at Three Hydraulic
Loadings (Influent NNO3 −− = 50 mg/L)
Sampling Port
1 2 3 4 5 6HydraulicSurface
Loading, Qv NNO3 −− Loading, g/m3.d
0.06m3/m2.hr 591a 295 197 148 118 98
0.08m3/m2.hr 787 394 262 197 157 131
0.10m3/m2.hr 984 492 328 246 197 164
a (0.06 m3/m2.hr x 50 g/m3 )/(0.3048 m x 0.4) x (24 hr/d) = 590.6 g/m3.d
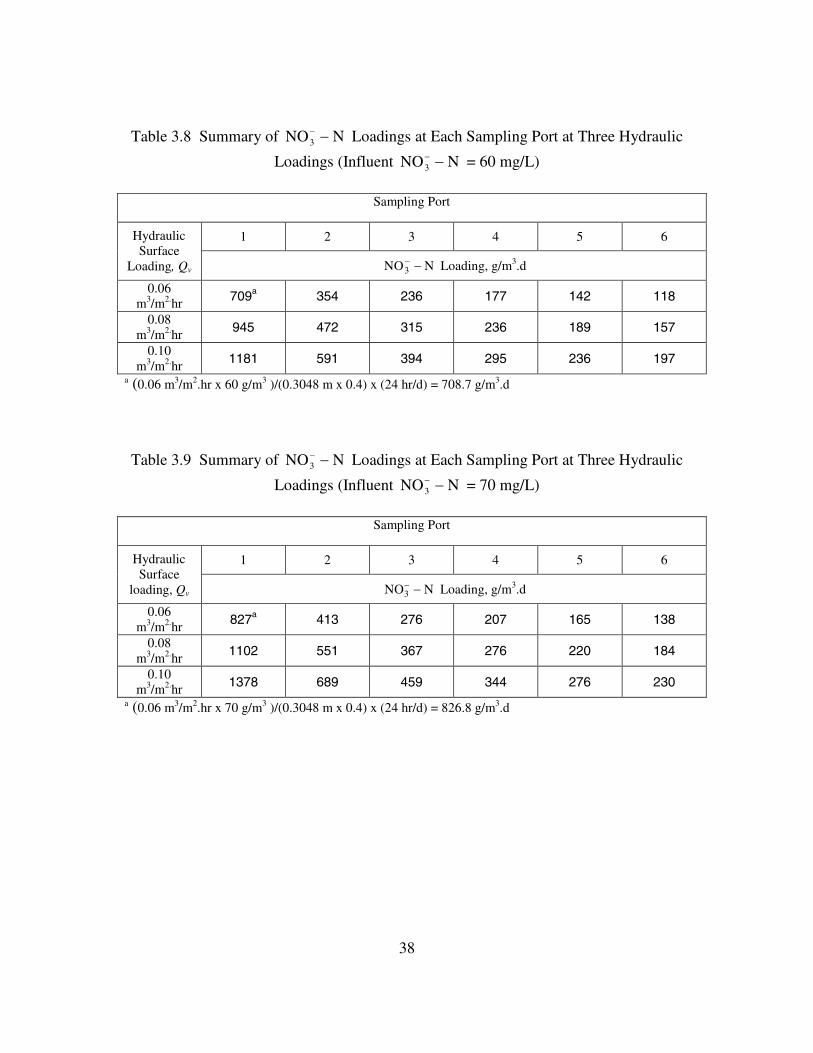
38
Table 3.8 Summary of NNO3 −− Loadings at Each Sampling Port at Three Hydraulic
Loadings (Influent NNO3 −− = 60 mg/L)
Sampling Port
1 2 3 4 5 6HydraulicSurface
Loading, Qv NNO3 −− Loading, g/m3.d
0.06m3/m2.hr 709a 354 236 177 142 118
0.08m3/m2.hr 945 472 315 236 189 157
0.10m3/m2.hr 1181 591 394 295 236 197
a (0.06 m3/m2.hr x 60 g/m3 )/(0.3048 m x 0.4) x (24 hr/d) = 708.7 g/m3.d
Table 3.9 Summary of NNO3 −− Loadings at Each Sampling Port at Three Hydraulic
Loadings (Influent NNO3 −− = 70 mg/L)
Sampling Port
1 2 3 4 5 6HydraulicSurface
loading, Qv NNO3 −− Loading, g/m3.d
0.06m3/m2.hr 827a 413 276 207 165 138
0.08m3/m2.hr 1102 551 367 276 220 184
0.10m3/m2.hr 1378 689 459 344 276 230
a (0.06 m3/m2.hr x 70 g/m3 )/(0.3048 m x 0.4) x (24 hr/d) = 826.8 g/m3.d

39
Table 3.10 Summary of NNO3 −− Loadings at Each Sampling Port at Three Hydraulic
Loadings (Influent NNO3 −− = 90 mg/L)
Sampling Port
1 2 3 4 5 6HydraulicSurface
Loading, Qv NNO3 −− Loading, g/m3.d
0.06m3/m2.hr 1063a 531 354 266 213 177
0.08m3/m2.hr 1417 709 472 354 283 236
0.10m3/m2.hr 1772 886 519 443 354 295
a (0.06 m3/m2.hr x 90 g/m3 )/(0.3048 m x 0.4) x (24 hr/d) = 1,063 g/m3.d

40
CHAPTER 4
RESULTS
The experimental program was conducted with two reactors: (1) an anaerobic
batch reactor, and (b) a continuous up-flow reactor. Results of each reactor study are
presented below.
4.1 Batch Reactor Study
The purpose of the batch reactor study was to (1) develop microbial seed to be
used in the continuous flow reactor, and (2) develop relationships between gas volume
generated, alkalinity destruction, and sulfate production with respect to NNO3 −−
destruction. The batch reactor study was conducted under anaerobic condition. The
reactor contained granular sulfur and the reactor contents were continuously mixed.
The effluent and influent samples were withdrawn and fed daily. The graduated gas
collection vessel was connected to the reactor, and volume of gas generated daily was
recorded. During the initial adjustment phase of reactor operation, the active microbial
population was established. This was indicated by consistent gas production. It took
approximately two weeks to reach the nearly consistent gas generation, and the data
recording began.
On a daily basis, approximately 600 mL of the reactor content was removed and
equal volume of nitrate containing substrate was added into the reactor. The
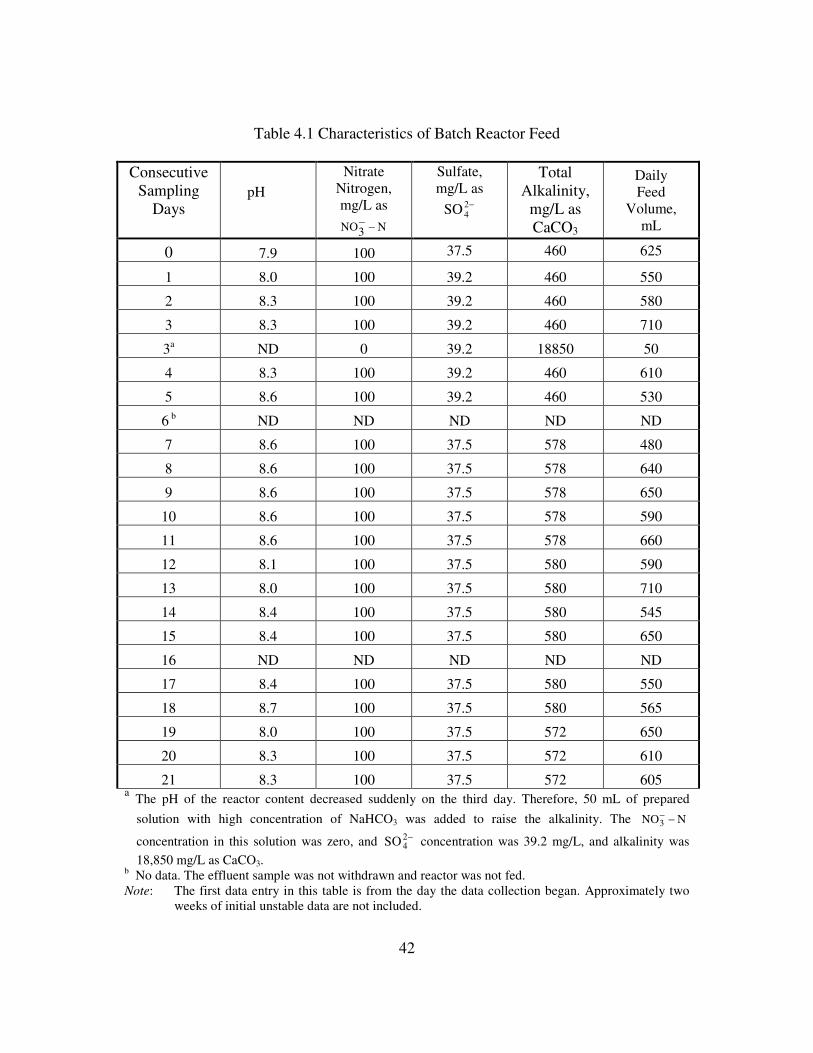
41
concentrations of alkalinity, nitrate-N, and sulfate in the influent and effluent were
measured and recorded. Additionally, pH, temperature, and gas volume produced were
measured for each day of operation. The volume of gas produced each day was
recorded before releasing the gas. Daily pH values, concentrations of NNO3 −− and
−24SO , total alkalinity in the feed, and daily volume of feed introduced into the batch
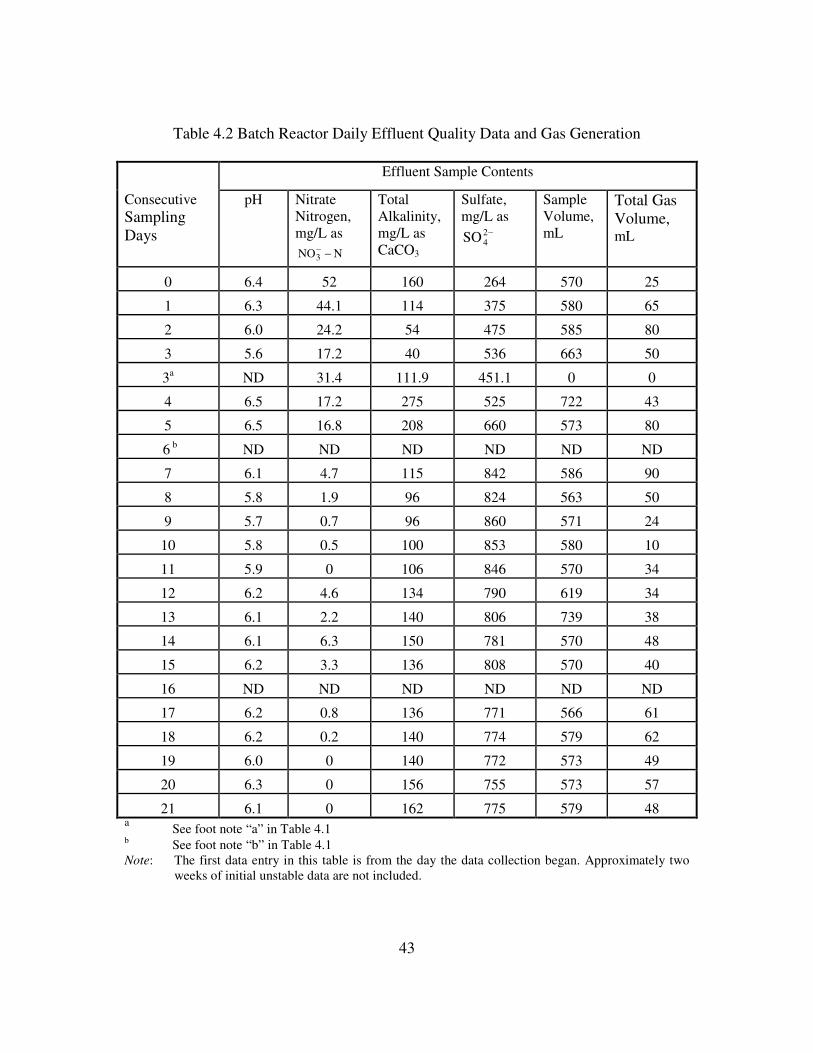
reactor are summarized in Tables 4.1. Additionally, the daily pH values, and
concentrations of NNO3 −− , −2
4SO , and total alkalinity in the effluent, volume of gas
produced, and volume of liquid withdrawn from the reactor are provided in Table 4.2.
The data presented in Tables 4.1 and 4.2 are from the day the data recording began. The
initial data of approximately two weeks of operation are not included in these tables.
4.2 Continuous Up-Flow Reactor Study
The continuous flow reactor consisted of a column packed with granular sulfur.
The purpose of the continuous flow reactor study was to: (1) operate the reactor at
different hydraulic and nitrate loadings; (2) develop relationships of alkalinity
destruction per unit nitrate nitrogen removal, and sulfate generation per unit nitrate
nitrogen removal; and (3) utilize measured data to model the effluent concentrations of
NNO3 −− and NNO2 −
− with respect to THRT.
42
Table 4.1 Characteristics of Batch Reactor Feed
ConsecutiveSampling
DayspH
NitrateNitrogen,mg/L as
N3NO −−
Sulfate,mg/L as
−24SO
TotalAlkalinity,
mg/L asCaCO3
DailyFeed
Volume,mL
0 7.9 100 37.5 460 625
1 8.0 100 39.2 460 550
2 8.3 100 39.2 460 580
3 8.3 100 39.2 460 710
3a ND 0 39.2 18850 50
4 8.3 100 39.2 460 610
5 8.6 100 39.2 460 530
6 b ND ND ND ND ND
7 8.6 100 37.5 578 480
8 8.6 100 37.5 578 640
9 8.6 100 37.5 578 650
10 8.6 100 37.5 578 590
11 8.6 100 37.5 578 660
12 8.1 100 37.5 580 590
13 8.0 100 37.5 580 710
14 8.4 100 37.5 580 545
15 8.4 100 37.5 580 650
16 ND ND ND ND ND
17 8.4 100 37.5 580 550
18 8.7 100 37.5 580 565
19 8.0 100 37.5 572 650
20 8.3 100 37.5 572 610
21 8.3 100 37.5 572 605a The pH of the reactor content decreased suddenly on the third day. Therefore, 50 mL of prepared
solution with high concentration of NaHCO3 was added to raise the alkalinity. The NNO3 −−
concentration in this solution was zero, and −24SO concentration was 39.2 mg/L, and alkalinity was
18,850 mg/L as CaCO3.b No data. The effluent sample was not withdrawn and reactor was not fed.Note: The first data entry in this table is from the day the data collection began. Approximately two
weeks of initial unstable data are not included.
43
Table 4.2 Batch Reactor Daily Effluent Quality Data and Gas Generation
Effluent Sample Contents
ConsecutiveSamplingDays
pH NitrateNitrogen,mg/L as
NNO3 −−
TotalAlkalinity,mg/L asCaCO3
Sulfate,mg/L as
−24SO
SampleVolume,mL
Total GasVolume,mL
0 6.4 52 160 264 570 25
1 6.3 44.1 114 375 580 65
2 6.0 24.2 54 475 585 80
3 5.6 17.2 40 536 663 50
3a ND 31.4 111.9 451.1 0 0
4 6.5 17.2 275 525 722 43
5 6.5 16.8 208 660 573 80
6 b ND ND ND ND ND ND
7 6.1 4.7 115 842 586 90
8 5.8 1.9 96 824 563 50
9 5.7 0.7 96 860 571 24
10 5.8 0.5 100 853 580 10
11 5.9 0 106 846 570 34
12 6.2 4.6 134 790 619 34
13 6.1 2.2 140 806 739 38
14 6.1 6.3 150 781 570 48
15 6.2 3.3 136 808 570 40
16 ND ND ND ND ND ND
17 6.2 0.8 136 771 566 61
18 6.2 0.2 140 774 579 62
19 6.0 0 140 772 573 49
20 6.3 0 156 755 573 57
21 6.1 0 162 775 579 48a See foot note “a” in Table 4.1b See foot note “b” in Table 4.1Note: The first data entry in this table is from the day the data collection began. Approximately two
weeks of initial unstable data are not included.
44
4.2.1 Start-up Phase
During the start-up phase, the alkalinity and NNO3 −− destructions were
monitored. The influent feed contained: NNO3 −− = 20 mg/L, and Alkalinity = 184
mg/L as CaCO3. The hydraulic loading was 0.06 m3/m2.hr. During the start-up phase,
the reactor did not achieve high nitrate nitrogen removal efficiency. The following
modifications were made during startup phase: (1) the residual chlorine was removed by
aerating the tap water for three days before it was used to prepare the raw feed solution,
(2) micronutrients as specified in Table 3.2 were added into the raw feed, and (3) a
small granular sulfur-packed PVC pipe was provided in the front of the reactor column
to deoxygenate the feed. This trap effectively removed DO in the feed but also
removed a portion of NNO3 −− in the feed. As a result, the DO trap was removed,
while aeration for chlorine removal and micronutrients addition were continued during
the entire operational phase.
4.2.2 Operation Phase
After all the modifications were made during the start-up phase, the operation
phase was carried out for approximately three months at three different hydraulic
loadings, and four to five influent NNO3 −− concentrations. The measured parameters
for the continuous flow reactor were total alkalinity, nitrate nitrogen, nitrite nitrogen,
sulfate, pH, and temperature. These parameters were measured in the feed as well as in
the samples collected from each port of the column.

45
4.2.2.1 Results at Hydraulic Loading of 0.06 m3/m2.hr
The hydraulic loading of 0.06 m3/m2.hr was maintained at a feed rate of 8.1 mL
per minute (0.000486 m3/hr) over the column area of 0.0081 m2. The column at this
hydraulic loading was operated from January 30th to March 6th, and the target NNO3 −−
concentrations in the feed were changed in the ascending order of 20, 50, 70, and 90
mg/L. The actual NNO3 −− concentrations in the feed however, were slightly different
from the target concentrations. Only 6 to 11 days of operation data at each influent
NNO3 −− concentration were averaged, while approximately 1 to 2 days of transition
data immediately after changing the NNO3 −− concentration in the feed were ignored.
The data are reported in Table 4.3 and illustrated in Figure 4.1.

46
Table 4.3 Average Concentrations of Measured Parameters in the Influent and Effluentfrom Each Port at Hydraulic Loading of 0.06 m3/m2.hr and Influent Target NNO3 −
−
Concentrations of 20, 50, 70, and 90 mg/L
Sampling PortsNNO3 −
−
Concent-ration inPreparedFeed
MeasuredParameter
MeasuredConcentrationin the Feed
1 2 3 4 5 6
NNO3 −− Loading at Each Port, g/m3.d
236a 118 79 59 47 39
Effluent Concentrations
NNO3 −− ,
mg/L
19.0 0 0 0 0 0 0
NNO2 −− ,
mg/L
0 0 0 0 0 0 0
Alkalinity,mg/L asCaCO3
182 106 106 106 106 106 98
Sulfate,mg/L as
−24SO
47 198 195 196 195 200 203
pH 7.0 6.1 6.0 6.0 6.0 6.1 6.0
20 mg/L
TemperatureoC
22 NDb ND ND ND ND ND
NNO3 −− Loading at Each Port, g/m3.d
591 295 197 148 118 98
Effluent Concentrations
NNO3 −− ,
mg/L
50.5 11.4 1.8 0.8 0.7 0.5 0.5
NNO2 −− ,
mg/L
1.8 4.9 2.8 1.1 0.7 0.7 0.5
Alkalinity,mg/L asCaCO3
335 197 165 161 159 158 153
Sulfate,mg/L as
−24SO
38 318 400 421 425 429 436
pH 8.4 6.6 6.4 6.4 6.4 6.4 6.5
50 mg/L
TemperatureoC
19.1 20.9 21.0 21.1 21.2 21.4 20.7
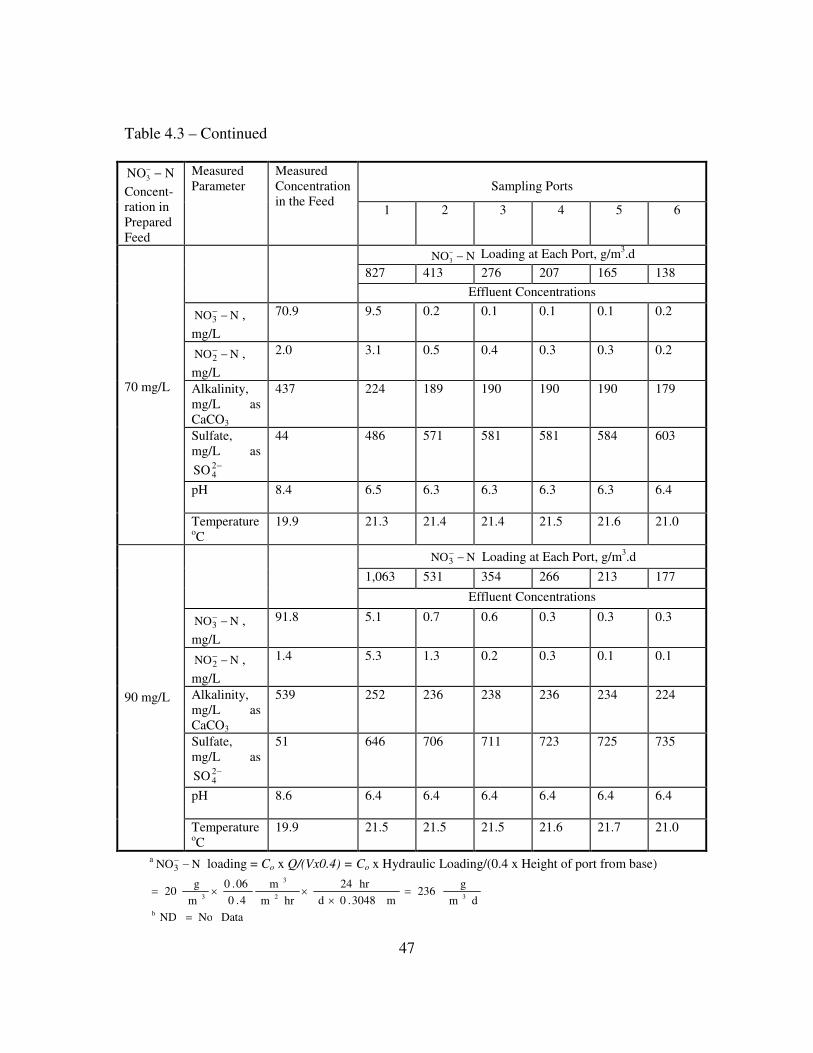
47
Table 4.3 – Continued
Sampling PortsNNO3 −
−
Concent-ration inPreparedFeed
MeasuredParameter
MeasuredConcentrationin the Feed
1 2 3 4 5 6
NNO3 −− Loading at Each Port, g/m3.d
827 413 276 207 165 138
Effluent Concentrations
NNO3 −− ,
mg/L
70.9 9.5 0.2 0.1 0.1 0.1 0.2
NNO2 −− ,
mg/L
2.0 3.1 0.5 0.4 0.3 0.3 0.2
Alkalinity,mg/L asCaCO3
437 224 189 190 190 190 179
Sulfate,mg/L as
−24SO
44 486 571 581 581 584 603
pH 8.4 6.5 6.3 6.3 6.3 6.3 6.4
70 mg/L
TemperatureoC
19.9 21.3 21.4 21.4 21.5 21.6 21.0
NNO3 −− Loading at Each Port, g/m3.d
1,063 531 354 266 213 177
Effluent Concentrations
NNO3 −− ,
mg/L
91.8 5.1 0.7 0.6 0.3 0.3 0.3
NNO2 −− ,
mg/L
1.4 5.3 1.3 0.2 0.3 0.1 0.1
Alkalinity,mg/L asCaCO3
539 252 236 238 236 234 224
Sulfate,mg/L as
−24SO
51 646 706 711 723 725 735
pH 8.6 6.4 6.4 6.4 6.4 6.4 6.4
90 mg/L
TemperatureoC
19.9 21.5 21.5 21.5 21.6 21.7 21.0
a NNO3 −− loading = Co x Q/(Vx0.4) = Co x Hydraulic Loading/(0.4 x Height of port from base)
DataNoND
dm
g236
m3048.0d
hr24
hrm
m
4.0
06.0
m
g20
b
32
3
3
=
=×
××=
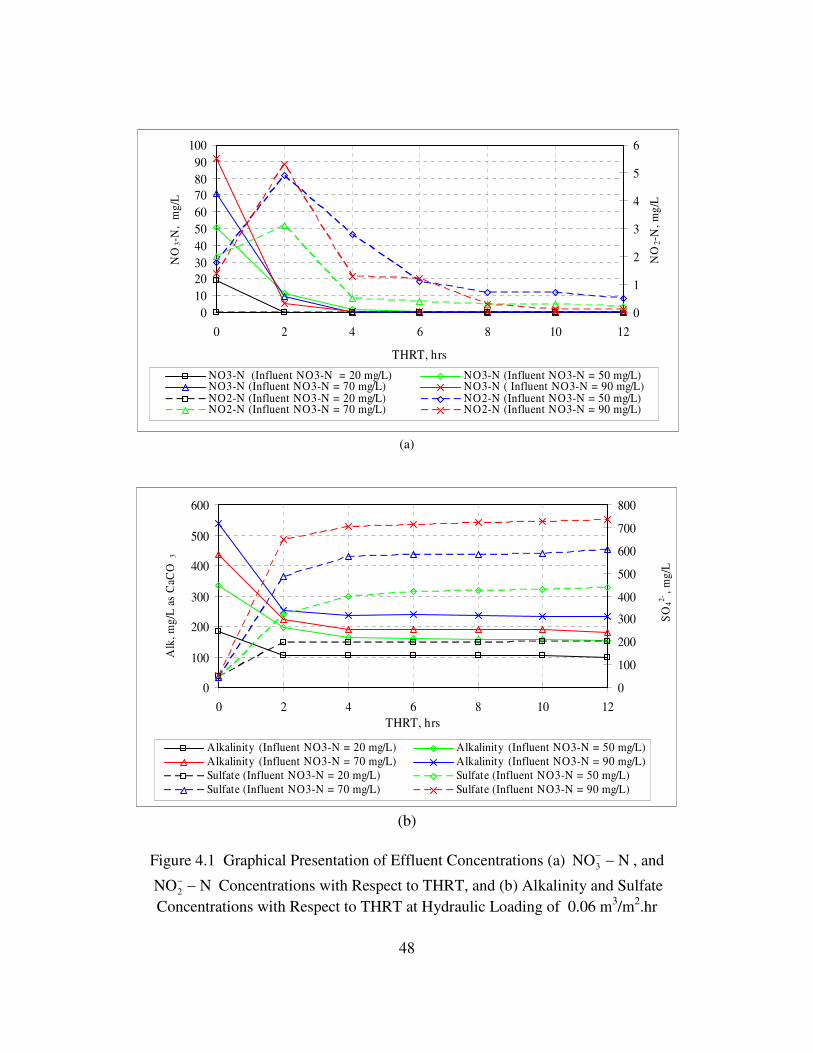
48
0102030405060708090
100
0 2 4 6 8 10 12
THRT, hrs
NO
3-N
,m
g/L
0
1
2
3
4
5
6
NO
2-N
,mg/
L
NO3-N (Influent NO3-N = 20 mg/L) NO3-N (Influent NO3-N = 50 mg/L)NO3-N (Influent NO3-N = 70 mg/L) NO3-N ( Influent NO3-N = 90 mg/L)NO2-N (Influent NO3-N = 20 mg/L) NO2-N (Influent NO3-N = 50 mg/L)NO2-N (Influent NO3-N = 70 mg/L) NO2-N (Influent NO3-N = 90 mg/L)
(a)
0
100
200
300
400
500
600
0 2 4 6 8 10 12THRT, hrs
Alk
,mg/
Las
CaC
O3
0
100
200
300
400
500
600
700
800
SO
42-,m
g/L
Alkalinity (Influent NO3-N = 20 mg/L) Alkalinity (Influent NO3-N = 50 mg/L)Alkalinity (Influent NO3-N = 70 mg/L) Alkalinity (Influent NO3-N = 90 mg/L)Sulfate (Influent NO3-N = 20 mg/L) Sulfate (Influent NO3-N = 50 mg/L)Sulfate (Influent NO3-N = 70 mg/L) Sulfate (Influent NO3-N = 90 mg/L)
(b)
Figure 4.1 Graphical Presentation of Effluent Concentrations (a) NNO3 −− , and
NNO2 −− Concentrations with Respect to THRT, and (b) Alkalinity and Sulfate
Concentrations with Respect to THRT at Hydraulic Loading of 0.06 m3/m2.hr
49
4.2.2.2 Results at Hydraulic Loading of 0.08 m3/m2.hr
The hydraulic loading of 0.08 m3/m2.hr was maintained at a feed rate of 10.8 mL
per minute (0.000649 m3/hr) over the column area of 0.0081 m2.
The column at this hydraulic loading was operated from March 19th to April
18th, and the target NNO3 −− concentrations in the feed were changed in the descending
order of 70, 60, 50, 40, and 20 mg/L. The actual NNO3 −− concentrations in the feed
however, were slightly different from the target concentrations. Only 4 to 6 days of the
operation data at each influent NNO3 −− concentration were averaged, while
approximately 1 to 2 days of transition data immediately after changing the NNO3 −−
concentration in the feed were ignored. The data are reported in Table 4.4 and
illustrated in Figure 4.2.

50
Table 4.4 Average Concentrations of Measured Parameters in the Influent and Effluentfrom Each Port at Hydraulic Loading of 0.08 m3/m2.hr and Influent Target NNO3 −
−
Concentrations of 20, 40, 50, 60, and 70 mg/L
Sampling PortsNNO3 −−
Concent-ration inPreparedFeed
MeasuredParameter
MeasuredConcentrationin the Feed
1 2 3 4 5 6
NNO3 −− Loading at Each Port, g/m3.d
315a 157 105 79 63 52
Effluent Concentrations
NNO3 −− ,
mg/L
19.9 0.1 0.1 0.0 0.0 0.0 0.0
NNO2 −− ,
mg/L
2.0 0.3 0.1 0.1 0.2 0.2 0.3
Alkalinity,mg/L asCaCO3
193 117 117 117 117 117 106
Sulfate,mg/L as
−24SO
63 229 236 231 237 240 244
PH 8.3 6.5 6.5 6.5 6.5 6.5 6.5
20 mg/L
TemperatureoC
21.0 21.8 21.8 21.9 22.0 22.0 22.0
NNO3 −− Loading at Each Port, g/m3.d
630 315 210 157 126 105
Effluent Concentrations
NNO3 −− ,
mg/L
37.9 1.1 0.7 0.6 0.6 0.6 0.6
NNO2 −− ,
mg/L
2.4 6.9 0.3 0.5 0.2 0.2 0.2
Alkalinity,mg/Las CaCO3
293 165 156 155 152 149 134
Sulfate,mg/L as
−24SO
59.3 345 365 378 380 375 390
pH 8.3 6.5 6.5 6.5 6.5 6.4 6.4
40 mg/L
TemperatureoC
21.0 21.9 21.9 21.9 22.0 22.0 21.7

51
Table 4.4 – Continued
Sampling PortsNNO3 −−
Concent-ration inPreparedFeed
MeasuredParameter
MeasuredConcentrationin the Feed
1 2 3 4 5 6
NNO3 −− Loading at Each Port, g/m3.d
787 394 262 197 157 131
Effluent Concentrations
NNO3 −− ,
mg/L
48.8 0.4 0.2 0.2 0.2 0.2 0.2
NNO2 −− ,
mg/L
1.5 4.9 0.6 0.3 0.4 0.3 0.3
Alkalinity,mg/Las CaCO3
342 181 174 175 175 174 166
Sulfate,mg/L as
−24SO
58 403 419 411 421 428 430
pH 8.4 6.5 6.4 6.4 6.4 6.4 6.5
50 mg/L
TemperatureoC
20.4 21.3 21.3 21.3 21.4 21.5 21.1
NNO3 −− Loading at Each Port, g/m3.d
945 472 315 236 189 157
Effluent Concentrations
NNO3 −− ,
mg/L
57.6 5.0 1.5 0.6 0.5 0.4 0.4
NNO2 −− ,
mg/L
1.3 12.2 7.2 3.3 1.4 1.2 0.5
Alkalinity,mg/Las CaCO3
394 214 200 193 192 191 186
Sulfate,mg/L as
−24SO
56 419 470 497 501 509 511
pH 8.5 6.5 6.5 6.4 6.4 6.4 6.5
60 mg/L
TemperatureoC
19.4 21.2 21.2 21.2 21.4 21.5 21.0
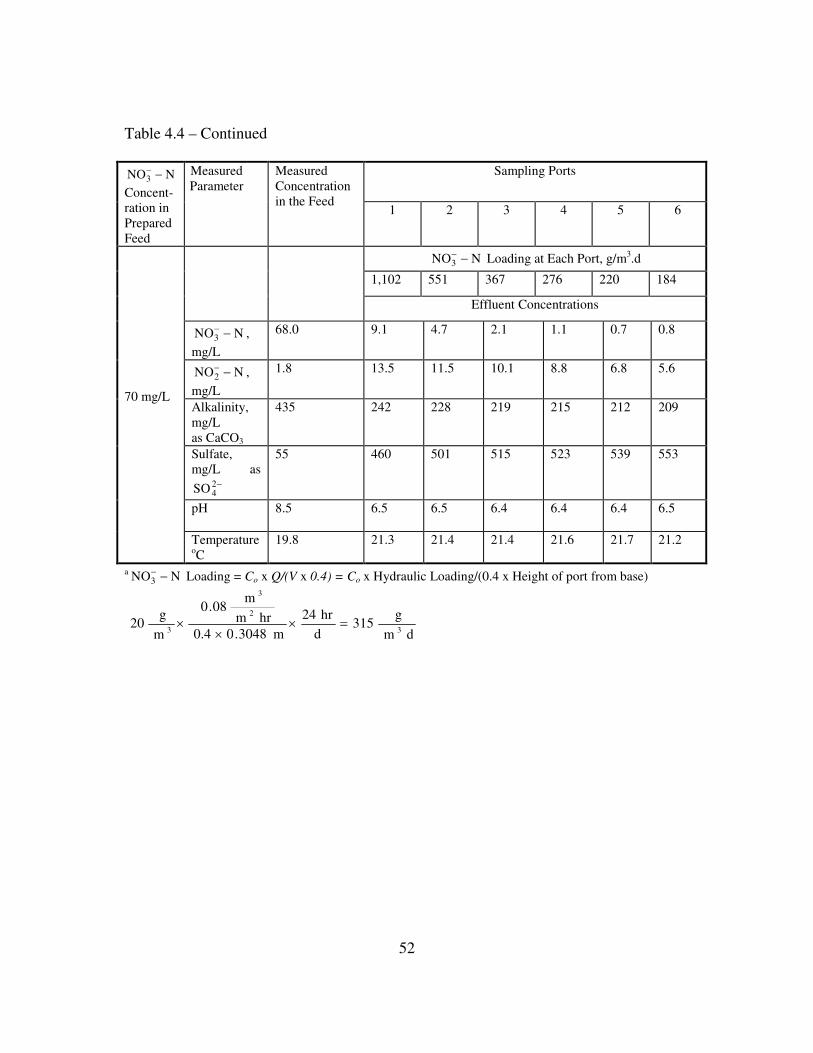
52
Table 4.4 – Continued
Sampling PortsNNO3 −−
Concent-ration inPreparedFeed
MeasuredParameter
MeasuredConcentrationin the Feed
1 2 3 4 5 6
NNO3 −− Loading at Each Port, g/m3.d
1,102 551 367 276 220 184
Effluent Concentrations
NNO3 −− ,
mg/L
68.0 9.1 4.7 2.1 1.1 0.7 0.8
NNO2 −− ,
mg/L
1.8 13.5 11.5 10.1 8.8 6.8 5.6
Alkalinity,mg/Las CaCO3
435 242 228 219 215 212 209
Sulfate,mg/L as
−24SO
55 460 501 515 523 539 553
pH 8.5 6.5 6.5 6.4 6.4 6.4 6.5
70 mg/L
TemperatureoC
19.8 21.3 21.4 21.4 21.6 21.7 21.2
a NNO3 −− Loading = Co x Q/(V x 0.4) = Co x Hydraulic Loading/(0.4 x Height of port from base)
dm
g315
d
hr24
m3048.00.4hrm
m08.0
m
g20
3
2
3
3=×
××
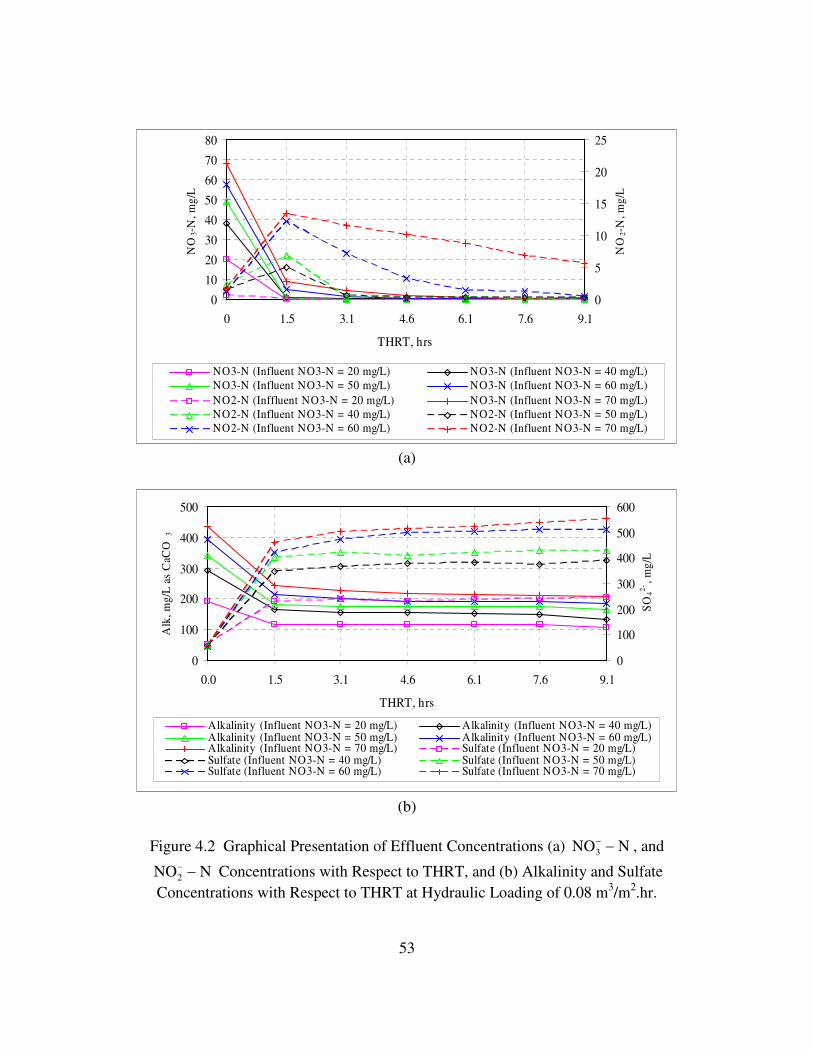
53
0
10
20
30
40
50
60
70
80
0 1.5 3.1 4.6 6.1 7.6 9.1
THRT, hrs
NO
3-N
,mg/
L
0
5
10
15
20
25
NO
2-N
,mg/
L
NO3-N (Influent NO3-N = 20 mg/L) NO3-N (Influent NO3-N = 40 mg/L)NO3-N (Influent NO3-N = 50 mg/L) NO3-N (Influent NO3-N = 60 mg/L)NO2-N (Inffluent NO3-N = 20 mg/L) NO3-N (Influent NO3-N = 70 mg/L)NO2-N (Influent NO3-N = 40 mg/L) NO2-N (Influent NO3-N = 50 mg/L)NO2-N (Influent NO3-N = 60 mg/L) NO2-N (Influent NO3-N = 70 mg/L)
(a)
0
100
200
300
400
500
0.0 1.5 3.1 4.6 6.1 7.6 9.1
THRT, hrs
Alk
,mg/
Las
CaC
O3
0
100
200
300
400
500
600
SO
42-,m
g/L
Alkalinity (Influent NO3-N = 20 mg/L) Alkalinity (Influent NO3-N = 40 mg/L)Alkalinity (Influent NO3-N = 50 mg/L) Alkalinity (Influent NO3-N = 60 mg/L)Alkalinity (Influent NO3-N = 70 mg/L) Sulfate (Influent NO3-N = 20 mg/L)Sulfate (Influent NO3-N = 40 mg/L) Sulfate (Influent NO3-N = 50 mg/L)Sulfate (Influent NO3-N = 60 mg/L) Sulfate (Influent NO3-N = 70 mg/L)
(b)
Figure 4.2 Graphical Presentation of Effluent Concentrations (a) NNO3 −− , and
NNO2 −− Concentrations with Respect to THRT, and (b) Alkalinity and Sulfate
Concentrations with Respect to THRT at Hydraulic Loading of 0.08 m3/m2.hr.
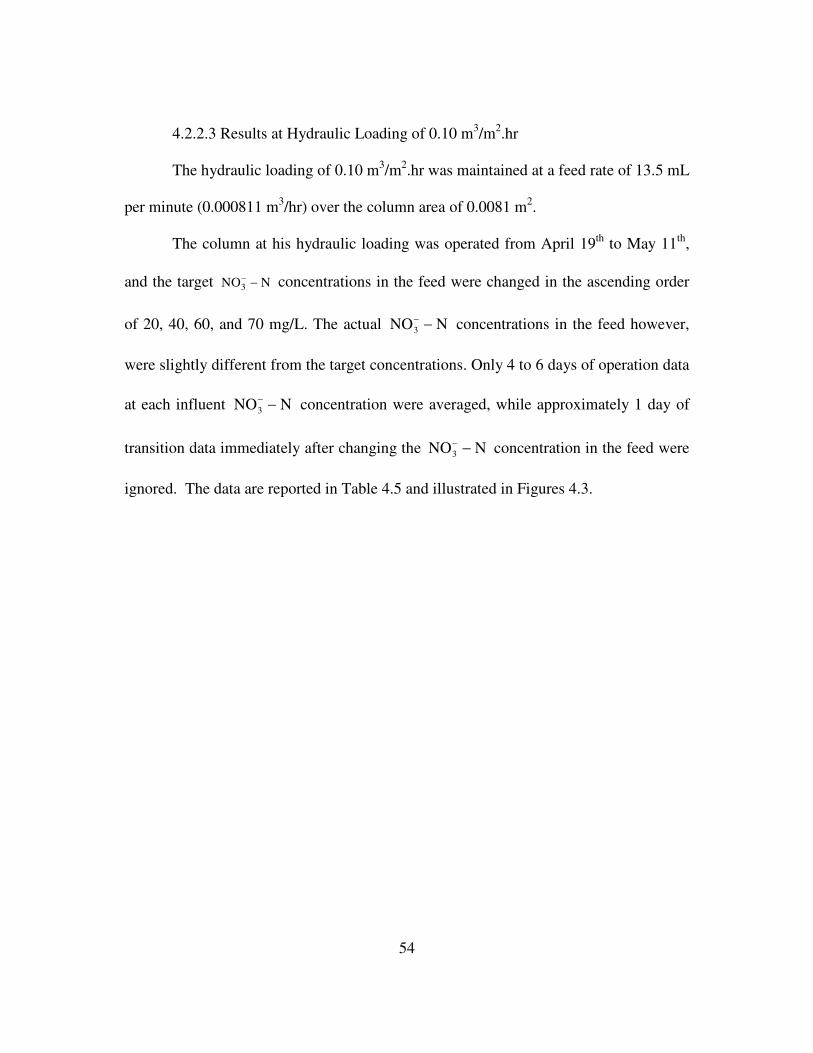
54
4.2.2.3 Results at Hydraulic Loading of 0.10 m3/m2.hr
The hydraulic loading of 0.10 m3/m2.hr was maintained at a feed rate of 13.5 mL
per minute (0.000811 m3/hr) over the column area of 0.0081 m2.
The column at his hydraulic loading was operated from April 19th to May 11th,
and the target NNO3 −− concentrations in the feed were changed in the ascending order
of 20, 40, 60, and 70 mg/L. The actual NNO3 −− concentrations in the feed however,
were slightly different from the target concentrations. Only 4 to 6 days of operation data
at each influent NNO3 −− concentration were averaged, while approximately 1 day of
transition data immediately after changing the NNO3 −− concentration in the feed were
ignored. The data are reported in Table 4.5 and illustrated in Figures 4.3.
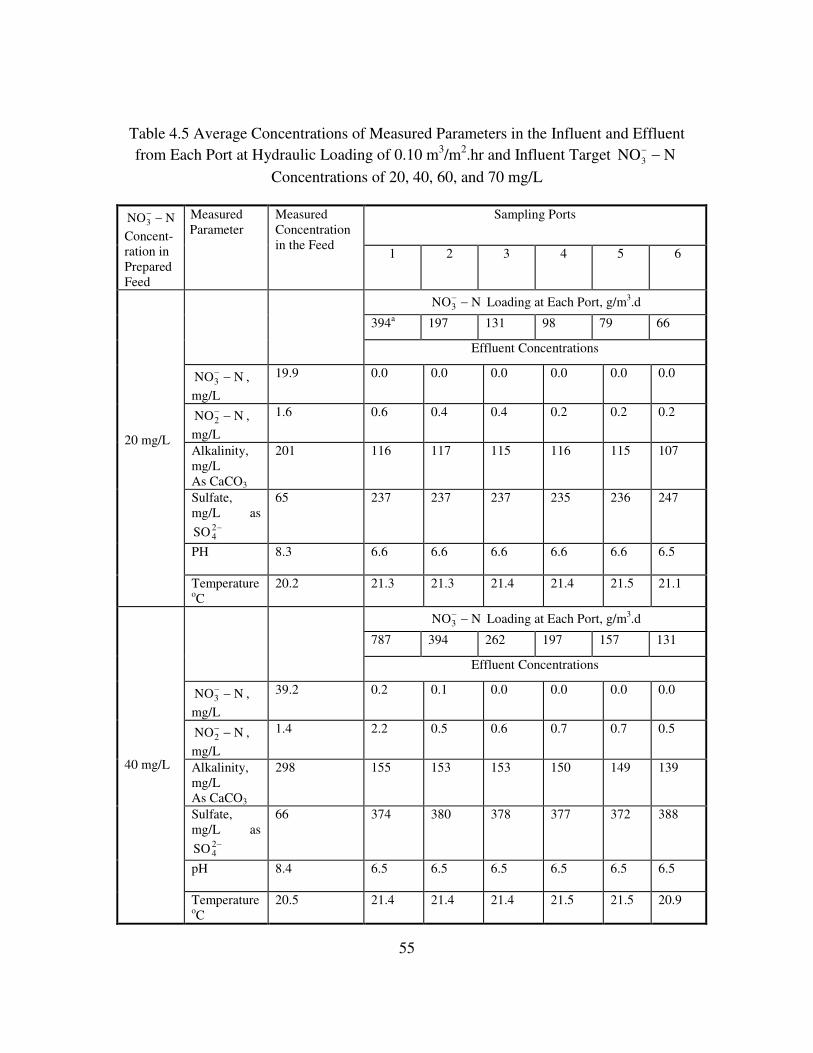
55
Table 4.5 Average Concentrations of Measured Parameters in the Influent and Effluentfrom Each Port at Hydraulic Loading of 0.10 m3/m2.hr and Influent Target NNO3 −
−
Concentrations of 20, 40, 60, and 70 mg/L
Sampling PortsNNO3 −−
Concent-ration inPreparedFeed
MeasuredParameter
MeasuredConcentrationin the Feed
1 2 3 4 5 6
NNO3 −− Loading at Each Port, g/m3.d
394a 197 131 98 79 66
Effluent Concentrations
NNO3 −− ,
mg/L
19.9 0.0 0.0 0.0 0.0 0.0 0.0
NNO2 −− ,
mg/L
1.6 0.6 0.4 0.4 0.2 0.2 0.2
Alkalinity,mg/LAs CaCO3
201 116 117 115 116 115 107
Sulfate,mg/L as
−24SO
65 237 237 237 235 236 247
PH 8.3 6.6 6.6 6.6 6.6 6.6 6.5
20 mg/L
TemperatureoC
20.2 21.3 21.3 21.4 21.4 21.5 21.1
NNO3 −− Loading at Each Port, g/m3.d
787 394 262 197 157 131
Effluent Concentrations
NNO3 −− ,
mg/L
39.2 0.2 0.1 0.0 0.0 0.0 0.0
NNO2 −− ,
mg/L
1.4 2.2 0.5 0.6 0.7 0.7 0.5
Alkalinity,mg/LAs CaCO3
298 155 153 153 150 149 139
Sulfate,mg/L as
−24SO
66 374 380 378 377 372 388
pH 8.4 6.5 6.5 6.5 6.5 6.5 6.5
40 mg/L
TemperatureoC
20.5 21.4 21.4 21.4 21.5 21.5 20.9

56
Table 4.5 – ContinuedEffluent ConcentrationsNNO3 −
−
Concent-ration inPreparedFeed
MeasuredParameter
MeasuredConcentrationin the Feed
1 2 3 4 5 6
NNO3 −− Loading at Each Port, g/m3.d
1,181 591 394 295 236 197
Effluent Concentrations
NNO3 −− ,
mg/L
57.6 7.9 2.0 0.9 0.4 0.2 0.2
NNO2 −− ,
mg/L
1.1 13.9 11.6 7.6 3.9 1.5 1.4
Alkalinity,mg/Las CaCO3
398 232 214 205 201 200 197
Sulfate,mg/L as
−24SO
67 391 439 465 487 499 507
pH 8.5 6.6 6.5 6.5 6.5 6.5 6.5
60 mg/L
TemperatureoC
20.5 21.2 21.2 21.3 21.4 21.5 20.9
NNO3 −− Loading at Each Port, g/m3.d
1,378 689 459 344 276 230
Effluent Concentrations
NNO3 −− ,
mg/L
66.5 10.5 6.5 4.6 3.2 1.8 1.9
NNO2 −− ,
mg/L
1.3 13.4 12.5 11.6 10.1 9.9 9.7
Alkalinity,mg/Las CaCO3
426 239 223 217 214 210 211
Sulfate,mg/L as
−24SO
68 458 505 508 536 534 550
pH 8.5 6.6 6.5 6.5 6.5 6.5 6.5
70 mg/L
TemperatureoC
20.4 21.2 21.1 21.1 21.1 21.2 20.5
a NNO3 −− Loading = Co x Q/(V x 0.4) = Co x Hydraulic Loading/(0.4 x Height of port from base)
.dm
g394
d
hr24
m3048.00.4hr.m
m10.0
m
g20
3
2
3
3=×
××
57
0
10
20
30
40
50
60
70
0.0 1.2 2.4 3.7 4.9 6.1 7.3
THRT, hrs
NO
3-N
,mg/
L
0
2
4
6
8
10
12
14
16
NO
2-N
,mg/
L
NO3-N (Influent NO3-N = 20 mg/L) NO3-N (Influent NO3-N = 40 mg/L)NO3-N (Influent NO3-N = 60 mg/L) NO3-N (Influent NO3-N = 70 mg/L)NO2-N (Influent NO3-N = 20 mg/L) NO2-N (Influent NO3-N = 40 mg/L)NO2-N (Influent NO3-N = 60 mg/L) NO2-N (Inffluent NO3-N = 70 mg/L)
(a)
050
100150
200250
300350
400450
0 1.2 2.4 3.7 4.9 6.1 7.3
THRT, hrs
Alk
,mg/
Las
CaC
O3
0
100
200
300
400
500
600
SO
42-,m
g/L
Alkalinity (Influent NO3-N = 20 mg/L) Alkalinity (Influent NO3-N = 40 mg/L)Alkalinity (Influent NO3-N = 60 mg/L) Alkalinity (Influent NO3-N = 70 mg/L)Sulfate (Influent NO3-N = 20 mg/L) Sulfate (Influent NO3-N = 40 mg/L)Sulfate (Influent NO3-N = 60 mg/L) Sulfate (Influent NO3-N = 70 mg/L)
(b)
Figure 4.3 Graphical Presentation of Effluent Concentrations (a) NNO3 −− , and
NNO2 −− Concentrations with Respect to THRT, and (b) Alkalinity and Sulfate
Concentrations with Respect to THRT at Hydraulic Loading of 0.10 m3/m2.hr.
58
CHAPTER 5
DISCUSSION
5.1 Batch Reactor Study
The batch reactor was operated to develop microbiological culture for use in the
continuous up-flow reactor. Also the batch reactor data was used to develop three
important relationships: ratios of alkalinity destruction, sulfate production, and gas
generation with respect to nitrate nitrogen destruction.
5.1.1 Reactor Base Line Data
Initially, the reactor operation was unstable. The gas generation, nitrate and
alkalinity destruction and sulfate production were inconsistent. It took approximately
two weeks to reach a stable condition, and data recording began. At that time, the
initial volume of the reactor contents, and concentrations of NNO3 −− , −2
4SO , and
alkalinity were respectively: 4,080 mL, 52.0 mg/L as NNO3 −− , 264.4 mg/L as −2
4SO ,
and 160.0 mg/L as CaCO3. The initial values of pH, temperature, and gas generation
were 6.4, 22 oC, and 25 mL/day.
5.1.2 Alkalinity Destruction, −24SO Production, and Gas Generation
A material mass balance analysis was conducted to calculate the concentration
of various parameters from day-to-day operation. The concentrations of different
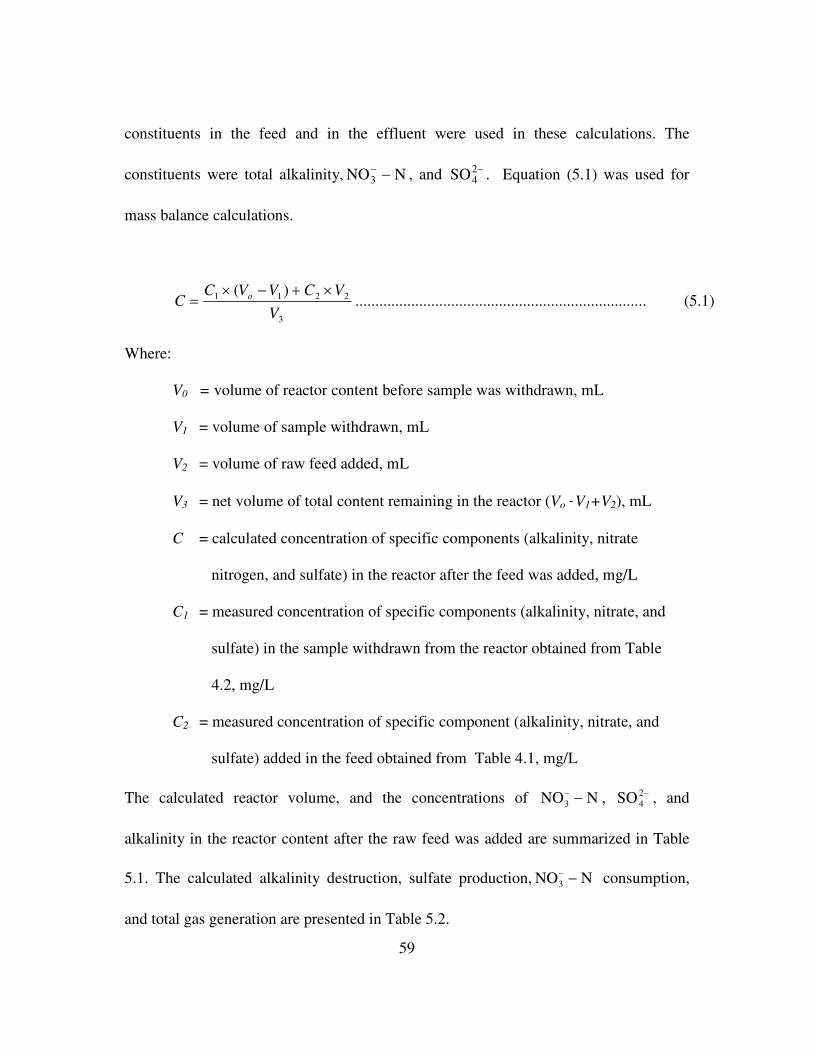
59
constituents in the feed and in the effluent were used in these calculations. The
constituents were total alkalinity, NNO3 −− , and −2
4SO . Equation (5.1) was used for
mass balance calculations.
3
2211 )(
V
VCVVCC o ×+−×= ......................................................................... (5.1)
Where:
V0 = volume of reactor content before sample was withdrawn, mL
V1 = volume of sample withdrawn, mL
V2 = volume of raw feed added, mL
V3 = net volume of total content remaining in the reactor (Vo-V1+V2), mL
C = calculated concentration of specific components (alkalinity, nitrate
nitrogen, and sulfate) in the reactor after the feed was added, mg/L
C1 = measured concentration of specific components (alkalinity, nitrate, and
sulfate) in the sample withdrawn from the reactor obtained from Table
4.2, mg/L
C2 = measured concentration of specific component (alkalinity, nitrate, and
sulfate) added in the feed obtained from Table 4.1, mg/L
The calculated reactor volume, and the concentrations of NNO3 −− , −2
4SO , and
alkalinity in the reactor content after the raw feed was added are summarized in Table
5.1. The calculated alkalinity destruction, sulfate production, NNO3 −− consumption,
and total gas generation are presented in Table 5.2.
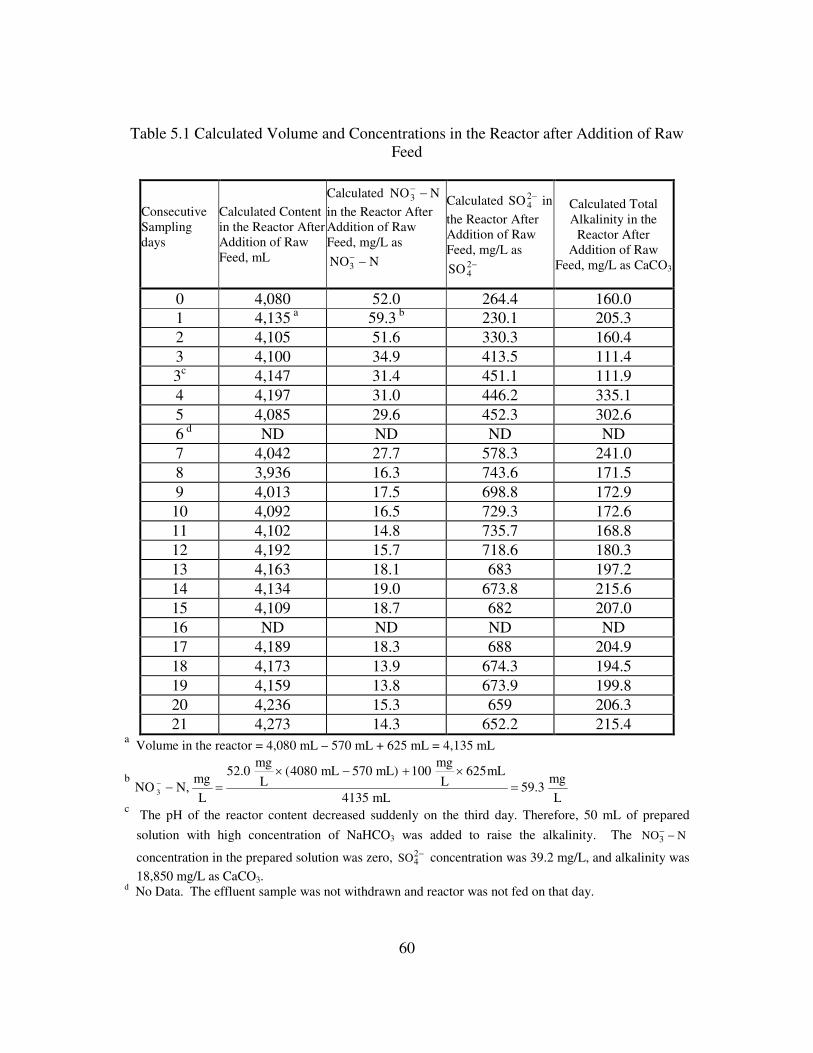
60
Table 5.1 Calculated Volume and Concentrations in the Reactor after Addition of RawFeed
ConsecutiveSamplingdays
Calculated Contentin the Reactor AfterAddition of RawFeed, mL
Calculated NNO3 −−
in the Reactor AfterAddition of RawFeed, mg/L as
NNO3 −−
Calculated −24SO in
the Reactor AfterAddition of RawFeed, mg/L as
−24SO
Calculated TotalAlkalinity in the
Reactor AfterAddition of Raw
Feed, mg/L as CaCO3
0 4,080 52.0 264.4 160.01 4,135 a 59.3 b 230.1 205.32 4,105 51.6 330.3 160.43 4,100 34.9 413.5 111.43c 4,147 31.4 451.1 111.94 4,197 31.0 446.2 335.15 4,085 29.6 452.3 302.66 d ND ND ND ND7 4,042 27.7 578.3 241.08 3,936 16.3 743.6 171.59 4,013 17.5 698.8 172.910 4,092 16.5 729.3 172.611 4,102 14.8 735.7 168.812 4,192 15.7 718.6 180.313 4,163 18.1 683 197.214 4,134 19.0 673.8 215.615 4,109 18.7 682 207.016 ND ND ND ND17 4,189 18.3 688 204.918 4,173 13.9 674.3 194.519 4,159 13.8 673.9 199.820 4,236 15.3 659 206.321 4,273 14.3 652.2 215.4
a Volume in the reactor = 4,080 mL – 570 mL + 625 mL = 4,135 mL
b
L
mg59.3
mL4135
mL625L
mg100mL)570mL4080(
L
mg52.0
L
mgN,NO 3 =
×+−×=−−
c The pH of the reactor content decreased suddenly on the third day. Therefore, 50 mL of prepared
solution with high concentration of NaHCO3 was added to raise the alkalinity. The NNO3 −−
concentration in the prepared solution was zero, −24SO concentration was 39.2 mg/L, and alkalinity was
18,850 mg/L as CaCO3.d No Data. The effluent sample was not withdrawn and reactor was not fed on that day.
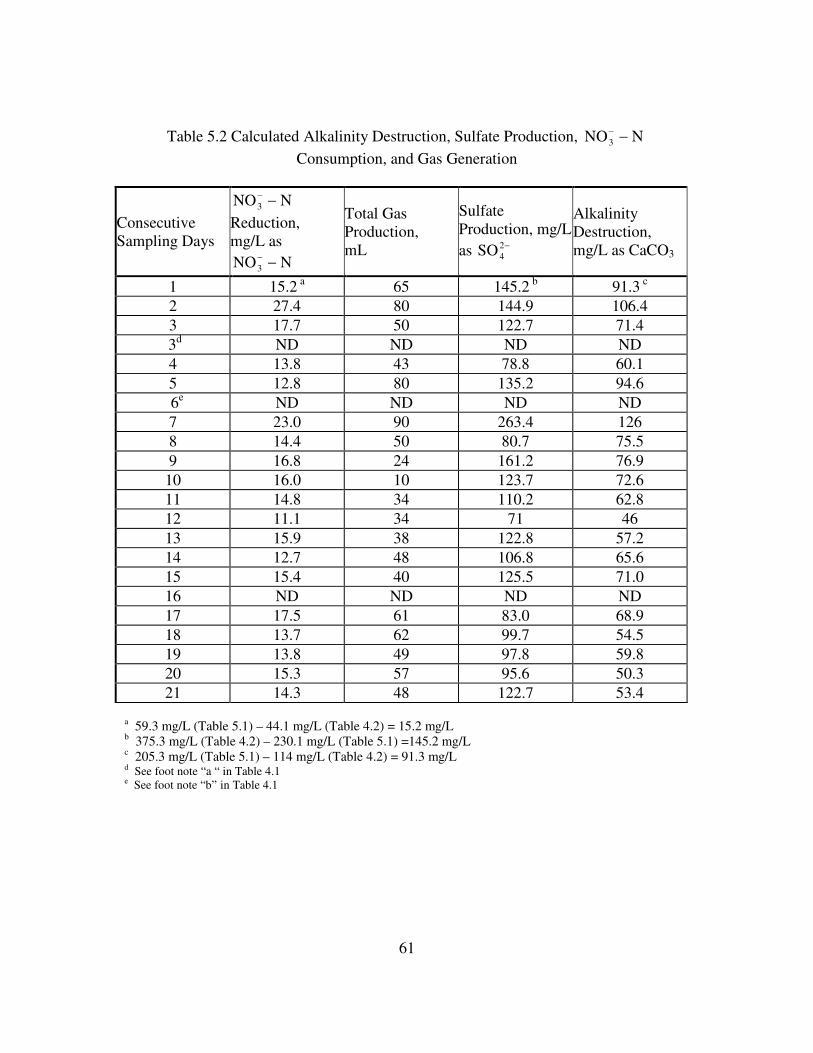
61
Table 5.2 Calculated Alkalinity Destruction, Sulfate Production, NNO3 −−
Consumption, and Gas Generation
ConsecutiveSampling Days
NNO3 −−
Reduction,mg/L as
NNO3 −−
Total GasProduction,mL
SulfateProduction, mg/Las −2
4SO
AlkalinityDestruction,mg/L as CaCO3
1 15.2 a 65 145.2 b 91.3 c
2 27.4 80 144.9 106.43 17.7 50 122.7 71.43d ND ND ND ND4 13.8 43 78.8 60.15 12.8 80 135.2 94.66e ND ND ND ND7 23.0 90 263.4 1268 14.4 50 80.7 75.59 16.8 24 161.2 76.910 16.0 10 123.7 72.611 14.8 34 110.2 62.812 11.1 34 71 4613 15.9 38 122.8 57.214 12.7 48 106.8 65.615 15.4 40 125.5 71.016 ND ND ND ND17 17.5 61 83.0 68.918 13.7 62 99.7 54.519 13.8 49 97.8 59.820 15.3 57 95.6 50.321 14.3 48 122.7 53.4
a 59.3 mg/L (Table 5.1) – 44.1 mg/L (Table 4.2) = 15.2 mg/Lb 375.3 mg/L (Table 4.2) – 230.1 mg/L (Table 5.1) =145.2 mg/Lc 205.3 mg/L (Table 5.1) – 114 mg/L (Table 4.2) = 91.3 mg/Ld See foot note “a “ in Table 4.1e See foot note “b” in Table 4.1
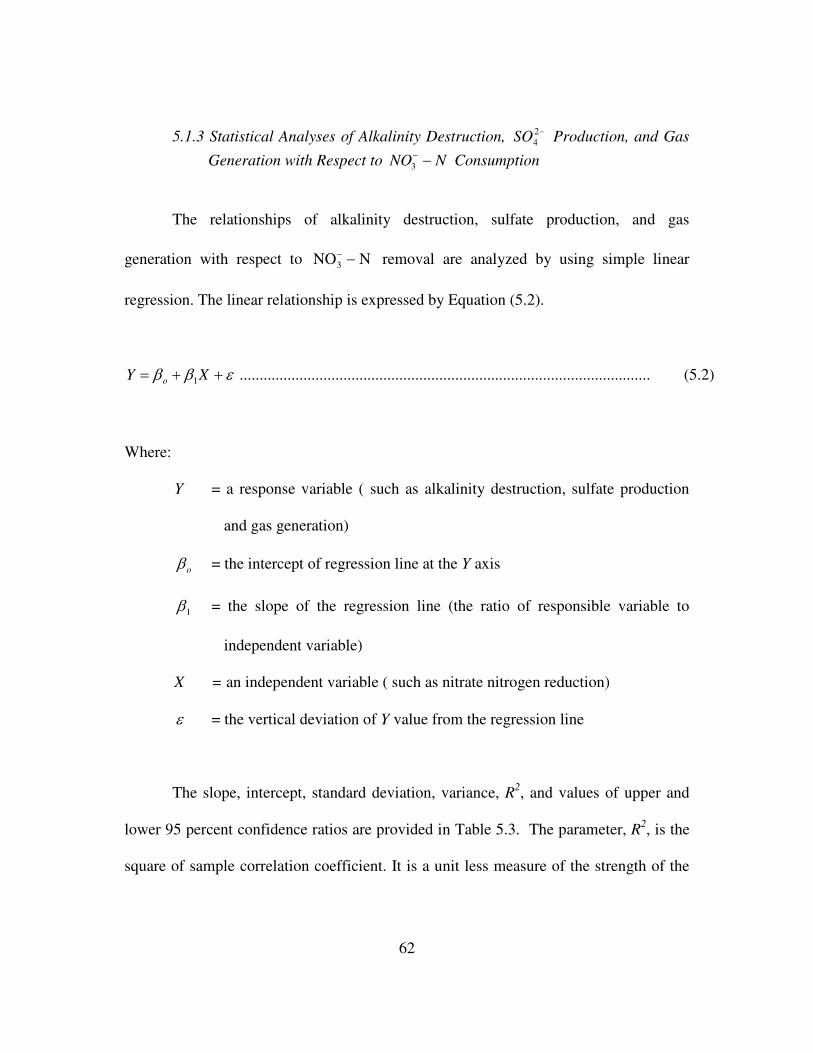
62
5.1.3 Statistical Analyses of Alkalinity Destruction, −24SO Production, and Gas
Generation with Respect to NNO −−3 Consumption
The relationships of alkalinity destruction, sulfate production, and gas
generation with respect to NNO3 −− removal are analyzed by using simple linear
regression. The linear relationship is expressed by Equation (5.2).
εββ ++= XY o 1 ....................................................................................................... (5.2)
Where:
Y = a response variable ( such as alkalinity destruction, sulfate production
and gas generation)
oβ = the intercept of regression line at the Y axis
1β = the slope of the regression line (the ratio of responsible variable to
independent variable)
X = an independent variable ( such as nitrate nitrogen reduction)
ε = the vertical deviation of Y value from the regression line
The slope, intercept, standard deviation, variance, R2, and values of upper and
lower 95 percent confidence ratios are provided in Table 5.3. The parameter, R2, is the
square of sample correlation coefficient. It is a unit less measure of the strength of the
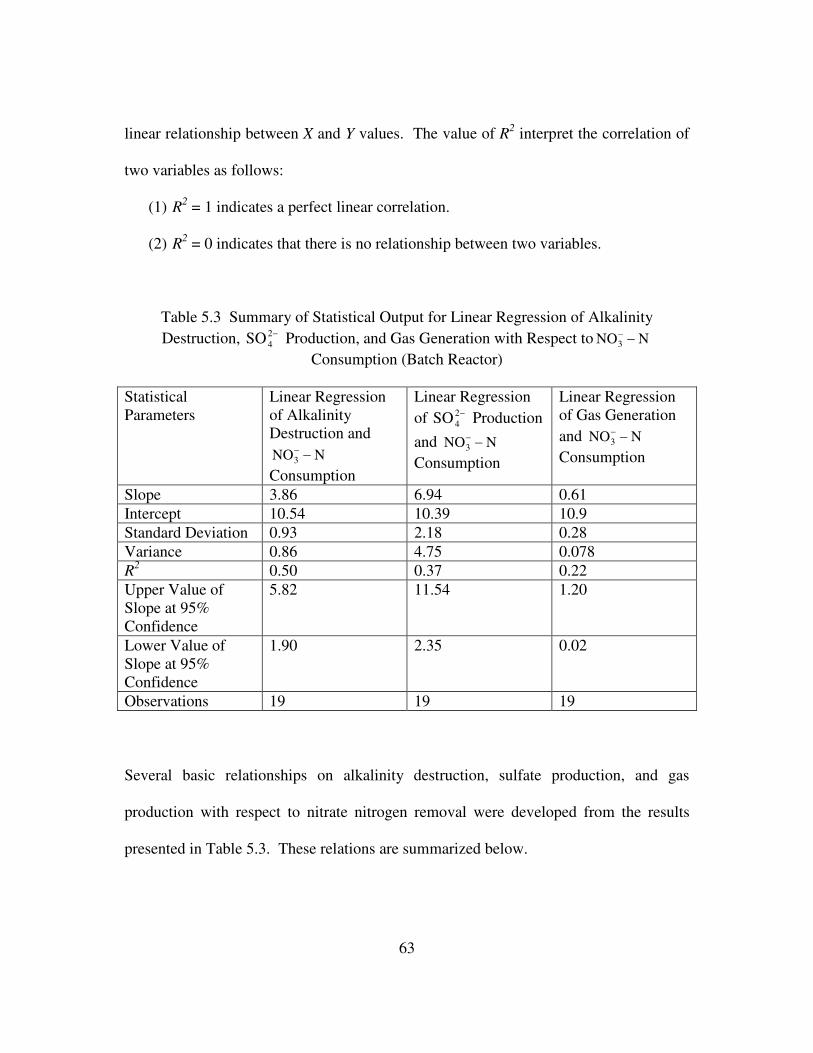
63
linear relationship between X and Y values. The value of R2 interpret the correlation of
two variables as follows:
(1) R2 = 1 indicates a perfect linear correlation.
(2) R2 = 0 indicates that there is no relationship between two variables.
Table 5.3 Summary of Statistical Output for Linear Regression of AlkalinityDestruction, −2
4SO Production, and Gas Generation with Respect to NNO3 −−
Consumption (Batch Reactor)
StatisticalParameters
Linear Regressionof AlkalinityDestruction and
NNO3 −−
Consumption
Linear Regressionof −2
4SO Production
and NNO3 −−
Consumption
Linear Regressionof Gas Generationand NNO3 −
−
Consumption
Slope 3.86 6.94 0.61Intercept 10.54 10.39 10.9Standard Deviation 0.93 2.18 0.28Variance 0.86 4.75 0.078R2 0.50 0.37 0.22Upper Value ofSlope at 95%Confidence
5.82 11.54 1.20
Lower Value ofSlope at 95%Confidence
1.90 2.35 0.02
Observations 19 19 19
Several basic relationships on alkalinity destruction, sulfate production, and gas
production with respect to nitrate nitrogen removal were developed from the results
presented in Table 5.3. These relations are summarized below.
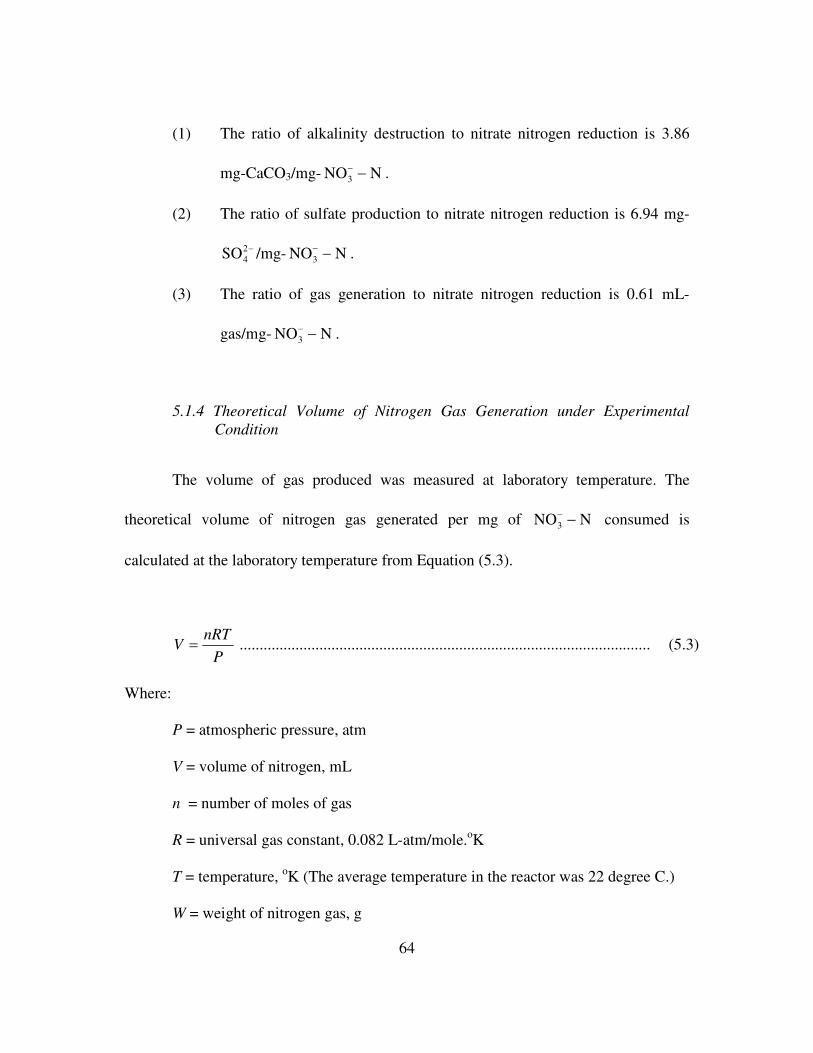
64
(1) The ratio of alkalinity destruction to nitrate nitrogen reduction is 3.86
mg-CaCO3/mg- NNO3 −− .
(2) The ratio of sulfate production to nitrate nitrogen reduction is 6.94 mg-
−24SO /mg- NNO3 −
− .
(3) The ratio of gas generation to nitrate nitrogen reduction is 0.61 mL-
gas/mg- NNO3 −− .
5.1.4 Theoretical Volume of Nitrogen Gas Generation under ExperimentalCondition
The volume of gas produced was measured at laboratory temperature. The
theoretical volume of nitrogen gas generated per mg of NNO3 −− consumed is
calculated at the laboratory temperature from Equation (5.3).
P
nRTV = ....................................................................................................... (5.3)
Where:
P = atmospheric pressure, atm
V = volume of nitrogen, mL
n = number of moles of gas
R = universal gas constant, 0.082 L-atm/mole.oK
T = temperature, oK (The average temperature in the reactor was 22 degree C.)
W = weight of nitrogen gas, g
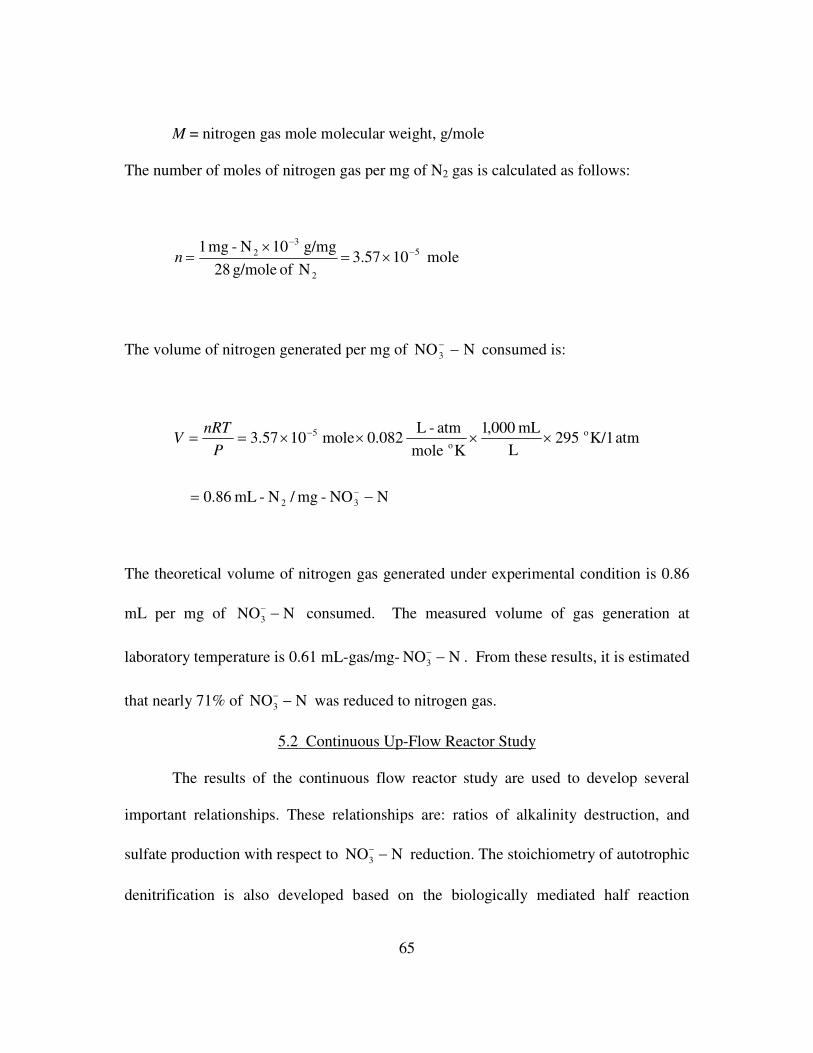
65
M = nitrogen gas mole molecular weight, g/mole
The number of moles of nitrogen gas per mg of N2 gas is calculated as follows:
mole103.57Nofg/mole28
g/mg10N-mg1 5
2
32 −
−
×=×
=n
The volume of nitrogen generated per mg of NNO3 −− consumed is:
NNO-mg/N-mL86.0
atmK/1295L
mL000,1
Kmole
atm-L082.0mole1057.3
32
oo
5
−=
××××==
−
−
P
nRTV
The theoretical volume of nitrogen gas generated under experimental condition is 0.86
mL per mg of NNO3 −− consumed. The measured volume of gas generation at
laboratory temperature is 0.61 mL-gas/mg- NNO3 −− . From these results, it is estimated
that nearly 71% of NNO3 −− was reduced to nitrogen gas.
5.2 Continuous Up-Flow Reactor Study
The results of the continuous flow reactor study are used to develop several
important relationships. These relationships are: ratios of alkalinity destruction, and
sulfate production with respect to NNO3 −− reduction. The stoichiometry of autotrophic
denitrification is also developed based on the biologically mediated half reaction
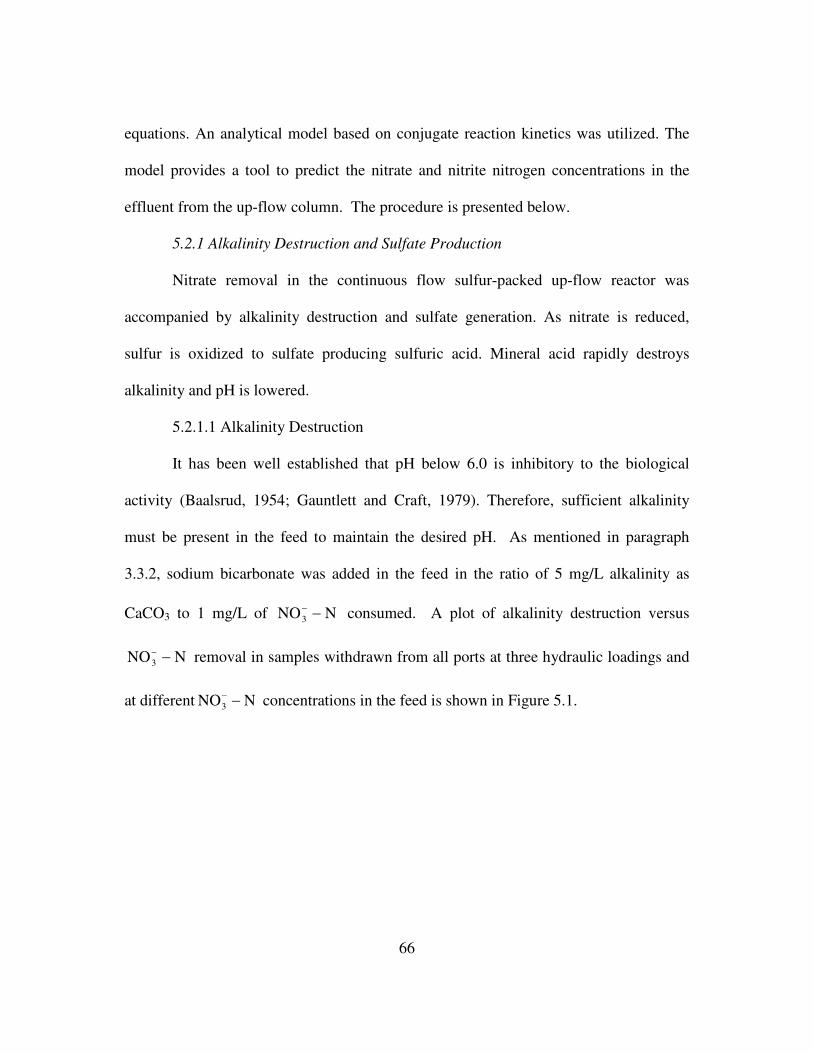
66
equations. An analytical model based on conjugate reaction kinetics was utilized. The
model provides a tool to predict the nitrate and nitrite nitrogen concentrations in the
effluent from the up-flow column. The procedure is presented below.
5.2.1 Alkalinity Destruction and Sulfate Production
Nitrate removal in the continuous flow sulfur-packed up-flow reactor was
accompanied by alkalinity destruction and sulfate generation. As nitrate is reduced,
sulfur is oxidized to sulfate producing sulfuric acid. Mineral acid rapidly destroys
alkalinity and pH is lowered.
5.2.1.1 Alkalinity Destruction
It has been well established that pH below 6.0 is inhibitory to the biological
activity (Baalsrud, 1954; Gauntlett and Craft, 1979). Therefore, sufficient alkalinity
must be present in the feed to maintain the desired pH. As mentioned in paragraph
3.3.2, sodium bicarbonate was added in the feed in the ratio of 5 mg/L alkalinity as
CaCO3 to 1 mg/L of NNO3 −− consumed. A plot of alkalinity destruction versus
NNO3 −− removal in samples withdrawn from all ports at three hydraulic loadings and
at different NNO3 −− concentrations in the feed is shown in Figure 5.1.
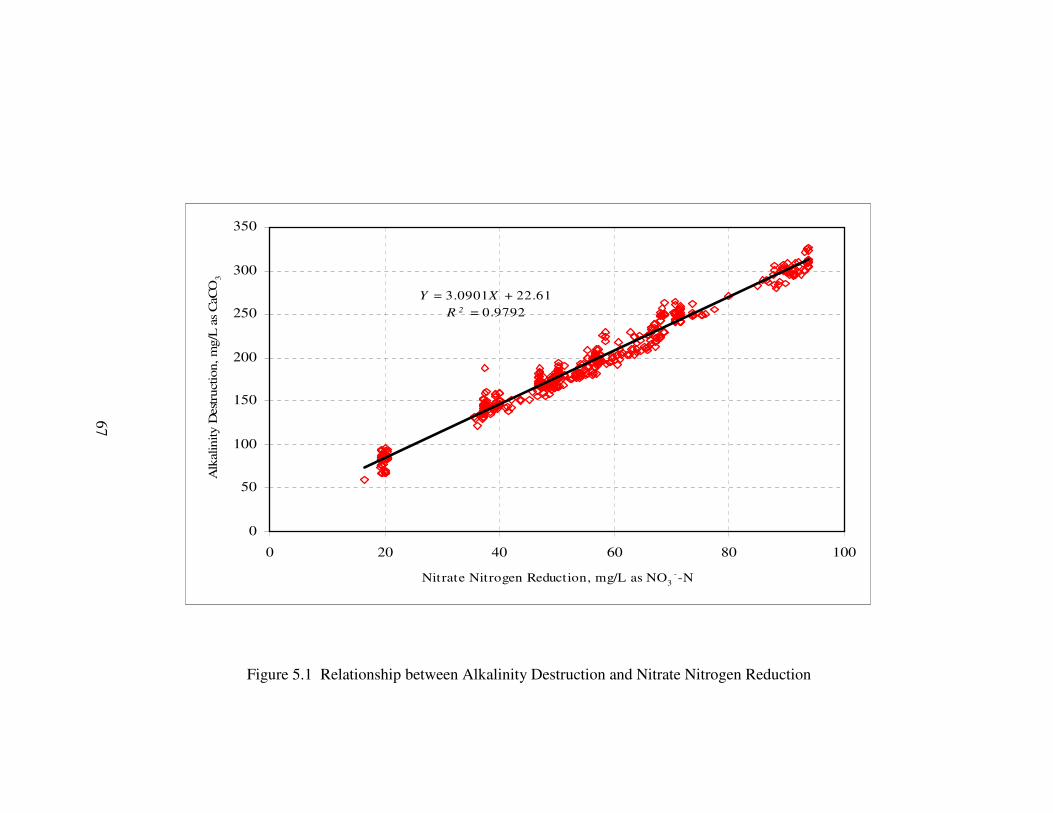
Y = 3.0901X + 22.61R 2 = 0.9792
0
50
100
150
200
250
300
350
0 20 40 60 80 100
Nitrate Nitrogen Reduction, mg/L as NO3--N
Alk
alin
ityD
estr
uctio
n,m
g/L
asC
aCO
3
Figure 5.1 Relationship between Alkalinity Destruction and Nitrate Nitrogen Reduction
67
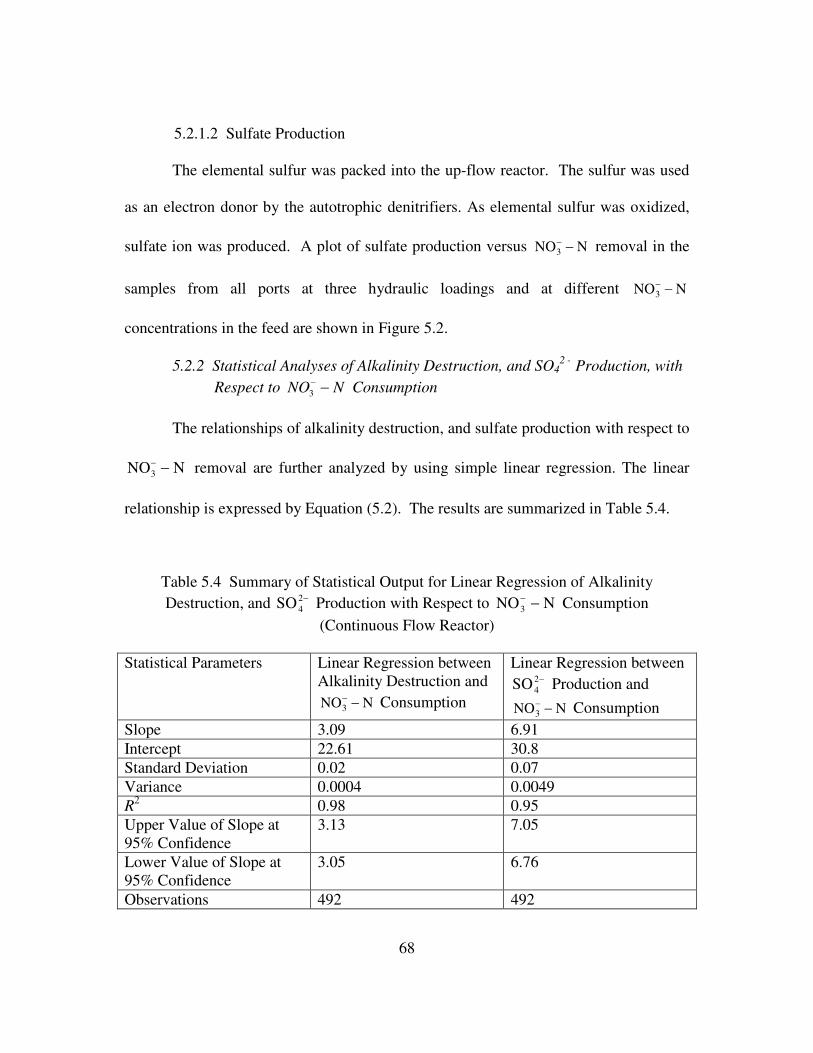
68
5.2.1.2 Sulfate Production
The elemental sulfur was packed into the up-flow reactor. The sulfur was used
as an electron donor by the autotrophic denitrifiers. As elemental sulfur was oxidized,
sulfate ion was produced. A plot of sulfate production versus NNO3 −− removal in the
samples from all ports at three hydraulic loadings and at different NNO3 −−
concentrations in the feed are shown in Figure 5.2.
5.2.2 Statistical Analyses of Alkalinity Destruction, and SO42- Production, with
Respect to NNO −−3 Consumption
The relationships of alkalinity destruction, and sulfate production with respect to
NNO3 −− removal are further analyzed by using simple linear regression. The linear
relationship is expressed by Equation (5.2). The results are summarized in Table 5.4.
Table 5.4 Summary of Statistical Output for Linear Regression of AlkalinityDestruction, and −2
4SO Production with Respect to NNO3 −− Consumption
(Continuous Flow Reactor)
Statistical Parameters Linear Regression betweenAlkalinity Destruction and
NNO3 −− Consumption
Linear Regression between−2
4SO Production and
NNO3 −− Consumption
Slope 3.09 6.91Intercept 22.61 30.8Standard Deviation 0.02 0.07Variance 0.0004 0.0049R2 0.98 0.95Upper Value of Slope at95% Confidence
3.13 7.05
Lower Value of Slope at95% Confidence
3.05 6.76
Observations 492 492
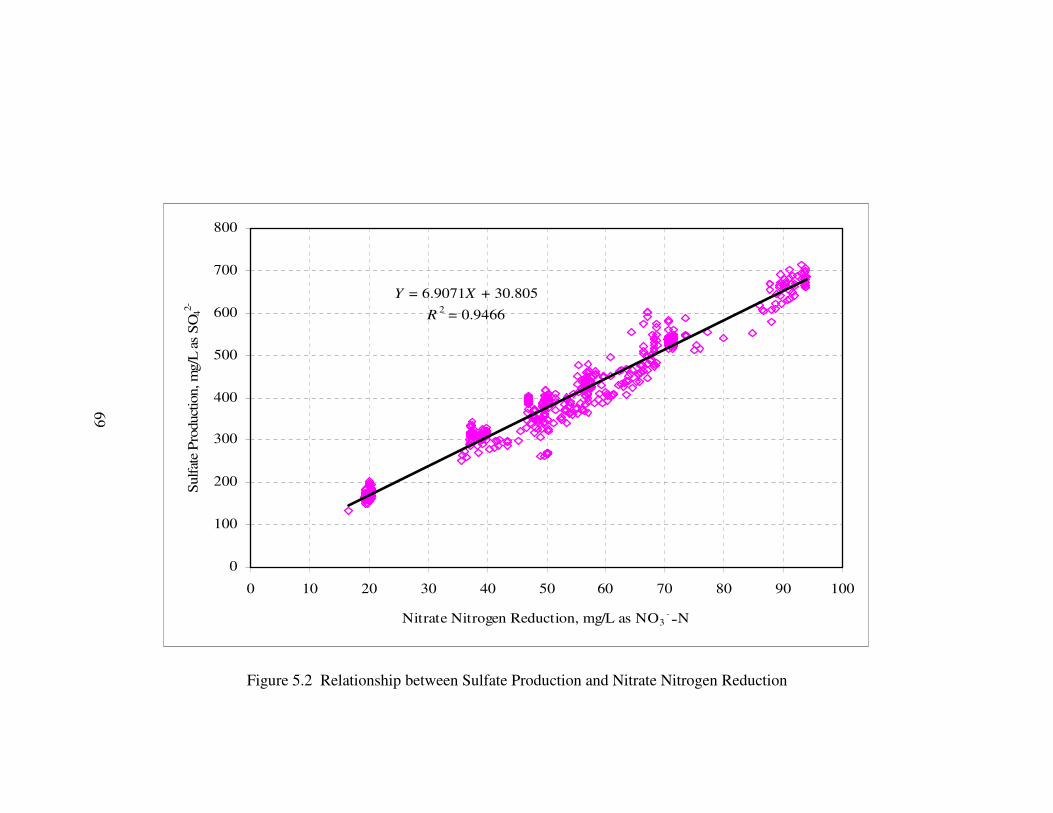
Y = 6.9071X + 30.805
R 2 = 0.9466
0
100
200
300
400
500
600
700
800
0 10 20 30 40 50 60 70 80 90 100
Nitrate Nitrogen Reduction, mg/L as NO3--N
Sul
fate
Pro
duct
ion,
mg/
Las
SO
42-
Figure 5.2 Relationship between Sulfate Production and Nitrate Nitrogen Reduction
69
70
The relationship between alkalinity destruction and nitrate nitrogen removal showed a
linear relationship with an R2 of 0.98. The R2 value close to 1 implied a perfect linear
relationship. The slope of the line indicates that 3.09 mg/L alkalinity as CaCO3 was
destroyed per mg/L of nitrate nitrogen removal. This ratio in the batch reactor study was
3.86. The intercept indicates that there is an initial 22.61 mg/L alkalinity destruction
which could be attributed to the DO removal and other unknown factors. This topic is
discussed further in Section 5.2.4. The small standard deviation, variance, interval
between lower 95% confidence and upper 95% confidence, and high number of
observations indicate that the value of slope is reliable and truly representative.
The relationship between sulfate production and nitrate nitrogen removal
showed a linear relationship with an R2 of 0.95. The R2 value close to one implied a
high linear relationship. The slope of the linear line is 6.91 indicating that 6.91 mg/L
−24SO is generated per mg/L of nitrate nitrogen removed. The sulfate generation ratio in
the batch reactor study was 6.94. The intercept indicates that 30.81 mg/L of −24SO is
initially generated. The initial sulfate generation may be attributed to deoxygenation of
raw feed and other unknown factors (see Section 5.2.4 for additional details). The small
standard deviations, variance, intervals between lower and upper 95% confidence, and
high number of observations indicate that the value of slope is reliable and truly
representative.
5.2.3 Stoichiometry of Autotrophic Denitrification
Sawyer and McCarty (1978) reported that most of biologically mediated
reactions are composed of three oxidation-reduction half reactions. These reactions are:
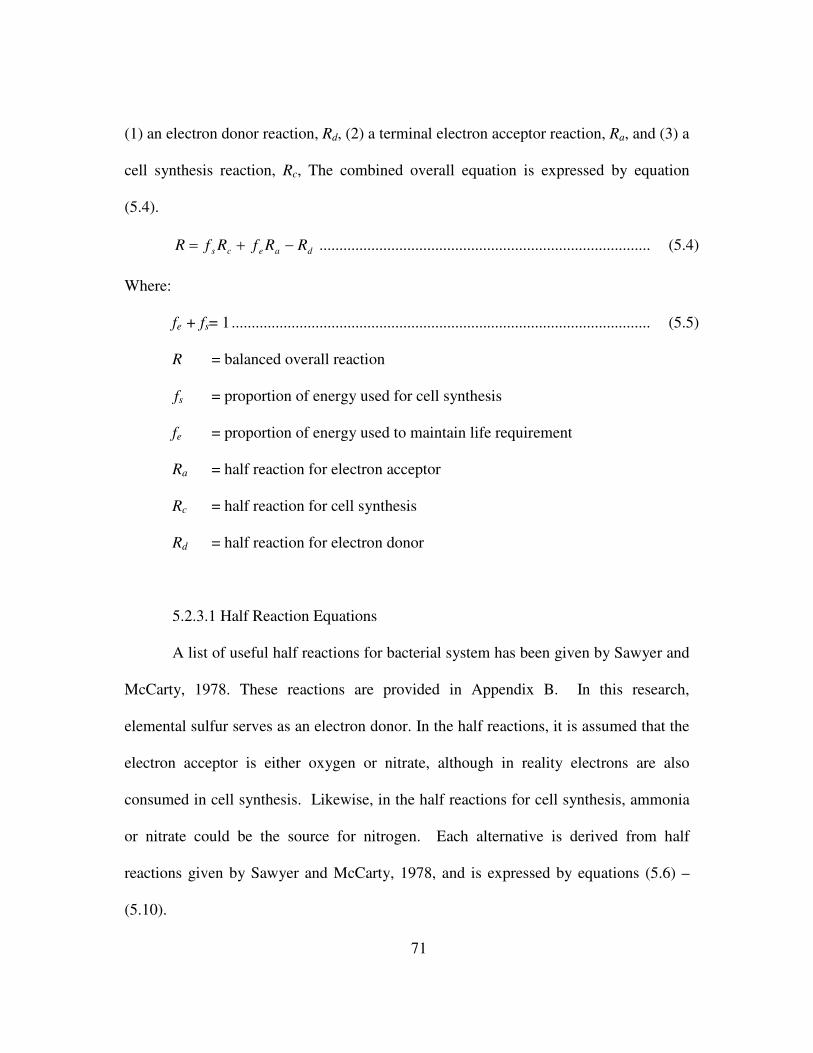
71
(1) an electron donor reaction, Rd, (2) a terminal electron acceptor reaction, Ra, and (3) a
cell synthesis reaction, Rc, The combined overall equation is expressed by equation
(5.4).
daecs RRfRfR −+= ................................................................................... (5.4)
Where:
fe + fs= 1......................................................................................................... (5.5)
R = balanced overall reaction
fs = proportion of energy used for cell synthesis
fe = proportion of energy used to maintain life requirement
Ra = half reaction for electron acceptor
Rc = half reaction for cell synthesis
Rd = half reaction for electron donor
5.2.3.1 Half Reaction Equations
A list of useful half reactions for bacterial system has been given by Sawyer and
McCarty, 1978. These reactions are provided in Appendix B. In this research,
elemental sulfur serves as an electron donor. In the half reactions, it is assumed that the
electron acceptor is either oxygen or nitrate, although in reality electrons are also
consumed in cell synthesis. Likewise, in the half reactions for cell synthesis, ammonia
or nitrate could be the source for nitrogen. Each alternative is derived from half
reactions given by Sawyer and McCarty, 1978, and is expressed by equations (5.6) –
(5.10).
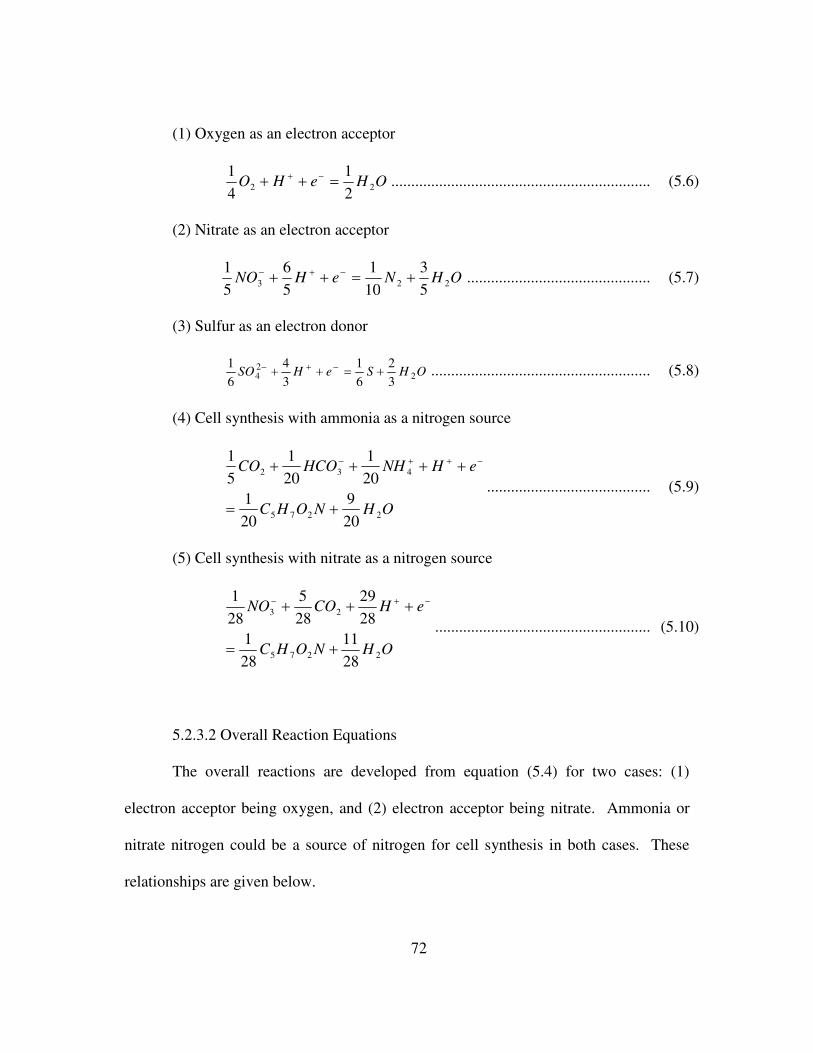
72
(1) Oxygen as an electron acceptor
OHeHO 22 2
1
4
1=++ −+ ................................................................. (5.6)
(2) Nitrate as an electron acceptor
OHNeHNO 223 5
3
10
1
5
6
5
1+=++ −+− .............................................. (5.7)
(3) Sulfur as an electron donor
OHSeHSO 224 3
2
6
1
3
4
6
1+=++ −+− ....................................................... (5.8)
(4) Cell synthesis with ammonia as a nitrogen source
OHNOHC
eHNHHCOCO
2275
432
20
9
20
120
1
20
1
5
1
+=
++++ −++−
......................................... (5.9)
(5) Cell synthesis with nitrate as a nitrogen source
OHNOHC
eHCONO
2275
23
28
11
28
128
29
28
5
28
1
+=
+++ −+−
...................................................... (5.10)
5.2.3.2 Overall Reaction Equations
The overall reactions are developed from equation (5.4) for two cases: (1)
electron acceptor being oxygen, and (2) electron acceptor being nitrate. Ammonia or
nitrate nitrogen could be a source of nitrogen for cell synthesis in both cases. These
relationships are given below.

73
(1) Oxygen – an electron acceptor
(a) Ammonia – a nitrogen source for cell synthesis
The stoichiometry of autotrophic denitrification is developed by substituting
equations (5.5), (5.6), (5.8), and (5.9) into equation (5.4). The stoichiometry is
expressed by equation (5.11).
+−
−+
++=
++++++
−
HSONOHCf
OHf
HCOf
NHf
COf
SOf
s
sssss
3
1
6
1
20
)60
310(
202056
1
4
1
24275
23422
............ (5.11)
(b) Nitrate – a nitrogen source for cell synthesis
The stoichiometry of autotrophic denitrification is developed by
substituting equations (5.5), (5.6), (5.8), and (5.10) into equation (5.4). The
stoichiometry is expressed by equation (5.12).
+−
−
−++=
+++++
−
Hf
SONOHCf
OHf
COf
NOf
SOf
ss
ssss
)84
328(
6
1
28
)84
914(
28
5)
28(
6
1
4
1
24275
2232
............................. (5.12)
(2) Nitrate – an electron acceptor
(a) Ammonia – a nitrogen source for cell synthesis

74
The stoichiometry of autotrophic denitrification is developed by substituting
equations (5.5), and (5.7) – (5.9) into equation (5.4). The stoichiometry is expressed by
Equation (5.13).
+−
−+−
+++−
+=
++++++
−
Hf
SONf
NOHCf
OHf
HCOf
NHf
COf
SNOf
sss
sssss
)515
2(
6
1
10
1
20
)60
94(
202056
1
5
1
242275
23423
........... (5.13)
(b) Nitrate – a nitrogen source for cell synthesis
The stoichiometry of autotrophic denitrification is developed by
substituting equations (5.5), (5.7), (5.8), and (5.10) into equation (5.4). The
stoichiometry is expressed by equation (5.14).
+−
−
+++
−+=
++++
−
Hf
SONf
NOHCf
OHf
COf
SNOf
sss
sss
)420
5669(
6
1
10
1
28
)420
2887(
28
5
6
1)
140
2328(
242275
223
............................... (5.14)
5.2.3.3 Application of Experimental Data to Determine OverallStoichiometric Equation Coefficients
The stoichiometric coefficients of overall equation of autotrophic denitrification
are developed by comparing the experimental data for the ratio of sulfate production
and nitrate nitrogen reduction. In autotrophic denitrification process, nitrate is used as
an electron acceptor. The overall equations are developed for two alternatives: ammonia

75
or nitrate being a nitrogen source for cell synthesis. Both alternatives are presented
below.
(1) Ammonia – a nitrogen source for cell synthesis
The ratio of sulfate production and nitrate nitrogen destruction is 6.91 (Figure
5.2). By substituting 6.91 equal to the stoichiometric ratio of sulfate production to
nitrate destruction in equation (5.13), the value of fs is calculated.
91.6NO
5
1
SO6
1
3
24
=− −
−
sf
6.91
NOmole
NOg14NOmole
5
-1
SOmole
SOg96SOmole
6
1
3
33
24
242
4
=×
×
−
−−
−
−−
sf
83.017.011(5.5),EquationFrom
17.0
=−=−=
=
se
s
ff
f
By substituting fs = 0.17 into equation (5.13), the stoichiometry of autotrophic
denitrification using granular sulfur as an electron donor, nitrate as an electron acceptor,
and ammonia as the nitrogen source for cell synthesis is obtained. The result is shown
by equation (5.15).
+−
−+−
+++⇒
+++++
HSONNOHC
OHHCONHCOSNO
0.10.15.005.0
55.005.005.02.00.10.1242275
23423 ................... (5.15)

76
(2) Nitrate – a nitrogen source for cell synthesis
The ratio of sulfate production and nitrate nitrogen destruction is 6.91 (Figure
5.2). By substituting 6.91 equal to the stoichiometric ratio of sulfate production to
nitrate destruction in equation (5.14), the value of fs is calculated.
91.6NO
140
2328
SO6
1
3
24
=− −
−
sf
6.91
NOmole
NOg14NOmole
140
23-28
SOmole
SOg96SOmole
6
1
3
33
24
242
4
=×
×
−
−−
−
−−
sf
79.021.011(5.5),EquationFrom
21.0
=−=−=
=
se
s
ff
f
By substituting fs = 0.21 into equation (5.14), the stoichiometry of autotrophic
denitrification using granular sulfur as an electron donor, nitrate as an electron acceptor,
and nitrate as the nitrogen source for cell synthesis is obtained. The result is expressed
in equation (5.16).
+−
−
+++⇒
+++
HSONNOHC
OHCOSNO
0.10.1477.0045.0
665.0226.00.10.1242275
223 ....................................... (5.16)

77
5.2.4 Initial Alkalinity Destruction, and Sulfate Production Due to DO Removal
The dissolved oxygen (DO) in the feed was rapidly removed by facultative
microorganisms accompanied by alkalinity destruction, and sulfate generation. Based
on the half reactions using oxygen as an electron acceptor and elemental sulfur as an
electron donor, the theoretical initial alkalinity destruction and sulfate production due to
DO removal is calculated. The nitrogen source for cell synthesis may be either ammonia
or nitrate nitrogen. Both alternatives are described below.
5.2.4.1 Initial Alkalinity Destruction
(1) Ammonia – a nitrogen source for cell synthesis
The alkalinity destruction is due to the hydrogen ion production which
consumes carbonate and bicarbonate. The consumption of one mole/L of −3HCO is
equivalent to the reduction of one equivalent/L of alkalinity. The calculation procedure
is shown below.
Equation (5.11) shows that 1/3 mole of [H+] is produced, and fs/20 mole of
−3HCO is consumed. Sawyer and McCarty, 1978, provided a list of fs(max) which is given
in Table B1 of Appendix B. Assuming fs(max) = 0.21, the theoretical initial alkalinity
destruction due to deoxygenation is calculated below.
O)4
1(
HCO20
H3
1
RemovalDO
nDestructioAlkalinity
2
3
s
s
f
f
−
+=
−+
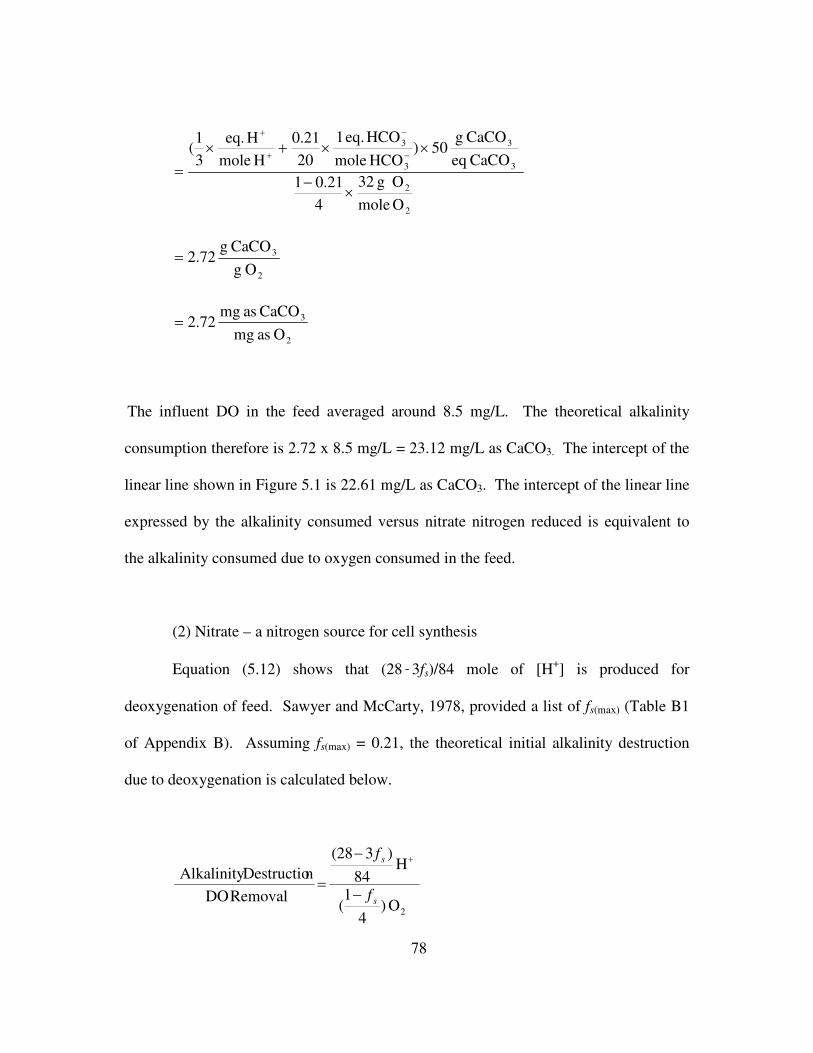
78
Omole
Og32
4
21.01CaCOeq
CaCOg50)
HCOmole
HCOeq.1
20
0.21
Hmole
Heq.
3
1(
2
2
3
3
3
3
×−
××+×=
−
−
+
+
2
3
Og
CaCOg72.2=
2
3
Oasmg
CaCOasmg72.2=
The influent DO in the feed averaged around 8.5 mg/L. The theoretical alkalinity
consumption therefore is 2.72 x 8.5 mg/L = 23.12 mg/L as CaCO3. The intercept of the
linear line shown in Figure 5.1 is 22.61 mg/L as CaCO3. The intercept of the linear line
expressed by the alkalinity consumed versus nitrate nitrogen reduced is equivalent to
the alkalinity consumed due to oxygen consumed in the feed.
(2) Nitrate – a nitrogen source for cell synthesis
Equation (5.12) shows that (28-3fs)/84 mole of [H+] is produced for
deoxygenation of feed. Sawyer and McCarty, 1978, provided a list of fs(max) (Table B1
of Appendix B). Assuming fs(max) = 0.21, the theoretical initial alkalinity destruction
due to deoxygenation is calculated below.
O)4
1(
H84
)3(28
RemovalDO
nDestructioAlkalinity
2s
s
f
f
−
−
=
+

79
Omole
Og32
4
21.01CaCOeq
CaCOg50)
Hmole
Heq.
84
0.21)3(28(
2
2
3
3
×−
×××−
=+
+
2
3
Og
CaCOg2.58=
2
3
Omg
CaCOmg58.2=
The influent DO in the feed averaged around 8.5 mg/L. The theoretical alkalinity
consumption therefore is 2.58 x 8.5 mg/L = 21.93 mg/L as CaCO3. This value is close
to 22.61 mg/L alkalinity as CaCO3 indicated by the intercept of linear line shown in
Figure 5.1.
5.2.4.2 Initial Sulfate Production
Both equations (5.11) & (5.12) show that 1/6 mole of sulfate is produced, and
(1-fs)/4 mole of O2 is consumed. Assuming fs(max) = 0.21 (Table B1 of Appendix B), the
theoretical initial sulfate production due to deoxygenation is calculated below.
2
24
2
22
-24
242
4
2
24
Oasmg
SOasmg2.53
Omole
Og32Omole
4
0.211
SOmole
SOg96SOmole
6
1
O4
1
SO6
1
RemovalDO
ProductionSulfate −
−−−
=×
−
×=
−=
sf

80
The influent DO in the feed averaged around 8.5 mg/L. The theoretical sulfate
consumption therefore is 2.53 x 8.5 mg/L = 21.5 mg/L as −24SO . This value is close to
30.81 mg/L as −24SO indicated by the intercept of linear line shown in Figure 5.2.
5.2.5 Data Modeling of Sulfur-Packed Continuous Up-Flow Reactor
The data developed by the continuous up-flow reactor are used to develop and
calibrate the nitrate-nitrite-nitrogen reduction equations. The reactions involving
autotrophic nitrate reduction in a sulfur-packed up-flow column is truly a consecutive
reaction. In consecutive reactions, the product of one reaction step becomes the reactant
of the subsequent reaction steps. The reduction of nitrate to nitrite and then to nitrogen
gas is expressed by Equation (5.17). The pathway from nitrite to nitrogen gas proceeds
via two intermediate forms of nitrogen: nitric oxide (NO) and nitrous oxide (N2O).
22321
NNONOkk→→ −− .......................................................................... (5.17)
In this reaction, reactant nitrate is reduced to product −2NO at a rate determined
by reaction rate constant k1. Product nitrite ( −2NO ) becomes the reactant for the second
step, and is finally reduced to nitrogen gas at an overall reaction rate constant k2. The
intermediate products are nitric oxide gas ( NO ) that is further reduced to nitrous oxide
gas ( ON2 ). Because nitric oxide and nitrous oxide are present in gaseous forms and the

81
gas components were not analyzed in the continuous flow study, the intermediate gas
products of nitric oxide and nitrous oxide are ignored, and nitrogen gas is assumed to be
the final end product. If the rates of consecutive reactions from nitrate to nitrite and then
nitrogen are assumed first-order, then the differential equations that describe the
reduction of NNO3 −− to NNO2 −
− and formation of N2 are expressed by Equations
(5.18) to (5.20).
NNO
NNO Ckdt
dC−
−−
−
=−
3
3
1 ................................................................................... (5.18)
NNONNO
NNO CkCkdt
dC−−
−−−
−
−=23
2
21 ................................................................... (5.19)
NNO
N Ckdt
dC−−
=2
2
2 .......................................................................................... (5.20)
The solutions of these differential equations provide the concentrations of constituents
at any time t as expressed by Equations (5.21) to (5.23).
tko
NNONNOeCC 1
33
−−− −− = ..................................................................................... (5.21)
tko
NNO
tktk
o
NNO
NNOeCee
kk
CkC 2
2
213
2)(
12
1 −−
−−−− −
−
− +−−
= .............................................. (5.22)
oN
tko
NNO
tktko
NNON CeC
kk
ekekCC
2
2
2
21
3
2)1(
)1(
12
12+−+
−
−−= −
−
−−−
−
−
......................... (5.23)

82
Where:
NNOC −−3= concentrations of NNO3 −
− at any time t, mg/L
NNOC −−2= concentrations of NNO2 −
− at any time t, mg/L
2NC = concentrations of N2 at any time t, mg/L
oNNOC −−3
= concentrations of NNO3 −− at t = 0, mg/L
oNNOC −−2
= concentrations of NNO2 −− at t = 0, mg/L
oNC
2= concentrations of N2 at t = 0, mg/L
k1 = reaction rate constant for NNO3 −− reduction, h-1
k2 = reaction rate constant for NNO2 −− reduction, h-1
t = true hydraulic retention time, h
The results of the sulfur-packed continuous up-flow reactor are used to calibrate the
nitrate reduction expressed by equations (5.21) to (5.23). The reaction rate constants k1
and k2 are estimated to best fit the experimental data.
The experimental data representing the ratios of effluent and influent NNO3 −−
concentrations (C/Co) at six sampling ports are plotted against the true hydraulic
retention time (THRT). As described in Chapter 3, THRT is the total void volume
divided by the influent flow rate. The THRT at three hydraulic loadings and at each
sampling ports are provided in Table 3.4. The results of C/Co versus THRT for

83
NNO3 −− at three hydraulic loadings and different initial NNO3 −
− concentrations are
shown in Figures 5.3 to 5.5. Finally, the data points of three figures are combined into a
single line by averaging all data points corresponding to the plotting THRT. This curve
is shown in Figure 5.6. The plot of NNO3 −− reduction clearly follows the classical
first order reaction rate.
5.2.5.1 Determination of Nitrate Reaction Rate Constant k1
The reaction rate constant k1 is determined using the classical methods that have
been applied for the first order BOD stabilization. These methods are Thomas, Least
Square, Fujimoto and others (Metcalf and Eddy, 2003). In this study, Fujimoto method
is applied to determine the reaction rate constants k1 and (1-C/Co) from the
experimental data. The procedure is presented in Appendix G (Table G1 and Figure
G1). The average value of k1 and the ultimate value of (1-C/Co) are 1.41/hr and 97.6
percent.
5.2.5.2 Determination of Nitrite Reaction Rate Constant k2
NNO2 −− was measured at many sampling ports. Presence of NNO2 −
− is an
indication of incomplete reduction of nitrate. At lower sampling ports and at higher
NNO3 −− loadings, the NNO2 −
− concentration was quite high. Figure 5.6 indicates
that the average NNO2 −− production reached 11 percent of the initial NNO3 −
−
concentration in the feed at THRT of 1.2 hr. The NNO2 −− concentration decreases
gradually at higher THRT.

Figure 5.3 Relationship between C/Co and THRT at Hydraulic Loading of 0.06 m3/m2.hr
84
0%
10%
20%
30%
40%
50%
60%
70%
80%
90%
100%
0 2 4 6 8 10 12
THRT, hrs
Rat
ioof
C/C
o
NO3-N Variation at Influent NO3-N = 50 mg/L NO3-N Variation at Influent NO3-N = 70 mg/L
NO3-N Variation at Influent NO3-N = 90 mg/L NO2-N Variation at Influent NO3-N = 50 mg/L
NO2-N Variation at Influent NO3-N = 70 mg/L NO2-N Variation at NO3-N = 90 mg/L
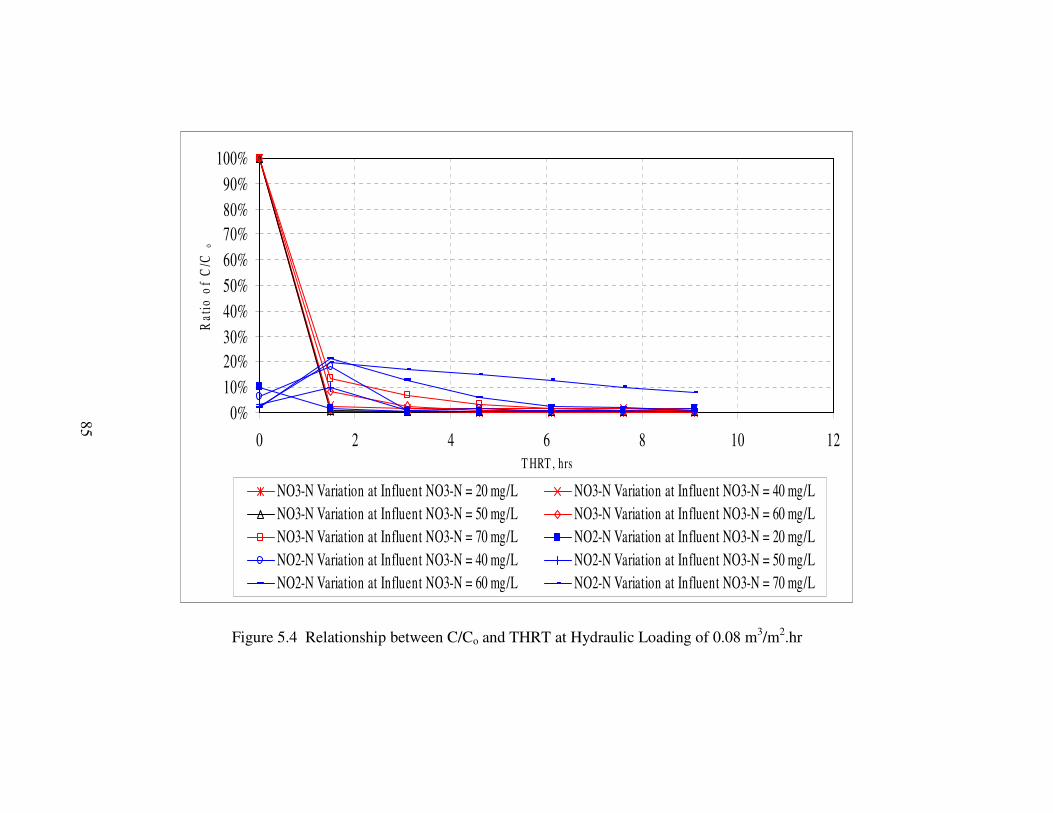
0%10%20%30%40%50%60%70%80%90%
100%
0 2 4 6 8 10 12T HRT , hrs
Rat
ioof
C/C
o
NO3-N Variation at Influent NO3-N = 20 mg/L NO3-N Variation at Influent NO3-N = 40 mg/LNO3-N Variation at Influent NO3-N = 50 mg/L NO3-N Variation at Influent NO3-N = 60 mg/LNO3-N Variation at Influent NO3-N = 70 mg/L NO2-N Variation at Influent NO3-N = 20 mg/LNO2-N Variation at Influent NO3-N = 40 mg/L NO2-N Variation at Influent NO3-N = 50 mg/LNO2-N Variation at Influent NO3-N = 60 mg/L NO2-N Variation at Influent NO3-N = 70 mg/L
Figure 5.4 Relationship between C/Co and THRT at Hydraulic Loading of 0.08 m3/m2.hr
85

0%
10%
20%
30%
40%
50%
60%
70%
80%
90%
100%
0 2 4 6 8 10 12
T HRT , hrs
Rat
ioof
C/C
o
NO3-N Variation at Influent NO3-N = 20 mg/L NO3-N Variation at Infleunt NO3-N = 40 mg/LNO3-N Variation at Influent NO3-N = 60 mg/L NO3-N Variation at Influent NO3-N = 70 mg/LNO2-N Variation at Influent NO3-N = 20 mg/L NO2-N Variation at Influent NO3-N = 40 mg/LNO2-N Variation at Influent NO3-N = 60 mg/L NO2-N Variation at Influent NO3-N = 70 mg/L
Figure 5.5 Relationship between C/Co and THRT at Hydraulic Loading of 0.10 m3/m2.hr
86

0%
10%
20%
30%
40%
50%
60%
70%
80%
90%
100%
0 2 4 6 8 10 12 14
THRT, hrs
C/C
o
Average NO3-N Average NO2-N
Figure 5.6 Relationship between Average C/Co and THRT at Three Combined Hydraulic Loadings
87
88
The value of reaction rate constant k2 is obtained by a trial and error procedure.
Different values of k2 are substituted in equation (5.22) to obtain C/Co ratios closest to
the experimental curve shown in Figure 5.6. A value of k2 equal to 3.15/hr provided the
best data fit. In Figure 5.7, the NNO3 −− and NNO2 −
− ratios from experimental data
points, and smooth curves from equations (5.18) and (5.19) using derived k1 and k2 are
compared. The results of model prediction are close to the experimental data. Because
nitrogen production was not measured in the continuous flow reactor study, the
generation rate is predicted from Equation (5.23).
5.2.5.3 Sensitivity Analysis of the Model
The sensitivity of the model is dependent upon the reaction rate constants k1 and
k2. The NNO3 −− and NNO2 −
− profiles are prepared by assuming different k1 and k2
values and then comparing them with the best fit profiles shown in Figure 5.7 (k1 =
1.41/hr and k2 = 3.15/hr). In this investigation the sensitivity analysis was performed by
varying the values of one parameter 50% higher and 50% lower than the optimum value
while keeping the other parameter constant at optimum value. The optimum values of
the constants are those that gave the best experimental data fit (Figure 5.7). The steps
involved in the sensitivity analysis are shown below.
k2 = 4.73/hr, 50% higherConstant k1 = 1.41/hrk2 changed from 3.15/hr k2 = 1.58/hr, 50% lower
k1 = 2.11/hr, 50% higherConstant k2 = 3.15/hrk1 changed from 1.41/hr k1 = 0.71/hr, 50% lower

0%
10%
20%
30%
40%
50%
60%
70%
80%
90%
100%
0 2 4 6 8 10 12
THRT, hrs
C/C
o
Experimental NO3-N Experimental NO2-N Calculated NO3-NCalculated NO2-N Calculated N2
k 1 =1.41/hr (best fit value)
k 2 =3.15/hr (best fit value)
Figure 5.7 Comparison of Average C/Co from Experimental Result and Calculated C/Co from Derived k1 and k2
89
90
The results of sensitivity analysis are illustrated in Figures 5.8 and 5.9. The key results
are summarized below.
(1) The NNO2 −− concentrations are sensitive to change in reaction rate
constant k2. As k2 value is increased over the optimum k2, the model predicts
lower NNO2 −− concentration (Figure 5.8(a)). Alternatively, as k2 is
decreased from the optimum k2, the model predicts significantly higher
NNO2 −− concentration (Figure 5.8(b)). The largest change however, occurs
at THRT of around 1.2 hr.
(2) The NNO3 −− concentrations are sensitive to the change in reaction rate
constant k1. As k1 value is increased over the optimum k1, the model predicts
lower NNO2 −− concentration (Figure 5.9(a)). The NNO3 −
−
concentrations are very sensitive to the decrease in reaction rate constant k1.
It shows a significant rise at THRT of around 1.2 hr (Figure 5.9(b)). The
change of NNO3 −− concentrations is much less with the increase in k1.
(3) The concentration of both NNO3 −− and NNO2 −
− are very sensitive to the
change in k1 and k2 at THRT of around 1.2 hr. As the THRT is increased,
the results become less sensitive to the change in reaction rate constants k1
and k2. At THRT of 4.0 hr, concentrations of NNO3 −− and NNO2 −
−
approach zero.

91
0%
10%
20%
30%
40%
50%
60%
70%
80%
90%
100%
0 2 4 6 8 10 12
THRT, hrs
C/C
o
Experimental NO3-NExperimental NO2-NBest fit NO3-N (k1=1.41/hr, k2=3.15/hr)Best fit NO2-N (k1=1.41/hr, k2=3.15/hr)Calculated NO3-N, k2=4.73/hr (50% higher than best fit k2=3.15/hr)Calculated NO2-N, k2=4.73/hr (50% higher than best fit k2=3.15/hr)
k 1 constant at 1.41/hr (best fit value)
k 2 =4.73/hr (50% higher than best fit k 2=3.15/hr)
(a)
0%
10%
20%
30%
40%
50%
60%
70%
80%
90%
100%
0 2 4 6 8 10 12
THRT, hrs
C/C
o
Experimental NO3-NExperimental NO2-NBest fit NO3-N (k1=1.41/hr, k2=3.15/hr)Best fit NO2-N (k1=1.41/hr, k2=3.15/hr)Calculated NO3-N, k2=1.58/hr (50% lower than best fit k2=3.15/hr)Calculated NO2-N, k2=1.58/hr (50% lower than best fit k2=3.15/hr)
k 1 constant at 1.41/hr (best fit value)
k 2 = 1.58/hr (50% lower than best fit k 2 = 3.15/hr)
(b)
Figure 5.8 Sensitivity Analysis and Concentration Profiles (a) k1 Constant at 1.41/hr(best fit value) and k2 = 4.73/hr (50% higher than the best fit k2 = 3.15/hr), and (b) k1
Constant at 1.41/hr (best fit value) and k2 = 1.58/hr (50% lower than the best fit k2 =3.15/hr)
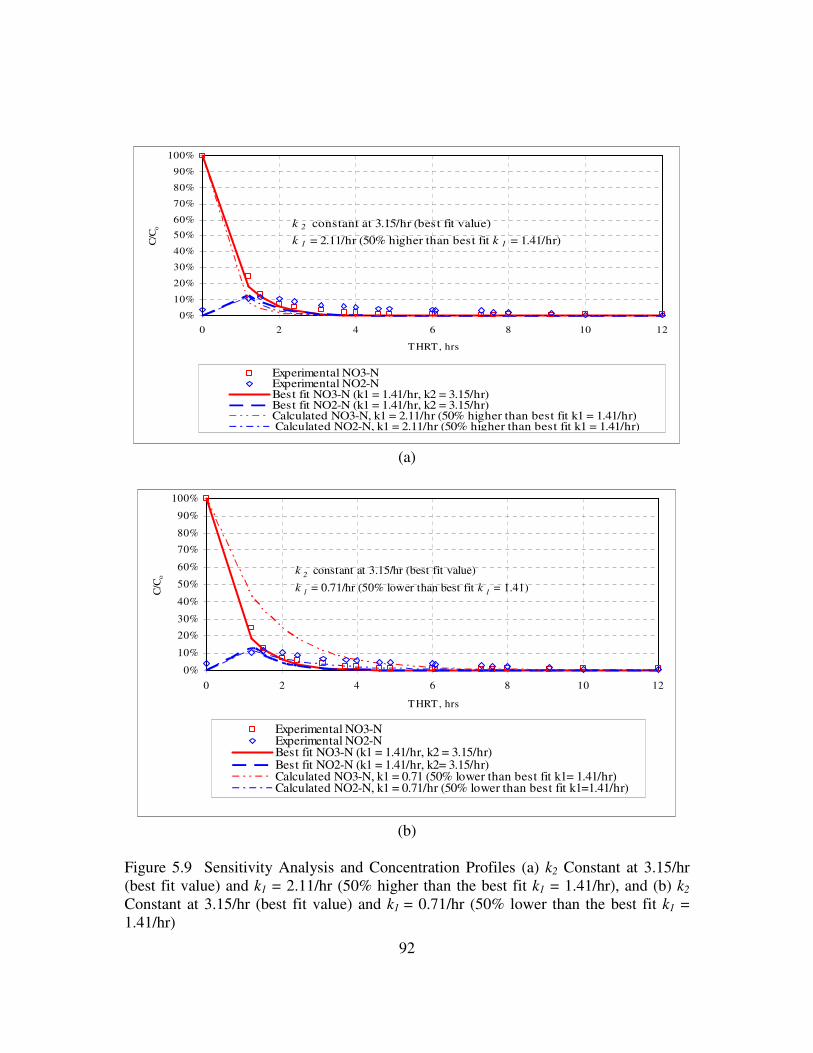
92
0%
10%
20%
30%
40%
50%
60%
70%
80%
90%
100%
0 2 4 6 8 10 12
THRT, hrs
C/C
o
Experimental NO3-NExperimental NO2-NBest fit NO3-N (k1 = 1.41/hr, k2 = 3.15/hr)Best fit NO2-N (k1 = 1.41/hr, k2 = 3.15/hr)Calculated NO3-N, k1 = 2.11/hr (50% higher than best fit k1 = 1.41/hr)Calculated NO2-N, k1 = 2.11/hr (50% higher than best fit k1 = 1.41/hr)
k 2 constant at 3.15/hr (best fit value)
k 1 = 2.11/hr (50% higher than best fit k 1 = 1.41/hr)
(a)
0%
10%
20%
30%
40%
50%
60%
70%
80%
90%
100%
0 2 4 6 8 10 12
THRT, hrs
C/C
o
Experimental NO3-NExperimental NO2-NBest fit NO3-N (k1 = 1.41/hr, k2 = 3.15/hr)Best fit NO2-N (k1 = 1.41/hr, k2= 3.15/hr)Calculated NO3-N, k1 = 0.71 (50% lower than best fit k1= 1.41/hr)Calculated NO2-N, k1 = 0.71/hr (50% lower than best fit k1=1.41/hr)
k 2 constant at 3.15/hr (best fit value)
k 1 = 0.71/hr (50% lower than best fit k 1 = 1.41)
(b)
Figure 5.9 Sensitivity Analysis and Concentration Profiles (a) k2 Constant at 3.15/hr(best fit value) and k1 = 2.11/hr (50% higher than the best fit k1 = 1.41/hr), and (b) k2
Constant at 3.15/hr (best fit value) and k1 = 0.71/hr (50% lower than the best fit k1 =1.41/hr)
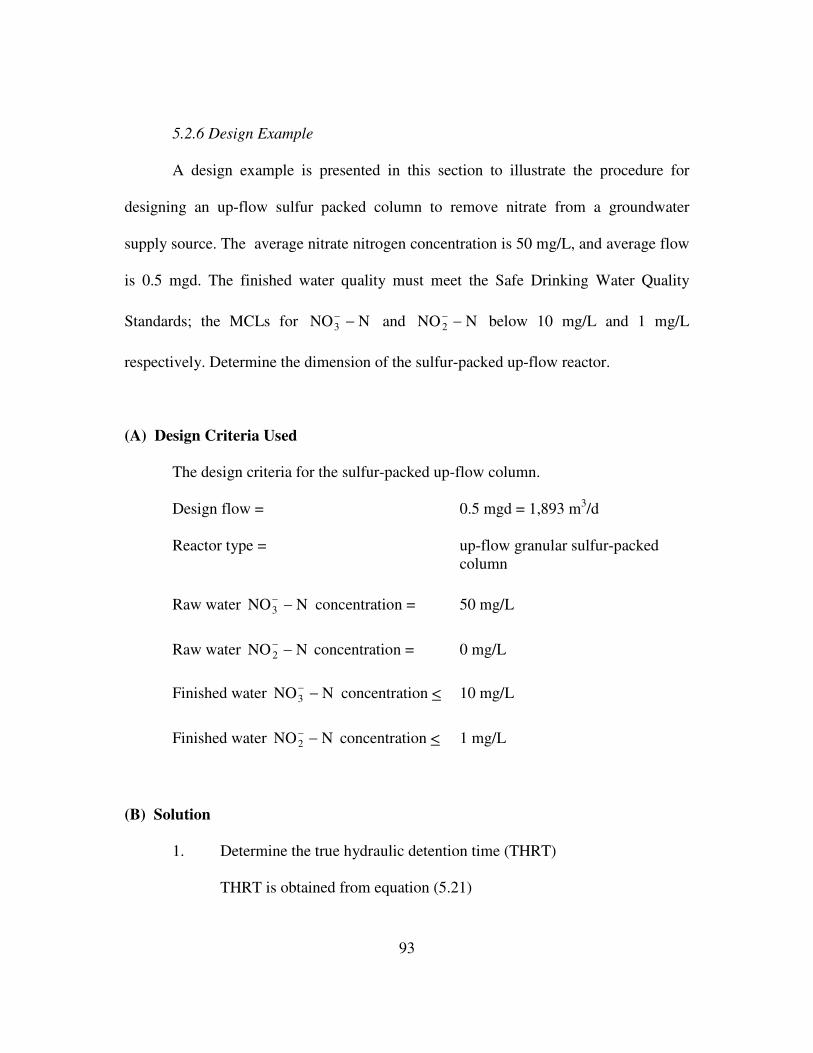
93
5.2.6 Design Example
A design example is presented in this section to illustrate the procedure for
designing an up-flow sulfur packed column to remove nitrate from a groundwater
supply source. The average nitrate nitrogen concentration is 50 mg/L, and average flow
is 0.5 mgd. The finished water quality must meet the Safe Drinking Water Quality
Standards; the MCLs for NNO3 −− and NNO2 −
− below 10 mg/L and 1 mg/L
respectively. Determine the dimension of the sulfur-packed up-flow reactor.
(A) Design Criteria Used
The design criteria for the sulfur-packed up-flow column.
Design flow = 0.5 mgd = 1,893 m3/d
Reactor type = up-flow granular sulfur-packedcolumn
Raw water NNO3 −− concentration = 50 mg/L
Raw water NNO2 −− concentration = 0 mg/L
Finished water NNO3 −− concentration < 10 mg/L
Finished water NNO2 −− concentration < 1 mg/L
(B) Solution
1. Determine the true hydraulic detention time (THRT)
THRT is obtained from equation (5.21)
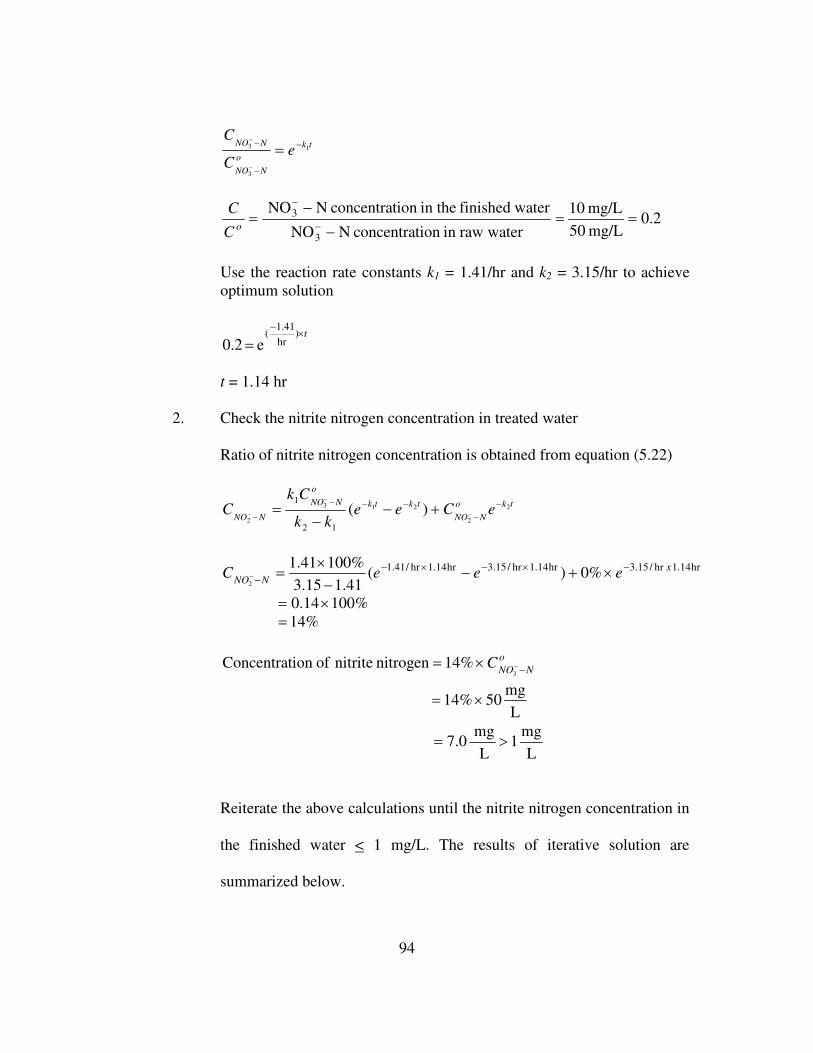
94
tk
o
NNO
NNOe
C
C1
3
3 −
−
− =−
−
2.0mg/L50
mg/L10
waterrawinionconcentratNNO
waterfinishedin theionconcentratNNO
3
3 ==−
−=
−
−
oC
C
Use the reaction rate constants k1 = 1.41/hr and k2 = 3.15/hr to achieveoptimum solution
t×−
=)
hr
41.1(
e0.2
t = 1.14 hr
2. Check the nitrite nitrogen concentration in treated water
Ratio of nitrite nitrogen concentration is obtained from equation (5.22)
tko
NNO
tktk
o
NNO
NNOeCee
kk
CkC 2
2
213
2)(
12
1 −−
−−−
− −
−
− +−−
=
hr14.1hr/15.3hr14.1hr/15.3hr14.1hr/41.1 %0)(41.115.3
%10041.12
xNNO eeeC −×−×−
− ×+−−×
=−
%10014.0 ×=%14=
oNNOC −−×=
3%14nitrogennitriteofionConcentrat
L
mg50%14 ×=
L
mg1
L
mg0.7 >=
Reiterate the above calculations until the nitrite nitrogen concentration in
the finished water < 1 mg/L. The results of iterative solution are
summarized below.

95
NNO3 −− , mg/L THRT, hrs NNO2 −
− , mg/L10 1.14 7.05 1.63 3.82.5 2.12 1.991.5 2.49 1.191.25 2.62 1.00
3. Determine the dimensions of the up-flow reactor
Assume void ratio, e, of the sulfur-packed reactor = 0.4
Required reactor volume
3
3
m517
hrs.)/0.42.62hrs.24
d
d
m(1,893
=
××=
Select the reactor height = 3.5 m
Required reactor surface area = 517 m3/3.5 m
=148 m2
Check hydraulic loading
hr.m
m0.53
m148
1
hrs.24
d
d
m893,1
2
3
2
3
=
××=
Select the reactor diameter of 7 m
Surface area of each reactor
2
2
m38.5
m)(74
π
=
×=
Required number of reactors = 148 m2/38.5 m2
= 3.8, use 4 reactors
96
CHAPTER 6
CONCLUSIONS AND RECOMMENDATIONS
6.1 Conclusions
Based on the results of an extensive literature search, and detailed experimental
programs with a batch reactor and a continuous up-flow sulfur-packed column, it is
concluded that the autotrophic denitrification is a viable process for nitrate removal
from groundwater supply sources. This process offers a distinct advantage over the
heterotrophic denitrification as no external carbon source is necessary. As a result, the
question regarding precursors and THMs formation potential in the finished water
supply does not arise. Under this research program many specific conclusions have
been drawn. These conclusions are summarized below.
(1) The elemental sulfur is oxidized and sulfate is produced linearly at a rate of 6.91
mg/L as −24SO per mg/L NNO3 −
− reduced. In this process however alkalinity
is destroyed linearly at a rate of 3.09 mg/L as CaCO3 per mg/L NNO3 −−
reduced. As a result, alkalinity must be added to maintain the pH in the
physiological range. pH below 6 is detrimental to the established
microbiological process. In this investigation pH was successfully maintained
by addition of sodium bicarbonate in the ratio of 5/1 in the feed as a source of

97
alkalinity (5 mg/L sodium bicarbonate expressed as CaCO3 per mg/L NNO3 −−
destroyed). Other investigators have used limestone packed columns with
limited success.
(2) The nitrate in the raw feed was reduced to nitrite and then to nitrogen. The
concentration of NNO2 −− increased initially in the effluent due to limiting
reaction rate from NNO3 −− to N2. As a result, there was significant build up of
NNO2 −− at higher nitrate loadings.
(3) The concentrations of nitrate and nitrite nitrogen in the effluent were
successfully modeled by conjugate reaction kinetics. The reaction rate constants
k1 = 1.41/hr and k2 = 3.15/hr predicted the NNO3 −− and NNO2 −
−
concentrations close to the experimental data.
(4) Nitrogen gas generation was not measured in the continuous flow reactor. It was
however, accurately modeled by conjugate reaction kinetics. The N2 gas
generation ratio C/Co approached 1.0 at around 4.0 hours of THRT. In the batch
reactor the gas generation was measured, and the ratio of gas generation was
0.61 mL N2 per mg of NNO3 −− reduced.
(5) The dissolved oxygen in the feed was clearly a source of interference in the
anoxic denitrification of nitrate. Although the dissolved oxygen in the
groundwater sources is normally low, the DO level in the feed was in the range
of 6.0 – 8.5 mg/L. Dissolved oxygen, being an electron acceptor, was

98
consumed. Therefore, initial sulfate production and alkalinity destruction may
be due to deoxygeneration reactions.
(6) The autotrophic denitrification reactions based on biologically medicated half
reaction equations are developed. These equations are based on (a) ammonia as
a nitrogen source for cell synthesis, and (b) nitrate as a nitrogen source for cell
synthesis. The cell mass in both equations is expressed by C5H7O2N.
(7) The analytical model based on conjugate reaction kinetics developed in this
research is a valuable tool to predict nitrate and nitrite concentration in the
effluent from the up-flow column. This model has potential for use in designing
a continuous up-flow column for removal of nitrate from the groundwater.
(8) A design example has been presented to develop the design procedure for an up-
flow sulfur packed column based on a given design flow, nitrate nitrogen
concentration in the feed, and limiting concentrations of nitrate and nitrite
nitrogen in the finished water. The limiting nitrite concentration in the finished
water governed the reactor size.
99
6.2 Recommendations
Many factors have been identified in this research that directly or indirectly
affect the performance of an up-flow sulfur packed autotropohic denitrification column.
These factors are temperature, dissolved oxygen in the feed, sulfur grain-size
distribution, granular sulfur, porosity ratio, hydraulic and nitrate loading, and true
hydraulic detention time. Many useful relationships have been developed in this
research in terms of these factors.
It is an established fact that the autotrophic denitrification is very sensitive to
lower temperature. Below 10 oC the performance of the process may drop significantly.
Additionally, the granular sulfur is constantly lost in the effluent as sulfate ions causing
a reduction in grain size. New material must be added in the column to maintain the
required sulfur mass in the column. As a result, the porosity ratios of sulfur in the
packed column will constantly change affecting the contact surface area of the sulfur
media, and true hydraulic detention time.
It is recommended that a full-scale or pilot plant field study be initiated. This
study will provide an opportunity to evaluate the effects of many key factors upon the
performance of the autotrophic denitrification process. The research strategy for field
investigation may include:
(1) The effect of temperature variation upon the nitrate removal, and nitrite build up
in the finished water will be established from the seasonal temperature variation
data. The results will be used to include the temperature effects upon the

100
reaction rate constants k1 and k2, and thus expand the capabilities of the
conjugate reaction model to include the temperature effects.
(2) The research performance on autotrophic denitrification was conducted using
the nitrate-spiked tap water. Micronutrients were added and the feed was stored
for several days for dechlorination. All these steps were taken to simulate the
groundwater. The DO in the feed however, remained high. The groundwater is
normally low in DO. Therefore, the field investigations performed on
groundwater will be a true representation of the real situation, and the effects of
DO and micronutrients will be confirmed.
(3) Claus and Kutzner (1985) conducted autotrophic denitrification using granular
sulfur as the electron donor and reported that there was no need of ammonium
for the nitrogen source. However, it is still a controversial issue. It is therefore
recommended to include in the future study the need for +4NH as a nitrogen
source for cell synthesis.
(4) The −2NO buildup in the effluent at high NNO3 −
− loading is a cause of concern.
It is recommended the effluent recycle through the reactor be investigated.
Effluent recycle will increase the NNO2 −− reductase concentrations in the feed
thus may accelerate the limiting reaction rate from NNO2 −− to N2.
101
APPENDIX A
STOICHIOMETRIC RELATIONSHIP OF BIOLOGICAL DENITRIFICATION
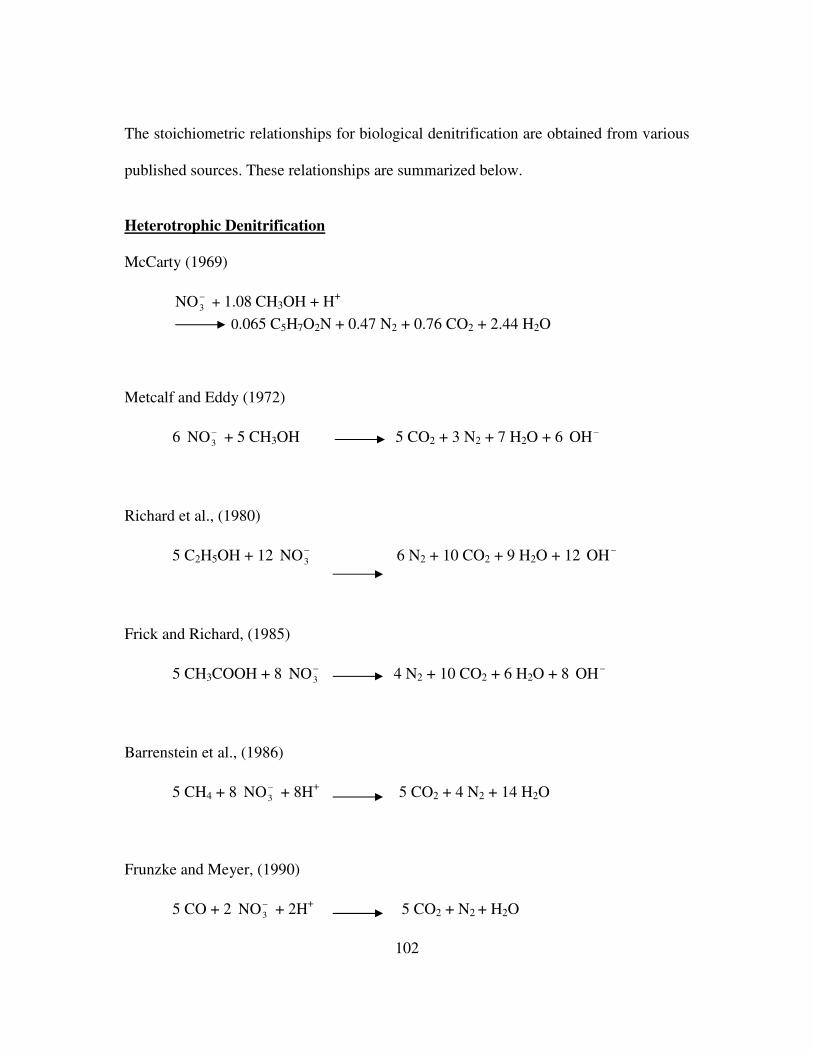
102
The stoichiometric relationships for biological denitrification are obtained from various
published sources. These relationships are summarized below.
Heterotrophic Denitrification
McCarty (1969)
−3NO + 1.08 CH3OH + H+
0.065 C5H7O2N + 0.47 N2 + 0.76 CO2 + 2.44 H2O
Metcalf and Eddy (1972)
6 −3NO + 5 CH3OH 5 CO2 + 3 N2 + 7 H2O + 6 −OH
Richard et al., (1980)
5 C2H5OH + 12 −3NO 6 N2 + 10 CO2 + 9 H2O + 12 −OH
Frick and Richard, (1985)
5 CH3COOH + 8 −3NO 4 N2 + 10 CO2 + 6 H2O + 8 −OH
Barrenstein et al., (1986)
5 CH4 + 8 −3NO + 8H+ 5 CO2 + 4 N2 + 14 H2O
Frunzke and Meyer, (1990)
5 CO + 2 −3NO + 2H+ 5 CO2 + N2 + H2O
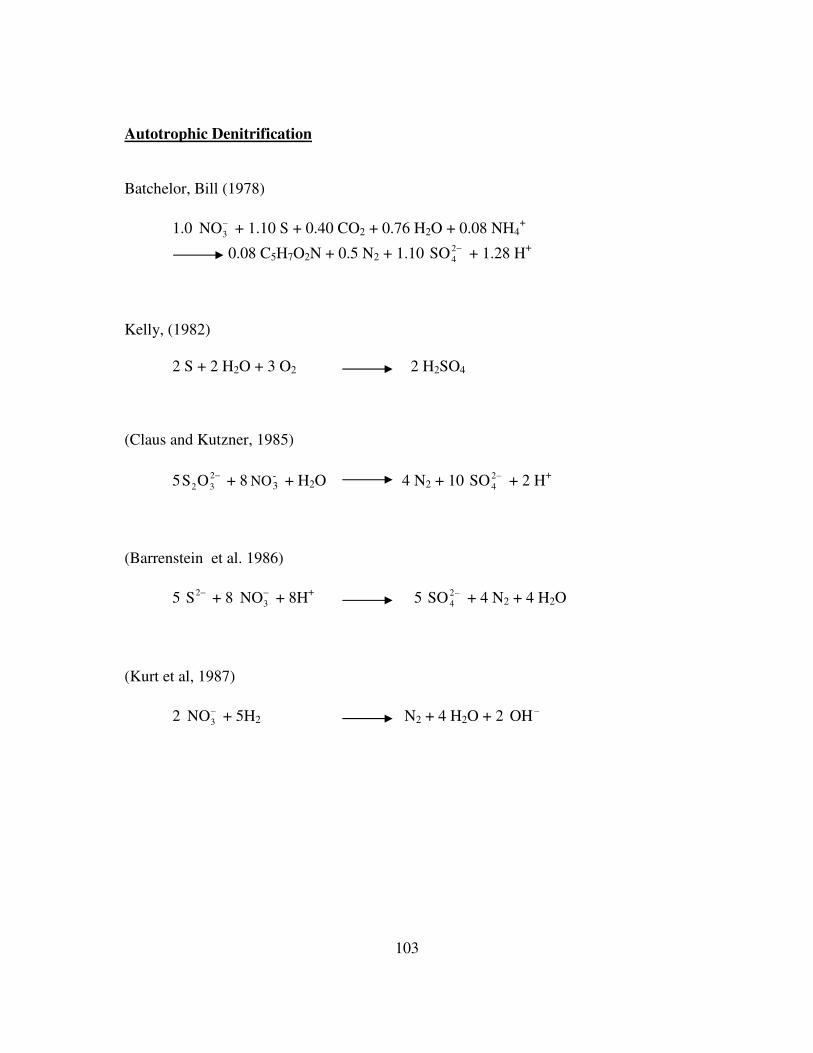
103
Autotrophic Denitrification
Batchelor, Bill (1978)
1.0 −3NO + 1.10 S + 0.40 CO2 + 0.76 H2O + 0.08 NH4
+
0.08 C5H7O2N + 0.5 N2 + 1.10 −24SO + 1.28 H+
Kelly, (1982)
2 S + 2 H2O + 3 O2 2 H2SO4
(Claus and Kutzner, 1985)
5 −232OS + 8 -
3NO + H2O 4 N2 + 10 −24SO + 2 H+
(Barrenstein et al. 1986)
5 −2S + 8 −3NO + 8H+ 5 −2
4SO + 4 N2 + 4 H2O
(Kurt et al, 1987)
2 −3NO + 5H2 N2 + 4 H2O + 2 −OH
104
APPENDIX B
USEFUL HALF-REACTIONS INVOLVED IN BIOLOGICAL SYSTEMS
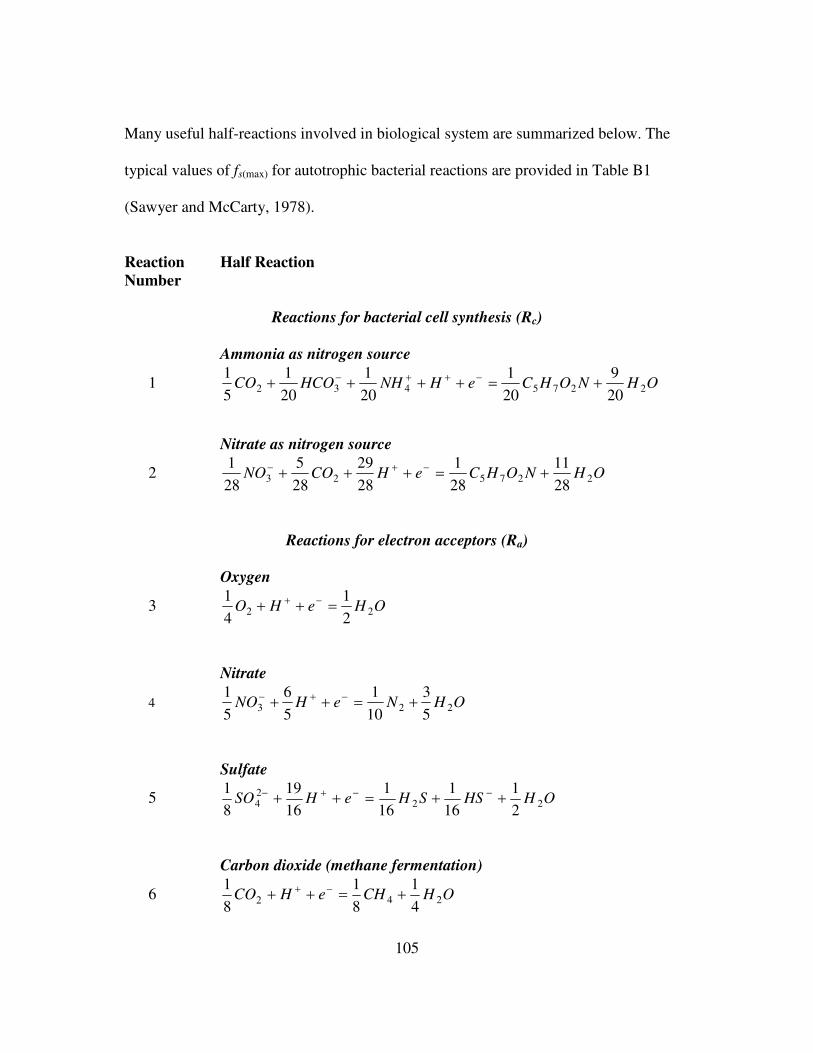
105
Many useful half-reactions involved in biological system are summarized below. The
typical values of fs(max) for autotrophic bacterial reactions are provided in Table B1
(Sawyer and McCarty, 1978).
Reaction Half ReactionNumber
Reactions for bacterial cell synthesis (Rc)
Ammonia as nitrogen source
1 OHNOHCeHNHHCOCO 2275432 20
9
20
1
20
1
20
1
5
1+=++++ −++−
Nitrate as nitrogen source
2 OHNOHCeHCONO 227523 28
11
28
1
28
29
28
5
28
1+=+++ −+−
Reactions for electron acceptors (Ra)
Oxygen
3 OHeHO 22 2
1
4
1=++ −+
Nitrate
4 OHNeHNO 223 5
3
10
1
5
6
5
1+=++ −+−
Sulfate
5 OHHSSHeHSO 2224 2
1
16
1
16
1
16
19
8
1++=++ −−+−
Carbon dioxide (methane fermentation)
6 OHCHeHCO 242 4
1
8
1
8
1+=++ −+
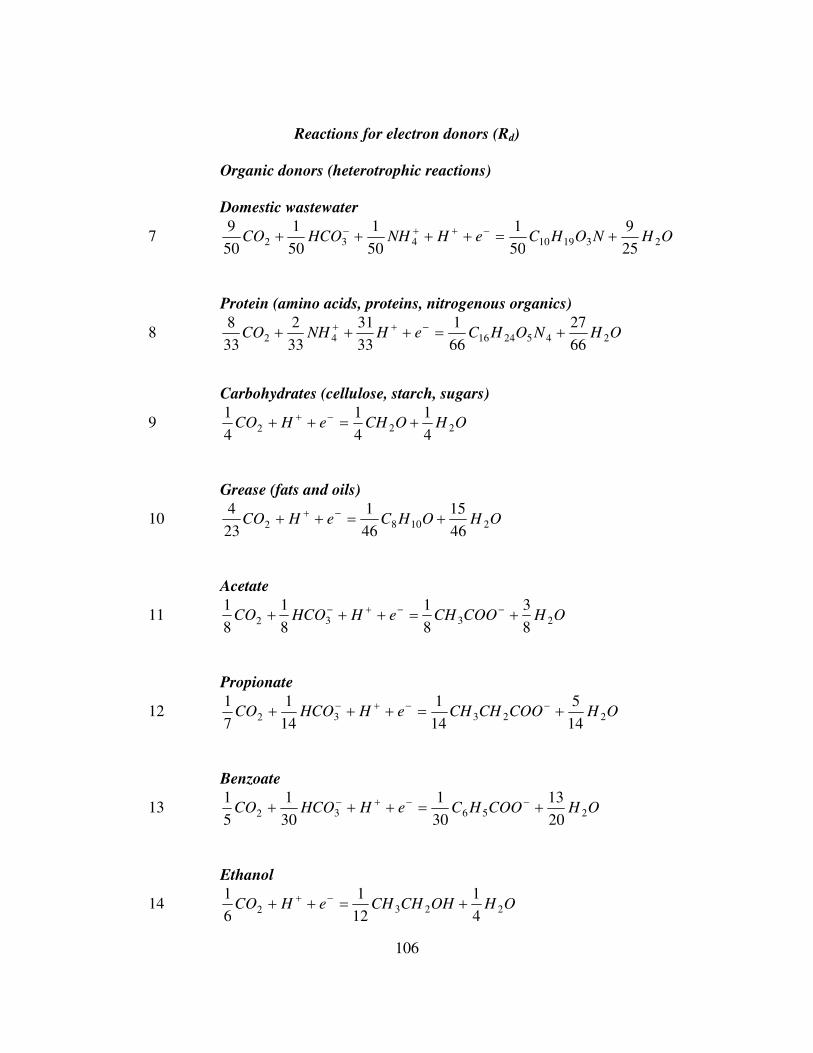
106
Reactions for electron donors (Rd)
Organic donors (heterotrophic reactions)
Domestic wastewater
7 OHNOHCeHNHHCOCO 231910432 25
9
50
1
50
1
50
1
50
9+=++++ −++−
Protein (amino acids, proteins, nitrogenous organics)
8 OHNOHCeHNHCO 245241642 66
27
66
1
33
31
33
2
33
8+=+++ −++
Carbohydrates (cellulose, starch, sugars)
9 OHOCHeHCO 222 4
1
4
1
4
1+=++ −+
Grease (fats and oils)
10 OHOHCeHCO 21082 46
15
46
1
23
4+=++ −+
Acetate
11 OHCOOCHeHHCOCO 2332 8
3
8
1
8
1
8
1+=+++ −−+−
Propionate
12 OHCOOCHCHeHHCOCO 22332 14
5
14
1
14
1
7
1+=+++ −−+−
Benzoate
13 OHCOOHCeHHCOCO 25632 20
13
30
1
30
1
5
1+=+++ −−+−
Ethanol
14 OHOHCHCHeHCO 2232 4
1
12
1
6
1+=++ −+
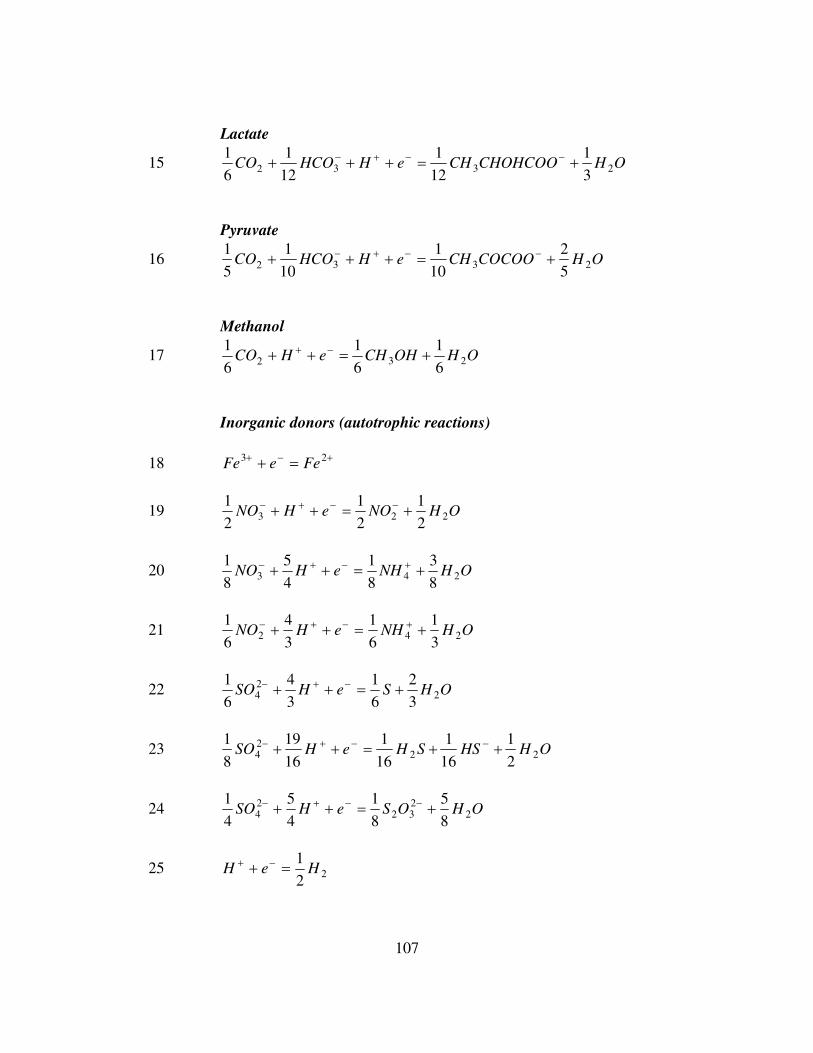
107
Lactate
15 OHCHOHCOOCHeHHCOCO 2332 3
1
12
1
12
1
6
1+=+++ −−+−
Pyruvate
16 OHCOCOOCHeHHCOCO 2332 5
2
10
1
10
1
5
1+=+++ −−+−
Methanol
17 OHOHCHeHCO 232 6
1
6
1
6
1+=++ −+
Inorganic donors (autotrophic reactions)
18 +−+ =+ 23 FeeFe
19 OHNOeHNO 223 2
1
2
1
2
1+=++ −−+−
20 OHNHeHNO 243 8
3
8
1
4
5
8
1+=++ +−+−
21 OHNHeHNO 242 3
1
6
1
3
4
6
1+=++ +−+−
22 OHSeHSO 224 3
2
6
1
3
4
6
1+=++ −+−
23 OHHSSHeHSO 2224 2
1
16
1
16
1
16
19
8
1++=++ −−+−
24 OHOSeHSO 2232
24 8
5
8
1
4
5
4
1+=++ −−+−
25 22
1HeH =+ −+
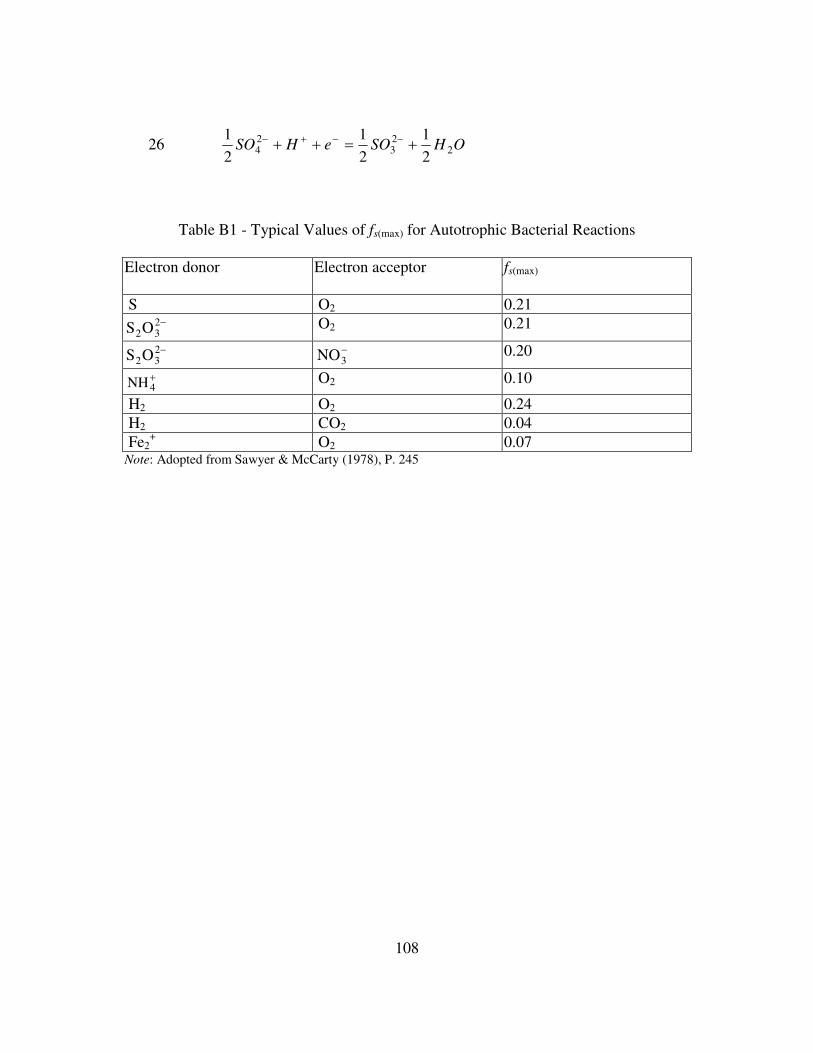
108
26 OHSOeHSO 223
24 2
1
2
1
2
1+=++ −−+−
Table B1 - Typical Values of fs(max) for Autotrophic Bacterial Reactions
Electron donor Electron acceptor fs(max)
S O2 0.21−2
32OS O2 0.21
−232OS −
3NO 0.20
+4NH O2 0.10
H2 O2 0.24H2 CO2 0.04Fe2
+ O2 0.07Note: Adopted from Sawyer & McCarty (1978), P. 245

109
APPENDIX C
PHYSICAL CHARACTERISTICS OF SULFUR MEDIA USED IN THIS
RESEARCH PROGRAM
110
The physical characteristics of sulfur media include density, void ratio and specific
surface area. These physical parameters were determined in the laboratory. Procedures
are given below.
Media Density
The media density was measured by the following procedures: (1) weigh a 250-mL
clean beaker, (2) take certain volume of granular sulfur into the beaker, (3) weigh the
beaker and sulfur, (4) measure equal volume of tap water in a 250-mL graduated
cylinder, (5) gradually transfer the sulfur from the beaker into the cylinder containing
the water, (6) measure the final water level after sulfur has been added, (7) calculate the
water volume replaced by sulfur, (8) determine the weight of sulfur, (9) calculate the
density of granular sulfur.
Void Ratio
The void ratio of the sulfur media was calculated by the following procedures: (1) fill
the granular sulfur into a 250-mL graduated cylinder to a certain volume, (2) fill a
second 250-mL graduated cylinder with tap water, (3) gradually pour the tap water from
the second graduated cylinder into the first graduated cylinder until the water level
reached to the top layer of the sulfur media, (4) determine the water volume filling the
voids, (5) calculate the void ratio.

111
Specific Surface Area
The specific surface area is defined as the ratio of the total surface area of the media and
the total volume of the media.
Assume average equivalent diameter of the sulfur media = d
Surface area = 2d××πφ
Where:
φ = shape factor. The shape factor is defined as the ratio of the surface area of an equal
volume of sphere to the surface area of the grain.
The media volume = 3)2
(3
4 d××π
The media diameter is the average grain size retained between the US Standard Sieve
#8 (2.38 mm) and #4 (4.76 mm).
mm3.572
mm4.76mm2.38=
+=d
Specific surface area = 323
3
2
/mm101.45mm3.57
60.866
)2
()3
4(
×=×
=×
=××
××dd
d φ
π
πφ

112
APPENDIX D
ANALYTICAL METHODS

113
The analytical procedures used in this investigation are the standard procedures as listed
in Table D1. Only the procedures of NNO3 −− and NNO2 −
− are adapted from the
literature. These procedures are briefly presented.
Table D1- Analytical Procedures
Determinations Analytical MethodspH Orion Scientific pH meter (Mode 920+)
with temperature compensationAlkalinity Standard Methods, 2320B, 18th Edition,
1992Sulfate Standard Methods, 4500E, 18th Edition,
1992Nitrate-N Salicyclic Sulfuric Acid Method (Cataldo,
et al., 1975)Nitrite-N HACH Water Analysis Handbook, 1992
Nitrate Determination by Salicylic Sulfuric Acid Method (Cataldo, et al. 1975)
Reagents:
1. 5% Salicylic-Sulfuric Acid Reagent
2. 4 N Sodium Hydroxide
3. Standard Nitrate (100 mg/L N)Procedures:
1. Pipet 0.4 mL sample solution into a reaction tube
2. Pipet 1.6 mL 5% Salicyclic-Sulfuric acid reagent into tube and swirl.
3. After 30 minutes, add 18.0 mL of 4N NaOH solution and swirl.

114
4. Allow contents to cool and read transmittance at a wavelength of 410
nm in the Spectronic-20D (Model 333183).
5. Read the nitrate concentration from the standard calibration curve
prepared on the same machine.
Nitrite Measurement (HACH Water Analysis Handbook, 1992)
Reagent
1. NitriVer 2 Nitrite Reagent Power Pillows (HACH)
2. Sodium Nitrite, ACS
Procedure
1. Filter through a 0.45-µm membrane filter to remove suspended solids.
2. Set wavelength at 585 nm in Spectronic-20D (Model 333183).
3. Fill a sample cell with 10 mL of sample.
4. Add the contents of one NitriVer 2 Nitrite Reagent Power Pillow, shake
to dissolve. A greenish-brown color will develop.
5. Read the transmittance after 10 min in the Spectronic-20D (Model
333183).
6. Read the nitrite concentration from the standard calibration curve
prepared on the same machine.
115
APPENDIX E
RAW EXPERIMENTAL DATA OF BATCH REACTOR STUDY
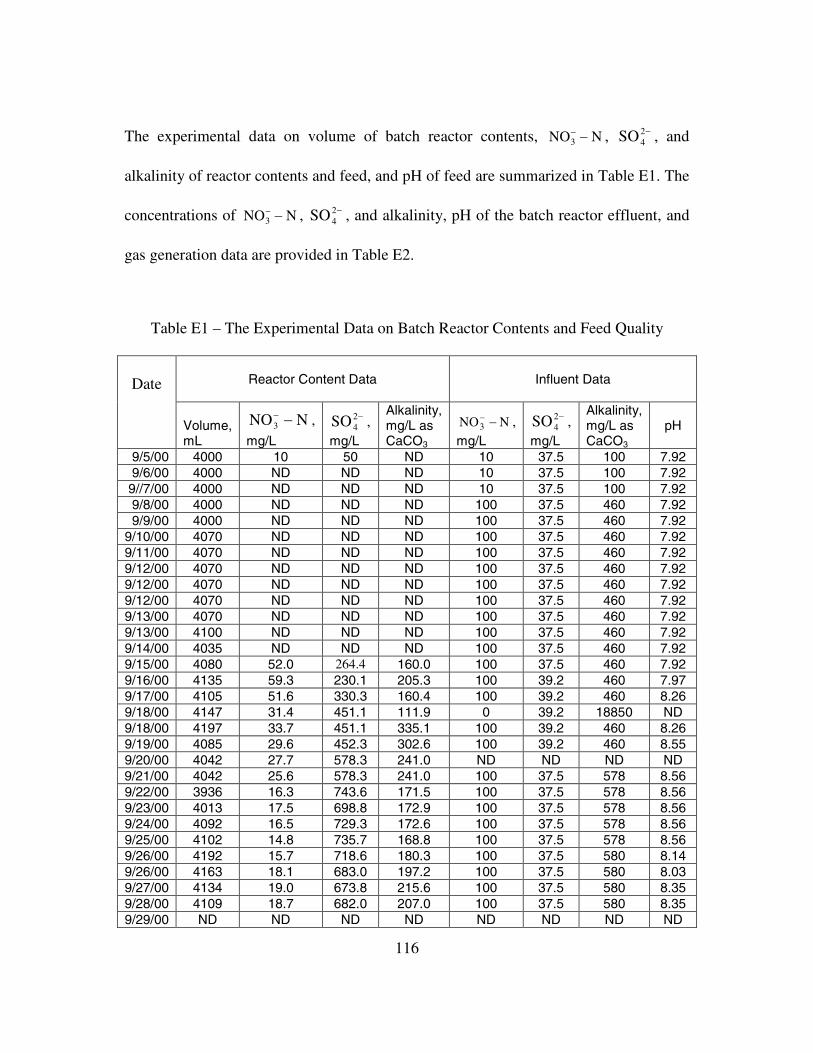
116
The experimental data on volume of batch reactor contents, NNO3 −− , −2
4SO , and
alkalinity of reactor contents and feed, and pH of feed are summarized in Table E1. The
concentrations of NNO3 −− , −2
4SO , and alkalinity, pH of the batch reactor effluent, and
gas generation data are provided in Table E2.
Table E1 – The Experimental Data on Batch Reactor Contents and Feed Quality
Reactor Content Data Influent DataDate
Volume,mL
NNO3 −− ,
mg/L
−24SO ,
mg/L
Alkalinity,mg/L asCaCO3
NNO3 −− ,
mg/L
−24SO ,
mg/L
Alkalinity,mg/L asCaCO3
pH
9/5/00 4000 10 50 ND 10 37.5 100 7.929/6/00 4000 ND ND ND 10 37.5 100 7.929//7/00 4000 ND ND ND 10 37.5 100 7.929/8/00 4000 ND ND ND 100 37.5 460 7.929/9/00 4000 ND ND ND 100 37.5 460 7.92
9/10/00 4070 ND ND ND 100 37.5 460 7.929/11/00 4070 ND ND ND 100 37.5 460 7.929/12/00 4070 ND ND ND 100 37.5 460 7.929/12/00 4070 ND ND ND 100 37.5 460 7.929/12/00 4070 ND ND ND 100 37.5 460 7.929/13/00 4070 ND ND ND 100 37.5 460 7.929/13/00 4100 ND ND ND 100 37.5 460 7.929/14/00 4035 ND ND ND 100 37.5 460 7.929/15/00 4080 52.0 264.4 160.0 100 37.5 460 7.929/16/00 4135 59.3 230.1 205.3 100 39.2 460 7.979/17/00 4105 51.6 330.3 160.4 100 39.2 460 8.269/18/00 4147 31.4 451.1 111.9 0 39.2 18850 ND9/18/00 4197 33.7 451.1 335.1 100 39.2 460 8.269/19/00 4085 29.6 452.3 302.6 100 39.2 460 8.559/20/00 4042 27.7 578.3 241.0 ND ND ND ND9/21/00 4042 25.6 578.3 241.0 100 37.5 578 8.569/22/00 3936 16.3 743.6 171.5 100 37.5 578 8.569/23/00 4013 17.5 698.8 172.9 100 37.5 578 8.569/24/00 4092 16.5 729.3 172.6 100 37.5 578 8.569/25/00 4102 14.8 735.7 168.8 100 37.5 578 8.569/26/00 4192 15.7 718.6 180.3 100 37.5 580 8.149/26/00 4163 18.1 683.0 197.2 100 37.5 580 8.039/27/00 4134 19.0 673.8 215.6 100 37.5 580 8.359/28/00 4109 18.7 682.0 207.0 100 37.5 580 8.359/29/00 ND ND ND ND ND ND ND ND
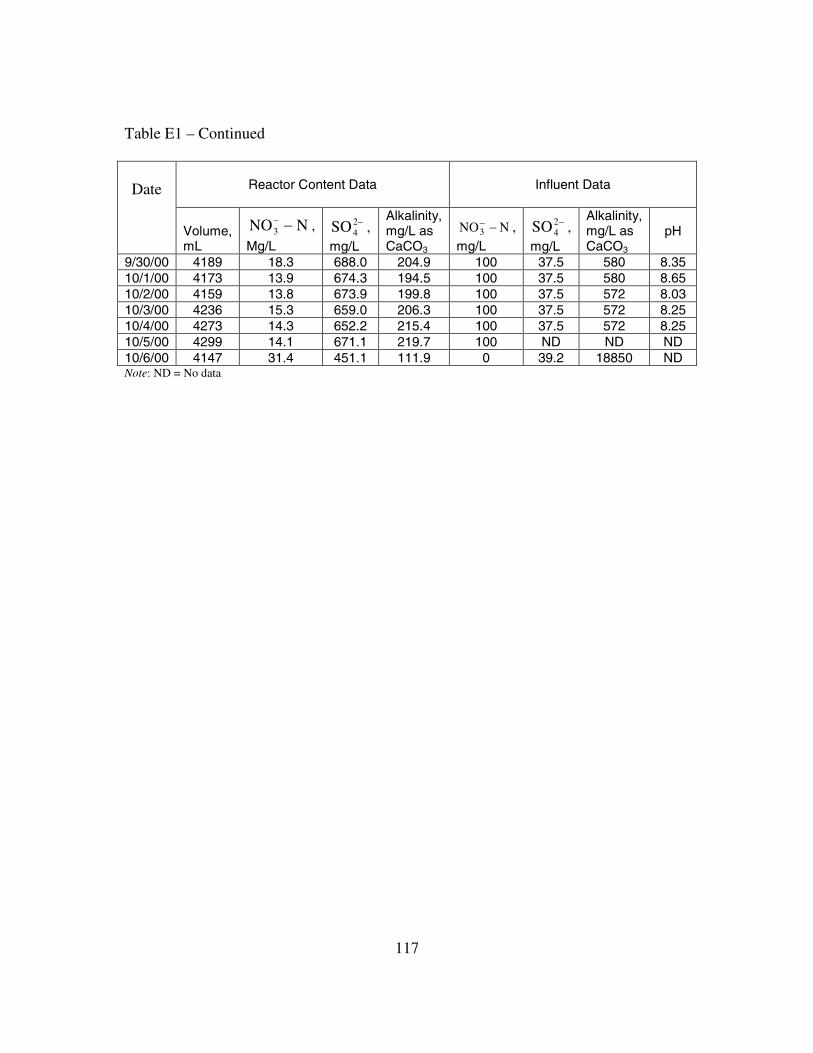
117
Table E1 – Continued
Reactor Content Data Influent DataDate
Volume,mL
NNO3 −− ,
Mg/L
−24SO ,
mg/L
Alkalinity,mg/L asCaCO3
NNO3 −− ,
mg/L
−24SO ,
mg/L
Alkalinity,mg/L asCaCO3
pH
9/30/00 4189 18.3 688.0 204.9 100 37.5 580 8.3510/1/00 4173 13.9 674.3 194.5 100 37.5 580 8.6510/2/00 4159 13.8 673.9 199.8 100 37.5 572 8.0310/3/00 4236 15.3 659.0 206.3 100 37.5 572 8.2510/4/00 4273 14.3 652.2 215.4 100 37.5 572 8.2510/5/00 4299 14.1 671.1 219.7 100 ND ND ND10/6/00 4147 31.4 451.1 111.9 0 39.2 18850 NDNote: ND = No data
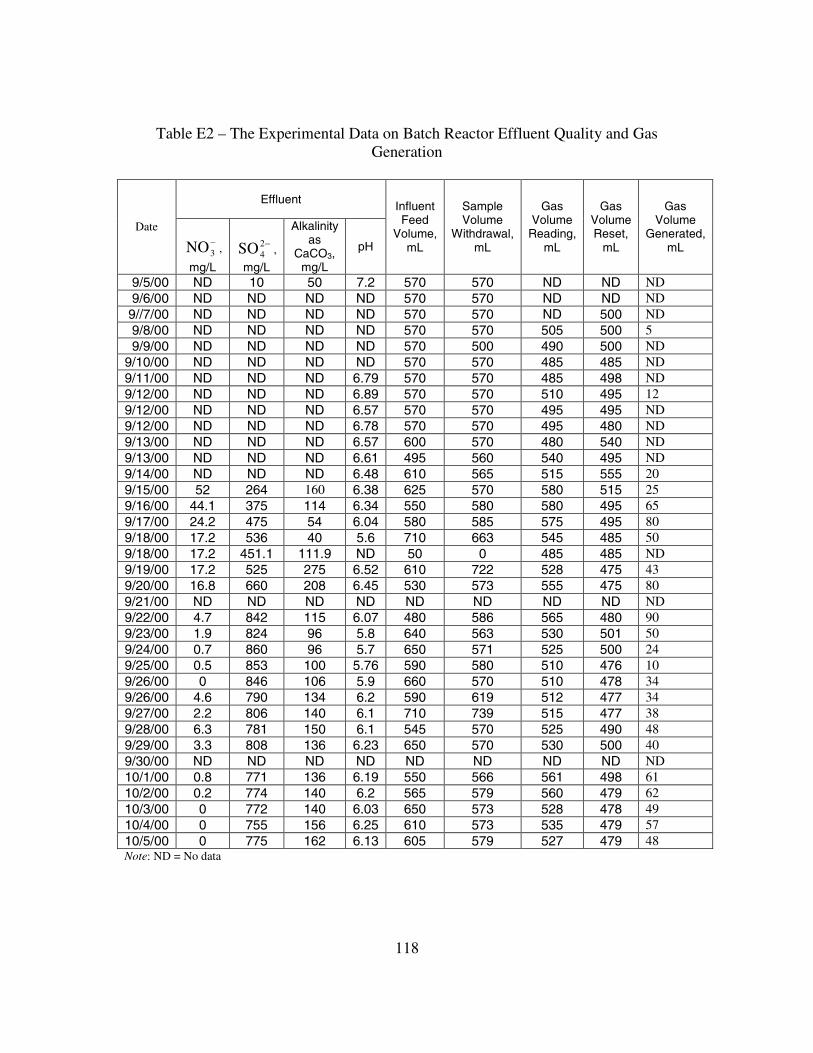
118
Table E2 – The Experimental Data on Batch Reactor Effluent Quality and GasGeneration
Effluent
Date−3NO ,
mg/L
−24SO ,
mg/L
Alkalinityas
CaCO3,mg/L
pH
InfluentFeed
Volume,mL
SampleVolume
Withdrawal,mL
GasVolume
Reading,mL
GasVolumeReset,
mL
GasVolume
Generated,mL
9/5/00 ND 10 50 7.2 570 570 ND ND ND9/6/00 ND ND ND ND 570 570 ND ND ND9//7/00 ND ND ND ND 570 570 ND 500 ND9/8/00 ND ND ND ND 570 570 505 500 59/9/00 ND ND ND ND 570 500 490 500 ND
9/10/00 ND ND ND ND 570 570 485 485 ND9/11/00 ND ND ND 6.79 570 570 485 498 ND9/12/00 ND ND ND 6.89 570 570 510 495 129/12/00 ND ND ND 6.57 570 570 495 495 ND9/12/00 ND ND ND 6.78 570 570 495 480 ND9/13/00 ND ND ND 6.57 600 570 480 540 ND9/13/00 ND ND ND 6.61 495 560 540 495 ND9/14/00 ND ND ND 6.48 610 565 515 555 209/15/00 52 264 160 6.38 625 570 580 515 259/16/00 44.1 375 114 6.34 550 580 580 495 659/17/00 24.2 475 54 6.04 580 585 575 495 809/18/00 17.2 536 40 5.6 710 663 545 485 509/18/00 17.2 451.1 111.9 ND 50 0 485 485 ND9/19/00 17.2 525 275 6.52 610 722 528 475 439/20/00 16.8 660 208 6.45 530 573 555 475 809/21/00 ND ND ND ND ND ND ND ND ND9/22/00 4.7 842 115 6.07 480 586 565 480 909/23/00 1.9 824 96 5.8 640 563 530 501 509/24/00 0.7 860 96 5.7 650 571 525 500 249/25/00 0.5 853 100 5.76 590 580 510 476 109/26/00 0 846 106 5.9 660 570 510 478 349/26/00 4.6 790 134 6.2 590 619 512 477 349/27/00 2.2 806 140 6.1 710 739 515 477 389/28/00 6.3 781 150 6.1 545 570 525 490 489/29/00 3.3 808 136 6.23 650 570 530 500 409/30/00 ND ND ND ND ND ND ND ND ND10/1/00 0.8 771 136 6.19 550 566 561 498 6110/2/00 0.2 774 140 6.2 565 579 560 479 6210/3/00 0 772 140 6.03 650 573 528 478 4910/4/00 0 755 156 6.25 610 573 535 479 5710/5/00 0 775 162 6.13 605 579 527 479 48Note: ND = No data

119
APPENDIX F
RAW EXPERIMENTAL DATA OF SULFUR-PACKED CONTINUOUS UP-FLOW
REACTOR STUDY

120
The experimental results on the influent and effluent quality from different sampling
ports of sulfur-packed up-flow reactor are summarized in this appendix. The NNO3 −− ,
NNO2 −− , alkalinity, sulfate, pH, and temperature data are provided separately in
Tables F1 through F6 respectively.
Table F1 - Experimental Data of NNO3 −− Concentration in the Influent and Effluent
from Different Ports of the Sulfur-Packed Continuous Up-Flow Reactor
NNO3 −− Concentration, mg/L
Effluent from Sampling Ports RemarksDate InfluentS-1 S-2 S-3 S-4 S-5 S-6
1/30/2001 50.1 14.6 9.9 8.2 6.6 6.6 6.6 TD1/31/2001 50.3 11.8 3.0 2.3 2.4 1.7 1.72/1/2001 50.3 14.4 2.5 1.1 1.1 0.7 0.42/2/2001 50.3 12.0 1.1 0.5 0.2 0.3 0.42/3/2001 ND2/4/2001 50.3 13.7 3.6 1.2 0.60 0.52 0.52/5/2001 51.4 10.2 2.1 0.6 < 0.1 < 0.1 < 0.12/6/2001 50.4 9.0 0.4 0.2 < 0.1 < 0.1 0.22/7/2001 50.4 8.3 0.1 0.1 0.1 0.1 0.12/8/2001 68.3 23.0 1.3 0.3 0.3 0.3 0.3 TD2/9/2001 70.6 20.5 < 0.1 < 0.1 < 0.1 < 0.1 < 0.12/10/2001 70.6 16.7 < 0.1 < 0.1 < 0.1 < 0.1 < 0.12/11/2001 ND2/12/2001 68.3 11.8 0.3 0.1 0.1 0.1 0.12/13/2001 71.3 5.3 0.1 0.1 < 0.1 < 0.1 0.12/14/2001 70.9 10.1 0.4 0.4 0.2 0.2 0.22/15/2001 70.9 7.5 0.5 0.2 0.2 0.2 0.22/16/2001 73.7 5.1 0.2 0.2 0.1 0.2 0.22/17/2001 69.0 6.4 0.3 0.4 0.4 0.4 0.42/18/2001 71.6 8.0 < 0.1 < 0.1 < 0.1 < 0.1 < 0.12/19/2001 71.6 5.6 < 0.1 < 0.1 < 0.1 < 0.1 < 0.12/20/2001 71.6 7.0 < 0.1 < 0.1 < 0.1 < 0.1 < 0.12/21/2001 91.1 16.0 2.3 < 0.1 < 0.1 < 0.1 < 0.1 TD2/22/2001 93.6 16.3 4.0 1.2 0.4 0.5 0.5 TD2/23/2001 91.8 16.5 3.2 1.5 0.4 0.5 0.3 TD2/24/2001 92.1 16.3 4.2 1.5 0.7 0.2 0.2 TD2/25/2001 ND2/26/2001 ND2/27/2001 93.9 9.0 0.3 0.2 0.2 0.2 0.32/28/2001 93.9 5.9 0.2 0.3 0.1 0.3 0.2
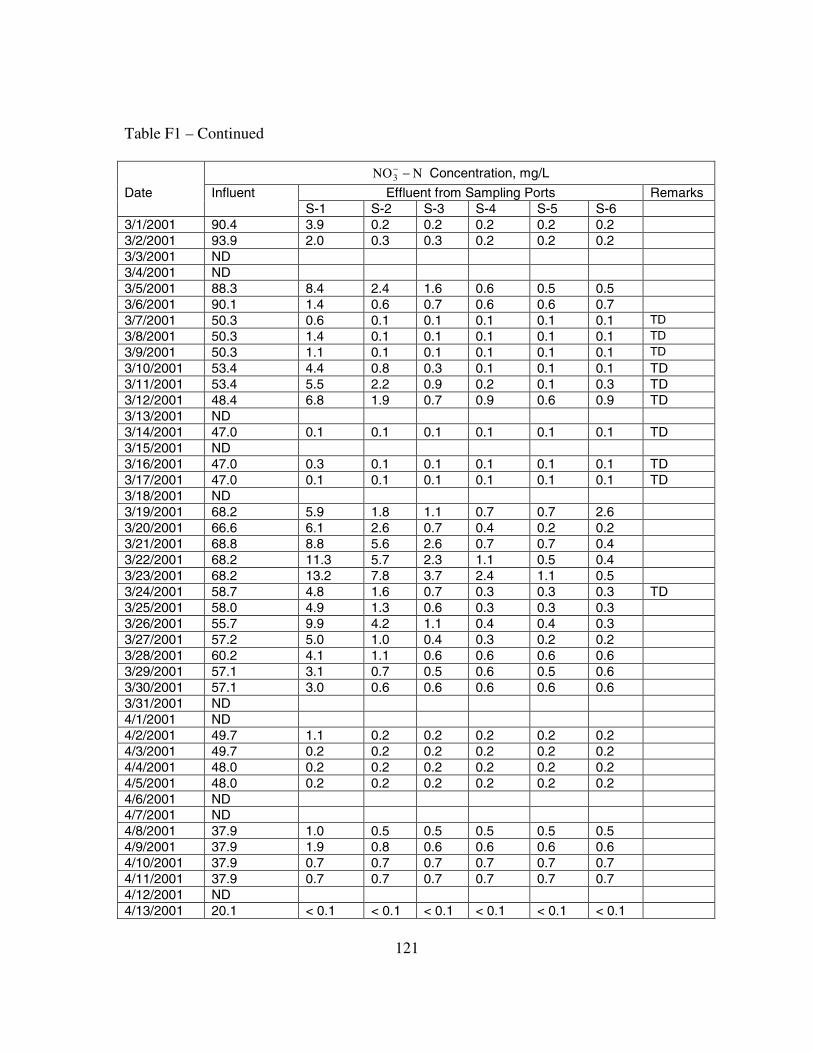
121
Table F1 – Continued
NNO3 −− Concentration, mg/L
Effluent from Sampling Ports RemarksDate InfluentS-1 S-2 S-3 S-4 S-5 S-6
3/1/2001 90.4 3.9 0.2 0.2 0.2 0.2 0.23/2/2001 93.9 2.0 0.3 0.3 0.2 0.2 0.23/3/2001 ND3/4/2001 ND3/5/2001 88.3 8.4 2.4 1.6 0.6 0.5 0.53/6/2001 90.1 1.4 0.6 0.7 0.6 0.6 0.73/7/2001 50.3 0.6 0.1 0.1 0.1 0.1 0.1 TD3/8/2001 50.3 1.4 0.1 0.1 0.1 0.1 0.1 TD3/9/2001 50.3 1.1 0.1 0.1 0.1 0.1 0.1 TD3/10/2001 53.4 4.4 0.8 0.3 0.1 0.1 0.1 TD3/11/2001 53.4 5.5 2.2 0.9 0.2 0.1 0.3 TD3/12/2001 48.4 6.8 1.9 0.7 0.9 0.6 0.9 TD3/13/2001 ND3/14/2001 47.0 0.1 0.1 0.1 0.1 0.1 0.1 TD3/15/2001 ND3/16/2001 47.0 0.3 0.1 0.1 0.1 0.1 0.1 TD3/17/2001 47.0 0.1 0.1 0.1 0.1 0.1 0.1 TD3/18/2001 ND3/19/2001 68.2 5.9 1.8 1.1 0.7 0.7 2.63/20/2001 66.6 6.1 2.6 0.7 0.4 0.2 0.23/21/2001 68.8 8.8 5.6 2.6 0.7 0.7 0.43/22/2001 68.2 11.3 5.7 2.3 1.1 0.5 0.43/23/2001 68.2 13.2 7.8 3.7 2.4 1.1 0.53/24/2001 58.7 4.8 1.6 0.7 0.3 0.3 0.3 TD3/25/2001 58.0 4.9 1.3 0.6 0.3 0.3 0.33/26/2001 55.7 9.9 4.2 1.1 0.4 0.4 0.33/27/2001 57.2 5.0 1.0 0.4 0.3 0.2 0.23/28/2001 60.2 4.1 1.1 0.6 0.6 0.6 0.63/29/2001 57.1 3.1 0.7 0.5 0.6 0.5 0.63/30/2001 57.1 3.0 0.6 0.6 0.6 0.6 0.63/31/2001 ND4/1/2001 ND4/2/2001 49.7 1.1 0.2 0.2 0.2 0.2 0.24/3/2001 49.7 0.2 0.2 0.2 0.2 0.2 0.24/4/2001 48.0 0.2 0.2 0.2 0.2 0.2 0.24/5/2001 48.0 0.2 0.2 0.2 0.2 0.2 0.24/6/2001 ND4/7/2001 ND4/8/2001 37.9 1.0 0.5 0.5 0.5 0.5 0.54/9/2001 37.9 1.9 0.8 0.6 0.6 0.6 0.64/10/2001 37.9 0.7 0.7 0.7 0.7 0.7 0.74/11/2001 37.9 0.7 0.7 0.7 0.7 0.7 0.74/12/2001 ND4/13/2001 20.1 < 0.1 < 0.1 < 0.1 < 0.1 < 0.1 < 0.1
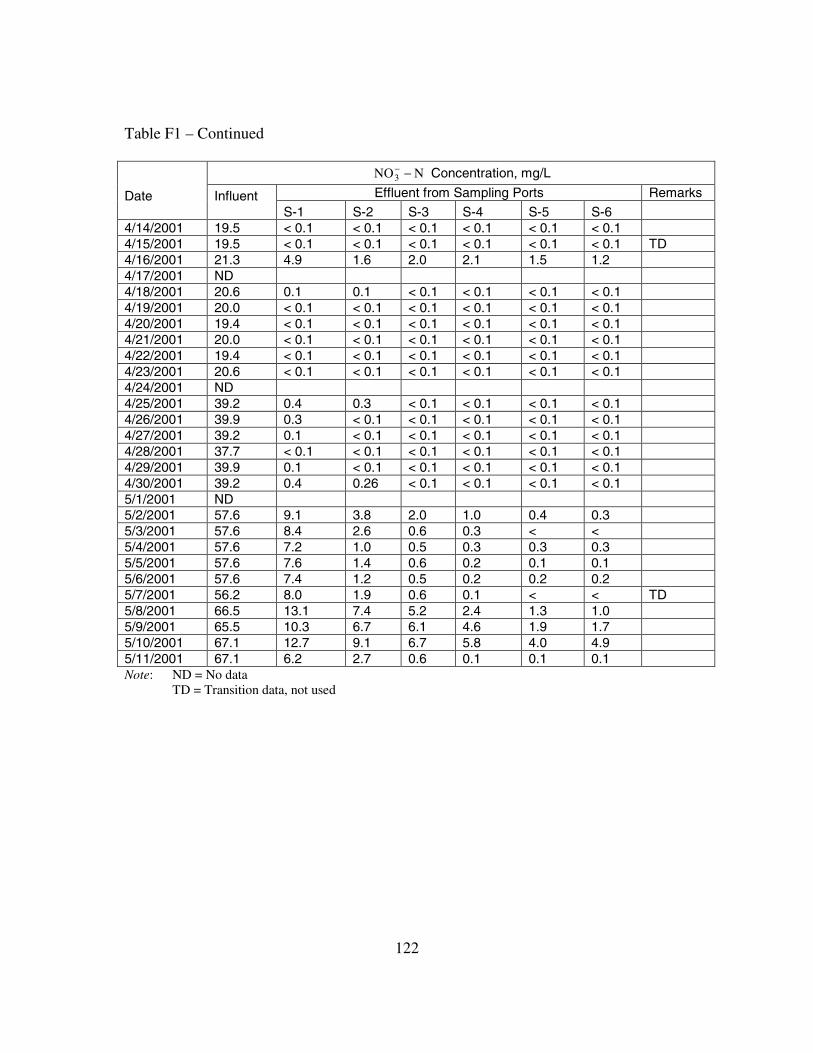
122
Table F1 – Continued
NNO3 −− Concentration, mg/L
Effluent from Sampling Ports RemarksDate InfluentS-1 S-2 S-3 S-4 S-5 S-6
4/14/2001 19.5 < 0.1 < 0.1 < 0.1 < 0.1 < 0.1 < 0.14/15/2001 19.5 < 0.1 < 0.1 < 0.1 < 0.1 < 0.1 < 0.1 TD4/16/2001 21.3 4.9 1.6 2.0 2.1 1.5 1.24/17/2001 ND4/18/2001 20.6 0.1 0.1 < 0.1 < 0.1 < 0.1 < 0.14/19/2001 20.0 < 0.1 < 0.1 < 0.1 < 0.1 < 0.1 < 0.14/20/2001 19.4 < 0.1 < 0.1 < 0.1 < 0.1 < 0.1 < 0.14/21/2001 20.0 < 0.1 < 0.1 < 0.1 < 0.1 < 0.1 < 0.14/22/2001 19.4 < 0.1 < 0.1 < 0.1 < 0.1 < 0.1 < 0.14/23/2001 20.6 < 0.1 < 0.1 < 0.1 < 0.1 < 0.1 < 0.14/24/2001 ND4/25/2001 39.2 0.4 0.3 < 0.1 < 0.1 < 0.1 < 0.14/26/2001 39.9 0.3 < 0.1 < 0.1 < 0.1 < 0.1 < 0.14/27/2001 39.2 0.1 < 0.1 < 0.1 < 0.1 < 0.1 < 0.14/28/2001 37.7 < 0.1 < 0.1 < 0.1 < 0.1 < 0.1 < 0.14/29/2001 39.9 0.1 < 0.1 < 0.1 < 0.1 < 0.1 < 0.14/30/2001 39.2 0.4 0.26 < 0.1 < 0.1 < 0.1 < 0.15/1/2001 ND5/2/2001 57.6 9.1 3.8 2.0 1.0 0.4 0.35/3/2001 57.6 8.4 2.6 0.6 0.3 < <5/4/2001 57.6 7.2 1.0 0.5 0.3 0.3 0.35/5/2001 57.6 7.6 1.4 0.6 0.2 0.1 0.15/6/2001 57.6 7.4 1.2 0.5 0.2 0.2 0.25/7/2001 56.2 8.0 1.9 0.6 0.1 < < TD5/8/2001 66.5 13.1 7.4 5.2 2.4 1.3 1.05/9/2001 65.5 10.3 6.7 6.1 4.6 1.9 1.75/10/2001 67.1 12.7 9.1 6.7 5.8 4.0 4.95/11/2001 67.1 6.2 2.7 0.6 0.1 0.1 0.1Note: ND = No data
TD = Transition data, not used
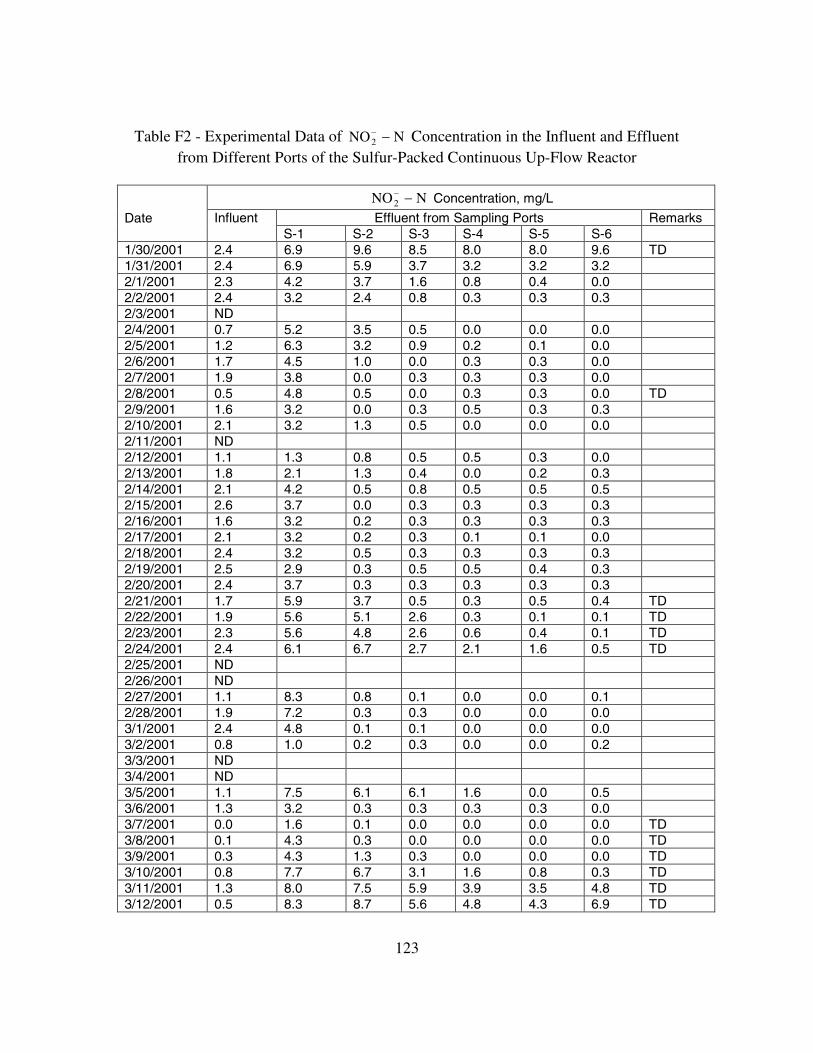
123
Table F2 - Experimental Data of NNO2 −− Concentration in the Influent and Effluent
from Different Ports of the Sulfur-Packed Continuous Up-Flow Reactor
NNO2 −− Concentration, mg/L
Effluent from Sampling Ports RemarksDate InfluentS-1 S-2 S-3 S-4 S-5 S-6
1/30/2001 2.4 6.9 9.6 8.5 8.0 8.0 9.6 TD1/31/2001 2.4 6.9 5.9 3.7 3.2 3.2 3.22/1/2001 2.3 4.2 3.7 1.6 0.8 0.4 0.02/2/2001 2.4 3.2 2.4 0.8 0.3 0.3 0.32/3/2001 ND2/4/2001 0.7 5.2 3.5 0.5 0.0 0.0 0.02/5/2001 1.2 6.3 3.2 0.9 0.2 0.1 0.02/6/2001 1.7 4.5 1.0 0.0 0.3 0.3 0.02/7/2001 1.9 3.8 0.0 0.3 0.3 0.3 0.02/8/2001 0.5 4.8 0.5 0.0 0.3 0.3 0.0 TD2/9/2001 1.6 3.2 0.0 0.3 0.5 0.3 0.32/10/2001 2.1 3.2 1.3 0.5 0.0 0.0 0.02/11/2001 ND2/12/2001 1.1 1.3 0.8 0.5 0.5 0.3 0.02/13/2001 1.8 2.1 1.3 0.4 0.0 0.2 0.32/14/2001 2.1 4.2 0.5 0.8 0.5 0.5 0.52/15/2001 2.6 3.7 0.0 0.3 0.3 0.3 0.32/16/2001 1.6 3.2 0.2 0.3 0.3 0.3 0.32/17/2001 2.1 3.2 0.2 0.3 0.1 0.1 0.02/18/2001 2.4 3.2 0.5 0.3 0.3 0.3 0.32/19/2001 2.5 2.9 0.3 0.5 0.5 0.4 0.32/20/2001 2.4 3.7 0.3 0.3 0.3 0.3 0.32/21/2001 1.7 5.9 3.7 0.5 0.3 0.5 0.4 TD2/22/2001 1.9 5.6 5.1 2.6 0.3 0.1 0.1 TD2/23/2001 2.3 5.6 4.8 2.6 0.6 0.4 0.1 TD2/24/2001 2.4 6.1 6.7 2.7 2.1 1.6 0.5 TD2/25/2001 ND2/26/2001 ND2/27/2001 1.1 8.3 0.8 0.1 0.0 0.0 0.12/28/2001 1.9 7.2 0.3 0.3 0.0 0.0 0.03/1/2001 2.4 4.8 0.1 0.1 0.0 0.0 0.03/2/2001 0.8 1.0 0.2 0.3 0.0 0.0 0.23/3/2001 ND3/4/2001 ND3/5/2001 1.1 7.5 6.1 6.1 1.6 0.0 0.53/6/2001 1.3 3.2 0.3 0.3 0.3 0.3 0.03/7/2001 0.0 1.6 0.1 0.0 0.0 0.0 0.0 TD3/8/2001 0.1 4.3 0.3 0.0 0.0 0.0 0.0 TD3/9/2001 0.3 4.3 1.3 0.3 0.0 0.0 0.0 TD3/10/2001 0.8 7.7 6.7 3.1 1.6 0.8 0.3 TD3/11/2001 1.3 8.0 7.5 5.9 3.9 3.5 4.8 TD3/12/2001 0.5 8.3 8.7 5.6 4.8 4.3 6.9 TD
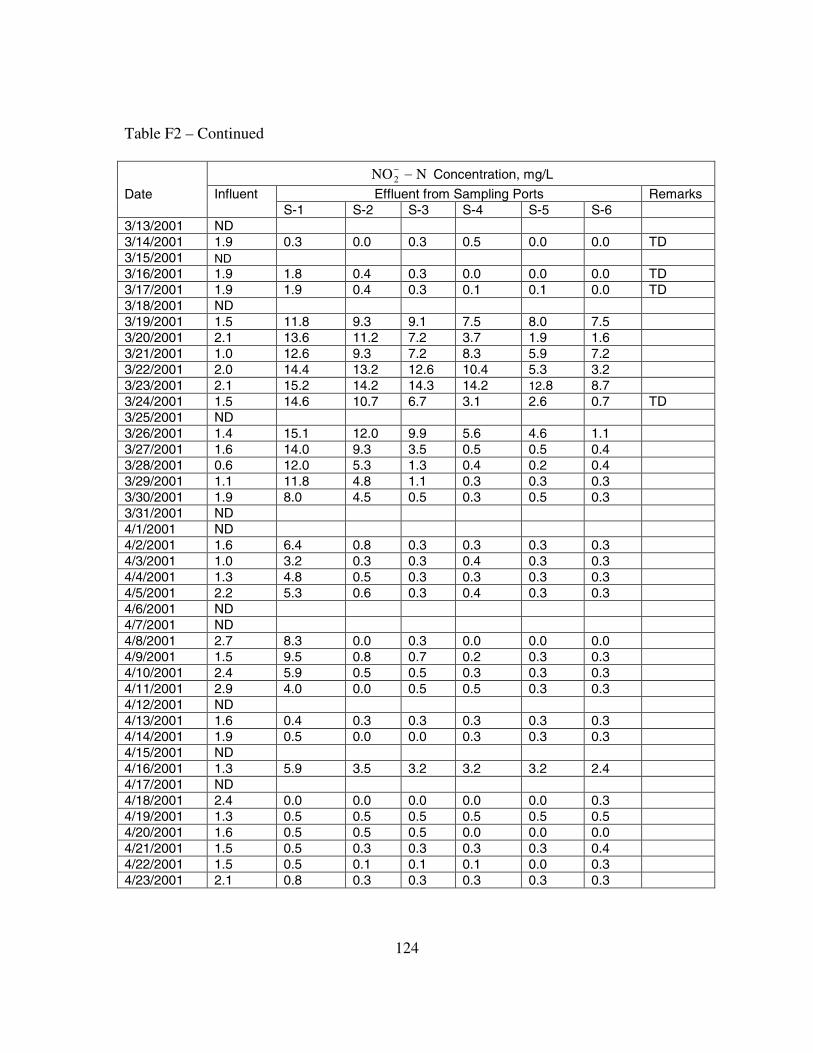
124
Table F2 – Continued
NNO2 −− Concentration, mg/L
Effluent from Sampling Ports RemarksDate InfluentS-1 S-2 S-3 S-4 S-5 S-6
3/13/2001 ND3/14/2001 1.9 0.3 0.0 0.3 0.5 0.0 0.0 TD3/15/2001 ND3/16/2001 1.9 1.8 0.4 0.3 0.0 0.0 0.0 TD3/17/2001 1.9 1.9 0.4 0.3 0.1 0.1 0.0 TD3/18/2001 ND3/19/2001 1.5 11.8 9.3 9.1 7.5 8.0 7.53/20/2001 2.1 13.6 11.2 7.2 3.7 1.9 1.63/21/2001 1.0 12.6 9.3 7.2 8.3 5.9 7.23/22/2001 2.0 14.4 13.2 12.6 10.4 5.3 3.23/23/2001 2.1 15.2 14.2 14.3 14.2 12.8 8.73/24/2001 1.5 14.6 10.7 6.7 3.1 2.6 0.7 TD3/25/2001 ND3/26/2001 1.4 15.1 12.0 9.9 5.6 4.6 1.13/27/2001 1.6 14.0 9.3 3.5 0.5 0.5 0.43/28/2001 0.6 12.0 5.3 1.3 0.4 0.2 0.43/29/2001 1.1 11.8 4.8 1.1 0.3 0.3 0.33/30/2001 1.9 8.0 4.5 0.5 0.3 0.5 0.33/31/2001 ND4/1/2001 ND4/2/2001 1.6 6.4 0.8 0.3 0.3 0.3 0.34/3/2001 1.0 3.2 0.3 0.3 0.4 0.3 0.34/4/2001 1.3 4.8 0.5 0.3 0.3 0.3 0.34/5/2001 2.2 5.3 0.6 0.3 0.4 0.3 0.34/6/2001 ND4/7/2001 ND4/8/2001 2.7 8.3 0.0 0.3 0.0 0.0 0.04/9/2001 1.5 9.5 0.8 0.7 0.2 0.3 0.34/10/2001 2.4 5.9 0.5 0.5 0.3 0.3 0.34/11/2001 2.9 4.0 0.0 0.5 0.5 0.3 0.34/12/2001 ND4/13/2001 1.6 0.4 0.3 0.3 0.3 0.3 0.34/14/2001 1.9 0.5 0.0 0.0 0.3 0.3 0.34/15/2001 ND4/16/2001 1.3 5.9 3.5 3.2 3.2 3.2 2.44/17/2001 ND4/18/2001 2.4 0.0 0.0 0.0 0.0 0.0 0.34/19/2001 1.3 0.5 0.5 0.5 0.5 0.5 0.54/20/2001 1.6 0.5 0.5 0.5 0.0 0.0 0.04/21/2001 1.5 0.5 0.3 0.3 0.3 0.3 0.44/22/2001 1.5 0.5 0.1 0.1 0.1 0.0 0.34/23/2001 2.1 0.8 0.3 0.3 0.3 0.3 0.3
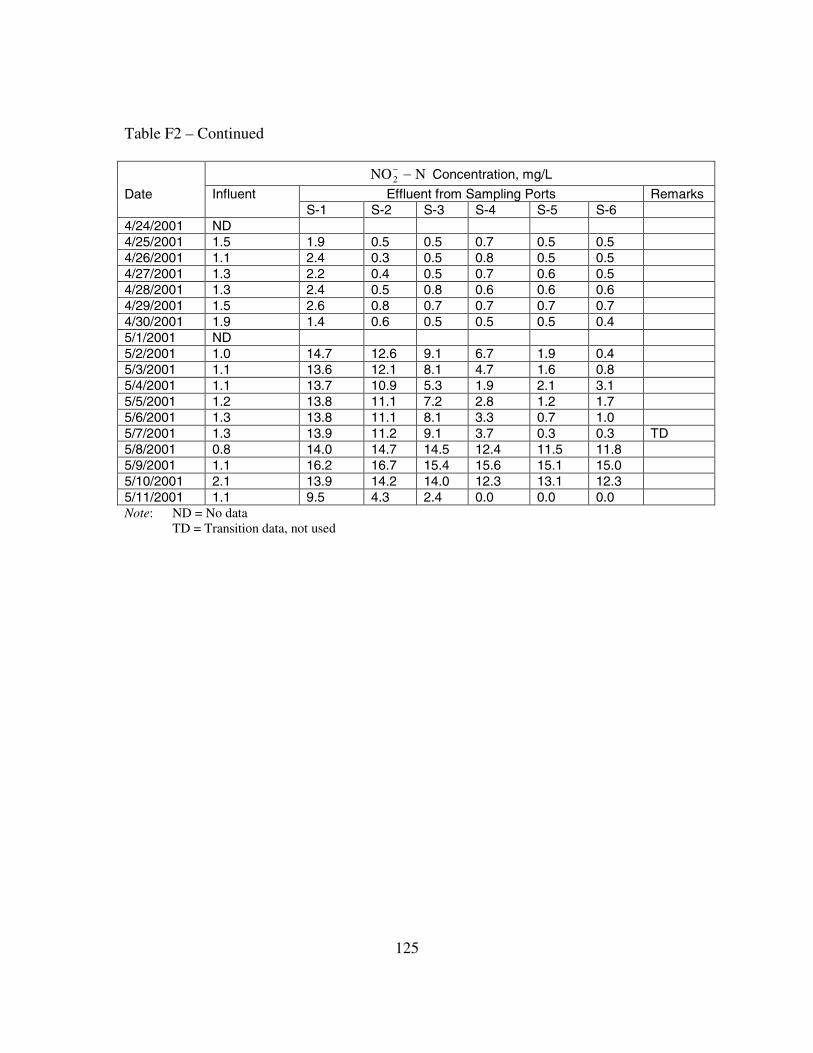
125
Table F2 – Continued
NNO2 −− Concentration, mg/L
Effluent from Sampling Ports RemarksDate InfluentS-1 S-2 S-3 S-4 S-5 S-6
4/24/2001 ND4/25/2001 1.5 1.9 0.5 0.5 0.7 0.5 0.54/26/2001 1.1 2.4 0.3 0.5 0.8 0.5 0.54/27/2001 1.3 2.2 0.4 0.5 0.7 0.6 0.54/28/2001 1.3 2.4 0.5 0.8 0.6 0.6 0.64/29/2001 1.5 2.6 0.8 0.7 0.7 0.7 0.74/30/2001 1.9 1.4 0.6 0.5 0.5 0.5 0.45/1/2001 ND5/2/2001 1.0 14.7 12.6 9.1 6.7 1.9 0.45/3/2001 1.1 13.6 12.1 8.1 4.7 1.6 0.85/4/2001 1.1 13.7 10.9 5.3 1.9 2.1 3.15/5/2001 1.2 13.8 11.1 7.2 2.8 1.2 1.75/6/2001 1.3 13.8 11.1 8.1 3.3 0.7 1.05/7/2001 1.3 13.9 11.2 9.1 3.7 0.3 0.3 TD5/8/2001 0.8 14.0 14.7 14.5 12.4 11.5 11.85/9/2001 1.1 16.2 16.7 15.4 15.6 15.1 15.05/10/2001 2.1 13.9 14.2 14.0 12.3 13.1 12.35/11/2001 1.1 9.5 4.3 2.4 0.0 0.0 0.0Note: ND = No data
TD = Transition data, not used

126
Table F3 - Experimental Data of Alkalinity Concentration in the Influent and Effluentfrom Different Ports of the Sulfur-Packed Continuous Up-Flow Reactor
Alkalinity Concentration, mg/L as CaCO3
Effluent from Sampling Ports RemarksDate InfluentS-1 S-2 S-3 S-4 S-5 S-6
1/29/2001 336 204 186 182 190 192 192 TD1/30/2001 332 200 181 180 180 180 182 TD1/31/2001 332 194 168 166 162 161 1642/1/2001 334 204 163 158 158 157 1542/2/2001 336 201 161 160 157 157 1502/3/2001 ND2/4/2001 336 201 174 162 160 159 1532/5/2001 340 198 172 164 161 160 1502/6/2001 336 192 161 160 160 158 1522/7/2001 334 192 156 156 154 154 1512/8/2001 437 285 198 190 194 194 185 TD2/9/2001 436 269 192 192 192 192 1852/10/2001 433 257 192 192 192 192 1842/11/2001 ND2/12/2001 440 238 191 191 191 191 1832/13/2001 437 211 187 187 187 187 1812/14/2001 438 220 186 187 187 187 1742/15/2001 438 214 186 186 186 186 1772/16/2001 437 208 186 190 188 188 1752/17/2001 440 210 190 191 190 190 1772/18/2001 438 214 188 190 187 190 1792/19/2001 438 212 192 192 192 190 1822/20/2001 434 214 193 193 193 193 1772/21/2001 442 193 154 143 146 148 139 TD2/22/2001 441 186 156 146 141 140 120 TD2/23/2001 437 188 153 142 142 140 128 TD2/24/2001 438 188 154 141 142 140 128 TD2/25/2001 ND2/26/2001 ND2/27/2001 540 258 232 232 229 228 2152/28/2001 539 259 235 235 234 231 2163/1/2001 532 243 230 232 235 234 2233/2/2001 541 237 230 233 231 228 2143/3/2001 ND3/4/2001 ND3/5/2001 541 270 252 254 245 240 2353/6/2001 542 243 235 241 240 242 2393/7/2001 342 165 158 159 158 157 151 TD3/8/2001 344 167 162 160 159 159 150 TD3/9/2001 341 170 162 162 160 158 153 TD3/10/2001 340 177 164 159 159 159 159 TD3/11/2001 340 184 172 165 163 161 160 TD3/12/2001 337 198 181 171 171 168 171 TD
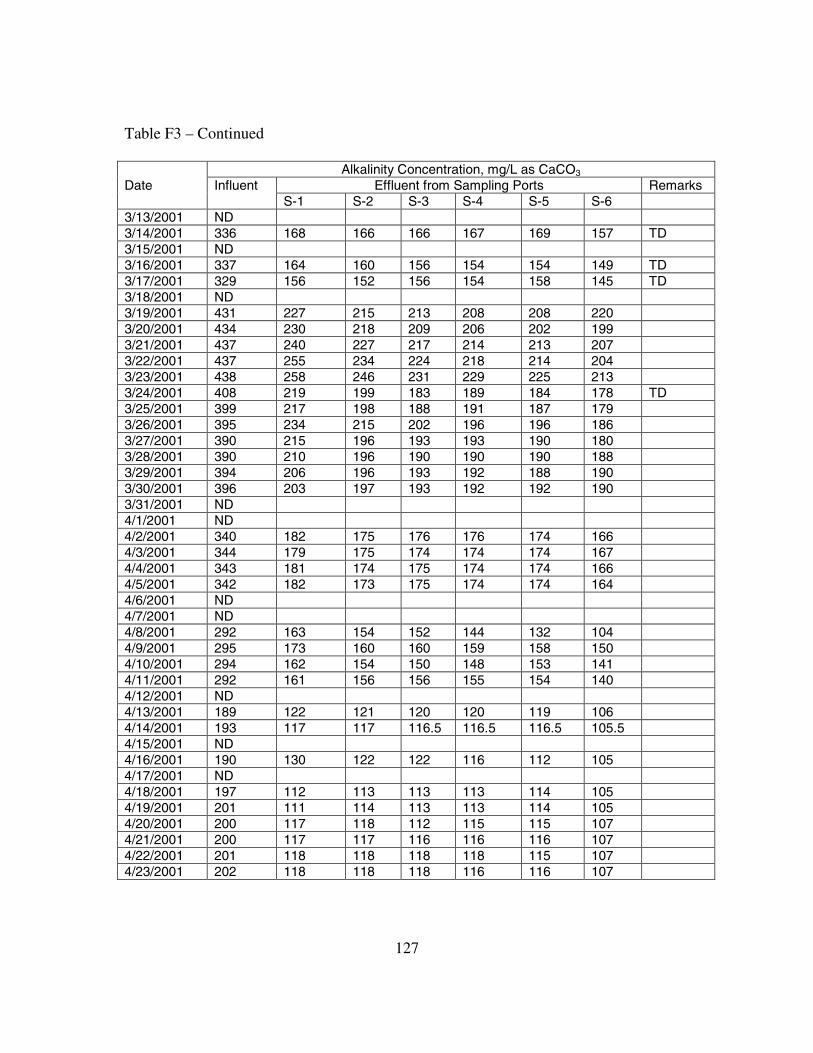
127
Table F3 – Continued
Alkalinity Concentration, mg/L as CaCO3
Effluent from Sampling Ports RemarksDate InfluentS-1 S-2 S-3 S-4 S-5 S-6
3/13/2001 ND3/14/2001 336 168 166 166 167 169 157 TD3/15/2001 ND3/16/2001 337 164 160 156 154 154 149 TD3/17/2001 329 156 152 156 154 158 145 TD3/18/2001 ND3/19/2001 431 227 215 213 208 208 2203/20/2001 434 230 218 209 206 202 1993/21/2001 437 240 227 217 214 213 2073/22/2001 437 255 234 224 218 214 2043/23/2001 438 258 246 231 229 225 2133/24/2001 408 219 199 183 189 184 178 TD3/25/2001 399 217 198 188 191 187 1793/26/2001 395 234 215 202 196 196 1863/27/2001 390 215 196 193 193 190 1803/28/2001 390 210 196 190 190 190 1883/29/2001 394 206 196 193 192 188 1903/30/2001 396 203 197 193 192 192 1903/31/2001 ND4/1/2001 ND4/2/2001 340 182 175 176 176 174 1664/3/2001 344 179 175 174 174 174 1674/4/2001 343 181 174 175 174 174 1664/5/2001 342 182 173 175 174 174 1644/6/2001 ND4/7/2001 ND4/8/2001 292 163 154 152 144 132 1044/9/2001 295 173 160 160 159 158 1504/10/2001 294 162 154 150 148 153 1414/11/2001 292 161 156 156 155 154 1404/12/2001 ND4/13/2001 189 122 121 120 120 119 1064/14/2001 193 117 117 116.5 116.5 116.5 105.54/15/2001 ND4/16/2001 190 130 122 122 116 112 1054/17/2001 ND4/18/2001 197 112 113 113 113 114 1054/19/2001 201 111 114 113 113 114 1054/20/2001 200 117 118 112 115 115 1074/21/2001 200 117 117 116 116 116 1074/22/2001 201 118 118 118 118 115 1074/23/2001 202 118 118 118 116 116 107
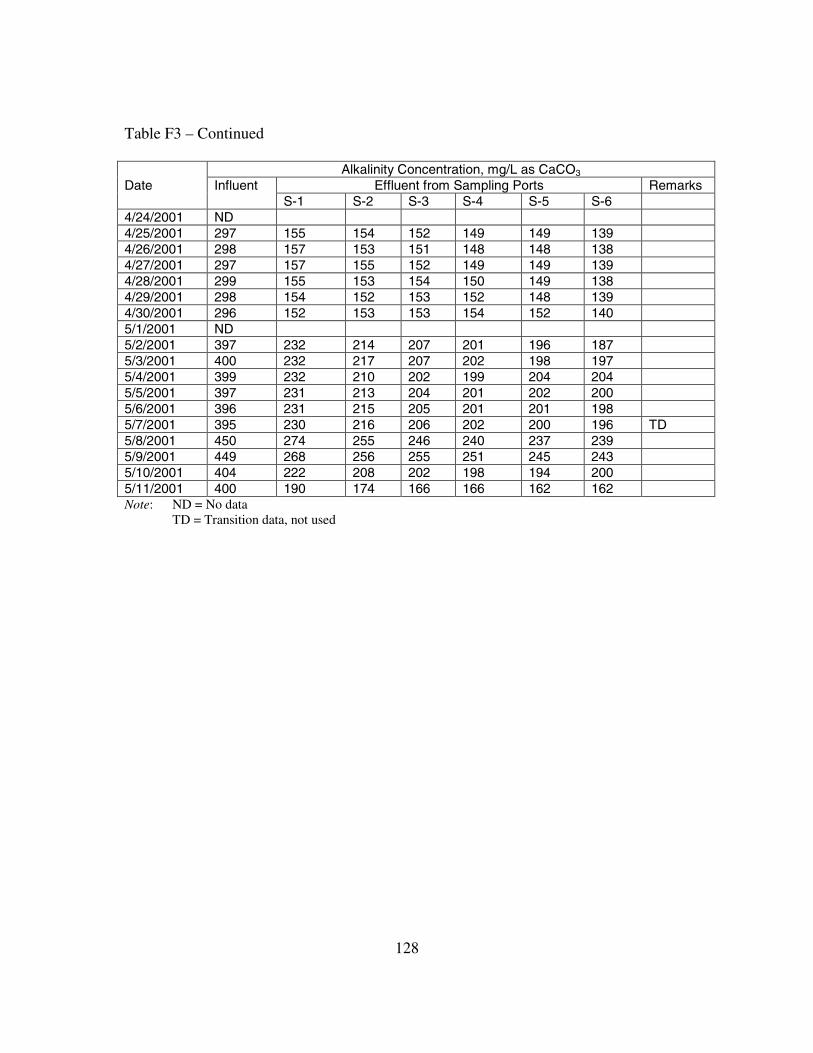
128
Table F3 – Continued
Alkalinity Concentration, mg/L as CaCO3
Effluent from Sampling Ports RemarksDate InfluentS-1 S-2 S-3 S-4 S-5 S-6
4/24/2001 ND4/25/2001 297 155 154 152 149 149 1394/26/2001 298 157 153 151 148 148 1384/27/2001 297 157 155 152 149 149 1394/28/2001 299 155 153 154 150 149 1384/29/2001 298 154 152 153 152 148 1394/30/2001 296 152 153 153 154 152 1405/1/2001 ND5/2/2001 397 232 214 207 201 196 1875/3/2001 400 232 217 207 202 198 1975/4/2001 399 232 210 202 199 204 2045/5/2001 397 231 213 204 201 202 2005/6/2001 396 231 215 205 201 201 1985/7/2001 395 230 216 206 202 200 196 TD5/8/2001 450 274 255 246 240 237 2395/9/2001 449 268 256 255 251 245 2435/10/2001 404 222 208 202 198 194 2005/11/2001 400 190 174 166 166 162 162Note: ND = No data
TD = Transition data, not used

129
Table F4 - Experimental Data of Sulfate Concentration in the Influent and Effluent fromDifferent Ports of the Sulfur-Packed Continuous Up-Flow Reactor
Sulfate Concentration, mg/L as -24SO
Effluent from Sampling Ports RemarksDate InfluentS-1 S-2 S-3 S-4 S-5 S-6
1/29/2001 33.4 279.6 333.4 309.9 323.9 310.8 TD1/30/2001 34.3 285.3 314.0 320.4 333.1 329.9 320.4 TD1/31/2001 36.5 307.6 377.7 384.1 387.2 384.1 384.12/1/2001 37.8 301.6 390.4 415.9 425.4 431.8 441.42/2/2001 37.1 323.6 425.4 435.0 438.2 454.1 454.12/3/2001 ND2/4/2001 38.4 298.1 384.1 422.3 422.3 441.4 435.02/5/2001 38.7 320.4 384.1 422.3 428.6 438.2 447.72/6/2001 38.7 336.3 422.3 438.2 444.6 425.4 438.22/7/2001 38.7 339.5 415.9 428.6 431.8 428.6 447.72/8/2001 41.3 339.5 519.7 551.6 551.6 551.6 557.9 TD2/9/2001 41.6 390.4 557.9 570.7 583.4 564.3 570.72/10/2001 42.2 425.4 570.7 570.7 577.1 583.4 602.52/11/2001 ND2/12/2001 43.2 448.4 558.6 580.9 573.9 568.1 584.12/13/2001 43.2 518.5 565.0 573.2 584.7 559.9 586.02/14/2001 42.9 494.3 570.7 574.5 568.1 584.1 622.32/15/2001 44.1 511.1 581.8 584.1 579.6 588.5 627.72/16/2001 45.4 528.0 593.0 593.6 591.1 593.0 633.12/17/2001 47.0 513.4 570.0 596.8 580.9 612.1 620.42/18/2001 46.4 487.3 568.1 579.6 586.0 595.5 586.62/19/2001 46.4 523.6 571.3 588.5 589.8 591.1 594.22/20/2001 44.8 509.5 571.3 582.8 581.5 588.5 605.72/21/2001 47.0 559.9 691.7 678.9 698.1 729.9 749.0 TD2/22/2001 48.6 603.8 671.3 736.3 742.6 729.9 761.7 TD2/23/2001 47.6 570.7 658.6 717.2 717.2 717.2 736.3 TD2/24/2001 48.0 564.3 628.0 678.9 698.1 710.8 717.2 TD2/25/2001 ND2/26/2001 ND2/27/2001 51.1 602.5 723.5 736.3 723.5 729.9 749.02/28/2001 51.1 659.8 710.8 729.9 736.3 736.3 755.43/1/2001 51.1 659.8 710.8 710.8 717.2 723.5 729.93/2/2001 50.5 691.7 729.9 717.2 710.8 717.2 749.03/3/2001 ND3/4/2001 ND3/5/2001 49.6 591.7 668.1 654.7 704.4 717.2 717.23/6/2001 50.5 672.6 691.7 717.2 742.6 723.5 710.83/7/2001 50.8 314.1 317.4 317.4 317.4 317.4 317.4 TD3/8/2001 50.5 312.5 320.9 320.9 320.9 320.9 320.9 TD3/9/2001 50.2 403.2 447.7 444.6 454.1 438.2 447.7 TD3/10/2001 52.2 358.6 400.0 438.2 447.7 447.7 454.1 TD3/11/2001 52.4 371.3 393.6 406.3 419.1 425.4 422.3 TD3/12/2001 50.6 349.0 380.9 406.3 406.3 419.1 406.3 TD
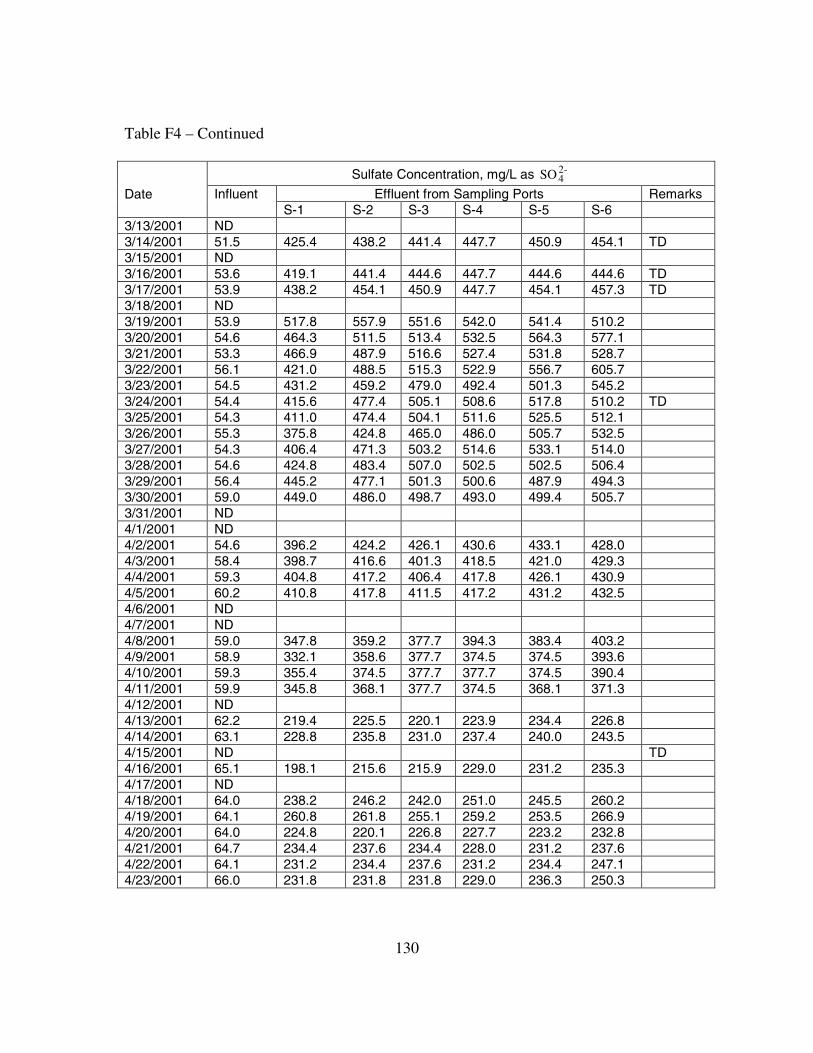
130
Table F4 – Continued
Sulfate Concentration, mg/L as -24SO
Effluent from Sampling Ports RemarksDate InfluentS-1 S-2 S-3 S-4 S-5 S-6
3/13/2001 ND3/14/2001 51.5 425.4 438.2 441.4 447.7 450.9 454.1 TD3/15/2001 ND3/16/2001 53.6 419.1 441.4 444.6 447.7 444.6 444.6 TD3/17/2001 53.9 438.2 454.1 450.9 447.7 454.1 457.3 TD3/18/2001 ND3/19/2001 53.9 517.8 557.9 551.6 542.0 541.4 510.23/20/2001 54.6 464.3 511.5 513.4 532.5 564.3 577.13/21/2001 53.3 466.9 487.9 516.6 527.4 531.8 528.73/22/2001 56.1 421.0 488.5 515.3 522.9 556.7 605.73/23/2001 54.5 431.2 459.2 479.0 492.4 501.3 545.23/24/2001 54.4 415.6 477.4 505.1 508.6 517.8 510.2 TD3/25/2001 54.3 411.0 474.4 504.1 511.6 525.5 512.13/26/2001 55.3 375.8 424.8 465.0 486.0 505.7 532.53/27/2001 54.3 406.4 471.3 503.2 514.6 533.1 514.03/28/2001 54.6 424.8 483.4 507.0 502.5 502.5 506.43/29/2001 56.4 445.2 477.1 501.3 500.6 487.9 494.33/30/2001 59.0 449.0 486.0 498.7 493.0 499.4 505.73/31/2001 ND4/1/2001 ND4/2/2001 54.6 396.2 424.2 426.1 430.6 433.1 428.04/3/2001 58.4 398.7 416.6 401.3 418.5 421.0 429.34/4/2001 59.3 404.8 417.2 406.4 417.8 426.1 430.94/5/2001 60.2 410.8 417.8 411.5 417.2 431.2 432.54/6/2001 ND4/7/2001 ND4/8/2001 59.0 347.8 359.2 377.7 394.3 383.4 403.24/9/2001 58.9 332.1 358.6 377.7 374.5 374.5 393.64/10/2001 59.3 355.4 374.5 377.7 377.7 374.5 390.44/11/2001 59.9 345.8 368.1 377.7 374.5 368.1 371.34/12/2001 ND4/13/2001 62.2 219.4 225.5 220.1 223.9 234.4 226.84/14/2001 63.1 228.8 235.8 231.0 237.4 240.0 243.54/15/2001 ND TD4/16/2001 65.1 198.1 215.6 215.9 229.0 231.2 235.34/17/2001 ND4/18/2001 64.0 238.2 246.2 242.0 251.0 245.5 260.24/19/2001 64.1 260.8 261.8 255.1 259.2 253.5 266.94/20/2001 64.0 224.8 220.1 226.8 227.7 223.2 232.84/21/2001 64.7 234.4 237.6 234.4 228.0 231.2 237.64/22/2001 64.1 231.2 234.4 237.6 231.2 234.4 247.14/23/2001 66.0 231.8 231.8 231.8 229.0 236.3 250.3
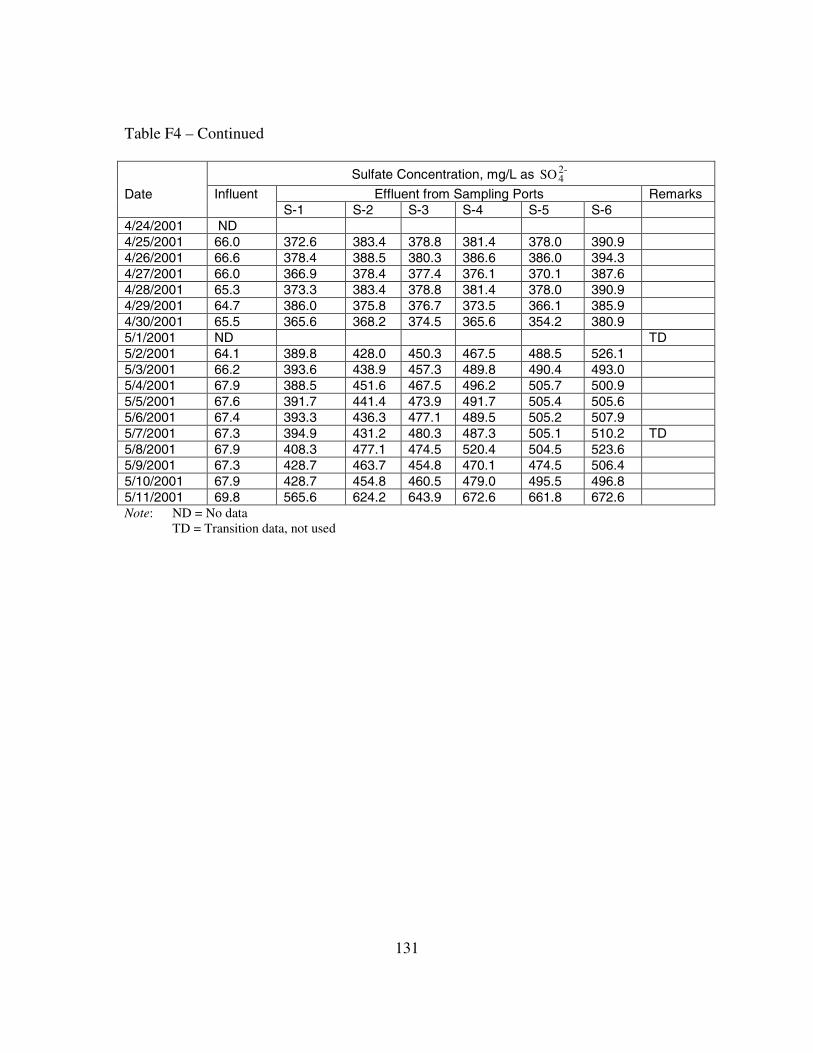
131
Table F4 – Continued
Sulfate Concentration, mg/L as -24SO
Effluent from Sampling Ports RemarksDate InfluentS-1 S-2 S-3 S-4 S-5 S-6
4/24/2001 ND4/25/2001 66.0 372.6 383.4 378.8 381.4 378.0 390.94/26/2001 66.6 378.4 388.5 380.3 386.6 386.0 394.34/27/2001 66.0 366.9 378.4 377.4 376.1 370.1 387.64/28/2001 65.3 373.3 383.4 378.8 381.4 378.0 390.94/29/2001 64.7 386.0 375.8 376.7 373.5 366.1 385.94/30/2001 65.5 365.6 368.2 374.5 365.6 354.2 380.95/1/2001 ND TD5/2/2001 64.1 389.8 428.0 450.3 467.5 488.5 526.15/3/2001 66.2 393.6 438.9 457.3 489.8 490.4 493.05/4/2001 67.9 388.5 451.6 467.5 496.2 505.7 500.95/5/2001 67.6 391.7 441.4 473.9 491.7 505.4 505.65/6/2001 67.4 393.3 436.3 477.1 489.5 505.2 507.95/7/2001 67.3 394.9 431.2 480.3 487.3 505.1 510.2 TD5/8/2001 67.9 408.3 477.1 474.5 520.4 504.5 523.65/9/2001 67.3 428.7 463.7 454.8 470.1 474.5 506.45/10/2001 67.9 428.7 454.8 460.5 479.0 495.5 496.85/11/2001 69.8 565.6 624.2 643.9 672.6 661.8 672.6Note: ND = No data
TD = Transition data, not used
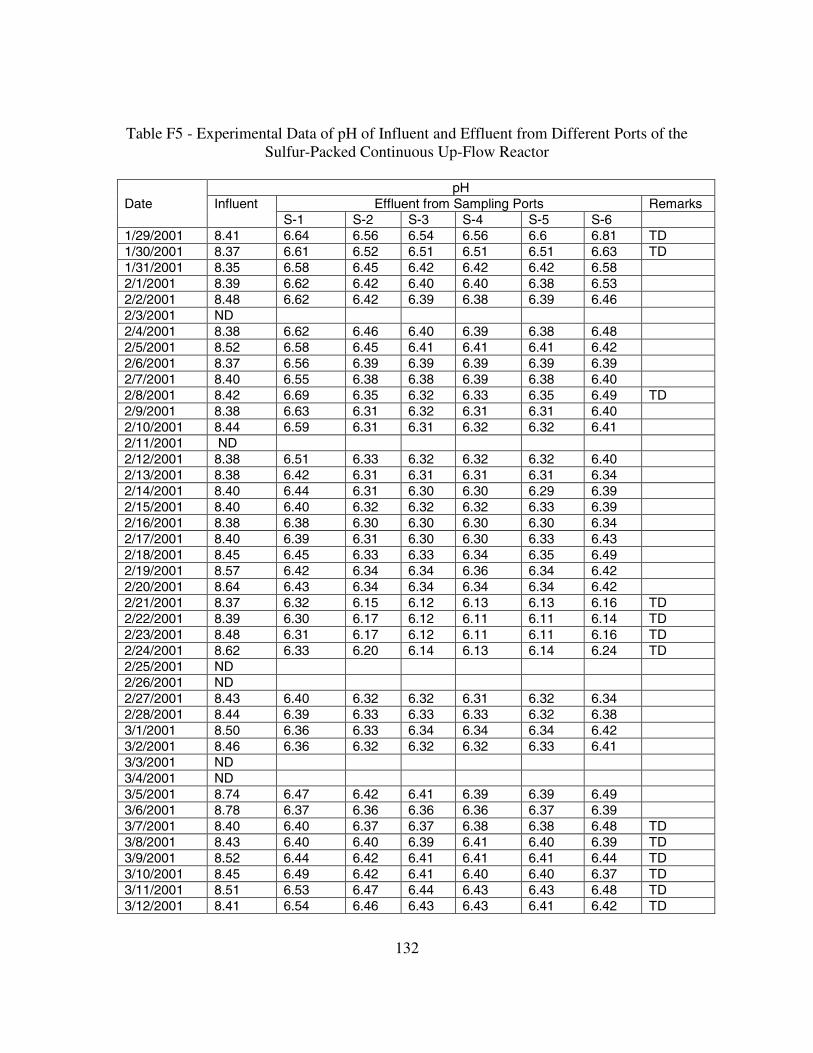
132
Table F5 - Experimental Data of pH of Influent and Effluent from Different Ports of theSulfur-Packed Continuous Up-Flow Reactor
pHEffluent from Sampling Ports RemarksDate Influent
S-1 S-2 S-3 S-4 S-5 S-6 1/29/2001 8.41 6.64 6.56 6.54 6.56 6.6 6.81 TD1/30/2001 8.37 6.61 6.52 6.51 6.51 6.51 6.63 TD1/31/2001 8.35 6.58 6.45 6.42 6.42 6.42 6.582/1/2001 8.39 6.62 6.42 6.40 6.40 6.38 6.532/2/2001 8.48 6.62 6.42 6.39 6.38 6.39 6.462/3/2001 ND2/4/2001 8.38 6.62 6.46 6.40 6.39 6.38 6.482/5/2001 8.52 6.58 6.45 6.41 6.41 6.41 6.422/6/2001 8.37 6.56 6.39 6.39 6.39 6.39 6.392/7/2001 8.40 6.55 6.38 6.38 6.39 6.38 6.402/8/2001 8.42 6.69 6.35 6.32 6.33 6.35 6.49 TD2/9/2001 8.38 6.63 6.31 6.32 6.31 6.31 6.402/10/2001 8.44 6.59 6.31 6.31 6.32 6.32 6.412/11/2001 ND2/12/2001 8.38 6.51 6.33 6.32 6.32 6.32 6.402/13/2001 8.38 6.42 6.31 6.31 6.31 6.31 6.342/14/2001 8.40 6.44 6.31 6.30 6.30 6.29 6.392/15/2001 8.40 6.40 6.32 6.32 6.32 6.33 6.392/16/2001 8.38 6.38 6.30 6.30 6.30 6.30 6.342/17/2001 8.40 6.39 6.31 6.30 6.30 6.33 6.432/18/2001 8.45 6.45 6.33 6.33 6.34 6.35 6.492/19/2001 8.57 6.42 6.34 6.34 6.36 6.34 6.422/20/2001 8.64 6.43 6.34 6.34 6.34 6.34 6.422/21/2001 8.37 6.32 6.15 6.12 6.13 6.13 6.16 TD2/22/2001 8.39 6.30 6.17 6.12 6.11 6.11 6.14 TD2/23/2001 8.48 6.31 6.17 6.12 6.11 6.11 6.16 TD2/24/2001 8.62 6.33 6.20 6.14 6.13 6.14 6.24 TD2/25/2001 ND2/26/2001 ND2/27/2001 8.43 6.40 6.32 6.32 6.31 6.32 6.342/28/2001 8.44 6.39 6.33 6.33 6.33 6.32 6.383/1/2001 8.50 6.36 6.33 6.34 6.34 6.34 6.423/2/2001 8.46 6.36 6.32 6.32 6.32 6.33 6.413/3/2001 ND3/4/2001 ND3/5/2001 8.74 6.47 6.42 6.41 6.39 6.39 6.493/6/2001 8.78 6.37 6.36 6.36 6.36 6.37 6.393/7/2001 8.40 6.40 6.37 6.37 6.38 6.38 6.48 TD3/8/2001 8.43 6.40 6.40 6.39 6.41 6.40 6.39 TD3/9/2001 8.52 6.44 6.42 6.41 6.41 6.41 6.44 TD3/10/2001 8.45 6.49 6.42 6.41 6.40 6.40 6.37 TD3/11/2001 8.51 6.53 6.47 6.44 6.43 6.43 6.48 TD3/12/2001 8.41 6.54 6.46 6.43 6.43 6.41 6.42 TD
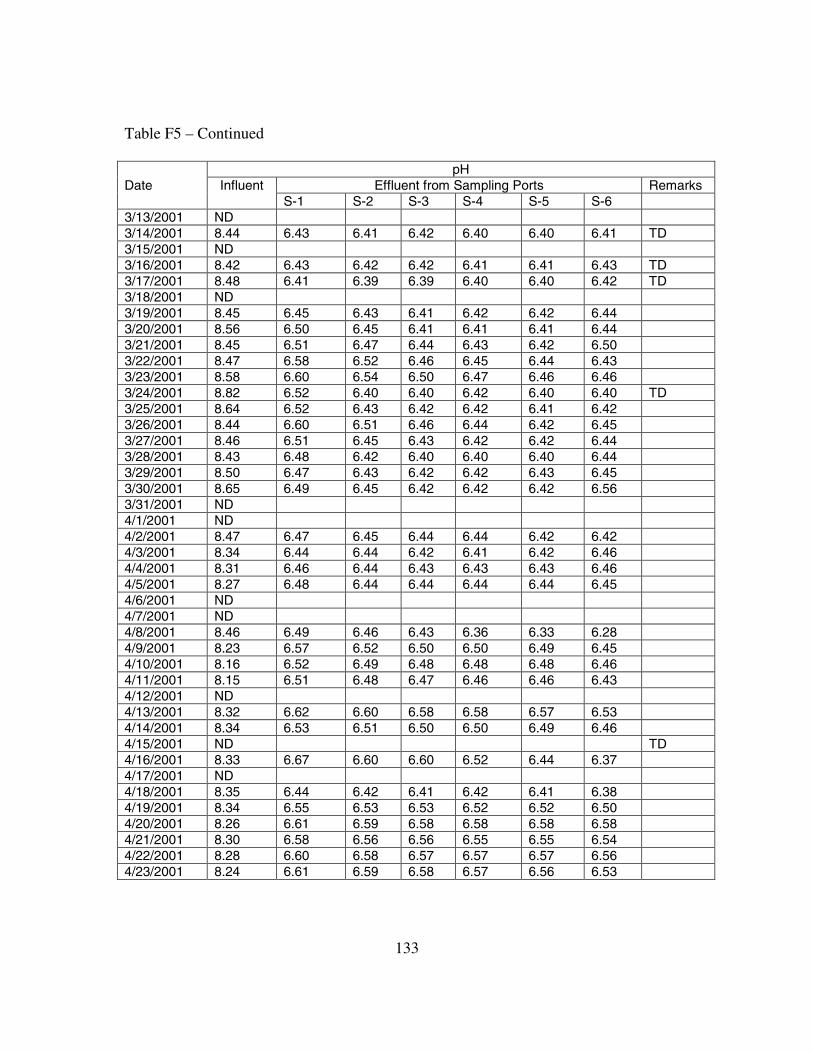
133
Table F5 – Continued
pHEffluent from Sampling Ports RemarksDate Influent
S-1 S-2 S-3 S-4 S-5 S-6 3/13/2001 ND3/14/2001 8.44 6.43 6.41 6.42 6.40 6.40 6.41 TD3/15/2001 ND3/16/2001 8.42 6.43 6.42 6.42 6.41 6.41 6.43 TD3/17/2001 8.48 6.41 6.39 6.39 6.40 6.40 6.42 TD3/18/2001 ND3/19/2001 8.45 6.45 6.43 6.41 6.42 6.42 6.443/20/2001 8.56 6.50 6.45 6.41 6.41 6.41 6.443/21/2001 8.45 6.51 6.47 6.44 6.43 6.42 6.503/22/2001 8.47 6.58 6.52 6.46 6.45 6.44 6.433/23/2001 8.58 6.60 6.54 6.50 6.47 6.46 6.463/24/2001 8.82 6.52 6.40 6.40 6.42 6.40 6.40 TD3/25/2001 8.64 6.52 6.43 6.42 6.42 6.41 6.423/26/2001 8.44 6.60 6.51 6.46 6.44 6.42 6.453/27/2001 8.46 6.51 6.45 6.43 6.42 6.42 6.443/28/2001 8.43 6.48 6.42 6.40 6.40 6.40 6.443/29/2001 8.50 6.47 6.43 6.42 6.42 6.43 6.453/30/2001 8.65 6.49 6.45 6.42 6.42 6.42 6.563/31/2001 ND4/1/2001 ND4/2/2001 8.47 6.47 6.45 6.44 6.44 6.42 6.424/3/2001 8.34 6.44 6.44 6.42 6.41 6.42 6.464/4/2001 8.31 6.46 6.44 6.43 6.43 6.43 6.464/5/2001 8.27 6.48 6.44 6.44 6.44 6.44 6.454/6/2001 ND4/7/2001 ND4/8/2001 8.46 6.49 6.46 6.43 6.36 6.33 6.284/9/2001 8.23 6.57 6.52 6.50 6.50 6.49 6.454/10/2001 8.16 6.52 6.49 6.48 6.48 6.48 6.464/11/2001 8.15 6.51 6.48 6.47 6.46 6.46 6.434/12/2001 ND4/13/2001 8.32 6.62 6.60 6.58 6.58 6.57 6.534/14/2001 8.34 6.53 6.51 6.50 6.50 6.49 6.464/15/2001 ND TD4/16/2001 8.33 6.67 6.60 6.60 6.52 6.44 6.374/17/2001 ND4/18/2001 8.35 6.44 6.42 6.41 6.42 6.41 6.384/19/2001 8.34 6.55 6.53 6.53 6.52 6.52 6.504/20/2001 8.26 6.61 6.59 6.58 6.58 6.58 6.584/21/2001 8.30 6.58 6.56 6.56 6.55 6.55 6.544/22/2001 8.28 6.60 6.58 6.57 6.57 6.57 6.564/23/2001 8.24 6.61 6.59 6.58 6.57 6.56 6.53

134
Table F5 – Continued
pHEffluent from Sampling Ports RemarksDate Influent
S-1 S-2 S-3 S-4 S-5 S-6 4/24/2001 ND4/25/2001 8.35 6.53 6.52 6.49 6.49 6.48 6.464/26/2001 8.33 6.52 6.50 6.48 6.47 6.47 6.454/27/2001 8.37 6.55 6.51 6.50 6.48 6.48 6.454/28/2001 8.32 6.54 6.52 6.51 6.49 6.49 6.454/29/2001 8.39 6.50 6.50 6.49 6.49 6.49 6.464/30/2001 8.44 6.51 6.48 6.49 6.48 6.48 6.485/1/2001 ND5/2/2001 8.51 6.62 6.53 6.50 6.49 6.47 6.545/3/2001 8.43 6.60 6.51 6.48 6.48 6.48 6.465/4/2001 8.49 6.60 6.51 6.50 6.49 6.49 6.495/5/2001 8.49 6.60 6.51 6.50 6.49 6.48 6.485/6/2001 8.49 6.60 6.51 6.49 6.49 6.48 6.475/7/2001 8.49 6.60 6.51 6.49 6.49 6.47 6.46 TD5/8/2001 8.48 6.65 6.56 6.53 6.52 6.50 6.505/9/2001 8.54 6.65 6.60 6.58 6.56 6.55 6.535/10/2001 8.49 6.59 6.52 6.49 6.48 6.48 6.485/11/2001 8.38 6.37 6.30 6.26 6.27 6.27 6.28Note: ND = No data
TD = Transition data, not used
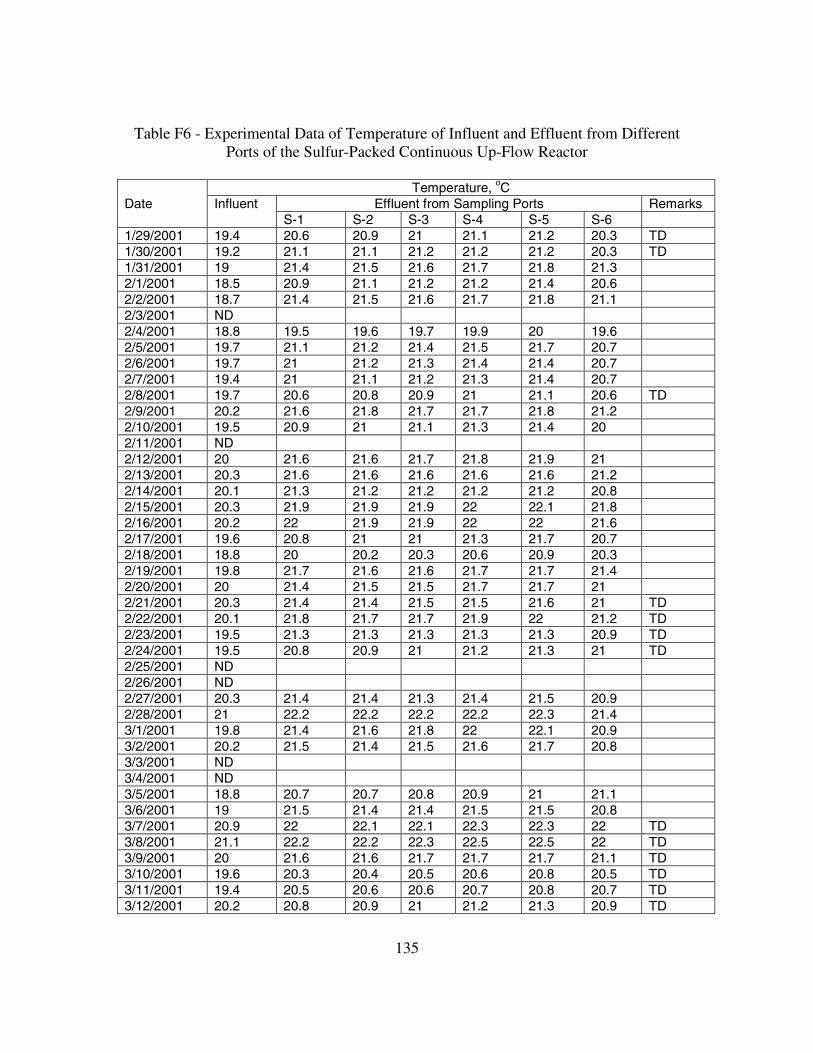
135
Table F6 - Experimental Data of Temperature of Influent and Effluent from DifferentPorts of the Sulfur-Packed Continuous Up-Flow Reactor
Temperature, oCEffluent from Sampling Ports RemarksDate Influent
S-1 S-2 S-3 S-4 S-5 S-6 1/29/2001 19.4 20.6 20.9 21 21.1 21.2 20.3 TD1/30/2001 19.2 21.1 21.1 21.2 21.2 21.2 20.3 TD1/31/2001 19 21.4 21.5 21.6 21.7 21.8 21.32/1/2001 18.5 20.9 21.1 21.2 21.2 21.4 20.62/2/2001 18.7 21.4 21.5 21.6 21.7 21.8 21.12/3/2001 ND2/4/2001 18.8 19.5 19.6 19.7 19.9 20 19.62/5/2001 19.7 21.1 21.2 21.4 21.5 21.7 20.72/6/2001 19.7 21 21.2 21.3 21.4 21.4 20.72/7/2001 19.4 21 21.1 21.2 21.3 21.4 20.72/8/2001 19.7 20.6 20.8 20.9 21 21.1 20.6 TD2/9/2001 20.2 21.6 21.8 21.7 21.7 21.8 21.22/10/2001 19.5 20.9 21 21.1 21.3 21.4 202/11/2001 ND2/12/2001 20 21.6 21.6 21.7 21.8 21.9 212/13/2001 20.3 21.6 21.6 21.6 21.6 21.6 21.22/14/2001 20.1 21.3 21.2 21.2 21.2 21.2 20.82/15/2001 20.3 21.9 21.9 21.9 22 22.1 21.82/16/2001 20.2 22 21.9 21.9 22 22 21.62/17/2001 19.6 20.8 21 21 21.3 21.7 20.72/18/2001 18.8 20 20.2 20.3 20.6 20.9 20.32/19/2001 19.8 21.7 21.6 21.6 21.7 21.7 21.42/20/2001 20 21.4 21.5 21.5 21.7 21.7 212/21/2001 20.3 21.4 21.4 21.5 21.5 21.6 21 TD2/22/2001 20.1 21.8 21.7 21.7 21.9 22 21.2 TD2/23/2001 19.5 21.3 21.3 21.3 21.3 21.3 20.9 TD2/24/2001 19.5 20.8 20.9 21 21.2 21.3 21 TD2/25/2001 ND2/26/2001 ND2/27/2001 20.3 21.4 21.4 21.3 21.4 21.5 20.92/28/2001 21 22.2 22.2 22.2 22.2 22.3 21.43/1/2001 19.8 21.4 21.6 21.8 22 22.1 20.93/2/2001 20.2 21.5 21.4 21.5 21.6 21.7 20.83/3/2001 ND3/4/2001 ND3/5/2001 18.8 20.7 20.7 20.8 20.9 21 21.13/6/2001 19 21.5 21.4 21.4 21.5 21.5 20.83/7/2001 20.9 22 22.1 22.1 22.3 22.3 22 TD3/8/2001 21.1 22.2 22.2 22.3 22.5 22.5 22 TD3/9/2001 20 21.6 21.6 21.7 21.7 21.7 21.1 TD3/10/2001 19.6 20.3 20.4 20.5 20.6 20.8 20.5 TD3/11/2001 19.4 20.5 20.6 20.6 20.7 20.8 20.7 TD3/12/2001 20.2 20.8 20.9 21 21.2 21.3 20.9 TD

136
Table F6 – Continued
Temperature, oCEffluent from Sampling Ports RemarksDate Influent
S-1 S-2 S-3 S-4 S-5 S-6 3/13/2001 ND3/14/2001 19.9 21.3 21.4 21.5 21.6 21.7 21 TD3/15/2001 ND3/16/2001 199 21.7 21.8 21.8 21.8 21.9 21 TD3/17/2001 18.8 20.4 20.4 205 206 20.7 19.4 TD3/18/2001 ND3/19/2001 20.1 21.6 21.7 21.8 21.9 22 21.33/20/2001 19.5 21.5 21.6 21.7 21.9 22 21.33/21/2001 20.2 21.6 21.6 21.5 21.6 21.6 21.43/22/2001 20 21 21.1 21.2 21.4 21.5 21.13/23/2001 19.4 20.8 20.9 21 21.1 21.3 213/24/2001 19.4 20.6 20.8 20.8 21 21.1 20.6 TD3/25/2001 ND3/26/2001 19.5 20.8 20.8 20.9 21 21.3 20.93/27/2001 19.3 20.8 20.8 20.9 21.1 21.2 20.93/28/2001 19.9 21.2 21.2 21.2 21.4 21.6 21.33/29/2001 19.7 21.4 21.5 21.5 21.6 21.7 20.93/30/2001 18.7 21.6 21.7 21.7 21.7 21.8 21.13/31/2001 ND4/1/2001 ND4/2/2001 20.2 21.5 21.5 21.5 21.6 21.5 21.14/3/2001 20.5 21.1 21.1 21.1 21.2 21.3 20.84/4/2001 20.5 21.3 21.3 21.3 21.4 21.5 21.14/5/2001 20.5 21.4 21.4 21.4 21.5 21.6 21.44/6/2001 ND4/7/2001 ND4/8/2001 21.6 22.7 22.7 22.8 23 23.2 22.94/9/2001 20.9 21.4 21.3 21.3 21.4 21.4 214/10/2001 20.4 21.5 21.4 21.4 21.3 21.3 214/11/2001 21 22 22 22.1 22.1 22.1 21.74/12/2001 ND4/13/2001 21 21.7 21.7 21.8 21.8 21.8 21.74/14/2001 21.0 21.8 21.8 21.9 22.0 22.0 21.64/15/2001 ND TD4/16/2001 20.9 21.3 21.2 21.3 21.4 21.4 20.94/17/2001 ND4/18/2001 20.9 21.8 21.9 22 22.1 22.1 21.44/19/2001 19.9 21.5 21.5 21.6 21.7 21.7 21.24/20/2001 20.4 21.1 21.1 21.1 21.1 21.2 214/21/2001 20.2 21.3 21.3 21.4 21.4 21.5 21.14/22/2001 20.2 21.3 21.4 21.4 21.4 21.5 214/23/2001 20.3 21.3 21.4 21.4 21.4 21.5 21.1

137
Table F6 – Continued
Temperature, oCEffluent from Sampling Ports RemarksDate Influent
S-1 S-2 S-3 S-4 S-5 S-6 4/24/2001 ND4/25/2001 20.3 21.2 21.3 21.3 21.4 21.4 204/26/2001 20.5 21.3 21.3 21.4 21.4 21.4 214/27/2001 20.4 21.2 21.2 21.2 21.3 21.3 20.94/28/2001 20.5 21.3 21.3 21.3 21.4 21.4 21.04/29/2001 20.4 21.2 21.2 21.3 21.3 21.3 20.94/30/2001 21 21.9 21.9 22 22 22 21.35/1/2001 ND5/2/2001 20.4 21.2 21.2 21.3 21.4 21.4 20.95/3/2001 20.6 21.3 21.3 21.3 21.4 21.6 215/4/2001 20.4 21.1 21.1 21.2 21.3 21.4 20.95/5/2001 20.5 21.2 21.2 21.3 21.4 21.5 21.05/6/2001 20.5 21.2 21.2 21.2 21.3 21.5 20.95/7/2001 21.2 21.9 21.9 21.9 21.9 21.9 21.1 TD5/8/2001 20.5 21.2 21.1 21.2 21.3 21.4 20.85/9/2001 20.3 21.1 21 21 21 21 20.35/10/2001 20.3 20.9 20.8 20.8 20.8 20.8 20.15/11/2001 20.6 21.4 21.4 21.4 21.4 21.4 20.9Note: ND = No data
TD = Transition data, not used
138
APPENDIX G
DETERMINATION OF REACTION RATE CONSTANT k1 USING FUJIMOTO
METHOD

139
The ratios of NNO3 −− concentration at any time t to initial NNO3 −
− concentration,
and calculation steps of Fujimoto method are summarized in Table G1. The
determination procedures for ultimate value of (1-C/Co) are plotted in Figure G1.
Table G1 - Determination of Reaction Rate Constant k1 Using Fujimoto Method
C/Co (1-C/Co)n (1-C/Co)n+1
(1-C/Co)Ultimate k1 t, hrs
100.00% 0.00% 75.33% 97.6% 0
24.67% 75.33% 86.84% 97.6% 1.23 1.2
13.16% 86.84% 92.59% 97.6% 1.47 1.5
7.41% 92.59% 94.49% 97.6% 1.49 2
5.51% 94.49% 96.34% 97.6% 1.44 2.4
3.66% 96.34% 97.62% 97.6% 1.41 3.1
2.38% 97.62% 97.83% - - 3.7
2.17% 97.83% 98.62% - - 4
1.38% 98.62% 98.75% - - 4.6
1.25% 98.75% 98.92% - - 4.9
1.08% 98.92% 99.16% - - 6
0.84% 99.16% 99.23% - - 6.1
0.77% 99.23% 99.25% - - 7.3
0.75% 99.25% 99.10% - - 7.6
0.90% 99.10% 99.27% - - 8
0.73% 99.27% 99.04% - - 9.1
0.96% 99.04% 99.08% - - 10
0.92% 99.08% 12
Average 1.41
Note:12
1
))/1/()/1(1ln(
tt
CCCCk ultimateono
−−−−
=
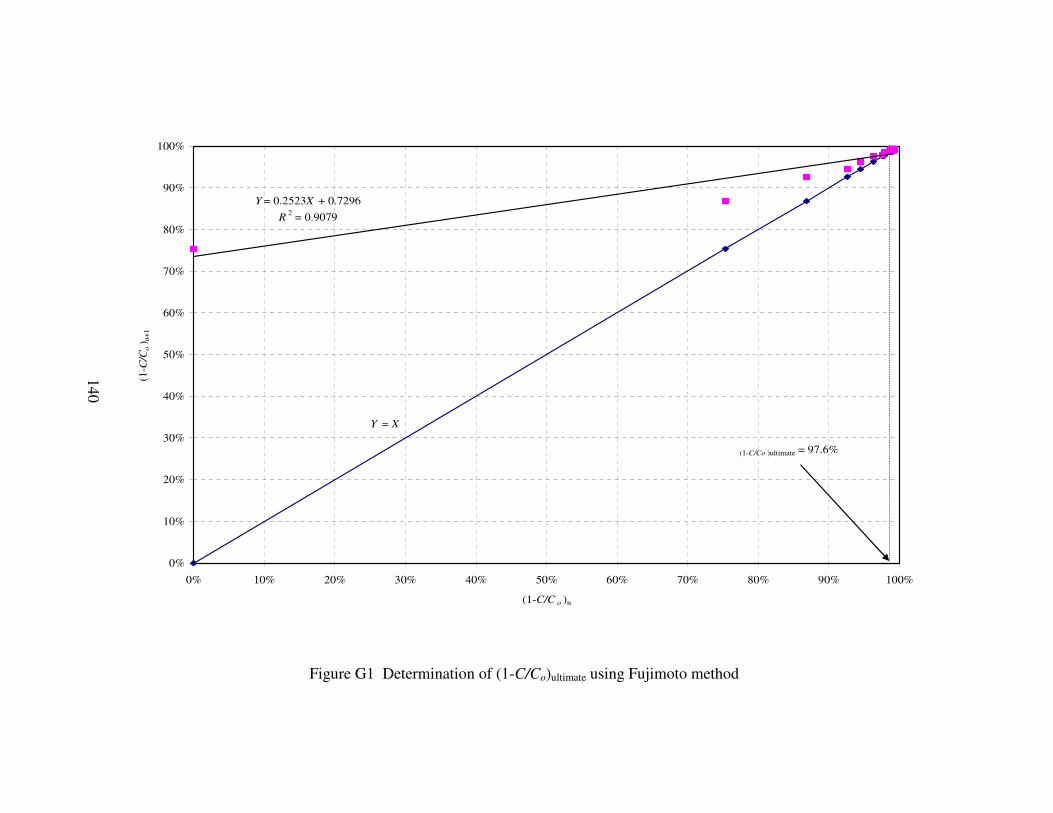
Y = 0.2523X + 0.7296
R 2 = 0.9079
0%
10%
20%
30%
40%
50%
60%
70%
80%
90%
100%
0% 10% 20% 30% 40% 50% 60% 70% 80% 90% 100%
(1-C/C o )n
(1-C
/Co) n
+1
(1-C/Co )ultimate = 97.6%
Y = X
Figure G1 Determination of (1-C/Co)ultimate using Fujimoto method
140
141
REFERENCES
1 American Public Health Association (APHA), American Water WorksAssociation (AWWA), Water Environment Federation (WEF), 1992 “StandardMethods for the Examination of Water and Wastewater,” 18th Edition,Washington, D.C.
2 American Water Works Association (AWWA), 1995, “Survey RevealPesticides, Nitrates in Water from Farming Areas,” Journal of American WaterWorks Association, vol. 87, No. 10, pp. 13-14
3 Baalsrud, K. and K. S. Baalsrud, 1954, “Studies on Thiobacillus Denitrificans,”Archives of Microbiology, vol. 20, No. 1, pp. 34-62
4 Barcelona, M. J., 1984, “TOC Determinations in Groundwater,” Ground Water,vol. 22, No. 1, pp. 18-24
5 Barrenstein, A., U. Kramer, and P. Obermann, 1986, “Underground Treatmentof Nitrate Rich Groundwater by Infiltration with Treated Wastewater orMethane-Rich Natural Gas,” DVGW-Schriftenreihe, Wasser, Frankfort, WestGermany, vol. 106, pp. 99-116
6 Batchelor, B., and A. W. Lawence, 1978a. “A Kinetic Model for AutotrophicDenitrification Using Elemental Sulfur,” Water Research, vol. 12, No 12, pp.1075-1084
7 Batchelor, B., and A. W. Lawence, 1978b, “Autotrophic Denitrification UsingElemental Sulfur,” Journal of Water Pollution Control Federation, vol. 50, No8, pp. 1986-2001
8 Batchelor, B., and A. W. Lawence, 1978c. “Stoichiometry of AutotrophicDenitrification Using Elemental Sulfur,” In: A.J. Rubin (Ed.), Chemistry ofWastewater Technology. Ann Arbor Science Publishers, Inc., Ann Arbor,Michigan, pp. 421-440.
9 Bergey, D. H., R. E. Buchanan, and N. E. Gibbons, 1974, “Bergey’s Manual ofDeterminative Bacteriology,” Eighth Edition, Williams & Wilkins Company,Baltimore, MD, pp. 456-461
142
10 Bergey, D. H., N. R. Krieg, and J. G. Holt, 1986, “Bergey’s Manual ofSystematic Bacteriology,” Volume II, Williams & Wilkins Company, Baltimore,MD, pp. 427-438
11 Bisogni, J. J. Jr., and C. T. Driscoll, 1977, “Denitrification Using Thiosulfateand Sulfide,” Journal of Environmental Engineering Division, American Societyof Civil Engineering, vol. 103, No. 4, pp. 593-604
12 Blecon, G., M. Gillet, G. Martin, and J. M. Philipot, 1983, “AutotrophicBiological Denitrification by Thiobacillus Denitrificans on Sulfur-Marl,” RevueFrancaise des Science de I’Eau, vol. 2, No. 3, pp. 267-279
13 Bouchard, D. C., M. K. Williams, and R.Y. Surampalli, 1992, “NitrateContamination of Groundwater: Sources and Potential Health Effects,” Journalof American Water Works Association, vol. 84, No. 9, pp. 85-90
14 Bouwer, E. J., and P. B. Crowe, 1988, “Biological Processes in Drinking WaterTreatment,” Journal of American Water Works Association, vol. 80, No. 9, pp.82-93
15 Brezonik, P. L., 1977, “Denitrification in Natural Waters,” Progress in WaterTechnology, vol. 8, No. 4-5, pp. 373-392
16 Brock, T. D., M. T. Madigan, J. Martinko, and J. Parker, 1994, “Biology ofMicroorganisms,” Prentice Hall International Editions, Seventh Edition,Englewood Cliffs, New Jersey.
17 Challis, B. C., 1973, “Rapid Nitrosation of Phenols and its Implications forHealth Hazards from Dietary Nitrites,” Nature, vol. 244 (5416), p. 466
18 Champ, D. R., J. Gulens, and R.E. Jackson, 1979, “Oxidation-ReductionSequences in Groundwater Flow Systems,” Canadian Journal of Earth Science,vol. 16, No. 1, pp. 12-23
19 Cizinska, S., V. Mateju, J. Krejci, T. Janoch and E. Kyslikova, 1992, “WaterDenitrification by an Immobilized Biocatalyst,” Journal of ChemicalTechnology and Biotechnology, vol. 55, No. 1, pp. 33-38
20 Claus, G., and H. J. Kutzner, 1985a, “Autotrophic Denitrification by
Thiobacillus Denitrificans in a Packed Bed Reactor,” Applied Microbiology andBiotechnology, vol. 22, No. 3, pp. 289-296

143
21 Claus, G., and H. J. Kutzner, 1985b, “Physiology and Kinetics of AutotrophicDenitrification by Thiobacillus Denitrificans,” Applied Microbiology andBiotechnology, vol. 22, No. 2, pp. 283-288
22 Clifford, D., and X. Liu, 1993, “Ion Exchange for Nitrate Removal,” Journal ofAmmerican Water Works Association, vol. 85, No. 4, pp. 135-143
23 Dahab, M. D., 1991, “Nitrate Treatment Methods: an Overview,” North AtlanticTreaty Organization Advanced Science Institutes, Series, G 30. NitrateContamination, Edit by Bogardi, I., and Kuzelka, R.D., Spring-Verlag, BerlinHeidelberg, pp. 349-368
24 Davidson, M. S., and H. F. Ridgeway, 1995, “Biological Denitrification ofGroundwater Using Sulfur-Oxidizing Bacteria, : Construction and Evaluation ofa 25 gpm Pilot System,” Report of A Cooperative Project of Orange CountyWater District, and the Metropolitan Water District of Southern California
25 Davies, T. R., 1973, “ Isolation of Bacteria Capable of Utilizing Methane as aHydrogen Donor in the Process of Denitrification,” Water Research, vol. 7, No.4, April, pp. 575-579
26 Delanghe, B., F. Nakamura, H. Myoga, and Y. Magara, 1994a, “BiologicalDenitrification with Ethanol in a Membrane Bioreactor,” EnvironmentalTechnology, vol. 15, No. 1, pp. 61-67
27 Delanghe, B., J. Nakamura, H. Myoga, Y. Magara and E. Guibal, 1994b,“Drinking Water Denitrification in a Membrane Bioreactor,” Water ScienceTechnology, vol. 30, No. 6, pp. 157-160
28 Exner, M. E., and R. F. Spalding, 1990, “Occurrence of Pesticides and Nitrate inNebraska’s Groundwater,” Water Center Publication, No. 1. Institute ofAgriculture and Natural Resources, University of Nebraska, Lincoln.
29 Flere, J. M., 1997, “Remediation of Nitrate-Contaminated Water Using Sulfurand Limestone Autotrophic Denitrification Processes,” M.S. Thesis, Departmentof Civil Engineering, University of Nebraska-Lincoln at Omaha Campus,Omaha, NE
30 Frank, C., and W. Dott, 1985, “Nitrate Removal from Drinking-Water byBiological Denitrification,” Vom Wasser, Weinheim, Germany, Vol. 65, pp.287-295.
144
31 Frick, B. R., and Y. Richard, 1985, “Experience with Biological Denitrificationin a Full Scale Drinking Water Treatment Plant,” Vom Wasser, vol. 64, pp. 145-154
32 Frunzke, K., and O. Meyer, 1990, “Nitrate Respiration, Denitrification, andUtilization of Nitrogen Sources by Aerobic Carbon Monoxide-OxidizingBacteria, Archives of Microbiology, vol. 154, No. 2, pp. 168-174
33 Furumai, H., H. Tagui, and K. Fujita, 1996, “Effects of pH and Alkalinity onSulfur-Denitrification in a Biological Granular Filter,” Water ScienceTechnology, Printed in Great Britain, vol. 34, No. 1-2, pp. 355-362
34 Gantzer, C. J., 1995, “ Membrane Dissolution of Hydrogen for BiologicalNitrate Removal,” Proceedings of Water Environment Federation 8th AnnualConference, Miami Beach, Florida
35 Gaudy, A. F. Jr., and E. T. Gaudy, 1980, “Microbiology for EnvironmentalScientists and Engineers,” McGraw-Hill, Inc., New York, p. 195
36 Gauntlett, R. B., and D. G. Craft, 1979, “Biological Removal of Nitrate fromRiver Water,” Technical Report TR 98, Water Research Centre, Medmenham,England
37 Gayle, B. P., G. D. Boardman, J.H. Sherrard, and R.E. Benoit, 1989, “BiologicalDenitrification of Water,” Journal of Environmental Engineering Division,ASCE, vol. 115, No. 5, pp. 930-943
38 Gross, H., and K. Treuter, 1986, “Biological Denitrification Process withHydrogen-Oxidizing Bacteria for Drinking Water Treatment,” Aquarium, vol. 5,No. 5, pp. 288-290
39 Hach Water Analysis Handbook, 1992, 2nd Edition, Hach Company, Loveland,Colorado
40 Hashimoto, S., K. Furikawa, and M. Shiyana, 1989, “Enrichment of SulfurDenitrifying Bacteria and Its Accumulation to Elemental Sulfur,” Journal ofWater Pollution Research, vol. 12, No. 7, pp. 431-440
41 Hiscock, K. M., J. W. Lloyd, and D. N. Lerner, 1991, “Review of Natural andArtificial Denitrification of Groundwater,” Printed in Great Britain, WaterResources, vol. 25, No. 9, pp. 1099-1111
145
42 van der Hoek, J. P., W. A. M. Hijnen, C. A. van Bennekom, and B. J.Mijnarends, 1992a, “Optimization of the Sulfur-Limstone Filtration Process forNitrate Removal from Groundwater,” Journal of Water SRT-AQUA, vol. 41, No.4, pp. 209-218
43 van der Hoek, J. P., J. W. N. M. Kappelhof, and W. A. M. Hijnen, 1992b,“Biological Nitrate Removal from Ground Water by Sulphur/LimestoneDenitrifcation,” Journal of Chemical Technology and Biotechnology, vol. 54,No. 2, pp. 197-200
44 van der Hoek, J. P., P. J. M. van der Ven, and A. Klapwijk, 1988b, “CombinedIon Exchange/Biological Denitrification for Nitrate Removal from GroundwaterUnder Different Process Conditions,” Water Research, vol. 22, No.6, pp. 679-684
45 Howard, K. W. F., 1985, “Denitrification in a Major Lime Stone Aquifer,”Journal of Hydrology, vol. 76, pp. 265-280
46 Justin P., and D. P. Kelly, 1978a, “Growth Kinetics of ThiobacillusDenitrificans in Anaerobic and Aerobic Chemostat Culture,” Journal of GeneralMicrobiology, vol. 107, No. 1, pp. 123-130
47 Kapoor, A., and T. Viraraghavan, 1997, “Nitrate Removal From DrinkingWater-Review,” Journal of Environmental Engineering Division, ASCE, vol.123, No. 4, April, pp. 371-380
48 Kelly, D. P., 1982, “Biochemistry of the Chemolithotrophic Oxidation ofInorganic Sulphur,” Philosphical Transactions, Royal Society of London, SeriesB 298, pp. 499-528
49 Kurt, M., I. J. Dunn, and J. R. Bourne, 1987, “Biological Denitrification ofDrinking Water Using Autotrophic Organisms with Hydrogen in a Fludized-BedBiofilm Reactor,” Biotechnology Bioengineering, vol. 29, No. 4, pp. 493-501
50 Korom, S., 1992, “Natural Denitrification in the Saturated Zone: A Review,”Water Resources Research, vol. 28 No. 6, pp. 1657-1668
51 Lampe, D. G., and T.C. Zhang, 1997. “Sulfur-based Autotrophic Denitrificationfor Remediation of Nitrate-contaminated Water,” In Situ and On-SiteBioremediation Symposium. New Orleans, April 28 – May 1. Battelle Press
52 Lewandowski, I., R. Bakke, and W. G. Characklis, 1987, “Nitrification andAutotrophic Denitrification in Calcium Alginate Beads,” Water ScienceTechnology, vol. 19, pp. 175-182
146
53 Lyubchenko, O. A., N. F. Mogilevich, and P. I. Gvozdyak, 1996, “MicrobialNitrification and Sewage Treatment,” Journal of Water Chemistry andTechnology, vol. 18, No. 1, pp. 98-112
54 McCarty, P. L., “Energetics and Bacterial Growth,” Presented at the July, 1969,5th Rudolf Research Conference, Rutgers University, New Brunswick, N.J.
55 Metcalf and Eddy, Inc. Revised by Tchobanoglous, G., L. Franklin, H. Burton,and D. Stensel, 2003, “Wastewater Engineering: Treatment and Reuse,”McGraw Hill Companies Inc. Fourth Edition, New York, NY.
56 Mirvish, S., 1991, “The significance for Human Health of Nitrate, Nitrite, andNitroso Compounds,” North Atlantic Treaty Organization, Advanced ScienceInstitutes, Series G30. Nitrate Contamination. Edit by Bogardi, I., and R. D.Kuzelka, pp. 253-266, Springer-Verlag Berlin Heidelberg
57 Myers, R. J. K., 1972, “Effect of Sulfide on Nitrate Reduction in Soil,“ Plantand Soil, vol. 37, No. 2, pp. 431-433
58 Overath, H., A. Hussmann, and K. Haberer, 1986, “Biological Denitrificationby Thiobacillus Denitrificans Using Elemental Sulfur Fixed on GranularActivated Carbon as Electron Donor,” Vom Wasser, vol. 66, pp.59-83
59 Pontius, F. W., 1993, “Nitrate and Cancer: Is There a Link,” Journal ofAmerican Water Works Association, vol. 85, No. 4, pp. 12-14.
60 Power, J. F. and J. S. Schepers, 1989, “Nitrate Contamination of Groundwater inNorth America,” Agriculture, Ecosystems and Environment, vol. 26, No. 3-4,pp. 165-187
61 Reddy, K. R., P. S. C. Rao, and R. E. Jessup, 1982, “The Effect of CarbonMineralization on Denitrification Kinetics in Mineral and Organic Soils,” SoilScience Society of America Journal, vol. 46, No. 1, pp. 62-68
62 Richard, Y., A. Leprince, G. Martin, and C. Leblanc, 1980, “Denitrification ofWater for Human Consumption,” Progress in Water Technology, Oxford,England, vol. 12, No. 6, pp. 173-191
63 Rittmann, B. E., and P. M. Huck, 1989, “Biological Treatment of Public Water,”Chemical Rubber Company, Critical Reviews in Environmental Control, vol. 19,No. 2, pp. 119-184
64 Sawyer, C. N. and P. L. McCarty., 1978 “Chemistry for EnvironmentalEngineering” Third Edition, pp. 242-245
147
65 Sikora L. J. and D. R. Keeney, 1976, “Evaluation of a Sulfur ThiobacillusDenitrificans Nitrate Removal System,” Journal of Environmental Quality, vol.5, No. 3, pp. 298-303
66 Skerman, V. B. and I. C. MacRae, 1957, “The Influence of Oxygen Availabilityon the Degree of Nitrate Reduction by Pseudomonas Denitrificans,” CanadianJournal of Microbiology, vol. 3, pp. 505-530
67 Smith, R. L., and J. H. Duff, 1988, “Denitrification in a Sand and GravelAquifer,” Applied and Environmental Microbiology, vol. 54, No. 5, pp. 1071-1078
68 Smith, R. L., M. L. Ceazan, and M. H. Brooks, 1994, “Autotrophic, Hydrogen-Oxidizing, Denitrifying Bacteria in Groundwater, Potential Agents forBioremediation of Nitrate Contamination,” Applied and EnvironmentalMicrobiology, vol. 60, No. 6, pp. 1949-1955
69 Thurman, E. M., 1985, ”Organic Geochemistry of Natural Waters,” Nijhoff-Junk, Dordrecht.
70 Waki, T., K. I. Murayma, Y. Kawato, and K. Ichikawa, 1980, “TransientCharacteristics of Paracoccus Denitrificans with Changes Between Aerobic andAnaerobic Conditions, Journal of Fermentation Technology, vol. 58, No. 3, pp.243-249

148
BIOGRAPHICAL INFORMATION
Shih-Hui Pan received a Bachelor of Science degree (BS) in Civil Engineering
from Chung Christian University, Chung Li, Taiwan in 1980. He received his MS
degree in Civil Engineering from the University of Texas at Arlington in 1995. His
experience after obtaining his BS degree includes: two years in the Taiwan Army Corps
of Engineers, four years in Min Young Real Estate and Advertisement Company at
Taiwan, one year at Utah State University in the Civil and Environmental Engineering
Department for course study, five years in engineering consulting firms in Taiwan, and
six years in engineering consulting firms in the United States. His civil engineering
experience includes: design of water wells, sewage lift stations, booster pump stations,
groundwater storage tanks, and water/wastewater treatment plants. He also had seven
years experience as a Graduate Teaching Assistant working in the water quality
laboratory at the University of Texas at Arlington.
His research interests are water and wastewater treatment processes. He would
like to work as an environmental engineer in a consulting engineering firm, or as a
college teacher.
Related Documents