Autophagic activity in thymus and liver during aging Mohammad Nizam Uddin & Naomi Nishio & Sachiko Ito & Haruhiko Suzuki & Ken-ichi Isobe Received: 1 October 2010 / Accepted: 8 February 2011 / Published online: 9 March 2011 # American Aging Association 2011 Abstract Impaired or deficient autophagy is believed to cause or contribute to aging, as well as several age- related pathologies. Thymic epithelial cells had a high constitutive level of autophagy. The autophagic process may play a supporting role or even a crucial role in the presentation of self-Ags in the thymus to shape the T-cell repertoires. Autophagic activity in the liver is important for the balance of energy and nutrients for basic cell functions. The abundance of autophagic structure in both cortical and medullary thymic epithelial cells and liver with mouse age has not been examined in detail. Here, we demonstrated that the architecture of mouse thymus and liver markedly changed with age. We found that the expression of LC3 detected by immunofluorescence and Western blot analysis was greatly decreased in thymus and liver of 12-month-old mice. The same level of reduction was observed in thymus and liver of 24-month-old mice. Ultrastructure analysis by an electron microscope revealed that the number of autophagic structure/vacuole in total thymic epithelial cells and hepatocytes decrease with age. The age-related decrease of autophagic structure in thymic epithelial cells may cause the reduction of immunocompetent T-cell pool in aged mice. The age-related decrease of autophagy in liver may induce accumulation of cellular materials in liver of aged mice. Keywords TEC . Hepatocytes . Autophagy . Aging . Liver Introduction All cells rely on surveillance mechanisms, chaperones, and proteolytic systems to control the quality of their proteins and organelles and to guarantee that any malfunctioning or damaged intracellular components are repaired or eliminated (Morimoto 2008; Goldberg 2003). Aging is an inevitable physiological process characterized by a progressive accumulation of damaged aberrant macromolecules and organelles in somatic cells during the post-developmental period, leading to the decreased ability of the organism to survive (Guarente and Kenyon 2000; Hekimi and Guarente 2003; Kirkwood and Austad 2000; Bishop and Guarente 2007). Inefficient removal of nonfunctional aberrant cellular components generated by oxidative damages and a general decline in housekeeping mechanisms appear to be critical in the progression of aging (Cuervo et al. 2005; Rajawat and Bossis 2008). Autophagy is a process of self-degradation of cellular components in which double-membrane autophagosomes sequester organelles or portions of cytosol and fuse with lysosomes or vacuoles for breakdown by resident hydro- AGE (2012) 34:75–85 DOI 10.1007/s11357-011-9221-9 M. N. Uddin : N. Nishio : S. Ito : H. Suzuki : K.-i. Isobe (*) Department of Immunology, Nagoya University Graduate School of Medicine, Nagoya University, 65 Turumai-cho, Showa-ku, Nagoya Aichi466-8520, Japan e-mail: [email protected]

Welcome message from author
This document is posted to help you gain knowledge. Please leave a comment to let me know what you think about it! Share it to your friends and learn new things together.
Transcript

Autophagic activity in thymus and liver during aging
Mohammad Nizam Uddin & Naomi Nishio &
Sachiko Ito & Haruhiko Suzuki & Ken-ichi Isobe
Received: 1 October 2010 /Accepted: 8 February 2011 /Published online: 9 March 2011# American Aging Association 2011
Abstract Impaired or deficient autophagy is believedto cause or contribute to aging, as well as several age-related pathologies. Thymic epithelial cells had a highconstitutive level of autophagy. The autophagicprocess may play a supporting role or even a crucialrole in the presentation of self-Ags in the thymus toshape the T-cell repertoires. Autophagic activity in theliver is important for the balance of energy andnutrients for basic cell functions. The abundance ofautophagic structure in both cortical and medullarythymic epithelial cells and liver with mouse age hasnot been examined in detail. Here, we demonstratedthat the architecture of mouse thymus and livermarkedly changed with age. We found that theexpression of LC3 detected by immunofluorescenceand Western blot analysis was greatly decreased inthymus and liver of 12-month-old mice. The samelevel of reduction was observed in thymus and liverof 24-month-old mice. Ultrastructure analysis by anelectron microscope revealed that the number ofautophagic structure/vacuole in total thymic epithelialcells and hepatocytes decrease with age. The age-relateddecrease of autophagic structure in thymic epithelialcells may cause the reduction of immunocompetent
T-cell pool in aged mice. The age-related decrease ofautophagy in liver may induce accumulation of cellularmaterials in liver of aged mice.
Keywords TEC . Hepatocytes . Autophagy . Aging .
Liver
Introduction
All cells rely on surveillance mechanisms, chaperones,and proteolytic systems to control the quality of theirproteins and organelles and to guarantee that anymalfunctioning or damaged intracellular componentsare repaired or eliminated (Morimoto 2008; Goldberg2003). Aging is an inevitable physiological processcharacterized by a progressive accumulation of damagedaberrant macromolecules and organelles in somatic cellsduring the post-developmental period, leading to thedecreased ability of the organism to survive (Guarenteand Kenyon 2000; Hekimi and Guarente 2003;Kirkwood and Austad 2000; Bishop and Guarente2007). Inefficient removal of nonfunctional aberrantcellular components generated by oxidative damagesand a general decline in housekeeping mechanismsappear to be critical in the progression of aging (Cuervoet al. 2005; Rajawat and Bossis 2008).
Autophagy is a process of self-degradation of cellularcomponents inwhich double-membrane autophagosomessequester organelles or portions of cytosol and fuse withlysosomes or vacuoles for breakdown by resident hydro-
AGE (2012) 34:75–85DOI 10.1007/s11357-011-9221-9
M. N. Uddin :N. Nishio : S. Ito :H. Suzuki :K.-i. Isobe (*)Department of Immunology, Nagoya University GraduateSchool of Medicine, Nagoya University,65 Turumai-cho, Showa-ku,Nagoya Aichi466-8520, Japane-mail: [email protected]

lases. Defective autophagy plays a significant role inhuman pathologies, including cancer, neurodegeneration,and infectious diseases (He and Klionsky 2009). Theparticipation of autophagy in different physiologicalfunctions is attributable, in almost all cases, to one ofits two main functions: as an energy source or as amechanism for the removal of unwanted cellularstructures (Mizushima and Klionsky 2007).
Autophagy has been implicated in both innate andacquired immunity through sampling, digestion, andpresentation of peptides from both invasive cellularpathogens and also from their own cellular milieu(Levine and Deretic 2007). The autophagic processmay play a supporting role or even a crucial role inthe presentation of self-Ags in the thymus to shapethe T-cell repertoires (Kasai et al. 2009). Thymicepithelial cells (TECs) had a high constitutive level ofautophagy. Autophagy focuses the MHC-II–peptiderepertoire of TECs on their intracellular milieu, whichcontributes to T-cell selection and is essential for thegeneration of a self-tolerant T-cell repertoire (Nedjicet al. 2008). Genetic interference with autophagyspecifically in TECs led to altered selection of certainMHC-II-restricted T-cell specificities and resulted insevere colitis and multi-organ inflammation.
Macroautophagy in the liver is important for thebalance of energy and nutrients for basic cell functions,the removal of misfolded proteins resulting from geneticmutations or pathophysiological stimulations, and theturnover of major subcellular organelles such asmitochondria, endoplasmic reticulum, and peroxisomesunder both normal and pathophysiological conditions.Disturbance of autophagy function in the liver couldthus have a major impact on liver physiology and liverdisease (Yin et al. 2008).
In the present study, we investigated TEC in thecortical and medulla regions of thymus to observeautophagy abundance at different stages of life. Inaddition, we observed the ultrastructure of the liver atdifferent stages of life and examined hepatic autophagy.
Methods
Animals
C57BL/6NCrSlc (C57BL/6) female mice were pur-chased from SLC. They were maintained at theAnimal Research Facility at Nagoya University
Graduate School of Medicine under specificpathogen-free conditions with food and water adlibitum and maintained on a 12-h light/dark cycle.After 1-week adaptation, 2-month-old mice weresacrificed. Mice, 12 (adult) and 24 months (old),were maintained in the same condition. Mice weresacrificed by performing cervical dislocation andperfused transcardially with ice-cold phosphate-buffered saline (PBS). After sacrificing, the liver andthymus tissues were collected immediately. We didnot have starvation period. All mice were handled inaccordance with the Nagoya University Guideline forAnimal Experiments.
Reagents and antibodies
Mayer’s hematoxylin solution was purchased fromWako (134-13065) and eosin Y-solution (0.5% aqueous)from MERCK, Germany. Xyline was obtained fromKatayama Chemical, Japan and malinol fromMuto PureChemical Co, Japan.
For immunostaining, rabbit polyclonal anti-LC3 waspurchased from Novus Biologicals and we reduced thenon-specificity usingmouse serum precipitationmethod.Alexa Fluor-488 (AF488) goat anti-rabbit IgG (H + L)and fluorescent streptavidin conjugates were bothobtained from Invitrogen (Tokyo). Fluorescent mount-ing medium and goat serum (normal) were eachpurchased from DakoCytomation/Dako (Carpinteria,CA/Denmark).
Rabbit polyclonal anti-LC3 was purchased fromNovus Biologicals and anti-rabbit IgG HRP-linked F(ab′)2 fragment raised in donkey and Amersham ECLPlus Western blotting detection reagents were boughtfrom GE Healthcare.
Glutaraldehyde, 2,4,6-tri-dimethylaminomethylphenol (DMP-30, code-D032), docenyl succinicanhydride (DDSA EM, code-D027), EPON 812 resin(code-T026), and methyl nadic anhydride (MNA,code-MO12) were obtained from TAAB.
Tissue processing for H & E and immunostaining
After euthanization, each mouse was perfused trans-cardially with PBS and then its thymus and liver weresurgically removed and embedded in Tissue-Tek OCT(optimum cutting temperature) compound (SakuraFinetek USA, Inc., Torrance, CA, USA), frozen in liquidnitrogen, and then immediately stored at −30°C. When
76 AGE (2012) 34:75–85
needed for analyses, the samples were then sectioned at10-μm thickness using a Leica cryostat (CM3050 S;Leica Instrument Gmbh, Nussloch, Germany).
H & E staining
Thymus and liver cryosections (10 μm) were driedand fixed with 4% formaldehyde. The sections werethen stained with hematoxylin for 2 min, washed intap water for 5 min, then stained with eosin for 4 min,and washed in tap water for 5 min. After dehydration,the sections were mounted with mounting medium(Malinol), observed, and then photographed using aKeyence BZ-8000 microscope (Osaka) and with anOlympus BX50F microscope fitted with an OlympusDP12-2 camera (Olympus Optical Co. Ltd, Tokyo).
Immunostaining
Frozen thymic and liver tissue samples were sectionedat 10-μm thickness with the cryostat. The cryosec-tions were then fixed in acetone, and non-specificbinding sites were blocked with 0.2% bovine serumalbumin and 1% goat serum in PBS. The sectionswere then incubated with optimal dilutions of rabbitanti-LC3 (1:1,000) antibody. Immunoreactivity wasultimately detected with AF488-conjugated goat anti-rabbit IgG. After dehydration, all slides were mountedwith fluorescent mounting medium and viewed with aNikon Eclipse E600 (Kawasaki, Japan) equipped witha Radience 2100 model confocal scanning system(Bio-Rad, Hertfordshire, UK).
Western blot
Thymus and liver tissues were lyzed in SDS lysisbuffer (1 M Tris HCl (pH 6.8), 20 mM EDTANa2⋅2H2O, 10% SDS). Cell debris was removed bycentrifugation and the protein concentration wasdetermined by the Bio-Rad protein assay reagents.After sodium dodecyl sulfate-polyacrylamide gelelectrophoresis (SDS-PAGE), the proteins were trans-ferred to nitrocellulose membranes. The membraneswere blocked with 3% non-fat milk in PBS-T andincubated with primary antibody overnight at 4°C.After washing, the membrane was incubated withHRP-linked Amersham ECL anti-rabbit IgG F(ab)2
fragment and detected with Amersham ECL PlusWestern blotting detection reagents.
Ultrastructure of the thymus and liver
The thymus and liver of dedicated mice in eachregimen were removed, cut into 1-mm3 pieces,immediately immersed in 2.5% glutaraldehyde inphosphate buffer (pH 7.2) for 1 h, in osmiumtetraoxide for 1 h, and then dehydrated for 10 minin succession with 50%, 70%, 80%, 90%, and 100%ethyl alcohol. Thereafter, the samples were dehy-drated three times with propylene oxide (for 10 mineach), then infiltrated for 10 min with propyleneoxide and epoxy resin (v/v=1:1), embedded withEPON 812 epoxy resin, DDSA, DMP-30, and MNAresin, and then aggregated for 24–48 h at 60°C. Afterpolymerization, 70-nm ultrathin sections were madewith a diamond knife using Reichert-Nissei ultracuts(Leica), and these were then stained with uranylacetate and lead stain solution (Sigma Aldrich). Thestained sections were then observed and photo-graphed using a JEOL JEM-1400EX transmissionelectron microscope (Tokyo).
Autophagic structure observation and enumerationunder an electron microscope
Autophagic structure was enumerated in differenttypes of thymic epithelial cells in the thymus and inliver cell. Thymic epithelial cells in the cortical andmedulla regions were categorized according to aprevious description (Milićević et al. 2008). Subcap-sular epithelial cells are positioned against theconnective tissue and always have a basal lamina.These cells are irregular in shape and have delicatecellular prolongations. The nucleus is euchromaticand the cytoplasm has a very active appearance. “Paleepithelial cells” show the low electron density of thenucleus and cytoplasm. They are stellate in shapewith delicate cytoplasmic prolongations. The nucleusis very large, oval, markedly euchromatic, with patentnucleolus. The cytoplasm is not abundant, but reflectsa high cell activity. “Intermediate epithelial cells”show higher electron density of the nucleus andcytoplasm. The nucleus is polygonal in shape andshows a characteristic pattern of chromatin organiza-tion with prominent nucleolus. Cytoplasm is abundantand shows massive extensions. Dark epithelial cellsshow a very high electron density of the nucleus andcytoplasm. The large clumps of heterochromatin arescattered all over the nucleus. The cytoplasm is
AGE (2012) 34:75–85 77
sparse. The cytoplasmic prolongations are extensive andpacked with organelles. “Large medullary epithelialcells” have very abundant cytoplasm and inconspicuousprolongations. The cytoplasm displays dilated profilesof rough endoplasmic reticulum, large Golgi fields. Weobserved autophagic structure/vacuole in different typesof critical thymic epithelial cells such as subcapsullarepithelial cells, pale epithelial cells, intermediateepithelial cells, dark epithelial cells, and large medullaryepithelial cells.
We also enumerated the number of autophagicstructure/vacuole in epithelial cell extension where wecannot observe the epithelial cell nucleus. In case of theliver, we observed autophagic structure in the liver cell.
Statistical analysis
Statistical analysis was expressed as mean ± standarddeviation (SD). Student’s t test was used to determinestatistical significance. Results were consideredsignificant if the P value was <0.05.
Results
Histological changes of thymus and liver with age
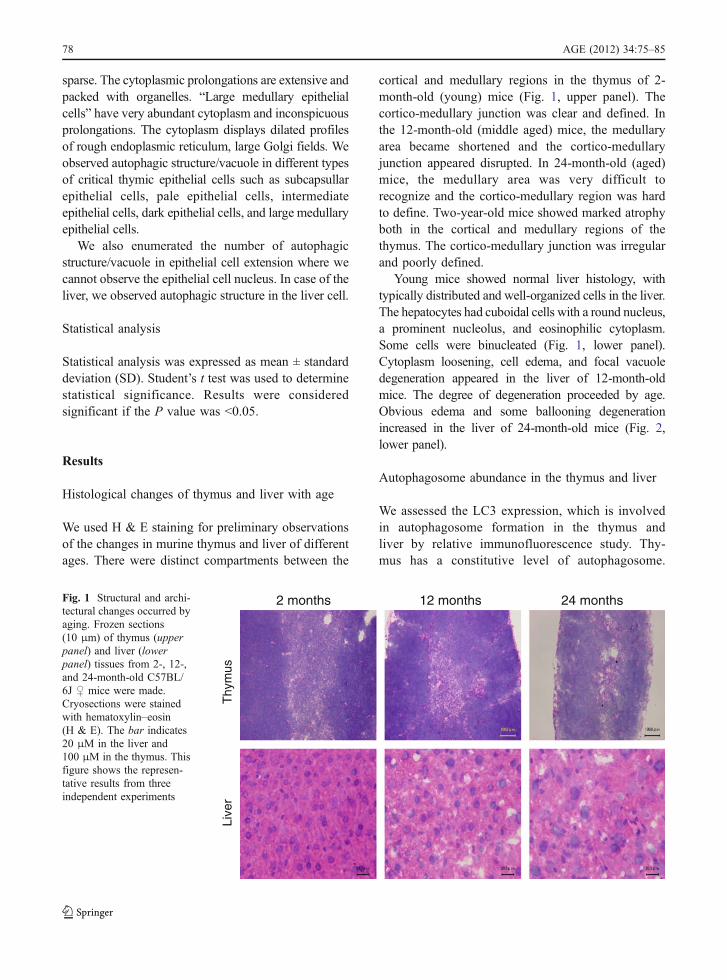
We used H & E staining for preliminary observationsof the changes in murine thymus and liver of differentages. There were distinct compartments between the
cortical and medullary regions in the thymus of 2-month-old (young) mice (Fig. 1, upper panel). Thecortico-medullary junction was clear and defined. Inthe 12-month-old (middle aged) mice, the medullaryarea became shortened and the cortico-medullaryjunction appeared disrupted. In 24-month-old (aged)mice, the medullary area was very difficult torecognize and the cortico-medullary region was hardto define. Two-year-old mice showed marked atrophyboth in the cortical and medullary regions of thethymus. The cortico-medullary junction was irregularand poorly defined.
Young mice showed normal liver histology, withtypically distributed and well-organized cells in the liver.The hepatocytes had cuboidal cells with a round nucleus,a prominent nucleolus, and eosinophilic cytoplasm.Some cells were binucleated (Fig. 1, lower panel).Cytoplasm loosening, cell edema, and focal vacuoledegeneration appeared in the liver of 12-month-oldmice. The degree of degeneration proceeded by age.Obvious edema and some ballooning degenerationincreased in the liver of 24-month-old mice (Fig. 2,lower panel).
Autophagosome abundance in the thymus and liver
We assessed the LC3 expression, which is involvedin autophagosome formation in the thymus andliver by relative immunofluorescence study. Thy-mus has a constitutive level of autophagosome.
2 months 12 months 24 months
Thy
mus
Live
r
Fig. 1 Structural and archi-tectural changes occurred byaging. Frozen sections(10 μm) of thymus (upperpanel) and liver (lowerpanel) tissues from 2-, 12-,and 24-month-old C57BL/6J ♀ mice were made.Cryosections were stainedwith hematoxylin–eosin(H & E). The bar indicates20 μM in the liver and100 μM in the thymus. Thisfigure shows the represen-tative results from threeindependent experiments
78 AGE (2012) 34:75–85
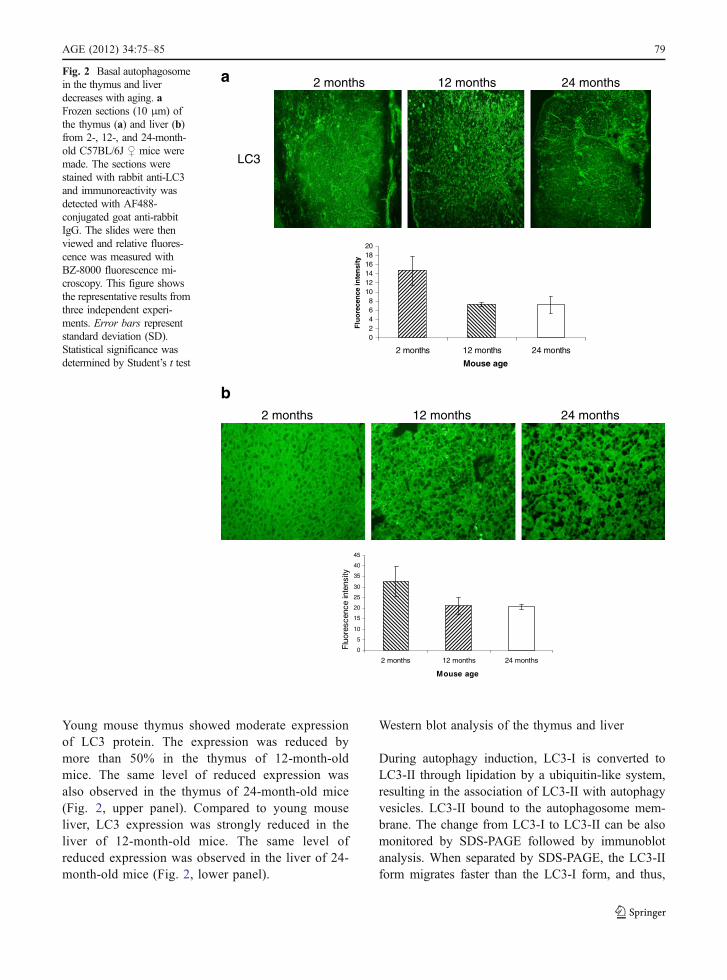
Young mouse thymus showed moderate expressionof LC3 protein. The expression was reduced bymore than 50% in the thymus of 12-month-oldmice. The same level of reduced expression wasalso observed in the thymus of 24-month-old mice(Fig. 2, upper panel). Compared to young mouseliver, LC3 expression was strongly reduced in theliver of 12-month-old mice. The same level ofreduced expression was observed in the liver of 24-month-old mice (Fig. 2, lower panel).
Western blot analysis of the thymus and liver
During autophagy induction, LC3-I is converted toLC3-II through lipidation by a ubiquitin-like system,resulting in the association of LC3-II with autophagyvesicles. LC3-II bound to the autophagosome mem-brane. The change from LC3-I to LC3-II can be alsomonitored by SDS-PAGE followed by immunoblotanalysis. When separated by SDS-PAGE, the LC3-IIform migrates faster than the LC3-I form, and thus,
LC3
2 months 12 months 24 months
02468
101214161820
2 months 12 months 24 months
Mouse ageF
luo
rece
nce
in
ten
sity
2 months 12 months 24 months
0
5
10
15
20
25
30
35
40
45
2 months 12 months 24 months
Mouse age
Flu
ores
cenc
e in
tens
ity
b
aFig. 2 Basal autophagosomein the thymus and liverdecreases with aging. aFrozen sections (10 μm) ofthe thymus (a) and liver (b)from 2-, 12-, and 24-month-old C57BL/6J ♀ mice weremade. The sections werestained with rabbit anti-LC3and immunoreactivity wasdetected with AF488-conjugated goat anti-rabbitIgG. The slides were thenviewed and relative fluores-cence was measured withBZ-8000 fluorescence mi-croscopy. This figure showsthe representative results fromthree independent experi-ments. Error bars representstandard deviation (SD).Statistical significance wasdetermined by Student’s t test
AGE (2012) 34:75–85 79
the increase in the LC3-II form can be correlated withautophagic turnover.
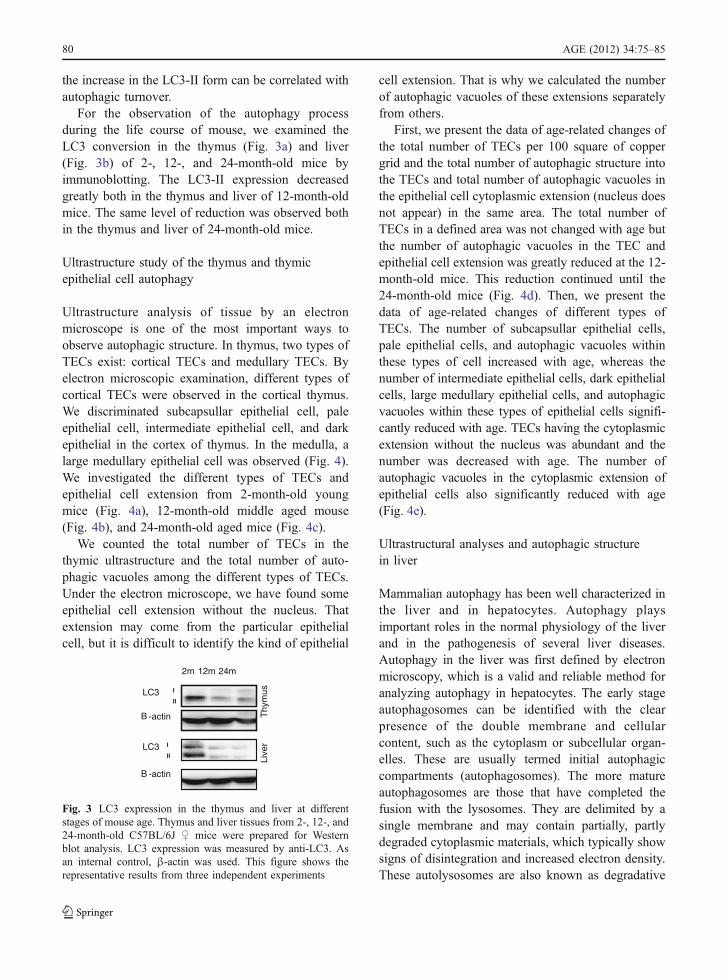
For the observation of the autophagy processduring the life course of mouse, we examined theLC3 conversion in the thymus (Fig. 3a) and liver(Fig. 3b) of 2-, 12-, and 24-month-old mice byimmunoblotting. The LC3-II expression decreasedgreatly both in the thymus and liver of 12-month-oldmice. The same level of reduction was observed bothin the thymus and liver of 24-month-old mice.
Ultrastructure study of the thymus and thymicepithelial cell autophagy
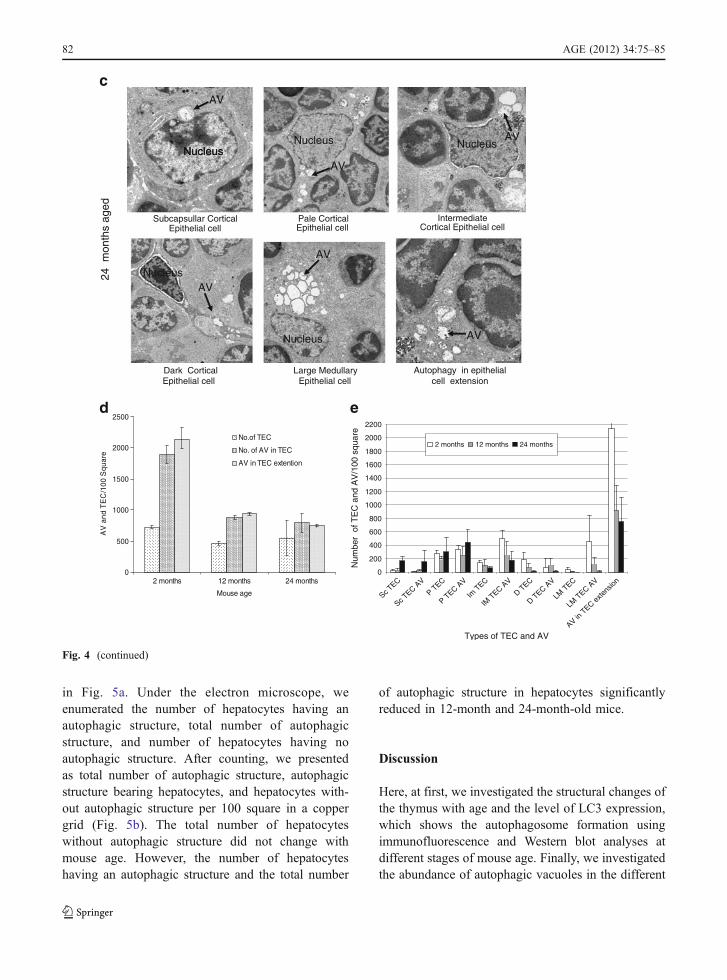
Ultrastructure analysis of tissue by an electronmicroscope is one of the most important ways toobserve autophagic structure. In thymus, two types ofTECs exist: cortical TECs and medullary TECs. Byelectron microscopic examination, different types ofcortical TECs were observed in the cortical thymus.We discriminated subcapsullar epithelial cell, paleepithelial cell, intermediate epithelial cell, and darkepithelial in the cortex of thymus. In the medulla, alarge medullary epithelial cell was observed (Fig. 4).We investigated the different types of TECs andepithelial cell extension from 2-month-old youngmice (Fig. 4a), 12-month-old middle aged mouse(Fig. 4b), and 24-month-old aged mice (Fig. 4c).
We counted the total number of TECs in thethymic ultrastructure and the total number of auto-phagic vacuoles among the different types of TECs.Under the electron microscope, we have found someepithelial cell extension without the nucleus. Thatextension may come from the particular epithelialcell, but it is difficult to identify the kind of epithelial
cell extension. That is why we calculated the numberof autophagic vacuoles of these extensions separatelyfrom others.
First, we present the data of age-related changes ofthe total number of TECs per 100 square of coppergrid and the total number of autophagic structure intothe TECs and total number of autophagic vacuoles inthe epithelial cell cytoplasmic extension (nucleus doesnot appear) in the same area. The total number ofTECs in a defined area was not changed with age butthe number of autophagic vacuoles in the TEC andepithelial cell extension was greatly reduced at the 12-month-old mice. This reduction continued until the24-month-old mice (Fig. 4d). Then, we present thedata of age-related changes of different types ofTECs. The number of subcapsullar epithelial cells,pale epithelial cells, and autophagic vacuoles withinthese types of cell increased with age, whereas thenumber of intermediate epithelial cells, dark epithelialcells, large medullary epithelial cells, and autophagicvacuoles within these types of epithelial cells signifi-cantly reduced with age. TECs having the cytoplasmicextension without the nucleus was abundant and thenumber was decreased with age. The number ofautophagic vacuoles in the cytoplasmic extension ofepithelial cells also significantly reduced with age(Fig. 4e).
Ultrastructural analyses and autophagic structurein liver
Mammalian autophagy has been well characterized inthe liver and in hepatocytes. Autophagy playsimportant roles in the normal physiology of the liverand in the pathogenesis of several liver diseases.Autophagy in the liver was first defined by electronmicroscopy, which is a valid and reliable method foranalyzing autophagy in hepatocytes. The early stageautophagosomes can be identified with the clearpresence of the double membrane and cellularcontent, such as the cytoplasm or subcellular organ-elles. These are usually termed initial autophagiccompartments (autophagosomes). The more matureautophagosomes are those that have completed thefusion with the lysosomes. They are delimited by asingle membrane and may contain partially, partlydegraded cytoplasmic materials, which typically showsigns of disintegration and increased electron density.These autolysosomes are also known as degradative
Thy
musLC3 I
II
2m 12m 24m
-actin
Live
rLC3 I
II
-actin
B
B
Fig. 3 LC3 expression in the thymus and liver at differentstages of mouse age. Thymus and liver tissues from 2-, 12-, and24-month-old C57BL/6J ♀ mice were prepared for Westernblot analysis. LC3 expression was measured by anti-LC3. Asan internal control, β-actin was used. This figure shows therepresentative results from three independent experiments
80 AGE (2012) 34:75–85

autophagic compartments. The extent of autophagymay be determined by morphometric analysis. Thenumber of autophagosomes, autolysosomes, or totalautophagic vesicles can be determined in a given cellsection, or area. The size or the area of the autophagic
vesicles, relative to the size or area of the cell, can bealso determined.
We investigated the autophagic structure in theliver from 2-, 12-, and 24-month-old mice. Represen-tative pictures from different ages of mice are shown
2 m
onth
s ag
ed
Subcapsullar Cortical Epithelial cell
Pale Cortical Epithelial cell
IntermediateCortical Epithelial cell
Dark Cortical Epithelial cell
Large MedullaryEpithelial cell
Autophagy in epithelialcell extension
NucleusNucleus
Nucleus
NucleusNucleus
AV
AV
AV
AVAVAV
12m
onth
sage
d
Nucleus
Nucleus
NucleusAV
Nucleus
Nucleus
AV AV
AVAVAV
Subcapsullar Cortical Epithelial cell
Pale Cortical Epithelial cell
IntermediateCortical Epithelial cell
Dark Cortical Epithelial cell
Large MedullaryEpithelial cell
Autophagy in epithelialcell extension
a
b
Fig. 4 Ultrastructure analysisfor thymic epithelial cells forautophagy. Electron micro-graph (×2,500) of thymustissues from a 2-, b 12-, and c24-month-old C57BL/6J ♀mice. Seventy-nanometerultrathin sections werestained with uranyl acetateand lead stain solution. Theywere observed under thetransmission electron micro-scope and photographed at×2,500. Arrow marks indi-cate the autophagic structurein thymic epithelial cells. dThe number of autophagicstructure in thymic epithelialcells were enumerated underthe electron microscope andpresented as the number ofthymic epithelial cells andautophagic structure per 100squares in the copper grid.This figure shows the repre-sentative results from threeindependent experiments. eThe number of autophagicstructure in subcapsullarthymic epithelial cell (ScTEC), pale thymic epithelialcell (P TEC), intermediatethymic epithelial cell (ImTEC), dark thymic epithelialcell (D TEC), large medullarythymic epithelial cell (LMTEC), and in epithelial cellextension was enumeratedunder the electron micro-scope and presented as thenumber of thymic epithelialcells and autophagic vacuole(AV) per 100 squares in thecopper grid. This figureshows the representativeresults from three indepen-dent experiments
AGE (2012) 34:75–85 81
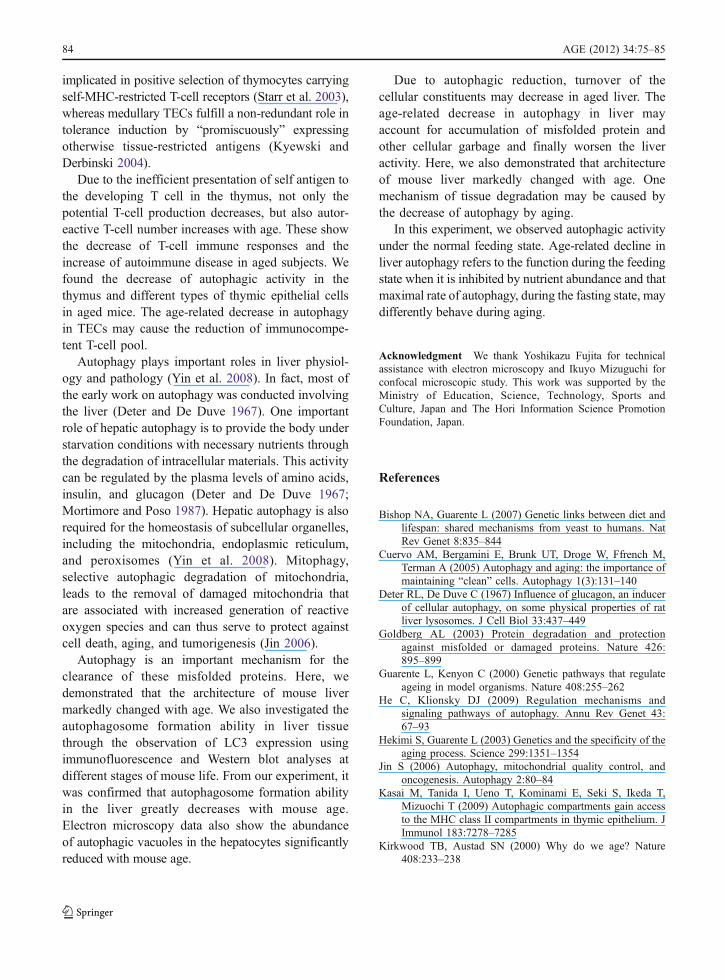
in Fig. 5a. Under the electron microscope, weenumerated the number of hepatocytes having anautophagic structure, total number of autophagicstructure, and number of hepatocytes having noautophagic structure. After counting, we presentedas total number of autophagic structure, autophagicstructure bearing hepatocytes, and hepatocytes with-out autophagic structure per 100 square in a coppergrid (Fig. 5b). The total number of hepatocyteswithout autophagic structure did not change withmouse age. However, the number of hepatocyteshaving an autophagic structure and the total number
of autophagic structure in hepatocytes significantlyreduced in 12-month and 24-month-old mice.
Discussion
Here, at first, we investigated the structural changes ofthe thymus with age and the level of LC3 expression,which shows the autophagosome formation usingimmunofluorescence and Western blot analyses atdifferent stages of mouse age. Finally, we investigatedthe abundance of autophagic vacuoles in the different
24 m
onth
s ag
ed
Subcapsullar CorticalEpithelial cell
Pale CorticalEpithelial cell
IntermediateCortical Epithelial cell
Dark CorticalEpithelial cell
Large MedullaryEpithelial cell
Autophagy in epithelialcell extension
Nucleus
AV
NucleusNucleus Nucleus
Nucleus
Nucleus
AV
AV
AV
AV
AV
c
d e
0
500
1000
1500
2000
2500
2 months 12 months 24 months
Mouse age
AV
and
TE
C/1
00 S
quar
e
No.of TEC
No. of AV in TEC
AV in TEC extention
0
200
400
600
800
1000
1200
1400
1600
1800
2000
2200
Sc TEC
Sc TEC A
V
P TEC
P TEC A
V
Im T
EC
IM T
EC AV
D TEC
D TEC A
V
LM T
EC
LM T
EC AV
AV in T
EC exten
sion
Types of TEC and AV
Num
ber
of T
EC
and
AV
/100
squ
are
2 months 12 months 24 months
Fig. 4 (continued)
82 AGE (2012) 34:75–85

types of cortical thymic epithelial cells, large medul-lary epithelial cells, and in the cytoplasmic extensionof epithelial cells. In this study, we have found thatwith increasing age the medullary and cortical areasof the mouse thymus were greatly changed in terms oftheir organization and a decrease in thymus size wasobserved. The medullary area was reduced and thecortico-medullary junction became disrupted. In theaged mice, the medullary area was broken intosmaller islands very difficult to recognize and thecortico-medullary region was difficult to define. Inour previous experiment, we also found that corticaland medullary thymic epithelial cells showed disorga-nized distribution throughout the thymus (Uddin et al.2010). Both the Western blot and immunofluorescencestudy revealed that the thymus has autophagic vacuoleformation capability under normal conditions. Com-pared to young mouse thymus, the autophagic vacuoleformation ability decreases with age. To show moreprecisely the age-related changes in TECs, we usedelectron microscopic studies. We showed that the
number of subcapsullar epithelial cells, pale epithelialcells, and autophagic vacuoles within these types ofcells increases with mouse age. A large number of theintermediate epithelial cells, dark epithelial cells, largemedullary epithelial cells, and autophagic vacuolewithin these types of epithelial cells significantlyreduced with mouse age. The number of autophagicvacuoles in the cytoplasmic extension of epithelial cellsalso significantly reduced with age. What caused theseresults? One possibility is that some parts of TECs withcytoplasmic extension without the nucleus are includedin subcapsullar epithelial cells and pale epithelial cells.Because the number of TECs with cytoplasmic exten-sion without nucleus is much larger than the subcap-sullar epithelial cells and pale epithelial cells, thesetypes of TECs may decrease with age. At present, it isdifficult to conclude whether these TECs are decreasedwith age or not. Some markers, which discriminate thesubtype of TECs, will solve this question.
Thymic epithelial cells had a high constitutive levelof autophagy. Cortical TECs have predominantly been
2 months 12 months 24 months
AV
AV
AV
AV
AV
a
b
0
50
100
150
200
250
300
350
400
450
2 Months 12 months 24 months
Mouse age
Hep
atoc
yte
and
AV
/100
squ
ar
Hepatocye without AVHepatocye with AVNumber of AV
Fig. 5 Ultrastructure analy-sis of liver cells for auto-phagic structure. a Electronmicrograph (×2,500) of livertissues from 2-, 12-, and 24-month-old C57BL/6J ♀mice. Seventy-nanometerultrathin sections werestained with uranyl acetateand lead stain solution. Theywere observed under thetransmission electron micro-scope and photographed at×2,500. Arrow marksindicate the autophagy inliver cells. b The number ofautophagic structure inliver cells was enumeratedunder the electron micro-scope and presented as thenumber of liver cells andautophagic structure per 100squares in the copper grid.This figure shows therepresentative results fromthree independent experi-ments. Error bars representstandard deviation (SD).Statistical significancewas determined by Student’st test
AGE (2012) 34:75–85 83
implicated in positive selection of thymocytes carryingself-MHC-restricted T-cell receptors (Starr et al. 2003),whereas medullary TECs fulfill a non-redundant role intolerance induction by “promiscuously” expressingotherwise tissue-restricted antigens (Kyewski andDerbinski 2004).
Due to the inefficient presentation of self antigen tothe developing T cell in the thymus, not only thepotential T-cell production decreases, but also autor-eactive T-cell number increases with age. These showthe decrease of T-cell immune responses and theincrease of autoimmune disease in aged subjects. Wefound the decrease of autophagic activity in thethymus and different types of thymic epithelial cellsin aged mice. The age-related decrease in autophagyin TECs may cause the reduction of immunocompe-tent T-cell pool.
Autophagy plays important roles in liver physiol-ogy and pathology (Yin et al. 2008). In fact, most ofthe early work on autophagy was conducted involvingthe liver (Deter and De Duve 1967). One importantrole of hepatic autophagy is to provide the body understarvation conditions with necessary nutrients throughthe degradation of intracellular materials. This activitycan be regulated by the plasma levels of amino acids,insulin, and glucagon (Deter and De Duve 1967;Mortimore and Poso 1987). Hepatic autophagy is alsorequired for the homeostasis of subcellular organelles,including the mitochondria, endoplasmic reticulum,and peroxisomes (Yin et al. 2008). Mitophagy,selective autophagic degradation of mitochondria,leads to the removal of damaged mitochondria thatare associated with increased generation of reactiveoxygen species and can thus serve to protect againstcell death, aging, and tumorigenesis (Jin 2006).
Autophagy is an important mechanism for theclearance of these misfolded proteins. Here, wedemonstrated that the architecture of mouse livermarkedly changed with age. We also investigated theautophagosome formation ability in liver tissuethrough the observation of LC3 expression usingimmunofluorescence and Western blot analyses atdifferent stages of mouse life. From our experiment, itwas confirmed that autophagosome formation abilityin the liver greatly decreases with mouse age.Electron microscopy data also show the abundanceof autophagic vacuoles in the hepatocytes significantlyreduced with mouse age.
Due to autophagic reduction, turnover of thecellular constituents may decrease in aged liver. Theage-related decrease in autophagy in liver mayaccount for accumulation of misfolded protein andother cellular garbage and finally worsen the liveractivity. Here, we also demonstrated that architectureof mouse liver markedly changed with age. Onemechanism of tissue degradation may be caused bythe decrease of autophagy by aging.
In this experiment, we observed autophagic activityunder the normal feeding state. Age-related decline inliver autophagy refers to the function during the feedingstate when it is inhibited by nutrient abundance and thatmaximal rate of autophagy, during the fasting state, maydifferently behave during aging.
Acknowledgment We thank Yoshikazu Fujita for technicalassistance with electron microscopy and Ikuyo Mizuguchi forconfocal microscopic study. This work was supported by theMinistry of Education, Science, Technology, Sports andCulture, Japan and The Hori Information Science PromotionFoundation, Japan.
References
Bishop NA, Guarente L (2007) Genetic links between diet andlifespan: shared mechanisms from yeast to humans. NatRev Genet 8:835–844
Cuervo AM, Bergamini E, Brunk UT, Droge W, Ffrench M,Terman A (2005) Autophagy and aging: the importance ofmaintaining “clean” cells. Autophagy 1(3):131–140
Deter RL, De Duve C (1967) Influence of glucagon, an inducerof cellular autophagy, on some physical properties of ratliver lysosomes. J Cell Biol 33:437–449
Goldberg AL (2003) Protein degradation and protectionagainst misfolded or damaged proteins. Nature 426:895–899
Guarente L, Kenyon C (2000) Genetic pathways that regulateageing in model organisms. Nature 408:255–262
He C, Klionsky DJ (2009) Regulation mechanisms andsignaling pathways of autophagy. Annu Rev Genet 43:67–93
Hekimi S, Guarente L (2003) Genetics and the specificity of theaging process. Science 299:1351–1354
Jin S (2006) Autophagy, mitochondrial quality control, andoncogenesis. Autophagy 2:80–84
Kasai M, Tanida I, Ueno T, Kominami E, Seki S, Ikeda T,Mizuochi T (2009) Autophagic compartments gain accessto the MHC class II compartments in thymic epithelium. JImmunol 183:7278–7285
Kirkwood TB, Austad SN (2000) Why do we age? Nature408:233–238
84 AGE (2012) 34:75–85

Kyewski B, Derbinski J (2004) Self-representation in the thymus:an extended view. Nature Rev Immunol 4:688–698
Levine B, Deretic V (2007) Unveiling the roles of autophagy ininnate and adaptive immunity. Nat Rev Immunol 7:767–777
Milićević NM, Nohroudi K, Milićević Z, Westermann J (2008)Activation of cortical and inhibited differentiation ofmedullary epithelial cells in the thymus of lymphotoxin-beta receptor-deficient mice: an ultrastructural study. JAnat 212(2):114–124
Mizushima N, Klionsky D (2007) Protein turnover viaautophagy: implications for metabolism. Annu Rev Nutr27:19–40
Morimoto RI (2008) Proteotoxic stress and inducible chaperonenetworks in neurodegenerative disease and aging. GenesDev 22:1427–1438
Mortimore GE, Poso AR (1987) Intracellular protein catabolismand its control during nutrient deprivation and supply. AnnuRev Nutr 7:539–564
Nedjic J, AichingerM, Emmerich J,Mizushima N, Klein L (2008)Autophagy in thymic epithelium shapes the T-cell repertoireand is essential for tolerance. Nature 455:396–400
Rajawat YS, Bossis I (2008) Autophagy in aging and inneurodegenerative disorders. Hormones 7:46–61
Starr TK, Jameson SC, Hogquist KA (2003) Positive andnegative selection of T cells. Annu Rev Immunol 21:139–176
Uddin MN, Nishio N, Ito S, Suzuki H, Isobe K (2010) Toxiceffects of D-galactose on thymus and spleen that resembleaging. J Immunotoxicol 7(3):165–173
Yin XM, Ding WX, Gao W (2008) Autophagy in the liver.Hepatology 47:1773–1785
AGE (2012) 34:75–85 85
Related Documents