Harsh Mehta (Research Analyst) 07 December 2012 [email protected] Automobile Monthly Dashboard November 2012 Festive party over for Automobile companies; product innovation post festive season to drive sales

Welcome message from author
This document is posted to help you gain knowledge. Please leave a comment to let me know what you think about it! Share it to your friends and learn new things together.
Transcript
Harsh Mehta (Research Analyst) 07 December 2012 [email protected]
Automobile Monthly Dashboard
November 2012
Festive party over for Automobile companies; product innovation post festive season to drive sales
Automobile Monthly Dashboard November 2012 7 December 2012
1 | P a g e
Contents November 2012: Monthly Sales Preview ................................................................................................................................... 2
Outlook ............................................................................................................................................................................................ 4
Peer Group Comparison ............................................................................................................................................................... 4
Monthly Performance of Leading Automobile Companies ...................................................................................................... 5
Hero MotoCorp: HMSI overtakes HMCL in premium bikes segment ................................... 5
Bajaj Auto: Festive party over; increase market share to increase volume .......................... 6
TVS Motor: Slump in sales continues after festive season .................................................. 7
Tata Motors: Fast losing ground in passenger car segment ................................................ 8
Maruti Suzuki: New Alto and diesel engine cars to drive sales .......................................... 10
Mahindra & Mahindra: New product launch in UV segment and revival of tractor segment to drive sales ................................................................................................................................. 12
New Launches .............................................................................................................................................................................. 14
Annexure ....................................................................................................................................................................................... 15
Contact Details ............................................................................................................................................................................. 21
Automobile Monthly Dashboard November 2012 7 December 2012
2 I Page
November 2012: Monthly Sales Preview
New product launches in festive season failed to set off fireworks for automakers, despite several new launches. New launches help in creating an excitement within the customers. However, this time new launches could not generate interest. Domestic passenger car segment grew by 2% YoY in November 2012. The festive season did play a role in changing the market sentiment, however, due to the current economic conditions and rise in inflation; the festival season has been weak compared to last year. The automotive industry did have reason to cheer with scooter and motorcycle makers doing well, courtesy rural sales. Market leader Hero MotoCorp (HMCL) sold more than 500,000 units for the second consecutive time in six months although its sales of around 500,000 units were down by 6.4% growth over last November. Rival Honda Motorcycles (HMSI) grew at 12% to sell 220,000 units while Bajaj Auto (BAL) registered almost flat growth.
Passenger Car Segment
The sluggish trend in car sales has improved 2% YoY due to new product launches across the segments
MSIL, market leader in Passenger Car Segment, was up 12.5% YoY and flat MoM. Contribution from MSIL’s mini segment is down 687 bps YoY and 542 bps MoM to 35.5%;
largest volume contributor for MSIL at 36,679 units. Alto still maintains its Numero Uno position in Indian Domestic Passenger Car Market followed by Swift and Dzire, both from MSIL stable.
Hyundai Motors, 2nd
largest Passenger Cars in domestic market, was down 2.3% YoY and 4.1% MoM; both domestic and export segment have shown sequential decline.
Hyundai Verna sales are around 4,000 unit mark; way below 6,000 units mark of Q1 FY13. Eon has registered second highest ever monthly sales to 8,449 units.
Tata Motors failed to regain its no.3 position from Mahindra & Mahindra (M&M) in domestic Passenger Car segment in November 2012. Combined sales of Indica and Indigo series were down 41.4% YoY and 19.3% MoM despite discounts on various segments. M&M’s Utility segment continues its stellar performance with XUV 5OO selling around
4,237 units and newly launches Quanto at 2,297 units. Rexton from Ssangyong stable sold around 121 units.
General Motors, Toyota and Volkswagen continue to have negative growth while Nissan, and Renault reported higher growth due to new model launches such Duster, Scala and Sunny. Honda’s flagship model “City” clocked 1,218 units in November; lowest ever monthly sales in FY13 and Volkswagen’s Vento maintained its steady monthly volumes of around 2,000 units mark while Hyundai Verna sold around 4,000 units mark .
Exports for Passenger cars with Hyundai are down by 4.8% YoY and MSIL is up 38.4% YoY and 73.3% MoM.
2-W and 3-W segment
Overall 2-W sales were down 1.3% YoY and 7.1% MoM to above 1.2 million units. Hero MotoCorp, is down 6.4% YoY and 5.1% MoM to above 5,00,000 units mark for second consecutive time in six months. HMSI motorcycle sales were higher by 36% YoY due to launch of “Dream Yuga”. HMSI scooter segment de-grew by 4% YoY and 11% MoM
while TVS motor sales were down by 2.1%YoY and 9.8% MoM.
As per BAL Management, “Festive season is over and nothing has changed fundamentally. December onwards the industry will again witness a relatively flat and difficult situation. The only way to grow volume then would be to grow market share”.
Commercial Vehicles
LCV segment continues its robust sales volumes as it is insulated from weak economic cycles. Contribution from LCV segment has increased from 61% in end FY12 to 68.6% in Q2 FY13.
Overall M&HCV volumes are down due to lower freight rates & no pick-up in Capex cycle. Tata Motors, market leader in M&HCV segment volumes were down to 9,000 units
in November ( after clocking 17,500 units monthly in FY12) despite to slew of new launches.
Festive party over for Automobile companies; product innovation post festive season to drive sales
Automobile Monthly Dashboard November 2012 7 December 2012
3 I Page
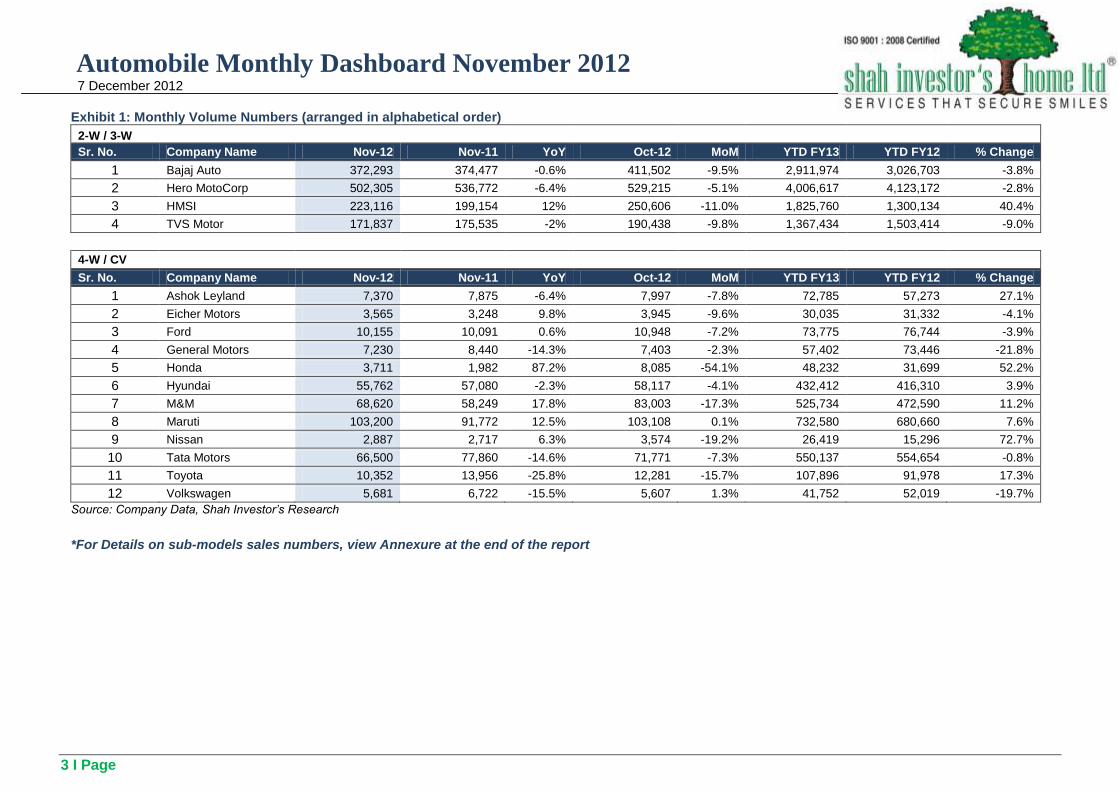
Exhibit 1: Monthly Volume Numbers (arranged in alphabetical order)
2-W / 3-W
Sr. No. Company Name Nov-12 Nov-11 YoY Oct-12 MoM YTD FY13 YTD FY12 % Change
1 Bajaj Auto 372,293 374,477 -0.6% 411,502 -9.5% 2,911,974 3,026,703 -3.8%
2 Hero MotoCorp 502,305 536,772 -6.4% 529,215 -5.1% 4,006,617 4,123,172 -2.8%
3 HMSI 223,116 199,154 12% 250,606 -11.0% 1,825,760 1,300,134 40.4%
4 TVS Motor 171,837 175,535 -2% 190,438 -9.8% 1,367,434 1,503,414 -9.0%
4-W / CV
Sr. No. Company Name Nov-12 Nov-11 YoY Oct-12 MoM YTD FY13 YTD FY12 % Change
1 Ashok Leyland 7,370 7,875 -6.4% 7,997 -7.8% 72,785 57,273 27.1%
2 Eicher Motors 3,565 3,248 9.8% 3,945 -9.6% 30,035 31,332 -4.1%
3 Ford 10,155 10,091 0.6% 10,948 -7.2% 73,775 76,744 -3.9%
4 General Motors 7,230 8,440 -14.3% 7,403 -2.3% 57,402 73,446 -21.8%
5 Honda 3,711 1,982 87.2% 8,085 -54.1% 48,232 31,699 52.2%
6 Hyundai 55,762 57,080 -2.3% 58,117 -4.1% 432,412 416,310 3.9%
7 M&M 68,620 58,249 17.8% 83,003 -17.3% 525,734 472,590 11.2%
8 Maruti 103,200 91,772 12.5% 103,108 0.1% 732,580 680,660 7.6%
9 Nissan 2,887 2,717 6.3% 3,574 -19.2% 26,419 15,296 72.7%
10 Tata Motors 66,500 77,860 -14.6% 71,771 -7.3% 550,137 554,654 -0.8%
11 Toyota 10,352 13,956 -25.8% 12,281 -15.7% 107,896 91,978 17.3%
12 Volkswagen 5,681 6,722 -15.5% 5,607 1.3% 41,752 52,019 -19.7%
Source: Company Data, Shah Investor’s Research
*For Details on sub-models sales numbers, view Annexure at the end of the report
Automobile Monthly Dashboard November 2012 7 December 2012
4 I Page
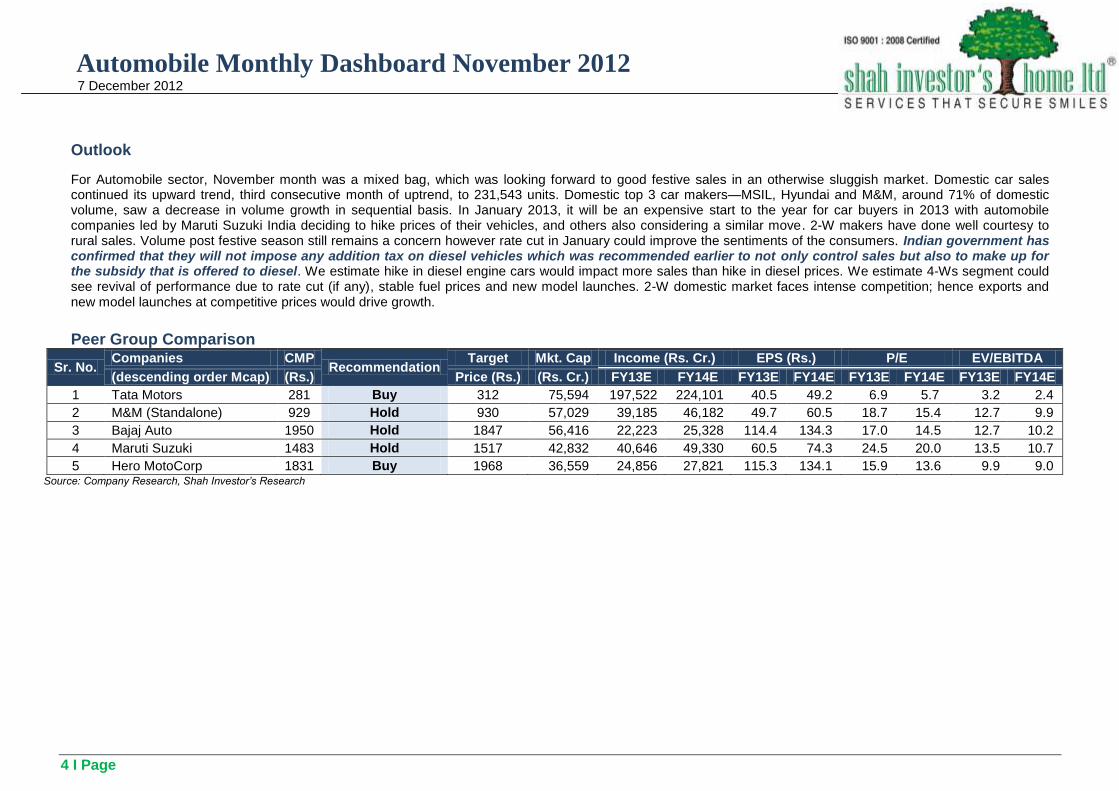
Outlook
For Automobile sector, November month was a mixed bag, which was looking forward to good festive sales in an otherwise sluggish market. Domestic car sales continued its upward trend, third consecutive month of uptrend, to 231,543 units. Domestic top 3 car makers—MSIL, Hyundai and M&M, around 71% of domestic volume, saw a decrease in volume growth in sequential basis. In January 2013, it will be an expensive start to the year for car buyers in 2013 with automobile companies led by Maruti Suzuki India deciding to hike prices of their vehicles, and others also considering a similar move. 2-W makers have done well courtesy to rural sales. Volume post festive season still remains a concern however rate cut in January could improve the sentiments of the consumers. Indian government has confirmed that they will not impose any addition tax on diesel vehicles which was recommended earlier to not only control sales but also to make up for the subsidy that is offered to diesel. We estimate hike in diesel engine cars would impact more sales than hike in diesel prices. We estimate 4-Ws segment could see revival of performance due to rate cut (if any), stable fuel prices and new model launches. 2-W domestic market faces intense competition; hence exports and new model launches at competitive prices would drive growth.
Peer Group Comparison
Sr. No. Companies CMP
Recommendation Target Mkt. Cap Income (Rs. Cr.) EPS (Rs.) P/E EV/EBITDA
(descending order Mcap) (Rs.) Price (Rs.) (Rs. Cr.) FY13E FY14E FY13E FY14E FY13E FY14E FY13E FY14E
1 Tata Motors 281 Buy 312 75,594 197,522 224,101 40.5 49.2 6.9 5.7 3.2 2.4
2 M&M (Standalone) 929 Hold 930 57,029 39,185 46,182 49.7 60.5 18.7 15.4 12.7 9.9
3 Bajaj Auto 1950 Hold 1847 56,416 22,223 25,328 114.4 134.3 17.0 14.5 12.7 10.2
4 Maruti Suzuki 1483 Hold 1517 42,832 40,646 49,330 60.5 74.3 24.5 20.0 13.5 10.7
5 Hero MotoCorp 1831 Buy 1968 36,559 24,856 27,821 115.3 134.1 15.9 13.6 9.9 9.0 Source: Company Research, Shah Investor’s Research
Automobile Monthly Dashboard November 2012 7 December 2012
5 I Page
Monthly Performance of Leading Automobile Companies
Hero MotoCorp: HMSI overtakes HMCL in premium bikes segment
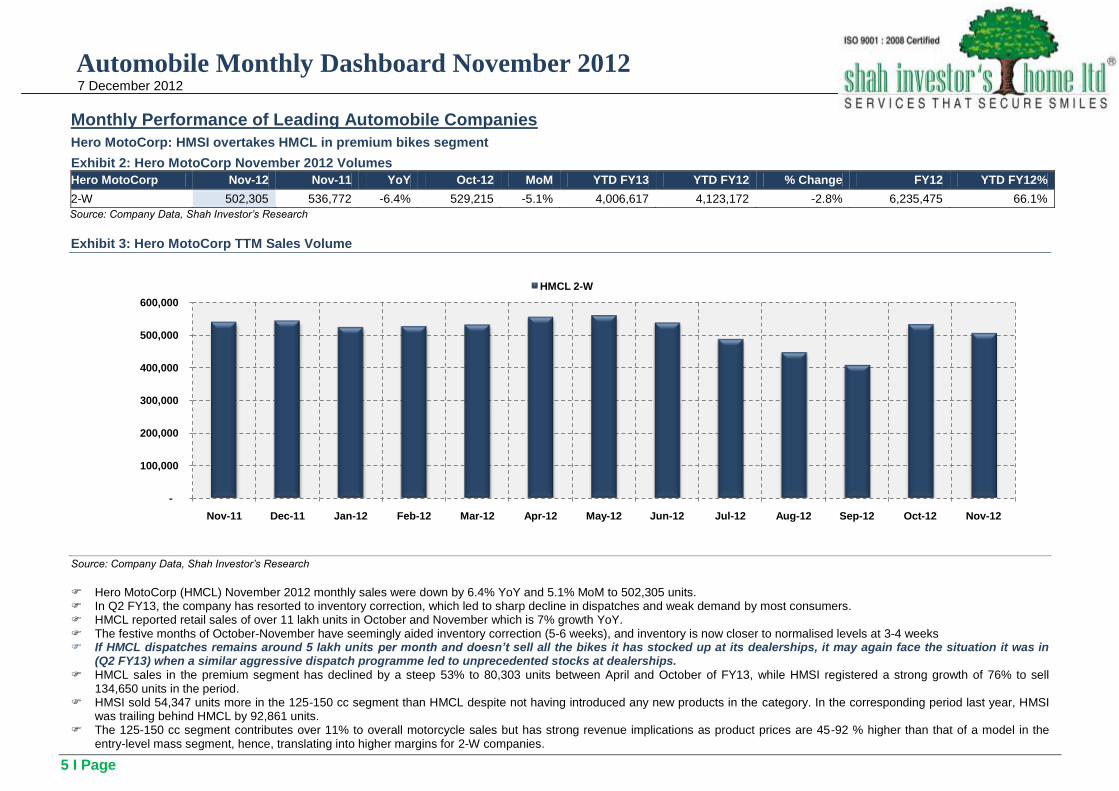
Exhibit 2: Hero MotoCorp November 2012 Volumes
Hero MotoCorp Nov-12 Nov-11 YoY Oct-12 MoM YTD FY13 YTD FY12 % Change FY12 YTD FY12%
2-W 502,305 536,772 -6.4% 529,215 -5.1% 4,006,617 4,123,172 -2.8% 6,235,475 66.1%
Source: Company Data, Shah Investor’s Research
Exhibit 3: Hero MotoCorp TTM Sales Volume
Source: Company Data, Shah Investor’s Research
Hero MotoCorp (HMCL) November 2012 monthly sales were down by 6.4% YoY and 5.1% MoM to 502,305 units. In Q2 FY13, the company has resorted to inventory correction, which led to sharp decline in dispatches and weak demand by most consumers. HMCL reported retail sales of over 11 lakh units in October and November which is 7% growth YoY. The festive months of October-November have seemingly aided inventory correction (5-6 weeks), and inventory is now closer to normalised levels at 3-4 weeks If HMCL dispatches remains around 5 lakh units per month and doesn’t sell all the bikes it has stocked up at its dealerships, it may again face the situation it was in
(Q2 FY13) when a similar aggressive dispatch programme led to unprecedented stocks at dealerships. HMCL sales in the premium segment has declined by a steep 53% to 80,303 units between April and October of FY13, while HMSI registered a strong growth of 76% to sell
134,650 units in the period. HMSI sold 54,347 units more in the 125-150 cc segment than HMCL despite not having introduced any new products in the category. In the corresponding period last year, HMSI
was trailing behind HMCL by 92,861 units. The 125-150 cc segment contributes over 11% to overall motorcycle sales but has strong revenue implications as product prices are 45-92 % higher than that of a model in the
entry-level mass segment, hence, translating into higher margins for 2-W companies.
-
100,000
200,000
300,000
400,000
500,000
600,000
Nov-11 Dec-11 Jan-12 Feb-12 Mar-12 Apr-12 May-12 Jun-12 Jul-12 Aug-12 Sep-12 Oct-12 Nov-12
HMCL 2-W
Automobile Monthly Dashboard November 2012 7 December 2012
6 I Page
Bajaj Auto: Festive party over; increase market share to increase volume
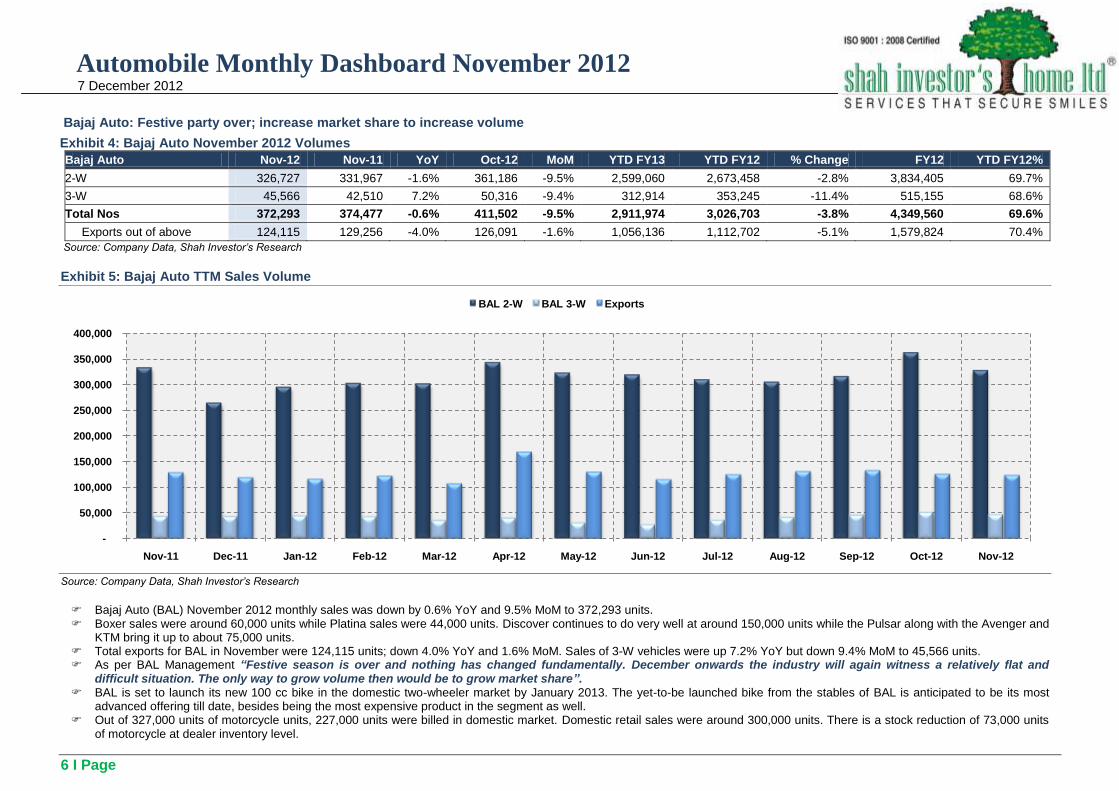
Exhibit 4: Bajaj Auto November 2012 Volumes
Bajaj Auto Nov-12 Nov-11 YoY Oct-12 MoM YTD FY13 YTD FY12 % Change FY12 YTD FY12%
2-W 326,727 331,967 -1.6% 361,186 -9.5% 2,599,060 2,673,458 -2.8% 3,834,405 69.7%
3-W 45,566 42,510 7.2% 50,316 -9.4% 312,914 353,245 -11.4% 515,155 68.6%
Total Nos 372,293 374,477 -0.6% 411,502 -9.5% 2,911,974 3,026,703 -3.8% 4,349,560 69.6%
Exports out of above 124,115 129,256 -4.0% 126,091 -1.6% 1,056,136 1,112,702 -5.1% 1,579,824 70.4%
Source: Company Data, Shah Investor’s Research
Exhibit 5: Bajaj Auto TTM Sales Volume
Source: Company Data, Shah Investor’s Research
Bajaj Auto (BAL) November 2012 monthly sales was down by 0.6% YoY and 9.5% MoM to 372,293 units. Boxer sales were around 60,000 units while Platina sales were 44,000 units. Discover continues to do very well at around 150,000 units while the Pulsar along with the Avenger and
KTM bring it up to about 75,000 units. Total exports for BAL in November were 124,115 units; down 4.0% YoY and 1.6% MoM. Sales of 3-W vehicles were up 7.2% YoY but down 9.4% MoM to 45,566 units. As per BAL Management “Festive season is over and nothing has changed fundamentally. December onwards the industry will again witness a relatively flat and
difficult situation. The only way to grow volume then would be to grow market share”. BAL is set to launch its new 100 cc bike in the domestic two-wheeler market by January 2013. The yet-to-be launched bike from the stables of BAL is anticipated to be its most
advanced offering till date, besides being the most expensive product in the segment as well. Out of 327,000 units of motorcycle units, 227,000 units were billed in domestic market. Domestic retail sales were around 300,000 units. There is a stock reduction of 73,000 units
of motorcycle at dealer inventory level.
-
50,000
100,000
150,000
200,000
250,000
300,000
350,000
400,000
Nov-11 Dec-11 Jan-12 Feb-12 Mar-12 Apr-12 May-12 Jun-12 Jul-12 Aug-12 Sep-12 Oct-12 Nov-12
BAL 2-W BAL 3-W Exports
Automobile Monthly Dashboard November 2012 7 December 2012
7 I Page
TVS Motor: Slump in sales continues after festive season
Exhibit 6: TVS Motor November 2012 Sales Volume
TVS Nov-12 Nov-11 YoY Oct-12 MoM YTD FY13 YTD FY12 % Change FY12 YTD FY12%
Motorcycle 65,494 62,608 4.6% 72,687 -9.9% 567,909 593,779 -4.4% 845,062 70.3%
Scooters 37,470 44,301 -15.4% 43,973 -14.8% 350,888 366,885 -4.4% 529,246 69.3%
3-W 1,701 858 98.3% 1,602 6.2% 12,810 8,319 54.0% 13,725 60.6%
Mopeds 47,092 43,497 8.3% 53,613 -12.2% 428,168 326,698 31.1% 526,347 62.1%
Domestic Sales 151,757 151,264 0.3% 171,875 -11.7% 1,359,775 1,295,681 4.9% 1,914,380 67.7%
Exports 20,080 24,271 -17.3% 18,563 8.2% 179,496 207,733 -13.6% 287,474 72.3%
2W 16,727 22,423 -25.4% 16,103 3.9% 156,844 186,528 -15.9% 261,432 71.3%
3W 3,353 1,848 81.4% 2,460 36.3% 22,652 21,205 6.8% 26,042 81.4%
Total Sales 171,837 175,535 -2.1% 190,438 -9.8% 1,539,271 1,503,414 2.4% 2,201,854 68.3%
Source: Company Data, Shah Investor’s Research
Exhibit 7: TVS Motor TTM Sales Volume
Source: Company Data, Shah Investor’s Research
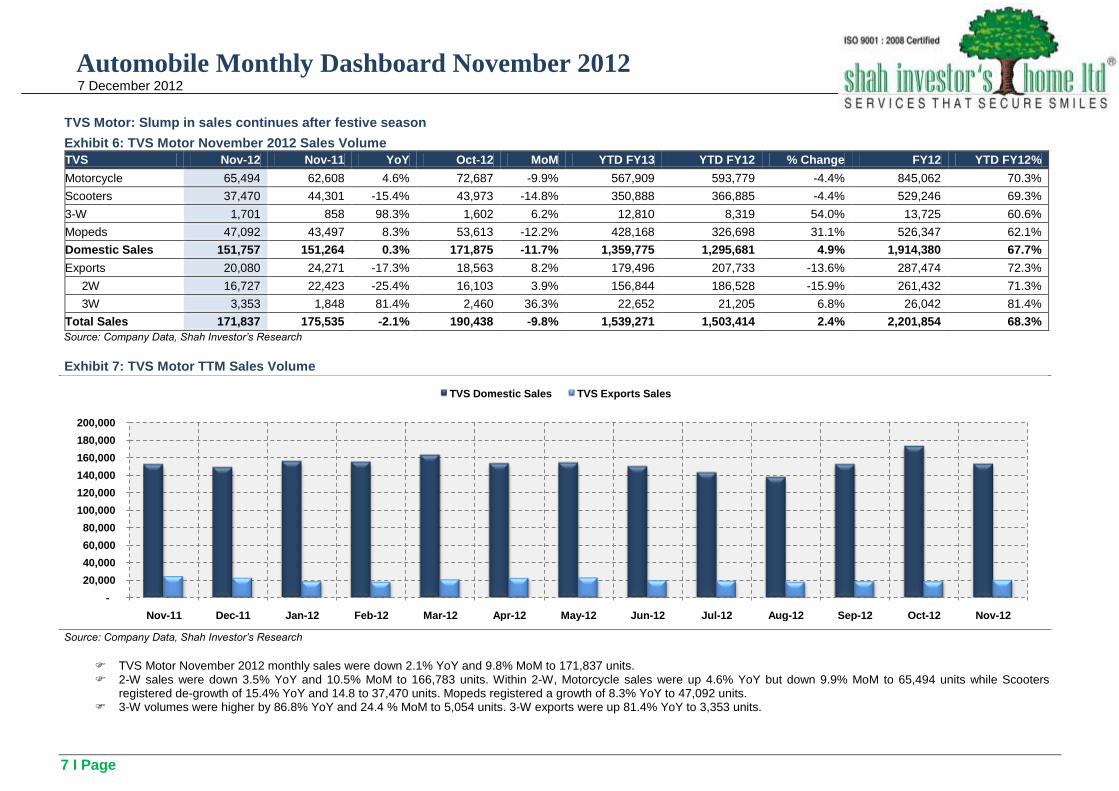
TVS Motor November 2012 monthly sales were down 2.1% YoY and 9.8% MoM to 171,837 units. 2-W sales were down 3.5% YoY and 10.5% MoM to 166,783 units. Within 2-W, Motorcycle sales were up 4.6% YoY but down 9.9% MoM to 65,494 units while Scooters
registered de-growth of 15.4% YoY and 14.8 to 37,470 units. Mopeds registered a growth of 8.3% YoY to 47,092 units. 3-W volumes were higher by 86.8% YoY and 24.4 % MoM to 5,054 units. 3-W exports were up 81.4% YoY to 3,353 units.
-
20,000
40,000
60,000
80,000
100,000
120,000
140,000
160,000
180,000
200,000
Nov-11 Dec-11 Jan-12 Feb-12 Mar-12 Apr-12 May-12 Jun-12 Jul-12 Aug-12 Sep-12 Oct-12 Nov-12
TVS Domestic Sales TVS Exports Sales
Automobile Monthly Dashboard November 2012 7 December 2012
8 I Page
Tata Motors: Fast losing ground in passenger car segment
Exhibit 8: Tata Motors November 2012 Volumes
Tata Motors Nov-12 Nov-11 YoY Oct-12 MoM YTD FY13 YTD FY12 % Change FY12 YTD FY12%
Domestic
M&HCV 9,495 16,064 -40.9% 12,121 -21.7% 99,313 129,119 -23.1% 207,008 62.4%
LCV 34,828 28,673 21.5% 34,905 -0.2% 243,543 197,792 23.1% 323,298 61.2%
Utility 4,493 4,197 7.1% 4,675 -3.9% 34,187 30,633 11.6% 55,418 55.3%
Cars 13,538 24,577 -44.9% 16,444 -17.7% 137,573 157,700 -12.8% 274,037 57.5%
FIAT - 1,037 -100.0% - NA 2,002 10,351 -80.7% 16,072 64.4%
Tata Nano 3,503 6,401 -45.3% 4,004 -12.5% 47,130 39,645 18.9% 74,526 53.2%
Indica Range 6,956 10,926 -36.3% 6,692 3.9% 55,739 63,021 -11.6% 105,706 59.6%
Indigo Range 3,079 6,213 -50.4% 5,748 -46.4% 32,702 44,683 -26.8% 77,733 57.5%
Total Domestic 62,354 73,511 -15.2% 68,145 -8.5% 514,616 515,244 -0.1% 859,761 59.9%
Total Exports 4,146 4,349 -4.7% 3,626 14.3% 35,521 39,410 -9.9% 62,890 62.7%
Total Sales 66,500 77,860 -14.6% 71,771 -7.3% 550,137 554,654 -0.8% 922,651 60.1%
Source: Company Data, Shah Investor’s Research
Exhibit 9: Tata Motors TTM Sales Volumes
Source: Company Data, Shah Investor’s Research
-
10,000
20,000
30,000
40,000
50,000
60,000
70,000
Nov-11 Dec-11 Jan-12 Feb-12 Mar-12 Apr-12 May-12 Jun-12 Jul-12 Aug-12 Sep-12 Oct-12 Nov-12
CV sales (M&HCV & LCV) Passenger Car Sales (Cars & UV) Total Exports

Automobile Monthly Dashboard November 2012 7 December 2012
9 I Page
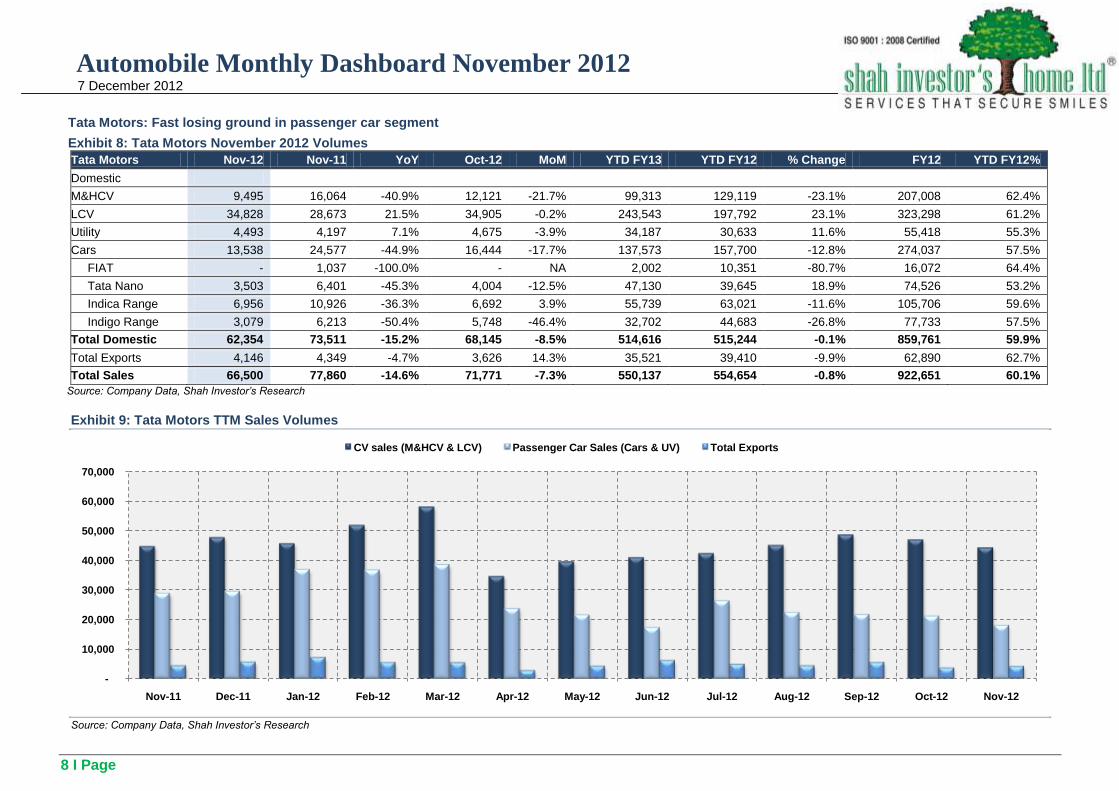
Overall sales of Tata Motors (ex-Fiat) were down 13.4% YoY and 7.3% MoM to 66,500 units. Tata Motors is behind Mahindra & Mahindra (M&M) at no.4 position in domestic
Passenger Car segment. Total CV sales for Tata Motors were down 0.9% YoY and 5.7% MoM to 44,323 units. Growth in CV segment was led by LCV segment which was up 21.5% YoY but flat MoM to
34,828 units. Sales in M&HCV segmented which were down 40.9% YoY and 21.7% MoM to 9,495 units. New truck launches by Tata Motors was unsuccessful in boosting sales in M&HCV
segment. Passenger car volumes (ex Nano and FIAT volumes) were down 41.4% YoY and 19.3% MoM to 10,035 units. The Indica range was down by 36.3% YoY but up 3.9% MoM to 6,956
units while Tata Indigo range was down 50.4% YoY and 46.4% MoM to 3,079 units. Tata Nano sale is around 3,503 units below FY13 average sales of 6,600 units. Utility Vehicles segment was up by 7.1% YoY but down 3.9% MoM to 4,493 units. Growth in Utility vehicles was led by Sumo sales; up 40.6% YoY to 2,959 units while Safari sales
were down by 23.1% YoY to 1,052 units. Exports were down 4.7% YoY but up 14.3% MoM to 4,146 units. JLR sales volume for October 2012 was up 6.6% YoY and 5.4% MoM to 27,897 units. We estimate lower volumes of JLR in Q3 (below 28,000 units) due to phase out of Range
Rover and Range Rover Sport. Inaugural sales of fourth generation Range Rover have been started in August. (Sales volumes for JLR are expected on 14th or 15th every month).
Exhibit 10: JLR October 2012 Sales Volume
JLR Oct-12 Oct-11 YoY Sep-12 MoM YTD FY13 YTD FY12 % Change FY12 YTD FY12%
Jaguar 3,339 5,231 -36.2% 2,808 18.9% 31,092 29,875 4.1% 54,034 55.3%
Land Rover 24,558 20,927 17.4% 23,653 3.8% 212,057 126,368 67.8% 260,394 48.5%
Total Sales 27,897 26,158 6.6% 26,461 5.4% 243,149 156,243 55.6% 314,428 49.7%
Source: Company Data, Shah Investor’s Research
Exhibit 11: JLR TTM Sales Volumes
Source: Company Data, Shah Investor’s Research
-
5,000
10,000
15,000
20,000
25,000
30,000
35,000
Oct-11 Nov-11 Dec-11 Jan-12 Feb-12 Mar-12 Apr-12 May-12 Jun-12 Jul-12 Aug-12 Sep-12 Oct-12
Jaguar Land Rover
Automobile Monthly Dashboard November 2012 7 December 2012
10 I Page
Maruti Suzuki: New Alto and diesel engine cars to drive sales
Exhibit 12: Maruti Suzuki November 2012 Sales Volumes
Maruti Suzuki Nov-12 Oct-11 YoY Oct-12 MoM YTD FY13 YTD FY12 % Change FY12 YTD FY12%
A: Mini (M800, Alto, WagonR & A-Star) 36,679 38,921 -5.8% 42,233 -13.2% 263,935 298,290 -11.5% 490,849 60.8%
A: Compact (Swift, Estillo & Ritz) 23,849 22,159 7.6% 22,459 6.2% 158,925 133,533 19.0% 235,754 56.6%
A: Super Compact (Dzire) 13,502 10,403 29.8% 14,389 -6.2% 101,041 60,787 66.2% 110,132 55.2%
A: Mid Size (SX4) 692 1,433 -51.7% 695 -0.4% 4,248 11,662 -63.6% 17,997 64.8%
A: Passenger Executive (Kizashi) 71 162 -56.2% 35 102.9% 141 336 -58.0% 458 73.4%
Total A: Passenger Vehicles 74,793 73,078 2.3% 79,811 -6.3% 528,290 504,608 4.7% 855,190 59.0%
B: Utility Vehicles (Grand Vitara & Gypsy) 7,439 180 4032.8% 7,400 0.5% 55,205 4,296 1185.0% 6,525 65.8%
C: Vans (Omni & Eeco) 8,650 9,612 -10.0% 8,791 -1.6% 76,607 97,973 -21.8% 144,061 68.0%
Total Domestic Sales 90,882 82,870 9.7% 96,002 -5.3% 660,102 606,877 8.8% 1,005,776 60.3%
Total Exports 12,318 8,902 38.4% 7,106 73.3% 72,478 73,783 -1.8% 127,379 57.9%
Total Sales 103,200 91,772 12.5% 103,108 0.1% 732,580 680,660 7.6% 1,133,155 60.1%
Source: Company Data, Shah Investor’s Research
Exhibit 13: Maruti Suzuki TTM Sales Volumes
Source: Company Data, Shah Investor’s Research
-
20,000
40,000
60,000
80,000
100,000
120,000
Nov-11 Dec-11 Jan-12 Feb-12 Mar-12 Apr-12 May-12 Jun-12 Jul-12 Aug-12 Sep-12 Oct-12 Nov-12
Total Domestic Sales Total Exports
Automobile Monthly Dashboard November 2012 7 December 2012
11 I Page
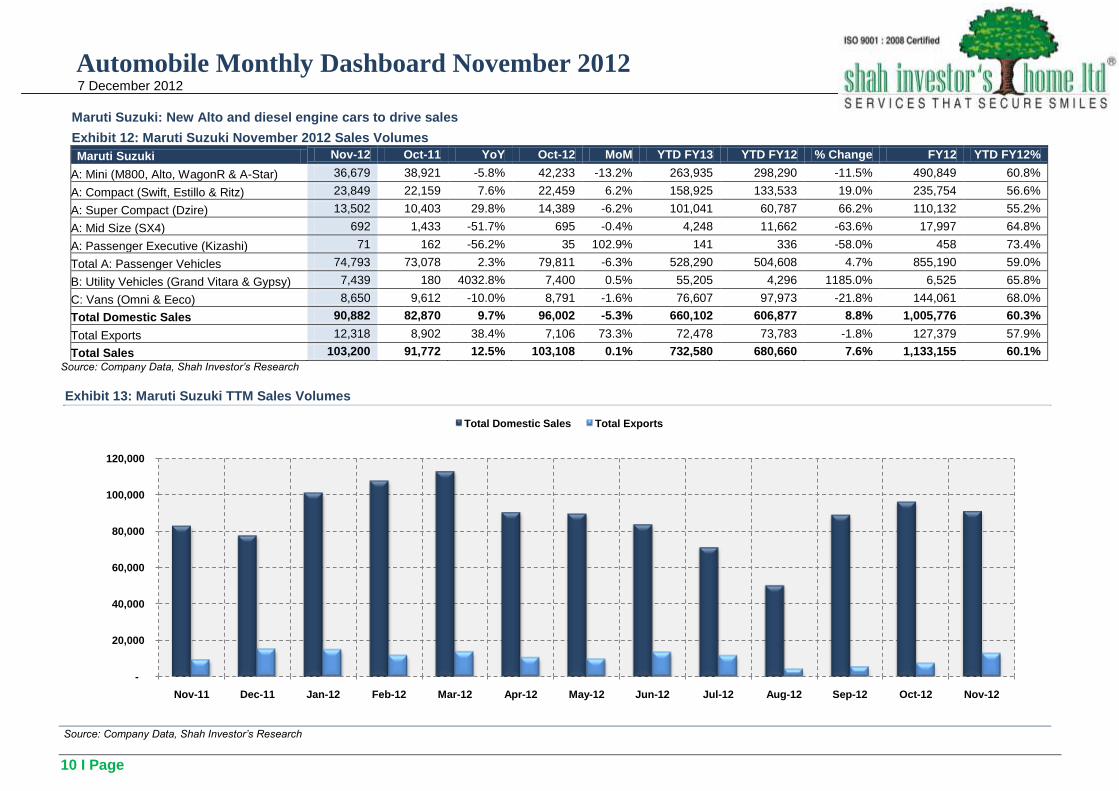
Overall sales of Maruti Suzuki (MSIL) were up 12.5% YoY and flat MoM to 103,200 units. Domestic sales for MSIL were up 9.7% YoY to 90,822 units while Exports were up 38.4% YoY and 73.3% MoM to 12,136 units.
Contribution from Mini segment (M800, Alto, A-Star and WagonR) is down at 35.5% vs. 42.4% YoY and 41.7% MoM to 36,679 units. Volumes of Alto are around 23,000 unit mark. The top three positions in Indian domestic market is dominated by Alto, Swift and Dzire; all brand of MSIL.
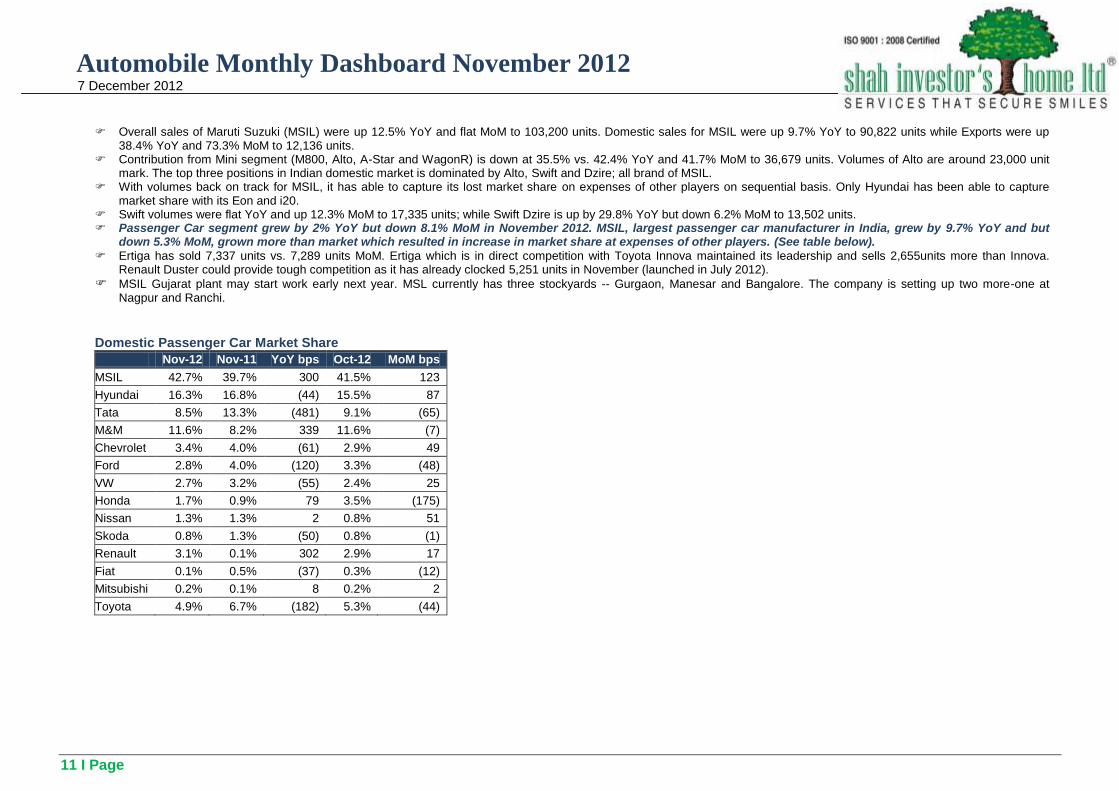
With volumes back on track for MSIL, it has able to capture its lost market share on expenses of other players on sequential basis. Only Hyundai has been able to capture market share with its Eon and i20.
Swift volumes were flat YoY and up 12.3% MoM to 17,335 units; while Swift Dzire is up by 29.8% YoY but down 6.2% MoM to 13,502 units. Passenger Car segment grew by 2% YoY but down 8.1% MoM in November 2012. MSIL, largest passenger car manufacturer in India, grew by 9.7% YoY and but
down 5.3% MoM, grown more than market which resulted in increase in market share at expenses of other players. (See table below).
Ertiga has sold 7,337 units vs. 7,289 units MoM. Ertiga which is in direct competition with Toyota Innova maintained its leadership and sells 2,655units more than Innova. Renault Duster could provide tough competition as it has already clocked 5,251 units in November (launched in July 2012).
MSIL Gujarat plant may start work early next year. MSL currently has three stockyards -- Gurgaon, Manesar and Bangalore. The company is setting up two more-one at Nagpur and Ranchi.
Domestic Passenger Car Market Share
Nov-12 Nov-11 YoY bps Oct-12 MoM bps
MSIL 42.7% 39.7% 300 41.5% 123
Hyundai 16.3% 16.8% (44) 15.5% 87
Tata 8.5% 13.3% (481) 9.1% (65)
M&M 11.6% 8.2% 339 11.6% (7)
Chevrolet 3.4% 4.0% (61) 2.9% 49
Ford 2.8% 4.0% (120) 3.3% (48)
VW 2.7% 3.2% (55) 2.4% 25
Honda 1.7% 0.9% 79 3.5% (175)
Nissan 1.3% 1.3% 2 0.8% 51
Skoda 0.8% 1.3% (50) 0.8% (1)
Renault 3.1% 0.1% 302 2.9% 17
Fiat 0.1% 0.5% (37) 0.3% (12)
Mitsubishi 0.2% 0.1% 8 0.2% 2
Toyota 4.9% 6.7% (182) 5.3% (44)
Automobile Monthly Dashboard November 2012 7 December 2012
12 I Page
Mahindra & Mahindra: New product launch in UV segment and revival of tractor segment to drive sales
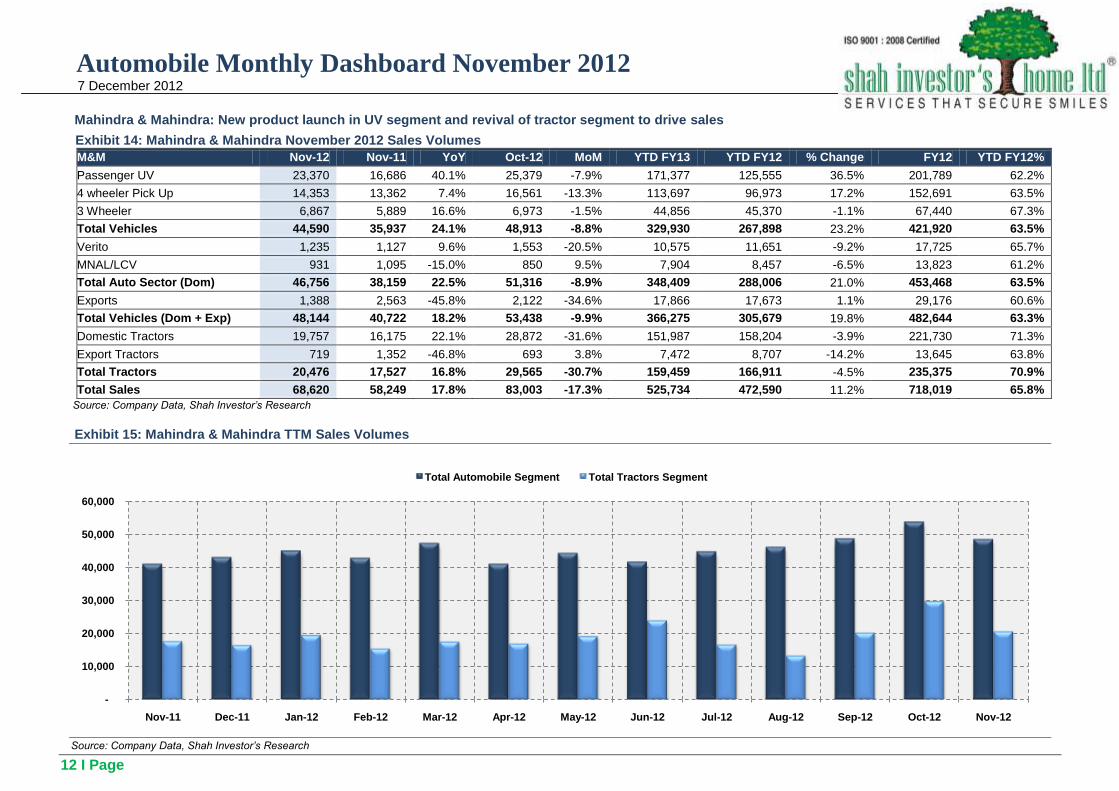
Exhibit 14: Mahindra & Mahindra November 2012 Sales Volumes
M&M Nov-12 Nov-11 YoY Oct-12 MoM YTD FY13 YTD FY12 % Change FY12 YTD FY12%
Passenger UV 23,370 16,686 40.1% 25,379 -7.9% 171,377 125,555 36.5% 201,789 62.2%
4 wheeler Pick Up 14,353 13,362 7.4% 16,561 -13.3% 113,697 96,973 17.2% 152,691 63.5%
3 Wheeler 6,867 5,889 16.6% 6,973 -1.5% 44,856 45,370 -1.1% 67,440 67.3%
Total Vehicles 44,590 35,937 24.1% 48,913 -8.8% 329,930 267,898 23.2% 421,920 63.5%
Verito 1,235 1,127 9.6% 1,553 -20.5% 10,575 11,651 -9.2% 17,725 65.7%
MNAL/LCV 931 1,095 -15.0% 850 9.5% 7,904 8,457 -6.5% 13,823 61.2%
Total Auto Sector (Dom) 46,756 38,159 22.5% 51,316 -8.9% 348,409 288,006 21.0% 453,468 63.5%
Exports 1,388 2,563 -45.8% 2,122 -34.6% 17,866 17,673 1.1% 29,176 60.6%
Total Vehicles (Dom + Exp) 48,144 40,722 18.2% 53,438 -9.9% 366,275 305,679 19.8% 482,644 63.3%
Domestic Tractors 19,757 16,175 22.1% 28,872 -31.6% 151,987 158,204 -3.9% 221,730 71.3%
Export Tractors 719 1,352 -46.8% 693 3.8% 7,472 8,707 -14.2% 13,645 63.8%
Total Tractors 20,476 17,527 16.8% 29,565 -30.7% 159,459 166,911 -4.5% 235,375 70.9%
Total Sales 68,620 58,249 17.8% 83,003 -17.3% 525,734 472,590 11.2% 718,019 65.8%
Source: Company Data, Shah Investor’s Research
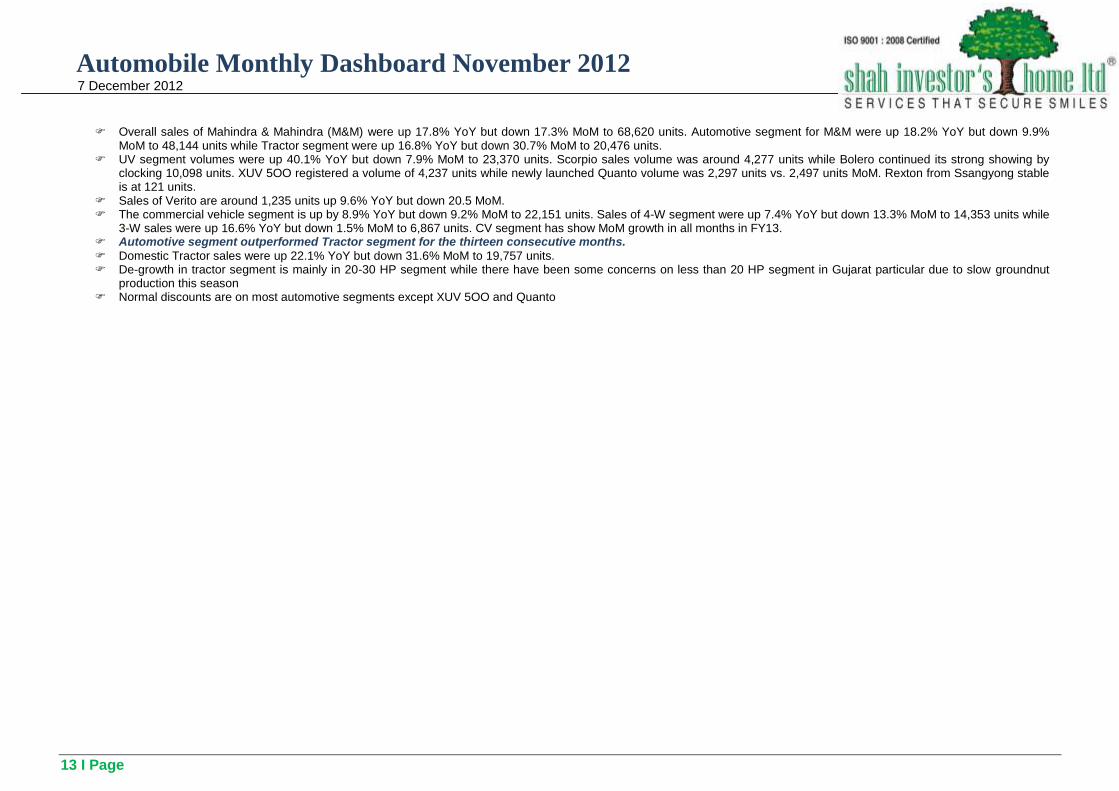
Exhibit 15: Mahindra & Mahindra TTM Sales Volumes
Source: Company Data, Shah Investor’s Research
-
10,000
20,000
30,000
40,000
50,000
60,000
Nov-11 Dec-11 Jan-12 Feb-12 Mar-12 Apr-12 May-12 Jun-12 Jul-12 Aug-12 Sep-12 Oct-12 Nov-12
Total Automobile Segment Total Tractors Segment
Automobile Monthly Dashboard November 2012 7 December 2012
13 I Page
Overall sales of Mahindra & Mahindra (M&M) were up 17.8% YoY but down 17.3% MoM to 68,620 units. Automotive segment for M&M were up 18.2% YoY but down 9.9% MoM to 48,144 units while Tractor segment were up 16.8% YoY but down 30.7% MoM to 20,476 units.
UV segment volumes were up 40.1% YoY but down 7.9% MoM to 23,370 units. Scorpio sales volume was around 4,277 units while Bolero continued its strong showing by clocking 10,098 units. XUV 5OO registered a volume of 4,237 units while newly launched Quanto volume was 2,297 units vs. 2,497 units MoM. Rexton from Ssangyong stable is at 121 units.
Sales of Verito are around 1,235 units up 9.6% YoY but down 20.5 MoM. The commercial vehicle segment is up by 8.9% YoY but down 9.2% MoM to 22,151 units. Sales of 4-W segment were up 7.4% YoY but down 13.3% MoM to 14,353 units while
3-W sales were up 16.6% YoY but down 1.5% MoM to 6,867 units. CV segment has show MoM growth in all months in FY13. Automotive segment outperformed Tractor segment for the thirteen consecutive months.
Domestic Tractor sales were up 22.1% YoY but down 31.6% MoM to 19,757 units. De-growth in tractor segment is mainly in 20-30 HP segment while there have been some concerns on less than 20 HP segment in Gujarat particular due to slow groundnut
production this season Normal discounts are on most automotive segments except XUV 5OO and Quanto
Automobile Monthly Dashboard November 2012 7 December 2012
14 I Page
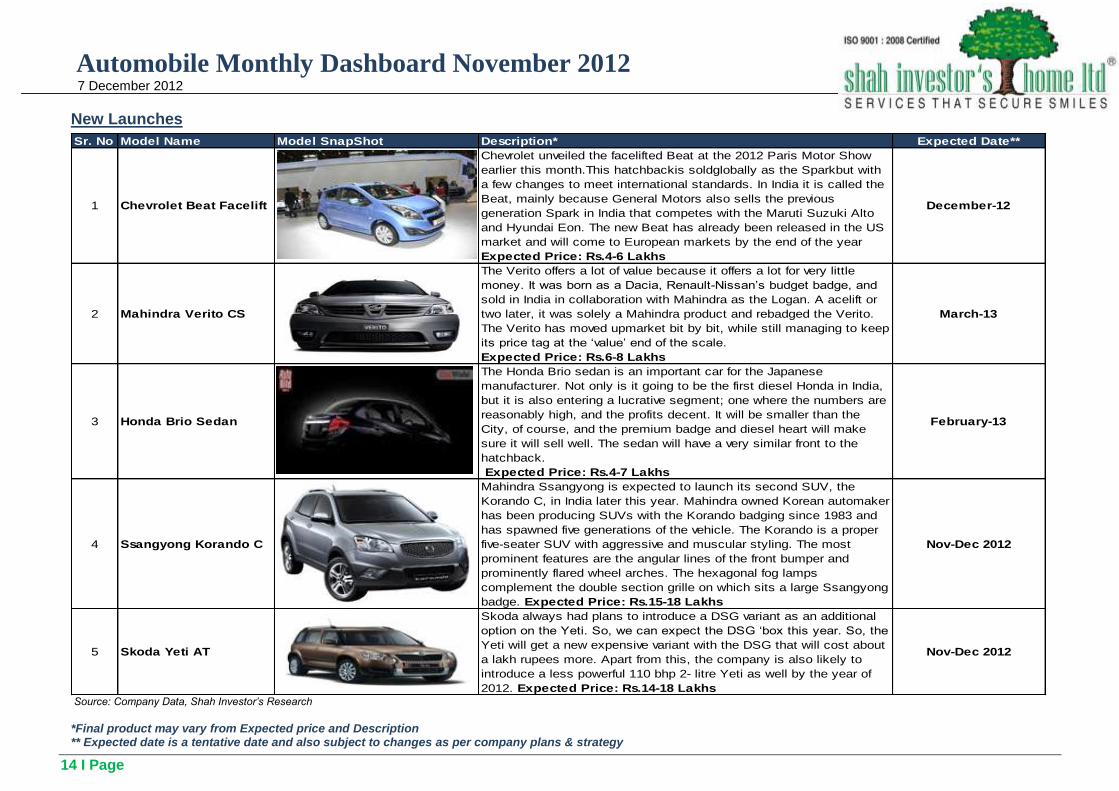
New Launches
Sr. No Model Name Model SnapShot Description* Expected Date**
1 Chevrolet Beat Facelift
Chevrolet unveiled the facelifted Beat at the 2012 Paris Motor Show
earlier this month.This hatchbackis soldglobally as the Sparkbut with
a few changes to meet international standards. In India it is called the
Beat, mainly because General Motors also sells the previous
generation Spark in India that competes with the Maruti Suzuki Alto
and Hyundai Eon. The new Beat has already been released in the US
market and will come to European markets by the end of the year
Expected Price: Rs.4-6 Lakhs
December-12
2 Mahindra Verito CS
The Verito offers a lot of value because it offers a lot for very little
money. It was born as a Dacia, Renault-Nissan‟s budget badge, and
sold in India in collaboration with Mahindra as the Logan. A acelift or
two later, it was solely a Mahindra product and rebadged the Verito.
The Verito has moved upmarket bit by bit, while still managing to keep
its price tag at the „value‟ end of the scale.
Expected Price: Rs.6-8 Lakhs
March-13
3 Honda Brio Sedan
The Honda Brio sedan is an important car for the Japanese
manufacturer. Not only is it going to be the first diesel Honda in India,
but it is also entering a lucrative segment; one where the numbers are
reasonably high, and the profits decent. It will be smaller than the
City, of course, and the premium badge and diesel heart will make
sure it will sell well. The sedan will have a very similar front to the
hatchback.
Expected Price: Rs.4-7 Lakhs
February-13
4 Ssangyong Korando C
Mahindra Ssangyong is expected to launch its second SUV, the
Korando C, in India later this year. Mahindra owned Korean automaker
has been producing SUVs with the Korando badging since 1983 and
has spawned five generations of the vehicle. The Korando is a proper
five-seater SUV with aggressive and muscular styling. The most
prominent features are the angular lines of the front bumper and
prominently flared wheel arches. The hexagonal fog lamps
complement the double section grille on which sits a large Ssangyong
badge. Expected Price: Rs.15-18 Lakhs
Nov-Dec 2012
5 Skoda Yeti AT
Skoda always had plans to introduce a DSG variant as an additional
option on the Yeti. So, we can expect the DSG „box this year. So, the
Yeti will get a new expensive variant with the DSG that will cost about
a lakh rupees more. Apart from this, the company is also likely to
introduce a less powerful 110 bhp 2- litre Yeti as well by the year of
2012. Expected Price: Rs.14-18 Lakhs
Nov-Dec 2012
Source: Company Data, Shah Investor’s Research
*Final product may vary from Expected price and Description ** Expected date is a tentative date and also subject to changes as per company plans & strategy
Automobile Monthly Dashboard November 2012 7 December 2012
15 I Page
Annexure
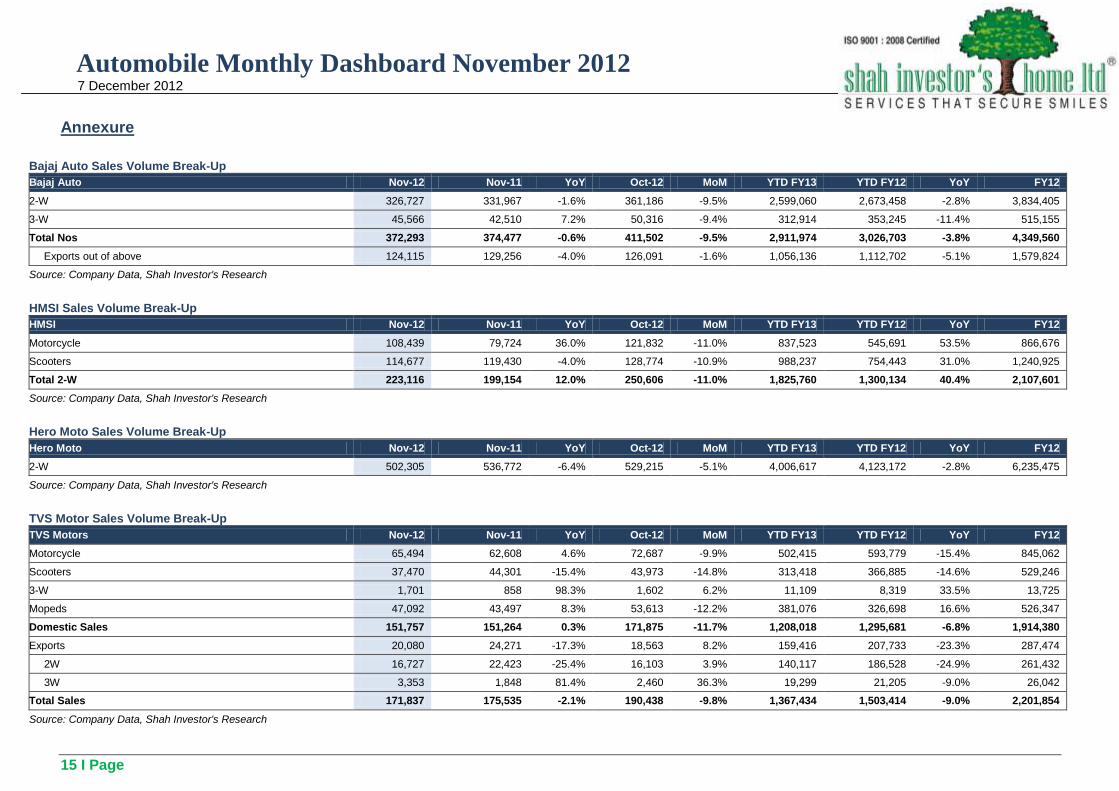
Bajaj Auto Sales Volume Break-Up
Bajaj Auto Nov-12 Nov-11 YoY Oct-12 MoM YTD FY13 YTD FY12 YoY FY12
2-W 326,727 331,967 -1.6% 361,186 -9.5% 2,599,060 2,673,458 -2.8% 3,834,405
3-W 45,566 42,510 7.2% 50,316 -9.4% 312,914 353,245 -11.4% 515,155
Total Nos 372,293 374,477 -0.6% 411,502 -9.5% 2,911,974 3,026,703 -3.8% 4,349,560
Exports out of above 124,115 129,256 -4.0% 126,091 -1.6% 1,056,136 1,112,702 -5.1% 1,579,824
Source: Company Data, Shah Investor's Research
HMSI Sales Volume Break-Up
HMSI Nov-12 Nov-11 YoY Oct-12 MoM YTD FY13 YTD FY12 YoY FY12
Motorcycle 108,439 79,724 36.0% 121,832 -11.0% 837,523 545,691 53.5% 866,676
Scooters 114,677 119,430 -4.0% 128,774 -10.9% 988,237 754,443 31.0% 1,240,925
Total 2-W 223,116 199,154 12.0% 250,606 -11.0% 1,825,760 1,300,134 40.4% 2,107,601
Source: Company Data, Shah Investor's Research
Hero Moto Sales Volume Break-Up
Hero Moto Nov-12 Nov-11 YoY Oct-12 MoM YTD FY13 YTD FY12 YoY FY12
2-W 502,305 536,772 -6.4% 529,215 -5.1% 4,006,617 4,123,172 -2.8% 6,235,475
Source: Company Data, Shah Investor's Research
TVS Motor Sales Volume Break-Up
TVS Motors Nov-12 Nov-11 YoY Oct-12 MoM YTD FY13 YTD FY12 YoY FY12
Motorcycle 65,494 62,608 4.6% 72,687 -9.9% 502,415 593,779 -15.4% 845,062
Scooters 37,470 44,301 -15.4% 43,973 -14.8% 313,418 366,885 -14.6% 529,246
3-W 1,701 858 98.3% 1,602 6.2% 11,109 8,319 33.5% 13,725
Mopeds 47,092 43,497 8.3% 53,613 -12.2% 381,076 326,698 16.6% 526,347
Domestic Sales 151,757 151,264 0.3% 171,875 -11.7% 1,208,018 1,295,681 -6.8% 1,914,380
Exports 20,080 24,271 -17.3% 18,563 8.2% 159,416 207,733 -23.3% 287,474
2W 16,727 22,423 -25.4% 16,103 3.9% 140,117 186,528 -24.9% 261,432
3W 3,353 1,848 81.4% 2,460 36.3% 19,299 21,205 -9.0% 26,042
Total Sales 171,837 175,535 -2.1% 190,438 -9.8% 1,367,434 1,503,414 -9.0% 2,201,854
Source: Company Data, Shah Investor's Research
Automobile Monthly Dashboard November 2012 7 December 2012
16 I Page
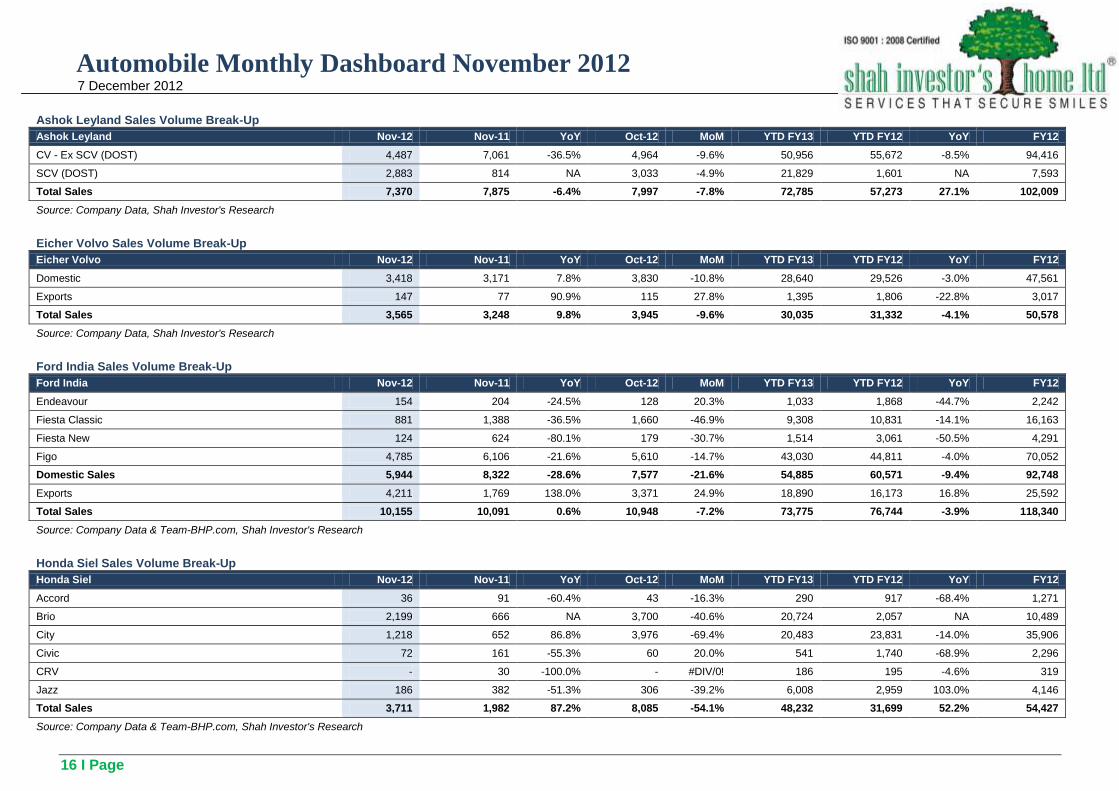
Ashok Leyland Sales Volume Break-Up
Ashok Leyland Nov-12 Nov-11 YoY Oct-12 MoM YTD FY13 YTD FY12 YoY FY12
CV - Ex SCV (DOST) 4,487 7,061 -36.5% 4,964 -9.6% 50,956 55,672 -8.5% 94,416
SCV (DOST) 2,883 814 NA 3,033 -4.9% 21,829 1,601 NA 7,593
Total Sales 7,370 7,875 -6.4% 7,997 -7.8% 72,785 57,273 27.1% 102,009
Source: Company Data, Shah Investor's Research
Eicher Volvo Sales Volume Break-Up
Eicher Volvo Nov-12 Nov-11 YoY Oct-12 MoM YTD FY13 YTD FY12 YoY FY12
Domestic 3,418 3,171 7.8% 3,830 -10.8% 28,640 29,526 -3.0% 47,561
Exports 147 77 90.9% 115 27.8% 1,395 1,806 -22.8% 3,017
Total Sales 3,565 3,248 9.8% 3,945 -9.6% 30,035 31,332 -4.1% 50,578
Source: Company Data, Shah Investor's Research
Ford India Sales Volume Break-Up
Ford India Nov-12 Nov-11 YoY Oct-12 MoM YTD FY13 YTD FY12 YoY FY12
Endeavour 154 204 -24.5% 128 20.3% 1,033 1,868 -44.7% 2,242
Fiesta Classic 881 1,388 -36.5% 1,660 -46.9% 9,308 10,831 -14.1% 16,163
Fiesta New 124 624 -80.1% 179 -30.7% 1,514 3,061 -50.5% 4,291
Figo 4,785 6,106 -21.6% 5,610 -14.7% 43,030 44,811 -4.0% 70,052
Domestic Sales 5,944 8,322 -28.6% 7,577 -21.6% 54,885 60,571 -9.4% 92,748
Exports 4,211 1,769 138.0% 3,371 24.9% 18,890 16,173 16.8% 25,592
Total Sales 10,155 10,091 0.6% 10,948 -7.2% 73,775 76,744 -3.9% 118,340
Source: Company Data & Team-BHP.com, Shah Investor's Research
Honda Siel Sales Volume Break-Up
Honda Siel Nov-12 Nov-11 YoY Oct-12 MoM YTD FY13 YTD FY12 YoY FY12
Accord 36 91 -60.4% 43 -16.3% 290 917 -68.4% 1,271
Brio 2,199 666 NA 3,700 -40.6% 20,724 2,057 NA 10,489
City 1,218 652 86.8% 3,976 -69.4% 20,483 23,831 -14.0% 35,906
Civic 72 161 -55.3% 60 20.0% 541 1,740 -68.9% 2,296
CRV - 30 -100.0% - #DIV/0! 186 195 -4.6% 319
Jazz 186 382 -51.3% 306 -39.2% 6,008 2,959 103.0% 4,146
Total Sales 3,711 1,982 87.2% 8,085 -54.1% 48,232 31,699 52.2% 54,427
Source: Company Data & Team-BHP.com, Shah Investor's Research
Automobile Monthly Dashboard November 2012 7 December 2012
17 I Page
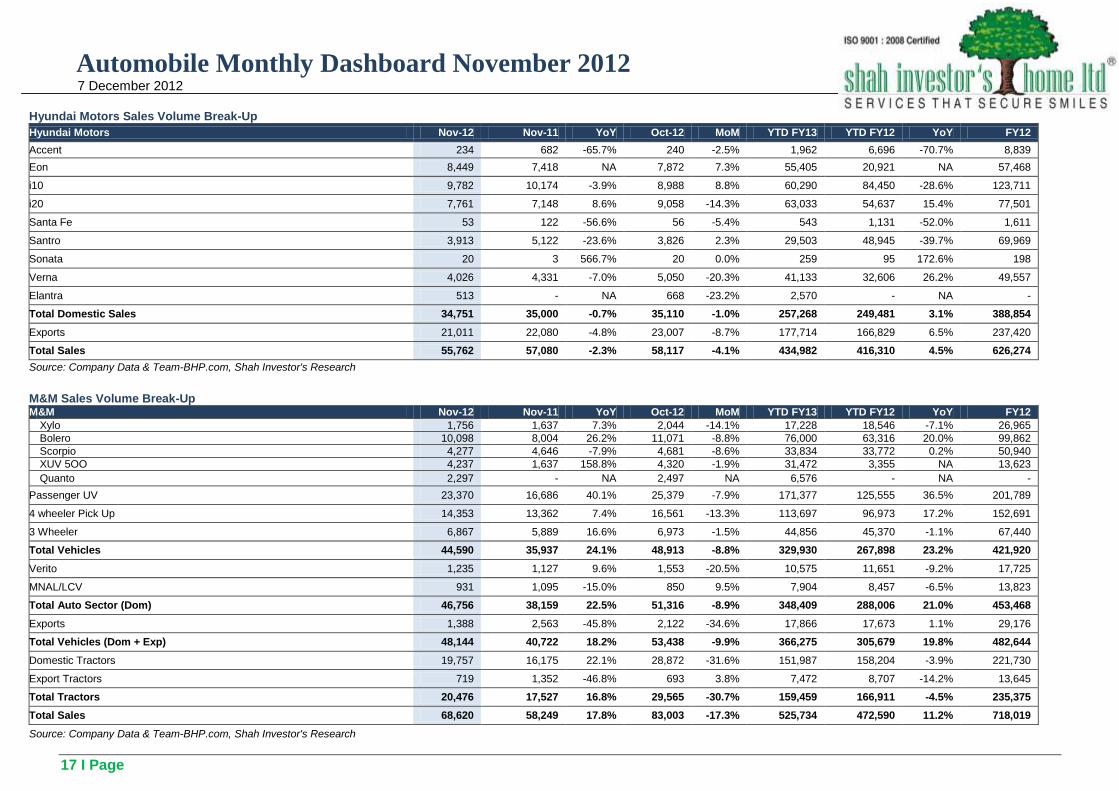
Hyundai Motors Sales Volume Break-Up
Hyundai Motors Nov-12 Nov-11 YoY Oct-12 MoM YTD FY13 YTD FY12 YoY FY12
Accent 234 682 -65.7% 240 -2.5% 1,962 6,696 -70.7% 8,839
Eon 8,449 7,418 NA 7,872 7.3% 55,405 20,921 NA 57,468
i10 9,782 10,174 -3.9% 8,988 8.8% 60,290 84,450 -28.6% 123,711
i20 7,761 7,148 8.6% 9,058 -14.3% 63,033 54,637 15.4% 77,501
Santa Fe 53 122 -56.6% 56 -5.4% 543 1,131 -52.0% 1,611
Santro 3,913 5,122 -23.6% 3,826 2.3% 29,503 48,945 -39.7% 69,969
Sonata 20 3 566.7% 20 0.0% 259 95 172.6% 198
Verna 4,026 4,331 -7.0% 5,050 -20.3% 41,133 32,606 26.2% 49,557
Elantra 513 - NA 668 -23.2% 2,570 - NA -
Total Domestic Sales 34,751 35,000 -0.7% 35,110 -1.0% 257,268 249,481 3.1% 388,854
Exports 21,011 22,080 -4.8% 23,007 -8.7% 177,714 166,829 6.5% 237,420
Total Sales 55,762 57,080 -2.3% 58,117 -4.1% 434,982 416,310 4.5% 626,274
Source: Company Data & Team-BHP.com, Shah Investor's Research
M&M Sales Volume Break-Up M&M Nov-12 Nov-11 YoY Oct-12 MoM YTD FY13 YTD FY12 YoY FY12
Xylo 1,756 1,637 7.3% 2,044 -14.1% 17,228 18,546 -7.1% 26,965
Bolero 10,098 8,004 26.2% 11,071 -8.8% 76,000 63,316 20.0% 99,862
Scorpio 4,277 4,646 -7.9% 4,681 -8.6% 33,834 33,772 0.2% 50,940
XUV 5OO 4,237 1,637 158.8% 4,320 -1.9% 31,472 3,355 NA 13,623
Quanto 2,297 - NA 2,497 NA 6,576 - NA -
Passenger UV 23,370 16,686 40.1% 25,379 -7.9% 171,377 125,555 36.5% 201,789
4 wheeler Pick Up 14,353 13,362 7.4% 16,561 -13.3% 113,697 96,973 17.2% 152,691
3 Wheeler 6,867 5,889 16.6% 6,973 -1.5% 44,856 45,370 -1.1% 67,440
Total Vehicles 44,590 35,937 24.1% 48,913 -8.8% 329,930 267,898 23.2% 421,920
Verito 1,235 1,127 9.6% 1,553 -20.5% 10,575 11,651 -9.2% 17,725
MNAL/LCV 931 1,095 -15.0% 850 9.5% 7,904 8,457 -6.5% 13,823
Total Auto Sector (Dom) 46,756 38,159 22.5% 51,316 -8.9% 348,409 288,006 21.0% 453,468
Exports 1,388 2,563 -45.8% 2,122 -34.6% 17,866 17,673 1.1% 29,176
Total Vehicles (Dom + Exp) 48,144 40,722 18.2% 53,438 -9.9% 366,275 305,679 19.8% 482,644
Domestic Tractors 19,757 16,175 22.1% 28,872 -31.6% 151,987 158,204 -3.9% 221,730
Export Tractors 719 1,352 -46.8% 693 3.8% 7,472 8,707 -14.2% 13,645
Total Tractors 20,476 17,527 16.8% 29,565 -30.7% 159,459 166,911 -4.5% 235,375
Total Sales 68,620 58,249 17.8% 83,003 -17.3% 525,734 472,590 11.2% 718,019
Source: Company Data & Team-BHP.com, Shah Investor's Research
Automobile Monthly Dashboard November 2012 7 December 2012
18 I Page
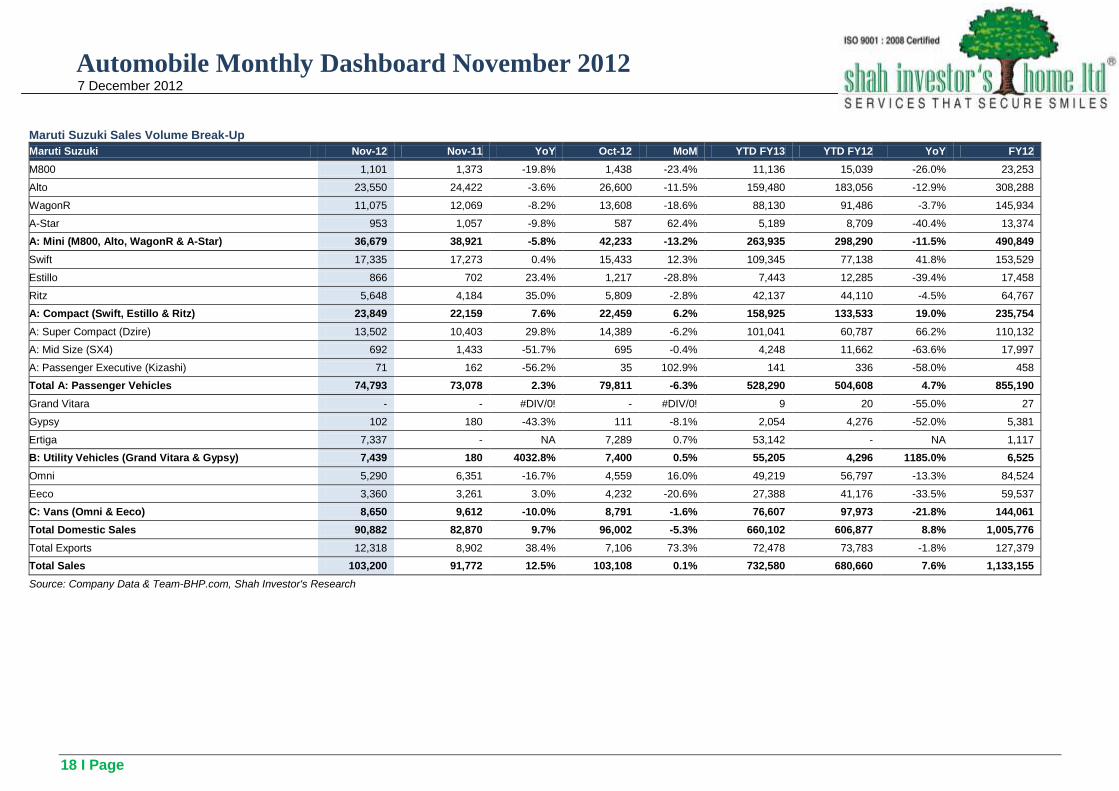
Maruti Suzuki Sales Volume Break-Up
Maruti Suzuki Nov-12 Nov-11 YoY Oct-12 MoM YTD FY13 YTD FY12 YoY FY12
M800 1,101 1,373 -19.8% 1,438 -23.4% 11,136 15,039 -26.0% 23,253
Alto 23,550 24,422 -3.6% 26,600 -11.5% 159,480 183,056 -12.9% 308,288
WagonR 11,075 12,069 -8.2% 13,608 -18.6% 88,130 91,486 -3.7% 145,934
A-Star 953 1,057 -9.8% 587 62.4% 5,189 8,709 -40.4% 13,374
A: Mini (M800, Alto, WagonR & A-Star) 36,679 38,921 -5.8% 42,233 -13.2% 263,935 298,290 -11.5% 490,849
Swift 17,335 17,273 0.4% 15,433 12.3% 109,345 77,138 41.8% 153,529
Estillo 866 702 23.4% 1,217 -28.8% 7,443 12,285 -39.4% 17,458
Ritz 5,648 4,184 35.0% 5,809 -2.8% 42,137 44,110 -4.5% 64,767
A: Compact (Swift, Estillo & Ritz) 23,849 22,159 7.6% 22,459 6.2% 158,925 133,533 19.0% 235,754
A: Super Compact (Dzire) 13,502 10,403 29.8% 14,389 -6.2% 101,041 60,787 66.2% 110,132
A: Mid Size (SX4) 692 1,433 -51.7% 695 -0.4% 4,248 11,662 -63.6% 17,997
A: Passenger Executive (Kizashi) 71 162 -56.2% 35 102.9% 141 336 -58.0% 458
Total A: Passenger Vehicles 74,793 73,078 2.3% 79,811 -6.3% 528,290 504,608 4.7% 855,190
Grand Vitara - - #DIV/0! - #DIV/0! 9 20 -55.0% 27
Gypsy 102 180 -43.3% 111 -8.1% 2,054 4,276 -52.0% 5,381
Ertiga 7,337 - NA 7,289 0.7% 53,142 - NA 1,117
B: Utility Vehicles (Grand Vitara & Gypsy) 7,439 180 4032.8% 7,400 0.5% 55,205 4,296 1185.0% 6,525
Omni 5,290 6,351 -16.7% 4,559 16.0% 49,219 56,797 -13.3% 84,524
Eeco 3,360 3,261 3.0% 4,232 -20.6% 27,388 41,176 -33.5% 59,537
C: Vans (Omni & Eeco) 8,650 9,612 -10.0% 8,791 -1.6% 76,607 97,973 -21.8% 144,061
Total Domestic Sales 90,882 82,870 9.7% 96,002 -5.3% 660,102 606,877 8.8% 1,005,776
Total Exports 12,318 8,902 38.4% 7,106 73.3% 72,478 73,783 -1.8% 127,379
Total Sales 103,200 91,772 12.5% 103,108 0.1% 732,580 680,660 7.6% 1,133,155
Source: Company Data & Team-BHP.com, Shah Investor's Research
Automobile Monthly Dashboard November 2012 7 December 2012
19 I Page
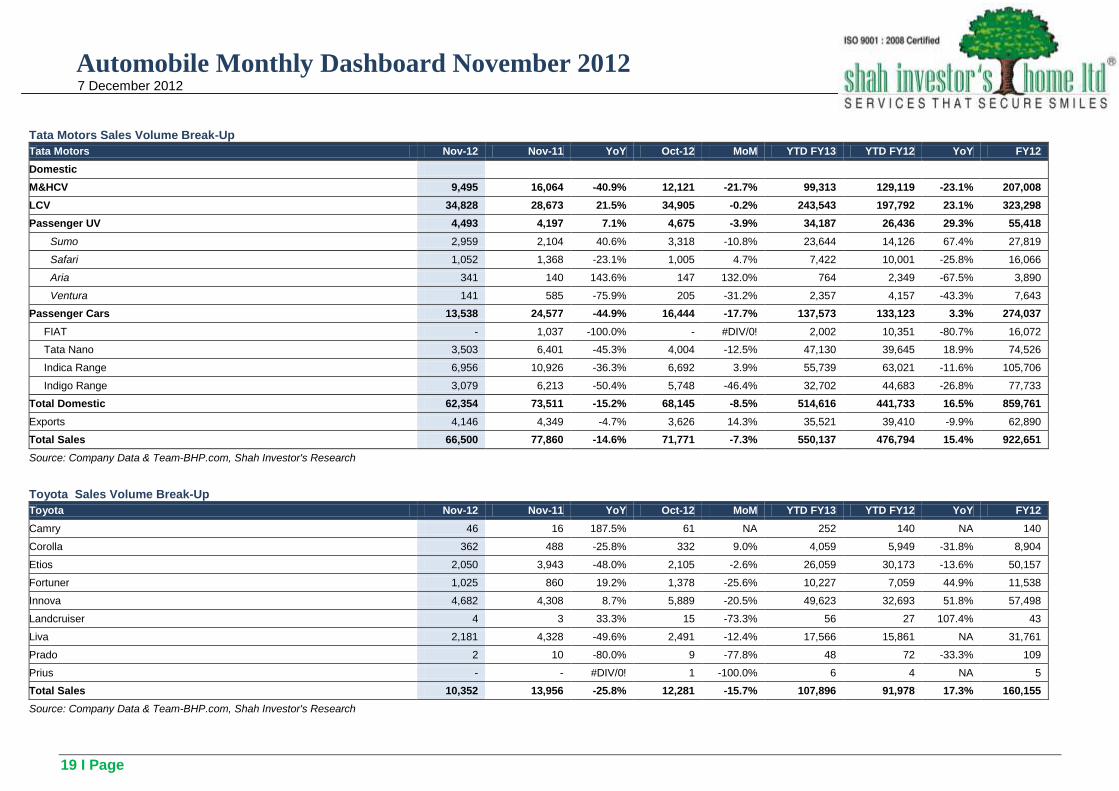
Tata Motors Sales Volume Break-Up
Tata Motors Nov-12 Nov-11 YoY Oct-12 MoM YTD FY13 YTD FY12 YoY FY12
Domestic
M&HCV 9,495 16,064 -40.9% 12,121 -21.7% 99,313 129,119 -23.1% 207,008
LCV 34,828 28,673 21.5% 34,905 -0.2% 243,543 197,792 23.1% 323,298
Passenger UV 4,493 4,197 7.1% 4,675 -3.9% 34,187 26,436 29.3% 55,418
Sumo 2,959 2,104 40.6% 3,318 -10.8% 23,644 14,126 67.4% 27,819
Safari 1,052 1,368 -23.1% 1,005 4.7% 7,422 10,001 -25.8% 16,066
Aria 341 140 143.6% 147 132.0% 764 2,349 -67.5% 3,890
Ventura 141 585 -75.9% 205 -31.2% 2,357 4,157 -43.3% 7,643
Passenger Cars 13,538 24,577 -44.9% 16,444 -17.7% 137,573 133,123 3.3% 274,037
FIAT - 1,037 -100.0% - #DIV/0! 2,002 10,351 -80.7% 16,072
Tata Nano 3,503 6,401 -45.3% 4,004 -12.5% 47,130 39,645 18.9% 74,526
Indica Range 6,956 10,926 -36.3% 6,692 3.9% 55,739 63,021 -11.6% 105,706
Indigo Range 3,079 6,213 -50.4% 5,748 -46.4% 32,702 44,683 -26.8% 77,733
Total Domestic 62,354 73,511 -15.2% 68,145 -8.5% 514,616 441,733 16.5% 859,761
Exports 4,146 4,349 -4.7% 3,626 14.3% 35,521 39,410 -9.9% 62,890
Total Sales 66,500 77,860 -14.6% 71,771 -7.3% 550,137 476,794 15.4% 922,651
Source: Company Data & Team-BHP.com, Shah Investor's Research
Toyota Sales Volume Break-Up
Toyota Nov-12 Nov-11 YoY Oct-12 MoM YTD FY13 YTD FY12 YoY FY12
Camry 46 16 187.5% 61 NA 252 140 NA 140
Corolla 362 488 -25.8% 332 9.0% 4,059 5,949 -31.8% 8,904
Etios 2,050 3,943 -48.0% 2,105 -2.6% 26,059 30,173 -13.6% 50,157
Fortuner 1,025 860 19.2% 1,378 -25.6% 10,227 7,059 44.9% 11,538
Innova 4,682 4,308 8.7% 5,889 -20.5% 49,623 32,693 51.8% 57,498
Landcruiser 4 3 33.3% 15 -73.3% 56 27 107.4% 43
Liva 2,181 4,328 -49.6% 2,491 -12.4% 17,566 15,861 NA 31,761
Prado 2 10 -80.0% 9 -77.8% 48 72 -33.3% 109
Prius - - #DIV/0! 1 -100.0% 6 4 NA 5
Total Sales 10,352 13,956 -25.8% 12,281 -15.7% 107,896 91,978 17.3% 160,155
Source: Company Data & Team-BHP.com, Shah Investor's Research
Automobile Monthly Dashboard November 2012 7 December 2012
20 I Page
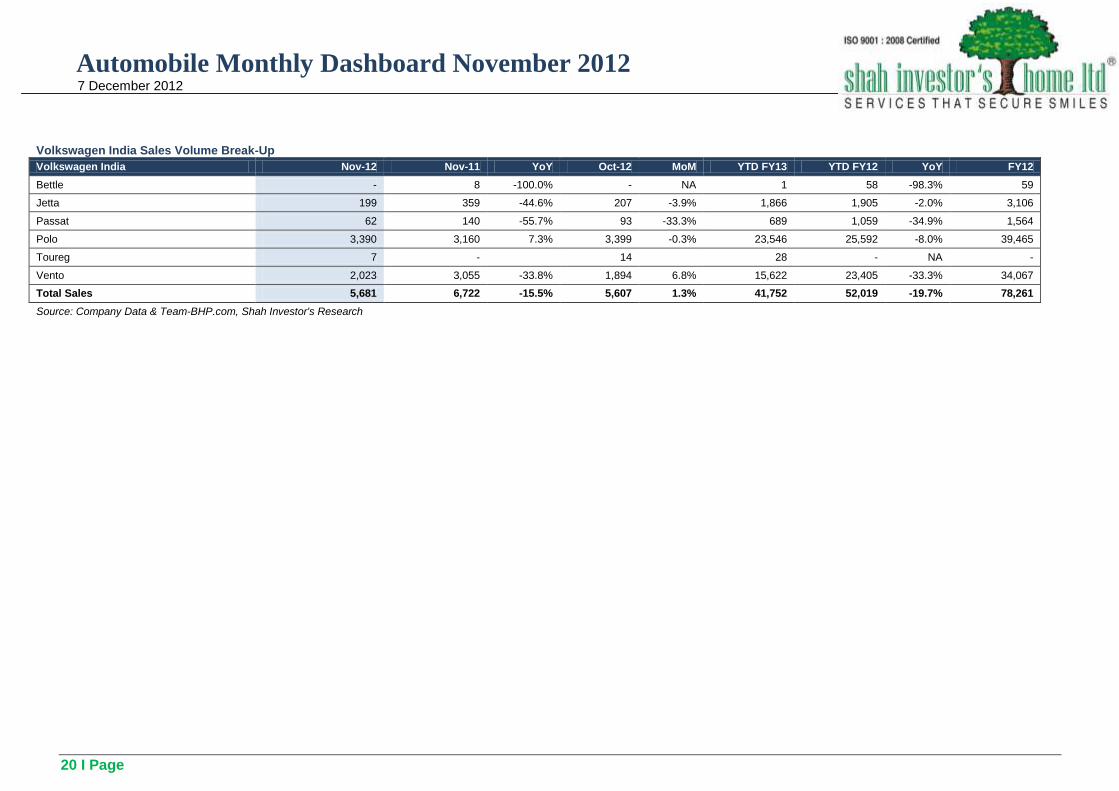
Volkswagen India Sales Volume Break-Up
Volkswagen India Nov-12 Nov-11 YoY Oct-12 MoM YTD FY13 YTD FY12 YoY FY12
Bettle - 8 -100.0% - NA 1 58 -98.3% 59
Jetta 199 359 -44.6% 207 -3.9% 1,866 1,905 -2.0% 3,106
Passat 62 140 -55.7% 93 -33.3% 689 1,059 -34.9% 1,564
Polo 3,390 3,160 7.3% 3,399 -0.3% 23,546 25,592 -8.0% 39,465
Toureg 7 - 14 28 - NA -
Vento 2,023 3,055 -33.8% 1,894 6.8% 15,622 23,405 -33.3% 34,067
Total Sales 5,681 6,722 -15.5% 5,607 1.3% 41,752 52,019 -19.7% 78,261
Source: Company Data & Team-BHP.com, Shah Investor's Research
Automobile Monthly Dashboard November 2012 7 December 2012
21 I Page
Contact Details
Shah Investor’s Home Ltd B /105, 1
st Floor, Sahayog Tower,
Above Central Bank of India, S.V. Road, Kandivali (West) Mumbai-400067 www.sihl.in
Contact: [email protected], +91-22-28016715/16 You can also access our reports on Bloomberg (ERH SIH<GO>)
Disclaimer:‐ The Information provided by SMS or in newsletter or in any document has been prepared by Shah Investor‟s Home Ltd (SIHL). The Information provided by SMS or in newsletter does
not constitute an offer or solicitation for the purchase or sale of any financial instrument or as an official confirmation of any transaction. The information contained herein is from publicly available data or other sources believed to be reliable, but we do not represent that it is accurate or complete and it should not be relied on as such. SIHL or any of its affiliates/ group companies shall not be in any way responsible for any loss or damage that may arise to any person from any inadvertent error in the information contained in this report or SMS. This Information provided by SMS, reports or in newsletter is provided for assistance only and is not intended to be and must not alone be taken as the basis for an investment decision. The user assumes the entire risk of any use made of this information. Each recipient of this Information provided by SMS, report or in newsletter should make such investigation as it deems necessary to arrive at an independent evaluation of an investment in the securities of companies referred to in this information provided by SMS, report or in newsletter (including the merits and risks involved), and should consult his own advisors to determine the merits and risks of such investment. The investment discussed or views expressed may not be suitable for all investors. This information is strictly confidential and is being furnished to you solely for your information.
The information should not be reproduced or redistributed or passed on directly or indirectly in any form to any other person or published, copied, in whole or in part, for any purpose.
The information provided by report or SMS is not directed or intended for distribution to, or use by, any person or entity who is a citizen or resident of or located in any locality, state, country or other jurisdiction, where such distribution, publication, availability or use would be contrary to law, regulation or which would subject SIHL and affiliates/ group companies to any registration or licensing requirements within such jurisdiction. The distribution of this Information provided by SMS or in newsletter in certain jurisdictions may be restricted by law, and persons in whose possession this Information provided by SMS or in newsletter comes, should inform themselves about and observe, any such restrictions. The information given or Information provided by SMS, report or in newsletter is as of the date of the issue date of report or the date on which SMS provided and there can be no assurance that future results or events will be consistent with this information. This information is subject to change without any prior notice. SIHL reserves the right to make modifications and alterations to this statement as may be required from time to time. However, SIHL is under no obligation to update or keep the information current.
Nevertheless, SIHL is committed to providing independent and transparent recommendation to its client and would be happy to provide any information in response to specific client
queries. Neither SIHL nor any of its affiliates, group companies, directors, employees, agents or representatives shall be liable for any damages whether direct, indirect, special or consequential including lost revenue or lost profits that may arise from or in connection with the use of the information. Past performance is not necessarily a guide to future performance. The disclosures of interest statements incorporated in the Information provided by SMS, report or in newsletter are provided solely to enhance the transparency and should not be treated as endorsement of the views expressed in the report. The analyst for this report certifies that all of the views expressed in this report accurately reflect his or her personal views about the subject company or companies and its or their securities, and no part of his or her compensation was, is or will be, directly or indirectly related to specific recommendations or views expressed in this report.
Related Documents