AUTOMATION & INTEGRATION OF SECONDARY AIR SYSTEM WORKFLOW FOR MULTIDISCIPLINARY DESIGN OPTIMIZATION OF GAS TURBINES by Timothé PEOC’H THESIS PRESENTED TO ÉCOLE DE TECHNOLOGIE SUPÉRIEURE IN PARTIAL FULFILLMENT FOR A MASTER’S DEGREE WITH THESIS IN AEROSPACE ENGINEERING M.A.Sc. MONTREAL, SEPTEMBER 17TH 2019 ÉCOLE DE TECHNOLOGIE SUPÉRIEURE UNIVERSITÉ DU QUÉBEC Copyright © 2019, Timothé PEOC’H, All right reserved

Welcome message from author
This document is posted to help you gain knowledge. Please leave a comment to let me know what you think about it! Share it to your friends and learn new things together.
Transcript

AUTOMATION & INTEGRATION OF SECONDARY AIR SYSTEM WORKFLOW FOR MULTIDISCIPLINARY
DESIGN OPTIMIZATION OF GAS TURBINES
by
Timothé PEOC’H
THESIS PRESENTED TO ÉCOLE DE TECHNOLOGIE SUPÉRIEURE
IN PARTIAL FULFILLMENT FOR A MASTER’S DEGREE WITH THESIS IN AEROSPACE ENGINEERING
M.A.Sc.
MONTREAL, SEPTEMBER 17TH 2019
ÉCOLE DE TECHNOLOGIE SUPÉRIEURE UNIVERSITÉ DU QUÉBEC
Copyright © 2019, Timothé PEOC’H, All right reserved

© Copyright Reproduction, saving or sharing of the content of this document, in whole or in part, is prohibited. A reader
who wishes to print this document or save it on any medium must first obtain author’s permission

BOARD OF EXAMINERS
THIS THESIS HAS BEEN EVALUATED
BY THE FOLLOWING BOARD OF EXAMINERS
M. Hany MOUSTAPHA, Thesis Supervisor Department of Mechanical Engineering, École de technologie supérieure M. François Garnier, Thesis Co-Supervisor Department of Mechanical Engineering, École de technologie supérieure Mme Tasseda BOUKHERROUB, Chair, Board of Examiners Department of Systems Engineering, École de technologie supérieure M. Constant CHARRETON, External Examiner SIEMENS CANADA LIMITED M. Martin STANISZEWSKI, Project Manager SIEMENS CANADA LIMITED
THIS THESIS WAS PRESENTED AND DEFENDED
IN THE PRESENCE OF A BOARD OF EXAMINERS AND THE PUBLIC
SEPTEMBER 5TH 2019
AT ÉCOLE DE TECHNOLOGIE SUPÉRIEURE


REMERCIEMENTS
Je tiens à remercier M. Hany Moustapha pour la confiance qu’il m’a accordé dans le cadre de
sa chaire de recherche « Siemens Chair on Industry 4.0 Technology Integration ». Cette année
et demie passée dans les locaux de Siemens Canada m’a permis de développer une
connaissance approfondie des mécanismes de conception des turbines à gaz.
Merci à Martin Staniszewski de m’avoir permis de trouver ma place au sein de son équipe à
Siemens Canada. Ce fut un voyage passionnant dans lequel je me suis pleinement épanoui.
Merci à Haley Deamond pour les nombreuses heures de relecture et pour ses conseils précieux
et toujours pertinents.
Pour leur expertise technique et leur passion communicative, je souhaite remercier Constant
Charreton et Samuel Vaillancourt.
Bien évidemment, merci à Baptiste Audéon, William Camirand, Maruthi Rangappa, Jasvir
Kaur Dhaliwal, Nadia Paramassivam, Sebastian Pilarski, Tomas Diaz Jimenez & Ahmed
Bayoumy tous membres de cette chaleureuse équipe DMADO.

Automatisation et intégration du flux de travail du système d’air secondaire pour l’optimisation multidisciplinaire des turbines à gaz
Timothé PEOC’H
RÉSUMÉ
Cette thèse présente l’intégration d’outils servant pour le compte du système d’air secondaire (SAS) dans une plateforme de conception et d’analyse (D&A) développée dans un contexte d’optimisation de conception multidisciplinaire (MDO). Comme la technologie des turbines à gaz requiert une très grande précision et par conséquent un travail méticuleux dans de nombreux domaines d’expertise, les ingénieur.e.s souffrent des tâches sans valeur ajoutée comme la gestion des données, la mauvaise transmission d’information entre les logiciels et les fastidieux pré et post-traitement des données produites. Les éléments décrits précédemment réduisent grandement le temps d’analyse et la qualité du produit final. Une telle plateforme regroupe les logiciels servant à la conception des turbines à gaz afin de permettre leur automatisation. Les outils sont exécutés en mode batch et la plateforme est liée à un système de gestion des données qui garantit une amélioration de l’efficacité du processus. Le SAS permet le refroidissement de composants tels que les aubes de turbines. Il participe également à l’isolation et à la gestion des charges appliquées sur les roulements à billes. Sans un tel système les turbines à gaz ne pourraient atteindre les puissances atteintes aujourd’hui. Un outil a été conçu et testé pour les ingénieur.e.s SAS. Au travers d’une scrupuleuse analyse du flux de travail, une liste de tâches éligibles pour l’automatisation a été établie et priorisée. Le pré-traitement a été semi-automatisé. Une pré-configuration basée sur les informations d’entrée permet de grandement réduire les erreurs humaines. Le traitement à proprement parler a été complètement automatisé, permettant le calcul d’une courbe de puissance complète en une seule exécution. Finalement, une autre source d’amélioration fut accomplie grâce au post-traitement. Les outils SAS produisent un grand nombre de valeurs, ainsi, pour simplifier la lecture de ces données, une page de synthèse affichant les paramètres d’intérêt a été créée, un outil pour tracer des graphiques est introduit pour réduire l’utilisation des feuilles de calcul. De manière à permettre plus d’itérations de conception et plus tard la MDO, le module SAS intègre une boucle de retour vers le module de performance. L’alignement des deux modèles (SAS et performance) est établi grâce à l’intégration des purges d’air du SAS dans le modèle de performance. Les fonctionnalités décrites ci-dessus ont montré un très grand potentiel. A présent, les tâches sans valeur-ajoutée sont drastiquement réduites; par conséquence, le temps d’analyse est allongé. Ainsi, l’exactitude des résultats sera grandement améliorée grâce aux multiples itérations.
Mots-Clés : Moteurs aéro-dérivés, turbines à gaz, automatisation, système d’air secondaire,
industrie 4.0

Automation and integration of secondary air system workflow for multidisciplinary design optimization of gas turbines
Timothé PEOC’H
ABSTRACT
This thesis presents the automation and integration of Secondary Air System (SAS) tools into a Design & Analysis (D&A) platform developed in a Multidisciplinary Design Optimization (MDO) context. As technology increasingly requires high precision, and therefore meticulous work in multi-expertise fields, gas turbine engineers and analysts suffer from non-value-added tasks. Among these tasks stand data management, poor data transmission between software, and fastidious pre and post-processing; all of which greatly reduce analysis time and consequently the quality of the final product. The objective of this project was to regroup all gas turbine software into a single platform to allow for automation. Tools are now run in batch mode and the platform is linked to a data management system both of which improve efficiency of the engineering workflow. This platform has been designed and tested for SAS engineers, but can be applied to other disciplines as well. The SAS extracts air from the main gas path in the compressors of gas turbines, which is then used for sealing and cooling in addition to influencing the load on the thrust bearings. SASs are thus necessary for gas turbines to reach high powers. To design a SAS specific platform a careful analysis of the workflow was performed and a list of eligible tasks for (semi-)automation was established and prioritized. The following objectives were achieved: pre and post -processing were semi-automated, and processing was fully automated. The complete automation of the process allowed an entire power-curve calculation to be generated in a single run. Whereas the automation of the post-processing allowed for simplified readouts using a task-dependent synthesis page and for graphs to be automatically created reducing manual plotting. The desirable amounts of design iterations do not occur because of the complex and lengthy calculations. In order to perform iterations and later MDO, the SAS module integrates a feedback loop to the performance module with the integration of SAS bleeds into the performance model to ensure model alignments. The aforementioned functionalities have shown great potential. Thus far, non-value-added tasks have been drastically reduced; consequently, time for analysis has been lengthened. In addition, result accuracy will greatly improve thanks to multi-iteration. Keywords : Aero derivative engines, gas turbines, automation, secondary air system, industry
4.0

TABLE OF CONTENT
Page
INTRODUCTION .....................................................................................................................1
CHAPTER 1 AN INDUSTRY 4.0 DESIGN & ANALYSIS PLATFORM ......................7 1.1 Industry 4.0 ....................................................................................................................7 1.2 Design and Analysis Platform .......................................................................................8
The Platform ............................................................................................... 8 Workflow Integration................................................................................ 11 Knowledge Management and PLM .......................................................... 11 Benefits ..................................................................................................... 12
CHAPTER 2 LITERATURE REVIEW: AUTOMATING A SAS WORKFLOW ........13 2.1 Understanding SAS tool as part of the GT design process ..........................................13
Gas turbine concept................................................................................... 13 SAS description ........................................................................................ 14 SAS engineer’s role .................................................................................. 17 Critical SAS components .......................................................................... 18
2.2 Challenges and need for automation ............................................................................25 Challenges faced by engineers .................................................................. 25 The need for automation ........................................................................... 26
2.3 Automating an engineering workflow .........................................................................27 Workflow definition.................................................................................. 27 Identify good automation candidates ........................................................ 28 Automation strategy .................................................................................. 28 Automation development .......................................................................... 29
2.4 Conclusion ...................................................................................................................31
CHAPTER 3 AUTOMATION METHODOLOGY ........................................................33 3.1 Introduction ..................................................................................................................33 3.2 Workflow Analysis ......................................................................................................33
Methodology ............................................................................................. 33 CAM- Modeling the Workflow ................................................................ 36
3.3 Analysis of user’s needs...............................................................................................50 Surveillance of the need of users .............................................................. 50 House of quality ........................................................................................ 53 Tool development Roadmap ..................................................................... 55
CHAPTER 4 AUTOMATION IMPLEMENTATION AND RESULTS ........................59 4.1 Workflow automation ..................................................................................................59
Methodology ............................................................................................. 59 Application ................................................................................................ 62
4.2 Automation Results ......................................................................................................67
XII
Experimentation Protocol ......................................................................... 67 Experimentation Results ........................................................................... 71 Limitations & Discussion ......................................................................... 80
CHAPTER 5 ADDRESSING USER EXPERIENCE......................................................83 5.1 Implementing new feature to fit users’ expectations ...................................................83
Agile development .................................................................................... 83 Using user feedback .................................................................................. 84 Managing change ...................................................................................... 84 Gathering analytics in the background ..................................................... 85 Gamification ............................................................................................. 86
5.2 User Interface guidelines definitions ...........................................................................87 Minimal number of clicks ......................................................................... 87 Keep the user informed ............................................................................. 89 Manage, Prevent, but with Freedom ......................................................... 93 Minimalist Design ..................................................................................... 94 Documented Help ..................................................................................... 94 Standardized tools ..................................................................................... 95
CHAPTER 6 MULTIDISCIPLINARY ANALYSIS: INTERACTIONS BETWEEN SAS AND PERFORMANCE ....................................................................97
6.1 Concept ........................................................................................................................97 6.2 Feedback loop ..............................................................................................................97
Performance model ................................................................................... 97 Possible inconsistencies ............................................................................ 98 Need for a new methodology .................................................................... 99
6.3 Convergence Module .................................................................................................100 Batch Automation ................................................................................... 100 Extension of the design space for model alignment ............................... 100 Integration of a MDO module ................................................................. 101
CONCLUSION ..................................................................................................................103
FUTURE DIRECTIONS .......................................................................................................105
BIBLIOGRAPHY ..................................................................................................................109
LIST OF TABLES
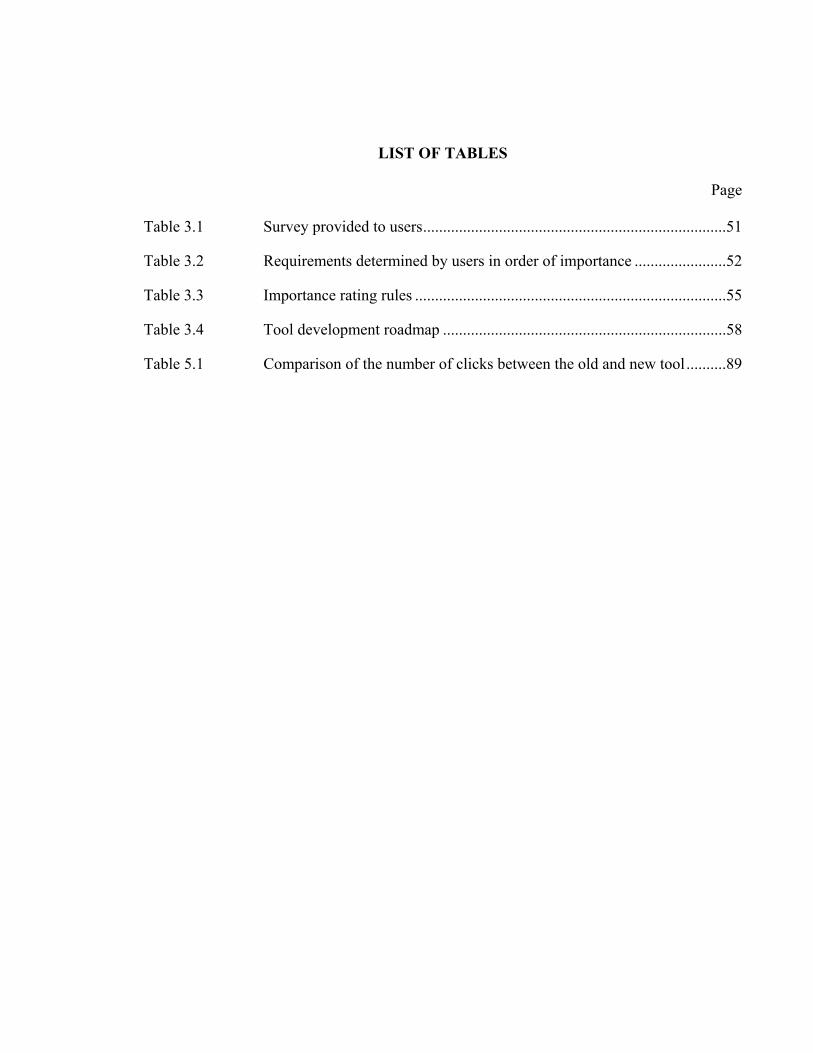
Page Table 3.1 Survey provided to users ............................................................................51
Table 3.2 Requirements determined by users in order of importance .......................52
Table 3.3 Importance rating rules ..............................................................................55
Table 3.4 Tool development roadmap .......................................................................58
Table 5.1 Comparison of the number of clicks between the old and new tool ..........89


LIST OF FIGURES
Page
Figure 1.1 Design & Analysis platform concept applied to the Siemens aeroderivative gas turbine development ....................................................10
Figure 2.1 Comparison of real and ideal thermodynamic process: ideal (left) real (right) .........................................................................................................13
Figure 2.2 GT cross-section with emphasis on the SAS, extracted from (Rolls-Royce, 1986) ...................................................................................14
Figure 2.3 Rim Seal description, extracted from (Zhou et al., 2013) ..........................15
Figure 2.4 Example of five bearing locations (1,2, 3B-3R, 4 and 5) on the CF56 engine; extracted from: (Lufthansa, 1999) .................................................16
Figure 2.5 Sealing Technology: Possible locations within GT, extracted from (Rolls-Royce, 1986) ..........................................................................19
Figure 2.6 Illustration of sealings technologies, extracted from (Rolls-Royce, 1986) ..........................................................................21
Figure 2.7 Bearing architecture ...................................................................................22
Figure 2.8 Simplified loads applied to an AGT shaft through compressor and turbine blades ......................................................................................23
Figure 3.1 Inputs and Outputs convention (in the context of Discipline B) ...............35
Figure 3.2 Color and Form Code for CAM modeling .................................................38
Figure 3.3 Convention for spreadsheet presentation ...................................................39
Figure 3.4 Simplified Gas Turbine workflow by discipline ........................................41
Figure 3.5 SAS-Performance-Aerothermal interconnectivity .....................................43
Figure 3.6 Secondary Air System main workflow (high level) ..................................48
Figure 3.7 House of quality: designed based on a template by Christopher Battles................................................................................56
Figure 4.1 Design envelope definition ........................................................................63
Figure 4.2 SAS workflow demonstrating the task-issues and their solutions .............66
XVI
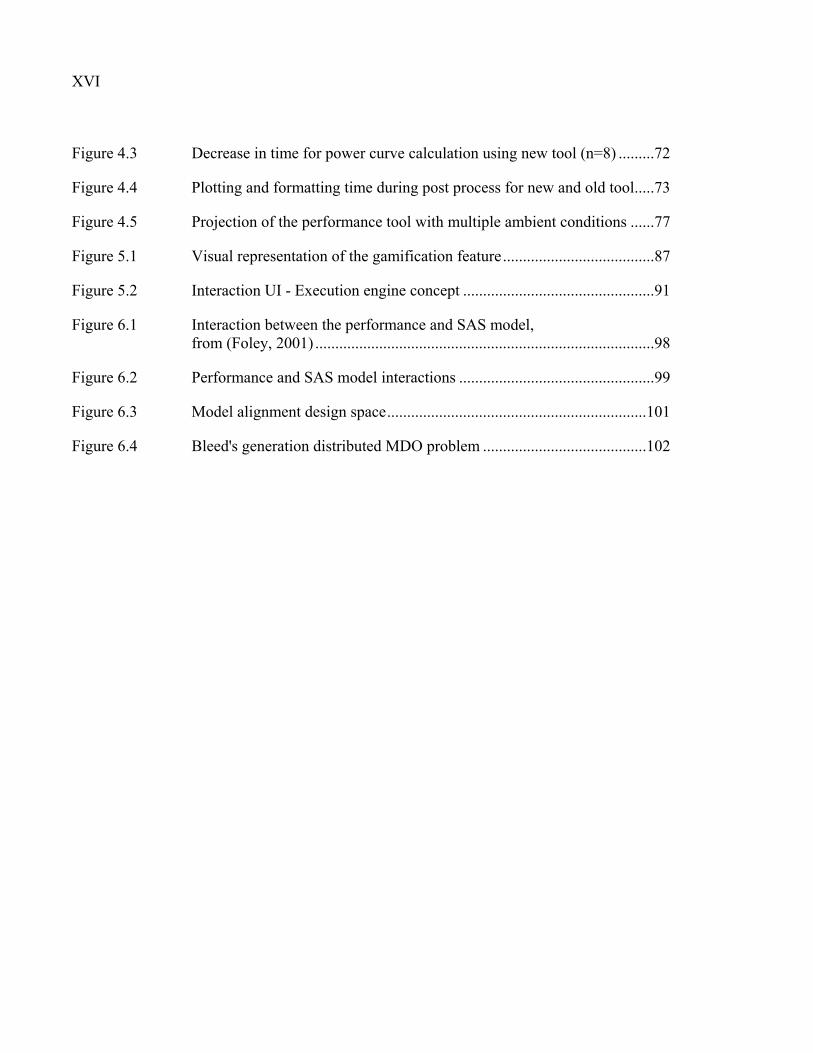
Figure 4.3 Decrease in time for power curve calculation using new tool (n=8) .........72
Figure 4.4 Plotting and formatting time during post process for new and old tool .....73
Figure 4.5 Projection of the performance tool with multiple ambient conditions ......77
Figure 5.1 Visual representation of the gamification feature ......................................87
Figure 5.2 Interaction UI - Execution engine concept ................................................91
Figure 6.1 Interaction between the performance and SAS model, from (Foley, 2001) .....................................................................................98
Figure 6.2 Performance and SAS model interactions .................................................99
Figure 6.3 Model alignment design space .................................................................101
Figure 6.4 Bleed's generation distributed MDO problem .........................................102

LIST OF ABBREVIATIONS AND ACRONYMS
AGT Aeroderivative Gas Turbine
API Application Programming Interface
BC
Boundary Condition
CAD Computer Assisted Design
CAM Cambridge Advanced Modeler
CPU
Central processing Unit
D&A Design & Analysis
DICE Duration, Integrity Commitment and Effort
GT Gas Turbine
HP
High Pressure
IDF Individual Discipline Feasible
IP
Intermediate Pressure
ISA International Standard Atmosphere
JSON JavaScript Object Notation
LP
Low Pressure
MDA Multidisciplinary Design Analysis
MDO Multidisciplinary Design Optimization
NGV Nozzle Guide Vane
NHATC Non-Hierarchical Analytical Target Cascading
NOx Nitrogen Oxide
OOP Object Oriented Programming
XVIII
PLM Product Life Management
RAM Random Access Memory
ROI Return On Investment
SAS Secondary Air System
UI User Interface
WETM
Whole Engine Thermo-Mechanics
INTRODUCTION
Context The gas turbine market, much like other markets, is under stress as a consequence of short
developing times. As a consequence, gas turbine manufacturers cannot afford to run long and
complex iterative processes. However, new methods are being widely developed to address
these issues as historical companies’ best practices struggle to fulfill new market requirements.
To tackle the issue of time, workflow automation has become mandatory. However, if
automation is occurring it must be integrated wisely so as to not limit engineering creativity
(Tarkian, 2012). This improvement will not only produce time benefits but also increase the
design space exploration. All of these advantages ultimately lead to increased result accuracy.
In 2010, a German initiative proclaimed the advent of a new era for the industry, called Industry
4.0. This new revolution aims at leading forward the digitalization and collaboration of
engineering, manufacturing, and business and strategy management. The industry 4.0 experts
advocate for better efficiency at all levels of the product life-cycle. The aeroderivative gas
turbine (AGT) industry is very competitive as many multinational firms such as Siemens, or
General Electric develop state-of-the-art AGTs. Over the past few years a new game changing
technology has been introduce to the market: renewable energy. Facing growing concerns
about global warming irreversibility, gas turbine manufacturers are now redoubling efforts to
develop cleaner and more efficient products. As a consequence, there has been a push to
develop new technology.
To address these contextual constraints, the decision of providing a new powerful tool kit to
enhance engineers’ tasks was introduced. The growing interest for coordination of engineering
disciplines in complex design processes can be achieved with Multidisciplinary Design
Analysis (MDA). An engineering system can be decomposed into multiple subsystems sharing
variables with one another. Multidisciplinary Design Optimization (MDO) is the coordinated
2
research of the optimized values for these variables (Sobieszczanski-Sobieski, 1995).
Providing engineers a powerful framework that incorporates MDO has shown to be beneficial
(Gray, Moore, Hearn, & Naylor, 2013).
This current project is part of a wider project aiming at developing industry 4.0 concepts at the
AGT division of SIEMENS Canada. The AGT division develops and assembles the AGT
(limited manufacturing). The primary focus of Industry 4.0 is analyzing and using data to
improve quality of results and decision making. The implementation of industry 4.0 concepts
was separated into two projects, manufacturing (not discussed here) and engineering (some
aspects of which will be discussed in greater detail).
The successful implementation of a multidisciplinary platform at SIEMENS large gas turbines
in the USA convinced management at SIEMENS AGT to also develop a single
multidisciplinary engineering platform using the same framework (Ramamurthy, Valenzuela-
del-Rio, Villeneuve, & Veer, 2014).
Indeed, a multidisciplinary platform can address a bottleneck in an engineer’s success which
is reducing errors and having design tools that are increasingly performant. One way a
multidisciplinary platform can resolve this is by incorporating Product Life Management
(PLM), which also promotes a better collaboration of the workforce (Ebert, 2013).
Unfortunately, there is currently no platform that allows for improved speed, accuracy, and the
collaborative efforts from different disciplines for AGTs.
One aspect of the AGT design process which complicates the integration of a multidisciplinary
platform is that it involves many engineers and many different tools that require specific
knowledge and training to master. The project in which the current research is involved intends
to integrate most of the engineering tools into a single platform.
To design an AGT a workflow must be defined. This design workflow is divided into
disciplines, each with their domain of expertise. The higher-level disciplines are referred to as
3
whole-engine disciplines. It was decided to integrate the tools of these higher-level disciplines
into the framework first. Two of these higher disciplines have been automated and integrated
in parallel to the work being described in this document. First, the Performance tool, a 1D
thermo-mechanical model, providing pressures, temperatures, flows and rotational speeds
across the engine was integrated. Second, a 2D whole engine thermo-mechanical model
allowing finite element calculations and analysis was integrated.
The project hereby presented describes the automation and integration of the Secondary Air
System (SAS), another higher-level discipline. More specifically, this project integrates the
SAS calculations of its numerical model into the previously described multidisciplinary
platform. The SAS is located “inside” the AGT and provides air to cool and seal critical
components, and manage bearing loads (Chapter 2). Engineers responsible for the SAS design
use a model of the SAS as well as a solver to calculate pressures, temperatures and flows across
the SAS. Results are used to assess the quality and efficiency of the SAS in a given
configuration. This defines the SAS design workflow. Therefore, analysis, automation and
integration, in an in-house framework (Ramamurthy, Valenzuela-del-Rio, Villeneuve, & Veer,
2014), of the SAS design workflow within a single MDO platform in combination with the
PLM software will be the main focus of this research.
In addition to this primary project, additional isolated projects aimed at solving specific issues
encountered during AGT design were launched. For example, a tool enabling computer
assisted design (CAD) automation of the cooling passages of blades was developed and could
be integrated in the platform. Moreover, further subprojects were defined to improve the
multidisciplinary platform framework.
Main Objectives The main objective of this study was to enhance SAS design and analysis by reducing process
time and human error. SAS engineers are currently using a rudimentary software that solves
the SAS 1D network without being user friendly or contributing to the pre and post processing.
4
The aim of this project was to utilize the existing software and re-engineer the workflow such
that it maintains its positive capacities but gains new abilities making it more effective.
Therefore, an entirely new engineering interface was created in order to resolve issues that
create downtime in the pre-processing, processing and post-processing. The new tool was
designed from scratch in Python and visual aspects were rendered thanks to the pyQt library.
Next, the aim was to integrate the developed tool into a wider multidisciplinary platform. In
order to achieve this objective, the research was divided in three separate sub-studies:
- Analyze and understand SAS engineer’s work. This study helped to see the
challenges and the bottlenecks of the current workflow. A careful analysis of this
workflow in addition with the consideration of engineers’ needs helped define a
general roadmap for a more efficient tool.
- The second phase was to develop the tool and that followed the guidelines previously
established with the roadmap. To do so, a conceptualization of the tasks was
undertaken in order to perform the best automation possible.
- Finally, the SAS tool was designed to enable MDA and MDO calculation.
Secondary Objectives & Constraints This project, being part of a more global project, driven to implement the Industry 4.0 concept
within an AGT context, was centered around the following hypotheses and constraints:
- The proposed method and tool kit should not require more computational power than
what the workforce can already provide.
- The proposed tool should be MDA and MDO compatible.
- The SAS solver should preferably remain the same as many companies have
developed knowledge and comfort with this tool.
5
Thesis organization The first chapter will address the current multidisciplinary platform upon which the study is
based. This will be followed by a literature review focusing on the SAS and means to analyze
and automate a workflow. The SAS workflow automation methodology and roadmap
definition will be presented. The new tool performance will be displayed and analyzed. As the
engineers are the main users of this tool, the user experience (UX) component will be addressed
in the fifth chapter. Interaction of the SAS tool and the Performance tool will be explained and
detailed in the sixth chapter on feedback loops. Finally, a discussion and a conclusion regarding
this study will be presented.

CHAPTER 1
AN INDUSTRY 4.0 DESIGN & ANALYSIS PLATFORM
1.1 Industry 4.0
Industry 4.0 is a German governmental initiative (Industrie 4.0 in German) launched in 2011.
It resides on the belief that the industrial world has come to its fourth revolution. The first,
which appeared in late XVIIIth century began with steam power. The second revolution
occurred in the late XIXth century with electrification. It was the beginning of machine
manufacturing and mass production. The third revolution took place after the two world wars,
by the end of the XXth century. The advent of computerisation and fast calculation gave it its
name - the digital revolution. This was the beginning of the internet, connectivity and
manufacturing automation.
The fourth industrial revolution, or Industry 4.0, is driven by three main components that are
the Internet of things, cyber-physical systems and smart factories (Kagermann, Wahlster, &
Helbig, 2013). These concepts are brought together to create connectivity. Information is
shared throughout all processes between objects, computers, and humans creating an
unprecedented amount of data called “big data”. The performance of such a new concept is
linked to the ability to analyse and interpret this data.
The Industry 4.0 is being developed through four main principles: Interconnection,
Information Transparency, Decentralized Decisions and Technical Assistance (Hermann,
Pentek, & Otto, 2016). As the industry 4.0 context brings many players together, they must be
interconnected. Machines, humans, and data must work in collaboration within a safe
environment. This collaboration can only be made possible through rigorous data analysis and
transparent sharing to all the members of the industry. As a result, decisions should be made
wisely in a decentralised manner, considering global and local information sagaciously
coupled. Finally, most human resources are shifted from operating tasks to process assistance
(decision and problem-solving activities).
8
Concerns are also being raised as the fourth industrial revolution could increase social
inequality and (cyber-)security issues, and could result in a modification of our communities
towards less diversity and freedom (Davis, 2016). Industry 4.0 concepts must be used and
implemented in a sustainable and responsible way.
1.2 Design and Analysis Platform
Gas Turbine design complexity has increased with the demanding market over the last decade.
Fuel efficiency, pollution and noise reduction are contributing factors among others. Engineers
are facing unprecedented challenges in order to provide products with improved lifetimes and
that are safer, cleaner, more reliable, and more powerful.
In order to satisfy as many of the above criteria as possible, designers have to run optimization
analysis. Multiple iterations might be required in order to converge to an optimal. Such a
process can be extremely long if run manually. Therefore, the first step is to automate the
process. A Design & Analysis platform provides a framework that will enhance workflow
automation. Providing a single tool to various engineering teams allows better technical
support and synergy between users and results.
The Platform
An in-house framework is of great advantage to the engineers. All modules and submodules
of this framework are developed, tested and validated with their expertise and request.
Moreover Ouellet et al. (Ouellet, Garnier, Roy, & Moustapha, 2014) mentioned that
“aerospace enterprises handle specific and complex design problems that require and rely on
in-house specific extensive knowledge. No commercial Computer Assisted Engineering (i.e.
CAE), Computer assisted Design (i.e. CAD) and Finite Element Analysis (i.e. FEA) tool fully
addresses all of these design problems”. Indeed, many engineering tools are developed in-
house and therefore are not always compatible with optimization software. Such a framework
acts as a buffer between in-house software and external optimization tools.
9
The Design & Analysis platform allows a better project management. Projects can easily be
organised, issues or blockers quickly identified, and tasks assigned to the right expert. By
enhancing collaboration, the overall project timing is sped up and the team’s productivity is
improved as valuable information does not get lost in the process.
The current work is based on the framework developed by Ramamurthy et al. (Ramamurthy et
al., 2014) in which they describe an object-oriented software allowing advanced data
management and workflow simulation. In order to shorten the development cycle, they outline
a framework which includes a Systems Engineering Module that allows the user to select,
configure, and execute a model after having linked all the required inputs. Their framework is
python object-oriented based, and provides an Application Programming Interface (i.e. API)
allowing on-site developers to easily design new streamline workflows upon the engineer’s
request. These workflows are displayed in a user-friendly user-interface (UI), “[minimizing]
the engineers’ necessity to get familiar with new concepts and interfaces”.
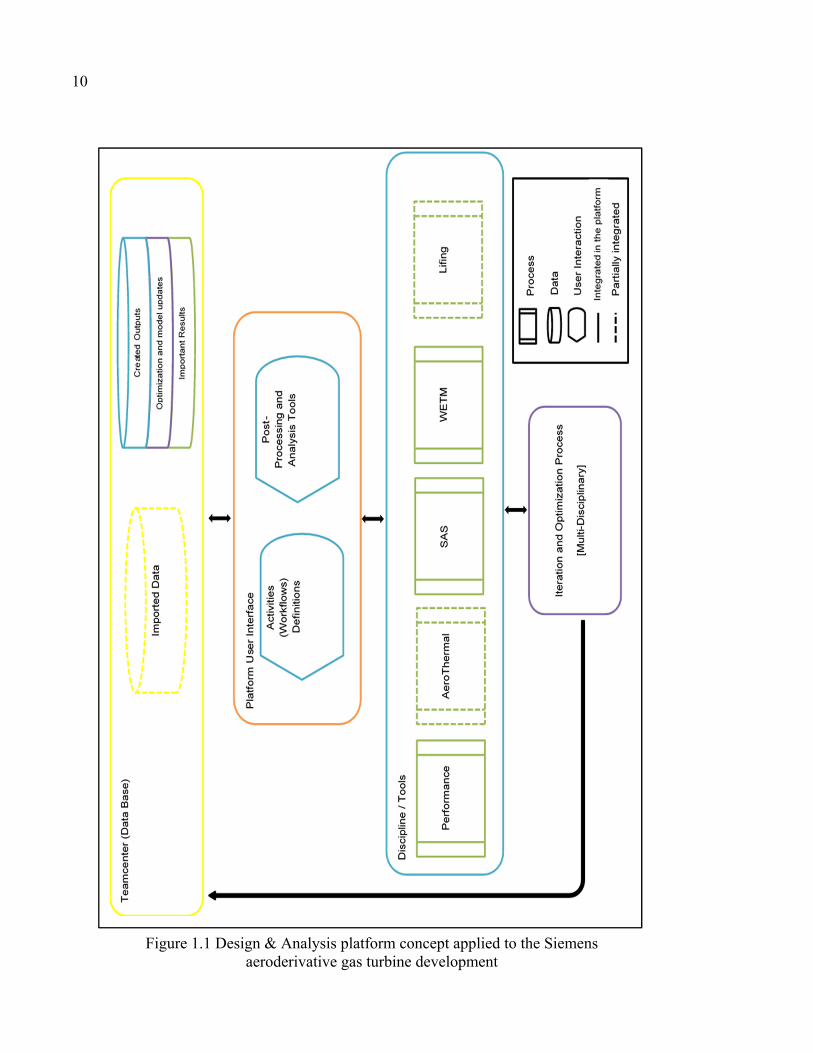
The platform also provides post-processing tools to analyse, compare, save or reject, and
transfer results. Multidisciplinary workflows have also been developed in order to run iteration
analysis and later optimizations. Models, outputs, or any other important results are saved and
shared in a database. Figure 1.1 summarizes how the platform operates.
10
Figure 1.1 Design & Analysis platform concept applied to the Siemens aeroderivative gas turbine development

11
Workflow Integration
The framework also enhances workflow automation. This was accomplished by providing a
unique tool to various engineering teams which allows for better technical support and synergy
between users and results.
In the platform, workflows are synthesised in a wide range of activities. Therefore, processes
can easily be set up by choosing the right succession of activities. Pre-programing the different
workflows enables the engineers to organize their work in collaboration, and keep a coherence
within the company. This standardization of the tasks can be beneficial for collaboration as it
is easier for one engineer to continue someone else’s work.
Knowledge Management and PLM
Knowledge and result transfer are key in an Industry 4.0 context. The platform works in close
collaboration with a Data Management tool that collects, sorts, classifies and redistributes
results or reports. Such a package reduces the risk of losing valuable information. It also
secures sensitive data.
The Design & Analysis platform will be used to integrate a powerful Product Life Management
(PLM) tool; providing model and data management. This is necessary as keeping consistent
data is required to reduce loss of time and errors. The implementation of the PLM tools must
be done with methodology. Processes and communication between teams must be analyzed to
define the PLM implementation method (Cartile, Marsden, & Liscouet-Hanke, 2019).
Because of its design complexity, development teams for gas turbines are composed of many
specialists with a wide range of expertise. Each contributor is required to use their requirements
and inputs to execute a model and analyse the results which will subsequently be passed on to
other experts. This iterative process can be long and produces a significant amount of data. As
a consequence, engineers are spending a long period of time finding up-to-date models or input
files. As Mendel (Mendel, 2011) points out “Engineers usually hate wasting time and effort.

12
After all, time is money, and engineering is always under very tight deadlines”. For instance,
the use of an outdated model or input data can result in incoherent results and the retardation
of the engineering process. In the worst-case scenario, this could result in test failure or on-site
forced outage. The platform reduces the occurrence of these issues.
Not only saved results are considered important. Rejected results can also be considered as
significant and valuable especially if they do not originate from errors or misinterpretations.
Such results help experts to understand which configurations will lead to potential hardware
failure. Moreover, gathering failed run-characteristics will enhance the optimization processes.
Benefits
Automated workflows have several advantages. First of all, they are known to be faster. This
is mandatory in order to perform more iterations in the limited amount of time allowed by the
market. As engineering time is valuable and expensive, it is in the interest of all to optimize
their productivity. As a consequence of automation, non-value-added tasks such as model
gathering, data collecting, run setting are greatly reduced. Lastly, humans are more prone to
errors than computers, thus by reducing non-decisional tasks for an operator one is also
reducing the risk of errors which often results in the waste of valuable time.
CHAPTER 2
LITERATURE REVIEW: AUTOMATING A SAS WORKFLOW
2.1 Understanding SAS tool as part of the GT design process
Gas turbine concept
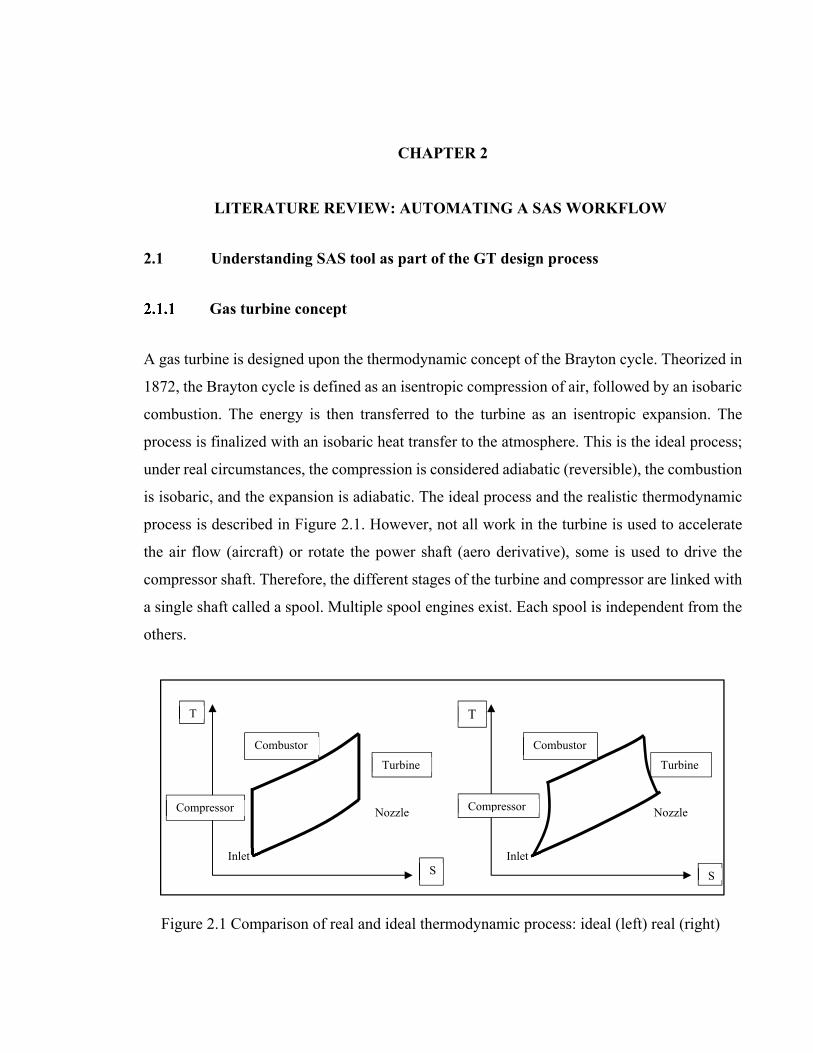
A gas turbine is designed upon the thermodynamic concept of the Brayton cycle. Theorized in
1872, the Brayton cycle is defined as an isentropic compression of air, followed by an isobaric
combustion. The energy is then transferred to the turbine as an isentropic expansion. The
process is finalized with an isobaric heat transfer to the atmosphere. This is the ideal process;
under real circumstances, the compression is considered adiabatic (reversible), the combustion
is isobaric, and the expansion is adiabatic. The ideal process and the realistic thermodynamic
process is described in Figure 2.1. However, not all work in the turbine is used to accelerate
the air flow (aircraft) or rotate the power shaft (aero derivative), some is used to drive the
compressor shaft. Therefore, the different stages of the turbine and compressor are linked with
a single shaft called a spool. Multiple spool engines exist. Each spool is independent from the
others.
Figure 2.1 Comparison of real and ideal thermodynamic process: ideal (left) real (right)
T
S
Compressor
Combustor Turbine
Nozzle
Inlet
T
S
Compressor
Combustor Turbine
Nozzle
Inlet
14
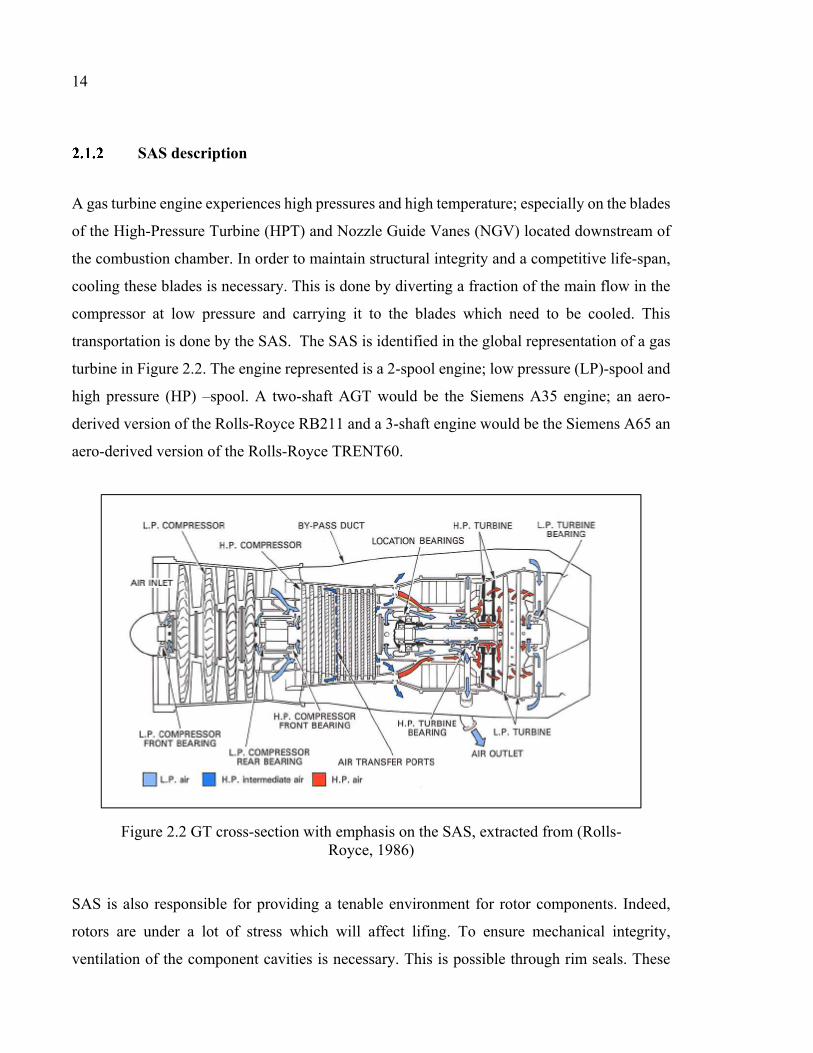
SAS description
A gas turbine engine experiences high pressures and high temperature; especially on the blades
of the High-Pressure Turbine (HPT) and Nozzle Guide Vanes (NGV) located downstream of
the combustion chamber. In order to maintain structural integrity and a competitive life-span,
cooling these blades is necessary. This is done by diverting a fraction of the main flow in the
compressor at low pressure and carrying it to the blades which need to be cooled. This
transportation is done by the SAS. The SAS is identified in the global representation of a gas
turbine in Figure 2.2. The engine represented is a 2-spool engine; low pressure (LP)-spool and
high pressure (HP) –spool. A two-shaft AGT would be the Siemens A35 engine; an aero-
derived version of the Rolls-Royce RB211 and a 3-shaft engine would be the Siemens A65 an
aero-derived version of the Rolls-Royce TRENT60.
SAS is also responsible for providing a tenable environment for rotor components. Indeed,
rotors are under a lot of stress which will affect lifing. To ensure mechanical integrity,
ventilation of the component cavities is necessary. This is possible through rim seals. These
Figure 2.2 GT cross-section with emphasis on the SAS, extracted from (Rolls-Royce, 1986)

15
seals insulate rotor cavities from the hot and highly pressurized air in the turbine annulus
(Zhou, Wood, & Owen, 2013) , (Figure 2.3).
Therefore, air from the compressor, called cooling air, is by-passed to the SAS to ensure no
hot air ingestion within rotor cavities. The hot air is generated from the post-combustion
turbine and if not sealed properly, components in the rotor cavities can experience important
thermal stresses. SAS integrates air from the low-pressure compressor, which allows cooling
air to extract the hot air from the cavities and cool the blades. As a consequence the SAS does
not directly do work on the turbine, thus creating a drop in efficiency (Philip P. Walsh, 2004).
However, the SAS is necessary to maintain the proper functioning of the turbine. The objective
of gas-turbine engineers working on the SAS is to optimize its efficiency by minimizing this
loss. Moreover, without the SAS, AGTs could not produce as much power because temperature
would be too high in the HPT.
The air bled from the compressor to the cooled components goes through a tortuous path and
encounters pressure drops. This is why, SAS air is mostly considered as a loss for the engine
performance. The amount of air bled into the SAS is not negligible, it is estimated to be around
10 to 30% of the main flow of the gas turbine (A. Foley, 2001). Indeed, HPT experiences high
Figure 2.3 Rim Seal description, extracted from (Zhou et al., 2013)
16
pressure and temperature; without cooling they would reach their melting point. Therefore, a
significant amount of air is necessary to keep them under this point. This air is brought from
the compressors to the cooling passages by the SAS.
Moreover, to improve general performance of the gas turbine, higher turbine entry temperature
is required to enhance the ideal Carnot efficiency. This increase in turbine entry temperature
results in an increase of the cooling requirements. In general, these requirements are achieved
by providing a greater quantity of cooling air through the SAS. Therefore, the benefits
associated with the SAS outweigh the loss as it allows for higher power and efficiency.
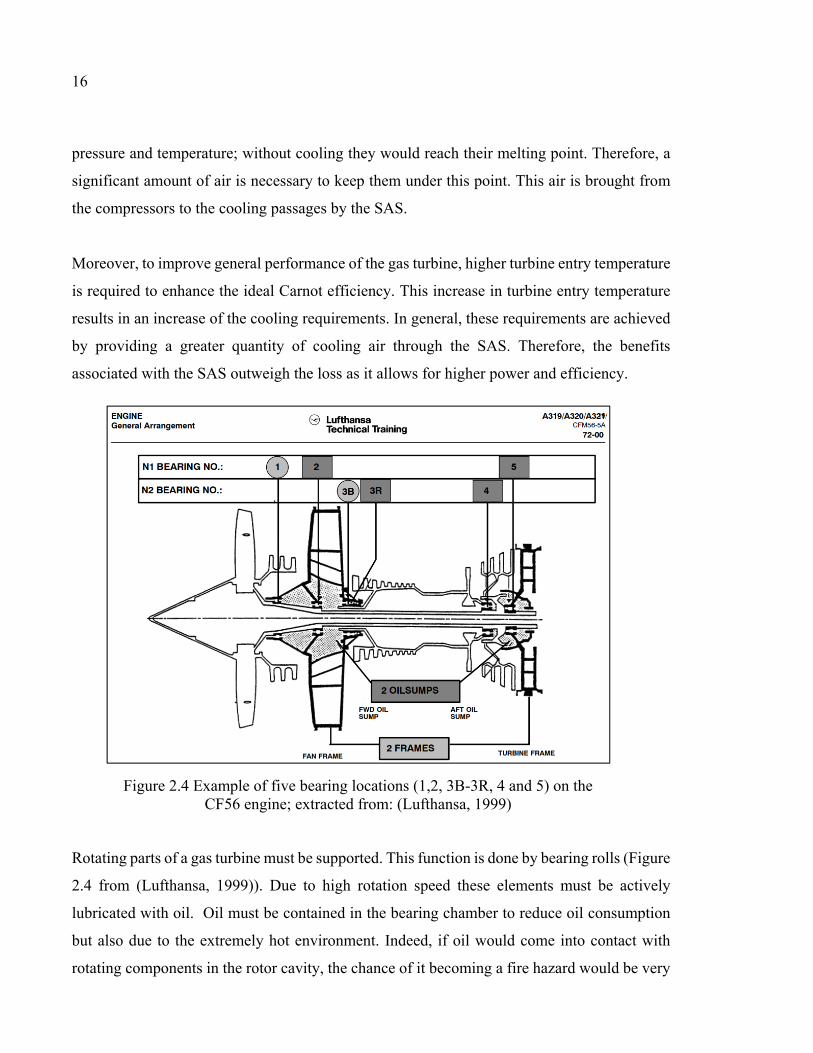
Rotating parts of a gas turbine must be supported. This function is done by bearing rolls (Figure
2.4 from (Lufthansa, 1999)). Due to high rotation speed these elements must be actively
lubricated with oil. Oil must be contained in the bearing chamber to reduce oil consumption
but also due to the extremely hot environment. Indeed, if oil would come into contact with
rotating components in the rotor cavity, the chance of it becoming a fire hazard would be very
Figure 2.4 Example of five bearing locations (1,2, 3B-3R, 4 and 5) on the CF56 engine; extracted from: (Lufthansa, 1999)
17
high. Additionally, this could lead to toxic fumes and a risk of coking accumulation inside the
rotor cavity. That is why, SAS also provides sealing between rotating and static parts.
Some air goes back to the main gas path. When used to purge turbine rim cavities, this
minimizes the drop on engine performance. Usually, the strategy adopted is to determine the
smallest purge flow that would allow meeting the system requirements (i.e. ingestion
concentration or components lives). They must keep in mind the possibility of flow disruption
when air goes back to the mainstream and attempt to limit unnecessary leakage.
SAS engineer’s role
SAS analyst’s expertise is broad and changes throughout the design process. Their main tool
is the SAS model and its solver. As inputs such as Performance data, boundary conditions and
modeling techniques vary, many analyses can be run with the same tool for the same engine.
To model the physical SAS, a 1D network is used. Opting for a one-dimensional network
allows for faster computation. It also reduces the amount of data required. This is a great
advantage in early development. The SAS network is composed of nodes that represent how
flows are divided or merged in the SAS. Between the different nodes are the bits; they represent
losses due to hardware. Both bits and nodes are defined by input and output pressures and
temperatures. Bits and nodes are linked to one another thanks to links. The links represent the
fluid flow. The boundaries of the networks are sources (where the air enters) and sinks (where
the air exits) the network.
Even though all possible analyses will not be listed here, it is important to review what the
SAS teams are responsible for the data produced for other departments as they determine what
data are generated.
SAS teams must provide:
- An efficient SAS configuration for a given engine.
18
- A high fidelity model, validated against engine test data
- Insurance that cooling air will arrive at the desired pressure and temperature at the
blade or vane inlet cooling passage.
- Insurance that all components of the SAS will fulfill the task they are designed for
in the desired operating envelop (rim sealing, bearing chambers, cavity
ventilation…).
- Bearing loads will meet the expected lifespan
SAS will provide to other teams:
- Expertise on component requirements to the mechanical design team.
- Bleed bids to the Performance team.
- Component temperature and pressure as well as air flow to lifing, aerothermal and
thermo-mechanical teams.
- Bearing loads to transmission specialists.
- Boundary conditions at engine interfaces to design auxiliary systems.
Critical SAS components
2.1.4.1 Sealing
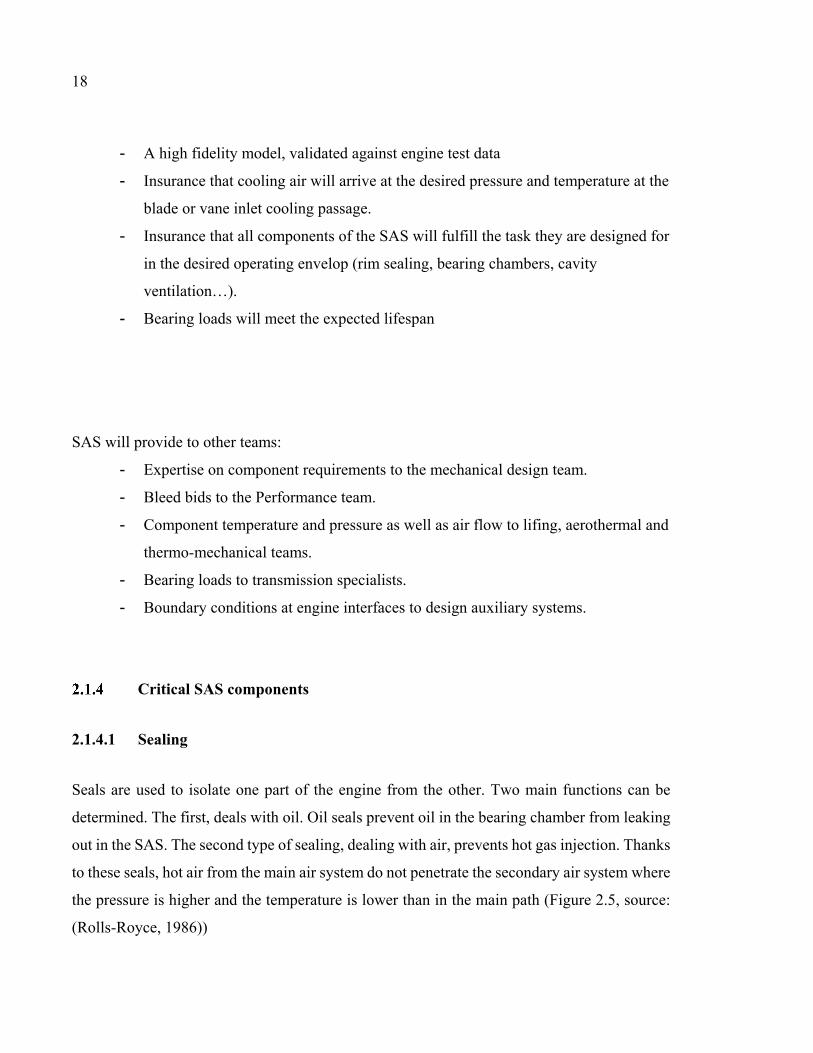
Seals are used to isolate one part of the engine from the other. Two main functions can be
determined. The first, deals with oil. Oil seals prevent oil in the bearing chamber from leaking
out in the SAS. The second type of sealing, dealing with air, prevents hot gas injection. Thanks
to these seals, hot air from the main air system do not penetrate the secondary air system where
the pressure is higher and the temperature is lower than in the main path (Figure 2.5, source:
(Rolls-Royce, 1986))
19
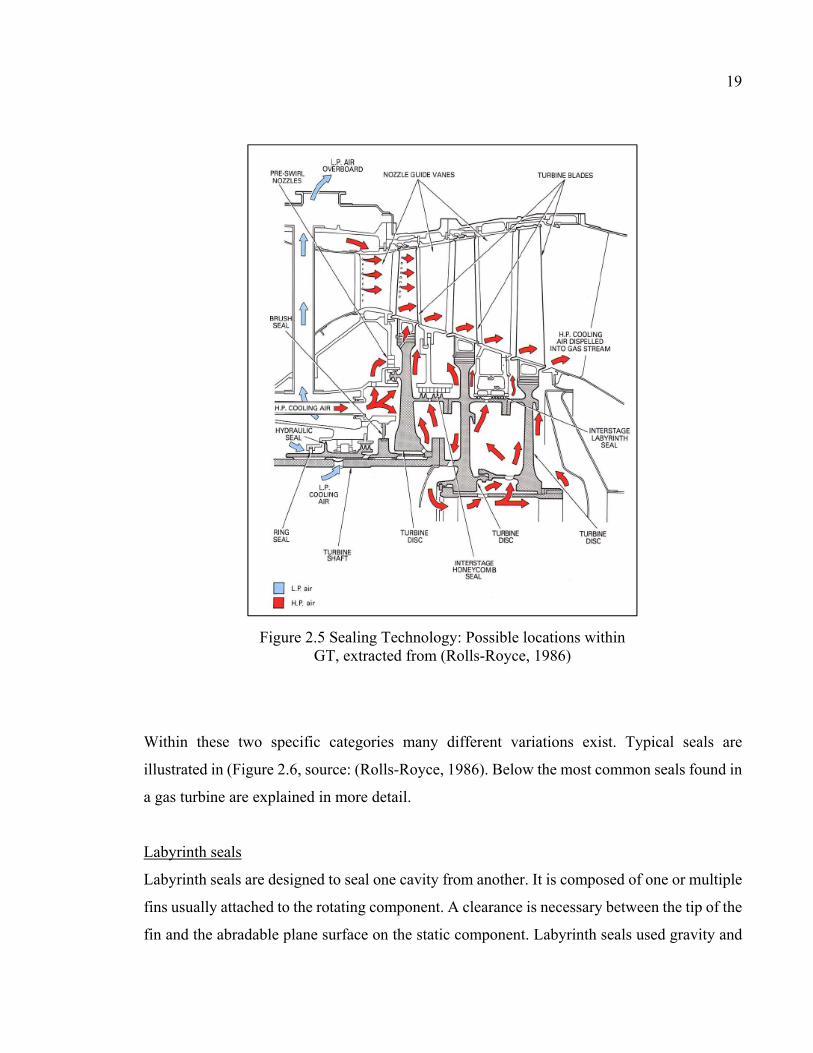
Within these two specific categories many different variations exist. Typical seals are
illustrated in (Figure 2.6, source: (Rolls-Royce, 1986). Below the most common seals found in
a gas turbine are explained in more detail.
Labyrinth seals
Labyrinth seals are designed to seal one cavity from another. It is composed of one or multiple
fins usually attached to the rotating component. A clearance is necessary between the tip of the
fin and the abradable plane surface on the static component. Labyrinth seals used gravity and
Figure 2.5 Sealing Technology: Possible locations within GT, extracted from (Rolls-Royce, 1986)

20
centrifugal forces to prevent fluid from leaking. The recirculation zone located between the
fins induce a loss resulting in the pressure drop, contributing to the sealing.
Ring seals
This seal is composed of ring and housing component. The housing is attached to the static
part. The inner diameter of the ring is in contact with the rotating part (shaft) while the outer
diameter is in contact with the housing. The ring is free to rotate. Therefore, its rotational speed
is somewhere between the shaft speed and the housing speed.
Hydraulic seals
Hydraulic seals are used in gas turbine to seal bearing chambers. Hydraulic seals have two
main characteristics. They are used when the two components are rotating. Indeed, bearing
chambers separate two shafts. Another particularity of these seals is that they do not allow air
leakage. Therefore, they cannot be used as flow regulation.
21
Figure 2.6 Illustration of sealings technologies, extracted from (Rolls-Royce, 1986)
22
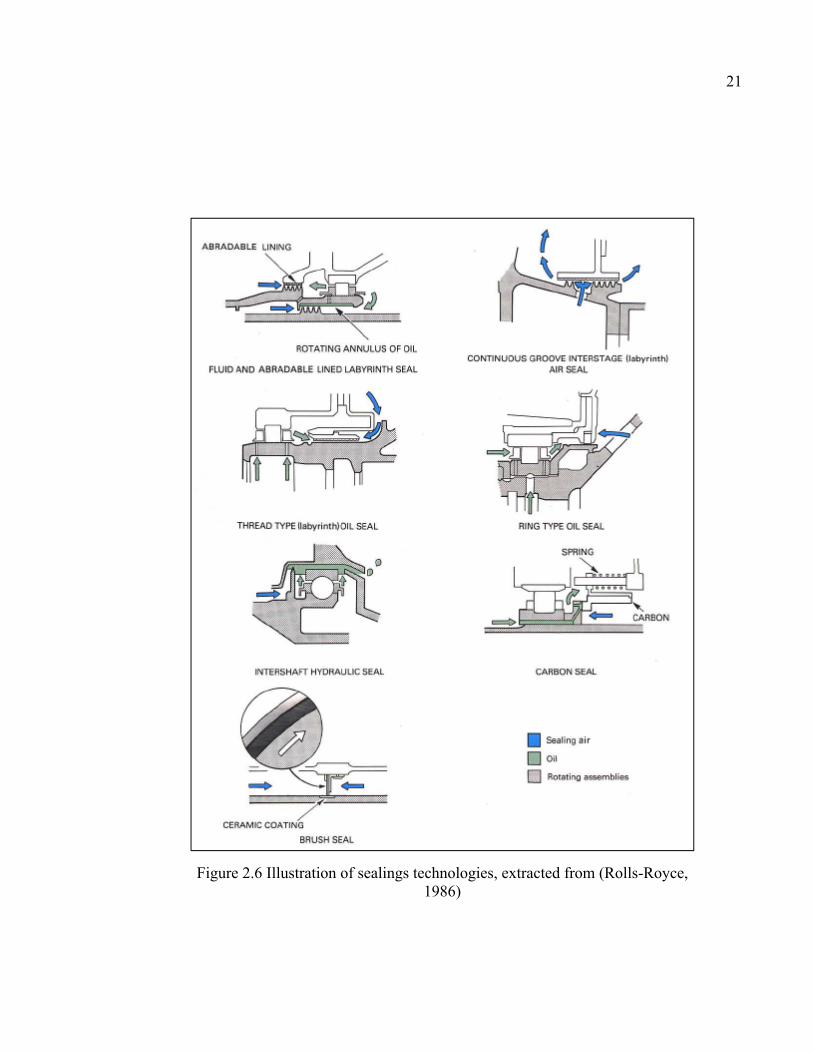
2.1.4.2 Bearings
Bearings are elements that constrain relative motion between moving parts to only the desired
motion; blocking 5 degrees of freedom except for the rotation desired. As any bearing, gas
turbine bearings are devices for minimizing the friction between two parts in rotation. The
bearing keeps the rotating component stationary to the static component or another rotating
component at different speed. 4 major components compose a bearing: 2 races (one for race
fixed to the rotating part and one to the static part), a set of bearing balls and a cage. The balls
make the connection between the two races that must not touch each other to avoid friction,
this achieved thanks to the cage. The contact zone is an ellipse (not a point, otherwise stress at
that point would be infinite). A representation of a typical bearing is shown in Figure 2.7.
Bearing are subject to two loads: radial loads and axial loads. The first are due to the weight
of the spool and other loads such as vibrations due to unbalance. Radial bearings, such as roller
BRGS bearings support these loads and only these loads.
Axial loads are due to the engine thrust. Each shaft experiences different gas loads. Indeed,
each of them link a compressor to a turbine section. In a 3-shaft AGT context, there is the LP
Bearing
Outer Race
Load Line
Inner Race
Race-Ball
contact zone
Load applied to the ball
Figure 2.7 Bearing architecture
23
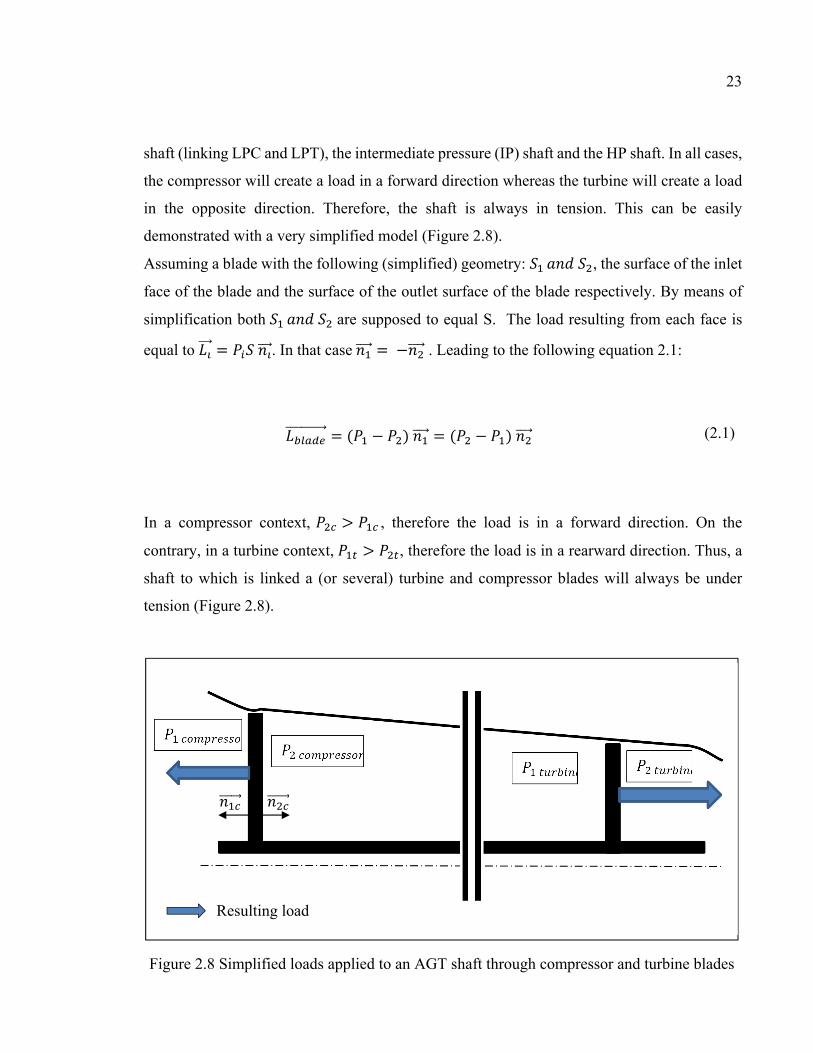
shaft (linking LPC and LPT), the intermediate pressure (IP) shaft and the HP shaft. In all cases,
the compressor will create a load in a forward direction whereas the turbine will create a load
in the opposite direction. Therefore, the shaft is always in tension. This can be easily
demonstrated with a very simplified model (Figure 2.8).
Assuming a blade with the following (simplified) geometry: 𝑆 𝑎𝑛𝑑 𝑆 , the surface of the inlet
face of the blade and the surface of the outlet surface of the blade respectively. By means of
simplification both 𝑆 𝑎𝑛𝑑 𝑆 are supposed to equal S. The load resulting from each face is
equal to 𝐿⃗ 𝑃 𝑆 𝑛⃗. In that case 𝑛⃗ 𝑛⃗ . Leading to the following equation 2.1:
𝐿 ⃗ 𝑃 𝑃 𝑛⃗ 𝑃 𝑃 𝑛⃗
(2.1)
In a compressor context, 𝑃 𝑃 , therefore the load is in a forward direction. On the
contrary, in a turbine context, 𝑃 𝑃 , therefore the load is in a rearward direction. Thus, a
shaft to which is linked a (or several) turbine and compressor blades will always be under
tension (Figure 2.8).
𝑃 𝑃 𝑃 𝑃
0
Resulting load
Figure 2.8 Simplified loads applied to an AGT shaft through compressor and turbine blades
𝑛 ⃗ 𝑛 ⃗

24
The resulting force is never null; as it would mean that the machine does not produce work.
For example, for the LP spool (LPC-LPT), the resulting force is directed rearward as the output
work is mostly applied to the LPT. On the contrary, the resulting force on the HP spool is
directed forward due to the large number of HPC stage and the large pressure in the
compressor.
This model is a very simplified model that does not take into account the effect of the SAS on
the loads applied to the bearing. SAS components such as seals or discs represent a non-
negligible area on which pressure is applied. As a consequence, the pressure is not equal on
both sides of the various SAS components, a resulting force appears and contributes to the
bearing load.
In some cases, the magnitude of the net load can exceed the bearing capability. This load can
be over the bearing design limit; this could damage the bearing. To provide a compensation
load a balance piston can be installed on the rotor. A counteracting force will result from the
pressure applied on the area of the balance piston and diminishes the resulting load on the
bearing.
That is why; bearings that will handle shaft axial loads are called thrust bearings. Thrust
bearing also support radial loads but they are the only ones to support axial loads. Each shaft
only has one thrust bearing. Indeed, as the engine runs, the shaft will undergo thermal growth.
Two or more thrust bearings would cause thermo-induced shaft axial tension.
SAS engineers must make sure that the resulting load applied on the bearings is never null.
Indeed, if the resulting load is null, the bearing might skid. In this scenario, the bearing ball,
because of centrifugal force, will lose contact with the inner race and start rotating at the outer
race speed. When finally, a load is applied, the balls abruptly contact the inner race of the
bearing resulting in a dent and rapid failure.

25
Load directions on bearings can be either forward or rearward, it differs based on the condition
at which the engine operates.
Bearing load calculations are necessary to prevent failures. However, it can be surprising that
these calculations are made within the SAS department. This is because it is a whole engine
calculation. It would be very inefficient to ask every department to provide bearing load for
the component they are responsible for and then regroup them. Such a procedure would be
source for error, calculations run at the wrong conditions, with different input data etc.
Moreover, most loads can only be calculated knowing SAS pressures. The SAS department is
therefore the first and only department in the workflow to assess bearing loads.
The main difference between an aircraft engine and its aero derivative form is that the AGT is
not meant to produce thrust. This is significantly different for bearing load management. AGT
do not have a fan at the intake. The fan provides most of the thrust and therefore creates greater
forward force component for aero engines that diminish the net load on the bearing. Because
AGTs are designed to create power, torque must be transferred to the shaft, this generates
heavier loads to handle for AGT bearings.
2.2 Challenges and need for automation
Challenges faced by engineers
The scope of this project is the integration of the SAS into a Gas Turbine Design & Analysis
Platform. As explained above, as a mean to address new challenges, MDO and therefore
workflow automation is becoming more and more important. Workflow automation cannot be
done without in-depth analysis of the workflows, the pain points of the engineers, or the
consequences of such an automation on user’s creativity. It is estimated that non-value-added
tasks can represent up to 70% of an engineer’s tasks (McManus, 2005). It can be argued that
engineering needs failures to succeed and therefore no conclusive tasks can represent value
added. However, 40% of the engineering time is considered to be pure waste, meaning that no
knowledge is extracted from it. Workflow automation intends to tackle this squandered time.
26
A survey to assess time loss in gas turbine engineering activities has been conducted within
Siemens. Results are in accordance with McManus‘s results (McManus, 2005). The analysis
of this survey provided a means to understand the struggles of SAS engineers. They can be
organized in two major categories: Input issues and traceability. The former, is a consequence
of format incompatibility, poor quality of the inputs, and an insufficient understanding of what
the inputs do and why they have been created. These issues make it challenging to run the
correct analysis initially. This naturally leads to the second item. Traceability of data is key in
engineering. It is necessary to manage all the data produced, and to maintain awareness of the
purpose of each dataset. Gathering such data greatly improves data management and can
prevent the tool from producing data that already exists.
The need for automation
The energy market is now regulated by emissions. As concerns about global warming have
increased over the last few decades, the main effort in GT development has been to reduce fuel
consumption and reduce NOx and CO emissions. These decisions are driven by economics but
also politics as emissions are more and more regulated (T.Bowman, 1992). Simultaneously,
the drive for greater efficiency and improvement of power capacity is demanded by the market.
One can therefore understand that the gas turbine industry is driven by advanced technology
and increment innovation (Proctor, 2018), thus no breakthrough technologies have been
introduced in recent years, and this is not expected to change in the foreseeable future. There
is the possibly for improvement with the emergence of combined-cycle technology (Deloitte,
2015) and also the use of hydrogen, bio-fuels and synthetic fuels. With the growing
development of renewable energy sources, the energy grid will require additional energy
sources to compensate down periods for renewables. Solar and wind energy for instance, are
not available all the time. Developing combined-cycles, with fast start-up AGTs, could be a
solution to compensate for renewable energy systems when they cannot produce sufficient
energy.
27
In order to keep up with the market, gas turbines manufacturers invest a lot in optimization
tools. For a long period of time, gas development was divided in sub-disciplines where
optimization was run independently resulting in a system that gathered optimized modules.
MDO aims to find a global optimum, resulting in the simultaneous manipulation of various
parameters from different disciplines (Sobieszczanski-Sobieski & Haftka). The holistic
approach of MDO, often requires multiple iterations to converge.
The gas turbine market, like other markets, is being overwhelmed by short development times,
and thus cannot afford to run long and complex iterative processes. Whereas historical best
practices struggle to fulfill new market requirements, MDO is being widely developed to effect
change. In order to face the duration issue, workflow automation seems to be mandatory.
Automation should therefore be integrated wisely in order not to limit engineering creativity
(Tarkian, 2012).
2.3 Automating an engineering workflow
Workflow definition
The Collins Dictionary’s definition for Workflow is “a sequence of operations in a workplace”.
Originally the term workflow was developed in a manufacturing context; as time passed it
evolved to define a sequence of steps adding value to a process. The different steps can be of
various natures, for instance, tasks, events, decisions, or communication. A workflow
organizes these steps into one process. Most of the time a workflow can be represented with a
graph, linking steps with arrows, indicating a dependency on the previous step(s). When
organized together the steps form a chain achieving a business process (Georgakopoulos,
Hornick, & Sheth, 1995). A workflow combines human tasks as well as software tasks and it
can be read at different levels of an organization.
28
Identify good automation candidates
Workflow automation does not intend to replace the human engineer. Through automation the
goal is to reduce unnecessary tasks to allow engineers to spend more time analyzing and
making correct actions concerning the produced data. Moreover, reducing the general
workflow timescale enables one to perform more iterations and consequently improve the
quality of their results.
Therefore, time consuming and non-creative tasks such as importing inputs and boundary
conditions applications are good candidates for automation (Tarkian, 2012). These tasks must
be simple and documented to minimize exceptions in the code (i.e. bugs) because sometimes
these exceptions are too difficult to handle without human input (Smith, 2005). An analogy
between manufacturing and engineering can be drawn. In 2018, the automotive manufacturer
Tesla, recognized that human beings were more effective at handling some “exceptions” in the
manufacturing process. For instance, robots could handle repetitive actions, but if a slightest
change were to occur in the supply-chain it would take robots a significantly larger amount of
time to adapt. Therefore, Tesla reduced automation of the supply chain and added more human
beings (Braga, 2018). As in manufacturing, automation in engineering is key; however, one
must acknowledge its limitations. Although, the ideal scenario would involve no exceptions,
these exceptions are inevitably more likely to occur as automation increases. Thus, a balance
must be found between human input and automatic processes.
Automation strategy
The workflow automation must follow some workflow management principles. The process is
analyzed, methodically decomposed, and modeled as a specification. The process should then
undergo a careful reengineering to seek optimization. It is only then that automation can be
implemented (Georgakopoulos et al., 1995). This automation will make sure that the process
is correctly scheduled, executed and controlled so that the specifications previously determined
are fully respected.
29
Once the tasks subject to automation are defined, an automation strategy must be established.
Tarkian (Tarkian, 2012) recommends decomposing the processes in order to make the
automation more simple. This will also enhance MDO integration afterwards. The
decomposition into elementary tasks will enhance the object-oriented programming (OOP) as
code-reusability would prevail.
Every module should be composed of repetitious tasks or tasks with a high degree of similarity.
Each module should be documented (inputs and outputs clearly defined) to be used as black
boxes (Smith, 2005). Decomposition should enable further automation development. Large
pieces of code should be avoided as they are not reusable and likely have to follow a specific
workflow designed for a specific activity.
Automation development
2.3.4.1 The agile philosophy
The workflow automation requires software development. To provide the best tool possible
the development team must adopt a working philosophy. One school of thought concerning
this is Agile Development. This is a widely accepted concept that continues to grow in
numbers.
Agile is a philosophy of work (i.e. not a method) the pillars of which have been formulated in
2001. An Agile team centers its way of working on 12 principles described in the Agile
Manifesto (Beck et al., 2001) that are presented below.
1. Our highest priority is to satisfy the customer through early and continuous delivery
of valuable software.
2. Welcome changing requirements, even late in development. Agile processes harness
change for the customer's competitive advantage.
3. Deliver working software frequently, from a couple of weeks to a couple of months,
with a preference to the shorter timescale.

30
4. Business people and developers must work together daily throughout the project.
5. Build projects around motivated individuals. Give them the environment and support
they need, and trust them to get the job done.
6. The most efficient and effective method of conveying information to and within a
development team is face-to-face conversation.
7. Working software is the primary measure of progress.
8. Agile processes promote sustainable development. The sponsors, developers, and
users should be able to maintain a constant pace indefinitely.
9. Continuous attention to technical excellence and good design enhances agility.
10. Simplicity--the art of maximizing the amount of work not done--is essential.
11. The best architectures, requirements, and designs emerge from self-organizing teams.
12. At regular intervals, the team reflects on how to become more effective, then tunes
and adjusts its behavior accordingly.
The manifesto praises enhanced communications between the developers but also with
customers as the project progresses. A constant work and deliverable release rate are
emphasized which helps the agile team to provide the best software to their customers.
Flexibility is a key word for an agile team as interactions, discussions, and feedback from beta
versions are at the core of the philosophy.
The agile process is supported by agile methods that provide practical guidance in achieving
agility. Even though the agile philosophy praises flexibility and openness, Agile experts do not
recommend developing a personal agile method as existing ones are deeply grounded in the
twelve agile principles. An absolute understanding of these principles is required to develop
any new method (Shore, 2007).
The agile method fits software developments for companies willing to operate the change
towards Industry 4.0 as they both praise interconnection and a customer-based service.
However, providing the user with a brand new and powerful tool does not imply that this tool
will be used. This is why change management philosophy and methods must be implemented.
31
2.3.4.2 Change management
Modifying someone else’s working habits can be very disturbing and can lead to resistance. It
is necessary to understand this resistance in order to erase or control it. A scale was developed
to predict why some people are resistant to change (Oreg, 2003). Four types of resistance are
identified: “(a) routine seeking, (b) emotional reaction to imposed change, (c) short-term
focus, and (d) cognitive rigidity”. These behaviors can have large consequences to the success
of the project, as early defiance can lead to a total rejection and possibly threaten the long term
implementation of the software (Boehm & Turner, 2005). Therefore, it is important to
implement a change management strategy as early as possible so that such a situation will not
occur.
The key factors that influence the success of a software change are defined with the DICE
factors (Sirkin, Keenan, & Jackson, 2005). DICE stands for Duration, Integrity Commitment
and Effort. Duration must be taken seriously as long projects might diminish a customer/user’s
enthusiasm and reduce acceptance. In this situation, it is necessary to implement reviewing
sessions with stakeholders to help keep the project going and maintain eagerness towards the
project. Monitoring the Integrity of the project is a management task. A team member must be
accountable for the quality of the product and ensure that the time frame is respected. This is
mainly executed by involving all team members, identifying the right skills and knowledge
and synergizing them to profit the project, the team, and the individuals. In order for a project
to succeed it must be backed up by the top-level management. When stakeholders constantly
and enthusiastically show an intense interest and commitment to the project, adopters are more
likely to follow along (Sirkin et al., 2005). Finally, for any process, software, or workflow,
change should be done with the consciousness that the adaptation phase can add to an already
busy schedule, thus the project managers should understand the situation in which the change
is being implemented.
2.4 Conclusion
The research described in this document will aim to design and provide a tool for SAS
engineers that respects their expectations and the standards of the discipline. A totally new

32
environment will have to be created. The tool will aim at automating the use of the SAS 1D
solver software. The method used for the tool development was in accordance the agile
philosophy. As the new tool was implemented progressively in the engineers’ tool kit; a regular
and careful review was adopted with the stakeholder. A total transparency policy was adopted
to make sure that both the researcher/developers and the end-users work in synergy to create
the best tool possible and enhance the working environment as well as the quality of the results.
CHAPTER 3
AUTOMATION METHODOLOGY
3.1 Introduction
Automating a workflow is not as trivial as it might seem. A fully automated workflow is
impossible. Many parameters are highly sensitive, and a slight difference can induce a large
consequence. The user must be able to have access to these parameters in order to work
efficiently. Unfortunately, allowing user setups reduces the automation efficiency, and when
user inputs are required the process becomes longer. To address this problem, we conducted a
careful analysis of the process in order to determine which tasks can be skipped, modified, or
automated, and which will inevitably require user inputs. This precise analysis of the process
is crucial for developing a properly automated workflow.
3.2 Workflow Analysis
Mapping the workflow was the first step toward improving the overall workflow. This has
been done with an open-source software: Cambridge Advanced Modeller (CAM). The CAM
has the advantage of allowing multi-level modelling. AGT workflows are complex and require
many tasks to be completed. The CAM was useful for clustering tasks into subcategories and
navigating through the different layers of detail easily. Whereas the whole gas turbine design
workflow has been mapped, the discipline of interest for this project is the SAS. Therefore,
only results regarding this discipline will be explained. However, the reader should note that
the methodology is the same for all disciplines.
Methodology
The purpose of this analysis is to determine tasks to be automated and a strategy to limit user
inputs. To do so, two workflow analysis phases were required.
34
3.2.1.1 Theoretical Analysis
The first was a theoretical analysis that focuses on software user guides, the company’s best
practices, tutorials, and defining a first draft of the workflow. The decision to begin with a
theoretical analysis was made to ensure that background knowledge on the workflow that was
going to be modeled was developed. Without this background knowledge, information
gathered in the second phase, with the engineers, could be lost or its importance might not be
as appreciated as need be. Having a first draft of the mapped workflow, when starting the
practical interactions with the engineers, allowed for deeper conversation and engagement
between the researchers and subjects as opposed to not having a fundamental understanding of
the subject’s work. Moreover, this step has the advantage of rediscovering functionalities that
the user might not be aware of and integrating them into future developments. Even though the
original best practices are never fully applied in today’s practice they are useful as they have
been thoroughly documented and rationalized. Since the initial authors defended and properly
justified all of their decisions; these documents help with the understanding as to why such
processes were initially adopted. In order to be as exhaustive as possible, the following
roadmap for the analysis process was established. This first step helped define a first scope of
the analysis and was inspired by the IDEF0 method (IDEF, 1993) :
1. List all tasks in the procedure: The objective was to list all actions that must be
executed to achieve the process. The task can be human for instance, selecting a
model, plotting a graph, or analyzing anomalies. Alternatively, the task can be
computerized for instance, creating a mesh, calculating boundary conditions or
executing solver calculations.
2. List all software used: The objective was to a) List all modules within the software
b) List the inputs required (with file type) c) List the outputs created (with file type).
3. Determine the interactions with other disciplines: The objective was to fully
comprehend all the data to ensure a successful process. The disciplines assessed were
a) Inputs from other disciplines b) outputs to other Disciplines c) Inputs from
‘downstream’ disciplines (Feedback) d) Outputs to ‘upstream’ disciplines (Feedback).
35
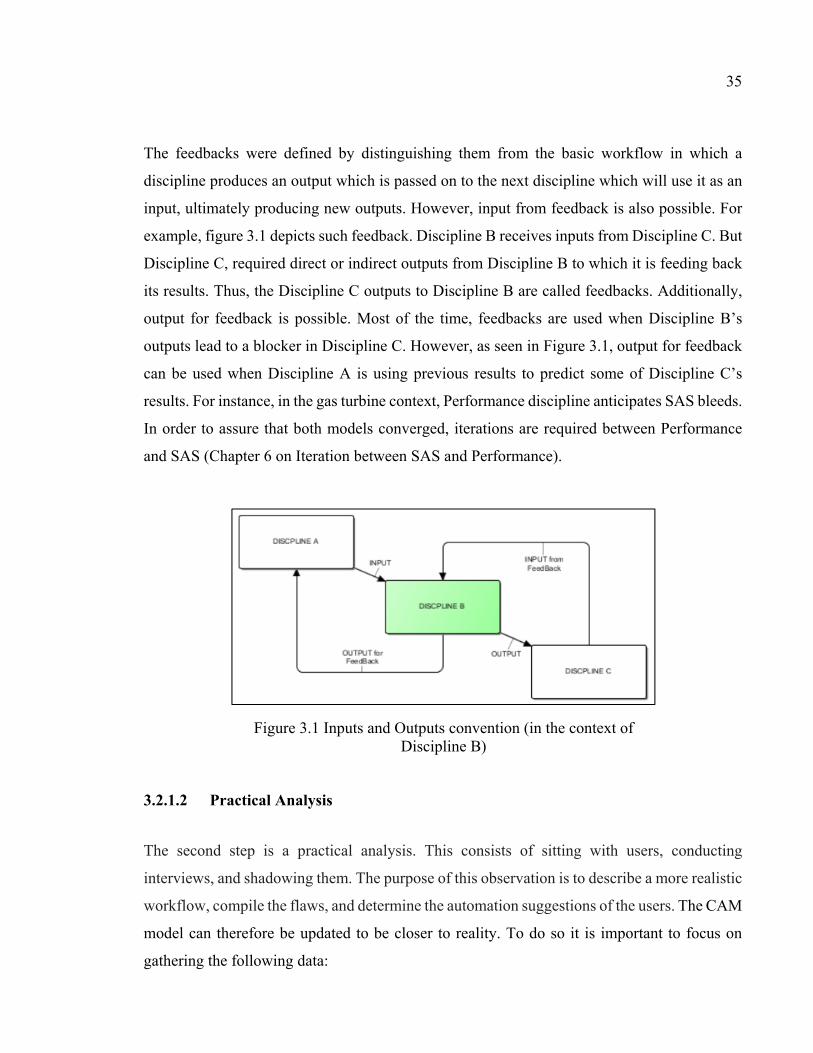
The feedbacks were defined by distinguishing them from the basic workflow in which a
discipline produces an output which is passed on to the next discipline which will use it as an
input, ultimately producing new outputs. However, input from feedback is also possible. For
example, figure 3.1 depicts such feedback. Discipline B receives inputs from Discipline C. But
Discipline C, required direct or indirect outputs from Discipline B to which it is feeding back
its results. Thus, the Discipline C outputs to Discipline B are called feedbacks. Additionally,
output for feedback is possible. Most of the time, feedbacks are used when Discipline B’s
outputs lead to a blocker in Discipline C. However, as seen in Figure 3.1, output for feedback
can be used when Discipline A is using previous results to predict some of Discipline C’s
results. For instance, in the gas turbine context, Performance discipline anticipates SAS bleeds.
In order to assure that both models converged, iterations are required between Performance
and SAS (Chapter 6 on Iteration between SAS and Performance).
3.2.1.2 Practical Analysis
The second step is a practical analysis. This consists of sitting with users, conducting
interviews, and shadowing them. The purpose of this observation is to describe a more realistic
workflow, compile the flaws, and determine the automation suggestions of the users. The CAM
model can therefore be updated to be closer to reality. To do so it is important to focus on
gathering the following data:
Figure 3.1 Inputs and Outputs convention (in the context of Discipline B)
36
1. Which tasks are operated by a human and which are computer-based tasks.
2. Determine the duration of both the “human” and “computer” tasks.
3. Define differences with the theoretical procedure.
CAM- Modeling the Workflow
3.2.2.1 Conventions
The model must be as clear as possible so that its interpretation is smoother. A writing
convention has been established so that every contributor models the process in the same way.
This convention involves the four following rules: 1) Decompose process steps into blocks, 2) Refer to data storage with Data Blocks, 3) Maintain a hierarchy among blocks and 4) The
spreadsheet must be organized
- Decompose process steps into blocks:
To map the gas turbine process, 6 different blocks have been defined. Each block type
represents a different feature in the workflow.
o Discipline
Refer to an engineering department e.g. Design, Performance, Stress or Secondary Air System.
o Software
This block represents specific software. It is a high-level block representing the whole package
of tools and actions that software can provide. These are vast and often need to be subdivided
into tools or plugins.
37
o Tool
A tool is an intermediate level block. It represents a script or a software function that can be
executed independently.
o Plugin
This is a piece of code not native to the software but can be executed from this software.
o Task
A task is an action in the process that needs to be done. It has inputs and outputs.
o Condition
Conditions imply that data are analyzed. A decision must be taken regarding the results.
Conditions are utilized when multiple options are offered at this step of the process. It serves
a logical gating purpose. The next step of the process depends on the output of this condition.
- Refer to data storage with Data Blocks
As data management is an important part of the platform, it is important to analyse what data
are stored during each process but also where and under which form. Two data blocks have
been determined. The database block represents data that is stored externally and therefore
accessible to all. On the contrary, the temporary database represents data that is stored locally
and is only accessible to the one user who produced the piece of data.
- Maintain a hierarchy among blocks
Disciplines are the higher blocks. A simplified workflow should be explained in terms of a
succession of disciplines.
A discipline is often centered around a limited amount of software. For instance, Mechanical
Designers activities will mostly be center on the CAD software. As the software block is high
level, it often can be subdivided into modules. Those modules can either be tools or plugins.
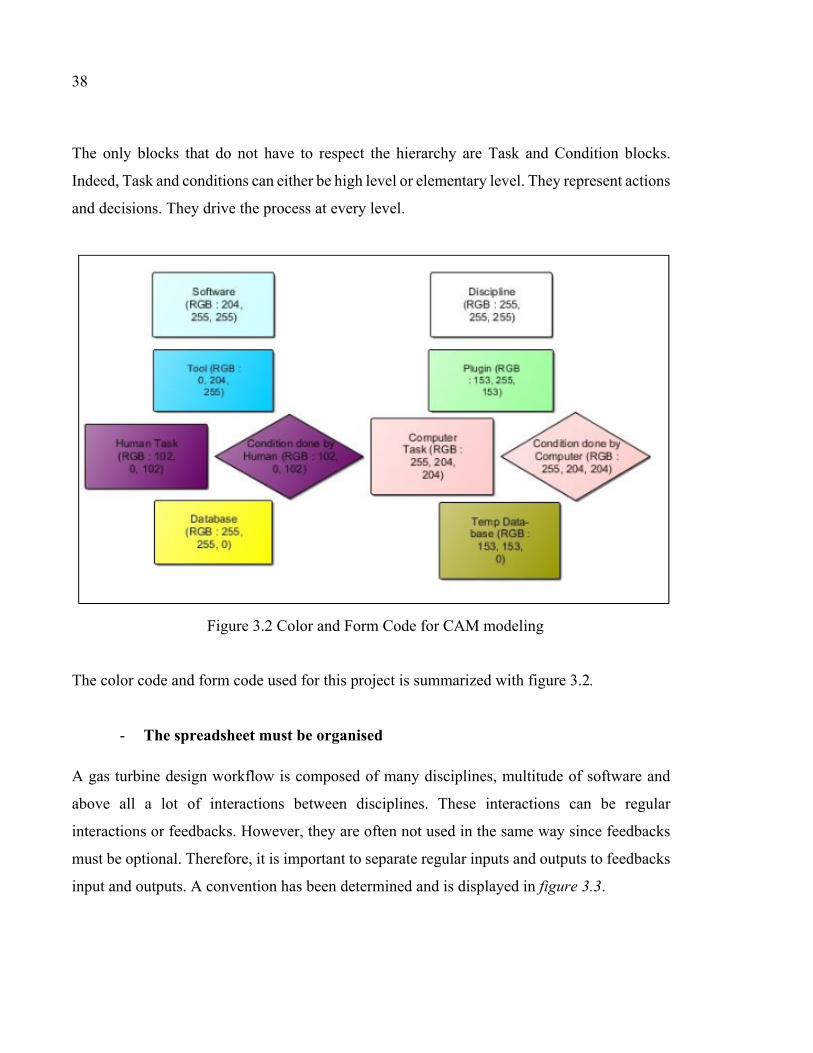
38
The only blocks that do not have to respect the hierarchy are Task and Condition blocks.
Indeed, Task and conditions can either be high level or elementary level. They represent actions
and decisions. They drive the process at every level.
The color code and form code used for this project is summarized with figure 3.2.
- The spreadsheet must be organised
A gas turbine design workflow is composed of many disciplines, multitude of software and
above all a lot of interactions between disciplines. These interactions can be regular
interactions or feedbacks. However, they are often not used in the same way since feedbacks
must be optional. Therefore, it is important to separate regular inputs and outputs to feedbacks
input and outputs. A convention has been determined and is displayed in figure 3.3.
Figure 3.2 Color and Form Code for CAM modeling
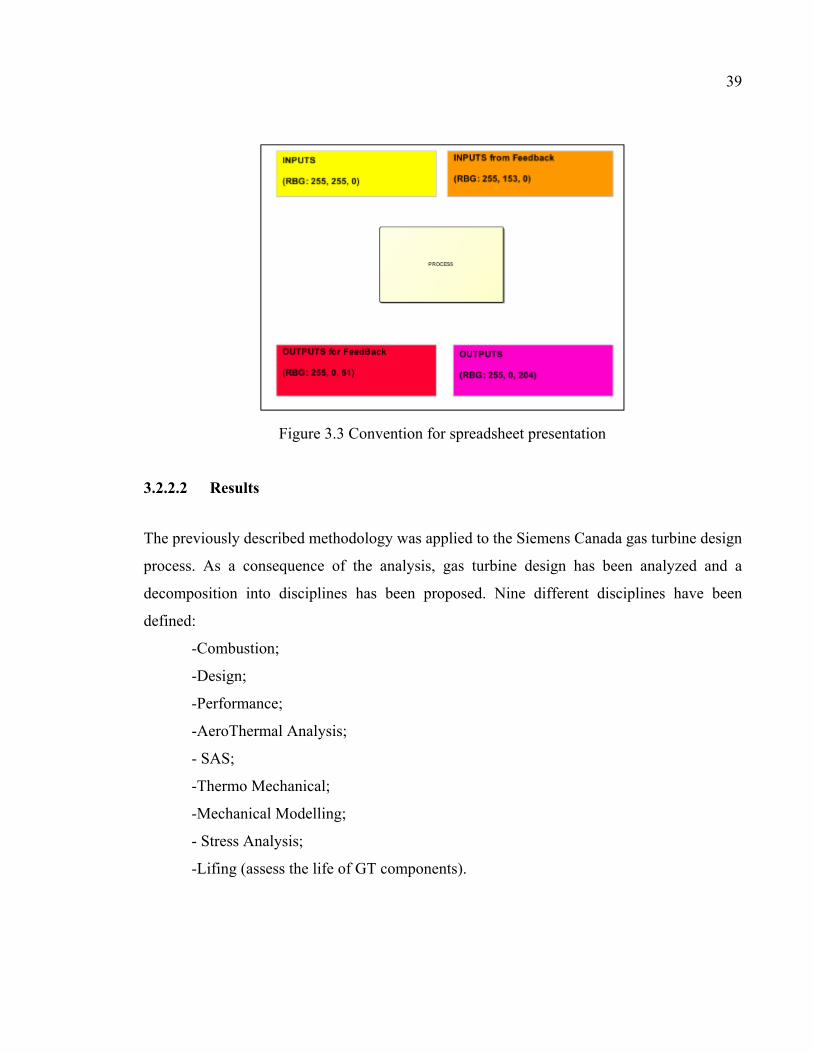
39
3.2.2.2 Results
The previously described methodology was applied to the Siemens Canada gas turbine design
process. As a consequence of the analysis, gas turbine design has been analyzed and a
decomposition into disciplines has been proposed. Nine different disciplines have been
defined:
-Combustion;
-Design;
-Performance;
-AeroThermal Analysis;
- SAS;
-Thermo Mechanical;
-Mechanical Modelling;
- Stress Analysis;
-Lifing (assess the life of GT components).
Figure 3.3 Convention for spreadsheet presentation
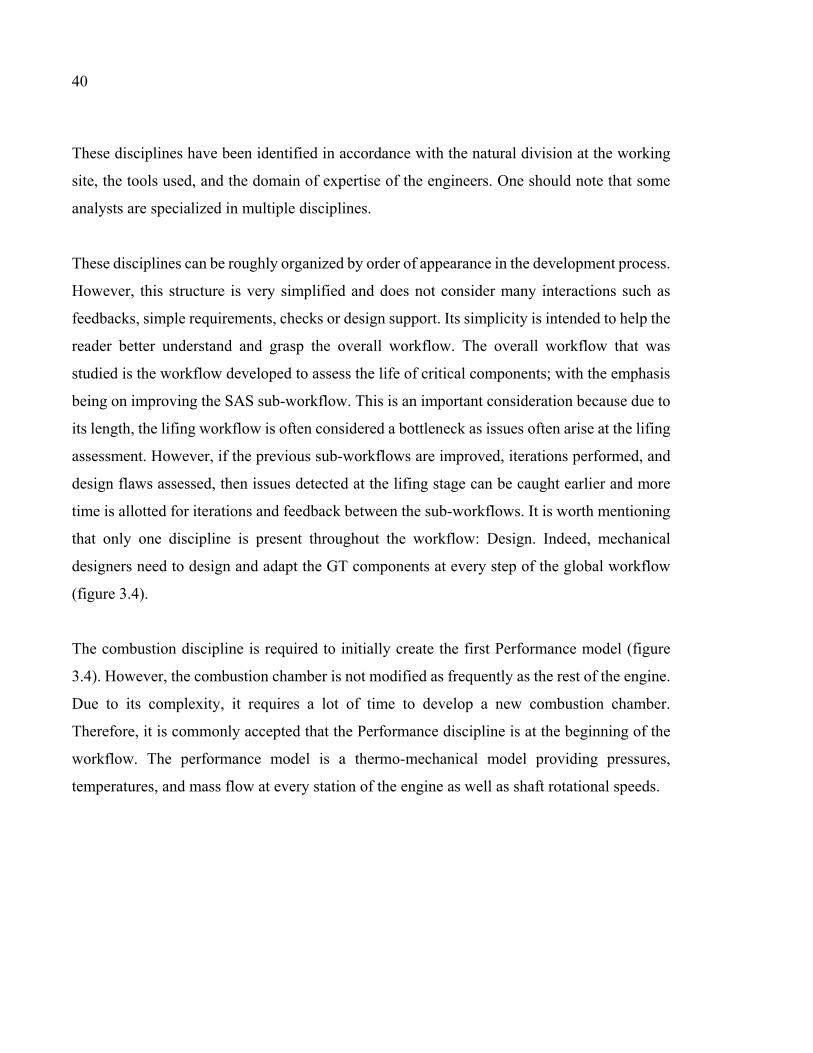
40
These disciplines have been identified in accordance with the natural division at the working
site, the tools used, and the domain of expertise of the engineers. One should note that some
analysts are specialized in multiple disciplines.
These disciplines can be roughly organized by order of appearance in the development process.
However, this structure is very simplified and does not consider many interactions such as
feedbacks, simple requirements, checks or design support. Its simplicity is intended to help the
reader better understand and grasp the overall workflow. The overall workflow that was
studied is the workflow developed to assess the life of critical components; with the emphasis
being on improving the SAS sub-workflow. This is an important consideration because due to
its length, the lifing workflow is often considered a bottleneck as issues often arise at the lifing
assessment. However, if the previous sub-workflows are improved, iterations performed, and
design flaws assessed, then issues detected at the lifing stage can be caught earlier and more
time is allotted for iterations and feedback between the sub-workflows. It is worth mentioning
that only one discipline is present throughout the workflow: Design. Indeed, mechanical
designers need to design and adapt the GT components at every step of the global workflow
(figure 3.4).
The combustion discipline is required to initially create the first Performance model (figure
3.4). However, the combustion chamber is not modified as frequently as the rest of the engine.
Due to its complexity, it requires a lot of time to develop a new combustion chamber.
Therefore, it is commonly accepted that the Performance discipline is at the beginning of the
workflow. The performance model is a thermo-mechanical model providing pressures,
temperatures, and mass flow at every station of the engine as well as shaft rotational speeds.
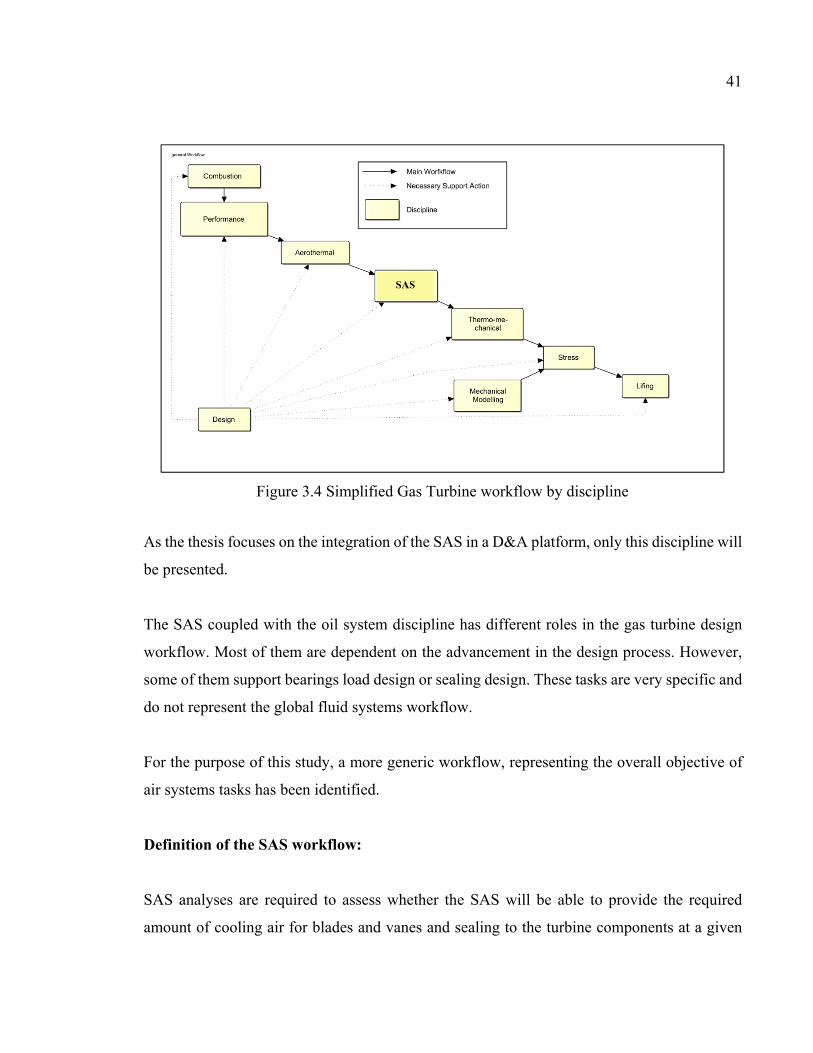
41
As the thesis focuses on the integration of the SAS in a D&A platform, only this discipline will
be presented.
The SAS coupled with the oil system discipline has different roles in the gas turbine design
workflow. Most of them are dependent on the advancement in the design process. However,
some of them support bearings load design or sealing design. These tasks are very specific and
do not represent the global fluid systems workflow.
For the purpose of this study, a more generic workflow, representing the overall objective of
air systems tasks has been identified.
Definition of the SAS workflow: SAS analyses are required to assess whether the SAS will be able to provide the required
amount of cooling air for blades and vanes and sealing to the turbine components at a given
Figure 3.4 Simplified Gas Turbine workflow by discipline
SAS
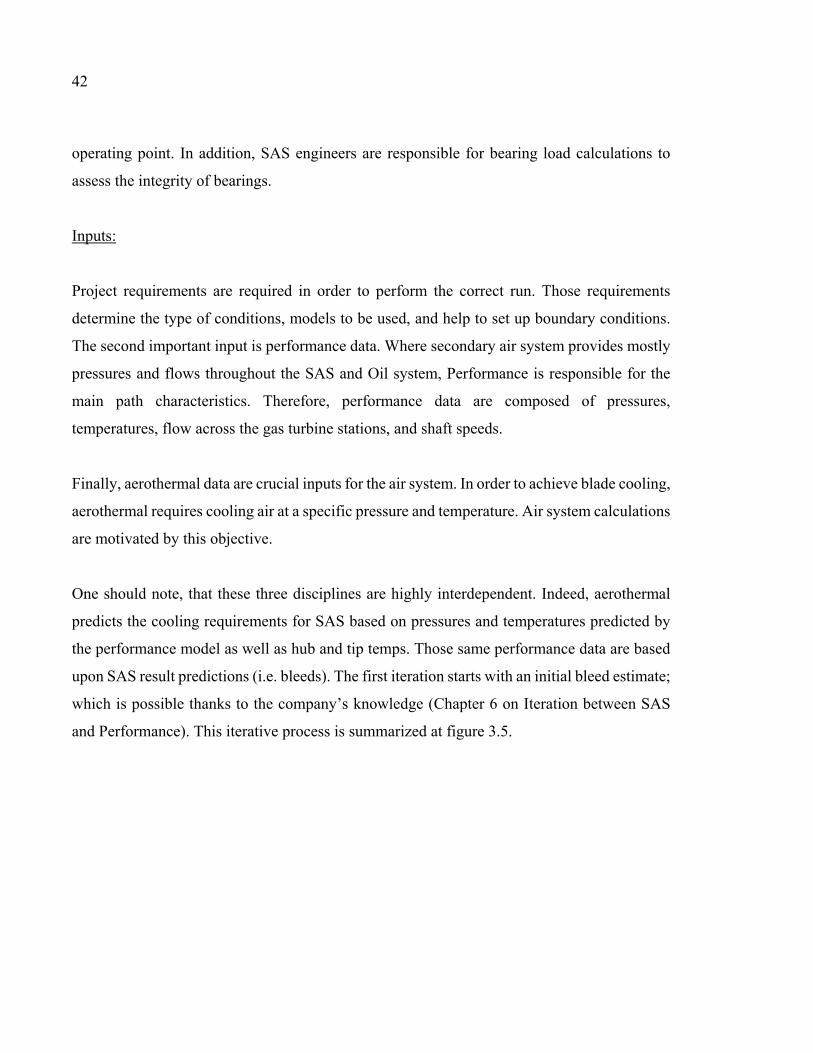
42
operating point. In addition, SAS engineers are responsible for bearing load calculations to
assess the integrity of bearings.
Inputs:
Project requirements are required in order to perform the correct run. Those requirements
determine the type of conditions, models to be used, and help to set up boundary conditions.
The second important input is performance data. Where secondary air system provides mostly
pressures and flows throughout the SAS and Oil system, Performance is responsible for the
main path characteristics. Therefore, performance data are composed of pressures,
temperatures, flow across the gas turbine stations, and shaft speeds.
Finally, aerothermal data are crucial inputs for the air system. In order to achieve blade cooling,
aerothermal requires cooling air at a specific pressure and temperature. Air system calculations
are motivated by this objective.
One should note, that these three disciplines are highly interdependent. Indeed, aerothermal
predicts the cooling requirements for SAS based on pressures and temperatures predicted by
the performance model as well as hub and tip temps. Those same performance data are based
upon SAS result predictions (i.e. bleeds). The first iteration starts with an initial bleed estimate;
which is possible thanks to the company’s knowledge (Chapter 6 on Iteration between SAS
and Performance). This iterative process is summarized at figure 3.5.
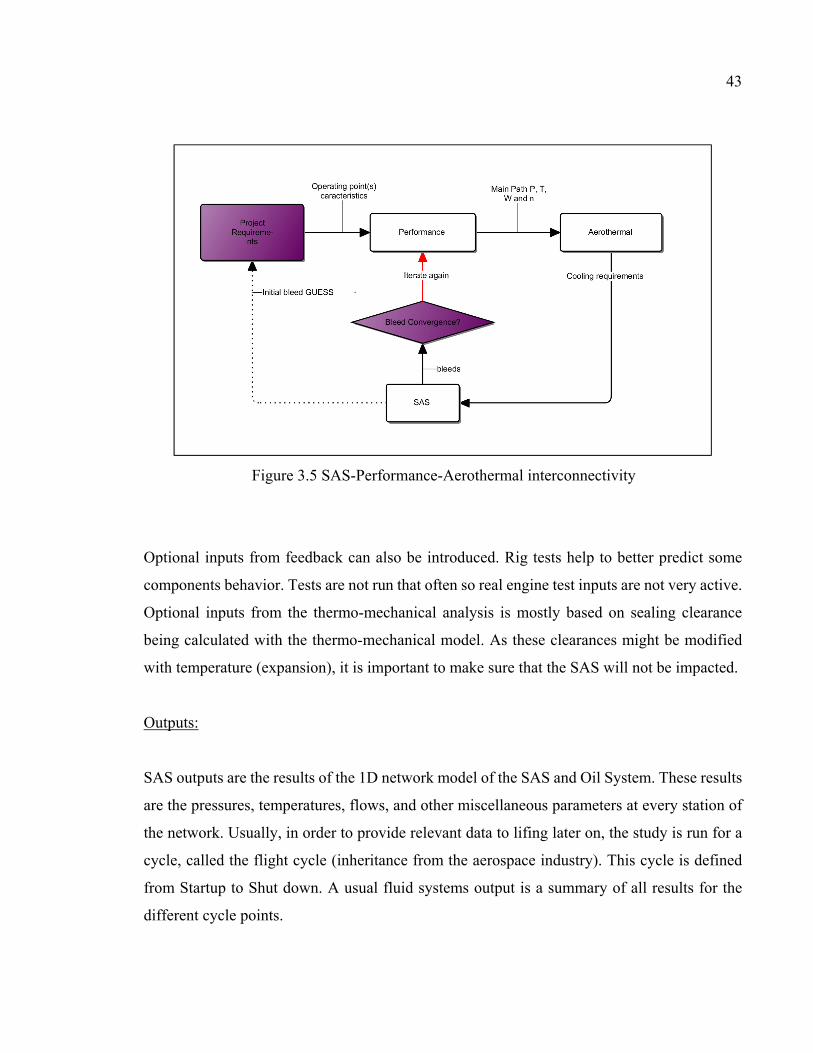
43
Optional inputs from feedback can also be introduced. Rig tests help to better predict some
components behavior. Tests are not run that often so real engine test inputs are not very active.
Optional inputs from the thermo-mechanical analysis is mostly based on sealing clearance
being calculated with the thermo-mechanical model. As these clearances might be modified
with temperature (expansion), it is important to make sure that the SAS will not be impacted.
Outputs:
SAS outputs are the results of the 1D network model of the SAS and Oil System. These results
are the pressures, temperatures, flows, and other miscellaneous parameters at every station of
the network. Usually, in order to provide relevant data to lifing later on, the study is run for a
cycle, called the flight cycle (inheritance from the aerospace industry). This cycle is defined
from Startup to Shut down. A usual fluid systems output is a summary of all results for the
different cycle points.
Figure 3.5 SAS-Performance-Aerothermal interconnectivity
44
As explained above, performance, SAS and aerothermal are very dependent on each other.
SAS outputs are fed back to performance (bleeds) and aerothermal (fulfilment of the
requirements)
Tasks:
Once the inputs and outputs are defined, the process to link them to one another must be
studied. These processes are referred to as tasks, and are explained above. Different layers of
tasks can be detailed. Due to the non-disclosure agreement regarding this project, only the
higher levels will be displayed and explained in the current document.
Pre-processing
This step is the most important step for the SAS calculation process. It must be done carefully
in order to obtain the desired results in the end. This is where the success or failure of a run is
determined. The engineer analyses the requirements: they are either pushed by performance
engineers who are mandated to try a new engine configuration, or they are pulled by other
disciplines that require results for a project. This analysis will end up with the selection of the
right performance point(s) required to do the calculations as well as the matching aerothermal
data files. The flight cycle is now defined. Because the SAS is run in steady-state, multiple
operating points are required. The analysts will identify those required points and will
configure the tool accordingly.
Although this is not systematic, some adjustments in the secondary air or oil systems must also
be required because of design modifications. New hardware in the design will need a new
model equivalent. The models will be updated respecting modelling best practices. Another
optional input are real engine tests. A significant amount of data is gathered on test beds. This
data can be relevant to the SAS and Oil system. They might highlight differences between the
model and the real engine. Often, component behaviors are gathered in graphs. Test data help
updating and calibrate the model in order to enhance quality of simulation data.
45
A last step is required before launching any calculation: configuration. Once the conceptual
configuration is done (performance data, aerothermal data, cycle definition and miscellaneous
data), all those must be formatted properly so that the tools understand what to do. This is done
through a couple of files, setting up the boundary conditions calculator, and the solver.
Processing
The process is mostly computerized since a tool is running the network and is in charge of
solving the problem. The tool is a solver; it utilizes boundary conditions to iteratively
determined pressures and temperatures at every node and bit of the 1D network and the flows
in the links between the nodes and bits. The first step is to run the air system. This is done
using the configuration established in the pre-processing step. The oil model is then run.
The air system calculation starts with boundary conditions calculations. This is a necessary
step since input data (performance and aerothermal) from the main gas path do not necessarily
represent air systems entry points. Equations and scaling graphs will translate raw input data
into relevant data to the air system. The newly calculated parameters form the boundary
conditions. The second step is to solve the network. Input for the solver are all the boundary
conditions and components’ behavior graphs. The 1D network is then run iteratively in order
to converge source conditions (where the air or oil is coming from) with sink conditions (where
the air is going to).
Once the air system data is produced, the oil model can be run. Air and oil systems are closely
related. Indeed, most oil system sealings are dependent on pressures, flows, and temperatures
of the air system. In order to reduce computational costs and time it is relevant to keep those
two models (oil and air) as independent as possible. Correlations have been established to
calculate the oil system boundary conditions based on performance data and not from the air
system results. This decision is also driven by the complexity of using two different fluids in
the same model. This decorrelation is accomplished using physics and graphical analysis.
46
Post-Processing
This phase is when the results are analyzed, and conclusions can be drawn. Interpreting data is
key in any engineering workflow. Making the critical decision whether the results are in
accordance with those expected is an important responsibility. Being too conservative or too
permissive might cause delays in the design process. Drawing the correct conclusion is not a
simple task, thus careful analysis and expertise is required.
Once all the produced files are gathered this analysis can begin. The first step is to define which
parameters are going to be key in the decision process. Since thousands of parameters can be
analyzed it would not be feasible to assess each of them; therefore, a decision process
determines which parameters will be selected for analysis. This choice depends on several
variables:
The requirements (why was the analysis performed).
The assumptions (how was the analysis performed).
The user’s intangible knowledge and experience (a logical prediction).
With an array of selected parameters, plotting them is the best way to visualize the parameter’s
results. This allow one to see possible inconsistencies between two runs. Moreover, comparing
parameters with previously known accurate results can assist with the decision-making
process.
In the eventuality of an error, the next step is to target that error and determine the root cause.
Troubleshooting an error can have two main outcomes. The first, the easiest, is a configuration
error. The run has not been arranged properly. Input data was not chosen in accordance to the
requirements and solver options were not selected correctly. The analysts must therefore
reconfigure the model and re-run the tool.
The second error option is an engineering issue. In this case the run is done properly but the
results are not conclusive. A highly probable cause would be that the design point chosen by
47
performance and aerothermal engineers do not allow the secondary air and oil system to
converge. In other words, the requirements are not met. In this scenario, the information must
be sent back to performance and aerothermal team. An engineering review would be held, and
a joint decision will be made. This decision might involve a design modification as a
workaround.
If no error is detected, the decision to proceed to thermo-mechanical teams for further
development is possible. In this case all result files are merged into one and transmitted to the
thermo-mechanical team. Sometimes, because aerothermal, performance, and SAS are
interdependent, feedback loops are necessary to make sure that all three models are properly
converged. The feedback loop between the secondary air system and performance is explained
later in this document.
Figure 3.6 represents this SAS main workflow with high level details.

48
3.2.2.3 Conclusions
Throughout the workflow analysis process, four main types of displeasure for the user arose.
They have been categorized as repetitive, time consuming, inefficient, unnecessary. Analyzing
each task keeping these discomforts in mind allowed for the identification of good candidates
for automation.
Figure 3.6 Secondary Air System main workflow (high level)
Pre
- Pro
cess
ing
Pr
oces
sing
Po
st - P
roce
ssin
g
49
Repetitive: Task that must be done multiple times during a single execution with no required
engineering skills. As the user must repeat actions in a single workflow iteration, they are more
prone to make mistakes. However, most of the time, these tasks only need to be setup once.
Full automation is applicable in this situation.
Time Consuming: Long tasks that requires engineering inputs. Necessary, but could benefit
from a better and more efficient UI to handle user inputs. Time is key in engineering
workflows. Reducing cycle time helps quality as more analysis can be run. It is also undeniable
that it helps to reduce costs. To correct this issue a semi-automation is proposed.
Inefficient: Task requiring inputs that are already implicitly imported to the workflow. It often
leads to errors through inconsistent results. Practices are often based on non-tangible
knowledge passed from one engineer to the other. With time, rationales are lost and tasks are
done “instinctively”. Therefore, it is important to seize that concept and be critical. Inefficient
tasks can be described as follow: Tasks requiring inputs that are already implicitly imported to
the workflow. It often leads to errors through inconsistent results. To solve this issue an
automation with metadata is proposed, using the inputs as a source of automation.
Unnecessary: Tasks related to old best practices often do not bring any specific knowledge or
value. Sometimes, because of arbitrary decisions made in the past and lack of time to re-design
and analyze the workflow, the wrong tool is used. Using the wrong tool does not necessarily
provide wrong results, but it might impact the time taken to complete a task.
Another factor to be considered before automation is the tool knowledge; when were the best
practices established? Beause they often do not evolve with the tools. Therefore, researching
the available new functionalities and defining new practices might help to improve workflow.
Such kind of tasks should be eliminated if possible.
50
3.3 Analysis of user’s needs
Following the analysis of the workflow as major flaws were identified, a roadmap for the tool
development was established. In unison with the developer-opinions generated when studying
the workflow, the user-opinions were integrated. This process was key to a smooth transition.
Therefore, the general SAS tool development roadmap was determined with a combination of
internal and external ideas.
Surveillance of the need of users
3.3.1.1 Survey composition
A list of requirements was established according to the results of the workflow analysis. The
tool was developed in increments, which was necessary to establish an order of priorities. The
list was provided to the potential users. The following statement was proposed: “On a scale of
1 to 10, how important do you consider each of the following implementations to be for a new
SAS tool”. The list of requirements is displayed in Table 3.1.
Requirements were divided in three main categories: tool capability, tool features, and user
experience. The tool capability was addressed with requirements such as Fast Computation or
Fast start up, describing the tool efficiency. Additionally, it was observed that the workflow
analysis presented a lack of automated tools to conduct certain analyses. Therefore, new
features such as simplified post-processing, output comparison or graph plotting were
proposed for consideration.
A survey was administered to twelve engineers closely related to the SAS at Siemens Canada,
the population related to SAS is relatively limited. Eight subjects completed the survey.
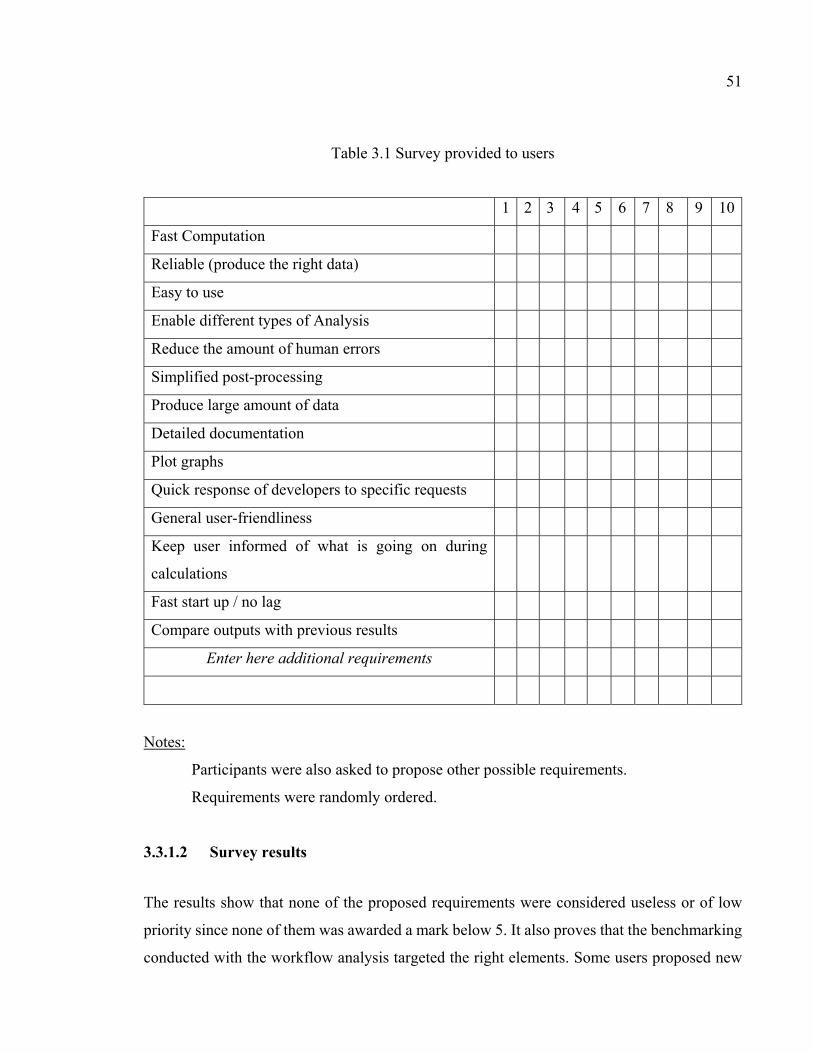
51
Table 3.1 Survey provided to users
1 2 3 4 5 6 7 8 9 10
Fast Computation
Reliable (produce the right data)
Easy to use
Enable different types of Analysis
Reduce the amount of human errors
Simplified post-processing
Produce large amount of data
Detailed documentation
Plot graphs
Quick response of developers to specific requests
General user-friendliness
Keep user informed of what is going on during
calculations
Fast start up / no lag
Compare outputs with previous results
Enter here additional requirements
Notes:
Participants were also asked to propose other possible requirements.
Requirements were randomly ordered.
3.3.1.2 Survey results
The results show that none of the proposed requirements were considered useless or of low
priority since none of them was awarded a mark below 5. It also proves that the benchmarking
conducted with the workflow analysis targeted the right elements. Some users proposed new
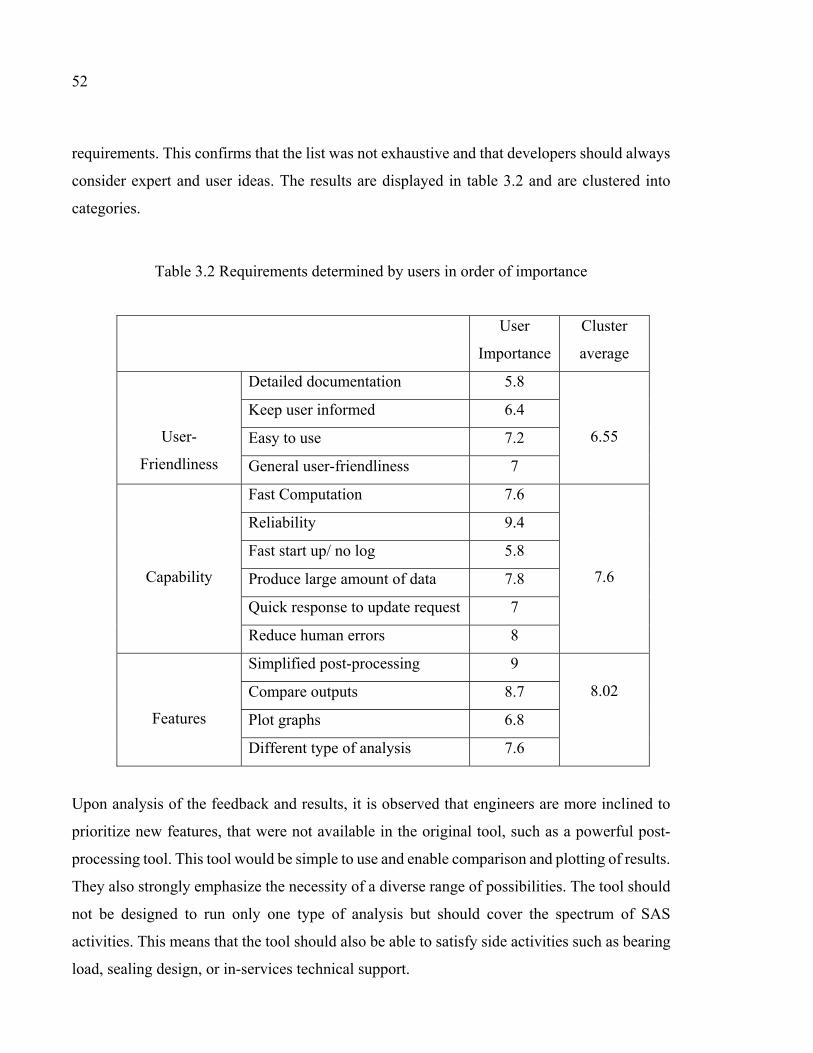
52
requirements. This confirms that the list was not exhaustive and that developers should always
consider expert and user ideas. The results are displayed in table 3.2 and are clustered into
categories.
Table 3.2 Requirements determined by users in order of importance
User
Importance
Cluster
average
User-
Friendliness
Detailed documentation 5.8
6.55 Keep user informed 6.4
Easy to use 7.2
General user-friendliness 7
Capability
Fast Computation 7.6
7.6
Reliability 9.4
Fast start up/ no log 5.8
Produce large amount of data 7.8
Quick response to update request 7
Reduce human errors 8
Features
Simplified post-processing 9
8.02 Compare outputs 8.7
Plot graphs 6.8
Different type of analysis 7.6
Upon analysis of the feedback and results, it is observed that engineers are more inclined to
prioritize new features, that were not available in the original tool, such as a powerful post-
processing tool. This tool would be simple to use and enable comparison and plotting of results.
They also strongly emphasize the necessity of a diverse range of possibilities. The tool should
not be designed to run only one type of analysis but should cover the spectrum of SAS
activities. This means that the tool should also be able to satisfy side activities such as bearing
load, sealing design, or in-services technical support.
53
The participants also pinpointed the tool capability as a point of importance. Tool capability is
the assessment of the performance of the tool. The reliability of the tool is highlighted. This is
meaningful to the engineers as they legally validate all results, thus the more confidence they
have in said results the better. One participant comment recorded in support of tool capability,
was the following, “[Reliability is] key, [We] have to have confidence that it is working as
intended”. Reliability is considered the top priority as it was awarded a 9.4 out of 10.
The user-friendliness is considered as less of a priority as its average mark is 6.55 out of 10. It
seems that a pleasant and easy to operate tool is considered as a bonus. Another participant
mentioned about keeping the user informed: “Nice to have, not terribly important. BUT a
diagnostic tool if something goes wrong […] could be useful”.
This survey gave a clear view on what the users are expecting from the new tool. However,
these requirements implemented with the tool-development engineering criteria in mind in
order to define the proper roadmap for the project.
House of quality
Throughout this research project, it was emphasized that the new tool should be the engineer’s
tool. It is believed that engineers will move toward a new tool more easily whenever their
opinions and expectations are considered in the design and development process. Allowing for
acceptance and transition to be smoother. However, not all the user-wishes can be easily
engineered. It was essential to conduct an analysis to determine how implementing the user’s
wishes would impact the software development.
The selected method was originally developed by the car manufacturer Mitsubishi in Japan.
This method commonly called the “House of quality” is part of the quality function deployment
approach. The house of quality intends to create a correlation between the customer/user
desires and development capacities. Once the house of quality is built, it presents “a map that
provides the means for interfunctional planning and communications” (Clausing, 1998).
54
The users request and their importance were determined with the survey. The functional
requirements were determined within the software design team. While other functional
requirements exist, for the purpose of this study, only the following requirements were
selected:
- User Inputs;
- Automated Sequence;
- Documentation;
- Input Auto-Checking;
- Time to perform one cycle;
- Quality of Results;
- Number of Power Curve Runs (repeatability);
- Number of Clicks;
- Error handling;
- Number of UI Windows;
- Formatting / Gathering files;
- Error Recovery;
- Error Detection;
- Retrieve Information in Output Files;
- Code Reusability.
Some functional requirements are not compatible with one another; therefore, improving one
would impact the other. The roof of the house of quality displays the positive or negative
correlations between the functional requirements.
The core of the house, groups the relationships between the user’s requirements and functional
requirements. These relationships can be Weak, Strong, Moderate or Inexistent. Then the
technical importance rating is determined as described in equation 3.1, where 𝛼 follows the
following rule displayed in table 3.3, user importance for each user requirement are gathered
in table 3.2.
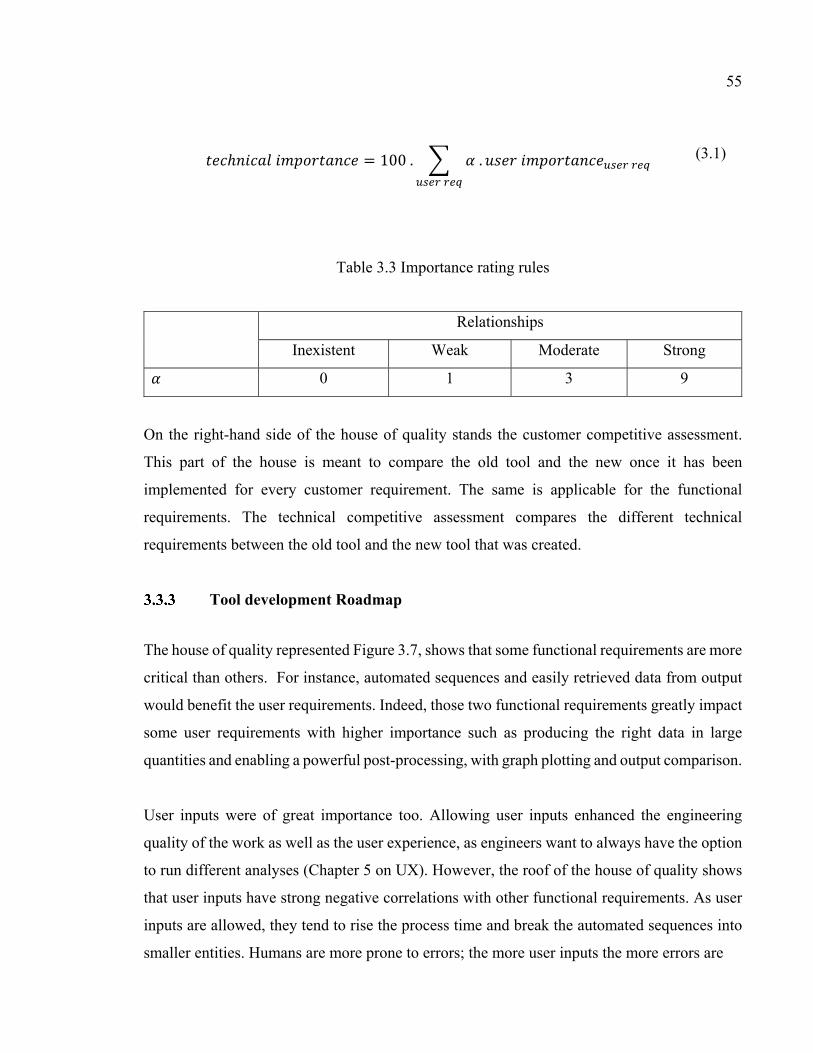
55
𝑡𝑒𝑐ℎ𝑛𝑖𝑐𝑎𝑙 𝑖𝑚𝑝𝑜𝑟𝑡𝑎𝑛𝑐𝑒 100 . 𝛼 .𝑢𝑠𝑒𝑟 𝑖𝑚𝑝𝑜𝑟𝑡𝑎𝑛𝑐𝑒
(3.1)
Table 3.3 Importance rating rules
Relationships
Inexistent Weak Moderate Strong 𝛼 0 1 3 9
On the right-hand side of the house of quality stands the customer competitive assessment.
This part of the house is meant to compare the old tool and the new once it has been
implemented for every customer requirement. The same is applicable for the functional
requirements. The technical competitive assessment compares the different technical
requirements between the old tool and the new tool that was created.
Tool development Roadmap
The house of quality represented Figure 3.7, shows that some functional requirements are more
critical than others. For instance, automated sequences and easily retrieved data from output
would benefit the user requirements. Indeed, those two functional requirements greatly impact
some user requirements with higher importance such as producing the right data in large
quantities and enabling a powerful post-processing, with graph plotting and output comparison.
User inputs were of great importance too. Allowing user inputs enhanced the engineering
quality of the work as well as the user experience, as engineers want to always have the option
to run different analyses (Chapter 5 on UX). However, the roof of the house of quality shows
that user inputs have strong negative correlations with other functional requirements. As user
inputs are allowed, they tend to rise the process time and break the automated sequences into
smaller entities. Humans are more prone to errors; the more user inputs the more errors are
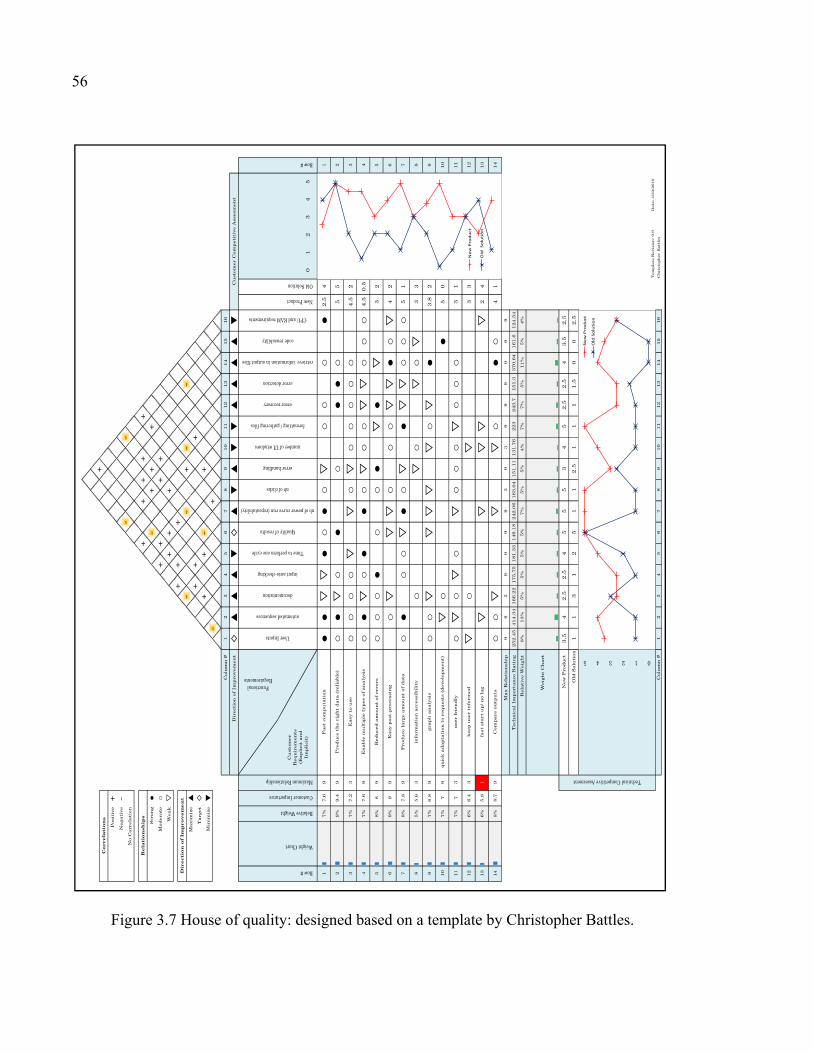
56
Figure 3.7 House of quality: designed based on a template by Christopher Battles.
Functional Requirements
Cu
stom
er
Req
uir
em
en
ts
(Exp
lici
t a
nd
Im
pli
cit)
1|||
7%
7.6
92
.54
1
2||||
9%
9.4
95
52
3|||
7%
7.2
34
.52
3
4|||
7%
7.6
94
.50
.54
5|||
8%
89
32
5
6||||
9%
99
42
6
7|||
8%
7.8
95
17
8||
5%
5.6
33
38
9|||
7%
6.8
93
.82
9
10
|||7
%7
95
01
0
11
|||7
%7
33
11
1
12
|||6
%6
.43
33
12
13
||6
%5
.81
24
13
14
||||8
%8
.79
41
14
Tem
pla
te R
evis
ion
: 0.9
D
ate
: 4
/23/2
010
Ch
rist
op
her
Batt
les
Technical Competitive Assesment
Cu
stom
er
Com
peti
tive A
ssesm
en
t
Maximum Relationship
3 2 1 0
Old
Solu
tion
5 4
3.5 1
N
ew
Pro
du
ct
1.5
2.5
43
.52
.5
13
12
515
53
45
2.5
00
2.5
12
.51
11
5
Row #
4
12
34
New Product
Old Solution
0
99
99
9
|
|||
|||
||
11%
Co
rrela
tio
ns
Posi
tive+
Nega
tive−
No C
orr
ela
tion
Dir
ect
ion
of
Imp
rov
em
en
t
Re
lati
on
ship
s
Str
on
g●
Mod
era
te○
Weak▽ ▲ ◇ ▼
Ma
xim
ize
Targ
et
Min
imiz
e
93
93
99
99
3
▲▼
45
67
89
10
Tech
nic
al
Imp
ort
an
ce R
ati
ng
Ma
x R
ela
tion
ship
99
14
15
16
Colu
mn
#
Weig
ht
Ch
art
Rela
tive W
eig
ht
2.5
2.5
45
89
10
11
12
13
|||||
||
|
12
34
56
7
||
||
5%
4%
|||
||||||
||
||
||
||
|||
5%
5%
4%
7%
7%
5%
8%
13%
5%
5%
5%
5%
7%
16
3.0
41
51
.11
25
2.4
54
14.3
41
66
.22
175
.75
18
1.3
314
9.1
82
42
.06
37
0.6
41
61
.61
24
.54
131
.76
22
32
43
.715
1.3
▲▲
▲1
41
51
6
▲▲
▲▼
◇
○●
○
Colu
mn
#
1 ◇
23
●
○●
fast
sta
rt u
p/
no l
ag
Com
pa
re o
utp
uts
▼▼
▼
Customer Importance
Relative Weight
Row #
Weight Chart
Dir
ect
ion
of
Imp
rovem
en
t
○▽
▽▽▽▽
▽▽
▽▽
○○
○○
○▽ ○
○▽ ○
▽ ○▽
▽ ○▽
●○
▽▽▽
▽ ○▽ ○
●▽▽
○○
○○
○▽
●▽▽
●○
○▽
▽▽○
▽▽▽
○○
▽ ●▽
●
○
○▽▽
○○
○▽▽
●○
●
○●
▽ ○●
●○
▽ ○○○
○○
○○
▽▽ ○
▽○
●●
○●
●▽ ○
●○
○○
○▽
use
r fr
ien
dly
○▽
○
●▽
○○
○○
○ ○ ○ ▽
○○
●
●
keep
use
r in
form
ed
Fast
com
pu
tati
on
Pro
du
ce t
he r
igh
t d
ata
(re
lia
ble
)
Ea
sy t
o u
se
En
ab
le m
ult
iple
typ
es
of
an
aly
sis
Red
uce
d a
mou
nt
of
err
ors
Ea
sy p
ost
-pro
cess
ing
nb of clicks
error handling
User Inputs
automated sequences
documentation
input auto-checking
Time to perform one cycle
Quality of results
nb of power curve run (repeatability)
○ ○ ○
Pro
du
ce l
arg
e a
mou
nt
of
da
ta
info
rmati
on
acc
ess
ibil
ity
gra
ph
an
aly
sis
qu
ick
ad
ap
tati
on
to r
eq
uest
s (d
evelo
pm
en
t)
formatting / gathering files
error recovery
error detection
−
++
+
11
12
▲▲
+
−+
+
+
number of UI windows
++
++
+
−+
−−
+++
+−
++
−
++
++
+−
+
code reusability
CPU and RAM requirements
−+
retrieve information in output files
13
+
New
Pro
duc
t
Old
So
luti
on
New
Pro
duc
t
Old
So
luti
on
57
likely to happen, in their number and diversity. Therefore, a more robust and careful tool must
be developed to detect, handle, and recover from these errors.
However, the new tool should not only be designed as a representation of the user’s wishes.
Indeed, in the present context, the project aims at integrating a multidisciplinary aspect into
the design process. Such an objective might result in fundamental modifications in the way
engineers work. Before a decision was taken, it was proposed in the context of the project
requirements to make sure it was in accordance with the philosophy of the tool (see chapter 1).
Achieving fast computation is strongly related to process time and CPU and RAM
requirements. However, these functional requirements are also strongly negatively correlated.
In order to decrease processing time, it is necessary to increase CPU and RAM requirements.
This is not in accordance with the previously mentioned project requirements in which it is
stated that it’s not ideal to have to modify or replace the laptops or desktops of engineers. A
more complex solution, out of the scope of this research project, was developed to address this
problem.
The following roadmap was established for the development of the SAS automated tool
integration within the platform (Table 3.4). Implementations are ordered by priority and the
order they were implemented. The column “requirements” lists the functionalities that need to
be developed in order to have the successful implementation of the next functionality. This can
be useful in the event of a modification of the roadmap as the developers will not try to
implement a new functionality whose requirements are not yet developed.
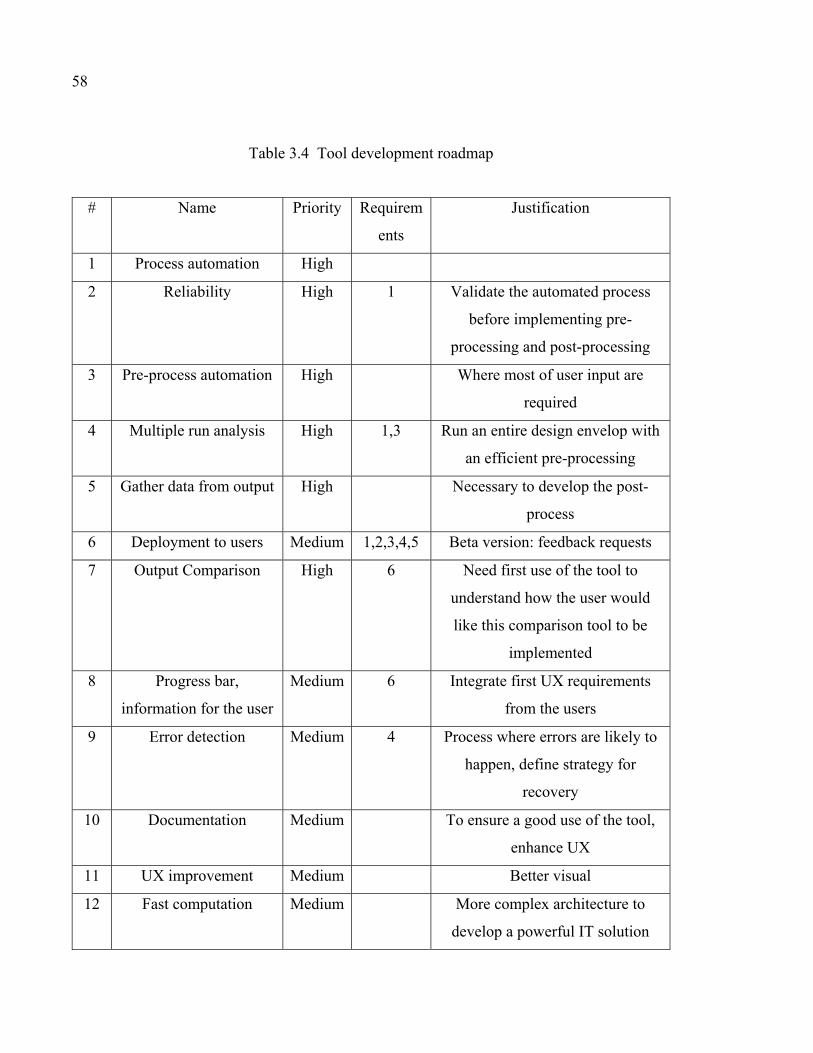
58
Table 3.4 Tool development roadmap
# Name Priority Requirem
ents
Justification
1 Process automation High
2 Reliability High 1 Validate the automated process
before implementing pre-
processing and post-processing
3 Pre-process automation High Where most of user input are
required
4 Multiple run analysis High 1,3 Run an entire design envelop with
an efficient pre-processing
5 Gather data from output High Necessary to develop the post-
process
6 Deployment to users Medium 1,2,3,4,5 Beta version: feedback requests
7 Output Comparison High 6 Need first use of the tool to
understand how the user would
like this comparison tool to be
implemented
8 Progress bar,
information for the user
Medium 6 Integrate first UX requirements
from the users
9 Error detection Medium 4 Process where errors are likely to
happen, define strategy for
recovery
10 Documentation Medium To ensure a good use of the tool,
enhance UX
11 UX improvement Medium Better visual
12 Fast computation Medium More complex architecture to
develop a powerful IT solution
CHAPTER 4
AUTOMATION IMPLEMENTATION AND RESULTS
4.1 Workflow automation
Methodology
4.1.1.1 Simple Automation
Response to: Repetitive Tasks
Repetitive tasks do not require any engineering skills. However, there are done more than once
during the process. They represent an important amount of time and therefore non-value-added
time. The solution to these tasks is a full automation. No user input is required because no
decision must be made. The solution acts as a black box with inputs and outputs.
Automated solutions can easily be called in loops to automatically perform multiple tasks in a
single run. Automated tasks are mostly used during the process period. The processing phase
is the phase requiring the least amount of engineering skills. The run has already been
configured. This phase is mainly focused on executing the process. The automation of the
process takes the pre-process as an input, automatically converts files, successively runs the
boundary condition calculator and the solver, and provides the output files to the post-process.
During the entire design process of this tool, efforts have been made to coordinate and sequence
as many automated tasks as possible so that a minimum number of clicks would be required to
run the process (Chapter 5 on User Experience).
60
4.1.1.2 Semi-Automation
Response to: Time-consuming tasks
Contrary to repetitive-tasks, time-consuming tasks require engineering decisions. They are
contributing the greatest to the time portion of the pre-processing or post-processing. This is
not an issue, time should be invested into these tasks; however, the ultimate goal is to reduce
the amount of interactions engineers had with the tool and make them as convenient as
possible. For instance, a UI was created to cluster all the information the user had to complete
in order to properly configure the SAS calculation, into one simple window. The UI includes
type of analysis, input management, model management, and other optional functionalities.
Time-consuming tasks can include other subtasks; thus, the previously described analysis was
performed recursively in order to optimize the UI efficiency and reduce user inputs. For
confidentiality reasons this detailed description could not be presented in this document.
4.1.1.3 Automation with metadata
Response to: Inefficient tasks
It is highly inefficient to select data while these are implicitly already selected. For instance,
in the SAS context, the engine type is embedded in the performance data, therefore the user is
spending unnecessary time gathering the right model and all other inputs from the
requirements.
As a solution, metadata have been joined to the performance output files when they are created
for automation. When the SAS tool is launched, it reads the metadata attached to its inputs and
pre-selects the right model and other configuration parameters. Metadata are stored in
JavaScript Object Notation (JSON) format.
61
An example of the metadata structure is given below:
{ Model Version: <string>,
Engine Configuration: <object>,
Ambient Condition: <array>,
Task Description : <sting>
….}
Automation with metadata appeared to be very effective in the pre-process and post - process
phases of the workflow, eliminating some non-value-added tasks and reducing errors.
4.1.1.4 Elimination
Response to: Unnecessary tasks
As knowledge is passed on within a company, some actions lose their raison d’être and are
systematically and blindly executed as a force of habit. In most situations, these tasks represent
a loss of time. As such tasks are deeply embedded in the company’s cultural environment, it
requires an external view point to identify them and assess their legitimacy. Unfortunately,
most engineers will tend to consider these as necessary steps. Change management skills were
required to implement new standards where these tasks were deleted.
Some other tasks such as data formatting, gathering and sharing become unnecessary as the
process is automated. They were simply removed from the process chain. It is logical that such
a platform should be introduced progressively, and thus cannot be considered as the exclusive
design tool. Therefore, formatting tools were designed as intermediate checkpoints to extract
data from the platform. Extracted data are used for reports or internal design reviews but cannot
be used for further analysis within the platform.
62
Application
Pre-processing
As explained above, the SAS pre-processing is mainly focused on configuring the software
that will run the SAS network solver. The model configuration requires engineering judgement
and should therefore accept user inputs; to accomplish this, a semi-automated process is
proposed.
This semi-automated process was designed so that instead of manually parameterizing the
execution, the user fills in a user interface (UI) that will automatically configure the run once
the execution is started. Thanks to the metadata linked to the Performance input, the type of
engine is passed to the configuration UI. The latest model in production is automatically pre-
selected as well as any complementary files. The same logic applies to the “flight” cycle data.
Processing
Once the configuration is fed from pre-processing, the execution of the model starts. As this
phase is very long and demanding in “clicks”, it has simply been automated. The tool is run in
batch and the execution of a full rating curve (cluster of operating points representing the
design envelope as much as possible, definition below) is launched with one click at the end
of the pre-processing. Calculating boundary conditions and solving the network is fully done
in batch without user input. Once all results are created post-processing can begin.
The SAS model is solved at different conditions of power. Because the tool only runs in steady
state, multiple state-points are calculated. A power curve refers to a set of points that describe
a cycle of the engine (from start up to shutdown). The rating curve is defined as a set of power
curves throughout the design envelope. That way the model is run for a range of ambient
conditions (mostly referred by its temperature) at different powers of the baseload (Figure 4.1).
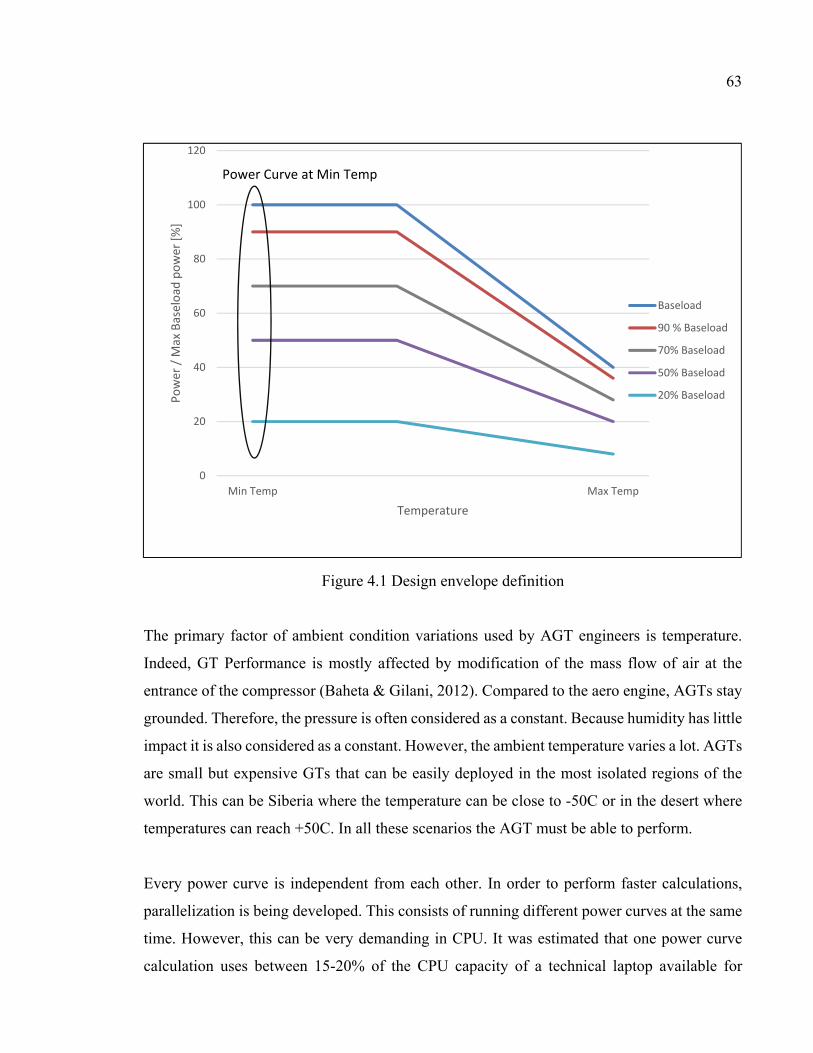
63
The primary factor of ambient condition variations used by AGT engineers is temperature.
Indeed, GT Performance is mostly affected by modification of the mass flow of air at the
entrance of the compressor (Baheta & Gilani, 2012). Compared to the aero engine, AGTs stay
grounded. Therefore, the pressure is often considered as a constant. Because humidity has little
impact it is also considered as a constant. However, the ambient temperature varies a lot. AGTs
are small but expensive GTs that can be easily deployed in the most isolated regions of the
world. This can be Siberia where the temperature can be close to -50C or in the desert where
temperatures can reach +50C. In all these scenarios the AGT must be able to perform.
Every power curve is independent from each other. In order to perform faster calculations,
parallelization is being developed. This consists of running different power curves at the same
time. However, this can be very demanding in CPU. It was estimated that one power curve
calculation uses between 15-20% of the CPU capacity of a technical laptop available for
0
20
40
60
80
100
120
Min Temp Max Temp
Pow
er /
Max
Bas
eloa
d po
wer
[%]
Temperature
Baseload
90 % Baseload
70% Baseload
50% Baseload
20% Baseload
Power Curve at Min Temp
Figure 4.1 Design envelope definition
64
engineers at SIEMENS Canada. As personal laptops are limited in capacity, calculations are
not run locally. This was made possible thanks to a Swarm manager coupled with the open
source Docker containers (Docker.Inc, 2013). By connecting the platform to a remote and more
powerful computer, the Swarm+Docker concept allows one to efficiently run power curves in
parallel. Such an approach should enable the process to be even faster. This concept is currently
in the deployment phase. However, it is out of the scope of this research and the following
explanations do not take this concept into account.
Post-Processing
This phase begins when the results are ready to be analyzed and conclusions can be drawn.
Too often engineers suffer from the overwhelming amount (McManus, 2005) of data that is
created and stored at various places for which formatting is necessary; this is why these tasks
have been semi-automated. Consequently, a UI appears when the results are available so that
the user can immediately identify failed runs in the status section. Furthermore, individual
output files can be read directly from the UI without needing to open additional software or
text editors. The user should note that for UX purposes, only one UI was created for the whole
workflow automation. (Chapter 5 on UX)
The majority of analysis time for the workflow is spent on post-processing. However, it has
been witnessed that a great proportion of that time was spent formatting data in order to plot
graphs to display the results. The proposed tool offers the possibility to plot all graphs from
the main UI; both formatting and data gathering have been eliminated. The user can focus
entirely on which parameters to plot.
Another important functionality that has been implemented is the use of presets. The user can
save/load a set of parameters that will automatically display the desired graphs depending on
the task being run. These presets can be saved globally and shared with other users.
65
Once the results are validated, the user can save them, and they will automatically be processed
to a PLM software (Teamcenter) to become accessible to other users. In that way, any data is
easily available for further analysis. A data management system enhances version control and
automatically notifies a user who used data whenever an updated version has been issued.
Engineers often need to compare newly generated results with those produced for other
projects or design iterations. Due to an important amount of created data, it is sometimes very
fastidious to compare individual parameters. A comparing tool has been integrated to the post-
process interface. When both output files are selected, they are parsed into a JSON format and
compared with selected sensitivity factor. Only the parameters in which deviations exceed this
sensitivity factor are conveniently displayed to the user.
This methodology for automation has been applied to the SAS and implemented in the design
platform. Figure 4.2 represents the results of the analysis and actions that have been taken to
improve the workflow.
The filling color of each task represents the type of problem that was detected (i.e. unnecessary,
time consuming, repetitive or inefficient). The outline colour of each box represents the
solution that was used to resolve the problem(s) (i.e. automation, semi-automation, automation
with metadata or removed).
One may note that some of the time consuming, inefficient or unnecessary tasks are also
repetitive. This is because the tasks can be divided into further detail and some of these
subtasks are purely repetitive and therefore simply automated.
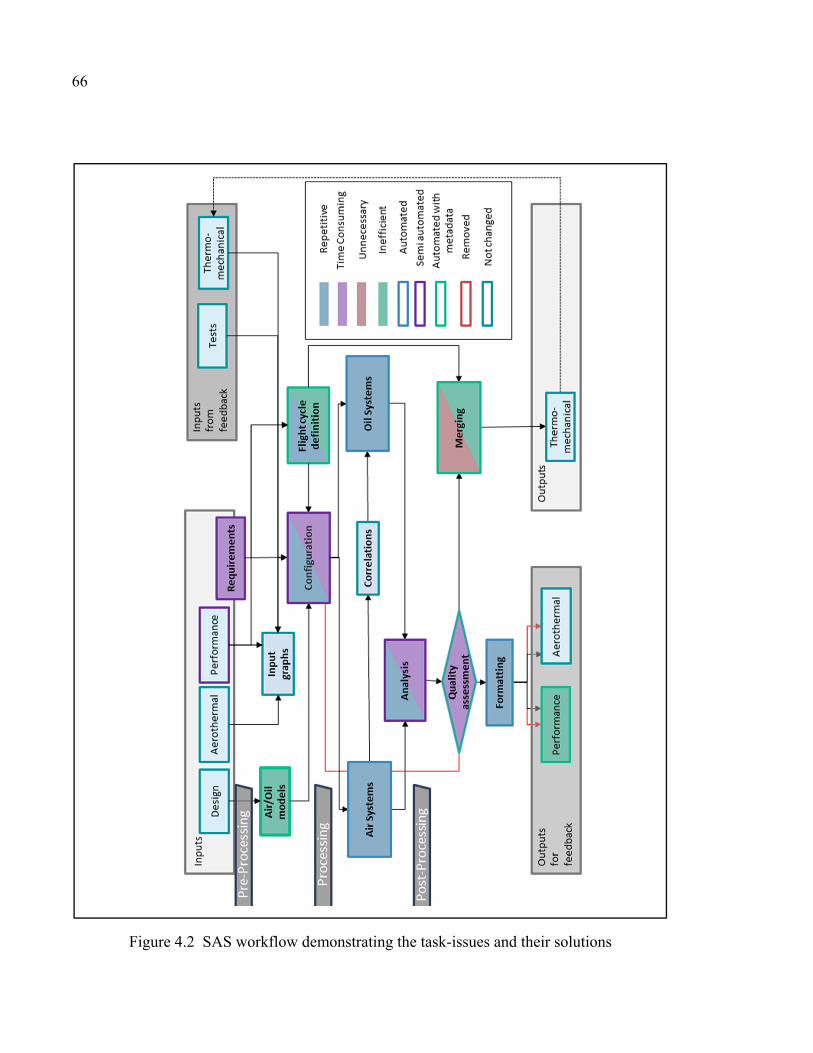
66
Figure 4.2 SAS workflow demonstrating the task-issues and their solutions
67
4.2 Automation Results
Experimentation Protocol
4.2.1.1 Purpose
To quantify the benefits associated with this study, experimentations have been performed. As
the tool is used by both expert and multidisciplinary engineers, subjects were chosen in both
fields. A total of 8 engineers or engineering students participated.
This experimentation aimed to quantify the benefits of process automation. Automation is
known to reduce human errors, enhance result quality, and most importantly create time
benefits, thus the later will be the focus of this experiment.
4.2.1.2 Participants
For the purpose of this study two subject groups were used: Expert and Multidisciplinary
Engineers.
Expert engineers were defined as engineers that have been trained in one specific discipline
and have acquired significant knowledge in that discipline. This knowledge that they possess
allows them master one aspect of the gas turbine design, and they are only responsible for
providing results from their discipline. However, they still hold a more general knowledge of
AGT design.
Multidisciplinary engineers are engineers that are not considered experts in regard of the
studied discipline (i.e. SAS in this case). Therefore, they can be an expert in another discipline,
for instance Performance or Aerothermal, and are considered as a multidisciplinary engineer
regarding SAS. Alternatively, they could be generalist engineers.
68
Discipline experience: 8 users were selected to participate in this experiment. They were
selected for their variety of backgrounds: some are experienced SAS engineers (experts),
whereas some are new to the discipline (multidisciplinary engineers), others are engineering
students with a degree in aerospace, and none are fully new to SAS and gas turbines concepts.
Tool experience: The group was composed of subjects that belong to multiple profiles
previously described:
- 3 aerospace engineers of which:
• 2 are highly trained engineers on the original software (1
helped in the development process and 1 was new to the new
software).
• 1 is an experienced multidisciplinary gas turbine engineer
aware of both processes.
• 1 PhD student in aerospace engineering, new to both
methods.
- 4 Master’s students in aerospace engineering of which:
• 3 developers of the new software.
• 3 new to the original software.
• 1 user new to both methods.
• 2 users familiar with both methods.
The group was therefore diverse, yet there were some limitations which are detailed in bias #1.
4.2.1.3 Process
Every participant was asked to perform the above-mentioned SAS workflow (Figure 4.2) using
both methods, the original and the newly proposed. This was done twice to reduce the confound
of a learning curve since not all subjects were familiar with both methods. All runs were similar
but with slight differences so that users had to modify inputs and remain fully focused on their
69
tasks. Some users had to run the workflow for 2 ambient conditions, others had only one
whereas some tried both.
4.2.1.4 Parameters captured
The process was decomposed in three main categories: Pre-processing, Processing and Post-
processing. Those categories where subdivided into subs tasks.
An array has been established (APPENDIX I) to gather the results in the most convenient way
possible.
While the participants were performing the required process, the amount of time for every task
were gathered and recorded. Errors were noted, but mostly used as to make UX improvements
as opposed to an attempt to prove a reduction in human error.
As the new method was currently in development during the experimentation and because the
work was done in an AGILE way, improvement feedbacks were gathered during the
experimentation. This inevitably brought bias #2 (as mentioned below).
Engineering decision was not captured as engineering tasks were not automated and should
not be reduced or shortened
4.2.1.5 Objective
Quantify the time benefits of the new automated process.
4.2.1.6 Material
The subject was provided a step by step guide and a requirement document describing the SAS
configuration and how to use the software.

70
Because the purpose of this experimentation was not to quantify the participant capacity to
interpret the guide or the requirements, any questions they had were answered during the
experiment. However, the clock wasn’t stopped.
Calculations are run locally. The docker container is not available.
4.2.1.7 Procedure
First, the participant randomly selected the requirements documents and randomly selected
which method (old or new) to start with. The guide and requirements were provided to the
subject who could spend an unlimited amount of time reading it.
The clock was started whenever the subject started to write or touch the computer mouse.
The user was then asked to perform the calculations defined in the requirements.
The clock was stopped when the participant accomplished the last task requested.
4.2.1.8 Bias
[1] Due to the restricted application of the new tool (AGT division at SIEMENS CANADA),
it was difficult to establish a non-biased population. Most subject profiles are sufficiently
represented to clearly establish a behavior tendency. However, for the purpose of this research
since most of the final users took part in the experimentation, we were able to draw some
conclusions.
[2] Because of scheduling and equipment availability the experiment was run over a month.
Minor software updates occurred during that month. Therefore, the new software had better
performance towards the end of the experimentations.
71
4.2.1.9 Notes
The step by step guide was presented as a “working reference” to the user and not as mandatory
steps. As long as the results were provided correctly any strategy was accepted.
It would have been interesting to capture errors since automation aims to reduce human error.
Unfortunately, this would have required separate experiments. Indeed, because both methods
were proposed with a step by step guide, errors were greatly reduced. However, users’
“feelings” have been gathered (see unquantified results). Participants were aware of the goal
of the experiments and how the data would be gathered and analyzed. Some participated in the
establishment of the process.
Experimentation Results
The results are intended to be interpreted as observations that could lead toward the acceptance
of such a tool. Statistical analysis was performed using unpaired one-tailed t-tests. A significant
difference between the old and new tool was denoted by an asterisk (*) above the relevant
comparison.
4.2.2.1 Time repartition
Time is a key metric for automation. The main objective of this research project was to find a
method to efficiently automate an engineering workflow to fasten the design process; with the
expectation that the overall workflow will become faster. In order to interpret the results more
accurately, time benefits for the different steps of the workflow (i.e. pre-processing, processing
and post-processing) can also be collected.
The first observation of interest was the time repartition for a power-curve calculation at one
ambient condition. The overall time spent on the task allocated to the subjects was, on average,
two times faster with the newly designed tool (figure 4.3 p<0.0001). Furthermore, it was
witnessed that the new tool was most effective in the post-processing phase being
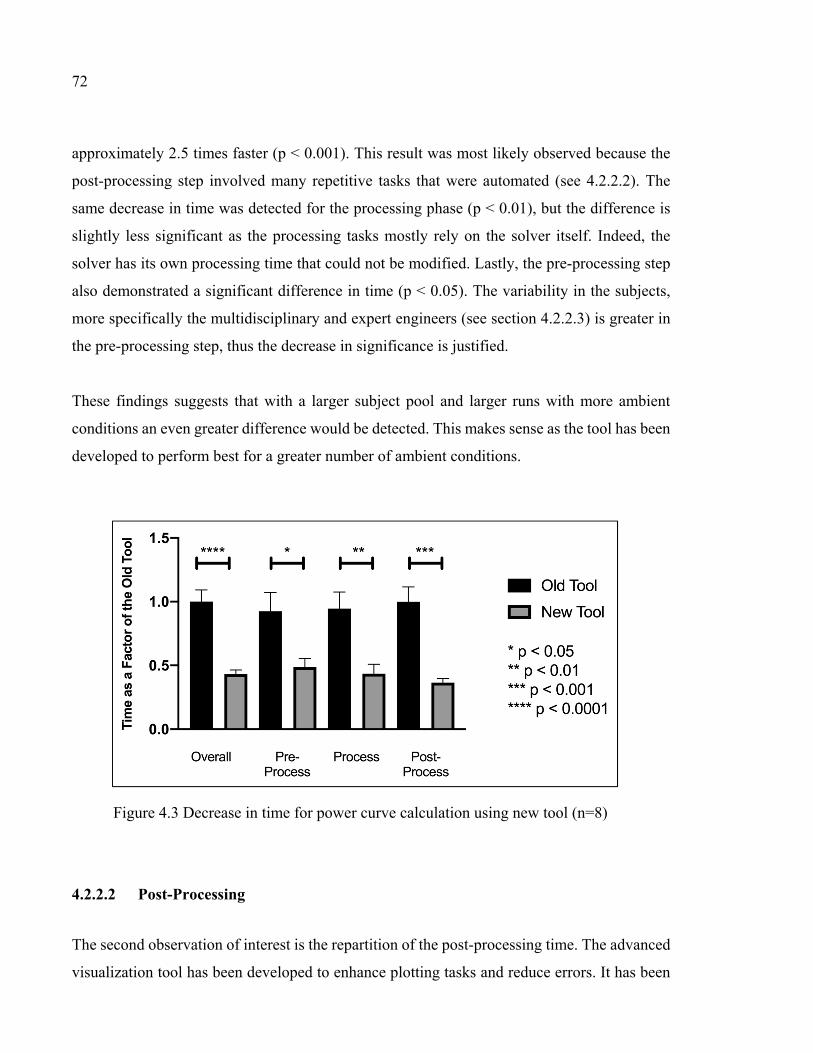
72
approximately 2.5 times faster (p < 0.001). This result was most likely observed because the
post-processing step involved many repetitive tasks that were automated (see 4.2.2.2). The
same decrease in time was detected for the processing phase (p < 0.01), but the difference is
slightly less significant as the processing tasks mostly rely on the solver itself. Indeed, the
solver has its own processing time that could not be modified. Lastly, the pre-processing step
also demonstrated a significant difference in time (p < 0.05). The variability in the subjects,
more specifically the multidisciplinary and expert engineers (see section 4.2.2.3) is greater in
the pre-processing step, thus the decrease in significance is justified.
These findings suggests that with a larger subject pool and larger runs with more ambient
conditions an even greater difference would be detected. This makes sense as the tool has been
developed to perform best for a greater number of ambient conditions.
4.2.2.2 Post-Processing
The second observation of interest is the repartition of the post-processing time. The advanced
visualization tool has been developed to enhance plotting tasks and reduce errors. It has been
Figure 4.3 Decrease in time for power curve calculation using new tool (n=8)
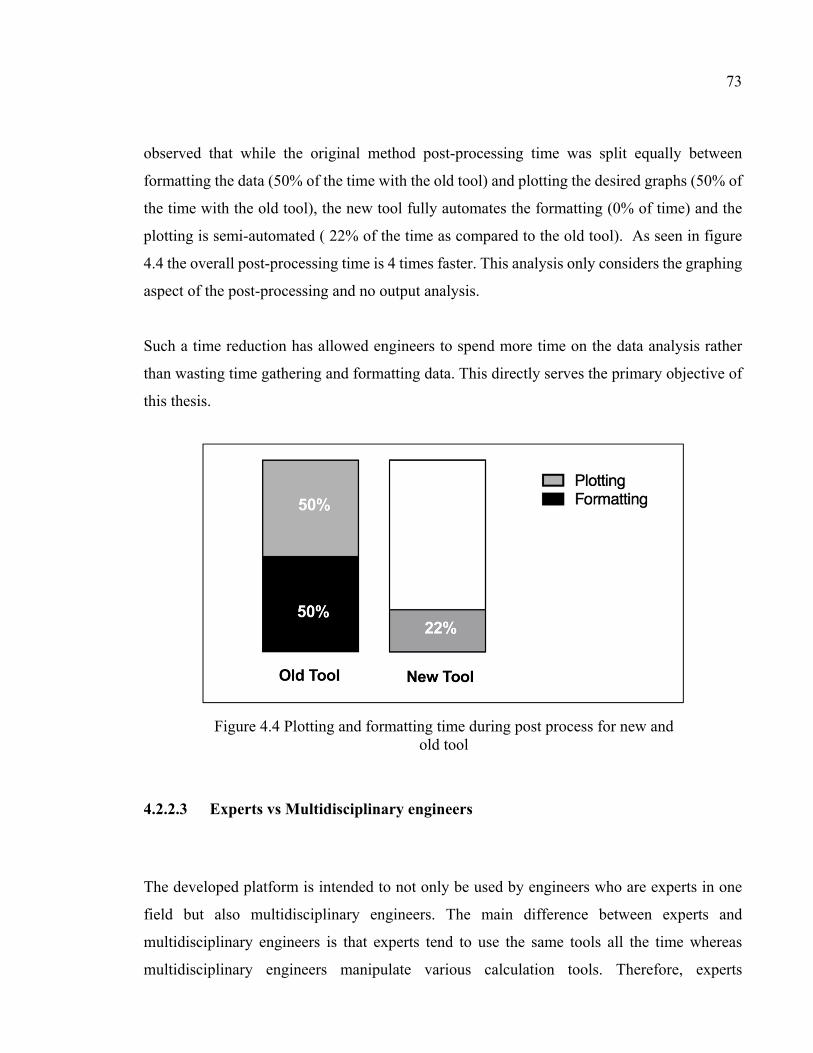
73
observed that while the original method post-processing time was split equally between
formatting the data (50% of the time with the old tool) and plotting the desired graphs (50% of
the time with the old tool), the new tool fully automates the formatting (0% of time) and the
plotting is semi-automated ( 22% of the time as compared to the old tool). As seen in figure
4.4 the overall post-processing time is 4 times faster. This analysis only considers the graphing
aspect of the post-processing and no output analysis.
Such a time reduction has allowed engineers to spend more time on the data analysis rather
than wasting time gathering and formatting data. This directly serves the primary objective of
this thesis.
4.2.2.3 Experts vs Multidisciplinary engineers
The developed platform is intended to not only be used by engineers who are experts in one
field but also multidisciplinary engineers. The main difference between experts and
multidisciplinary engineers is that experts tend to use the same tools all the time whereas
multidisciplinary engineers manipulate various calculation tools. Therefore, experts
Figure 4.4 Plotting and formatting time during post process for new and old tool

74
completely master the tools they use. Since these tools are complex, it might be very
challenging for non-experts to run basic calculations.
The results of the time benefit experiment can be analyzed from the multidisciplinary and
expert engineer perspective. Figure 4.5 depicts that the benefits for multidisciplinary engineers
is greater than for experts. This can be explained as the original tool requires expertise whereas
the new version is straight forward. It is important to note that both experts and
multidisciplinary do benefit from the new tool.
The tool is undeniably effective for multidisciplinary engineers. Figure 4.5.A demonstrates
that overall, there is a significant reduction of time with the new tool for multidisciplinary
engineers (n=5); this reduction appears to be more than 60%. One can also see that there’s a
trend toward a reduction of around 43% for expert engineers. This trend suggests that the tool
is beneficial for experts as well, but that a significant effect is not being detected because of
large variability and small sample size (n=3). Figure 4.5.B, displays a similar trend where the
pre process time is significantly reduced for multidisciplinary engineers using the new tool,
whereas a trend toward a decrease is seen for expert users. At baseline (using the old tool)
experts are faster since expertise can be used to shorten the pre-process time by reusing
previous input files and configuration. Experts also tend to verify less often the configuration
parameters as they developed a certain confidence with the tool. Therefore, when the new tool
was introduced the benefits were less dramatic as compared to multidisciplinary engineers who
were much slower with the old tool and find the new tool simpler to understand. Figure 4.5.C,
demonstrates that since the process is entirely automated both the multidisciplinary and expert
engineers have a significant reduction in time. Lastly, figure 4.5.D demonstrates that again
there was a very significant decrease in post-process time for multidisciplinary engineers and
a trend towards a decrease for experts. In addition to a small sample size another explanation
for the lack of significance for expert engineers is that one of the experts experienced
difficulties, while using the old tool, with a spreadsheet software while plotting the graphs,
resulting in a greater variability in the results. This, in fact, further justifies the need for an
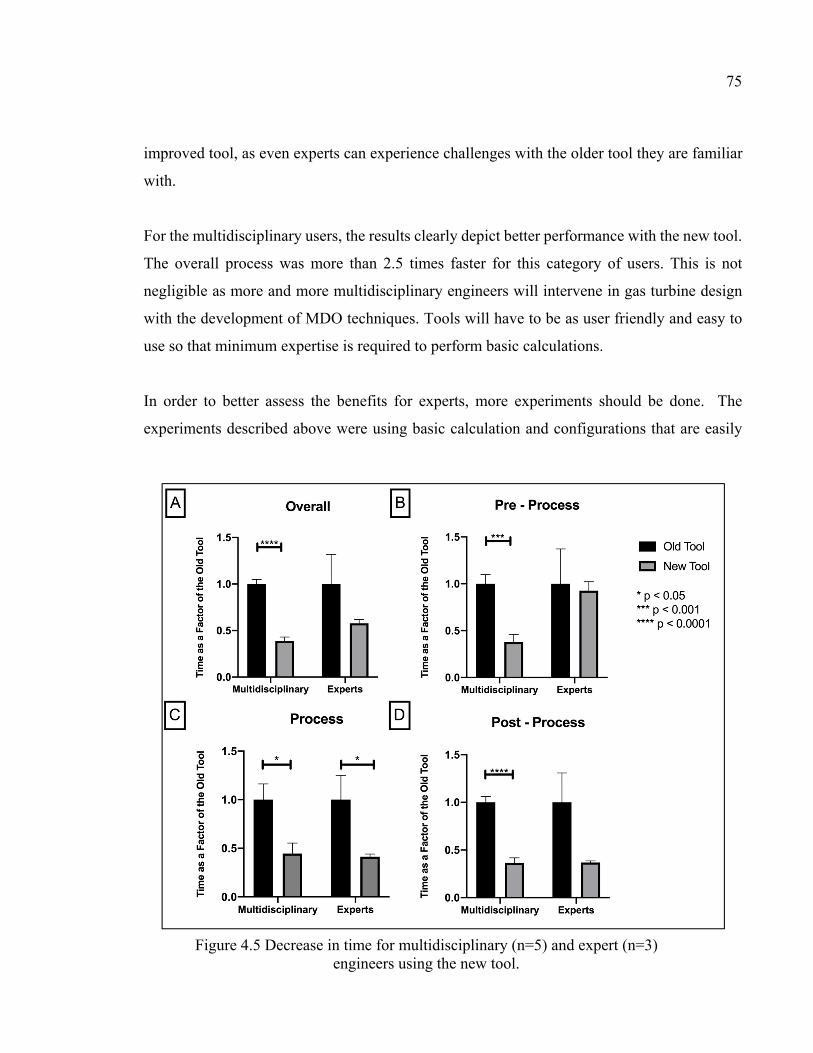
75
improved tool, as even experts can experience challenges with the older tool they are familiar
with.
For the multidisciplinary users, the results clearly depict better performance with the new tool.
The overall process was more than 2.5 times faster for this category of users. This is not
negligible as more and more multidisciplinary engineers will intervene in gas turbine design
with the development of MDO techniques. Tools will have to be as user friendly and easy to
use so that minimum expertise is required to perform basic calculations.
In order to better assess the benefits for experts, more experiments should be done. The
experiments described above were using basic calculation and configurations that are easily
Figure 4.5 Decrease in time for multidisciplinary (n=5) and expert (n=3) engineers using the new tool.
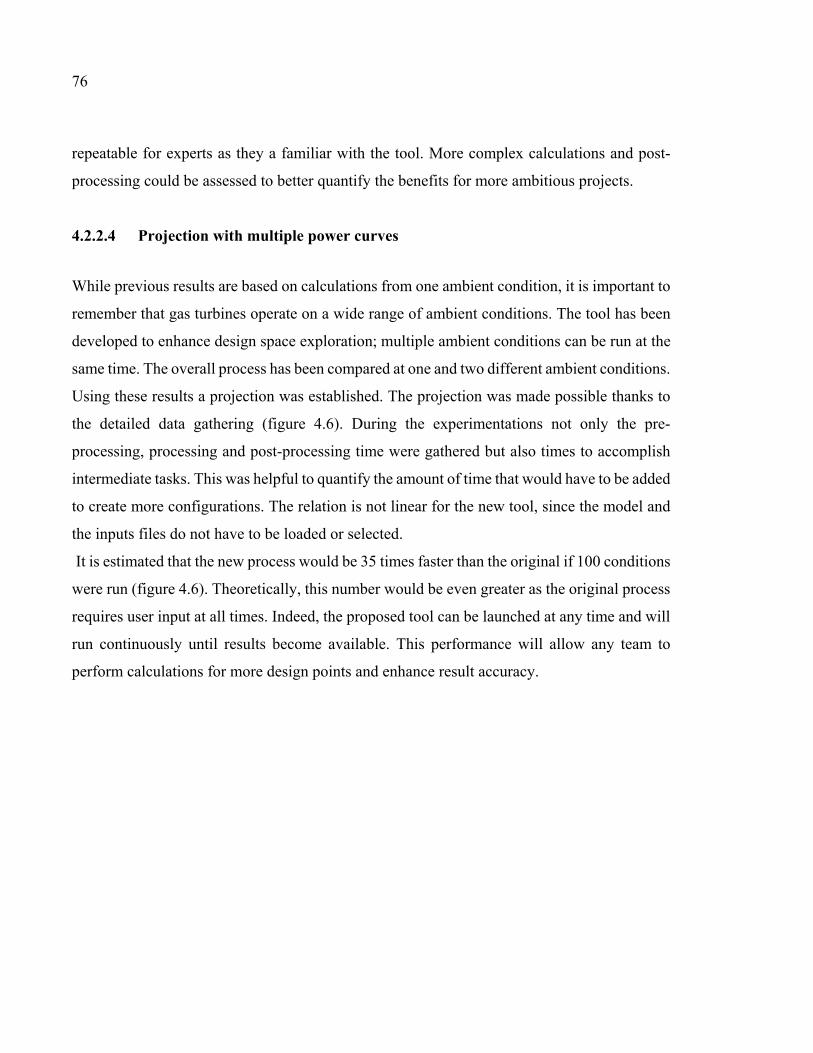
76
repeatable for experts as they a familiar with the tool. More complex calculations and post-
processing could be assessed to better quantify the benefits for more ambitious projects.
4.2.2.4 Projection with multiple power curves
While previous results are based on calculations from one ambient condition, it is important to
remember that gas turbines operate on a wide range of ambient conditions. The tool has been
developed to enhance design space exploration; multiple ambient conditions can be run at the
same time. The overall process has been compared at one and two different ambient conditions.
Using these results a projection was established. The projection was made possible thanks to
the detailed data gathering (figure 4.6). During the experimentations not only the pre-
processing, processing and post-processing time were gathered but also times to accomplish
intermediate tasks. This was helpful to quantify the amount of time that would have to be added
to create more configurations. The relation is not linear for the new tool, since the model and
the inputs files do not have to be loaded or selected.
It is estimated that the new process would be 35 times faster than the original if 100 conditions
were run (figure 4.6). Theoretically, this number would be even greater as the original process
requires user input at all times. Indeed, the proposed tool can be launched at any time and will
run continuously until results become available. This performance will allow any team to
perform calculations for more design points and enhance result accuracy.
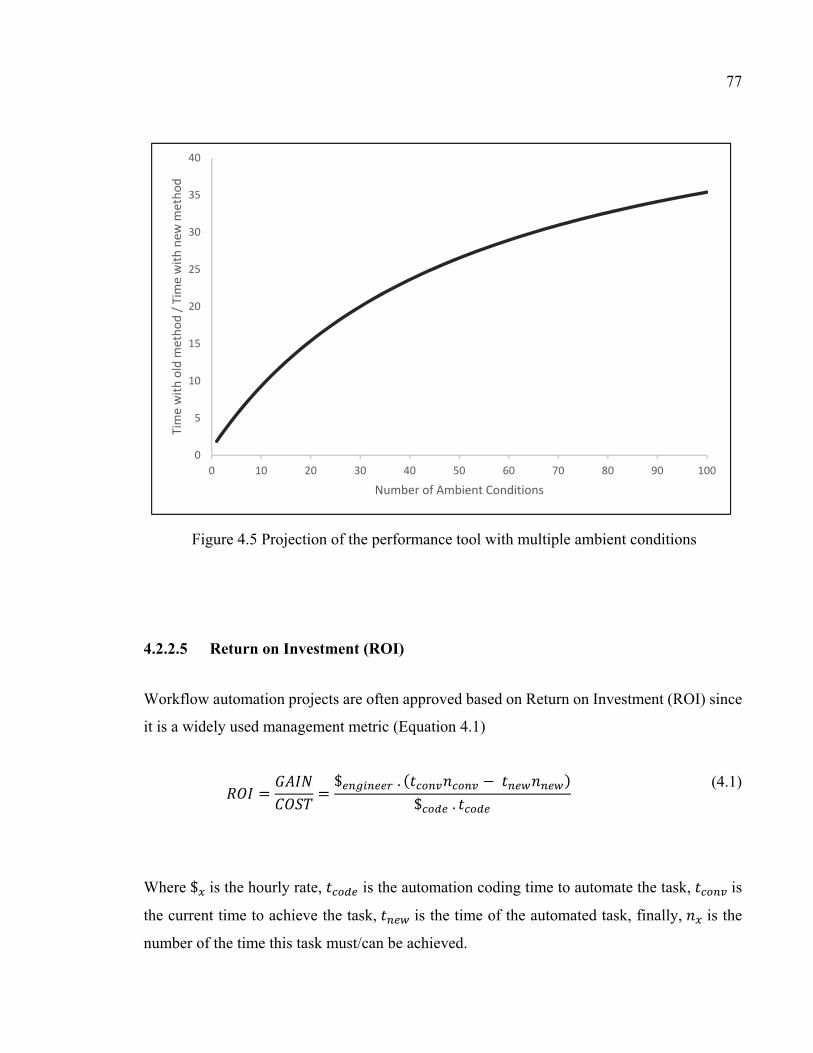
77
4.2.2.5 Return on Investment (ROI)
Workflow automation projects are often approved based on Return on Investment (ROI) since
it is a widely used management metric (Equation 4.1)
𝑅𝑂𝐼 𝐺𝐴𝐼𝑁𝐶𝑂𝑆𝑇 $ . 𝑡 𝑛 𝑡 𝑛$ . 𝑡
(4.1)
Where $ is the hourly rate, 𝑡 is the automation coding time to automate the task, 𝑡 is
the current time to achieve the task, 𝑡 is the time of the automated task, finally, 𝑛 is the
number of the time this task must/can be achieved.
0
5
10
15
20
25
30
35
40
0 10 20 30 40 50 60 70 80 90 100
Tim
e w
ith o
ld m
etho
d / T
ime
with
new
met
hod
Number of Ambient Conditions
Figure 4.5 Projection of the performance tool with multiple ambient conditions
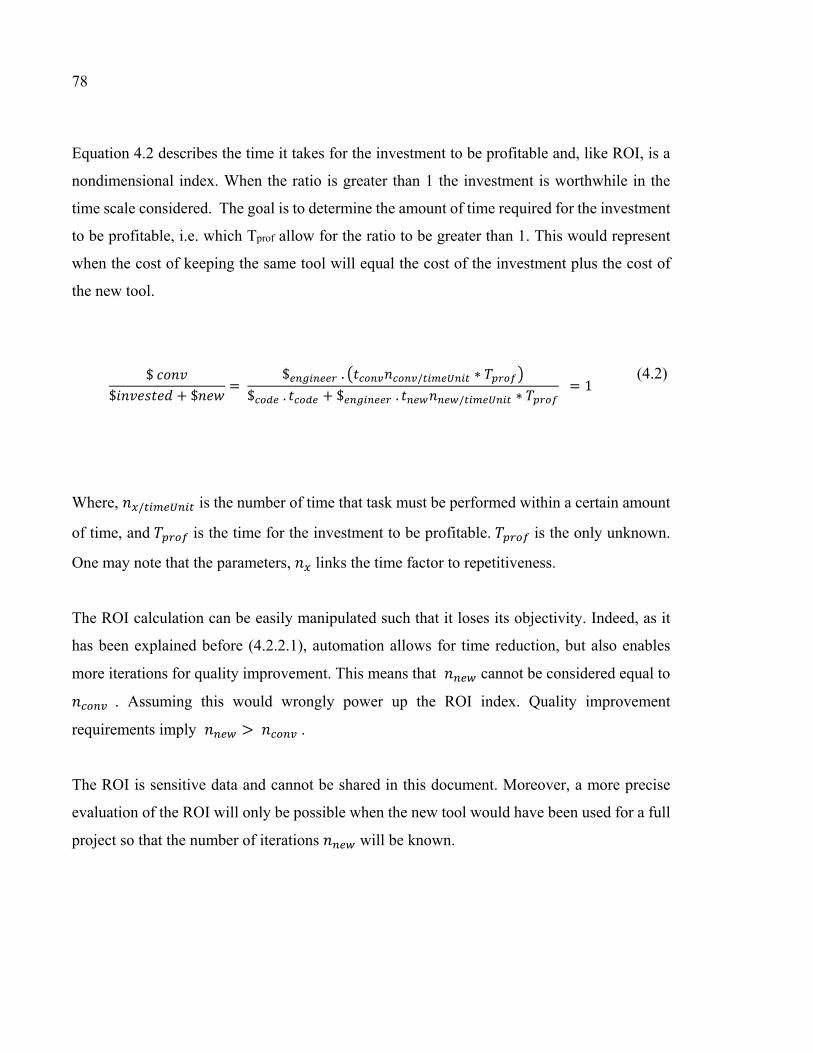
78
Equation 4.2 describes the time it takes for the investment to be profitable and, like ROI, is a
nondimensional index. When the ratio is greater than 1 the investment is worthwhile in the
time scale considered. The goal is to determine the amount of time required for the investment
to be profitable, i.e. which Tprof allow for the ratio to be greater than 1. This would represent
when the cost of keeping the same tool will equal the cost of the investment plus the cost of
the new tool.
$ 𝑐𝑜𝑛𝑣$𝑖𝑛𝑣𝑒𝑠𝑡𝑒𝑑 + $𝑛𝑒𝑤 = $ . 𝑡 𝑛 / ∗ 𝑇$ . 𝑡 + $ . 𝑡 𝑛 / ∗ 𝑇 = 1 (4.2)
Where, 𝑛 / is the number of time that task must be performed within a certain amount
of time, and 𝑇 is the time for the investment to be profitable. 𝑇 is the only unknown.
One may note that the parameters, 𝑛 links the time factor to repetitiveness.
The ROI calculation can be easily manipulated such that it loses its objectivity. Indeed, as it
has been explained before (4.2.2.1), automation allows for time reduction, but also enables
more iterations for quality improvement. This means that 𝑛 cannot be considered equal to 𝑛 . Assuming this would wrongly power up the ROI index. Quality improvement
requirements imply 𝑛 > 𝑛 .
The ROI is sensitive data and cannot be shared in this document. Moreover, a more precise
evaluation of the ROI will only be possible when the new tool would have been used for a full
project so that the number of iterations 𝑛 will be known.

79
4.2.2.6 Unquantified Results
The experimentation was designed to address process time. However, automation does not
only improve processing time. Other factor such as errors, learning phase, documentation and
user friendliness could be analyzed too. This has not been quantified, but user feedback was
documented throughout the experiments.
Errors:
Users had a user guide and a step by step guide to perform the experiments. Therefore, errors
were less prone to happen. The quantification of those errors would not have been
representative of the real situation. They were not quantified (4.2.9.1). However, 75% of the
participants declared during the experimentations that the older version was more subject to
error.
Different types of errors exist. They can be configuration errors, software errors, or analysis
errors. Configuration errors are the most common and are most likely to occur. Because
requirements can sometimes be blurry due to knowledge transfer from one engineer to another,
calculations can be done for a slightly different configuration. Gas turbines technologies
require a refined analysis quality. Therefore, new calculations shall be required. Thanks to the
new tool, such configuration errors are greatly reduced. The framework allows a smooth and
quick data transfer, the PLM software provides a version control tool to limit incoherence
between input data. Finally, the automated SAS tool provides pre-settings, model management
and a single window UI that summarize the analysis configuration. This greatly reduces the
potential for errors as the user can easily double check the configuration before launching the
tool.
80
Learning phase:
The time it takes for a user to be fully autonomous with a tool is important for engineering
companies as the learning phase cost time, money, and human resources. Reducing this
learning curve is key in a multidisciplinary context.
Experts and non-experts both agree that the new tool required less “tricks” and knowledge,
thus it was successful at reducing configuration time. The new tool can easily be mastered,
enabling users to produce valuable results quickly.
Documentation:
Any tool needs refurbishment as time goes on. Implementing new concepts to an older tool
could help in many ways. As the new tool was based upon the old one, no knowledge and best
practices were lost. A lot of documentation is required to run the original tool properly. This
documentation can be long to read to find the desired piece of information. The new tool was
developed to embed the documentation and provides easy access to it. In that way, the user can
easily find answers on how to operate the tool as they are using it (see chapter 5 on User
Experience).
Limitations & Discussion
The above described tool has shown great potential, as it showed to be faster than the original
workflow, it led to the design cycle being ultimately shortened, and it allowed for more design
iterations to occur. This inevitably enhances accuracy of the results and leads to improved
products.
The tool could become even faster as parallel computing is under development thanks to the
docker container concept. It will also consequently be less demanding in CPU and memory
81
(RAM) for personal laptop. Therefore, it would create additional financial benefits for the
company as they will not need to provide every engineer a state-of-the-art laptop.
As results are created, they are stored in the PLM software or locally on the user’s computer.
Some results are considered as success some as failures. Nevertheless, knowledge resides in
both and that knowledge can be used for further application (must do vs must not do). Using a
database and artificial intelligence such as machine learning (Pilarski, Staniszewski,
Villeneuve, & Varo, 2019), new features could be brought to the SAS tool. For instance, a
powerful comparison allowing the user to easily compare and validate the produced data.
The proposed design platform would be of better efficiency if it could produce all required
input for its tool. Indeed, as some inputs must be imported, data management is not optimal.
Moreover, metadata start being generated only after the importation, and some knowledge is
lost. In conclusion, as the development of the new tool within the platform will improve, the
efficiency of the said platform will increase.
To summarize, automation must not simply keep the foundations of the original process and
add a computer process. Automating a workflow requires a careful analysis and critical sense.
This thorough process is necessary to prevent the creation of only a slightly better tool when a
much greater gain is possible. The transition to automation may be met with resistance (Oreg,
2003), thus it is of great importance to implement change management with a carefully
determined transition phase. Consequently, a meticulous UX analysis is required to ensure the
tool is developed in close collaboration with its future users (Chapter 5 on UX)

CHAPTER 5
ADDRESSING USER EXPERIENCE
5.1 Implementing new feature to fit users’ expectations
Agile development
The agile manifesto (Beck et al., 2001) was articulated in 2001 and proposes fundamental
concepts to software development. The SCRUM process was adopted in order to efficiently
provide engineers the best and most suitable tool possible. It is widely accepted that smaller
teams can perform more efficiently than larger ones (Bray, Kerr, & Atkin, 1978). The
terminology, Scrum, comes from an analogy to rugby; a small united team working in in the
same direction. In a Scrum process, the project is divided into sprints. They are short periods
of time during which each team member is tasked to achieve a specific goal. For this project,
the sprints were two weeks long. The sprints start with a planning session where each team
member defines their tasks, priorities and planification. At the end of the two weeks there is a
sprint review, during which each team member briefly explains to the project stakeholders their
success, failures, ideas, and concerns for future development. Daily informal meetings were
held in order to spot difficulties and keep track of progress. A Scrum software, JIRA (Atlassian,
2002), was used to gather team members tasks and planification. The board, where all tasks
were submitted, was updated during the daily meeting.
This method has shown great results in the last decade, teams appear to be more efficient and
ensure that their product is delivered to the users in their respected timelines. The mindset of
the software development community is to share and to have open channel of communication.
Therefore, experience reports on Scrum process are published. Rising and al, (Rising & Janoff,
2000) provide an inside-look on how to manage and acquire experience with the scrum process.
As the agile method incites to adapt and continually change the process, the scrum process for
this project was also dynamic. Initially, the team was having long and inefficient meetings, this

84
was addressed, and the meeting-agenda and duration were modified. The scrum process was
not considered as a step by step procedure but as a mindset fitting the project team in particular.
Agile development intended to provide the most adapted tools for the user with “early and
continuous delivery of valuable software” (Beck et al., 2001) to the users. Such a philosophy
enabled the development team to gather a lot of user feedback information. These were
considered crucial, but sometimes lead to modifying the general roadmap (detailed in 3.3.3).
New ideas were studied, discussed and an adapted decision were made. Sometimes, following
the agile manifesto’s principles, major development strategy modifications were implemented
in order to always provide a better, more robust, more efficient product to the user.
Using user feedback
UX is subjective and a quantification with simple metrics such as the number clicks does not
provide a good enough estimation of the UX and discussions in the field are lead to properly
define a proper UX evaluation (Obrist et al., 2009). In addition of quantitative metrics,
qualitative aspects must be considered. In the context of this research, because of the small
population, a pleasant tool for all users is possible. The tool must not be personalized either,
as it should be adapted for the greater majority. A just balance must be found. The developer
must combine, the general roadmap of the tool, user feedbacks, UX literature, and quantitative
measurements.
Managing change
It is difficult for people to change their habits (Oreg, 2003), therefore, when implementing a
new tool, some precautions must be undertaken. The agile process helps the users to
understand that the new tool is meant to reduce their difficulties and to cure their pains.
However, sometimes changing philosophies required more management skills. This aspect of
the project is mostly out of scope for this research as it was handled by management rather
than developers. However, developers had to understand and feel which philosophy change
85
were bothering users and adapt their tool accordingly. An example of change management is
described below.
As the developed tool was integrated into a platform, the philosophy was to be able to operate
anything within the platform. From pre-processing to post processing. This showed great time
benefits and possible human error cuts (4.2.2). But this goes against long time use of
spreadsheets that are widely used in the engineering field. The following strategy has been
adopted as a transition phase. An icon in the UI allows the user to export data in an “.xlsm”
format. However, it is believed that the available functionalities are powerful enough to
encourage engineers to use them instead of doing it manually. This might especially be true
for entire design envelop calculation. The tool has not been in service for a long enough time
to draw any conclusions regarding its implementation yet.
Gathering analytics in the background
Some UX feedbacks with the tool can be gathered thanks to discussions and surveys; other can
be gathered every time the tool is used. For that reason, every time the tool is being used an
automatic script gathered information in JSON format. Examples of information gathered are
list below:
- Time of pre-processing; - Time of processing; - Time of post-processing; - Was the pre-defined model changed? - Were the results saved? - Were graphs plotted? - If YES, which graphs? - Which operations were run? - Which ambient temperatures were run? - Were the results compared with other results? - Were the results and graphs exported to an external spreadsheet? - Was the oil model run?
In order for this data to have significance, it is required to wait for the tool to be used by
multiple engineers on real projects and for a few months. At this stage of the project, as the
86
tool just passed validation, engineers are simply starting to create results and use the tool.
However, a further analysis of the data will bring valuable information on how the tool is being
used. This will help developers to identify future development steps.
Gamification
On a lighter note, but still with interesting implications, the concept of gamification has been
introduced in the SAS tool of the developed platform. Gamification is defined as the use of
game concepts in a non-gaming environment (Deterding, Khaled, Nacke, & Dixon, 2011).
Games takes UX at its core as their primary purpose it to entertain the user. It seems that
gamification would help create a more engaging and creative workplace (Deterding, Sicart,
Nacke, O’Hara, & Dixon, 2011). Many companies derive game concepts for their products.
Apple, for instance, designed its Apple Watch with rings to be filled daily by exercising. The
user, by completing the rings, is awarded badges and levels that can be shared with the
community.
In the SAS tool context, a very simple approach has been tested in order for people to engage
with the tool. The basis of a very famous game designed by Dong Nguyen, Flappy Bird, has
been used to create a friendly and amusing competition between the platform users. Flappy
Bird is a very well-designed game, where the player has to fly a bird through pipes. The game
is exceptionally hard but addictive and encountered a tremendous amount of success among
the gamer community in 2015 (Stuart, 2014).
A similar game has been designed (Figure 5.1) and integrated to the platform allowing the
users to compete against their peers while the tool is running. Different rankings are available
in order to create an amusing competition and enhance team building. This game is not believed
to be a distraction for the engineers as it can only be triggered during run time and stops when
results are available.
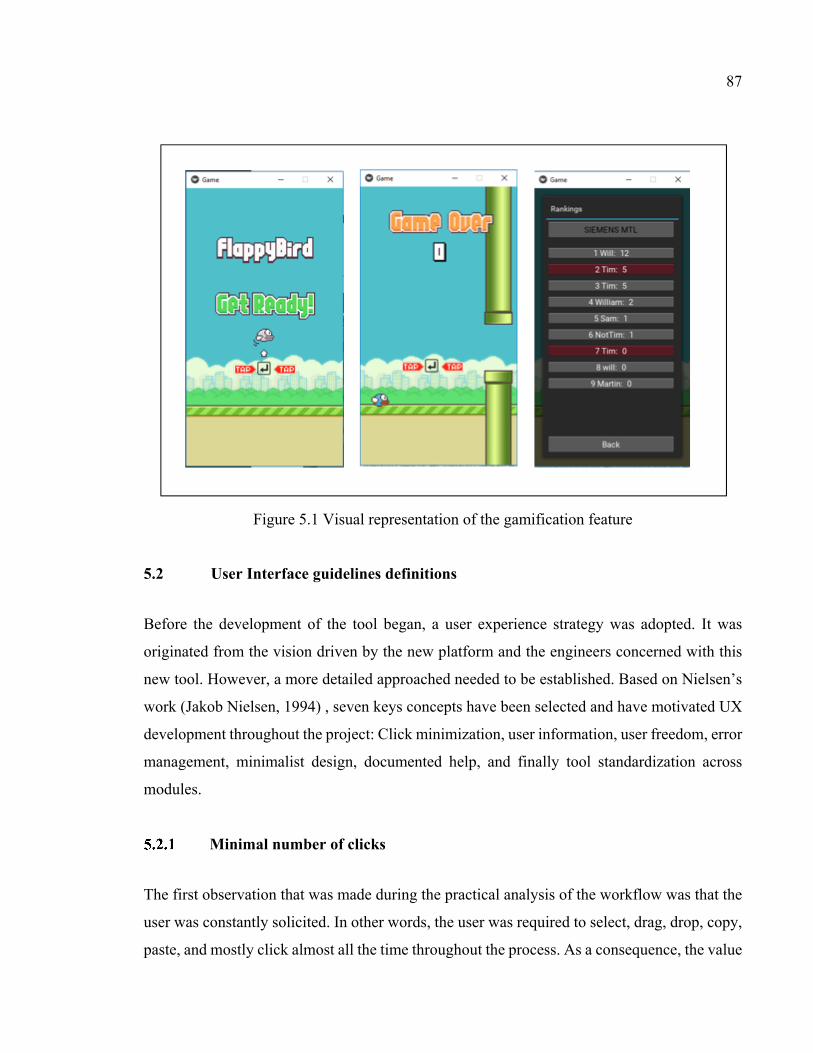
87
5.2 User Interface guidelines definitions
Before the development of the tool began, a user experience strategy was adopted. It was
originated from the vision driven by the new platform and the engineers concerned with this
new tool. However, a more detailed approached needed to be established. Based on Nielsen’s
work (Jakob Nielsen, 1994) , seven keys concepts have been selected and have motivated UX
development throughout the project: Click minimization, user information, user freedom, error
management, minimalist design, documented help, and finally tool standardization across
modules.
Minimal number of clicks
The first observation that was made during the practical analysis of the workflow was that the
user was constantly solicited. In other words, the user was required to select, drag, drop, copy,
paste, and mostly click almost all the time throughout the process. As a consequence, the value
Figure 5.1 Visual representation of the gamification feature
88
added by a single click was very low. The new approach intends to increase the efficiency and
make every user action valuable. In that way, pre-configuration was determined to be the most
effective approach. As the model and calculation are pre-configured, the user does not need to
click on anything for basic configuration. However, in the event of a specific configuration,
any click the user may do, would add value to the process.
Reducing the number of clicks was made possible by focusing on 5 main components:
- task automation (i.e. processing);
- removing user input redundancy;
- simplifying and reducing the number of interfaces;
- pre-configure as much as possible basic tasks;
- remove external software necessity (i.e. spreadsheet).
An experiment was conducted to quantify the difference of clicks between the old and new
tools. This was done for two type of analysis: for a basic analysis of the SAS or for a new
model. The experiment was run with the same configuration as for the time experiment
explained in Chapter 3.
The results displayed in Table 5.1, demonstrate that the number of clicks in any scenario is
greatly reduced with the newly proposed method. Modifying the model only impacts the pre-
processing as only the model configuration is modified. The number of clicks for basic
calculations is 4.5 times higher with the older tool. It is only 4.04 times greater when a new
model is tested. It is not a flaw of performance of the new tool. Indeed, the old tool needs user
importation no matter the purpose of the calculations. For basic calculations, the model is
simply easier to configure. This is why more clicks are required for a new model with the old
tool. However, with the new tool, no user input is required for a basic model. Therefore, when
user inputs are required (i.e. when a new model is being tested), the number of clicks increases
significantly.
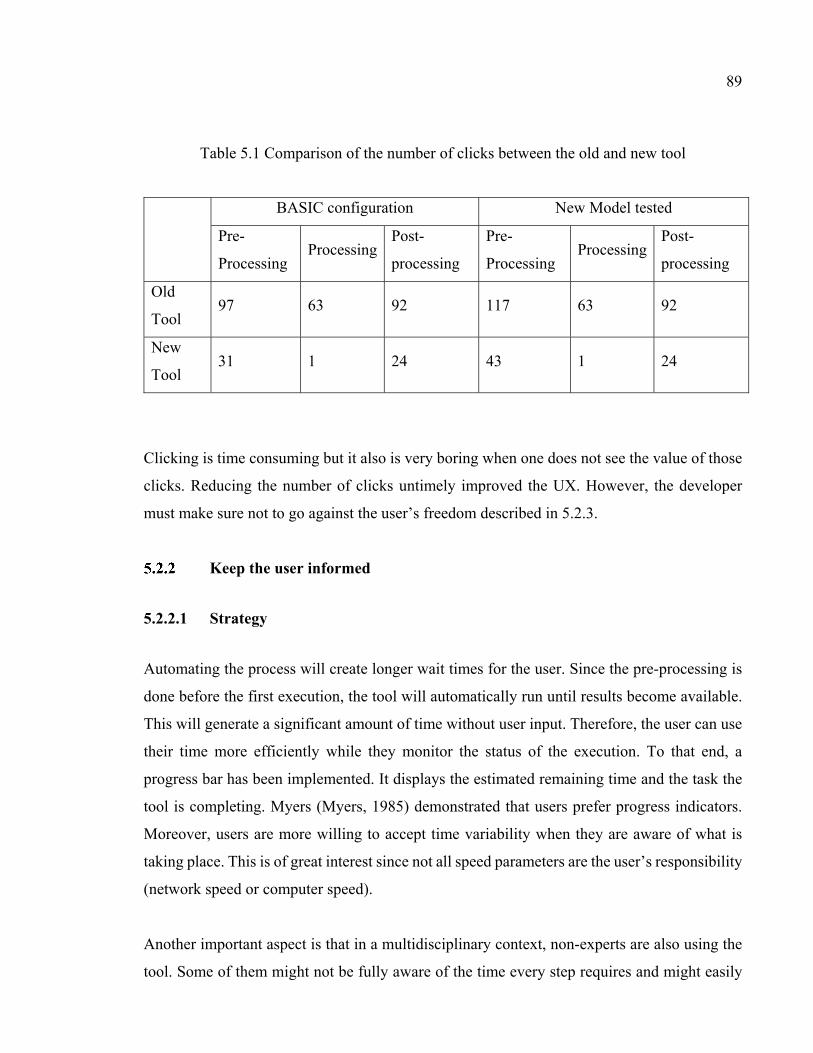
89
Table 5.1 Comparison of the number of clicks between the old and new tool
BASIC configuration New Model tested
Pre-
Processing Processing
Post-
processing
Pre-
Processing Processing
Post-
processing
Old
Tool 97 63 92 117 63 92
New
Tool 31 1 24 43 1 24
Clicking is time consuming but it also is very boring when one does not see the value of those
clicks. Reducing the number of clicks untimely improved the UX. However, the developer
must make sure not to go against the user’s freedom described in 5.2.3.
Keep the user informed
5.2.2.1 Strategy
Automating the process will create longer wait times for the user. Since the pre-processing is
done before the first execution, the tool will automatically run until results become available.
This will generate a significant amount of time without user input. Therefore, the user can use
their time more efficiently while they monitor the status of the execution. To that end, a
progress bar has been implemented. It displays the estimated remaining time and the task the
tool is completing. Myers (Myers, 1985) demonstrated that users prefer progress indicators.
Moreover, users are more willing to accept time variability when they are aware of what is
taking place. This is of great interest since not all speed parameters are the user’s responsibility
(network speed or computer speed).
Another important aspect is that in a multidisciplinary context, non-experts are also using the
tool. Some of them might not be fully aware of the time every step requires and might easily
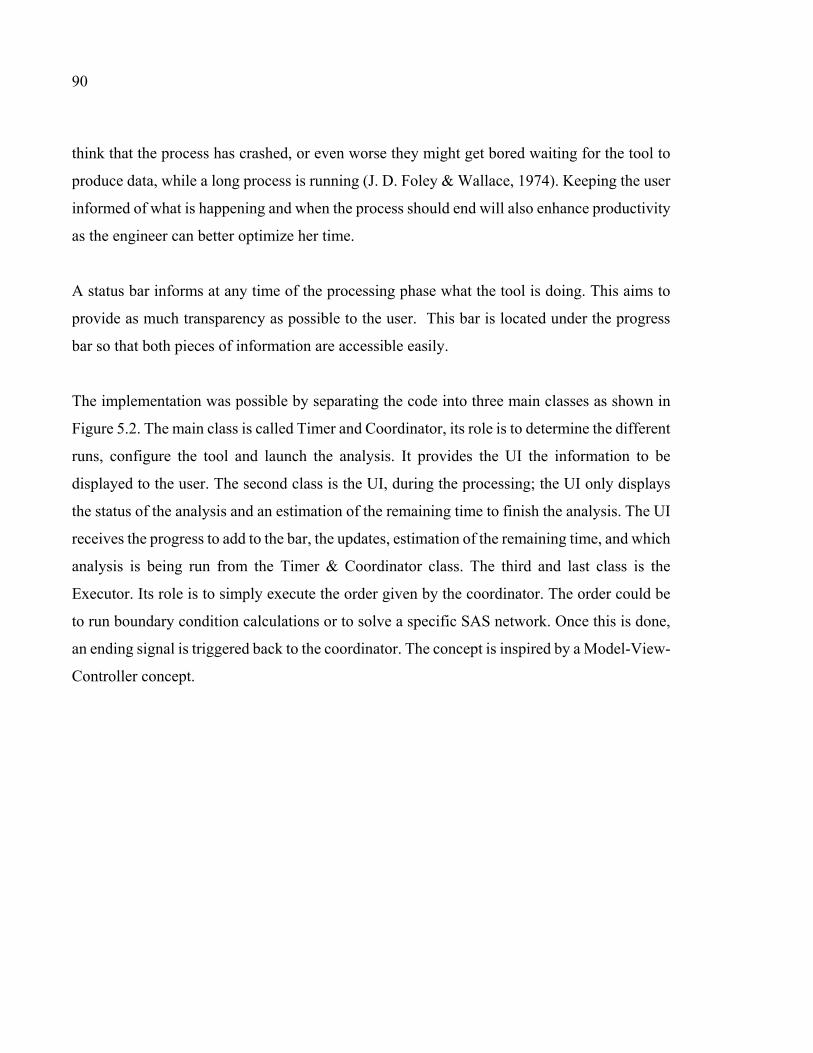
90
think that the process has crashed, or even worse they might get bored waiting for the tool to
produce data, while a long process is running (J. D. Foley & Wallace, 1974). Keeping the user
informed of what is happening and when the process should end will also enhance productivity
as the engineer can better optimize her time.
A status bar informs at any time of the processing phase what the tool is doing. This aims to
provide as much transparency as possible to the user. This bar is located under the progress
bar so that both pieces of information are accessible easily.
The implementation was possible by separating the code into three main classes as shown in
Figure 5.2. The main class is called Timer and Coordinator, its role is to determine the different
runs, configure the tool and launch the analysis. It provides the UI the information to be
displayed to the user. The second class is the UI, during the processing; the UI only displays
the status of the analysis and an estimation of the remaining time to finish the analysis. The UI
receives the progress to add to the bar, the updates, estimation of the remaining time, and which
analysis is being run from the Timer & Coordinator class. The third and last class is the
Executor. Its role is to simply execute the order given by the coordinator. The order could be
to run boundary condition calculations or to solve a specific SAS network. Once this is done,
an ending signal is triggered back to the coordinator. The concept is inspired by a Model-View-
Controller concept.
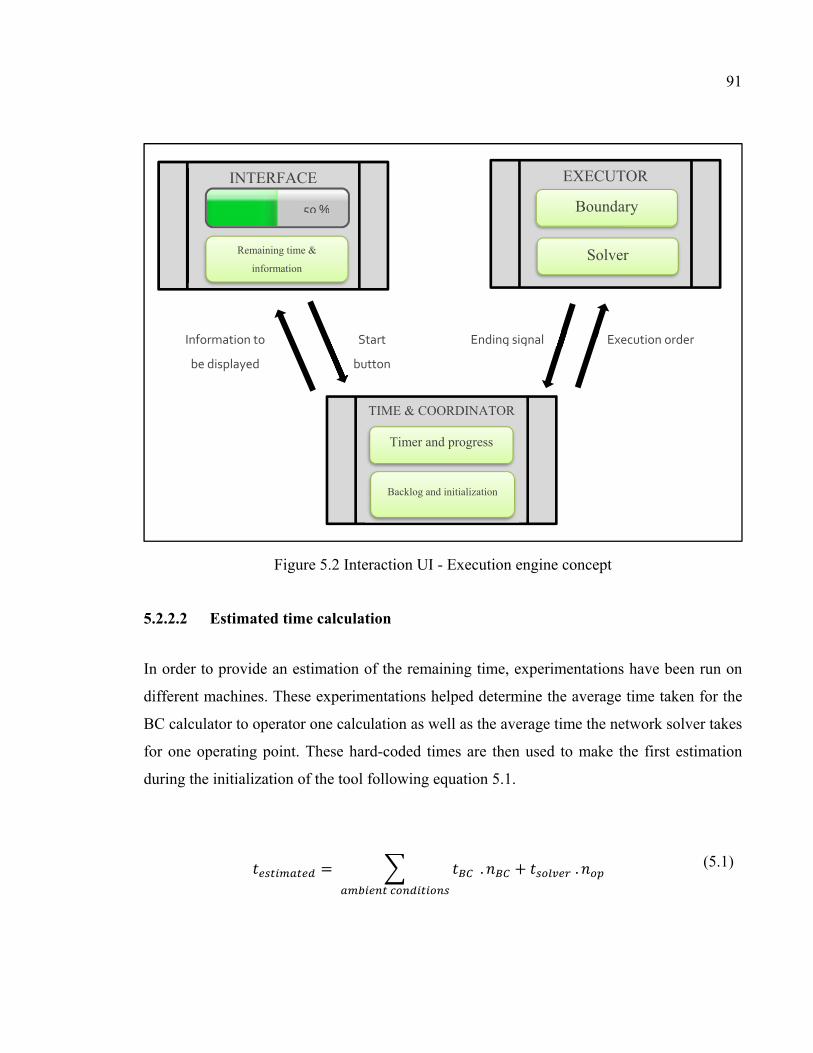
91
5.2.2.2 Estimated time calculation
In order to provide an estimation of the remaining time, experimentations have been run on
different machines. These experimentations helped determine the average time taken for the
BC calculator to operator one calculation as well as the average time the network solver takes
for one operating point. These hard-coded times are then used to make the first estimation
during the initialization of the tool following equation 5.1.
𝑡 = 𝑡 .𝑛 + 𝑡 .𝑛
(5.1)
INTERFACE EXECUTOR
TIME & COORDINATOR
Boundary
Solver Remaining time &
information
Timer and progress
Backlog and initialization
50 %
Execution order Ending signal Start
button
Information to
be displayed
Figure 5.2 Interaction UI - Execution engine concept
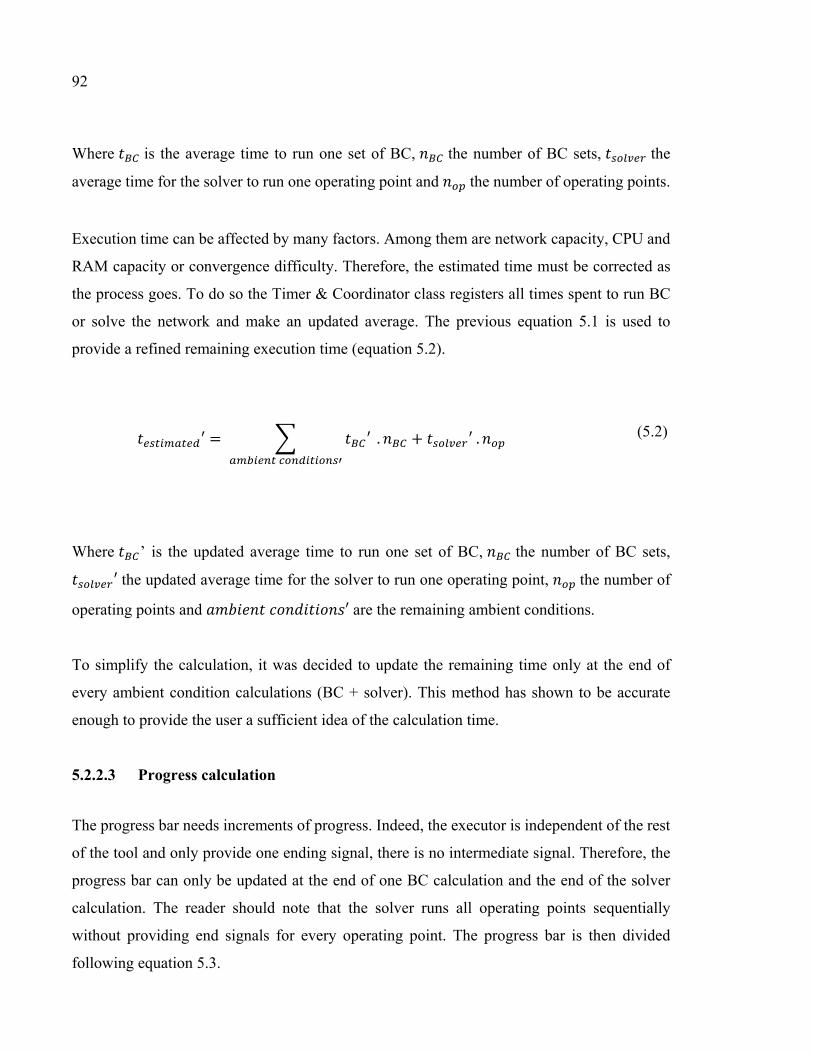
92
Where 𝑡 is the average time to run one set of BC, 𝑛 the number of BC sets, 𝑡 the
average time for the solver to run one operating point and 𝑛 the number of operating points.
Execution time can be affected by many factors. Among them are network capacity, CPU and
RAM capacity or convergence difficulty. Therefore, the estimated time must be corrected as
the process goes. To do so the Timer & Coordinator class registers all times spent to run BC
or solve the network and make an updated average. The previous equation 5.1 is used to
provide a refined remaining execution time (equation 5.2).
𝑡 ′ = 𝑡 ′ .𝑛 + 𝑡 ′ .𝑛
(5.2)
Where 𝑡 ’ is the updated average time to run one set of BC, 𝑛 the number of BC sets, 𝑡 ′ the updated average time for the solver to run one operating point, 𝑛 the number of
operating points and 𝑎𝑚𝑏𝑖𝑒𝑛𝑡 𝑐𝑜𝑛𝑑𝑖𝑡𝑖𝑜𝑛𝑠′ are the remaining ambient conditions.
To simplify the calculation, it was decided to update the remaining time only at the end of
every ambient condition calculations (BC + solver). This method has shown to be accurate
enough to provide the user a sufficient idea of the calculation time.
5.2.2.3 Progress calculation
The progress bar needs increments of progress. Indeed, the executor is independent of the rest
of the tool and only provide one ending signal, there is no intermediate signal. Therefore, the
progress bar can only be updated at the end of one BC calculation and the end of the solver
calculation. The reader should note that the solver runs all operating points sequentially
without providing end signals for every operating point. The progress bar is then divided
following equation 5.3.
93
𝑛 = 𝑛 + 𝑛
(5.3)
At the end of one BC calculation one division is added to the progress bar whereas at the end
of a solver calculation 𝑛 divisions are added to the progress bar.
This strategy is not optimal as it creates big “jumps” in the progress bar when 𝑛 divisions
are added at the end of the solver calculation. A new strategy is under development; the
division process would be dynamic constantly updated (following time estimation strategy)
and a new approach would enable progress bar updates during the solver execution.
However, as a temporary solution the current approach was relatively easy to implement and
provides an accurate visual status of the tool execution to the user. Positive comments were
received regarding this widget.
The user can start analysing output files as they are created. This improves efficiency of
primary analysis. Indeed, as it might be challenging to begin running a full analysis with partial
results, the user can start assessing whether the tool converged, and results are suitable for
further analysis.
Manage, Prevent, but with Freedom
Too often design automation results in the reduction of the user’s freedom as the tool can only
perform specific tasks. This can greatly reduce user acceptance as they can feel “trapped”.
Therefore, the SAS module is designed to leave as much freedom as possible to the user while
reducing possible errors. Instead of limiting the user’s liberty, the tool focuses on possible
errors and warns the users when their actions might lead to one.
94
The SAS and oil models are pre-selected based on metadata from the performance tool.
However, the user is free to modify them. It is the same for the boundary conditions equations
or additional graph files required to run the model. Because in most cases nothing will be
changed those modifications can be done in a separate tab that is easily accessible. This is not
made in the main tab of the UI as to not conflict with the next point: Minimalist Design.
Preventing errors is extremely challenging. It requires a very good understanding of the tool,
a certain experience and constant development to handle new exceptions. Discussions with
experts helped identifying the most common mistakes and errors. To address these comments
a manager was designed to handle these exceptions such as an input file checking/reformatting
and a unit checking tool. The latter analyzes which performance parameters are required for
the desired calculation and automatically formats them. This reduces errors due to poor
formatting later-on. For practical reasons some models do not use the same units (SI, Imperial
etc.), a tool was developed to automatically check the units and adapt the configuration
accordingly.
Minimalist Design
The proposed modules are developed respecting the same minimalist design pattern. No
irrelevant information is displayed to help an effective analysis process and keep the users
undistracted from unnecessary solicitations. However, every piece of information is still
available on request to respect User Freedom. It is important to maintain consistency between
the modules. This is addressed in section 5.2.6 – Standardized tools
Documented Help
It is strongly believed that any user should be able to understand how the tool works without
having to refer to any documentation. However, this is not realistic. Help menus are available
for the users at different levels and will help them to easily find the answer they are looking
for. Specifically, in addition to the help menu and tutorial section of the platform, every module
also has one which is accessible from the module’s UI. SAS’ menu has been designed during
95
development phases and thanks to users’ frequently asked questions. Therefore, the help menu
responds to users’ questions and not to questions developers may anticipate.
Tutorial sessions have been recorded. These are not scripted videos. It simply is a videotaped
training session. A real user is being trained as a developer explains the tool and answers
potential questions the trainee has. This method of recording tutorials has two major interesting
components, they are cheap and easy to edit. Secondly, they address the needs for users, answer
potential questions and solve potential issues that could results from a bad understanding of a
feature’s logics.
In order to fit the Tool Standardization section, all help menus within the design platform are
built around the same architecture.
Standardized tools
During the workflow analysis, it has been witnessed that all tools are widely different and do
not follow a strict pattern. For instance, a different logic is used to operate tool actions such
as starting the execution, importing data, saving results or gathering output files. This can be
confusing for new users that have to adapt to every tool and know their specificities. All this
reinforces the attachment of one user to a specific discipline mostly focused on one tool and as
a consequence reduces multidisciplinary activities.
All modules respect a specific logic of how to start, save, import inputs, and plot graphs. The
multidisciplinary advanced visualization tool allows the user to post-process the tools more
easily with the same logic across the platform. Even though some specificities might apply to
each tool, the core and architecture remains the same across the platform. This created a
consistent environment for all tools, enhanced the global understanding of the user, and
reduced the learning phase (J. Nielsen, 1989). There was a conscious effort to create something
as simple as possible as to not overwhelm the user with unnecessary information.

CHAPTER 6
MULTIDISCIPLINARY ANALYSIS: INTERACTIONS BETWEEN SAS AND PERFORMANCE
6.1 Concept
As Performance and SAS do not operate the same model, some inconsistencies between them
can appear. Every hardware or modelling modifications should result in a full model
convergence to ensure the most accurate results possible. This process being very demanding
on engineering time, cannot be done sufficiently often to reach the full desired convergence.
A performance tool (similar to the SAS tool), was developed and integrated within the D&A
platform. The performance solution creates output in a JSON format containing metadata. This
tool was used as a basis for the development of the interaction.
6.2 Feedback loop
Performance model
In order to calculate the data across the compressors and the turbines, the performance model
needs to estimate the amount of air that will be taken from the main path and brought to the
SAS; these fractions of the main flow are called bleeds. This can be done by solving the SAS
network with the solver or using a method similar to (A. Foley, 2001). The most precise and
rigorous method would be to solve the SAS network, but this long iterative process does not
procure enough accuracy gain to be performed when minor changes occur in the SAS network.
An example of the interaction between the performance model and the SAS network model is
represented in Figure 6.1.
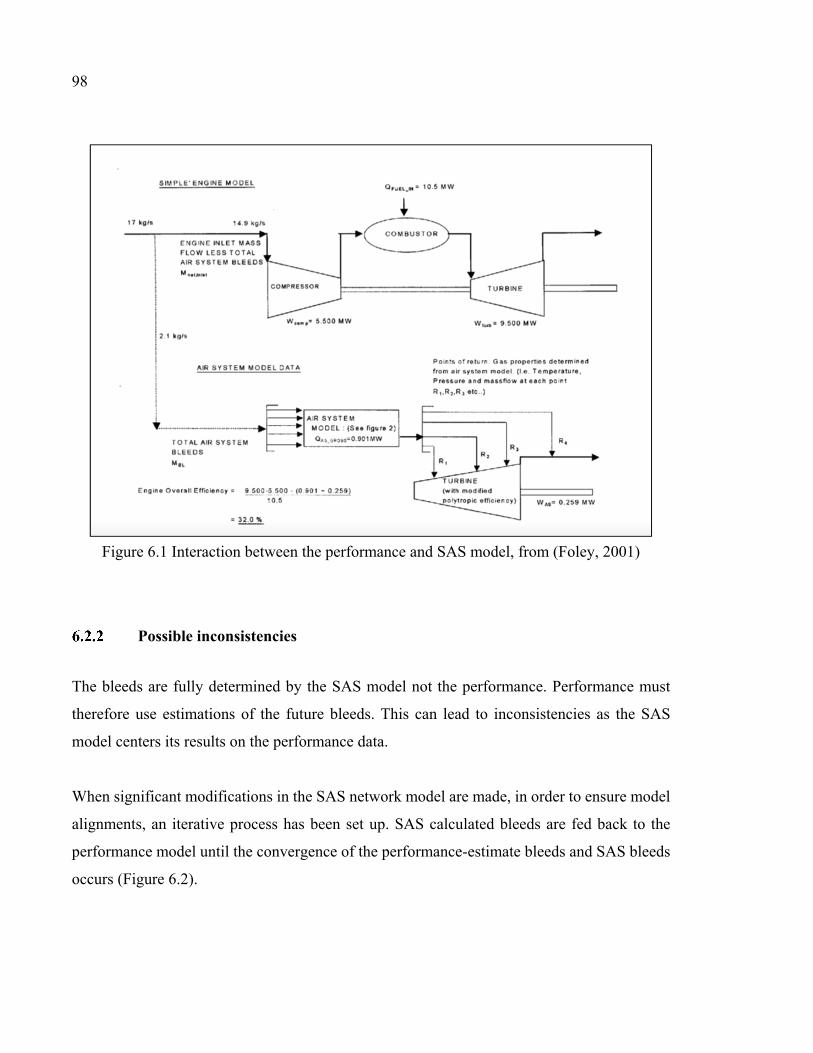
98
Possible inconsistencies
The bleeds are fully determined by the SAS model not the performance. Performance must
therefore use estimations of the future bleeds. This can lead to inconsistencies as the SAS
model centers its results on the performance data.
When significant modifications in the SAS network model are made, in order to ensure model
alignments, an iterative process has been set up. SAS calculated bleeds are fed back to the
performance model until the convergence of the performance-estimate bleeds and SAS bleeds
occurs (Figure 6.2).
Figure 6.1 Interaction between the performance and SAS model, from (Foley, 2001)
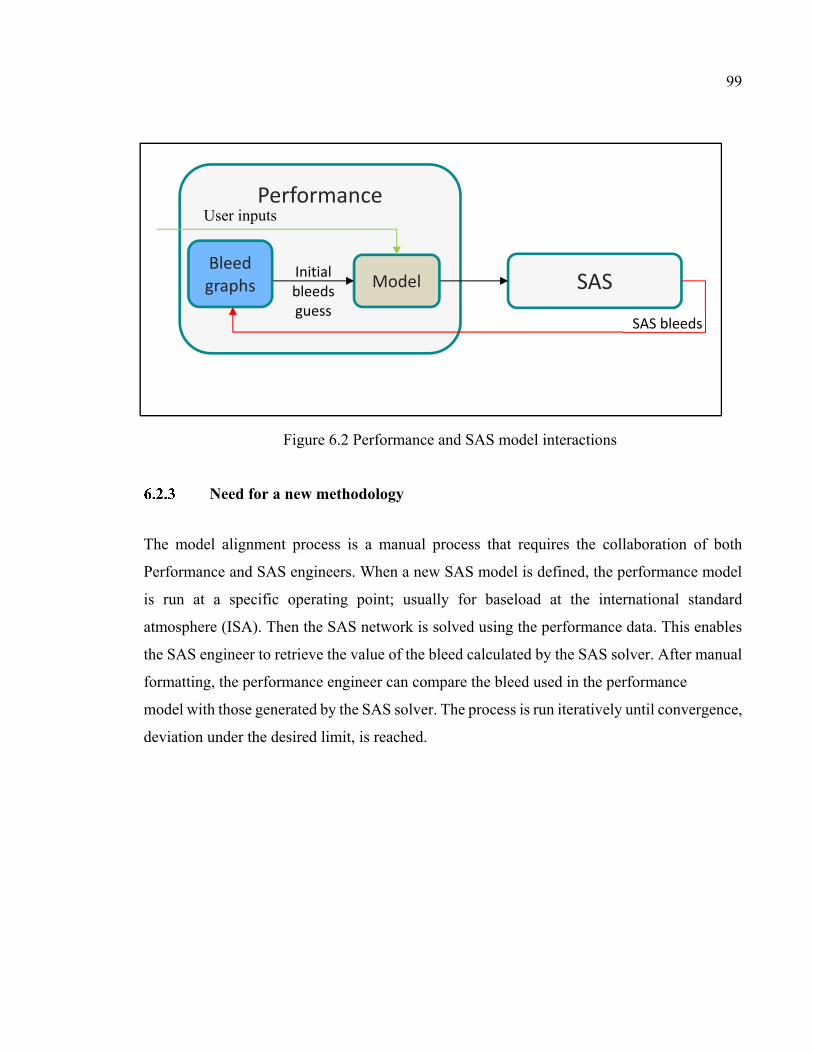
99
Need for a new methodology
The model alignment process is a manual process that requires the collaboration of both
Performance and SAS engineers. When a new SAS model is defined, the performance model
is run at a specific operating point; usually for baseload at the international standard
atmosphere (ISA). Then the SAS network is solved using the performance data. This enables
the SAS engineer to retrieve the value of the bleed calculated by the SAS solver. After manual
formatting, the performance engineer can compare the bleed used in the performance
model with those generated by the SAS solver. The process is run iteratively until convergence,
deviation under the desired limit, is reached.
Performance
SAS
SAS bleeds
Bleed graphs Model Initial
bleeds guess
User inputs
Figure 6.2 Performance and SAS model interactions
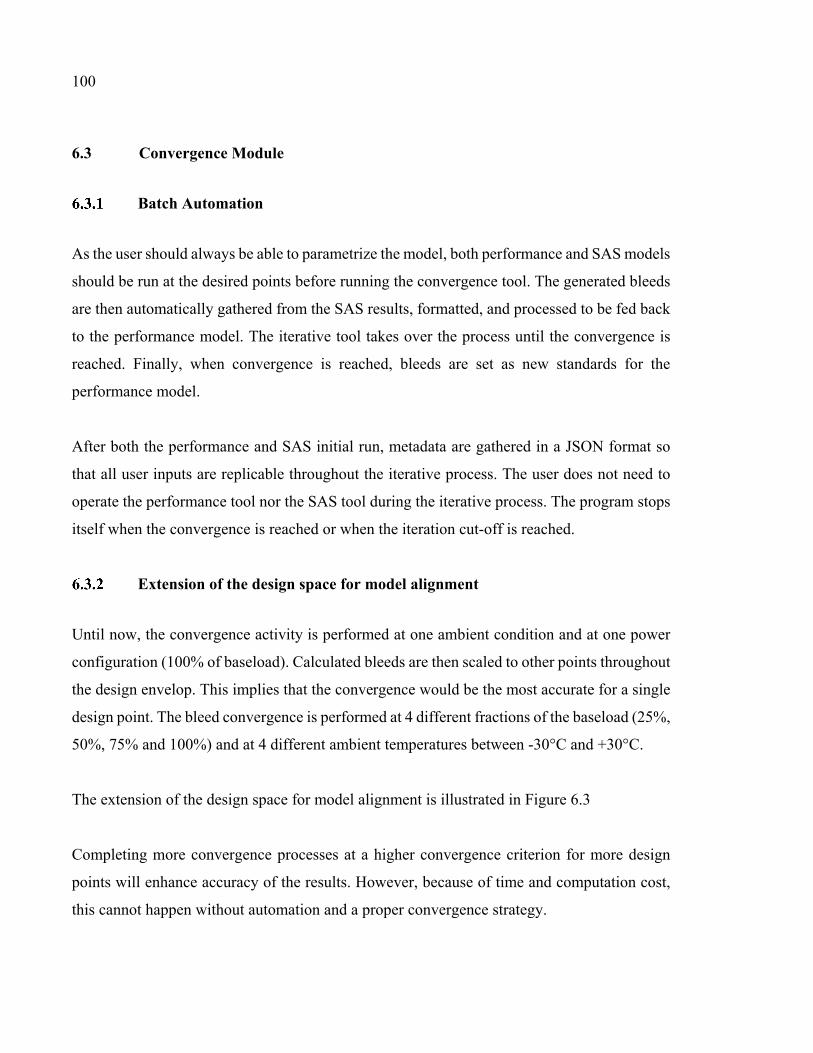
100
6.3 Convergence Module
Batch Automation
As the user should always be able to parametrize the model, both performance and SAS models
should be run at the desired points before running the convergence tool. The generated bleeds
are then automatically gathered from the SAS results, formatted, and processed to be fed back
to the performance model. The iterative tool takes over the process until the convergence is
reached. Finally, when convergence is reached, bleeds are set as new standards for the
performance model.
After both the performance and SAS initial run, metadata are gathered in a JSON format so
that all user inputs are replicable throughout the iterative process. The user does not need to
operate the performance tool nor the SAS tool during the iterative process. The program stops
itself when the convergence is reached or when the iteration cut-off is reached.
Extension of the design space for model alignment
Until now, the convergence activity is performed at one ambient condition and at one power
configuration (100% of baseload). Calculated bleeds are then scaled to other points throughout
the design envelop. This implies that the convergence would be the most accurate for a single
design point. The bleed convergence is performed at 4 different fractions of the baseload (25%,
50%, 75% and 100%) and at 4 different ambient temperatures between -30°C and +30°C.
The extension of the design space for model alignment is illustrated in Figure 6.3
Completing more convergence processes at a higher convergence criterion for more design
points will enhance accuracy of the results. However, because of time and computation cost,
this cannot happen without automation and a proper convergence strategy.
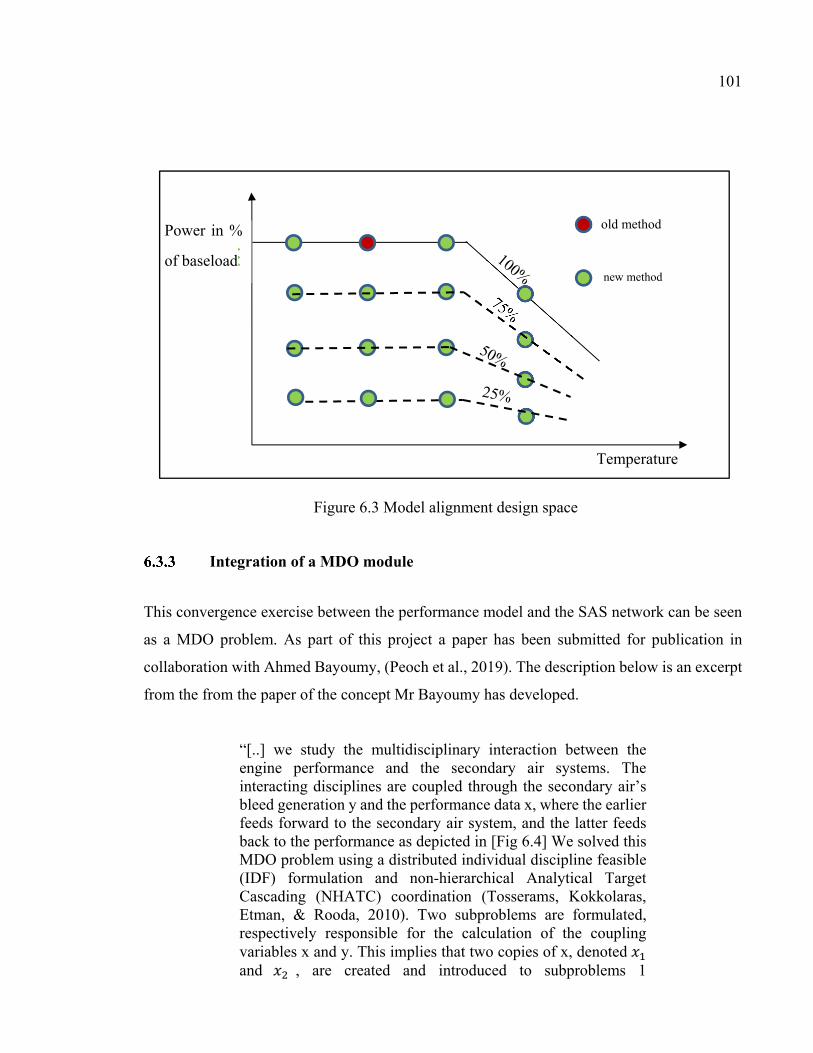
101
Integration of a MDO module
This convergence exercise between the performance model and the SAS network can be seen
as a MDO problem. As part of this project a paper has been submitted for publication in
collaboration with Ahmed Bayoumy, (Peoch et al., 2019). The description below is an excerpt
from the from the paper of the concept Mr Bayoumy has developed.
“[..] we study the multidisciplinary interaction between the engine performance and the secondary air systems. The interacting disciplines are coupled through the secondary air’s bleed generation y and the performance data x, where the earlier feeds forward to the secondary air system, and the latter feeds back to the performance as depicted in [Fig 6.4] We solved this MDO problem using a distributed individual discipline feasible (IDF) formulation and non-hierarchical Analytical Target Cascading (NHATC) coordination (Tosserams, Kokkolaras, Etman, & Rooda, 2010). Two subproblems are formulated, respectively responsible for the calculation of the coupling variables x and y. This implies that two copies of x, denoted 𝑥 and 𝑥 , are created and introduced to subproblems 1
Figure 6.3 Model alignment design space
Power in %
of baseload
Temperature
old method
new method
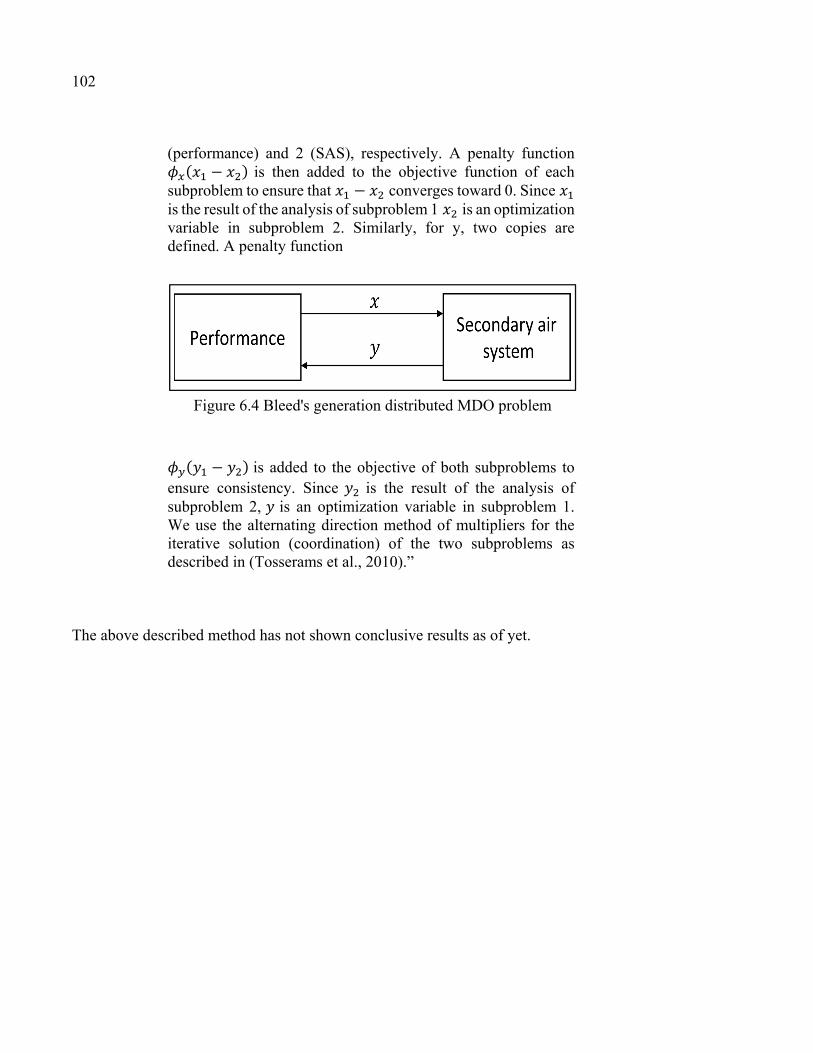
102
(performance) and 2 (SAS), respectively. A penalty function 𝜙 𝑥 𝑥 is then added to the objective function of each subproblem to ensure that 𝑥 𝑥 converges toward 0. Since 𝑥 is the result of the analysis of subproblem 1 𝑥 is an optimization variable in subproblem 2. Similarly, for y, two copies are defined. A penalty function
𝜙 𝑦 𝑦 is added to the objective of both subproblems to ensure consistency. Since 𝑦 is the result of the analysis of subproblem 2, 𝑦 is an optimization variable in subproblem 1. We use the alternating direction method of multipliers for the iterative solution (coordination) of the two subproblems as described in (Tosserams et al., 2010).”
The above described method has not shown conclusive results as of yet.
Figure 6.4 Bleed's generation distributed MDO problem
CONCLUSION
The above described tool has shown great potential, as it proved to be faster than the original
workflow, it led to the design cycle being ultimately shortened, and allows for more design
iterations to occur. This inevitably enhances accuracy of the results and leads to improved
products. The SAS workflow was proven to be at least 2 times faster for an elementary
calculation and up to 35 times faster for 100 calculations.
The tool has the potential to be even faster as parallel computing is under development. This
is likely to happen quickly as work is in progress to use the Docker and Swarm concept.
The tool is adapted for MDO purposes and the first test has been run for a convergence module
between the SAS network model and the performance model thanks to batch execution. No
conclusive results have been generated yet, but it is expected to be performant within a short
period of time as the MDO configuration is soon to be operational.
Additionally, an element of this project that shows great promise is the consideration of UX
concepts. However, further development of user-satisfaction elements remains to be done. The
potential of a collaboration with UX/UI experts to assess the proposed tool with clear and
defined metrics is a goal of great personal interest.
Additional UX and errors experiments should be completed when the tool will be operated on
a regular basis by all users, and further collaboration with other disciplines such as aerothermal
and the whole engine thermo-mechanics should be developed to improve the multidisciplinary
collaboration. New MDO modules should be developed grouping these disciplines together
toward a unique design optimization.
The development management should seek for continuous improvement of the roadmap
defined for the SAS and the developers shall always keep improving and evolving the tool as
new ideas and technologies become available. This is in respect of the Agile development
philosophy.

104
Finally, the proposed tool respects all constraints set at the beginning of the study. The tool
was successfully integrated into the existing framework. The proposed script allows any user
to user their personal laptop. An MDO process was implemented and is being tested, proving
the ability of this updated tool to be used in an MDO context. Lastly, the solver was not
changed in order to fit the project requirements.
The method for engineering workflow automation that was developed and applied in
completion of this project showed to be effective. By placing engineers in the center of the
process the new tool was successful at reflecting and addressing their specific needs and
provided a means to implement personalization. This philosophy of prioritizing the user
experience, in addition to developing an efficient tool, is one that is under represented in the
field of engineering. Our positive preliminary findings encourage the implementation of such
philosophies in additional disciplines of engineering, but could be expanded to multiple fields
of research if the proper assessment of the workflow is done preemptively. Such a method
enhances change management as the user is involved in the design process, thus improving
overall quality of work.
Therefore, in conclusion, we feel very strongly that this improved tool, and the methods used
to create it, is of great value to the engineers at SIEMENS Canada. It is our hope that other
developers will also improve their existing workflows to serve a greater function today, all
while keeping in mind the needs of the users, such that any changes will be accepted easily
into the workplace.
FUTURE DIRECTIONS
This project successfully initiated the integration of a SAS tool in a multidisciplinary platform
for AGT. The SAS tool is operational and valuable results are being used for engineering
purposes. The following recommendations for future directions of this project are: subsequent
validations, additional discipline integration, computational improvement, and MDO
development.
The SAS tool has been validated; however, further validations can still be performed. For
instance, one could quantify the engineering and economic impact in the long-term. This would
confirm that the tool is being properly used for its intended purpose and is assisting with the
faster completion of projects. It would also reveal flaws and provide a new roadmap for the
platform’s continuous development.
The SAS tool will not be fully operational until most of the AGT design disciplines are
integrated into the multidisciplinary design platform. Should this done, it will enable an
improved collaboration between the tools, enhanced engineering efficiency, and a reduced
overall design time.
To minimize the computation time two approaches could be developed; a docker container
and/or artificial intelligence. The former would allow for parallelization and would enable the
SAS tool to remotely connect to a fleet of computers and servers to run a portion of the
calculations in the background which reduces computational time. The latter would analyze a
variety of SAS results which would train a model to quickly generate novel results without
needing to run the actual tool. This solution would be useful for pre-detailed design.
Artificial intelligence could also be implicated into the post-processing and could help the user
compare their results with previous results that are known to be correct. Artificial intelligence

106
and especially machine learning could be of great help to fasten primary calculations as an
estimation of the results can easily be given thanks to a trained model.
Lastly, further development of the MDO modules could be achieved once the majority of
disciplines are automated and integrated into the platform. However, it must be kept in mind
that, the initial Performance-SAS module would have to be validated before proceeding with
additional development.
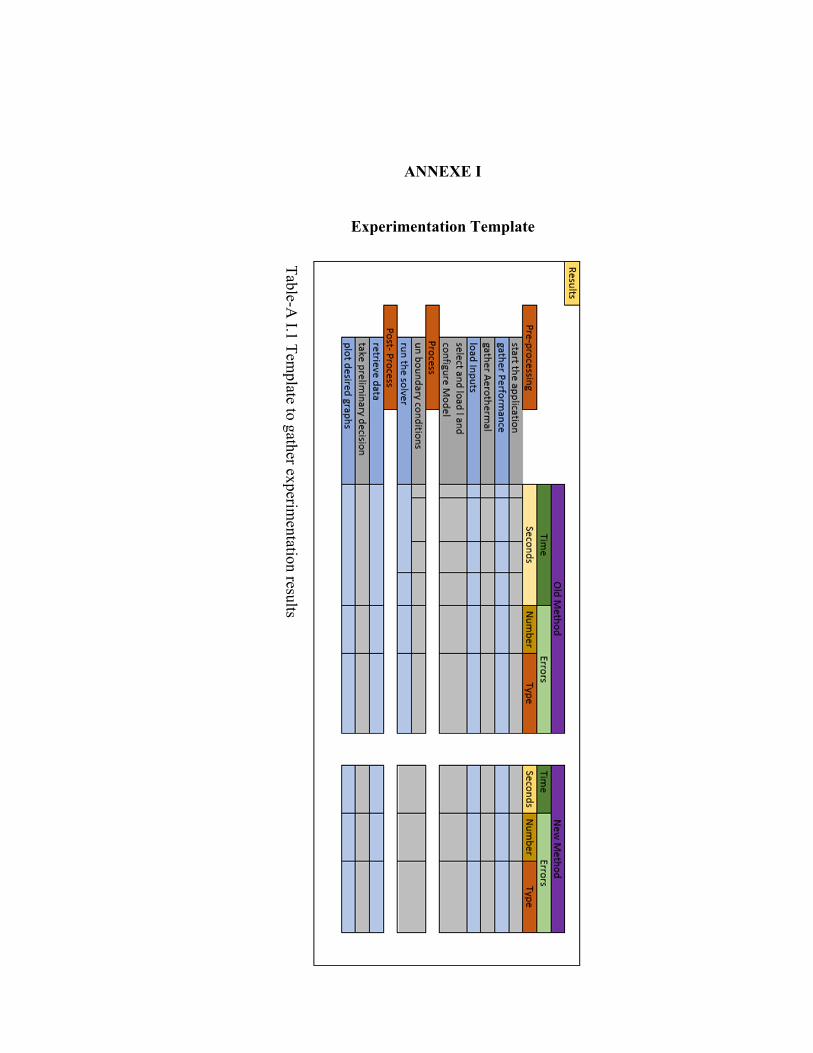
ANNEXE I
Experimentation Template
Table-A I.1 Tem
plate to gather experimentation results

BIBLIOGRAPHY
Atlassian. (2002). JIRA. doi: https://www.atlassian.com/software/jira. Repéré à https://www.atlassian.com/software/jira
Baheta, A. T., & Gilani, S. I.-U.-H. (2012). The effect of ambient temperature on a gas turbine
performance in part load operation. AIP Conference Proceedings, 1440(1), 889-893. doi: 10.1063/1.4704300. Repéré à https://aip.scitation.org/doi/abs/10.1063/1.4704300
Beck, K., Beedle, M., van Bennekum, A., Cockburn, A., Cunningham, W., Fowler, M., . . .
Thomas, D. (2001). Manifesto for Agile Software Development Manifesto for Agile Software Development.
Boehm, B., & Turner, R. (2005). Management challenges to implementing agile processes in
traditional development organizations. IEEE Software, 22(5), 30-39. Braga, M. (2018). Tesla is a cautionary tale of too much automation, too soon. Repéré à
https://www.cbc.ca/news/technology/tesla-model-3-sedan-automation-robots-manufacturing-delay-1.4734829
Bray, R. M., Kerr, N. L., & Atkin, R. S. (1978). Effects of group size, problem difficulty, and
sex on group performance and member reactions. Journal of Personality and Social Psychology, 36(11), 1224-1240. doi: 10.1037/0022-3514.36.11.1224
Cartile, A., Marsden, C., & Liscouet-Hanke, S. (2019). Product Lifecycle Management
software tools in small-to-medium aerospace entreprises: Help or hindrance? Dans CASI AERO19. Repéré à https://openconf.s3.amazonaws.com/AERO2019/papers/20.pdf?AWSAccessKeyId=1S4TZ7FHYC2HTER44JG2&Signature=mfRNZ7w0nu7CAgFVogJc9IMKRK8%3D&Expires=1562416175
Clausing, J. R. H. (1998). The House of Quality. Repéré le 24-06-2019 à
https://hbr.org/1988/05/the-house-of-quality Davis, N. (2016). What is the fourth industrial revolution? World Economic Forum. Repéré à
https://www.weforum.org/agenda/2016/01/what-is-the-fourth-industrial-revolution/ Deloitte. (2015). The future of the global power sector Preparing for emerging opportunities
and threats gx-power-future-global-power-sector-report. Repéré à https://www2.deloitte.com/content/dam/Deloitte/global/Documents/Energy-and-Resources/gx-power-future-global-power-sector-report.pdf
Deterding, S., Khaled, R., Nacke, L., & Dixon, D. (2011). Gamification: Toward a definition.
12-15.
110
Deterding, S., Sicart, M., Nacke, L., O’Hara, K., & Dixon, D. (2011). Gamification: Using
game design elements in non-gaming contexts. Proceedings of the 2011 Annual Conference Extended Abstracts on Human Factors in Computing Systems, 66, 2425-2428. doi: 10.1145/1979742.1979575
Docker.Inc. (2013). Docker Inc. Repéré à https://www.docker.com/ Ebert, C. (2013). Improving engineering efficiency with PLM/ALM. Software & Systems
Modeling, 12(3), 443-449. doi: 10.1007/s10270-013-0347-3. Repéré à https://doi.org/10.1007/s10270-013-0347-3
Foley, A. (2001). On the Performance of Gas Turbine Secondary Air Systems. (78521),
V003T001A073. doi: 10.1115/2001-GT-0199. Repéré à http://dx.doi.org/10.1115/2001-GT-0199
Foley, J. D., & Wallace, V. L. (1974). The art of natural graphic man-machine conversation.
Dans COMG. Georgakopoulos, D., Hornick, M., & Sheth, A. (1995). An overview of workflow management:
From process modeling to workflow automation infrastructure. Distributed and parallel Databases, 3(2), 119-153.
Gray, J., Moore, K. T., Hearn, T. A., & Naylor, B. A. (2013). Standard platform for
benchmarking multidisciplinary design analysis and optimization architectures. AIAA journal, 51(10), 2380-2394.
Hermann, M., Pentek, T., & Otto, B. (2016). Design principles for industrie 4.0 scenarios. Dans
2016 49th Hawaii international conference on system sciences (HICSS) (pp. 3928-3937). IEEE.
IDEF. (1993). Integrated DEFinition Methods - IDEF0 Function modelling method. Repéré à
http://www.idef.com/idefo-function_modeling_method/ Kagermann, H., Wahlster, W., & Helbig, J. (2013). Recommendations for implementing the
strategic initiative Industrie 4.0: Final report of the Industrie 4.0 Working Group. Forschungsunion: Berlin, Germany.
Lufthansa. (1999). Lufthansa Technical Training - Training Manual A319 / A320 / A321.
Repéré à https://www.metabunk.org/attachments/docslide-us_a-320-engine-pdf.16733/
McManus, H. H., Al; Murman, Earll. (2005). Lean Engineering: Doing the Right Thing Right.
Dans 1st International Conference on Innovation and Integration in Aerospace
111
Sciences. Repéré à https://pdfs.semanticscholar.org/5a1e/0587f32e5deaf8658b2db850423e9b5ec378.pdf
Mendel, A. F. (2011). Why Care About PLM? Mechanical Engineering Magazine Select
Articles, 133(03), 42-43. doi: 10.1115/1.2011-MAR-5. Repéré à http://dx.doi.org/10.1115/1.2011-MAR-5
Myers, B. A. (1985). The importance of percent-done progress indicators for computer-human
interfaces. SIGCHI Bull., 16(4), 11-17. doi: 10.1145/1165385.317459 Nielsen, J. (1989). Coordinating user interfaces for consistency. SIGCHI Bull., 20(3), 63-65.
doi: 10.1145/67900.67910 Nielsen, J. (1994). 10 Usability Heuristics for User Interface Design. Repéré à
https://www.nngroup.com/articles/ten-usability-heuristics/ Obrist, M., Roto, V., V, K., #228, #228, #228, & nen-Vainio-Mattila. (2009). User experience
evaluation: do you know which method to use? présentée à CHI '09 Extended Abstracts on Human Factors in Computing Systems, Boston, MA, USA. doi: 10.1145/1520340.1520401
Oreg, S. (2003). Resistance to change: Developing an individual differences measure. Journal
of applied psychology, 88(4), 680. Ouellet, Y., Garnier, F., Roy, F., & Moustapha, H. (2014). A Preliminary Design System for
Turbine Discs présentée à ASME Turbo Expo 2014: Turbine Technical Conference and Exposition. doi: 10.1115/GT2014-26167. Repéré à http://dx.doi.org/10.1115/GT2014-26167
Peoch, T., Bayoumy, A., Staniszewski, M., Moustapha, H., Kokkolaras, M., & Garnier, F.
(2019). Integration of Secondary Air System for Multidisciplinary Design Optimization of Gas Turbines. Dans submitted for review: CASI AERO 19. CASI.
Philip P. Walsh, P. F. (2004). Gas Turbine Performance - Second Edition (Technology &
Engineering éd.). Pilarski, S., Staniszewski, M., Villeneuve, F., & Varo, D. (2019). Towards Using Artificial
Intelligence for Simulation and Design Space Exploration in Aeroderivative Gas Turbine Design présentée à MODELS, submitted for review, Munich Germany.
Proctor, D. (2018). Efficiency Improvements Mark Advances in Gas Turbines. powermag. Ramamurthy, A., Valenzuela-del-Rio, J., Villeneuve, F., & Veer, J. (2014). DEVELOPMENT
OF A SysML FRAMEWORK FOR GAS TURBINE DESIGN UNDER UNCERTAINTY. Dans Global Power and Propulsion Forum (Vol. 1). Repéré à
112
https://www.gpps.global/documents/events/zurich17/papers/general/GPPF_2017_paper_159.pdf
Rising, L., & Janoff, N. S. (2000). The Scrum software development process for small teams.
IEEE Software, 17(4), 26-32. doi: 10.1109/52.854065 Rolls-Royce. (1986). The jet Engine 5th Edition. Dans (pp. p80-93). Shore, J. (2007). The Art of Agile Development: Pragmatic guide to agile software
development. " O'Reilly Media, Inc.". Sirkin, H. L., Keenan, P., & Jackson, A. (2005). The hard side of change management. Harvard
Business Review, 83(10), 108-118. Smith, A. L. a. B., N.S. (2005). A Driving Need for Design Automation within Aerospace
Engineering. Dans 11th Australian International Aerospace Congress. Repéré à https://pdfs.semanticscholar.org/ede7/c081e675eeb1a9090d177c9b91ab823d55de.pdf
Sobieszczanski-Sobieski, J. (1995). Multidisciplinary design optimization: an emerging new
engineering discipline. Dans Advances in Structural Optimization (pp. 483-496). Springer.
Sobieszczanski-Sobieski, J., & Haftka, R. Multidisciplinary aerospace design optimization -
Survey of recent developments. Dans 34th Aerospace Sciences Meeting and Exhibit. doi: 10.2514/6.1996-711. Repéré à https://arc.aiaa.org/doi/abs/10.2514/6.1996-711
Stuart, K. (2014). Flappy Bird is dead - but brilliant mechanics made it fly. The Guardian, Mon
10 Feb 2014. Repéré à https://www.theguardian.com/technology/2014/feb/10/flappy-bird-is-dead-but-brilliant-mechanics-made-it-fly
T.Bowman, C. (1992). Control of combustion-generated nitrogen oxide emissions:
Technology driven by regulation. Symposium (International) on Combustion, 24(1), 859 - 878. doi: https://doi.org/10.1016/S0082-0784(06)80104-9. Repéré à http://www.sciencedirect.com/science/article/pii/S0082078406801049
Tarkian, M. (2012). Design Automation for Multidisciplinary Optimization: A High Level CAD
Template Approach (inköping University, Linköping University Electronic Press). Repéré à http://liu.diva-portal.org/smash/record.jsf?pid=diva2%3A556208&dswid=-581
Tosserams, S., Kokkolaras, M., Etman, L. F. P., & Rooda, J. E. (2010). A Nonhierarchical
Formulation of Analytical Target Cascading. Journal of Mechanical Design, 132(5), 051002-051002-051013. doi: 10.1115/1.4001346. Repéré à http://dx.doi.org/10.1115/1.4001346

113
Zhou, K., Wood, S. N., & Owen, J. M. (2013). Statistical and theoretical models of ingestion through turbine rim seals. Journal of Turbomachinery, 135(2), 021014.

Related Documents


