Automating The Selection of a Simulation Warm-up Period Stewart Robinson, Katy Hoad, Ruth Davies Warwick Business School Cardiff University - October 2008 The AutoSimOA Project A 3 year, EPSRC funded project in collaboration with SIMUL8 Corporation. http://www.wbs.ac.uk/go/autosimoa

Automating The Selection of a Simulation Warm-up Period Stewart Robinson, Katy Hoad, Ruth Davies Warwick Business School Cardiff University - October 2008.
Dec 22, 2015
Welcome message from author
This document is posted to help you gain knowledge. Please leave a comment to let me know what you think about it! Share it to your friends and learn new things together.
Transcript

Automating The Selection of a Simulation Warm-up Period
Stewart Robinson, Katy Hoad, Ruth DaviesWarwick Business School
Cardiff University - October 2008
The AutoSimOA Project
A 3 year, EPSRC funded project in collaboration with SIMUL8 Corporation.
http://www.wbs.ac.uk/go/autosimoa

Research Aim
• To create an automated system for advising a non-expert user on how to obtain accurate measures of model performance
• i.e. warm-up, run-length and number of replications
• For implementation into simulation software
AutoSimOA = Automated SIMulation Output Analysis

Simulationmodel
Warm-upanalysis
Run-lengthanalysis
Replicationsanalysis
Use replicationsor long-run?
Recommendationpossible?
Recommend-ation
Output data
AnalyserO
btai
n m
ore
outp
ut d
ata
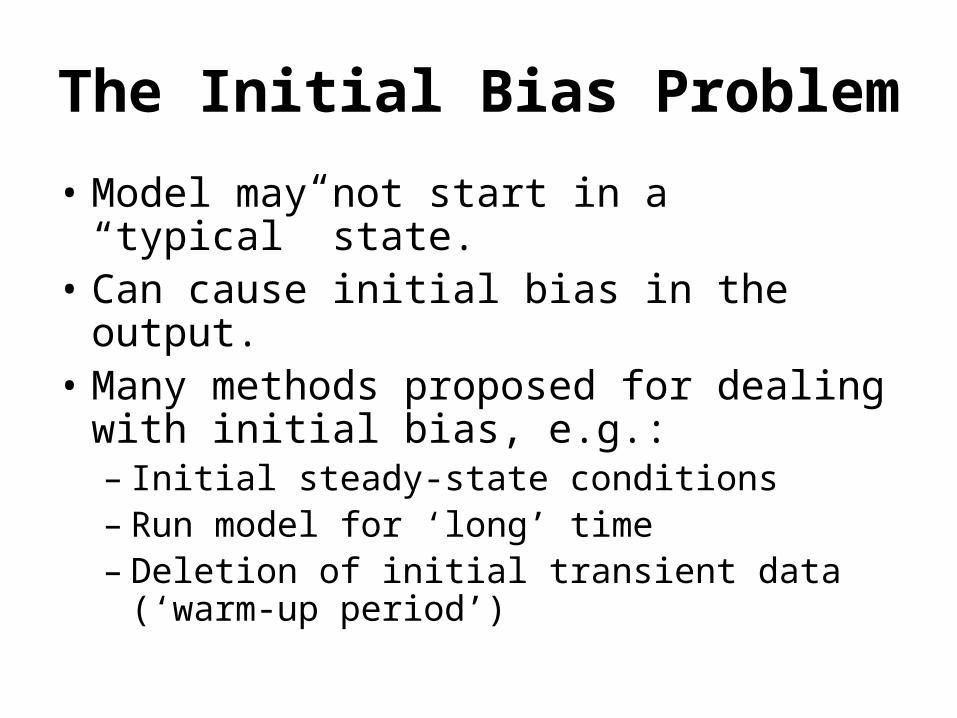
The Initial Bias Problem
• Model may not start in a “typical” state.• Can cause initial bias in the output.• Many methods proposed for dealing with
initial bias, e.g.: – Initial steady-state conditions– Run model for ‘long’ time– Deletion of initial transient data (‘warm-up
period’)

The Initial Bias Problem
0
20
40
60
80
100
120
140
1 2 3 4 5 6 7 8 9 10 11 12 13 14 15 16 17 18 19 20 21 22 23 24 25 26 27 28 29 30
Day
Dai
ly t
hrou
ghpu
t
Initial transient Steady-state
f (steady-state)
Steady-statemean

This project uses: Deletion of the initial transient data by specifying a warm-
up period (or truncation point).
The question is:
How do you estimate the length of the warm-up period required?

Methods fall into 5 main types :
1. Graphical Methods.
2. Heuristic Approaches.
3. Statistical Methods.
4. Initialisation Bias Tests.
5. Hybrid Methods.

Literature search – 44 methods
Summary of methods and
literature references on project
web site:
http://www.wbs.ac.uk/go/autosimoa

Short-listing warm-up methods for automation using literature
Short-listing Criteria
» Accuracy & robustness
» Ease of automation
» Generality
» Computer running time

Short-listing results: reasons for rejection of methods
64
3
3
52
2
1
1
0
2
4
6
8
10
12
Graphical Statistical Heuristic
Warm-up method type
Nu
mb
er
of m
eth
od
s
Ease of Automation Accuracy
Generality Excessive running time
Other

• Statistical methods:– Goodness of Fit (GoF) test– Algorithm for a static data set (ASD)– Algorithm for a Dynamic data set (ADD)
• Heuristics:– MSER-5– Kimbler’s Double Exponential Smoothing– Euclidean Distance Method (ED)
Short-listing results: 6 Methods taken forward to testing

Preliminary testing of shortlisted methods
• Rejected methods:– ASD & ADD required a prohibitively large
number of replications– GoF & Kimbler’s method consistently and
severely underestimated truncation point.– ED failed to give any result on majority of
occasions
• MSER-5 most accurate and robust method

MSER-5 warm-up method
0
0.002
0.004
0.006
0.008
0.01
0.012
0.014
0.016
0.018
0.02
0 50 100 150 200 250 300 350 400
Truncation Point
Test
Sta
tistic
0
1
2
3
4
5
6
Batc
h M
eans
MSER-5 test statistic
Output data (batched means values)
Rejection zone
Estimated warm-up period
Estimated truncation point

Further Testing of MSER-5
1. Artificial data – controllable & comparable initial bias functions steady state functions
2. Full factorial design.
3. Set of performance criteria.

Parameters Levels
Data Type Single run
Data averaged over 5 reps
Error type N(1,1), Exp(1)
Auto-correlation
None, AR(1), AR(2), MA(2), AR(4), ARMA(5,5)
Bias Severity 1, 2, 4
Bias Length 0%, 10%, 40%, 100%
Bias direction Positive, Negative
Bias shape 7 shapes
Artificial Data Parameters

• Mean Shift:
• Linear:
• Quadratic:
• Exponential:
• Oscillating (decreasing):
Quadratic ExponentialLinear

Add Initial Bias to Steady state:
Superpostion: Bias Fn, a(t), added onto end of steady state function:
e.g.
2. Full factorial design: 3048 types of artificial data set
MSER-5 run with each type 100 times
...
)(1
etc
taXY
XX
tt
ttt

i. Coverage of true mean.
ii. Closeness of estimated truncation point (Lsol) to true truncation point (L).
iii. Percentage bias removed by truncation.
iv. Analysis of the pattern & frequency of rejections of Lsol (i.e. Lsol > n/2).
3. Performance Criteria

MSER-5 Results
Does the true mean fall into the 95% CI for the estimated mean?
Non-truncated data sets
Truncated data sets
% of cases
yes yes 7.7%
yes no 0%
no no 19.8%
no yes 72.5%
i. Coverage of true mean.

-70
-50
-30
-10
10
30
50
0 20 40 60 80 100run
Lsol -
L
Quadratic bias Mean-shift bias
ii. Closeness of Lsol to L:
• Wide range of Lsol values.
e.g.
(Positive bias functions, single run data, N(1,1) errors, MA(2) auto-correlation, bias severity value of 2 and true L = 100.)

iii. Percentage bias removed by truncation.
0
5
10
15
20
25
300-4
0
40-5
0
50-6
0
60-7
0
70-8
0
80-9
0
90-9
5
95-9
9
99-1
00
100+
% bias removed
% o
f to
tal v
alid
runs
All valid runs

Effect of data parameters on bias removal
No significant effect: Error type
Bias direction
Significant effect: Data type
Auto-correlation type
Bias shape
Bias severity
Bias length

0
50
100
0-4
0
40
-50
50
-60
60
-70
70
-80
80
-90
90
-95
95
-99
99
-10
0
10
0+
% of bias removed
cum
ula
tive
% o
f va
lid c
ase
s Single run
Averaged replications
More bias removed by using averaged replications rather than a single run.

0
50
1000
-40
40
-50
50
-60
60
-70
70
-80
80
-90
90
-95
95
-99
99
-10
0
10
0+
% of bias removed
cu
mu
lative
% o
f va
lid
ca
se
s no a-c AR(1)
AR(2) AR(4)
MA(2) ARMA(5,5)
The stronger the auto-correlation, the less accurate the bias removal.
Effect greatly reduced by using averaged data.

0
50
100
0-4
0
40
-50
50
-60
60
-70
70
-80
80
-90
90
-95
95
-99
99
-10
0
10
0+
% of bias removed
cu
mu
lative
% o
f va
lid
ca
se
s
mean-shift Linear
Quad Exp
OscL OscQ
OscE
The more sharply the initial bias declines, the more likely MSER-5 is to underestimate the warm-up period and to remove increasingly less bias.

0
50
1000
-40
40
-50
50
-60
60
-70
70
-80
80
-90
90
-95
95
-99
99
-10
0
10
0+
% of bias removed
cum
ula
tive
% o
f va
lid c
ase
s 1
2
4
As the bias severity increases, MSER-5 removes an increasingly higher percentage of the bias.

0
50
100
0-4
0
40
-50
50
-60
60
-70
70
-80
80
-90
90
-95
95
-99
99
-10
0
10
0+
reje
ctio
ns
% of bias removed
cum
ula
tive
% o
f va
lid c
ase
s
10%
40%
Longer bias removed slightly more efficiently than shorter bias.
Shorter bias - more overestimations - partly due to longer bias overestimations being more likely to be rejected.

0
100
200
300
400
500
600
700
800
900
x=
0
0<
x≤1
1<
x≤5
5<
x≤1
0
10
<x≤2
0
20
<x≤4
0
40
<x≤6
0
60
<x≤8
0
80
<x≤1
00
x = no. of Lsol rejections
no
. o
f ca
se
s
ARMA(5,5)
MA(2)
AR(4)
AR(2)
AR(1)
No auto-correlation
Rejections caused by: high auto-correlation, bias close to or over n/2, smooth end to data = ‘end point’ rejection.
Averaged data slightly increases probability of getting ‘end point’ rejection but increases probability of more accurate L estimates.
iv. Lsol rejections

0
10
20
30
40
50
1000 1100 1200 1300 1400 1500 1600 1700 1800n
Lso
l re
ject
ion
co
un
t
+ meanshift
+ linear
+ quadratic
+ exp
+ osclinear
+ oscquad
+ oscexp
Giving more data to MSER-5 in an iterative fashion produces a valid Lsol value where previously the Lsol value had been rejected.
e.g. ARMA(5,5)

Lsol values Percentage of cases
Lsol = 0 71%
Lsol ≤ 50 93%
Testing MSER-5 with data that has no initial bias.
Want Lsol = 0
Lsol > 50 mainly due to highest auto-correlated data sets - AR(1) & ARMA(5,5).
Rejected Lsol values: 5.6% of the 2400 Lsol values produced. 93% from the highest auto-correlated data ARMA(5,5).

Testing MSER-5 with data that has 100% bias.
Want 100% rejection rate: Actual rate = 61%
0
1020
30
4050
60
70
8090
100
Line
ar
Qua
d
Exp
Osc
Line
ar
Osc
Qua
d
Osc
Exp
Bias shape
Per
cent
age
of L
sol
reje
ctio
ns
0
10
20
30
40
50
60
70
80
90
M1 M2 M4
Bias severity
Per
cent
age
of L
sol
rej
ectio
ns
Single data Averaged data

Summary
• MSER-5 most promising method for automation– Not model or data type specific. – No estimation of parameters needed. – Can function without user intervention. – Shown to perform robustly and effectively
for the majority of data sets tested. – Quick to run. – Fairly simple to understand.
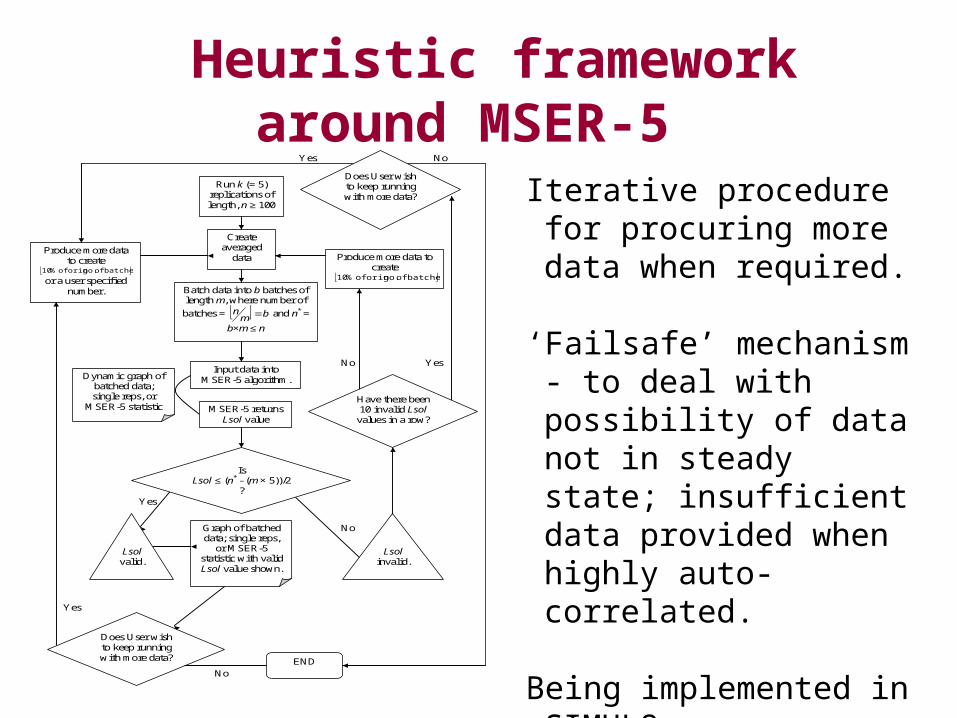
Heuristic framework around MSER-5
Run k (= 5) replications of length, n ≥ 100
Create averaged
data
Batch data into b batches of length m, where number of
batches = bmn and n* =
b×m ≤ n
MSER-5 returns Lsol value
Produce more data to create
batches of no. orig of %10 or a user specified
number.
Dynamic graph of batched data; single reps, or
MSER-5 statistic
Graph of batched data; single reps,
or MSER-5 statistic with valid Lsol value shown.
Input data into MSER-5 algorithm.
Yes
Yes
No
No
Does User wish to keep running with more data? END
Lsol valid.
Lsol invalid.
Is Lsol ≤ (n* - (m × 5))/2
?
Yes
Have there been 10 invalid Lsol
values in a row?
No
Yes No
Does User wish to keep running with more data?
Produce more data to create
batches of no. orig of %10
Iterative procedure for procuring more data when required.
‘Failsafe’ mechanism - to deal with possibility of data not in steady state; insufficient data provided when highly auto-correlated.
Being implemented in SIMUL8.
Related Documents