1 Paper 95-2019 Automating a Summary Report of PSM Model and Match Results Desiree Hall, Optum, Inc.; Blake Krebs, Optum, Inc. ABSTRACT When performing propensity score modeling and matching, various output is produced and located in separate reports. As you iterate the process after adjusting the model or match inputs, it is helpful to have the key results in one report for easy comparison with later iterations. This paper demonstrates a method to automate the creation of a report to summarize key results using the ODS output from PROC LOGISTIC and PROC PSMATCH. The intended audience are those with basic familiarity with SAS/STAT® software. INTRODUCTION The goal of propensity score matching is to reduce bias within an observational study, so that outcomes can be compared between your treated and control groups and attributed to the treatment. One approach is to run a logistic regression and use the resulting probability score (propensity score) to perform a match of the most similar subjects between your treated and control groups. You then evaluate your model and match results and the balance of your groups. You will probably iterate through this process multiple times in order to build and fine-tune your model and match. Many SAS procedures make their report data available as ODS output. To help streamline the iterative process, this paper focuses on summarizing the output created during PROC LOGISTIC and PROC PSMATCH using ODS. Your model and match summary reports can then be compared between iterations as you weigh the merits of each model and match combination. These examples were developed for a binary logistic model. Other model approaches may require adjustments to the code. STEPS This paper focuses on the steps shown below in green. Run logistic regression on your treated and control subjects using PROC LOGISTIC, with treated=1 as the outcome of interest Using the score generated during your logistic regression, run a propensity score match of the subjects from the treated group to the subjects from the control group with the closest scores using PROC PSMATCH o During PROC LOGISTIC and PROC PSMATCH, hold onto temporary report data using ODS OUTPUT statements Combine and reformat the temporary report data produced by SAS Print your summary report

Welcome message from author
This document is posted to help you gain knowledge. Please leave a comment to let me know what you think about it! Share it to your friends and learn new things together.
Transcript

1
Paper 95-2019
Automating a Summary Report of PSM Model and Match Results
Desiree Hall, Optum, Inc.; Blake Krebs, Optum, Inc.
ABSTRACT
When performing propensity score modeling and matching, various output is produced and located in separate reports. As you iterate the process after adjusting the model or match inputs, it is helpful to have the key results in one report for easy comparison with later iterations. This paper demonstrates a method to automate the creation of a report to summarize key results using the ODS output from PROC LOGISTIC and PROC PSMATCH. The intended audience are those with basic familiarity with
SAS/STAT® software.
INTRODUCTION
The goal of propensity score matching is to reduce bias within an observational study, so that outcomes can be compared between your treated and control groups and attributed to the treatment. One approach is to run a logistic regression and use the resulting probability score (propensity score) to perform a match of the most similar subjects between your treated and control groups. You then evaluate your model and match results and the balance of your groups.
You will probably iterate through this process multiple times in order to build and fine-tune your model and match. Many SAS procedures make their report data available as ODS output. To help streamline the iterative process, this paper focuses on summarizing the output created during PROC LOGISTIC and PROC PSMATCH using ODS. Your model and match summary reports can then be compared between iterations as you weigh the merits of each model and match combination.
These examples were developed for a binary logistic model. Other model approaches may require adjustments to the code.
STEPS
This paper focuses on the steps shown below in green.
Run logistic regression on your treated and control subjects using PROC LOGISTIC, with treated=1 as the outcome of interest
Using the score generated during your logistic regression, run a propensity score match of the subjects from the treated group to the subjects from the control group with the closest scores using PROC PSMATCH
o During PROC LOGISTIC and PROC PSMATCH, hold onto temporary report data using ODS OUTPUT statements
Combine and reformat the temporary report data produced by SAS
Print your summary report

2
HOLD ONTO TEMPORARY REPORTS USING ODS OUTPUT STATEMENTS
The following are just a few of the reports created by PROC LOGISTIC and PROC PSMATCH. Their temporary dataset names are shown in green.
PROC LOGISTIC ODS Reports:
SOURCE: http://support.sas.com/documentation/cdl/en/statug/68162/HTML/default/viewer.htm#statug_logistic_examples06.htm
PROC PSMATCH ODS Reports:
SOURCE: https://documentation.sas.com/?docsetId=statug&docsetVersion=14.3&docsetTarget=statug_psmatch_examples08.htm&locale=en

3
The underlying data for these reports are in temporary datasets which exist only during the procedure. However, by specifically naming these temporary reports in an ODS OUTPUT statement prior to running the procedure, you ask SAS to hold them in the WORK space after the procedure has completed. You can then read them into a single dataset and print them out as one report.
Prior to the PROC LOGISTIC step, specify the ODS OUTPUT statement. Include the following procedure-created output tables: ParameterEstimates, FitStatistics, ModelInfo, ResponseProfile, Association, OddsRatios, GlobalTests, and NObs. Calling out these tables and assigning them a name will keep them active in your work session.
ods output
ParameterEstimates=estimates
FitStatistics=FitStats
ModelInfo=ModelInfoRpt
ResponseProfile=ResponseProfileRpt
Association=AssociationRpt
OddsRatios=OddsRatios
GlobalTests=GlobalTests
NObs=NObs;
…PROC LOGISTIC statements…
Prior to the PROC PSMATCH step, again specify an ODS OUTPUT statement. Include the following output tables: MatchInfo, PSInfo, and DataInfo.
ods output
MatchInfo=matchinfo
PSInfo=psinfo
DataInfo=datainfo;
…PROC PSMATCH statements…
These report tables will be combined in the next step.
Note that the table names have some differences between versions of SAS/Stat. This paper uses SAS/Stat v9.4.
ODS table names for PROC LOGISTIC: http://documentation.sas.com/?docsetId=statug&docsetVersion=15.1&docsetTarget=statug_logistic_details112.htm&locale=en
ODS table names for PROC PSMATCH: http://documentation.sas.com/?docsetId=statug&docsetVersion=15.1&docsetTarget=statug_psmatch_details43.htm&locale=en
Consult the SAS online documentation for the correct table names if you are using a different version of SAS/Stat.
COMBINE TEMPORARY REPORT DATA
Using the ODS Output reports you called-out, you can then build two summarized tables: model_rpt and rpt_variables. Some of the variables are renamed in order to align within the tables.
CREATE FINAL REPORT
The model_rpt and rpt_variables tables are used to create the summary report. The summary report contains the following five report sections:

4
MODEL BUILD
The ResponseProfile table contributes your treated and comparison cohort labels. The ModelInfo table provides the model method. The NObs table provides the number of observations read and used.
MODEL FIT AND TEST OF GLOBAL NULL
The FitStatistics table provides the AIC, SC, and -2 Log L values of your model. The GlobalTests table provides the results of the tests of the global null.
MODEL METRICS
The Association table provides your logistic model performance metrics such as concordant/discordant/ties, and c-stat.
CONTROL GROUP MATCH
The DataInfo and MatchInfo tables are created during PROC PSMATCH. These will show the beginning and final matched set counts, the matching method, the caliper, and the absolute final difference.
MODEL VARIABLES
The final report shows the combined estimates and odds ratios for each covariate used within your model. These are taken from the PROC LOGISTIC ParameterEstimates and OddsRatios tables, and then merged together in one dataset for a consolidated view.
The summary report can then be printed using PROC PRINT.
CODE
The code used to generate the example report:
*** Set Model Parameters;
%let TBRAND=AMD_TREATED; *** treatment group name;
%let CBRAND=AMD_UNTREATED; *** control group name;
%put _user_;
*** Classification variables for the model;
%let in_class= pre_ind_visit_er ind_male ind_ins_commercial
ind_race_caucasian ind_region_northeast pre_charlson_metastatic;
*** Continuous variables for the model;
%let in_cont=age PRE_OFFICE_VISITS PRE_CHARLSON_SCORE;
*** Model variables you want assessed by PROC PSMATCH;
%let key_match= ind_male ind_ins_commercial age pre_charlson_score
pre_ind_visit_er;
*** Logistic Regression Model;
ods output
ParameterEstimates=estimates
FitStatistics=FitStats
ModelInfo=ModelInfoRpt
ResponseProfile=ResponseProfileRpt
Association=AssociationRpt
OddsRatios=OddsRatios
GlobalTests=GlobalTests
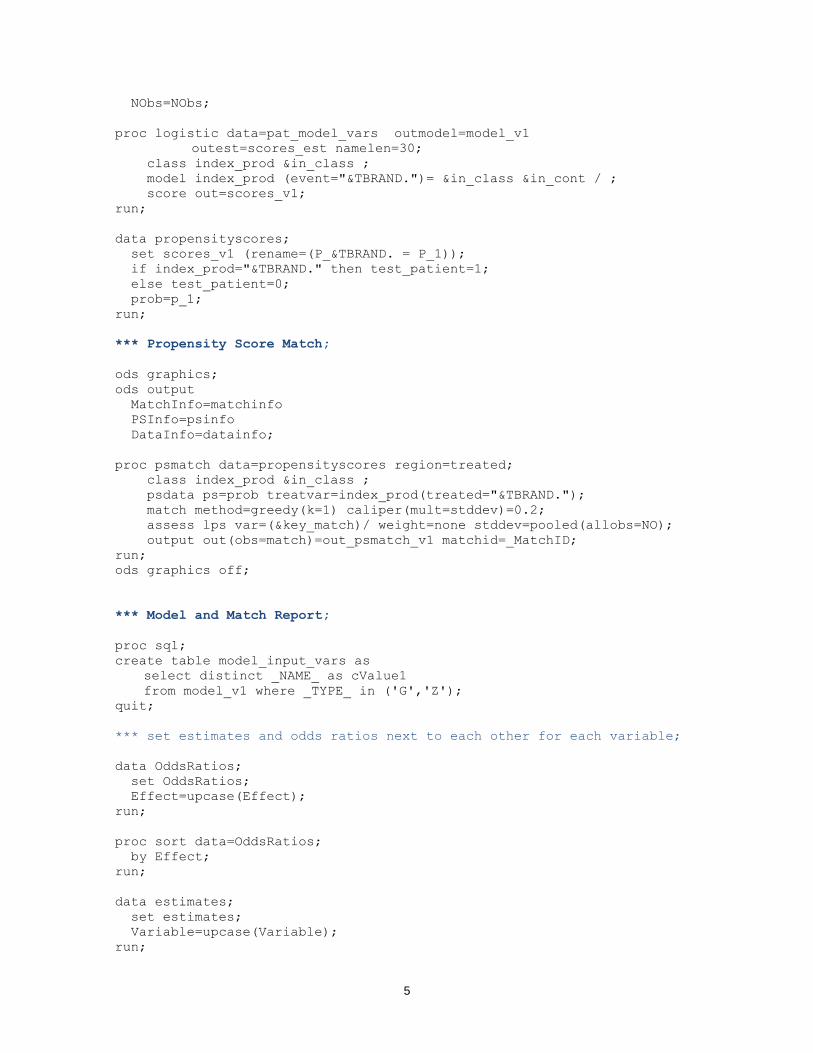
5
NObs=NObs;
proc logistic data=pat_model_vars outmodel=model_v1
outest=scores_est namelen=30;
class index_prod &in_class ;
model index_prod (event="&TBRAND.")= &in_class &in_cont / ;
score out=scores_v1;
run;
data propensityscores;
set scores_v1 (rename=(P_&TBRAND. = P_1));
if index_prod="&TBRAND." then test_patient=1;
else test_patient=0;
prob=p_1;
run;
*** Propensity Score Match;
ods graphics;
ods output
MatchInfo=matchinfo
PSInfo=psinfo
DataInfo=datainfo;
proc psmatch data=propensityscores region=treated;
class index_prod &in_class ;
psdata ps=prob treatvar=index_prod(treated="&TBRAND.");
match method=greedy(k=1) caliper(mult=stddev)=0.2;
assess lps var=(&key_match)/ weight=none stddev=pooled(allobs=NO);
output out(obs=match)=out_psmatch_v1 matchid=_MatchID;
run;
ods graphics off;
*** Model and Match Report;
proc sql;
create table model_input_vars as
select distinct _NAME_ as cValue1
from model_v1 where _TYPE_ in ('G','Z');
quit;
*** set estimates and odds ratios next to each other for each variable;
data OddsRatios;
set OddsRatios;
Effect=upcase(Effect);
run;
proc sort data=OddsRatios;
by Effect;
run;
data estimates;
set estimates;
Variable=upcase(Variable);
run;

6
proc sort data=estimates;
by Variable;
run;
data rpt_variables;
merge
estimates (in=ina drop=DF _ESTTYPE_)
OddsRatios (in=inb rename=(Effect=Variable));
by Variable;
if ina or inb;
run;
*** set the model and match metrics into one dataset;
data model_rpt;
length label1 rptSection $50 cValue1 cValue2 $80;
set
ResponseProfileRpt (in=ina keep=Outcome rename=(Outcome=Label1))
ModelInfoRpt (in=ind keep=Description Value
rename=(Description=Label1 Value=cValue1)
where=(Label1 in ('Model','Optimization Technique')))
NObs (in=inj keep=Label N)
FitStats (in=inc rename=(Criterion=Label1
InterceptOnly=nValue1 InterceptAndCovariates=nValue2))
GlobalTests (in=ini)
AssociationRpt (in=ine keep=Label1 cValue1)
AssociationRpt (in=inh keep=Label2 cValue2)
datainfo (in=inf keep=Label1 cValue1
where=(label1 in ('All Obs (Treated)','All Obs (Control)')))
matchinfo (in=ing keep=label1 cValue1
where=(label1 not in ('Order','Matched Obs (Treated)',
'Matched Obs (Control)')));
*** reformat rows to align properly in the report;
if ina and label1="&TBRAND" then do;
rptSection='Model Build';
label1='Treated Cohort';
cValue1="&TBRAND";
end;
else if ina and label1="&CBRAND" then do;
rptSection='Model Build';
label1='Comparison Cohort';
cValue1="&CBRAND";
end;
else if inc then do;
cValue1=put(nValue1,8.3);
cValue2=put(nValue2,8.3);
rptSection='Model Fit';
end;
else if inh then do;
cValue1=cValue2;
label1=label2;
cValue2=.;
rptSection='Model Metrics';
end;
else if ini then do;
label1=Test;

7
cValue1=put(ChiSq,8.3);
cValue2=put(DF,8.0);
rptSection='Model Test Global Null';
end;
else if inj then do;
label1=Label;
cValue1=put(N,8.0);
rptSection='Model Build';
end;
else if ind then rptSection='Model Build';
else if ine then rptSection='Model Metrics';
else if inf or ing then rptSection='Control Group Match';
run;
*** print final report;
proc print data=model_rpt noobs;
var rptSection label1 cValue1 cValue2 ProbChiSq;
where label1 ne 'All Candidate Variables';
title 'Model and Match Report';
run;
proc print data=rpt_variables noobs;
title 'Model Variables';
run;
SAMPLE REPORT
The final report created in the last two PROC PRINT steps:
Model and Match Report
rptSection label1 cValue1 cValue2 ProbChiSq
Model Build Treated Cohort AMD_TREATED .
Model Build Comparison Cohort AMD_UNTREATED .
Model Build Model binary logit .
Model Build Optimization Technique Fisher's scoring .
Model Build Number of Observations Read 6011 .
Model Build Number of Observations Used 6011 .
Model Fit AIC 8225.804 7774.711 .
Model Fit SC 8232.505 7841.724 .
Model Fit -2 Log L 8223.804 7754.711 .
Model Test Global Null Likelihood Ratio 469.093 9 <.0001
Model Test Global Null Score 425.263 9 <.0001
Model Test Global Null Wald 380.755 9 <.0001
Model Metrics Percent Concordant 64.9 .
Model Metrics Percent Discordant 35.1 .
Model Metrics Percent Tied 0.0 .
Model Metrics Pairs 8869410 .

8
rptSection label1 cValue1 cValue2 ProbChiSq
Model Metrics Somers' D 0.299 . .
Model Metrics Gamma 0.299 . .
Model Metrics Tau-a 0.147 . .
Model Metrics c 0.649 . .
Control Group Match All Obs (Treated) 2601 .
Control Group Match All Obs (Control) 3410 .
Control Group Match Distance Metric Logit of Propensity Score .
Control Group Match Method Greedy Matching .
Control Group Match Control/Treated Ratio 1 .
Control Group Match Caliper (Logit PS) 0.12182 .
Control Group Match Matched Sets 2582 .
Control Group Match Total Absolute Difference 160.1091 .
Model Variables
Variable ClassVal0 Estimate StdErr WaldChiSq ProbChiSq OddsRatioEst LowerCL UpperCL
AGE 0.0476 0.00390 148.8802 <.0001 1.049 1.041 1.057
IND_INS_COMMERCIAL 0 0.1462 0.0443 10.9086 0.0010 1.340 1.126 1.594
IND_MALE 0 0.0173 0.0281 0.3776 0.5389 1.035 0.927 1.156
IND_RACE_CAUCASIAN 0 -0.1430 0.0459 9.7025 0.0018 0.751 0.628 0.899
IND_REGION_NORTHEAST 0 0.2359 0.0365 41.7816 <.0001 1.603 1.389 1.850
INTERCEPT -4.1240 0.3136 172.9093 <.0001 . . .
PRE_CHARLSON_METASTATIC 0 -0.3869 0.1222 10.0187 0.0015 0.461 0.286 0.745
PRE_CHARLSON_SCORE -0.0657 0.0174 14.3414 0.0002 0.936 0.905 0.969
PRE_IND_VISIT_ER 0 0.0926 0.0309 8.9699 0.0027 1.204 1.066 1.359
PRE_OFFICE_VISITS 0.0173 0.00212 66.8423 <.0001 1.017 1.013 1.022
NEXT STEPS
After you review all of your logistic and match output, print this summary report and save it to compare with later iterations.
An important step in evaluating your matched groups is balance assessment. PROC PSMATCH provides output to help evaluate balance for many of your variables. See this PharmaSUG white paper for a method to further evaluate balance for all of your variables: http://www.pharmasug.org/proceedings/2014/SP/PharmaSUG-2014-SP07.pdf
After reviewing your results, saving your summary report, and evaluating balance, you may wish to adjust your parameters as needed and rerun the process. You can then compare summary reports across iterations.
CONCLUSION
Many SAS procedures make their report data available as ODS output. This paper shows a method to create a summarized report for a propensity score model and match using the ODS output. Once you

9
have reviewed your report, you can repeat the process, produce this report again, and compare reports between the iterations to help select the most appropriate combination of model and match parameters.
REFERENCES
Hulbert, Erin and Brekke, Lee. 2014. “A SAS® Macro to Evaluate Balance after Propensity Score Matching”. Proceedings of the PharmaSUG 2014 Conference, San Diego, CA: PharmaSUG. Available at http://www.pharmasug.org/proceedings/2014/SP/PharmaSUG-2014-SP07.pdf.
SAS Institute Inc., “SAS/Stat® 14.1 User’s Guide”. Accessed July 2, 2019. https://support.sas.com/en/software/sas-stat-support.html#documentation
CONTACT INFORMATION
Your comments and questions are valued and encouraged. Contact the author at:
Desiree Hall Optum Analytics [email protected] www.optum.com
SAS and all other SAS Institute Inc. product or service names are registered trademarks or trademarks of SAS Institute Inc. in the USA and other countries. ® indicates USA registration. Other brand and product names are trademarks of their respective companies.
Related Documents