Automatic Pharmacophore Generation Using Catalyst Jon M. Sutter, Osman Güner, Rémy Hoffmann, Hong Li, Marvin Waldman

Welcome message from author
This document is posted to help you gain knowledge. Please leave a comment to let me know what you think about it! Share it to your friends and learn new things together.
Transcript

Automatic Pharmacophore GenerationUsing Catalyst
Jon M. Sutter, Osman Güner, Rémy Hoffmann, Hong Li, Marvin Waldman

HypoGen
• Brief review of HypoGen
• Scoring functions
• Variable weights and tolerancesThe effect on scoring functions
• Validation study

Pharmacophore Model Generation
Molecules/Select Features
Begin...
Molecules– Conformational Models– Activity data is known – spans ~4 orders of magnitude
Features– Generalized (e.g. Hydrogenbond acceptor)
Optimize Reasonable
PharmacophoresHypoGen...
Pharmacophores– present in actives / not in inactives
Optimize– simulated annealing– score... Occam’s Razor– steps (rotation, translation,vary weights and tolerances)
Final...Top 10
Hypotheses Validate Improve
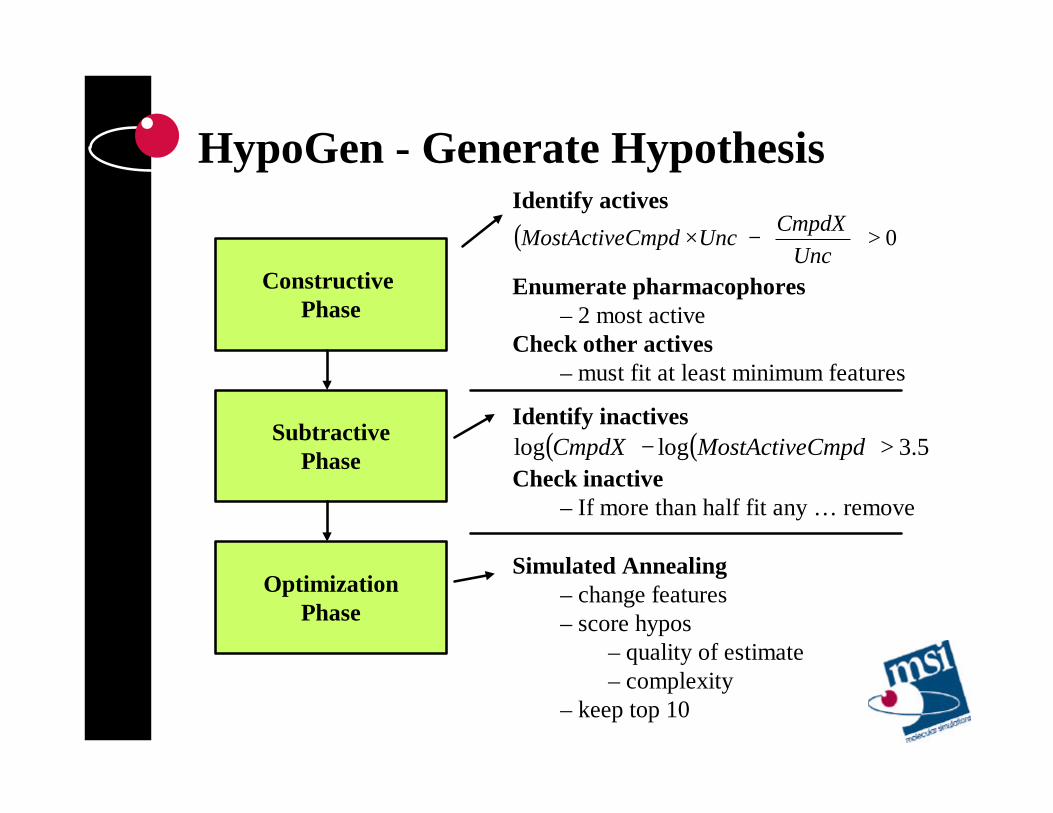
HypoGen - Generate Hypothesis
Constructive Phase
SubtractivePhase
OptimizationPhase
Identify actives( ) 0>
−×
UncCmpdXUncCmpdMostActive
Enumerate pharmacophores – 2 most active
Check other actives– must fit at least minimum features
Identify inactives( ) ( ) 5.3loglog >− CmpdMostActiveCmpdX
Check inactive– If more than half fit any … remove
Simulated Annealing– change features– score hypos
– quality of estimate– complexity
– keep top 10

Regression
Geometric Fit
-log(
activ
ity)
-log(Activity)Est= Fit * Slope + Y intercept
> Fit, More Active
Regression Info•Used to estimate activity of training set•Used to estimate futureunknown

Fit value computed as: weight * [ max(0, 1 - SSE)]
where SSE = (D/T)2
D = displacement of the feature from the center of the location constraint T = the radius of the location constraint sphere for the feature (tolerance).

Scoring Functions ...

Score
Quantitative extension of Occam’s Razor -
When equivalent alternatives, the simplestis the best.
Cost – Error (activity estimates) – Complexity
– simplicity derived from information theory– minimum description length– cost is number of bits needed to describe fully

Cost ComponentsError
– bits needed to describe the errors in the leads– the smaller the errors, the smaller the cost– summation across all leads– major contributor to cost
Weight– bits required to describe the feature weights– the closer the average weight value is to expected typical
value, the smaller the cost
Configuration– bits required to describe the types and relative positions of
the features in the hypothesis– derived from pharmacophore space

Types of Cost
Fixed– cost of the simplest possible hypothesis– fits data perfectly– lower bound of the cost
Null Hypothesis– cost when each molecule estimated as mean activity– acts like a hypothesis with no features
Pharmacophore– lies between the fixed cost and null hypo cost– larger difference between pharmacophore and null cost
corresponds to more significant models

Variable Weights and Tolerances ...

HypoGen - Generate Hypothesis
Constructive Phase
SubtractivePhase
OptimizationPhase
Same as before
Simulated Annealing– change features
– change weight or tolerance by selecting from discrete choices
– score hypos – quality of estimate– complexity
– keep top 10
Same as before

Cost ComponentsError
– bits needed to describe the errors in the leads– the smaller the errors, the smaller the cost
Weight– bits required to describe the feature weights– the closer the average weight value is to expected typical
value, the smaller the cost
Tolerance– bits required to describe the feature tolerance values– the closer the average tolerance value is to expected typical
value, the smaller the cost
Configuration– bits required to describe the types and relative positions of
the features in the hypothesis– derived from pharmacophore space and possible
combinations due to variable tolerance and weights

Validation Study ...

Validation Study
5-HT3 antagonistsData
— 23 compounds— activity ranging from 0.2 - 1400 nM— 7 considered as active— 3 considered as inactive
Feature types considered— Ring aromatic (R)— Positive Ionizable (P)— Hydrophobic (H)— Hydrogen Bond Donor (D)— Hydrogen Bond Acceptor (A)

Standard HypoGenPharmacophore
•4 features, HHDR, Weight = 2.2, Tolerance = 1.6 and 2.2 AngstromsRegression
•R = 0.828•RMS = 1.402
Cost•Fixed cost = 89.84•Pharmacophore Cost = 112.67•Null Cost = 148.93
LY278584 - patented by Eli Lilly.

Variable Tolerance HypoGenPharmacophore
•4 features, HHAP, Weight = 2.5 Regression
•R = 0.866•RMS = 1.256
Cost•Fixed cost = 102.60•Pharmacophore Cost = 122.28•Null Cost = 148.93
T= 1.3
T= 1.3
T= 1.9, 1.75
T= 1.3

Variable Weight HypoGenPharmacophore
•4 features, HHAP, T = 1.6, 2.2Regression
•R = 0.834•RMS = 1.381
Cost•Fixed cost = 101.45•Pharmacophore Cost = 123.94•Null Cost = 148.93
W=2.0
W=2.6
W=2.6
W=2.0
Pharmacophores (T&W):RMS - 0.309

Are they better?
Search database•Derwent’s World Drug Index•48,405•Limit search to non-empty MA field (10,318)•Known actives found by searching for “antiserotonins” (225)
Measures of fit
%Y = Ha/Ht
%A = Ha/A
Ht = # in hit listHa = # of actives in hit listD = # in databaseA = # of actives in database
E = (Ha/Ht) / (A/D)
GH =Ha(3A + Ht)
4 HtAx 1 -
Ht - Ha D - A

Search Results - Yes, they’re better
Query Actives Hits %Y %A E GH
DB 225 10318 2.18 100.0 1.00 0
Std 64 1889 3.39 28.4 1.55 0.079
Tol 97 1915 5.06 43.1 2.32 0.120
Weight 112 2512 4.46 49.8 2.04 0.120

Variable Weights/Tol HypoGenPharmacophore
•4 features, HHAPRegression
•R = 0.854•RMS = 1.30
Cost•Fixed cost = 114.21•Pharmacophore Cost = 134.61•Null Cost = 148.93
T = 1.3W = 2.1
T = 1.3W = 2.1T = 1.3
W = 2.8
T = 2.35, 1.75W = 2.1
Pharmacophores (T&T/W):RMS - 0.340

Search Results - Tolerance and Weights
Query Actives Hits %Y %A E GH
Std 64 1889 3.39 28.4 1.55 0.079
Tol 97 1915 5.06 43.1 2.32 0.120
Weight 112 2512 4.46 49.8 2.04 0.120
W&T 93 1965 4.73 41.3 2.17 0.113

SummaryIn General:
– variable weights and tolerances improve models– Improved RMS– Improved R
– do not see evidence of overfitting– Feature types and positions are similar to standard hypo– External prediction is good– Database searches are good
In This Study:– variable weights and tolerance
– lead to better models– similar pharmacophores– superior search results
Statistical Significance:Standard > Variable Weight = Variable Tolerance > Combined

Acknowledgements
Catalyst Developers
Bernard Chang - Senior ScientistDaniel McDonald - Senior Engineer
Related Documents