Automatic Person Identification and Verification using Online Handwriting Submitted in partial fulfillment of the requirements for the degree of Master of Science (by Research) in Computer Science by Sachin Gupta <sachin [email protected]> http://students.iiit.ac.in/∼sachin g International Institute of Information Technology Hyderabad, INDIA March, 2008

Welcome message from author
This document is posted to help you gain knowledge. Please leave a comment to let me know what you think about it! Share it to your friends and learn new things together.
Transcript

Automatic Person Identification andVerification using Online Handwriting
Submitted in partial fulfillment of
the requirements for the degree of
Master of Science (by Research)
in
Computer Science
by
Sachin Gupta
<sachin [email protected]>
http://students.iiit.ac.in/ ∼sachin g
International Institute of Information Technology
Hyderabad, INDIA
March, 2008


INTERNATIONAL INSTITUTE OF INFORMATION TECHNOLOGY
Hyderabad, India
CERTIFICATE
It is certified that the work contained in this thesis, titled“Automatic Person Identification and
Verification using Online Handwriting” by Sachin Gupta, has been carried out under my super-
vision and is not submitted elsewhere for a degree.
Date Advisor: Dr. Anoop Namboodiri


c©Copyright by Sachin Gupta, 2007


To my family, and friends.


Acknowledgement
First of all, I want to convey my sincere thanks to my advisor,Dr. Anoop Namboodiri, for
his guidance and all-time support. He not only advised me in my academics but also helped me
in developing my thought process to the extent that I not onlyenjoyed my current research and
decided to look forward to go for research as a career.
Most of all, I would like to thank my parents, who gave me a chance to go for higher studies in
the field of my choice. Without their guidance, It would have been difficult to acheive this. They
always encouraged me to excel and always gave me freedom to choose the field of my interests.
I would also like to thank my friends who always encouraged meand are the great source
of strength. My CVIT friends inspired me by their hardwork and always motivated me to step
towards excellence. I want to personally thank Amit, Mayankand Rafiya for their helping hand
in every aspect be it technical or any other problem.
I want to thank all my friends and juniors at IIIT, who helped me in data collection for my
experiments. Without their help the data collection process, which was the huge and tedious part
of my research work could not be done. They helped me in-spiteof hectic curriculum of IIIT,
without any incentives.
My acknowledgement would not be over If I do not thank Dr. C. V.Jawahar and Prof.
P.J.Narayanan whom I always consider my role models for their ”simple living and high think-
ing” attitude. I will always be grateful to IIIT and CVIT for providing me a platform where I
could transform my dreams into reality.
ix


Abstract
Automatic person identification is one of the major concernsin this era of automation. How-
ever, this is not a new problem and our society has adopted several different ways to authenticate
the identity of a person such as signature and possessing a document. With the advent of elec-
tronic communication media (Internet), the interactions are becoming more and more automatic
and thus the problem of identity theft has became even more severe. Even, the traditional modes
of person authentication systems such asPossessionsandKnowledgeare not able to solve this
problem. Possessionsinclude physical possessions such as keys, passports, and smart cards.
Knowledgeis a piece of information that is memorized, such as a password and is supposed to be
kept a secret.Knowledgeandpossessionbased methods are more focused on “what you know”
or “what you possess” rather than “who you are”. Due to inability of knowledge and possession
based authentication methods to handle the security concerns, biometrics research have gained
significant momentum in the last decade as the security concerns are increasing due to increasing
automation of every field.Biometricsrefers to authentication of a person using a physiological
and behavioral trait of the individual that distinguish himfrom others. Biometric authentication
has various advantages over knowledge and possession basedidentification methods including
ease of use and non repudiation. In this thesis, we address the problem of handwriting biomet-
rics. Handwriting is a behavioral biometric as it is generated as the consequence of an action
performed by a person. Handwriting identification also has along history. Signature (a specific
instance of handwriting) has been used for authentication of legal documents for a long time.
This thesis addresses the various problems related to automatic handwriting identification.
Most of the writer identification work is being done manuallytill date as a lot of context depen-
dent information, such as, source of documents, nature of handwriting, etc. is difficult to model
mathematically. However, they can be easily analyzed by human experts. Still, an automatic
handwriting analysis system is useful as it can remove subjectivity from the process of hand-
writing identification and can be used for expert advice in various court cases. The final aim of
this research is to design efficient algorithms for automatic feature extraction and recognition of
the writer from a given handwritten document with as less human intervention as possible.
Specifically, we propose efficient solutions to three different applications of handwriting iden-
tification. First we look at the problem of determining the authorship of an arbitrary piece of on-
line handwritten text. We then analyze the discriminative information from online handwriting
to propose an efficient and accurate approach for text-dependent writer verification for practi-
cal and low security applications. We also look at the problem of repudiation in handwritten
xi

xii
documents for forensic document examination. After introducing the problem of repudiation in
handwritten documents, we propose an algorithm for repudiation detection in the handwritten
documents.
Handwriting identification is quite different from handwriting recognition; the other popular
sub-field of automatic handwriting analysis. Handwriting recognition tries to identify the content
of a handwritten text and tries to minimize variations due towriting style. On the other hand, in
the case of handwriting identification, variations due to style is sought out.

Contents
Chapter Page
1 Introduction . . . . . . . . . . . . . . . . . . . . . . . . . . . . . . . . . . . . . . 11.1 Handwriting: a Behavioral Biometric . . . . . . . . . . . . . . . .. . . . . . 2
1.1.1 Individual Features of Handwriting . . . . . . . . . . . . . . .. . . . 41.1.2 Handwriting Recognition Vs Writer Identification . . .. . . . . . . . . 61.1.3 Text independent Vs Text dependent systems . . . . . . . . .. . . . . 71.1.4 Verification Vs Identification . . . . . . . . . . . . . . . . . . . .. . . 8
1.2 Applications . . . . . . . . . . . . . . . . . . . . . . . . . . . . . . . . . . . .101.2.1 Online Vs Offline Handwriting . . . . . . . . . . . . . . . . . . . . .. 11
1.3 Contributions of the thesis . . . . . . . . . . . . . . . . . . . . . . . .. . . . 111.4 Thesis overview . . . . . . . . . . . . . . . . . . . . . . . . . . . . . . . . . .12
2 Background and Related Work. . . . . . . . . . . . . . . . . . . . . . . . . . . . . 132.1 Text-dependent approaches . . . . . . . . . . . . . . . . . . . . . . . .. . . . 13
2.1.1 Sub-character and character level features . . . . . . . .. . . . . . . . 152.1.2 Word level features . . . . . . . . . . . . . . . . . . . . . . . . . . . . 162.1.3 Line and paragraph level features . . . . . . . . . . . . . . . . .. . . 17
2.2 Text Independent Methods . . . . . . . . . . . . . . . . . . . . . . . . . .. . 172.2.1 Text Line Features . . . . . . . . . . . . . . . . . . . . . . . . . . . . 182.2.2 Paragraph/document level features . . . . . . . . . . . . . . .. . . . . 19
2.2.2.1 Texture Analysis . . . . . . . . . . . . . . . . . . . . . . . . 192.2.3 Directional features . . . . . . . . . . . . . . . . . . . . . . . . . . .. 202.2.4 Code-book Generation . . . . . . . . . . . . . . . . . . . . . . . . . . 20
2.2.4.1 Image processing features . . . . . . . . . . . . . . . . . . . 212.3 Online Handwriting . . . . . . . . . . . . . . . . . . . . . . . . . . . . . . .. 222.4 Machine Learning for writer Identification . . . . . . . . . . .. . . . . . . . . 222.5 Our contribution . . . . . . . . . . . . . . . . . . . . . . . . . . . . . . . . .. 24
3 Text Independent Writer Identification. . . . . . . . . . . . . . . . . . . . . . . . . 253.1 Challenges due to Text independency . . . . . . . . . . . . . . . . .. . . . . 263.2 Text-independent framework . . . . . . . . . . . . . . . . . . . . . . .. . . . 273.3 Feature Extraction . . . . . . . . . . . . . . . . . . . . . . . . . . . . . . .. . 303.4 Experimental Results . . . . . . . . . . . . . . . . . . . . . . . . . . . . .. . 323.5 Analysis and Conclusion . . . . . . . . . . . . . . . . . . . . . . . . . . .. . 35
4 Text Dependent Writer Identification. . . . . . . . . . . . . . . . . . . . . . . . . . 374.0.1 Challenges . . . . . . . . . . . . . . . . . . . . . . . . . . . . . . . . 39
4.1 Framework of the system: . . . . . . . . . . . . . . . . . . . . . . . . . . .. . 39
xiii

xiv CONTENTS
4.1.1 Authentication phase: . . . . . . . . . . . . . . . . . . . . . . . . . .. 404.1.1.1 Text generation . . . . . . . . . . . . . . . . . . . . . . . . 404.1.1.2 Boosting and text generation . . . . . . . . . . . . . . . . . 424.1.1.3 Cascaded Classifier . . . . . . . . . . . . . . . . . . . . . . 44
4.1.2 Writer Verification . . . . . . . . . . . . . . . . . . . . . . . . . . . . 454.1.3 Enrollment Phase . . . . . . . . . . . . . . . . . . . . . . . . . . . . . 47
4.1.3.1 Discriminating information extraction . . . . . . . . .. . . 474.2 Feature extraction . . . . . . . . . . . . . . . . . . . . . . . . . . . . . . .. . 484.3 Experimental setup and results . . . . . . . . . . . . . . . . . . . . .. . . . . 494.4 Conclusion and future work . . . . . . . . . . . . . . . . . . . . . . . . .. . . 57
5 Repudiation Detection in Handwritten Documents. . . . . . . . . . . . . . . . . . . 615.0.1 Automatic Detection of Repudiation . . . . . . . . . . . . . . .. . . . 625.0.2 Applications . . . . . . . . . . . . . . . . . . . . . . . . . . . . . . . 63
5.1 A Framework for Repudiation Detection . . . . . . . . . . . . . . .. . . . . . 635.1.1 Detecting Repudiation and Forgery . . . . . . . . . . . . . . . .. . . 655.1.2 Feature Extraction . . . . . . . . . . . . . . . . . . . . . . . . . . . . 67
5.2 Experiments . . . . . . . . . . . . . . . . . . . . . . . . . . . . . . . . . . . . 68
6 Conclusions and Future Work. . . . . . . . . . . . . . . . . . . . . . . . . . . . . 716.1 Key contributions . . . . . . . . . . . . . . . . . . . . . . . . . . . . . . . .. 716.2 Future work . . . . . . . . . . . . . . . . . . . . . . . . . . . . . . . . . . . . 72
Bibliography . . . . . . . . . . . . . . . . . . . . . . . . . . . . . . . . . . . . . . . . 75

List of Figures
Figure Page
1.1 Within-writer consistency and between-writer variations of handwriting (a) Writer1,(b) Writer2 . . . . . . . . . . . . . . . . . . . . . . . . . . . . . . . . . . . . 5
1.2 Identification framework: Who is the writer of the document among the pool ofwriters? . . . . . . . . . . . . . . . . . . . . . . . . . . . . . . . . . . . . . . 8
1.3 Verification framework: Are the given two documents written by same person? 9
3.1 Training phase: Given documents the main goal is to identify and extract con-sistent primitives. . . . . . . . . . . . . . . . . . . . . . . . . . . . . . . . . .27
3.2 Writer Identification: Given writer-document; extractprimitives; cluster intovarious groups and finally classify the writer. . . . . . . . . . . .. . . . . . . 27
3.3 (a) Stroke and velocity based dominant points(Red Points represents minimumvelocity points and Blue points the corresponding maximum velocity points.)(b)Velocity profile of the stroke . . . . . . . . . . . . . . . . . . . . . . .. . . 31
3.4 curve representation: angles represents shape of the curves and size of vectorsrepresents the size of the curve. . . . . . . . . . . . . . . . . . . . . . . .. . . 32
3.5 Different Clusters extracted from Devanagari script using unsupervised K-meanclustering . . . . . . . . . . . . . . . . . . . . . . . . . . . . . . . . . . . . . 33
3.6 Test data size Vs Accuracy: Test data is represented as the number of curves.Each word on an average have 10-12 curves. . . . . . . . . . . . . . . . .. . . 34
3.7 Number of Writers Vs Accuracy . . . . . . . . . . . . . . . . . . . . . . .. . 35
4.1 Example of text generation based verification system. . .. . . . . . . . . . . . 414.2 Text generation unit for writer verification . . . . . . . . . .. . . . . . . . . . 424.3 Effect of number of stages on the Margin between positiveand negative samples. 434.4 Writer verification framework for low security access control applications. . . . 444.5 Discriminating power of words is inversely proportional to the area of intersection. 484.6 Discriminating table of the characters for pair of Writers. Discriminating table
list five words with highest discriminating power for the 4-writer pairs. . . . . . 484.7 Comparison of (a) False Rejection Rates(FRR), (b) FalseAcceptance Rates (FAR)
and (c) Total Error for different text selection methods forHindi script using DTW 514.8 Comparison of (a) False Rejection Rates(FRR), (b) FalseAcceptance Rates (FAR)
and (c) Total Error for different text selection methods forHindi script using Di-rectional features . . . . . . . . . . . . . . . . . . . . . . . . . . . . . . . . . 52
4.9 Description of Threshold-1 and Threshold-2. In the figure Threshold-2 is takenat 20 percentile and Threshold-1 as max of within writer distances. WritersW4,W5 will be rejected at the shown stage. . . . . . . . . . . . . . . . .. . . 53
4.10 (a) FRR, (b) FAR and (c) Combined error rates for DTW distance for Hindi script 54
xv

xvi LIST OF FIGURES
4.11 (a) FRR, (b) FAR and (c) Combined error rates for Direction features for Hindiscript . . . . . . . . . . . . . . . . . . . . . . . . . . . . . . . . . . . . . . . 55
4.12 (a)FRR, (b)FAR and (c)combined error rates for Direction features for EnglishScript . . . . . . . . . . . . . . . . . . . . . . . . . . . . . . . . . . . . . . . 56
4.13 Number of words comparison as the function of Thresholds, (a) Hindi Scriptand DTW features, (b) Hindi Script and Direction features (c) English Scriptand Direction features . . . . . . . . . . . . . . . . . . . . . . . . . . . . . . .58
4.14 Error Rates as the function of Number of writers (a) English Script (b) Hindi Script 59
5.1 (a) and (b) Natural handwriting samples from 3 writers and (c) Repudiated sam-ples from the writers. . . . . . . . . . . . . . . . . . . . . . . . . . . . . . . . 62
5.2 Framework for detecting repudiation from handwriting.. . . . . . . . . . . . . 645.3 Comparison between two words ’apple’ . . . . . . . . . . . . . . . . . . . . . 685.4 Roc Curve of False Acceptance and Genuine Acceptance rates for the proposed
system. . . . . . . . . . . . . . . . . . . . . . . . . . . . . . . . . . . . . . . 705.5 Histogram of (a) Inter-writer and (b) Intra-writer distances . . . . . . . . . . . 70

List of Tables
Table Page
2.1 Feature extraction methods used for writer identification. . . . . . . . . . . . . 14
3.1 Script Vs Accuracy . . . . . . . . . . . . . . . . . . . . . . . . . . . . . . . .343.2 Accuracy Vs Different Number of Writers . . . . . . . . . . . . . .. . . . . . 34
xvii


Chapter 1
Introduction
With the ease and speed of interactions, electronic media isextremely popular these days, in
the form of e-mails, chats and phone calls. With the advancesin electronic and communication
technologies, traditional inter-personal interactions are getting replaced with interactions over
a communication medium (emails, chat etc.) or human machineinteractions: ATM machines,
digital libraries etc. Knowledge of identity of your peer was taken for granted in traditional in-
teractions. However as digital data replaces the vision andsound in traditional interactions, the
individual’s claimed identity must be authenticated by more rigorous means rather than just being
assumed. Fraudulent use of false identity is one of the most undesirable aspects of automation.
Use of a fast and robust person authentication system can deter crime, help in maintaining social
cohesion as well as save a lot of critical resources from being wasted. Person authentication is
not a new problem and our society had adopted various ways to verify the identity of a person,
i.e., to authenticate the person. The traditional modes of person authentication arePossessions,
KnowledgeandBiometrics. Possessionsinclude physical possessions such as keys, passports,
and smart cards.Knowledgeis a piece of information that is memorized, such as a password
and is supposed to be kept a secret. According to a survey by CyberSource Corp. [1], the cost
of credit card fraud reaches into billions of dollars annually and increasing each year. In 2006
only, fraud in the United-states alone was estimated at$3 billion(an increase of7% over2005).
According to NTA survey [2] in 2002, individual user have average21 different passwords and
they either select easy-to-guess passwords or write them down, which makes passwords based
authentication more prone to forgery. Biometrics solves the problems posed by knowledge and
possession based methods and provides the forgery robust and fast person authentication meth-
ods.Biometricsrefers to the authentication of a person using a physiological or behavioral trait
of individuals that distinguish one person from another. These three modes of authentication
can be used either individually or in combination with others. Knowledgeandpossessionbased
methods are more focused on “what you know” or “what you possess” rather than “who you are”.
At the same time, possessions such as identity cards can be lost or stolen and passwords can be
guessed, this makes the use of such authentication methods prone to forgery attacks. Since, the
personal biometrics traits like face, fingerprints, voice,etc. can not be stolen or easily copied so
biometrics traits can replace current identification methods to identify a person uniquely.
1

This thesis addresses the specific problem of person identification using handwriting: a behav-
ioral biometric trait. Writer identification has many applications in various forensic and civilian
applications. Person authentication using signature, which is being used extensively for person
authentication in banks and documents authentication in general, is a specific instance of writer
identification. With the increase in usage of mobile devicesbased on pen-based input such as
PDA and Tablet PC, the amount of data created in the handwriting form also increases. How-
ever, the use of such documents for various forensic and legal purposes depends on our ability
to assign authorship/writership to the document. Most of the writer identification work is being
done manually as a lot of context dependent information likesource of documents, nature of
handwriting, etc. are difficult to model mathematically, while being easier to analyze manually.
The main objective of this work is to design efficient algorithms for automatic feature extraction
and pattern recognition to identify the writer of a given document with as less human interven-
tion as possible. Connected to the authorship of a document,there are many other interesting
research problems, such as:
1. Personalized handwriting recognition system: Automatic handwriting recognition is one
of the most challenging problem of automatic pattern analysis owing to the within class
variations due to different handwriting styles. It is very difficult to design automatic hand-
writing recognition system for all handwriting styles withhigh accuracy. However, at the
same time, there are less variations within each writer. This problem is being addressed as
the problem of writer adaptation in handwriting literature. The main objective of a writer
adaptation system is to learn the writer specific details from the handwriting of the writer
and adapt those changes to increase the accuracy of the recognition system itself.
2. Quantitative analysis of individuality of handwriting: How much amount of data do we
require to model the writer with significantly high accuracyand how much accuracy for
person identification, we can gain with handwriting as the biometrics.
Specifically, we propose efficient solutions to three different applications of handwriting iden-
tification. First we look at the problem of determining the authorship of an arbitrary piece of on-
line handwritten text. We then analyze the discriminative information from online handwriting
to propose an efficient and accurate approach for text-dependent writer verification for practi-
cal and low security applications. We also look at the problem of repudiation in handwritten
documents for forensic document examination. After introducing the problem of repudiation in
handwritten documents, we propose an algorithm for repudiation detection in the handwritten
documents. Before describing the comprehensive details ofthe work, we briefly introduce some
of the commonly used terms in the field of the writer identification.
1.1 Handwriting: a Behavioral Biometric
Biometrics (origin: Greek, bios =”life”, metron =”measure”) is the study of methods for
uniquely recognizing humans based upon one or more intrinsic physiological or behavioral traits,
2

such as face, iris, hand, hand veins, ear, handwriting, speech, keystroke dynamics, gait patterns,
etc. Physical modalities like face, iris, hand, hand-veins, ear etc. are more invasive and need
cooperative subjects. Behavioral modalities such as, handwriting, speech, gait, etc. are less
invasive. However, high within class variations make them less accurate. Handwriting is a
behavioral biometric trait, as handwriting is generated asthe result of an action accomplished by
the person.
Handwriting identification is the study of differences and similarities of the handwriting of
individuals in order to identify the writer of a given document. Handwriting identification can
be defined as the study of discriminating elements (characteristics or writing habits), which are
simply the manifestations of the habits of an individual. Handwriting identification is based on
the hypothesis that handwriting of each individual is unique and an individual’s handwriting can
be modeled mathematically. However, there still exists a lot of challenges that make handwriting
identification a hard task.
Handwriting identification, like other biometrics such as fingerprint identification, DNA anal-
ysis and face identification, is a discriminatory process. However, it is subject to larger variations
from one occasion to another and even the range of variationsvary between the individuals. Ac-
cording to Huber and Headrick [3]:
”In case of handwriting, no two samples of the same text, by the same individual, with the same writing
instrument, on the same date, and under the same writing and writer circumstances will be identical in
all aspects.”
Some of the factors (as recognized by handwriting experts) that affects the handwriting of
a person includes: Adequacy of standards, accidental occupancies, alternative styles, ambidex-
terity, carelessness or negligence, changes in health conditions of writer, changes in physical
conditions like fractures, fatigue, weakness etc. of writer, changes in mental condition or state
of the writer, concentration on the act of writing, disguiseor deliberate change, drugs of alcohol,
influence of medications, intentional changes for later denial, nervous tension, natural varia-
tions - beyond those of standards, writing conditions - place or circumstances(moving vehicles),
writing instrument, writing position - include stance, writing surface and writing under stress.
Another major difference between handwriting and other physical biometrics traits is that
the handwriting should be readable. It is not free (like fingerprints) to vary from one subject
to another without imparting recognition. It must be written clearly in order to be readable.
Thus there are more chances that two writers duplicate the same style when they are writing the
same text. Thus extraction of writer information from handwriting is challenging compared to
verification based on physical biometrics traits, due to thelarge intra-class variation (between
handwriting samples of the same person), and the high inter-class similarity (same words being
written by different people). Further, the handwriting of aparticular writer may also be affected
by the nature of the pen, writing surface, and the writer’s mental state.
In addition to the above, challenges in handwriting identification increase further when user
is not cooperating. Two major problems arise usually due to uncooperative users.Repudiation,
also called negative biometrics in biometrics literature,comes in to light when person tries to dis-
3

guise himself from the system by not revealing his identity.The problem ofForgery, also called
positive biometrics, arises when a person tries to copy someone else’s identity(handwriting).
Forgeries have been focus area in other fields like signatureidentification. However, the prob-
lem of repudiationin context of handwriting has not been addressed before. In short, challenges
of traditional handwriting identification can be summarized as follows:
• High within writer variations: Documents written by the same writer are also quite dif-
ferent at different times based on mood and conditions, which adds to high intra-class
variations of the handwriting.
• Low between writer variation: Each writer is basically trying to write the same word or
character. At the same time, there is not much scope for variation, as handwriting must
also be readable. This makes the variations between handwriting of different writers, low.
• Repudiation and Forgery: These problems of handwriting are caused by non-cooperative
individuals. The result of repudiation is increase in within writer variations, as the writer
essentially is trying to alter his handwriting. However, inthe case of forgery, the between
writer variations become less, as a writer is deliberately trying to copy someone else’s
handwriting.
Based on the above discussions, it can be concluded that the problems in writer identification
is quite different from other biometrics and thus needs different attention and methods as com-
pared to other physical biometrics. Another major difference in writer identification is that some
part of the handwriting can be more informative and more discriminating than other text for a
particular writer.
In spite of all these problems, it has been shown by the forensic experts, that handwriting
identification is possible. They have shown that even repudiation and forgery detection can be
done, if the examination is carried out at an appropriate level of precision. From the principle of
exclusionandinclusion, inferred by the document examiners from their experience in the field,
one can’t exclude from one’s own writing, those discriminating elements of which he/she is not
aware, or include those elements of another’s writing of which he/she is not cognizant[3]. Next
section will explain in detail what makes handwriting identification possible. We also describes
various individuality features of the handwriting.
1.1.1 Individual Features of Handwriting
Challenges and variations posed by the handwriting makes usto think whether the writer of a
document is uniquely determinable with sufficient confidence. We have discussed various factors
which do influence handwriting of the individuals. In this section, we will discuss the factors
which make handwriting individuality possible. The major goal of handwriting identification
systems is to find out whether the difference between the documents is significant enough and
overtake the similarities between the documents. Handwriting identification is possible based on
two accepted premises or principles:
4

(a) (b)
Figure 1.1Within-writer consistency and between-writer variationsof handwriting (a) Writer1,(b) Writer2
• Habituation: People are primarily creatures of habits and writing is the collection of those
habits. Writing habits are considered neither instinctivenor hereditary but are complex
processes that are developed gradually.
• Individuality or heterogeneity of handwriting:Each individual had his own style of writ-
ing. Nature has not given the same style to any two writers. Inshort, no two individuals
can have the same handwriting.
Numerous elements of writing become habitual with practise, and the execution becomes
more automatic as the writing process separates itself fromthe thought process. The individual
is being more concerned about what is being written rather than how it is being written. Due
to complexity of writing process, the individual develops his/her own idiosyncracies in both the
shape or form of letter and fashion in which they are combined, all of which become habitual
gradually. All these habits make the handwriting of the individuals different from one another.
See Figure 1.1 for within writer consistency and between writer variations while writing same
document.
Based on the handwriting experts [3], the discriminating elements of handwriting can be
segregated into two main categories (Elements of style and execution) and two minor categories
(consistency and lateral expansion):
1. Elements of style: Consists mainly of arrangement, connections, construction, design,
dimensions, slant or slope, spacings, class and choice of allograph(s). With the exception,
5

perhaps, of construction, these are the aspects of writing that play a significant role in
creating pictorial, general or overall effect. Differences in the construction, of course, do
not necessarily alter the overall effects.
2. Elements of execution: Consists of abbreviations, alignments, commencements and ter-
minations, diacritic and punctuation, embellishments, line continuity, line quality or flu-
ency(speed), pen control(includes pen hold, pen position,and pen pressure), writing mo-
ment, (including angularity) and legibility or writing quality (which includes letter shapes
or letter forms for any given allograph).
3. Consistency or natural variations and persistency
4. Lateral expansion:Horizontal dimension of a group of successive letters and words and
word proportions (Vertical Dimension Vs Horizontal Dimension and the Product of size
and spacing).
All these features are used by the handwriting experts during handwriting analysis. It may
not always be possible to compute all these features mathematically either due to the absence
of sufficient data needed for statistically stable computations or due to the absence of efficient
algorithms to compute this.
In addition to the above features, which can be computed fromthe handwritten documents,
logical and analytical features are also being used by handwriting experts for the final conclusion
during manual inspection. The fact that such determinationis possible and done by experts make
automatic handwriting identification possible even if it isnot an easy one. We now look at various
categories of problems in handwriting analysis.
1.1.2 Handwriting Recognition Vs Writer Identification
Handwriting has received much attention from the time human-beings started writing. The
ease and individuality of handwriting made it to expand as a major communication medium.
With the advent of easy to use and fast electronic communication and storage mediums, the
focus starts shifting from handwriting. However, still handwriting is one of the major modes of
expression and data storage, for example, there are specificsituations such as classrooms, one-
to-one discussions, meeting, etc. where handwriting is still the major medium for note taking.
At the same time, with the advent of electronic handwriting devices such as PDA, Tablet PC,
research interests in the field of automatic handwriting analysis have gain significant increase in
the last two decades. Researchers are always attracted by non-intrusive nature of handwriting
data entry methods as compared to keyboards and speech. At the same time, keyboards can not
be used for data entry in all languages that can be done easilyusing handwriting. This makes
automatic handwriting recognition even more popular.
At the same time, the complexity of handwriting generation process have always attracted
many researchers to explore the field of automatic handwriting analyst. The study of handwriting
has been done from various perspectives, based on the information content to be extracted from
6

the handwriting. The information that is present in the handwriting can be categorized as text
level information (what has been written), person style information (who has written it), and
noise (due to external factors like pen, paper, etc). The extraction of the former is addressed as
handwriting recognition and latter is known as writer identification in literature. Both the forms
of handwriting analysis look quite similar, which essentially is not the case.
• Handwriting recognition : Handwriting recognition is a process to extract the style invari-
ant features to eliminate variations added due to differenthandwriting styles. The major
goal of handwriting recognition is to extract the underlying text, automatically. This will
enable us to use many automatic systems that are controlled using handwritten query. The
handwriting recognition systems look for style invariant features, so that the variations
added due to different handwriting styles can be eliminated. Thus, handwriting recogni-
tion require eliminations of variations due to different writers.
• Handwriting identification : Writer identification is a process to identify the writer ofthe
documents. In writer identification systems, features are extracted that can discriminate
between different writers i.e., features based on the styleof the writer. In short, writer
identification requires enhancement of the variations due to style.
Based on the above arguments, it can be concluded that both handwriting recognition and
handwriting individuality are two opposite facets of handwriting analysis. Another major field
that is closely related to handwriting individuality isGraphology [4] (Study of handwriting to
analyze the personality of the person).
1.1.3 Text independent Vs Text dependent systems
Automatic handwriting analysis is more constrained and challenging than manual analysis of
documents. From the point of view of pattern recognition, techniques for writer identification
can be categorized as text independent and text dependent.Text-dependent systemsare more
constrained and require similar verification and enrollment text. Text dependent systems are
closer to signature verification systems and thus inherit the problems associated with signature
verification, such as, forgery. Text dependent methods are more general in approach than the
signature identification. These methods, therefore, require prior localization and segmentation
of the relevant information, which can be performed interactively by the human user or by an
automatic segmentation algorithm.Text independent systems, on the other hand do not make any
assumption about the underlying data. Text independent methods for writer identification and
verification use statistical features, extracted from an entire block of handwriting. A minimum
amount of handwritten data is needed to ensure the stabilityand consistency of characteristics
extracted from the data.
Both the text-dependent and the text-independent systems have their pros and cons. Text de-
pendent systems provide high accuracy and confidence with small amount of data, which is not
7

FeaturesExtract
Writer−1
Writer−2
Writer−3
Writer−4
Document−1
20
17
15
10
Similarity Scores
Writer−4
Result
Writer Identification Framework
Figure 1.2 Identification framework: Who is the writer of the document among the pool ofwriters?
possible for text independent systems. However, they are more prone to forgery, as the verifica-
tion text is known in advance. In case of text independent systems forgery is not a major problem
as the text-independent systems extract less frequent properties from the handwritten document
that are difficult to forge. The major problem with text-dependent system is of annotation of
data prior to training. Automatic annotation can be done using either a handwriting-recognition
engine or an alignment engine. However, the state-of-art inhandwriting recognition systems in
not such that it can be used prior to writer identification. Moreover, handwriting recognition
systems are not available for all languages and at the same time it is an expensive operation.
Since text-independent systems generally do not require annotated text, they are better from a
practical point of view.
The use of text independent or text dependent system fully depends on the application and
availability of data. For example, in the case of forensic applications, we can not control the
proceedings, i.e., we can not make sure the data that is available for verification is same as that
of reference handwriting, thus the only option is to use text-independent system. However, as
data is less manual alignment can be done easily and a text-dependent algorithm can be used.
We will be using these two terms frequently and the difference will become more prominent and
clear.
1.1.4 Verification Vs Identification
The problem of resolving the identity of a person can be categorized into two fundamentally
distinct types of problems with different inherent complexities: (i) Verification problems and
(ii) Recognition (Identification) problems. Verification refers to the problem of confirming or
denying any identity claim (am I who I claim I am?). Verification is generally a two class
problem. Identification, on the other hand is the problem of establishing the identity of a person
from a group of people (close identification problem) or otherwise (open identification problem).
Writer identification systems make one-to-many comparisons with a given database of writers
8

Extract Yes
No
Statistics Compare
Writer Verification Framework
Figure 1.3Verification framework: Are the given two documents writtenby same person?
and returns a writer or a list of probable writers. Writer identification system essentially can
be thought of as information extraction system from a given pool of database of writers, where
features are specific to the writer of the document. The identification problem can be formally
posed as: given a input feature vectorXQ, determine the writerWi, i ∈ 1, 2, . . . ,N,N + 1.
HereN is the number of writers enrolled in the system andN +1 is the case for rejection option
where no suitable identity is determined for the input. Assume thatS(., .) is the similarity
function between two feature vectors.
Xq ∈{
Wk if (k = maxkS(Xq,Xwk) and S(Xq,Xwk
) > η)
Wk+1 otherwise(1.1)
In the case of document analysis, the verification systems work in two different modes. In
the first mode, the system verifies the claim made by a person previously enrolled in the system.
The given problem can either be solved using one-to-one comparison or using one-to-many
comparisons. In one-to-one comparison, the questioned sample is compared with the reference
sample of the claimed identity stored in the database. Identity is then established using similarity
score and within writer distance threshold (calculated during training phase). The case of one-
to-many comparison is essentially same as the writer identification, as the questioned sample is
compared with all the samples from the database and the writer with the minimum distance is
compared with the claimed identity. The one-to-one problemin case of verification can be posed
as: given as database of writers, questioned documentXq and the claimK,
Y =
{
1(Accept Claim) if (Dis(Xq,Xwk) < η)
0(Reject Claim) otherwise, (1.2)
Here,η is the threshold of between-class and within-class distance, calculated during training
stage.
9

In second mode, verification problem verifies whether two given documents,Questioned doc-
ument, whose identity need to be verified andReference document, which is collected from the
writer for comparison, belong to the same writer or not. The writer of the reference document
may or may not be known. This is the major problem in case of forensic documents, where usu-
ally two documents need to be compared. This problem can be thought of as the more general
instance of one-one verification problem. The difference between the two is that in this case
no database of writers is available and thus, a threshold cannot be computed. In order to solve
the problem, some statistical measure is needed to compute the significance of the score. The
problem ofrepudiationand forgery detection comes under this category. The generic problem
of writer verification can be stated as follows: given two documentsDQ andDR, we need to
find out whether two documents belongs to same writer or different writers.
Y =
{
1(Same Writer) if(H(Dis(Xq,Xr)) > η)
0(Different Writers) otherwise, (1.3)
HereH(.) calculates the statistical significance of the distance measure.
1.2 Applications
Handwriting biometrics, can be applied in a lot of fields. However, based on security and other
aspects, applications of any biometric systems can be broadly divided into following categories:
• Personalized handwriting recognition systems:A general handwriting recognition system
can not perform as accurate as is required, since it is difficult to learn the variations due to
the different handwriting styles. However, an adaptive (handwriting recognition) system
for an individuals’ needs to learn the personal handwritingtraits of a writer. Since the
writing style of an individual is consistent, recognition performance will be better. Auto-
matic writer identification system can be used as the preprocessing step to recognition that
can identify the handwriting style and perform the handwriting recognition specific to the
writer. To this end, we have developed an automatic writer identification algorithm that
can learn the discriminative features in a individual’s handwriting.
• Low security access control systems:Handwriting is considered as a weak biometric trait
based on amount of discriminating power it posses, however it can be used for low se-
curity access control applications, where the cost due to false accept is quite low. Low
security applications, such as access to personal computercan be done using writer identi-
fication system rather than a password, which is the common practice these days. Our aim
in this context was to enhance the verification accuracy and propose a forgery resistant
handwriting verification algorithm.
• Automatic forensic document examination:The field of forensic handwritten document
examination is concerned with issues such as determining whether the writer of a docu-
ment (say a Ransom Letter) is the same as the known writer of sample documents, whether
10

the given piece of handwriting is genuine or forgery, whether the writer of the documents is
trying to conceal his identity, etc. We have specifically addressed the problem of detecting
repudiation with a statistical framework.
Forensic applications are the major applications of handwritten documents examination. The
major issue in any forensic document examination is the highrisk associated with the result.
Civilian applications require less security. However the main concern in civilian applications is
the ease of use.
1.2.1 Online Vs Offline Handwriting
Based on the nature of data availability, handwriting analysis systems can be categorized as
online or offline handwriting systems. Offline handwriting refers to scanned images of handwrit-
ten documents. Online documents contain temporal information of the pen movement such as
stroke order information together with pen up-down events.Since, online documents have more
information as compared to offline documents, systems working on online data are supposed to
provide more accurate results. However, both online and offline documents are associated with
different set of problems and challenges. Even though, online documents have more information,
their within writer variations is also more, that makes modeling and recognition tasks difficult. In
the case of offline documents the temporal information is lost. In a lot of practical applications,
online data is not available, such as forensic applications. However, in the case of access control
applications, a user can be asked to provide online data. Since, online and offline handwriting
documents have different set of problems and information and thus require different processing
methods and need to be studied differently than offline handwriting based approaches.
1.3 Contributions of the thesis
The key contributions of this work are:
1. Proposed a method for identification of discriminating features for text-independent writer
identification [5]. The key characteristics of the system are:
(a) Presents an algorithm for automatic extraction of consistent features for writer iden-
tification.
(b) Robust to forgery and
(c) Provides a script-and text-independent framework.
2. A framework for repudiation detection in forensic documents [6]. Key insights are:
(a) We introduce the problem of repudiation for handwritingfor the first time, and
(b) Presents a hypothesis testing based framework for writer verification in forensic ap-
plications.
11

3. Text dependent writer verification for civilian applications [7]. The key contributions of
the work are:
(a) An algorithm to generate writer-specific test sentencesfor individual writers.
(b) Forgery resistant framework by implanting randomness into the generation process,
and
(c) Applicable to low security access control and civilian applications.
1.4 Thesis overview
This thesis is organized as follows. Chapter-2 presents theoverview of the work that has been
done previously and describes features and pattern recognition techniques that has been applied
to the online and offline handwriting identification. The next chapter presents the framework
for text-independent writer identification using online handwriting. The framework presents the
code book designing algorithm together with the empirical results to prove the applicability of
the proposed algorithm. Chapter-4 explains a text-dependent technique for practical and low
security applications of writer verification. The system presents a boosting based approach for
text-selection specific to a writer. Chapter-5 presents a framework for repudiation detection in
handwritten documents. The problem of repudiation have notbeen studied before in context
of handwritten documents. We, first introduce the problem ofrepudiation and then presents a
solution for repudiation detection, together with empirical results. The conclusion and future
work is presented at the end.
12

Chapter 2
Background and Related Work
Owing to the need and applications of handwriting analysis in various forensic and civilian
domains, many researchers have been attracted towards the field. The security of documents
always has been a major concern, however due to advances in electronics and digital media, as
traditional interactions are being replaced by electronicinteractions, these concerns have become
more vital. Need for automatic document analysis and the complexity of handwriting generation
process have always attracted researchers towards it. Signature verification systems had been
used previously to authenticate handwritten documents. However, handwriting itself contain
individuality information about the writer that can easilybe used for writer identification. Writer
identification system also have various advantages over traditional signature based verification
systems. Moreover, signature identification is the specificsub-field of handwriting identification,
in which a writer is to be verified based on some specific predefined text chosen by the writers
themselves, i.e.signature of the writer. This chapter willpresent the insight in to the related work
and various approaches used by different researchers for writer identification. Comprehensive
survey of work until1989 has been published in [8]. With the advent of new technologies,
a variety of new approaches have been proposed for the problem of writer identification and
verification. We will try to include most of the known approaches that have significant impact
on this field.
Chapter is organized as follows. First two sections presentthe details about text-dependent
and text-independent systems. Section following that willlist out the remaining pen input ap-
proaches which are not described in previous two sections. Next section will present the details
about various machine learning and pattern recognition methods for writer identification and
verification. Analysis of the field based on features, classifiers and results is included at the end.
2.1 Text-dependent approaches
Text dependent approaches assume the similar text to be usedfor enrollment and authentica-
tion. Signature identification is a specific instance of textdependent writer identification. In case
of signature identification, writer himself choose the textthat will be later used for verification,
i.e. signature of the writer. The major difference between general text dependent handwriting
13

Feature-Level Handwriting Type Feature Description
Text-Dependent
CharacterOffline
GSC features [9,10]Structural features [11–14]Directional features [15]
Online Pen-input features [16]
Word OfflineGSC, WMR, SC, SCON [17,18]
Morphological features [19]
Text-independent
Line Features
Offline Connected ComponentsEnclose regions,
Lower and upper profiles,Fractal features [20,21]
ParagraphOffline
Gabor, GSCM [22,23],GGD, contourlet GGD [24,25]Directional features [26–28]
Code-book generation [29–31]Online Code-book Generation [5,32]
Image Processing Document OfflineGrey scale features [33,34]
Grey scale Histogram [35,36]Run length coding [37]
Pen Input Feature Document Online
Pen Pressure, Velocity, Azimuth [38]Velocity bary center [39]
Point Distribution model [40]Continuous Dynamic programming [41]
Table 2.1Feature extraction methods used for writer identification.
identification system and signature verification system is that in case of general text dependent
system user may not have enough freedom to choose verification text. User can be asked to
write some predefined text for verification, which is not known before. Moreover general text
dependent writer identification system are more complex than normal signature verification, as
the signature of a person can be a scribble that may or may not be readable. However, in case of
general text dependent writer identification words are mostly written to be readable and as the
other person is also trying to write the same word, difference between-writers and within-writer
distances will reduce more.
Text dependent systems suffer from the major drawback of vulnerability to forgery. Since the
verification text is known in advance, the system sometimes become prone to forgery. The com-
parison of similar text may look easier on the first instance,however, since no two handwriting
pieces of the same individual are exactly the same, containsa lot of within-writer variations, it
sometimes becomes difficult to verify whether the distance between handwritten documents is
due to within- writer variability or words are actually written by different writers. Analyzing the
handwriting variations between two documents, Harrison [3] once expounds that:
”... it is not surprising that when specimens of the handwriting of one person written under different
conditions are compared, there should be a doubt expressed that one individual was responsible for writ-
14

ing all the scripts, so different they appear.”
However challenging may be the text-dependent systems, butsince the text-dependent sys-
tems rely on similar text comparisons, they can provide highaccuracy as compared to text-
independent systems with small amount of data. The text-independent systems, on the other
hand, use less frequent properties of handwriting that can not be extracted from lesser data.
Based on above arguments, major challenge of text-dependent systems is to classify the distance
between similar pieces of text as the within-writer and between-writers distances. Various re-
searchers have studied the problem of the text-dependent writer identification for both online
and offline handwriting. In this section, we discuss the details of various feature extraction
methods used for text dependent systems. One should note thepoint here that for the practical
text-dependent systems, the features extraction should bedone at lower level, i.e., sub-character,
character or word level. Since paragraph or line-based feature may not be practically feasible.
We categorize the feature extraction methods according to document level hierarchy, i.e., char-
acter, word, line and paragraph.
2.1.1 Sub-character and character level features
Huber and Headrick [3] have identified some features (refer to section 1.1.1) those are used
by forensic experts for manual or semiautomatic document examination. According to hand-
writing experts size and shape of the characters have large amount of individuality information
associated. Researchers have tried to design computational algorithms to extract the shape and
size based individuality of the characters.
Srihari et al. have studied the problem of individuality of characters [9] and numerals [10]
for offline handwritten documents. Srihari have proposed computational algorithms for size
and shape estimation of characters, called micro-features. Micro features are512 bit features
corresponding to gradient(192 bit), structure(192 bit) and concavity(128 bits) and are computed
locally from the character image. Micro features have extensively been used previously for
handwriting recognition purposes. Gradient features are the distribution of the directions of
gradient elements extracted from the image using 3X3 Sobel operators and represent shape of
the characters. Structural feature extractor takes gradient map and looks in the neighborhood for
certain combinations of gradient values that are used to represent the strokes and corner of the
image. Concavity features is extracted by applying a star like operator in eight directions at each
of the white pixels to extract the strokes, holes and concavities. More information about micro
features can be found in [42].
In the study, micro features(GSC) are found to be discriminating for the writers. Nearest
neighbor classifier is used for identification and AritificalNeural Network (ANN) for verification
to classify the dichotomy of within-writer and between-writer distances. Srihari analyzed that
the numeral ’1’ and ’0’ are least discriminating. Accordingto the study, ’G’, ’b’, ’N’, ’I’, ’K’,
’J’, ’W’, ’D’, ’h’, ’f’ are the 10 most discriminating characters.
15
Leedham et al. [11–13] have also proposed11 different binary features those correspond
closely to the conventional features extracted by forensicexperts. Leedham essentially tried to
design exact algorithm for conventional Features. Featureinclude aspect ratio, number of end
points, number of junctions, shape size and number of loops,width and height distributions,
slant, shape, average curvature, and gradient features. Leedham et al. [14] also proposed a
method based on25 structural features extracted from the skeleton of word ’th’, in order to
establish the individuality power of each of the25 structural features, such as, height, width,
aspect ratio, presence of loop, structure of t-bar, structure of h-stem, stroke width, number of
strokes etc. The height of the character is found to be relevant (more discriminating), while
width and pseudo-pressure information was not found as relevant(less discriminating). Wang et
al. have analyzed the strength of the directional features for the offline character images. Feature
computations had been done by dividing the image into sub-regions and calculating different
values. Principle Component Analysis (PCA) and Linear Discriminant Analysis (LDA) is used
to reduce the dimensionality of the feature vector and to make it more discriminating. More
information about the feature extraction process is given by Wang [15].
Except these set of features, which are extracted from character image(binary or grey level),
researchers have also designed algorithm for features extraction for online handwriting. On-
line handwriting has extra temporal information about the sequence and the structure of the
strokes in the character [43] and thus possess more individuality information about the writer.
Yoshikaju [16] has done analysis on the individuality powerof the characters (Kanji) from online
handwriting. He extracted the features such as writing duration, pen-up and pen-down duration,
pen pressure, pen azimuth, bounding box, the aspect ratio, centroid, the length of stroke etc., for
each character, stroke and sub-stroke. Features have been evaluated with one-way Analysis of
Variance (ANOVA) and the Kruskal-Walls tests. Some of the features such as, relative position
of terminations and commencements, pen inclination, absolute starting position and length were
found to be more discriminating than other features. These features directly correspond to the
conventional features such as terminations, beginning, pen pressure and pen inclinations and can
also be used for forensic analysis such as repudiations and forgery detections.
2.1.2 Word level features
According to the handwriting experts also the handwritten words possess a lot of individuality
information in the form of character-spacing and connections. Handwriting experts have been
using these properties since a long time manually. In case ofautomatic handwriting analysis, the
word based features have a long history, starting with the work of Steinke’s work [44].
For establishing the discriminating power of the words [17,18], the micro features together
with the other word comparison features(segmentation freeand segmentation based) are used.
Tomai et al. have used four different type of feature extraction methods: (i) GSC(Gradient,
Structural and Concavity features) [42], (ii) WMR (Word Model Recognition) [45], (iii) SC
(Shape curvature) and (iv) Shape context [46]. The WMR features capture the distribution of
the directions in the each segment of the word. Shape Curvature represent the complexity of the
16

character through curvature information. The Shape-context has been demonstrated by Belongie
et al. [46] as the robust object recognition method using shape based comparison. The Shape-
context establishes the similarity between objects using critical points of the contour. Results
have been published for1000 writers that is the largest database used by any expert in thefield.
According to the study, larger words are more discriminating. However, the words which contain
higher discriminating characters (e.g. ’G’,’F’ [9]) are also more discriminating. For about10
words, the highest accuracy (GSC features) of62% and82% have been reported for identification
and verification, respectively.
Another set of features which has also been considered is morphological operations. Morpho-
logical operations extract information about geometricaland structural properties of the words.
Zois and Anastassopoulos [19] has performed writer identification and verification using mor-
phological operations on thinned word images. The word image is processed with horizontal
opening operator of increasing size to estimate the area distribution under the functionp(x)
(vertical projection profile). Another set of features is obtained using central moments. Clas-
sification is performed using Bayesian classifier and multi-layer perception (ANN). Accuracies
around95 percent are obtained for both Greek and English scripts.
In case of online handwriting, Nakamura et al. [16] has analyzed the individuality power
of the handwriting words using features similar to the character together with space between
subsequent characters(or strokes). Bunke et al. [20] have also analyzed some of the character
spacing based features for text independent offline handwriting. However the method has been
used for the text-independent comparisons.
2.1.3 Line and paragraph level features
In case of the text-dependent handwriting identification, it is impractical to expect same line
to be written (by the writer) for authentication. We as such are not aware of any system(text-
dependent) based on the line and paragraph level features. However, many line and paragraph
level approaches have been discussed in text-independent context.
2.2 Text Independent Methods
Text-independent methods as opposed to text-dependent do not make any assumptions about
verification text. At the same time these systems do not generally require any recognition or seg-
mentation engine prior to authentication which is the majoradvantage of these systems over text
dependent systems. Since state-of-the-art in handwritingrecognition is not such that they can
be used as automatic annotation systems, most of the annotation work has to be done manually
that makes annotation a very difficult task. Moreover, for most of the languages in the world,
recognition engines are even not available. Also the assumption about the verification text is also
infeasible in a lot of circumstances. For example in case of forensic document examination task,
we do not have any control over the proceedings.
17

However, text independent systems require large amount of text for training, in order to learn
the less frequent user specific properties of the writers with high statistical stability. Most of
the text independent approaches assume each writer as a stochastic generator of the ink-blob
shapes and graphemes. According to these approaches handwriting generation is a neuromus-
cular process and human being a consistent generator of similar invariant shapes or graphemes.
Each individual’s handwriting is considered as a differentcombination of smaller number of
graphemes, with only difference in distribution and shape of these invariants. As these invariants
can not be learned using characters or words only, most of thetext independent systems are based
on line, document level features. As such we are not aware of any system (text- independent)
just based on character or word level entities.
2.2.1 Text Line Features
Conventional features, used by forensic experts include line level features such as, word-
spacing, line slant and line slope etc. These features are not dependent on the text and thus can
be used for text independent approaches. Bunke et al. [20] has analyzed some of the line-level
features for offline documents and can be categorized into different categories, as follows:
1. Connected components:Spacing between the characters within the word is one of the ma-
jor individuality components. However, in case of non-annotated data it is very difficult
to segment words at character-level. Character level segmentation [47] is still a very diffi-
cult problem in document analysis. Thus in order to Analyze spacing between characters,
Bunke segmented the words into smaller units based on some predefined heuristics. Spac-
ing between bounding box of connected components is calculated and average, variance,
distribution of spacing are used as features. This feature directly correspond to character
and word spacing parameters.
2. Enclosed regions:Enclose regions represents the holes, blobs and loops present in the
character. Srihari [9] has identified character ’G’ as the most discriminating character
due to the presence of loop. Enclosed regions(blobs) are calculated using standard region
growing algorithms [48, 49]. Size and shape of these regionsare being calculated using
formulas given in [20]. Bunke later found this feature not much discriminating as the
number of blobs are quite small for each text line that may notbe able to model the
individual’s handwriting style.
3. Lower and upper profiles:A number of features have been extracted using upper and lower
profiles of text lines. Profiles are calculated as upper and lower points from each column.
Gaps between the words are eliminated shifting columns to the left. Slope of lines is
calculated using linear regression analysis on upper and lower profile. Mean square error
of upper and lower profiles are also used as a feature. frequency of minima and maxima are
also used for writer classification. All the above features that correspond to the profiles are
the measure of slant and slope of the line that has been used frequently by the handwriting
experts.
18

4. Fractal features:[50,51], showed previously that fractal geometry is usefulto derive fea-
tures that can characterize handwriting styles. The basic idea behind fractal feature is to
measure how the area A (i.e. number of pixels) of a handwritten text grows when we
apply a dilation operation on the binary image. In the study,line images are dilated using
disk-shape and ellipsoidal- kernels of increasing radius.Disk shape kernel results in an
evolution graph that is invariant under rotation of the original image. Three slope param-
eters related to this evolution graph was used to characterize the writer. Fractal features
extract the direction of individual strokes and stroke segments. More information about
fractal feature can be found in the paper [20].
5. Basic features:Other features such as height of three main writing zones (upper, middle
and lower), width of writing have also been used. More information about computational
algorithms of these features can be found in [21]. .
Classification experiments for50 writers were performed using5-nearest neighbor based clas-
sifiers. Out of all the features blob features have the lowestclassification rates as the number of
blobs are quite small in the line and thus could not be modeledaccurately. Best performance
was provided by fractal features of around86.2% accuracy. With all the lines and all the features
taken together99.6% accuracy was reported
2.2.2 Paragraph/document level features
In case of forensic applications of handwriting one strivesfor 100% accuracy from a list of
100 available writers. Methods defined above are not able to get up to that level. Some methods
are required that can automatically generate the features from the document without much human
intervention. Next few sections will describe some methodsbased on that.
2.2.2.1 Texture Analysis
Texture analysis based methods assume handwriting of the individual having discriminating
and consistent texture. Various texture analysis based approaches have been proposed that in-
cludes2-D multi-channel Gabor filters (MGF), gray scale co-occurrence matrix (GSCM) [52],
wavelet based generalized Gaussian density(GGD) models, and contour-let based GGD mod-
els. Texture components essentially capture the directional components from the handwritten
document image that are very essential for writer identification.
Multichannel Gabor [22] filter technique is inspired by the psycho-physical findings that the
processing of pictorial information in the human visual cortex involves a set of parallel and quasi-
independent mechanisms or cortical channels which can be modeled by bandpass filters. Using
MGF and GSCM, accuracy of96% are reported for40 writers with 1000 documents. [53–55]
also proposed other Gabor filter based approaches.
2-D Gabor filter is an effective writer identification method. Usefulness of 2-D Gabor filter
together with GSCM features has been demonstrated in [23,56–58].However, it still suffers from
19

some inherent disadvantages. One of the most serious disadvantages is the intensive computa-
tional cost, because the 2-D Gabor filter has to convolute thewhole image for each orientation
and each frequency. Compared with the Gabor filter, 2-D wavelet GGD [25] can decompose the
image into sub-bands with different frequencies and orientations. So, we only need to deal with
the specified wavelet sub-bands according to the selected values of frequency and orientation.
Wavelet-based GGD not only improves the identification accuracy but also greatly reduces the
computational cost as well.
Wavelet-based GGD [25] is good at catching separate edge points of image, however it can not
notice the contour along these edge points, that actually means that the wavelet fails to represent
the geometric structure of image. However, contourlet [59]is an image representation scheme
which owns a powerful ability to efficiently capture the smooth contours of image. Contourlets
not only possesses the main features of wavelets (namely, multi-scale and time-frequency local-
ization), but also specially decompose the sub-band at eachscale into different directional parts
with flexible number. Contour-let based GGD method for texture analysis perform better as well
as faster than both Gabor filter and wavelet-based GGD. Information about implementation and
usage of contourlet based GGD can be found in [24].
2.2.3 Directional features
Handwriting modeling approaches [60–64] have shown that distribution of directions of the
strokes while represented in the polar system have ability to characterize the writer. Schomaker
et al. [26, 27] proposed an approach using edge based directional features. They have proposed
a new feature: edge hinge distribution, that can characterize the changes in direction undertaken
during writing. The hinge is being placed on each edge pixels, with its legs aligned along the
edges. The joint probability of the angles that legs of the hinge makes with the horizontal was
used as a feature in polar coordinates space. Run length of these directional features are also
used as second feature. The joint PDF of ”hinged” edge-anglecombinations outperformed all
the other evaluated features. Further improvements are obtained through incorporating location
information by extracting separate PDFs for the upper are lower halves of the text lines and then
adjoining the feature vectors [28].
2.2.4 Code-book Generation
According to handwriting modeling papers [65,66], handwriting consists of concatenation of
ballistic strokes, which are bound by the points of high curvature. Curve shapes are realized
by the differential timing of movement of the wrist and fingersubsystem. In spatial domain, a
natural coding therefore is expressed by angular information of the curve [67].
This subsection presents some of the techniques used to generate codebook of strokes from
online as well as from offline handwriting which was used later for identification and verifica-
tion. In case of offline documents, Bensefia et al. [29, 68–70]used distributions of graphemes
generated by a handwriting segmentation method to encode the individual characteristic of hand-
20
writing independent of the textual content. Handwriting characters are divided into graphemes
using some segmentation method. Experimental results are reported on three data sets containing
88 writers,39 writers and150 writers, with two samples (text blocks) per writer. Writer identi-
fication is performed as an information retrieval frameworkwhile writer verification is based on
the mutual information of the grapheme distribution in given two documents using hypothesis
testing based framework. Yoon et al. [71] have described a method to classify profiles of the
writers based on handwriting style codebook. They have usedfeatures like gradient (slant) etc
to classify the handwriting style.
Another work related to graphemes based approach is proposed by Balacu et al. [28, 30, 72,
73]. They proposed an autograph based approach to identify various connected components
contour from offline handwriting of individual. Code book ofthese connected components was
constructed using various clustering algorithms. Resultsare reported on the data set of150
writers, with top-10 performance of97 percent.
In an another approach [31,74] the reference code-book is generated using fractal based image
compression techniques. Fractal compression is a technique that has been developed [75] and
mostly used in the field of image compression. Fractal based feature extraction methods consider
a given image I, as the fixed point (or attractor) of a geometrical transform T defined on the set
of all images with same size. It is deduced from one of the usual ways some synthetic images
are generated, fractal images.
In case of online documents, we [5] proposed a work to construct the code-book of hand-
writing styles from online handwriting. We proposed a method to extract writer specific curves
using the velocity profile the strokes. Velocity profile is used to segment the strokes into different
units. The size and shape of the curves together with distribution of these curves was used as
the discriminating features. Major difference in previoustwo approaches and our approach is in
feature space since the feature corresponding to previous two approaches uses only distribution
of the curve. However, shape and size of these curves also make some impact on the individu-
ality information. In another approach for online documents [32, 76–78] proposed a method to
cluster the strokes based on some previous designed clusters of stroke type and then used the
distribution of properties on these strokes for the writer characterization.
The major difference between all these approaches is in the method of segmentation and
clustering. The common point of all these approaches is thatthe first reference strokes are
segmented from the handwriting and then using some clustering methods common code-book
of each writer is constructed. Writer is identified/verifiedbased on this code-book. [79] also
provides the clustering comparison for stroke clustering.
2.2.4.1 Image processing features
Except all these features lots of other features based primarily on the image processing tech-
niques are also being analyzed and studied. Some of these features have been described and used
by Srihari [33,34], called macro features. Macro features are extracted at the document level or at
21

paragraph level. Macro features are classified into three groups: pen pressure (entropy of Grey
Level, Grey level threshold, number of black pixels), writing movement(interior contour and
exterior curves), and stroke information(vertical, horizontal, positive and negative slope compo-
nents). Macro features correspond closely with conventional features extracted by experts. [80]
have also used Grey level histogram for writer profiling. [35,36] have used run length histogram
for writer authentication. [37] have analyzed timing information contained in the on/off paper
motions of handwriting for its applicability to the problemof handwriting identification.
2.3 Online Handwriting
With the advent of PDA and Tablet PC, pen input devices are becoming more common in
practice. The major advantage of online devices is the extratemporal information together with
pressure information associated with the devices. This information has been used for the purpose
of writer identification. [38, 81] proposes writer identification framework based on pen input
based features like pen pressure, velocity, pen azimuth etc..
Velocity information is the major part that is associated with the input devices. Absolute
velocity information may not be associated with the device.However, as devices used to capture
stroke points with equal intervals, relative velocity of strokes can be used. Pitak et al. [39,82,83]
proposes an approach based on velocity of Bary center of pen input. Bary center is the center of
curve between two consecutive points on the stroke. Finite Impulse Response (FIR) of velocity
of Bary center is taken as feature. Type I accuracies of1.5 percent and type II accuracies of0.5
percent are being reported for database containing81 writers.
Tsai et al. [40] proposed a writer identification approach based on point distribution model.
Tsai proposes an approach to identify the point distribution models for each characters for
the writer and then used dimensionality reduction methods to reduce the complexity as well
as to generate discriminating features. [41, 84] have givena continuous dynamic programming
based approach for figure based writer identification. A writer can write any portion of the fig-
ure(enrolled into the system), for the verification. Extensive experiments are proposed to support
the algorithm.
Yashushi et al. [85, 86] has proposed a writer specific text selection method for verification
using Hidden Markov Models (HMM). Different data is used formultiple authentications and
the data is generated using discriminating information available about the data(characters) for
the specific writer. Yashushi et al. have used the P-type fourier descriptor as the features of the
strokes.
2.4 Machine Learning for writer Identification
Except from feature extraction process, different analysis has been done for analyzing the ap-
plicability of various classifiers for the problem of writeridentification. In this section we will
describe different machine learning and pattern recognition methods used for writer identifica-
tion and verification.
22

Bunke et al. [87–90] have proposed an algorithm for writer identification using HMM based
recognizer with text line based features [20,21] proposed above. Each writer’s handwriting style
is modeled using single HMM. Hundreds of different featuresare extracted for the purpose.
Log likelihood scores of HMMs are used to identify the writeron separate text lines of variable
contents. Results of96 percent are reported for identification with 2.5 percent equal error rate
(EER) for writer verification. [91] presents the variant of above system using Gaussian mixture
models(GMMs), instead of HMMs. HMM is used to model time series data and GMM model
data as the mixture of various Gaussian. [92] also presents the comparison between GMMs and
HMMs for writer identification task. Schalpbach et al [93] presented a feature selection based
framework with nearest neighbor classifiers for text line, wavelet and other texture based features
described in [20].
Long Zuo et al. [94] proposed a new approach for writer identification using Principle com-
ponent analysis (PCA). Zuo calculated the discriminatory power of each word for each writer
using PCA based method for handwritten word images. Words with higher discriminating power
was used for identification. Images are scaled to equal size and used as feature vectors. Results
are shown for16000 Chinese words, written by40 different writers. Accuracies of97.5 percent
is reported for10 combined words.
[95] have discussed methods to improve statistical and model-based approaches used in [28].
Matten analyzed wavelet based multi resolution approachesover single scale approach used
for statistical edge-hinge feature extraction. In case of model based approaches, Matten et al.
have analyzed that generating code-books using self-organized feature map (SOFM) is quite
unnecessary and random draw of curves from the codebook is performing with similar accuracy.
Hypothesis testing based framework have been extensively used for the purpose of writer
verification. Hypothesis testing with Nayman Pearson paradigm provides the better way to prove
the truthness of the hypothesis. [96,97] presented a methodbased on Neyman Pearson paradigm
for decision level fusion using handwriting words. [29, 68]have also proposed a framework
for writer verification using hypothesis testing on distribution of connected components in the
handwritten documents.
One of the major problem in case of writer verification is the fusion of heterogeneous fea-
tures and distances. [98, 99] have proposed a framework for fusion of different distance coming
from heterogeneous sources using a dichotomy transformation. Dichotomy transformation is
the transformation of feature space into feature distance space. The problem of writer verifi-
cation after transformation will become the problem of identifying whether distance belongs to
within writer category or between writer category. [100] has proposed a binary vector dissimi-
larity method for comparison of GSC features explained in [9]. For writer verification in case
of forensic documents, Srihari [101] have proposed a statistical framework using log likelihood
similarity between documents. Results was provided on a 9-point scale used by forensic experts.
In case of forensic documents, [102] have done some work using wrinkleness factors. Accord-
ing to cha et al. genuine documents have more smoother than forgery documents. They have
derived wrinkleness factor from offline handwritten document in order to capture forgery. [103]
23

has discussed the use of forensic knowledge i.e. handwriting formulation (used by handwriting
experts) for forensic document examination. Other documents and projects related to forensic
documents can be found in [104–108].
2.5 Our contribution
This thesis addresses various problems associated with automatic writer verification and iden-
tification for online handwriting. In the next chapter we proposed a framework for writer iden-
tification using online handwriting. We proposed an algorithm for designing the code-book of
individual writers. In the next chapter, we proposed framework for text-dependent writer verifi-
cation from online handwriting. We proposed boosting basedalgorithm to identify discriminat-
ing elements of handwriting for each individual handwriting. In case of forensic approaches, we
introduced the problem of repudiation detection from handwritten documents for the first time.
We proposed a hypothesis testing based approach to detect repudiated documents.
24

Chapter 3
Text Independent Writer Identification
In the previous chapter, we have introduced several text-dependent and text-independent ap-
proaches used previously for writer identification. In thischapter, we present a text-independent
framework for writer identification using online handwriting. Text independency is an important
aspect of a writer identification system. Text independenceessentially means that the system
does not make any assumption about the data available for identification. In other words, the
system need not have any prior knowledge about the data written for identification or verifica-
tion. Text independent system do have various advantages over text dependent systems. Some
of the major advantages are listed below:
• Less Manual Labor: For text dependent systems, data need be annotated which isthe
major problem of these systems. Text-independent systems extract features/statistics that
are not directly dependent on specific text and extract the global features of the writer’s
handwriting style. Annotation is considered as major problem since, the state-of-art in
automatic handwriting annotation or recognition systems is not satisfactory enough to be
used it directly. Moreover, for most of the languages, the recognition systems are not even
available. Thus most of the annotation work has to be done manually that includes cost
and very difficult to be used in practice.
• Robust to forgery: Forgery is the major concern for any writer identification and verifi-
cation system. Forgery essentially means that unauthorized users are able to access the
system by copying the handwriting style of the genuine writer. Text dependent systems,
usually rely on text specific comparisons for authentication. On the other hand, text-
independent systems do extract features that are not frequent and hence difficult to forge.
Sometimes even writers are not aware of his own handwriting features and thus are dif-
ficult to forge. At the same time, as a specific and predetermined text is not written for
authentication, the chances of forgery are further minimized.
In this chapter, we propose an algorithm for text-independent writer identification. We present
a framework for automatic identification and extraction of consistent features from individual’s
handwriting. The system constructs a codebook of handwriting style of each individual, which
is later used as the reference base for identification. Codebook for each writer do model the
25

handwriting style of the writer. Codebook is basically constructed using sub-strokes of indi-
vidual handwriting. Various handwriting modeling approaches [65, 66] consider handwriting
generation process as a neuromuscular process and consistent generator of sub-curves called
graphemes. Handwriting of each individual is considered tobe a collection of these graphemes.
Graphemes are usually dependent on the script under consideration and the shape, size and dis-
tributions of graphemes vary from individual to individual. In the present approach, our major
contribution is to construct a database of grapheme for the specific script and to use size, shape
and distributions of these sub-curves(graphemes) to identify writers. The proposed approach
presents algorithms for graphemes identification and extraction from online handwritten docu-
ment. Even user is unaware about the features being extracted by system and thus have less
chance to be forged. Automatic extraction of features make the system applicable to different
scripts as the approach itself, is not dependent on a particular script. Framework is easily expend-
able and more robust representation and clustering algorithms can always replace the algorithms
used here, without much changes in the entire framework itself. There is no major assumption
about the data or the constituent algorithms. The only assumption is that the online data is pro-
vided to the system. Framework proposes a text independent method for writer identification
using online handwriting. In case of online handwriting [43], usually methods based on pen
usage characteristics such as pressure, tilt, etc. have been proposed. However, methods based
on codebook of graphemes have been discussed in case of offline handwriting [28, 30]. More
information about literature survey can be found in chapter2.
The remainder of the chapter is organized as follows. The next section introduces the chal-
lenges of text-independent handwriting identifications. The section following that explains com-
prehensive framework of the system. Section 3.3 provides the details of feature extraction meth-
ods used for experimentation. Section 3.4 provides the details about the experimental setup
and analysis of the empirical results. Conclusion and future directions in which work can be
proceeded, are covered in the last section.
3.1 Challenges due to Text independency
The text independent systems are more general and do not require annotated data for com-
parison. However, this generality adds more complexity to the system. The challenges posed by
text-independent systems can be categorized as follows:
• Less Accurate: The text-independent systems are less accurate as compared to the text-
dependent systems. Since it is always easier to compare to similar words for differences
or similarities as in the case of text-dependent system (forexample signature verification)
which is not the case with text independent systems. Text-independent system, on the
other hand, rely on less frequent properties of handwritingof an individual those became
consistent due to long form habits [3].
• More amount of data is required: Text independent systems require more data for compar-
ison as with small amount of data less frequent properties can not be extracted consistently.
26

Text independent algorithms usually extract features which user write with consistency. In
order to capture consistency from user’s handwriting more amount of data will be needed.
In spite of all challenges, text independent systems are needed to design forgery free security
systems. The next section will explain the complete framework of text-independent system using
online handwriting.
Input Document
Extract Primitive Identify Consistent
Primitives
ClusteringUnsupervised
Figure 3.1 Training phase: Given documents the main goal is to identifyand extract consistentprimitives.
Extract Primtives Classify WriterCluster−2
Cluster−1
Cluster−3
Writer DocumentCluster−4
Figure 3.2Writer Identification: Given writer-document; extract primitives; cluster into variousgroups and finally classify the writer.
3.2 Text-independent framework
This section explains a generic text-independent framework for writer identification. The
basic idea of our framework is to automatically identify repetitive and consistent primitives from
handwritten script, and use variations in the captured primitives to discriminate between writers.
Since framework does not make any assumption about the script and extract features independent
of the underlying script, framework is applicable to any script. Figures 3.1 and 3.2 displays the
27

stepwise implementation of text-independent writer identification system. The identification
framework consists of the following major components:
1. Defining Primitives:
The major goal of any identification system is to extract the primitives that can be used to
model the handwriting of an individual and afterward can establish the identity of writers.
Any handwriting identification system essentially can be thought of as an information ex-
traction process in which the information pertaining to writer is to be extracted. The first
stage of information extraction system is to identify the information that is to be extracted.
In the context of handwriting identification system, we willrefer to the information as
primitives. The primitive can be defined as any component of handwriting which posses
individuality information about the writer. Consistent definition of primitive will make
feature extraction process easier. Various primitives of handwriting can be sub-character,
character, word, line, paragraph and documents. Handwriting experts [3] also identified
features pertaining to these components only. They dividedvarious features in different
categories such as character based, sub-character based, word based and document-level
global features. Major problem of character and word level features are that they are
dependent on the specific text. However, since the present work concentrate on text in-
dependent systems, primitive should not be varying with thevarying text. Any primitives
that is consistent in the handwriting for the individual anddoesn’t depend on the text can
be used for text-independent identification. Examples include shape primitives, which de-
fined the shape of various sub-characters; allograph types,connections between parts of
handwriting such as characters and sub-characters, etc. Section 1.1.1 presents the details
for primitive selection and extraction algorithms.
2. Extraction and Representation:
Once the primitives to be used are defined, a mechanism to extract them from the data
need to be identified. A consistent mechanism for primitive extraction is essential for en-
suring consistency in the statistics derived from them, andhence the overall accuracy of
the system. A clear definition of the primitive will lead to a simple extraction scheme.
Extraction essentially means to automatically extract theprimitive from the handwriting.
let the primitive be certain type of characters, extractionmethod will define the process to
extract all the present character from the handwriting automatically. Representationessen-
tially means feature extraction. Any automatic pattern classification system use numbers
to classify any pattern. hence, in order to classify the pattern, pattern need to be repre-
sented automatically. This phase is referred to asfeature extractionprocess in context of
pattern recognition. Feature extraction is the bottleneckof any classification system. A
consistent method of feature extraction directly impact the accuracy and efficiency of final
system.
3. Similarity Measure:
28

A similarity or distance measure between two primitives need to be defined for compari-
son, based on the representation chosen in the previous step. Distance essentially means
a method to compare two given patterns and represents the similarity between two pat-
terns. The less the distance, the more the patterns are similar. Based on the feature space
various similarity and distance measures can be used such asEuclidean distance, Man-
hattan Distance etc. Distance measure should be such that within-class distances can be
discriminated from between-class distances.
4. Identifying Consistent Primitives:
Depending on the script under consideration, certain type of primitives repeat more often
than other in various allographs. These primitives can be used directly for writer identifica-
tion. These primitives can be automatically identified using some unsupervised clustering
algorithm. Pair-wise distances are computed for each pair of primitives extracted from the
training samples and a distance-based clustering method, such as k-means clustering is
used. The clusters thus formed are referred to as consistentprimitives of the script. For
each script consistent primitives are being identified automatically during training phase.
5. Writer Identification: The final step is to use the between-writer variations withincon-
sistent primitives to determine the identity of the writer.This involves the design of a
classifier for each of the consistent primitives (clusters)and then combining the results to
get the most likely identity.
Let Sj be thejth primitive that was extracted from the data andCk be thekth cluster in
the script. The data likelihood of the primitiveSj , given a particular writerWi can be
computed as:
p(Sj/Wi) =N
∑
k=1
p(Sj/Wi, Ck) ∗ αi,k, (3.1)
whereαi,k is the weight of thekth cluster for theith writer that quantifies the discrim-
inability of thekth cluster for theith writer.
Now the complete data likelihood (for the documentD), given writerWi, can be computed
from equation 3.1 as:
p(D/Wi) =∏
Sj∈D
p(Sj/Wi), (3.2)
The probability that the given document belongs to a writer can now be computed using
Baye’s rule from equation 3.2.
P (Wi/D) =p(D/Wi) ∗ P (Wi)
n∑
i=1
p(D/Wi) ∗ P (Wi)
. (3.3)
29

Note : Equal prior probabilities are assigned to all writers.
3.3 Feature Extraction
As discussed earlier, five different levels of individuality information: sub-character level,
character level, word level, line level and paragraph level, is present in handwritten data. Based
on the requirement different individuality information will be extracted from handwriting sam-
ples. For any practical purpose, individuality information present at paragraphs or lines level will
be very difficult to capture as person may not be willing to give so much data each time to verify
identity. Also, for text independent systems, we need some features which are independent of
the text. In the previous literature of handwriting modeling, handwriting generation process have
been modeled as neuromuscular process, which generate ink-blob(curves) continuously. These
curves are considered to posses a lot of individuality information with them in the form of shape,
size and distribution. Since the writer usually writes sub-characters unconsciously, due to long
formed habituation, writer tends to write consistently.
In this framework, sub-character level information is usedto model the writer as sub-character
level information is independent of the text. Sub-character level information includes design,
construction and spatial distribution of curves present inthe script. We can use different sub-
character level information like size, shape, style for extracting writer-specific information. We
demonstrate the effectiveness of the proposed framework using curve shapes as the basic prim-
itive. The curve shape and size captures only part of the individuality information present at
sub-character level. However, the results suggest that even the partial information can effec-
tively distinguish between writers. Our framework allows for extension to multiple primitives
for writer identification. This sub-character level information will be referred to as the shape
curve in our discussions.
In this work, shape primitive is defined using the velocity profile of handwriting. It has been
analyzed in various previous studies that relative velocity of an individual remains the same, in-
spite of changes in absolute velocity. According to kinematic theory of human hand movements,
presented by Plamondon [8, 67], human movements are combination of different forces and
transition between these forces. In case of handwriting, a single force can be defined as the
equi-curvature portion of handwritten stroke (Portion of handwriting between one pen-down
and corresponding pen-up events). Stroke is also defined as the combination of different forces.
Based on the above, portion of stroke between two minimum velocity points can represent the
basic primitive,shape curve. Figure 3.3 shows dominant (maximum and minimum velocity)
points, extracted using velocity profile of the stroke shownin Figure 3.3. According to our
empirical findings also, the dominant points of the stroke remains the same, in-spite of changes
of velocity on different occasions. This reason behind thisconsistency can be the habituation
while writing these small curves. In order to exploit the individuality information present in the
transition, two consecutive shape curves are used as basic primitive.
30

(a) (b)
Figure 3.3 (a) Stroke and velocity based dominant points(Red Points represents minimum ve-locity points and Blue points the corresponding maximum velocity points.) (b)Velocity profileof the stroke
The consistent and clear definition of the primitive, enableus to extract the primitive easily
as follows. For each stroke from the handwriting samples of the individual, find the dominant
velocity points. The portion of curve between three consecutive velocity points is used as the
basic shape primitive.
The third step is to devise consistent representation for shape primitive. A curve of constant
curvature can be uniquely represented using three parameters: the incident direction, the curva-
ture and size or length of the curve [67]. Based on this principle, curve shapes are represented
using angle of incidence, angle between corresponding vectors and size of the vectors. Figure 3.4
shows all the elements, used for representation of a particular shape-based primitive curve. Fea-
tures 1–4 represent the incident angles and the curvature ofeach portion of the curve, while the
other features represent the length of the curve. Thus each shape primitive is represented using
an 8-dimensional feature vector. The representation constitutes an abstraction of the curve that
is both direction and scale dependent. Another shape representation techniques such as shape
context [46] geometric moments and zernike moments [109, 110] can also be used to represent
curves together with directional features defined above.
Since, the shape curve is represented using a fixed sized feature vector, a distance measure be-
tween two curves can be defined using Euclidean distance. To account for the variations in scales
of the angular features and the length feature, we use a weighted Euclidean distance. Another
distance measure can be easily used based on the feature extraction method. Dynamic Time
Warping (DTW) based distance measure can be used to provide distance which is not usually
affected by small changes in the curve shape. The distribution of shape primitive curves varies
in different scripts. To identify repetitive shape primitives present in the script, unsupervised
k-means clustering algorithm is used. Ratio of within-cluster variance to between-cluster vari-
ance is used as cluster validation criteria. Figure 3.5 shows six major primitive shape clusters
extracted from Devanagari script.
To calculate the between-writer variation for consistent primitives, we design a classifier using
the labeled training samples that falls in each of thek clusters. In this experiment, we have used
Neural Network based classifier for classifying each curve primitive. The output of the classifier
31

P1 P5
P2
P3
P4
3
46
7
2
85
1
Figure 3.4curve representation: angles represents shape of the curves and size of vectors repre-sents the size of the curve.
for each of the classes is used as the probability of observation of the curve, given the cluster
and the writer. For each consistent primitive cluster different classifier is used. Equation 3.1 and
equation 3.2 are used to calculate the log-likelihood of shape based primitives. Equation 3.3 is
used to find out the probability of the writer given the document. One could replace the classifier
in each node with any other technique such as Gaussian modelsor k- nearest neighbor (KNN), as
long as the classifier returns a confidence measure for the given curve. Next section will describe
the experimental set up with complete results.
3.4 Experimental Results
Experiments were performed on5 different scripts; Devanagari, English, Cyrillic, Arabicand
Hebrew. For each script, experiments were performed for10 to 12 writers. Data was collected
using IBM CrossPad. Each user was asked to write out any text in particular script on a letter
sized paper, that was captured electronically by the CrossPad. Data was divided randomly into
four parts and at every step, three parts of the data were usedfor training and the remaining part
for testing.
The data was smoothened using a Gaussian low-pass filter prior to training and testing, to
remove any noise added due to pen vibration. Around700 instances of basic shape primitives
are extracted from the training data of each writer.
Three different sets of experiments were performed to determine the variation in accuracy
of the identification scheme: i) variation as data size varies ii) variation as number of writers
increase and iii) variation with different scripts under consideration. First two set of experiments
were performed only for Devanagari script as we had more dataavailable for it.
For the first two experiments, around700 curves were extracted from Devanagari data col-
lected from10 different writers. The data was clustered into16 clusters (experimentally chosen)
and the classifiers were trained on each of these clusters. Ratio of within cluster variance to
32
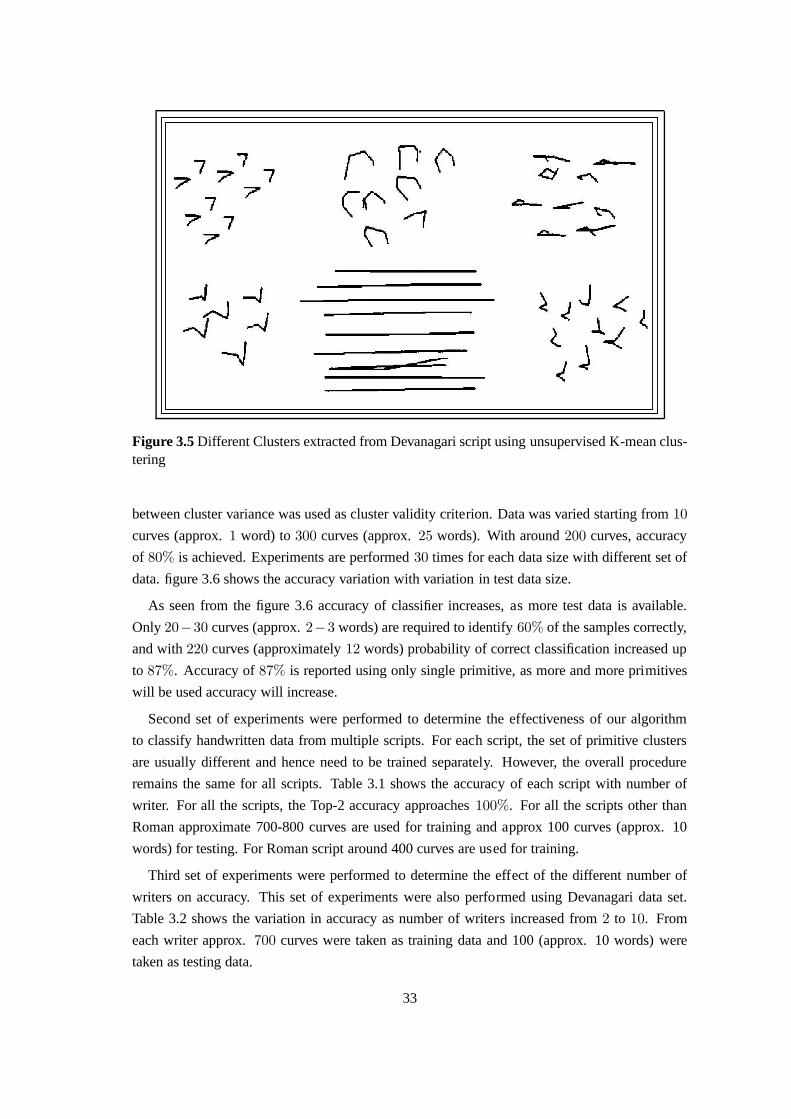
Figure 3.5Different Clusters extracted from Devanagari script usingunsupervised K-mean clus-tering
between cluster variance was used as cluster validity criterion. Data was varied starting from10
curves (approx.1 word) to300 curves (approx.25 words). With around200 curves, accuracy
of 80% is achieved. Experiments are performed30 times for each data size with different set of
data. figure 3.6 shows the accuracy variation with variationin test data size.
As seen from the figure 3.6 accuracy of classifier increases, as more test data is available.
Only 20−30 curves (approx.2−3 words) are required to identify60% of the samples correctly,
and with220 curves (approximately12 words) probability of correct classification increased up
to 87%. Accuracy of87% is reported using only single primitive, as more and more primitives
will be used accuracy will increase.
Second set of experiments were performed to determine the effectiveness of our algorithm
to classify handwritten data from multiple scripts. For each script, the set of primitive clusters
are usually different and hence need to be trained separately. However, the overall procedure
remains the same for all scripts. Table 3.1 shows the accuracy of each script with number of
writer. For all the scripts, the Top-2 accuracy approaches100%. For all the scripts other than
Roman approximate 700-800 curves are used for training and approx 100 curves (approx. 10
words) for testing. For Roman script around 400 curves are used for training.
Third set of experiments were performed to determine the effect of the different number of
writers on accuracy. This set of experiments were also performed using Devanagari data set.
Table 3.2 shows the variation in accuracy as number of writers increased from2 to 10. From
each writer approx.700 curves were taken as training data and 100 (approx. 10 words)were
taken as testing data.
33

0 50 100 150 200 250 30045
50
55
60
65
70
75
80
85
90
Figure 3.6 Test data size Vs Accuracy: Test data is represented as the number of curves. Eachword on an average have 10-12 curves.
Script No. ofWriter
Top-1Accu-racy
Top-2Accu-racy
Devanagari 10 87 100Roman 6 83 88Cyrillic 10 80 100Arabic 15 85 97Hebrew 10 90 100
Table 3.1Script Vs Accuracy
No of Writers Accuracy2 1003 99.84 99.65 98.86 98.07 98.38 97.09 9210 87
Table 3.2Accuracy Vs Different Number of Writers
34

2 3 4 5 6 7 8 9 100
10
20
30
40
50
60
70
80
90
100
Number of Writers
Acc
urac
y
Figure 3.7Number of Writers Vs Accuracy
Shape based primitive proved a bad choice for Chinese Script, as most of the shapes extracted
were straight lines, that do not contain much individualityinformation. Only50% accuracy could
be achieved. However, one could identify a different set of primitives and different representation
scheme to rectify this problem. For Chinese and Roman scripts, in which lots of shape based
primitives are straight lines, size based primitive, like ratio of size between consecutive primitive
curves can be used. Experiments are being performed to checkthe confidence measure of size
based primitives for different scripts.
3.5 Analysis and Conclusion
In this chapter, we proposed a text independent writer identification system for online docu-
ments. The advantage of this method include the need of smallamount of test data in addition
to being text independent. The classification is fast and we can improve our confidence in the
results as the data size increases (evidence accumulation). Even with one line of data we can get
a high confidence about the identity of the writer. We have used sub character level features for
writer identification.
To improve on the accuracy and robustness of the system, for the script like Chinese and
Roman, in future we can use other high level primitives basedon character,word, line and para-
graph. Different primitives like shape, size and other higher level features can also be used in
combination to improve the system. More robust representation, like spline, can be used for
shape primitives. More robust cluster validity criteria can be used for generating the clusters.
35


Chapter 4
Text Dependent Writer Identification
In the previous chapter, we have presented a text-independent writer identification system.
However, the applicability of the text-independent identification is still doubtful in the practical
scenario, owing to the need for large amount of data for writer authentication. In this chapter,
we address the problem of automatic text-dependent writer verification using online handwrit-
ing. Text-dependent systems require that the enrollment and verification text be similar for au-
thentication. Automatic signature verification [111] is a specific instance of the text-dependent
systems, in which the writer is verified based on the text chosen by the writer himself, i.e., his
signature. Since text-dependent writer verification systems are based on similar text compari-
son, the amount of data required for authentication is quiteless as compared to text-independent
approaches. However, text-dependent systems are more prone to forgery as compared to text-
independent approaches. This chapter presents a verification system for practical low security
access control applications using online handwriting. Forthe verification system based on hand-
writing to be applicable in practical scenarios, it should have some specific characteristics de-
scribed below:
1. Robust to forgery:
Forgeryis a major problem with every biometric system. In order for abiometric system to
be applicable to any practical purpose, the false accept rates should be as low as possible,
i.e., system should be able to identify impostors efficiently. Since the handwriting is a
behavioral biometric, and can be learned by rigorous and continuous practice, the problem
of forgery is even bigger. In case of text-independent handwriting identification systems,
the problem is not severe since text-independent systems extract features that can not be
forged easily. However, in case of text-dependent verification as the verification text is
known in advance, risk due to forgery is even bigger. This risk can be minimized using
varying and writer-specific text for verification.
• Varying verification text:
Fixed predefined text is the major problem of text-dependentsystems that leads to the
problem of forgery. To make systems robust to forgery, the verification text should
not be revealed beforehand, and be varied with time. The verification stage should
37

itself be able to generate different text for verification, each time a user tries to access
the system. Since the system is well aware of the text writtenby the writer, it can
still use text dependent comparison for higher accuracy. Also, since it is difficult and
not even possible to learn every aspect of individual’s handwriting, the problem of
forgery can be minimized through text variation.
2. Minimum amount of text for verification
Ease of use is a major concern for any authentication system.In the era of automation,
no-one has much time and asking a writer to write large amountof data for verification can
adversely affect the utility of the system. A user can not be asked to write long sentences
for comparison which is a major problem for text-independent systems. However, if we
choose specific text that is more discriminating for a particular user, one can minimize the
amount of data required for authentication.
• Writer-specific text and threshold:
Writer-specific text for a person is the combination of primitives (sub-characters,
characters, words, etc) that can easily discriminate the individual from other in-
dividuals. Signature verification is a good example of writer-specific verification.
Writer-specific text can also make the system robust to forgery with less amount of
text since it is difficult to copy the information that the writer writes consistently and
discriminating from other writers.
Write-specific text generation will also solve our problem of identification of an
appropriate threshold. Traditional verification systems use the threshold of within
and between-writer distances for verification which is calculated using training data.
However, it is sometimes difficult to specify a global threshold for all writers (or the
respective text) that perform efficiently. This is due to thefact that different primi-
tives(characters, words etc.) of handwriting possess different discriminating power
for different individuals and single primitive of handwriting can not be discriminat-
ing enough to discriminate between different pair of writers [3]. Thus thresholds
should be selected based on the underlined text and the writer. If one can generate
text; specific to the writer, he can simultaneously identifya writer-specific threshold
also.
3. Adaptiveness to the handwriting changes:
Handwriting is a behavioral biometric and the handwriting of an individual changes with
time. However, these changes will not be abrupt and will be continuous. Any verifica-
tion system should be able to adapt to these changes in handwriting and should learn the
changes from the test samples itself. Adaptiveness can increase the lifespan of a system,
as if a system is not adaptive, it may start rejecting genuinewriters and the users will get
frustrated by repeated rejections.
38

In short, a system that combines the above features can take advantage of both text-independent
(robust to forgery)and text-dependent systems(high accuracy with less data)to verify the writer
of the system. Beside all the above mentioned advantages such a system will be faster and more
suited for practical purposes.
The major theme of this work is to design a practical verification system for low security
and access control applications. The requirements of low security civilian applications are quite
different from that of forensic document examination(or other high security applications). In
case of low security civilian applications, the major requirements are ease of use and low false
rejection rate, i.e., genuine user should not be rejected frequently. Another major factor that
arise from the domain of use is the control over data collection. In case of low security access
control applications, the user can be asked to provide online data, which may not be possible
in case of high security and forensic applications. In this chapter, we present a framework for
text-dependent writer verification that is quite differentfrom traditional approaches. Traditional
text dependent approaches require some predefined text, to be written for verification, that makes
the system more prone to forgery. We propose a method to generate writer specific test data at
verification stage, which also suits the requirements of thepractical verification system.
4.0.1 Challenges
Handwriting based person authentication systems pose several challenges due to: i) High
within-writer variations and ii) Low between-writer variations. However, in case of text-dependent
comparisons, the between-writer distances become even smaller; as the writers are essentially
writing the same text and trying to make it readable. Thus thevariations are limited and not sim-
ilar to other biometrics, such as iris, face, DNA, etc. At thesame time, verification using online
data poses more challenges due to high variations within writers. Major sources of variations in
the case of online handwriting are:
1. Overwriting: Writers tend to overwrite whenever they make a mistake. Overwriting may
not be a major problem in the case of offline handwriting, as itcan just increase the stroke
width for a single stroke. However, in case of online handwriting, overwriting is captured
as a different stroke. Since in the case of online handwriting, the number and order of
strokes is the part of the information and overwriting will lead to increase in within-writer
distances.
2. Quality of capturing devices:In case of online handwriting, data capturing devices are not
very accurate and sometimes they do introduce noise, which is usually not present in the
actual stroke. This tends to increase within-writer distance.
4.1 Framework of the system:
Based on our discussion on practical writer verification systems, varying the verification text
is an important requirement. However, if this text is specific to the writer as well, and if we
39

can generate writer-and text-specific threshold that wouldadd to the performance of the system.
However, the text can not be varied as such since text-dependent systems do require similar text
written by the writer beforehand, for text-dependent comparisons. This limits the scope of the
text variations only to the text collected at the time of enrollments. In order to solve this prob-
lem, the text generation phase is delayed till the authentication phase, accompanied by the text
synthesis phase. The text synthesis [112] phase will synthesize the handwriting of the writer
based on handwriting samples provided by the individual during enrollment. For example, as-
sume that the character level data is collected from the users during enrollment phase and stored
in the database. During authentication phase, the text generation unit will generate the text and
display it on the screen and synthesis phase will generate the corresponding handwriting text
specific to the user which will be compared with the test data provided by the user at the time
of authentication. Distance between test sample (written by user for verification) and training
(generated by synthesis phase) samples will be used to verify the authenticity of the claim based
on the thresholds generated by the text-generation phase. Figure 4.1 displays an example of
text-dependent authentication system. Given six primitive characters, text generation unit has
selected three characters (based on discriminating power of the characters for the writer). Lan-
guage unit, then generate a meaningful word from the combination of these characters. Writer is
asked to write the word and is compared with the training template generated by synthesis unit.
Distance between two templates is compared with threshold for final decision.
4.1.1 Authentication phase:
Writer verification or authentication phase is divided intotext generation and verification
phases. The following subsections will explain in detail each of them.
4.1.1.1 Text generation
Text generation (see Figure 4.2) is the major requirement for the writer verification frame-
work. The generated text should be specific to the writer thatcan discriminate the writer from
the other writers. This will make verification engine forgery resistant and at the same time will
reduce the amount of text for verification.
Given a set of primitives, i.e. sub-characters, characters, words, etc. none of which is indi-
vidually efficient enough to discriminate the writer from other writers (i.e. are weak classifier),
the problem of text generation is to design most discriminating and compact text for a specific
writer. Given a set of primitives and features, for the purpose of text selection, an automatic fea-
ture selection method can be used. Since the major requirement of the verification system is text
variation, thus different text should be generated for multiple authentication and at the same time
at each stage primitives should be selected based on the selected in the previous stages. Bunke
et al. have proposed a feature selection for offline writer verification in [93]. In this chapter,
we present a Boosting based feature selection framework forwriter verification system. Boost-
ing [113] is a method to combine different sets of weak classifiers, to boost the performance of
40

Writer VerificationExample
Text Synthesis
ID
Comparator
Segmentation
α 1
α 2 α 3
Classifier
Results
Text Selection
Pool of Character
Selected Characters
Dictionary
Figure 4.1Example of text generation based verification system.
the final hypothesis. Adaboost (an efficient boosting algorithm) is a greedy algorithm, which at
each stage selects the most efficient classifier from a bag of weak classifiers depending on the
previously selected hypothesis. Adaboost can be efficiently used as feature and text selection
method, by cleverly designing base classifiers.
In case of writer verification, in order to enable text generation, each weak classifier is based
on the primitives and features. The number of base classifiers will be number of primitive times
the number of different features. The complete discussion on discriminating features has been
given in section 1.1.1. Adaboost has also been used before asa feature selection method in other
domains (for example face detection [114]).As the text-selection, in case of verification system,
is sequential and also dependent on previous selection, Adaboost provides a dynamic framework
to fulfill these requirements. At the same time, since individual features and primitive based
classifiers are not discriminating enough, Adaboost can also select and combine the feature based
weak classifiers such that accuracy of final classifier is high. In our case, as the classifiers are
dependent both on text as well as different features extracted from this text, the feature selection
method can effectively be used for the purpose of text selection also. In the next section, we will
introduce the Adaboost algorithm for boosting and its applicability to writer verification.
41
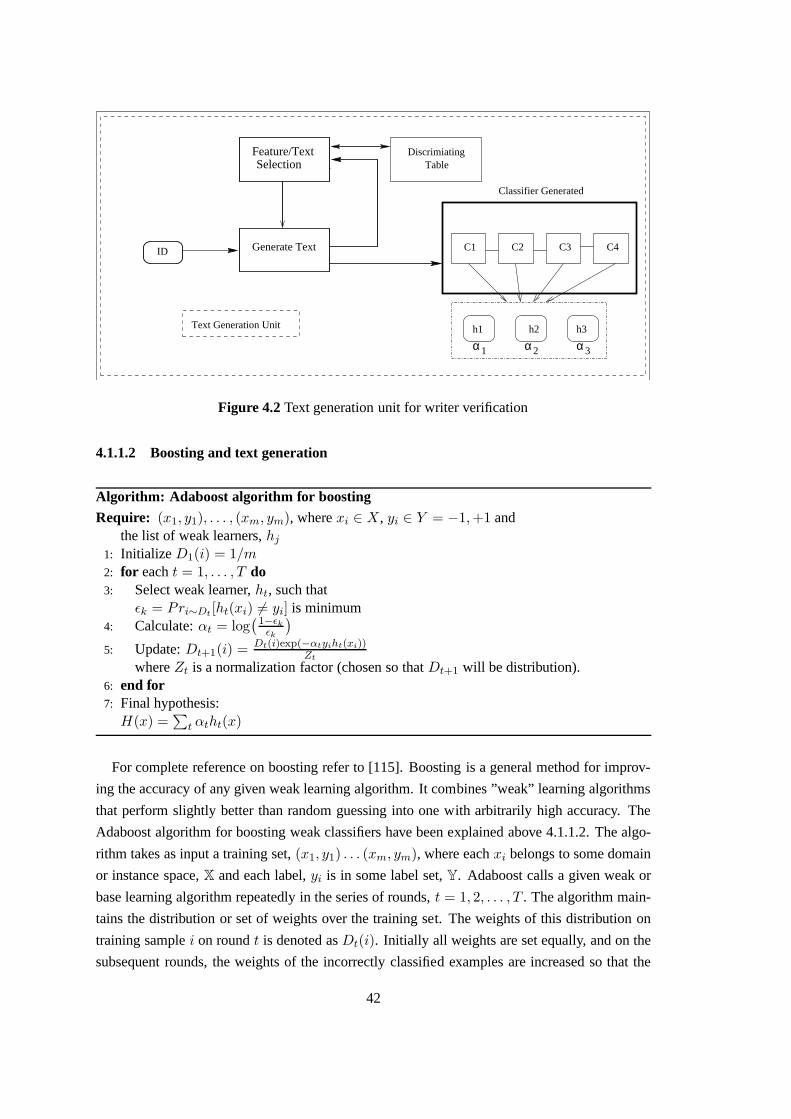
α 1 α 2 α 3
Feature/TextSelection
DiscrimiatingTable
Generate TextID C1 C2 C3 C4
h1 h2 h3Text Generation Unit
Classifier Generated
Figure 4.2Text generation unit for writer verification
4.1.1.2 Boosting and text generation
Algorithm: Adaboost algorithm for boostingRequire: (x1, y1), . . . , (xm, ym), wherexi ∈ X, yi ∈ Y = −1,+1 and
the list of weak learners,hj
1: Initialize D1(i) = 1/m2: for eacht = 1, . . . , T do3: Select weak learner,ht, such that
ǫk = Pri∼Dt [ht(xi) 6= yi] is minimum4: Calculate:αt = log
(
1−ǫk
ǫk
)
5: Update:Dt+1(i) = Dt(i)exp(−αtyiht(xi))Zt
whereZt is a normalization factor (chosen so thatDt+1 will be distribution).6: end for7: Final hypothesis:
H(x) =∑
t αtht(x)
For complete reference on boosting refer to [115]. Boostingis a general method for improv-
ing the accuracy of any given weak learning algorithm. It combines ”weak” learning algorithms
that perform slightly better than random guessing into one with arbitrarily high accuracy. The
Adaboost algorithm for boosting weak classifiers have been explained above 4.1.1.2. The algo-
rithm takes as input a training set,(x1, y1) . . . (xm, ym), where eachxi belongs to some domain
or instance space,X and each label,yi is in some label set,Y. Adaboost calls a given weak or
base learning algorithm repeatedly in the series of rounds,t = 1, 2, . . . , T . The algorithm main-
tains the distribution or set of weights over the training set. The weights of this distribution on
training samplei on roundt is denoted asDt(i). Initially all weights are set equally, and on the
subsequent rounds, the weights of the incorrectly classified examples are increased so that the
42

weak learner is forced to focus on the hard examples in the training set. The weak learner’s job
is to find a weak hypothesisht : X → R appropriate for the distribution,Dt of weights. In the
simplest case, the range of eachht is binary, i.e. restricted to{−1,+1}; the weak learner’s job is
to minimize the error due to misclassification. Once the weakhypothesis,ht has been received,
Adaboost chooses the parameter,αt belongs toR, which intuitively measure the importance that
it assigns toht or in other words, the weight of the classifier.
The verification problem can be posed as the two-class classification problem of”One vs
Rest”. The samples for the specific writer will be considered as thepositive samples and rest
all writers as negative samples. For each writer different set of classifiers will be combined by
repeatedly calling weak learning algorithm (feature/textselection). In the case of writer veri-
fication, a set of weights will be maintained for the writers and not for the individual training
sample. Initially equal weights is given to each writer and after each stage weights will be re-
assigned such that the writers who are more discriminated bythe selected primitive, get lesser
weights. The more discriminating a writer is from the given writer based on the selected prim-
itive, the less will be the weight and vice versa. This is doneto make sure the next primitive
is selected based on hard samples. The next weak hypothesis will be chosen based on the set
of weights, thus giving more importance to classes that are less discriminated. Final hypothesis
will be such that negative samples are nicely discriminatedfrom the positive samples.
With−in Writer Distance
Number of Boosting Stages
Between Writer Distance
Pro
babi
lity
Distance
Figure 4.3Effect of number of stages on the Margin between positive andnegative samples.
Weak learning algorithms will be based on different primitives and features of handwriting.
Different primitives of the handwriting can be sub-character, characters, words, etc. Since, prim-
itives are not discriminating enough to individually discriminate positive samples from negative
samples with high accuracy thus they will perform as weak classifiers. Essentially Adaboost
based algorithm will behave as a primitive selection mechanism such that primitive with high
discrimination get more importance than the others. Since,Adaboost algorithm selects primi-
43

tives dynamically, primitive selection will be specific to each writer and will vary from writer
to writer. Relative importance(weights) of each primitivewill be calculated using Adaboost
algorithm. In some sense, boosting can also be seen as the process of increasing the margin
between positive and negative samples (see Figure 4.1.1.2), selecting the primitive classifier that
is the most discriminating for the certain distribution of the weights of the writers. Another main
advantage of Adaboost algorithm is that it provides better generalization than other classifier
combination mechanisms. The key insight is that generalization error is related to margin of
the examples and the Adaboost achieves large margins rapidly. Schapire et al [115] bound the
generalization error of the Adaboost as:
PD
(
yf(x) ≤ 0)
≤ PS
(
yf(x) ≤ θ)
+ O
(
1√m
[
log(m) log|H|θ2
+ log(1
δ)
])
(4.1)
Here the term,m, refers to the margin of the examples.T is the number of iterations and|H|represents the cardinality of the classifier subspace.
Since, generalization error is directly proportional to the margin and as more and more weak
classifiers are combined, the margin will also increase. As at each stage, we select the classifier
that is most discriminating for the writer, given the list ofwriters to compare with, essentially the
classifier is selected will increases the margin between positive and negative samples. However,
the generalization error is also dependent on the cardinality of the classifier space. As the number
of classifiers are quite large, generalization error will also be large. In order to overcome that
problem, a cascaded structure of classifiers have been proposed in the next section.
ID
α 1α 2 α 3
GenerationText
TableDiscriminating
Training
Yes
No No
1 1 1 1
0 0 0 0
Authentication
NoDataBase
Classifier Generated
No
C1 C2 C3 C4
h1 h2 h3
Figure 4.4Writer verification framework for low security access control applications.
4.1.1.3 Cascaded Classifier
As seen from the framework in Figure 4.4, classifiers are combined in the cascade. At each
stage in the cascade, some of the writers are rejected, thus pruning the list of writers at each stage.
44

Each cascaded classifier is a combination of different boosted classifiers. Cascaded structure of
the classifiers is employed to reject the writers those are quite discriminating from the writer
to be verified and about which we are more confident. One can nowspend more effort for the
hard samples in the following stages. Essentially the writers with smaller weights are removed
from consideration. If any cascaded classifier rejects somewriter from the consideration, then no
further processing is done for that writer. The structure ofthe cascaded classifiers is essentially
that of a ”degenerate decision tree” and is related to the work of Fleuret & Geman [116] and
Amit & Geman [117].
After each stage in cascaded structure, a threshold is selected which decides which writer
is to be rejected. Since we are approaching the problem of writer verification for low security
applications, where false rejection rate is the major concern, thus the threshold is selected such
that verification system is biased towards the writer to be verified. The insight of the cascaded
structure is that writers who are discriminated easily fromthe writer(to be verified) need not
go through complex computations. Only the writers who are hard to discriminate need to be
analyzed with complex computations. Moreover, as the number of writers decrease over the
stages, the number of computations that are required for each classifier will also decrease, that,
in turn, will make system fast. Writers are rejected based onthreshold calculated during the text
generation phase. Classifier stages are biased towards the writer in order to keep false rejection
rate as small as possible. False acceptance rates are controlled with every new stages added.
Stages are added until all the writers except the writer to beverified are not rejected. For any
writer to verify claim, he/she should pass through each stage of cascade. Once the writer is
rejected by any one of the stages, it will not be tested through any of the subsequent stages.
4.1.2 Writer Verification
The previous section explained the boosting based feature selection algorithm for text gener-
ation. Feature/text selection method removes the major hurdle of designing writer specific text.
However, the problem of forgery in text-dependent system will still remain the same as the text
will be the same each time user tries to verify identity, although the text is selected specific to the
writer. In order to overcome this limitation of the system, the text generated should be different
each time the user tries to verify his identity. At the same time, it is the requirement of the system
to be aware of the text written by the writer to take the advantage of text-dependent comparison.
Thus the system should itself design random text based on feature selection method and the user
is asked to write that text to verify his identity. However, here our feature selection based method
is limited as for each writer all different combinations of primitives need to be written before-
hand by the writer, in order to allow text-dependent comparison, which is practically impossible.
This problem is solved by text synthesis.
In order to vary text across multiple authentications, randomization is introduced at the weak
hypothesis/classifier selection phase. In the modified selection process the hypothesis is selected
not just based on discriminating power. We add an option thatclassifier can be rejected or
accepted, each time the classifier selection routine is called. Other processing is done as before as
45

Algorithm: Boosting based text generation algorithmRequire: ID of the writer to be verified, weak hypothesishj
1: Initialize D1(i) = 1/n, wherei = 1, . . . ,m,wheren is the number of writers in the system
2: writer-List = {1, . . . , n}3: while |writer − List| > 1 do4: while Nowriterisrejected do5: Select weak learner,hk
t , such thatǫk =
∑
i Dt(i)θIDi is maximum.
θIDi represents the pairwise discriminating power of the classifier hk for and calculated
during the enrollment stage6: Calculate:
αt = log(
1−ǫk
ǫk
)
7: Update:
Dt+1(i) =
Dt(i)exp
(
αtθIDi
)
Zt
whereZt is a normalization factor (chosen so thatDt+1 will be distribution).8: Compute thresholdTh for the stage using within-writer distance.9: if (ξi > Th) Reject the writer
10: end while11: end while
in the basic version of classifier selection. Acceptance or rejection is based on a random number
generator. The random number generator is also designed using discriminating distribution of
the primitives. The weak classifiers are accepted or rejected based on their discriminating power.
Classifier with more discriminating power has more chances of being selected.
Let each stage in the cascaded classifier denoted byCi, wherei = 1, . . . n. n is the number
of cascaded stages in the classifier. Final hypothesis,H is given by:
H(x) =∏
i
(Wi < ϑi) (4.2)
Wi is the score ofith cascade andϑj is the threshold forith cascade calculated during text
generation phase. Threshold will be fixed such that the classifier is biased towards the writer
to be verified and false rejection rate (FRR) is minimized. During the authentication stage, a
writer is rejected ifWi > ϑi, otherwise accepted. In order for a writer to be authenticated,
he/she should be able to pass through all the stages. Rejection at any stage will also reject his
claim. ScoreWi of each cascaded classifier is calculated as the combinationof various weak
hypotheses selected at each selection stage. lethj be thejthweak hypothesis. ThenWi is given
by:
Wi =∑
j
αjhj (4.3)
46

whereαj is the relative importance or weight given tojth weak classifier computed during
Adaboost based text generation phase andhj(X) is the hypothesis generated byjth classifier
within a single stage.
In order to vary text, as randomness is introduced in the framework. Each weak classifier
can be rejected with probability ofP (1 − Di(w)). Where,Di(k) is the discriminating power of
kth primitive for ithwriter. Method to calculate discrimination power has been explained in next
section.
It is always more natural to write words and sentences as compared to individual characters
or sub-characters. Primitives of handwriting may be sub-character, character or any larger unit
and the writer still can be asked to write a single sentence. This is done using a language-unit
inside the system. The system supports language unit such that given a list of characters (or
sub-character) and dictionary (or mapping sub-character to character), the language unit will
generate meaningful words. The words can further be combined to form different sentences.
Randomness can be incorporated at word level as well as sentence generation level. More the
randomness, less will be chances of forgery. As this is always difficult to forge an arbitrary
handwriting of any individual. Some of the simple rules thathave been used for the purpose of
experimentation has been given below. More complex rules can be easily incorporated.
• SUBJECT + VERB + OBJECT
• SUBJECT + HELPING-VERB + MAIN-VERB + OBJECT
4.1.3 Enrollment Phase
In traditional writer verification process, enrollment phase is to identify the threshold of
between-writer distances to within-writer distances. In our framework, text generation phase
and the threshold calculation phases are delayed till authentication phase (defined above). Thus
only, the calculation of discriminating power and trainingof synthesis phase is done during the
enrollment phase.
4.1.3.1 Discriminating information extraction
Discrimination is defined as the degree of separation of within-and between-writer distances
between a pair of writers. The discriminating power for a primitive (for the writer) against the
world population is approximated as the level of discrimination of that component against the
writers in the training set.
Discriminatory power of primitive is defined as
Dij(w) = 1 −(
∫ X
X1
g(x) +
∫ X2
X
f(x)
)
, (4.4)
whereDij(w) is the discriminatory power of wordw for writersWi andWj andf(x) andg(x)
are the distributions of within writer and between writer distances. So, the discriminating power
47

������������������������������������������������������������
������������������������������������������������������������
X1 X2
X
g(x)f(x)
Distance
Pro
babi
lity
Within−writer Distances Between−writer Distances
Figure 4.5Discriminating power of words is inversely proportional tothe area of intersection.
of words, essentially, is proportional to the overlap between distribution(see Figure 4.5). The
more the overlap between distributions, The less the discriminating power and vice versa. Fig-
ure 4.6 lists the discriminating power of different words for different writer pairs.
Word−5Word−2 Word−3 Word−4Word−1
0.03 0.09 0.12 0.25 0.35
0.230.220.100.000.00
0.05 0.09 0.12 0.25 0.35
0.250.210.090.03
W5
W4
W3
W2
VsW1
0.01
Figure 4.6 Discriminating table of the characters for pair of Writers.Discriminating table listfive words with highest discriminating power for the 4-writer pairs.
4.2 Feature extraction
For the purpose of the experiments, words are used as basic unit of handwriting. Online word
is the set of strokes which in turn is the sequence of points. Thus the distance between words
can be calculated using distance between corresponding strokes of the words as the order, num-
ber and the shape of strokes do possess a lot of individualityinformation about the writer. For
the experiments two different methods are used for strokes comparison, Dynamic time warp-
48

ing(DTW [118]) and directional features. DTW matching is the natural choice for the stroke
distance as the number of points in the strokes are not same and DTW provides us an efficient
method to compare different length feature vectors. Two approaches used to calculate stroke
distances are:
• DTW Matching:As the number of points on the strokes are different even for same writers.
DTW matching provides the method to compare two strokes.
• Directional features:As discussed in chapter-2 direction based features have lots of indi-
viduality information associated with them. The curvatureof the strokes are calculated at
each point and grouped into 12 bins. Euclidean distance between these fixed dimension
feature vectors is used for distance calculations.
Once the distance between all pairs of strokes are calculated, dynamic time warping is used to
calculate the distance between words. In this case, dynamictime warping will take care of order
and number of strokes in the word while calculating distancebetween two words.
4.3 Experimental setup and results
As there is currently no available online handwriting databases with writer information, for
the purpose of experiments, data is collected from different writers using Genius tablet. Data
is collected from30 writers in both Hindi and English scripts. Hindi data is collected from10
users and English data is collected from20 users. Each person have written20 word, 10 − 12
times each. Experiments are performed using3-fold cross validation. The data is randomly
divided into three sets. Two out of the three sets are used fortraining and remaining one for
testing. The process is repeated for all possible combination of sets. Two different feature
extraction methods are used for the experiments. Within andbetween class distances for each
pair of writers is considered as the representative of true global distribution of the distances. The
discriminating power of the words has been defined as the proportion of the samples that comes
in the region between these two distributions. Discriminating power can also be defined as the
measure of similarity between these two curves.
The boosting based framework described above, is essentially a feature/text selection based
framework. In order to test the applicability and accuracy of the algorithm for writer verification
task, results are compared with other feature/text selection approaches such as random selection
and discrimination based selection. In the case of random selection, the primitives are selected
randomly from the given database and given equal weights. Inthe second case of discriminating
power based selection methods, words are selected based on their discriminating power for the
given set of writers. Two variants of discrimination based methods are used differently for the
purpose of experiments. In the first case, discriminating power of the primitives is determined
taking all the writer taken together called as global discriminating power. In second case, dis-
criminating power of the words can also be calculated for an individual writer. Global discrim-
49

inating power can be affected by outliers as it is the averageof all the individual discrimination
(average is sensitive to outliers).
Figure 4.7 and Figure 4.8, shows the comparison of accuracies of different primitive selection
methods. It is evident from the graph that accuracies of boosting based randomized method
are quite comparable to discriminating power based primitive selection and quite higher than
random selection. Effectiveness of the verification systems are quantitatively represented in
terms of false acceptance rates(FAR) and false rejection rates(FRR). The false acceptance rates
represents the percentage of impostors accepted by the systems and the false rejection rates is
the percentage of the genuine user rejected by the system. False acceptance and false rejection
rates are inversely proportional to each other as these two are related to the threshold selected
for verification. The more the threshold, lesser will be the false rejection rates. However, the
system will tend to accept a lot of impostors also, thus leading to high false acceptance rates and
vice versa. Figure 4.7, 4.8 below shows the FAR, FRR rates of the boosting based selection in
comparison to the other selection methods.
It is evident from the FRR graph (Figure 4.7 and Figure 4.8) that the performance of individ-
ual discrimination based selection is better than global discrimination based selection method.
The main reason for this is that in the case of individual discriminating power, the threshold is
selected based on the single classifier and thus it performs better for the individual writer and
provide lower FRR. Boosting based method described in this chapter, performs better than all
other methods. as this method selects primitives dynamically, based on the individual writers and
give more weighage to the hard samples which are being misclassified in the previous stages.
Performance of the boosting based classifier is much more dependent on the threshold that is
chosen. In case of false acceptance rates, as seen from the diagram that false rejection rates are
quite higher initially and decreases rapidly as the number of words increases. Boosting provides
better generalization performance and as the number of stages increases, the margin between
positive and negative samples increases. It has been empirically proved that boosting decreases
the generalization error even long after training error becomes zero.
In the case of the cascaded-boosted classifiers described above, the threshold plays a major
role in deciding the performance of the system. Traditionalwriter verification system uses single
threshold of within and between-writer distances for the authentication. However, the text gen-
eration phase of the algorithm proposed in the chapter, enable us to decide the threshold specific
to the writer and the text. In the case of the cascaded classifiers, the two thresholds are being
selected which affects the performance of the system. The thresholds are decided based on both
the positive and negative samples (see Figure 4.9). Threshold that is calculated based on the pos-
itive samples effects the false rejection rates of the system since if threshold is decided such that
all the positive samples from training data are accepted then false rejection rates will be lower
and vice versa. However, this also effects the false acceptance rates as the threshold is higher,
impostors will also be accepted. The second threshold is chosen based on the negative samples
and effectively controls false acceptance rates. It decides when to reject writer for consideration
from the next cascade. Both thresholds are not independent and affects each other. For the sake
50

0 2 4 6 8 10 12 14 16 18 200
0.05
0.1
0.15
0.2
0.25
0.3
0.35
0.4
0.45
0.5
Number of Words
Fa
lse
Re
ject
Ra
te (
FR
R)
Random
Global disc
Local disc
Boosting
(a)
0 2 4 6 8 10 12 14 16 18 200
0.05
0.1
0.15
0.2
0.25
0.3
0.35
0.4
0.45
0.5
Number of Words
Fa
lse
Acc
ep
t R
ate
(F
AR
)
Random
Global disc
Local disc
Boosting
(b)
0 2 4 6 8 10 12 14 16 18 200
0.05
0.1
0.15
0.2
0.25
0.3
0.35
0.4
0.45
0.5
Number of Words
Err
or
random
Global disc
Local disc
Boosting
(c)
Figure 4.7 Comparison of (a) False Rejection Rates(FRR), (b) False Acceptance Rates (FAR)and (c) Total Error for different text selection methods forHindi script using DTW
51

0 2 4 6 8 10 12 14 16 18 200
0.05
0.1
0.15
0.2
0.25
0.3
0.35
0.4
0.45
0.5
Number of Words
Fa
lse
Re
ject
Ra
te (
FR
R)
Random
Global disc
Local disc
Boosting
(a)
0 2 4 6 8 10 12 14 16 18 200
0.05
0.1
0.15
0.2
0.25
0.3
0.35
0.4
0.45
0.5
Number of Words
Fa
lse
Acc
ep
t R
ate
(F
AR
)
Random
Global disc
Local disc
Boosting
(b)
0 2 4 6 8 10 12 14 16 18 200
0.05
0.1
0.15
0.2
0.25
0.3
0.35
0.4
0.45
0.5
Number of Words
Err
or
random
Global disc
Local disc
Boosting
(c)
Figure 4.8 Comparison of (a) False Rejection Rates(FRR), (b) False Acceptance Rates (FAR)and (c) Total Error for different text selection methods forHindi script using Directional features
52

With−in Writer Distance
Pro
babi
lity
Distance
Between Writer Distance
Threshold −1
Figure 4.9Description of Threshold-1 and Threshold-2. In the figure Threshold-2 is taken at 20percentile and Threshold-1 as max of within writer distances. Writers W4,W5 will be rejectedat the shown stage.
of experiments, second threshold is taken as the percentileof the negative samples below first
threshold. For example, let the threshold-1 be Th and threshold-2 selected to be20% (of number
of total test samples for the class), then we reject all the writers for who have less than20% of
the samples below threshold-1. Essentially increasing threshold-2 means to make system more
prone to rejecting writers and that directly affects the performance of the system on account of
false rejection rates. For the experiments, threshold-2 isbeing varied from5 to 50 with the step
size of5 and threshold-1 is varied as the multiple of the basic threshold from 1 to 3 with the
step size of0.25. Figure 4.10, 4.11 and 4.12 below shows the Performance of the system for
different values of the threshold for different features.
As seen from the above graphs(see Figure 4.10, 4.11, 4.12), false acceptance rates of the
classifiers increases with increasing threshold-1 and decreases with decreasing threshold-2. Ex-
planation of this have been given in the previous paragraph.Also the system performs better in
the case of the false rejection rates with higher values of threshold-1. As seen from the above
graphs, direction based features perform slightly better than DTW distance based methods. The
major reason behind this is the higher sensitivity of the DTWdistance for small variations. On
the other hand, direction based feature is not sensitive forsmall variations. Also, direction fea-
ture based comparison is faster than DTW based comparison, as the number of comparisons for
each stroke is much more in DTW (of the order ofn2, n is the number of points on the stroke),
whereas in case of directional feature based comparison, each stroke is just represented with
12-dimensional feature vector.
Threshold-1 and threshold-2 does not only affect the accuracy but they also affects the number
of primitive comparison to be made for the decision. The number of comparisons are directly
53

11.21.41.61.822.22.42.62.83
0
10
20
30
40
50
0.05
0.1
0.15
0.2
0.25
0.3
0.35
0.4
Threshold−1Threshold−2
Fa
lse
Re
ject
ion
Ra
te(F
AR
)
(a)
1
1.5
2
2.5
3
0
10
20
30
40
500
0.1
0.2
0.3
0.4
0.5
Threshold−1Threshold−2
Fa
lse
Acc
ep
tan
ce R
ate
(FA
R)
0.05
0.1
0.15
0.2
0.25
0.3
0.35
0.4
0.45
(b)
1
1.5
2
2.5
3
0
10
20
30
40
500
0.1
0.2
0.3
0.4
0.5
Threshold−1Threshold−2
Err
or
(c)
Figure 4.10(a) FRR, (b) FAR and (c) Combined error rates for DTW distancefor Hindi script
54

1
1.5
2
2.5
3
0
10
20
30
40
50
0
0.05
0.1
0.15
0.2
0.25
0.3
0.35
Threshold−1Threshold−2
Fa
lse
Re
ject
ion
Ra
te(F
AR
)
(a)
1
1.5
2
2.5
3
0
10
20
30
40
500
0.1
0.2
0.3
0.4
0.5
0.6
0.7
Threshold−1Threshold−2
Fal
se A
ccep
tanc
e R
ate(
FA
R)
(b)
1
1.5
2
2.5
3
0
10
20
30
40
500
0.1
0.2
0.3
0.4
0.5
0.6
0.7
Threshold−1Threshold−2
Err
or
(c)
Figure 4.11 (a) FRR, (b) FAR and (c) Combined error rates for Direction features for Hindiscript
55

11.5
22.5
3
0
10
20
30
40
50
0
0.5
1
1.5
Threshold−1Threshold−2
Fa
lse
Re
ject
ion
Ra
te(F
RR
)
(a)
1
1.5
2
2.5
3
0
10
20
30
40
500
0.5
1
1.5
2
2.5
3
3.5
Threshold−1Threshold−2
Fa
lse
Acc
ep
tan
ce R
ate
(FA
R)
(b)
1
1.5
2
2.5
3
0
10
20
30
40
500
0.5
1
1.5
2
2.5
3
Threshold−1Threshold−2
Err
or
(c)
Figure 4.12 (a)FRR, (b)FAR and (c)combined error rates for Direction features for EnglishScript
56

related to time taken for verification. Figure 4.13 below shows the variations in average number
of comparison with the changes in values of threshold-1 and threshold-2. As seen from the
diagram, as threshold-1 increases more number of words are needed for comparison. The main
reason behind this is as the threshold-1 increases, more number of words will be needed to reject
all the other writers(leaving only one writer, ID), for constant value of threshold-2. However,
increase in threshold-2 effectively means that system is more prone to rejecting other writers and
less number of words will be needed for comparison. As the number of comparison increases,
more will be the accuracy because of increase in the number ofstages of boosting based classifier.
Major problem with different biometrics based verificationsystems is of scalability with the
number of writers. As the number of writers increase the performance of the system decreases.
However, in the cascaded boosting based method, performance of the system is not considerably
affected by the increasing number of writers (see Figure 4.14). As evident from the graph 4.14,
the error term is decreasing with the increase in the number of writers. This is due to the gen-
eralization capability of boosting based systems. At the same time, as the number of writers
increases, the number of the cascaded stages also increases. More the number of stages, the
writer have to pass through more rigorous testing. For smallnumber of writers, number of
stages will be lesser and since the system is biased towards accepting the writers rather than
rejecting, the false acceptance rates will be higher. As thenumber of writer increases, effect due
to biasing reduces and makes the system more accurate.
4.4 Conclusion and future work
Text-dependent writer verification framework for civilianapplications has been proposed.
System presented an algorithm to generate writer-specific test sentences for individual writers
which makes the system forgery resistant (by implanting randomness into the generation pro-
cess), and fast as the amount of text required for verification is low. System is being designed
specifically for low security access control and civilian applications as false rejection rates are
quite low can be controlled with varying thresholds. Experimental results show that boosting
based text-generation system is better than different selection methods and also require small
amount of data for verification.
57

1
1.5
2
2.5
3
0
10
20
30
40
500
2
4
6
8
10
12
14
Threshold−1Threshold−2
Ave
rage
Num
ber
of W
ords
(a)
1
1.5
2
2.5
3
0
10
20
30
40
500
5
10
15
20
Threshold−1Threshold−2
Ave
rag
e N
um
be
r o
f W
ord
s
(b)
11.5
22.5
3
010
2030
4050
0
50
100
150
200
Threshold−1Threshold−2
Ave
rag
e N
um
be
r o
f W
ord
s
(c)
Figure 4.13Number of words comparison as the function of Thresholds, (a) Hindi Script andDTW features, (b) Hindi Script and Direction features (c) English Script and Direction features
58

2 4 6 8 10 12 14 16 18 200
0.05
0.1
0.15
0.2
0.25
Number of Writers
Err
or
Directional Feature Comparison
(a)
2 3 4 5 6 7 8 90
0.05
0.1
0.15
0.2
0.25
Number of Writers
Err
or
DTW Comparison
Directional Feature Comparison
(b)
Figure 4.14Error Rates as the function of Number of writers (a) English Script (b) Hindi Script
59


Chapter 5
Repudiation Detection in Handwritten Documents
In last two chapters, we have introduced the problems of traditional writer identification and
verification in the context of text independent and text dependent scenario, respectively. In this
chapter we will introduce the different set of problems thatarise mainly in forensic documents.
The problems that arise in forensic document examinations,are usually quite different from that
of traditional writer identification and verification tasks, where the data is assumed to be natural
handwriting. However, in case of forensic documents no suchassumption can be made about
data. This give rise to problems of forgery and repudiation detection. The problem of forgery
detection has been studied in the context of signature verification. The second problem, repudi-
ation, arise where a writer deliberately distorts his handwriting in order to avoid identification.
Moreover, in case of forensic documents, we often have to arrive at a decision based on a sin-
gle document pair. Thus learning writer specific models can also become difficult. Since the
problem of repudiation is inherently different from that ofwriter identification or verification,
the optimal way to handle them needs to be different. This chapter addresses the problem of
repudiation in generic handwritten documents, and also proposes a framework to analyze such
documents. The approach can further be extended for detection of forgeries as well.
In forensic science, the primary role of handwriting analysis is in the problem of Questioned
Document Examination(QDE) [33,119]. Determination of authorship of a document is the main
task in QDE, where one has to decide whether a pair of documents, thequestioned document(one
whose origin is unknown) and thereference document(one whose origin might be known), were
written by the same writer or not. However, due to the circumstances under which the documents
are generated, there is a motivation for the writer to deliberately alter his natural handwriting to
avoid detection. We refer to this problem ashandwriting repudiation, as the purpose of distortion
is to deny someone’s involvement in the case (repudiation [120]).
The problem of detection of repudiation in QDE is different from that of traditional writer
identification and verification tasks. Writer identification is the problem of identifying writer of
the document from given candidates and, writer verificationis the process of verifying whether
the claimed identity actually belongs to claimed writer. Inboth identification and verification
problems, writer need to be enrolled into the system before hand. Also the data in case of
traditional writer identification and verification is supposed to be naturally written. In case of
61

Writer−1 Writer−2 Writer−3
(a)
(b)(b)(b)
(a)
(c) (c) (c)
(a)
Figure 5.1 (a) and (b) Natural handwriting samples from 3 writers and (c) Repudiated samplesfrom the writers.
forensic documents, as data can not be assumed to be natural handwriting, other problems arises,
i.e. forgery and repudiation.
• Forgery Detection: The problem is identical to that of verification, except that there is an
additional suspicion that the writer could be an impersonator.
• Repudiation Detection: Given two samples of handwriting (both could be deliberately
distorted), verify the claim that they are from different writers.
Note that in both identification and verification tasks, the users are assumed to be cooperative,
and one could build statistical models for each writer from their natural handwriting. However,
in the case of forgery, the questioned document need not be natural, and in repudiation, both the
questioned document and the reference document could be distorted, and we have to assume that
the writer is non-cooperative. Figure 5.1 shows examples ofwords from three writers in their
natural form, as well as when they distort their handwritingfor repudiation.
In this chapter, we primarily deal with the problem of repudiation in generic handwritten
documents. We propose a generic framework for automated analysis of handwritten documents
to flag suspicious cases of repudiation.
5.0.1 Automatic Detection of Repudiation
Extraction of writer information from handwriting is more challenging as compared to verifi-
cation based on physical biometrics traits, due to the largeintra-class variation (between hand-
writing samples of the same person), and the large inter-class similarity (same words being
written by different people). Moreover, the handwriting ofa writer may also be affected by the
nature of the pen, writing surface, and writers mental state. In addition, the problem of forensic
document analysis is particularly difficult due to the additional problems posed by repudiation:
• During repudiation, a writer tries to change his handwriting style to be different from that
of his natural handwriting. This introduces a large amount of intra-class variability that the
62

system has to handle. Moreover, the writer need to be assumednon-cooperative, unlike
in forgery, where the person who is being forged will be cooperative and provide their
natural handwriting in the required manner and amount.
• The content of the handwriting that is available during forgery detection is not in our
control, and is often small in quantity. This prevents us from using the less frequent
statistical properties of the handwriting for the purpose of verification of the claims.
• The cost of false match is often very high in the case of forensic documents, as it might
result in erroneous conviction of an innocent person. Moreover, to use such an evidence
in the court, one needs to give a statistically valid confidence measure in the result that is
generated.
In spite of all these problems, it has been shown by forensic experts, that repudiation detection
is possible. From the principle ofexclusionandinclusion, inferred by document examiners from
their experience in the field, one can’t exclude from one’s own writing, those discriminating
elements of which he/she is not aware, or include those elements of another’s writing of which
he/she is not cognizant [3]. Thus the task of repudiation detection comes down to finding the dis-
criminating elements of which writer is not aware of. We propose a framework (see Figure 5.2)
that exploits the statistical similarity between lower level feature distributions in two documents
to detect possible cases of repudiation. One needs to add a line of caution here that many of
the clues that are used by forensic experts comes from external sources (such as background of
the suspect, examination of paper material, etc.) and are not available to an automatic writer
verification system. Hence any such system can only be used asan aid to a forensic expert, and
not a replacement.
The prior work in this area primarily concentrates on the problems of natural handwritten
documents. Comprehensive survey of work has been given in chapter-2.
5.0.2 Applications
The major applications of repudiation detection is in the field of forensic document only.
Since, only in these scenario, writer would like to forcefully change his handwriting.
5.1 A Framework for Repudiation Detection
This section describes a generic framework for repudiationdetection for questioned document
examination. The primary goals of the framework are:
1. To develop a statistically significant matching score between two documents, without any
additional information in the form of training data.
2. Utilize the online handwriting information that could beobtained from the reference doc-
ument to improve the matching.
63

Could beSame Writer
WritersDifferent
CompareStatistics
?Word Cluster −1
Word Cluster − 2
Intra−document Statistics
Inter−document Statistics
Intra−document Statistics
Document − 1
Document − 2
Figure 5.2Framework for detecting repudiation from handwriting.
3. Allow the inclusion of additional features that might be extracted from the handwriting
to enhance the results. This would also mean, we should not make specific assumptions
about the distributions of the features, in the framework.
4. Allow the user to specify a confidence threshold, beyond which, the system will pass the
documents for expert examination.
To make a generalized system is very difficult. We also make the certain assumptions in our
approach. The assumptions, however, are practically soundand will not affect on the final sys-
tem. The primary assumption is that the content of the questioned document and the reference
document are either the same or has significant overlap at theword level. This allows us to use
text-dependent approaches to compare the words in the two documents. Without this assump-
tion, it will be difficult to identify consistent features ofhandwriting of individual, which is the
bottleneck of the system. In case of repudiation, consistency is the major feature as it is difficult
to change consistently written features from the individual’s handwriting, even deliberately [3].
We also assume that the reference document is collected in the online mode (with temporal
information). These assumptions are valid in the case of QDE, since the investigator can control
the content and mode of the reference document being collected. Online data have more indi-
viduality information about the writer. This information can be used to compare the consistent
features of reference document with same features from questioned document.
Let the two documents be denoted asDi = {wk}, k = 1 · · · ni andDj = {wk}, k = 1 · · · nj.
The words in each document are first partitioned into disjoint sets as follows:
64

Di =
Ni⋃
k=1
Cki , and
Cki = {wj |wj ∈ Di, and denote the wordk}
(5.1)
whereNi is the number of distinct words inDi. This partitioning can be done using recognition-
based or ink-matching techniques. We then compute the correspondence between the setsCi and
Cj from the two documents. Once again, we can find the correspondence based on recognition
results or ink matching. Without loss of generality, we assume that the corresponding sets are
Cki andCk
j , k = 1 · · ·K.
To compute the similarity between the two documents, we firstdefine a distance measure be-
tween two corresponding words,Wi andWj, asd(Wi,Wj). This could be the distance between
any set of features that are extracted from the word. Letdi,j denote the average distance between
corresponding words in documentsDi andDj . We compute two distributions of distances: i)
pw, coming from within document distancesdi,i anddj,j, and ii) pb, from between document
distances,di,j.
Now referring to the major requirements of the framework, one of the major problem with
repudiation detection is to find out the significance of the score. After consistent features from
reference document is being extracted and compared with similar features from questioned docu-
ments, we can easily arrive at some distance between documents.Now the problem of significant
distance is posed as that of testing the hypothesis, whetherthe two distributions,pw, andpb, come
from the same population or not. In other words, we can say that if intra-documentpw and inter-
documentpb, distance distribution came from same general distribution with high probability,
then we can predict that these two documents are written by same writers with higher probability.
One could assume thatpw andpb are normal from central limit theorem and can be compared
using parametric tests such as, t-test, z-test etc. However, no prior information about distribu-
tions is available in case of forensic documents verification. Any wrong assumption about data
distribution can lead to misleading conclusions. Non-Parametric tests like KL-test and KS-test
do not make any assumption about distance distributions andthus more fit for question docu-
ment analysis. Complete analysis of non-parametric tests and hypothesis testing is given in next
section.
5.1.1 Detecting Repudiation and Forgery
Major problem in case of verification is generating significance of distance between ques-
tioned pattern and known pattern. Traditionally, this is done using threshold, which in turn is
calculated from training data. In case of one to one problemsof verification, such as in forensic
documents, where training data is not available, significance of distance need to be calculated
using statistical methods such as Hypothesis testing. Hypothesis testing allows us to compute
65

the significance of the distance and hence arrive at a confidence measure of the result in a mean-
ingful and systematical manner. Hypothesis testing provides a formal means for distinguishing
between probability distributions on the basis of random samples generated from the distribu-
tions. Two class hypothesis testing problem for forensic documents can be posed as:
H0 = Documents written by same writer
H1 = Documents written by different writers
(5.2)
Λ =Likelihood that documents written by same writer
Likelihood that documents written by different writer(5.3)
if Λ > α, then documents are proved to be from same writer. Otherwisedocuments are
declared to be written by different writers. Here,α is the threshold that is decided based on the
problem.
Likelihood ratio,Λ, can be calculated as the probability whether two distributionspw andpb
came from same universal probability distribution. Similarity of distributions can be calculated
using different non-parametric tests, such as Kullback-Leibler(KL) divergence or Kolmogorov-
Smirnov(KS) test. Kullback-Leibler divergence or relative entropy test is one of the tests that
can be used to compare two hypothesis or distributions. Kullback-Leibler divergence test is the
natural distance measure from a true probability distribution, P to an arbitrary distribution,Q.
For probability distributionsP andQ of a discrete variable, theKL divergence (or informally
KL distance) ofQ from P is given by equation 5.4.
DKL(P ||Q) =∑
i
P (i) logP (i)
Q(i)
PKL = e−ξDKL
(5.4)
DistanceDKL can be converted into probability terms using 5.4. KullbackLeibler distance
essentially calculates divergence between distributions, and is not a distance metric, as it is nei-
ther symmetric nor satisfies triangle inequality. On the other hand, KS test determines whether
an underlying probability distribution differs from a hypothesized distribution, based on finite
samples. The KS-test also has advantage of not making assumptions about the distribution of
data and so, is a non parametric (parameter or distribution free method). Two parameter KS-test
is sensitive to differences in both location and shape of theempirical cumulative distribution
functions of the two samples. KS test computes a simple distance measure and mathematically
can be represented by equation 5.5:
DKS(P ||Q) = max(P (i) − Q(i)),∀i (5.5)
66

WhereP andQ are cumulative probability functions andP (i) andQ(i) are corresponding
probability values. for two distributions. DistanceDKS can be interpreted as maximum absolute
difference of cumulative probability on all potential values ofi. Probability of similarity between
two distributions is then calculated by:
PKS = QKS(√
Ne + 0.12 + ( 0.11√Ne
)DKS)
QKS(λ) = 2∑∞
j=1(−1)j−1e−2j2λ2 |QKS(0) = 1, QKS(∞) = 0,
(5.6)
andNe is effective number of data points,Ne = N1N2(N1 + N2)−1, whereN1 andN2 are
number of data points in two distributions respectively. The major limitation of KS test is that
it is more sensitive near the center of the distribution thanat the tails. For experimentation
purposes KS test is used as statistic. Distance metrics based on combination of KL test and KS
test explained in [121] can also be used to get some improvement in the results. Any of these
two tests can be used for our purpose. In this paper, experiments are performed using KS-test.
The formulation of the comparison using hypothesis test, makes an implicit assumption that
two documents from the same writer will be exactly same. However, this is not true due to
two factors: i) natural handwriting of two documents from a writer tends to be different due to
environmental and physical conditions of the writer, and ii) In case of repudiation and forgery, the
writer introduces some variation even if appropriate features are extracted. Hence we modify the
hypothesis test result by looking at the confidence level of the result, and choosing a threshold,
α, on the confidence to decide if we should involve an expert or not.
5.1.2 Feature Extraction
This section explains feature extraction and comparison details. In case of repudiated docu-
ments, feature extraction plays a major role. Based on the level of details discriminating features
of handwriting can be divided as macro level or high level features and micro level or low level
features. High level features, such as alignment, slope, slant of line and words can be repudi-
ated, as the person is quite aware of these features and thus can be changed forcefully. However,
lower-level features, such as shape and size of primitive curves and connection between these
curves can not be changed easily, as the person is habituatedof writing primitive curves for a
long time. Moreover, various studies in the field had verifiedthat people are more aware of
words rather than individual characters present in those. Also, automatic segmentation of char-
acter from words is difficult task. Another major reason for choosing words as our primitive
unit is same character is written quite differently (with respect to shape and size) within different
words and this will introduce large intra-class variationsat character level. Individual words are
segmented and clustered into clusters of same words using automatic clustering and segmenta-
tion methods. Simple features like horizontal, vertical, lower and upper profiles of the word are
used to cluster them into cluster of same words. Small errorsin data clustering and segmentation
67

Word−2
Word−1
Alignment
SimilarityMeasure
CoorespondingCurves
FeatureComparison
Figure 5.3Comparison between two words ’apple’
is removed using manual efforts. In case of forensic documents, manual segmentation is also
possible as volume of data is small.
The distance between pair of words is calculated using lowerlevel features like shape, size
of size of the constituent primitive curves explained in [5]. Primitive curves from the words
are calculated using dominant points. For online handwriting (reference document) dominant
points are defined as maximum and minimum velocity points andfor off-line words (questioned
document) curvature points are used as dominant points. More rigorous method can be used to
extract dominant points on the words. It can be argued that velocity of handwriting can change
with change in environmental conditions and also be changeddeliberately. However it can be
shown that the critical points of velocity remains the same due to long form habits. Figure 5.3
describes the feature extraction and comparison process. It demonstrate two wordapplewritten
by same person from both normal and repudiated handwriting along with the corresponding
critical points. Critical points were used to extract primitive curves from the words. Primitive
curves are defined as the portion of curves between three consecutive minimum velocity points
on the stroke. Note that in case both documents are off-line,critical points can be calculated
using curvature.
Distance between a pair of words is calculated using dynamictime warping. Each word is
represented as two dimensional feature vector of sizemxn, where,m is the number if different
curves in the word, w, andn is representation of each curve. Curves are represented using ann
dimensional feature vector, comprising of curvature,sizeof connecting vectors, relative velocity
and shape of each curve is represented using higher order moments to retain fine changes. Simple
Euclidean distance can be used to calculate distance between two primitive curves. The proposed
method is simple in nature, and could be replaced with a more comprehensive distance measure
that uses various properties that are extracted from the curves. One could also employ distance
measures based onDTW distance, between two primitives.
5.2 Experiments
The data used in our experiments was collected from23 different writers. Each writer was
asked to write three pages on A5 sized pages in his/her own natural handwriting. In addition,
three pages of data was collected from each writer, while trying to masquerade his/her handwrit-
68

ing style. The data was collected using iball take-note, which collects the data in both on-line
and off-line forms. The data is then segmented into words using inter-word distance and then
clustered into groups of same words.
As noted before, the actual significance of the distance between two documents cannot be used
directly. A threshold need to be identified, such that if the matching distance is below this, we
use the services of an expert. To present the capabilities ofthe system, we plot the ROC curve
of the system by varying the threshold. Figure 5.5 shows ROC curve and the corresponding
distributions of within-writer and between-writer distance distributions. The document pairs
that are written by same person is considered as genuine documents. Note that this includes
repudiated documents from the same writer. The genuine accept rate is acceptance (or matching)
of documents that are written by same person and false acceptrate is percentage of documents
that are accepted, when they actually belong to different writers. ROC curve shows that about
82% of documents which belong to different writers are rejected, while keeping the genuine
acceptance rate at100%. As discussed before, this step is considered as the preliminary step for
the document screening before it goes to expert. All the documents, which are not rejected can
be processed further by handwriting expert.
An alternate way of presenting the results of matching a particular document pair to an expert
is on the traditional nine-point scale. Forensic experts use this scale to indicate the level of
match between two documents under consideration. The scaleconsists of:identification, strong
probability of identification, probable, indications, no conclusion, indications did not, probably
did not, strong probability did notandelimination. We can present a similar result based on the
densities in the corresponding histograms in figure 5.5. However, due to the bias introduced by
hypothesis testing (tests are done under the assumption that null hypothesis is true), the results
will be confined to the values ofno conclusion, indications did not, probably did not, strong
probability did notandelimination, in the case of repudiation.
We have introduced the problem of repudiation in handwritten documents, which is particu-
larly relevant for forensic document examination. A statistical model for automatic repudiation
(and forgery) detection , that uses the statistical significance of the distance between two distri-
butions is presented. Preliminary results support the validity of the model. Such an automated
system can act either as a screening mechanism for questioned documents, or could provide
additional insights to an expert examiner of the documents.
Preliminary investigations into the use of the model for detecting forgeries seem to be promis-
ing. However, we need to conduct extensive experiments using expert forgeries to make any
conclusive statements on the effectiveness. One can also experiment with a variety of features to
compute the distance between two words, in order to improve the matching results.
69

10−1
100
101
102
86
88
90
92
94
96
98
100
False Accept Rate(%)
Gen
uine
Acc
ept R
ate(
%)
Figure 5.4 Roc Curve of False Acceptance and Genuine Acceptance rates for the proposedsystem.
−120 −100 −80 −60 −40 −20 0 200
5
10
15
20
25
(a)
−120 −100 −80 −60 −40 −20 0 200
5
10
15
20
25
30
(b)
Figure 5.5Histogram of (a) Inter-writer and (b) Intra-writer distances
70

Chapter 6
Conclusions and Future Work
Handwriting recognition and analysis is gaining popularity with the advent of pen-based de-
vices, and the need for robust systems for recognition and writer identification is on the rise.
In this thesis, we have explored the problem of writer identification. Due to habituation and
the complex generation process, each individual develops his own style of handwriting which
makes it different and discriminating from others. In this thesis, we discussed the problem of
handwriting identification from different aspects such as text-independent and text-dependent. In
the case of text-independent handwriting identification, the system learns writer’s characteristics
and style from the handwriting itself and uses that style information to identify the writer, later.
The major problem of text-dependent systems is to classify the distance between handwriting
samples as within and between-writer distance. High with-in writer variations and low between-
writer variations due to same text, is the major problem in the case of text-dependent systems.
We propose a method for text-selection based on boosting such that the margin between these
distance distributions increases that in turn will improvethe performance of the system.
The problems of forensic applications of handwriting is quite different than that of civilian
applications. In the case of forensic analysis of the documents, handwriting can not be consid-
ered natural, which is a major assumption in the previous twoproblems. At the last, we have also
presented an approach for repudiation detection in handwritten documents. Due to behavioral
nature of handwriting, the repudiation is always possible.We have introduced the problem of
repudiation for handwritten documents and also provided a framework to detect repudiation in
handwritten documents.
6.1 Key contributions
We have explored three different, but important aspects of handwriting biometrics: text-
independent, text-dependent and forensic document examinations in this thesis.
• A method is proposed for text-independent writer identification [5] using online handwrit-
ing. We presented an algorithm for automatic identificationand extraction of consistent
features that can be used to model an individual’s handwriting style. Since the system
extracts features at subcharacter level of which sometimeseven the writer himself is not
71

aware, the system becomes robust to forgery. As the featuresare not dependent on the
script and are identified from different scripts individually, the framework can easily be
applied to any script.
• A framework for repudiation detection in forensic documents [6] is proposed. We in-
troduced the problem of repudiation for handwriting for thefirst time, and presented a
hypothesis testing based framework for writer verificationin forensic applications.
• A text-dependent writer verification framework for civilian applications [7] has been pro-
posed. We presented an algorithm to generate writer-specific test sentences for individual
writers which makes the system forgery resistant (by implanting randomness into the gen-
eration process), and fast as the amount of text required forverification is lower. The
system is being designed specifically for low security access control and civilian applica-
tions where the false rejection rates needed to be low which can be controlled with varying
thresholds in the system.
6.2 Future work
The problem of writer identification has been analyzed usingonline handwriting. However,
it remains to be seen whether the system performance will be affected by using both online and
offline features together. At the same time, quantitative analysis of handwriting individuality
can be done, i.e., how much individuality does specific pieceof a handwriting possess. In other
words, can we confidently set upper and lower limits on the performance of the system?
72

Publications
The work in the thesis resulted in the following publications:
• Anoop M. Namboodiri and Sachin Gupta, ”Text-Independent writer identification for
online handwriting”, In Proceedings of ”International Workshop on Frontiers inHand-
writing Recognition”, 23-26, Oct, 2006, Labarum, France.
• Sachin Gupta and Anoop M. Namboodiri, ”Repudiation Detection in Handwritten Doc-
uments”, In Proceedings of ”International conference of Biometrics”, 356-365, 2007, Au-
gust, Seoul, Korea.
• Sachin Gupta and Anoop M. Namboodiri, ”Text-dependent writer verification”, sub-
mitted to, ”International Conference on Frontiers in Handwriting Recognition”, Montreal,
Canada.
• Sachin Gupta and Anoop M. Namboodiri, ”Text-dependent writer verification”, To be
submitted, ”IEEE Transactions of Information Security andForensics”.
73


Bibliography
[1] S. Walia, “Battling e-commerce credit card fraud.”
[2] “2002 nta monitor password survey.” Survey: http://www.silicon.com/a56760, 2002.
[3] R. Huber and A. Headrick,Handwriting Identification: Facts and Fundamentals. Boca
Roton, CRC Press, 1999.
[4] “Graphology.” Website: http://www.thegraphologysite.co.uk.
[5] A. M.Namboodiri and S. Gupta, “Text independent writer identification from online hand-
writing,” in Proceedings of 10th International Workshop on Frontiers inHandwriting
Recognition, (La Baule, Centre de Congreee Atlantia, France), pp. 23–26, October 2006.
[6] S. Gupta and A. M. Namboodiri, “Repudiation detection inhandwritten documents,” in
International conference of biometrics, (Seoul, Korea), pp. 356–365, September 2007.
[7] S. Gupta and A. M. Namboodiri, “Text-dependent writer-specific verification framework.”
planned: IEEE transictions of information security and forensics, 2007.
[8] R. Plamondon and G. Lorette, “Automatic signature identification and writer verification-
the state of the art,”Pattern Recognition, vol. 22, no. 2, pp. 107–131, 1989.
[9] S. S. Zhang, B. and S. Lee, “Individuality of handwrittencharacters,” inInternational
Conference on Document Analysis and Recognition, (Edinburgh, Scotland), pp. 1086–
1090, August 3-6 2003.
[10] B. Z. Sargur N. Srihari, C. Tomai and S. Lee, “Individuality of numerals,” inInternational
Conference on Document Analysis and Recognition, (Edinburgh, Scotland), pp. 1096–
1100, August 3-6 2003.
[11] G. Leedham and S. Chachra, “Writer identification usinginnovative binarised features of
handwritten numerals,” inInternational Conference on Document Analysis and Recogni-
tion, 2003.
[12] V. Pervouchine and G. Leedham, “Extraction and analysis of forensic document exam-
iner features used for writer identification,”Pattern Recognition, vol. 40, pp. 1004–1013,
March 2007.
75

[13] P. Sutanto, G. Leedham, and V. Pervouchine, “Study of the consistency of some discrim-
inatory features used by document examiners in the analysisof handwritten letter ’a’,” in
International Conference on Document Analysis and Recognition, pp. 1091–1095, 2003.
[14] V. Pervouchine and G. Leedham, “Extraction and analysis of document examiner features
from vector skeletons of grapheme ’th’,” inDocument Analysis Systems, pp. 196–207,
2006.
[15] X. D. Xianliang Wang and H. Liu, “Writer identification using directional element fea-
tures and linear transform,” inInternational Conference on Document Analysis and
Recognition, 2003.
[16] Y. Nakamura and M. Kidode, “Individuality analysis of online kanji handwriting,” in
International Conference on Document Analysis and Recognition, 2005.
[17] B. Zhang and S. N. Srihari, “Analysis of handwriting individuality using word features,” in
International Conference on Document Analysis and Recognition, (Edinburgh, Scotland),
pp. 1142–1146, August 3-6 2003.
[18] B. Z. Catalin I. Tomai and S. N. Srihari, “Discriminatory power of handwritten words for
writer recognition,” inInternational Conference on Pattern Recognition, vol. 2, (Cam-
bridge, UK), pp. 638–641, 2004.
[19] E. Zois and V. Anastassopoulos, “Morphological waveform coding for writer identifica-
tion,” Pattern Recognition, vol. 33, pp. 385–398, March 2000.
[20] C. Hertel and H. Bunke, “A set of novel features for writer identification,” inInternational
Conference Audio and Video-Based Biometric Person Authentication, pp. 679–687, 2003.
[21] R. M. U.V. Marti and H. Bunke, “Writer identification using text line based features,” in
International Conference of Document Analysis and Recognition, pp. 101–105, 2001.
[22] T. N. Tan, “Texture feature extraction via visual cortical channel modelling,” inInterna-
tional Conference of Pattern Recognition, vol. 3, pp. 607–610, 1992.
[23] P. G. S. T. T. N. Said, H. E. S. and K. D. Baker, “Writer identification from non-uniformly
skewed handwriting images,” inBritish Machine Vision Conference, (Southampton, UK),
pp. 478–487, 1998.
[24] T. Y. Zhenyu, He and Y. Xinge, “A contourlet-based method for writer identification,”
International Conference on Systems, Man and Cybernetics, vol. 1, pp. 364–368, October
10-12 2005.
[25] J. Y. Z.He, B.Fang and X.You, “A novel method for off-line handwriting-based writer
identification,” in International Conference on Document Analysis and Recognition,
pp. 242–256, 2005.
76
[26] L. S. Marius Bulacu and L. Vuurpijl, “Writer identification using edge-based directional
features,” inInternational Conference on Document Analysis and Recognition, (Edin-
burgh, Scotland), pp. 937–941, August 3-6 2003.
[27] M. Balacu and L. Schomaker, “Writer style from orientededge fragments,” inInterna-
tional Conference on Computer Analysis of Image and Patterns, pp. 460–469, August
2003.
[28] L. Schomaker and M. Bulacu, “Text-independent writer identification and verification
using textural and allographic features,”IEEE Transactions on Pattern Analysis and Ma-
chine Intelligence. Special Issue - Biometrics: Progress and Directions., vol. 29, pp. 701–
717, April 2007.
[29] T. A.Bensefia and L.Heutte, “A writer identification andverification system,”Pattern
Recognition Letters, vol. 26, pp. 2080–2092, October 2005.
[30] L. Schomaker and M. Bulacu, “Automatic writer identification using connected-
component contours and edge-based features of uppercase western script,”IEEE Trans-
actions on Pattern Analysis and Machine Intelligence, vol. 26, pp. 787–798, June 2004.
[31] A. Seropian, M. Grimaldi, and N. Vincent, “Writer identification based on the fractal
construction of a reference base,” inInternational Conference of Document Aanalysis
and Recognition, pp. 1163–1167, 2003.
[32] W. Jin, Y. Wang, and T. Tan, “Text-independent writer identification based on fusion of
dynamic and static features,” inInternational Workshop Biometric Recognition Systems,
p. 197, 2005.
[33] H. Sargur N. Srihari, S. Cha and S. Lee, “Individuality of handwriting,”Forensic Sciences,
vol. 47, pp. 1–17, July 2002.
[34] S. Srihari, S. Cha, H. Arora, and S. Lee, “Individualityof handwriting: a validation study,”
in International Conference on Document Analysis and Recognition, pp. 106–109, 2001.
[35] B. Arazi, “Handwriting identification by means of run-length measurements,”IEEE
Transactions of System, Man and Cybernatics, vol. 7, pp. 878–881, 1977.
[36] B. Arazi, “Automatic handwriting identification basedon the external properties of the
samples,”IEEE Transactions of System, Man and Cybernatics, vol. 13, pp. 635–642,
1983.
[37] K. Zimmerman and M. Varady, “Handwriter identificationfrom one-bit quantized pres-
sure patterns,”Pattern Recognition, vol. 18, no. 1, pp. 63–72, 1985.
[38] S. Y. Seiichiro Hangai and T. Hamamoto, “On-line signature verification based on altitude
and direction of pen movement,” vol. 1, pp. 489–492, 2000.
77

[39] P. Thumwarin and T. Matsuura, “On-line writer recognition for thai based on velocity of
barycenter of pen-point movement,” inIEEE International Conference on Image Process-
ing, vol. Singapore, pp. 889–892, October 24-27 2004.
[40] L. M. Y. Tsai, “Online writer identification using the point distribution model,” inInter-
national Conference on System, Man and Cybernatics, vol. 2, pp. 1264–1268, Oct 2005.
[41] S. M. Hiroshi Kameya and R. Oka, “Figure-based writer verification by matching between
an arbitrary part of registered sequence and an input sequence extracted from on-line
handwritten figures,” inInternational Conference on Document Analysis and Recognition,
2003.
[42] J. Favata and G. Srikantan, “A multiple feature/resolution approach to handprinted digit
and character recognition,”International Journal of Imaging Systems and Technology,
vol. 7, pp. 304–311, 1996.
[43] R. jean Plamondon and S. N. Srihari, “On-line and off-line handwriting recognition:a
comprehensive survey,”IEEE Transactions on Pattern Analysis and Machine intelligence,
vol. 22, pp. 333–342, Sep 11-13 2000.
[44] K. Steinke, “Recognition of writer by handwriting images,”Pattern Recognition, vol. 14,
no. 1-6, pp. 357–364, 1981.
[45] G. Kim and V. Govindraju, “A lexicon driven approach to handwritten word recognition
for real-time applications,”IEEE Transictions on Pattern Analysis and Machine Intelli-
gence, vol. 19, pp. 366–379, April 1997.
[46] J. M. S. Belonge and J. Puzicha, “Shape matching and object recognition using shape con-
text,” IEEE Transictions on Pattern Analysis and Machine Intelligence, vol. 4, pp. 509–
522, April 2002.
[47] P. Dunn, C.E. Wang, “Character segmentation techniques for handwritten text-a survey,”
in IAPR International Conference on Pattern Recognition Methodology and Systems, (The
Hague, Netherlands), pp. 577–580, Sep 1992.
[48] P. K. Sahoo, S. Soltani, A. K. Wong, and Y. C. Chen, “A survey of thresholding tech-
niques,”Computer Vision, Graphics, and Image Processing, vol. 41, no. 2, pp. 233–260,
1988.
[49] R. Adams and L. Bischof, “Seeded region growing,”IEEE Trans. Pattern Anal. Mach.
Intell., vol. 16, no. 6, pp. 641–647, 1994.
[50] R. S. V. Bouletreau, N. Vincent and H. Emptoz, “Handwriting and signature: One or two
personally identifiers?,” inInternational Conference on Pattern Recognition, (Brisbane,
Australia), pp. 1758–1760, 1998.
78

[51] R. S. V. Bouletreau, N. Vincent and H. Emptoz, “Synthetic parameters for handwrit-
ing classification,” inInternational Conference on Document Analysis and Recognition,
(Ulm, Germany), pp. 102–106, 1997.
[52] R. M. Haralick, “Statistical and structural approaches to textures,”IEEE, vol. 67, pp. 786–
804, 1979.
[53] T. T. Yong Zhu and Y. Wang, “Biometric personal identification based on handwriting,”
International Conference of Pattern Recognition, vol. 2, pp. 797–800, 2000.
[54] X.-G. R. Cong Shed and T.-L. Mao, “Writer identificationusing gabor wavelet,” inWorld
Congress on Intelligent Control and Automation, (Shanghai, P.R.China), June 10-14 2002.
[55] O. B. Katrin Franke and T. Sy, “Ink texture analysis for writer identification,” p. 268,
2002.
[56] T. T. H.E.S. Said and K. Baker, “Personal identificationbased on handwriting,”Pattern
Recognition, vol. 33, pp. 149–160, Jan 2000.
[57] T. Tan, K. Baker, and H. Said, “Personal identification based on handwriting,” inInterna-
tional Conference of Pattern Recognition, pp. Vol II: 1761–1764, 1998.
[58] Z. He and Y. Tang, “Chinese handwriting based writer identification by texture anal-
ysis,” in International Conference on Machine Learning and Cybernetics, (Shanghai),
pp. 3488–3491, August 2004.
[59] D. M.N. and V. M., “The contourlet transform: an efficient directional multiresolution
image representation,”IEEE Transictions of Image Processing, no. 12, pp. 2091–2106,
2005.
[60] J. P.Crettez, “A set of handwriting families: Style recognition,” in International Confer-
ence on Document Analysis and Recognition, pp. 489–295, Aug 1995.
[61] L. S. F. Maarse and H. L. Teulings, “Automatic identification of writers,” Human Com-
puter Interection: Psychonomic Aspects, pp. 353–360, 1988.
[62] F.Maarse and A.Thomassen, “Produced and perceived writing slant: Differences between
up and down strokes,”Acta Psychologica, vol. 54, no. 1-3, pp. 131–147, 1983.
[63] R. Plamondon and F. Maarse, “An evaluation of motor models of handwriting,” IEEE
Transactions of System, Man and Cybernatics, vol. 19, pp. 1060–1072, 1989.
[64] L. Schomaker and R. Plamondon, “The relation between pen-force and pen-point kine-
matics in handwriting,”Biological Cybernatics, vol. 63, pp. 277–289, 1990.
[65] R. jean Plamondon, “A kinematic theory of rapid human movements part-i movement
representation and generation,”Biological Cybernatics, 1995.
79

[66] R. jean Plamondon, “A kinematic theory of rapid human movements part-ii movement
representation and generation,”Biological Cybernatics, 1995.
[67] R. Plamondon and F. Maarse, “An evaluation of motor models of handwriting,” IEEE
Transactions of System, Man and Cybernatics, vol. 19, pp. 1060–1072, 1989.
[68] T. A.Bensefia and L.Heutte, “Handwriting document analysis for automatic writer recog-
nition,” Electronic Letters on Computer Vision and Image Analysis, vol. 5, pp. 72–86,
August 2005.
[69] T. A.Bensefia, A. Nosary and L.Heutte, “Writer identification by writer’s invariants,” in
Internatinal Workshop on Fronters in Handwriting Recognition, pp. 274–279, August
2002.
[70] T. A.Bensefia and L.Heutte, “Information retrieval based writer identification,” inConfer-
ence of Document Analysis and Recognition, pp. 946–950, August 2003.
[71] S. Yoon, S. Choi, S. Cha, and C. Tappert, “Writer profiling using handwriting copybook
styles,” inInternational Conference of Document Aanalysis and Recognition, pp. II: 600–
604, 2005.
[72] K. F. Lambert Schomaker and M. Bulacu, “Using codebooksof fragmented connected-
component contours in forensic and historic writer identification,” Pattern Recognition
Letters, vol. 28, no. 6, pp. 719–727, 2007.
[73] M. B. L. Schomaker and K. Franke, “Automatic writer identification using fragmented
connected-component contour,” inInternational Workshop of Frontiers in Handwriting
Recognition, pp. 185–190, Oct 2004.
[74] A. Seropian and N. Vincent, “Writers authentication and fractal compression,” inInterna-
tional Workshop on Frontiers in Handwriting Recognition, pp. 434–439, 2002.
[75] Y. Fisher, ed.,Fractal image compression: theory and application. London, UK:
Springer-Verlag, 1995.
[76] Y. W. Kun Yu and T. Tan, “Writer identification using dynamic features,” inInternational
Conference on Biometric Authentication, (Hong Kong, China), pp. 512–518, July 2004.
[77] Y. W. Kun Yu and T. Tan, “Writer authentication based on the analysis of strokes,” in
SPIE: Biometric Technology for Human Identification, vol. 5404, pp. 215–224, 2002.
[78] K. Yu, Y. Wang, and T. Tan, “Writer identification using dynamic features,” inInterna-
tional Conference on Biometric Authentication, pp. 512–518, 2004.
[79] M. Bulacu and L. Schomaker, “A comparison of clusteringmethods for writer identifica-
tion and verification,” inInternational Conference on Document Analysis and Recogni-
tion, (Seoul, Korea), pp. 1275–1279, August 2005.
80

[80] A. S. M. Wirotius and N. Vincent, “Writer identificationfrom gray level distribution,” in
International Conference on Document Analysis and Recognition, 2003.
[81] S. Y. Seiichiro Hangai and T. Hamamoto, “Writer verification using direction and altitude
of pen movement,” vol. 3, pp. 479–482, 2000.
[82] P. Thumwarin and T. Matsuura, “Online writer recognition for thai numeral,” IE-
ICE Transactions of Fundamental Electronics, Communication and Computer Science,
vol. E86-A, pp. 2535–2541, Oct 2003.
[83] P. Thumwarin and T. Matsuura, “Online writer recognition for thai numeral based on
barycenter trajectory and handwriting velocity,”The school of information technology
and electronics, vol. 3, no. 1, pp. 71–76, 2003.
[84] H. Kameya, S. Mori, and R. Oka, “A segmentation-free biometric writer verifica-
tion method based on continuous dynamic programming,”Pattern Recognition Letters,
vol. 27, pp. 567–577, April 2006.
[85] T. N. Yasushi Yamazaki and N. Komatsu, “Text-indicatedwriter verification using hidden
markov models,” inInternational Conference on Document Analysis and Recognition,
(Edinburgh, Scotland), pp. 329–332, 2003.
[86] Y. Yamazaki and N. Komatsu, “A proposal for a text-indicated writer verification method,”
pp. 709–713, 1997.
[87] A. Schlapbach and H. Bunke, “A writer identification andverification system using hmm
based recognizers,”Pattern Analysis & Applications, vol. 10, no. 1, pp. 33–43, 2007.
[88] A. Schlapbach and H. Bunke, “Using hmm-based recognizers for writer identification
and verification,” in9th International Workshop on Frontiers in Handwriting Recognition,
(Kokubunji, Tokyo, Japan), pp. 167–172, October 2004.
[89] A. Schlapbach and H. Bunke, “Off-line handwriting identification using hmm based
recognizers,” inInternational Conference on Pattern Recognition, (Cambridge, UK),
pp. 654–658, 2004.
[90] A. Schlapbach and H. Bunke, “Off-line handwriting identification using hmm based rec-
ognizers,” inInternational Conference on Pattern Recognition, pp. II: 654–658, 2004.
[91] A. Schlapbach and H. Bunke, “Off-line writer identification using gaussian mixture mod-
els,” in International Conference on Pattern Recognition, pp. III: 992–995, 2006.
[92] A. Schlapbach and H. Bunke, “Off-line writer verification: A comparison of a hidden
markov model (hmm) and a gaussian mixture model (gmm) based system,” in Interna-
tional Workshop on Frontiers in Handwriting Recognition, (La Baule, France), pp. 275–
280, October 23-26 2006.
81

[93] V. K. Andreas Schlapbach and H. Bunke, “Improving writer identification by means of
feature selection and extraction,” inInternational Conference of Document Analysis and
Recognition, pp. 131–135, 2005.
[94] Y. W. Long Zuo and T. Tan, “Personal handwriting identification based on pca,” inSPIE:
International Conference on Image and Graphics, pp. 766–771, July 2002.
[95] L. van det Maaten and E. Postma, “Improving automatic writer identification,” in
Belgium-Netherlands Conference Artificial Intelligence, pp. 260–266, 2005.
[96] E. Zois and V. Anastassopoulos, “Fusion of correlated decisions for writer verification,”
Pattern Recognition, vol. 32, pp. 1821–1823, October 1999.
[97] V. Anastassopoulos and E. Zois, “Fusion of correlated decisions for writer verification,”
Pattern Recognition, vol. 34, pp. 47–61, January 2001.
[98] S.H.Cha and S.N.Srihari, “Writer identification: Statistical analysis and dichotomizer,”
in SS&SPR LNCS- Advances in Pattern Recognition, vol. 1876, pp. 123–132, Springer-
Verlag, Sep 2000.
[99] C. SH and S. Srihari, “Multiple feature integration forwriter verification,” inInternational
Workshop on Frontiers in Handwriting Recognition, pp. 333–342, 2000.
[100] B. Zhang and S. Srihari, “Binary vector dissimilaritymeasures for handwriting identifica-
tion,” in International Society for Optical Engineering proceedings series, pp. 155–166,
2003.
[101] K. B. S. N. Srihari and M. Beal, “A statistical model forwriter verification,” in Inter-
national Conference on Document Analysis and Recognition, (Seoul, Korea), pp. 1105–
1109, August 2005.
[102] S. Cha and C. Tappert, “Automatic detection of handwriting forgery,” in International
Workshop on Frontiers in Handwriting Recognition, pp. 264–267, 2002.
[103] M. Tapiador and J. Siguenza, “Writer identification method based on forensic knowledge,”
in International Conference on Biometric Authentication, pp. 555–561, 2004.
[104] L. V. K. F. M. van Erp and L. Schomaker, “The wanda measurement tool for forensic
document examination,” inInternational Graphonomics Society, pp. 282–285, 2003.
[105] L. Schomaker and L. Vuurpijl, “Forensic writer identification: A benchmark data set and
a comparison of two systems.” Technical Report, 2000.
[106] L. V. K. Franke, L. Schomaker and S. Giesler, “Fish-new: A common ground for
computer-based forensic writer identification,” inEuropean Academy of Forensic Trien-
nial Meeting, (Istanbul, Turkey), p. 84, 2003.
82

[107] D. Lopresti and J. Raim, “The effectiveness of generative attacks on an online handwriting
biometric,” in International Conference on Audio Video Based Person Authentication,
p. 1090, 2005.
[108] Y. Yamazaki, A. Nakashima, K. Tasaka, and N. Komatsu, “A study on vulnerability in on-
line writer verification system,” inInternational Conference on Document Analysis and
Recognition, vol. II, 2005.
[109] P. Hew, “Geometric and zernike moments.” P C Hew. Geometric and Zernike Mo-
ments. Diary, Department of Mathematics, The University ofWestern Australia,
http://maths.uwa.edu. au/ phew/postgrad/diaries/geozermom.ps.Z, October 1996., 1996.
[110] T. Gale, “Object detection using geometric invariantmoment,”American Journal of Ap-
plied Sciences, vol. 3, June 2006.
[111] F. G. A.K Jain and S. Connel, “On-line signature verification,” Pattern Recognition,
vol. 35, pp. 2963–2972, December 2002.
[112] C.V.Jawahar and A. Balasubramanian, “Synthesis of online handwriting in indian lan-
guages,” inInternational Workshop on Frontiers in Handwriting Recognition, (La Baule,
France), October 2006.
[113] R. Schapire, “The boosting approach to machine learning: An overview.” In D. D. Deni-
son, M. H. Hansen, C. Holmes, B. Mallick, B. Yu, editors, Nonlinear Estimation and
Classification, Springer, 2003.
[114] P. A. Viola and M. J. Jones, “Robust real-time face detection,” International Journal of
Computer Vision, vol. 57, no. 2, pp. 137–154, 2004.
[115] R. E. Schapire, “Theoretical views of boosting,”Lecture Notes in Computer Science,
vol. 1572, pp. 1–10, 1999.
[116] Y. Amit and D. Geman, “A computational model for visualselection,”Neural Computa-
tion, vol. 11, no. 7, pp. 1691–1715, 1999.
[117] F. Fleuret and D. Geman, “Coarse-to-fine face detection,” International Journal of Com-
puter Vision, vol. 41, no. 1/2, pp. 85–107, 2001.
[118] H. Sakoe and S. Chiba, “Dynamic programming algorithmoptimization for spoken word
recognition,”IEEE transactions on Acoustics, Speech, and Signal processing, vol. Assp-
26, Feb 1978.
[119] R. Morris,Forensic Handwriting Identification: Fundamental concepts and primiciples.
Academic Press, 2000.
[120] J. Trevis, “Forensic document examination validation studies.” Solicitation:
http://ncjrs.org/pdffiles/sl297.pdf, Oct 1998.
83

[121] T. S. Press W.H., Flannery B.P. and V. W.T.,Numerical Recepies in C: The Art of Scientific
Computing. Cambridge University Press, 1992.
84
Related Documents