Automatic milking: economic consequences caused by somatic cell count Thesis report Wednesday, 03 July 2019 Niek van Grinsven Student number: 930609-279-080 Study program: Management, Economics and Consumer studies Specialisation: Business economics Course code: BEC-80430 Supervisor WUR: Dhr.Ir. B. van den Borne Second supervisor WUR: Prof.Dr.Ir. H. Hogeveen Period: Part-time: November 19 th 2018 until March 1 st 2019 Full-time: March 2 nd 2019 until 18 th July 2019

Welcome message from author
This document is posted to help you gain knowledge. Please leave a comment to let me know what you think about it! Share it to your friends and learn new things together.
Transcript

Automatic milking: economic consequences caused by somatic cell count
Thesis report Wednesday, 03 July 2019 Niek van Grinsven
Student number: 930609-279-080 Study program: Management, Economics and Consumer studies Specialisation: Business economics Course code: BEC-80430 Supervisor WUR: Dhr.Ir. B. van den Borne Second supervisor WUR: Prof.Dr.Ir. H. Hogeveen Period: Part-time: November 19th 2018 until March 1st 2019 Full-time: March 2nd 2019 until 18th July 2019
Automatic milking II
Acknowledgements During the master at the University of Wageningen, writing the thesis is an important step to obtain the master degree. With the help of a thesis it is possible to show the developed skills, such as academic writing and data analysis. I have chosen to do research on the effects of robot milking on somatic cell count, which has increased my knowledge and will help me in the future. Writing a thesis is not possible without the help and support of supervisors, family and friends. First of all I am very thankful for the supervision of dr.ir. Bart van den Borne, with his help it was possible to accomplish the results. I am also thankful to prof.dr.ir. Henk Hogeveen who provided me with this subject and who has brought me into contact with Bart. I would also like to name dr. Mariska van der Voort and CRV Holding BV who enabled their data for this research. As last I want to thank my parents, brothers, girlfriend and friends who have support me during my study and especially during my master thesis. The master thesis will have a great impact on my future career. It has given me the knowledge which I can use when I start at the company of my parents. The knowledge gained from the theory will help me in practice; for this I will always be grateful. Once again, I would like to thank everyone for their support and help. I wish you pleasant reading. Niek van Grinsven Wednesday, 03 July 2019

Automatic milking III
Summary Automatic milking systems (AM-systems) are known due to two major advantages; reduce in labour and increase in milk yield. However, the exponential growth of AM-systems has led to a discussion about the somatic cell count (SCC). During the last years, the average SCC in the Netherlands has decreased to approximately 175,000 cells/ml. The relation between milk quality, animal welfare and SCC show the importance of SCC within AM-systems. Somatic cell count does not only affect the parameters, such as milk yield, milk quality or animal welfare, but also the economic performance on a farm. The average total costs of mastitis are mostly related with the failure costs, cost due to treatment or consequences of mastitis such as milk production losses. For cows with a high SCC, the economic losses are caused by production losses and variate between primiparous (0.4 kg milk per day) and multiparous (0.6 kg milk per day) cows. The transition from conventional milking systems (CM-systems) to AM-systems can have an effect on different parameters, among which is the bulk milk somatic cell count (BMSCC). The aim of this research was to analyse the economic consequences due to SCC after the transition to AM-systems. Also the consequences on cows with high SCC and 305-day production were important factors within this research. With the use of multivariable population-averaged generalized estimating equations models, the farms which made a transition to a AM-system were compared to farms with CM-systems. A significant increase in BMSCC was observed directly after the transition to a AM-systems. However the increase became less pronounced over the years with a direct increase of 20,000 cells/ml in 2007 and 2,000 cells/ml in 2017. The transition to AM-systems also had an effect on cows with high SCC or new high SCC. For both parameters, an direct increase was shown which did not return to the same level as before the transition. The 305-day production after the transition did increase. In 2017, the 305-day production did even increase by 87.5% from 12 months before till 12 months after transition. The economic losses within this research were focused on the costs of individual SCC and the incidence rate of clinical mastitis. On cow level, the economic losses increased directly after the transition and were higher compared to farms with CM-systems. The results of this research show the (economic) consequences of SCC after the transition to a AM-system. The methodology and results of this study can be used for further research, for example a study whereby farms are categorised before the transition to AM-systems or a dividing in AM-system brands. The results also adds knowledge to the further improvement of the SCC in AM-systems. The results showed an improvement of the increase in BMSCC, which will have a positive impact on the advice for farms when considering switching to AM-systems.

Automatic milking IV
Content Acknowledgements ......................................................................................................................................... II
Summary ........................................................................................................................................................... III
Content ................................................................................................................................................................IV
1 Introduction .............................................................................................................................................. 5
1.1 Problem statement ........................................................................................................................ 5
1.2 Objective of study ........................................................................................................................... 6
2 Literature review .................................................................................................................................... 7
2.1 Automatic milking systems and somatic cell count.......................................................... 7
2.2 Economic performance .............................................................................................................. 11
2.3 Somatic cell count trend ............................................................................................................ 14
2.4 Conclusion ....................................................................................................................................... 16
3 Materials and methods........................................................................................................................ 17
3.1 Data management ........................................................................................................................ 17
3.2 Methodology ................................................................................................................................... 18
4 Results ....................................................................................................................................................... 21
4.1 Descriptive statistics ................................................................................................................... 21
4.2 BMSCC and 305-day production ............................................................................................ 23
4.3 High SCC and new high SCC ...................................................................................................... 24
4.4 Economic losses ............................................................................................................................ 25
5 Discussion ................................................................................................................................................ 27
6 Conclusion ................................................................................................................................................ 29
Bibliography ..................................................................................................................................................... 30
Appendix............................................................................................................................................................ 37
Appendix I: Coding cow level.......................................................................................................... 37
Appendix II: Coding farm level ........................................................................................................ 42
Appendix III: Coding combination ................................................................................................... 43
Appendix IV: Coding analyses ........................................................................................................... 45
Appendix IV: Coding economic analyses ...................................................................................... 47

Automatic milking 5
1 Introduction This chapter describes the introduction of this thesis report, concluding problem statement, research objective and research questions and the methodology of this thesis.
1.1 Problem statement Introduction
Automatic milking systems (AM-systems) became globally accepted as a milking technology which reduces the need for labour and offers the possibility for an increased milking frequency and consequently the milk yield. Currently there are more than 25,000 dairy farms with AM-systems in the world (Barkema et al., 2015). The current number of farms with AM-systems in the Netherlands is 4,157 (Stichting KOM, 27-01-2019). Several studies have analysed the advantages and disadvantages of AM-systems. Frequent mentioned items are reduced labour, between 18% and 46%, (Bentley et al., 2013; Hogeveen et al., 2004) and increased milk production. The average milk production increase is from 10% to 15%. (Hansen, 2015) but when correcting for the yearly production increase due to improving genetics and management, the increase of milk production is only around 2% (Wade et al., 2004). On the other hand, the impact of AM-systems on milk quality and animal health is not consistent. Several studies showed no differences in somatic cell count (SCC) on quarter milking or the bulk tank SCC (BTSCC) (Berglund et al., 2002; Tse et al., 2018). Another study expects that the variation in the milking interval can be part of the reason in the increase in SCC (Hogeveen et al., 2001).
The awareness of SCC has increased in the last years. Milk with a high level of SCC cannot be used for cheese production and has a negative influence on the condition of the animal (Sharma et al., 2011). This causes an increase in the awareness of consumers and organisations regarding animal welfare (Schukken et al., 2003). But most important is the negative influence on milk quality, lower milk production and changes in milk consistency (Sharma et al., 2011). Those changes have also an influence on the profitability of a dairy farm. A study concluded that “the SCC is a useful benchmark for evaluating dairy farm profit and milk quality” (El‐Tahawy & El‐Far, 2010, page 468). This study mentioned a decrease of milk return per month per cow from 24% when SCC is over 400,000/ml instead of being below 100,000/ml.
Somatic cell count is frequently used as a proxy for mastitis and mastitis is one of the most expensive disease costs in dairy farms (Geary et al., 2012). Previous surveys have found that the incidence of mastitis in American dairy herds is rising over time, whereas milk quality standards have become more rigorous. In the Netherlands, the incidence of mastitis reduced in the past years. A study by Lam et al. (2013) has shown a significantly decrease of clinical mastitis between 2004 and 2009. Subclinical mastitis occurrence did not change significantly, although a more recent study has shown a decrease of 5% of subclinical mastitis in the last years (Santman-Berends et al., 2016).
The inconsistencies of studies on SCC and milk quality within AM-systems affects the opinion from the dairy farmer. According to Van der Vorst et al. (2002), milk quality is significantly lower with AM-systems, with the poorest quality in the first six months after introducing an AM-system. However, the effect of AMS on BTSCC has been variable according to a study by Tse et al. (2018). With the use of linear regression models the strength of associations between BTSCC and time since transition to AM-systems has been shown. A decrease or no change after the transition to AM-systems was reported by 80% of the interviewed respondents. Based on the reported averages, geometric mean of the BTSCC was 180,000/ml. According to de Koning (2011), the results of SCC before

Automatic milking 6
automatic milking are 175,000/ml and after automatic milking increased to 190,000/ml. Both are still far within the requirements of the dairy industry.
According to developers of AM-systems, the technique of the AM-systems has improved significantly. The knowledge of SCC within AM-systems has ensured that the milking technique has improved, besides the knowledge of farmers working with an AM-system. The change in working method has also an impact on the SCC. Nowadays suppliers of AM-systems advice to improve the udder health before the transition, which also reduces the SCC.
Problem statement Several studies have shown the differences of SCC before and after automatic milking, effects on milk quality, milk yield and corresponding milk return. But none is focussed on the costs and economic efficiency of variation in SCC by AM-systems, where the decrease in milk return and increase in costs are taken into account. According to the current literature, there is no study about the economic consequences of SCC within AM-systems. There are several studies about SCC in AM-systems and about the difference in milk return within AM-systems. However, these studies are not focused on the overall economic consequences of SCC within AM-systems.
This study aims to analyse the SCC changes on Dutch dairy farms after introducing AM-systems and to quantify its economic consequences. The results of the study will contribute to the discussion on economic consequences of SCC within AM-systems within the Dutch dairy industry.
1.2 Objective of study In connection with the problem statement, the aim of this study is to analyse the effects on the economic efficiency of SCC within AM-systems, based on the overall trend of SCC in Dutch dairy farms. This will lead to the following main research question: What are the economic consequences of SCC after the introduction of an AM-systems in Dutch dairy farms? The main research question can be divided into several sub-questions, in order to examine the influences mentioned in the problem statement and to answer the present knowledge gap:
1. What is the relation between animal welfare, milk quality and SCC? 2. What is the influence of SCC on economic performance? 3. What is the overall trend of SCC on Dutch dairy farms? 4. What are the changes on SCC after introducing AM-systems? 5. What are the economic consequences of SCC on a Dutch dairy farm?

Automatic milking 7
2 Literature review The global acceptance of Automatic Milking Systems (AM-systems) as a milking technology has led to more than 25,000 dairy farms with AM-systems worldwide (Barkema et al., 2015). AM-systems are known for a reduction in labour, increase in milk yield and improvement of animal welfare (Jacobs & Siegford, 2012). However, the results in milk quality vary widely (Tse et al., 2018). AM-systems are developed in order to improve the farmers daily routine, but what are the results on milk yield, milk quality and animal welfare? Somatic cell count can be used to monitor the occurrence of subclinical mastitis (SCM), and is therefore an important component of milk in assessing aspects of quality and hygiene. Mastitis has a direct negative influence on animal welfare, milk quality, and milk yield (Cinar et al., 2015; Petersson-Wolfe et al., 2018; Sharma et al., 2011). But what is the direct relation between those aspects and the trend within Dutch dairy farms? Within this chapter several sub-questions will be answered. First of all a introduction of AM-systems and SCC is given, thereafter the relation between those subject and milk yield, milk quality and animal welfare is described, answering sub-question 1. Also the influence of SCC on economic performance, answering sub-question 2, will be given. Additionally, sub-question 3, the overall trend in the last 10 years of SCC on Dutch dairy farms, will be answered.
2.1 Automatic milking systems and somatic cell count Milking is a time-consuming and demanding routine task, especially on smaller dairy farms where milking is done by the family. On larger farms, where hired labour is used, it is often difficult to continue the hired labour due to competition from other companies. Automatic milking systems offer the possibility to relieve the farmer of this labour-intensive task. AM-systems offer two major advantages; reduction in labour for milking and increase in milk production (Rotz et al., 2003). After introducing the AM-systems, it became apparent that it is an entirely new management system whereby milking, milk quality, feeding, cow behaviour, cow traffic, grazing and animal welfare are important factors (Svennersten-Sjaunja & Pettersson, 2008). Milk yield is related to the milking frequency of high-yielding cows. With a milking frequency of more than twice daily, an average increase of 10%-15% on the milk yield is expected (Österman & Bertilsson, 2003). With AM-systems it is possible to control the milking frequencies during different stages of the lactation and between different cows (Svennersten-Sjaunja & Pettersson, 2005). Somatic cell count and udder health are highly related to milk quality and dairy cow hygiene (Sant’Anna & Paranhos da Costa, 2011). Concerns were raised regarding udder health and SCC after introduction of AM-systems (Klungel et al., 2000; Kruip et al., 2002). A decrease in milk quality, due to an increased SCC or total bacterial count, has significant negative consequences for the farmer and the dairy industry (Rasmussen et al., 2002). An significant increase of the total bacterial count is shown during the first three months after introduction of AM-systems. Although several studies have shown that AM-systems do not increase SCC and occur no increase in clinical mastitis (Bennedsgaard et al., 2006; Berglund et al., 2002), higher values of SCC are shown during the first year after introduction. Nevertheless the SCC decreased over time and showed an improvement in the third year (Castro et al., 2018). After the introduction of AM-systems, the awareness that the systems have an influence on the cows’ well-being is raised. A study by Hagen et al. (2005) has concluded
Automatic milking 8
an increased chronic stress level compared to loose housing systems and a study by Stefanowska et al. (2000) has shown an increase of attachment failure with robotic milking. Although an increase of chronic stress during milking was not observed, attachment failure can lead to stress and leakage of milk. Somatic cell count, a udder-health-associated variable, is an indicator for mastitis. Risk factors for mastitis can be categorised into three group; factors related to (1) exposure to causal pathogens, (2) host resistance to infection and (3) cure of infection (Barkema, Schukken, et al., 1999). The first factor group is frequently mentioned on farms with CM-systems. Factors related to this group are; hygiene of the cow and the milking machine, housing, milking procedure, post-milking teat disinfection and milk leakage (Barkema, Schukken, et al., 1999; Breen et al., 2009; Klaas et al., 2005; Santman-Berends et al., 2016). Risk factors related to the second group, host resistance to infection, are for example; breed, milk production level and nutrition (Heringstad et al., 2000; Hogan et al., 1993; Schukken et al., 1990). Factors associated with the last group, cure of infection, include cow, treatment-associated factors and pathogen characteristics (Barkema et al., 2006).
Many risk factors for mastitis in CM-systems apply to AM-systems also, however some determinants differ (Deng et al., 2019). For example, the detection of clinical mastitis is based on screening with sensors within AM-systems, while it is done by the farmer within CM-systems Deng et al. (2019). Moreover, udder preparation is done automatically with the same intensity within AM-systems, whereas the farmer can adjust the process related to the circumstances within CM-systems. Additionally, the incidence of milk leakage is higher within AM-systems compared to CM-systems, according to Persson Waller et al. (2003) An increase in SCC does not only have an effect on the potential of clinical mastitis but also, as mentioned before, on the milk yield, milk quality and animal welfare. During the next sections, these effect are discussed.
2.1.1 Milk yield When introducing AM-systems, farmers frequently mention a milk yield increase. However, production losses may be observed also because almost 10% of the herd realised a milking frequency of 2 or lower which can lead to non-increase in milk yield (De Koning & Rodenburg, 2004). Penry et al. (2018) has shown a positive relation between milking interval and days in milk (DIM; figure 1). Cows in late lactation may thus explain that 10% of the total herd has a milking frequency of 2 or lower.

Automatic milking 9
As mentioned before SCC is mainly affected by exposure to causal pathogens and host resistance to infections, mainly mammary gland infections (Dohoo & Meek, 1982). SCC is also influenced by physiological and management factors such as milking frequency, lactation stage or stress (Wiktorsson & Sørensen, 2004). According to a study by Helmreich et al. (2016), SCC is only weakly influenced by milking frequency. A higher milking frequency tends to have a lower SCC compared to lower milking frequencies (figure 2). Moreover, an increase in SCC does have a significant effect on milk yield. Figure 3 indicates the correlation between SCC and milk yield, with a P-value under 0.01 (Cinar et al., 2015). Milk yield loss will increase related to the number of day with SCC ≥ 100,000 cells/ml, whereby cows with chronic mastitis have higher milk losses than cows with a new infection. The daily revenue losses vary from $1.20 per cow per day in the first month, to $2.06 per cow per day in the 10th month of lactation (Hadrich et al., 2018).
Although SCC has a negative correlation with milk yield it has a positively correlation with the total solids of milk such as milk fat, milk protein and milk urea Nitrogen (figure 4). The milk lactose level is also correlated with SCC but did not change in cows in first lactation. It decreased in cows in second lactation (Cinar et al., 2015).
Figure 4 Correlation of SCC with milk composition (Cinar et al., 2015)
2.1.2 Milk quality Somatic cell count is a common measure of milk quality (Harding, 1995, page 25). Also, total plate count, free fatty acids, freezing point, fat content and protein content are important parameters. According to a study by Klungel et al. (2000), conducted on 28 farms in the Netherlands, the introduction of AM-systems in dairy farms has a negative impact on milk quality. Increases in total plate count, free fatty acids and freezing point were observed. The SCC did not change after introduction of the AM-systems but the SCC
Figure 1 Linear regression of milking interval versus days in milk (Penry et al., 2018)
Figure 2 Influence of SCC by milking frequency (Helmreich et al., 2016)
Figure 3 Correlation of SCC with milk yield (Cinar et al., 2015)

Automatic milking 10
levels before transition were already rather high (> 200,000 cells/ml) compared to SCC levels of CM-systems in this study. A more recent study has shown an significant increase in SCC during and just after the introduction of AM-systems. Figure 5 shows the course of the BMSCC on 99 Danish farms 45 days before and until 390 after the introduction of the AM-systems. Three groups of AM-systems are compared with a group of CM-systems, the groups were divided based on the installation dates of the AM-systems. The results show that the introduction of AM-systems has a high impact on bulk milk SCC (BMSCC) during and after the introduction of AM-systems (De Koning et al., 2004). AM4, the group to which the AM-system was last installed, does show a lower BMSCC compared to the other AM-groups.
A more recent study by Castro et al. (2018) only indicates a difference between the summer and winter months. The BMSCC was the highest during the first year after installation (figure 6) although differences between before and after introducing an AM-system were not significant (P-value = 0.275). Over time the BMSCC decreases to the same level before the introduction of AM-systems, due to gaining experience, improvement in management and the adaption of the cows (Castro et al., 2018).
2.1.3 Animal welfare Cows usually fulfil their activities, such as eating and resting, synchronously. With an AM-system, cows are forced to eat, milk and rest separately and line-up in front of the system. This can lead to problems with low-ranked cows to adapt in a situation where they must compete with high-ranked cows (Svennersten-Sjaunja & Pettersson, 2008). Cows kept in barns with AM-systems do have an increased chronic stress, compared with cows kept in a loose housing system. However, this is not observed during milking (Hagen et al., 2005). Moreover, adaptation to the new system within a few days is possible for most cows but there is a large variation around that. The first visit of a cow to the AM-system did increase the heart rate compared to CM-system but the second visit did not (Weiss et al., 2004). Also the risk for failure of milking has an impact on cow behaviour. Missed attachment of the milking cluster impacts the time spent lying and it results in more frequent urinating (Stefanowska et al., 2000). On farms with AM-systems, the hygiene of the cow and milking system are significantly related to udder health (Dohmen et al., 2010). A recent study has determined risk factors for mastitis within AM-systems. The dairy farms were divided into two principal
Figure 5 Changes of BMSCC before and after introduction of AM-systems (De Koning et al., 2004)
Figure 6 Changes of BMSCC before and after introduction of AM-systems (Castro et al., 2018)
Automatic milking 11
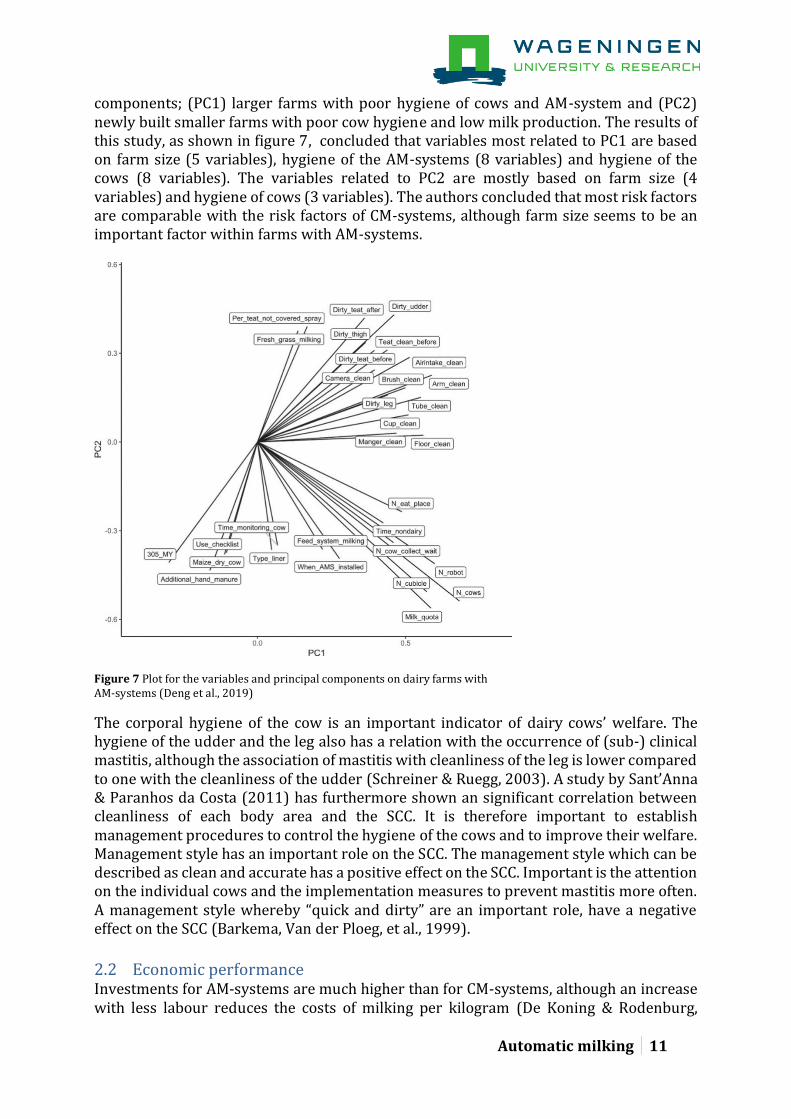
components; (PC1) larger farms with poor hygiene of cows and AM-system and (PC2) newly built smaller farms with poor cow hygiene and low milk production. The results of this study, as shown in figure 7, concluded that variables most related to PC1 are based on farm size (5 variables), hygiene of the AM-systems (8 variables) and hygiene of the cows (8 variables). The variables related to PC2 are mostly based on farm size (4 variables) and hygiene of cows (3 variables). The authors concluded that most risk factors are comparable with the risk factors of CM-systems, although farm size seems to be an important factor within farms with AM-systems.
Figure 7 Plot for the variables and principal components on dairy farms with AM-systems (Deng et al., 2019)
The corporal hygiene of the cow is an important indicator of dairy cows’ welfare. The hygiene of the udder and the leg also has a relation with the occurrence of (sub-) clinical mastitis, although the association of mastitis with cleanliness of the leg is lower compared to one with the cleanliness of the udder (Schreiner & Ruegg, 2003). A study by Sant’Anna & Paranhos da Costa (2011) has furthermore shown an significant correlation between cleanliness of each body area and the SCC. It is therefore important to establish management procedures to control the hygiene of the cows and to improve their welfare. Management style has an important role on the SCC. The management style which can be described as clean and accurate has a positive effect on the SCC. Important is the attention on the individual cows and the implementation measures to prevent mastitis more often. A management style whereby “quick and dirty” are an important role, have a negative effect on the SCC (Barkema, Van der Ploeg, et al., 1999).
2.2 Economic performance Investments for AM-systems are much higher than for CM-systems, although an increase with less labour reduces the costs of milking per kilogram (De Koning & Rodenburg,

Automatic milking 12
2004). When an AM-systems replaces hired labour, a substantial saving up to $200 per cow per year can be obtained. However, when the farmer’s labour is replaced, the saving is less tangible (Rotz et al., 2002).
Rotz et al. (2002) analysed the economic impact of AM-systems. The results of this study, shown in figure 8, are divided into three different systems; an CM-system with twice daily milking, an AM-system also with twice daily milking and an AM-system with three times a day milking. The study concluded that the economic benefit of an AM-system will be the highest on farms where herd size matches the capacity of the AM-system. Figure 8 indicates that on several herd sizes, the CM-systems has a higher annual net return compared to the AM-systems.
Figure 8 Annual net return as influenced by milking system (Rotz et al., 2002)
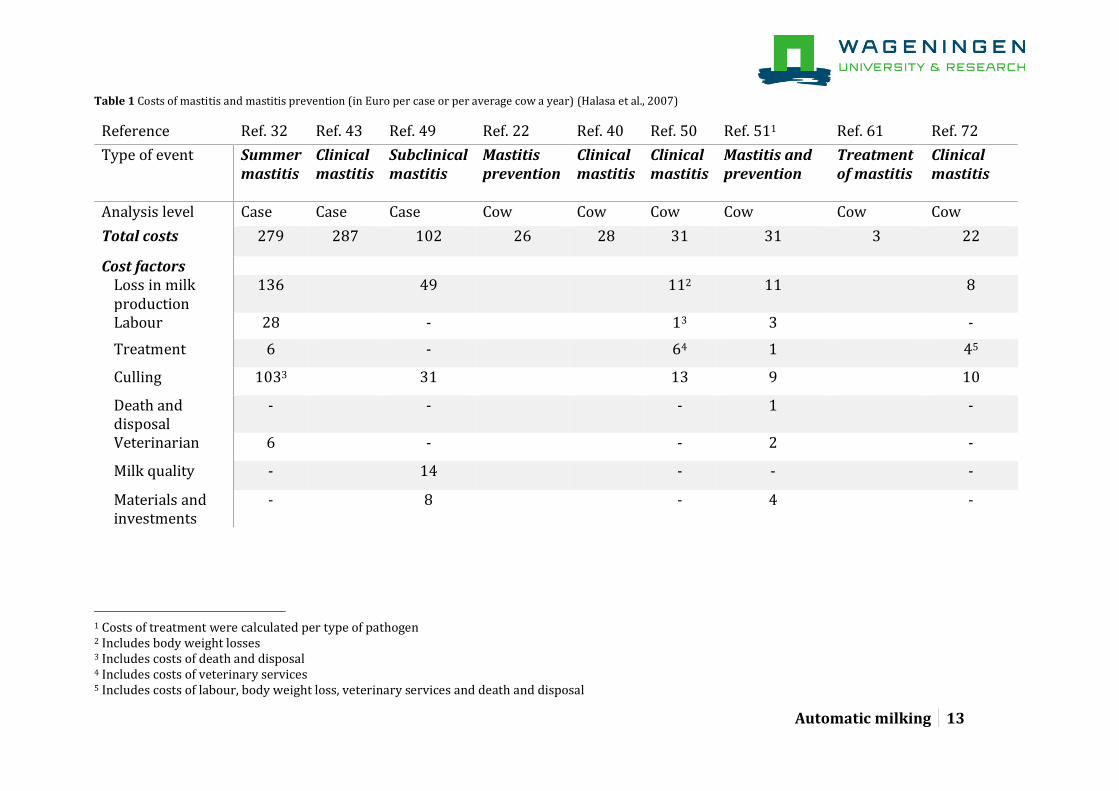
Although several herd sizes have a higher annual return when using an AM-system compared to an CM-system (Rotz et al., 2002), the costs of an increase in SCC is not taken into account. An increase in SCC has an negative impact on the milk yield and milk return (El‐Tahawy & El‐Far, 2010). The costs can be divide in (1) penalties in the milk payment related to SCC and (2) veterinary costs due to mastitis. To reduce the costs and avoid payment penalties, culling of cows with high SCC is commonly advised. However culling is not often applied, culling incurs a cost of replacement and this might be more expensive than accepting milk quality penalties (Dekkers et al., 1996). Another approach is to withdraw the milk from cows with high SCC. But according to Nielsen et al. (2010), withdrawing milk from cows with high SCC is never profitable due to a substantial amount of milk withdrawal. The costs of mastitis and mastitis prevention can be divided into several factors and several events. Table 1 shows an indication of all costs according to different studies, based on the events and the factors defined by Halasa et al. (2007).
Automatic milking 13
Table 1 Costs of mastitis and mastitis prevention (in Euro per case or per average cow a year) (Halasa et al., 2007)
Reference Ref. 32 Ref. 43 Ref. 49 Ref. 22 Ref. 40 Ref. 50 Ref. 511 Ref. 61 Ref. 72
Type of event Summer mastitis
Clinical mastitis
Subclinical mastitis
Mastitis prevention
Clinical mastitis
Clinical mastitis
Mastitis and prevention
Treatment of mastitis
Clinical mastitis
Analysis level Case Case Case Cow Cow Cow Cow Cow Cow
Total costs 279 287 102 26 28 31 31 3 22
Cost factors Loss in milk production
136 49 112 11 8
Labour 28 - 13 3 -
Treatment 6 - 64 1 45
Culling 1033 31 13 9 10
Death and disposal
- - - 1 -
Veterinarian 6 - - 2 -
Milk quality - 14 - - -
Materials and investments
- 8 - 4 -
(Fourichon et al., 2001; Hillerton et al., 1992; Kaneene & Hurd, 1990; Kossaibati & Esslemont, 1997; McInerney et al., 1992; Miller & Dorn, 1990; Miller et al., 1993; Reinsch & Dempfle, 1997; Sischo et al., 1990)
1 Costs of treatment were calculated per type of pathogen 2 Includes body weight losses 3 Includes costs of death and disposal 4 Includes costs of veterinary services 5 Includes costs of labour, body weight loss, veterinary services and death and disposal
Automatic milking 14
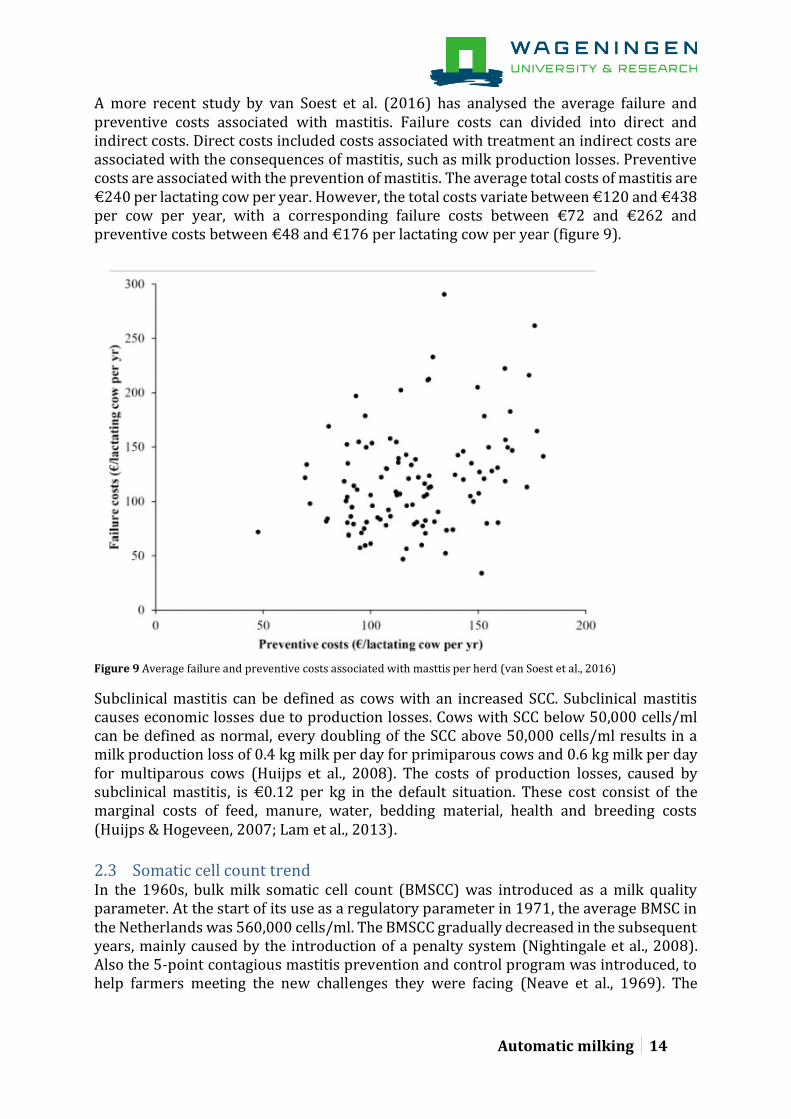
A more recent study by van Soest et al. (2016) has analysed the average failure and preventive costs associated with mastitis. Failure costs can divided into direct and indirect costs. Direct costs included costs associated with treatment an indirect costs are associated with the consequences of mastitis, such as milk production losses. Preventive costs are associated with the prevention of mastitis. The average total costs of mastitis are €240 per lactating cow per year. However, the total costs variate between €120 and €438 per cow per year, with a corresponding failure costs between €72 and €262 and preventive costs between €48 and €176 per lactating cow per year (figure 9).
Figure 9 Average failure and preventive costs associated with masttis per herd (van Soest et al., 2016)
Subclinical mastitis can be defined as cows with an increased SCC. Subclinical mastitis causes economic losses due to production losses. Cows with SCC below 50,000 cells/ml can be defined as normal, every doubling of the SCC above 50,000 cells/ml results in a milk production loss of 0.4 kg milk per day for primiparous cows and 0.6 kg milk per day for multiparous cows (Huijps et al., 2008). The costs of production losses, caused by subclinical mastitis, is €0.12 per kg in the default situation. These cost consist of the marginal costs of feed, manure, water, bedding material, health and breeding costs (Huijps & Hogeveen, 2007; Lam et al., 2013).
2.3 Somatic cell count trend In the 1960s, bulk milk somatic cell count (BMSCC) was introduced as a milk quality parameter. At the start of its use as a regulatory parameter in 1971, the average BMSC in the Netherlands was 560,000 cells/ml. The BMSCC gradually decreased in the subsequent years, mainly caused by the introduction of a penalty system (Nightingale et al., 2008). Also the 5-point contagious mastitis prevention and control program was introduced, to help farmers meeting the new challenges they were facing (Neave et al., 1969). The
Automatic milking 15
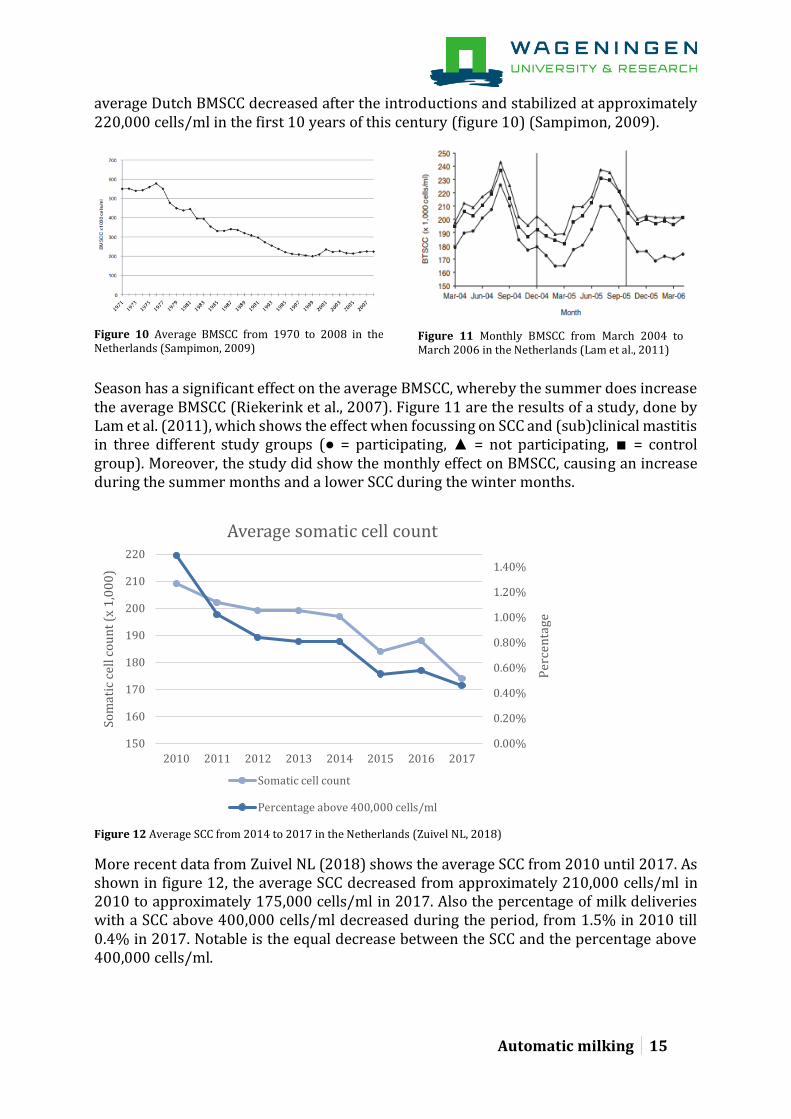
average Dutch BMSCC decreased after the introductions and stabilized at approximately 220,000 cells/ml in the first 10 years of this century (figure 10) (Sampimon, 2009).
Season has a significant effect on the average BMSCC, whereby the summer does increase the average BMSCC (Riekerink et al., 2007). Figure 11 are the results of a study, done by Lam et al. (2011), which shows the effect when focussing on SCC and (sub)clinical mastitis in three different study groups (● = participating, ▲ = not participating, ∎ = control group). Moreover, the study did show the monthly effect on BMSCC, causing an increase during the summer months and a lower SCC during the winter months.
Figure 12 Average SCC from 2014 to 2017 in the Netherlands (Zuivel NL, 2018)
More recent data from Zuivel NL (2018) shows the average SCC from 2010 until 2017. As shown in figure 12, the average SCC decreased from approximately 210,000 cells/ml in 2010 to approximately 175,000 cells/ml in 2017. Also the percentage of milk deliveries with a SCC above 400,000 cells/ml decreased during the period, from 1.5% in 2010 till 0.4% in 2017. Notable is the equal decrease between the SCC and the percentage above 400,000 cells/ml.
0.00%
0.20%
0.40%
0.60%
0.80%
1.00%
1.20%
1.40%
150
160
170
180
190
200
210
220
2010 2011 2012 2013 2014 2015 2016 2017
Per
cen
tage
Som
atic
cel
l co
un
t (x
1,0
00
)
Average somatic cell count
Somatic cell count
Percentage above 400,000 cells/ml
Figure 10 Average BMSCC from 1970 to 2008 in the Netherlands (Sampimon, 2009)
Figure 11 Monthly BMSCC from March 2004 to March 2006 in the Netherlands (Lam et al., 2011)
Automatic milking 16
2.4 Conclusion Somatic cell count has an effect on different performance indicators of farms with AM-systems. During the last years, the average SCC in the Netherlands has decreased to approximately 175,000 cells/ml with only 0.4% of all cows above 400,000 cells/ml. However, the exponential growth of AM-systems have led to an discussion about the SCC. The relation between milk quality, animal welfare and SCC show the importance of SCC within AM-systems. Even though SCC has an positive correlation with several milk quality aspects, such as total solids, milk fat and protein, SCC does decrease the total milk yield. The relation between animal welfare and SCC is not directly feasible, indirect relations through indicators as cleanliness of the legs or udders are important to indicate the animal welfare. Farms with AM-systems have comparable risk factors for animal welfare as farms with CM-systems, however missed attachment or cow hygiene are more important within AM-systems. Somatic cell count does not only affect the parameters but also the economic performance on a farm. The average total costs of mastitis, failure and preventive costs, are €240 per lactating cow per year, which mostly results from the failure costs. For cows with a high SCC, the economic losses are caused by production losses and variate between primiparous (0.4 kg milk per day) and multiparous (0.6 kg milk per day) cows.
Automatic milking 17
3 Materials and methods Data management and methodology are part of the overall effort to design or analyse a study. Several steps need to be taken into account, such as formulating the problem, collecting data, constructing a computer program which need to be verified and analysing output data (Law, 2015).
In this paragraph, the data management and methodology will be explained. The data management is focused on changing the data, obtained from CRV Holding BV, to analysable data. Thereafter, the methodology to answer the fourth and fifth sub-questions, what are the changes on SCC after introducing AM-systems and what are the economic consequences of SCC on a Dutch dairy farm, will be described.
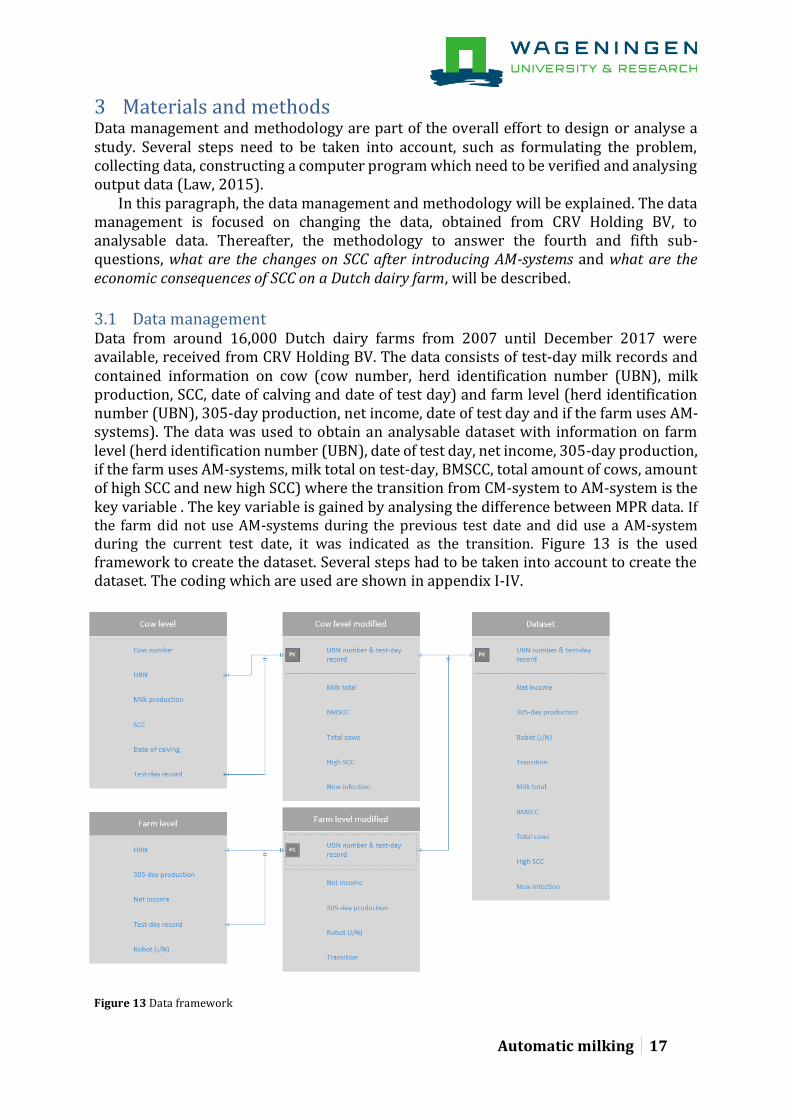
3.1 Data management Data from around 16,000 Dutch dairy farms from 2007 until December 2017 were available, received from CRV Holding BV. The data consists of test-day milk records and contained information on cow (cow number, herd identification number (UBN), milk production, SCC, date of calving and date of test day) and farm level (herd identification number (UBN), 305-day production, net income, date of test day and if the farm uses AM-systems). The data was used to obtain an analysable dataset with information on farm level (herd identification number (UBN), date of test day, net income, 305-day production, if the farm uses AM-systems, milk total on test-day, BMSCC, total amount of cows, amount of high SCC and new high SCC) where the transition from CM-system to AM-system is the key variable . The key variable is gained by analysing the difference between MPR data. If the farm did not use AM-systems during the previous test date and did use a AM-system during the current test date, it was indicated as the transition. Figure 13 is the used framework to create the dataset. Several steps had to be taken into account to create the dataset. The coding which are used are shown in appendix I-IV.
Figure 13 Data framework

Automatic milking 18
Deviating values in a dataset can cause poor results. Missing values is a common problem in analysis and the removal of the complete observation ensures a correct dataset (Acuna & Rodriguez, 2004). Also, the observations within the sixth milking after calving show insignificant values which can influence the results and were therefore deleted within the dataset (Barkema, Deluyker, et al., 1999). The primary outcome of this study was the change of BMSCC after the transition to AM-systems. To calculate the BMSCC, the following code was used (i = cow, j = test-day record):
𝐵𝑀𝑆𝐶𝐶𝑗 = 𝑚𝑖𝑙𝑘𝑖𝑗 ∗ 𝑆𝐶𝐶𝑖𝑗
𝑚𝑖𝑙𝑘 𝑡𝑜𝑡𝑎𝑙𝑗
Also the amount of cows with an high SCC or new high SCC is important within this study. Herd level prevalence of SCM was defined as the proportion of cows having a composite SCC above 200,000 cells/ml (Lam et al., 2013; Van den Borne et al., 2011). If the SCC was less than 200,000 cells/ml during the previous test date and above 200,000 cells/ml during the current test date, it was indicated as a cow with a new high SCC.
3.2 Methodology The methodology consists of two parts; data analysis and normative economic modelling. Within this study, the focus is on the change of the BMSCC when introducing AM-systems.
3.2.1 Data analysis The effect before and after introducing AM-systems will be analysed with Multivariable Population-Averaged Generalized Estimating Equations (PA-GEE) models. The natural logarithm of the BMSCC and the 305-day production are normally distributed, and therefore a GEE analysis with a Gaussian distribution and a link function were used. To select the best working correlation structure among competing structures, the quasi-likelihood under the independence model criterion (QIC) was used, resulting in the autoregressive correlation structure to be used for all models. The autoregressive correlation structure estimates the general trend of correlations decreasing with length of time interval (Littell et al., 2000). To analyse the effect of transitioning from CM-systems to AM-systems on the proportion of cows with high SCC or new high SCC, also a GEE model was used. Instead of using a Gaussian distribution, the negative binomial distribution was used with identity log function and autoregressive correlation structure. The number of cows with a high SCC, or a new high SCC, were modelled; the natural logarithm of the total number of cows at each test day was used as the offset. Within all models, the effect over year and months before or after the transition were analysed. All effects have been corrected per year to be able to quantify over the years. This allows estimation of effects for each year after transition and shows whether it causes a gradual response over years or an immediate effect directly after transition (Mundlak, 1961). To correct for seasonality of the BMSCC, cows with high SCC and new high SCC, a combination of a sine-cosine function was used (Lam et al., 2013). A new variable was established, dif, to ensure that the effect from 12 months before the transition to 12 months after the transition could be analysed. The following model was built for each outcome variable:
Automatic milking 19
𝑌𝑖 = 𝛼 + 𝛽𝑦𝑒𝑎𝑟 + 𝛽𝑑𝑖𝑓 + 𝛽 cos (2 ∗𝑚
12) + 𝛽 sin (2 ∗
𝑚
12) + 𝜀𝑖
where Y = the outcome variable at test day i, α = intercept, year = the year of the test, dif = the month before or after the transition to AM-system, β = estimated regression parameter, m = month of MPR recording (1 to 12) and εi = residual error term. Census data is modelled which causes less valuable statistics because of the large size of the dataset. Therefore, only associations which are significant and considered to be biologically relevant are important within this study. In a separate analysis, the interaction term between year and dif was added to the model to evaluate the changes in dif over years for each outcome variable.
3.2.2 Normative economic modelling The normative economic modelling focused on the economic losses caused by subclinical mastitis and clinical mastitis. The total costs of mastitis is the sum of failure costs and preventive costs. Failure costs are related to treatment or consequences from mastitis, such as production losses, while preventive costs are related to the prevention of mastitis. Within this study the focus will be on the costs of treatment and consequences from mastitis. Costs related to treatment are veterinary visits and medication. Costs related to the consequences are milk production losses or culling.
Subclinical mastitis, defined as cows with an increased SCC, causes milk production losses when SCC is higher than 50,000 cells/ml. To calculate these, a log-linear relationship between SCC and milk production losses per month was modelled as follows (Halasa et al., 2009):
𝑌 = (∑ −1 ∗ (0.72 + ln[𝑆𝐶𝐶𝑗] ∗ 0.22) + ∑ −1 ∗ (1.90 + ln[𝑆𝐶𝐶𝑘] ∗ −0.47)
𝐾
𝑘=1
𝐽
𝑗=1
) ∗ 30.4
SCC ≥ 50 Where Y is the reduction in daily yield on farm level as a result of the SCC, j represents primiparous cows and k represents multiparous cows. To calculate the milk production losses per month, the outcome is multiplied with 30.4.
Clinical mastitis cases (CM) are linked to individual dairy cows, however CM is not correlated with BMSCC (Barkema et al., 1998). Since the dataset did not have any data on clinical mastitis, it was assumed that the clinical mastitis incidence rate would be 1.5% in cows with SCC <200,000 cells/ml and 5.5% for cows with SCC ≥200,000 cells/ml (Van den Borne et al., 2011). The failure costs of clinical mastitis consisted of treatment, veterinary visits, culling and labour. The assumptions used within this study, table 2, are based on the calculations from van Soest et al. (2016). It was assumed that 80% of the clinical mastitis cases were treated with antibiotics by the farmer, 5% was visited by the veterinarian and antibiotics were used and in 15% of the cases the cow was culled, without the use of antibiotics. The costs of antibiotics was assumed to be €22 per case and the cost of a culled cow €480. The labour costs were assumed to be the price of hired labour, €20/h and the wage per visit of the veterinarian was assumed to be €22. It was assumed that the farmer was needed for all three treatments; antibiotics (45 minutes), veterinary visits (45

Automatic milking 20
minutes) and culling (15 minutes). The following model equations were used to calculate the failure costs of clinical mastitis:
𝐴𝑛𝑡𝑖𝑏𝑖𝑜𝑡𝑖𝑐𝑠 (𝐴) = 𝐶𝑀 ∗ 80% ∗ (€22 + 4560⁄ ∗ €20)
𝑉𝑒𝑡𝑒𝑟𝑖𝑛𝑎𝑟𝑦 𝑣𝑖𝑠𝑖𝑡𝑠 (𝑉) = 𝐶𝑀 ∗ 5% ∗ (€22 + €22 + 4560⁄ ∗ €20)
𝐶𝑢𝑙𝑙𝑖𝑛𝑔 (𝐶) = 𝐶𝑀 ∗ 15% ∗ (€480 + 1560⁄ ∗ €20)
Table 2 Overview of assumptions to estimate failure costs (Van Asseldonk et al., 2010; van Soest et al., 2016)
Assumption Value Market and price assumptions
Cost of production losses subclinical mastitis (€/kg of milk) 0.12 Cost of antibiotics for treatment (€/case) 22 Cost of veterinary visits (€/visit) 22 Cost of labour (€/hour) 20 Cost of culled cow (€/cow) 480
Other assumptions Labour for treatment of clinical mastitis (minutes/case) 45 Antibiotic uses (% per cases) 80 Veterinary visits (% of cases) 5 Culling (% of clinical mastitis) 15
The cost of milk production losses were assumed to be €0.12/kg milk (Huijps et al., 2008). These costs consist of the marginal costs of feed, manure, water, bedding material, health and breeding costs and corrected for additional revenues. To calculate the total economic losses per cow per month, the following model equation was used: 𝑇𝑜𝑡𝑎𝑙 𝑒𝑐𝑜𝑛𝑜𝑚𝑖𝑐 𝑙𝑜𝑠𝑠𝑒𝑠 = (𝑌 ∗ €0.12 + 𝐴 + 𝑉 + 𝐶) 𝐼⁄ where Y is the reduction in daily yield, A is the costs of antibiotics, V is the veterinary visits costs, C is the culling costs and I are all cows per farm. The effect before and after the transition were analysed with a PA-GEE mode. The economic losses were normally distributed and therefore a GEE analysis with a Gaussian distribution, a link function and the autoregressive correlation structure was used. Within the model, the effect over year and months before or after the transition were analysed. All effects have been corrected per year to be able to quantify over the years. Also the new variable, dif, was used to ensure that the effect from 12 months before the transition to 12 months after the transition could be analysed. In a separate analysis, the interaction term between year and dif was added to the model to evaluate the changes in dif over years for each outcome variable. The following model was built for the outcome variable:
𝑌𝑖 = 𝛼 + 𝛽𝑦𝑒𝑎𝑟 + 𝛽𝑑𝑖𝑓 + 𝛽 (2 ∗𝑚
12) + 𝛽 (2 ∗
𝑚
12) + 𝜀𝑖
where Y = the outcome variable at test day i, α = intercept, year = the year of the test, dif = the month before or after the transition to AM-system, β = estimated regression parameter, m = month of MPR recording (1 to 12) and εi = residual error term.

Automatic milking 21
Figure 16 Average proportion (%) of cows with high SCC and new high SCC of all Dutch dairy farms
4 Results The results of this study are based on the methodology and dataset received from CRV. The primary outcome of this study is the change of SCC during the transition to AM-systems. The change in production, cows with high SCC and new high SCC were secondary outcomes. Also the economic consequences of SCC when the transition to AM-systems is realised are given. In this chapter several results are shown. First of all the descriptive statistics which gives an indication of the input within the dataset and the overall BMSCC. Thereafter the change in BMSCC and 305-day production during the transition to AM-systems are given. The proportion of cows with high SCC and new high SCC after transition are also described. Finally, the economic consequences of SCC are shown.
4.1 Descriptive statistics The descriptive statistics of all dairy farms included in this study are presented in table 3. The table is divided into several years and for each year divided into farms with CM-systems and AM-systems. The division was made over all years, farms who transitioned later are categorised as a farm with a AM-system. The average herd size increased for both groups, ranging from 58 to 83 cows and 69 to 93 cows. The average 305-day production of all farms is illustrated in figure 14, the 305-day production of farms with AM-systems was 5%-8% higher than the 305-day production of farms with CM-systems (Table 3). The descriptive statistics show that the BMSCC of farms with AM-systems was approximately 2% lower than the BMSCC of farms with CM-systems, mostly related to the high maximum of CM-systems. The average BMSCC of all farms (figure 15) confirms the seasonality and downward trend which were concluded from the literature research. Notable is the similar proportion of cows with high SCC and new high SCC between both systems (Table 3), the national average of both indicators is shown in figure 16.
Figure 14 Average 305-day production of all Dutch dairy farms
Figure 15 Average BMSCC (* 1,000 cells/ml) of all Dutch dairy farms

Automatic milking 22
Table 3 Descriptive statistics of the dataset
2007
Farms with CM-systems Farms with AM-systems
Total farms 13,648 3,818
Farms transited to AM-systems
238
Mean Min Max Mean Min Max Herd 58 1 1,140 69 2 497 305-day production 8,324 1,835 20,670 8,753 3,772 13,044
BMSCC(* 1,000 cells/ml)
232 11 6,186 225 29 1,424
Cows with high SCC (%)
27 0 100 25 0 87
New high SCC (%) 8 0 100 8 0 48
2012
Farms with CM-systems Farms with AM-systems
Total farms 12,609 3,911
Farms transited to AM-systems
386
Mean Min Max Mean Min Max Herd 68 1 1,154 78 2 502 305-day production 8,313 290 27,366 8,829 2,040 12,702
BMSCC(* 1,000 cells/ml)
194 3.5 9,999 192 24 981
Cows with high SCC (%)
22 0 100 22 0 98
New high SCC (%) 8 0 100 9 0 85
2017
Farms with CM-systems Farms with AM-systems
Total farms 11,729 3,895
Farms transited to AM-systems
186
Mean Min Max Mean Min Max Herd 83 1 1,696 93 1 578 305-day production 8,517 2,434 14,109 9,199 1,964 13,732
BMSCC (* 1,000 cells/ml)
178 12 5,069 177 17 1,625
Cows with high SCC (%)
18 0 100 18 0 100
New high SCC (%) 7 0 100 8 0 53

Automatic milking 23
4.2 BMSCC and 305-day production The BMSCC of farms with AM-systems showed a significant and relevant difference compared to the farms with CM-systems, as shown in table 4. During and after the transition, the BMSCC increased. Over the years, there was a decreasing trend in BMSCC.
The average BMSCC of farms with AM-systems increased after the transition, figure 17. However, the BMSCC-increase in the first month after transition became less over the years with an increase of 20,000 cells/ml in 2007 and 2,000 cells/ml in 2017 relative to the farms with CM-systems in the corresponding year. The results before the transition did not show a difference between 2007 and 2017. In the months after the transition, BMSCC decreased to the same level as the CM-systems. However, it did not return to the same level as before the transition.
Figure 17 BMSCC (* 1,000 cells/ml) 12 months before and 12 months after transition to a AM-system in relation to farms with a CM-system (dotted line).
The average 305-day production of farms with AM-systems showed a significant difference compared to farms with CM-systems, as shown in table 4. The first month after the transition did show an increase, which slightly increased to one year after the transition. Over the years, the 305-day production also increased.
The average 305-day production of farms with AM-systems was higher before and after transition compared to farms with CM-systems. However, the 305-day production increased after the transition. Most interesting is 2017; the difference between the 305-day production 12 months before and 12 months after transition increased with 87.5%.
Figure 18 305-day production 12 months before and 12 months after transition to a AM-system in relation to farms with a CM-system (dotted line).

Automatic milking 24
4.3 High SCC and new high SCC The average prevalence of cows with high SCC increased after transition, as shown in table 4. Over time it did not decrease, but it did stagnate. Over the years the amount of cows with high SCC also decreased.
The transition to AM-systems had an effect on the prevalence of cows with high SCC, figure 19. Over the years the amount of cows with high SCC decreased but it never returned to the same level before the transition.
Figure 19 Cows with high SCC (>200,000 cells/ml) 12 months before and 12 months after transition to a AM-system in relation to farms with a CM-system (dotted line).
The transition to AM-systems also had an effect on cows with new high SCC, table 4. A large increase occurred during the first months after transition which slightly decreased in the months following. However, over time it did not decreases to the same level as before the transition. Over the years, the average proportion of cows with new high SCC reduced.
The transition had led to a large increase in the first months after the transition, figure 20. Over the years, the increase became smaller but even after 12 months the amount of cows with a new high SCC stays higher compared to the CM-systems.
Figure 20 Cows with new high SCC (>200,000 cells/ml) 12 months before and 12 months after transition to a AM-system in relation to farms with a CM-system (dotted line).

Automatic milking 25
4.4 Economic losses In this section, the difference of the total economic losses per month per cow before and after transition are given. The economic losses of farms which made a transition to a AM-system does increase in the first months, table 4. However, after a few months the economic losses stagnates. Over the years, the economic losses per cow per month decreased.
The interaction term of months before and after transition and years is illustrated in figure 21. The economic losses of farms with AM-systems before the transition were lower compared to farms with CM-systems. However, the transition had impact wherefore the economic losses increased. The economic losses mostly stagnated and became similar to the economic losses of farms with CM-systems. However, the economic losses did not decrease to the same level as before the transition. Between the years, the economic losses after transition did decrease.
Figure 21 Economic losses due to SCC, euros per cow per month, 12 months before and 12 months after transition to a AM-system in relation to farms with a CM-system (dotted line).
Automatic milking 26
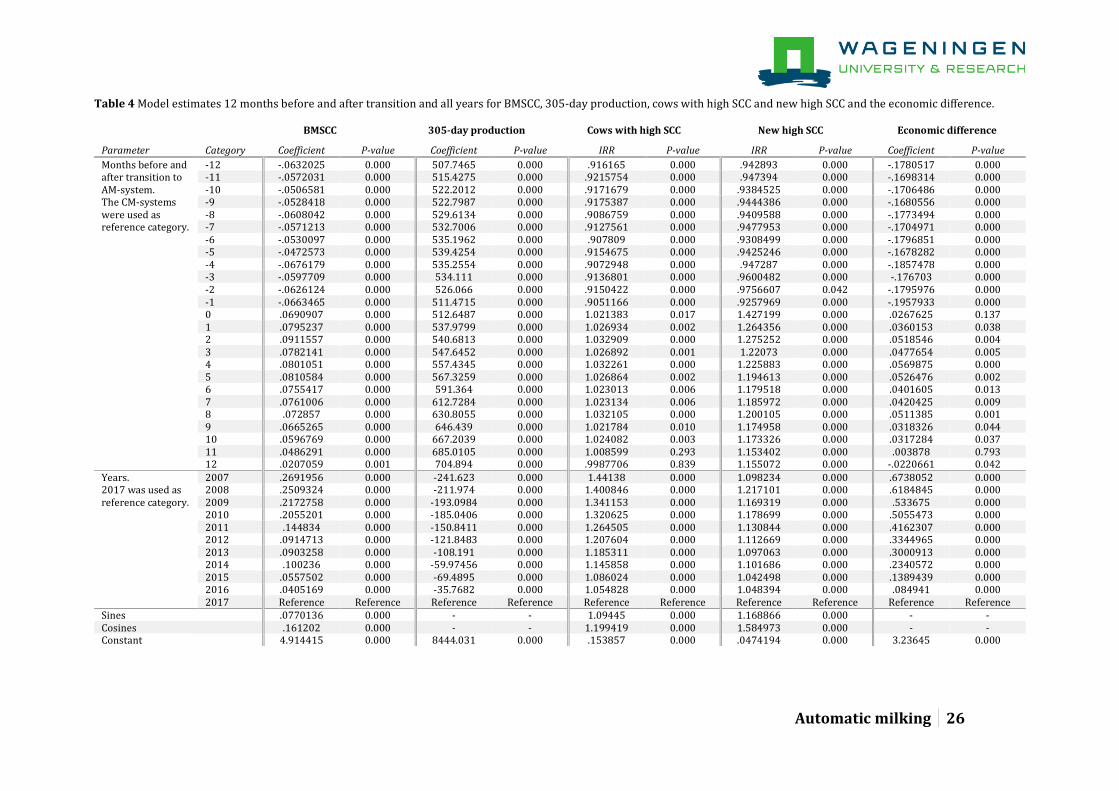
Table 4 Model estimates 12 months before and after transition and all years for BMSCC, 305-day production, cows with high SCC and new high SCC and the economic difference.
BMSCC 305-day production Cows with high SCC New high SCC Economic difference
Parameter Category Coefficient P-value Coefficient P-value IRR P-value IRR P-value Coefficient P-value
Months before and after transition to AM-system. The CM-systems were used as reference category.
-12 -.0632025 0.000 507.7465 0.000 .916165 0.000 .942893 0.000 -.1780517 0.000 -11 -.0572031 0.000 515.4275 0.000 .9215754 0.000 .947394 0.000 -.1698314 0.000 -10 -.0506581 0.000 522.2012 0.000 .9171679 0.000 .9384525 0.000 -.1706486 0.000 -9 -.0528418 0.000 522.7987 0.000 .9175387 0.000 .9444386 0.000 -.1680556 0.000 -8 -.0608042 0.000 529.6134 0.000 .9086759 0.000 .9409588 0.000 -.1773494 0.000 -7 -.0571213 0.000 532.7006 0.000 .9127561 0.000 .9477953 0.000 -.1704971 0.000 -6 -.0530097 0.000 535.1962 0.000 .907809 0.000 .9308499 0.000 -.1796851 0.000 -5 -.0472573 0.000 539.4254 0.000 .9154675 0.000 .9425246 0.000 -.1678282 0.000 -4 -.0676179 0.000 535.2554 0.000 .9072948 0.000 .947287 0.000 -.1857478 0.000 -3 -.0597709 0.000 534.111 0.000 .9136801 0.000 .9600482 0.000 -.176703 0.000 -2 -.0626124 0.000 526.066 0.000 .9150422 0.000 .9756607 0.042 -.1795976 0.000 -1 -.0663465 0.000 511.4715 0.000 .9051166 0.000 .9257969 0.000 -.1957933 0.000 0 .0690907 0.000 512.6487 0.000 1.021383 0.017 1.427199 0.000 .0267625 0.137 1 .0795237 0.000 537.9799 0.000 1.026934 0.002 1.264356 0.000 .0360153 0.038 2 .0911557 0.000 540.6813 0.000 1.032909 0.000 1.275252 0.000 .0518546 0.004 3 .0782141 0.000 547.6452 0.000 1.026892 0.001 1.22073 0.000 .0477654 0.005 4 .0801051 0.000 557.4345 0.000 1.032261 0.000 1.225883 0.000 .0569875 0.000 5 .0810584 0.000 567.3259 0.000 1.026864 0.002 1.194613 0.000 .0526476 0.002 6 .0755417 0.000 591.364 0.000 1.023013 0.006 1.179518 0.000 .0401605 0.013 7 .0761006 0.000 612.7284 0.000 1.023134 0.006 1.185972 0.000 .0420425 0.009 8 .072857 0.000 630.8055 0.000 1.032105 0.000 1.200105 0.000 .0511385 0.001 9 .0665265 0.000 646.439 0.000 1.021784 0.010 1.174958 0.000 .0318326 0.044 10 .0596769 0.000 667.2039 0.000 1.024082 0.003 1.173326 0.000 .0317284 0.037 11 .0486291 0.000 685.0105 0.000 1.008599 0.293 1.153402 0.000 .003878 0.793 12 .0207059 0.001 704.894 0.000 .9987706 0.839 1.155072 0.000 -.0220661 0.042
Years. 2017 was used as reference category.
2007 .2691956 0.000 -241.623 0.000 1.44138 0.000 1.098234 0.000 .6738052 0.000 2008 .2509324 0.000 -211.974 0.000 1.400846 0.000 1.217101 0.000 .6184845 0.000 2009 .2172758 0.000 -193.0984 0.000 1.341153 0.000 1.169319 0.000 .533675 0.000 2010 .2055201 0.000 -185.0406 0.000 1.320625 0.000 1.178699 0.000 .5055473 0.000 2011 .144834 0.000 -150.8411 0.000 1.264505 0.000 1.130844 0.000 .4162307 0.000 2012 .0914713 0.000 -121.8483 0.000 1.207604 0.000 1.112669 0.000 .3344965 0.000 2013 .0903258 0.000 -108.191 0.000 1.185311 0.000 1.097063 0.000 .3000913 0.000 2014 .100236 0.000 -59.97456 0.000 1.145858 0.000 1.101686 0.000 .2340572 0.000 2015 .0557502 0.000 -69.4895 0.000 1.086024 0.000 1.042498 0.000 .1389439 0.000 2016 .0405169 0.000 -35.7682 0.000 1.054828 0.000 1.048394 0.000 .084941 0.000 2017 Reference Reference Reference Reference Reference Reference Reference Reference Reference Reference
Sines .0770136 0.000 - - 1.09445 0.000 1.168866 0.000 - - Cosines .161202 0.000 - - 1.199419 0.000 1.584973 0.000 - - Constant 4.914415 0.000 8444.031 0.000 .153857 0.000 .0474194 0.000 3.23645 0.000

Automatic milking 27
5 Discussion The current research is both descriptive and quantitative in nature and gives retrospective insight into the change in SCC after the transition from CM-systems to AM-systems. The literature provides information about the current research results and contributes as input to analyse the data. The results of this study contribute to further research on the effect of robotic milking on SCC. However, limitations can occur which have effect on the results. Therefore this chapter provides comments on the results. The results of this research are based on a combination of literature research and quantitative data analysis with an extensive data set. The used data is obtained from CRV Holding BV and consist of census data of all Dutch dairy farms. Given its large sample size even small differences become quickly significant but not all results are therefore relevant wherefore the study was focused on specific years.
Results The focus of this research was to analyse the (economic) consequences of SCC after the transition to AM-systems. The overall BMSCC in the Netherlands decreased in the last few years to approximately 175,000 cells/ml in 2017. However, several studies have indicated an increase of the BMSCC after the transition to AM-systems and concerns about it have been raised (Klungel et al., 2000; Kruip et al., 2002). Both transition to AM-systems and seasonality have an effect on the SCC (Castro et al., 2018; Riekerink et al., 2007). This study confirmed this. However it was shown that the BMSCC became less several months after the transition and the results showed improvement over the years. The effect on BMSCC of farms which transited in 2017 were less than farms which transited in 2007. The research by Castro et al. (2018) has shown the same effect but also indicates that after three years the SCC improves due to gaining experience, improvement in management and the adaptation of the cows. However, the data from Castro et al. (2018) consists only of 13 farms with 15 AM-systems. The current research consists of all data from the Netherlands whereby the farms with CM-systems are used as a baseline to compare all observations of herds with AM-systems to, however only 1 year after transition was researched. Although cows with a higher milking frequency tend to have lower SCC and AM-systems ensure an increase in milking frequency (Helmreich et al., 2016), this research showed a direct SCC increase after transition to an AM-system. The variation of milking interval could be part of the increase in SCC (Hogeveen et al., 2001), but also stress and adaptation to the new system can have an impact on udder health and therefore on SCC. The increase in milk yield is commonly mentioned when introducing AM-systems. Milking frequency has an impact on the milk yield, a milking frequency of 2 or lower can lead to a non-increase in milk yield (Penry et al., 2018). On the other hand, an increase in milk frequency can lead to an increase in milk production from 10% to 15% (Hansen, 2015; Österman & Bertilsson, 2003). The results of this research are comparable with the results of the studies of Österman & Bertilsson (2003), Hansen (2015) and Penry et al. (2018). An increase of the 305-day production after the transition was shown, however the 305-day production of those farms compared to the baseline farms were already higher before the transition. Economic losses due to SCC are related to the costs of mastitis and mastitis prevention. Failure costs, treatment of mastitis and costs associated with the consequences of
Automatic milking 28
mastitis, and preventive costs, costs due to the prevention of mastitis, are the cost related factors due to mastitis (van Soest et al., 2016). To compare the costs of mastitis between CM-systems and AM-systems, only the failure costs are taken into account because the preventive costs of CM-systems and AM-systems are too different and no data of the preventive costs were available. The failure costs vary between €72 and €262 per cow per year (van Soest et al., 2016). The costs of subclinical mastitis are caused by production losses. Cows with SCC above 50,000 cells/ml result in a production loss of 0.4 kg milk per day (Huijps et al., 2008). The costs due to subclinical mastitis were analysed on individual cow level and the costs due to clinical mastitis were based on the incidence rate at the farm level. Assumptions generated from several other studies indicates the costs per factor. The results show an increase in economic losses per cow per month after the transition. However, after a few months the average economic losses per cow decreased to the same level as the economic losses of farms with CM-systems.
Limitations A limitation of this research can be the chosen length of time. Within the data analysis, 12 months before and 12 months after the transition are used. However, within the results, the difference after a few years is not taken into account. It could be possible that due to gaining experience, adaptation of the cows and improvement in management the parameters decrease to the same level as before the transition. A limitation for the analysis of high SCC and new high SCC can be the value of SCC. Within this study a SCC above 200,000 cells/ml is indicated as a cow with high SCC. However, in the Netherlands the value is different. For primiparous cows the limit is 150,000 cells/ml and for multiparous cows 250,000 cells/ml (Jansen & van den Borne, 2008). During the analysis of the economic losses several assumptions are made but some assumptions are from studies older than 5 years which can lead to outdated data. However, it did not have an effect on the difference on economic consequences between CM-systems and AM-systems. It can only effect the actual costs which are currently applicable. Another limitation of this research is the dataset. Although the dataset includes all data of all farmers in the Netherlands, it has a negative impact on the data analysis. The data set consists of 1.8 million observations, each with more than 10 variables. As a result, it was not possible to run certain models.
Further research Further research on SCC within automatic milking systems could focus on different elements. In the future it is possible to perform the same analysis with new data, this leads to better insight into the present. With the current data it is possible to make a division between different groups. Several examples are; a dividing of herd size, a dividing of SCC groups before transition or a dividing of brand. Further research on the economic consequences caused by SCC within AM-systems could be a more in-depth analysis. With the use of interviews or data from accountancy firms, it is possible to analyse all economic consequences before and after the transition.

Automatic milking 29
6 Conclusion The transition from a CM-system to a AM-system has an effect on different SCC performance indicators. The BMSCC increases directly after the transition although it became less several months after the transition. After 12 months the BMSCC is almost equal as the CM-systems, however it does not decrease to the same level as before the transition. Over the years, the increase in BMSCC after transition became less strong. From 20,000 cells/ml in 2007 till 2,000 cells/ml in 2017. Those results indicate that the increase of BMSCC does not have a high impact on the overall performance of Dutch dairy farms. The 305-day production showed also an increase after the transition, but was already higher before the transition compared to herds with CM-systems. The transition from CM-systems to AM-systems had also an impact on the cows with high SCC and a large impact on cows with new high SCC. After the transition both indicators increased; thereafter it slightly decreased to the same level as farms with CM-systems. However, the prevalence of cows with new high SCC did not return to the same level as before the transition. The economic losses per cow per month of farms which made a transition to AM-systems are lower before the transition. After the transition, the economic losses directly increases but stagnated at the same level as farms with CM-systems. Although all SCC indicators; BMSCC, high SCC and new high SCC, showed an increase directly after the transition, it does not have a negative impact on the performance of the dairy farms. The 305-day production increased, which has a positive impact on the performance and the economic performance due to impaired udder health only increased slightly. Farmers who are considering switching should take into account a possible increase in the BMSCC and cows with high SCC. The AM-system supplier can advise prior to the transition to make improvement in the BMSCC and to reduce the number of cows with an increased SCC. However, gaining experience, improvement in management and the adaptation of the cows has a positive impact after several years of AM-system usage.
Automatic milking 30
Bibliography (1) Acuna, E., & Rodriguez, C. (2004). "The treatment of missing values and its effect on
classifier accuracy." In Classification, clustering, and data mining applications, 639-647. Springer.
(2) Barkema, H. W., Schukken, Y. H., Lam, T. J. G. M., Beiboer, M. L., Wilmink, H., Benedictus,
G., & Brand, A. (1998). Incidence of clinical mastitis in dairy herds grouped in three categories by bulk milk somatic cell counts. Journal of dairy science 81 (2): 411-419.
(3) Barkema, H. W., Deluyker, H. A., Schukken, Y. H., & Lam, T. J. G. M. (1999). Quarter-milk
somatic cell count at calving and at the first six milkings after calving. Preventive veterinary medicine 38 (1): 1-9.
(4) Barkema, H. W., Schukken, Y. H., Lam, T. J. G. M., Beiboer, M. L., Benedictus, G., & Brand,
A. (1999). Management practices associated with the incidence rate of clinical mastitis. Journal of dairy science 82 (8): 1643-1654.
(5) Barkema, H. W., Van der Ploeg, J. D., Schukken, Y. H., Lam, T. J. G. M., Benedictus, G., &
Brand, A. (1999). Management style and its association with bulk milk somatic cell count and incidence rate of clinical mastitis. Journal of Dairy Science 82 (8): 1655-1663.
(6) Barkema, H. W., Schukken, Y. H., & Zadoks, R. N. (2006). Invited review: The role of
cow, pathogen, and treatment regimen in the therapeutic success of bovine Staphylococcus aureus mastitis. Journal of dairy science 89 (6): 1877-1895.
(7) Barkema, H. W., Von Keyserlingk, M. A. G., Kastelic, J. P., Lam, T. J. G. M., Luby, C., Roy, J.
P., . . . Kelton, D. F. (2015). Invited review: Changes in the dairy industry affecting dairy cattle health and welfare. Journal of Dairy Science 98 (11): 7426-7445.
(8) Bennedsgaard, T. W., Rasmussen, M. D., Pedersen, L. H., & Bjerring, M. (2006). Changes
in herd health and conversion to automatic milking systems. Paper read at Proc. 11th Int. Symp. Vet. Epidemiol. Econ. Cairns, Australia.
(9) Bentley, J. A., Tranel, L. F., Timms, L. L., & Schulte, K. (2013). Automatic milking systems
(AMS)—Producer surveys. Animal Industry Report 659 (1): 39. (10) Berglund, I., Pettersson, G., & Svennersten-Sjaunja, K. (2002). Automatic milking:
effects on somatic cell count and teat end-quality. Livestock Production Science 78 (2): 115-124.
(11) Breen, J. E., Green, M. J., & Bradley, A. J. (2009). Quarter and cow risk factors
associated with the occurrence of clinical mastitis in dairy cows in the United Kingdom. Journal of dairy Science 92 (6): 2551-2561.
(12) Castro, A., Pereira, J. M., Amiama, C., & Barrasa, M. (2018). Long-term variability of
bulk milk somatic cell and bacterial counts associated with dairy farms moving

Automatic milking 31
from conventional to automatic milking systems. Italian Journal of Animal Science 17 (1): 218-225.
(13) Cinar, M., Serbester, U., Ceyhan, A., & Gorgulu, M. (2015). Effect of somatic cell count
on milk yield and composition of first and second lactation dairy cows. Italian Journal of Animal Science 14 (1): 3646.
(14) De Koning, K., & Rodenburg, J. (2004). Automatic milking: State of the art in Europe
and North America. Automatic milking: A better understanding: 27-37. (15) De Koning, K., Slaghuis, B., & Van Der Vorst, Y. (2004). Milk quality on farms with an
automatic milking system. Paper read at Proceedings of the international symposium Automatic Milking, a better understanding, Wageningen Academic Publishers, Wageningen, the Netherlands.
(16) de Koning, K. (2011). Automatic milking. Dairy Research Foundation 14. (17) Dekkers, J. C. M., Van Erp, T., & Schukken, Y. H. (1996). Economic benefits of reducing
somatic cell count under the milk quality program of Ontario. Journal of Dairy Science 79 (3): 396-401.
(18) Deng, Z., Koop, G., Lam, T. J. G. M., van der Lans, I. A., Vernooij, J. C. M., & Hogeveen, H.
(2019). Farm-level risk factors for bovine mastitis in Dutch automatic milking dairy herds. Journal of Dairy Science.
(19) Dohmen, W., Neijenhuis, F., & Hogeveen, H. (2010). Relationship between udder
health and hygiene on farms with an automatic milking system. Journal of dairy science 93 (9): 4019-4033.
(20) Dohoo, I. R., & Meek, A. H. (1982). Somatic cell counts in bovine milk. The Canadian
Veterinary Journal 23 (4): 119. (21) El‐Tahawy, A. S., & El‐Far, A. H. (2010). Influences of somatic cell count on milk
composition and dairy farm profitability. International journal of dairy technology 63 (3): 463-469.
(22) Fourichon, C., Seegers, H., Beaudeau, F., Verfaille, L., & Bareille, N. (2001). Health-
control costs in dairy farming systems in western France. Livestock Production Science 68 (2-3): 141-156.
(23) Geary, U., Lopez-Villalobos, N., Begley, N., McCoy, F., O’brien, B., O’grady, L., & Shalloo,
L. (2012). Estimating the effect of mastitis on the profitability of Irish dairy farms. Journal of Dairy Science 95 (7): 3662-3673.
(24) Hadrich, J. C., Wolf, C. A., Lombard, J., & Dolak, T. M. (2018). Estimating milk yield and
value losses from increased somatic cell count on US dairy farms. Journal of dairy science 101 (4): 3588-3596.
Automatic milking 32
(25) Hagen, K., Langbein, J., Schmied, C., Lexer, D., & Waiblinger, S. (2005). Heart rate variability in dairy cows—influences of breed and milking system. Physiology & behavior 85 (2): 195-204.
(26) Halasa, T., Huijps, K., Østerås, O., & Hogeveen, H. (2007). Economic effects of bovine
mastitis and mastitis management: a review. Veterinary quarterly 29 (1): 18-31. (27) Halasa, T., Nielen, M., De Roos, A. P. W., Van Hoorne, R., de Jong, G., Lam, T. J. G. M., . . .
Hogeveen, H. (2009). Production loss due to new subclinical mastitis in Dutch dairy cows estimated with a test-day model. Journal of Dairy Science 92 (2): 599-606.
(28) Hansen, B. G. (2015). Robotic milking-farmer experiences and adoption rate in Jæren,
Norway. Journal of Rural Studies 41: 109-117. (29) Harding, F. (1995). Milk quality: Springer. (30) Helmreich, S., Wechsler, B., Hauser, R., & Gygax, L. (2016). Effects of milking
frequency in automatic milking systems on salivary cortisol, immunoglobulin A, somatic cell count and melatonin. Schweizer Archiv fur Tierheilkunde 158 (3): 179-186.
(31) Heringstad, B., Klemetsdal, G., & Ruane, J. (2000). Selection for mastitis resistance in
dairy cattle: a review with focus on the situation in the Nordic countries. Livestock Production Science 64 (2-3): 95-106.
(32) Hillerton, J. E., West, J. G., & Shearn, M. F. (1992). The cost of summer mastitis. The
Veterinary Record 131 (14): 315-317. (33) Hogan, J. S., Weiss, W. P., & Smith, K. L. (1993). Role of vitamin E and selenium in host
defense against mastitis. Journal of Dairy Science 76 (9): 2795-2803. (34) Hogeveen, H., Ouweltjes, W. C. J. A. M., De Koning, C. J. A. M., & Stelwagen, K. (2001).
Milking interval, milk production and milk flow-rate in an automatic milking system. Livestock production science 72 (1-2): 157-167.
(35) Hogeveen, H., Heemskerk, K., & Mathijs, E. (2004). Motivations of Dutch farmers to
invest in an automatic milking system or a conventional milking parlour. Automatic Milking: A Better Understanding: 56-61.
(36) Huijps, K., & Hogeveen, H. (2007). Stochastic modeling to determine the economic
effects of blanket, selective, and no dry cow therapy. Journal of dairy science 90 (3): 1225-1234.
(37) Huijps, K., Lam, T. J. G. M., & Hogeveen, H. (2008). Costs of mastitis: facts and
perception. Journal of Dairy Research 75 (1): 113-120. (38) Jacobs, J. A., & Siegford, J. M. (2012). Invited review: The impact of automatic milking
systems on dairy cow management, behavior, health, and welfare. Journal of dairy science 95 (5): 2227-47. http://dx.doi.org/10.3168/jds.2011-4943.

Automatic milking 33
(39) Jansen, J., & van den Borne, B. H. P. (2008). Actieve aanpak celgetal loont: deelnemers
studiegroepen UGCN realiseren een significant lager celgetal. Veeteelt 25 (1): 12-14.
(40) Kaneene, J. B., & Hurd, H. S. (1990). The national animal health monitoring system in
Michigan. III. Cost estimates of selected dairy cattle diseases. Preventive Veterinary Medicine 8 (2-3): 127-140.
(41) Klaas, I. C., Enevoldsen, C., Ersbøll, A. K., & Tölle, U. (2005). Cow-related risk factors
for milk leakage. Journal of dairy science 88 (1): 128-136. (42) Klungel, G. H., Slaghuis, B. A., & Hogeveen, H. (2000). The effect of the introduction of
automatic milking systems on milk quality. Journal of Dairy Science 83 (9): 1998-2003.
(43) Kossaibati, M. A., & Esslemont, R. J. (1997). The costs of production diseases in dairy
herds in England. The veterinary journal 154 (1): 41-51. (44) Kruip, T. A. M., Morice, H., Robert, M., & Ouweltjes, W. (2002). Robotic milking and its
effect on fertility and cell counts. Journal of Dairy Science 85 (10): 2576-2581. (45) Lam, T. J. G. M., Jansen, J., Van den Borne, B. H. P., Renes, R. J., & Hogeveen, H. (2011).
What veterinarians need to know about communication to optimise their role as advisors on udder health in dairy herds. New Zealand Veterinary Journal 59 (1): 8-15.
(46) Lam, T. J. G. M., Van Den Borne, B. H. P., Jansen, J., Huijps, K., Van Veersen, J. C. L., Van
Schaik, G., & Hogeveen, H. (2013). Improving bovine udder health: A national mastitis control program in the Netherlands. Journal of dairy science 96 (2): 1301-1311.
(47) Law, A. M. (2015). Simulation modeling and analysis. New York, NY: McGraw-Hill
Education. (48) Littell, R. C., Pendergast, J., & Natarajan, R. (2000). Modelling covariance structure in
the analysis of repeated measures data. Statistics in medicine 19 (13): 1793-1819. (49) McInerney, J. P., Howe, K. S., & Schepers, J. A. (1992). A framework for the economic
analysis of disease in farm livestock. Preventive Veterinary Medicine 13 (2): 137-154.
(50) Miller, G. Y., & Dorn, C. R. (1990). Costs of dairy cattle diseases to producers in Ohio.
Preventive Veterinary Medicine 8 (2-3): 171-182. (51) Miller, G. Y., Bartlett, P. C., Lance, S. E., Anderson, J., & Heider, L. E. (1993). Costs of
clinical mastitis and mastitis prevention in dairy herds. Journal of the American Veterinary Medical Association 202 (8): 1230-1236.

Automatic milking 34
(52) Mundlak, Y. (1961). Empirical production function free of management bias. Journal of Farm Economics 43 (1): 44-56.
(53) Neave, F. K., Dodd, F. H., Kingwill, R. G., & Westgarth, D. R. (1969). Control of mastitis
in the dairy herd by hygiene and management. Journal of dairy science 52 (5): 696-707.
(54) Nielsen, C., Østergaard, S., Emanuelson, U., Andersson, H., Berglund, B., & Strandberg,
E. (2010). Economic consequences of mastitis and withdrawal of milk with high somatic cell count in Swedish dairy herds. Animal 4 (10): 1758-1770.
(55) Nightingale, C., Dhuyvetter, K., Mitchell, R., & Schukken, Y. (2008). Influence of
variable milk quality premiums on observed milk quality. Journal of Dairy Science 91 (3): 1236-1244.
(56) Österman, S., & Bertilsson, J. (2003). Extended calving interval in combination with
milking two or three times per day: effects on milk production and milk composition. Livestock production science 82 (2-3): 139-149.
(57) Penry, J. F., Crump, P. M., Hernandez, L. L., & Reinemann, D. J. (2018). Association of
milking interval and milk production rate in an automatic milking system. Journal of dairy science 101 (2): 1616-1625.
(58) Persson Waller, K., Westermark, T., Ekman, T., & Svennersten-Sjaunja, K. (2003). Milk
leakage—An increased risk in automatic milking systems. Journal of dairy science 86 (11): 3488-3497.
(59) Petersson-Wolfe, C. S., Leslie, K. E., & Swartz, T. H. (2018). An Update on the Effect of
Clinical Mastitis on the Welfare of Dairy Cows and Potential Therapies. Veterinary Clinics: Food Animal Practice 34 (3): 525-535.
(60) Rasmussen, M. D., Bjerring, M., Justesen, P., & Jepsen, L. (2002). Milk quality on Danish
farms with automatic milking systems. Journal of dairy science 85 (11): 2869-2878. (61) Reinsch, N., & Dempfle, L. (1997). Investigations on functional traits in Simmental: 1.
Treatment costs for ten different diseases. Journal of Animal Breeding and Genetics 114 (1‐6): 407-417.
(62) Riekerink, R. G. M. O., Barkema, H. W., & Stryhn, H. (2007). The effect of season on
somatic cell count and the incidence of clinical mastitis. Journal of dairy science 90 (4): 1704-1715.
(63) Rotz, C. A., Coiner, C. U., & Soder, K. J. (2002). Economic Impact of Automatic Milking
Systems on Dairy Farms. Paper read at 2002 ASAE Annual Meeting. (64) Rotz, C. A., Coiner, C. U., & Soder, K. J. (2003). Automatic Milking Systems, Farm Size,
and Milk Production. Journal of Dairy Science 86 (12): 4167-4177. http://dx.doi.org/10.3168/jds.S0022-0302(03)74032-6.
Automatic milking 35
(65) Sampimon, O. C. (2009). Coagulase-negative staphylococci mastitis in Dutch dairy herds: Utrecht University.
(66) Sant’Anna, A. C., & Paranhos da Costa, M. J. R. (2011). The relationship between dairy
cow hygiene and somatic cell count in milk. Journal of dairy science 94 (8): 3835-3844.
(67) Santman-Berends, I. M. G. A., Swinkels, J. M., Lam, T. J. G. M., Keurentjes, J., & van
Schaik, G. (2016). Evaluation of udder health parameters and risk factors for clinical mastitis in Dutch dairy herds in the context of a restricted antimicrobial usage policy. Journal of dairy science 99 (4): 2930-2939.
(68) Schreiner, D. A., & Ruegg, P. L. (2003). Relationship between udder and leg hygiene
scores and subclinical mastitis. Journal of dairy science 86 (11): 3460-3465. (69) Schukken, Y. H., Grommers, F. J., Van de Geer, D., Erb, H. N., & Brand, A. (1990). Risk
factors for clinical mastitis in herds with a low bulk milk somatic cell count. 1. Data and risk factors for all cases. Journal of Dairy Science 73 (12): 3463-3471.
(70) Schukken, Y. H., Wilson, D. J., Welcome, F., Garrison-Tikofsky, L., & Gonzalez, R. N.
(2003). Monitoring udder health and milk quality using somatic cell counts. Veterinary research 34 (5): 579-596.
(71) Sharma, N., Singh, N. K., & Bhadwal, M. S. (2011). Relationship of Somatic Cell Count
and Mastitis: An Overview. Asian-Australasian journal of animal sciences 24: 429-438.
(72) Sischo, W. M., Hird, D. W., Gardner, I. A., Utterback, W. W., Christiansen, K. H.,
Carpenter, T. E., . . . Heron, B. R. (1990). Economics of disease occurrence and prevention on California dairy farms: a report and evaluation of data collected for the national animal health monitoring system, 1986–87. Preventive Veterinary Medicine 8 (2-3): 141-156.
(73) Stefanowska, J., Plavsic, M., Ipema, A. H., & Hendriks, M. M. W. B. (2000). The effect of
omitted milking on the behaviour of cows in the context of cluster attachment failure during automatic milking. Applied animal behaviour science 67 (4): 277-291.
(74) Stichting KOM. Statistiek 27-01-2019. Available from
http://www.stichtingkom.nl/index.php/stichting_kom/category/statistiek. (75) Svennersten-Sjaunja, K., & Pettersson, G. (2005). Effect of milking frequency on
lactation persistent in an automated milking system. EAAP—56th Annu. Meet. Uppsala. Book of Abstracts (11): 156.
(76) Svennersten-Sjaunja, K. M., & Pettersson, G. (2008). Pros and cons of automatic
milking in Europe. Journal of Animal Science 86 (suppl_13): 37-46.

Automatic milking 36
(77) Tse, C., Barkema, H. W., DeVries, T. J., Rushen, J., & Pajor, E. A. (2018). Impact of automatic milking systems on dairy cattle producers’ reports of milking labour management, milk production and milk quality. animal: 1-8.
(78) Van Asseldonk, M., Renes, R. J., Lam, T., & Hogeveen, H. (2010). Awareness and
perceived value of economic information in controlling somatic cell count. Veterinary Record 166 (9): 263-267.
(79) Van den Borne, B. H. P., Vernooij, J. C. M., Lupindu, A. M., Van Schaik, G., Frankena, K.,
Lam, T. J. G. M., & Nielen, M. (2011). Relationship between somatic cell count status and subsequent clinical mastitis in Dutch dairy cows. Preventive veterinary medicine 102 (4): 265-273.
(80) Van der Vorst, Y., Knappstein, K., & Rasmussen, M. D. (2002). Milk quality on farms
with an automatic milking system: effects of automatic milking on the quality of produced milk.
(81) van Soest, F. J. S., Santman-Berends, I. M. G. A., Lam, T. J. G. M., & Hogeveen, H. (2016).
Failure and preventive costs of mastitis on Dutch dairy farms. Journal of dairy science 99 (10): 8365-8374.
(82) Wade, K. M., Van Asseldonk, M. A. P. M., Berentsen, P. B. M., Ouweltjes, W., &
Hogeveen, H. (2004). Economic efficiency of automatic milking systems with specific emphasis on increases in milk production. Automatic milking: a better understanding. Wageningen Academic Publ., Wageningen, the Netherlands: 62-67.
(83) Weiss, D., Helmreich, S., Mostl, E., Dzidic, A., & Bruckmaier, R. M. (2004). Coping
capacity of dairy cows during the change from conventional to automatic milking. Journal of animal science 82 (2): 563-570.
(84) Wiktorsson, H., & Sørensen, J. T. (2004). Implications of automatic milking on animal
welfare. Automatic milking. A better understanding. Wageningen Academic Publishers, The Netherlands: 371-381.
(85) Zuivel NL. Zuivel in cijfers 2018. Available from https://www.zuivelnl.org/zuivel-in-
cijfers/.

Automatic milking 37
Appendix
Appendix I: Coding cow level
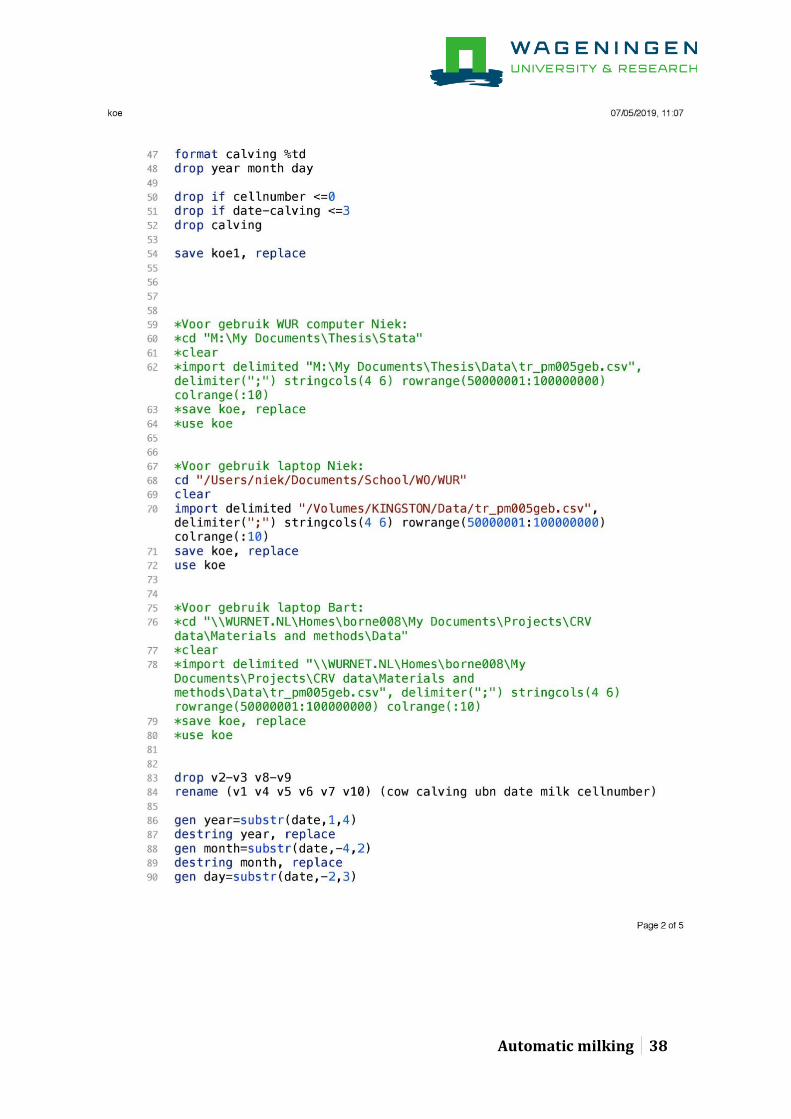
Automatic milking 38
Automatic milking 39

Automatic milking 40

Automatic milking 41
Automatic milking 42
Appendix II: Coding farm level

Automatic milking 43
Appendix III: Coding combination
Automatic milking 44

Automatic milking 45
Appendix IV: Coding analyses

Automatic milking 46
Automatic milking 47
Appendix IV: Coding economic analyses
Automatic milking 48
Automatic milking 49

Automatic milking 50

Automatic milking 51
Related Documents